room to swing a cat - hatc
TRANSCRIPT

ROOM TO SWING A CAT?
The Amount and Use of Space in New
Dwellings in London & the South East
March 2010

Dwelling Size Survey in London & SE
Page - 2
HATC Ltd is a housing consultancy specialising in property development issues, has a national client base
and covers four main areas of activity:
o Project delivery
o Programme delivery (strategy development, good practice processes and procedures, standard
design briefs, project financial evaluation, risk management)
o Research and policy development
o Training and professional development.
This study has been conducted as part of our programme of activities in research and policy development
on housing standards.
HATC contributes to the www.swingacat.info website aimed at raising consumer awareness about the
space needed for a home to work well.
Acknowledgements
This report was written by Andrew Drury and Eleanor Somers of HATC Ltd.
The fieldwork was undertaken by Eleanor Somers.
We should like to thank Zoe Smith of the RIBA for undertaking the validation exercise and English
Partnerships for part-funding the research.
ANDREW DRURY
HATC Ltd
Thursday, 04 March 2010

Dwelling Size Survey in London & SE
Page - 3
CONTENTS
Introduction..........................................................................................................................4
Research Methodology ............................................................................................................5
Criteria used to select dwelling sample ...................................................................................5
Council Tax Band ............................................................................................................6
Sampling Method................................................................................................................6
Sample Size ......................................................................................................................7
Measurement Definitions, Method & Validation.........................................................................7
Definitions .....................................................................................................................8
Design Occupancy Level: persons per dwelling....................................................................... 10
Results and Analysis............................................................................................................. 11
Property Categories .......................................................................................................... 11
Numbers of each Dwelling Type .......................................................................................... 11
Scope of Analysis ............................................................................................................. 12
Gross Internal Areas (GIA)................................................................................................. 12
Observations ................................................................................................................ 17
Distribution of Gross Internal Area....................................................................................... 19
Average Distributions..................................................................................................... 19
Storage Space .............................................................................................................. 21
Observations ................................................................................................................ 22
Habitable Area.............................................................................................................. 23
Observations ................................................................................................................ 28
Price / Area Relationship.................................................................................................... 30
Observations ................................................................................................................ 32
Comparisons With Benchmarks. .......................................................................................... 33
Observations ................................................................................................................ 40
Conclusions ........................................................................................................................ 41
Appendix 1 – Targeted Geographical Area of Postal Survey by LAs................................................ 43
Appendix 2 - Map of Targeted Area ......................................................................................... 44

Dwelling Size Survey in London & SE
Page - 4
Introduction
This dwelling size survey was conducted as part of a programme of research by the UK Space Standards
group. The research programme has been prompted by concerns that dwelling sizes have been reducing in
recent years; these concerns are based on anecdotal evidence.
This project was formulated in parallel with that of Resident Satisfaction with Space in the Home (HATC,
2009).
The objective of this research was to obtain information on the internal areas of new-build dwellings for
sale. The fieldwork was undertaken in July – September 2008.

Dwelling Size Survey in London & SE
Page - 5
Research Methodology
The internal dwelling area was measured from the sales details provided by housebuilders, either from
sales brochures obtained through the post or from housebuilder’s websites.
Criteria used to select dwelling sample
The dwelling sample came from the sub-group of dwellings for sale that were:
o built by Britain’s 20 biggest house-builders (as listed in ‘Britain’s biggest house builders’ in The
House Builder)
o within approximately 1-hour travel time of central London.
In addition, a target was set for 40% of the dwellings to come from within the Greater London area
This geographical target area and the target of 40% of the dwellings selected to come from within the
Greater London area is the same sampling approach as that adopted for another piece of research under
this programme, Resident Satisfaction With Space In The Home, HATC Ltd (2009), sponsored by CABE.
The area is shown at Appendices 1 and 2.
Some house-builders had no developments in this geographic area and were therefore excluded.
Approximately 6 dwellings were targeted from each builder. However, this was not always achieved, either
because of difficulty in obtaining sales information or in order to fulfill other criteria (for instance achieving
approximately 40% of the dwellings in London).
The criteria used to select individual properties were:
o Sale price was up to and including Council Tax Band D (see below for the explanation of how this
was calculated);
o Approximately 40% of the sample to be from the Greater London area;
o Not more than 3 bedrooms;
o No detached houses.
These are the same criteria as those in the Resident Satisfaction With Space In The Home report.
The sample actually drew from developments by 17 housebuilders1.
1 Barratt, Bellway, Berkeley Group, Bloor Homes, Bovis Homes, Countryside Properties, Crest Nicholson,
Fairview, Galliford Try, Gladedale, Kier Residential, Lovell, Miller, Morris Homes, Persimmon, Redrow,
Wimpey

Dwelling Size Survey in London & SE
Page - 6
Council Tax Band
Council Tax bands are calculated with reference to property values in Quarter 2 of 1991. In order to
select properties that are in Council Tax bands A – D inclusive, and exclude those in Band E and above, we
had to make an assessment of where the boundary lies (at current values) between band D and band E
The Council Tax Band D upper limit was £88,000 in Q2 1991. Current equivalent values were calculated
using the Nationwide House Price Index and the Halifax House Price Index. These two indices were used to
provide current equivalent values in different price regions.
The figures produced by the two indices differed, as did their geographic regions. However, using the
information provided by the indices, we have estimated the current price of properties that were worth
£88,000 in 1991 for the different house price regions as follows:
o Greater London: £325,000
o Outer Metropolitan and Outer South East: £300,000
o East Anglia and East Midlands: £250,000
The sample did not include detached properties or those with more than 3 bedrooms as a these formed a
small minority (approximately 15%) of the dwellings in the resident satisfaction survey.
Unusual property types, for example a penthouse 1-bed flat in London, were not included in the sample.
Sampling Method
Information on dwellings was obtained from sales details, either directly from the website of the house-
builder or by the researcher acting as a potential buyer2 and obtaining sales information by post or email.
The data collected included:
o House-builder
o Name of the development
o Location (address)
o Name of individual property
o Property type and number of bedrooms
o Price
o Floor plan of the property (including room dimensions)
2 This was to avoid the possibility that housebuilders may be reluctant to provide floor plans for research
such as this.

Dwelling Size Survey in London & SE
Page - 7
The number of people it could accommodate (as indicated by the builder or where there is no indication,
assessed from the sizes of the bedrooms)
Sample Size
The total sample obtained was 89 dwellings (from 17 housebuilders), 31 of which came from the Greater
London area.
The sample did not draw evenly from all top-20 housebuilders for two reasons. Firstly, a number of
house-builders did not have any developments in Greater London. Secondly, it was difficult to obtain all
the required information on individual properties from some housebuilders and in a few circumstances the
information was unusable because of inaccurate dimensions on floor plans.
Thus, some housebuilders have a higher degree of representation than other builders with the range of
numbers of dwellings per housebuilder varying from 2 to 10.
No 3-bed flats outside London were included in the sample as they appears to be a very unusual property
type. Only 2 out of 22 developments outside London had hard-copy marketing information referring to 3-
bed flats.
Where marketing information was obtained from websites, we did not try to establish the scheme mix.
The averages (whether means, modes or medians) therefore do not give an indication of the average size
of dwellings produced in schemes. For example, the dataset includes only one studio/bedsit flat, but this
dwelling type constituted 27 out of the 114 dwellings (24%) in the scheme from which it came.
Measurement Definitions, Method & Validation
Internal areas were calculated by manually measuring the floor plans of the property. The following areas
were measured:
o Gross Internal Area (GIA);
o Net Internal Area (NIA);
o Storage space;
o Utility space;
o Kitchen area;
o ‘Notional corridor’ areas
o Habitable Areas
The measurements were validated (a 10% sample) by having the plans independently measured and
calculated. The validations confirmed all the original calculations and measurements.

Dwelling Size Survey in London & SE
Page - 8
Definitions
The GIA and the NIA were measured in accordance with the definitions set out in the Royal Institute of
Chartered Surveyors (RICS) ‘Code of Measuring Practice’ 6th Ed. (2007).
Gross Internal Area is the internal area of the dwelling measured to the internal face of the dwelling’s
perimeter walls.
Net Internal Area is the GIA, but excluding circulation areas, bathrooms, toilets and internal structural
walls.
NB1: Internal non-structural walls were included in the NIA, but partitions between spaces that were
not included in the NIA were not. For example, the walls of a store area surrounded by circulation area
were not included in the NIA.
NB2: Areas of reduced head height (under sloping ceilings) were included but one third of this area
was assumed to be too low to be fully useable, and so was counted as storage space.
Storage: The space inside wardrobes, storage cupboards, under-stairs cupboards (see below) and (in one
dwelling) 1/3 of the floor area under a sloping ceiling. It also included Linen cupboards if there was
another linen/airing cupboard in the dwelling but not otherwise (see below).
Utility: The space inside utility rooms, airing cupboards, isolated washing machine spaces, boilers,
cylinders or any combination. Linen/airing cupboards were included in the Utility category. However if
there were two or more linen cupboards, one was classified as Utility and other(s) as Storage (see above).
The area of under-stairs cupboards was taken to be the measured width of the cupboard and depth of 1
metre, which was the assumed area that would actually be usable by residents.
Kitchen: The space inside the kitchen. In cases where the exact size of the kitchen area was not clearly
demarcated (most commonly in open plan flats) the area was calculated as the length of the kitchen
multiplied by 1.6 metres (600mm for the depth of the kitchen units plus 1m clear working space in front
of the kitchen units, as expected by the National Housing Federation's Guide to Standards & Quality in
Development, 2008).
Notional Corridors: Areas in rooms / spaces that were unusable by residents as anything other than
circulation areas i.e. areas that have to be kept clear to enable people to pass through one area to get to
another ‘primary’ area in the dwelling when there was no other way to reach it. Such areas cannot be
used for furniture, storage etc and so are effectively corridors.
‘Primary’ areas are those that are used by all occupants frequently (for example the kitchen or living
areas).

Dwelling Size Survey in London & SE
Page - 9
The areas were calculated as the length of the notional corridor and an assumed width of 750mm as per
guidance in the National Housing Federation’s Guide to Standards and Quality in Development (2008).
A prudent view was taken of Notional Corridors. In a number of cases the notional corridor could have
been assessed as significantly longer than was actually measured. For example, the options for the
Notional Corridor for one dwelling type are shown in Figure 1. The shorter length (Figure 1A) was used in
the analysis, even though it probably under-states the space that has to be used for circulation within
rooms.
Figure 1A Figure 1B
Habitable Area: (HA) is a statistic developed for this piece of research. It draws from the frequently used
term "habitable room" but reflects the fact that many of the dwellings in this sample were open-plan and
so had "areas" rather than "rooms". Furthermore, there is no generally agreed definition of the term
"habitable room". Although often used in planning applications, there is no definition of this term in
planning law. The 2010 Building Regulations use different definitions for "habitable room" in different
Parts:

Dwelling Size Survey in London & SE
Page - 10
� A room used, or intended to be used, for dwellinghouse purposes (including for the purposes of Part
B, a kitchen but not a bathroom). (Part B);
� a room used for dwelling purposes but which is not solely a kitchen, utility room, bathroom, cellar or
sanitary accommodation. (Part F);
� a room used, or intended to be used, for dwelling purposes including a kitchen but not a bathroom or
utility room. (Part M)
For the purposes of this research, therefore, Habitable Area is the Net Internal Area less Kitchen, Utility,
Storage, and Notional Circulation areas. Habitable Area is therefore a measurement of the space that can
be used by the residents for furniture and activities in living areas, dining areas and bedrooms.
Design Occupancy Level: persons per dwelling
Figure 2
This was calculated by logging the number of bedspaces in
each dwelling. In most cases this was done by counting the
number of bedspaces shown on the housebuilder’s
marketing details (Figure 2 provides an illustration of a
‘declared’ 4-person dwelling).
However, some of the marketing plans did not contain
illustrative furniture layouts. We therefore derived a
benchmark from all the layouts3 by measuring all bedrooms
with a “declared” occupancy level to determine the boundary
between double / twin rooms and singles.
That boundary was approximately 8m². “Undeclared”
bedrooms <8m² were therefore counted as single
occupancy, and larger rooms as double occupancy. From
this, the dwelling’s designed occupancy level was scored.
3 22 dwellings from 6 of the 17 housebuilders.

Dwelling Size Survey in London & SE
Page - 11
Results and Analysis
Property Categories
All data recorded was entered into a spreadsheet which was used for the analysis.
Data was sorted by dwelling type, with most of the dwellings falling into 7 categories. These were:
o 1 bed flats in London
o 1 bed flats outside London
o 2 bed flats in London
o 2 bed flats outside London
o 2 bed houses outside London
o 3 bed flats in London
o 3 bed houses outside London
There were three dwellings that did not fall into one of these categories; one bedsit flat, one 2-bed house
and one 3-bed house, all in Greater London. They were not included in the analysis.
There were also two 1-bed 1-person flats (one in London and one outside London) that were excluded
from the analysis as they were an unusual property type in this sample.
Numbers of each Dwelling Type
In total 86 individual dwellings were measured and included in this analysis. Figure 3 shows the number
of each dwelling types in each location, ordered by bedroom size.
27 of the 86 dwellings included in this analysis were located within London, representing 31% of the total.
This is less than the 40% target for the reasons noted earlier in this report.

Dwelling Size Survey in London & SE
Page - 12
Figure 3
Dataset by Dwelling Type & location
0
5
10
15
20
25
1 bed Flat in
London
1 bed Flat ex-
London
2 bed Flat in
London
2 bed Flat ex-
London
2 bed House
ex-London
3 bed Flat in
London
3 bed House
ex-London
Nu
mb
er
of
dw
ell
ing
s
NB: 'ex-London' means 'outside London'
Scope of Analysis
The analysis focused on producing the following statistics for each of the 7 property categories:
o The average Gross Internal Area (GIA) and frequency diagrams for GIA
o The proportion of the GIA that is taken up by these various sub-categories i.e. how the GIA is
used;
o Habitable Area (HA)
o Average Habitable Area per person and frequency diagrams for HA per person
o Cost per m² & cost per square foot of GIA, NIA and HA
Gross Internal Areas (GIA)
Figure 4 shows the average Gross internal Area (GIA) for each of the seven main property types.

Dwelling Size Survey in London & SE
Page - 13
Figure 4
1 bed Flats
1–bedroom flats have an average GIA of 46.9m², both in London and outside London (see Fig 2).
The frequency distributions (Fig 5 and Fig 6) show that both in and outside London, the 1-bed flats mostly
fall in the 40m² - 50m² band.
Figure 5 Figure 6
Average (mean) Gross Internal Area (GIA) of different property types / locations
0
10
20
30
40
50
60
70
80
90
100
1 bed Flat
in London
1 bed Flat
ex-London
2 bed Flat
in London
2 bed Flat
ex-London
2 bed
House ex-
London
3 bed Flat
in London
3 bed
House ex-
London
m 2
GIA of 1B2P flats in London
0
1
2
3
4
5
6
7
35-40 40-45 45-50 50-55 55-60
GIA (sqm)
Fre
qu
ency
GIA of 1B2P flats outside London
0
1
2
3
35-40 40-45 45-50 50-55 55-60
GIA (sqm)
Fre
qu
en
cy

Dwelling Size Survey in London & SE
Page - 14
It is worth noting that there was one studio flat in the survey data (in London), with a GIA of 22.3m².
There were also two 1-bedroom 1-person flats (one in London and one outside London) with GIAs of 37.6
m² and 33.5 m² respectively.
As previously noted these drawings were not included in the analysis.
2-bed Flats & Houses
The average GIA for 2-bed flats and houses were in the middle of the 60-70m² band. 2-bed flats outside
London had a mean GIA of 64.0m², 2-bed flats in London had 61.7m² and 2-bed houses in London had
66.7m². This is shown in Figure 4
Figures 7 & 8 show how many 2-bed flats were in each different size category. Both in and outside
London the most common site type was the 60m²-65m² band, but there is a long tail of larger flats
outside London – the largest being 83m².
Figure 7
Figure 8
The 2-bed flats within London (Fig 8) start smaller than those outside London and do not include the
larger sizes. Outside London, 2-bed flats start in the 50m² - 55m² band; in London they start in the
45m²-50m² band. None of the 2-bed flats in London fell into the two larger size categories.
Figure 9 shows the spread of GIAs for 2-bedroom houses outside London.
Figure 9
These houses cover a narrower range of sizes
than the 2-bed flats, whether in London or
outside London i.e. 50m² - 75m². The houses
are weighted towards the upper end of this
range (65m² - 75m²), while the flats are
weighted towards the lower end (55m² -
65m²). However, as was noted earlier, the
GIA of 2 bed flats in London
0
1
2
3
4
5
45-50 50-55 55-60 60-65 65-70 70-75 75-80 80-85
GIA (sqm)
Fre
qu
en
cy
GIA of 2 bed flats outside London
0
2
4
6
8
10
12
45-50 50-55 55-60 60-65 65-70 70-75 75-80 80-85
GIA (sqm)
Fre
qu
ency
GIA of 2 bed houses outside London
0
1
2
3
45-50 50-55 55-60 60-65 65-70 70-75 75-80 80-85
GIA (sqm)
Fre
quen
cy

Dwelling Size Survey in London & SE
Page - 15
average GIA of the 2-bed houses is only marginally higher than that of the 2-bed flats outside London
(67m² and 64m² respectively).
Of the nine 2-bed houses included in this analysis, two were 2B3P and seven were 2B4P. The mean GIAs
of these two dwelling types were 60.4 m2 and 68.5 m2 respectively. The median for the 2B4P houses was
70.4 m2.
3 – Bed Flats & Houses
There were no 3-bed houses in London within this study's Council Tax Band criterion and so we have not
reported on them. Only three 3-bed flats in London came within the Council Tax Band criterion. These are
shown in Figure 10. With only three examples, little can be gleaned, although there is again an
interestingly wide range of sizes, from 77m² - 92m².
Figure 10
GIA of 3 bed flats in London
0
1
2
3
75-80 80-85 85-90 90-95
GIA (sqm)
Fre
qu
ency
Figure 11 shows the distribution of dwelling sizes for 3-bed houses outside London.
Figure 11
GIA of 3 bed houses outside London
0
1
2
3
4
5
70-
75
75-
80
80-
85
85-
90
90-
95
95-
100
100-
105
105-
110
110-
115
115-
120
120-
125
125-
130
GIA (sqm)
Fre
quency
Dwelling Size Survey in London & SE
Page - 16
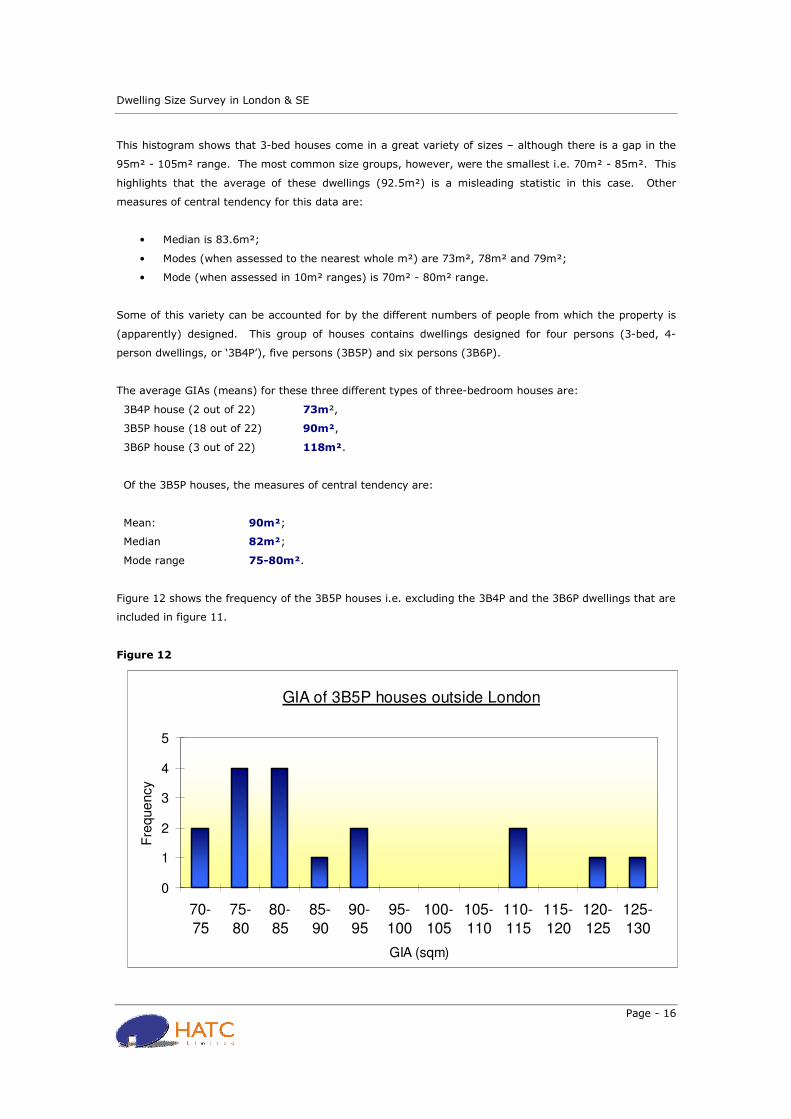
This histogram shows that 3-bed houses come in a great variety of sizes – although there is a gap in the
95m² - 105m² range. The most common size groups, however, were the smallest i.e. 70m² - 85m². This
highlights that the average of these dwellings (92.5m²) is a misleading statistic in this case. Other
measures of central tendency for this data are:
• Median is 83.6m²;
• Modes (when assessed to the nearest whole m²) are 73m², 78m² and 79m²;
• Mode (when assessed in 10m² ranges) is 70m² - 80m² range.
Some of this variety can be accounted for by the different numbers of people from which the property is
(apparently) designed. This group of houses contains dwellings designed for four persons (3-bed, 4-
person dwellings, or ‘3B4P’), five persons (3B5P) and six persons (3B6P).
The average GIAs (means) for these three different types of three-bedroom houses are:
3B4P house (2 out of 22) 73m²,
3B5P house (18 out of 22) 90m²,
3B6P house (3 out of 22) 118m².
Of the 3B5P houses, the measures of central tendency are:
Mean: 90m²;
Median 82m²;
Mode range 75-80m².
Figure 12 shows the frequency of the 3B5P houses i.e. excluding the 3B4P and the 3B6P dwellings that are
included in figure 11.
Figure 12
GIA of 3B5P houses outside London
0
1
2
3
4
5
70-
75
75-
80
80-
85
85-
90
90-
95
95-
100
100-
105
105-
110
110-
115
115-
120
120-
125
125-
130
GIA (sqm)
Fre
que
ncy
Dwelling Size Survey in London & SE
Page - 17
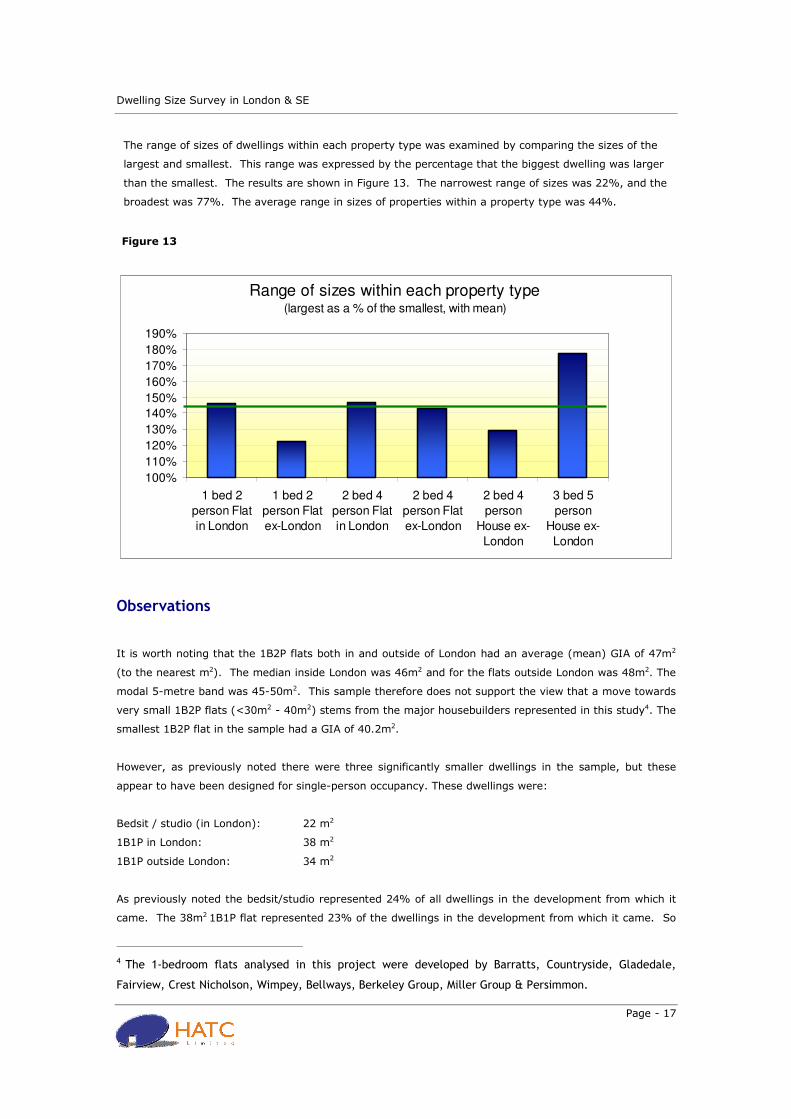
The range of sizes of dwellings within each property type was examined by comparing the sizes of the
largest and smallest. This range was expressed by the percentage that the biggest dwelling was larger
than the smallest. The results are shown in Figure 13. The narrowest range of sizes was 22%, and the
broadest was 77%. The average range in sizes of properties within a property type was 44%.
Observations
It is worth noting that the 1B2P flats both in and outside of London had an average (mean) GIA of 47m2
(to the nearest m2). The median inside London was 46m2 and for the flats outside London was 48m2. The
modal 5-metre band was 45-50m2. This sample therefore does not support the view that a move towards
very small 1B2P flats (<30m2 - 40m2) stems from the major housebuilders represented in this study4. The
smallest 1B2P flat in the sample had a GIA of 40.2m2.
However, as previously noted there were three significantly smaller dwellings in the sample, but these
appear to have been designed for single-person occupancy. These dwellings were:
Bedsit / studio (in London): 22 m2
1B1P in London: 38 m2
1B1P outside London: 34 m2
As previously noted the bedsit/studio represented 24% of all dwellings in the development from which it
came. The 38m2 1B1P flat represented 23% of the dwellings in the development from which it came. So
4 The 1-bedroom flats analysed in this project were developed by Barratts, Countryside, Gladedale,
Fairview, Crest Nicholson, Wimpey, Bellways, Berkeley Group, Miller Group & Persimmon.
Range of sizes within each property type(largest as a % of the smallest, with mean)
100%
110%
120%
130%
140%
150%
160%
170%
180%
190%
1 bed 2
person Flat
in London
1 bed 2
person Flat
ex-London
2 bed 4
person Flat
in London
2 bed 4
person Flat
ex-London
2 bed 4
person
House ex-
London
3 bed 5
person
House ex-
London
Figure 13

Dwelling Size Survey in London & SE
Page - 18
although the major housebuilders may not be developing 1B2P dwellings that are particularly small, there
is some evidence that some very small dwellings are being developed (albeit designed for single
occupancy) and that these dwellings may form a very significant proportion of overall output.
Figure 14 shows the floor plan of the bedsit/studio
Figure 14: 22m2 bedsit/studio
There is a significant range of sizes of two-bedroom flats both in London and outside London, with the
largest example in the sample being approximately 50% greater than the smallest in both geographic
areas. The flats in London tended to be one size-band smaller than those outside London, even though
the modal band for both was 60-65 m2 (see Figures 7 & 8).
The smallest of the 2B4P flats (which was in London) was the same size as the average (mean) of the
1B2P flats.
The two bed houses (outside London) started in the same size-band as the two bed flats outside London
(i.e. 50-55 m2). Given the space taken up by staircases and landings, one might expect that the
Habitable Area (HA) would be significantly less in the house than the flats. In reality the Habitable Areas
were (on average) 29m2 and 32m2 respectively i.e. the houses had only 10% less Habitable Area than the
flats. This was because the flats had significant lengths of notional corridors to provide access from the
hallway to the kitchen.
The three bed houses (all outside London) showed a very wide range of sizes, with the largest unit being
79% bigger than the smallest. The largest 3B5P house was 75% bigger than the smallest 3B5P house.
When considering only the 3B5P houses there are two distinct groupings in the 70-95m2 band and the
>110m2band. Of the smaller dwelling types, the majority are in the 75-85 m2 band.

Dwelling Size Survey in London & SE
Page - 19
Distribution of Gross Internal Area
This section looks at how the internal space in the dwellings is used i.e. how much is taken up by:
• storage,
• kitchen,
• utility, bathrooms, WCs, shower rooms and corridor
• notional corridor
• habitable area.
Not all bedrooms were measured, however it was noted that housebuilders appear to consider a bedroom
>8m² as a double.
Single bedrooms were as small as 4.5m² (although some were over 7m²).
These compare to minimum sizes of 10.2m² for a double and 6.5m² for a single bedroom in legislation
regarding over-crowding5.
Average Distributions
How the overall space provided (Gross Internal Area) is distributed between the different uses is
illustrated in this section. Pie charts illustrate this spatial distribution for some of the property types
examined with a consolidated graph that summarises the position for all property types.
The charts have been produced by taking the average (mean) of the measured spaces for the relevant
property type, and dividing it by the mean GIA for that property type and then expressing it as a
percentage of the mean GIA for that property type.
Example pie charts for a selection property types is shown in Figures 15-17.
Figure 15 Figure 16
5 Housing Act 1985 Part 10 S.326
Use of space (GIA) -
1 bed flat in London
61%
12%4%
20%1%
2%
Habitable Area
Storage
Utility
Kitchen
Notional Corridors
Corridors, WC,
bthrms etc
Use of space (GIA) -
2 bed flat outside London
61%
9%3%
24% 1%
2%
Habitable Area
Storage
Utility
Kitchen
Notional Corridors
Corridors, WC,
bthrms etc

Dwelling Size Survey in London & SE
Page - 20
Figure 17
Use of space (GIA) -
2 bed houses outside London
58%
8%3%
27%1%
3%
Habitable Area
Storage
Utility
Kitchen
Notional
Corridors
Corridors, WC,
bthrms etc
Figure 18 shows how space is used in the home (as a percentage of the GIA) for all different property
types. There are a number of spaces / areas that account for only a few percentage points of the GIA –
particularly the storage and utility areas.
Figure 18
Use of space (as % of GIA) for Different Property Types
0%
10%
20%
30%
40%
50%
60%
70%
80%
90%
100%
1 bed Flat
in London
1 bed Flat
ex-London
2 bed Flat
in London
2 bed Flat
ex-London
2 bed
House ex-
London
3 bed Flat
in London
3 bed
House ex-
London
Dwelling Type
Pe
rce
nta
ge
of G
ross In
tern
al A
rea
Utility
Storage
Notional Corridors
Kitchen
Corridors, WCs,
bthrms etc
Habitable Area

Dwelling Size Survey in London & SE
Page - 21
Figure 19 is a slightly consolidated version, aggregating the kitchen space with the utility space, and the
notional corridors with the corridors, bathrooms and WC areas.
Figure 19
Use of space (as % of GIA) for Different Property types Kitchen & Utility have been aggregated as "Kitchen & Utility"
"Other" refers to bathrooms, WCs, corridors & notional corridors
0%
10%
20%
30%
40%
50%
60%
70%
80%
90%
100%
1 bed
Flat in
London
1 bed
Flat ex-
London
2 bed
Flat in
London
2 bed
Flat ex-
London
2 bed
House
ex-
London
3 bed
Flat in
London
3 bed
House
ex-
London
Dwelling Type
Pe
rce
nta
ge o
f G
ross I
nte
rna
l A
rea
Storage
Kitchen & Utility
Other
Habitable Area
Storage Space
The average figures for storage were examined in more detail as it was noted that a number of the
dwellings had no storage space at all. Figure 20 shows the percentage of each dwelling type that allowed
no storage space.

Dwelling Size Survey in London & SE
Page - 22
Figure 20
% of Dwellings with No Storage
0%
10%
20%
30%
40%
50%
60%
70%
1 bed Flat in
London
1 bed Flat ex-
London
2 bed Flat in
London
2 bed Flat ex-
London
2 bed House
ex-London
3 bed Flat in
London
3 bed House
ex-London
Figure 21 shows (for those dwellings were storage space is provided) the average amount of storage per
unit and per person.
Figure 21
Storage Space (where provided)
0.0
0.5
1.0
1.5
2.0
2.5
1 bed Flat in
London
1 bed Flat ex-
London
2 bed Flat in
London
2 bed Flat ex-
London
2 bed House
ex-London
3 bed Flat in
London
3 bed House
ex-London
m2
Storage per unit (mean; m2 of floor area provided)
Storage per person (mean; m2 of floor area provided)
Observations
In almost all dwelling types approximately 60% of the Gross Internal Area is habitable. In the two-
bedroom houses outside London the habitable area is 58% of the GIA.
Bathrooms and corridors take up approximately 25-30% of the dwelling area.

Dwelling Size Survey in London & SE
Page - 23
Kitchens and utility areas account for 10-15% of the space in the dwelling.
There is little apparent difference in the proportionate distribution of the space within the homes for the 1-
or 2-bed flats either in London or outside London.
The kitchen falls as a percentage as the actual GIA increases, because the kitchens are all between 5.5m²
and 6.0m² (apart from the 3-bed houses: 7.6m²).
The space devoted to corridors and bathrooms increases slightly as a proportion of the GIA as the
dwellings become larger. If the dwellings had only one bathroom and varying lengths of corridor, these
areas would fall as a percentage of the GIA. However, the converse is true; in nominal terms theses areas
increase significantly across the property types, from 9m² in the 1-bed flats, to 15m² for the 2-bed flats
outside London, to 24.5m² in the 3-bed houses. Clearly the corridor area in houses is likely to be greater
as a proportion, because of the need for the staircase, but the increase goes beyond that. It is probably
the result of additional bathroom areas (such as en-suite bathrooms adjacent to master bedrooms).
Bathroom areas were not measured separately, as that was beyond the scope of the brief (which was to
measure the GIA and NIA of the dwellings), but it may well be worth while doing so, to disaggregate the
corridors from bathrooms. The former do not add value, from the housebuilders perspective, but the
latter do, and so should be clearly identifiable.
Seven of the twelve (58%) 1B2P flats in London had no built-in storage space at all. For the other
dwellings there was no discernible relationship between dwelling size and the amount of storage space
provided. Similarly, where storage space was provided the amount per person fluctuated between
approximately 0.2 m2 0.5 m2.
Habitable Area
Figure 22 shows the Habitable Area per property type, and the Habitable Area per person. This latter
statistic was produced by calculating the mean of the Habitable Area per person for each dwelling within
each dwelling type.

Dwelling Size Survey in London & SE
Page - 24
Figure 22
Average Habitable Areas (HA)
for Different Property Types
0.0
10.0
20.0
30.0
40.0
50.0
60.0
70.0
1 bed Flat
in London
1 bed Flat
ex-London
2 bed Flat
in London
2 bed Flat
ex-London
2 bed
House ex-
London
3 bed Flat
in London
3 bed
House ex-
London
Dwelling types
Ave
rag
e A
rea
(m
2)
Average HA per unit
Average HA per person
However, these average figures obscure the ranges within each dwelling type. The following graphs
(Figures 23-30) show the range of Habitable Area per person for each difference dwelling type using
frequency diagrams with 5m2 categories.
Figure 23
Habitable Area Per Person
1 Bed 2 Person Flats in London
0
1
2
3
4
5
<=10 >10-11 >11-12 >12-13 >13-14 >14-15 >15-16 >16-17 >17-18 >18-19 >19-20
m²
Fre
qu
en
cy

Dwelling Size Survey in London & SE
Page - 25
Figure 24
Habitable Area Per Person
All 1 Bed 2 Person Flats
0
1
2
3
4
5
6
<=10 >10-11 >11-12 >12-13 >13-14 >14-15 >15-16 >16-17 >17-18 >18-19 >19-20
m²
Fre
qu
en
cy
Figure 25
Habitable Area Per Person
2 Bed Flats in London
0
1
2
3
4
5
6
7
8
<=10 >10-11 >11-12 >12-13 >13-14 >14-15 >15-16 >16-17 >17-18 >18-19 >19-20
m²
Fre
qu
en
cy

Dwelling Size Survey in London & SE
Page - 26
Figure 26
Habitable Area Per Person
2 Bed Flats outside London
0
1
2
3
4
5
6
7
8
9
<=10 >10-11 >11-12 >12-13 >13-14 >14-15 >15-16 >16-17 >17-18 >18-19 >19-20
m²
Fre
qu
en
cy
Figure 27
Habitable Area Per Person
All 2 Bed Flats
0123456789
10111213141516
<=10 >10-
11
>11-
12
>12-
13
>13-
14
>14-
15
>15-
16
>16-
17
>17-
18
>18-
19
>19-
20
m²
Fre
quency

Dwelling Size Survey in London & SE
Page - 27
Figure 28
Habitable Area Per Person
2 Bed Houses outside London
0
1
2
3
4
5
<=10 >10-
11
>11-
12
>12-
13
>13-
14
>14-
15
>15-
16
>16-
17
>17-
18
>18-
19
>19-
20
m²
Fre
quency
Figure 29
Habitable Area Per Person
3 Bed Houses outside London
0
1
2
3
4
5
6
7
8
9
<=10 >10-
11
>11-
12
>12-
13
>13-
14
>14-
15
>15-
16
>16-
17
>17-
18
>18-
19
>19-
20
m²
Fre
quency

Dwelling Size Survey in London & SE
Page - 28
Figure 30
Habitable Area Per Person:
All 2 & 3 Bed Properties
0123456789
101112131415161718192021
<=8 >8-9 >9-10 >10-11 >11-12 >12-13 >13-14 >14-15 >15-16
m²
Fre
quency
Observations
The average Habitable Area per person is remarkably consistent at 15m² per person in the 1-bed flats and
10m² per person in all other dwelling types, although there is a significant range between dwellings – see
Figure 23. For the 2- & 3-bed dwellings the mean Habitable Area was 10.5m², the median was 10.3m²
and the mode (when the areas were rounded to the nearest whole m²) was 10m². However, as Figure 30
shows, the greatest grouping across the 2-bed and 3-bed dwellings was in the 8.1m² - 10.9m² range.
The 25th and 75th quartiles were 9.3m² and 11.3m². This suggests that one in four 2-bed and 3-bed
dwellings may have an average habitable area per person of less than 9.3m².
There is no recent data on how much habitable area households need to undertake the normal functions
and activities of using the dwelling as a home. The last significant piece of research to address those was
undertaken by the Parker Morris Committee at the beginning of the 1960s.
However, dwellings need to have the space to accommodate a reasonable range of furniture, and for that
furniture to be laid out in a manner which allows it to be reasonably conveniently used. The amount of
space required to do this will depend, amongst other things, on the shape of the space provided.
Examples are shown at Figures 31, 32 and 33.

Dwelling Size Survey in London & SE
Page - 29
Figure 31
Figure 32
Figure 33

Dwelling Size Survey in London & SE
Page - 30
Price / Area Relationship
The average (mean) asking price for the different property types was calculated and divided by the
average (mean) GIA, NIA and HA for that property type (expressed in square feet, not m2) in order to
calculate the £ per ft² of the different property types. These are shown at Figure 34
Figure 34
£/ft² (asking price) of different dwelling types
200
300
400
500
600
700
800
1 bed f lats in
London
2 bed f lats in
London
3 bed flats in
London
1 bed f lats
outside
London
2 bed f lats
outside
London
2 bed houses
outside
London
3 bed houses
outside
London
Po
un
ds/s
q.f
oo
t
Hab
Area
NIA
GIA
The property types have been grouped according to whether they are in London or not.
Figure 35 plots the rate of price increase alongside the rate of size increase, in terms of both GIA and
Habitable Area.
Figure 35
Rate of Increase in Price, GIA & HA
0
50,000
100,000
150,000
200,000
250,000
300,000
350,000
1 bed F
in
London
2 bed F
in
London
3 bed F
in
London
1 bed F
ex-
London
2 bed F
ex-
London
2 bed H
ex-
London
3 bed H
ex-
London
£
0.0
10.0
20.0
30.0
40.0
50.0
60.0
70.0
80.0
90.0
100.0
m²
"Average Price"
"GIA"
HA

Dwelling Size Survey in London & SE
Page - 31
Figures 36 and 37 take the same data but show the price per square foot from all dwellings rather than
using averages (means). To help with interpreting this scatter graph, linear trend lines have been inserted
for each of the different dwelling types/locations.
Figure 36
Unit Price/sq ft & Unit GIA with trendlines
150
250
350
450
550
650
750
850
40 60 80 100 120 140
GIA (m2)
£ p
er
sq
ft
1 bed flats: London
1 bed flats ex London
2 bed flats: London
2 bed flats ex-London
2 bed houses ex-London
3 bed houses ex- London
Linear (1 bed flats: London)
Linear (1 bed flats ex London)
Linear (2 bed flats: London)
Linear (2 bed houses ex-London)
Linear (2 bed flats ex-London)
Linear (3 bed houses ex- London)
Figure 37
Unit Price/sq ft & Unit HA with trendlines
150
250
350
450
550
650
750
850
40 60 80 100 120 140
HA (m2)
£ p
er
sq
ft
1 bed flats: London
1 bed flats ex London
2 bed flats: London
2 bed flats ex-London
2 bed houses ex-London
3 bed houses ex- London
Linear (1 bed flats: London)
Linear (1 bed flats ex London)
Linear (2 bed flats: London)
Linear (2 bed houses ex-London)
Linear (3 bed houses ex- London)
Linear (2 bed flats ex-London)

Dwelling Size Survey in London & SE
Page - 32
Observations
From Figures 34 and 35 it appears that the rate of increase of the Average Price is similar to that of the
Habitable Area, whilst the gradient for the Gross Internal Area is steeper. This might indicate that
Habitable Area might provide a higher marginal rate of return than Gross Internal Area i.e. An increase in
the Habitable Area may result in a proportionate increase in the Average Price. Increasing Gross Internal
Area may result in a price increase that is less than pro-rata. If so, this would suggest that marginal
increases in Habitable Area of higher value than marginal increases in Gross Internal Area.
The trendlines associated with Figures 36 and 37 suggest a different marginal price effect of differences in
Gross Internal Area and Habitable Area. For all dwelling types (except one) the trend line shows that the
income per square foot reduces as the dwelling size increases. The only exception is the 1-bed flats
outside London where larger dwellings appear to generate real additional value i.e. £ per square foot
increases as dwelling size increases. However, this may be a spurious result from the small sample.
It is also noticeable that the gradients of the trendlines in Figures 36 and 37 are lower when £per square
foot is plotted against Habitable Area than when plotted against Gross Internal Area. This suggests that
each extra m2 of Habitable Area is less valuable than Gross Internal Area. In other words, using the extra
space to provide bathrooms and corridors etc may be more commercially valuable than using it to
increase the amount of space in a bedroom living or dining area.
This may be an effect of how UK purchasers asses the sizes of homes – by the number of bedrooms, not
the size of the bedrooms and other habitable areas. A home with two bedrooms and two bathrooms
therefore appears more valuable than a home with two bedrooms and one bathroom, even though the
dwellings may have the same Gross Internal Area – and consequently cramped bedrooms.
Figure 34 suggests that Outside London the cost pressures are less (easier gradients), but there is still a
significant higher level of sales receipts per sq.ft from smaller dwellings.
These Figures all illustrate the financial pressure on housebuilders to build smaller dwellings: Figure 34
suggests that their income in £psq.ft is, on average, almost 50% higher in London if they develop 1-bed
flats instead of 3-bed flats (it is 28% higher for the dwellings outside London). Figure 36 reinforces this for
variation in dwelling size within any one dwelling category.
In other words, on a site that can accommodate 10,000sq.ft of residential development, it is clear from
Figures 33 & 35 that there will be an incentive to develop that site as small dwellings (i.e. one bedroom
flats, as small as possible).
The financial pressure to follow this route appears to be less severe outside London
There may also be a financial incentive to allocate extra space to bathrooms rather than Habitable Area.
Certainly, that has been a noticeable trend over recent decades.
Set against that is the lower cost of constructing each marginal sq.ft of accommodation, particularly
Habitable Areas. The construction costs per sq.ft of Habitable Areas may be considered to be typically

Dwelling Size Survey in London & SE
Page - 33
30% - 50% the cost per m2 (GIA) of 1-bed flats, as the extra space provided will not include relatively
expensive items such as services, drainage, kitchen and bathroom fittings. This means that the average
construction cost per sq.ft of larger dwellings may be lower than for smaller dwellings. If the reduction in
sales income per sq.ft is more than offset by the average reduction in construction costs per sq.ft, then
larger properties would be more profitable.
This data draws from a relatively small sample that is geographically widespread. The relationship
between changing marginal value for changing marginal size should be examined more closely by drawing
a sample of dwellings of different sizes from a more geographically focused area where property values
(per square foot) will be more consistent than has been the case in this sample. If that study could also
gather information about average and marginal cost of construction then the marginal profitability of
increasing the Gross Internal Area and/or the Habitable Area could be ascertained.
These results also reflect market conditions in the late summer of 2008. In the current altered market
conditions and the relationship between sales price per square foot and the size of dwelling may have
changed.
Comparisons With Benchmarks.
The main benchmarks for residential space standards are:
• Ministry of Housing Homes for Today & Tomorrow (1961) (aka the Parker Morris standards)
• National Housing Federation’s Guide to Standards & Quality in Development (2008)
• Greater London Authority Housing Space Standards (2006)
• Greater London Authority London Housing Design Guide (2009)
• Homes & Communities Agency draft standards (consultation paper March 2010)
These benchmark standards are shown in Figure 38 against the average GIA for the dwelling types shown.

Dwelling Size Survey in London & SE
Page - 34
Mean GIA for different dwelling types with benchmarks
0
10
20
30
40
50
60
70
80
90
100
1B2P flats in
London
1B2P flats
outside London
2B4P flats in
London
2B4P flats
outside London
2B4P houses
outside London
3B5P houses
outside London
Dwelling type
Are
a (
m2)
Draft HCA
National Housing Federation
Parker Morris
GLA 2006 (Housing Space Standards)
GLA 2009 (LHDG)
The Parker Morris standards were published in 1961. The National Housing Federation standards were
developed in 1998 and updated in 2008, reflecting the ergonomic and activity-based approach of the
Parker Morris report, with slightly updated furniture schedules. The GLA's London Housing Design Guide
standards were similarly developed from an activity-based approach. Both these and the Homes &
Communities Agency standards were designed to set reasonable minima. The GLA's 2006 standards
("Housing Space Standards") were described by the reports authors as "safety-net" standards.
It is also worth noting that the GLA safety-net standards are set per person, regardless of property type.
They were produced for an environment where 80% of the housing output was flats. They are therefore
not designed to provide even safety-net standards for houses.
Figure 39 tabulates the mean GIAs of the different property types in the sample against the proposed
Homes & Communities Agency space standards to highlight the variance between what was being sold on
Figure 38

Dwelling Size Survey in London & SE
Page - 35
the private market and the proposed new standards for the main property types that were being
developed. The unusual property types have been part-shaded.
As well as showing the variance between the average dwelling size of each property type from the good-
practice benchmark, it shows the difference between that benchmark and the smallest dwelling in each
property type, both in terms of floor area (m2) and as a percentage of the benchmark figure.
A B C D E F
Dwelling Type Mean
GIA
m2
Smallest
GIA
m2
HCA
Minima
m2
Var
from
Mean
(C-A)
m2
Var
from
mean
(D/C)
%
Var
Smallest
(C-B)
m2
Var
Smallest
(E/C)
%
1B2P flats ex-London 47 42 48 1 2% 6 12%
1B2P flats London 47 41 48 1 2% 7 16%
2B3P flats ex-London 63 54 61 -2 -3% 7 11%
2B4P flats ex-London 65 56 71 6 9% 15 22%
2B4P flats London 62 49 71 9 12% 22 31%
2B3P houses ex-
London 60 54 71 11 15% 17 24%
2B4P houses ex-
London 68 60 81 13 15% 21 26%
3B4P houses ex-
London 73 72 87 14 16% 15 17%
3B5P houses ex-
London 90 73 97 7 7% 24 25%
3B6P houses ex-
London 118 106 107 -11 -11% 1 1%
As shown in the Figure 39, the variance between the average size of each property type in the sample and
the benchmark ranged from -11m2 to 14m2 per. The most noticeable variance, however, was in the 2-
bedroom flats in and outside of London and particularly the 2-bedroomed houses outside London. These
were 9%, 12% and 15% below the benchmark, on average. The smallest example of each of these
different dwelling types were respectively 22%, 31% and 26% below the benchmark.
The variance of the average GIAs against the HCA benchmarks is graphed in Figure 40
Figure 39

Dwelling Size Survey in London & SE
Page - 36
Figure 40
Variance between GIA Means & HCA Minima
-15
-10
-5
0
5
10
15
1B2P fl
ats
ex-L
ondo
n1B
2P flat
s Lo
ndon
2B3P fl
ats
ex-L
ondo
n
2B4P
flats
ex-
London
2B4P fl
ats L
ondon
2B3P
hou
ses ex
-Lon
don
2B4P h
ouse
s ex-
Lond
on
3B4P
hou
ses ex
-Lon
don
3B5P h
ouse
s ex-
Lond
on
3B6P
hou
ses ex
-Lon
don
Dwelling Types
m2
It should be noted that the graphs and tables show the position in relation to the average size of dwellings
that were developed, not the minimum sizes. The following Figures, therefore, show the histograms of the
property types with the draft HCA standards shown.
Figure 41
GIAs of 1B2P Flats in London with HCA Minimum
30
35
40
45
50
55
60
1 2 3 4 5 6 7 8 9 10 11 12
Unit Number
m2

Dwelling Size Survey in London & SE
Page - 37
GIAs of 1B2P Flats outside London with HCA Minimum
30
40
50
60
1 2 3 4 5
Unit Number
m2
GIAs of 2B4P Flats in London with HCA Minimum
40
50
60
70
80
1 2 3 4 5 6 7 8 9 10 11 12
Unit Number
m2
Figure 43
Figure 44
Figure 42

Dwelling Size Survey in London & SE
Page - 38
GIAs of 2B4P Flats outside London with HCA Minimum
50
55
60
65
70
75
80
85
90
1 2 3 4 5 6 7 8 9 10 11 12 13 14 15 16 17 18 19 20 21 22 23
Unit Number
m2
GIAs of 2B4P Houses outside London with HCA Minimum
50
55
60
65
70
75
80
85
1 2 3 4 5 6 7 8 9
Unit Number
m2
Figure 46
Figure 45

Dwelling Size Survey in London & SE
Page - 39
GIAs of 3B5P Houses outside London with HCA Minimum
70
80
90
100
110
120
130
1 2 3 4 5 6 7 8 9 10 11 12 13 14 15 16 17
Unit Number
m2
Figure 47 summarises the extent to which the dwellings of each different property type exceeded or fell
short of the draft HCA Standards.
Figure 47
Dwelling Type % exceeding HCA Standards % falling short of HCA
Standards
1B2P flats in London 25% 75%
1B2P flats outside London 60% 40%
2B4P flats in London 9% 91%
2B4P flats outside London 20% 80%
2B4P houses outside London 0% 100%
3B5P houses outside London 24% 76%

Dwelling Size Survey in London & SE
Page - 40
Observations
The 1B2P flats and the 3B5P houses exceeded the GLA's "safety-net" and the Parker Morris standards, but
fell short of the more recent standards from the National Housing Federation, GLA and HCA. But the
greatest shortfall, however, was in the two-bed dwellings. All of the non-"safety net" standards for the
two-bedroom flats are set as a very similar level (70 m² or 71 m²). The GLA's "safety net" standards for
these type of properties was lower, but the two-bed flats in London were (on average) smaller than even
the safety-net benchmark. This would probably have been true also of the two-bed houses outside London
had the GLA's safety-net standards reflected storey height not just designed occupancy level. The two-
bed houses were on average significantly smaller than Parker Morris, and over 10m² smaller than the
remaining standards which are all clustered at just above 80m².
The three-bed houses outside London were larger than GLA's safety-net and Parker Morris, but smaller
than the remaining standards.
This pattern is confirmed when looking at the percentage of dwellings within any one property type that
exceeded or fell short of the draft HCA standards (Figure 47). Only a minority of the 1B2P flats outside
London fell below the proposed minimum HCA standards. Whilst this rose to 75% for the same flats in
London, this means that 25% of the London 1B2P flats exceeded the draft HCA standards. However, the
two-bedroom dwellings perform much worse against this benchmark, particularly the 2B4P flats in London
(91% falling short), and the 2B4P houses outside London (100% fall short).

Dwelling Size Survey in London & SE
Page - 41
Conclusions
This research looked at the amount of space provided in dwellings of different types in London and
southeast that were being sold in the late summer of 2008. It does not look at the prevalence of the
different dwelling types in the schemes that were being marketed. For example, only one bedsit/studio
dwelling was included in the sample, but it constituted 24% of the dwellings on the scheme from which it
came.
Schemes that were being marketed in the late summer of 2008 would probably have been designed in
2005/2006, when the curve on the Nationwide property price index was approaching its steepest – see
Figure 48.
On average, 20% - 30% of the Gross Internal Area is taken up by corridors, bathrooms (and WCs, shower
rooms etc) and internal non-structural partitions. Most of this space will be bathrooms and toilets.
This is a high proportion, and represents the increased provision of bathing areas (see Figure 49 as an
example). This may have been driven by the growth of the Buy to Let market aimed at renting dwellings
to individuals who are willing to house-share, rather than letting to single households. This suggests that
GIA has become a poor indicator of habitable space, which is (mostly) what prospective purchasers will be
buying. Whilst Habitable Area is, on average, 60% of GIA, that figure can vary considerably, depending
upon the space taken up by bathrooms etc.
Nationwide Price Index
0
100
200
300
400
500
600
Q1
1991
Q4
1991
Q3
1992
Q2
1993
Q1
1994
Q4
1994
Q3
1995
Q2
1996
Q1
1997
Q4
1997
Q3
1998
Q2
1999
Q1
2000
Q4
2000
Q3
2001
Q2
2002
Q1
2003
Q4
2003
Q3
2004
Q2
2005
Q1
2006
Q4
2006
Q3
2007
Q2
2008
Q1
2009
Q4
2009
Quarter
Ind
ice
s
Outer Met: new properties
Outer Met: flats
London: flats
London: new properties
Figure 48

Dwelling Size Survey in London & SE
Page - 42
Highlighting Habitable Area as one of the key indicators – or the key indicator - of the size of dwellings is
likely to be of considerable assistance to people purchasing or renting housing.
Room shape is, of course, a major determinant of the usefulness of the Habitable Area. Oddly-shaped
rooms will render some of the Habitable Area unusable for anything other than (perhaps) storage.
Overall, most dwelling types fall short, on average, of both good-practice and safety-net standards.
However, there is a wide range of dwelling sizes within any one category of an X-bed dwelling. Even
where average GIAs exceed safety-net standards, there are many cases of dwellings which fall below even
that standard.
There appear to be financial incentives on housebuilders to develop smaller rather than larger dwellings in
London (based on Q2 2008 London process), but outside London the position is less clear, depending upon
the effect on sales prices of ensuite bathrooms as opposed to simply more space. There may also be
financial incentives which mitigate against extra space being used as Habitable Area; we recommend that
further research investigates the marginal profitability of using space for different purposes in a more
geographically-focused study.
There is a high degree of consistency in the average Habitable Area per person across dwelling types:
15m² in 1-bed dwellings and 10m² in all other types, although there is a significant range around those
average figures: 8m² - 11m² per person in the 2 and 3-bed properties.
If the bedroom part of the personal Habitable Area accounts for (say) 4-5m², this leaves approximately
another 4-6m² of personal Habitable Area in the home for the furniture and space needed for living and
eating in. This is a circle of diameter 1600mm or approximately the size of a wheelchair turning circle.
If dwellings provide inadequate space for people to be able to be reasonably comfortable these dwellings
may not function effectively as homes, making them less useful and popular over the long term. This has
implications for their longevity and consequently for future costs of early redevelopment, which will be
payable in both monetary and environmental currencies, such as CO2.
Figure 49 - three
bathrooms for three
bedrooms

Dwelling Size Survey in London & SE
Page - 43
Appendix 1 – Targeted Geographical Area of Postal Survey by LAs
County Local Authority
Bedfordshire Bedford
Bedfordshire Luton
Bedfordshire Mid Bedfordshire
Bedfordshire South Bedfordshire
Berks Bracknell Forest
Berks Reading
Berks Slough
Berks West Berkshire
Berks Windsor and Maidenhead
Berks Wokingham
Bucks Aylesbury Vale
Bucks Chiltern
Bucks Milton Keynes
Bucks South Bucks
Bucks Wycombe
Cambs Cambridge
Cambs Huntingdonshire
Cambs Peterborough
Cambs South Cambridgeshire
East Sussex Brighton and Hove
East Sussex Eastbourne
East Sussex Hastings
East Sussex Lewes
East Sussex Rother
East Sussex Wealden
Essex Basildon
Essex Braintree
Essex Brentwood
Essex Castle Point
Essex Chelmsford
Essex Colchester
Essex Epping Forest
Essex Harlow
Essex Maldon
Essex Rochford
Essex Uttlesford
Essex Southend-on-Sea
Essex Thurrock
Hampshire Basingstoke and Deane
Hampshire East Hampshire
Hampshire Eastleigh
Hampshire Fareham
Hampshire Gosport
Hampshire Hart
Hampshire Havant
Hampshire Portsmouth
Hampshire Rushmoor
Hampshire Southampton
Hampshire Winchester
Inner London Camden
Inner London City of London
Inner London Hackney
Inner London Hammersmith and Fulham
Inner London Haringey
Inner London Islington
Inner London Kensington and Chelsea
Inner London Lambeth
Inner London Lewisham
Inner London Newham
Inner London Southwark
Inner London Tower Hamlets
Inner London Wandsworth
Inner London Westminster
Kent Ashford
Kent Dartford
Kent Gravesham
Kent Maidstone
Kent Medway
Kent Sevenoaks
Kent Swale
Kent Tonbridge and Malling
Kent Tunbridge Wells
Northants Northampton
Northants Wellingborough
Outer London Barking and Dagenham
Outer London Barnet
Outer London Bexley
Outer London Brent
Outer London Bromley
Outer London Croydon
Outer London Ealing
Outer London Enfield
Outer London Greenwich
Outer London Harrow
Outer London Havering
Outer London Hillingdon
Outer London Hounslow
Outer London Kingston upon Thames
Outer London Merton
Outer London Redbridge
Outer London Richmond upon Thames
Outer London Sutton
Outer London Waltham Forest
Oxfordshire Oxford
Oxfordshire South Oxfordshire
Suffolk Ipswich
Surrey Elmbridge
Surrey Epsom and Ewell
Surrey Guildford
Surrey Mole Valley
Surrey Reigate and Banstead
Surrey Runnymede
Surrey Spelthorne
Surrey Surrey Heath
Surrey Tandridge
Surrey Waverley
Surrey Woking
West Sussex Adur
West Sussex Arun
West Sussex Chichester
West Sussex Crawley
West Sussex Horsham
West Sussex Mid Sussex
West Sussex Worthing

Dwelling Size Survey in London & SE
Page - 44
Appendix 2 - Map of Targeted Area

Studley House
7 Moorfield Road
Ilkley
West Yorkshire
LS29 8BL
www.hatc.co.uk
01943 604259