rong viet securities - investment strategy report july 2017
TRANSCRIPT

Expecting on the Directive 24/CT-TTg and the Bad Debt Resolution, the Vietnam stock market continued to conquer new high as VNindex closed at 776.47 (+5.2%) and HNindex reached 99.14 (+5.6%) approaching the end of-June. As the market continued to advance, it is not surprised that both buyers and sellers start becoming more risk adverse. As a result, market liquidity decreased to VND 3,563 bil (-19.1% MoM). Despite cautious action of domestic investors, foreign investors’ sentiment remained positive shown by the 6 month-accumulated net bought value of VND 9,200 bil. Foreign participants included not only institutional and retail investors but the ETF as well. So, Vietnam stock market has witnessed a return of off shore money in 1H2017 after a net withdrawal a year before.
Monetary market enjoyed favorable conditions in the first six months. In particulars, while the State Treasury fulfilled 69% of their Government bonds issuance, the actual disbursement of public capital was significantly lower than target. Funding source from Government bonds has temporarily come back to the economy. That, in turn, increased bank liquidity to support lending activities the context of slower deposit growth. Therefore, we think this has been the key reason for ample liquidity in the stock market in 2Q2017.
VN-Index has recorded a strong year-to-date growth of 16.8%. Therefore, it is understandable that the market now is dominated by conservative investor’s sentiment. At the meantime, Vietnam market’s relative valuation is trading at 16.3-16.5 times earnings in June which is considered not expensive. However, given rapid market development in 1H2017, investors would need time to adjust themselves to the new valuation level of the market.
For July, we believe that VNIndex and HNIndex could fluctuate in a narrow band. Market liquidity is not likely to surge rapidly as enterprises enter in busy mid –year production season requiring increasing demand for capital. Therefore, we expect average trading value in both exchanges would likely move between VND 3,200 billion and VND 3,800 billion in the upcoming months.
Analysis and Investment Advisory
Truc Doan – Head of Research
Ha My Tran
Lam Nguyen
Thien Bui
Hieu Nguyen
Quang Vo
Huong Pham
Please see penultimate page for additional important disclosure
Viet Dragon Securities Corp. (“VDSC”) is a foreign broker-dealer unregistered in the USA. VDSC research is prepared by research analysts who are not registered in the USA. VDSC research is distributed in the USA pursuant to Rule 15a-6 of the Securities Exchange Act of 1934 solely by Rosenblatt Securities Inc, an SEC registered and FINRA-member broker-dealer.
700
720
740
760
780
0
50
100
150
200
250
300
29/03 13/04 27/04 15/05 29/05 12/06 26/06
Trading Volume (mil. shares) VNINdex (right axis)
06/07/2017
Investment Strategy July 2017
1H2017 Earning Release Season

Rong Viet Securities Corporation – Investment Strategy Report July 2017 2
CONTENTS
WORLD ECONOMY ............................................................................................................................................................................... 3
US: Subdued Inflation Prompts Doubts About Further Fed Hikes ............................................................................................................ 3
EU: Growth Momentum Stabilizes in Q2 at High Levels ............................................................................................................................... 4
China: Moderated Economic Growth in Q2 ...................................................................................................................................................... 5
GLOBAL STOCK MARKETS ................................................................................................................................................................... 6
VIETNAM’S ECONOMY IN Q22017: GROWTH IS ACCELERATING ..................................................................................................... 7
VIETNAM MACRO ............................................................................................................................................................................... 10
Hidden Facts in Macro Picture, Why Are We Concerned About The Real Growth? .......................................................................... 10
Q2 2017 Business Outlook Considering Macro Perspectives .................................................................................................................... 11
Stabilized VND in 2H2017 ..................................................................................................................................................................................... 11
VIETNAM STOCK MARKET IN JUNE: ADVANCED FURTHER AND FURTHER ................................................................................... 13
JULY STOCK MARKET OUTLOOKS ..................................................................................................................................................... 18
INVESTMENT STRATEGY .................................................................................................................................................................... 20
Continuous market advance in 1H2017 saw many sectors and stocks experience great gains. Majority of investors therefore could have found more profitable opportunities in the first six month of 2017 than in 2016’s same period. We think that a decline of liquidity in June was understandably caused by investors’ prudent action rather than a cash-withdrawing signal after both VNIndex and HNIndex successfully broke out of multi -year high level. As a result, it is quite unlikely that the market would see a significant correction in July. However, like we said, it would take time for investors to get accustomed to a new level of Vietnam market valuation before VNIndex can conquer the 800 threshold.
The favor of money for leading stocks in 1H2017 resulted in the scenario of rising VNIndex valuation but constituent large- and mid-cap stocks saw little gains. Therefore, we believe there are still opportunities of attractively valued stock with great prospects for investors with a long-term holding horizon. With the earnings seasons unfolding, rumors on company earnings estimate would dominate stocks and stock market in the short-term.
Regarding Q2 outlook, we are optimistic on companies in construction stone, steel, financial services (securities brokerage) industries and stocks with turn around stories. Peak season of projects handover and revenue recognition pushed 1H2017 sales of real estate to record the sector’s 5 year highest growth of 3.86% YoY and contributed 0.21% in total GDP growth. Building material providers with construction stone in specific have enjoyed double benefits of higher sales volume and prices. The increase of construction stone prices is more than offset the higher mining costs and resulted in further GPM expansion of construction stone firms. At the same time, increasing input prices while output price remains flat may see profit margins of plastic pipe to contract. Therefore, we are quite conservative on BMP’s business results while optimistic on NNC and PTB’ earnings prospect. For construction steels, production price index of the metallurgical industry increased sharply at the beginning of the year while input costs were stable in the second quarter (+2.63%QoQ). Therefore, we expect steel and galvanized steel producers to deliver good earnings results in this quarter. Given HSG valuation is fairly priced and short-term share dilution is a concerns of NKG, HPG is the best stock selection in this sector. For real estate sector, we prefer stocks that have a strong project pipeline to develop instead of being motivated by news on one-off transaction profit. Therefore, NLG and HDG are our top picks at this time.
Considering utilities stocks, we reiterate the recovery story of hydro power stocks and the turnaround of PPC as we mentioned previously. In this sector, interested investors should heed on hydro power plants in the South and Central Highland with names in our coverage including REE, PPC, CHP, and SHP. We think other names such as VSH or SJD also enjoyed favorable weather condition in the South since end of last year.
Supported by stable macro environment and Government’s push to achieve GDP target, we expect a favorable business environment to carry on. Moreover, stronger consumer confidence in 1H2017 has led to a strong inflation adjusted growth in retail sales of 8.4% YoY in June from 6.2% in the end of 1Q2017. Combined with the low inflation environment and easing monetary policy, we are positive that consumer related sector will experience further growth. Our favorite sectors are banking, logistic, industrial, infrastructure and consumer-related with some specific stocks are VCB, PNJ, DRC, VSC, FPT, ACV, PVT, HTI, and NTC.
HIGHLIGHT STOCKS ........................................................................................................................................................................... 24 48 stocks of RongViet Research (analyzing, discussing with companies) and have analysis and specific evaluation in “Company report” or “Analyst pinboard”.

Rong Viet Securities Corporation – Investment Strategy Report July 2017 3
WORLD ECONOMY • US: Subdued Inflation Prompts Doubts About Further Fed Hikes
• EU: Growth Momentum Stabilizes in Q2 at High Levels
• China: Moderated Economic Growth in Q2
Global growth remains positive in the second quarter of 2017 while inflation remains subdued, particular in the US and EU. It should be noticed that central banks in developed economies are leaning towards tightening. However, as a result of limited inflation, the Fed and ECB are likely to be very gradual in their policy normalization, keeping interest rates and volatility contained. Despite the pickup in US interest rates in June 2017, we think there is not as negative for Vietnam economy as if another interest rates’ hike will happen in the second half of the year.
US: Subdued Inflation Prompts Doubts About Further Fed Hikes
The FOMC raised the Fed funds rate 25bp to 1.25% after the June meeting. In addition, the Fed looks eager to move on with both rate hikes and balance-sheet reduction in coming months. The FOMC statement provide the detailed plan to initially reduce USD10 billion of Treasuries and mortgages bonds a month for three months. It is expected to raise the pace by another USD10 billion every quarter, until reaching USD50 billion a month.
With a sign of more hawkish FED, the USD strengthened but it happened only a short period. At the end of June, the DXY index fell 1.2%. That drop is because observers doubt that the Fed will not be able to move on with the aggressive tightening scheme after the release of May inflation data. Core inflation eased from 1.9% in April to 1.7% in May, the lowest level in two years. The Fed's preferred inflation measure, the PCE deflator, also came in at a weaker 1.5%, well below the Fed's 2% inflation target.
Figure 1: US Core Inflation (Unit: %) Figure 2: FOMC Rate Funds Expectations (%)
Source: Bloomberg Source: BBVA
1.5
1.9
2.3
2.7
07/2
014
09/2
014
11/2
014
01/2
015
03/2
015
05/2
015
07/2
015
09/2
015
11/2
015
01/2
016
03/2
016
05/2
016
07/2
016
09/2
016
11/2
016
01/2
017
03/2
017
05/2
017

Rong Viet Securities Corporation – Investment Strategy Report July 2017 4
EU: Growth Momentum Stabilizes in Q2 at High Levels
Leading economic indicators show that the EU economic recovery gained stream in Q2. The preliminary PMI came in at 55.7 in June, down from 56.8 in May. However, despite a set back, the composite PMI averaged 56.4 in Q2, remained on track for the best quarter since 2011 as business confidence firms in the EU. According IHS Markit, Eurozone GDP growth was on course to accelerate from 0.6% in Q1 to 0.7% in Q2.
After the June meeting, the ECB no longer expects to cut rates, and may signal a taper in the coming months. However, as same as the US, the inflation outlook was lowered to an extent that makes it impossible for the ECB to start hiking rates any time soon. Inflation eased in May to 1.4% YoY driven by the moderation in energy and services. Core inflation also slowed down (to 0.9% YoY) and remain subdued. As a results, markets have postponed a first 10bp hike from the ECB and are currently pricing this around 2018.
Figure 3: The EU Composite PMI Figure 4: EU Inflation Rate
Source: Bloomberg Source: Bloomberg
46
48
50
52
54
56
58
07/2
014
09/2
014
11/2
014
01/2
015
03/2
015
05/2
015
07/2
015
09/2
015
11/2
015
01/2
016
03/2
016
05/2
016
07/2
016
09/2
016
11/2
016
01/2
017
03/2
017
05/2
017
-1
-0.5
0
0.5
1
1.5
2
2.5
07/2
014
10/2
014
01/2
015
04/2
015
07/2
015
10/2
015
01/2
016
04/2
016
07/2
016
10/2
016
01/2
017
04/2
017

Rong Viet Securities Corporation – Investment Strategy Report July 2017 5
China: Moderated Economic Growth in Q2
China economy continued its moderation in May. Industrial production maintained at a relatively low growth of 6.5%YoY. In addition, FAI dropped to 8.6% YoY from 8.9% in April, in which, private investment also dropped from 6.9%YoY to 6.8%. However, leading indicators in June suggest an improvement in manufacturing activities. The official PMI rose to 51.7, accelerating from 51.2 in May. Market consensus for China economic growth is at 6.7-6.8%, lower than 6.9% in Q1.
At the moment, the PBoC is implementing prudent monetary policy and tight regulations on banking system. However, the PBoC has decided not to react to the Fed’s latest move, keeping the interest rates for its reverse repo operations unchanged (at 2.45% for 7-day reserve repo and 2.75% for 28-day tenor), in contrast to the PBoC’s reaction back in March when the Fed last hiked interest rates. After a half year, several changes in China’s financial system and market conditions have greatly alleviated the risk of CNY depreciation, and made it much less compelling for the PBoC to track the Fed’s monetary policy closely.
Figure 5: China FAI Growth Figure 6: China Official PMI
Source: Bloomberg Source: Bloomberg
8
9
10
11
12
13
14
15
16
17
01/1
5
03/1
5
05/1
5
07/1
5
09/1
5
11/1
5
01/1
6
03/1
6
05/1
6
07/1
6
09/1
6
11/1
6
01/1
7
03/1
7
05/1
7
49
49.5
50
50.5
51
51.5
52
01/1
5
03/1
5
05/1
5
07/1
5
09/1
5
11/1
5
01/1
6
03/1
6
05/1
6
07/1
6
09/1
6
11/1
6
01/1
7
03/1
7
05/1
7

Rong Viet Securities Corporation – Investment Strategy Report July 2017 6
GLOBAL STOCK MARKETS
Figure 7: Performance of some major global stock market indexes in June
Source: Bloomberg, RongViet Research
After experiencing April and May quite favorable, the market slightly stabilized in June. However, this slowdown does not affect the profitability from the beginning of the year to this time of world markets.
Looking back to the first half of 2017, the US economy showed a more positive sign as the unemployment rate was low for many years. Evaluating the economy has improved; the FED raised interest rates for the second time this year in mid-June with the announcement of the balance sheet’s reduction. The FED’s view that the ability to implement monetary policy narrowed did not have much impact on US stock indexes by expectations of a warming economy is a key psychology of investors in this market. The Dow Jones, S&P 500 index rose in June while NASDAQ closed down this month. Accumulated from the beginning of the year, all 3 indexes achieved impressive gains: Dow Jones +8.03%, S&P 500 +8.24%% and Nasdaq +16.11%.
European markets become the focus in the first half of 2017. In previous months, mostly political issues included the election of the French President and the early general election in England. Candidate Marien Le Pen’s with the trend of separation from EU did not win, instead, Emmanual Macron who support to stay in the EU. Thus, political uncertainty in Europe has generally decreased but increased in the UK, after May's Conservative Party did not win a majority of seats in the parliament led to a “hard landing” scenario for Britain during the Brexit negotiations. After political points, the European market welcomed Mario Draghi's remarks. Investors are selling aggressively in markets with concerns over Mr. Draghi's remarks that the ECB will narrow monetary policy stimulus. By the close of June, major indices such as FTSE 100, CAC 40, and DAX all fell. Even so, the decline was not enough to lose the positive of capital markets that maintained in previous months.
Investors in Asian markets did not experience many important events. Stable China economy (compared to the last 2 years) seemed to calm investors. Investors also appreciated the President Election result of South Korea. They believe the new President is a positive sign for this country’s economy and diplomatic relation with North Korea. Therefore, most of Asian market indices rallied strongly in the first half 2017. HNX-Index of Vietnam was among the best gainers with an upside of 24% and broke out 100 pts after accumulating for 6 years.
8% 8%
16%
2% 5% 7%5%
12%17%
12%
18%
10%5%
17%
24%
8%
-14%-20%
-10%
0%
10%
20%
30%
Dow
Jone
s
S&P
500
Nas
daq
FTSE
100
CAC
40
DA
X
Nik
kei 2
25
SSE
(Sha
ngha
i)
Han
g Se
ng (H
ongk
ong)
TSEC
(Tai
wan
)
Kosp
i (Ko
rean
)
JKSE
(Ind
ones
ia)
KLSE
(Mal
aysi
a)
VNIn
dex
(Vie
tnam
)
HN
X-In
dex
(Vie
tnam
)
Gol
d Oil
From 31/05/2017 to 30/06/2017 From 31/12/2016 to 30/06/2017

Rong Viet Securities Corporation – Investment Strategy Report July 2017 7
VIETNAM’S ECONOMY IN Q22017: GROWTH IS ACCELERATING
Accelerating in Economic Growth
Vietnam’s GDP growth rebounded sharply to 6.17%YoY in Q2, from 5.15% in Q1 thanks to the improvement in both domestic and external demand. Mining sector still recorded a negative growth of 8.2% but the acceleration in three key sectors (agriculture, manufacturing and construction) led to a stronger economic growth.
Assessments: Excluding the negative growth factor in GDP (mining), economic growth in the first half of 2017 was around 6.8%. It is an impressive result compared to other countries in the region. On the other hand, the Government is stepping up efforts to achieve a GDP growth of 6.7% in 2017. To realize that target, the economy must grow at 7.4% in the second half of the year, above the average level of 6.4% since 2013.
Figure 8: Quarterly GDP Growth
Source: GSO
Inflation is gradually easing
Average CPI for 1H2017 increased by 4.15% YoY. Public goods had the highest contribution to headline inflation during 1H. Specifically, the highest increases came from medicine and healthcare because there were an upward adjustments for service costs during March and April 2017. Conversely, food prices index declined 4 months in a row with a negative growth YoY (-3.12%).
Assessments: The food prices weighed significantly on CPI movements in the second quarter of 2017 despite rising costs of healthcare services. More hikes in hospital and medical service rates are underway in the second half of the year. However, we think the subdued food and oil prices are likely to keep a lid on inflation.
Besides, although analysts expect there is room for oil prices to recover in the next few months, we think a below 50$/barrel will continue to support Vietnam macro environment. Low inflation environment could help the Government in easing monetary policy as well as strengthening business and consumer confidence.
Figure 9: Headline and Core Inflation
Source: GSO
-2%
0%
2%
4%
6%
8%
10%
1Q2016 2Q2016 3Q2016 4Q2016 1Q2017 2Q2017
GDP Agriculture Manufacturing Services
0.0%
0.1%
0.2%
0.3%
0.4%
0.5%
0.6%
06/2
016
07/2
016
08/2
016
09/2
016
10/2
016
11/2
016
12/2
016
01/2
017
02/2
017
03/2
017
04/2
017
05/2
017
06/2
017
Headline inflation Core inflation

Rong Viet Securities Corporation – Investment Strategy Report July 2017 8
New Investments in Coal – burning Power Plants
Registered FDI reached USD17 billion in the first 6 months, up 50.5% YoY. Among top 3 FDI projects, there were two coal power plants with total investment value of USD4.8 billion. According to the MPI, the Vietnamese government is set to approve investment licenses for three coal-fired power plants worth a combined USD7.5 billion this year.
Two projects by Japanese and Singapore investors received licenses in June 2017. Each investor would have a 50-percent stake in the plant and commercial operation is expected to start in 2021. Another project is a 1,320 MW plant, Japan’s Sumitomo Corp would invest about USD2.64 billion into this plant with an expected starting date of 2022. This project was expected to get its license later this year.
Regarding to disburse FDI, inflow maintained positive with total value of USD7.7 billion, +6% YoY.
Assessments: Coal – burning power will play a key role in Vietnam’s energy sector. The electricity output from coal - burning power is expected to account for 49.3% by 2020 and 55% by 2025. With growth of coal power plants, we think the environment costs could be very high in the future.
Figure 10: FDI Capital Inflow (million USD)
Source: GSO
Retail sales accelerated in the second quarter of 2017
The domestic demand showed a positive improvement with retail sales (adjusted for inflation) growing to 8.4% YoY in June from 6.2% at the end of Q12017. There was a significant gain in retail sector, this sector recorded a growth of 10.2% in the first half of 2017 and was much higher than 7.9% in the same period last year. Retail sector contributes 75% to Vietnam’s retail sales, in which, food products grew at the highest pace (10.6%).
Assessments: We think Vietnam consumer confidence is very strong at the moment thanks to the orientation of the Government as well as the easing streak of inflation. Under a disinflation environment, there are a lot of opportunities for retail companies to grow. According to the latest report on Vietnam Income and Expenditure (Euromonitor), Vietnamese consumers enjoy rising incomes and growing expenditure back by steady economic growth. However, a high level of income inequality remains a challenge for businesses, resulting in market fragmentation and hindering middle-class expansion.
Figure 11: Retail Sales Growth
Source: GSO
0
1000
2000
3000
4000
5000
6000
7000
06/2
016
07/2
016
08/2
016
09/2
016
10/2
016
11/2
016
12/2
016
01/2
017
02/2
017
03/2
017
04/2
017
05/2
017
06/2
017
Implemented capital Registered capital
5%
7%
9%
11%
06/2
016
07/2
016
08/2
016
09/2
016
10/2
016
11/2
016
12/2
016
01/2
017
02/2
017
03/2
017
04/2
017
05/2
017
06/2
017
YoY growth Growth (Ex inflation)

Rong Viet Securities Corporation – Investment Strategy Report July 2017 9
Credit growth is outpacing M2 growth
According to GSO, credit growth was 7.54% as of June 20, 2017, the highest growth in 6 years. In year over year terms, this translates into a 17.5% loan growth, which points to strong credit support for the economy. Lending to real estate sector and the corporate sector (particular in the form of short term lending) was robust. Meanwhile, money supply grew at slower pace (+5.69% YTD compared to an increase of 14.2% in the same period last year).
Abundant liquidity in banking system led to a plunge in interbank interest rates from around 5% at the beginning of the year to 1.98% at the end of June.
Assessments: Policies are expected to remain supportive for lending to the economy in order to sustain economic growth and the SBV will also remain active in managing interbank liquidity.
Figure 12: Loan vs M2 Growth (YoY)
Source: GSO, SBV
10%
12%
14%
16%
18%
20%
22%
Q12016 Q22016 Q32016 Q42016 Q12017 Q22017
M2 Credit

Rong Viet Securities Corporation – Investment Strategy Report July 2017 10
VIETNAM MACRO • Hidden Facts in Macro Picture, Why Are We Concerned About The Real Growth?
• Q2 2017 Business Outlook Considering Macroeconomic Factors
• Stabilized VND in 2H2017
Hidden Facts in Macro Picture, Why Are We Concerned About The Real Growth?
The economy witnessed a breakthrough in GDP growth in Q22017 – the miracle named Formosa. According to GSO, GDP growth in Q1 was adjusted to 5.15%, and there was a big improvement in Q2 with a growth of 6.17% YoY. The gap between the second quarter and the first quarter growth is more than 1%, much higher than the historical data average of 0.3-0.4%. As a result, we guess that the return of Formosa at the end of May 2017 is likely to be a key driver for GDP growth. In 1H2017, manufacturing growth was 10.5%, still lower than the Government’s target of 13%. In addition, to achieve the target growth of 6.7% this year, GDP growth must be 7.4% in the second half of the year. Historical data showed that there was no such GDP growth in the same period of the last three years. But somehow, the economy is growing with the miracle named Formosa.
The paradox of Government’s capital mobilization and disbursement. The State Treasury successfully mobilized capital from Government bonds in 1H2017. Until the end of June, 2017, the total of capital mobilization reached over VND125,744 billion and completed 69% the task of 2017. Despite total issued value was lower than the same period last year, the wining ratio was higher (reached an average of 81.4% in the last six months). In contrast, the State Treasury was not able to promote the disbursement of public investment capital during 1H. The pace of disbursing public investment capital was very slow, just completed 37.4% the yearly plan. In addition, it should be noticed that the disbursement of G-bonds capital reached only 14.8% the yearly plan. The Government has not broken the bottleneck in public investment yet, therefore, the economic growth would not deviate much from 6%.
Credit growth steadied despite the supportive monetary policy. As we mentioned in the June Strategy Report, credit growth trend is not sustainable during 1H2017. Latest data confirmed that credit growth momentum is likely to be idle in Q2. As of 20/06/2017, total credit of the economy grew at 7.54% YTD, lower than an increase of 8.16% and 7.86% in the same period of 2016 and 2015, respectively. This was also in line with an ample liquidity in banking system when interbank rate dropped from 4.7% at the end of Q1 to 1.98% at the end of Q2. All considered, the Government’s desire to boost economic growth through easing monetary policy is still questionable at the moment.
Figure 13: Contribution to GDP Growth by Sector in 1H2017
Source: GSO, RongViet Research

Rong Viet Securities Corporation – Investment Strategy Report July 2017 11
Q2 2017 Business Outlook Considering Macro Perspectives
In Q22017, the metallurgical industry (iron and steel) continued to perform well. Total production and consumption increased by 33.8%YoY and 12.3%YoY, respectively. This was in line with the performance of construction and real estate industries. These two industries grew at 10.2%YoY and 3.99%YoY in the second quarter of 2017, higher than the same period last year.
Production price index of the metallurgical industry increased sharply at the beginning of the year. However, input costs were stable in the second quarter (+2.63%QoQ). This could help earning results for steel and galvanized steel producers in this quarter. In addition, we think investors should not concern much about inventories provision because leading companies showed that they have abilities to deal with raw materials’ fluctuation. Our steel analyst think that HSG and POM might have to make adjustments for their inventories while other companies (HPG, NKG, TIS, SMC, etc.) might not.
There was a significant improvement in electronic products industry in the second quarter when both production and consumption growth turned positive to 15.3%YoY and 1.5% YoY, respectively. On the other hand, we are positive about the business results of textile and chemicals companies in Q22017. Combined with the encouraging growth of retail sales and low inflation environment, consumer staples industry (food & beverage) will continue to grow.
Table 1: Production Situation of Some Products in Q2 2017
Production growth
Price Index (vs Q22016)
Price Index (vs Q12017)
Consumption growth
1 Metal 33.8 10.31 2.63 12.3
2 Electronic products 15.3 -15.74 -6.35 1.5
3 Paper 10.2 -1.35 0.05 8.6
4 Textile 9.9 0.76 0.48 0.9
5 Chemicals 9.2 0.19 0.26 6.7
6 Consumer 8.5 -0.32 0.23 8.1
7 Drinks 8.5 2.31 0.69 5.1
8 Rubber 8.0 2.19 1.12 8.8
9 Electrical equipment 7.7 8.6
10 Wooden 7.5 2.9 0.41 0.9
11 Other means of transport 6.7 13.5
12 Motor vehicles 6.2 10.0
13 Food 5.7 2.48 -0.1 1.2
14 Pharmaceutical 5.4 2.3
Source: GSO, RongViet Research
Stabilized VND in 2H2017
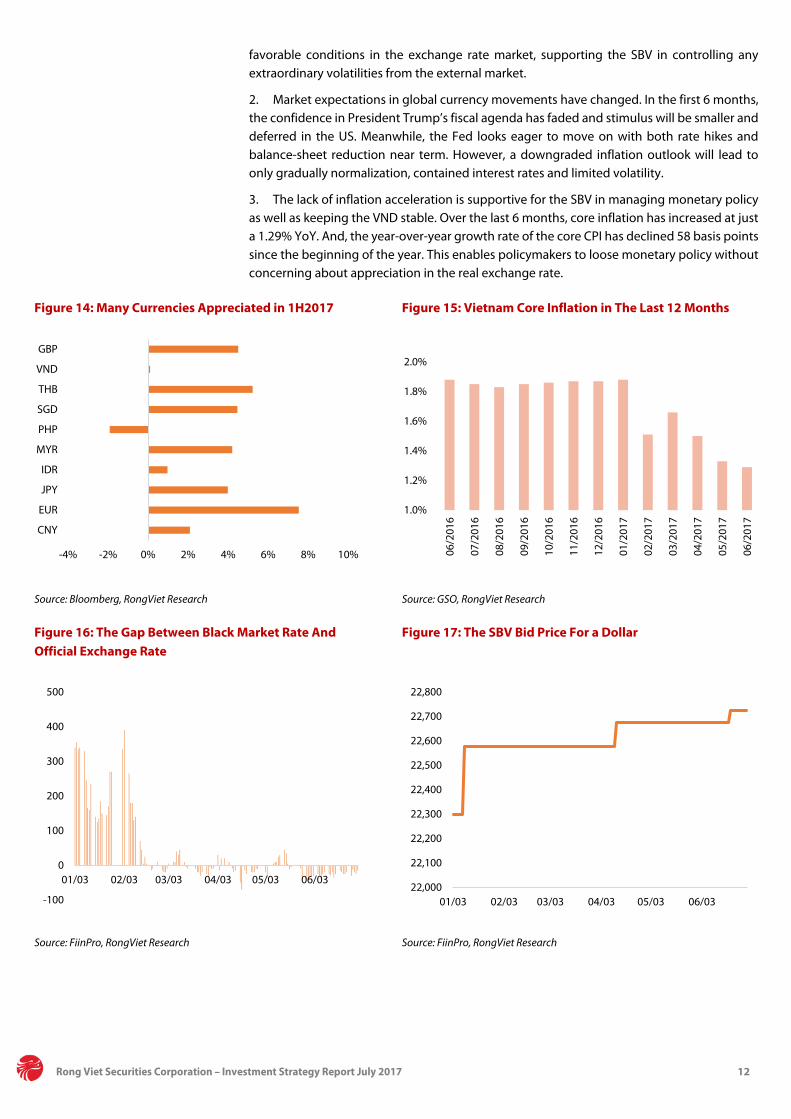
The USDVND exchange rate has stabilized in the last six months, mainly due to the weakened momentum of the USD. The DXY index fell 6.54%YTD, in contrast to the expectation at the beginning of the year. This led to the appreciation of many currencies (except PHP – Philippine Peso). In Vietnam, despite the efforts of the SBV to steadily devalue the VND, amble USD supply in the market led to the small appreciation of VND versus USD. Despite the start of balance sheet unwinding by the Fed near term, we expect a broadly sideways move in USD/VND over the second half of the year for three reasons:
1. In the last 4 months, the gap between free market rate and the official rate has been narrowed. Meanwhile, the SBV adjusted the bid price for a dollar three times during 1H2017. As a result, we suppose that the Vietnam foreign reserves increased dramatically due to
Rong Viet Securities Corporation – Investment Strategy Report July 2017 12
favorable conditions in the exchange rate market, supporting the SBV in controlling any extraordinary volatilities from the external market.
2. Market expectations in global currency movements have changed. In the first 6 months, the confidence in President Trump’s fiscal agenda has faded and stimulus will be smaller and deferred in the US. Meanwhile, the Fed looks eager to move on with both rate hikes and balance-sheet reduction near term. However, a downgraded inflation outlook will lead to only gradually normalization, contained interest rates and limited volatility.
3. The lack of inflation acceleration is supportive for the SBV in managing monetary policy as well as keeping the VND stable. Over the last 6 months, core inflation has increased at just a 1.29% YoY. And, the year-over-year growth rate of the core CPI has declined 58 basis points since the beginning of the year. This enables policymakers to loose monetary policy without concerning about appreciation in the real exchange rate.
Figure 14: Many Currencies Appreciated in 1H2017 Figure 15: Vietnam Core Inflation in The Last 12 Months
Source: Bloomberg, RongViet Research Source: GSO, RongViet Research
Figure 16: The Gap Between Black Market Rate And Official Exchange Rate
Figure 17: The SBV Bid Price For a Dollar
Source: FiinPro, RongViet Research Source: FiinPro, RongViet Research
-4% -2% 0% 2% 4% 6% 8% 10%
CNY
EUR
JPY
IDR
MYR
PHP
SGD
THB
VND
GBP
1.0%
1.2%
1.4%
1.6%
1.8%
2.0%
06/2
016
07/2
016
08/2
016
09/2
016
10/2
016
11/2
016
12/2
016
01/2
017
02/2
017
03/2
017
04/2
017
05/2
017
06/2
017
-100
0
100
200
300
400
500
01/03 02/03 03/03 04/03 05/03 06/0322,000
22,100
22,200
22,300
22,400
22,500
22,600
22,700
22,800
01/03 02/03 03/03 04/03 05/03 06/03

Rong Viet Securities Corporation – Investment Strategy Report July 2017 13
VIETNAM STOCK MARKET IN JUNE: ADVANCED FURTHER AND FURTHER
The market surged in the first half of June thanks to the lead of PLX and banking stocks, which rallied following the expectation for the Bad Debt Resolution. That momentum continued in the second half of the month despite the fact that the Fed decided to raise interest rate and that Vietnam remained in the MSCI frontier index. The VN-Index (776.47 + 5.2%) and HNX-Index (99.14 + 5.6%) both closed the month at a new year-high.
Figure 18: Event chart in June
Source: RongViet Research
Although the market has entered into an uptrend, there are still concerns regarding its liquidity. In 6M17, the market liquidity plunged on both the HSX and the HNX by 19.1% and 5.4% respectively, equivalent to absolute values of VND839bn and VND34bn respectively. For deeper analysis, we found that the decreased liquidity of ROS (- VND625bn, -66.6%) and mid-caps (- VND187bn, -17.2%) were the main driving forces of this decline; While, the VN-Sml liquidity only increased by 4.5% and the VN-30 liquidity almost unchanged (-0.2%). Even excluding ROS, we figure out that the movement of market liquidity also is not in line with the increase in prices. As such, there is disagreement in the market now.
Figure 19: VN-Index movement in June Figure 20: HNX-Index movement in June
Source: RongViet Research Source: RongViet Research
90
92
94
96
98
100
102
720
730
740
750
760
770
780
01/06 06/06 09/06 14/06 19/06 22/06 27/06 30/06
VN-Index HNX-Index (trục phải)
1
2
4
(1): The National Assembly discussed the Bad Debt Resolution (2): VNM ETF announced to add ROS in its portfolio (3): Another rate hike from Fed. End of ETF reconsitution (4): The Bad Debt Resolution was passed. MSCI still classified Vietnam as frontier market
3
700
720
740
760
780
0
50
100
150
200
250
300
29/03 13/04 27/04 15/05 29/05 12/06 26/06
Trading Volume (mil. shares) VNINdex (right axis)
85
87
89
91
93
95
97
99
0
20
40
60
80
100
29/03 13/04 27/04 15/05 29/05 12/06 26/06
Trading Volume (mil. shares) HNXIndex (right axis)

Rong Viet Securities Corporation – Investment Strategy Report July 2017 14
Looking into the difference between buying and selling volumes, we found that there were 12 over-supply sessions in June (vs. 3 in May). For the VN-30 stocks only, the figure was 16, while the supply – demand volumes condition of the VN-Mid and the VN-Sml were in equilibrium. Coupling with the drop in market liquidity, we believe buyers to consider the market expensive now, particularly in high market-price stocks including the VN-30.
It is time to look at the sectors’ performance in the first half of 2017. In the context that the market is continuously setting new peaks (VN-Index + 16.8% YTD and HNX-Index +23.7% YTD), many sectors and stocks in general were able to deliver a return of more than 20% for investors. Among them, the most outperforming sectors were pharmaceuticals, brokerage, banking, and real estate.
Pharmaceuticals: Thanks to stories about foreign strategic partners, FOL lifting and divestment, DHG and DMC both nearly doubled in 6 months, besides the rally of DHT (+200%), OPC (+43%), TRA (+33%).
Real estates: The revenue of many projects will be booked in 2017, along with the gains from projects transferring. Except VIC, the biggest stocks, most stocks in this sector up dramatically in only 6 months: QCG (+663%), LDG (+163%), PDR (+133%), TDH (+107%), and DIG (+104%) to name a few.
Brokerages: The earnings were boosted thanks to booming market liquidity and profit from their own portfolios
Bank: The Bad Debt Resolution will be not only help banks address unprofitable backlogs but can also bring abnormal returns through reversal of bad loans once bad debt is recovered. In addition, with Directive 24, it is likely that business prospects in the last 6 months of the banking industry will be brighter. Besides banks with good business prospects, the changing at SHB and STB is also worth to pay attention.
On the contrary, Media, Travel & Leisure, and Insurance were underperformed sectors. While VNS and SKG were out of favor due to rise of competition in the industry, insurance stocks seemed to reach fair valuation after a sharp increase in 2016.
Figure 21: Sectors performance 1H 2017
Source: FiinPro, RongViet Research
90
100
110
120
130
140
150
160
January February March April May June
Insurance Real Estate Financial Services Travel & Leisure Chemicals
Banks Basic Resources Food & Beverage Media Health Care

Rong Viet Securities Corporation – Investment Strategy Report July 2017 15
The expensive-or-cheap matter relies heavily on investors’ view. If looking at the indices point, the market seems to be expensive. However, if considering the insignificant change of the market PE (from 16.3x on December 30th, 2016 to 16.5x on June 30th, 2017), the answer will be different. In our view, we expect the market still has room to increase, given the sustainable macroeconomic environment and the efficiency of listing companies.
Figure 22: P/E trailing of the VN-Index
Source: Bloomberg
Foreign Investors Trading: Reaching a new high
Figure 23: Net trading value of foreign investors
Source: RongViet Research
10
12
14
16
18
January-16 April-16 July-16 October-16 January-17 April-17
0
1000
2000
3000
4000
5000
6000
7000
8000
9000
10000
-400
-300
-200
-100
0
100
200
300
400
500
600
03/01 21/03 02/06
Net bought/sold Accumulated Value

Rong Viet Securities Corporation – Investment Strategy Report July 2017 16
Table 2: Net buying/selling value of foreign investors classifying by sectors in June
Sectors
HSX HNX
Net volume Net value (bn
VND) Net volume
Net value (bn VND)
Oil & gas -9,503,510 24.4 -6,509,064 -107.2
Chemicals -2,877,050 -56.0 72,917 2.2
Basic resource 19,405,230 583.9 544,010 2.5
Construction & building materials 2,570,950 417.3 4,232,342 45.3
Industrial goods & services 7,113,020 151.7 84,700 6.2
Automobiles & parts 2,030,650 72.1 -291,700 -3.0
Food & beverage -10,815,170 107.5 513,020 11.4
Personal and household goods -668,550 -24.3 -680,275 -21.3
Healthcare 48,380 -3.4 130,760 5.5
Retail -32,090 2.7 73,800 0.9
Communication 0 0.0 262,900 3.9
Travel & leisure -2,010,220 -167.7 -110,379 8.7
Utilities 2,404,220 168.4 -126,800 2.7
Banks 19,014,450 399.7 -5,718,810 -43.0
Insurance -829,350 -54.7 -7,480 -0.3
Real estate 1,248,912 318.4 413,640 10.1
Financial services 13,236,194 165.0 1,805,101 7.9
Technology 484,990 9.4 -39,500 0.3
Total 40,821,056 2,114.5 -5,350,818 -67.1
Source: FiinPro, RongViet Research
Foreigners continued to net buy in June. In the HSX they net purchased strongly to the tune of VND2,114 billion worth of shares while net sold VND67 billion in the HNX. The selling pressure in the HNX was not significant and did not represent market sentiment of foreigners as it was biased by the large value of Oil & gas sector including PVS and PGS.
In the HSX, Basic resource and Construction & building material shares were the 2 leaders. Banking shares stayed very closed with the third place. HPG (VND504 billion), ROS (VND299 billion) and PLX (VND207 billion) etc. attracted foreigners. For the case of ROS, the ETF bought a large volume of this stock in this review period. In this June, foreigners also net bought E1VFVN30. 8.4 million Certificates, equivalent to VND104 billion were transferred. In the context that market movement is very positive but the foreign room is not enough for off-shore investors to participate, this ETF is a good choice.

Rong Viet Securities Corporation – Investment Strategy Report July 2017 17
Sectors
HSX HNX
Net volume Net value (bn VND)
Net volume Net value (bn VND)
Oil & gas -5,484,950 -109 197,370 2
Chemicals -697,460 -79 -1,459,669 -36
Basic resource -95,623,978 -1.044 4,557,174 75
Construction & building materials 1,271,841 69 -672,851 -6
Industrial goods & services -14,978,030 406 -6,247,959 -103
Automobiles & parts 1,521,997 236 11,550,593 128
Food & beverage 11,759,220 486 -3,655,552 -58
Personal and household goods 3,029,860 344 463,920 9
Healthcare 11,127,060 303 -604,782 10
Retail 17,981 147 -664,710 -19
Communication -27,428,750 -301 -90,344 10
Travel & leisure 38,370,466 544 -25,811,825 -192
Utilities 3,775,682 45 1,032,259 17
Banks 36,376,980 1.281 -121,978 -8
Insurance 11,459,259 4.793 3,744,534 64
Real estate -1,310 0 677,038 12
Financial services 3,946,477 1.669 23,101,302 287
Technology 3,875,380 184 745,667 34
Total -17,682,275 2,282 6,740,187 226
Source: FiinPro, RongViet Research
In addition, after 1H2017, total net buying value was VND9,200 billion, a 9-year high. Foreigners tended to pay more attention to F&B, construction and other relating sectors.
Table 3: ETFs’ inflows and outflows in 1H2017
VanEck Vectors Vietnam ETF (mn USD)
Db x-trackers FTSE Vietnam UCITS ETF (mn USD)
Jan 5.32 -4.53
Feb 12.28 -8.65
March -5.41 -9.62
April -0.70 -4.79
May -9.25 -7.24
June 7.30 -2.51
Total 9.53 -37.34
Source: Bloomberg, RongViet Research
For the off-shore ETFs, they just reconstituted their portfolios in this June. Db x-trackers FTSE Vietnam ETF excluded NT2, BVH, HAG while added NVL and STB. The other VanEck Vectors Vietnam ETF added ROS and deleted 2 Oil & gas stocks PVD and PVS. We saw capital flowing into VanEck ETF (USD9.5 million) but flowing out of FTSE ETF (USD37.3 million). After the first 6 months, VNM ETF still attracted more capital but FTSE ETF did not manage to do so, which resulted in a negative inflows of these 2 ETFs.
Rong Viet Securities Corporation – Investment Strategy Report July 2017 18
JULY STOCK MARKET OUTLOOKS
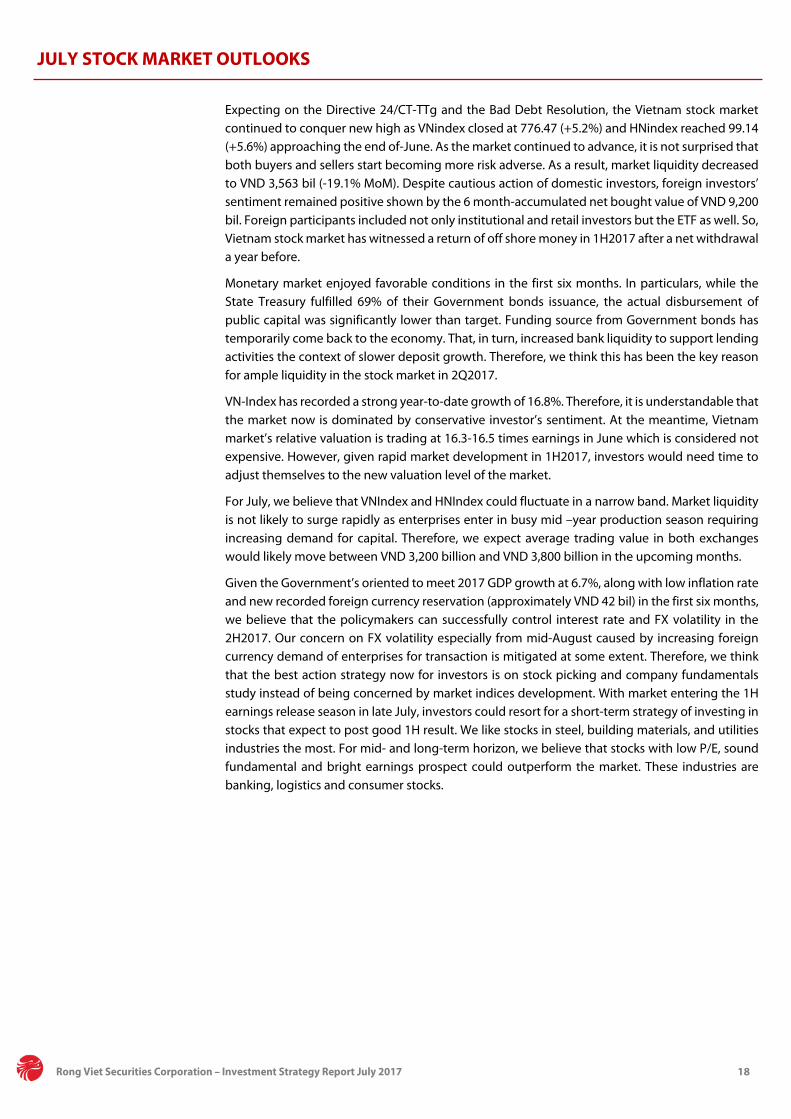
Expecting on the Directive 24/CT-TTg and the Bad Debt Resolution, the Vietnam stock market continued to conquer new high as VNindex closed at 776.47 (+5.2%) and HNindex reached 99.14 (+5.6%) approaching the end of-June. As the market continued to advance, it is not surprised that both buyers and sellers start becoming more risk adverse. As a result, market liquidity decreased to VND 3,563 bil (-19.1% MoM). Despite cautious action of domestic investors, foreign investors’ sentiment remained positive shown by the 6 month-accumulated net bought value of VND 9,200 bil. Foreign participants included not only institutional and retail investors but the ETF as well. So, Vietnam stock market has witnessed a return of off shore money in 1H2017 after a net withdrawal a year before.
Monetary market enjoyed favorable conditions in the first six months. In particulars, while the State Treasury fulfilled 69% of their Government bonds issuance, the actual disbursement of public capital was significantly lower than target. Funding source from Government bonds has temporarily come back to the economy. That, in turn, increased bank liquidity to support lending activities the context of slower deposit growth. Therefore, we think this has been the key reason for ample liquidity in the stock market in 2Q2017.
VN-Index has recorded a strong year-to-date growth of 16.8%. Therefore, it is understandable that the market now is dominated by conservative investor’s sentiment. At the meantime, Vietnam market’s relative valuation is trading at 16.3-16.5 times earnings in June which is considered not expensive. However, given rapid market development in 1H2017, investors would need time to adjust themselves to the new valuation level of the market.
For July, we believe that VNIndex and HNIndex could fluctuate in a narrow band. Market liquidity is not likely to surge rapidly as enterprises enter in busy mid –year production season requiring increasing demand for capital. Therefore, we expect average trading value in both exchanges would likely move between VND 3,200 billion and VND 3,800 billion in the upcoming months.
Given the Government’s oriented to meet 2017 GDP growth at 6.7%, along with low inflation rate and new recorded foreign currency reservation (approximately VND 42 bil) in the first six months, we believe that the policymakers can successfully control interest rate and FX volatility in the 2H2017. Our concern on FX volatility especially from mid-August caused by increasing foreign currency demand of enterprises for transaction is mitigated at some extent. Therefore, we think that the best action strategy now for investors is on stock picking and company fundamentals study instead of being concerned by market indices development. With market entering the 1H earnings release season in late July, investors could resort for a short-term strategy of investing in stocks that expect to post good 1H result. We like stocks in steel, building materials, and utilities industries the most. For mid- and long-term horizon, we believe that stocks with low P/E, sound fundamental and bright earnings prospect could outperform the market. These industries are banking, logistics and consumer stocks.

Rong Viet Securities Corporation – Investment Strategy Report July 2017 19
Table 4: Key sectors performance
No Name % 1M Price Change
% 3M Price Change
Market Cap (VND Billion)
ROA (%) ROE (%) Basic P/E P/B
1 Retail 8.0 125.3 36,755 10.0 42.3 17.0 3.3
2 Insurance 0.4 10.5 60,539 4.4 9.1 26.1 2.5
3 Real Estate 3.9 18.8 240,533 3.6 8.6 24.3 3.1
4 Technology 7.5 36.8 31,882 6.7 16.4 13.0 2.2
5 Oil & Gas 8.8 17.5 92,408 5.6 18.0 16.1 3.3
6 Financial Services 10.6 38.3 39,618 3.3 9.7 14.2 1.4
7 Utilities 8.0 21.7 156,525 11.0 18.3 13.6 2.5
8 Travel & Leisure -2.0 3.4 51,164 5.4 60.6 14.2 6.6
9 Industrial Goods & Services 3.0 25.5 81,357 0.0 16.5 12.1 1.8
10 Personal & Household Goods 9.1 33.4 31,943 11.9 26.4 15.6 3.8
11 Chemicals 3.5 14.4 44,321 7.7 13.7 10.0 1.3
12 Banks 7.0 20.2 398,732 1.0 12.1 16.4 1.9
13 Automobiles & Parts 4.5 0.5 18,459 9.7 15.2 12.4 1.7
14 Basic Resources 10.6 53.4 105,630 15.2 16.0 6.5 1.9
15 Food & Beverage 3.6 43.1 508,548 13.9 32.2 22.0 6.4
16 Media 5.5 27.2 10,668 6.5 4.0 18.7 1.9
17 Construction & Materials -4.1 81.3 176,114 0.0 19.4 16.7 3.1
18 Health Care 10.8 99.8 35,390 11.0 21.8 21.0 3.4
Source: FiinPro

Rong Viet Securities Corporation – Investment Strategy Report July 2017 20
INVESTMENT STRATEGY
Continuous market advance in 1H2017 saw many sectors and stocks experience great gains. Majority of investors therefore could have found more profitable opportunities in the first six month of 2017 than in 2016’s same period. We think that a decline of liquidity in June was understandably caused by investors’ prudent action rather than a cash-withdrawing signal after both VNIndex and HNIndex successfully broke out of multi -year high level. As a result, it is quite unlikely that the market would see a significant correction in July. However, like we said, it would take time for investors to get accustomed to a new level of Vietnam market valuation before VNIndex can conquer the 800 threshold.
The favor of money for leading stocks in 1H2017 resulted in the scenario of rising VNIndex valuation but constituent large- and mid-cap stocks saw little gains. Therefore, we believe there are still opportunities of attractively valued stock with great prospects for investors with a long-term holding horizon. With the earnings seasons unfolding, rumors on company earnings estimate would dominate stocks and stock market in the short-term.
Figure 24: PER of large-, mid-cap groups and VNIndex
Source: Bloomberg
Regarding Q2 outlook, we are optimistic on companies in construction stone, steel, financial services (securities brokerage) industries and stocks with turn around stories. Peak season of projects handover and revenue recognition pushed 1H2017 sales of real estate to record the sector’s 5 year highest growth of 3.86% YoY and contributed 0.21% in total GDP growth. Building material providers with construction stone in specific have enjoyed double benefits of higher sales volume and prices. The increase of construction stone prices is more than offset the higher mining costs and resulted in further GPM expansion of construction stone firms. At the same time, increasing input prices while output price remains flat may see profit margins of plastic pipe to contract. Therefore, we are quite conservative on BMP’s business results while optimistic on NNC and PTB’ earnings prospect. For construction steels, production price index of the metallurgical industry increased sharply at the beginning of the year while input costs were stable in the second quarter (+2.63%QoQ). Therefore, we expect steel and galvanized steel producers to deliver good earnings results in this quarter. Given HSG valuation is fairly priced and short-term share dilution is a concerns of NKG, HPG is the best stock selection in this sector. For real estate sector, we prefer stocks that have a strong project pipeline to develop instead of being motivated by news on one-off transaction profit. Therefore, NLG and HDG are our top picks at this time.

Rong Viet Securities Corporation – Investment Strategy Report July 2017 21
Considering utilities stocks, we reiterate the recovery story of hydro power stocks and the turnaround of PPC as we mentioned previously. In this sector, interested investors should heed on hydro power plants in the South and Central Highland with names in our coverage including REE, PPC, CHP, and SHP. We think other names such as VSH or SJD also enjoyed favorable weather condition in the South since end of last year.
Supported by stable macro environment and Government’s push to achieve GDP target, we expect a favorable business environment to carry on. Moreover, stronger consumer confidence in 1H2017 has led to a strong inflation adjusted growth in retail sales of 8.4% YoY in June from 6.2% in the end of 1Q2017. Combined with the low inflation environment and easing monetary policy, we are positive that consumer related sector will experience further growth. Our favorite sectors are banking, logistic, industrial, infrastructure and consumer-related.
The Bad Debt Resolution adopted during the June meeting of the National Assembly will have a positive impact on the recovery and dealing with the bad debt of banking sector. Noticeably, the Resolution is effective only for bad debts incurred before August 15 (the time when the Resolution takes effect). We think that this regulation could force banks to expose "understated" bad debt, especially restructuring loans under Decision 780, sooner. As announced by the State Bank of Vietnam, total amount of bad debts and restructured loans accounted for about 10.08% of total outstanding loans, in which the NPL ratio was a mere 2.5%. It implies that restructured loans (~VND 414 bil) is three times higher than the reported NPLs loans. This potential bad debt, if following our logic, will be shown as bad debt before Aug 15th 2017. The banks may then sell all of this “new bad debt” to VAMC for special bonds. The Resolution’s terms that allow to extend provision term for special bonds, and other consistent regulations related to collateral collection and solving may reduce the pressure on profit decline for these banks. Therefore, we think the profitability of such banks may not be too pessimistic even if the “restructured loans” actually becomes bad debt. We do not have enough data of “restructure loans” at each bank to assess the impact. Therefore, at the most conservative view, we think that banks with strict policies to loan-classified such as VCB and MBB, or almost fulfilled their restructuring plan like ACB will be less impacted. Along with that, the credit growth continues to be strong, which will help profit of these banks to significantly improve in the Q22017. Therefore, VCB, MBB, and ACB are our three favorite banks. The market price of ACB, however, is reasonable given our positive assumptions are in line with the practical. We will consider to revise target price until we have ACB’s audited financial statements. BID and CTG are the two banks with high NPLs sold to VAMC. As real estate and real estate formed in the future accounted for high proportion of these two banks’ bad debt and morgate, we believe they are the two beneficiaries from the Bad Bebt Resolution. However, we do not have detailed data on the restructure loans in these two banks, we continue rating “Observed” for BID and CTG until the Bad Debt Resolution goes in effective.

Rong Viet Securities Corporation – Investment Strategy Report July 2017 22
In June 2017, we also released five company analysis reports, including PNJ, PTB, STK, PAC, and KLB. Investors who are interested in these stocks can find the full report on our website at Company reports.
Tickers Target price (VND)
Overall Opinions
PNJ 114,000 The positive outlook of Vietnam’s consumer goods market is supported by (1) the young and growing population, (2) recent improvements in income per capita and (2) consumers’ growing tendency to use high-quality, branded products increases. PNJ currently holds about 28% of share in the domestic branded jewelry market, outweighing runner-ups like Doji and SJC. Wide market coverage and strong brand recognition are primary advantages that has helped PNJ to expand their network. The expansion in distribution system positively supports sales and profit growth of PNJ. By developing its retail channel, which has the highest GPM (28.5%) compared to export (~12%) and wholesales (3-5%), PNJ will be able to improve its margins.
Forecasted EPS for 2017 and 2018 are VND 6,796 and VND 8,506 respectively.
PTB 128,800 The positive demand of natural stone brought a rapid growth for PTB in the past and we think this growth will continue in the next two years. At the moment, the market size for natural stone products is quite small. Meanwhile, many projects are being completed in the construction industry, which will be the driving force for the company’s sales volume. Regarding Phu Cat wood processing factory, we have an optimistic view on the demand given the recovery of the wooden products exports in Vietnam. However, the company will face challenges in finding a stable raw materials supply for its wood production business. There will be a slowdown in cars consumption in 2017 because of the ASEAN tariff reductions, so we think PTB’s automotive retail segment will follow the industry’s trend.
Forecasted EPS for 2017 and 2018 are VND 11,897 and VND 13,071 respectively.
STK 24,200 Considering the leading position of STK in the yarn industry in Vietnam, the company has benefited greatly from the recovery of textile and garment demand. STK's Q1 business results recorded revenue and PAT growth rates of 70.6% and 764.1% YoY, respectively. These figures were impressive partly when we compare them with 2016 - a bad year for STK as many unexpected problems occur. In 2016, STK's PAT dropped sharply by nearly 60% to around VND28.5 billion, which is the lowest level since 2009. In 2017, we believe that the recovery of textile and garment demand, along with positive signals from potential markets including Japan and South Korea, will benefit STK. For long-term perspective, the development of yarns that are in line with the "eco-friendly consumption" trend including recycled and colored yarns will be the highlight of this company.
Forecasted EPS for 2017 and 2018 are VND 1,990 and VND 2,654 respectively.
PAC PAC share has been rising steadily since the beginning of the year. Compared with the beginning of the year, this stock have increased dramatically (~71%) despite rising raw material prices, lower gross margin and declining earning’s outlook this year. We think factors that made stock prices rise rapidly in a short time are outside of the business prospects. There are a chain of supportive news happening simultaneously with the bull run of PAC share: (1) an increase of VND76 billion in 2016’s profit, (2) a change in the Board of Directors’ structure with tighter control from the company’s state-owned shareholder (Vinachem), and (3) the continuously net bought from foreign investors.
Based on 2017 outlook assuming demand for storage battery is positive and world lead prices is stable at USD2,100/ton, we use the DCF and PE methods to valuate PAC’s stock at VND40,600 per share. However, apart from fundamental factors, Vinachem’s divestment and the ambition to control this company of its strategic partner (Furukawa) will significantly impact on the stock’s movement. Given that this story will be prolonged, we recommend investors to HOLD this stock in the LONG-TERM.
Forecasted EPS for 2017 and 2018 are VND 2,599 and VND 3,721 respectively.
KLB 12,000 Going through the restructure phase of the banking industry, the rural joint stock commercial banks group, including KLB, faced many challenges and obstacles to maintain their operations. Contrary to many other banks in the same group that need to merge with big banks or fall into the category of "zero-dong", KLB has made great "self-restructure" efforts to go through this difficult period. Compared to state-owned banks or joint stock commercial bank in Groups 1 and 2, KLB does not have much advantage in terms of liquidity deposit or brand credibility. However, with a clear development strategy, KLB has been investing quite well in the technology platform as well as completing its product portfolio. Considering what KLB is working on, we believe KLB will be able to stand strongly and have good prospects for growth.
The relatively low profitability ratios are our biggest concern for KLB. However, KLB has the capital adequacy and liquidity ratios higher than those set by the SBV, and still be able to improve these ratios further. Thanks to the Directive 24 and the Bad Debt Resolution, the business environment of the banking industry in the second half of 2017 is promise to be more favorable. KLB will also be the beneficiary of this trend. Credit growth should outweigh the deposit growth in 2017, and NIM will improve slightly to 3.54%. We project the after-tax profit to grow approximately 68% YoY, driven by rising interest incomes and continuing service growth.
Forecasted EPS for 2017 and 2018 are VND 685 and VND 842 respectively.

Rong Viet Securities Corporation – Investment Strategy Report July 2017 23
Figure 25: RongViet Research’s stock pick
Source: RongViet Research; Price @ July 5th, 2017

Rong Viet Securities Corporation – Investment Strategy Report July 2017 24
Ticker
Exchange
Upside (%)
Rating Time horizon
2016 2017F 2018F PER
Trailing (x)
PER 2017F
(x)
PBR Cur. (x)
Div Yield
(x)
+/- Price
1y (%)
3-month avg. daily
vol. (shares)
3-month avg. daily turnover
(USD thousand)
Market cap (USD mn)
Foreign remaining
room (%)
Target price (VND)
Price @ July 5th
(VND)
+/- Rev. (%)
+/- NPAT
(%)
+/- Rev. (%)
+/- NPAT
(%)
+/- Rev. (%)
+/- NPAT
(%)
NTC UPCOM 73,800 48,700 51.5 Buy Long-term 17.8 121.4 21.6 -17.7 14.0 12.0 5.7 8.2 2.4 7.2 0.0 34,465 73 34 49.0
STK HSX 24,200 18,000 34.4 Buy Long-term 31.2 -59.9 38.6 272.4 7.8 33.3 20.4 9.0 1.3 5.6 -20.5 3,651 3 42 37.3
ACV UPCOM 67,000 50,800 31.9 Buy Long-term 11.2 -70.1 16.2 -20.1 17.1 26.3 32.0 23.1 4.5 1.8 0.0 238,521 528 4,851 45.5
VFG HSX 69,800 53,000 31.7 Buy Long-term 13.4 5.2 9.9 16.2 6.1 7.6 9.0 8.2 1.2 5.7 -7.5 7,029 22 55 27.7
DNP HNX 29,600 23,000 28.7 Accumulate Long-term 60.9 91.6 34.7 50.6 17.6 10.8 11.0 5.3 2.0 0.0 26.9 65,802 82 50 45.9
PVS HNX 21,900 17,500 25.1 Accumulate Long-term -20.0 -31.5 -0.8 -17.6 17.1 39.6 8.1 9.2 0.7 6.0 5.7 1,336,518 991 343 23.5
PGS HNX 21,900 17,700 23.7 Buy Intermediate-term -16.5 206.7 36.4 -63.7 6.8 6.5 9.1 7.2 0.9 2.5 15.9 239,615 194 39 34.7
DRC HSX 40,200 32,500 23.7 Accumulate Long-term 1.3 -4.8 15.3 8.6 7.8 17.5 10.2 9.8 2.3 9.2 -10.6 527,553 716 170 18.9
HPG HSX 40,000 32,900 21.6 Accumulate Long-term 21.2 89.4 20.8 9.3 26.6 9.4 5.6 6.7 1.9 0.0 55.6 4,351,260 5,845 2,192 10.4
TNG HNX 14,100 11,800 19.5 Accumulate Intermediate-term -1.9 13.9 17.0 16.5 10.5 11.1 5.9 5.9 0.8 0.0 -11.0 201,264 127 21 26.8
MIG UPCOM 15,600 13,100 19.1 Accumulate Long-term 23.1 83.5 0.0 19.6 N/a N/a 14.8 12.4 1.2 6.1 0.0 142,695 77 46 49.0
VSC HSX 73,700 62,200 18.5 Accumulate Long-term 16.6 -10.0 18.2 18.7 6.0 9.6 11.3 10.1 2.0 2.4 -2.0 136,834 361 124 -
PGI HSX 24,900 21,050 18.3 Accumulate Long-term 0.0 5.2 10.3 55.5 13.2 -13.5 13.1 9.4 1.7 5.7 30.5 65,280 65 66 47.8
PTB HSX 128,800 110,400 16.7 Accumulate Long-term 20.2 52.8 25.6 25.6 16.1 9.8 10.6 8.0 3.1 0.9 17.8 38,240 208 126 36.7
BMP HSX 113,800 98,500 15.5 Accumulate Long-term 18.5 20.9 11.2 7.9 13.1 10.0 15.4 13.2 1.9 5.8 11.8 116,901 821 354 3.0
VIT HNX 33,900 29,400 15.3 Accumulate Long-term 41.6 53.5 17.8 18.2 33.4 25.7 7.3 6.8 1.9 3.4 19.0 35,590 45 19 48.0
FPT HSX 53,200 46,700 13.9 Neutral Long-term 4.1 3.1 21.7 21.0 13.2 46.7 12.0 8.2 2.5 2.1 33.0 1,066,712 2,167 1,089 -
VNR HNX 27,300 24,200 12.8 Neutral Long-term -2.8 -1.2 18.2 9.6 4.3 6.8 12.7 12.1 1.2 4.5 26.5 10,860 12 139 19.3
PNJ HSX 114,000 101,900 11.9 Neutral Long-term 11.1 496.3 33.1 63.3 21.8 28.6 17.4 15.0 5.7 1.8 36.3 451,960 1,888 440 -
KLB UPCOM 12,000 10,900 10.1 Neutral Long-term 9.0 26.8 24.8 67.7 22.0 30.5 8.8 15.9 0.9 4.6 0.0 399,149 183 143 30.0
CTD HSX 237,700 216,000 10.0 Neutral Long-term 52.0 113.5 30.4 22.2 9.9 9.8 10.0 10.2 2.5 2.5 43.3 128,798 1,165 730 3.5
NNC HSX 67,570 62,330 8.4 Neutral Intermediate-term 14.9 49.8 23.5 25.7 8.1 3.4 7.5 8.0 3.1 8.0 20.5 27,826 97 60 27.9
NT2 HSX 31,900 29,450 8.3 Neutral Long-term 18.6 -4.9 -13.2 -10.6 4.5 0.3 8.1 9.2 1.6 8.5 -3.9 442,686 571 372 28.1
VCB HSX 41,700 38,850 7.3 Neutral Long-term 17.3 28.6 6.1 11.8 13.8 22.5 19.4 22.9 2.8 2.1 6.0 1,486,705 2,442 6,140 9.2
CTI HSX 31,500 29,700 6.1 Neutral Long-term 23.8 58.4 22.3 12.4 12.8 22.3 10.8 16.3 1.9 5.7 14.8 517,671 683 80 15.8
HIGHLIGHT STOCKS

Rong Viet Securities Corporation – Investment Strategy Report July 2017 25
Ticker Exchange
Upside (%)
Rating Time horizon
2016 2017F 2018F PER
Trailing (x)
PER 2017F
(x)
PBR Cur. (x)
Div Yield
(x)
+/- Price
1y (%)
3-month avg. daily
vol. (shares)
3-month avg. daily turnover
(USD thousand)
Market cap (USD mn)
Foreign remaining
room (%)
Target price (VND)
Price @ July 5th
(VND)
+/- Rev. (%)
+/- NPAT
(%)
+/- Rev. (%)
+/- NPAT
(%)
+/- Rev. (%)
+/- NPAT
(%)
PC1 HSX 37,000 34,900 6.0 Neutral Long-term -3.0 24.1 13.6 5.8 46.1 76.2 12.6 11.8 1.3 0.0 0.0 134,251 221 150 18.7
DPM HSX 25,000 23,600 5.9 Neutral Long-term -18.8 -23.3 16.4 4.9 20.5 -3.8 9.8 9.1 1.1 8.5 -6.2 1,020,327 1,041 406 29.9
PVT HSX 15,400 14,600 5.5 Neutral Long-term 16.9 12.9 6.6 5.9 10.6 9.5 9.2 9.9 1.1 6.8 31.7 751,494 446 180 20.8
HSG HSX 34,200 32,700 4.6 Neutral Intermediate-term 16.5 145.3 29.9 18.5 21.4 7.3 6.5 6.9 2.4 3.1 32.5 2,440,159 4,122 503 18.7
CTG HSX 21,200 20,400 3.9 Neutral Long-term 16.3 20.0 8.3 17.4 9.2 17.3 11.0 12.0 1.3 3.4 22.2 1,505,033 1,269 3,337 -
SVC HSX 54,500 52,700 3.4 Neutral Long-term 38.0 18.4 8.2 20.4 -5.0 4.5 10.7 5.1 1.5 3.8 1.3 65,566 148 58 6.8
BFC HSX 41,000 40,600 1.0 Neutral Long-term -1.6 21.0 17.8 18.4 15.8 10.1 7.7 7.9 2.4 9.9 71.5 308,916 523 102 29.0
VNM HSX 151,800 156,600 -3.1 Neutral Long-term 16.8 20.3 19.9 12.0 13.4 10.9 22.4 24.1 9.2 0.3 35.4 924,041 6,010 9,984 44.9
VJC HSX 121,000 125,200 -3.4 Neutral Long-term 38.6 113.3 41.5 42.5 22.0 25.2 15.1 13.0 7.9 1.2 0.0 378,974 2,134 1,773 5.8
MBB HSX 21,000 21,750 -3.4 Neutral Long-term 12.4 16.7 16.5 16.7 7.4 18.4 12.3 12.0 1.5 2.8 56.7 2,565,890 2,172 1,636 -
PPC HSX 19,400 20,300 -4.4 Neutral Long-term -22.0 -2.2 17.7 33.0 1.8 -3.3 7.7 9.6 1.2 7.4 54.3 138,983 119 284 32.0
REE HSX 35,500 37,600 -5.6 Neutral Long-term 38.4 28.2 23.1 10.1 0.0 11.4 8.7 9.9 1.7 4.3 94.1 1,410,693 1,968 512 -
ACB HNX 24,500 26,500 -7.5 Neutral Long-term 21.6 28.9 12.8 24.1 27.8 45.8 17.5 17.7 1.8 0.0 57.6 3,213,489 3,389 1,148 -
HT1 HSX 21,200 23,700 -10.5 Reduce Long-term 8.3 9.5 6.6 13.7 5.2 6.7 11.4 11.5 1.7 0.0 -10.6 613,304 601 397 41.6
NKG HSX 30,740 34,600 -11.2 Reduce Intermediate-term 55.4 310.7 62.0 29.0 14.6 10.4 5.1 3.8 1.3 0.0 89.4 534,099 864 151 18.2
PHR HSX 30,600 35,000 -12.6 Reduce Intermediate-term -4.0 3.9 61.0 48.6 20.0 11.0 8.8 10.9 1.2 4.3 85.2 671,108 917 121 41.5
IMP HSX 50,000 63,000 -20.6 Sell Long-term 4.8 8.9 24.6 33.5 18.4 17.8 20.1 20.4 1.8 3.3 67.4 42,223 112 119 -
TCM HSX 24,095 30,700 -21.5 Sell Long-term 10.0 -25.6 6.2 55.6 1.9 7.4 11.3 10.0 1.6 3.3 31.1 930,863 1,180 70 0.1
PAC HSX 40,600 52,800 -23.1 Hold Long-term 8.2 107.5 16.0 -27.0 11.4 20.4 20.4 19.7 4.3 3.8 27.2 196,135 381 108 17.8
SAB HSX 158,400 210,000 -24.6 Sell Long-term 12.6 31.3 11.2 4.2 12.9 4.2 28.9 30.7 10.8 1.0 0.0 99,061 845 5,916 39.2
VGC HNX 14,600 19,500 -25.1 Sell Long-term 4.1 56.4 8.8 23.6 13.6 9.1 10.3 10.5 1.4 3.6 0.0 355,267 268 366 39.9
DHG HSX 83,500 121,800 -31.4 Sell Long-term 4.9 20.6 12.4 10.0 9.7 9.2 21.7 15.5 3.5 1.2 88.2 230,138 1,310 700 0.2
MWG HSX 67,250 102,700 -34.5 Sell Intermediate-term 76.7 47.2 63.2 41.4 35.9 16.5 18.1 8.5 3.6 0.7 68.4 293,204 1,589 1,388 -
Rong Viet Securities Corporation – Investment Strategy Report July 2017 26
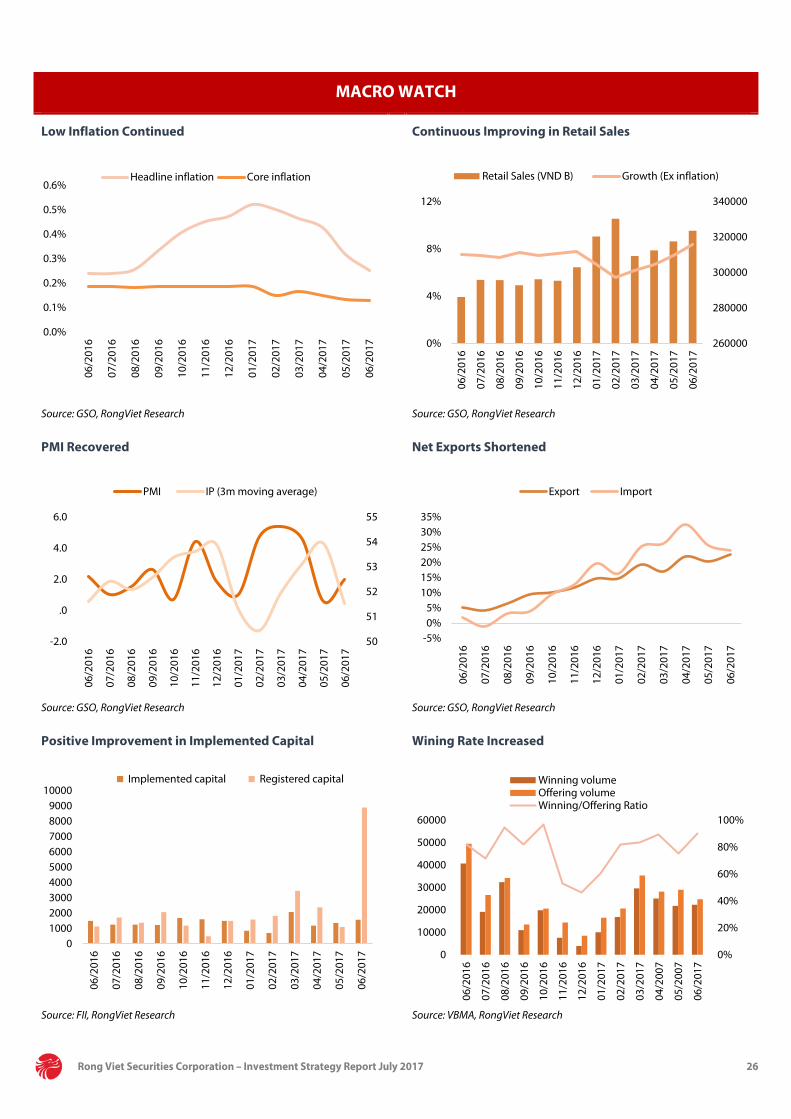
MACRO WATCH
Low Inflation Continued Continuous Improving in Retail Sales
Source: GSO, RongViet Research Source: GSO, RongViet Research
PMI Recovered Net Exports Shortened
Source: GSO, RongViet Research Source: GSO, RongViet Research
Positive Improvement in Implemented Capital Wining Rate Increased
Source: FII, RongViet Research Source: VBMA, RongViet Research
0.0%
0.1%
0.2%
0.3%
0.4%
0.5%
0.6%
06/2
016
07/2
016
08/2
016
09/2
016
10/2
016
11/2
016
12/2
016
01/2
017
02/2
017
03/2
017
04/2
017
05/2
017
06/2
017
Headline inflation Core inflation
260000
280000
300000
320000
340000
0%
4%
8%
12%
06/2
016
07/2
016
08/2
016
09/2
016
10/2
016
11/2
016
12/2
016
01/2
017
02/2
017
03/2
017
04/2
017
05/2
017
06/2
017
Retail Sales (VND B) Growth (Ex inflation)
-2.0
.0
2.0
4.0
6.0
06/2
016
07/2
016
08/2
016
09/2
016
10/2
016
11/2
016
12/2
016
01/2
017
02/2
017
03/2
017
04/2
017
05/2
017
06/2
017
50
51
52
53
54
55
PMI IP (3m moving average)
-5%0%5%
10%15%20%25%30%35%
06/2
016
07/2
016
08/2
016
09/2
016
10/2
016
11/2
016
12/2
016
01/2
017
02/2
017
03/2
017
04/2
017
05/2
017
06/2
017
Export Import
0100020003000400050006000700080009000
10000
06/2
016
07/2
016
08/2
016
09/2
016
10/2
016
11/2
016
12/2
016
01/2
017
02/2
017
03/2
017
04/2
017
05/2
017
06/2
017
Implemented capital Registered capital
0%
20%
40%
60%
80%
100%
0
10000
20000
30000
40000
50000
60000
06/2
016
07/2
016
08/2
016
09/2
016
10/2
016
11/2
016
12/2
016
01/2
017
02/2
017
03/2
017
04/2
007
05/2
007
06/2
017
Winning volumeOffering volumeWinning/Offering Ratio

Rong Viet Securities Corporation – Investment Strategy Report July 2017 27
INDUSTRY INDEX
Level 1 industry movement Level 2 industry movement
Source: RongViet Research Source: RongViet Research
Industry PE comparison Industry PB comparison
Source: RongViet Research Source: RongViet Research
8%
-2%
10%
4%
14%
6%
9%
7%6%
6%
-4%
-2%
0%
2%
4%
6%
8%
10%
12%
14%
16%
Tech
nolo
gy
Indu
stria
ls
Oil
& G
as
Cons
umer
Ser
vice
s
Hea
lth C
are
Cons
umer
Goo
ds
Bank
s
Basi
c M
ater
ials
Fina
ncia
ls
Util
ities
9%1%
6%8%
10%9%
6%0%
6%9%
6%9%
1%7%
6%6%
-6%14%
-10% -5% 0% 5% 10% 15% 20%
Retail
Insurance
Real Estate
Technology
Oil & Gas
Financial Services
Utilities
Travel & Leisure
Industrial Goods & Services
Personal & Household Goods
Chemicals
Banks
Automobiles & Parts
Basic Resources
Food & Beverage
Media
Construction & Materials
Health Care
12.813.9
16.5 16.1
21.2
19.1
15.8
7.5
20.3
13.4
17.4
12.5
Tech
nolo
gy
Indu
stria
ls
Oil
& G
as
Cons
umer
Ser
vice
s
Hea
lth C
are
Cons
umer
Goo
ds
Bank
s
Basi
c M
ater
ials
Fina
ncia
ls
Util
ities
HSX
HN
X
2.2
3.03.4
3.03.5
5.7
1.91.6
2.82.4
3.7
1.8
Tech
nolo
gy
Indu
stria
ls
Oil
& G
as
Cons
umer
Ser
vice
s
Hea
lth C
are
Cons
umer
Goo
ds
Bank
s
Basi
c M
ater
ials
Fina
ncia
ls
Util
ities
HSX
HN
X

Rong Viet Securities Corporation – Investment Strategy Report July 2017 28
DISCLAIMERS
This report is prepared in order to provide information and analysis to clients of Rong Viet Securities only. It is and should not be construed as an offer to sell or a solicitation of an offer to purchase any securities. No consideration has been given to the investment objectives, financial situation or particular needs of any specific. The readers should be aware that Rong Viet Securities may have a conflict of interest that can compromise the objectivity this research. This research is to be viewed by investors only as a source of reference when making investments. Investors are to take full responsibility of their own decisions. VDSC shall not be liable for any loss, damages, cost or expense incurring or arising from the use or reliance, either full or partial, of the information in this publication.
The opinions expressed in this research report reflect only the analyst's personal views of the subject securities or matters; and no part of the research analyst's compensation was, is, or will be, directly or indirectly, related to the specific recommendations or opinions expressed in the report.
The information herein is compiled by or arrived at Rong Viet Securities from sources believed to be reliable. We, however, do not guarantee its accuracy or completeness. Opinions, estimations and projections expressed in this report are deemed valid up to the date of publication of this report and can be subject to change without notice.
This research report is copyrighted by Rong Viet Securities. All rights reserved. Therefore, copy, reproduction, republish or redistribution by any person or party for any purpose is strictly prohibited without the written permission of VDSC.
IMPORTANT DISCLOSURES FOR U.S. PERSONS
This research report was prepared by Viet Dragon Securities Corp. (“VDSC”), a company authorized to engage in securities activities in Vietnam. VDSC is not a registered broker-dealer in the United States and, therefore, is not subject to U.S. rules regarding the preparation of research reports and the independence of research analysts. This research report is provided for distribution to “major U.S. institutional investors” in reliance on the exemption from registration provided by Rule 15a-6 of the U.S. Securities Exchange Act of 1934, as amended (the “Exchange Act”).
Any U.S. recipient of this research report wishing to effect any transaction to buy or sell securities or related financial instruments based on the information provided in this research report should do so only through Rosenblatt Securities Inc., 40 Wall Street 59th Floor, New York, NY 10005, a registered broker dealer in the United States. Under no circumstances should any recipient of this research report effect any transaction to buy or sell securities or related financial instruments through VDSC. Rosenblatt Securities Inc. accepts responsibility for the contents of this research report, subject to the terms set out below, to the extent that it is delivered to a U.S. person other than a major U.S. institutional investor.
The analyst whose name appears in this research report is not registered or qualified as a research analyst with the Financial Industry Regulatory Authority (“FINRA”) and may not be an associated person of Rosenblatt Securities Inc. and, therefore, may not be subject to applicable restrictions under FINRA Rules on communications with a subject company, public appearances and trading securities held by a research analyst account.
Ownership and Material Conflicts of Interest
Rosenblatt Securities Inc. or its affiliates does not ‘beneficially own,’ as determined in accordance with Section 13(d) of the Exchange Act, 1% or more of any of the equity securities mentioned in the report. Rosenblatt Securities Inc, its affiliates and/or their respective officers, directors or employees may have interests, or long or short positions, and may at any time make purchases or sales as a principal or agent of the securities referred to herein. Rosenblatt Securities Inc. is not aware of any material conflict of interest as of the date of this publication.
Compensation and Investment Banking Activities
Rosenblatt Securities Inc. or any affiliate has not managed or co-managed a public offering of securities for the subject company in the past 12 months, nor received compensation for investment banking services from the subject company in the past 12 months, neither does it or any affiliate expect to receive, or intends to seek compensation for investment banking services from the subject company in the next 3 months.
Additional Disclosures
This research report is for distribution only under such circumstances as may be permitted by applicable law. This research report has no regard to the specific investment objectives, financial situation or particular needs of any specific recipient, even if sent only to a single recipient. This research report is not guaranteed to be a complete statement or summary of any securities, markets, reports or developments referred to in this research report. Neither VDSC nor any of its directors, officers, employees or agents shall have any liability, however arising, for any error, inaccuracy or incompleteness of fact or opinion in this research report or lack of care in this research report’s preparation or publication, or any losses or damages which may arise from the use of this research report.

Rong Viet Securities Corporation – Investment Strategy Report July 2017 29
VDSC may rely on information barriers, such as “Chinese Walls” to control the flow of information within the areas, units, divisions, groups, or affiliates of VDSC.
Investing in any non-U.S. securities or related financial instruments (including ADRs) discussed in this research report may present certain risks. The securities of non-U.S. issuers may not be registered with, or be subject to the regulations of, the U.S. Securities and Exchange Commission. Information on such non-U.S. securities or related financial instruments may be limited. Foreign companies may not be subject to audit and reporting standards and regulatory requirements comparable to those in effect within the United States.
The value of any investment or income from any securities or related financial instruments discussed in this research report denominated in a currency other than U.S. dollars is subject to exchange rate fluctuations that may have a positive or adverse effect on the value of or income from such securities or related financial instruments.
Past performance is not necessarily a guide to future performance and no representation or warranty, express or implied, is made by VDSC with respect to future performance. Income from investments may fluctuate. The price or value of the investments to which this research report relates, either directly or indirectly, may fall or rise against the interest of investors. Any recommendation or opinion contained in this research report may become outdated as a consequence of changes in the environment in which the issuer of the securities under analysis operates, in addition to changes in the estimates and forecasts, assumptions and valuation methodology used herein.
No part of the content of this research report may be copied, forwarded or duplicated in any form or by any means without the prior.
Hanoi Branch
2C Thai Phien St., Hai Ba Trung Dist, Hanoi City
Tel: (84 4) 6288 2006
Fax: (84 4) 6288 2008
Can Tho Branch
95-97-99 Vo Van Tan – Ninh Kieu - Can Tho
Tel: (84 71) 381 7578
Fax: (84 71) 381 8387
Nha Trang Branch
50Bis Yersin St, Nha Trang
Tel: (84 58) 382 0006
Fax: (84 58) 382 0008
VIET DRAGON SECURITIES CORPORATION
Floor 1-2-3-4, Viet Dragon Tower,
141 Nguyen Du St. - Dist 1 – HCMC
Tel: (84 8) 6299 2006
Fax: (84 8) 6291 7986
Email: [email protected]
Website: www.vdsc.com.vn