rong viet securities - investment strategy report outlook 2018
TRANSCRIPT

BỨC TRANH LỢI NHUẬN QUÝ III/2013
A First Look at 2018 December 2017
Please see penultimate page for additional important disclosures. Viet Dragon Securities Corp. (“VDSC”) is a foreign broker-dealer unregistered in the USA. VDSC research isprepared by research analysts who are not registered in the USA. VDSC research is distributed in the USA pursuant to Rule 15a-6 of the Securities Exchange Act of 1934 solelyby Rosenblatt Securities Inc, an SEC registered and FINRA-member broker-dealer
DISCLAIMER:
This research report was prepared by Viet Dragon Securities Corp. (“VDSC”), a company authorized to engage in securities activities in Vietnam. VDSC is not a registered broker-dealer in the United States and, therefore, is not subject to U.S. rules regarding the preparation of research reports and the independence of research analysts. This research report is provided for distribution to “major U.S. institutional investors” in reliance on the exemption from registration provided by Rule 15a-6 of the U.S. Securities Exchange Act of 1934, as amended (the “Exchange Act”).Any U.S. recipient of this research report wishing to effect any transaction to buy or sell securities or related financial instruments based on the information provided in this research report should do so only through Rosenblatt Securities Inc., 20 Broad Street 26th Floor, New York NY 10005, a registered broker dealer in the United States. Under no circumstances should any recipient of this research report effect any transaction to buy or sell securities or related financial instruments through VDSC. Rosenblatt Securities Inc. accepts responsibility for the contents of this research report, subject to the terms set out below, to the extent that it is delivered to a U.S. person other than a major U.S. institutional investor.The analyst whose name appears in this research report is not registered or qualified as a research analyst with the Financial Industry Regulatory Authority (“FINRA”) and may not be an associated person of Rosenblatt Securities Inc. and, therefore, may not be subject to applicable restrictions under FINRA Rules on communications with a subject company, public appearances and trading securities held by a research analyst account.Ownership and Material Conflicts of InterestRosenblatt Securities Inc. or its affiliates does not ‘beneficially own,’ as determined in accordance with Section 13(d) of the Exchange Act, 1% or more of any of the equity securities mentioned in the report. Rosenblatt Securities Inc., its affiliates and/or their respective officers, directors or employees may have interests, or long or short positions, and may at any time make purchases or sales as a principal or agent of the securities referred to herein. Rosenblatt Securities Inc. is not aware of any material conflict of interest as of the date of this publication.Compensation and Investment Banking Activities Rosenblatt Securities Inc. or any affiliate has not managed or co-managed a public offering of securities for the subject company in the past 12 months, nor received compensation for investment banking services from the subject company in the past 12 months, neither does it or any affiliate expect to receive, or intends to seek compensation for investment banking services from the subject company in the next 3 months.Additional DisclosuresThis research report is for distribution only under such circumstances as may be permitted by applicable law. This research report has no regard to the specific investment objectives, financial situation or particular needs of any specific recipient, even if sent only to a single recipient. This research report is not guaranteed to be a complete statement or summary of any securities, markets, reports or developments referred to in this research report. Neither VDSC nor any of its directors, officers, employees or agents shall have any liability, however arising, for any error, inaccuracy or incompleteness of fact or opinion in this research report or lack of care in this research report’s preparation or publication, or any losses or damages which may arise from the use of this research report.VDSC may rely on information barriers, such as “Chinese Walls” to control the flow of information within the areas, units, divisions, groups, or affiliates of VDSC.Investing in any non-U.S. securities or related financial instruments (including ADRs) discussed in this research report may present certain risks. The securities of non-U.S. issuers may not be registered with, or be subject to the regulations of, the U.S. Securities and Exchange Commission. Information on such non-U.S. securities or related financial instruments may be limited. Foreign companies may not be subject to audit and reporting standards and regulatory requirements comparable to those in effect within the United States.The value of any investment or income from any securities or related financial instruments discussed in this research report denominated in a currency other than U.S. dollars is subject to exchange rate fluctuations that may have a positive or adverse effect on the value of or income from such securities or related financial instruments.Past performance is not necessarily a guide to future performance and no representation or warranty, express or implied, is made by VDSC with respect to future performance. Income from investments may fluctuate. The price or value of the investments to which this research report relates, either directly or indirectly, may fall or rise against the interest of investors. Any recommendation or opinion contained in this research report may become outdated as a consequence of changes in the environment in which the issuer of the securities under analysis operates, in addition to changes in the estimates and forecasts, assumptions and valuation methodology used herein.No part of the content of this research report may be copied, forwarded or duplicated in any form or by any means without the prior

3
REPORT CONTENT
MACRO OUTLOOKS
STOCK MARKET OUTLOOKS
INVESTMENT IDEAS & STOCK PICKS

MACRO ECONOMICS

5
2017: Impressive Performance
Vietnam’s GDP growth was at the top of Asia Interest rate’s gradual drop and a newly low platform
Source: Bloomberg, A.T. Kearney, RongViet Research
Foreign capital still flowed into Vietnam Vietnam’s retail market: sweet fruit
2.7%
3.0%
0%
2%
4%
6%
8%
Taxes and subsidies ServiceIndustry and construction Agriculture, forestry and fishingGDP growth 2017 GDP growth 2016
100
150
200
250
300
350
0
2
4
6
8
10
12
14
16
05/12 05/13 05/14 05/15 05/16
VGB 5Y yield VGB 10Y yieldCPI RHS Short-term Lending rateVietnam 5Y CDS RHS
(%) (Points)
-8-6-4-202468
1012
Q1 2013 Q1 2014 Q1 2015 Q1 2016 Q1 2017
Net Errors and OmissionsFinancial AccountCapital AccountCurrent Account
(USD B)
0
20
40
60
80
100
120 GRDI Score Time pressure*(Points)
Note: 1) High time pressure means it is urgent to enter the country and capture the growth opportunity2) Vietnam’s lower 5Y CDS illustrates a sorter mid-term risk

6
2018 economic outlook: Identifying the prospects
2018 business environment: • According to RongViet Research’s forecast, the 2018 economic growth will reach 6.70% YoY (basic scenario) and 7.0% YoY
(positive scenario), thanks to 2 drivers, including consumption and investment
• Interest rate burden put on prioritized sectors is likely to decline in the context of VGBs’ low yield
• SBV stands keeps loosening monetary policy which is expected to ease negative effects on domestic commodity prices
• Basic commodity prices will rally gradually
• FX risk is low in H1 2018
Hope for turning points:• Investment opportunities stemming from the state divestment plan in the hope of higher business efficiency of divested
companies
• Strengthening of public revenue via consumption tax’s hikes
• Identifying long-term momentum of the economy, including 3 SEZs named Van Don, North Van Phong, and Phu Quoc
• Completely reducing 1/3–1/2 of business registration documents
• Renegotiating lots of trading agreements, such as CPTPP, RCEP, and EVFTA
2018 themes:Theme 1 : 2018 – switching points of state divestment plan
Theme 2 : Restructuring public revenue
Theme 3 : Consumer financing – opening a door for credit growth
Theme 4 : SEZs – hope for new momentum?

7
2018 Forecast
Source: RongViet Research
2015 2016 2017E 2018F
GDP growth 6.68% 6.21% 6.65% 6.7%-7.0%
Trade balance (USD B) -4.1 +1.78 +2.0 +1.8
Export growth 7.9% 9.0% 18.9% 13.8%
Import growth 12.0% 5.6% 19.2% 14.0%
Inflation 0.6% 2.66% 3.62% 3.71%
Refinancing interest rates 6.5% 6.50% 6.25% 6.25%
M2 growth 14.5% 18.4% 17.5% 17.0%
Credit growth 17.3% 18.2% 19.0% 18.0%
Public deficit 4.6% 3.64% 3.5% 3.7%
Trading USD/VND rate 22,485 22,761 22,715 23,014

8
Theme 1: 2018 – Switching point for state divestment plan
Source: GSO, HNX, Fin Pro, RongViet Research
Completing most of the equitization plan Slow state divestment
~60% of domestic-denominated bond dues in 2018-2021 Comments:
There will be 89 SOE equitization in 2018-2020. After 30
years, Vietnam expectedly completes the equitization
plan on 4.655 state-owned companies
However, state ownership ratio remains high due to
extremely low state divestment
2018 is willing to be a switching point of state divestment
plan as there are 181 companies, 70% of a 3-year plan in
2018-2020
0
1
2
3
4
5
0
50
100
150
200
250
300 Book value Divestment value Premium(VND T)
An engine behind significant state divestment effort
0
2
4
6
8
10
12(USD B)
Note: 2017’s divestment value excludes Sabeco’s USD4.8B value deal

9
Theme 1: 2018 – Switching point for state divestment plan
Source: Bloomberg, HNX, RongViet Research
The government removes administrative obstacles Tightening cycle is at the beginning
Regarding SOE equitization, Decree No.126/2017/ND-CP:
• Supporting potentially strategic investors as the non-transferable time will be cut down to 3 years from 5 years
• Pushing listing/registering after equitization
• Diversifying valuation methods by adding book building method
• Land ownership right’s revaluation is based on market value
• Guidelines of calculating goodwill value
Regarding the state divestment, draft decree amending andsupplementing some articles of Government's Decree No91/2015/NĐ-CP:
Interest rates of South Korea and China
• Rebuilding a 2-step divestment process, consisting of publicoffering auction and put-through transactions, of which,public offering auction includes normal auction and large-size auction
• Legalizing unregistered state ownership public offeringauction
• Accepting a lower divestment value compared with itsbook value 3
4
5
6
7
01/12 09/12 05/13 01/14 09/14 05/15 01/16 09/16 05/17
South Korea China(%)
Encouraging environment and the government’s action
-0.2
0
0.2
0.4
0.6
0.8
-1
0
1
2
3
4
5
6
7
01/00 01/02 01/04 01/06 01/08 01/10 01/12 01/14 01/16
ECB LHS FED LHS BOJ RHS(%) (%)

10
Theme 1: 2018 – Switching point for state divestment plan
Source: Bloomberg, HNX, RongViet Research
FX reserve: Will the 10-year-ago event recur? Considerate M2 growth
Controlling floating money Adjusting short-term money via OMO channels
05
101520253035404550
1997 1999 2001 2003 2005 2007 2009 2011 2013 2015 2017E
(USD B)
0%
10%
20%
30%
40%
50%
60%
2006 2007 2008 2009 2010 2011 2012 2013 2014 2015 2016 2017
Credit growth M2 growth
0
200
400
600
800
1,000
1,200
1,400
2012 2013 2014 2015 2016 2017E
Loan value
Net VGBs value
Money supply
Liquidity gap
-300
-200
-100
0
100
200
300
05/12 12/12 07/13 02/14 09/14 04/15 11/15 06/16 01/17 08/17
Reverse repoOutrightTotal trading value
(Trillion VND)
SBV policies to adapt to a new environment

11
Theme 1: 2018 – Switching point of state divestment plan
Source: RongViet Research compiles
Natural Rubber Oil&Gas Utility Industry
Agriculture Oil&Gas Utility Cement
Aviation Pharmacy Textile Construction material
IPO – State divestment in 2018

12
Theme 2: Restructuring public revenue
Source: Bloomberg, RongViet Research
Public debt-to-GDP rate close to the roof of 65% 40% gap of capital for infrastructure investment
A massive loss caused by lower export-import taxes Comments:
• Restructuring public budget plays an important role
• Significant revenue like export-import tax, grants and
priority loans will drop, resulting in changes in revenue
structure
• Lack of infrastructure investment calls for private sectors’
participation
0
5
10
15
20
25
30
2007 2010 2013 2016 2019 2022 2025 2028 2031 2034 2037 2040
Energy TelecommunicationAirport PortsRail RoadWater
(USD B)
0%
5%
10%
15%
20%
25%
2007 2010 2013 2016 2019
ACFTA AFTAAKFTA AIFTAAANZFTA EPA
0
5,000
10,000
15,000
0%
20%
40%
60%
80%
2009 2010 2011 2012 2013 2014 2015 2016 2017E2018F
Grants RHSPublic debt-to-GDP rate LHSDebt repayment-to-public revenue rate LHS
(VND B)
Fiscal “wheel” wears out

13
Theme 2: Restructuring public revenue
Source: MOF, RongViet Research
Public revenue structure Public expense structure*
(1) Income and consumption taxes account for the biggest percentage of total revenue, 26.3% and 37.4%, respectively
(2) Fees, charges and non-tax surges 20.6% YoY, accounting for 17% of total revenue
(3) Environmental protection tax grows at an annual 22 pace on average and accounts for 3.9% of total revenue
(4) Revenue from Lottery was added
(1) Regular expenditures climb 13,1% YoY in 10 years and accounts for 74% of total expense
(2) Investment expenditures increase only 8,7% YoY and its percentage drops to 26% of total expense
(3) According to the financial restructure plan, the government prioritizes debt repayment in 2016-2020
* Note: Public expenditures exclude principal repayment
Public revenue structure Public expense structure
0%
20%
40%
60%
80%
100%
2005 2006 2007 2008 2009 2010 2011 2012 2013 2014 2015 2016 2017
Income taxes Consumption taxesExport-Import taxes Environmental protection taxRevenue from Loterry Other taxesFees, charges and non-tax Grants
0%
20%
40%
60%
80%
100%
2005 2006 2007 2008 2009 2010 2011 2012 2013 2014 2015 2016 2017
Administration expenditures Economic expendituresSocial expenditures Interest paymentOthers Investment expenditures
Public budget structure

14
Theme 2: Restructuring public revenue
Source: MOF, RongViet Research
Type Impact
Value-Added Tax (VAT)
1) The MoF estimates the VAT increase could add 0.06-0.39% to CPI
2) RongViet Research estimates budget revenue could be added by VND70,000 billion-VND90,000 billion
3) Vietnam’s shadow economy, equivalent to 15.1% of GDP, may increase
4) Strongly impacted sectors: Consumer; Real Estate; Agriculture
Special Sale Tax 1) Special Sales Tax contributes to 7-8% of total budget revenue. The increase of SST for soft drinks andcigarettes could boost budget revenue in the medium term
2) Allow domestic car manufacturers to better compete with imported cars
Corporate Income Tax 1) SMEs make up 95% of all companies operating in Vietnam. Therefore, tax reduction will enhance suchbusinesses
2) CIT from SMEs contributes less than 1% to total budget revenue. So we think the tax cuts will impactinsignificantly to budget revenue
3) Limit corporate leverage, especially state-owned corporation
4) Weakening the momentum of price transferring
Personal Income Tax 1) Supporting medium-income class
2) Encouraging employees in the prioritized sectors
3) Rising public revenue via tax burden put on lottery income
Tax reform
15
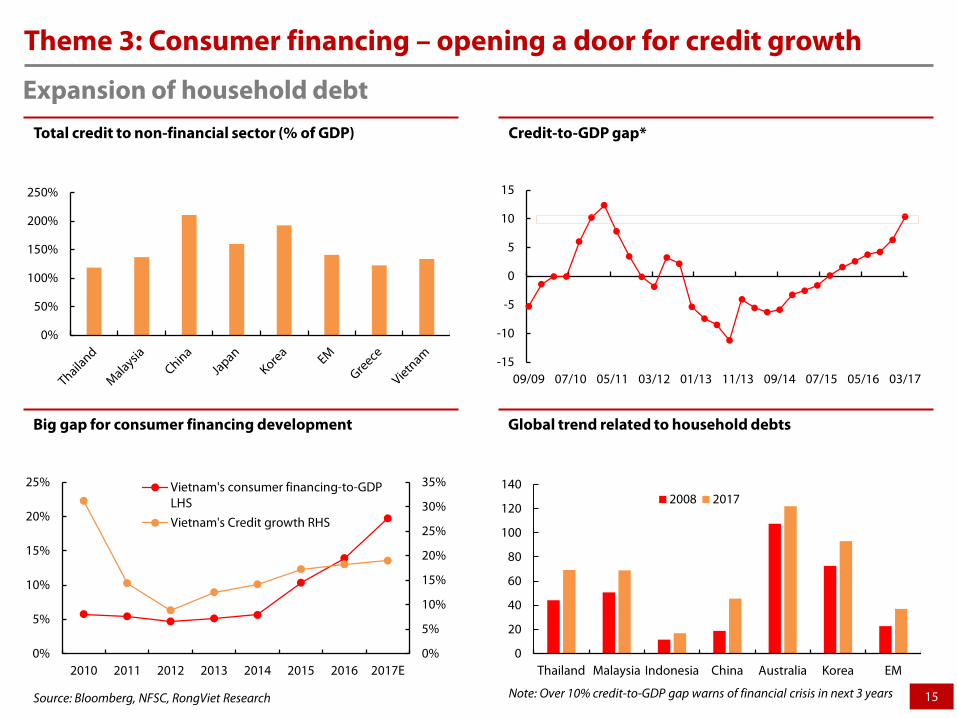
Theme 3: Consumer financing – opening a door for credit growth
Source: Bloomberg, NFSC, RongViet Research
Total credit to non-financial sector (% of GDP) Credit-to-GDP gap*
Big gap for consumer financing development Global trend related to household debts
-15
-10
-5
0
5
10
15
09/09 07/10 05/11 03/12 01/13 11/13 09/14 07/15 05/16 03/17
0%
50%
100%
150%
200%
250%
0
20
40
60
80
100
120
140
Thailand Malaysia Indonesia China Australia Korea EM
2008 2017
0%
5%
10%
15%
20%
25%
30%
35%
0%
5%
10%
15%
20%
25%
2010 2011 2012 2013 2014 2015 2016 2017E
Vietnam's consumer financing-to-GDPLHSVietnam's Credit growth RHS
Expansion of household debt
Note: Over 10% credit-to-GDP gap warns of financial crisis in next 3 years

16
Theme 3: Consumer financing – opening a door for credit growth
Source: Bloomberg, NFSC, RongViet Research
Consumption contribution to GDP Consumer financing structure
Banks take the driving role Low net-interest margin
8.43 8.97
18.0723.27
0.47 1.53
2.53
3.28
0
5
10
15
20
25
30
2013 2014 2015 2016
Finance companiesBanks
Spread-out effects on the economy
2.4%
2.6%
2.8%
3.0%
3.2%
3.4%
5%
10%
15%
20%
2012 2013 2014 2015 2016 2017E
NIM RHSShort-term lending rate LHSShort-term deposit rate LHSBanks' Consumer financing interest rate LHS
0%
10%
20%
30%
40%
50%
60%
70%
80%
90%
China Thailand Indonesia Philippines Vietnam
52.36%15%
24%
1%
3% 4.64%
Buy/repair houses Transport
Durable goods Hi-tech goods
Education, tourism, health care Others

17
Theme 3: Consumer financing – opening a door for credit growth
Source: Bloomberg, Savills, RongViet Research
Saving/GDP rates of Asian nations Stock market movement
Real estate prices climb in Ho Chi Minh city Lesson from other countries
70
75
80
85
90
88
89
90
91
92
93
94
Q1/2012 Q1/2013 Q1/2014 Q1/2015 Q1/2016 Q1/2017
Housing Price Index LHS
Office Price Index RHS
0%
10%
20%
30%
40%
50%
-15%
-10%
-5%
0%
5%
10%
15%
20%
25%
0%
1%
2%
3%
4%
5%
6%
7%
8%
03/13 10/13 05/14 12/14 07/15 02/16 09/16 04/17 11/17
Potential risks from surging consumer financing growth
100
200
300
400
500
25
50
75
100
125
1981 1984 1988 1992 1995 1999 2003 2006 2010 2014
Canada new housing price index LHSCanada Household Debt-to-GDP ratio LHSUS household debt-to-GDP ratio LHSU.S. Housing price index RHS
(%) (Points)

18
Theme 4: SEZs – hope for a new momentum?
Lessons from other countries
Contents China India
Results SEZs account for 22% of China’s GDP growth, creating 30 million jobs; taking 45% of FDI
Upto 2014, only 164/564 SEZs are alive
Size Very big. Typically in hundreds of hectares Over 10 hectares
Position Well thought out and located only on coasts to facilitate exports and importseasily.
Anywhere. No restriction
Number Only 6 SEZs: Shenzhen, Zhuhai, Shantou, Xiamen, Hainan and Pudong Any number
Policy regime Experimentation of liberal policies in the specified areas Based on fiscal sops.
Labor law Relaxed in the SEZs Flexibility is totally absent
Investors Basically foreigners who are wooed with sops and promises of stability in policy
Basically local not foreign investor driven; which should have been the case.
4%
5%
6%
7%
8%
9%
10%
1991 1994 1997 2000 2003 2006 2009 2012 2015
GDP growth
Manufacturing Area Industrial Area High-tech, border-gate economic zones Open and Coastal Economic Zones
Source: GSO, RongViet Research
The economy’s momentum is weakening

19
Theme 4: SEZs – hope for a new momentum?
Van Don
1) Prioritized sectors:• Hi-tech projects• Supporting industry• Tourism• Logistics
2) Job creation (2030): 132,0003) Additional public revenue (2021-2030): USD4 billion4) Added value (2021-2030): USD9.7 billion
North Van Phong
1) Prioritized sectors:• Information technology• Electricity• Exact mechanics• Ports and logistics• Defense• Tourism• Commerce–finance
2) Job creation (2030): 65,0003) Additional public revenue (2021-2030): USD2.2 billion4) Added value (2021-2030): USD10 billion
1) Prioritized sectors:• Tourism• Retail• Healthcare
2) Job creation (2030): 57,6003) Additional public revenue (2021-2030):
USD3.3 billion4) Added value (2021-2030): USD19 billion
Phu Quoc
SEZs’ Impact

20
Theme 4: SEZs – hope for a new momentum?
Stage 1 Stage 2 Stage 32022 2026 2030
Preliminary Period 2018
• Entertainment casino• Port and airline services• Shopping center• Creative technology; entrepreneur
center
• Seafood processing• Logistic services• Education; Health services• Finance services
• Bioengineering• Green technology• High technology,…
Van Don
Preliminary Period 2018
• Complete legal formalities, planning, arrange management system
• Build main infrastructure
• Complete synchronized substruction and legal system
• Attract investment and main sectors
• Deep investment to establish international city status
• Create spillover effect
• Build cargo port, international airline port
• Build shopping center – finance• Build urban area• Develop model: high-tech area, high-
tech center
• Transport by international airline; develop port service
• Build finance - banking; attract international funds
• Build yacht port; Education; Health services• Develop high technology for national
defence, new building material technology; biology technology,….
• Develop and optimize port services• Develop finance forms, securities,
venture capital,….• Develop services, traveling,….• Develop R&D activities
Bac Van Phong
Stage 1 Stage 22025 2030
Start 2018
Acceleration Develop and disseminate2021 2025
• Create spillover to Kien Giang and national economy
• Expand pilot with opener regulars
Develop main sectors:• Traveling• Shopping center and exhibition• Study and development
Develop momentum sectors:• Processing• Communication and logistics• Universal education and finance
services• Health services,…
Develop other sectors:• Bio-engineering, green technology• High-tech appliance center, AI• Advanced telecommunication services• Investment funds
Phu Quoc
• Complete legal formalities, planning, arrange management system
• Build main infrastructure
• Complete synchro substruction and legal system
• Attract investment and main sectors
SEZs development process

21
List of potential risks
No Risk Impact Level Probability
1 Unreal bad debts solved Direct
2 Delay of IPOs & state divestment Direct
3 Negative effects of consumption tax hikes
Direct
4 Foreign outflow Direct
5 Commodity prices Direct
6 China’s economic policies Direct
7 China-US relationship worsens Indirect
8 Political risks Indirect
Note: Probability-Impact Assessment
Very high High Medium Low Very low

22
Appendix: Some projects in SEZs
Source: RongViet Research
Name Sector Size (VND B) Investors Status
Van Don
Van Don International Airport Infrastructure 7,500 Sun Group Operation in 2018
Ha Long - Hai Phong Highway Infrastructure 13,600 CIENCO 4 Operation in 2018
Ha Long – Van Don Highway Infrastructure 13,988 BOT Bien Cuong JSC. Operation in 2018
Van Don – Mong Cai Highway Infrastructure 16,014 N/A Start in 2017
Bac Cai Bau seaport Infrastructure 2,200 MBLand Hoildings Studying
Van Don Heritage Road Tourism 5,000 Van Don Heritage Road JSC. Studying
Sonasea Dragon Bay Tourism 4,950 CEO group Studying
Furama Ha Long Viet Nam Resort & Villas Tourism 1,120 Viglacera corporation Pending
Eco-tourism area Ngoc Vung, Van Canh Tourism 46,000 FLC group Studying
Non-tariff, clean industrial zone Industrial area 31,500 N/A N/A
Van PhongVan Phong 1 Thermal Power Project Energy 58,721 Sumitomo corporation (Japan) Licensed
Nam van phong petrochemical refinery complex Energy 109,248 Petrolimex and Nippon Oil Energy (Japan) Licensed
Phu Quoc
Phu Quoc International Passenger Port Infrastructure 1,600 Vingroup Operation in 2018
The Phu Quoc Cable Car Tourism 10,000 Sun Group Operation in 2018
Safari Park Infrastructure 3,150 Vingroup Pending
Deep Water Port Infrastructure 2,000 PVN Pending
Sun World Hon Thom Natural Park Tourism 10,000 Sun Group Pending
Expansion of International Airport Infrastructure 2,000 Airport Corporation of Vietnam Operation in 2018
Sonasea Villas & Resort Tourism 4,500 CEO group N/A
Phu Quoc Marina Tourism N/A BIM group N/A
Condotel Premier Residences Tourism N/A Sun group N/A
The Coast Villas Tourism N/A Nam Land N/A
Grand Word Tourism 7,500 LDG Group Pending

23
Appendix: Tax reformTypes Key changes Impact
Value-
Added Tax
(VAT)
1) Increase the current standard VAT rate to 12% from 10%.2) Transfer of land use rights is proposed to be changed from VAT exempt to taxable At the standard VAT rate.3) Remove the role of subtracting land-use-right transfer price/land rent out of real estate prices used to calculate VAT4) Transfer of fertilizers, agricultural machines, off-shore fishing boats from VAT exempt to taxable.5) Threshold for payment by bank for both VAT and CIT purposes is proposed to be reduced from VND20 million toVND10 million6) The draft law removes a number of goods/services entitled to 5% VAT rate, moving them to the standard tax rate(water, medical and educational equipment used for multiple purposes, sporting and entertaining activities, books)
1) The MOF estimates the VAT increase could add 0.06%-0.39% to CPI.2) RongViet Research estimates public revenue could beadded VND70,000 billion – VND90,000 billion.3) Vietnam’s shadow economy, currently equivalent to 15.1%of GDP, may grow.4) Significantly under-impacted sectors: Consumer; RealEstate; Agriculture; etc.
Special
sale tax
(SST)
1) Introduce SST on soft drinks at either 10% or 20% from 01 Jan 2019.2) Increase taxes for cigarettes and cigars:• Add a fixed SST charge of VND1,000 per pack of 20 cigarettes and VND1,500 per cigar, effective 01 January 2020; or• Increase the SST rate from 75% to 80% on cigarettes from 1 January 2020 and to 85% from 1 January 2021.3) Amend taxable revenue for automobiles with less than 9 seats manufactured in Vietnam to sales price of manufacturer exclusive of the value of spare parts produced domestically.4) Hike SST on imported pickup trucks: 60% of the rate on sedans with the same engine capacity.
1) Special Sale Tax contributes to 7-8% of total budgetrevenue. Such hike could boost budget revenue in themedium term.2) Allow domestic car manufacturers to better compete withimported cars.
Corporate
Income
Tax (CIT)
1) CIT burden put on SMEs will be down to 15%-17%.2) Tax on capital/share transfers by non-residents (CAPT): 1% on sales proceeds as opposed to the current 20% on net gain.3) Proposal to allow offsetting of gains from real estate transfers against losses from operations.4) Introduction of thin capitalization rules: no tax deduction for interest where debt to equity ratio exceeds 5:1 for manufacturing companies, 4:1 for other industries and 12:1 for banking.
1) SMEs make up 95% of all companies operating in Vietnam.Therefore, facilitating SMEs groups through tax incentives isone of the ways to upgrade growth driver in Vietnameconomy.2) CIT from SMEs contributes less than 1% to total budgetrevenue. So, the tax cut will impact insignificantly to budgetrevenue.3) Discouraging high corporate leverage, especially state-owned companies.4) Limiting transfer pricing manipulation.
Personal
Income
Tax (PIT)
1) Reduce the number of tax brackets from 7 to 5 for employment income for tax residents and broaden the tax base for middle income earners.2) There is 50% reduction of PIT on employment income of individuals working in IT industry, agriculture, and agricultural product processing projects.3) PIT on both residents and nonresidents for capital transfer is proposed to be 1% on sales proceeds.4) Amend the tax rate for income from prizes from flat rate of 10% to progressive rates up to 30%.
1) Supporting mid-class income persons.2) Encouraging employment in prioritized sectors.3) Increase budget revenue via increase of tax on prizes.
Source: RongViet Research

STOCK MARKET OUTLOOKS

25
Market review: beyond expected
650
680
710
740
770
800
830
860
890
920
950
980
0
50
100
150
200
250
300
350
03/01 17/01 07/02 21/02 07/03 21/03 04/04 19/04 05/05 19/05 02/06 16/06 30/06 14/07 28/07 11/08 25/08 11/09 25/09 09/10 23/10 06/11 20/11 04/12 18/12
Bad debt resolutiondicussion
Banking and real estate stocks continued to increase
SAB started to increase as state divestment confirmed to happen in 2017
Debut of the derivative market
GAS, PVD, PVS rallied as oil price recovered strongly
State divestment speed up: IDC, VNM, SAB, DMC, BMP, NTP, FPT, etc
Despite low liquidity, market advanced thanks to large cap stocks
- Extended the timeline applying Circular 06 - Prime Minister decided to boost credit growth further - VRE listed on
HOSE- VIC surged
- SAB auctioned at VND320,000/share
Banking stocks rallied
US bombed Afghanistan
Real estate stocks rallied
YTD: +43.4%
- Banking stocks returned thanks to recapitalization
- Strong state divestment due to public debt reached the limit

26
Market review: moderated earnings growth, yet higher P/E
Vietnam stock market relative valuations
Source: Bloomberg, RongvVet Research
Change of market cap over the last 10 years
Source: Bloomberg, Rongviet Research
0%
5%
10%
15%
20%
25%
30%
35%
1012141618202224
Viet
nam
Chin
a
Hon
g Ko
ng
Indi
a
Taiw
an
Kore
a
Mal
aysi
a
Indo
nesi
a
Phili
ppin
es
Sing
apor
e
Thai
land
Current P/E 2018E Earning growth (%)
29%
-39%
74%
14%
-14% -12%
16%
4%9%
-8%
13%
0%
1%
2%
3%
4%
5%
6%
-40%
-20%
0%
20%
40%
60%
80%
2007 2008 2009 2010 2011 2012 2013 2014 2015 2016 2017E
Earnings growth (left axis) Dividend yield (right axis)
Earnings growth of VNIndex 2007 – 2017

27
o 2017 is the most active year of foreign investors
o Net value in 2017: USD1.07 billion (VND23,830 billion)
o 10-year accumulated value: USD4.4 billion
o Food & beverage was the most favorite destination of foreign capitals
Market review: strong foreign inflows
Foreign investors’ accumulated value Foreign investors’ net buying values categorized by sectors
Source: Fiinpro, RongViet Research
0
500
1,000
1,500
2,000
2,500
3,000
3,500
4,000
4,500
5,000
-200
-100
0
100
200
300
400
500
600
01-0
1-07
01-0
8-07
01-0
3-08
01-1
0-08
01-0
5-09
01-1
2-09
01-0
7-10
01-0
2-11
01-0
9-11
01-0
4-12
01-1
1-12
01-0
6-13
01-0
1-14
01-0
8-14
01-0
3-15
01-1
0-15
01-0
5-16
01-1
2-16
01-0
7-17
Net Value(mn $) Accumulate value (mn$)
29%
15%
14%
11%
11%
9%
5%6% Food & Beverage
Financial Services
Real Estate
Banks
Basic Resources
Utilities
Construction & Materials
Others
28
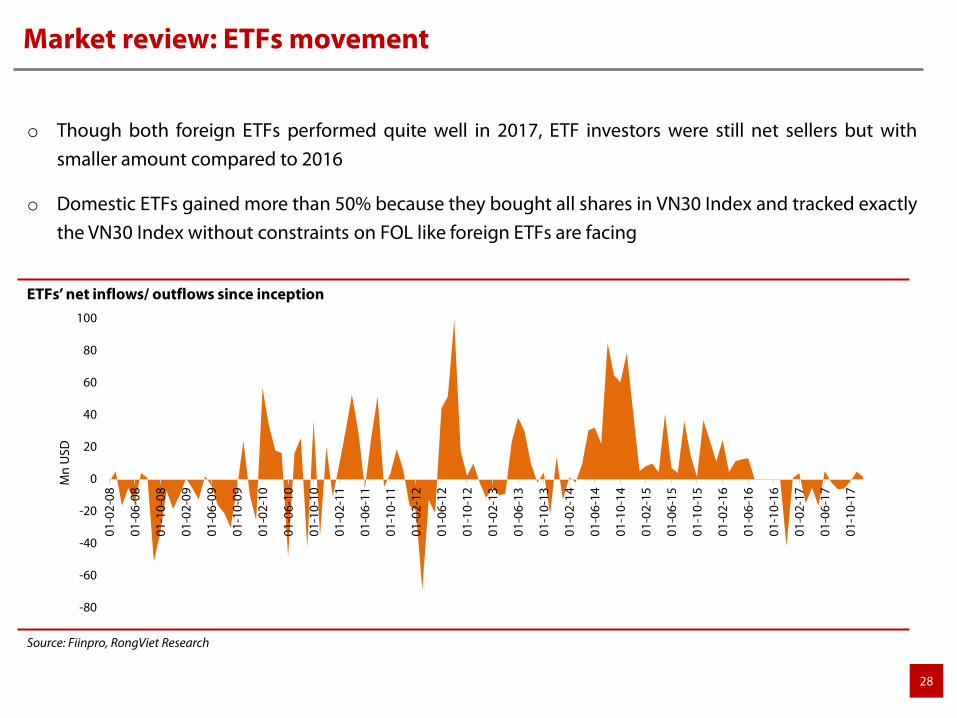
o Though both foreign ETFs performed quite well in 2017, ETF investors were still net sellers but withsmaller amount compared to 2016
o Domestic ETFs gained more than 50% because they bought all shares in VN30 Index and tracked exactlythe VN30 Index without constraints on FOL like foreign ETFs are facing
Market review: ETFs movement
ETFs’ net inflows/ outflows since inception
Source: Fiinpro, RongViet Research
-80
-60
-40
-20
0
20
40
60
80
100
01-0
2-08
01-0
6-08
01-1
0-08
01-0
2-09
01-0
6-09
01-1
0-09
01-0
2-10
01-0
6-10
01-1
0-10
01-0
2-11
01-0
6-11
01-1
0-11
01-0
2-12
01-0
6-12
01-1
0-12
01-0
2-13
01-0
6-13
01-1
0-13
01-0
2-14
01-0
6-14
01-1
0-14
01-0
2-15
01-0
6-15
01-1
0-15
01-0
2-16
01-0
6-16
01-1
0-16
01-0
2-17
01-0
6-17
01-1
0-17
Mn
USD

29
o Market cap has increased gradually and surged to 68% GDP in 2017 thanks to large cap stocks listed
o Average daily turnover in 2017 increased ~63% compared to that of 2016
o Margin lending has been increasing continuously since 2016, which is a factor that helps boost theliquidity on the market
Market review: Liquidity surged
Change of market cap over the last 10 years
Source: Bloomberg, RongViet Research
0%
10%
20%
30%
40%
50%
60%
70%
80%
0
500
1,000
1,500
2,000
2,500
2006 2008 2010 2012 2014 2016
Thou
sand
bill
ion
VND
HSX HNX % Marcap to GDP
Change of turnover over the last 10 years
Source: Bloomberg, Rongviet Research
-75%
-25%
25%
75%
125%
175%
225%
275%
0
1,000
2,000
3,000
4,000
5,000
6,000
2007 2008 2009 2010 2011 2012 2013 2014 2015 2016 YTD2017
Bn V
ND
HSX HNX Growth

30
o More listed firms, more “float” thanks to regulations supporting IPO, state divestment, new listing shares
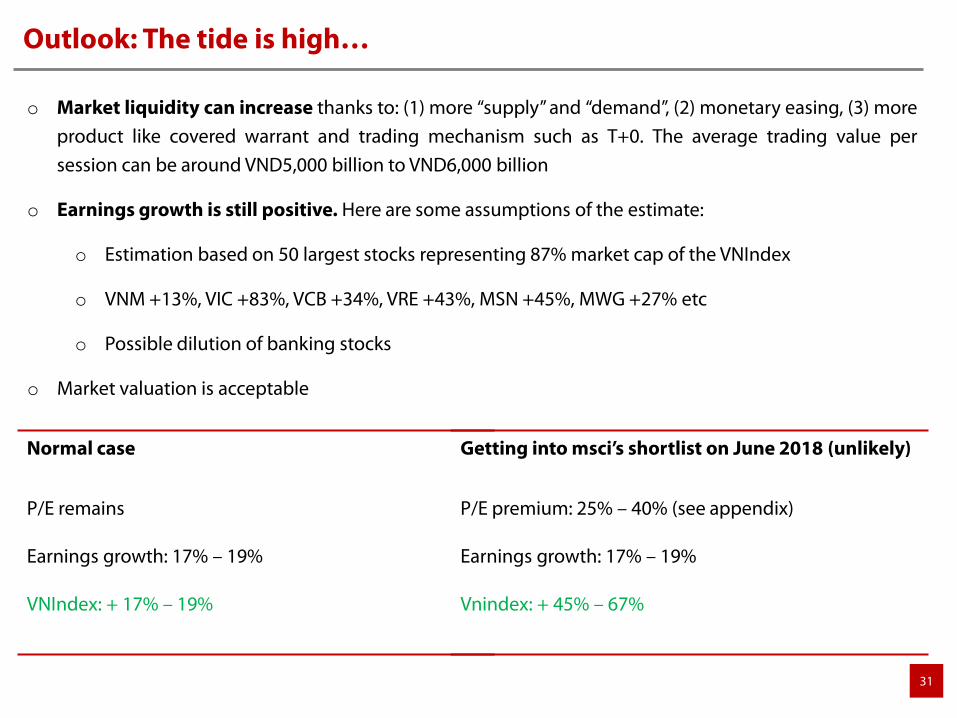
Outlook: The tide is high…
No. Ticker Company Market cap (Trillion VND) No. Ticker Company Market cap
(Trillion VND )1 VNM Vinamilk 293.2 21 NVL Novaland 38.32 VIC VinGroup 193.9 22 ACB Asia Commercial Bank 34.33 VCB Vietcombank 176.3 23 VRG Vietnam Rubber Group 34.04 GAS PetroVietnam Gas 176.2 24 PVPower PetroVietnam Power Corporation 33.75 SAB SABECO 171.5 25 FPT FPT Corp 29.96 VRE Vincom Retail 87.1 26 BHN HABECO 29.57 BID BIDV 83.8 27 HDBANK HD Bank 25.98 CTG VietinBank 83.6 28 STB Sacombank 22.69 PLX Petrolimex 81.1 29 VCS VICOSTONE 19.6
10 MSN Masan Group 79.7 30 CTD COTECCONS construction 16.711 ROS FLC FAROS Construction 79.2 31 EIB Eximbank 15.212 THA Truong Hai Auto Corporation 70.5 32 DHG Hau Giang Pharmaceutical 14.913 HPG Hoa Phat Group 66.7 33 TPBANK Tien Phong Bank 14.314 VJC Vietjet Air 64.4 34 PNJ Phu Nhuan Jewelry 14.215 VPB VPBank 60.4 35 PVOil PetroVietnam Oil Corporation 13.916 TCB TechcomBank 51.0 36 SSI SaiGon Securities Inc. 13.717 BSR Binh Son Refining and Petrochemical 45.3 37 REE Refrigeration Electrical Engineering 13.218 MBB MBBank 45.2 38 GMD Gemadept 11.619 MWG Mobile World Investment 40.9 39 SBT Bourbon Tay Ninh 11.520 BVH Bao Viet Group 40.7 40 VGC Viglacera Corporation 11.2
Source: Various sources and media news
31
o Market liquidity can increase thanks to: (1) more “supply” and “demand”, (2) monetary easing, (3) moreproduct like covered warrant and trading mechanism such as T+0. The average trading value persession can be around VND5,000 billion to VND6,000 billion
o Earnings growth is still positive. Here are some assumptions of the estimate:
o Estimation based on 50 largest stocks representing 87% market cap of the VNIndex
o VNM +13%, VIC +83%, VCB +34%, VRE +43%, MSN +45%, MWG +27% etc
o Possible dilution of banking stocks
o Market valuation is acceptable
Outlook: The tide is high…
Normal case
P/E remains
Earnings growth: 17% – 19%
VNIndex: + 17% – 19%
Getting into msci’s shortlist on June 2018 (unlikely)
P/E premium: 25% – 40% (see appendix)
Earnings growth: 17% – 19%
Vnindex: + 45% – 67%

32
o Unexpected political risks: Arrests of a few VIPs started to “settle a fire” in the last quarter
o Mind the volatility:
o In the past, there was no clear evidence showing positive correlation between volatility and marginlending. However, these two factors has been moving in a same way since beginning 2017
o Intraday volatility increased sharply in Q4 2017
Risk: …but mind the wind
Margin and volatility
0
10000
20000
30000
40000
50000
60000
0%
2%
4%
6%
8%
10%
12%
14%
16%
18%
20%
Q1/2016 Q2/2016 Q3/2016 Q4/2016 Q1/2017 Q2/2017 Q3/2017
Margin Volatility
Intraday volatility
-25%
-20%
-15%
-10%
-5%
0%
5%
10%
15%
20%
25%
30%
0.0%
0.2%
0.4%
0.6%
0.8%
1.0%
1.2%
1.4%
1.6%
1.8%
2.0%
Q1/
2010
Q3/
2010
Q1/
2011
Q3/
2011
Q1/
2012
Q3/
2012
Q1/
2013
Q3/
2013
Q1/
2014
Q3/
2014
Q1/
2015
Q3/
2015
Q1/
2016
Q3/
2016
Q1/
2017
Q3/
2017
Intraday Volatility (LHS) Quarterly Return (RHS)
Source: FiinPro, RongViet Research

33
Appendix: How PE in frontier markets when they were upgraded?
7
8
9
10
11
12
13
14
15
16
4,000
5,000
6,000
7,000
8,000
9,000
10,000
11,000
12,000
13,00006
/30/
2009
12/3
1/20
09
06/3
0/20
10
12/3
0/20
10
06/3
0/20
11
12/2
9/20
11
06/2
8/20
12
12/3
1/20
12
06/3
0/20
13
12/3
1/20
13
06/3
0/20
14
12/3
1/20
14
06/3
0/20
15
12/3
1/20
15
06/3
0/20
16
12/2
9/20
16
06/2
9/20
17
12/0
6/20
17
DSM
P/E
DSM
inde
x
DSM index DSM P/E
Official ReclassificationReclassification
Announcement
Qatar market 18 months prior official reclassification:
Index +41%P/E +45%
6810121416182022
1,5002,0002,5003,0003,5004,0004,5005,000
06/3
0/20
09
12/3
1/20
09
06/3
0/20
10
12/3
0/20
10
06/3
0/20
11
12/2
9/20
11
06/2
8/20
12
12/3
1/20
12
06/3
0/20
13
12/3
1/20
13
06/3
0/20
14
12/3
1/20
14
06/3
0/20
15
12/3
1/20
15
06/3
0/20
16
12/2
9/20
16
06/2
9/20
17
12/0
6/20
17
AD
SMI P
/E
AD
SMI i
ndex
ADSMI index ADSMI P/E
Official ReclassificationReclassification Announcement
18 months prior official reclassification:
Index +73%P/E +56%
UAE market
Source: Bloomberg, RongViet Research compiles

34
Appendix: How PE in frontier markets when they were upgraded?
Pakistan market KSE index
10
11
12
13
14
15
20,00022,00024,00026,00028,00030,00032,00034,00036,000
07/3
1/20
15
08/3
1/20
15
09/3
0/20
15
10/3
0/20
15
11/3
0/20
15
12/3
1/20
15
01/2
9/20
16
02/2
9/20
16
03/3
1/20
16
04/2
9/20
16
05/3
1/20
16
06/3
0/20
16
07/2
9/20
16
08/3
1/20
16
09/3
0/20
16
10/3
1/20
16
11/3
0/20
16
12/3
0/20
16
01/3
1/20
17
02/2
8/20
17
03/3
1/20
17
04/2
8/20
17
05/3
1/20
17
06/3
0/20
17
07/3
1/20
17
08/3
1/20
17
09/2
9/20
17
10/3
1/20
17
11/3
0/20
17
12/0
8/20
17
KSE
P/E
KSE
inde
x
KSE index KSE P/E
18 months prior official reclassification:
Index +60%P/E +46%
7
8
9
10
11
12
13
16,000
18,000
20,000
22,000
24,000
26,000
07/3
1/20
15
08/3
1/20
15
09/3
0/20
15
10/3
0/20
15
11/3
0/20
15
12/3
1/20
15
01/2
9/20
16
02/2
9/20
16
03/3
1/20
16
04/2
9/20
16
05/3
1/20
16
06/3
0/20
16
07/2
9/20
16
08/3
1/20
16
09/3
0/20
16
10/3
1/20
16
11/3
0/20
16
12/3
0/20
16
01/3
1/20
17
02/2
8/20
17
03/3
1/20
17
04/2
8/20
17
05/3
1/20
17
06/3
0/20
17
07/3
1/20
17
08/3
1/20
17
09/2
9/20
17
10/3
1/20
17
11/3
0/20
17
12/0
8/20
17
KSE3
0 P/
E
KSE3
0 in
dex
KSE30 index KSE30 P/E
18 months prior official reclassification:
Index +50%P/E +47%
Pakistan market KSE 30 index
Source: Bloomberg, RongViet Research compiles
35
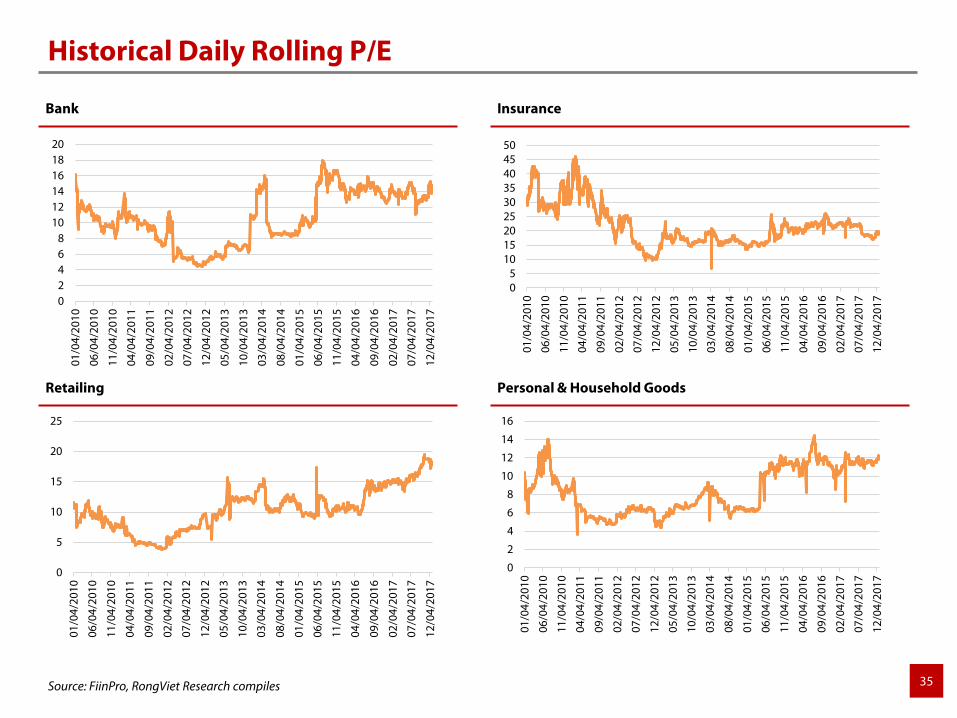
Historical Daily Rolling P/E
Bank Insurance
Retailing Personal & Household Goods
0
2
4
6
8
10
12
14
16
01/0
4/20
10
06/0
4/20
10
11/0
4/20
10
04/0
4/20
11
09/0
4/20
11
02/0
4/20
12
07/0
4/20
12
12/0
4/20
12
05/0
4/20
13
10/0
4/20
13
03/0
4/20
14
08/0
4/20
14
01/0
4/20
15
06/0
4/20
15
11/0
4/20
15
04/0
4/20
16
09/0
4/20
16
02/0
4/20
17
07/0
4/20
17
12/0
4/20
17
0
5
10
15
20
25
01/0
4/20
10
06/0
4/20
10
11/0
4/20
10
04/0
4/20
11
09/0
4/20
11
02/0
4/20
12
07/0
4/20
12
12/0
4/20
12
05/0
4/20
13
10/0
4/20
13
03/0
4/20
14
08/0
4/20
14
01/0
4/20
15
06/0
4/20
15
11/0
4/20
15
04/0
4/20
16
09/0
4/20
16
02/0
4/20
17
07/0
4/20
17
12/0
4/20
17
05
101520253035404550
01/0
4/20
10
06/0
4/20
10
11/0
4/20
10
04/0
4/20
11
09/0
4/20
11
02/0
4/20
12
07/0
4/20
12
12/0
4/20
12
05/0
4/20
13
10/0
4/20
13
03/0
4/20
14
08/0
4/20
14
01/0
4/20
15
06/0
4/20
15
11/0
4/20
15
04/0
4/20
16
09/0
4/20
16
02/0
4/20
17
07/0
4/20
17
12/0
4/20
1702468
101214161820
01/0
4/20
10
06/0
4/20
10
11/0
4/20
10
04/0
4/20
11
09/0
4/20
11
02/0
4/20
12
07/0
4/20
12
12/0
4/20
12
05/0
4/20
13
10/0
4/20
13
03/0
4/20
14
08/0
4/20
14
01/0
4/20
15
06/0
4/20
15
11/0
4/20
15
04/0
4/20
16
09/0
4/20
16
02/0
4/20
17
07/0
4/20
17
12/0
4/20
17
Source: FiinPro, RongViet Research compiles

36
Historical Daily Rolling P/E
Oil & Gas Basic Resources
Chemicals Construction & Materials
02468
10121416
01/0
4/20
10
06/0
4/20
10
11/0
4/20
10
04/0
4/20
11
09/0
4/20
11
02/0
4/20
12
07/0
4/20
12
12/0
4/20
12
05/0
4/20
13
10/0
4/20
13
03/0
4/20
14
08/0
4/20
14
01/0
4/20
15
06/0
4/20
15
11/0
4/20
15
04/0
4/20
16
09/0
4/20
16
02/0
4/20
17
07/0
4/20
17
12/0
4/20
17
0
5
10
15
20
25
30
01/0
4/20
10
06/0
4/20
10
11/0
4/20
10
04/0
4/20
11
09/0
4/20
11
02/0
4/20
12
07/0
4/20
12
12/0
4/20
12
05/0
4/20
13
10/0
4/20
13
03/0
4/20
14
08/0
4/20
14
01/0
4/20
15
06/0
4/20
15
11/0
4/20
15
04/0
4/20
16
09/0
4/20
16
02/0
4/20
17
07/0
4/20
17
12/0
4/20
17
0
5
10
15
20
25
30
01/0
5/20
15
03/0
5/20
15
05/0
5/20
15
07/0
5/20
15
09/0
5/20
15
11/0
5/20
15
01/0
5/20
16
03/0
5/20
16
05/0
5/20
16
07/0
5/20
16
09/0
5/20
16
11/0
5/20
16
01/0
5/20
17
03/0
5/20
17
05/0
5/20
17
07/0
5/20
17
09/0
5/20
17
11/0
5/20
17
0
5
10
15
20
25
01/0
4/20
10
06/0
4/20
10
11/0
4/20
10
04/0
4/20
11
09/0
4/20
11
02/0
4/20
12
07/0
4/20
12
12/0
4/20
12
05/0
4/20
13
10/0
4/20
13
03/0
4/20
14
08/0
4/20
14
01/0
4/20
15
06/0
4/20
15
11/0
4/20
15
04/0
4/20
16
09/0
4/20
16
02/0
4/20
17
07/0
4/20
17
12/0
4/20
17
Source: FiinPro, RongViet Research compiles

37
Historical Daily Rolling P/E
Real Estate Utilities
Food & Drinks Automobile & Parts
02468
1012141618
01/0
4/20
10
06/0
4/20
10
11/0
4/20
10
04/0
4/20
11
09/0
4/20
11
02/0
4/20
12
07/0
4/20
12
12/0
4/20
12
05/0
4/20
13
10/0
4/20
13
03/0
4/20
14
08/0
4/20
14
01/0
4/20
15
06/0
4/20
15
11/0
4/20
15
04/0
4/20
16
09/0
4/20
16
02/0
4/20
17
07/0
4/20
17
12/0
4/20
17
0
5
10
15
20
25
30
35
01/0
4/20
10
06/0
4/20
10
11/0
4/20
10
04/0
4/20
11
09/0
4/20
11
02/0
4/20
12
07/0
4/20
12
12/0
4/20
12
05/0
4/20
13
10/0
4/20
13
03/0
4/20
14
08/0
4/20
14
01/0
4/20
15
06/0
4/20
15
11/0
4/20
15
04/0
4/20
16
09/0
4/20
16
02/0
4/20
17
07/0
4/20
17
12/0
4/20
17
05
1015202530354045
01/0
4/20
10
06/0
4/20
10
11/0
4/20
10
04/0
4/20
11
09/0
4/20
11
02/0
4/20
12
07/0
4/20
12
12/0
4/20
12
05/0
4/20
13
10/0
4/20
13
03/0
4/20
14
08/0
4/20
14
01/0
4/20
15
06/0
4/20
15
11/0
4/20
15
04/0
4/20
16
09/0
4/20
16
02/0
4/20
17
07/0
4/20
17
12/0
4/20
17
0
5
10
15
20
25
30
01/0
4/20
10
06/0
4/20
10
11/0
4/20
10
04/0
4/20
11
09/0
4/20
11
02/0
4/20
12
07/0
4/20
12
12/0
4/20
12
05/0
4/20
13
10/0
4/20
13
03/0
4/20
14
08/0
4/20
14
01/0
4/20
15
06/0
4/20
15
11/0
4/20
15
04/0
4/20
16
09/0
4/20
16
02/0
4/20
17
07/0
4/20
17
12/0
4/20
17
Source: FiinPro, RongViet Research compiles

38
Historical Daily Rolling P/E
Financial Services Travel & Tourism
Technology Industrials
0
5
10
15
20
25
30
35
02/0
5/20
1305
/05/
2013
08/0
5/20
13
11/0
5/20
13
02/0
5/20
1405
/05/
2014
08/0
5/20
14
11/0
5/20
14
02/0
5/20
1505
/05/
2015
08/0
5/20
15
11/0
5/20
15
02/0
5/20
1605
/05/
2016
08/0
5/20
16
11/0
5/20
16
02/0
5/20
1705
/05/
2017
08/0
5/20
17
11/0
5/20
17
05
10152025303540
06/0
1/20
15
08/0
1/20
15
10/0
1/20
15
12/0
1/20
15
02/0
1/20
16
04/0
1/20
16
06/0
1/20
16
08/0
1/20
16
10/0
1/20
16
12/0
1/20
16
02/0
1/20
17
04/0
1/20
17
06/0
1/20
17
08/0
1/20
17
10/0
1/20
17
12/0
1/20
17
0
2
4
6
8
10
12
14
16
01/0
4/20
10
07/0
4/20
10
01/0
4/20
11
07/0
4/20
11
01/0
4/20
12
07/0
4/20
12
01/0
4/20
13
07/0
4/20
13
01/0
4/20
14
07/0
4/20
14
01/0
4/20
15
07/0
4/20
15
01/0
4/20
16
07/0
4/20
16
01/0
4/20
17
07/0
4/20
17
0
5
10
15
20
25
30
01/0
5/20
15
03/0
5/20
15
05/0
5/20
15
07/0
5/20
15
09/0
5/20
15
11/0
5/20
15
01/0
5/20
16
03/0
5/20
16
05/0
5/20
16
07/0
5/20
16
09/0
5/20
16
11/0
5/20
16
01/0
5/20
17
03/0
5/20
17
05/0
5/20
17
07/0
5/20
17
09/0
5/20
17
11/0
5/20
17
Source: FiinPro, RongViet Research compiles

39
Our sector rating for 2018
No. Subsector2017
Supply -Demand
InputLegal
Environment
Long-term growth
potential
Technological
development
Competition Rating
Technology + + + 3.8 Positive
Automotive retail + - + + -- 3.7 Positive
F&B (Beer, milk) ++ + + 3.6 Positive
Banking + - + + + - 3.3 Positive
Power + - + + - 3.3 Positive
Aviation + - + 3.2 Positive
Real Estate + - + + 3.2 Positive
Oil & Gas ++ + + - 3.9 Positive
Phamarceutical + ++ + + - 3.8 Positive
Automotive - Rubber Tires + + - 3.1 Positive
Textile + - 3.0 Neutral
Port - + + + + - 3.0 Neutral
Insurance + + -- 3.0 Neutral
Steel + - - + 3.0 Neutral
Construction - + + 3.0 Neutral
Building materials - + + - 3.0 Neutral
Chemicals - Fertilizers/Agochemicals - - + - 2.6 Negative
Chemicals - natural rubber - - + 2.6 Negative

THE BIG GAME FOR ALL STAKEHOLDERS

41
Vietnam has gone through half of the new term and is entering the third year led by Prime Minister Nguyen Xuan Phuc(2016 - 2021). It can be observed that the government is endeavoring to handle the “leftover” issues and paving the wayfor the future, to which 2018 is an important year. In this particular period of time, each of the participants of theeconomy seems to be engaged in the "big game" that the government is the “moderator”
• The government strengthens the confidence of the local business community and promotes the image ofVietnam to foreign investors. Two prominent features in this role are drastic reform of administrativeprocedures and raising the status of the national economy, exemplified by the race to upgrade the Vietnamesestock market
• SBV maintains low interest rates, facilitates the handling of bad debts (that is handling the real estate propertiesas collateral) and indirectly increases the attractiveness of ongoing divestments from SOEs
• Real estate companies are taking advantage of low interest rates, aggressively increasing supply to the market.At the same time, banks are raising capital, "cleaning" their balance sheets before executing more sustainablebusiness strategies and getting ready to apply Basel 2 in early 2019
• The State’s divestments from 181 SOEs in 2018 will continue to be an opportunity for foreign strategic investorswho are interested business development in Vietnam, especially in the consumer sector
• Finally, the orientation towards on-the-spot export through tourism and services (for the FDI sector) will createincentives for the expansion and development of the big players in the fields of infrastructure, utility,construction, logistics, supporting industries and HoReCa (hotel, restaurant, cafe)
The Big Game for All Stakeholders
Peak of State’s Divestment and IPOs

43
o In 2018, there will be 181 companies to be divested, which accounts for 70% of total plannedcompanies to be divested in 2018-2020
o To complete such a challenged plan, the Government has been adjusted many legal frameworks(Decree 126 and Daft on Decree 91) to make it flexible and feasible for investors to participate inbidding progress
o Given 2 big successful deals in 2017, VNM and SAB, we also expect that the officials will have experienceto do the State’s divestment process on the following big deals (ACV, GAS, PLX, Genco, Sawaco, etc.)
Peak of State’s divestment and IPOs
The State’s divestment results in 2012 – 2020F
Source: RongViet Research
0
20
40
60
80
100
120
140
0
20
40
60
80
100
2012 2013 2014 2015 2016 2017
Thou
sand
s
State's divestment No. deal IPO No. deal State's divestment Value (VND B) (RHS) IPO Value (VND B) (RHS)
44
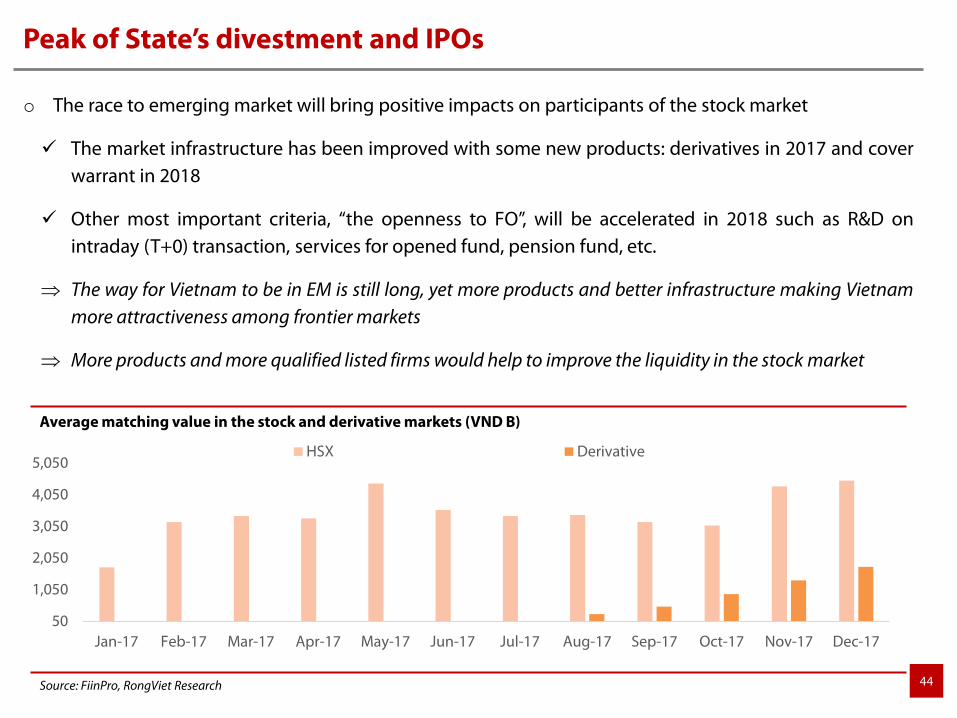
o The race to emerging market will bring positive impacts on participants of the stock market
The market infrastructure has been improved with some new products: derivatives in 2017 and coverwarrant in 2018
Other most important criteria, “the openness to FO”, will be accelerated in 2018 such as R&D onintraday (T+0) transaction, services for opened fund, pension fund, etc.
⇒ The way for Vietnam to be in EM is still long, yet more products and better infrastructure making Vietnammore attractiveness among frontier markets
⇒ More products and more qualified listed firms would help to improve the liquidity in the stock market
Average matching value in the stock and derivative markets (VND B)
Source: FiinPro, RongViet Research
50
1,050
2,050
3,050
4,050
5,050
Jan-17 Feb-17 Mar-17 Apr-17 May-17 Jun-17 Jul-17 Aug-17 Sep-17 Oct-17 Nov-17 Dec-17
HSX Derivative
Peak of State’s divestment and IPOs

45
State's divestment in 2018
No Ticker Name Listed Charter Capital (VND B) Divester Divested ratio
1 ACV Airport Corporation of Vietnam Upcom 26,194 MTVN 20.0%
2 PLX Vietnam National Petroleum Group HSX 23,238 MOIT 25.0%
3 VGT Vietnam Textile and Garment Group Upcom 7,608 MOIT 53.0%
4 VNP Vietnam Plastic Corporation SCIC 131 SCIC 65.0%
5 DVN Vietnam Pharmaceutical Corporation Upcom 2,459 MOHVN 30.0%
6 VGC Viglacera Corporation HNX 6,405 MOCVN 20.0%
7 DBD Binh Dinh Phamaceutical and Medical Equipment Jsc. Upcom 891 Binh Dinh province, People's committee 10.0%
Source: RongViet Research compiles
State-owned enterprises to be IPO in 2018
NoTicker NameCharter Capital
(VND B)1 PVOil PetroVietnam Oil Corporation 10,342
2 PVPower PetroVietnam Power Corporation 23,419
3 BSR Binh Son Refining and Petrochemical Ltd 31,005
4 VRG Vietnam Rubber Group 26,141
5 VNF2 Vinafood 2 2,823
6 VICEM Vietnam Cement Industry Corporation 12,360
7 MOBIFONE Mobifone
8 GENCO 3 EVN Genco 3Source: RongViet Research compiles
New listing in 2018
No Ticker NameCharter Capital
(VND B) 1 TCB Techcombank 8,878
2 HDBANK HDBank 8,100
3 TPBANK TPBank 5,842
4 VEAM VEAM Corporation 4,903
5 THA Thaco 4,145
Source: RongViet Research compiles
Peak of State’s divestment and IPOs

46
Circulars/Decrees Note
126/2017/ND-CP
(1) Reducing the committed period for strategic investors to 3 years from 5 years;
(2) Being listed on the stock exchange (HSX, HNX, or UpCOM) not later than 90 days after the IPO; and,
(3) Adding "book building" method to define the winning price
Draft on amending Decree 91/2015/ND-CP
(1) Reducing the steps needed to sell the state’s shares from three to two; and,
(2) Discussing the feasibility of selling the state’s shares with a price lower than book value per share
Source: RongViet Research compiles
Peak of State’s divestment and IPOs

47
Price @ 20 Dec 2017
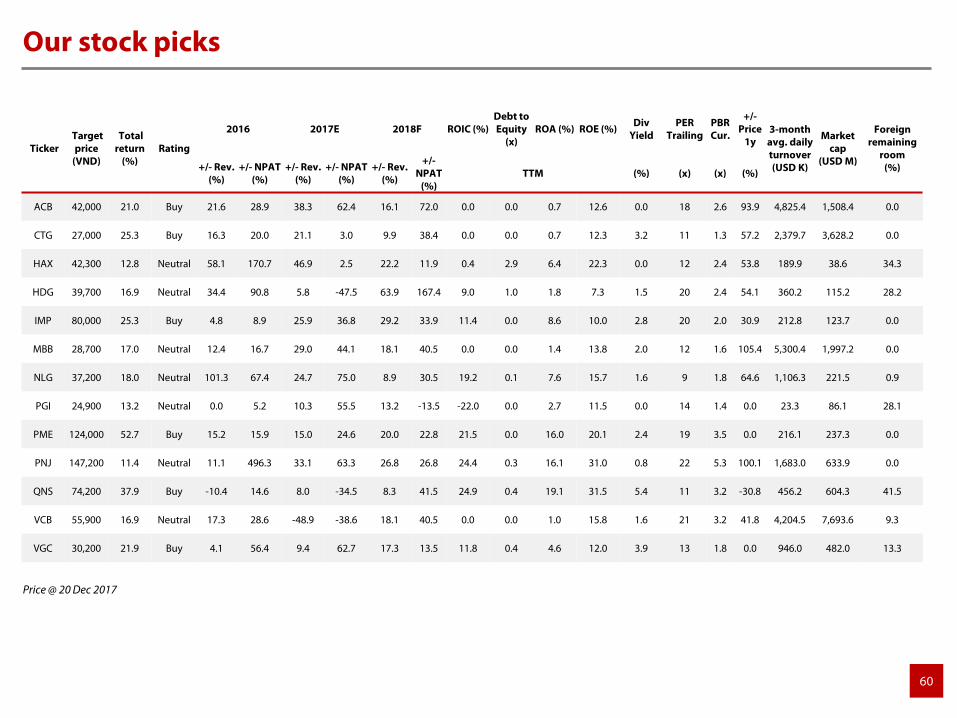
Our stock picks
Ticker Target price
(VND)
Total return
(%) Rating
2016 2017E 2018F ROIC (%)Debt to Equity
(x)ROA (%) ROE (%) Div Yield PER
Trailing PBR Cur. +/-
Price 1y
3-month avg. daily turnover (USD K)
Market cap
(USD M)
Foreign remaining
room(%) +/- Rev.
(%)+/- NPAT
(%)+/- Rev.
(%)+/- NPAT
(%)+/- Rev.
(%)
+/-NPAT
(%)TTM (%) (x) (x) (%)
ACV 127,000 32.7 Buy 11.2 -70.1 15.5 -23.9 22.5 45.0 9.4 0.6 10.5 19.8 1.5 43 8.1 105.5 481 9,313.7 45.5
FPT 62,900 15.1 Neutral 4.1 3.1 -50.7 45.1 14.6 -27.8 15.3 0.7 7.5 17.8 3.5 14 2.8 59.1 5,358 1,320.2 0.0
PHR 46,000 14.1 Neutral -4.0 3.9 32.8 102.9 8.1 77.6 4.9 0.4 9.7 17.0 7.0 9 1.5 74.5 622 148.6 39.1
48
Price @ 20 Dec 2017
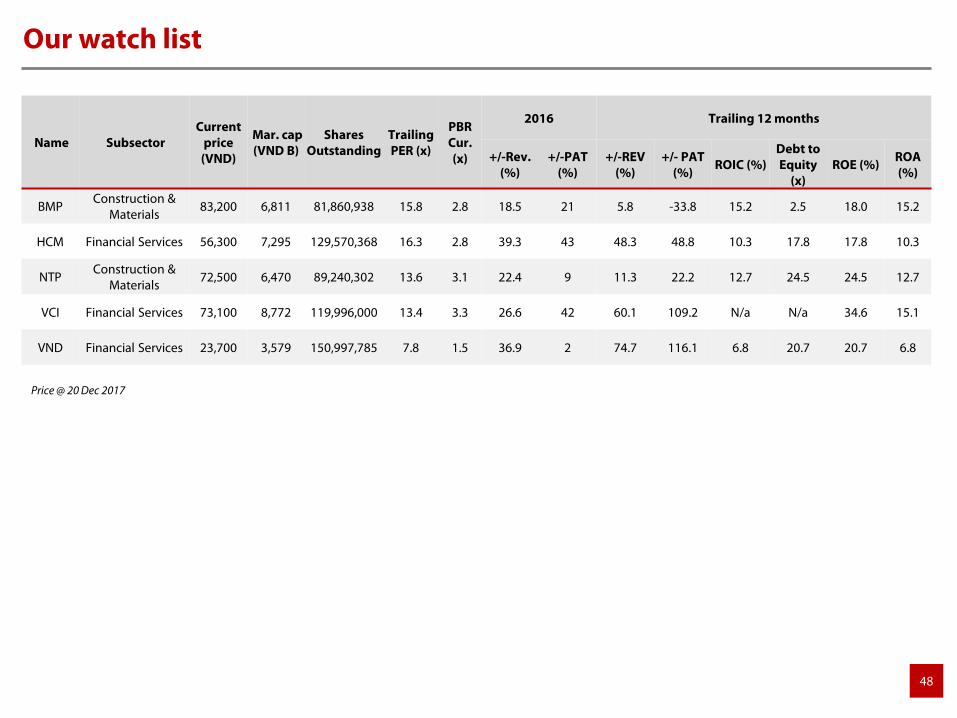
Our watch list
Name Subsector Current
price (VND)
Mar. cap (VND B)
Shares Outstanding
Trailing PER (x)
PBR Cur. (x)
2016 Trailing 12 months
+/-Rev. (%)
+/-PAT (%)
+/-REV (%)
+/- PAT (%) ROIC (%)
Debt to Equity
(x)ROE (%) ROA
(%)
BMPConstruction &
Materials83,200 6,811 81,860,938 15.8 2.8 18.5 21 5.8 -33.8 15.2 2.5 18.0 15.2
HCM Financial Services 56,300 7,295 129,570,368 16.3 2.8 39.3 43 48.3 48.8 10.3 17.8 17.8 10.3
NTPConstruction &
Materials72,500 6,470 89,240,302 13.6 3.1 22.4 9 11.3 22.2 12.7 24.5 24.5 12.7
VCI Financial Services 73,100 8,772 119,996,000 13.4 3.3 26.6 42 60.1 109.2 N/a N/a 34.6 15.1
VND Financial Services 23,700 3,579 150,997,785 7.8 1.5 36.9 2 74.7 116.1 6.8 20.7 20.7 6.8

The Focus on Growth Engines

50
GDP growth by sectors GDP growth by foreign investment
Source: GSO, RongViet Research compiles
The Focus on Growth Engines
16.0% 16.4% 17.0% 17.6%15.0%15.5%16.0%16.5%17.0%17.5%18.0%
0.0%
2.0%
4.0%
6.0%
8.0%
10.0%
2013 2014 2015 2016
% contribution (RHS) % GDP growth of FDI
GDP growth
o FDI continues to show their important role as a growth engine of Vietnam’s economy in 2017:supporting the growth of construction, domestic building materials, and manufactures
o In 2018, some large FDI projects in steel (Formosa), electricity, electronic and semiconductor sectors willhave significant contribution into Vietnam’s GDP growth and export value
o Despite of TPP’s failure, Vietnam moves on other key FTAs such as CPTPP, RCEP, and EVFTA, whichpresents the Government’s further commitment on trade and investment liberalization
o The development of SEZs (Special Economic Zones), such as Van Don, Bac Van Phong, Phu Quoc, willboost growth of tourism as well as hospitality sector, which will be drivers for service’s growth
1.0 1.0 1.1 1.2 1.3
0.0
0.5
1.0
1.5
2.0
2.5
3.0
3.5
2013 2014 2015 2016 2017 E
Mill
ions
Agriculture, forestry and fishing Industry and constructionService Taxes and subsidies

51
Six countries with the highest number of tourists arrivals to Vietnam (passengers in thousands)
MoT accounted for large proportion of State’s investment budget
Source: RongViet Research compiles
14281900 1947 1780
2696
3594
700 748 8481110
1544
2158
0500
1,0001,5002,0002,5003,0003,5004,000
2012 2013 2014 2015 2016 11M 2017
China Korea Japan USA Taiwan Russia
2812
21 1832
0
10
20
30
40
50
60
70
80
2013 2014 2015 2016 E 2017 E
MoT MARD MoH VDB VBSP MoET Other
o Disbursement of state budget has faced some obstacles in 2017, and we expect that the difficulties willbe solved in 2018
o Investment into soft and hard infrastructure will boost the growth of sectors such as technology, airport,traffic infrastructure, industrial real estate, and supportive sectors (tile-granite, construction stone, etc.)
o Given its strong recovery in 2017, the earnings of steel firms will experience a reasonable growth in 2018
o Electricity price must be increase to attract private investment into this sector
The Focus on Growth Engines

52
List of infrastructure projects by type up to 2020
Name Total investment (USD M) Investment model
Dau Giay - Lien Khuong highway 3,520 PPP
Ninh Binh - Thanh Hoa - Nghi Son route of the North-South highway 1,867 PPP
Noi Bai - Ha Long highway 1,762 PPP, BOT
Trung Luong - My Thuan highway 1,381 PPP, ODA
Bien Hoa - Vung Tau highway 1,175 PPP, ODA
Cam Lo - La Son highway 1,095 PPP, BOT
Bien Hoa - Vung Tau railway 5,000 BOT
Upgrading the Hanoi - Ho Chi Minh city railway route 2,300 BOT, ODA
Railway into Hai Phong international port 1,600 PPP, BOT
Hanoi urban railway route 6 (from the center of Hanoi to Noi Bai Airport) 1,356 PPP
Long Thanh international airport (phase 1) 5,620 PPP, BOT
The phase 1 of Van Phong international port 500 FDI/ Joint Venture
Binh Dinh power centre 4,000 PPP
Dung Quat coal-fired thermal plant 140 PPP
Source: RongViet Research compiles
The Focus on Growth Engines

53
The Focus on Growth Engines
Vietnam's free trade agreements
FTA Status Extra notes
Asean - Hong Kong, China FTA Signed 12 November 2017
Regional Comprehensive Economic Partnership First time China, India and Japan
Vietnam-European Free Trade Association FTA Signed 29 September 2017
Vietnam-Israel FTA Venture capital
Vietnam-European Union FTA Not signed yet Ambiguous laws
Trans-Pacific Partnership (TPP-11) Signed 11 Nov 201 Rename CPTPP
Asean Free Trade Area Signed and in effect
Asean-Australia and New Zealand FTA Signed Feb 2009
Asean-India Comprehensive Economic Corporation Agreement Signed and in effect Special goods
Asean-Japan Comprehensive Economic Partnership Signed 2008
Asean-People's Republic of China Comprehensive Econic Cooperation Agreement Signed and in effect
Asean-Republic of Korea Comprehensive Economic Cooperation Agreement Replaced by ATIGA
Chile-Vietnam Economic FTA Signed Jan 2014 Agricultural products
Japan-Vietnam Economic Partnership Agreement Signed 25 Dec 2008 First Agreement
Vietnam-Eurasian Economic Union FTA Signed 29 May 2015 Agricultural machine equipment
Republic of Korea-Vietnam FTA Signed 5 May 2015 Goods, services, investment
Source: RongViet Research compiles

54
Our stock picks
Price @ 20 Dec 2017
Ticker Target price
(VND)
Total return
(%) Rating
2016 2017E 2018F ROIC (%)Debt to Equity
(x)ROA (%) ROE (%) Div Yield PER
Trailing PBR Cur.
+/-Price
1y 3-month
avg. daily turnover (USD K)
Market cap
(USD M)
Foreign remaining
room(%) +/- Rev.
(%)+/- NPAT
(%)+/- Rev.
(%)+/- NPAT
(%)+/- Rev.
(%)
+/-NPAT
(%)TTM (%) (x) (x) (%)
ACV 127,000 32.7 Buy 11.2 -70.1 15.5 -23.9 22.5 45.0 9.4 0.6 10.5 19.8 1.5 43 8.1 105.5 480.7 9,313.7 45.5
CHP 31,900 15.8 Neutral -10.9 -21.5 28.6 54.2 -14.2 -19.0 21.1 0.7 16.3 29.0 2.5 7 2.0 46.5 143.7 156.4 45.7
DRC 28,200 20.5 Buy 1.3 -4.8 8.1 -45.3 4.1 40.3 14.8 0.6 8.6 15.6 7.2 12 1.9 -17.0 582.6 130.4 24.1
FPT 62,900 15.1 Neutral 4.1 3.1 -50.7 45.1 14.6 -27.8 15.3 0.7 7.5 17.8 3.5 14 2.8 59.1 5,358.2 1,320.2 0.0
HPG 53,600 21.5 Buy 21.2 89.4 28.3 23.3 30.6 18.1 21.9 0.4 19.1 32.1 0.0 8 2.2 68.6 7,670.7 2,949.5 8.5
LTG 57,100 38.9 Buy -0.9 9.2 7.4 23.1 11.4 2.6 12.7 1.3 6.4 17.7 3.6 7 1.3 0.0 64.4 122.9 4.6
NKG 49,400 30.6 Buy 55.4 310.7 62.0 29.0 14.6 10.4 14.0 2.2 8.4 33.9 2.6 6 1.8 66.9 1,104.0 221.3 9.8
NT2 37,600 22.5 Buy 18.6 -4.9 -10.3 -31.3 4.5 41.7 12.4 0.9 6.3 14.5 6.8 13 2.0 26.9 505.6 412.5 26.8
NTC 127,000 42.3 Buy 17.8 121.4 -10.4 -5.5 16.7 3.2 19.6 0.5 7.6 56.2 2.7 8 4.2 383.2 189.6 64.0 48.9
VJC 171,000 24.5 Buy 38.6 113.3 54.4 119.0 21.1 18.1 27.0 0.9 13.9 48.2 2.1 19 7.6 0.0 7,272.0 2,782.1 3.7

55
Price @ 20 Dec 2017
Our watch list
Name Subsector Current
price (VND)
Mar. cap (VND B)
Shares Outstanding
Trailing PER (x)
PBR Cur. (x)
2016 Trailing 12 months
+/-Rev. (%)
+/-PAT (%)
+/-REV (%)
+/- PAT (%) ROIC (%)
Debt to Equity
(x)ROE (%) ROA
(%)
CTIConstruction &
Materials29,400 1,852 62,999,997 11.0 1.6 23.8 58 -2.2 36.7 3.2 11.8 11.8 3.2
HTIConstruction &
Materials16,800 419 24,949,200 5.5 1.0 33.1 9 -11.0 15.0 5.0 18.4 18.4 5.0
HUTConstruction &
Materials11,000 2,762 251,058,913 6.5 0.9 24.1 152 -37.9 -21.6 3.3 12.3 12.3 3.3
LHG Real Estate 17,000 849 49,939,812 3.1 0.7 106.8 138 38.0 58.4 9.9 24.1 24.1 9.9
PC1Construction &
Materials38,900 4,491 115,452,410 17.4 1.8 -3.0 24 -1.5 -36.5 4.4 10.5 10.5 4.4
REEIndustrial Goods &
Services42,500 13,177 310,050,926 7.9 1.7 38.4 28 53.3 117.5 13.7 21.1 21.1 13.7
PVTIndustrial Goods &
Services18,450 5,193 281,440,162 13.9 1.5 17.8 12 -2.7 -24.3 4.1 9.0 9.0 4.1

Opportunities in the“Golden Population Structure” Period

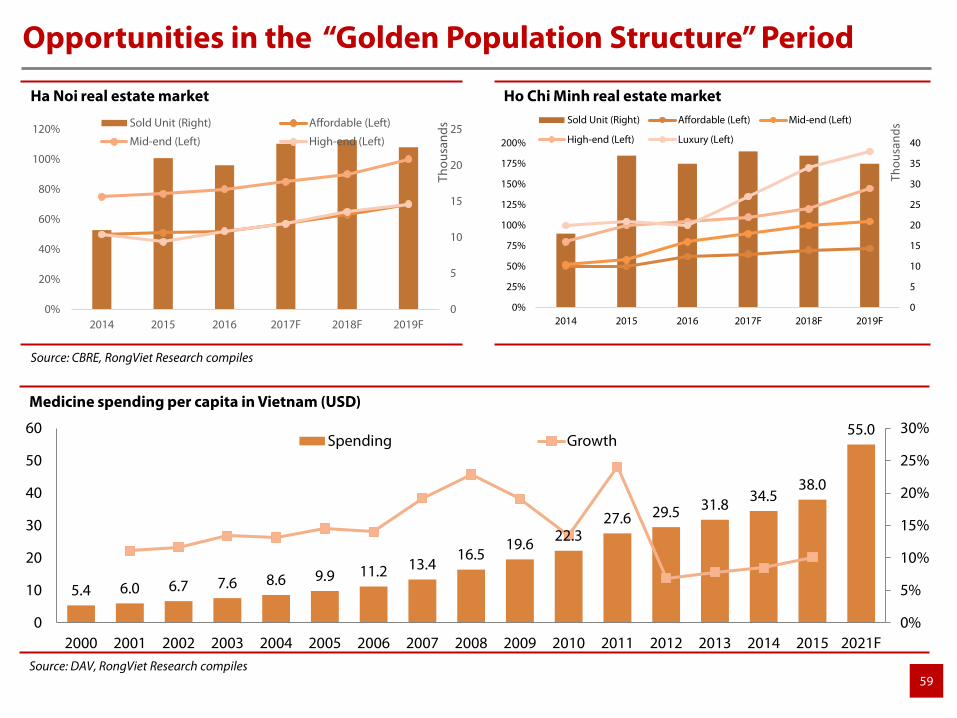
57
Retail sales continues to pick up The correlation between the average annual disposable income and total vehicle sales volume in Vietnam
Source: GSO, Euromonitor, RongViet Research compiles
260
280
300
320
340
0%
4%
8%
12%
10/2
016
11/2
016
12/2
016
01/2
017
02/2
017
03/2
017
04/2
017
05/2
017
06/2
017
07/2
017
08/2
017
09/2
017
10/2
017
Thou
sand
sRetail Sales (VND B) Growth (%)
Opportunities in the “Golden Population Structure” Period
o Vietnam’s golden population period will prolong in next 10 – 15 years, resulting the fast growth ofconsumer market during this time
o In 2017, Vietnam moved to No. 6 from No. 11 (out of 30) in Global Retail Development Index (GRDI) andis in the peak attractiveness period
o Domestic pharmaceuticals, who have been investing to upgrade their factories into EU-GMP or PIC/Scriteria, will be beneficiaries of Circular 01/2012/TTLT-BYT-BTC
o The higher special sales tax on vehicle with a cylinder capacity of 2,500 – 3,000 ccs unlikely causesnegative impacts on high-end cars
0
50
100
150
200
0
5
10
15
20
25
30
35
40
2012 2013 2014 2015 2016
Thou
sand
sDisposable Income per Capita (unit: million VND)
Passenger car sales volume

58
NIM and interest rate Proportion of consumer lending loan outstanding
Source: GSO, RongViet Research compiles
Opportunities in the “Golden Population Structure” Period
o Banking sector’s profitability has been improved in 2017 thanks to (1) the supportive policies andabundant monetary liquidity and (2) Higher proportion of retails loan outstanding, which help toincrease NIM
o Profitability in 2017 allows banks to enhance their loan loss reserves (LLR) => the better buffer, the saferfor banks in case of economic difficulties
o Banks’ recent investment on core banking and digital banking will boost growth in services income
o Given the high supply of apartments in 2018-19, affordable housing developers who have cleanprojects located in fully-invested infrastructure will less likely be hit negative affect
52.36%
15%
24%
1%
3% 4.64%
Buy/repair houses
Transport
Durable goods
Hi-tech goods
Education, tourisim,health careOthers2%
3%
3%
4%
5%
10%
15%
20%
2012 2013 2014 2015 2016 2017E
NIM RHSShort-term lending rate LHSShort-term deposit rate LHSBanks' Consumer financing interest rate LHS
59
Medicine spending per capita in Vietnam (USD)
Source: DAV, RongViet Research compiles
5.4 6.0 6.7 7.6 8.6 9.9 11.2 13.416.5
19.6 22.327.6 29.5 31.8 34.5
38.0
55.0
0%
5%
10%
15%
20%
25%
30%
0
10
20
30
40
50
60
2000 2001 2002 2003 2004 2005 2006 2007 2008 2009 2010 2011 2012 2013 2014 2015 2021F
Spending Growth
Opportunities in the “Golden Population Structure” Period
Ha Noi real estate market Ho Chi Minh real estate market
Source: CBRE, RongViet Research compiles
0
5
10
15
20
25
0%
20%
40%
60%
80%
100%
120%
2014 2015 2016 2017F 2018F 2019F
Thou
sand
sSold Unit (Right) Affordable (Left)
Mid-end (Left) High-end (Left)
0
5
10
15
20
25
30
35
40
0%
25%
50%
75%
100%
125%
150%
175%
200%
2014 2015 2016 2017F 2018F 2019F
Thou
sand
sSold Unit (Right) Affordable (Left) Mid-end (Left)
High-end (Left) Luxury (Left)
60
Price @ 20 Dec 2017
Our stock picks
Ticker Target price
(VND)
Total return
(%) Rating
2016 2017E 2018F ROIC (%)Debt to Equity
(x)ROA (%) ROE (%) Div
Yield PER
Trailing PBR Cur.
+/-Price
1y 3-month
avg. daily turnover (USD K)
Market cap
(USD M)
Foreign remaining
room(%) +/- Rev.
(%)+/- NPAT
(%)+/- Rev.
(%)+/- NPAT
(%)+/- Rev.
(%)
+/-NPAT
(%)TTM (%) (x) (x) (%)
ACB 42,000 21.0 Buy 21.6 28.9 38.3 62.4 16.1 72.0 0.0 0.0 0.7 12.6 0.0 18 2.6 93.9 4,825.4 1,508.4 0.0
CTG 27,000 25.3 Buy 16.3 20.0 21.1 3.0 9.9 38.4 0.0 0.0 0.7 12.3 3.2 11 1.3 57.2 2,379.7 3,628.2 0.0
HAX 42,300 12.8 Neutral 58.1 170.7 46.9 2.5 22.2 11.9 0.4 2.9 6.4 22.3 0.0 12 2.4 53.8 189.9 38.6 34.3
HDG 39,700 16.9 Neutral 34.4 90.8 5.8 -47.5 63.9 167.4 9.0 1.0 1.8 7.3 1.5 20 2.4 54.1 360.2 115.2 28.2
IMP 80,000 25.3 Buy 4.8 8.9 25.9 36.8 29.2 33.9 11.4 0.0 8.6 10.0 2.8 20 2.0 30.9 212.8 123.7 0.0
MBB 28,700 17.0 Neutral 12.4 16.7 29.0 44.1 18.1 40.5 0.0 0.0 1.4 13.8 2.0 12 1.6 105.4 5,300.4 1,997.2 0.0
NLG 37,200 18.0 Neutral 101.3 67.4 24.7 75.0 8.9 30.5 19.2 0.1 7.6 15.7 1.6 9 1.8 64.6 1,106.3 221.5 0.9
PGI 24,900 13.2 Neutral 0.0 5.2 10.3 55.5 13.2 -13.5 -22.0 0.0 2.7 11.5 0.0 14 1.4 0.0 23.3 86.1 28.1
PME 124,000 52.7 Buy 15.2 15.9 15.0 24.6 20.0 22.8 21.5 0.0 16.0 20.1 2.4 19 3.5 0.0 216.1 237.3 0.0
PNJ 147,200 11.4 Neutral 11.1 496.3 33.1 63.3 26.8 26.8 24.4 0.3 16.1 31.0 0.8 22 5.3 100.1 1,683.0 633.9 0.0
QNS 74,200 37.9 Buy -10.4 14.6 8.0 -34.5 8.3 41.5 24.9 0.4 19.1 31.5 5.4 11 3.2 -30.8 456.2 604.3 41.5
VCB 55,900 16.9 Neutral 17.3 28.6 -48.9 -38.6 18.1 40.5 0.0 0.0 1.0 15.8 1.6 21 3.2 41.8 4,204.5 7,693.6 9.3
VGC 30,200 21.9 Buy 4.1 56.4 9.4 62.7 17.3 13.5 11.8 0.4 4.6 12.0 3.9 13 1.8 0.0 946.0 482.0 13.3

61
Our watch list
Price @ 20 Dec 2017
Name Subsector Current
price (VND)
Mar. cap (VND B)
Shares Outstanding
Trailing PER (x)
PBR Cur. (x)
2016 Trailing 12 months
+/-Rev. (%)
+/-PAT (%)
+/-REV (%)
+/- PAT (%) ROIC (%) Debt to
Equity (x) ROE (%) ROA (%)
BVH Insurance 59,800 40,692 680,471,434 27.2 3.0 24.0 0 25.4 19.7 1.9 0.3 10.5 1.9
KDFFood &
Beverage57,900 3,242 56,000,000 22.7 4.9 30.8 85 88.0 25.2 15.5 29.7 0.0 0.0
THACOAutomobiles &
PartsN/a N/a 1,658,000,000 N/a N/a 42.6 13 N/a N/a N/a N/a 41.7 18.6
VEAMAutomobiles &
PartsN/a N/a 1,328,800,000 N/a N/a 7.0 3 N/a N/a N/a N/a 26.7 24.2
VNMFood &
Beverage202,000 293,158 1,451,278,520 28.2 12.2 16.8 20 9.6 10.0 47.0 2.2 43.2 33.5
VNR Insurance 22,900 3,002 131,075,937 10.8 1.1 -2.8 -1 -0.4 24.8 4.2 10.1 10.1 4.2
VPB Banks 40,350 60,420 1,497,403,415 9.6 2.3 39.8 64 45.2 78.0 N/a N/a 28.6 2.5
BID Banks 24,500 83,759 3,418,715,334 14.5 1.9 23.2 5 25.2 -10.4 0.5 12.5 12.5 0.5

The Rebound of Oil Price
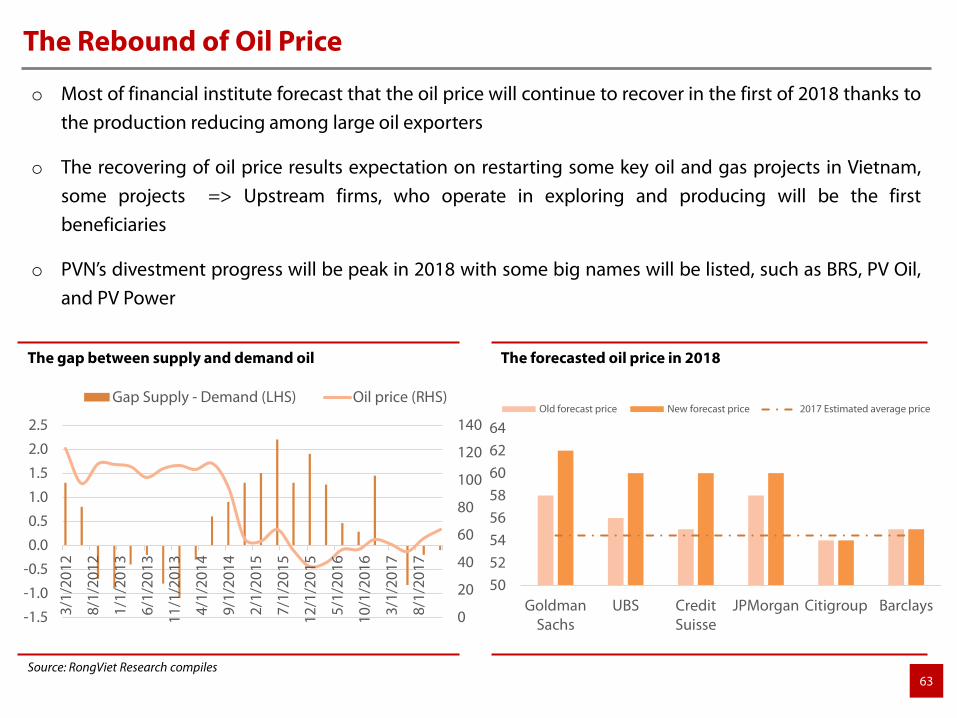
63
The gap between supply and demand oil The forecasted oil price in 2018
Source: RongViet Research compiles
The Rebound of Oil Price
o Most of financial institute forecast that the oil price will continue to recover in the first of 2018 thanks tothe production reducing among large oil exporters
o The recovering of oil price results expectation on restarting some key oil and gas projects in Vietnam,some projects => Upstream firms, who operate in exploring and producing will be the firstbeneficiaries
o PVN’s divestment progress will be peak in 2018 with some big names will be listed, such as BRS, PV Oil,and PV Power
0
20
40
60
80
100
120
140
-1.5
-1.0
-0.5
0.0
0.5
1.0
1.5
2.0
2.5
3/1/
2012
8/1/
2012
1/1/
2013
6/1/
2013
11/1
/201
3
4/1/
2014
9/1/
2014
2/1/
2015
7/1/
2015
12/1
/201
5
5/1/
2016
10/1
/201
6
3/1/
2017
8/1/
2017
Gap Supply - Demand (LHS) Oil price (RHS)
5052545658606264
GoldmanSachs
UBS CreditSuisse
JPMorgan Citigroup Barclays
Old forecast price New forecast price 2017 Estimated average price

64
Business results in Q3 TTM of up- and mid-stream O&G firms
Key O&G projects
Source: RongViet Research compiles
The Rebound of Oil Price
Name Scheduled operation Progress
Nam Con Son No. 2, Phase 2 2019 FS
Red Emperor 2019 FS
White Lion 2019 – 2020 FS
Block B 2021 – 2022 FEED
155 141110 111
17 18 7 1030
40
50
60
70
0
100
200
2014 2015 2016 2017
Thou
sand
s Revenue NPAT Oil price (RHS)
Divestment plan
Period CompanyCurrent PVN’s ownership (%)
Target ownership (%)
2017-2018
Binh Son Refining and Petrochemical Company Limited * 100 43PV Oil* 100 35.1
PV Power* 100 51
PV Fertilizer and Chemicals Coperation (HSX:DPM) 61.3 51
PV Ca Mau Fertilizer Jsc. (HSX:DCM) 75.56 51
PV Phuoc An Port Investment & Operation Jsc. 79.54 0
Green Indochina Development Jsc. 29 0
PV Insurance Corporation (HSX:PVI) 36.85 0
2018-2019 PV Gas (HSX:GAS) 96.72 65
After 2019 PV Trans (HSX:PVT) 51 36
Source: RongViet Research compiles; * IPO in 2018

65
Our watch list
Price @ 20 Dec 2017
Name Subsector Current
price (VND)
Mar. cap (VND B)
Shares Outstanding
Trailing PER (x)
PBR Cur. (x)
2016 Trailing 12 months
+/-Rev. (%)
+/-PAT (%)
+/-REV (%)
+/- PAT (%) ROIC (%) Debt to
Equity (x) ROE (%) ROA (%)
GAS Utilities 92,100 176,219 1,913,348,070 19.6 4.4 -8.1 -18 4.0 76.0 15.0 21.6 21.6 15.0
PLX Oil & Gas 70,000 81,117 1,158,813,235 18.9 4.6 -16.2 52 21.2 9.4 7.3 17.7 17.7 7.3
PVS Oil & Gas 22,000 9,827 446,700,421 11.6 0.9 -20.0 -32 -12.7 -11.1 3.4 7.1 7.1 3.4
PVD Oil & Gas 23,700 9,074 382,850,160 -47.0 0.7 -62.9 -92 -48.7 -209.4 -0.9 -1.5 -1.5 -0.9

Viet Dragon Securities CorporationViet Dragon Tower, 141 Nguyen Du Street.,
Dist.1, HCMC, Vietnamwww.vdsc.com.vn
Marc Djandji, CFAHead of Institutional SalesP. + 84 8 6299 2006 (Ext: 1312)E. [email protected]
Truc DoanHead of ResearchP. + 84 8 6299 2006 (Ext: 1308)E. [email protected]