role of camkii- in the neurodevelopment of embryonic ... · this thesis is an original work by...
TRANSCRIPT

Role of CaMKII- in the Neurodevelopment of Embryonic Zebrafish
by
Birbickram Roy
A thesis submitted in partial fulfillment of the requirements for the degree of
Doctor of Philosophy
in
Physiology, Cell and Developmental Biology
Department of Biological Sciences
University of Alberta
@ Birbickram Roy, 2015

ii
Abstract
Calcium/calmodulin dependent protein kinase 2 (CaMKII) is a multifunctional
serine/threonine kinase that is highly abundant in the central nervous system. It plays
important roles in many neuronal functions, including neurite extension and maturation,
activity-dependent synaptic plasticity and behavior. Although much focus has been given
to elucidate the roles of this enzyme in activity-dependent synaptic plasticity, such as
long term potentiation and depression, relatively little attention has been paid to explore
the enzyme’s role in the synaptic receptor development in embryonic organism. Thus, my
overall goal in this thesis is to examine the role CaMKII in the synaptic development of
embryonic zebrafish. Zebrafish offers many advantages for developmental studies, rapid
development and presence of identifiable Mauthner neurons (M-cells) in the embryos
being two of them. Major findings reported in this thesis include (1) two days post
fertilization (dpf) zebrafish M-cells predominantly express the alpha transcript of
CaMKII genes, (2) knockdown of CaMKII alpha transcript led to increased branching of
the ventral dendrite of the M-cells and aberrant locomotor response to touch, (3)
development of excitatory synaptic receptor currents, specifically NMDA receptors were
affected by knockdown of CaMKII- transcript, while development of AMPA receptors
were unaffected, and (4) knockdown of CaMKII- transcript also affected the
development of inhibitory GABA and glycine receptor currents. These findings
contribute to our understanding of the important roles of CaMKII- in the synaptic and
neuronal development of embryonic organisms.

iii
Preface
This thesis is an original work by Birbickram Roy. The study, of which this thesis is a
part, has received research ethics approval from the University of Alberta Animal Policy
and Welfare Committee. The author has met the Canadian Council on Animal Care
(CCAC) mandatory training requirements for animal users on the Care and Use of
Animals in Research, Teaching, and Testing.
A portion of the chapter 2 (sections 2.1 and 2.5) of this thesis has been published:
Roy,B., Ali, D.W. (2013). Patch clamp recordings from embryonic zebrafish Mauthner
cells. Journal of Visualized Experiments 79, e50551, doi:10.3791/50551.
Birbickram Roy performed the experiments, analyzed data, and wrote the manuscript.
Declan W. Ali was the supervisory author and was involved in concept formation, data
analysis, and manuscript composition.
A version of the chapters 2, 3, and 4 of this thesis has been published as:
Roy, B., Ferdous, J., and Ali, D.W. (2015). NMDA receptors on zebrafish Mauthner cells
require CaMKII-α for normal development. Developmental Neurobiology 75,145-
62.
Birbickram Roy permormed the experiments, analyzed data, and wrote the manuscript.
Jannatul Ferdous assisted in confocal imaging data acquisition presented in figure 3.8,
and analyzed the behavioural data presented in figure 3.10. Declan W. Ali was the
supervisory author and was involved in concept formation, data analysis, and manuscript
composition.

iv
A version of chapter 5 of this thesis has been published as:
Roy, B. and Ali, D.W. (2014). Multiple types of GABAA responses identified from
zebrafish Mauthner cells. Neuroreport 25, 1232-6.
Birbickram Roy permormed the experiments, analyzed data, and wrote the manuscript.
Declan W. Ali was the supervisory author and was involved in concept formation, data
analysis, and manuscript composition.
Unless otherwise stated, data presented in this thesis are the author’s original work.

v
ACKNOWLEDGEMENTS
I would like to express my sincere gratitude to my supervisor Dr. Declan Ali for his
guidance and encouragement over the years of my graduate study. Your support and
mentorship has led me to become a critical thinker, a good presenter and a better
scientist. It has been a great pleasure working with you. I would also like to thank my
supervisory committee members, Ted Allison and Peter Nguyen, for the invaluable
insights and advice I received from them.
Thanks to all my present and past fellow lab mates Dr. Kessen Patten, Dr. Chris
Coutts, Nicole Sylvain, Daniel Brewster, Marcus Cunningham, Kazi Tanveer Ahmed,
Jannatul Ferdous and Rajarshi Mukharjee. Your friendship and company over the years
was much appreciated. I would also like to thank the summer students, Zach Mansour,
Caitlyn Collins, Taylor Bucyk, Shubham Shan and Savanna Boutin, whose excitement
and great company made the lab work more joyful.
Last but certainly not least, I would like to thank my wife and my parents for never
losing confidence in me. You have been a boundless source of inspiration and support for
me. Thank you!

vi
Table of Contents
CHAPTER 1: GENERAL INTRODUCTION ............................................................... 1
1.1 Introduction ............................................................................................................... 1
1.2 Outline of thesis ........................................................................................................ 3
1.3 Literature review ....................................................................................................... 4
1.3.1 Overview ............................................................................................................ 4
1.3.2 Zebrafish ............................................................................................................ 4
1.3.3 Synaptic transmission in zebrafish Mauthner cell ........................................... 10
1.3.3.1 AMPA receptors ....................................................................................... 12
1.3.3.2 NMDA receptors ....................................................................................... 17
1.3.3.3 GABAA receptor ....................................................................................... 20
1.3.3.4 Glycine receptor ........................................................................................ 22
1.3.4 Calcium/calmodulin dependent protein kinase 2 (CaMKII) ............................ 25
1.3.4.1 Expression profile of CaMKII genes in developing zebrafish brain ........ 25
1.3.4.2 Structure and regulatory mechanism ....................................................... 26
1.3.4.3 CaMKII and Synaptic plasticity................................................................ 27
1.3.4.4 Regulation of neuronal morphology by CaMKII...................................... 29
1.4 Research Objectives and Aims ............................................................................... 30
CHAPTER 2: MATERIALS AND METHODS .......................................................... 41
2.1 Animals ................................................................................................................... 41
2.1.1 Dissection ......................................................................................................... 41
2.1.2 Identification of Mauthner cells ....................................................................... 42
2.2 RT-PCR................................................................................................................... 42
2.3 Single-cell qRT-PCR .............................................................................................. 43
2.3.1 Collection of Individual Mauthner cells .......................................................... 43
2.3.2 cDNA Synthesis from single cells ................................................................... 43
2.3.3 Construction of real-time PCR standards ........................................................ 44
2.3.4 Preamplification ............................................................................................... 44
2.3.5 Quantitative real-time PCR .............................................................................. 45
2.4. Morpholino oligonucleotide mediated knockdown of camk2a ............................. 45
2.4.1 Morpholino design ........................................................................................... 45
2.4.2 Microinjection .................................................................................................. 46
2.4.3 Knockdown assessment ................................................................................... 47
2.4.4 Western blot ..................................................................................................... 47
2.5. Electrophysiology .................................................................................................. 48
2.5.1 Recording solutions ......................................................................................... 48
2.5.2 Isolation of receptor-specific miniature postsynaptic currents ........................ 49
2.5.3 Neuronal depolarization by a 10 mM K+ depolarizing medium ...................... 49
2.5.4 Data Acquisition .............................................................................................. 50
2.5.5 Analysis of spontaneous miniature postsynaptic currents ............................... 50
2.6 Immunohistochemistry ........................................................................................... 51
2.7 Behavioral assay ..................................................................................................... 51
2.8 Statistical analysis ................................................................................................... 52

vii
CHAPTER 3: EXPRESSION OF THE camk2a GENE AND ITS REGULATION
OF DENDRITIC BRANCHING IN EMBRYONIC ZEBRAFISH MAUTHNER
CELLS ............................................................................................................................. 58
3.1 Introduction ............................................................................................................. 58
3.2 Results ..................................................................................................................... 61
3.2.1 Expression of camk2 genes in zebrafish 2 dpf embryos .................................. 61
3.2.2 Mauthner cell-specific expression of camk2 genes ......................................... 61
3.2.3 Morpholino knockdown of CaMKII- ............................................................ 63
3.2.4 Dendritic branching on Mauthner cells is altered in camk2a morphants......... 64
3.2.5 CaMK2- is required for normal development of zebrafish escape response 65
CHAPTER 4: REGULATION OF AMPA AND NMDA RECEPTOR
DEVELOPMENT BY CAMK2- ................................................................................. 88
4.1 Introduction ............................................................................................................. 88
4.2 Results. .................................................................................................................... 90
4.2.1 CaMKII- does not affect AMPA receptor development ............................... 90
4.2.2 Effect of camk2a knockdown on NMDA mEPSCs ......................................... 95
4.2.3 Effect of acute activation or blocking of CaMKII- on NMDA mEPSC decay
kinetics ...................................................................................................................... 97
CHAPTER 5: EFFECT OF CAMKII- ON GABAA AND GLYCINE RECEPTOR
MEDIATED INHIBITORY SYNAPTIC CURRENTS ............................................ 130
5.1 Introduction ....................................................................................................... 13030
5.2 Results ................................................................................................................... 133
5.2.1 Characterization of GABAergic miniature inhibitory synaptic currents
(mIPSCs) in Mauthner cell ................................................................................... 1333
5.2.2 Effect of CaMK2- on GABA receptor mediated mIPSCs ........................ 1355
5.2.3 CaMKII- knockdown alters Glycine mIPSC decay kinetics ..................... 1366
CHAPTER 6: DISCUSSION ..................................................................................... 1622
6.1 Overview of findings ............................................................................................ 162
6.2 Zebrafish Mauthner cells express primarily camk2a at 2 dpf ............................... 164
6.3 Morphology and touch response ........................................................................... 166
6.4 AMPA mEPSCs are not affected in CaMKII- morphants ............................... 1707
6.5 NMDA receptor development ............................................................................... 170
6.6 Role of CaMKII- in synaptic GABAA receptor current development ............... 172
6.7 Development of glycine receptor current ............................................................. 175
6.8 Future research ...................................................................................................... 178
REFERENCES .............................................................................................................. 181

viii
List of Tables
Table 1.1 Excitatory and inhibitory ionotropic receptor subunits. ............................... 32
Table 2.1 List of primer pairs for reverse transcription PCR. ...................................... 54
Table 2.2: List of qRT-PCR primers. ............................................................................ 55
Table 3.1 Characteristics of the real-time PCR standard curves. ................................. 67
Table 4.1 Electrophysiological parameters of M-Cells. ............................................... 99

ix
List of Figures
Figure 1.1 Two days postfertilization (dpf) zebrafish embryo. ................................... 34
Figure 1.2 Structure and topology of excitatory glutamate receptors. ........................ 36
Figure 1.3 Structure and topology of glycine and GABAA receptors. ........................ 38
Figure 1.4 Structural organization of CaMKII subunit. .............................................. 40
Figure 2.1 Setup for electrophysiological recording from zebrafish M-cells ............. 56
Figure 3.1 Two dpf zebrafish embryos express all seven CaMKII genes. ................. 68
Figure 3.2 Measurement of output vs. input copy numbers of DNA standards ......... 70
Figure 3.3 Zebrafish M-cells express primarily camk2a transcripts ........................... 72
Figure 3.4 Quantification of camk2a cDNA copy number. ........................................ 74
Figure 3.5 Images of uninjected and morpholino injected 2 dpf zebrafish ................. 76
Figure 3.6 Knockdown of CaMKII- mRNA by splice-blocking morpholinio ......... 78
Figure 3.7 Immunoblot of zebrafish CaMKII- protein ............................................. 80
Figure 3.8 Immunohistochemical images of the M-cell labeled with anti-3A10 ....... 82
Figure 3.9 Locomotor behaviour of zebrafish in response to tactile stimuli .............. 84
Figure 3.10 Touch responses of 2 dpf, agar-restrained embryos .................................. 86
Figure 4.1 CaMKII inhibitors block upregulation of AMPAR mEPSCs ........... 100100
Figure 4.2 Amplitude histogram and scatter plot of AMPA mEPSCs.................... 1022
Figure 4.3 Kinetic properties of AMPA mEPSC recorded from 10 mM K+ stimulated
M-cells .......................................................................................................................... 1044
Figure 4.4 Acute effect of active CaMKII- on AMPA mEPSCs ......................... 1066
Figure 4.5 Spontaneous synaptic AMPAR currents obtained from M-cells........... 1088
Figure 4.6 AMPA mEPSC distributions ................................................................... 110
Figure 4.7 Properties of AMPA mEPSCs ................................................................. 112
Figure 4.8 Kinetic properties of AMPA mEPSCs .................................................... 114
Figure 4.9 Spontaneous synaptic NMDAR currents obtained from M-cells ............ 116
Figure 4.10 Long-term stability of NMDA mEPSCs ............................................... 1188
Figure 4.11 Properties of NMDA mEPSCs ................................................................ 120
Figure 4.12 Averaged NMDA mEPSCs ..................................................................... 122
Figure 4.13 Decay kinetics of NMDA mEPSCs ....................................................... 1244
Figure 4.14 NMDA mEPSC properties following 10 mM K+ stimulation ............... 1266
Figure 4.15 NMDA mEPSC decay kinetics following 10 mM K+ stimulation ........ 1288

x
Figure 5.1 GABA mIPSCs from M-cells of 2 dpf zebrafish embryos. .................... 1388
Figure 5.2 Properties of GABA mIPSCs ............................................................... 14040
Figure 5.3 Decay kinetics of GABA mIPSCs ............................................................ 142
Figure 5.4 Comparison of GABA mIPSC properties .............................................. 1444
Figure 5.5 Properties of Group I GABA mIPSCs in morphant zebrafish.................. 146
Figure 5.6 Decay time course distribution of Group I events .................................. 1488
Figure 5.7 Properties of Group II GABA mIPSCs in morphant embryos ................. 150
Figure 5.8 Spontenous synaptic GlyR currents from 2 dpf zebrafish M-cells ........... 152
Figure 5.9 Distributions of Glycine mIPSCs ........................................................... 1544
Figure 5.10 Properties of glycine mIPSCs ................................................................... 156
Figure 5.11 Averaged glycine mIPSCs ........................................................................ 158
Figure 5.12 Glycine mIPSC decay kinetics ................................................................. 160

xi
List of Abbreviations
AIP Autocamtide-2-related inhibitory peptide
AMPA Alpha-amino-3-hydroxy- 5-methyl-4-isoxazole propionic acid
AMPAR AMPA receptor
APV D(-)-2-amino-5-phosphonopentanoic acid
BSA Bovine serum albumin
camk2 CaMKII gene
CaMKII Calcium/calmodulin dependent protein kinase 2
CNS Central nervous system
Ct Threshold cycle
dpf Day post-fertilization
DRG Dorsal root ganglia
EPSC Excitatory postsynaptic current
EPSP Excitatory postsynaptic potential
GABA - aminobutyric acid
GABAAR Ionontropic GABAA receptor
GluA AMPA receptor subunit
GluN NMDA receptor subunit
GlyR Glycine receptor
hpf Hours postfertilization
iGluR Ionotropic glutamate receptor
KN-62 4-[(2S)-2-[(5-isoquinolinylsulfonyl)methylamino]-3-oxo-3-(4-
phenyl-1-piperazinyl)propyl] phenyl isoquinolinesulfonic acid ester
KYN Kynurenic acid
LTD Long-term depression
LTP Long-term potentiation
M-cell Mauthner cell
mEPSC miniature excitatory postsynaptic current
mEPSP Miniature excitatory postsynaptic potential
mIPSP Miniature inhibitory postsynaptic potential
MO Morpholino oligonucleotide
ms millisecond
mV millivolt
MΩ megaohm
NMDA N-methyl-D-aspartate
NMDAR NMDA receptor
pA picoampere
PBS Phosphate-buffered solution
PFA Paraformaldehyde
pS picosiemens
PSD Postsynaptic density
PTU N-phenylthiourea

xii
RT-PCR Reverse transcription polymerase chain reaction
RT-qPCR Reverse transcription quantitative real-time polymerase chain
reaction
TARP Transmembrane AMPA receptor regulatory protein
TTX Tetrodotoxin

1
Chapter 1: General Introduction
1.1 Introduction
Calcium/calmodulin dependent protein kinase 2 (CaMKII) is a multifunctional
serine/threonine kinase that is abundant in the brain and is highly expressed in the
synapse (Feng et al., 2011; Hudmon and Schulman, 2002; Kennedy et al., 1983). In
mammals, CaMKII is encoded by four distinct genes or ) (Hudmon and
Schulman, 2002). The holoenzyme is composed of 12 individual subunits of varying
stoichiometries (Brocke et al., 1999; Gaertner et al., 2004) and is activated upon binding
to calcium/calmodulin, which results in autophosphorylation and persistent kinase
activity (Coultrap and Bayer, 2012).
CaMKII has a wide variety of neuronal targets and plays a major role in synaptic
plasticity, presynaptic excitability and neuronal development (Hojjati et al., 2007; Liu et
al., 2007; Lu and Hawkins, 2006; Pang et al., 2010; Shakiryanova et al., 2007;
Shakiryanova et al., 2011). For instance, during hippocampus-dependent learning and
memory, CaMKII translocates to the synapse where it binds to the GluN2B subunit and
up-regulates NMDA receptor activity (Bayer et al., 2001; Hell, 2014). It regulates the
trafficking and gating of AMPA receptors (Hayashi et al., 2000; Kristensen et al., 2011a;
Lu et al., 2010; Rongo, 2002) and modulates dendritic spine volume by interacting with
cytoskeleton components such as Factin (Ahmed et al., 2006; O'Leary et al., 2006;
Okamoto et al., 2007; Pi et al., 2010). CaMKII activity alters the surface expression of
GABAA receptors (Guetg et al., 2010; Marsden et al., 2010) and enhances the clustering
of glycinergic receptors. Furthermore de-regulation of CaMKII leads to changes in

2
synaptic connectivity, aberrant dendritic branching, impeded dentate gyrus development
and substantial behavioral deficits in rodent models (Hagihara et al., 2013; Hardingham
et al., 2003; Lo Iacono and Gross, 2008; Pattinson et al., 2006b; Yamasaki et al., 2008).
While much attention has been paid to the role of CaMKII in mature organisms, there is
comparatively less information on the role of CaMKII at developing and maturing
synapses.
Research in the Ali laboratory has focused on the development of synaptic properties
associated with zebrafish Mauthner cells (M-cells) (Ali et al., 2000a; Ali et al., 2000b;
Brewster and Ali, 2013; Patten and Ali, 2007, 2009). A particularly attractive reason for
this focus on the M-cells is that one can return to the same cell from preparation to
preparation to study excitatory synaptic development in vivo. Embryonic development is
very rapid; the fertilized eggs hatch in two days, and the embryos are transparent,
allowing extensive imaging studies to be performed on whole organisms. The genome
has been sequenced and the technology is available to either knockdown or knockout
proteins of interest (Ekker, 2000; Nasevicius and Ekker, 2000; Patten et al., 2010;
Tallafuss et al., 2012). Moreover, one can closely examine escape responses and
swimming behaviors. Thus the zebrafish is an excellent organism to investigate the link
between synaptic development and locomotor responses.
The overall objective of my research is to understand the role of CaMKII in synaptic
development. I am particularly interested to know how CaMKII aids synaptic maturation
in vivo. Zebrafish express seven different isoforms of CaMKII, therefore, I will focus on

3
determining which isoforms are expressed in the M-cell, and will then investigate how
those isoforms might affect M-cell morphology and synaptic physiology. My work has
broad implications because improper synaptic development could lead to a wide range of
behavioral and physiological deficits in the developing organisms. Thus, it is important to
have a thorough understanding of synaptic development for basic and translational
science. My specific research goals are listed below-
Aim 1: To characterize the expression profile of CaMKII isoforms in zebrafish
Mauthner cells during hatching.
Aim 2: To determine the role of CaMKII in the development of synaptic currents
associated with M-cells.
1.2 Outline of thesis
I present my thesis in 6 chapters. In this first chapter, I give a general introduction to
my research and review relevant literature. The second chapter is a detailed description of
the methods and materials I have used throughout my research. I present the findings of
my research in Chapters three to five. Finally, I present an overview of all research
findings, their significance and future direction in chapter six.

4
1.3 Literature review
1.3.1 Overview
Zebrafish is a suitable model for studying the role of CaMKII in neurodevelopment.
In this section, I review embryonic development of zebrafish, with an emphasis on
synaptic development onto M-cells, and development of locomotor responses. I
summarize the structure and function of synaptic receptors involved in synaptic
transmission in M-cells. Finally, I describe structure, function and distribution of CaMKII
and how this enzyme influence synaptic transmission.
1.3.2 Overview of the system: Zebrafish M-cells
Zebrafish has been widely used to study vertebrate development since its introduction
by George Streisinger in 1981. It is a freshwater fish native to the Ganges river and found
in East India, Bangladesh, Nepal and Myanmar. They belong to the Cyprinidae family of
teleost fish. Zebrafish offers many advantages for developmental studies, such as high
fecundity (females produce hundreds of eggs at bi-weekly intervals), external
fertilization, transparent embryos, rapid development, short generation time (3-4 months)
and easy maintenance.
Zebrafish embryonic development is divided into eight distinct periods of
embryogenesis- the zygote, cleavage, blastula, segmentation, pharyngula, and hatching
periods (Kimmel et al., 1995). The newly fertilized eggs are in the zygotic period, which
is about 40 minutes long. The cleavage period begins with the first cell division around
34⁄ hours post fertilization (hpf) and continues until 7 cleavage cycles, ending in the 64-

5
cell stage embryos. The blastula (2 1 4⁄ -5 1 4⁄ hpf) period encompasses development
from the eighth zygotic cell cycle, or 128-cell stage, until the beginning of gastrulation.
This period is characterized by lengthening and asynchrony of cell cycles, and onset of
epiboly, which refers to thinning and spreading of the cell layer due to cell movement
over the yolk, producing a blastoderm. During the gastrula period (5 1 4⁄ -10 hpf), epiboly
continues and morphogenetic cell movements of involution, convergence and extension
produce the primary germ layers and the embryonic axis. The M-cell is born during this
period, around 8-10 hpf (Mendelson, 1986). The segmentation period (10-24 hpf) marks
the beginning of primary organogenesis and somitogenesis through which a basic
vertebrate body plan emerges. At the pharyngula phase (24-48 hpf) the body straightens
up from the curved state, fins develop, and pigment cells differentiate and melanophors
begin to form characteristic body stripes. The circulatory system, consisting of a beating
heart and a closed set of channels also forms at this stage. The embryos are encased in the
chorion and hatch out asynchronously during the hatching period (48-72 hpf). They
continue to grow and morphogenesis of many rudimentary organs nears completion by
the end of day 3 (72 hpf). During the early larval period, after 72 hpf and onwards, the
morphogenesis of the hatched larva is complete and the swim bladder becomes inflated.
The primordial central nervous system of zebrafish begins to develop during
gastrulation. By the end of gastrulation the neural plate becomes thick and well defined.
Ten distinct folds or neuromeres are formed along the anterior part of the neural plate that
will eventually develop into the brain. The posterior cells of the neural plate give rise to
the trunk spinal cord. The first two neuromeres form the two forebrain subdivisions, the
6
diencephalon and telencephalon, while the third neuromere forms the midbrain or
mesencephalon. The remaining seven neuromeres represent the hindbrain, which is
divided into seven divisions or rhombomeres (r1-r7). Other CNS structures, such as the
premordium of hypothalamus, cerebellum, rudimentary structures of the eyes and optic
primordia are formed later in the segmentation period.
Morphogenesis of the neural tube closely parallels neuronal differentiation. The first
neurons to arise in the nervous system are referred to as primary neurons, which rapidly
develop long axons, and form a simple neural network that mediates the early embryonic
behaviours such as spontaneous movement of the trunk and tail as well as avoidance
response to tactile stimuli (Grunwald et al., 1988; Metcalfe et al., 1990). Different types
of identifiable primary neurons, including interneurons of the hindbrain and spinal cord
(Kuwada et al., 1990; Mendelson, 1986), motoneurons (Eisen et al., 1986; Myers et al.,
1986) and sensory neurons (Metcalfe et al., 1990) have been characterized from very
early stages of development. The earliest interneurons to originate in zebrafish are a pair
of M-cells, which belong to the reticulospinal neuron (RSN) group and play a key role in
the escape response of the organism (Kimmel et al., 1981; Mendelson, 1986; Zottoli,
1978). RSN neurons arise as a single cluster in the midbrain and seven separate clusters
in the hindbrain, with each cluster sitting in one neuromere (Lee et al., 1993). The
reticulospinal system is comprised of twenty-seven types of RSNs, which are readily
identifiable due to their distinct morphology, forming the primary descending system of
zebrafish (Eaton and Farley, 1973; Kimmel et al., 1981). The RSNs, together with other
descending neurons of the brain stem regulate sensorimotor coordination, and control the
7
turning and swimming behaviours in zebrafish (Eaton et al., 2001; Gahtan et al., 2002).
Arising at about 7.5 hours post fertilization (hpf) during the gastrulation period, M-cells
are the first of the RSN neurons to appear in the nervous system, closely followed by
their serial homologs MiD2cm and MiD3cm, which appear at 9.5 hpf (Mendelson, 1986).
The M-cell has two large crescent shaped dendrites, one projecting laterally (the lateral
dendrite) and the other projecting ventrally (the ventral dendrite) (Kimmel et al., 1981).
Additional finer dendrites arise from these two prominent dendrites and the cell body.
M-cells receive sensory inputs from the somatosensory, visual, acousto-vestibular and
lateral line systems, with each type of afferent projecting to one of the prominent
dendrites. The first sensory inputs to the M-cells form around 18 hpf from somatosensory
trigeminal ganglion cells, which are also some of the first sensory neurons to arise in the
nervous system around 14 hpf (Kimmel et al., 1990; Metcalfe et al., 1990). Peripheral
axons from the trigeminal ganglia, located between the eye and the otic vesicle, innervate
the skin of the head and rostral part of the yolk sac, while the central axons projects to the
hindbrain. M-cells also receive somatosensory input from the Rohon-Beard neurons in
the spinal cord that innervate the skin of the trunk and project axons to the hindbrain
around 19 hpf (Metcalfe et al., 1990). Transmission of somatosensory stimuli to M-cells
is taken over by the neurons of the dorsal root ganglia (DRG) as the Rohon-Beard cells
start to die off (Kohashi and Oda, 2008; Lewis and Eisen, 2003). Bipolar neurons of these
ganglia begin to differentiate at 36 hpf and appear in the spinal cord by 45 hpf (An et al.,
2002; Bernhardt et al., 1990; Reyes et al., 2004). Input from the ears (otoliths) is relayed
by the acoustic-vestibular ganglion (VIIIth
cranial nerve) to the M-cells beginning at 23

8
hpf (Kimmel et al., 1990). Input from the lateral line neurons arrive last at around 25 hpf
and are believed to modulate M-cell’s response to acustico-vestibular input (Chang et al.,
1987; Faber and Korn, 1975). The sensory inputs onto M-cells terminate as electrical,
chemical or mixed synaptic contacts (Kimmel et al., 1990). Electrical synapses are
predominantly found on the ventral dendrites and ventral perikaryon of the M-cell,
whereas chemical synapses are found largely on the lateral dendrites and dorsal surface
of the cell (Kimmel et al., 1981). Chemical synapses predominate over the electrical and
mixed synapses during early development, while gap junctions become identifiable by 3
days post fertilization (Kimmel et al., 1981; Yao et al., 2014). Chemical synapses on M-
cells are either excitatory (glutamatergic AMPA and NMDA) or inhibitory (glycinergic
and GABAergic) in nature (Ali et al., 2000a; Ali et al., 2000; Ali et al., 2000b; Legendre,
1998; Legendre and Korn, 1994; Triller et al., 1997).
The M-cells relay sensory information to motor centers in the brain and spinal cord.
The pair begins to extend axons in the segmentation period (18 h), concurrently with the
arrival of axonal growth cones from trigeminal sensory neurons. The axons cross the
midline of the brain and descend on the contralateral side to extend the entire length of
the spinal cord. The axons send collaterals which synapse onto to the descending spinal
interneurons as well as motoneurons that innervate the muscles (Celio et al., 1979;
Fetcho, 1992; Fetcho and O'Malley, 1995; Svoboda and Fetcho, 1996). The descending
interneurons are electrically coupled to two to four motoneurons (Celio et al., 1979;
Gahtan and O'Malley, 2003). Thus, activation of an M-cell results in synchronous

9
activation of the motoneurons, leading to contraction of the body and tail musculature
that drives the escape response of the fish (Fetcho and O'Malley, 1995).
The escape response, an evasive behavior that animals use to flee from the predators,
is essential for the survival of the animal (Eaton et al., 1977). The response is a two- stage
behavior; the animal makes a C-bend to orient the body away from the stimulus at first
and then propel it away from the danger in the direction of the initial turn (Eaton et al.,
1988). The M-cells are critically involved in the first stage of the escape response (Eaton
et al., 2001; Zottoli, 1977) and are responsible for activation of short-latency C-start
(SLC) responses occurring within 5-6 ms of detection of the stimulus (Burgess and
Granato, 2007; Kohashi and Oda, 2008; Liu and Fetcho, 1999). Fish where M-cells were
ablated lacked SLC and showed long-latency C-start (LLC) responses characterized by
an increased latency and turn duration, and decreased angular velocity (Kohashi and Oda,
2008; Liu and Fetcho, 1999). In freely swimming zebrafish, tactile stimuli to the head
activates the M-cells and its homologs, producing a large escape response (Foreman and
Eaton, 1993). A stimulus to the tail activates only M-cells that produce a rapid but small
response. M-cells usually fire only one action potential when activated followed by a
temporary inhibition (Nakayama and Oda, 2004; Zottoli, 1977). Inhibition occurs due to
activation of inhibitory synaptic inputs onto the M-cells and increased conductance of
potassium currents (Brewster and Ali, 2013; Furukawa and Furshpan, 1963; Nakayama
and Oda, 2004; Zottoli, 1977). Inhibitory commissural interneurons synapse onto both M-
cells and contribute to the feed forward inhibition, whereas inhibitory collateral neurons
provide recurrent inhibition to the ipsilateral M-cell.

10
1.3.3 Synaptic transmission in zebrafish Mauthner cell
The neurons in the central nervous system communicate with each other through
specialized anatomical structures called synapses. Presynaptic neurons can pass
information to the postsynaptic cell directly through electrical synapses, or via chemical
synapses. In the vertebrate brain, chemical synapses are more common than electrical
synapses. Electrical synapses allow the direct flow of current from presynaptic neurons to
postsynaptic neurons through gap junctions, which provide electrical continuity between
cells. Chemical synaptic transmission can be mediated directly by ionotropic
neurotransmitter receptors, or indirectly by metabotropic receptors. Ionotropic receptors
are ligand-gated ion channels in the postsynaptic membrane that respond to
neurotransmitters by allowing ions to flow, thereby mediating chemical synaptic
transmission. Metabotropic receptors, which mediate slow, indirect chemical
transmission, produce intracellular second messengers in the postsynaptic cell when
activated by neurotransmitters released from presynaptic cell. The second messengers
then influence ion channels and other intracellular targets that result in excitation or
inhibition of the postsynaptic cell.
In the mammalian nervous system three main neurotransmitters mediate the majority
of fast synaptic transmission: glutamate, glycine, and γ-aminobutyric acid (GABA).
Glutamate is the primary neurotransmitter mediating excitatory synaptic transmission in
the mammalian central nervous system. It acts on three types of ionotropic receptors: α-
Amino-3-hydroxy-5-methyl-4-isoxazolepropionic acid (AMPA), N-methyl-D-aspartate
(NMDA), and kainate (KA) receptors. Ligand binding to these ionotropic glutamate

11
receptors (iGluRs) leads to opening of the intrinsic cation channels, which allow Na+, K
+,
and sometimes Ca2+
to flow down their electrochemical gradients. As a result, excitatory
postsynaptic potentials (EPSPs) are generated, which depolarize the postsynaptic
membrane potential. These local depolarizations cause the opening of voltage-gated ion
channels and lead to the generation of action potentials in the postsynaptic cell, if the
depolarization is above threshold. Glycine and GABA are the primary inhibitory
transmitters in the adult CNS. They activate ionotropic receptors that are anion channels,
allowing Cl- to flow down its electrochemical gradient. In adult organisms, Cl
- influx into
the postsynaptic cell generates inhibitory postsynaptic potentials (IPSPs) causing
hyperpolarization of the membrane potential and thus inhibiting action potential
production. By contrast, activation of glycine and GABA inotropic receptors during early
embryonic development, when intracellular Cl- concentration is high, causes an efflux of
Cl- and a subsequent membrane depolarization that may induce action potentials to be
produced (Ben-Ari, 2002).
In this section, I will briefly discuss fast synaptic transmission through ionotropic
receptors. Throughout the thesis, I refer to the mammalian ionotropic receptor subunits
and the encoding genes according to the terminology proposed by The International
Union of Basic and Clinical Pharmacology (IUPHAR) (Collingridge et al., 2009). The
ZFIN Zebrafish Nomenclature Guidelines was followed to refer Zebrafish orthologs of
mammalian genes (Zebrafish Nomenclature Committee (ZNC), 1992). Briefly, gene
names and symbols are written in lowercase letters and italicized, whereas protein names

12
and symbols are non-italic with an uppercase first letter. A comprehensive list of the
ionotropic receptor subunits that are discussed in the thesis is presented in Table 1.1.
1.3.3.1 AMPA receptors
Subunit Composition and structure
AMPA receptors (AMPARs) are complexes of four subunits (GluA1-4) with varying
stoichiometry (Hollmann and Heinemann, 1994). In mammals, four closely related genes,
which have approximately 70% sequence identity, encode the subunits. However,
zebrafish has eight homologs of the mammalian genes due to genome duplication in
teleost fish (Table 1.1). Sequence homology among different subunits suggests that they
share a common architecture, with each subunit comprised of four semi-autonomous
domains: the extracellular amino-terminal domain, the extracellular ligand-binding
domain, the transmembrane domain , and an intracellular carboxyl-terminal domain
(Figure 1.2) (Traynelis et al., 2010). The extracellular domain is formed from the first
~450 amino acids and plays important roles in subunit assembly and receptor trafficking
(Kumar and Mayer, 2013). Additionally, this domain influences ligand binding, receptor
open probability, desensitization, deactivation and contains binding sites for divalent
ions, allosteric modulators and extracellular proteins. The ligand binding domain
provides the binding pocket for the receptor agonists. It is highly conserved within
receptor classes and is formed from two extracellular polypeptide chains referred to as S1
and S2 (Traynelis et al., 2010). A polypeptide section on the amino terminal (N-terminal)
of M1 membrane helix forms S1 while the segment between M3 and M4 membrane
helices forms S2. Agonist binding leads to a conformational change in ligand binding

13
domain, which in turn leads to structural rearrangement of M3 membrane helix and
channel opening. The transmembrane domain of glutamate receptors is composed of M1,
M3, M4 transmembrane helices and the M2 reentrant helix from each of the four
subunits, and forms the core ion channel. The carboxyl-terminal domain of glutamate
receptors is diverse in amino acid sequence and length. It contains many sites for
phosphorylation and binding of intracellular proteins. It influences membrane targeting,
stabilization and post-translational modification of the receptors.
All AMPAR subunits undergo alternative splicing in a region N-terminal to the M4
transmembrane helix; producing ‘flip’ and ‘flop’ splice variants (Mosbacher et al., 1994;
Sommer et al., 1990). The splice variants influence channel desensitization kinetics and
sensitivity to various allosteric modulators. The AMPAR subunits can also undergo
alternative splicing on carboxyl-terminal domain, giving rise to either ‘short’ or ‘long’
isoforms (Gallo et al., 1992). In addition to alternative splicing, AMPARs undergo RNA
editing post-transcriptionally at a site that resides at the apex of the reentrant M2 helix
converting a glutamine (Q) residue into arginine (R) (Sommer et al., 1991). The vast
majority of GluA2 subunits in the CNS are edited at this site. AMPARs with edited
GluA2 exhibit low Ca2+
permeability and low single channel conductance due to the
large size and positive charge on the side chain in the edited form. In addition to the Q/R
site, another codon immediately preceding the flip/flop site, the R/G site, may be edited
in GluA2, -3, and -4. The RNA editing in AMPAR subunits are carried out by RNA-
dependent adenosine deaminase 2. All AMPAR subunits also have glycosylation sites in
the S1 region that forms the ligand binding domain. Cell-specific differences in AMPAR
14
subunit composition and post-translational modifications contribute to the differences in
trafficking, ligand affinity, and receptor kinetics.
Trafficking
AMPAR subunits assemble as dimers of dimers in the endoplasmic reticulum (ER).
Conformational changes in the subunits which are necessary for normal receptor function
also occurs in the ER and influences receptor trafficking to dendritic membrane. Surface
AMPARs are incorporated into synapse by lateral diffusion from extrasynaptic sites and
stabilized by postsynaptic scaffolding proteins. Under basal condition, mature AMPARs
undergo constitutive recycling where synaptic AMPARs are internalized from plasma
membrane and trafficked to early endosomes. AMPARs can be inserted back to the
plasma membrane from the early endosomes for fast recycling, or through recycling
endosomes. AMPARs in late endosomes enter degradation pathway (Anggono and
Huganir, 2012). Interactions between AMPARs and their accessory proteins, such as
transmembrane AMPA receptor regulatory proteins (TARPs), chornicons (CHINs), and
other auxiliary subunits play important roles in AMPAR trafficking.

15
Distribution
The expression and distribution of AMPAR subunits are developmentally and
regionally regulated, which reflects a balance of transcription, translation, receptor
assembly, and presentation at the cell surface. AMPAR subunits are widely expressed in
the CNS. GluA1, -2, and -3 are highly expressed in the hippocampus, outer layers of
cortex, olfactory regions, basal ganglia and amygdala of rat CNS (Hollmann and
Heinemann, 1994). In contrast, GluA4 expression is mostly low to moderate throughout
the brain. Glial cells also express AMPARs, where they are involved in excitotoxicity
(Gallo and Russell, 1995; Yoshioka et al., 1996). AMPARs have also been shown to
localize in presynaptic terminals, where they regulate neurotransmitter release (Barnes et
al., 1994) and movement of axonal filopodia (Chang and De Camilli, 2001). In
embryonic zebrafish, eight AMPAR subunit mRNA express differentially throughout the
CNS (Hoppmann et al., 2008). Importantly, all subunits are expressed in hindbrain,
hypothalamus, telencephalon and olfactory bulb between 48 and 72 hpf. Expression
patterns in earlier developmental periods and in other brain regions are variable.
Physiology and function
Synaptic AMPARs activate upon binding of glutamate, allowing a brief pulse of
current with a fast deactivation time course of 1-2 milliseconds. The precise kinetics and
amplitude of the currents are determined by the subunit composition and synaptic density
of the receptors, along with time course of glutamate release and uptake. Properties of
AMPA receptors have been studied extensively in developing zebrafish M-cells
previously, where the receptor kinetics becomes faster during development between 33

16
and 48 hpf (Ali et al., 2000a; Patten and Ali, 2007; Patten et al., 2010). The average
amplitude of spontaneous AMPAR mEPSCs in developing zebrafish embryo has a
unimodal distribution, with peak amplitude increasing significantly between 33 and 48
hpf, from about 24 pA to about 30 pA along with a fourfold increase of mEPSCs
frequency. The deactivation kinetics of AMPARs is best fitted with a single exponential
curve, which decreases progressively with development between 33 to 72 hpf. The
AMPARs in zebrafish have a fast rise time of about 0.1 ms, which does not change
significantly during embryonic development.
AMPA receptors play key roles in the activity-dependent synaptic plasticity
phenomena such as long term potentiation (LTP) and long term depression (LTD) which
are believed to be the cellular correlate of learning and memory (Nicoll and Roche,
2013). Both forms of synaptic plasticity require trafficking of AMPARs. During LTP
AMPARs are inserted into the postsynaptic membrane, resulting in potentiation. During
LTD, the rate of synaptic AMPARs internalization outpaces the rate of insertion, leaving
reduced number of AMPARs at the synapse. In embryonic zebrafish, AMPARs have
been shown to undergo activity-dependent potentiation that relies on the trafficking and
insertion of AMPARs into the postsynaptic membrane (Patten and Ali, 2009). AMPAR
trafficking is also necessary for the maturation of glutamate synapses, as developmental
transition of slow-kinetics AMAPARs to fast-kinetics AMPARs relies on the receptor
trafficking (Patten et al., 2010).

17
1.3.3.2 NMDA receptors
Subunit composition and expression
NMDA receptors (NMDARs), which belong to the ionotropic glutamate receptor
family, are transmembrane protein complexes of four large subunits of more than 900
amino acids long (Paoletti et al., 2013). The structure of each subunit is similar to that of
other ionotropic glutamate receptors, consisting of four distinct modules (Figure 1.2).
There are seven different subunits of NMDARs in mammals, which are grouped into
three subfamilies based on sequence homology: GluN1 subunits, four GluN2 subunits
(GluN2A, GluN2B, GluN2C and GluN2D), and two GluN3 subunits (GluN3A and
GluN3B). The LBD in GluN1 and GluN3 subunits bind to glycine (or D-serine), whereas
in GluN2 subunits it binds to glutamate. NMDARs are composed of two copies of the
obligatory GluN1 subunits and two copies of GluN2 subunits, or a combination of GluN2
and GluN3 subunits, leading to the formation of di-heteromeric and tri-heteromeric
receptors.
The GluN1 subunit, encoded by a single gene, has eight different isoforms resulting
from alternative splicing (Paoletti et al., 2013) . It is ubiquitously expressed in the CNS
from embryonic stages to adulthood, although isoform-specific differences exist. GluN2
subunits, which are major determinants of NMDARs functional properties, also show
differential spatiotemporal expression patterns. In rodents, only GluN2B and GluN2D are
expressed at embryonic stages. GluN2A expression begins soon after birth and rises
steadily to become the most prevalent isoform throughout the CNS in the adult, while at
the same time GluN2D expression is reduced markedly. In contrast to GluN2D,
18
expression of GluN2B remains high following birth and peaks in the first postnatal week.
GluN3C is expressed later in development around postnatal day 10 and remains confined
to the cerebellum and the olfactory bulb. GluN3 isoforms also show differential
expression. GluN3A is expressed in early postnatal development and then declines over
time; while GluN3B expression increases slowly throughout development, leading to
high levels of expression in motor neurons of the adults. Overall, differential expression
patterns result in high levels of GluN2B, GluN2D and Glu3A subunits in early
development, suggesting their involvement in synaptogenesis and synaptic maturation.
On the other hand, high levels of GluN2A and GluN2B in the adult CNS point to the
importance of these isoforms in synaptic function and plasticity.
Expression of NMDAR subunits in zebrafish has been investigated by Cox et al
(2005). Zebrafish express two paralogs of each of the GluN1 and GluN2 genes (Table 1).
The GluN1 paralogs share about 90% amino acid identity to the corresponding human
subunit. The transmembrane domains and C-terminus regions show the most similarity
while the N-terminus region is more divergent. One important difference between
zebrafish and human GluN1 subunits is that the majority of the zebrafish transcript
contains the canonical motif for binding PDZ proteins, whereas it is not encoded in most
of the mammalian GluN1 subunits. Because they lack this protein binding motif,
mammalian GluN1 subunits depend on the PDZ motif containing GluN2 subunits for
protein-protein interactions in the postsynaptic density (PSD) (Kornau et al., 1995;
Niethammer et al., 1996). It is therefore suggested that zebrafish GluN1 subunits can
directly interact with PDZ proteins (Cox et al., 2005). The transmembrane domain

19
regions of GluN2 subunits are also 90% conserved between zebrafish and human
isoforms, while the N- and C- terminals are somewhat divergent. Zebrafish GluN2
subunit C-terminus is also longer than that found in mammals and contains several
sequence repeats. Like their human counterparts, all zebrafish GluN2 subunits contain a
PDZ binding motif. Expression of zebrafish grin1 paralogs, which encode the GluN1
subunit (Table 1.1) is observed from early embryonic development of 24 hpf and
becomes stronger by 48 hpf. Expression of grin2 genes in the CNS differs significantly,
with grin2c paralogs being absent throughout the development between 24-96 hpf, and
grin2ba appearing at 96 hpf. The other grin2 genes appear in the CNS within 24 to 48
hpf. There has been no study on the expression pattern of grin3 paralogs in zebrafish.
Physiology and function
Activation of NMDARs requires simultaneous binding of both glutamate and glycine,
because GluN1 and GluN3 subunits bind to glycine (or D-serine) and GluN2 subunits
bind to glutamate. The ion channel is also subjected to a voltage dependent block by
extracellular Mg2+
. As a result the receptor acts as a coincidence detector, sensing
postsynaptic depolarization and release of glutamate at the same time. NMDARs are
highly Ca2+
permeable. Activation of NMDARs generates a current with slow rise and
slow decay time compared to AMPARs. The decay of NMDAR excitatory postsynaptic
currents (EPSCs) is mainly governed by the identity of GluN2 subunit, with decay time
of GluN1/GluN2A, GluN1/Glu2B or GluN2C and GluN1/GluN2D receptors being 40,
300 and 2000 ms respectively (Paoletti et al., 2013). During early postnatal development,
NMDA receptors undergo a developmental switching of subunits whereby GluN2A
20
containing receptors predominates GluN2B containing receptors. This developmental
change in receptor subunit composition is evolutionarily conserved, and accompanied by
functional change of the receptors. In developing zebrafish, a developmental trend of
increasing amplitude of NMDAR containing synapses has been observed between 1.2 to
3 dpf embryos (Ali et al., 2000a). The deactivation phase of NMDAR mediated synaptic
currents of these embryos were best fitted with a biexponential function, which did not
vary much during the development, indicating that maturation of NMDAR synapses in
zebrafish probably occurs before 28 hpf. The role of NMDARs in synaptic plasticity has
been studied extensively. In hippocampus, a brief high-frequency stimulus to CA1
pyramidal cells leads to long-lasting strengthening of synaptic transmission. Induction of
this form of LTP is critically dependent on the activation of NMDARs, which
subsequently increases intracellular Ca2+
and trafficking of AMPARs to the postsynaptic
membranes. NMDAR dependent LTD has been also reported at many synapses.
1.3.3.3 GABAA receptor
Subunit composition and structure
GABAA receptors (GABAARs), like other Cys-loop ligand-gated chloride channels
(LGICs) including GlyRs, are heteropentameric assemblies (Figure 1.3). All GABAA
receptor subunits have a structural arrangement that is common to all group I LGICs,
with a large N-terminal extracellular domain, four transmembrane domains, a long
intracellular loop connecting transmembrane domain 3 and 4, and a short C terminus
(Corringer et al., 2000). A stretch of disulfide-bond rich 15 amino acids (Cys loop) in
extracellular domain is conserved throughout all LGICs. It provides binding sites for

21
glycine, antagonists and allosteric modulators whereas the transmembrane domain 2 from
five neighboring subunits forms the chloride channel.
GABAAR subunits are encoded by 19 different genes in mammals that fall into eight
subclasses based on sequence homology () (Table 1.1).
Assembly of different combinations of the subunits gives rise to a large number of
structurally and functionally distinct GABAARs, although majority of the receptors
abundant in brain combine 2 , 2 and a single or subunits (Farrant and Nusser,
2005). In general, two populations of GABAARs are found in the CNS; those that are
localized at postsynaptic densities and the others that are at extrasynaptic sites. The
synaptic receptors largely consist of 1-3, 2-3 and 2 subunits; although their
localization in postsynaptic specializations is not exclusive, as these receptors are also
found in extrasynaptic sites. The 2 subunit is essential for postsynaptic clustering of
GABAARs (Essrich et al., 1998). In developing postnatal brain, 3 functionally substitute
(Baer et al., 1999). Receptors that contain 4-6 along with and subunits are mostly
or exclusively distributed extrasynaptically. The lack of subunits in these receptors
probably lead to their failure to localize at synapses.
Physiology and function
GABAergic transmission during early embryonic development is primarily mediated
through extrasynaptic GABAARs that contain 5 and subunits, as well as 2/3 and
subunits (Deidda et al., 2014). These receptors show higher agonist affinity and capable
of binding ambient GABA, producing long lasting “tonic” currents in young neurons.

22
GABA is depolarizing and excitatory during early development due to high intracellular
chloride concentration (Ben-Ari et al., 2012). Thus, activation of extrasynaptic
GABAARs leads to persistent depolarization of immature neurons, which is critical for
cell migration, proliferation, neurite growth and synapse formation. As synapses develop,
GABAARs with 2 and 3 subunits, characterized by long-lasting currents become
widely expressed (Deidda et al., 2014). These subunits gradually become downregulated
and receptors with 1 become prevalent, resulting in faster decay time course allowing
for fine synaptic integration and network synchronization. Synaptic receptors mediate the
phasic GABAAR response.
1.3.3.4 Glycine receptor
Subunit composition and structure
Glycine receptors (GlyRs), which mediate fast inhibitory synaptic currents are group I
ligand-gated ion channels (LGICs) that belong to the Cys loop receptor family, which
also include GABAA receptors (GABAARs). GlyRs are heteropentameric assemblies of
two subunits, GlyR and GlyR, with a tightly bound cytosolic scaffolding protein,
gephyrin (Figure 1.3) (Lynch, 2004). Four vertebrate genes (Glra1-4) encode GlyRand
a single gene encodes GlyR(Grenningloh et al., 1990a; Grenningloh et al., 1990b)
GlyR subunits have more than 80% sequence homology and form functional
homomeric receptors in heterologous expression system. GlyR subunits contain the
critical determinants of the ligand binding sites. By contrast GlyR subunits, which has
less than 50% sequence similarity to GlyR subunits do not form functional receptors
when expressed alone in heterologous systems. This subunit also contributes to ligand
23
binding, provides binding sites for gephyrin, and plays essential roles in trafficking and
postsynaptic clustering of the GlyRs. All GlyR subunits share the common structural
features of other Cys-loop family of receptors.
Expression, physiology and function
GlyRs are expressed throughout the brain in a spatiotemporally regulated manner
(Malosio et al., 1991). The 2 subunit is the most widely expressed isoform in the brain
throughout embryonic development while mRNA for the subunit is expressed in the
cortex during early development. Expression of other GlyRs has not been identified in
embryonic brain. Postnatally, expression of and transcripts shows a dynamic
change, with expression being greatly reduced and progressively restricted to cortical
layer VI and dentate gyrus (Malosio et al., 1991). In contrast, transcripts show
widespread expression in all cortical layers, hippocampus, olfactory bulb, thalamus and
cerebellum. In rats and mice, transcripts for and subunits become detectable in the
CNS only after second postnatal week of development. 1 is the most prevalent GlyR
subunit in the adult CNS, where it is highly expressed in the hypothalamus, brainstem
and spinal cord. Synaptic 2 has been identified in different adult CNS regions, including
spinal cord, brainstem, midbrain, olfactory bulb and retina. 3 transcripts are expressed
later in development and are associated with regions that are involved in sensory and
motor functions (Dutertre et al., 2012). Distribution pattern of GlyR subunits in adult
zebrafish is generally consistent with that of mammalian CNS (Imboden et al., 2001).

24
The properties of GlyRs depend on the subunit composition of the receptors;
therefore, a shift from 2 subunits to 1 subunits during early postnatal development is
accompanied by a shift in GlyR channel kinetics. For example, the decay time of
spontaneous GlyR currents (mIPSCs) in hypoglossal motoneurons becomes smaller
during the first two postnatal weeks, from a mean value of 14.2 ± 2.4 ms to 6.3 ± 0.7 ms,
concomitant with a developmental switch from fetal 2 subunit to adult 1 subunits
(Singer et al., 1998). A developmental speeding of GlyR kinetics has also been observed
in zebrafish M-cells (Ali et al., 2000b; Legendre, 1998), where GlyR mIPSCs were first
observed in 26-29 hpf embryos at very low frequency, which increased several hundred
folds by the time of hatching at around 48 hpf. The mIPSCs had characteristic decay time
courses with two components (fast and slow), which progressively became faster
throughout embryonic development. During this developmental period, glycinergic
postsynaptic potentials shift from depolarizing in young embryos, to hyperpolarizing in
larvae (Reynolds et al., 2008; Saint-Amant and Drapeau, 2000). An excitatory
depolarizing effect of GlyR at early embryonic development plays important role in
synaptogenesis (Drapeau et al., 1999). It has been shown that GlyR transmission at these
early developmental stages induce activation of voltage-gated Ca2+
channels, which are
crucial for postsynaptic clustering of GlyRs (Kirsch and Betz, 1998). Additionally,
activation of presynaptic GlyRs is necessary for depolarization of nerve terminals and
glutamate release during early postnatal development (Turecek and Trussell, 2001).

25
1.3.4 Calcium/calmodulin dependent protein kinase 2 (CaMKII)
Calcium/calmodulin dependent protein kinase 2 (CaMKII) is a multifunctional
serine/threonine kinase that is highly abundant in the brain, constituting 1–2% of the total
protein. It is enriched at synapses and is the main protein of the postsynaptic density
(PSD). Neuronal CaMKII regulates important neuronal functions such as
neurotransmitter synthesis and release, modulation of ion channel activity, cellular
transport, cell morphology and neurite extension, synaptic plasticity and gene expression.
In zebrafish (Danio rerio), the activity of CaMKII can be detected as early as 2 hpf and
increases 100-fold by 3 days of development.
1.3.4.1 Expression profile of CaMKII genes in developing zebrafish brain
CaMKII is encoded by seven genes in zebrafish: one α gene (camk2a1), two β genes
(camk2b1), two γ genes (camk2g1 and camk2g2), and two δ genes (camk2d1 and
camk2d2) (Rothschild et al., 2007b). In situ hybridization of 72 hpf zebrafish reveals
relatively small amounts of camk2a1 mRNA in the forebrain compared with β1
(camk2b1), which is highly expressed in the forebrain and midbrain by 72 hpf. γ1
expression is reduced by 48 hpf, but then reappears strongly in the mid- and hindbrain by
72 hpf, while γ2 has been detected in the mid- and hindbrain at 48 and 72 hpf. Expression
of δ1 mRNA is very weak in the brain, whereas δ2 is strongly expressed in the midbrain
at 48hpf and in mid- and hindbrain at 72hpf. The distribution pattern of CaMKII isoforms
in zebrafish demonstrates that these isoforms are expressed in a spatiotemporally
regulated manner in the CNS.

26
1.3.4.2 Structure and regulatory mechanism
The CaMKII holoenzyme is a homo- or hetero-oligomeric complex of 12 subunits
(Gaertner et al., 2004). Each subunit has three distinct domains: a C-terminal association
domain, an N-terminal catalytic domain, and a regulatory domain in between (Figure
1.4). The catalytic domain contains the ATP- and substrate-binding sites, as well as sites
for interaction with anchoring proteins, and inherently capable of catalyzing the
phosphotransferase reaction. The sequence of amino acids 282–300 within the regulatory
domain is known as the autoinhibitory domain which resembles protein substrates. This
pseudosubstrate region interacts with the catalytic domain to block the ATP binding site,
and inhibits the kinase activity of the enzyme. The amino acid sequence 293–310 binds
calcium/calmodulin and partially overlaps with the autoinhibitory domain. Binding of
calcium/calmodulin to the calmodulin binding site disrupts the interactions between the
autoinhibitory and catalytic domains, activates the enzyme and exposes Thr286 on the
autoinhibitory domain. The exposed Thr286 can now be phosphorylated by a neighboring
subunit.
Autophosphorylation of Thr286 has two primary consequences: (1) the subsequent
dissociation of bound Ca2+
/CaM is decreased by several folds, thereby prolonging its
activation, and (2) even after full dissociation of Ca2+
/CaM, the kinase retains partial
(30%–60%) activity (i.e., Ca2+
-independent or constitutive/autonomous activity). Thus,
transient elevations of intracellular [Ca2+
] can result in prolonged CaMKII activity until
protein phosphatases dephosphorylate Thr286 (Colbran, 2004a). Moreover, the extent of
CaMKII autonomous activity can be dictated by the frequency of Ca2+
oscillations. This

27
mechanism is thought to be critical in several physiological situations, especially
potentiation of synaptic transmission during learning and memory (Lisman et al., 2002).
Once CaMKII is in the autonomous state, other sites within the calmodulin binding
domain (Thr305/6) are available for phosphorylation. When these sites are
phosphorylated, calmodulin can no longer bind to CaMKII and the activity of the enzyme
becomes insensitive to changes in calcium/calmodulin.
CaMKII is present in the neuron as a soluble protein, which localized to the
postsynaptic region in an activity dependent manner. Importantly, CaMKII constitutes the
major protein of the postsynaptic density (PSD) in dendritic spines where it interacts with
several proteins (Colbran, 2004b). Interaction of CaMKII with the PSD is dynamic and is
regulated by binding of Ca2+
/CaM and the phosphorylation status of CaMKII. For
instance, autophosphorylation of Thr286 promotes and stabilizes CaMKII binding to the
PSD whereas autophosphorylation of Thr305/306 suppresses this interaction.
1.3.4.3 CaMKII and Synaptic plasticity
Synaptic plasticity is a property of vertebrate brain that refers to the modification of
strength of synapses depending on their recent level of activity. Depending on the
specific pattern of stimulation, individual synapses can increase or decrease the strength
of their transmission. Short term synaptic plasticity, lasting from several milliseconds to
few minutes, has been proposed to play important roles in short-term adaptations to
sensory inputs, transient changes in behavioral states and short lasting memory (Citri and
Malenka, 2008). A short burst of activity induces this type of synaptic plasticity by
28
causing transient increase of calcium in presynaptic nerve terminals. An increase in
presynaptic calcium in turn activates the pathway for vesicle exocytosis, thereby
increasing release probability. Several lines of study suggest that presynaptic CaMKII,
predominantly associated with synaptic vesicles, regulates neurotransmitter release and
short term synaptic plasticity (Wang, 2008).
The two prominent forms of long lasting synaptic plasticity, long-term potentiation
(LTP) and long-term depression (LTD), have been considered as a cellular model for the
process of learning and memory formation. LTP is triggered by the activation of N-
methyl-D-aspartate (NMDA) receptors (NMDARs) followed by the trafficking of α-
amino-3-hydroxy-5-methyl-4-isoxazole propionic acid (AMPA) receptors (AMPARs)
into the postsynaptic membrane. At resting potential, AMPARs provide the majority of
fast excitatory current of sodium and potassium ions whereas NMDARs become
permeable only at a depolarized membrane potential due to its magnesium block that
occludes the channel at resting potential. Upon activation, NMDARs allow sodium as
well as calcium ions to flow into the postsynaptic cell. Several lines of study have shown
that CaMKII is activated by the NMDA-receptor-mediated Ca2+
elevation which triggers
the induction of LTP (Lisman et al., 2002). Extracellular or intracellular application of
CaMKII inhibitors such as KN-62 and AIP, blocks LTP (Ito et al., 1991). Conversely,
application of constitutively active CaMKII to CA1 hippocampal pyramidal cells
increases AMPA receptor mediated synaptic transmission and prevents further LTP
induction (Lledo et al., 1995). A specific subunit of AMPAR (GluR1) can be
phosphorylated at Ser831 by CaMKII. Although phosphorylation of Ser831 enhances

29
channel function, it is not necessary for AMPARs trafficking. It has been proposed that
the stable binding of autophosphorylated CaMKII to the NMDA receptor leads to the
organization of a structural process that incorporates AMPA-receptor-binding proteins
into the PSD, and subsequently anchors additional AMPA receptors (Lisman 2001).
CaMKII has also been implicated in the regulation of plasticity and synaptic
transmission of inhibitory synapses containing type A (ionotropic) γ-aminobutyric acid
(GABAA) receptors. Application of constitutively active CaMKII increases the amplitude
and prolongs the duration of β3 subunit-containing GABAA receptor mediated IPSCs in
rat cerebellar granule neurons (Houston and Smart, 2006). The potentiation is a
consequence of altered channel kinetics following phosphorylation of the receptor. On
the other hand, CaMKII induced increase in GABAA IPSC in the hippocampus has been
proposed to be the result of recruitment of new receptors to the cell surface (Wei et al.,
2004).
1.3.4.4 Regulation of neuronal morphology by CaMKII
Neurite extension, branching, stabilization and maturation are important neuronal
plasticity events that can lead to the addition of synaptic contacts in developing neurons,
and changes in the number of synapses on mature neurons. CaMKII regulates dendritic
arborization and maturation of dendritic branches (Fink et al., 2003; Wu and Cline 1998).
For instance, inhibition of CaMKII by the specific CaMKII inhibitor, KN-93, leads to a
rapid reduction in filopodial motility and small dendritic branching, and a longer-term
decrease in the degree of dendritic arborization (Fink et al., 2003). Knockdown of
30
CaMKII-β expression by RNAi reduced dendritic arborization and synapse formation,
whereas overexpression increased the number of synapses. CaMKII-a appeared to have
opposing effect on dendritic arborization, which decreased branching and increased
stabilization when overexpressed in Xenopus tectum (Wu and Cline, 1998). Together,
these data suggest that CaMKII play important roles in the regulation of neuronal
morphology.
1.4 Research Objectives and Aims
As previously mentioned, my research objective is to understand the role of CaMKII
in synaptic development. My studies were guided by 2 main aims as presented below:
Aim 1: To characterize the expression profile of CaMKII isoforms in zebrafish
Mauthner cells at the time of hatching. Rationale: In zebrafish, seven CaMKII genes (α,
β1, β2, δ1, δ2, γ1, γ2) have been identified which are expressed in a spatio-temporally
regulated manner during the early development of 24 to 72 hpf (Rothschild et al., 2009;
Rothschild et al., 2007). Therefore, identifying the CaMKII isoforms expressed in
Mauthner cells is a prerequisite for determining the function of different isoforms in the
neurodevelopment of M-cells. Hypothesis: I hypothesize that M-cells at 48 hpf express
camk2a and camk2b, considering their prominent expression in mammalian central
nervous system (CNS) (Tobimatsu and Fujisawa, 1989).
Aim 2: To determine the role of CaMKII in the development of synaptic currents
associated with M-cells. Rationale: The role of α and β CaMKII in neuronal

31
development and plasticity has been studied previously (Lisman et al., 2002; Wayman et
al., 2008). However, the majority of the published literature is based on studies utilizing
ex vivo preparations. While much is known about the role of CaMKII in synaptic
plasticity, less is known about the role of CaMKII in synaptic development. Therefore,
investigating the function of CaMKII isoforms in embryonic zebrafish will advance our
understanding of its role in synaptic current development in vivo. Moreover, my research
may demonstrate how development of synaptic receptors affects the excitability
properties of M-cells. Hypothesis: Based on the existing literature, I hypothesize that
CaMKII plays a role in the development of both excitatory and inhibitory synaptic
currents in embryonic zebrafish.
The research in this thesis focuses on synaptic development. I present novel findings
on the function of CaMKII- in a developing organism and set the stage for future
studies that aim to delineate the specific role of CaMKII- in the development of
NMDAR-containing synapses.

32
Table 1.1 Excitatory and inhibitory ionotropic receptor subunits.
Receptor
class
IUPHAR
subunit
nomenclature
Zebrafish
orthologs
Longest splice
variant in
zebrafish
(amino acids)
ZFIN Accession
# (followed by
ZDB-GENE-)
AMPA GluA1
gria1a 914 020125-1
gria1b 917 020125-2
GluA2 gria2a 917 020125-3
gria2b 897 020125-4
GluA3 gria3a 886 020125-5
gria3b 883 030616-53
GluA4 gria4a 898 020125-7
gria4b 904 030131-8013
NMDA GluN1 grin1a 966 051202-1
grin1b 937 051202-2
GluN2A grin2aa 1460 070424-129
grin2ab 1445 070424-223
GluN2B grin2ba - 090821-2
grin2bb 1770 061207-27
GluN2C grin2ca 1400 070822-3
grin2cb 1328 100308-2
GluN2D grin2da 1916 041008-124
grin2db 1959 100920-7
GluN3A grin3a - 130530-780
GluN3B grin3ba 1156 070912-354
grin3bb 961 131122-77
Glycine 1 glra1 459 991117-1
2 glra2 448 090407-1
3 glra3 450 020402-1
4 glra4a 457 010410-3
glra4b 537 020402-2
glrba 498 010410-2
glrbb 494 040801-106
GABAA 1 gabra1 459 061013-194
3 gabra3 294 091204-365
5 gabra5 491 081104-30
6 gabra6a 435 040426-1692
gabra6b 444 080815-1
2 gabrb2 519 030131-8196
3 gabrb3 532 101102-2
2 gabrg2 469 091118-65
gabrg3 - 070718-5
gabrd 469 081105-170

33
Receptor
class
IUPHAR
subunit
nomenclature
Zebrafish
orthologs
Longest splice
variant in
zebrafish
(amino acids)
ZFIN Accession
# (followed by
ZDB-GENE-)
GABAA gabrp 464 081028-62
1 gabrr1 466 040724-212
2 gabrr2a 475 060825-164
gabrr2b 464 041014-174
3 gabrr3a 472 080722-20
gabrr3b 308 131120-131

34
Figure 1.1

35
Figure 1.1 Two days post fertilization (dpf) zebrafish embryo. (A) Face view
photograph. (B) Schematic representation of the zebrafish hindbrain showing the location
of the Mauthner cells (M-cells), and their homologs Mid2cm and mid3cm. Arrowhead
indicates ventral dendrite, arrow indicates lateral dendrite (not to sale).

36
Figure 1.2

37
Figure 1.2 Structure and topology of excitatory ionotropic glutamate receptors. (A)
Glutamate receptor subunits share common structural features, including extracellular
amino-terminal domain (ATD), ligand-binding domain (LBD), the transmembrane
domain (TMD), and an intracellular carboxyl-terminal (CTD). The ATD plays important
roles in subunit assembly and receptor trafficking. The LBD provides the binding pocket
for the receptor agonists. The TMD is composed of M1, M3, M4 transmembrane helices
and M2 reentrant helix. (B) Schematic drawing of a heteromeric AMPA receptor
containing GluA1 and GluA2 subunits. AMPARs with edited GluA2 exhibit low Ca2+
permeability and low single channel conductance. (C) Schematic drawing of
diheteromeric NMDA receptors containing two obligatory GluN1 subunits and two
GluN2 subunits.

38
Figure 1.3

39
Figure 1.3 Structure and topology of glycine and GABAA receptors. (A) Topology of
glycine and GABAA receptor subunits. Each subunit contains extracellular N- and C-
terminus and four transmembrane domains (M1-M4). (B) Schematic drawing of a
heteropentameric glycine receptor containing two 1 subunits and three subunits. (C)
Schematic drawing of a pentameric GABAA receptor containing and or subunits.

40
Figure 1.4
Figure 1.4 Structural organization of CaMKII subunit. Each subunit is comprised of a
catalytic domain, a regulatory domain, a variable linker region and an association
domain. The regulatory segment includes the autoinhibitory region (inhibitory) and
calmodulin-binding region (CaM). Three critical phosphorylation sites lies in the
regulatory domain: Thr 286 is located within the autoinhibitory segment, and Thr 305,
Thr 306 are located within the CaM binding region (dark grey). The complete
holoenzyme is composed of twelve subunits.

41
Chapter 2: Materials and Methods
2.1 Animals
Zebrafish wild-type AB line was obtained from the University of Oregon and raised
in the aquatics facility in the Department of Biological Sciences at the University of
Alberta according to established protocols (Westerfield, 2007). Embryos were raised at
28.5°C in Egg Water (60 μg/mL “Instant Ocean”, United Pet Group, Cincinnati, OH,
USA). Microinjected embryos were incubated in Embryo Medium (mM: 13.7 NaCl; 0.54
KCl; 0.025 Na2HPO4; 0.044 KH2PO4; 1.3 CaCl2; 1.0 MgSO4; 0.42 NaHCO3; pH=7.2)
containing Methylene Blue (Sigma-Aldrich, St. Louis, MO, USA; 0.003%) and PenStrep
(Sigma; 10 mL/L). On the day of the experiment, the embryos were taken out of the
incubator in the morning and kept at ambient room temperature (20-24°C) throughout the
experimental procedures.
2.1.1 Dissection
Zebrafish embryos at 2 dpf were staged according to established procedures (Kimmel
et al., 1995) and dissected for electrophysiology as described previously (Drapeau et al.,
1999; Roy and Ali, 2013). In brief, the embryos were anesthetized in 0.02% tricaine (MS-
222) (Sigma-Aldrich) and pinned through the notochord onto an electrophysiological
recording chamber (Figure 2.1). After removal of the forebrain and rostral structures, the
entire hindbrain was exposed to access the ventral surface (Figure 2.1B).
42
2.1.2 Identification of Mauthner cells
Mauthner cells were easily identified under Nomarski differential interface
contrast (DIC) optics based on their morphology and location in rhombomere 4 of
the hindbrain (Eaton and Farley, 1973). Occasionally, the cells were filled with 0.1%
Lucifer Yellow (Sigma-Aldrich) to further confirm their identity during
electrophysiological recording (Figure 2.1D).
2.2 RT-PCR
RNA was extracted from 40 whole 2 dpf embryos into 25 µl nuclease-free water
using the MasterPure RNA purification kit (Epicentre Biotechnologies, Madison, MI,
USA). In order to remove genomic DNA, the prepared RNA was treated with DNase I
(Life Technologies, Carlsbad, CA, USA). RNA concentration was measured with a
NanoDrop 1000 spectrophotometer (Thermo Fisher Scientific, Wilmington, DE, USA)
and quality was confirmed by gel electrophoresis. Reverse transcription was carried out
with a Maxima First strand cDNA synthesis kit (Thermo Fisher Scientific), according to
manufacturer’s instructions. To PCR amplify target cDNA sequences, primer pairs for
each gene (Table 2.1) were designed using the Primer-BLAST program (Ye et al., 2012).
The PCR reactions were carried out in a total volume of 50 µl containing 5 µl 5 µM
primers, 1 µl 10 mM dNTP mix, 2.5 µl first strand cDNA, 10 µl 5X buffer and 0.5 µl
Phusion high fidelity DNA polymerase (Thermo Fisher Scientific). The thermal profile
was 98ºC for 30s followed by 40 cycles of amplification (98ºC for 15s, 60ºC for 30s,
72ºC for 30s) and a final amplification at 72ºC for 10 minutes. Amplified products were
analyzed on a 2% agarose gel.

43
2.3 Single-cell RT-qPCR
2.3.1 Collection of Individual Mauthner cells
Patch-clamp pipettes with tip diameters of 0.2-0.4 m were pulled from thin-walled
borosilicate glass capillaries and backfilled with 4 l resuspension buffer (Invitrogen,
Carlsbad, CA, USA) containing RNase inhibitor and 0.1% Lucifer Yellow. The whole-
cell configuration onto an M-cell was achieved and the resuspension buffer was allowed
to permeate the cell for 1 minute before the cell was pulled out of the brain by visual
guidance of the pipette. The cell was collected by breaking the pipette tip at the bottom of
a 0.2 ml PCR tube after applying a small amount of positive pressure into the pipette. The
cell was discarded if it was broken or if surrounding cells were attached to the pipette tip.
The PCR tube was immediately transferred to a container filled with dry ice to prevent
breakdown of cellular components. For long-term storage, the tubes were transferred to -
80˚C freezer. As a contamination control, 2 l of the perfusate surrounding the M-cell
was collected in separate tubes and processed along with the single cell samples.
2.3.2 cDNA Synthesis from single cells
I used the Superscript III CellsDirect cDNA synthesis kit (Invitrogen) was used to
synthesize cDNA directly from single cells into a final volume of 16.5 µl according to the
manufacturer’s instructions except that we reduced the recommended reaction volumes
by half. Prior to the cDNA synthesis steps, samples were treated with 2.5 µl DNase I and
0.8 µl buffer at room temperature for 5 minutes to remove genomic DNA. The reaction
was stopped by adding 0.6 µl of 25 mM EDTA and incubating at 70ºC for 5 minutes.
cDNA synthesis was carried out using Oligo(dT)20 primers (1 µl 50 mM primer, 0.5 µl 10

44
mM dNTP mix, 3 µl 5X RT buffer, 0.5 µl RNaseOUT, 0.5 µl Superscript III RT and 0.5
µl 0.1 M DTT) for 50 minutes at 50ºC followed by 5 minutes at 85ºC. Samples were then
incubated with 0.5 µl RNase H (2U/µl) at 37ºC for 20 minutes to remove the starting
RNA and stored at -80ºC until preamplification.
2.3.3 Construction of real-time PCR standards
Gene-specific standard curves for seven CaMKII genes, and EF1-α were prepared to
quantify absolute cDNA copy number in single cell samples. Reverse transcription-PCR
products were purified with QIAquick gel extraction kit (Qiagen, Maryland, USA),
cloned into TOPO Vector (Life Technologies) and verified by sequencing. After
transformation, plasmids were purified using the QIAprep spin miniprep kit (Qiagen)
from overnight cultures, linearized and gel verified before making a serial dilution from 2
to 107 copies per 16.5 µl in 9 steps and stored in -80ºC freezer until needed.
2.3.4 Preamplification
A multiplex preamplification of the target genes was carried out on the single cell
cDNA and plasmid DNA standards. TaqMan assays for all the genes were pooled
together to give a final concentration of 1.75 µM for each primer. The preamplification
reactions were carried out by combining 1 µl of the assay mix with 16.5 µl of cDNA or
plasmid DNA sample, and 17.5 µl of 2X TaqMan PreAmp Mastermix (Applied
Biosystems, CA, USA) and running 1 cycle of 95ºC for 10 minutes followed by 14 cycles
of 95ºC for 15 s and 60ºC for 4 min. Preamplified products were diluted to 1:10 for
downstream application.

45
2.3.5 Quantitative real-time PCR
The quantitative real-time PCR assays were designed by using the Universal
ProbeLibrary Assay Design Center (Roche Diagnostics GmbH, Mannheim, Germany)
and carried out with the 7500 Fast system (Applied Biosystems). qPCR Primers (Table
2.2) were designed so that they were separated by an intron. Each reaction (10 µl)
contained 2.4 µl of cDNA, 2.5 µl of 1.6 µM forward and reverse primer mix, 0.1 µl of
probes (Roche Diagnostics) and 5 µl of 2X FastStart TaqMan Probe Master (Rox) (Roche
Diagonstics). The thermal profile included an initial cycle of 95ºC for 10 min followed by
45 cycles of 95ºC for 30 s, and 60ºC for 1 min. The standards were run in triplicate,
single cell samples in duplicate, and the threshold cycle (Ct) was determined
automatically by SDS software (Applied Biosystems). Ct values were averaged and 1
cycle was subtracted from the measured Ct values of the samples because the standards
were double-stranded molecules. Data were presented as the absolute number of cDNA
molecules per cell, which represent the lower limit estimate of the actual mRNA
molecules in the cell (Stahlberg et al., 2011). I determined the limit of detection (LOD) as
the Ct value for the lowest copy number standard in which all three replicates were
positive. All data points below the LOD were removed from analysis.
2.4. Morpholino oligonucleotide mediated knockdown of camk2a
2.4.1 Morpholino design
Two separate antisense morpholino oligonucleotides (MO), obtained from Gene
Tools LLC (Philomath, Oregon, USA) were used to knockdown camk2a expression. The
translation-blocking MO, 5’-GCCATCCTGGAAGCGTGTGCGCCTC-3’ was
46
previously used and validated for its specificity in zebrafish (Francescatto et al., 2010).
The splice-blocking MO, 5’-GCTGATCTGAGCACCTACCCCGAGT-3’, was designed
to target the splice junction between exon 2 and intron 2 of camk2a pre-mRNA. A
fluoresceinated MO, 5’-CCTCTTACCTCAgTTACAATTTATA-3’, targeted against
human beta-globin gene that does not bind to any known mRNA sequence in zebrafish
was used as a standard negative control. MOs were diluted in sterile water to make a
stock solution of 1 mM and stored at 4C.
2.4.2 Microinjection
MO stock solutions were diluted and injected according to established guidelines
(Bill et al., 2009). In brief, MO stocks were diluted in 1x Danieau solution (mM: 58
NaCl, 0.7 KCl, 0.4 MgSO4, 0.6 Ca(NO3)2, 5.0 HEPES, pH 7.6) containing 0.05% Phenol
Red. Each MO was injected in three different concentrations – 1, 2 and 4 ng/nL to
determine the highest dosage. Most MOs show specific knockdown at a dose of 5 ng or
less, while injection of 6 ng or more sometimes can cause off-target effects (Bill et al.,
2009). Therefore, I limited the highest dose to 4 ng in my experiments. None of the three
MOs showed toxicity or mortality at 4ng/nL. This concentration was therefore chosen for
subsequent experiments. MOs were delivered into one to four cell stage embryos using a
Picospritzer II (General Valve Corporation, Fairfield, NJ, USA) Microinjection System
calibrated to eject 1 nL solution consistently from microinjection needles.

47
2.4.3 Knockdown assessment
RT-PCR was performed to assess the level of knockdown by the splice blocking
morpholino using a forward primer TCTCTCAGGGCAAGAGTATGC, and a reverse
primer AAGATGAGGTAGTGGTGGCCT. Blot densities were measured using ImageJ
software (Rasband, 1997-2014). Embryos at 2 dpf were used for RNA extraction and
cDNA synthesis as previously described.
2.4.4 Western blot
Adult zebrafish brains or whole larvae (1.5, 2 and 3 dpf) were rapidly dissected in
ice-cold physiological saline, placed in either sucrose buffer (in mM: 320 sucrose, 0.01
EDTA, 10 Tris–HCl, pH 7.4) or Tissue-PE LB buffer (G Biosciences, St. Louis, MO,
USA) containing protease inhibitors (3mM PMSF, 40 M leupeptin, 4 M pepstatin A,
0.4 mg/ml aprotinin) and immediately placed on dry ice. We found no difference in the
protein content of tissue homogenized in either of these two buffers. Whole brains were
homogenized by hand with a Dounce tissue homogenizer and centrifuged at 13,000 X g
for 5 min. The supernatant was removed to quantify the protein content and the pellet was
discarded. Protein quantification was performed using the Lowry Protein Assay (Bio-
Rad, Hercules, CA), and 50 g of zebrafish homogenate was loaded per lane. Samples
were subjected to SDS-PAGE (10%) and transferred to nitrocellulose membranes using a
semi-dry transfer apparatus (Bio-Rad). Membranes were blocked in blocking buffer (5%
skim milk powder, 0.1% Tween-20 in TBS) for 1 h at room temperature and incubated in
rabbit polyclonal anti-CaMKII (pan) (Cell Signaling Technology, Danvers, MA, USA;
1:1000), or anti-Actin (Sigma-Aldrich, 1:2000) primary antibody overnight at 4C.
48
Membranes were washed 5 times in TBS-T and incubated in secondary antibody coupled
to horseradish peroxidase (HRP; 1:50,000 goat anti rabbit IgG, Santa Cruz
Biotechnology) for 1 h at room temperature on a shaker. An enhanced HRP substrate
(SuperSignal West Pico, Pierce, Rockford, IL) was added to the membrane and the
resulting chemiluminescent signal was captured on X-ray film. Negative controls were
performed whereby the primary antibody was pre-incubated with recombinant full length
human CaMKII- in a ratio of 1:5 overnight. This incubation mixture was then used as
the primary antibody.
2.5. Electrophysiology
2.5.1 Recording solutions
Following dissection, the preparation was moved to a recording set-up and the
chamber was continuously perfused with an aerated recording solution at room
temperature (20-24oC) that contained 15 M D-tubocurarine
(Sigmaaldrich), but lacked
tricaine. Unless otherwise stated, synaptic currents were recorded at a holding potential of
-60 mV, which approximate the normal resting membrane potential of M-cells of 2dpf
zebrafish (Table 4.1). The extracellular recording solution contained (in mM) 134 NaCl,
2.9 KCl, 2.1 CaCl2, 1.2 MgCl2, 10 HEPES, and 10 glucose, with osmolarity adjusted to
285 mOsm, pH 7.8. MgCl2 was excluded from extracellular recording solution for
NMDA miniature excitatory postsynaptic potential (mEPSC) recording. Tetrodotoxin
(TTX, 1 M) was included in all recordings to block action potentials. Patch-clamp
electrodes were pulled from borosilicate glass and had resistances
of 3-5 MΩ when filled
with a CsCl solution. The CsCl intracellular solution was composed of (in mM)

49
140 CsCl, 2 MgCl2, 10 HEPES, 10 EGTA, 4 Na2ATP, 0.4 LiGTP, osmolarity adjusted to
295 mOsm, pH 7.4.
2.5.2 Isolation of receptor-specific miniature postsynaptic currents
Different combinations of the following drugs were used to isolate receptor-specific
currents: kynurenic acid (1 mM), strychnine (5 M), picrotoxin (100 M), APV (50 M)
and NBQX (0.1 M) to block Glycine, GABA, NMDA and AMPA receptor mediated
currents respectively. Effective concentration of NBQX for blocking synaptic AMPAR
mEPSCs was determined empirically by varying its concentration in the recording
solution in the following order (in m): 2, 1, 0.5 and 0.1.
2.5.3 Neuronal depolarization by a 10 mM K+ depolarizing medium
Whole cell configuration was achieved using the previously described recording
solution in voltage clamp configuration. After recording baseline synaptic activity, the
configuration was switched to I=0 mode and depolarization of the Mauthner cell was
induced by applying a 5-minute bath of 10 mM K+ depolarizing medium that contained
(in mM): 125 NaCl, 10 KCl, 2.1 CaCl2, 0.3 MgCl2, 10 HEPES, and10 glucose, osmolarity
adjusted to 285 mOsm, pH 7.8. To reduce Ca2+
buffering capacity of the CsCl internal
solution, EGTA concentration was lowered to 0.2 mM in all experiments involving
depolarization of the M-cell. Depolarization of the M-cell and increased synaptic activity
was monitored throughout the 5-minute period. At the end of the depolarization, the cell
was allowed to return to the normal resting potential by switching to regular extracellular
recording solution. Synaptic activity was recorded again in voltage clamp mode.

50
2.5.4 Data Acquisition
Whole cell currents were recorded using an Axopatch 200B amplifier (Molecular
Devices, Sunnyvale, CA, USA) and were low-pass filtered at 5-10 kHz (-3 dB) and
digitized at 50 kHz. After establishing whole-cell recording mode, series resistance was
compensated by 60-85 % using the amplifier’s compensation circuitry. Data was
discarded if series resistance changed by more than 20 % or when membrane potentials
were more positive than -45 mV. The liquid junction potential after going whole cell was
not corrected.
2.5.5 Analysis of spontaneous miniature postsynaptic currents
Synaptic activity was monitored using pClamp 8.1 software (Molecular Devices).
Synaptic events were detected using the template function for events >3 standard
deviations above the basal noise and analyzed with Axograph X (AxoGraph Scientific,
Sydney, Australia). The software detected all events that could be recognized visually.
All events were then inspected visually, and those with uneven baselines or overlaying
events were discarded. Identified events from a single recording trace were averaged and
analysis was carried out on the averaged events unless otherwise stated. The rise times
were defined as the time from 20 to 80% of the miniature current amplitude. The
presence of one or two exponential components during the decay phase of the miniature
currents was tested by visually comparing the single and double exponential fits over the
entire range of the decay. For events with double exponential fits, single exponential fits
over the fast and slower decay regions were compared. Lastly, the sum of the squared

51
errors of the single and the double fits were compared using Student t-tests to determine
the best exponential fit of the decay phase.
2.6 Immunohistochemistry
Zebrafish 2 dpf embryos were fixed in 2% paraformaldehyde for 1–2 h. Tissues were
washed several times in PBS and permeabilized for 30 min in 4% Triton-X 100
containing 2% bovine serum albumin (BSA) and 10% goat serum. Following
permeabilization, tissues were incubated in the primary antibodie anti-3A10
(Developmental Studies Hybridoma Bank, University of Iowa, Iowa, USA, 1:250) for
48 h at 4°C on a shaker. Tissues were then washed several times in PBS over a 24 h
period, and then incubated in the secondary antibodies conjugated with Alexa 488
(Molecular Probes, Carlsbad, CA, 1:1000) for 4–6 h at room temperature. Animals were
washed in PBS several times, de-yolked, cleared in 70% glycerol and mounted. Z-stack
images were photographed using a Zeiss LSM 510 confocal microscope equipped with a
63X oil immersion objective, and compiled using Zeiss LSM Image Browser software.
The z-stack fluorescent images were deconvolved using Huygens Essential (Scientific
Volume Imaging, Hilversum, The Netherlands) software, and 3D rendering of the cell
body and dendritic arborizations were carried out using Imaris software package
(Bitplane Scientific Software, South Windsor, CT, USA).
2.7 Behavioral assay
Video observation of 2 dpf zebrafish embryos was performed using an AOS video
camera (AOS S-PRI 1995; 1250 FPS; shutter speed: 800 s; 2700 frames per sequence)

52
mounted on a dissecting microscope. Embryos were immobilized for behavioural
observation in 2% low-melting point (26-30°C) agarose (LMPA) dissolved in embryo
medium (2-Hydroxyethylagarose, type VII low gelling temperature, Sigmaldrich).
The LMPA was made up in 50 mL aliquots and left to dissolve in a 66°C water bath for
approximately one hour. After the LMPA was fully dissolved, 10-12 embryos were
transferred to a 35 mm petri dish in a small amount of embryo medium and the LMPA
was cooled to 32°C in an ice bath. The embryo media was replaced with approximately 2
mL of LMPA and was then left to solidify. To observe embryo movements, the LMPA
was cut away from the embryo’s tails while leaving the heads embedded in the gel.
Embryo media was added to the petri dish to ensure that the larvae remained immersed in
solution. Embryo stimulation was performed using a pulse of basic 2% phenol red
(Sigma-Aldrich) dissolved in egg water ejected from a Picospritzer II (General Valve
Corporation); the pulse lasted approximately 15-20 milliseconds (ms) with a pressure of
approximately 35-55 pounds per square inch (psi) of pressure. The pipette was positioned
close to the otolith without contacting the embryo. Borosilicate glass micropipettes
(Sutter Instrument; O.D.: 1.2 mm, I.D.:094 mm, 10 cm length) were pulled using a
Flaming/Brown Sutter Instrument pipette puller (model P-97; heat: 459, Vel: 70, Time:
200). The video-recordings were transferred and analyzed using a Motion Analysis
Software, ProAnalyst® (Xcitex Inc, Cambridge, MA, USA).
2.8 Statistical analysis
All data values are given as means ± SEM. Correlations were calculated with the use
of a least-squares linear regression analysis. Significance was determined using paired

53
and unpaired t-test. One-way analysis of variance with the Student Newman-Keuls
Method of post-hoc testing was used for multiple comparisons of normally
distributed, equal variance data. Kruskal–Wallis ANOVA and Dunn's method of
comparison were used for non-normal distributions.

54
Table 2.1 List of primer pairs designed for RT-PCR of cDND from 2 dpf zebrafish
embryos.
Gene GenBank Accession
No.
Primer Sequence (5'→3') Length
(bp)
camk2a NM_001017741.2 CCAGTCCGAAGAGACACGAATC 181
CCAATGGAGTTCAAGGAAACGA
camk2b1 NM_001271393 TACCTGTCCCCCGAGGTGCTG 522
TGCCTCCAGTGCAGGAGAGGG
camk2b2 XM_001338641.2 TGTGCGAAACTCAGCACGGGT 863
CTGCCCACGGAGAAGTTGCG
camk2d1 NM_001114708.2 CTCCACTGCCACCAGATGG 272
CAGAAAGGAGGGTAACCCACAA
camk2d2 NM_001002542.1 CGGCTGTTAAGCTTGCTGACT 173
CAGCAGAATGTAGAGGATCACACC
camk2g1 NM_001030125.1 AGCAGCAGAGGCATCGACCCC 581
AACCAGGTGTCCCAGCAAAACCAAA
camk2g2 XM_001332303.2 CCGGAGACACCACAGAGGCGA 868
GGAGCGTTGGCAGACCCATGG
ef1a NM_131263.1 CCCTGCCAATGTAACCACTGA 263
CGATGTGAGCAGTGTGGCA

55
Table 2.2: List of qRT-PCR primers.
Gene UPL Probe
No.
Primer Sequence (5'→3') Amplicon
Length (bp)
camk2a 78 TGGCAGATAGTCCATTTCCAC 78
CCTGCGACTGTTTTCAACTG
camk2b1 78 CTTTCTGGGACGAGGATCAG 78
CCCATTCTGGAGATGGAAAA
camk2b2 78 AACACCAAGAAGCTCTCAGCTC 72
TTTTAGCAGACGGCAGATCC
camk2d1 94 GTACAGGGAGACCAGCAAGC 96
TACGGGTTTGCCATAAGGTT
camk2d2 94 TTGGTTTGGCCATTGAGGTC 110
CGGTTTGCCATAAGGATCTTTC
camk2g1 133 CGACCAGGTTTACGGACGAG 98
TTCCTGGCCAGTGGATTTTT
camk2g2 78 TGAGGACCAGCACAAACTGT 67
CCACTCTGGAGAGGGAAAATC
ef1a 94 ACATCCGTCGTGGTAATGTG 94
GGGTGGTTCAGGATGATGAC

56
Figure 2.1

57
Figure 2.1 Setup for electrophysiological recording from zebrafish M-cells. (A)
Dissecting and recording dish obtained from WPI. A thin washer is carefully sealed onto
the glass slide at the bottom of the dish and Sylgard is applied to the well. (B) 48 hpf
hindbrain-spinal cord preparation. The ventral surface of the hindbrain is facing up and
the M-cell is located just beneath the surface of the tissue at the level of the arrowhead.
(C) Diagram outlining whole-cell patch clamp recording setup. (D) Fluorescent image of
a Mauthner cell of a 2 dpf embryo. The image was taken after recording spontaneous
excitatory synaptic activity from the M-cell. The cell was filled with lucifer yellow
during the experiment.

58
Chapter 3: Expression of the camk2a gene and its regulation of dendritic branching
in embryonic zebrafish Mauthner cells 1
3.1 Introduction
The temporal and spatial distribution patterns of camk2 genes have been reported in
many organisms including rat, mouse, zebrafish and drosophila (Bayer et al., 1999;
Rachidi et al., 1999; Rothschild et al., 2007; Takaishi et al., 1992; Tobimatsu and
Fujisawa, 1989). In zebrafish seven genes, namely α, β1, β2, γ1, γ2, δ1, and δ2, encode
CaMKII. Using in situ hybridization of whole mount zebrafish Rothschild et al (2007)
demonstrated expression of these genes at varying degrees in embryonic zebrafish brain.
For example, during 24 to 72 hpf development expression of α gene (camk2a1) appears
to be low in zebrafish brain while β1 (camk2b1) mRNA is present in the forebrain at 48
hpf and in mid- and forebrain by72hpf. Expression of γ1, γ2 and δ2 transcripts was also
detected in varying degree in different brain areas during this developmental stage.
CaMKII activity increases progressively throughout development. While the activity was
stable between 4 and 12 hpf, it increased 100-fold by 3 dpf, and gradually levelled off
around 6 dpf. These studies provided valuable information about which CaMKII
transcripts are expressed in the hindbrain at 2 dpf, the developmental stage that is the
focus of my study. But individual cells, even in a seemingly homogenous tissue, show
cell-to-cell variation in mRNA and protein expression (Blake et al., 2003; Cai et al.,
1 A version of this chapter has been published: Roy, B., Ferdous, J., and Ali, D.W. (2015). NMDA receptors on zebrafish Mauthner cells require CaMKII-α for normal development. Developmental Neurobiology 75(2):145-62.

59
2006; Elowitz et al., 2002). Therefore, I set out to determine the isoforms of camk2 that
are expressed specifically in M-cells of embryonic zebrafish at the time of hatching.
Normal expression of CaMKII is required for proper neuronal development. Neurons
are dynamic cells whose dendrites change structures throughout the lifespan. Dendritic
architecture specification is driven primarily by cell intrinsic genetic control mechanisms
during early development, while input-specific activity-dependent mechanisms take over
during later development and maturation stages (Metzger, 2010). Dendritic growth is
rapid during early development, with frequent addition and removal of dendritic
branches. As development progresses, dendritic growth slows and the branches become
stable and mature. CaMKII plays important roles in dendritic stabilization and
maturation. For example, Wu and Cline (1998) demonstrated that in Xenopus retinotectal
neurons, dendritic arborization slowed down with the onset of CaMKII expression.
Overexpression of constitutively active CaMKII reduced dendritic growth in young
neurons, and stabilized dendritic structures in more mature neurons, while inhibition of
CaMKII activity led to increased dendritic growth, neurite complexity and branch
dynamics (Wu and Cline, 1998; Zou and Cline, 1999). Similarly, CaMKII regulates
dendritic branching and maturation in rodent dorsal horn interneurons (Pattinson et al.,
2006). For example, mice expressing a mutant version of CaMKII had significantly
greater dendritic branching, while synaptic maturation of these neurons required
autophosphorylation of CaMKII-. The role of CaMKII- in stabilizing dendritic
processes is also conserved in adult brain, where conditional deletion of CaMKII- from
neural progenitor cells led to adult born granule cells with increased dendritic complexity

60
and a reduction in the number of mature synapses (Arruda-Carvalho et al., 2014). In line
with altered morphological development, the newly generated granule cells also showed
impaired hippocampus-dependent learning. A mouse strain that harbors a heterozygous
null mutation for CaMKII- shows profound abnormalities in brain structures and
behaviour (Yamasaki et al., 2008). For example, these mice had impaired neuronal
development in the dentate gyrus, where the number of immature neurons increased
significantly. These mice also exhibited behavioral deficits such as severe working
memory deficit and exaggerated infradian rhythm. Together, these data suggest that
CaMKII- is necessary for the stabilization and maturation of dendritic branches and
development of normal behaviour. Therefore, following the determination of camk2
expression in 2 dpf M-cell, I knocked down the expression of the predominant transcript
to investigate its roles in the development of M-cell dendrites and the touch response of
zebrafish embryos.

61
3.2 Results
3.2.1 Expression of camk2 genes in zebrafish 2 dpf embryos
I began by identifying the camk2 genes that are expressed in 2 dpf whole embryos by
reverse-transcription PCR. RNA from whole zebrafish embryos was reverse transcribed
and the cDNA was PCR amplified with gene-specific primer pairs (Table 2.1). Zebrafish
elongation factor 1 alpha (ef1a) was used as a positive control for successful RNA
extraction and cDNA synthesis. I found that 2 dpf zebrafish embryos express all seven
camk2 genes (Figure 3.1). PCR products were detected as single bands at the expected
molecular weights ranging from 100 to 900 base-pairs (bp) except for the camk2b1 PCR
product, which was detected as multiple bands, possibly due to non-specific
amplification. I sequenced the amplified PCR products of the expected molecular weights
and found that the primers were amplifying the intended sequences of all seven isoforms.
3.2.2 Mauthner cell-specific expression of camk2 genes
Next, I used quantitative real-time PCR to determine the expression of these seven
genes in M-cells at the time of hatching. To make the calibration curves for real-time
PCR, I prepared specific DNA standards for each gene by cloning the reverse
transcription PCR products and serially diluting them to 2, 10, 102, 10
3, 10
4, 10
5 and 10
6
copies. To maintain the integrity of the standards over the entire period of the study, I
used the cloned reverse transcription PCR products to construct the standards instead of
directly using the purified PCR products (Dhanasekaran et al., 2010). The plasmid was
linearized before making the serial dilution to prevent copy number overestimation (Hou
et al., 2010). The resulting standard curves had high coefficient of determination (R2
≥
62
0.993) and obtained PCR efficiencies ranging from 91% to 105% (Table 3.1). I then
plotted the input copy number of the standards against output copy numbers and
calculated 95% confidence intervals, illustrating a high level of detection sensitivity over
the entire range (Figure 3.2).
I used qPCR to analyze 19 single M-cells for camk2 expression. Ubiquitously
expressed ef1a was used as an indicator for successful single cell processing. ef1a was
not detected in 3 of the 19 cells and expression of camk2 was only detected in cells where
ef1a was also detected (Figure 3.3). The control sample, which consisted of extracellular
solution taken from a region surrounding the M-cells (ECS in Fig 3.3), showed no
detectable amplification. I found that none of the cells expressed CaMKII-β1, β2, γ1 or
γ2 genes at detectable levels. Only one of the 16 cells expressed camk2d1 at a calculated
copy number of 12 copies. The gene for camk2a showed the highest level of expression,
which was detectable in 14 cells (87.5% of the cells). The calculated copy numbers of
camk2a and ef1a are shown in box plots in Figure 3.4A. The expression followed a log-
normal distribution as is commonly seen in biological samples (Figure 3.4B) (Bengtsson
et al., 2005). The copy number of camk2a in a single M-cell varied widely, from a low
value of 3 to a high of 155, with a geometric mean of 8 copies per cell. Thus, my results
suggest that the primary CaMKII isoform present in M-cells at the time of hatching is
CaMKII-α.

63
3.2.3 Morpholino knockdown of CaMKII-α
To investigate a possible role of CaMKII-α during development, I knocked down its
expression in zebrafish embryos using two different morpholinos. The first morpholino
was a translation-blocking CaMKII-α morpholino that had been previously validated by
CaMKII peptide assay (Francescatto et al., 2010), while the second was a splice-blocking
morpholino designed to remove exon 2 from the transcript, which encodes part of the
CaMKII-α catalytic domain. I reasoned that if the enzyme was involved in excitatory
neurodevelopment, then its reduction might lead to alterations in cell morphology,
synaptic activity and behavior (Wu and Cline, 1998; Yamasaki et al., 2008). Injection of
4 ng/nl of either morpholino resulted in embryos that were smaller than controls and
which sometimes exhibited curved tails (Figure 3.5). I performed RT-PCR on whole
embryos to confirm that the splice-blocking morpholino reduced the levels of CaMKII-α
mRNA (Figure 3.6) and found that there was a 57% reduction in the levels of CaMKII-α
mRNA in morphants compared with uninjected embryos and a 47% reduction compared
with control injected embryos (Figure 3.6; n=5; p<0.001, one-way ANOVA, multiple
comparison with Student-Newman-Keuls Method), confirming the knockdown of
CaMKII-α.
To determine the extent of knockdown at the protein level, I attempted to perform
SDS PAGE and immunoblotting with a pan-CaMKII antibody (Figure 3.7). Mouse brain
lysate (15 mg/lane) was used as a positive control. A polyclonal antibody raised against
N-terminal region of human CaMKII detected a 50 kDa band, the expected size for
CaMKII- in both mouse tissue and in the adult zebrafish CNS tissue (Figure 3.7a, left
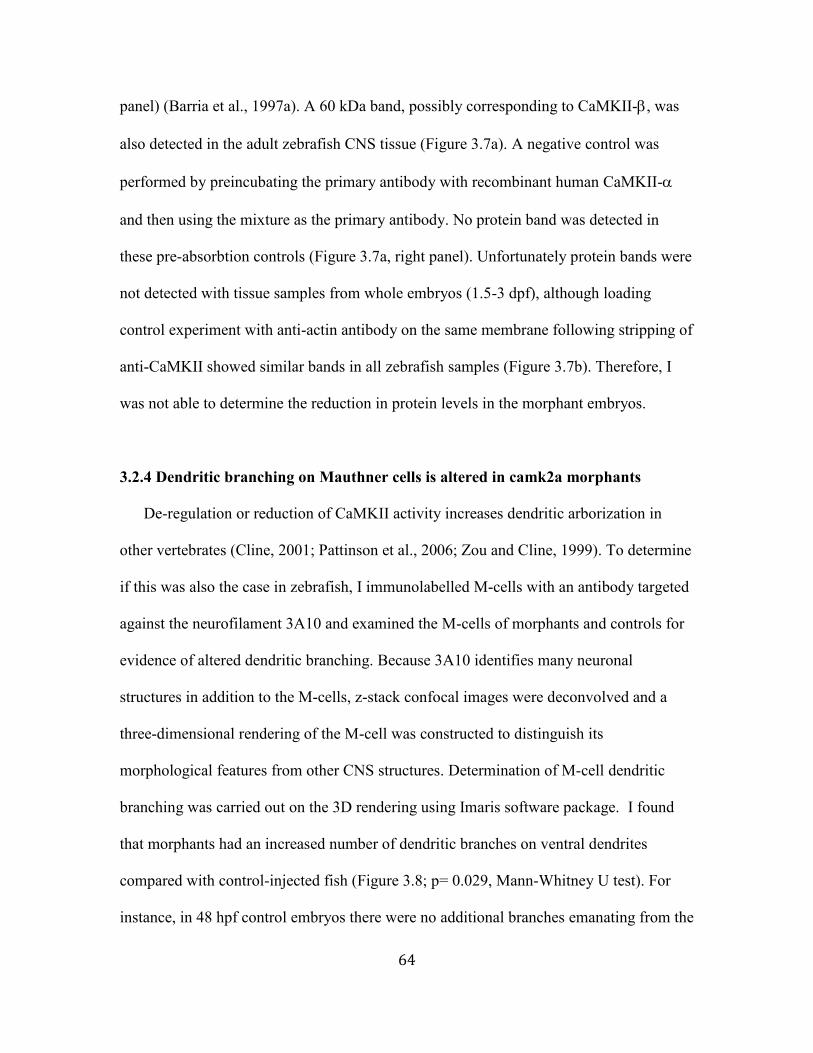
64
panel) (Barria et al., 1997a). A 60 kDa band, possibly corresponding to CaMKII-, was
also detected in the adult zebrafish CNS tissue (Figure 3.7a). A negative control was
performed by preincubating the primary antibody with recombinant human CaMKII-
and then using the mixture as the primary antibody. No protein band was detected in
these pre-absorbtion controls (Figure 3.7a, right panel). Unfortunately protein bands were
not detected with tissue samples from whole embryos (1.5-3 dpf), although loading
control experiment with anti-actin antibody on the same membrane following stripping of
anti-CaMKII showed similar bands in all zebrafish samples (Figure 3.7b). Therefore, I
was not able to determine the reduction in protein levels in the morphant embryos.
3.2.4 Dendritic branching on Mauthner cells is altered in camk2a morphants
De-regulation or reduction of CaMKII activity increases dendritic arborization in
other vertebrates (Cline, 2001; Pattinson et al., 2006; Zou and Cline, 1999). To determine
if this was also the case in zebrafish, I immunolabelled M-cells with an antibody targeted
against the neurofilament 3A10 and examined the M-cells of morphants and controls for
evidence of altered dendritic branching. Because 3A10 identifies many neuronal
structures in addition to the M-cells, z-stack confocal images were deconvolved and a
three-dimensional rendering of the M-cell was constructed to distinguish its
morphological features from other CNS structures. Determination of M-cell dendritic
branching was carried out on the 3D rendering using Imaris software package. I found
that morphants had an increased number of dendritic branches on ventral dendrites
compared with control-injected fish (Figure 3.8; p= 0.029, Mann-Whitney U test). For
instance, in 48 hpf control embryos there were no additional branches emanating from the

65
ventral dendrites or cell bodies, but in the splice-blocked morphants we found several
additional branches projecting from both the ventral dendrites and the cell soma.
Evidence of dendrites branching from the M-cell soma is unusual and was only present in
the morphants.
3.2.5 CaMK2 is required for normal development of zebrafish escape response
Since the M-cells are involved in escape responses, and it appeared that the reduction
in CaMKII- altered M-cell morphology, I performed a behavioral analysis of the c-start
escape response following a touch stimulus to assess the effect of CaMKII
knockdown. I embedded fish in agar but then cut away the agar surrounding the trunk and
tail of the embryo, as well as a small section of agar on one side of the head in order to
stimulate the fish. I then pico-spritzed a jet of fluid onto the head near the otolith, which
produced an escape response of the embryo. The responses were recorded and analyzed
from the initiation of the response. I compared various parameters of the first major bend
of the trunk, which represents the c-bend, as well as the second bend that represents the
onset of swimming following the c-start (Figure 3.9). I found no difference in the
maximum angle of the c-start (Figure 3.10A) but the translation-blocked morphants took
a longer time to reach the maximum bend angle compared with controls (Figure 3.10B;
p<0.05, Kruskal-Wallis ANOVA, multiple comparison test with Dunn’s method).
Furthermore, the second bend of the trunk took a significantly longer time to occur in
both morphants compared with the controls (Figure 3.10C; p<0.001 for translation
blocked morphants, and p<0.05 for splice blocked morphants, Kruskal-Wallis ANOVA,
multiple comparison test with Dunn’s method). In the control injected fish the time of the
second bend was 30.1 ± 1.5 ms (n=18), while it was 74.1 ± 11.5 ms (n=14) in the
66
translation blocked morphants and 42.9 ± 2.3 (n=13) in the splice-blocked morphants. In
addition, I found that of the splice-blocked morphants, 13 of 26 fish displayed abnormal
responses by bending once during the c-start, and then stopping their movement, or by
not responding to the stimulus at all. Additionally, 5 of 19 fish in the translation-blocked
group, and 2 of the 14 fish in the splice-blocked group responded abnormally by turning
towards the stimulus, while 1 of 19 control injected fish and 1 of 15 uninjected fish
responded abnormally (Figure 3.10D; p= 0.221, Chi-square test). These data indicate that
knockdown of CaMKII-α resulted in abnormal escape response.

67
Table 3.1 Characteristics of the real-time PCR standard curves.
Gene Slope Y Intercept R2 PCR Efficiency
(%)
camk2a -3.24318 29.89442 0.995368 103.3947
camk2b1 -3.56875 34.58887 0.994586 90.6383
camk2b2 -3.25046 29.53241 0.995697 103.0716
camk2d1 -3.2969 30.17769 0.993664 101.0552
camk2d2 -3.21457 28.42632 0.998021 104.6839
camk2g1 -3.3246 29.742 0.9985 99.8886
camk2g2 -3.24705 29.29339 0.995874 103.2228
ef1a -3.32544 30.22648 0.993261 99.8538
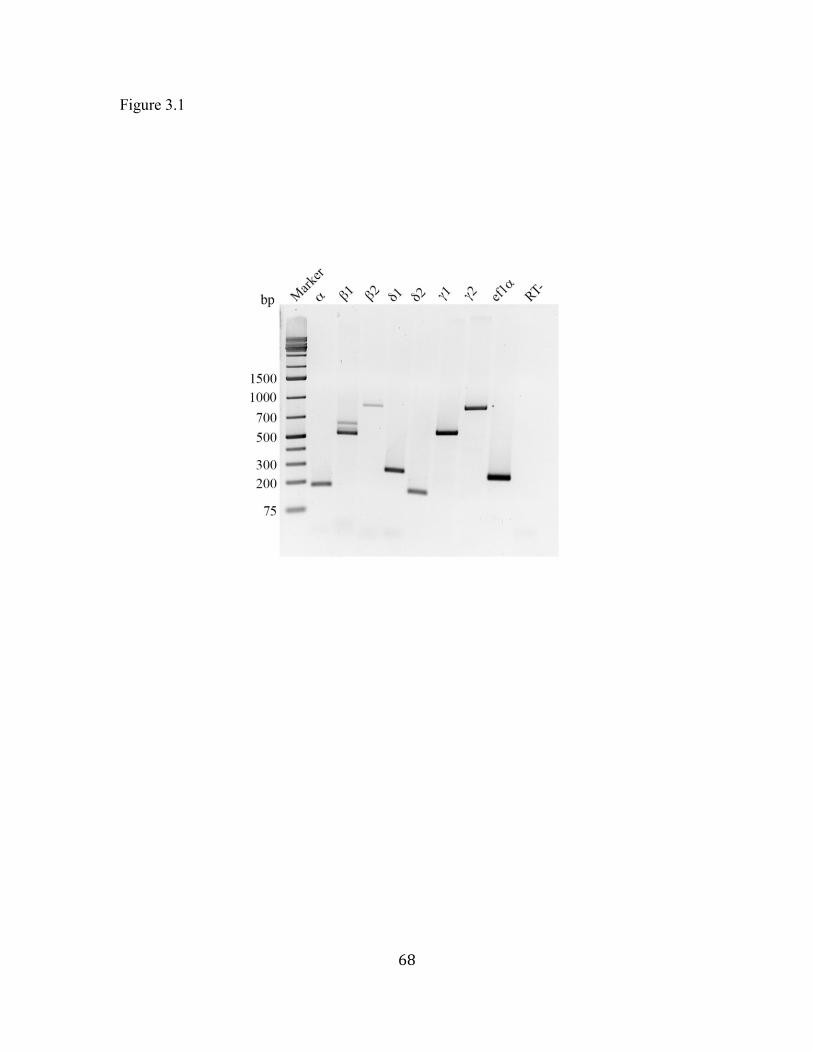
68
Figure 3.1

69
Figure 3.1 Two dpf zebrafish embryos express all seven CaMKII genes. RNA from 40
embryos were extracted, reverse transcribed and PCR amplified with eight gene-specific
primer pairs. Zebrafish elongation factor 1 alpha (EF1-α) was used as a positive control.
RT-: no reverse transcriptase in the reaction.

70
Figure 3.2

71
Figure 3.2 Measurement of output copy numbers for an input of pre-amplified DNA
standards of known copy numbers ranging from 2 to 106. Linear regression lines and 95%
confidence intervals are shown. Each data point was measured in triplicate.

72
Figure 3.3

73
Figure 3.3 Zebrafish M-cells express primarily camk2a transcripts. Expression of
housekeeping gene ef1a indicates successful cell processing. An arbitrary Ct value of 0
was assigned when any particular gene was undetectable. Note that only one cell (ID: 9)
expressed CaMKII-δ1 at detectable level. The control sample consisted of extracellular
fluid (ECS) taken from a region surrounding the M-cell.
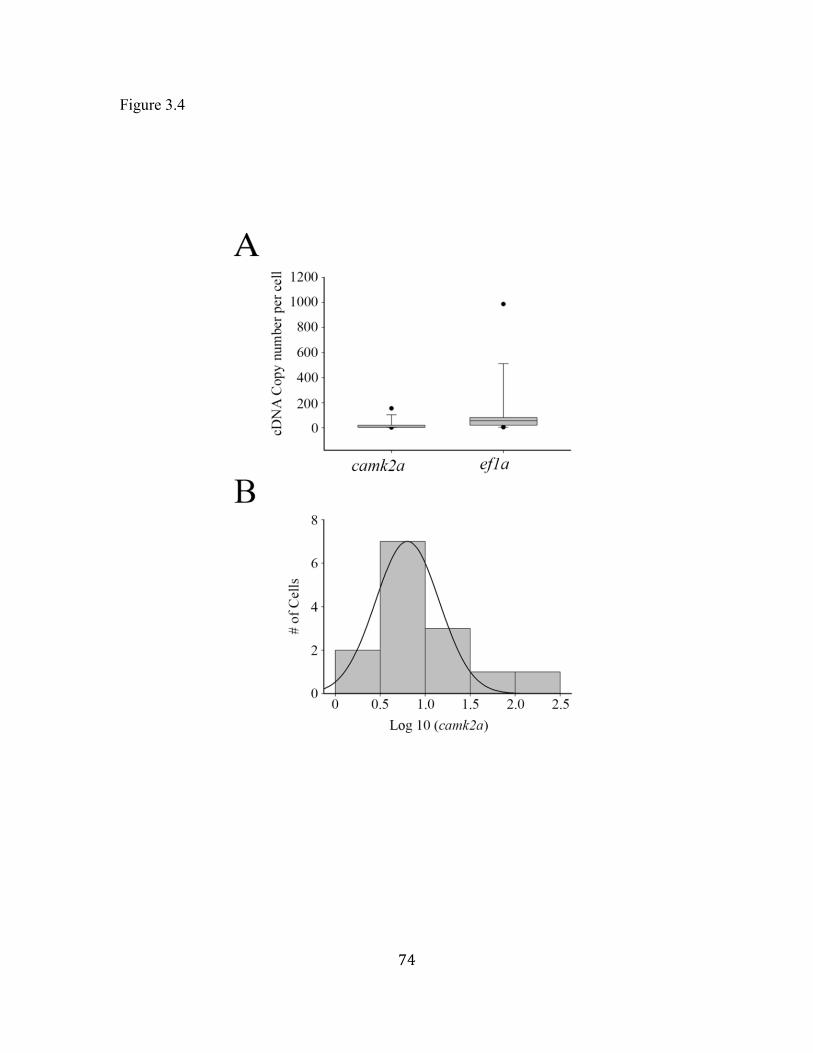
74
Figure 3.4

75
Figure 3.4 Quantification of camk2a cDNA copy number. (A) Box plot of quantified
copies of camk2a and ef1a cDNA in single M-cells. The median and 10, 25, 75 and 90
percentiles are plotted. (B) Log-normal distribution of camk2a cDNA.

76
Figure 3.5

77
Figure 3.5 Images of 2 dpf zebrafish. (A) uninjected controls, (B) embryos injected with
4 ng of control morpholino, (C) embryos injected with 4 ng of a translation-blocking
CaMKII- morpholino, and (D) embryos injected with 4 ng of a splice-blocking
morpholino.

78
Figure 3.6

79
Figure 3.6 Knockdown of CaMKII- mRNA by splice-blocking morpholinio. (A) RT-
PCR blots of CaMKII- knockdown assessment. EF1- was used as a loading control.
(B) Quantification of blot densities (n=5 experiments).

80
Figure 3.7

81
Figure 3.7 Immunoblot of zebrafish CaMKII- protein (n = 3). Lanes were loaded with
either mouse brain lysate or zebrafish homogenate. Proteins were transferred to
nitrocellulose membranes and incubated in either anti-CaMKII (pan), or anti-CaMKII
(pan) preabsorbed with recombinant human CaMKII- at a ratio of 1:5, or anti-Actin.
Protein standards ranging from 40 kDa to 700 kDa are indictaed to the left of each
immunoblot. (A) Lanes were loaded with either 15 mg mouse brain lysate or 5-50 mg
adult zebrafish brain homogenate as indicated. Right panel shows negative control with
preabsorbed anti-CaMKII (pan). (B) Lanes were loaded with either 15 mg mouse brain
lysate or 50 mg embryonic zebrafish homogenate, and probed with anti-CaMKII (pan)
(upper panel) or with anti-Actin (lower panel) after stripping the same membrane.

82
Figure 3.8

83
Figure 3.8 Immunohistochemical images of the M-cell labeled with anti-3A10, from
control injected and splice-blocking morphants. (A) The M-cell of MO control-injected
fish. Arrow points to the ventral dendrite. (B) The M-cell of a splice-blocked embryo.
Arrow points to the ventral dendrite. Arrowheads point to dendritic arborizations present
on the cell body and ventral dendrite. Quantification of the number of branch points per
100 m, emanating from the lateral dendrites (C) and the ventral dendrites (D). *
Significantly different from MO controls, p<0.05.

84
Figure 3.9

85
Figure 3.9 Locomotor behaviour of zebrafish in response to tactile stimuli. Agar-
restrained embryos were given a pulse of water jet around the otolith and response was
recorded using a high-speed video camera. The times shown on the figures indicate the
time from the start of the response at t=0 ms.

86
Figure 3.10

87
Figure 3.10 Touch responses of 2 dpf, agar-restrained embryos. (A) Angle of the c-bend
ascertained by measuring the degree of rotation of the tail from the unstimulated, start
position (t=0 ms) to the maximum bend angle. (B) Time for the c-bend to occur from the
moment the fish starts to respond, to the maximum point of curvature of the tail. (C)
Time taken for the tail to move from the end of the c-start to the second bend of the tail.
(D) Direction of the movement of the tail relative to the stimulation. * Significantly
different from MO controls, p<0.05, *** significantly different from MO controls,
p<0.005.

88
Chapter 4: Regulation of AMPA and NMDA receptor development by CaMK2-
4.1 Introduction
Glutamatergic synapses mediate the majority of the excitatory synaptic transmission
in the vertebrate CNS. AMPA and NMDA are the two principle types of ionotropic
receptors in the glutamatergic synapses. During long-term potentiation, activation of
NMDA receptors increases intracellular Ca2+
which activates CaMKII. Upon activation,
CaMKII translocates from cytoplasm to the postsynaptic membrane, where it binds to
NMDARs (Leonard et al., 1999; Shen and Meyer, 1999; Strack and Colbran, 1998). The
GluN2B subunit of NMDARs contains several binding sites for CaMKII (Bayer et al.,
2001). The amino acid S1303 in GluN2B binds to CaMKII that is not phosphorylated at
T286 site. A second binding site on GluN2B between amino acids 839 and 1120 requires
activated CaMKII that is phosphorylated at the T286 site. Binding of CaMKII to
NMDAR locks the enzyme in an active state, which can persist for tens of minutes.
The active CaMKII in the postsynaptic membrane potentiates AMPAR mediated
transmission. This is achieved by increasing the AMPAR conductance and also by
increasing the number of receptors at the synapse. A number of studies have found that
CaMKII phosphorylate the GluA1 subunit of AMPARs, thereby increasing the channel
conductance during LTP (Barria et al., 1997b; Benke and Isaac, 1998; Lee, 2006).
Synaptic increase of AMPA receptor number involves multiple steps, including insertion
2 A version of this chapter has been published: Roy, B., Ferdous, J., and Ali, D.W. (2015). NMDA receptors on zebrafish Mauthner cells require CaMKII-α for normal development. Developmental Neurobiology 75(2):145-62.

89
of AMPARs from an intracellular pool to the extrasynaptic membrane, lateral diffusion
of the receptors to synapse and subsequent stabilization of the receptors within PSD
(Opazo and Choquet, 2011). CaMKII has been implicated in these steps. For example,
CaMKII can phosphorylate extrasynaptic mobile AMPARs on their auxiliary protein
stargazing which then traps the receptors at the PSD (Opazo et al., 2010). Although, the
role of CaMKII has been studied in detail for activity-dependent plasticity mechanisms,
its role in the synaptic development of glutamate receptors has not received comparable
attention. Therefore, my goal in this study was to explore the roles of CaMKII- in the
development of ionotropic glutamate receptor mediated synaptic currents in embryonic
zebrafish.

90
4.2 Results.
4.2.1 CaMKII-α does not affect AMPA receptor development
CaMKII affects AMPAR currents in mammalian systems. In particular, activation of
CaMKII leads to an upregulation of AMPA currents through phosphorylation of the
GluA1 subunit (Barria et al., 1997b; Kristensen et al., 2011). To determine if acute
activation of CaMKII could affect AMPA mEPSCs in zebrafish, I incubated the
preparation in an elevated K+ solution to depolarize the cells and to increase synaptic
activity as shown previously (Patten and Ali, 2009). This treatment should increase
intracellular Ca2+
and CaMKII activity. AMPA mEPSCs were recorded in regular
recording solution that included TTX (1 M) to block action potentials, strychnine (5
M) to block glycine, picrotoxin (100 M) to block GABA, and APV (50 M) to block
NMDA receptors in the extracellular bath. All remaining events were blocked by NBQX
(0.1 M), confirming their identity (Figures 4.5). For elevated K+ experiments, I recorded
baseline AMPA mEPSCs in regular recording solution in voltage clamp mode and then
switched to I=0 mode to allow the cells to depolarize for 5 minutes in 10 mM KCl
containing solution that lacked the drugs. I used a low calcium buffering CsCl internal
solution to allow calcium levels to rise throughout the elevated K+ wash and continuously
monitored the membrane potential. When 10 mM KCl was washed on to the preparation,
the membrane potential typically depolarized to about -30 mV from an average resting
membrane potential of about -65 mV. I also noted a significant increase in synaptic
activity during the elevated K+ wash. At the end of the depolarization period, the elevated
K+ solution was washed off with the regular recording solution that contained the above-
mentioned drugs. I waited for 5 minutes to allow the drugs to fully block voltage gated

91
Na+ channels and other receptors and then recorded AMPA mEPSCs again in voltage-
clamp mode as shown in Figure 4.1A. Individual events in each recording traces were
averaged and analysis done on the averaged mEPSCs. Analysis of mEPSCs indicated a
significant increase in the amplitude of the events, from a control amplitude of 25.2 ± 1.4
pA to a mean of 30.3 ± 1.7 pA after elevated K+ application (Figure 4.1B; n= 6
experiments; p=0.038, t-test). The increase in mEPSC amplitude was prevented by
inclusion of 10 M of the CaMKII blocker, KN 62, in the intracellular solution (Figure
4.1B; n=4 experiments; p=0.80, t-test). To confirm these results, I tested the ability of a
second, more specific CaMKII blocker, AIP in the intracellular solution to prevent the
elevated K+ induced increase in AMPA mEPSC. I found that 1 M AIP also prevented
the increase in amplitude (Figure 4.1B; n=4 experiments; p=0.80, t-test).
Elevated K+ also induced an increase in the frequency of AMPAR mEPSCs, which
doubled from a control value of 9.6 ± 1.0 Hz in normal ESC to 20.1 ± 1.8 Hz following
elevated K+ wash (Figure 4.1C; p<0.001, t-test). The CaMKII blockers KN 62 and AIP
had no effect on the elevated K+-induced change in frequency (Figure 4.1C; p=0.04 and
p=0.004 respectively, t-test), suggesting that CaMKII plays little or no role in the
presynaptic release of glutamate.
To examine the mEPSCs in more detail, I constructed amplitude histograms for
controls and for events obtained from elevated K+ preparations (Figure 4.2A). There
appeared to be a slight shift in the events such that there were a greater proportion of
higher amplitude events following high K+ solution incubation compared with controls.

92
Scatter plots of 20-80% rise time vs amplitude (Figure 4.2B) showed no correlation in
these parameters, indicating no space clamping issues with my recordings.
An examination of the kinetics showed that incubation of 10 mM K+ alone does not
change mEPSC rise time (Figure 4.3A; p=0.23, t-test). Neither was there a change in the
groups incubated in AIP, but curiously there was a significant increase in the rise time of
high K+ induced events compared with controls, in the KN 62 incubated group (Figure
4.3A, p= 0.0255, t-test). It is surprising that this occurred given the lack of effect in the
AIP group; however, it should be noted that the control rise time was slightly smaller in
the KN 62 group than in any of the other controls, while the rise time in the elevated K+
group was actually not significantly different from any other elevated K+ group (Figure
4.3A; p=0.495, one-way ANOVA).
An analysis of the decay time constants suggested that blocking CaMKII leads to a
significant slowing of the mEPSC off kinetics as indicated by the increased decay time
constant in the AIP treated group (Figure 4.3B; n=4, p= 0.0243, t-test). Here, the decay
time constant increased from 0.28 ± 0.01 ms in baseline recording to 0.36 ± 0.03 ms
following elevated K+ application. These values were significantly different and
represented a 28 % increase in the decay time. The decay time of the elevated K+ treated
group when incubated in KN 62 was not significantly different from its control (Figure
4.3B; p=0.114, t-test), but was trending towards higher values.

93
Taken together, these data suggest that CaMKII increase the amplitude of AMPA
currents following cellular depolarization by elevated K+ solution. These findings are
similar to those in mammalian systems which show that activation of CaMKII
phosphorylates AMPARs and induces insertion of new receptors to synapses, thus
increasing AMPA current amplitudes (Poncer et al., 2002). I attempted to confirm these
results by including an active form of CaMKII in the whole cell patch pipette, which
would theoretically lead to a gradual increase in the amplitude of AMPA mEPSCs, and
possibly a change in decay kinetics. For these experiments I used a mammalian form of
CaMKII- that was made constitutively active and that has been shown to be effective in
murine models (Lledo et al., 1995). However, I found that inclusion of active CaMKII-
(400 nM or 10 U/l) in the pipette had no effect on mEPSC parameters as shown in
Figure 4.4. It was difficult to maintain the whole cell patch for longer than 10 minutes
and so all parameters are examined within the 10 minute time point. My results indicate
that AMPA mEPSCs were unaffected by the active CaMKII. These findings were at odds
with my previous data suggesting that CaMKII may indeed alter AMPA mEPSC
properties, as has been shown in mammalian systems (Lledo et al., 1995), and could be
due to my use of mammalian rather than zebrafish CaMKII, or that a longer period of
time is required to see an effect. It is also possible that CaMKII may not actually be
involved in the high K+ induced upregulation of AMPA mEPSCs. Therefore, additional
studies are required to shed more light on the acute effect of CaMKII- activation on
AMPARs. I should be clear that I did not directly measure the activity of CaMKII after
the high K+ wash, and therefore cannot confirm that high K
+ does indeed activate
CaMKII. However, the similar effects of KN 62 and AIP, which employ different
94
mechanisms to block CaMKII, lead me to believe that CaMKII was activated by the
elevated K+ solution.
Since my primary aim was to determine if CaMKII- is involved in the normal
development of AMPA containing synapses, I sought to reduce the levels of CaMKII via
morpholino knockdown as described in Chapter 3. Electrophysiological recordings were
difficult to obtain from the morphants because they possessed fragile cell membranes that
precluded stable, long-term recordings; however, basal electropohysiological parameters
were similar between all of the groups (Table 4.1). Example traces are shown in Figure
4.5, along with averaged mEPSCs. To confirm that the events were indeed AMPA
mEPSCs, I blocked their occurrence with NBQX (Figure 4.5). Surprisingly, I found little
difference among the mEPSC parameters investigated. Amplitude distributions and 20-
80% rise time vs amplitude scatter plots (Figure 4.6) show no obvious difference amongst
the various groups. Similarly, bar graphs of mean amplitude and frequency indicate that
the morphants exhibit AMPA mEPSCs that are similar to controls (Figure 4.7; p>0.05,
one-way ANOVA, multiple comparison test with Student Newman–Keuls Method).
Finally, an analysis of mEPSC kinetics (Figure 4.8) shows no change in the rise time of
the events and only a small but significant increase in the decay time constant in the
translation blocking morphants compared with uninjected controls (Figure 4.8B; p<0.05,
one-way ANOVA, multiple comparison test with Student Newman–Keuls Method).
However the decay time course of the AMPA mEPSCs obtained from the splice-blocking
morphants were not significantly different from the control-injected embryos. Taken

95
together, these results suggest that knockdown of CaMKII-α has little or no effect on the
development of AMPA currents on zebrafish M-cells.
4.2.2 Effect of camk2a knockdown on NMDA mEPSCs
To determine if CaMKII affects the development of NMDA-containing synapses, I
isolated NMDA mEPSCs, by including TTX (1 M), picrotoxin (100 M), strychnine (5
M) and NBQX (0.1 M) in Mg2+
free extracellular recording solutions. Confirmation of
their identity was obtained by blocking all remaining mEPSCs with APV (50 M)
(Figure 4.9). Due to the low frequency of NMDA events, I recorded mEPSCs for long
period (~30 minutes) to capture a sufficient number of events for analyses. To confirm
the stability of the mEPSC kinetics under my recording conditions, I compared the events
captured between 6 to 15 minutes with events captured between 16 to 25 minutes (n = 3
uninjected embryos). I found that the frequency of NMDA events increased significantly
over time from 0.06 ± .01 Hz in 6-15 minutes to 0.11 ± 0.01 Hz in 16-25 minutes (Figure
4.10A; p<0.05, t-test). However, the mean amplitude of the events and amount of charge
transferred during synaptic currents were not different between the two groups (Figure
4.10B, C) confirming the general stability of the mEPSCs throughout the recording
period.
I recorded NMDA mEPSCs from uninjected (n=7), control MO-injected (n=6),
translation blocking MO-injected (n=5), and splice blocking MO-injected (n=5) 2 dpf
embryos. There were no obvious differences between the uninjected controls and the MO
controls; however, analysis of NMDA mEPSCs indicated that the mean mEPSC

96
amplitude was significantly smaller in the translation-blocking and splice-blocking
morphants compared with control embryos (Figures 4.9 and 4.11A,). Specifically, I found
that mean mEPSC amplitude of NMDA events was 83.7 ± 8.3 pA in uninjected controls,
80.6 ± 9.3 pA in MO controls, 49.7 ± 5.3 pA in the translation-blocking morphants and
58.0 ± 12.1 pA in the splice-blocking morphants (Figure 4.11A; p=0.003, one-way
ANOVA, multiple comparison test with Student Newman–Keuls Method ). There was no
change in either the frequency or the 20-80% rise times of the NMDA mEPSCs between
groups (Figure 4.11B, C).
An examination of the mEPSC decay component indicated that NMDA events
decayed with a bi-exponential time course, and that the amplitude of the fast component
did not differ between groups (Figures 4.9, 4.12, 4.13A). There was no difference in the
time course of the fast exponential component (fast), which was 34.9 ± 4.4 ms (n=5) in
the translation-blocking morphants, 32.1 ± 8.8 ms (n=5) in the splice-blocking
morphants, 25.9 ± 4.8 ms (n=6) in the control MO group and 25.2 ± 2.2 ms (n=7) in the
uninjected embryos (Figure 4.13B; p=0.246, one-way ANOVA, multiple comparison test
with Student Newman–Keuls Method). Additionally, there was no significant effect on
the time course of the slow NMDA component (slow) (Figure 4.13D); but importantly,
the amplitude of the slow component was significantly reduced in both of the morphants
compared with controls (Figure 4.13C; p=0.001, one-way ANOVA, multiple comparison
test with Student Newman–Keuls Method). Specifically, the amplitude of slow was 19.8 ±
2.7 pA (n = 5) in the translation-blocking morphants, 26.7 ± 5.8 pA (n = 5) in the splice-
blocking morphants, 45.1 ± 4.6 pA (n = 6) in the MO injected controls and 45.4 ± 4.6 pA

97
(n = 7) in the uninjected embryos (Figure 4.13C). These results suggest that CaMKII-α is
necessary for the normal development of NMDA-mediated currents in zebrafish M-cells.
4.2.3 Effect of acute activation or blocking of CaMKII- on NMDA mEPSC decay
kinetics
To confirm that the reduction of NMDAR mEPSC amplitude in CaMKII-
morphants resulted from a lack of developmental upregulation of NMDARs, and not
from a deficiency in acute activity of CaMKII-, I attempted to activate CaMKII- in M-
cells via a high K+ solution as I had done for the AMPA mEPSCs. I used a bath solution
that contained 10 mM K+ to depolarize the neurons and activate CaMKII-. Application
of the depolarizing solution doubled NMDA mEPSC frequency in the control recordings
from 0.12 ± 0.01 Hz to 0.23 ± 0.05 Hz (Figure 4.14A n = 4 recordings, p = 0.018, t-test).
When the CaMKII blocker, AIP, was included in the recording pipette, the increase in
frequency did not occur (n = 4 embryos; p=0.258, t-test). This result was a curious one
and remains unexplained, as effects on mEPSC frequency are likely to be presynaptic in
origin and were not expected to be affected by CaMKII inhibition in the postsynaptic
cell.
High K+ solution or acute inhibition of CaMKII- did not change the amplitude, rise
time, or decay kinetics of NMDA mEPSCs (Figure 4.14 B, C, 4.14A, C; p >0.05).
Specifically, AIP did not affect the amplitude of the slow component of the NMDA
decay (Figure 4.15D, control: 36.3 ± 6.5 pA before 10 mM K+ bath, AIP: 34.5 ± 5.7
before 10 mM K+ bath, p > 0.05). These findings suggest that acute block of CaMKII did

98
not have an effect on NMDA mEPSCs properties and that the main role of CaMKII was
to regulate normal development of NMDAR-containing synapses.

99
Table 4.1 Electrophysiological parameters of M-Cells.
Membrane Potential
(mV)
Cell Capacitance
(pF)
Membrane
Resistance (M)
Uninjected controls
(n = 7) -61.9 2.5 24.1 1.8 55.2 8.3
MO controls (n = 6) -63.4 1.6 24.5 1.7 57.9 5.2
Translation-
blocking MO (n =
5)
-60.7 7.6 21.7 0.6 63.9 10.4
Splice-blocking MO
(n = 5) -65.2 1.2 18.6 1.4 53.5 9.3

100
Figure 4.1

101
Figure 4.1 CaMKII inhibitors block upregulation of AMPAR mEPSCs. (A) Example
traces of AMPAR mEPSCs recorded before (control) and after (10 mM K+) 5-minute
bath application of 10 mM K+ containing depolarizing medium. Recordings were
obtained from 6 different preparations. In separate experiments, two different CaMKII
inhibitors, KN-62 (10 M, n = 4 experiments) and AIP (1 M, n = 4 experiments) were
used in the intracellular solution to block CaMKII activity in the postsynaptic cell. Bar
graphs comparing (B) amplitude and (C) frequency of averaged AMPA mEPSCs. *
Significantly different from control, p<0.05, ** significantly different from control,
p<0.01, *** significantly different from control, p<0.001.

102
Figure 4.2

103
Figure 4.2 Amplitude histogram and scatter plot of AMPA mEPSCs obtained from the
M-cell of 48 hpf embryos, recorded in the presence of 1 mM TTX, 1 mM strychnine and
100 mM picrotoxin. mEPSCs recorded from control (normal ECS) are represented by the
black bars while events recorded from elevated K (10 mM K+) solutions are represented
by the light grey, hatched bars. Dark grey, hatched bars represent overlapping regions.
(B) Scatter plot of rise time vs mEPSC amplitude. Holding potential was -60 mV.

104
Figure 4.3

105
Figure 4.3 Kinetic properties of AMPA mEPSC recorded from 10 mM K+ stimulated M-
cells. Bar graph showing the (A) 20-80% rise time and (B) decay time constant of
mEPSCs recorded in normal ECS and 10 mM K+ solution illustrating the effect of the
broad spectrum CaMKII blocker, KN62 and the more specific CaMKII blocker, AIP. *
Significantly different from control, p<0.05.

106
Figure 4.4

107
Figure 4.4 Acute effect of active CaMKII- on AMPA mEPSCs. (A) 10 minute
application of the active form of CaMKII- (400 nM, or 10 U/l) to the Mauthner cell
cytosol had no apparent effect on AMPA mEPSCs. Bar graphs showing mEPSC (B)
amplitude, (C) frequency, (D) 20-80% rise time and (E) decay time constant indicate no
change in these parameters after 10 minute intracellular application of active CaMKII.

108
Figure 4.5
109
Figure 4.5 Spontaneous synaptic AMPAR currents obtained from M-cells. Uninjected
embryos (n = 7), control morpholino injected embryos (n = 8), translation-blocking
morpholino injected embryos (n = 7) and splice-blocking morpholino injected embryos (n
= 6) exhibit AMPAR currents at similar frequencies. The inclusion of NBQX (0.1 M)
confirmed the mEPSCs as AMPAR-mediated. Preparations were incubated in TTX (1
m), strychnine (5 M), picrotoxin (100 M) and APV (50 M) to block action
potentials, glycine, GABA and NMDA receptors respectively. Average traces are shown
to the right of each recording; each trace is an average of multiple events; 215 mEPSCs
for the uninjected controls, 224 events for the MO controls, 174 events for the
translation-blocking morphants and 276 events for the splice-blocking morphants.

110
Figure 4.6

111
Figure 4.6 AMPA mEPSC distributions. (A) Amplitude histogram of AMPA mEPSCs
obtained from Mauthner cells and recorded from uninjected controls (n = 7), morpholino
controls (n = 8), translation-blocking morphants (n = 7) and splice-blocking morphants
(n=6). (B) Scatter plots of rise time versus amplitudes of mEPSCs captured from the cells
in (A). For uninjected controls, r = 0.077; n = 227 events. For morphant controls, r =
0.014; n = 239 events. For translation-blocking morphants, r = 0.098; n = 223 events. For
splice-blocking morphant, r = 0.095; n = 472 events.
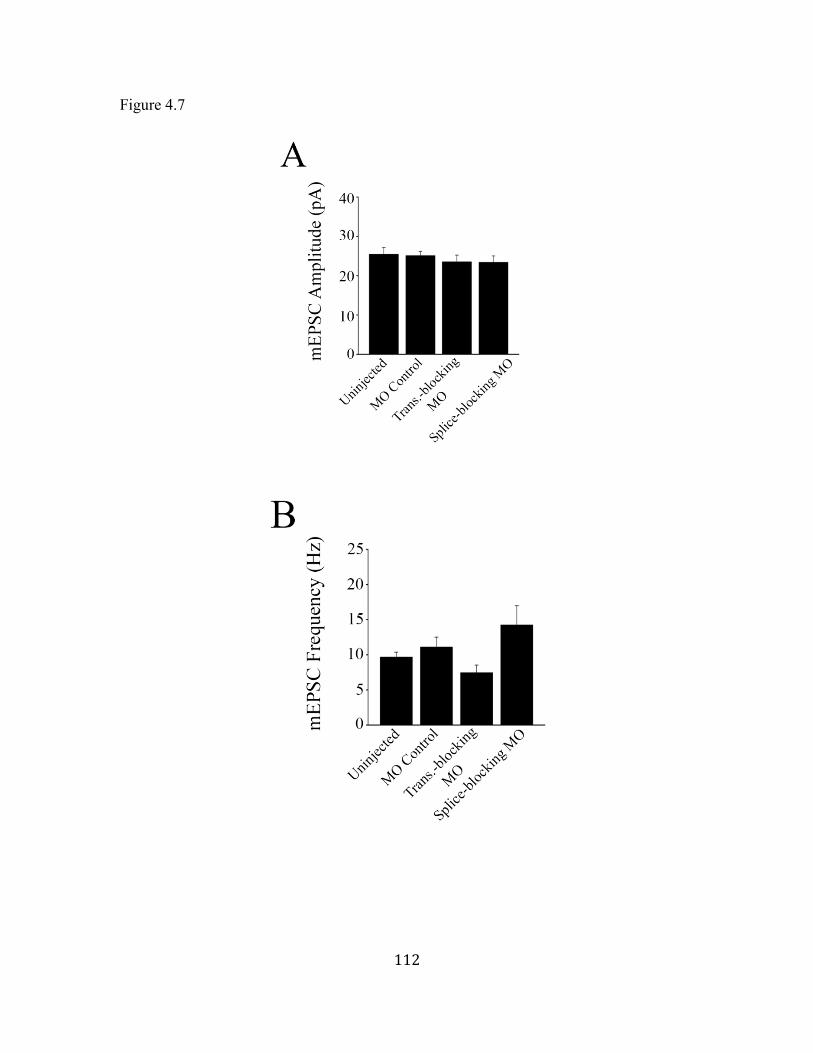
112
Figure 4.7

113
Figure 4.7 Properties of AMPA mEPSCs. Bar graphs showing the mean mEPSC
amplitude (A) and frequency (B) of events recorded from uninjected controls,
morpholino controls, translation-blocking morphants and splice-blocking morphants.

114
Figure 4.8

115
Figure 4.8 Kinetic properties of AMPA mEPSCs. Bar graphs showing the mean mEPSC
rise time (A) and decay time constants (B) of events recorded from uninjected controls (n
= 7), morpholino controls (n = 8), translation-blocking morphants (n = 7) and splice-
blocking morphants (n = 6). * Significantly different from uninjected controls, p<0.05.

116
Figure 4.9
117
Figure 4.9 Spontaneous synaptic NMDAR currents obtained from M-cells. (A)
Uninjected embryos, control morpholino injected embryos, translation-blocking
morpholino injected embryos and splice-blocking morpholino injected embryos exhibit
NMDAR currents at similar frequencies. The inclusion of APV (50 M) confirmed the
mEPSCs as NMDAR-mediated. Inset shows an example of an individual mEPSC on an
expanded time scale. Note the biexponential decay phase of the individual event.
Preparations were incubated in TTX (1 m), strychnine (5 M), picrotoxin (100 M) and
NBQX (0.1 M) to block action potentials, glycine, GABA and AMPA receptors
respectively. (B) Averaged mEPSCs recorded from M-cells of an uninjected control, a
control MO injected embryo and translation-blocking morpholino injected embryo and a
splice-blocking morpholino injected embryo. Each trace is an average of multiple events;
86 mEPSCs for the uninjected controls, 44 events for the MO controls, 58 events for the
translation-blocking morphants and 22 events for the splice-blocking morphants.
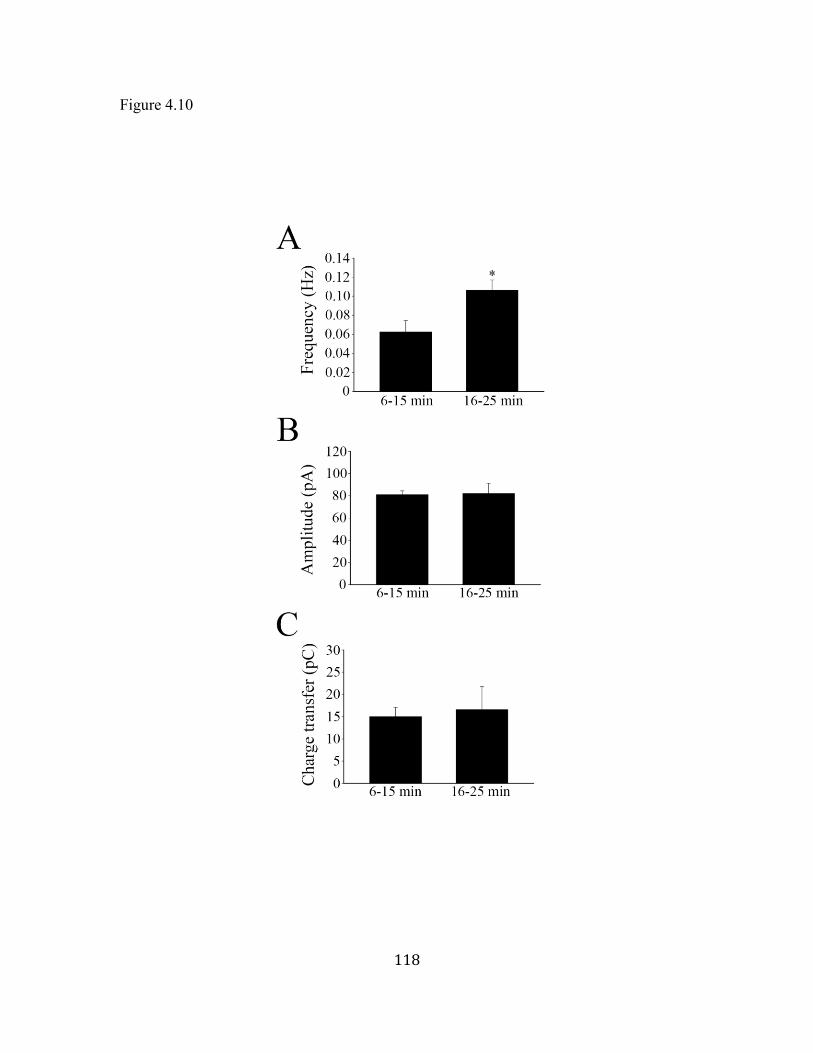
118
Figure 4.10

119
Figure 4.10 Long-term stability of NMDA mEPSCs. Bar graphs comparing frequency
(A), peak amplitude (B), and mean charge transfer (C) between events captured from 6 to
15 minutes and events captured from 16-to 25 minutes of recording. * Significantly
different, p < 0.05.
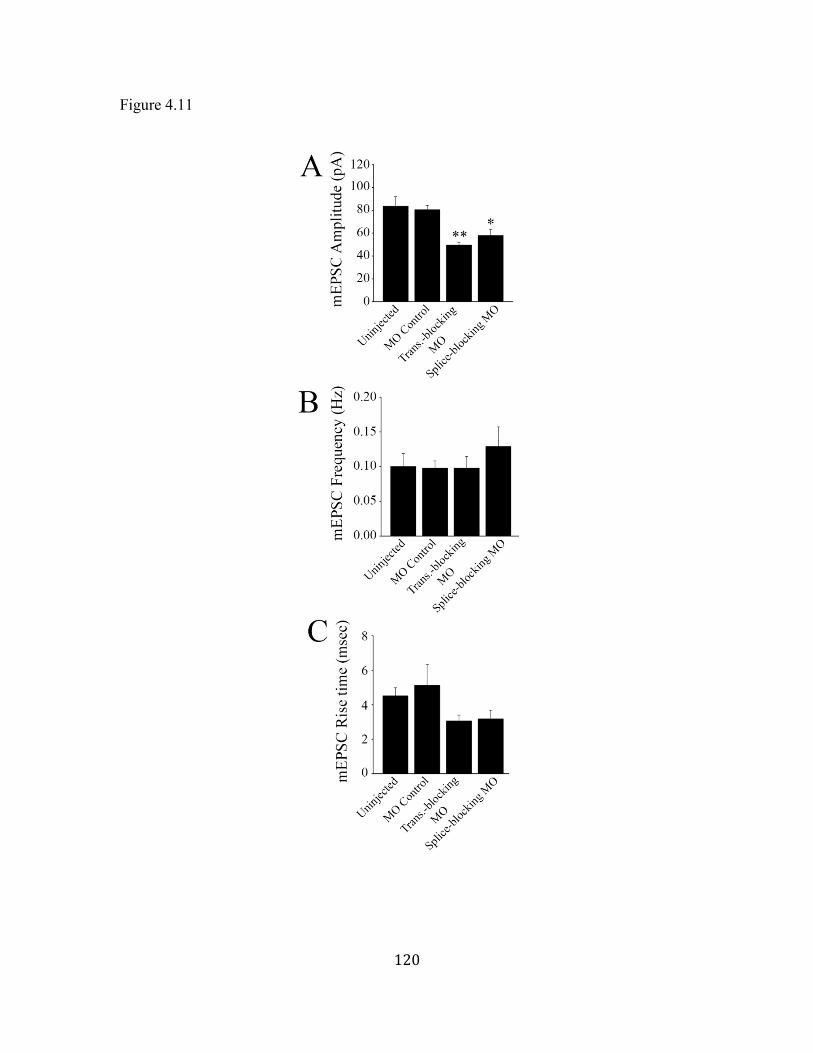
120
Figure 4.11

121
Figure 4.11 Properties of NMDA mEPSCs. Bar graphs comparing the peak amplitude
(A), frequency (B) and 20-80% rise time (C) of averaged NMDA mEPSCs. *
Significantly different from uninjected and MO controls, p<0.05, ** significantly
different from uninjected and MO controls, p<0.01.

122
Figure 4.12

123
Figure 4.12 Averaged NMDA mEPSCs. The averaged traces had biexponential decay
phases with fast=21 ms and slow =319 ms in the uninjected control, fast =18 ms and
slow=316 ms in the MO controls, fast =40 ms and slow=299 ms for the translation-
blocking morphants and fast=39 ms and slow =221 ms for the splice-blocking morphants.

124
Figure 4.13

125
Figure 4.13 Decay kinetics of NMDA mEPSCs. Bar graphs comparing the amplitude of
the fast component (A), the decay time constant of the fast component, fast (B), the
amplitude of the slow component (C), and the decay time constant of the slow
component, slow (D). * Significantly different from uninjected and MO controls, p<0.05.

126
Figure 4.14

127
Figure 4.14 NMDA mEPSC properties before and after acute activation or inhibition of
CaMKII-. Acutely activation of CaMKII- was induced by a 5 minute bath of 10 mM
K+ containing recording solution (n = 4 experiments). A CaMKII- specific inhibitory
peptide, AIP (1 M) was included AIP in the intracellular recording solution to block
CaMKII- activity (n = 4 experiments). Bar graphs comparing frequency (A), amplitude
(B), and 20-80% rise time (C) of the averaged mEPSCs before and after acute activation
or inhibition of CaMKII-. * Significantly different than control, p < 0.05.

128
Figure 4.15

129
Figure 4.15 NMDA mEPSC decay kinetics following 10 mM K+ stimulation. Bar graphs
shows (A) the decay time constant of the fast component, fast (B), the amplitude of the
fast component, (C) the decay time constant of the slow component, slow, and (D) the
amplitude of the slow component.

130
Chapter 5: Effect of CaMKII- on GABAA and Glycine receptor mediated
inhibitory synaptic currents3
5.1 Introduction
γ-Aminobutyric acid (GABA) is a major inhibitory neurotransmitter in the vertebrate
nervous system (Capogna and Pearce, 2011; Mody and Pearce, 2004; Roberts and
Frankel, 1950, 1951; Rudolph and Mohler, 2014). It mediates fast, inhibitory synaptic
transmission by binding to ionotropic GABAA receptors (GABAARs), and slower, second
messenger signaling via activation of metabotropic GABAB receptors. Ionotropic
GABAARs belong to the family of pentameric, fast ligand gated receptors and are
composed of 5 individual subunits (α1-6, β1-3, γ1-3, δ, ε, θ, π, ρ1-3) with various
stoichiometries (Laurie et al., 1992a; Laurie et al., 1992b; Wisden et al., 1992). Although
GABAARs can be composed of a wide diversity of subunits, the α1β2γ2 subunit
combination appears to be the predominant form in the mammalian brain (Laurie et al.,
1992a; Laurie et al., 1992b; Wisden et al., 1992).
The GABA system plays crucial roles in regulating and controlling neural networks and
GABAARs are key targets for the treatment of disorders such as schizophrenia, autism,
epilepsy and depression (Rudolph and Mohler, 2014). Thus, it is important to have a clear
understanding of the properties, behavior and function of GABAARs. Multiple studies
have reported on the expression of GABA neurons in the zebrafish brain (Doldan et al.,
1999; Mueller et al., 2006; Tabor and Friedrich, 2008), but an investigation into the
3 A version of this chapter has been published: Roy, B., and Ali, D.W. (2014). Multiple types of GABAA responses identified from zebrafish Mauthner cells. Neuroreport 25(15):1232-6.

131
electrophysiological properties of GABAARs in developing zebrafish has not been
presented. In this section of the thesis I sought to determine the properties of synaptic
GABAAR associated with the M-cells in zebrafish. Additionally, I sought to determine if
knockdown of CaMKII had an effect on the development of GABAARs, since CaMKII
potentiates GABAAR currents in other organisms (Houston and Smart, 2006).
In addition to GABA synaptic activity, the M-cell receives a substantial amount of
inhibition via Glycine receptors (GlyRs) (Ali et al., 2000b; Legendre and Korn, 1994).
Like GABAARs, GlyRs are pentameric receptors, with various combinations of and
subunits. The subunits are encoded by four different genes (Glra 1-4), while the
subunit is encoded by one gene (Glrb) in mammals. The subunits contain the ligand
binding sites for glycine, while the subunit provides the binding site for gephyrin. The
majority of synaptic GlyRs are heteromeric assemblies of and subunits, although
homomeric receptors containing only subunits can also form functional receptors that
are mostly non-synaptic due to the lack of gephyrin binding sits on the subunits.
Expression of GlyRs in the CNS is developmentally regulated, with 2 being the most
prominently expressed during embryonic development and 1 being the predominant
form in the adult brain. Moderate expression of 3 transcript is also observed in the adult
CNS (Malosio et al., 1991). The developmental changes of GlyRs are accompanied by
changes in the biophysical and electrophysiological properties of the receptors (Betz and
Laube, 2006). The development and maturation of GlyR synapses has been examined in
zebrafish M-cells throughout the early developmental stages between 26 to 56 hpf (Ali et
al., 2000b; Legendre, 1998; Legendre and Korn, 1994). Overall, spontaneous glycinergic

132
synaptic activity is detected as early as 26-29 hpf. The frequency of the mIPSCs increas
progressively, presumably indicating accelerated synaptogenesis. Concomitant with the
increasing frequency, the rise time and decay kinetics of the GlyRs become faster
throughout the development, although the amplitude remains remarkably unchanged. It is
proposed that the change in decay time reflects a transition from embryonic, slow GlyR
to mature, fast GlyR subtypes during this time period. CaMKII plays an important role in
the formation and maturation of glycinergic synapses (Charrier et al., 2010; Wang and
Randic, 1996; Yamanaka et al., 2013). GlyRs are primarily inserted and removed from
plasma membrane from non-synaptic sites. Single particle imaging techniques revealed
that GlyRs diffuse freely on the plasma membrane and are trapped into synaptic sites by
interaction with the scaffolding protein gephyrin (Dahan et al., 2003; Feng et al., 1998).
Recently, adhesion protein integrins have been found to regulate the number of GlyRs at
synapses indirectly by modulating gephyrin turnover at synaptic sites in a CaMKII
dependent manner (Charrier et al., 2010). Inhibition of CaMKII decreases synaptic
accumulation of GlyRs but did not affect GlyR mobility in the extrasynaptic membrane.
Inhibition of CaMKII also impairs synaptic accumulation of GlyRs in embryonic
zebrafish M-cells (Yamanaka et al., 2013), where application of a CaMKII inhibitor KN-
93 to 1-3 dpf embryos or targeted expression of a CaMKII inhibitor peptide in zebrafish
M-cell both reduce GlyR clustering. Given that CaMKII is involved in the clustering of
the GlyRs, and the kinetic properties of these receptors change during embryonic
development, I hypothesized that CaMKII- may play a role in the development of GlyR
currents.
133
5.2 Results
5.2.1 Characterization of GABAergic miniature inhibitory synaptic currents
(mIPSCs) in Mauthner cell
To isolate GABAA mIPSCs, I recorded in the presence of TTX (1 M), kynurenic
acid (1 mM), and strychnine (5 M). Bath application of the GABAAR antagonist,
picrotoxin (100 M), completely abolished all remaining mIPSCs, confirming their
identity as GABAA-mediated (Figure 5.1A). GABA mIPSCs were low in amplitude,
averaging 27.2 ± 0.9 pA (Figure 5.2A; n = 271 events), and only occurred about once
every 30 seconds. To examine mIPSC properties, I binned the event amplitudes and 20-
80% rise times and plotted their distributions (Figure 5.2A, B). Both distributions were
normal but were skewed towards larger values. Interestingly, the rise time distribution
exhibited a main peak around 0.5 ms, and a second smaller peak around 2 ms (Figure
5.2B) indicating the possible presence of a sub-population of events that may represent
activation of extrasynaptic receptors (Capogna and Pearce, 2011; Ferando and Mody,
2013). A scatter plot of 20-80% rise time versus amplitude showed that the longer rise
time events clustered around the lower amplitudes, as might be expected for the
activation of extrasynaptic events (Figure 5.2C).
To examine the mIPSC decay kinetics, I fitted the decay portion of individual
events with an exponential function. Most events were well fit with a single exponential
decay; with values ranging from ~10 ms to ~300 ms. Approximately 15% of the events
were better fit with a double exponential decay rather than with a single exponent. I
separated the events based on single or double exponential time courses and examined

134
them further. The distribution of mIPSCs with single decay kinetics was skewed towards
larger values (Fig 5.3A) with a main peak around 40-60 ms and a second, smaller peak
around 150 ms. A scatter plot of the single decay time constant versus peak amplitude
indicated that the majority of the longer decaying events had smaller amplitudes in the
range of 15 pA to 45 pA (Fig 5.3B). These results suggested that there might be two
separate populations of events that decay with a single exponential time course: fast and
slow mIPSCs. Therefore, we grouped the events into two groups: the first (group I)
exhibited a single decay component less than 100 ms (peaking between 40 and 60 ms)
and the second (group II) had decay time courses above 100 ms (peaking between 120-
160 ms) (Fig 5.1B, 5.3C). Lastly, we placed the double exponential events in group III.
The mean time course of the fast component of the double decay events (1=
28.7±2.5 ms, n = 42 events from 9 experiments) was shorter than the time course of the
single exponential fast events (Fig 5.3C; Fast = 54 ± 1.6 ms, n = 192 events; p<0.001
Mann- Whitney U test), while the time course of the slow component of the double decay
(2 = 153 ± 11 ms, n = 42 events) was similar to the time course of the single exponential
slower event (Slow = 151 ± 7 ms, n = 37 events) (Fig 5.3 C; p= 0.927, Mann-Whitney U
test). Even though the mean values of the fast single decay events and the fast component
of the double decay events were different, their distributions showed significant overlap,
suggesting that they may indeed belong to the same population of receptors. Taken
together, these results suggest the presence of 3 separate groups of events: single
exponential fast, single exponential slow and double exponential events.

135
To further examine the properties of each of these 3 groups of mIPSCs, I
compared their frequencies, amplitudes and rise times (Fig 5.4). The frequency of the fast
single exponential events (f) was several-fold greater than either the slow single decay
(s), or the double decay mIPSCs (Fig 5.4B; n = 9 experiments; p=0.001, one-way
ANOVA, multiple comparison with Student-Newman-Keuls Method) suggesting that the
majority of GABA synapses are of the fast type. The mean amplitude of the double decay
events was significantly greater than either of the single decay groups (Fig 5.4A;
p<0.001, Kruskal-Wallis One Way ANOVA, multiple comparison with Dunn’s method).
The amplitude of the fast component of the double exponential decay was 21.2 ± 2.4 pA
(n = 42 events). Finally, there was no difference in mIPSC rise time between groups
indicating that the longer rise time events (Figure 5.2B) were comprised of a mixture of
events from all 3 group (Figure 5.4C; p<0.05; n=192 events for Fast, n=37 events for Slow
and n=42 events for the double decay mIPSCs).
5.2.2 Effect of CaMK2- on GABA receptor mediated mIPSCs
To determine the role of CaMKII- on the GABA receptors, I recorded mIPSC
from control MO-injected, and CaMKII- translation blocking MO-injected embryos (n
= 4 embryos in each group) as described in the previous section. Next, I assembled the
events in three groups as described and analyzed the properties of each group of events. I
detected very few events that fell in the double decay group (n = 6 events for control
MO-injected embryos, and 7 for translation blocking morphants) and therefore excluded
this group from further analysis. Comparison of single decay fast events between groups
showed that there was no difference in the frequency, rise time or amplitude (Figure 5.5).

136
Interestingly, the decay time course of these fast events in translation blocking morphants
(39.3 ± 1.7 ms, n = 130 events) was significantly smaller than control MO injected
embryos (47.7 ± 1.7 ms, n = 146 events) (Figure 5.5D; p < 0.05, Mann-Whitney U test).
Histograms of decay time distribution revealed that the fast events in translation blocking
morphants were shifted towards lower values (Figure 5.6). The properties of slow
mIPSCs were not significantly different between control morphants and translation
blocking morphants (Figure 5.7).
5.2.3 CaMKII- knockdown alters Glycine mIPSC decay kinetics
To determine if CaMKII- is involved in the development of inhibitory synapses on
zebrafish M-cells, I recorded glycine mIPSCs from control and morpholino injected
embryos. I focused on the translation-blocking morphants for 2 reasons. First, when
comparing the effects of the two different morpholinos thus far, I found no significant
difference between them. Second, in the interest of time I was only able to investigate the
effects a single morpholino and decided to use the translation-blocking morpholinos. To
record Glycine currents from M-cells, I included TTX (1 M) to block action potentials,
kynurenic acid (1 mM) to block AMPA and NMDA receptors, and picrotoxin (100 M)
to block GABA receptors in the recording solution. All remaining currents were blocked
by adding the glycine receptor antagonist, strychnine (5 M) in the bath (Figure 5.8).
Glycine mIPSCs were recorded from uninjected, control morpholino-injected, and
CaMKII translation blocking morpholino-injected embryos. Amplitude histograms
show no obvious differences between the three groups (Fig 5.9). Additionally, bar graphs

137
of the mean mIPSC amplitudes and frequencies showed no significant effect of knocking
down CaMKII-a (Fig 5.9; p=0.782 and 0.508 respectively, one-way ANOVA).
Similar analysis revealed that the 20-80% rise times were normally distributed between
groups (Fig 5.10A). Bar graphs of the mean rise times also indicated no significant
differences between groups (Fig 5.10B, p=0.36, one-way ANOVA). Scatter plots of
mIPSC rise times versus amplitudes showed no correlation between these parameters,
suggesting that there were no space clamping issues in the recordings. Next, I examined
the decay time constants of the mIPSCs. Glycinregic mIPSCs have been extensively
investigated in the Ali lab and show double exponential decay time constants throughout
development (Ali et al., 2000b; Legendre, 1998; Legendre and Korn, 1994). At the time
of hatching (48-52 hpf) glycinergic mIPSCs associated with the M-cells of uninjected
fish exhibit a fast component with a time course of 1.2 ± 0.1 ms (n=10), and a slow
component of 5.0 ± 0.4 ms. The decay time constants of the control morphant group is
similar with a fast component of 1.2 ± 0.1 ms and a slow component of 5.8 ± 0.5 ms
(n=7) (Fig 5.11, 5.12). However, the decay time courses of the mIPSCs recorded from the
translation-blocking morphants was significantly longer in duration than either of the
controls (Fig 5.12, p=0.037, one-way ANOVA, multiple comparison with Student-
Newman-Keuls Method ). Specifically, I found that the fast decay component of the
mIPSC was 1.6 ± 0.1 ms (n=6) and for the slow component it was 7.6 ± 0.6 ms (Fig
5.12). The relative amplitudes of the fast and the slow decay time constants were not
significantly different from the uninjected controls or the morpholino control groups (Fig
5.11B).

138
Figure 5.1

139
Figure 5.1 Isolation of GABA mIPSCs from M-cells of 2 dpf zebrafish embryos. (A) A
30 second trace showing the low frequency of mIPSCs (denoted by *) during bath
application of 1 M TTX, 1 mM kynurenic acid and 5 M strychnine to block action
potentials, AMPA, NMDA and glycine receptors respectively. Bath application of 100
M picrotoxin blocks mIPSCs. (B) Individual mIPSCs recorded from 48 hpf embryos
with a single decay time course () of 31.6 ms, 163 ms, or a double exponential decay of
1 = 34 ms and 2 = 179 ms.

140
Figure 5.2

141
Figure 5.2 Properties of GABA mIPSCs. (A) Amplitude distribution of the mIPSCs
obtained from 9 separate recordings (n= 271 events; binwidth = 3 pA). (B) 20-80% Rise
time distribution of all mIPSCs (n = 271 events; binwidth = 0.2 ms). (C) Scatter plot of
rise time vs. amplitude for all of the mIPSCs obtained from 9 separate recordings.

142
Figure 5.3

143
Figure 5.3 Decay kinetics of GABA mIPSCs. (A) Single exponential decay distribution
of mIPSCs that were appropriately fit with a single exponential decay (n = 229 events;
binwidth = 10 ms). (B) Scatter plot of single exponential decay vs. peak amplitude of
mIPSCs. (C) Bar graph of the decay time constants for the single fit fast events (f),
single fit slow events (s) and the fast (1) and slow (2) components of the double
exponential fits. *** Significantly different from control, p<0.001.

144
Figure 5.4

145
Figure 5.4 Comparison of GABA mIPSC properties. (A) Averaged amplitudes of events
from group I (f; n=192), group II (s; n=37) and group III (n=42). Note that the fast and
slow components of the double fits are shown individually for comparison with the single
exponential decays. (B) Averaged frequencies of events from group I, group II and group
III. (C) Averaged 20-80% Rise times of group I, group II and group III events. *
Significantly different from control, p<0.05, *** Significantly different from control,
p<0.001.

146
Figure 5.5

147
Figure 5.5 Properties of single decay fast (Group I) GABA mIPSCs in CaMKII-
morphant zebrafish. GABA mIPSCs were recorded from control morpholino injected (n
= 4 embryos, 146 events) and translation-blocking morpholino injected (n = 4 embryos,
130 events). Bar graphs comparing (A) frequency, (B) amplitude, (C) 20-80% rise time,
and (D) decay time course. * Significantly different compared to control, p < 0.05.
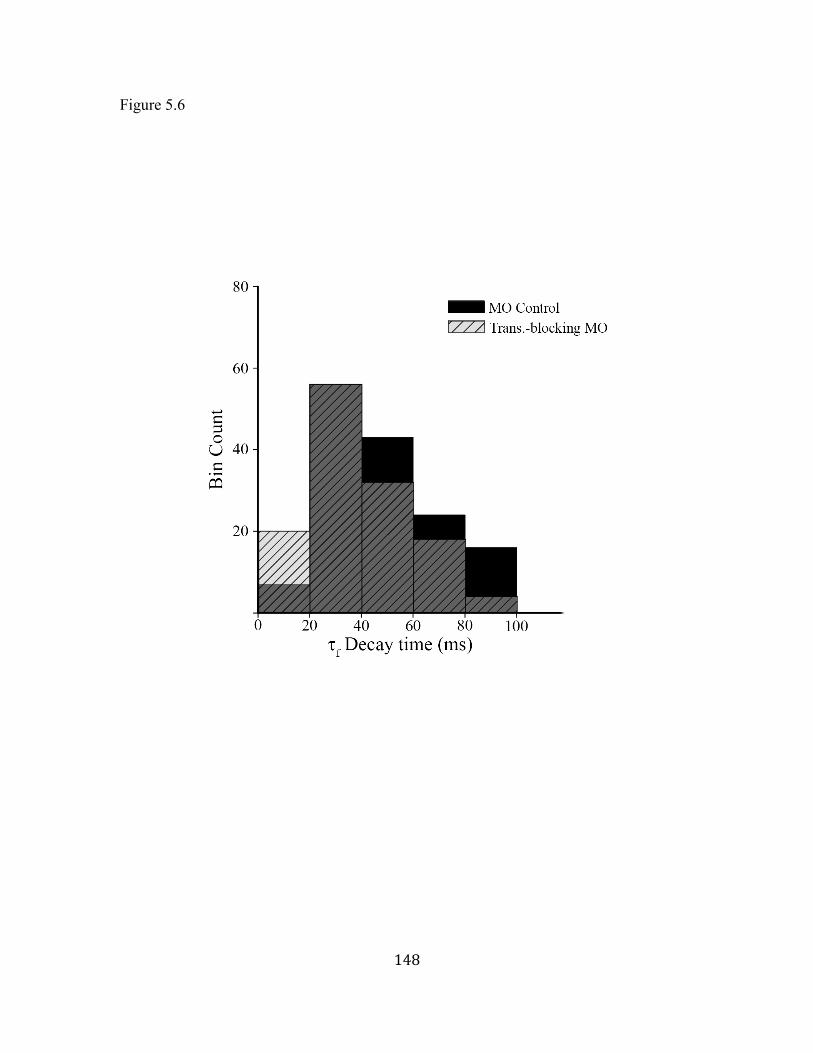
148
Figure 5.6

149
Figure 5.6 Decay time course distribution of Group I events. Histograms showing decay
time of single decay fast events from control morpholino injected embryos (n = 146
events, bin width = 20 ms), and translation blocked morphants (n = 130 events, bin width
= 20 ms).

150
Figure 5.7

151
Figure 5.7 Properties of single decay slow GABA mIPSCs (Group II) in morphant
embryos. Bar graphs comparing (A) frequency, (B) amplitude, (C) 20-80% rise time, and
(D) decay time (n = 24 events for control MO injected, and 17 events for translation
blocked morphants).

152
Figure 5.8

153
Figure 5.8 Spontenous synaptic GlyR currents recorded from 2 dpf zebrafish Mauthner
cells. (A) Uninjected embryos (n=10), control morpholino injected embryos (n=7), and
CaMKII-a translation blocking morpholino injected embryos (n=6) exhibit synaptic
currents at comparable frequencies. Currents were recorded in the presence of 1 M
TTX, 1 mM kynurenic acid and 100 M picrotoxin to block action potentials, ionotropic
glutamate receptors and GABAA receptors respectively. The remaining currents were
completely abolished by 5 M strychnine incubation, confirming the identity of the
synaptic currents as GlyR-mediated (B) Averaged GlyR mIPSCs. Each trace is an
average of multiple events; 113 events for uninjected, 191 events for control morpholino
injected and 114 events for translation blocking morpholino injected embryos

154
Figure 5.9

155
Figure 5.9 Distributions of Glycine mIPSCs. Example histograms of (A) amplitude (bin
width = 10 pA) and (B) 20-80 % rise times (bin width = 100 s) of mIPSCs obtained
from uninjected (n = 112 events), control morpholino injected (n = 147 events) and
translation-blocking morpholino injected (n = 336 events) embryos.

156
Figure 5.10

157
Figure 5.10 Properties of glycine mIPSCs. Bar graphs showing (A) frequency, (B)
amplitude, and (C) rise time of glycine currents recorded from uninjected (n = 10),
control morpholino injected (n = 7), and translation blocking morpholino injected (n = 6)
2 dpf embryos.

158
Figure 5.11

159
Figure 5.11 Averaged glycine mIPSCs. The decay phases of the average traces are best
fitted with a double exponential function. Example average traces from (A) an uninjected
embryo with fast = 1.41 ms and slow = 5.48 ms, (B) a control morpholino injected
embryo with fast = 1.14 ms and slow = 6.06 ms and (C) a translation blocking morpholino
injected embryo with fast = 1.4 ms and slow = 6.87 ms.

160
Figure 5.12

161
Figure 5.12 Glycine mIPSC decay kinetics. Bar graphs comparing (A) the decay time
constant of the fast component, fast (B), the amplitude of the fast component, (C) the
decay time constant of the slow component, slow, and (D) the amplitude of the slow
component. a, significantly different from uninjected p<0.05, b, significantly different
from MO Control p<0.05.

162
Chapter 6: Discussion
6.1 Overview of findings
In this thesis I present results from studies designed to determine the expression and
function of CaMKII isoforms in the developing fish. Specifically, my goals were to
determine exactly which isoforms of CaMKII are expressed in the M-cells of embryonic
zebrafish and then determine their roles in synaptic physiology and locomotor responses.
My first aim was to use single cell RT-qPCR to determine CaMKII expression in M-cells
as shown in Chapter 3. To quantify CaMKII gene expression, I designed gene specific
primer and probe sets for real-time amplification and detection of each of the seven
genes. The primers were designed to anneal on two different exons separated by an
intron, thus preventing false positive results due to genomic DNA amplification Single
cells contain very minute amount of nucleic acid, typically in the low picogram range
(Kawasaki, 2004). Therefore, I synthesized cDNA directly from the cells in the same tube
where they were collected without an RNA extraction step to prevent sample loss.
Additionally, TaqMan PreAmp mastermix was used to linearly amplify all target cDNA
prior to qPCR. To ensure that the single cells were processed successfully, each sample
was tested for the ubiquitously expressed transcription factor, ef1a alongside the CaMKII
genes in the qPCR. Cells that did not express ef1a were deemed a processing failure and
removed from further analysis, which prevented false negative results. My findings
strongly suggest that camk2a is the predominantly expressed gene in 48 hpf M-cells,
which encode the CaMKII- . To determine if CaMKII has a role in synaptic
development and behavior, I knocked down its expression via morpholino technology. I
163
found that knockdown resulted in increased dendritic branching (of the M-cell), as has
been shown in other organisms. Furthermore, knockdown of CaMKII- affected the
embryo’s gross morphology and led to altered escape response. In Chapter 4, I examined
the effect of knocking down CaMKII- on the properties and activity of excitatory
synapses that contain AMPA and NMDA receptors. I found that knockdown of CaMKII-
had no significant effect on the development of AMPA currents, but led to altered
development of NMDAR currents. Specifically, the slow decay component of NMDA
mEPSCs was reduced in amplitude in the knockdowns compared with controls. In
Chapter 5, I examined the effect of CaMKII on GABAA and Glycine receptor mediated
synaptic currents. I first characterized the GABAA receptor activity since this had not
been done previously in zebrafish. My results suggest that there are 3 general groups of
GABAAR-containing synapses: the first (group I) expresses a homogeneous type of
receptor with a broad distribution and a single exponential decay time peaking around 40-
60 ms; the second (group II) expresses GABAARs with a single decay time peaking
around 120-160 ms, and the third (group III) appears to express a combination of the first
two groups. I found that CaMKII- has very little, if any effect on the development of
GABA containing synapses. Lastly, I examined the properties of glycinergic synapses.
Here, my results indicate that the time course of glycine mIPSCs was significantly
slowed when CaMKII levels were reduced. Taken together, these findings support a role
of CaMKII- in the development of synaptic NMDARs and possibly GlyRs in
embryonic zebrafish but suggest that it has little or no effect on the development of
synapses that contain AMPARs and GABAARs. I discuss each of these areas in the
following sections.

164
6.2 Zebrafish Mauthner cells express primarily camk2a at 2 dpf
My single-cell qRT-PCR results showed that the camk2a gene was preferentially
expressed in M-cells of 2 dpf zebrafish embryos, while other isoforms (1, 2, 1, 2, 1,
2) were mostly undetectable. In a previous whole mount in situ hybridization study on
tissue specific expression of CaMKII genes, Rothschild et al (2007) demonstrated that 1,
2 and 2 mRNA are the most prevalent in 2 dpf zebrafish hindbrain. It was intriguing to
find that the expression pattern of CaMKII genes in M-cells was different from their
tissue distribution. This apparent discrepancy between my findings and those of
Rothschild et al (2007) may occur because we specifically targeted a single cell type
rather than examining whole tissue. Thus, my results represent a significant difference in
CaMKII gene expression in M-cells from the reported levels of camk2a in whole tissue.
CaMKII is the major protein in post-synaptic density (PSD), constituting 2-6% of
total PSD protein (Chen et al., 2005). The enzyme is essential for the induction of long-
term potentiation (LTP) (Malenka et al., 1989). Activity-dependent plasticity mechanisms
such as LTP are believed to play important roles in learning and memory (Lisman et al.,
2002; Martin et al., 2000; Mayford et al., 2012). Active CaMKII up-regulates AMPA
receptor gating and trafficking, and alters dendritic spine volume via an interaction with
cytoskeleton components (Hayashi et al., 2000; Kristensen et al., 2011; Lu et al., 2010;
Rongo, 2002). In mammals an up-regulation of CaMKII-’s expression coincides with
the restriction of dendritic neuronal arborizations in developing optic tectum (Wu and
Cline, 1998; Zou and Cline, 1999), hippocampus (Ahmed et al., 2006) and dorsal horn
neurons (Pattinson et al., 2006). Moreover, mice that are heterozygous for null mutation

165
in CaMKII- gene show severe deficit in working memory, profound dysregulation of
gene expression in the dentate gyrus, and aberrant cellular and synaptic physiology that is
indicative of immature cells (Yamasaki et al., 2008). In the hippocampus, CaMKII- is
initially expressed at relatively low levels, and increases to adult levels within 2-3 weeks
after birth, (Burgin et al., 1990; Kelly and Vernon, 1985). Thus, CaMKII- plays a
significant role during development and disruption of its function can lead to aberrant
cellular behavior and physiology, as well as deficit in learning and memory in adult
animals.
I used two independent morpholinos to knockdown the production of CaMKII-α. The
first was a translation blocking morpholino that had been used in previous studies and
that was independently verified via CaMKII peptide assay, to knockdown CaMKII-α
(Francescatto et al., 2010). The second was a splice-blocking morpholino that was used to
prevent the proper splicing of CaMKII-α pre-mRNA. My attempts to determine CaMKII-
protein expression in the embryonic zebrafish were not successful. Although the
immunoblots using an anti-CaMKII antibody detected the protein from adult zebrafish
CNS tissue, it failed to do so in embryonic tissue; possibly due to the difference in the
isoforms expressed in embryonic and adult zebrafish. Both of these morpholinos gave
almost identical results in all aspects of my study. Moreover, the splice-blocking
morpholino resulted in a decrease in CaMKII-α mRNA ascertained by RT-PCR, and an
increase in dendritic branching of the M-cell; a result that essentially mirrors findings in
other systems (Pattinson et al., 2006; Wu and Cline, 1998; Zou and Cline, 1999). Thus, I
am confident that CaMKII-α was knocked down in my studies, and that my findings

166
represent an effect resulting from a reduction in the expression of CaMKII-α during
development.
6.3 Morphology and touch response
My immunohistochemical data show an increase in the number of dendritic branches
associated with the ventral dendrite of splice-blocked morphants compared with control-
injected fish. The increased branches were evident on the ventral dendrites and in some
cases, directly from the M-cell body. These findings are similar to those in developing
optic tectum, hippocampus and dorsal horn neurons, where reduced CaMKII activity or
expression leads to an increase in dendritic arborization.
To determine if knockdown of CaMKII- affected behavior, I examined the c-start
escape response of the organism, which requires activation of the M-cell. My results
indicate the morpholino knockdown of CaMKII-prolonged the time course of the c-
start in the translation-blocked morphants, although the splice-blocked embryos were not
affected. Both morphants took longer time for the second bend of the trunk, which
represents the onset of swimming away from the stimulus after the c-start. The c-start
occurs via the strong activation of the Mauthner cell largely brought about through
electrical transmission and fast glutamatergic chemical transmission. Although I found no
change in synaptic AMPAR currents, NMDAR currents were significantly affected in
morphants embryos. Moreover, knock down of camk2a altered dendritic morphology in
the M-cell, and possibly in the other neurons on the escape network as well. Therefore, it
is not surprising that the c-start escape response is disrupted in the morphants.

167
Additionally, about 50% of the splice-blocked fish showed some type of abnormal
response by either not responding to the stimulus, or by responding with a sharp c-start
followed by a relaxation of the tail, rather than swimming movements. Taken together,
these data suggest that knockdown of CaMKII- leads to abnormal escape response in
embryonic zebrafish.
6.4 AMPA mEPSCs are not affected in CaMKII- morphants
CaMKII is an important regulator of synaptic strength of AMPA receptors. It is
well established that CaMKII is essential for induction of hippocampus-dependent long
term potentiation (LTP), which depends on an increase in AMPA transmission following
activation of NMDARs and subsequent rise in intracellular Ca2+
(Nicoll and Roche,
2013). Early evidence showed that application of CaMKII inhibitors prevented LTP
induction. For example, injection of a synthetic peptide that mimics the autoinhibitory
domain of CaMKII, blocked LTP (Malinow et al., 1989), while delivery of a
constitutively active form of CaMKII increased the amplitude of spontaneous AMPA
mEPSCs and occluded further synaptic enhancement by LTP protocol (Lledo et al.,
1995). CaMKII- increases synaptic AMPAR strength by increasing receptor number
(Hayashi et al., 2000; Opazo et al., 2010) and channel conductance (Barria et al., 1997b;
Benke and Isaac, 1998; Derkach et al., 1999; Kristensen et al., 2011). The GluA1 subunit
of AMPARs contains two phosphorylation sites for CaMKII: S831, which is also
phosphorylated by protein kinase c (PKC), and S567. Evidence suggests that
phosphorylation of S831 by CaMKII during the early stages of LTP, increases AMPAR
conductance (Barria et al., 1997a). For instance, pseudophosphorylation of this site

168
inhibits the increase in conductance when active CaMKII is expressed, and single
channel recordings show that S831 phosphorylation enhances the probability of
activation of the high conductance states of the AMPARs, rather than increasing the
magnitude of any conductance states. Delivery of AMPARs to the synaptic site is a
multistep process that includes trafficking of the receptors to the membrane from an
intracellular pool, and capturing of the membrane receptors into synaptic sites during
increased activity (Opazo and Choquet, 2011). Inhibition of CaMKII by KN 62 partially
blocks exocytosis of AMPARs (Patterson et al., 2010). Finally, the capture of AMPARs
is also blocked by inhibition of CAMKII (Opazo et al., 2010).
Since CaMKII plays a vital role in the upregulation of AMPARs in mammals, I
conducted experiments to test if CaMKII- also mediates activity dependent
enhancement of AMPAR transmission in zebrafish. My results are in general in
agreement with the published literature. I used an elevated K+ solution to induce cellular
depolarization for 5-10 minutes. Comparison of AMPAR mEPSCs recorded before and
after depolarization revealed that the amplitude and frequency of the mEPSCs increased
significantly following cellular depolarization. To assess whether CaMKII was involved
in this process, I used two different pharmacological blockers to inhibit CaMKII activity.
One of the blockers, KN 62 binds to the calmodulin binding site of CaMKII, thereby
blocking the enzyme’s interaction with calmodulin and its subsequent activation
(Tokumitsu et al., 1990). However, KN 62 does not inhibit CaMKII that is already
autophosphosphorylated and thus functions independently of Ca2+
/calmodulin binding.
The second blocker, autocamtide-2-related inhibitory peptide (AIP), is a synthetic peptide

169
that is modeled after the autoinhibitory region of the enzyme and does not compete with
calmodulin. Thus, KN-62 and AIP have different modes of action and yet were both able
to block the depolarization induced increase in AMPA mEPSC amplitude. The inhibitors
did not affect mEPSC frequency, as expected from their intracellular application into the
postsynaptic cell.
Application of constitutively active CaMKII to CA1 hippocampal pyramidal cells
increases AMPA receptor mediated synaptic transmission (Lledo et al., 1995). I used a
truncated form of rat CaMKII- monomer to further examine the effect of the enzyme on
AMPAR mEPSCs directly but did not find any significant effect on the properties of the
mEPSCs, possibly because I used a rat derived enzyme that may not be effective in
zebrafish. Even though there are similarities between rat and zebrafish CaMKII-, the
amino acid sequences are not identical. Additionally, I only maintained the whole cell
patch for 10 minutes, but longer incubation times may be required to see an effect of
intracellularly applied CaMKII-.
My primary objective was to examine the role of CaMKII- in the development of
AMPARs. AMPARs switch subunits during embryonic development (Patten and Ali,
2007, 2009). Given that CaMKII- plays important roles in the activity-dependent
trafficking of AMPARs, I hypothesized that CAMKII- is also involved in the
developmental regulation of the AMPAR s. To explore a developmental role of CaMKII-
, I reduced its expression in zebrafish embryos by injecting two different morpholinos
and obtained AMPAR mediated mEPSC recordings from morphant and control embryos.

170
AMPAR mEPSCs in morphant fish were not different from controls. This was
unexpected since CaMKII-α upregulates AMPA trafficking and acute block of its activity
reduces current amplitude. However, my RT-PCR results indicate that there is about 60%
knockdown of CaMKII-α mRNA in the splice-blocking morphants, suggesting that the
~40% production of CaMKII-α may be enough to ensure normal development of
AMPARs. Alternatively, CaMKII may only be involved in activity-dependent trafficking
and play insignificant role in the developmental regulation of AMPARs in zebrafish.
Previous findings in the Ali lab indicate that the enzyme PKC is involved in both acute
and developmental trafficking of GluA2-containing AMPA receptors into membranes
(Patten and Ali, 2007, 2009; Patten et al., 2010). Thus, it is possible that while CaMKII-
is important for acute trafficking of AMPRS, it is primarily PKC that regulates
developmental trafficking of AMPARs.
6.5 NMDA receptor development
CaMKII is capable of binding to the GluN2B subunit of NMDARs at two
potential sites: the first is present within residues 1290-1309 while the second is found
within residues 839-1120 (Bayer et al., 2001; Leonard et al., 1999; Strack and Colbran,
1998a; Strack et al., 2000). When CaMKII is activated, this interaction allows for its
localization at synapses (Bayer et al., 2006). Since CaMKII physically interacts with
NMDARs, I wondered whether knockdown of CaMKII-α might affect NMDAR activity
at developing synapses. I found that this was indeed the case as NMDA receptor currents
were reduced in the CaMKII-α morphants compared with morphant controls. Averaged
NMDA miniature currents in both uninjected controls and morphant controls displayed a

171
clear bi-exponential decay in which fast was around 35 ms, and slow about 330 ms. These
time courses correspond well with published values in which mammalian forms of
GluN1/GluN2A receptors decay with a time course of ~30 ms and GluN1/2B or
GluN1/2C receptors decay with a time course of ~300 ms (Paoletti et al., 2013).
Therefore, it is tempting to speculate that zebrafish express GluN1/2A and either the
GluN1/2B or 2C types NMDA receptors, but I was unable to make this determination
based on the present study. Additional experiments using antibodies targeted against
GluN subunits, using single cell qRT-PCR or using probes for in situ-hybridization might
allow for the identification of the NMDAR subunits associated with the M-cells.
A reduction in the amplitude of the slow component without affecting fast suggests
that there might be fewer functional GluN2B or 2C containing receptors when CaMKII-
levels are reduced. The double exponential decay of my averaged NMDAR mEPSCs
could occur through a number of scenarios. First, an individual synapse may contain a
single subtype of receptor that experiences complex kinetics as the channels close;
second, there may be more than one receptor subtype present at a single synapse, each
with its own characteristic decay constant, and third, an individual synapse may contain a
single type of NMDAR, but there are different NMDARs at different synapses. An
examination of the electrophysiological recordings indicates that individual mEPSCs
decayed with bi-exponential time courses on the order of 30 ms (fast) and 300 ms (slow)
suggesting that individual synapses likely contain multiple NMDA receptor subtypes.

172
Why is the mEPSC amplitude reduced by knockdown of CaMKII-α, and specifically,
why is the slow component preferentially affected in the morphants? The simplest
explanation is that slow occurs due to the presence of the GluN2B subunit (which binds
CaMKII-α), and that an association between the two is required for proper targeting,
trafficking or function of 2B containing NMDARs during development. CaMKII has
been postulated to play a non-enzymatic role due to its extremely high abundance and
density in the PSD (Erondu and Kennedy, 1985; Petersen et al., 2003). It acts as a
scaffold to recruit proteasomes to dendritic spines, where proteasomal degradation
regulates activity-induced spine outgrowth (Bingol et al., 2010; Hamilton et al., 2012). A
second possibility underlying the effect of CaMKII-α on the slow decay component
relates to the ability of calmodulin to directly bind to and regulate NMDA receptor
activity (Ehlers et al., 1996; Wyszynski et al., 1997; Zhang et al., 1998). Calmodulin
regulates NMDA receptors by binding to the C0 region of the GluN1 subunit (Ehlers et
al., 1996). Therefore, a reduction in CaMKII level could potentially lead to an increased
availability of calmodulin, which down-regulates NMDA receptor activity.
6.6 Role of CaMKII- in synaptic GABAA receptor current development
The GABA system plays crucial roles in regulating and controlling neural networks
and ionotropic GABAARs are key targets for the treatment of disorders such as
schizophrenia, autism, epilepsy and depression (Rudolph and Mohler, 2014). Here I
provide electrophysiological evidence that GABAA responses from 48 hpf zebrafish
Mauthner cells can be classified into 3 separate groups based on mIPSC decay kinetics.
Group I decays with a single exponential time course around 40-60 ms, but appears to

173
range from a low of ~10 ms to a high of approximately 100 ms. The second group (group
II) is markedly longer, with decay kinetics peaking at 120-160 ms, but ranges as high as
280 ms. The third group (group III) consists of events which decay with 2 separate time
courses, 1 and 2, where 1 = 28.7±2.5 ms and 2 = 153±11 ms. I assigned events to the
first two groups based on the distribution in Fig 5.3A; however, it is possible that all of
the single decaying events belong to a single population with quite variable kinetics.
Indeed, as much as 40% of the variability in the decay of GABAAR-mediated currents
may be due to quantal charge differences and variations in transmitter concentration
(Nusser et al., 2001). However, the decay times of the group I and group II events that we
have observed are about 3 fold different from each other (50 ms vs 150 ms), suggesting
that their differences are due to more than just variations in transmitter concentration.
About 15% of the GABA mIPSCs from the M-cells display a double exponential
decay. mIPSCs that exhibit slow rise times and bi-exponential decays may occur due to
spillover of GABA onto extrasynaptic receptors (Ferando and Mody, 2013). However,
many of the bi-exponential events had fast rise times implying that they were due to the
activation of synaptic rather than extrasynaptic GABAARs.
The kinetic properties of the fast GABAA-mediated events from M-cells are
quantitatively similar to those recorded from hippocampus, neocortex, pyramidal and
cerebellar granule (Banks and Pearce, 2000; Hajos and Mody, 1997; Houston et al., 2008;
Hutcheon et al., 2000; Sceniak and Maciver, 2008) where the single decay time courses
generally range from ~4 ms to ~60 ms. The slow GABAA events from zebrafish M-cells

174
decay with a time course (~150 ms) that is longer than those found in the literature and it
will be necessary, although difficult, to determine the exact subunit identity of the
GABAARs in zebrafish. The majority of the inhibitory input onto M-cells of 48 hpf
zebrafish occurs due to glycinergic activity, whereby the mIPSCs have a greater
amplitude, a faster time course and occur at a frequency that is ~500-fold greater than the
GABA events (Ali et al., 2000b), suggesting that the glycinergic inputs are
developmentally more advanced compared to the GABA inputs.
The and subunits of GABAA receptors are major substrates for CaMKII-
phosphorylation (McDonald and Moss, 1994). Depending on receptor subunit
composition and localization at the synaptic or extrasynaptic sites, CaMKII- shows
differential regulation of GABA IPSCs. In hippocampus, CaMKII- increases GABAA
IPSC by recruiting receptors to the cell surface (Wei et al., 2004). In cultured rat
cerebellar granule neurons, application of constitutively active CaMKII- increases IPSC
amplitude of β2 subunit-containing GABAA receptors. In contrast, active CaMKII-
increases only the duration of IPSCs but not amplitude in β3 subunit-containing receptor
IPSCs (Houston and Smart, 2006). It was proposed that phosphorylation by CaMKII-
modulates IPSC decay kinetics at synaptic GABAA receptors that contain predominantly
the β3 subunit (Herd et al., 2008). Increases in IPSC amplitude may result from CaMKII-
mediated synaptic recruitment of extrasynaptic GABAA receptors that are primarily
composed of the β2 subunit. My findings from the morpholino knockdown experiments
are in line with the existing literature. It is possible that the reduction I observed in the

175
time course of single decay fast events (Group I) is a consequence of decreased β3
subunit phosphorylation in CaMKII- morphants.
6.7 Development of glycine receptor current
Fast inhibitory neurotransmission in embryonic zebrafish M-cells is mediated
primarily through inotropic glycine receptors (GlyRs). GlyRs are expressed in a
developmentally regulated pattern in the CNS, where they continuously move along the
plasma membrane by lateral diffusion, and anchor at the postsynaptic sites by binding to
the scaffolding protein gephyrin. Formation and maturation of functional GlyR synapses
require clustering of these receptors at the postsynaptic membrane following neuronal
activity and Ca2+
influx (Kirsch and Betz, 1998). Inhibition of CaMKII in cultured
neurons impairs clustering of GlyR at postsynaptic sites (Charrier et al., 2010).
Conversely, intracellular application of activated CaMKII- enhances glycine currents in
spinal neurons (Wang and Randic, 1996). Inhibition of CaMKII in zebrafish perturbs
GlyR clustering (Yamanaka et al., 2013). Specifically, application of a CaMKII-specific
inhibitor, KN-93, to the developing embryo, as well as transgenic expression of a
CaMKII inhibitory peptide, autocamtider-2-related inhibitory peptide 2 (AIP2), in
zebrafish M-cells impair GlyR clustering. The maturation of GlyRs in mammals leads to
a progressive decrease in the duration of glycinergic inhibitory response, which has been
proposed to result from switching of slower 2 subunits for faster 1 subnuits (Krupp et
al., 1994; Singer et al., 1998; Takaishi et al., 1992). Embryonic zebrafish also show
developmental upregulation of glycine receptor kinetics (Ali et al., 2000b). For example,
between 30-40 hpf and >50 hpf of development, the frequency of GlyR mediated mIPSCs
176
increased greatly, concurrent with a significant decrease in the decay kinetics, where the
off kinetics of Fast component fell about 55% and the Slow component reduced by 28%.
The mean amplitude of the events, although varied, was similar for the different groups.
I recorded spontaneous GlyR mIPSCs from CaMKII- morphant embryos and
compared them to the mIPSCs obtained from control embryos. Knockdown of CaMKII-
had no effect on the amplitude, frequency or rise times of the mIPSCs (Figure 5.9B, C;
5.10B). Given that CaMKII regulates GlyR clustering, it was surprising that the
amplitude or frequency of the mIPSCs was not affected in the morphants. However,
immune-electron micsroscopic observation of zebrafish M-cells showed that glycinergic
synapses on the cell body and dendrites are already mature in 2 dpf embryos, although
dendritic endings contained synapses with immature appearances (Triller et al., 1997).
Thus, the majority GlyR synapses in morphants are probably already established by 2
dpf, leading to mIPSC frequencies and amplitudes similar to those from the control
embryos. Additionally, I reduced the expression of CaMKII- but did not confirm the
possible upregulation of any other isoforms of CaMKII that could account for the
continued clustering of GlyRs. Moreover, only ~50% CaMKII knockdown may not have
been enough to affect GlyR clustering. Certainly further experiments are needed to more
closely examine the effects of either knocking down or knocking out the expression of
CaMKII- on synaptic inhibitory receptors.
The morphants in my study however exhibited significantly longer decay time
constants for both the fast and slow components compared to the controls (Figure 5.12).

177
Specifically, the decay times of the fast and slow components of mIPSCs in the
morphants were about 33% and 31% greater than the control groups respectively. This
result is in line with previous finding that decay time of GlyRs change with the
progression of development (Ali et al., 2000b). The longer decay time in the morphants
suggest that maturation of GlyRs in these organisms may have been delayed.
178
6.8 Future research
To further explore the roles of CaMKII- in the development of Mauthner cell
excitability properties and general neurodevelopment of zebrafish brain, the following
areas of research could be addressed in future:
1. Generation of CaMKII- knockouts via CRISPR technology. In this study I used
morpholinos to reduce the levels of CaMKII-, but producing a knockout would have
several advantages if the animals are viable and survive beyond the first week of
development. In particular, a knockout would likely result in the total absence of
CaMKII- rather than a ~50% reduction in levels. Moreover, morpholinos may have
non-specific, off-target effects and a knockout would hopefully alleviate errors due to any
non-specific activity. Synaptic activity should be examined in the knockouts to confirm
the morpholino results.
2. An examination of the excitability properties of the M-cells to determine if these
have also been affected in the morphants, and in the knockouts (if they are available).
Action potentials from M-cell could be recorded in whole-cell current clamp
configuration. Zebrafish M-cells fire single action potential when depolarized to
threshold but can fire multiple times at the onset of suprathreshold stimuli (Brewster and
Ali, 2013). To assess the effect of CaMKII- on neuronal excitability, action potential
peak amplitude, afterhyperpolarization amplitude, half width, voltage threshold and input
current threshold could be analyzed and compared between morphants and control
embryos. Based on my previous findings, I hypothesize that CaMKII- morphants will

179
demonstrate altered firing properties due to synaptic and morphological changes of M-
cell.
3. Examining the role of CaMKII- in neuronal development in CNS. CaMKII-
regulates structural development of neurons. Neuronal development could be monitored
in zebrafish brain using Isl1-GFP transgenic zebrafish embryos and
immunohistochemistry as described previously (Hanington et al., 2008). Briefly, the Isl1-
GFP transgenic zebrafish line could be used to assess sensory and motor neuron
development. These embryos express GFP in motor neurons (Higashijima et al., 2000). In
addition, immunohistochemistry using anti-acetylated tubulin antibody, which stains
mature neurites could be used for sensory neuron development (Chitnis and Kuwada,
1990). Based on my recent finding, I hypothesize that CaMKII- morphants will show
reduced stabilization of the dendritic structures and impairment in network integration of
the neurons.
4. A determination of which NMDAR subunits comprise the NMDARs during
development. My data suggest that the synaptic NMDARs in 48 hpf M-cells are
composed of GluN1+GluN2A subunits and GluN1+GluN2B/C subunits, but the exact
identities have not been confirmed. Use of immunohistochemical techniques,
pharmacological studies, in-situ hybridization and RT-qPCR might help confirm the
identity of NMDARs on the M-cell. To electrophysiologically characterize zebrafish
NMDA receptors, various drugs such as CP-101 that blocks GluN2B containing
receptors, TCN-201 that blocks GluN2A containing receptors and CIQ that potentiates

180
GluN2C/2D containing receptors could be used. Immunohistochemistry using antibodies
targeting different subunits of the NMDARs could also be used to visualize localization
of the receptors. Expression pattern of the NMDAR subunits could be examined by in
situ hybridization and RT-qPCR. Finally, heterologous expression systems could be used
to characterize subunit specific zebrafish NMDAR currents.

181
References
Ahmed, R., Zha, X.M., Green, S.H., and Dailey, M.E. (2006). Synaptic activity and F-
actin coordinately regulate CaMKIIalpha localization to dendritic postsynaptic
sites in developing hippocampal slices. Molecular and Cellular Neuroscience 31,
37-51.
Ali, D.W., Buss, R.R., and Drapeau, P. (2000a). Properties of miniature glutamatergic
EPSCs in neurons of the locomotor regions of the developing zebrafish. Journal
of Neurophysiology 83, 181-191.
Ali, D.W., Drapeau, P., and Legendre, P. (2000b). Development of spontaneous
glycinergic currents in the Mauthner neuron of the zebrafish embryo. Journal of
Neurophysiology 84, 1726-1736.
An, M., Luo, R., and Henion, P.D. (2002). Differentiation and maturation of zebrafish
dorsal root and sympathetic ganglion neurons. Journal of Comparative Neurology
446, 267-275.
Anggono, V., and Huganir, R.L. (2012). Regulation of AMPA receptor trafficking and
synaptic plasticity. Current Opinion in Neurobiology 22, 461-469.
Arruda-Carvalho, M., Restivo, L., Guskjolen, A., Epp, J.R., Elgersma, Y., Josselyn, S.A.,
and Frankland, P.W. (2014). Conditional deletion of alpha-CaMKII impairs
integration of adult-generated granule cells into dentate gyrus circuits and
hippocampus-dependent learning. Journal of neuroscience 34, 11919-11928.
Baer, K., Essrich, C., Benson, J.A., Benke, D., Bluethmann, H., Fritschy, J.M., and
Luscher, B. (1999). Postsynaptic clustering of gamma-aminobutyric acid type A
receptors by the gamma3 subunit in vivo. Proceedings of the National Academy
of Sciences of the United States of America 96, 12860-12865.
Banks, M.I., and Pearce, R.A. (2000). Kinetic differences between synaptic and
extrasynaptic GABA(A) receptors in CA1 pyramidal cells. Journal of
Neuroscience 20, 937-948.
Barnes, J.M., Dev, K.K., and Henley, J.M. (1994). Cyclothiazide unmasks AMPA-
evoked stimulation of [3H]-L-glutamate release from rat hippocampal
synaptosomes. British Journal of Pharmacology 113, 339-341.
Barria, A., Derkach, V., and Soderling, T. (1997a). Identification of the
Ca2+/calmodulin-dependent protein kinase II regulatory phosphorylation site in
the alpha-amino-3-hydroxyl-5-methyl-4-isoxazole-propionate-type glutamate
receptor. Journal of Biological Chemistry 272, 32727-32730.

182
Barria, A., and Malinow, R. (2005). NMDA receptor subunit composition controls
synaptic plasticity by regulating binding to CaMKII. Neuron 48, 289-301.
Barria, A., Muller, D., Derkach, V., Griffith, L.C., and Soderling, T.R. (1997b).
Regulatory phosphorylation of AMPA-type glutamate receptors by CaM-KII
during long-term potentiation. Science 276, 2042-2045.
Bayer, K.U., De Koninck, P., Leonard, A.S., Hell, J.W., and Schulman, H. (2001).
Interaction with the NMDA receptor locks CaMKII in an active conformation.
Nature 411, 801-805.
Bayer, K.U., LeBel, E., McDonald, G.L., O'Leary, H., Schulman, H., and De Koninck, P.
(2006). Transition from reversible to persistent binding of CaMKII to
postsynaptic sites and NR2B. Journal of Neuroscience 26, 1164-1174.
Bayer, K.U., Lohler, J., Schulman, H., and Harbers, K. (1999). Developmental expression
of the CaM kinase II isoforms: ubiquitous gamma- and delta-CaM kinase II are
the early isoforms and most abundant in the developing nervous system.
Molecular Brain research 70, 147-154.
Ben-Ari, Y. (2002). Excitatory actions of gaba during development: the nature of the
nurture. Nature Reviews Neuroscience 3, 728-739.
Ben-Ari, Y., Khalilov, I., Kahle, K.T., and Cherubini, E. (2012). The GABA
excitatory/inhibitory shift in brain maturation and neurological disorders.
Neuroscientist 18, 467-486.
Bengtsson, M., Ståhlberg, A., Rorsman, P., and Kubista, M. (2005). Gene expression
profiling in single cells from the pancreatic islets of Langerhans reveals
lognormal distribution of mRNA levels. Genome Research 15, 1388-1392.
Benke, T.A., and Isaac, J.T.R. (1998). Modulation of AMPA receptor unitary
conductance by synaptic activity. Nature 393, 793-797.
Bernhardt, R.R., Chitnis, A.B., Lindamer, L., and Kuwada, J.Y. (1990). Identification of
spinal neurons in the embryonic and larval zebrafish. Journal of Comparative
Neurology 302, 603-616.
Betz, H., and Laube, B. (2006). Glycine receptors: Recent insights into their structural
organization and functional diversity. Journal of Neurochemistry 97, 1600-1610.
Bill, B.R., Petzold, A.M., Clark, K.J., Schimmenti, L.A., and Ekker, S.C. (2009). A
primer for morpholino use in zebrafish. Zebrafish 6, 69-77.
Bingol, B., Wang, C.F., Arnott, D., Cheng, D., Peng, J., and Sheng, M. (2010).
Autophosphorylated CaMKIIalpha acts as a scaffold to recruit proteasomes to
dendritic spines. Cell 140, 567-578.

183
Blake, W.J., M, K.A., Cantor, C.R., and Collins, J.J. (2003). Noise in eukaryotic gene
expression. Nature 422, 633-637.
Brewster, D.L., and Ali, D.W. (2013). Expression of the voltage-gated potassium channel
subunit Kv1.1 in embryonic zebrafish Mauthner cells. Neuroscience Letters 539,
54-59.
Brocke, L., Chiang, L.W., Wagner, P.D., and Schulman, H. (1999). Functional
implications of the subunit composition of neuronal CaM kinase II. Journal of
Biological Chemistry 274, 22713-22722.
Burgess, H.A., and Granato, M. (2007). Sensorimotor gating in larval zebrafish. Journal
of Neuroscience 27, 4984-4994.
Burgin, K.E., Waxham, M.N., Rickling, S., Westgate, S.A., Mobley, W.C., and Kelly,
P.T. (1990). In situ hybridization histochemistry of Ca2+/calmodulin-dependent
protein kinase in developing rat brain. Journal of Neuroscience 10, 1788-1798.
Cai, L., Friedman, N., and Xie, X.S. (2006). Stochastic protein expression in individual
cells at the single molecule level. Nature 440, 358-362.
Capogna, M., and Pearce, R.A. (2011). GABA A,slow: causes and consequences. Trends
in Neurosciences 34, 101-112.
Celio, M.R., Gray, E.G., and Yasargil, G.M. (1979). Ultrastructure of the Mauthner axon
collateral and its synapses in the goldfish spinal cord. Journal of Neurocytology 8,
19-29.
Chang, S., and De Camilli, P. (2001). Glutamate regulates actin-based motility in axonal
filopodia. Nature Neuroscience 4, 787-793.
Chang, Y.T., Lin, J.W., and Faber, D.S. (1987). Spinal inputs to the ventral dendrite of
the teleost Mauthner cell. Brain Research 417, 205-213.
Charrier, C., Machado, P., Tweedie-Cullen, R.Y., Rutishauser, D., Mansuy, I.M., and
Triller, A. (2010). A crosstalk between beta1 and beta3 integrins controls glycine
receptor and gephyrin trafficking at synapses. Nature Neuroscience 13, 1388-
1395.
Chen, X., Vinade, L., Leapman, R.D., Petersen, J.D., Nakagawa, T., Phillips, T.M.,
Sheng, M., and Reese, T.S. (2005). Mass of the postsynaptic density and
enumeration of three key molecules. Proceedings of the National Academy of
Sciences of the United States of America 102, 11551-11556.
Chitnis, A.B., and Kuwada, J.Y. (1990). Axonogenesis in the brain of zebrafish embryos.
Journal of Neuroscience 10, 1892-1905.

184
Citri, A., and Malenka, R.C. (2008). Synaptic plasticity: multiple forms, functions, and
mechanisms. Neuropsychopharmacology 33, 18-41.
Cline, H.T. (2001). Dendritic arbor development and synaptogenesis. Current Opinion in
Neurobiology 11, 118-126.
Colbran, R.J. (2004a). Protein phosphatases and calcium/calmodulin-dependent protein
kinase II-dependent synaptic plasticity. Journal of Neuroscience 24, 8404-8409.
Colbran, R.J. (2004b). Targeting of calcium/calmodulin-dependent protein kinase II.
Biochemical Journal 378, 1-16.
Collingridge, G.L., Olsen, R.W., Peters, J., and Spedding, M. (2009). A nomenclature for
ligand-gated ion channels. Neuropharmacology 56, 2-5.
Corringer, P.J., Le Novere, N., and Changeux, J.P. (2000). Nicotinic receptors at the
amino acid level. Annual Review of Pharmacology and Toxicology 40, 431-458.
Coultrap, S.J., and Bayer, K.U. (2012). CaMKII regulation in information processing and
storage. Trends in Neurosciences 35, 607-618.
Cox, J.A., Kucenas, S., and Voigt, M.M. (2005). Molecular characterization and
embryonic expression of the family of N-methyl-D-aspartate receptor subunit
genes in the zebrafish. Developmental Dynamics 234, 756-766.
Dahan, M., Levi, S., Luccardini, C., Rostaing, P., Riveau, B., and Triller, A. (2003).
Diffusion dynamics of glycine receptors revealed by single-quantum dot tracking.
Science 302, 442-445.
Deidda, G., Bozarth, I.F., and Cancedda, L. (2014). Modulation of GABAergic
transmission in development and neurodevelopmental disorders: investigating
physiology and pathology to gain therapeutic perspectives. Frontiers in Cellular
Neuroscience 8, 119.
Derkach, V., Barria, A., and Soderling, T.R. (1999). Ca2+/calmodulin-kinase II enhances
channel conductance of alpha-amino-3-hydroxy-5-methyl-4-isoxazolepropionate
type glutamate receptors. Proceedings of the National Academy of Sciences of the
United States of America 96, 3269-3274.
Dhanasekaran, S., Doherty, T.M., and Kenneth, J. (2010). Comparison of different
standards for real-time PCR-based absolute quantification. Journal of
Immunological Methods 354, 34-39.
Doldan, M.J., Prego, B., Holmqvist, B.I., and de Miguel, E. (1999). Distribution of
GABA-immunolabeling in the early zebrafish (Danio rerio) brain. European
Journal of Morphology 37, 126-129.

185
Drapeau, P., Ali, D.W., Buss, R.R., and Saint-Amant, L. (1999). In vivo recording from
identifiable neurons of the locomotor network in the developing zebrafish. Journal
of Neuroscience Methods 88, 1-13.
Dutertre, S., Becker, C.M., and Betz, H. (2012). Inhibitory glycine receptors: An update.
Journal of Biological Chemistry.287, 40216-40223.
Eaton, R.C., Bombardieri, R.A., and Meyer, D.L. (1977). The Mauthner-initiated startle
response in teleost fish. Journal of Experimental Biology 66, 65-81.
Eaton, R.C., DiDomenico, R., and Nissanov, J. (1988). Flexible body dynamics of the
goldfish C-start: implications for reticulospinal command mechanisms. Journal of
Neuroscience 8, 2758-2768.
Eaton, R.C., and Farley, R.D. (1973). Development of the Mauthner Neurons in Embryos
and Larvae of the Zebrafish. Copeia 4, 673-682.
Eaton, R.C., Lee, R.K.K., and Foreman, M.B. (2001). The Mauthner cell and other
identified neurons of the brainstem escape network of fish. Progress in
Neurobiology 63, 467-485.
Ehlers, M.D., Zhang, S., Bernhadt, J.P., and Huganir, R.L. (1996). Inactivation of NMDA
receptors by direct interaction of calmodulin with the NR1 subunit. Cell 84, 745-
755.
Eisen, J.S., Myers, P.Z., and Westerfield, M. (1986). Pathway selection by growth cones
of identified motoneurones in live zebra fish embryos. Nature 320, 269-271.
Ekker, S.C. (2000). Morphants: a new systematic vertebrate functional genomics
approach. Yeast 17, 302-306.
Elowitz, M.B., Levine, A.J., Siggia, E.D., and Swain, P.S. (2002). Stochastic gene
expression in a single cell. Science 297, 1183-1186.
Erondu, N.E., and Kennedy, M.B. (1985). Regional distribution of type II
Ca2+/calmodulin-dependent protein kinase in rat brain. Journal of Neuroscience
5, 3270-3277.
Essrich, C., Lorez, M., Benson, J.A., Fritschy, J.M., and Luscher, B. (1998). Postsynaptic
clustering of major GABAA receptor subtypes requires the gamma 2 subunit and
gephyrin. Nature Neuroscience 1, 563-571.
Faber, D.S., and Korn, H. (1975). Inputs from the posterior lateral line nerves upon the
goldfish Mauthner cells. II. Evidence that the inhibitory components are mediated
by interneurons of the recurrent collateral network. Brain Research 96, 349-356.
Farrant, M., and Nusser, Z. (2005). Variations on an inhibitory theme: phasic and tonic
activation of GABA(A) receptors. Nature Reviews Neuroscience 6, 215-229.
186
Feng, B., Raghavachari, S., and Lisman, J. (2011). Quantitative estimates of the
cytoplasmic, PSD, and NMDAR-bound pools of CaMKII in dendritic spines.
Brain Research 1419, 46-52.
Feng, G., Tintrup, H., Kirsch, J., Nichol, M.C., Kuhse, J., Betz, H., and Sanes, J.R.
(1998). Dual requirement for gephyrin in glycine receptor clustering and
molybdoenzyme activity. Science 282, 1321-1324.
Ferando, I., and Mody, I. (2013). Interneuronal GABA receptors inside and outside of
synapses. Current Opinion in Neurobiology 26C, 57-63.
Fetcho, J.R. (1992). Excitation of motoneurons by the Mauthner axon in goldfish:
complexities in a "simple" reticulospinal pathway. Journal of Neurophysiology
67, 1574-1586.
Fetcho, J.R., and O'Malley, D.M. (1995). Visualization of active neural circuitry in the
spinal cord of intact zebrafish. Journal of Neurophysiology 73, 399-406.
Fink, C.C., Bayer, K.U., Myers, J.W., Ferrell, J.E., Jr., Schulman, H., and Meyer, T.
(2003). Selective regulation of neurite extension and synapse formation by the
beta but not the alpha isoform of CaMKII. Neuron 39, 283-297.
Foreman, M.B., and Eaton, R.C. (1993). The direction change concept for reticulospinal
control of goldfish escape. Journal of Neuroscience 13, 4101-4113.
Francescatto, L., Rothschild, S.C., Myers, A.L., and Tombes, R.M. (2010). The activation
of membrane targeted CaMK-II in the zebrafish Kupffer's vesicle is required for
left-right asymmetry. Development 137, 2753-2762.
Furukawa, T., and Furshpan, E.J. (1963). Two inhibitory mechanisms in the Mauthner
neurons of goldfish. Journal of Neurophysiology 26, 140-176.
Gaertner, T.R., Kolodziej, S.J., Wang, D., Kobayashi, R., Koomen, J.M., Stoops, J.K.,
and Waxham, M.N. (2004). Comparative analyses of the three-dimensional
structures and enzymatic properties of alpha, beta, gamma and delta isoforms of
Ca2+-calmodulin-dependent protein kinase II. Journal of Biological Chemistry
279, 12484-12494.
Gahtan, E., and O'Malley, D.M. (2003). Visually guided injection of identified
reticulospinal neurons in zebrafish: a survey of spinal arborization patterns. The
Journal of Comparative Neurology 459, 186-200.
Gahtan, E., Sankrithi, N., Campos, J.B., and O'Malley, D.M. (2002). Evidence for a
widespread brain stem escape network in larval zebrafish. Journal of
Neurophysiology 87, 608-614.
Gallo, V., and Russell, J.T. (1995). Excitatory amino acid receptors in glia: different
subtypes for distinct functions? Journal of Neuroscience Research 42, 1-8.

187
Gallo, V., Upson, L.M., Hayes, W.P., Vyklicky, L., Jr., Winters, C.A., and Buonanno, A.
(1992). Molecular cloning and development analysis of a new glutamate receptor
subunit isoform in cerebellum. Journal of Neuroscience 12, 1010-1023.
Grenningloh, G., Pribilla, I., Prior, P., Multhaup, G., Beyreuther, K., Taleb, O., and Betz,
H. (1990a). Cloning and expression of the 58 kd beta subunit of the inhibitory
glycine receptor. Neuron 4, 963-970.
Grenningloh, G., Schmieden, V., Schofield, P.R., Seeburg, P.H., Siddique, T., Mohandas,
T.K., Becker, C.M., and Betz, H. (1990b). Alpha subunit variants of the human
glycine receptor: primary structures, functional expression and chromosomal
localization of the corresponding genes. The EMBO Journal 9, 771-776.
Grunwald, D.J., Kimmel, C.B., Westerfield, M., Walker, C., and Streisinger, G. (1988).
A neural degeneration mutation that spares primary neurons in the zebrafish.
Developmental Biology 126, 115-128.
Guetg, N., Abdel Aziz, S., Holbro, N., Turecek, R., Rose, T., Seddik, R., Gassmann, M.,
Moes, S., Jenoe, P., Oertner, T.G., et al. (2010). NMDA receptor-dependent
GABAB receptor internalization via CaMKII phosphorylation of serine 867 in
GABAB1. Proceedings of the National Academy of Sciences of the United States
of America 107, 13924-13929.
Hagihara, H., Takao, K., Walton, N.M., Matsumoto, M., and Miyakawa, T. (2013).
Immature dentate gyrus: an endophenotype of neuropsychiatric disorders. Neural
Plasticity 2013, 318596.
Hajos, N., and Mody, I. (1997). Synaptic communication among hippocampal
interneurons: properties of spontaneous IPSCs in morphologically identified cells.
Journal of Neuroscience 17, 8427-8442.
Hamilton, A. M., Oh, W. C., Vega-Ramirez, H., Stein, I. S., Hell, J. W., Patrick, G. N.,
and Zito, K. (2012). Activity-Dependent Growth of New Dendritic Spines Is
Regulated by the Proteasome. Neuron 74, 1023-1030.
Hanington, P.C., Patten, S.A., Reaume, L.M., Waskiewicz, A.J., Belosevic, M., and Ali,
D.W. (2008). Analysis of leukemia inhibitory factor and leukemia inhibitory
factor receptor in embryonic and adult zebrafish (Danio rerio). Developmental
Biology 314, 250-260.
Hardingham, N., Glazewski, S., Pakhotin, P., Mizuno, K., Chapman, P.F., Giese, K.P.,
and Fox, K. (2003). Neocortical long-term potentiation and experience-dependent
synaptic plasticity require alpha-calcium/calmodulin-dependent protein kinase II
autophosphorylation. Journal of Neuroscience 23, 4428-4436.

188
Hayashi, Y., Shi, S.H., Esteban, J.A., Piccini, A., Poncer, J.C., and Malinow, R. (2000).
Driving AMPA receptors into synapses by LTP and CaMKII: Requirement for
GluR1 and PDZ domain interaction. Science 287, 2262-2267.
Hell, J.W. (2014). CaMKII: claiming center stage in postsynaptic function and
organization. Neuron 81, 249-265.
Herd, M.B., Haythornthwaite, A.R., Rosahl, T.W., Wafford, K.A., Homanics, G.E.,
Lambert, J.J., and Belelli, D. (2008). The expression of GABAA beta subunit
isoforms in synaptic and extrasynaptic receptor populations of mouse dentate
gyrus granule cells. Journal of Physiology 586, 989-1004.
Higashijima, S., Hotta, Y., and Okamoto, H. (2000). Visualization of Cranial Motor
Neurons in Live Transgenic Zebrafish Expressing Green Fluorescent Protein
Under the Control of the Islet-1 Promoter/Enhancer. Journal of Neuroscience 20,
206-218.
Hojjati, M.R., van Woerden, G.M., Tyler, W.J., Giese, K.P., Silva, A.J., Pozzo-Miller, L.,
and Elgersma, Y. (2007). Kinase activity is not required for alphaCaMKII-
dependent presynaptic plasticity at CA3-CA1 synapses. Nature Neuroscience 10,
1125-1127.
Hollmann, M., and Heinemann, S. (1994). Cloned glutamate receptors. Annual Review of
Neuroscience 17, 31-108.
Hoppmann, V., Wu, J.J., Soviknes, A.M., Helvik, J.V., and Becker, T.S. (2008).
Expression of the eight AMPA receptor subunit genes in the developing central
nervous system and sensory organs of zebrafish. Developmental Dynamics 237,
788-799.
Hou, Y., Zhang, H., Miranda, L., and Lin, S. (2010). Serious overestimation in
quantitative PCR by circular (supercoiled) plasmid standard: microalgal pcna as
the model gene. PloS One 5, e9545.
Houston, C.M., Hosie, A.M., and Smart, T.G. (2008). Distinct regulation of beta2 and
beta3 subunit-containing cerebellar synaptic GABAA receptors by
calcium/calmodulin-dependent protein kinase II. Journal of Neuroscience 28,
7574-7584.
Houston, C.M., and Smart, T.G. (2006). CaMK-II modulation of GABA(A) receptors
expressed in HEK293, NG108-15 and rat cerebellar granule neurons. European
Journal of Neuroscience 24, 2504-2514.
Hudmon, A., and Schulman, H. (2002). Structure-function of the multifunctional
Ca2+/calmodulin-dependent protein kinase II. Biochemical Journal 364, 593-611.

189
Hutcheon, B., Morley, P., and Poulter, M.O. (2000). Developmental change in GABAA
receptor desensitization kinetics and its role in synapse function in rat cortical
neurons. Journal of Physiology 522 Pt 1, 3-17.
Imboden, M., Devignot, V., Korn, H., and Goblet, C. (2001). Regional distribution of
glycine receptor messenger RNA in the central nervous system of zebrafish.
Neuroscience 103, 811-830.
Ito, I., Hidaka, H., and Sugiyama, H. (1991). Effects of KN-62, a specific inhibitor of
calcium/calmodulin-dependent protein kinase II, on long-term potentiation in the
rat hippocampus. Neuroscience Letters 121, 119-121.
Kawasaki, E.S. (2004). Microarrays and the gene expression profile of a single cell.
Annals of the New York Academy of Sciences 1020, 92-100.
Kelly, P.T., and Vernon, P. (1985). Changes in the subcellular distribution of calmodulin-
kinase II during brain development. Brain Research 350, 211-224.
Kennedy, M.B., Bennett, M.K., and Erondu, N.E. (1983). Biochemical and
immunochemical evidence that the "major postsynaptic density protein" is a
subunit of a calmodulin-dependent protein kinase. Proceedings of the National
Academy of Sciences of the United States of America 80, 7357-7361.
Kimmel, C.B., Ballard, W.W., Kimmel, S.R., Ullmann, B., and Schilling, T.F. (1995).
Stages of embryonic development of the zebrafish. Developmental Dynamics
203, 253-310.
Kimmel, C.B., Hatta, K., and Metcalfe, W.K. (1990). Early axonal contacts during
development of an identified dendrite in the brain of the zebrafish. Neuron 4, 535-
545.
Kimmel, C.B., Sessions, S.K., and Kimmel, R.J. (1981). Morphogenesis and
synaptogenesis of the zebrafish Mauthner neuron. Journal of Comparative
Neurology 198, 101-120.
Kirsch, J., and Betz, H. (1998). Glycine-receptor activation is required for receptor
clustering in spinal neurons. Nature 392, 717-720.
Kohashi, T., and Oda, Y. (2008). Initiation of Mauthner- or non-Mauthner-mediated fast
escape evoked by different modes of sensory input. Journal of Neuroscience 28,
10641-10653.
Kornau, H.C., Schenker, L.T., Kennedy, M.B., and Seeburg, P.H. (1995). Domain
interaction between NMDA receptor subunits and the postsynaptic density protein
PSD-95. Science 269, 1737-1740.
Kristensen, A.S., Jenkins, M.A., Banke, T.G., Schousboe, A., Makino, Y., Johnson, R.C.,
Huganir, R., and Traynelis, S.F. (2011). Mechanism of Ca2+/calmodulin-

190
dependent kinase II regulation of AMPA receptor gating. Nature Neuroscience
14, 727-735.
Krupp, J., Larmet, Y., and Feltz, P. (1994). Postnatal change of glycinergic IPSC decay
in sympathetic preganglionic neurons. Neuroreport 5, 2437-2440.
Kumar, J., and Mayer, M.L. (2013). Functional insights from glutamate receptor ion
channel structures. Annual Review of Physiology 75, 313-337.
Kuwada, J.Y., Bernhardt, R.R., and Nguyen, N. (1990). Development of spinal neurons
and tracts in the zebrafish embryo. Journal of Comparative Neurology 302, 617-
628.
Laurie, D.J., Seeburg, P.H., and Wisden, W. (1992a). The distribution of 13 GABAA
receptor subunit mRNAs in the rat brain. II. Olfactory bulb and cerebellum.
Journal of Neuroscience 12, 1063-1076.
Laurie, D.J., Wisden, W., and Seeburg, P.H. (1992b). The distribution of thirteen
GABAA receptor subunit mRNAs in the rat brain. III. Embryonic and postnatal
development. Journal of Neuroscience 12, 4151-4172.
Lee, H.-K. (2006). Syanptic plasticity and phosphorylation. Pharmacology &
Therapeutics 112, 810-832.
Lee, R.K., Eaton, R.C., and Zottoli, S.J. (1993). Segmental arrangement of reticulospinal
neurons in the goldfish hindbrain. Journal of Comparative Neurology 329, 539-
556.
Legendre, P. (1998). A reluctant gating mode of glycine receptor channels determines the
time course of inhibitory miniature synaptic events in zebrafish hindbrain
neurons. Journal of Neuroscience 18, 2856-2870.
Legendre, P., and Korn, H. (1994). Glycinergic inhibitory synaptic currents and related
receptor channels in the zebrafish brain. European Journal of Neuroscience 6,
1544-1557.
Leonard, A.S., Lim, I.A., Hemsworth, D.E., Horne, M.C., and Hell, J.W. (1999).
Calcium/calmodulin-dependent protein kinase II is associated with the N-methyl-
D-aspartate receptor. Proceedings of the National Academy of Sciences of the
United States of America 96, 3239-3244.
Lewis, K.E., and Eisen, J.S. (2003). From cells to circuits: development of the zebrafish
spinal cord. Progress in Neurobiology 69, 419-449.
Lisman, J., Schulman, H., and Cline, H. (2002). The molecular basis of CaMKII function
in synaptic and behavioural memory. Nature Reviews Neuroscience 3, 175-190.

191
Lisman, J.E., and Zhabotinsky A.M. (2001). A model of synaptic memory: a
CaMKII/PP1 switch that potentiates transmission by organizing an AMPA
receptor anchoring assembly. Neuron 31, 191-201.
Liu, K.S., and Fetcho, J.R. (1999). Laser ablations reveal functional relationships of
segmental hindbrain neurons in zebrafish. Neuron 23, 325-335.
Liu, Q., Chen, B., Ge, Q., and Wang, Z.W. (2007). Presynaptic Ca2+/calmodulin-
dependent protein kinase II modulates neurotransmitter release by activating BK
channels at Caenorhabditis elegans neuromuscular junction. Journal of
Neuroscience 27, 10404-10413.
Lledo, P.M., Hjelmstad, G.O., Mukherji, S., Soderling, T.R., Malenka, R.C., and Nicoll,
R.A. (1995). Calcium/calmodulin-dependent kinase II and long-term potentiation
enhance synaptic transmission by the same mechanism. Proceedings of the
National Academy of Sciences of the United States of America 92, 11175-11179.
Lo Iacono, L., and Gross, C. (2008). Alpha-Ca2+/calmodulin-dependent protein kinase II
contributes to the developmental programming of anxiety in serotonin receptor
1A knock-out mice. Journal of Neuroscience 28, 6250-6257.
Lu, F.M., and Hawkins, R.D. (2006). Presynaptic and postsynaptic Ca(2+) and CamKII
contribute to long-term potentiation at synapses between individual CA3 neurons.
Proceedings of the National Academy of Sciences of the United States of America
103, 4264-4269.
Lu, W., Isozaki, K., Roche, K.W., and Nicoll, R.A. (2010). Synaptic targeting of AMPA
receptors is regulated by a CaMKII site in the first intracellular loop of GluA1.
Proceedings of the National Academy of Sciences of the United States of America
107, 22266-22271.
Lynch, J.W. (2004). Molecular structure and function of the glycine receptor chloride
channel. Physiological Reviews 84, 1051-1095.
Malenka, R.C., Kauer, J.A., Perkel, D.J., Mauk, M.D., Kelly, P.T., Nicoll, R.A.,
Waxham, M.N. (1989). An essential role for postsynaptic calmodulin and protein
kinase activity in long-term potentiation. Nature 340, 554–557
Malinow, R., Schulman, H., and Tsien, R.W. (1989). Inhibition of postsynaptic PKC or
CaMKII blocks induction but not expression of LTP. Science (New York, NY)
245, 862-866.
Malosio, M.L., Marqueze-Pouey, B., Kuhse, J., and Betz, H. (1991). Widespread
expression of glycine receptor subunit mRNAs in the adult and developing rat
brain. EMBO Journal 10, 2401-2409.

192
Marsden, K.C., Shemesh, A., Bayer, K.U., and Carroll, R.C. (2010). Selective
translocation of Ca2+/calmodulin protein kinase IIalpha (CaMKIIalpha) to
inhibitory synapses. Proceedings of the National Academy of Sciences of the
United States of America 107, 20559-20564.
Martin, S. J., Grimwood, P. D., and Morris, R.G.M. (2000). Synaptic plasticity and
memory: an evaluation of the hypothesis. Annual Reviews Neuroscience 23:649–
711.
Mayford, M., Siegelbaum, S.A., and Kandel, E.R. (2012). Synapses and Memory
Storage. Cold Spring Harbor Perspectives in Biology 4, 1-18.
McDonald, B.J., and Moss, S.J. (1994). Differential phosphorylation of intracellular
domains of gamma-aminobutyric acid type A receptor subunits by
calcium/calmodulin type 2-dependent protein kinase and cGMP-dependent
protein kinase. Journal of Biological Chemistry 269, 18111-18117.
Mendelson, B. (1986). Development of reticulospinal neurons of the zebrafish. II. Early
axonal outgrowth and cell body position. Journal of Comparative Neurology 251,
172-184.
Metcalfe, W.K., Myers, P.Z., Trevarrow, B., Bass, M.B., and Kimmel, C.B. (1990).
Primary neurons that express the L2/HNK-1 carbohydrate during early
development in the zebrafish. Development 110, 491-504.
Metzger, F. (2010). Molecular and cellular control of dendrite maturation during brain
development. Current Molecular Pharmacology 3, 1-11.
Mody, I., and Pearce, R.A. (2004). Diversity of inhibitory neurotransmission through
GABA(A) receptors. Trends in Neuroscience 27, 569-575.
Mosbacher, J., Schoepfer, R., Monyer, H., Burnashev, N., Seeburg, P.H., and
Ruppersberg, J.P. (1994). A molecular determinant for submillisecond
desensitization in glutamate receptors. Science 266, 1059-1062.
Mueller, T., Vernier, P., and Wullimann, M.F. (2006). A phylotypic stage in vertebrate
brain development: GABA cell patterns in zebrafish compared with mouse.
Journal of Comperative Neurology 494, 620-634.
Myers, P.Z., Eisen, J.S., and Westerfield, M. (1986). Development and axonal outgrowth
of identified motoneurons in the zebrafish. Journal of Neuroscience 6, 2278-2289.
Nakayama, H., and Oda, Y. (2004). Common sensory inputs and differential excitability
of segmentally homologous reticulospinal neurons in the hindbrain. Journal of
Neuroscience 24, 3199-3209.
Nasevicius, A., and Ekker, S.C. (2000). Effective targeted gene 'knockdown' in zebrafish.
Nature Genetics 26, 216-220.

193
Nicoll, R.A., and Roche, K.W. (2013). Long-term potentiation: peeling the onion.
Neuropharmacology 74, 18-22.
Niethammer, M., Kim, E., and Sheng, M. (1996). Interaction between the C terminus of
NMDA receptor subunits and multiple members of the PSD-95 family of
membrane-associated guanylate kinases. Journal of Neuroscience 16, 2157-2163.
Nusser, Z., Naylor, D., and Mody, I. (2001). Synapse-specific contribution of the
variation of transmitter concentration to the decay of inhibitory postsynaptic
currents. Biophysical Journal 80, 1251-1261.
O'Leary, H., Lasda, E., and Bayer, K.U. (2006). CaMKIIbeta association with the actin
cytoskeleton is regulated by alternative splicing. Molecular Biology of the Cell
17, 4656-4665.
Okamoto, K., Narayanan, R., Lee, S.H., Murata, K., and Hayashi, Y. (2007). The role of
CaMKII as an F-actin-bundling protein crucial for maintenance of dendritic spine
structure. Proceedings of the National Academy of Sciences of the United States
of America 104, 6418-6423.
Opazo, P., and Choquet, D. (2011). A three-step model for the synaptic recruitment of
AMPA receptors. Molecular and Cellular Neurosciences 46, 1-8.
Opazo, P., Labrecque, S., Tigaret, C.M., Frouin, A., Wiseman, P.W., De Koninck, P., and
Choquet, D. (2010). CaMKII triggers the diffusional trapping of surface
AMPARs through phosphorylation of stargazin. Neuron 67, 239-252.
Pang, Z.P., Cao, P., Xu, W., and Sudhof, T.C. (2010). Calmodulin controls synaptic
strength via presynaptic activation of calmodulin kinase II. Journal of
Neuroscience 30, 4132-4142.
Paoletti, P., Bellone, C., and Zhou, Q. (2013). NMDA receptor subunit diversity: impact
on receptor properties, synaptic plasticity and disease. Nature Reviews
Neuroscience 14, 383-400.
Patten, S.A., and Ali, D.W. (2007). AMPA receptors associated with zebrafish Mauthner
cells switch subunits during development. Journal of Physiology 581, 1043-1056.
Patten, S.A., and Ali, D.W. (2009). PKCgamma-induced trafficking of AMPA receptors
in embryonic zebrafish depends on NSF and PICK1. Proceedings of the National
Academy of Sciences of the United States of America 106, 6796-6801.
Patten, S.A., Roy, B., Cunningham, M.E., Stafford, J.L., and Ali, D.W. (2010). Protein
kinase Cgamma is a signaling molecule required for the developmental speeding
of alpha-amino-3-hydroxyl-5-methyl-4-isoxazole-propionate receptor kinetics.
European Journal of Neuroscience 31, 1561-1573.
194
Patterson, M.A., Szatmari, E.M., and Yasuda, R. (2010). AMPA receptors are exocytosed
in stimulated spines and adjacent dendrites in a Ras-ERK-dependent manner
during long-term potentiation. Proceedings of the National Academy of Sciences
of the United States of America 107, 15951-15956.
Pattinson, D., Baccei, M., Karadottir, R., Torsney, C., Moss, A., McCutcheon, J., Giese,
K.P., and Fitzgerald, M. (2006). Aberrant dendritic branching and sensory inputs
in the superficial dorsal horn of mice lacking CaMKIIalpha autophosphorylation.
Molecular and Cellular Neuroscience 33, 88-95.
Petersen, J.D., Chen, X., Vinade, L., Dosemeci, A., Lisman, J.E., and Reese, T.S. (2003).
Distribution of postsynaptic density (PSD)-95 and Ca2+/calmodulin-dependent
protein kinase II at the PSD. Journal of Neuroscience 23, 11270-11278.
Pi, H.J., Otmakhov, N., El Gaamouch, F., Lemelin, D., De Koninck, P., and Lisman, J.
(2010). CaMKII control of spine size and synaptic strength: role of
phosphorylation states and nonenzymatic action. Proceedings of the National
Academy of Sciences of the United States of America 107, 14437-14442.
Poncer, J.C., Esteban, J.A., and Malinow, R. (2002). Multiple mechanisms for the
potentiation of AMPA receptor-mediated transmission by alpha-
Ca2+/calmodulin-dependent protein kinase II. Journal of Neuroscience 22, 4406-
4411.
Rachidi, M., Lopes, C., Takamatsu, Y., Ohsako, S., Benichou, J.C., and Delabar, J.M.
(1999). Dynamic expression pattern of Ca(2+)/calmodulin-dependent protein
kinase II gene in the central nervous system of Drosophila throughout
development. Biochemical and Biophysical Research Communications 260, 707-
711.
Rasband, W.S. (1997-2014). ImageJ. (Bethesda, Maryland, USA, U. S. National
Institutes of Health).
Reyes, R., Haendel, M., Grant, D., Melancon, E., and Eisen, J.S. (2004). Slow
degeneration of zebrafish Rohon-Beard neurons during programmed cell death.
Developmental Dynamics 229, 30-41.
Reynolds, A., Brustein, E., Liao, M., Mercado, A., Babilonia, E., Mount, D. B., and
Drapeau, P. (2008). Neurogenic role of the depolarizing chloride gradient
revealed by global overexpression of KCC2 from the onset of development.
Journal of Neuroscience 28, 1588-1597.
Roberts, E., and Frankel, S. (1950). -Aminobutyric acid in brain: its formation from
glutamic acid. Journal of Biological Chemistry 187, 55-63.
Roberts, E., and Frankel, S. (1951). Glutamic acid decarboxylase in brain. Journal of
Biological Chemistry 188, 789-795.

195
Rongo, C. (2002). A fresh look at the role of CaMKII in hippocampal synaptic plasticity
and memory. Bioessays 24, 223-233.
Rothschild, S.C., Easley, C.A., Francescatto, L., Lister, J.A., Garrity, D.M., and Tombes,
R.M. (2009). Tbx5-mediated expression of Ca(2+)/calmodulin-dependent protein
kinase II is necessary for zebrafish cardiac and pectoral fin morphogenesis.
Developmental Biology 330, 175-184.
Rothschild, S.C., Lister, J.A., and Tombes, R.M. (2007). Differential expression of
CaMK-II genes during early zebrafish embryogenesis. Developmental Dynamics
236, 295-305.
Roy, B., and Ali, D.W. (2013). Patch clamp recordings from embryonic zebrafish
Mauthner cells. Journal of Visualized Experiments, 79, e50551,
doi:10.3791/50551.
Rudolph, U., and Mohler, H. (2014). GABAA receptor subtypes: Therapeutic potential in
Down syndrome, affective disorders, schizophrenia, and autism. Annual Review
of Pharmacology and Toxicology 54, 483-507.
Saint-Amant, L., and Drapeau, P. (2000). Motoneuron Activity Patterns Related to the
Earliest Behavior of the Zebrafish Embryo. Journal of Neuroscience 20, 3964-
3972.
Sceniak, M.P., and Maciver, M.B. (2008). Slow GABA(A) mediated synaptic
transmission in rat visual cortex. BMC Neuroscience 9, 8.
Shakiryanova, D., Klose, M.K., Zhou, Y., Gu, T., Deitcher, D.L., Atwood, H.L., Hewes,
R.S., and Levitan, E.S. (2007). Presynaptic ryanodine receptor-activated
calmodulin kinase II increases vesicle mobility and potentiates neuropeptide
release. Journal of Neuroscience 27, 7799-7806.
Shakiryanova, D., Morimoto, T., Zhou, C., Chouhan, A.K., Sigrist, S.J., Nose, A.,
Macleod, G.T., Deitcher, D.L., and Levitan, E.S. (2011). Differential control of
presynaptic CaMKII activation and translocation to active zones. Journal of
Neuroscience 31, 9093-9100.
Shen, K., and Meyer, T. (1999). Dynamic control of CaMKII translocation and
localization in hippocampal neurons by NMDA receptor stimulation. Science 284,
162-166.
Singer, J.H., Talley, E.M., Bayliss, D.A., and Berger, A.J. (1998). Development of
glycinergic synaptic transmission to rat brain stem motoneurons. Journal of
Neurophysiology 80, 2608-2620.
Sommer, B., Keinanen, K., Verdoorn, T.A., Wisden, W., Burnashev, N., Herb, A.,
Kohler, M., Takagi, T., Sakmann, B., and Seeburg, P.H. (1990). Flip and flop: a

196
cell-specific functional switch in glutamate-operated channels of the CNS.
Science 249, 1580-1585.
Sommer, B., Kohler, M., Sprengel, R., and Seeburg, P.H. (1991). RNA editing in brain
controls a determinant of ion flow in glutamate-gated channels. Cell 67, 11-19.
Stahlberg, A., Andersson, D., Aurelius, J., Faiz, M., Pekna, M., Kubista, M., and Pekny,
M. (2011). Defining cell populations with single-cell gene expression profiling:
correlations and identification of astrocyte subpopulations. Nucleic Acids
Research 39, 1-12.
Strack, S., and Colbran, R.J. (1998). Autophosphorylation-dependent targeting of
calcium/ calmodulin-dependent protein kinase II by the NR2B subunit of the N-
methyl- D-aspartate receptor. Journal of Biological Chemistry 273, 20689-20692.
Strack, S., McNeill, R.B., and Colbran, R.J. (2000). Mechanism and regulation of
calcium/calmodulin-dependent protein kinase II targeting to the NR2B subunit of
the N-methyl-D-aspartate receptor. Journal of Biological Chemistry 275, 23798-
23806.
Svoboda, K.R., and Fetcho, J.R. (1996). Interactions between the neural networks for
escape and swimming in goldfish. Journal of Neuroscience 16, 843-852.
Tabor, R., and Friedrich, R.W. (2008). Pharmacological analysis of ionotropic glutamate
receptor function in neuronal circuits of the zebrafish olfactory bulb. PLoS One 3,
e1416.
Takaishi, T., Saito, N., and Tanaka, C. (1992). Evidence for distinct neuronal localization
of gamma and delta subunits of Ca2+/calmodulin-dependent protein kinase II in
the rat brain. Journal of Neurochemistry 58, 1971-1974.
Tallafuss, A., Gibson, D., Morcos, P., Li, Y., Seredick, S., Eisen, J., and Washbourne, P.
(2012). Turning gene function ON and OFF using sense and antisense photo-
morpholinos in zebrafish. Development 139, 1691-1699.
Tobimatsu, T., and Fujisawa, H. (1989). Tissue-specific expression of four types of rat
calmodulin-dependent protein kinase II mRNAs. Journal of Biological Chemistry
264, 17907-17912.
Tokumitsu, H., Chijiwa, T., Hagiwara, M., Mizutani, A., Terasawa, M., and Hidaka, H.
(1990). KN-62 , a Specific Inhibitor of Ca2 ”/ Calmodulin-dependent Protein
Kinase II * protein. Journal of Biological Chemistry 265, 4315-4320.
Traynelis, S.F., Wollmuth, L.P., McBain, C.J., Menniti, F.S., Vance, K.M., Ogden, K.K.,
Hansen, K.B., Yuan, H., Myers, S.J., and Dingledine, R. (2010). Glutamate
receptor ion channels: structure, regulation, and function. Pharmacological
Reviews 62, 405-496.

197
Triller, A., Rostaing, P., Korn, H., and Legendre, P. (1997). Morphofunctional evidence
for mature synaptic contacts on the Mauthner cell of 52-hour-old zebrafish larvae.
Neuroscience 80, 133-145.
Turecek, R., and Trussell, L.O. (2001). Presynaptic glycine receptors enhance transmitter
release at a mammalian central synapse. Nature 411, 587-590.
Wang, R.A., and Randic, M. (1996). Alpha-subunit of CaM-KII increase glycine currents
in acutely isolated rat spinal neurons. Journal of Neurophysiology 75, 2651-2653.
Wang, Z.W. (2008). Regulation of synaptic transmission by presynaptic CaMKII and BK
channels. Molecular Neurobiology 38, 153-166.
Wayman, G.a., Lee, Y.-S., Tokumitsu, H., Silva, A.J., Silva, A., and Soderling, T.R.
(2008). Calmodulin-kinases: modulators of neuronal development and plasticity.
Neuron 59, 914-931.
Wei, J., Zhang, M., Zhu, Y., and Wang, J.H. (2004). Ca(2+)-calmodulin signalling
pathway up-regulates GABA synaptic transmission through cytoskeleton-
mediated mechanisms. Neuroscience 127, 637-647.
Westerfield, M. (2007). The zebrafish book. A guide for the laboratory use of zebrafish
(Danio rerio), 5th edn (Eugene: University of Oregon Press).
Wisden, W., Laurie, D.J., Monyer, H., and Seeburg, P.H. (1992). The distribution of 13
GABAA receptor subunit mRNAs in the rat brain. I. Telencephalon,
diencephalon, mesencephalon. Journal of Neuroscience 12, 1040-1062.
Wu, G.Y., and Cline, H.T. (1998). Stabilization of dendritic arbor structure in vivo by
CaMKII. Science 279, 222-226.
Wyszynski, M., Lin, J., Rao, A., Nigh, E., Beggs, A.H., Craig, A.M., and Sheng, M.
(1997). Competitive binding of alpha-actinin and calmodulin to the NMDA
receptor. Nature 385, 439-442.
Yamanaka, I., Miki, M., Asakawa, K., Kawakami, K., Oda, Y., and Hirata, H. (2013a).
Glycinergic transmission and postsynaptic activation of CaMKII are required for
glycine receptor clustering in vivo. Genes to Cells 18, 211-224.
Yamasaki, N., Maekawa, M., Kobayashi, K., Kajii, Y., Maeda, J., Soma, M., Takao, K.,
Tanda, K., Ohira, K., Toyama, K., et al. (2008a). Alpha-CaMKII deficiency
causes immature dentate gyrus, a novel candidate endophenotype of psychiatric
disorders. Molecular Brain 1, 6.
Yao, C., Vanderpool, K.G., Delfiner, M., Eddy, V., Lucaci, A.G., Soto-Riveros, C.,
Yasumura, T., Rash, J.E., and Pereda, A.E. (2014). Electrical synaptic
transmission in developing zebrafish: properties and molecular composition of

198
gap junctions at a central auditory synapse. Journal of Neurophysiology 112,
2102-2113.
Ye, J., Coulouris, G., Zaretskaya, I., Cutcutache, I., Rozen, S., and Madden, T.L. (2012).
Primer-BLAST: a tool to design target-specific primers for polymerase chain
reaction. BMC Bioinformatics 13, 134.
Yoshioka, A., Bacskai, B., and Pleasure, D. (1996). Pathophysiology of oligodendroglial
excitotoxicity. Journal of Neuroscience Research 46, 427-437.
Zebrafish Nomenclature Committee (ZNC) (1992). ZFIN Zebrafish Nomenclature
Guidelines. A. Singer, ed. (University of Oregon, Eugene, OR 97403-5274).
Zhang, S., Ehlers, M.D., Bernhardt, J.P., Su, C.T., and Huganir, R.L. (1998). Calmodulin
mediates calcium-dependent inactivation of N-methyl-D-aspartate receptors.
Neuron 21, 443-453.
Zottoli, S.J. (1977). Correlation of the startle reflex and Mauthner cell auditory responses
in unrestrained goldfish. The Journal of Experimental Biology 66, 243-254.
Zottoli, S.J. (1978). Comparison of Mauthner cell size in teleosts. Journal of Comparative
Neurology 178, 741-757.
Zou, D.J., and Cline, H.T. (1999). Postsynaptic calcium/calmodulin-dependent protein
kinase II is required to limit elaboration of presynaptic and postsynaptic neuronal
arbors. Journal of Neuroscience 19, 8909-8918.