rockwood r-vi school district comprehensive annual...st. louis county, missouri rockwood r-vi school...
TRANSCRIPT

ST. LOUIS COUNTY, MISSOURIWWW.ROCKWOOD.K12.MO.US
Rockwood R-VI School District2014 Comprehensive Annual Financial ReportFor fiscal year ended June 30, 2014

ROCKWOOD R-VI SCHOOL DISTRICT Saint Louis County, Missouri
Comprehensive Annual Financial Report For the year ended June 30, 2014
Submitted by: Tim Rooney, CPA, Chief Financial and Legislative Officer
Dan Steinbruegge, CPA, Director of Finance
http://www.rockwood.k12.mo.us

ROCKWOOD R-VI SCHOOL DISTRICT
TABLE OF CONTENTS Page
I. INTRODUCTORY SECTION – UNAUDITED
Transmittal Letter i - viii Board of Education ix - x Superintendent’s Cabinet xi Organizational Chart xii - xx District Locations xxi ASBO Certificate of Excellence in Financial Reporting xxii GFOA Certificate of Achievement for Excellence in Financial Reporting xxiii
II. FINANCIAL SECTION
Independent Auditors' Report 1 - 3
Management’s Discussion and Analysis – Unaudited 4 - 14
Basic Financial Statements: Government-Wide Financial Statements:
Statements of Net Position 15 Statements of Activities 16 - 17
Fund Financial Statements:
Balance Sheets – Governmental Funds 18
Reconciliation of the Balance Sheet of Governmental Funds to the Statement of Net Position 19
Statements of Revenues, Expenditures and Changes in Fund Balances – Governmental Funds 20
Reconciliation of the Statement of Revenues, Expenditures And Changes in Fund Balances of Governmental Funds With the Statement of Activities 21
Statements of Net Position – Proprietary Fund 22 Statements of Revenues, Expenses and Changes in Net Position – Proprietary Fund 23
Statements of Cash Flows – Proprietary Fund 24

ROCKWOOD R-VI SCHOOL DISTRICT
TABLE OF CONTENTS (CONTINUED)
Page II. FINANCIAL SECTION (concluded)
Notes to the Basic Financial Statements 25 - 53
Required Supplementary Information – Unaudited
Schedule of Revenues, Expenditures and Changes in Fund Balance – Budget and Actual
General Fund 54 Teachers Fund 55
Notes to Required Supplementary Information 56
Schedule of Other Postemployment Benefit Obligation 57
Supplementary Information Schedule of Revenues, Expenditures and Changes in Fund Balance – Budget and Actual
Debt Service Fund 58 Capital Projects Fund 59 All Major Funds 60
III. STATISTICAL SECTION – UNAUDITED
Summary of Statistical Information 61
Net Position by Component 62
Expenses, Program Revenues and Net Expense 63
General Revenues and Total Change in Net Position 64
Fund Balances – Governmental Funds 65
Governmental Funds Revenues 66
Governmental Funds Expenditures and Debt Service Ratio 67
Other Financing Sources and Net Change in Fund Balances Governmental Funds 68
ROCKWOOD R-VI SCHOOL DISTRICT
TABLE OF CONTENTS (CONTINUED)
Page III. STATISTICAL SECTION – UNAUDITED (concluded)
Assessed Value and Actual Value of Taxable Property 69
Direct and Overlapping Property Taxes 70
Principal Property Taxpayers 71 Assessed Value and Estimated Actual Value of Taxable Property 72 Property Tax Levies and Collections – St. Louis County 73 Outstanding Debt by Type 74 Direct and Overlapping Governmental Debt 75 Legal Debt Margin Information 76 Pledged-Revenue Coverage 77 Demographic and Economic Statistics – St. Louis County Only 78 Principal Employers 79 Employee Counts 80 Operating Statistics 81 Teacher Base Salaries 82 School Building Information 83 - 86
IV. STATE COMPLIANCE SECTION
Independent Accountants’ Report on Management’s Assertions About Compliance with Specified Requirements of Missouri State Laws And Regulations 87
Schedule of Selected Statistics – Unaudited 88 - 91

ROCKWOOD R-VI SCHOOL DISTRICT
TABLE OF CONTENTS (CONCLUDED)
Page
V. FEDERAL COMPLIANCE SECTION
Independent Auditors’ Report on Internal Control Over Financial Reporting and On Compliance and Other Matters Based on an Audit of Financial Statements Performed in Accordance with Government Auditing Standards 92 - 93
Independent Auditors’ Report on Compliance for Each Major Program and on Internal Control over Compliance in Accordance with OMB Circular A-133 94 - 96 Schedule of Expenditures of Federal Awards 97 Notes to the Schedule of Expenditures of Federal Awards 98 Schedule of Findings and Questioned Costs 99 - 100

i
December 10, 2014 Members, Board of Education and Citizens Rockwood School District St. Louis County, Missouri The Comprehensive Annual Financial Report (CAFR) of the Rockwood R-VI School District (the District), St. Louis County, Missouri, for the fiscal year ended June 30, 2014, is presented on the following pages. The District is governed by an elected seven member Board of Education (the Board). The Board is the basic level of government, which has financial accountability and control over all activities related to K-12 public school education within the District. The Board is not included in any other governmental reporting entity, as defined by Governmental Accounting Standards Board (GASB) pronouncements, since Board members are elected by the public and have decision making authority and primary accountability for fiscal matters. Responsibility for the accuracy of the data presented and the completeness and fairness of the presentation, including all disclosures, rests with the District. We believe that data, as presented, is accurate in all material aspects; that it is presented in a manner designed to fairly set forth the financial position and results of operations of the District as shown by the disclosure of all financial activity of its various funds; and that all disclosures necessary to enable the reader of the statements to gain a full understanding of the District’s financial status have been incorporated in the Report. The report has been prepared by the District’s Finance Department following the requirements and guidelines contained in the GASB Codification of Governmental Accounting and Financial Reporting Standards. The District’s activities and funds are all presented in this report and have been audited by the District’s Certified Public Accountants, Kerber, Eck & Braeckel LLP, who rendered an unmodified opinion for the District again this year. Generally Accepted Accounting Principles (GAAP) requires that management provide a narrative introduction, overview and analysis to accompany the basic financial statements in the form of Managements’ Discussion and Analysis (MD&A). This letter of transmittal is designed to complement the MD&A and should be read in conjunction with it. The District’s MD&A follows the independent auditors’ report.
Administrative Center Dan Steinbruegge, CPA 111 East North Street Director of Finance Eureka, MO 63025-1229 (636) 733-2058
(636) 938-2265 Fax
Growing Together, Learning for Life

ii
The District History The District began with the opening of Eureka High School in 1908. It was the first four-year high school in St. Louis County west of Kirkwood. The District, in its present form, was created on October 29, 1949 by a merger of 26 districts. The name was changed from Reorganized School District No. R-VI of St. Louis County, Missouri to Rockwood R-VI School District, St. Louis County, Missouri in April 1964. The District includes 150-square miles located in southwest St. Louis County and a small section of northern Jefferson County. Geographically, the District represents approximately 30% of St. Louis County. It encompasses all or parts of twenty communities including Ballwin, Chesterfield, Ellisville, Eureka, Fenton, Manchester and Wildwood. According to the 2010 Census, this represents approximately 115,931 residents in 41,913 households. The chart below summarizes the District’s enrollment history over a 10 year period.
Resident VICC Total2004-05 19,669 2,129 21,798 2005-06 20,050 1,882 21,932 2006-07 20,068 2,030 22,098 2007-08 20,258 2,010 22,268 2008-09 20,371 1,788 22,159 2009-10 20,504 1,750 22,254 2010-11 20,511 1,925 22,436 2011-12 20,313 1,844 22,157 2012-13 20,151 1,765 21,916 2013-14 19,894 1,604 21,498
As noted by the chart, the District has experienced slight annual enrollment reductions over the last four years. The District is projecting total enrollment for 2014-15 to be 21,152 students, a decrease of 346 students. General The District continues to be a leader in the field of public education. The U.S. Department of Education’s “Blue Ribbon List” includes ten District schools and Missouri’s “Gold Star” list includes fourteen District schools. The District is one of only seven school districts in the state accredited through AdvancED, the world’s largest education community. The District has also received numerous awards for its work in the area of character education, including earning the distinction of a National District of Character. The following are some of the highlights of academic achievement by students of the District:
• On the ACT, Rockwood students average a composite score of 23.5, outperforming the state average of 21.6 and the national average of 20.9.
• Rockwood students are performing at high levels in the content areas of Reading, Language Arts, Mathematics, Science and Social Studies on state assessment tests.
• Missouri Assessment Program (MAP) results show 74.3 percent of all students scored proficient or higher in Communication Arts and 71.1 percent of all students scored proficient or higher in Math.
• In 2013, the Rockwood School District was named to the College Board’s Annual AP District Honor Roll.
iii
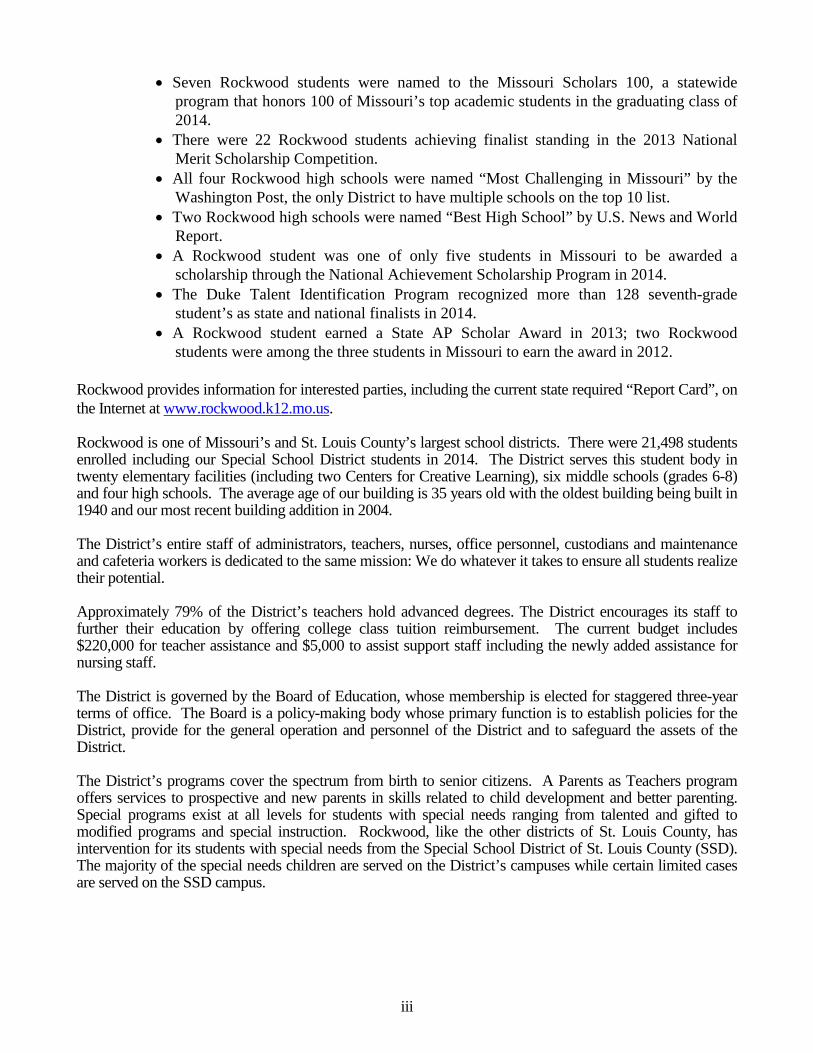
• Seven Rockwood students were named to the Missouri Scholars 100, a statewide program that honors 100 of Missouri’s top academic students in the graduating class of 2014.
• There were 22 Rockwood students achieving finalist standing in the 2013 National Merit Scholarship Competition.
• All four Rockwood high schools were named “Most Challenging in Missouri” by the Washington Post, the only District to have multiple schools on the top 10 list.
• Two Rockwood high schools were named “Best High School” by U.S. News and World Report.
• A Rockwood student was one of only five students in Missouri to be awarded a scholarship through the National Achievement Scholarship Program in 2014.
• The Duke Talent Identification Program recognized more than 128 seventh-grade student’s as state and national finalists in 2014.
• A Rockwood student earned a State AP Scholar Award in 2013; two Rockwood students were among the three students in Missouri to earn the award in 2012.
Rockwood provides information for interested parties, including the current state required “Report Card”, on the Internet at www.rockwood.k12.mo.us. Rockwood is one of Missouri’s and St. Louis County’s largest school districts. There were 21,498 students enrolled including our Special School District students in 2014. The District serves this student body in twenty elementary facilities (including two Centers for Creative Learning), six middle schools (grades 6-8) and four high schools. The average age of our building is 35 years old with the oldest building being built in 1940 and our most recent building addition in 2004. The District’s entire staff of administrators, teachers, nurses, office personnel, custodians and maintenance and cafeteria workers is dedicated to the same mission: We do whatever it takes to ensure all students realize their potential. Approximately 79% of the District’s teachers hold advanced degrees. The District encourages its staff to further their education by offering college class tuition reimbursement. The current budget includes $220,000 for teacher assistance and $5,000 to assist support staff including the newly added assistance for nursing staff. The District is governed by the Board of Education, whose membership is elected for staggered three-year terms of office. The Board is a policy-making body whose primary function is to establish policies for the District, provide for the general operation and personnel of the District and to safeguard the assets of the District. The District’s programs cover the spectrum from birth to senior citizens. A Parents as Teachers program offers services to prospective and new parents in skills related to child development and better parenting. Special programs exist at all levels for students with special needs ranging from talented and gifted to modified programs and special instruction. Rockwood, like the other districts of St. Louis County, has intervention for its students with special needs from the Special School District of St. Louis County (SSD). The majority of the special needs children are served on the District’s campuses while certain limited cases are served on the SSD campus.

iv
The District responds to the needs of students who are culturally different, at risk of educational failure, bilingual or have special needs by providing a broad spectrum of programs, services and resources. The District has received national recognition for both the successful Talented and Gifted program and the exemplary Community Education program. Also recognized are the Partners in Education program with local corporate sponsors. The District’s high schools offer numerous Advanced Placement and College Credit courses to prepare the graduating student to enter either college or the working world. The Individualized Learning Center (ILC) educates students who are in danger of dropping out of school because of difficulty faced in a regular school setting. These initiatives and investments in enrichment of the full curriculum with emphasis on acceleration and differentiation result in the District’s students experiencing a high level of achievement. Students continue to score above state and national norms on achievement tests. The percentage of District students going on to post-secondary education is 89.8% (2013-2014). To ensure that District students receive the individualized educational experiences necessary, the average building level pupil-teacher ratios are: Elementary Schools: 21 to 1; Middle Schools: 22 to 1; and High Schools: 22 to 1. Curriculum study and writing is a continuous improvement process. Each curriculum document is reviewed on an annual basis and is revised and updated (in-depth year) on a six-year cycle via approval of the Board of Education. Rockwood contracts with First Student Transportation to provide transportation for resident students to and from school and on school district sponsored activity trips. Approximately 12,700 resident students are transported on a daily basis. In 2002, the District formed the Rockwood School District Educational Facilities Authority to acquire, construct, improve, extend, repair, remodel, renovate, furnish and equip buildings and facilities for the District. The Facility issued Leasehold Revenue Bonds Series 2002 in order to pay off the existing G. E. Capital energy note and to finance the construction of an Early Childhood Center. The equipment financed and the Early Childhood Center is being leased to the District for the amount of principal and interest due on the leasehold revenue bonds. The District participates in a Voluntary Transfer Student (VTS) program in which St. Louis City resident African-American students volunteer to transfer to the District’s schools. As of January 2014, this K-12 program represents 1,604 of 21,498 students or about 7.5% of the population. Accounting System and Budgetary Control The District’s accounting system for governmental funds reflects the modified accrual basis of accounting. At the end of the year, the governmental funds are converted from the modified accrual basis to the accrual basis for presentation in district-wide financial statements. In developing the accounting system, consideration has been given to the adequacy of internal accounting controls. We believe the District’s internal accounting controls adequately safeguard assets and provide reasonable assurance of proper recording of transactions. As management, we assert that, to the best of our knowledge and belief, the financial report is complete and reliable in all material respects. The District’s accounting system is organized on the basis of funds, each of which is considered its own entity. The District follows Missouri State Statutes in establishing budgetary data (Chapter 67, RSMo) for each major fund of the political subdivision. The District considers four funds (General, Special Revenue-Teachers’, Debt Service and Capital Projects) as major. Changes in the overall revenue and expenditure of a fund’s budget require full disclosure and Board resolution for approval. Budgetary variances at the function and object level are reported to the Board at the monthly business meeting. The District is not a component unit of another report entity, but has a component unit, the Rockwood School District Facility Authority.

v
The budget process is a yearly cycle: In September, Missouri Statute requires an official count of enrolled students on the last Wednesday of the month (this begins the process of the budget). From that data and other significant information, the projections of future enrollment are calculated for the budget year and four years beyond. This enrollment projection becomes the basis for hiring personnel and establishing the school-level allocation budgets. In preparation for the 2014-15 budget the Chief Financial Officer and members of the Facilities Department visited each building site and, with the assistance of the principal or department manager, identified outstanding maintenance issues and updated the list of major infrastructure improvements. A PTO representative was also invited to the school reviews. The principal or department manager prioritized each project within their building or department. When all visits were concluded, the prioritized projects were scored using a rubric including the following criteria:
1. Safety 2. For existing infrastructure components, the current age relative to the estimated useful life 3. Any regulatory issues 4. Impact on the educational program 5. The ability to generate additional revenue 6. Eminent mechanical failure
A composite score was determined for each of these items. The information was submitted to Cabinet and a recommendation was made to the Board on October 17, 2013. Official enrollment was taken the last week of September 2013. Enrollment projections were developed for subsequent years. These projections are used to estimate some revenue lines and to staff and provide supply allocations to schools. Considering the importance of enrollment projections, the District hired an outside consultant to estimate enrollment for the next five years and to assist with an analysis of building capacity vs. projected enrollment. A District committee was formed to review the information and a report was provided to the Board on May 15, 2014. The report addressed two elementary schools with projected enrollment approaching the functional capacity of the buildings as well as some suggested middle school boundary changes. In October 2013, school and department levels began working on their 2014-15 requested budgets. The Superintendents Cabinet held a series of meetings to go through staffing levels and detailed budget requests with rationales. School building budgets were based on a per pupil calculation. The 2014-15 budget target was presented to the Board of Education in December 2013 and included the following priorities:
• Increasing staff compensation to the mid-point of the St. Louis County districts over three years
• Funding of high priority maintenance projects from fund balance • Reinstate the curriculum development process that was delayed for several years • Maintaining pupil-teacher ratios

vi
The governing body of each political subdivision may revise, alter, increase or decrease the items contained in the proposed budget, subject to such limitations as may be provided by law or charter; provided, that in no event shall the total authorized expenditures from any fund exceed the estimated revenues to be received plus any unencumbered balance or less any deficit estimated for the beginning of the budget year. After any political subdivision has approved the budget for any year and has approved or adopted the orders, motions, resolutions, or ordinances required to authorize the expenditures proposed in the budget, the political subdivision shall not increase the total amount authorized for expenditure from any fund, unless the governing body adopts a resolution setting forth the facts and reasons making the increase necessary and approves or adopts an order, motion, resolution or ordinance to authorize the expenditures. Throughout the year, budgets are reviewed daily in connection with purchase order and payroll processing. Revenue budgets are reviewed monthly. Budget adjustments can, and will, be made on a regular basis as additional information becomes available, especially in regard to title programs, grant approvals and changes in assessed valuations and required changes in related expenditures. Management may make budget adjustments between objects within a fund without pre-approval from the Board. Any additions to or redirections from the approved budget at the fund level must be pre-approved. Also, any movement between funds must have Board approval. The Board of Education has final approval for the original budget and for budget adjustments made throughout the year. Economic Condition St. Louis County is the largest county in the State of Missouri and the major contributor to the economy of the state and the twelve-county metropolitan area with approximately one million residents. The service sector continues to show the largest job growth in the County. The areas of medical, bio-technical, business and technology services are expected to provide long term employment growth in the County as manufacturing jobs continue to decline. The District is located in Southwest St. Louis County and residents have full access to the large and diverse employment base in the AAA rated St. Louis County. The District is anticipating assessed valuations to rebound from the reductions we experienced with the global downturn in the economy. We are seeing more residential and small commercial development activity in our area. Next year is a reassessment year in Missouri and we conservatively expect increases in the range of 2-3% in assessed valuation. The District enjoys a bond rating among the highest in the nation - AAA. Current Initiatives The Rockwood Board strongly supports the process of long-range planning in making important decisions about the future of the District’s schools and the District as a whole. The State of Missouri requires all school districts to conduct an in-depth public engagement program to set goals for the next five years. This requirement of the Missouri Department of Elementary and Secondary Education is governed by the Department’s Missouri School Improvement Program (MSIP) document. MSIP specifies that each Missouri school district have a Comprehensive School Improvement Plan (CSIP) as one of the major components of the MSIP. The main thrust of the CSIP was to engage a cross section of the District’s public to assist in assessing the District’s current structure and planning for the future by determining a ubiquitous set of goals to be used across the District for the next five years. Rockwood is an exemplary school district in part because of the strength and complexity of its planning efforts. The results of this long-range planning effort have resulted in the following five key goals that will guide the District through the end of the 2014-19 school year:

vii
• Student Learning: All students will demonstrate academic growth and be well prepared for their future.
• Highly Effective Staff: Recruit, attract, develop and retain highly effective staff to carry out the
Rockwood School District’s missions, goals and objectives.
• District Finance: Ensure efficient operations and accountability for fiscally responsible use of District resources.
• School Climate: Create a safe and caring learning environment that includes a positive school
culture and positive collaboration and communication throughout the school and community.
• Governance: Govern the Rockwood School District in an efficient and effective manner, providing leadership and representation to benefit the students, staff and patrons of the District.
Significant Board Policies The District has entered into agreements with the Rockwood National Education Association, the Rockwood Custodial Education Association, and the Rockwood Association of Nurses. Each of these agreements dictates the work environment and compensation for the member’s of each organization. In May 2013 the Board of Education approved a renewal of the current agreement with the Rockwood National Education Association for an additional two years to cover the school years 2014-2015 and 2015-2016. In April 2012, the Rockwood Custodial Education Association agreement was renewed for an additional three years to cover the school years 2012-2013, 2013-2014 and 2014-2015. In March 2012, the Rockwood Association of Nurses agreement was renewed for an additional three years to cover the school years 2012-2013, 2013-2014 and 2014-15. The Board has an approved policy of maintaining operating fund balances at 18% of the subsequent year’s expenditure with an additional 4% of expenditures for a stabilization plan. The District had 26% of operating fund balance as of June 30, 2014. Independent Audit The Revised Statutes of the State of Missouri and the Board policies of the District require an audit of the books of accounts, financial records and transactions of all funds of the District. The audit is performed by independent certified public accountants that are selected by the District’s Board of Education. This requirement has been complied with and the auditors’ unmodified opinion is included in this report. Financial Reporting Awards The Government Finance Officers Association of the United States and Canada (GFOA) awarded a Certificate of Achievement for Excellence in Financial Reporting to Rockwood School District for its comprehensive annual financial report for the fiscal year ended June 30, 2013. This was the ninth year that the District has achieved this prestigious award. In order to be awarded a Certificate of Achievement, a government must publish an easily readable and efficiently organized comprehensive annual financial report. This report must satisfy both generally accepted accounting principles and applicable legal requirements. A Certificate of Achievement is valid for a period of one year only. We believe that our current comprehensive annual financial report continues to meet the Certificate of Achievement Program’s requirements and we are submitting it to the GFOA to determine its eligibility for another certificate.

viii
The District has been awarded the Association of School Business Officials International (ASBOi) Certificate of Excellence in Financial Reporting (CAFR) for the years ended June 30, 2004 - 2013. The District will also submit this 2014 financial report for that coveted award. The District also participates in ASBO International’s Meritorious Budget Award (MBA) Program. For the past fourteen years, the District has applied for and received the prestigious award for excellence in budgeting. Closing Statement It is the District’s intention that this Comprehensive Annual Financial Report will provide the District’s management, parents and other interested patrons, outside investors and the local business community with the most meaningful financial presentation possible. In this report we intend to provide all readers a clear and concise picture of the District’s financial condition as of June 30, 2014. We are thankful for the loyalty and support of our taxpayers, the vision of the Board of Education, the dedication and hard work of fellow employees and the success of our students. Respectfully submitted, Dr. Eric Knost Superintendent Mr. Tim Rooney, CPA Chief Financial and Legislative Officer Mr. Dan Steinbruegge, CPA Director of Finance

ix
Rockwood School District
Board of Education
2014-2015
Bill Brown, President, was elected to the Rockwood Board of Education in 2012. Mr. Brown received a bachelor's in Secondary Education from Southeast Missouri State and a master's in Education from Southwest Baptist University. Currently Mr. Brown teaches at Saint Louis University High School and serves as a Question Leader at the Advanced Placement/U.S. Government and Politics Grading. Prior to this, he taught for more than 30 years in the Missouri Public School system and served Rockwood on numerous committees and other volunteer positions. He and his wife Cindy have four children who graduated from Rockwood. Their two grandchildren presently attend Rockwood schools.
Loralee Mondl, Vice President, was elected to the Rockwood Board of Education in 2013. She holds bachelors’ degrees in Chemistry, Math and Education from the University of Missouri, St. Louis in addition to a master’s degree in Education from Lindenwood University. She was a teacher and coach at Marquette High School for five years. Her family has lived in Rockwood for the past seven years, and her sons attend Rockwood Schools. For the past 11 years, she has been active as PTO Treasurer and Co-President.
Rob Castle, Director, was appointed to the Rockwood Board of Education in August 2014. He is a graduate of Eureka High School. In his career, Mr. Castle managed loss prevention at the corporate level, with a strong focus on business partnerships, training and conflict resolution. He has an extensive history of volunteer service in Rockwood, including the Comprehensive School Improvement Planning Committee (2013-2014), Picture Rockwood facilitating team member (2012-2013) and the Special School District Parent Advisory Council (2012-2014) as well as the Special School District Public Review Committee (2013-2014). He and his wife, Sheila, have one child enrolled at Rockwood Summit High School, as well as two children who have graduated from Rockwood schools.

x
Matt Doell, Director, was elected to the Rockwood Board of Education in 2011. Mr. Doell is a Licensed Professional Engineer and holds a master's degree in Business Administration from the University of Missouri St. Louis and a bachelor's degree in Electrical Engineering from the Missouri University of Science and Technology.
Dr. Keith Kinder, Director, was elected to the Rockwood Board of Education in 2011. Dr. Kinder, a career educator, previously worked for the Rockwood School District as both associate principal and principal for three of the district’s high schools. Currently, he is an assistant professor of education at Maryville University, helping prepare teachers and administrators for advanced masters and doctoral degrees in education.
Dominque` A. Paul, Director, is a graduate from The Ohio State University as an Academic All-American student-athlete. A mother of two Rockwood children and the wife of Mayor Adam Q. Paul, she is a Certified Residential Appraiser, Chair of REACH PTO Activities, and a member of REACH teacher grants committee. Dominque' A. Paul has been active for the past four years with REACH PTO activities and teacher grants. As early as High School she began volunteering within the community. She also participated in the Picture Rockwood initiative.
Sherri Rogers, Director, was elected to the Rockwood Board of Education in 2012. Ms. Rogers received a bachelor's of science in Business Administration from Southeast Missouri State University and a master's of Business Administration from Saint Louis University with emphases in Finance and Accounting. Her background includes more than 20 years of experience working in finance, accounting, operations management, human resources, and employee and customer relations in both small business and corporate finance. She and her husband have two children enrolled in Rockwood schools.

xi
2014/15 ORGANIZATION
Board of Education
Mr. Bill Brown President Ms. Loralee Mondl Vice President Mr. Rob Castle Director Mr. Matt Doell Director Dr. Keith Kinder Director Ms. Dominque' A. Paul Director Ms. Sherri Rogers Director
Interim Superintendent
Dr. Eric Knost Superintendent of Schools Superintendent’s Cabinet
Mr. Will Blaylock Chief Information Officer Ms. Kim Cranston Chief Communications Officer Dr. Karen Hargadine Asst. Superintendent Learning and Support Services Dr. Katherine Reboulet Asst. Superintendent, Human Resources Mr. Tim Rooney Chief Financial and Legislative Officer Dr. Jane Brown Executive Director of Pre-K & Elementary Education Ms. Beth Knes Interim Executive Director Student Services Dr. James Wipke Executive Director of Secondary Education
Directors
Dr. Dottie Barbeau Director Gifted Program Dr. Michael Barla Director Early Childhood Ms. Suzanne Dotta Director of Professional Learning Ms. Carmen Fischer Director Child Nutrition Services Mr. Chris Freund Director Facilities Services, Warehouse Dr. Tracy Edwards Director Human Resources Mr. Jeff Puls Director of Research, Evaluation & Assessment Mr. Michael Seppi Director Community Education Mr. Bill Sloan Director Purchasing and Transportation Mr. Dan Steinbruegge Director Finance Ms. Shelley Willott Director of Curriculum

Rockwood Board of Education
Assistant Superintendent
Learning & Support Services
Dr. Karen Hargadine
Chief Financial and Legislative
OfficerTim Rooney
Assistant Superintendent
for Human ResourcesDr. Katie Reboulet
Executive Director of
Student Services
TBD
Superintendent of SchoolsDr. Eric Knost
Citizens
Secretary to the Board of Educationand
Administrative Assistant to the Superintendent
Gretchen Bedo
Executive Director of Secondary Education
Dr. Jim Wipke
Chief Information
OfficerWill Blaylock
Executive Director of PreK-Elementary
EducationDr. Jane Brown
Chief Communications
OfficerKim Cranston
xii

Superintendent of Schools Dr. Eric Knost
Assistant Superintendent for Human Resources
Dr. Katie Reboulet
Technical Support Specialist
Chrissy Hasenbeck
SecretaryNatasha Mullen
Coordinator of Human Resources
Stacy Neely
Coordinator of Benefits
Lori Roach
Director of Human Resources
TBDSupervisor of
Health & WellnessAmy Wehr
Human Resources Assistant
Cathy Jones
Secretary Danielle Maxwell
Records Room SecretaryRonni Meyers
SubFinder FacilitatorEvelyn Mayer
SecretaryTBD
SecretaryVeronica Woll
Human Resources Specialist
Brenda Tinsley
Cigna Onsite Benefits Specialist
Amy Lewis
Cigna Onsite Wellness Coordinator
Rebecca Keightley
xiii

Chief Financial and Legislative Officer
Tim Rooney
SecretaryTerra Wichowski
Director of FinanceDaniel Steinbruegge
Director of Purchasing/Transportation
Bill Sloan
Director of Child Nutrition ServicesCarmen Fischer
Superintendent of Schools Dr. Eric Knost
Purchasing AgentMary Thouviner
PermanentRecords
Patricia Beckham
Payroll SupervisorAdrianne Genail
Financial AnalystDavid Tatlow
Coordinator of Financial Reporting
Carl Mertens
Manager Accounts Payable/
Expense Reports/Petty Cash
Barb Fuerst
Biweekly Processor
Andrea Weise
Semi-Monthly Processor
Paula White
Payroll Processor
Paige Zimmermann
Accounts Payable Vendors
L-ZDebbie Downey
Accounts Payable Vendors
A-KTammy Goss
Purchasing BuyerTBD
Accounting ClerkKayla Farner
Junior AccountantTBD
Catering ManagerJill Hogan
Program Specialist
Sharon Cucchi
Dietitian/SupervisorKristin Davis
Warehouse SupervisorBryan Hatfield
Training/Staff Development
SupervisorHolly Deckard
Warehouse Drivers
Mail Services
Babler Camp ManagerStarr Giammanco
Assistant Warehouse SupervisorJimmy Bay
Business AnalystBecky Morris
School Lunch SecretaryPat Brune
Inventory Secretary
Heather Cardinale
Assistant Cafeteria Managers
CNS Employees
Cafeteria Managers
Director of FacilitiesChris Freund
See attached
Staff AccountantBrenda McNabb
xiv

Director of FacilitiesChris Freund
SecretaryDiane Meyer
Construction Coordinator
Michael J. Schneider
Maintenance/Grounds
Coordinator Bill Branson
SecretaryDarlene Hogue
Maintenance SupervisorDan Moore
Construction Supervisor
Dennis Albanello
SupervisorJohn Valenti
SupervisorJoe Trimberger
SupervisorSteve Pinson
SupervisorDavid Richards
Warehouse HeadVivian Lord
Chief Financial and Legislative Officer
Tim Rooney
Accounts Payable Secretary
Pam Griffin
Superintendent of Schools Dr. Eric Knost
Grounds Supervisor
Steve Meyers
SecretaryRegena Buehler
Warehouse TechRobin Schumacher
xv

Instructional Technology Specialist
Ellen Downs
Instructional Technology Specialist
Dana Stiebel
Instructional Technology Specialist
Mark Pennycuick
Instructional Technology Specialist
Maria Tenny
Lead IS Support Specialist
Karen Rosselot
Lead Prog/AnalystMaria Hines
Sr. Prog/AnalystJerry Keppler
Instructional Technology Specialist
Bob Deneau
Technology Customer Service Supervisor
Jim Apps
Site-based Support SpecialistsBradley BellJoshua BoxxDoreen ConteJulie Dwyer
Charles GearyMckinley Griggs
Anton HoChristopher Krieger
Linda LamatinaPat LeMarbe
Shallee LessmeierSteven LindseyAdam Maxey
Christopher MoeckelAmela NasufovicMike PiotraschkeJason PolaskeMichael Roland
Katherine SammonsRobert Schaeg
Steven Stauffacher
Chief Information Officer
Will Blaylock
Coordinator of Information
SystemsChris DeWille
Sr. IS Support Specialist
Shellie Greer
Coordinator of Technology
Support ServicesDebbie Ketring
HELP DESKShelly Lindemann*
Judy Rollins*Michelle Daniels
*Senior Level
IS Support Specialist
Ann Brinker
Instructional Technology Specialist
Amanda Lindemann
Instructional Technology Specialist
Alison Hancock
Instructional Technology Specialist
Dana Todaro
Prog/AnalystMolly Cumiskey
IS Support Specialist
Judy Redman
Network and ServerSupport Services
Mark BuddemeyerGary Hertz*Ted Hinch
Sherry Nuelle*Robin PradoScott Rhodes*Senior Level
Superintendent of Schools Dr. Eric Knost
Information Systems Instructional Technology Technical Support
Technology Customer Service Supervisor
Tony Spina
Printers and Inventory
Sandy Goss
xvi
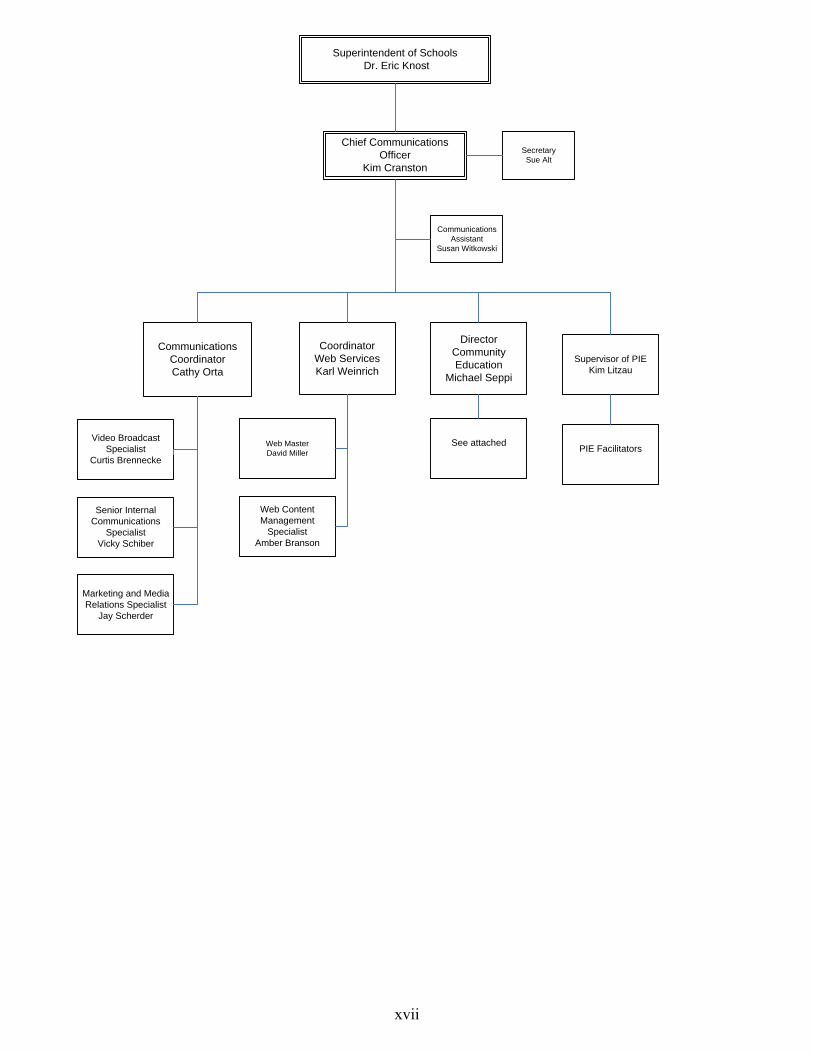
Chief Communications Officer
Kim Cranston
Communications CoordinatorCathy Orta
Senior Internal Communications
SpecialistVicky Schiber
Marketing and Media Relations Specialist
Jay Scherder
Web MasterDavid Miller
Video Broadcast Specialist
Curtis Brennecke
SecretarySue Alt
Communications Assistant
Susan Witkowski
Web Content Management
SpecialistAmber Branson
Superintendent of Schools Dr. Eric Knost
CoordinatorWeb ServicesKarl Weinrich
DirectorCommunity Education
Michael Seppi
See attached
Supervisor of PIEKim Litzau
PIE Facilitators
xvii

Director of Community EducationMike Seppi
Senior Business Analyst
Jennifer Ritter
Senior Graphic Design/Marketing
SpecialistKali Rogers
Sports SupervisorCurt Riek
Babler Outdoor Education Center
Supervisor Heather Stewart
Adventure Club Coordinator
Leanne Cantu
Technical Theater Manager
Dave Kozinski
Facility Usage
ManagerDenise
Wooldridge
ManagerMike
Podgorski Personnel Secretary
Donna Wilson
Account Specialist
Katrina Walsh
Accounts Receivable
Clerk Carolyn Desloge
Account Specialist
Deb Gayer
Senior Purchasing/
Accounts Payable AnalystRobin Weaver
Account Specialist
Pam Hertz
Audiovisual Services
Ron Leonard
Assistant Technical Manager
Alecia Brandenburg
SecretaryElizabeth Grayson
Adult Education & Literacy/GED
Online SupervisorMary Grott
Literacy Facilitator/
GED Online Program Designer
Kim Brogan
Secretary Part-Time
Beth Paskoff
Account Specialist
Lisa Gardner
AEL/GED Online
Teachers
Aquatics SupervisorTodd Gabel
Office & Technical Supervisor
Mary Jo Wilkins
Secretary Part-Time
Karen Hutten
Swim America
Instructors
Superintendent of Schools Dr. Eric Knost
Chief Communications Officer
Kim Cranston
Swim Club Coaches
Aquatics Program Specialist
Laurel Stallings
ManagerKevin Zimmer
ManagerTBD
Club Volleyball Head Coach
Gretchen Moser
Club Volleyball Asst Head Coach
Michael Weber
Club Volleyball Coaches
Enrichment/ Visual &
Performing Arts
SupervisorKelly Regan
ManagerTBD
AccountSpecialist
Jean Watson
Lead Supervisor Jana Ramsey
Area SupervisorChristine Poertner
Area SupervisorCassie Eckman
Area SupervisorSusan Vasterling
Area Supervisor Kristen Sherry
Area Supervisor TBD
SecretaryPart-Time
Lynn Marshall
xviii

Superintendent of Schools Dr. Eric Knost
Elementary Principals
Director of Early
Childhood Education
Dr. Michael Barla
Parents as Teachers
SupervisorDiane McKinney
Full-Day Preschool Supervisor Patty Gillis
Half-Day Preschool Supervisor
Faith Williamson
Preschool Screening Supervisor
Cindy Lewis
Process Coordinator
Kristin Clemons
Coordinator of Autism
Dr. Elizabeth Mrozowicz
Secondary Principals
Activity Directors
Coordinator of ILC
Matt Dieckhaus
Special Ed 504/
Homebound Coordinator
(K-12)Dr. Jamie
Smith
ELL Content Facilitator (K-12)
(.5)Jeff Tamaroff
Coordinator of Professional
LearningJulie
McDonnell
Data AnalystsBrian Koop
Michelle Fitzsimmons Jennifer Swartz
Math Content Facilitator (Elementary)
Stephanie Nauman
Math Content Facilitator (Secondary)Lisa Lingle
Science Content Facilitator (Elementary)
Susanne Moar
Coordinator of Science (6-12)TBD
Social Studies Content Facilitator (K-12)
Katie Nease
Fine Arts Content Facilitator K-12)
Mark McHale
PE/Health/Drivers Education Content Facilitator (K-12) Edward Mattison
Practical Arts Content Facilitator (Secondary)
Paige Carlson
World Language
Content Facilitator (6-12) (.5)
Jeff Tamaroff
Middle School Academic
Stretch Teachers
High School Gifted
Teachers/Facilitators
Elementary Gifted
TeachersCCL/Primary
Campus
Assistant Superintendent of
Learning & Support Services
Dr. Karen Hargadine
SecretarySandy Menchella
Secretary Connie Moehlenhoff
Project Coordinator to Drug Free CommunitiesRenee Heney
Director of K-12 Gifted & Talented
Dr. Dottie Barbeau
Director of Research, Evaluation and
AssessmentJeff Puls
Executive Director of PreK – Elementary
EducationDr. Jane Brown
Director of Professional Learning
Suzanne Dotta
Executive Director of Secondary
EducationDr. Jim Wipke
Director of CurriculumShelley Willott
SecretaryKay Julius
Coordinator of STEM Glenn Hancock
Coordinator of Elementary Literacy &
Title ProgramsStefanie Steffan
Coordinator of Secondary Literacy, K-
12 Speech & K-12 Library Media
Dawnette Wiskur
xix
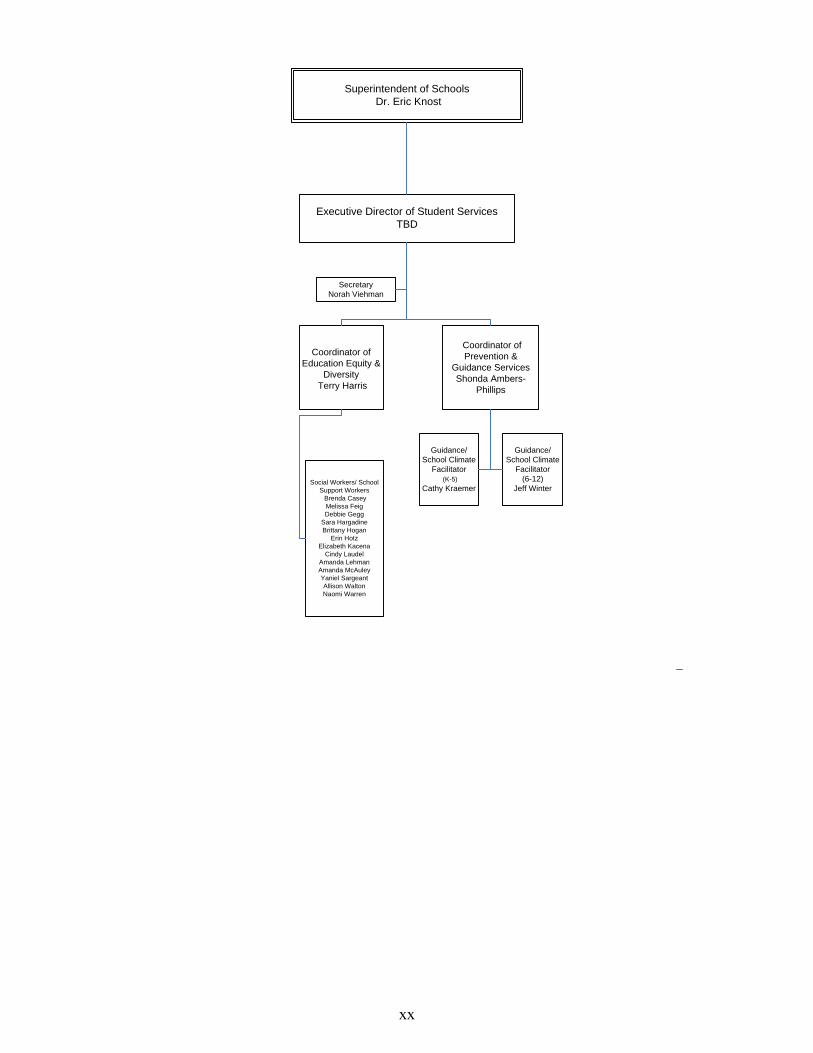
Superintendent of Schools Dr. Eric Knost
Guidance/School Climate
Facilitator (K-5)
Cathy Kraemer
Coordinator of Education Equity &
Diversity Terry Harris
Coordinator of Prevention &
Guidance ServicesShonda Ambers-
Phillips
Social Workers/ School Support Workers Brenda CaseyMelissa FeigDebbie Gegg
Sara HargadineBrittany Hogan
Erin HotzElizabeth Kacena
Cindy LaudelAmanda LehmanAmanda McAuleyYaniel SargeantAllison WaltonNaomi Warren
Guidance/School Climate
Facilitator (6-12)
Jeff Winter
Secretary Norah Viehman
Executive Director of Student Services TBD
xx

733-4100
733-3100
891-6000
891-6800
733-1140
733-1175
733-2000
733-2100
733-3270
733-1100
733-2017
733-3250
733-2101
733-2175Comm.Ed. Facility Usage 733-2167
733-4187
733-4200
891-6850 733-3175
891-6775
733-3150
891-6700
891-6750
891-6725
891-6675891-6690
891-6575
733-3200
891-6150
891-6075
891-6175
891-6950
733-4270
891-6100
733-4230
891-6600
733-4150
891-6050
733-3225
891-6650
891-6525
891-6550
891-6500
891-6200
xxi

xxii
Association of School Business Officials International
The Certificate of Excellence in Financial Reporting Award is presented to
Rockwood R-VI School District For Its Comprehensive Annual Financial Report (CAFR)
For the Fiscal Year Ended June 30, 2013
The CAFR has been reviewed and met or exceeded ASBO International’s Certificate of Excellence standards
Terrie S. Simmons, RSBA, CSBO John D. Musso, CAE, RSBA President Executive Director

xxiii
Government Finance Officers Association
Certificate of Achievement for Excellence
in Financial Reporting
Presented to
Rockwood R-VI School District
Missouri
For its Comprehensive Annual Financial Report
for the Fiscal Year Ended
June 30,2013
Executive Director/CEO


Other Locations Belleville, IL • Carbondale, IL • • Litchfield, IL • Springfield, IL • Cape Girardeau, MO • Milwaukee, WI
CPAs and Management Consultants
One South Memorial Drive Ninth Floor St. Louis, MO 63102 ph 314.231.6232 fax 314.880.9307 www.kebcpa.com
Independent Auditors' Report Board of Education Rockwood R-VI School District Report on the Financial Statements We have audited the accompanying financial statements of the governmental activities, each major fund and the aggregate remaining fund information of Rockwood R-VI School District as of and for the year ended June 30, 2014, and the related notes to the financial statements, which collectively comprise the District’s basic financial statements as listed in the table of contents. Management’s Responsibility for the Financial Statements
Management is responsible for the preparation and fair presentation of these financial statements in accordance with accounting principles generally accepted in the United States of America; this includes the design, implementation, and maintenance of internal control relevant to the preparation and fair presentation of the financial statements that are free from material misstatement, whether due to fraud or error.
Auditors’ Responsibility Our responsibility is to express opinions on these financial statements based on our audit. We conducted our audit in accordance with auditing standards generally accepted in the United States of America and the standards applicable to financial audits contained in Government Auditing Standards, issued by the Comptroller General of the United States. Those standards require that we plan and perform the audit to obtain reasonable assurance about whether the financial statements are free of material misstatement. An audit involves performing procedures to obtain audit evidence about the amounts and disclosures in the financial statements. The procedures selected depend on the auditors’ judgment, including the assessment of the risks of material misstatement of the financial statements, whether due to fraud or error. In making those risk assessments, the auditor considers internal control relevant to the entity’s preparation and fair presentation of the financial statements in order to design audit procedures that are appropriate in the circumstances, but not for the purpose of expressing an opinion on the effectiveness of the entity’s internal control. Accordingly, we express no such opinion. An audit includes evaluating the appropriateness of accounting policies used and the reasonableness of significant accounting estimates made by management, as well as evaluating the overall presentation of the financial statements. We believe that the audit evidence we have obtained is sufficient and appropriate to provide a basis for our audit opinions.
1
2
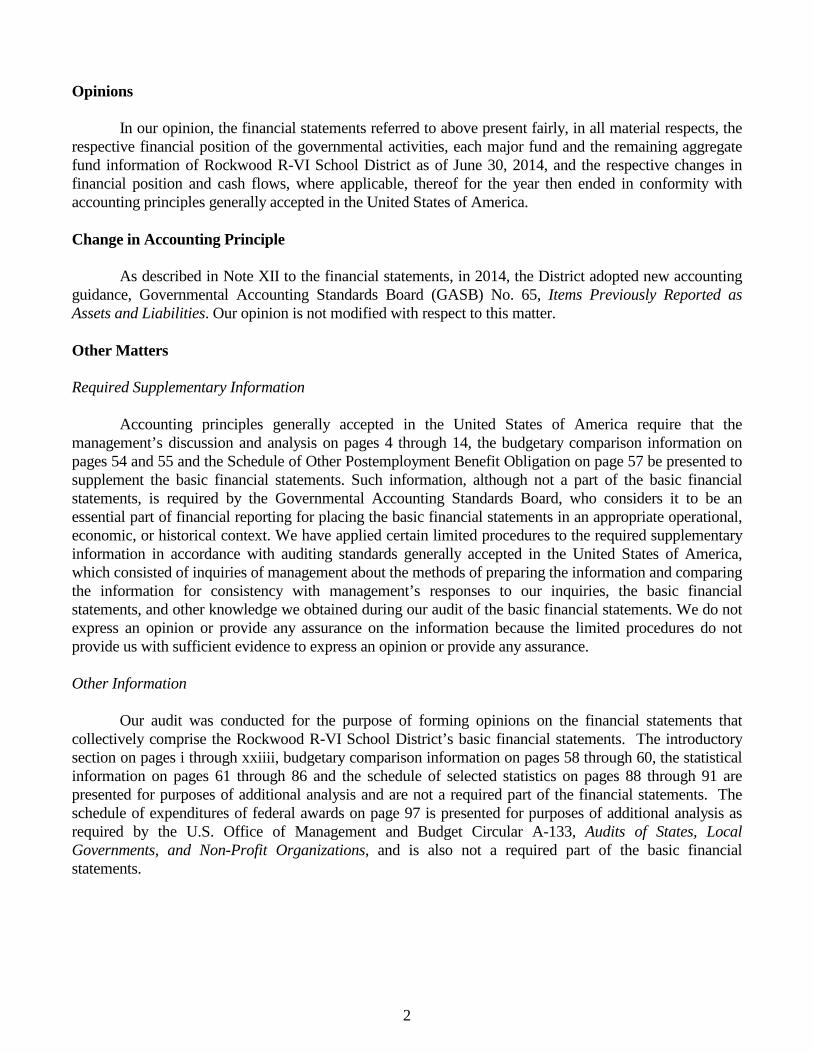
Opinions In our opinion, the financial statements referred to above present fairly, in all material respects, the respective financial position of the governmental activities, each major fund and the remaining aggregate fund information of Rockwood R-VI School District as of June 30, 2014, and the respective changes in financial position and cash flows, where applicable, thereof for the year then ended in conformity with accounting principles generally accepted in the United States of America. Change in Accounting Principle
As described in Note XII to the financial statements, in 2014, the District adopted new accounting guidance, Governmental Accounting Standards Board (GASB) No. 65, Items Previously Reported as Assets and Liabilities. Our opinion is not modified with respect to this matter. Other Matters Required Supplementary Information Accounting principles generally accepted in the United States of America require that the management’s discussion and analysis on pages 4 through 14, the budgetary comparison information on pages 54 and 55 and the Schedule of Other Postemployment Benefit Obligation on page 57 be presented to supplement the basic financial statements. Such information, although not a part of the basic financial statements, is required by the Governmental Accounting Standards Board, who considers it to be an essential part of financial reporting for placing the basic financial statements in an appropriate operational, economic, or historical context. We have applied certain limited procedures to the required supplementary information in accordance with auditing standards generally accepted in the United States of America, which consisted of inquiries of management about the methods of preparing the information and comparing the information for consistency with management’s responses to our inquiries, the basic financial statements, and other knowledge we obtained during our audit of the basic financial statements. We do not express an opinion or provide any assurance on the information because the limited procedures do not provide us with sufficient evidence to express an opinion or provide any assurance. Other Information Our audit was conducted for the purpose of forming opinions on the financial statements that collectively comprise the Rockwood R-VI School District’s basic financial statements. The introductory section on pages i through xxiiii, budgetary comparison information on pages 58 through 60, the statistical information on pages 61 through 86 and the schedule of selected statistics on pages 88 through 91 are presented for purposes of additional analysis and are not a required part of the financial statements. The schedule of expenditures of federal awards on page 97 is presented for purposes of additional analysis as required by the U.S. Office of Management and Budget Circular A-133, Audits of States, Local Governments, and Non-Profit Organizations, and is also not a required part of the basic financial statements.

3
The budgetary comparison information and the schedule of expenditures of federal awards are the responsibility of management and were derived from and relate directly to the underlying accounting and other records used to prepare the basic financial statements. Such information has been subjected to the auditing procedures applied in the audit of the basic financial statements and certain additional procedures, including comparing and reconciling such information directly to the underlying accounting and other records used to prepare the basic financial statements or the basic financial statements themselves, and other additional procedures in accordance with auditing standards generally accepted in the United States of America. In our opinion, the information is fairly stated in all material respects in relation to the basic financial statements as a whole.
The introductory section, statistical section and schedule of selected statistics have not been subjected to the auditing procedures applied in the audit of the basic financial statements and, accordingly, we do not express an opinion or provide an assurance on them.
St. Louis, Missouri December 10, 2014


ROCKWOOD SCHOOL DISTRICT
St. Louis County, Missouri MANAGEMENT’S DISCUSSION AND ANALYSIS
THE YEAR ENDED JUNE 30, 2014 (UNAUDITED)
The Management’s Discussion and Analysis (MD&A) of Rockwood School District’s (District) financial performance provides a comprehensive overview of the District’s financial activities and the results of operations for the fiscal year ended June 30, 2014. Readers of the District statements, including this MD&A, are encouraged to review the notes to the basic financial statements to enhance their understanding of the District’s financial performance. The MD&A is provided at the beginning of the audit report to communicate the past and current position of the District’s financial condition. Financial Highlights The key government-wide financial highlights for FY14 are as follows: At the government-wide level, the net position was $293.2 million compared to $285.7
million at the end of FY13 for an increase of $7.5 million. Of the $293.2 million of net position (assets less liabilities), $221.4 million is restricted for net investment in capital assets. At June 30, 2014, $49.7 million of net position is restricted by Missouri Statute for: debt service ($16.7 million), certified employees compensation and benefits ($20.8 million), and capital projects ($12.2 million). Net position restricted for debt service decreased $2.7 million as the District continues to pay off remaining general obligation debt. Net position restricted for certified employees compensation and benefits decreased $7.9 million. The decrease in the restricted net position for certified employees compensation and benefits is attributed to salary and benefit increases as well as the redistribution of the respective tax levy allocating local revenue to other areas of the District. In FY14, the District approved a plan to fund certain non-recurring capital projects. To fund these projects the District had to reallocate a portion of the tax levy to the capital projects, which contributed to the $9.2 million increase in net position restricted for capital projects.
The remaining $22.1 million is unrestricted and may be used to finance day-to-day activities without constraints. Unrestricted net position decreased $6.3 million as a result of increased personnel costs such as compensated absences and salary and benefit costs as well as increased costs associated with the District’s postemployment benefits other than pensions.
Administrative Center Dan Steinbruegge, CPA 111 East North Street Director of Finance Eureka, MO 63025-1229
(636) 733-2058
(636) 938-2265 Fax
Growing Together, Learning for Life
4

ROCKWOOD SCHOOL DISTRICT St. Louis County, Missouri
MANAGEMENT DISCUSSION AND ANALYSIS FOR THE YEAR ENDED JUNE 30, 2014
(UNAUDITED) (continued)
Total assets decreased $40 million in the current year. The decrease in current assets of $34.4
million is mainly in cash as the District had approximately $35 million in restricted cash from a prior year advance refunding for the purpose of paying general obligation debt requirements. This restricted cash was released in the current year to settle those requirements that came due in the current fiscal year. The decrease in noncurrent assets is primarily because depreciation on the District’s capital assets was approximately $12.1 million which more than offset the additions of $6.6 million.
Total liabilities decreased $47.6 million in the current year. The District’s long-term obligations had a net decrease of $56.1 million primarily due to the reduction on outstanding principal from the District’s general obligation bonds. That decrease was offset by a $6.4 million increase in accounts payable and other current liabilities. The District had approximately $3.2 million in construction projects expenditures that were accrued as of June 30, 2014. Of the total long-term obligations, $21.8 million is classified as current as this represents the amount due within one year of June 30, 2014.
General revenues accounted for $219.4 million or 86% of the District’s $255.9 million total
revenue. Of this general revenue, $184.3 million or 72% was from local effort including all taxes and the revenue from the Voluntary Student Transfer program. Program specific revenue in the form of charges for services and operating grants and contributions accounted for approximately $36.4 million or 14% of the total revenue.
The dependence upon local tax revenues is apparent. Approximately 74% of instructional activities are supported through local effort (mainly taxes) showing, again, that the community is the primary support for this District. The assessed valuation for the fiscal year ended June 30, 2014, decreased $77,193,650 (2.4%) to $3,196,042,640 from the prior year. The District’s tax rate increased $0.148 as a result of the decrease in assessed valuation and a process called recoupment. The State statute allows a District to recoup lost taxes from settlement reductions with an individual taxpayer. The process involves recalculating the tax rate for each year affected by the settlement. For FY14, this process netted the District an additional $0.04 towards the tax rate. As a result, the District’s revenues from property taxes increased $2.8 million for the year ended June 30, 2014 compared to June 30, 2013, but revenues from other local and intermediate sources decreased $0.5 million. The District’s revenue from the State remained flat in FY14 compared to FY13 but revenue from Federal sources decreased $0.8 million as a result of decrease federal funding in Title programs.
At the government-wide level, the District had $248.3 million in expenses. Of these expenses
approximately $36.4 million were offset by program specific charges for services, grants or contributions. General revenues were adequate to provide for the District’s programs in FY14.
5

ROCKWOOD SCHOOL DISTRICT St. Louis County, Missouri
MANAGEMENT DISCUSSION AND ANALYSIS FOR THE YEAR ENDED JUNE 30, 2014
(UNAUDITED) (continued)
6
Enrollment The District served a student body of 21,498 students which included 19,607 resident students, 1,516 Voluntary Transfer Students (VTS) and 375 Special School District (287 resident and 88 VTS) students as of the September 2013 official enrollment. The District’s enrollment has experienced slight annual reductions over the last four years. The overall picture for the next few years reflects a slightly declining pattern with moderate residential growth and maintaining the proportionate number of voluntary transfer students from the City of St. Louis schools. The declining enrollment directly impacts the District’s funding from the State formula. Using this Annual Report The District’s annual report consists of a series of financial statements that show information for the District as a whole including the Rockwood School District Educational Facilities Authority (a component unit) and its individual funds. The Statements of Net Position on page 15 and the Statements of Activities on pages 16 and 17 provide information about the activities of the Government as a whole based on the accrual basis of accounting and present a longer-term view of the District’s finances. The Fund Financial Statements, the Balance Sheets–Governmental Funds and Statements of Revenue, Expenditures and Changes in Fund Balances, provide the next level of detail about the District’s four required funds; the General Fund, the Special Revenue (Teacher’s) Fund, the Debt Service Fund and the Capital Projects Fund. These statements tell how the District financed program services in the short-term, as well as what remains for future spending. The fund level statements are prepared on the modified accrual basis of accounting and include a bridge schedule to reconcile them to the government-wide level statements. These statements provide a comparative look at FY14 versus the prior year. The annual report also includes the notes to the basic financial statements. The user of the annual report should read the independent auditors’ report, as well as the notes to the basic financial statements, to gain a clear picture of the financial position of the District. Reporting the District as a Whole The District adheres to Missouri State requirements for school districts and uses four major funds to account for the revenues, programs and activities each fiscal year. These statements provide information on these funds individually, and the view of the District as a whole. The Statement of Activities answers the question of how well did the District do financially during the year. The Statement of Activities explains the types of resources: revenues, charges for services, grants and contributions and the uses of resources: instructional and support services expenses. In addition, the Statement of Net Position reports the District’s net position and changes in those assets and liabilities or claims against those assets. This statement tells the reader that, for the District as a whole, the financial position during the current year has either improved or diminished.
ROCKWOOD SCHOOL DISTRICT St. Louis County, Missouri
MANAGEMENT DISCUSSION AND ANALYSIS FOR THE YEAR ENDED JUNE 30, 2014
(UNAUDITED) (continued)
7
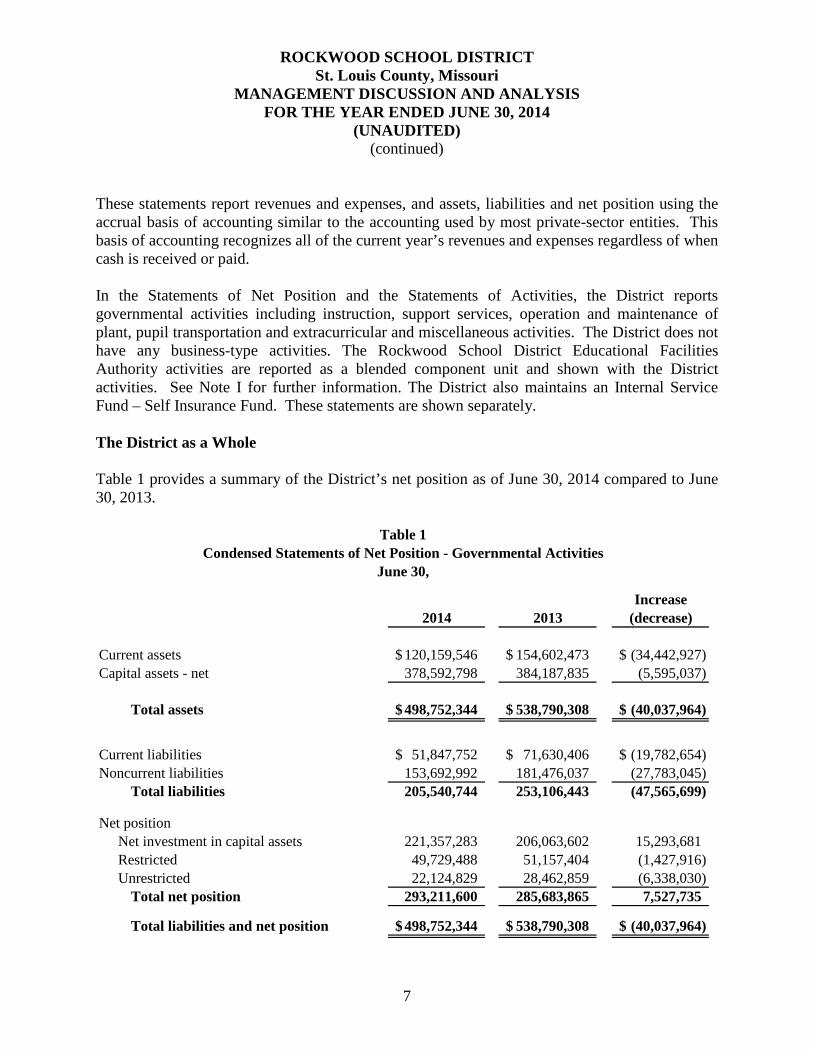
These statements report revenues and expenses, and assets, liabilities and net position using the accrual basis of accounting similar to the accounting used by most private-sector entities. This basis of accounting recognizes all of the current year’s revenues and expenses regardless of when cash is received or paid. In the Statements of Net Position and the Statements of Activities, the District reports governmental activities including instruction, support services, operation and maintenance of plant, pupil transportation and extracurricular and miscellaneous activities. The District does not have any business-type activities. The Rockwood School District Educational Facilities Authority activities are reported as a blended component unit and shown with the District activities. See Note I for further information. The District also maintains an Internal Service Fund – Self Insurance Fund. These statements are shown separately. The District as a Whole Table 1 provides a summary of the District’s net position as of June 30, 2014 compared to June 30, 2013.
Increase2014 2013 (decrease)
Current assets 120,159,546$ 154,602,473$ (34,442,927)$ Capital assets - net 378,592,798 384,187,835 (5,595,037)
Total assets 498,752,344$ 538,790,308$ (40,037,964)$
Current liabilities 51,847,752$ 71,630,406$ (19,782,654)$ Noncurrent liabilities 153,692,992 181,476,037 (27,783,045)
Total liabilities 205,540,744 253,106,443 (47,565,699)
Net positionNet investment in capital assets 221,357,283 206,063,602 15,293,681 Restricted 49,729,488 51,157,404 (1,427,916) Unrestricted 22,124,829 28,462,859 (6,338,030)
Total net position 293,211,600 285,683,865 7,527,735
Total liabilities and net position 498,752,344$ 538,790,308$ (40,037,964)$
Table 1Condensed Statements of Net Position - Governmental Activities
June 30,
ROCKWOOD SCHOOL DISTRICT St. Louis County, Missouri
MANAGEMENT DISCUSSION AND ANALYSIS FOR THE YEAR ENDED JUNE 30, 2014
(UNAUDITED) (continued)
8
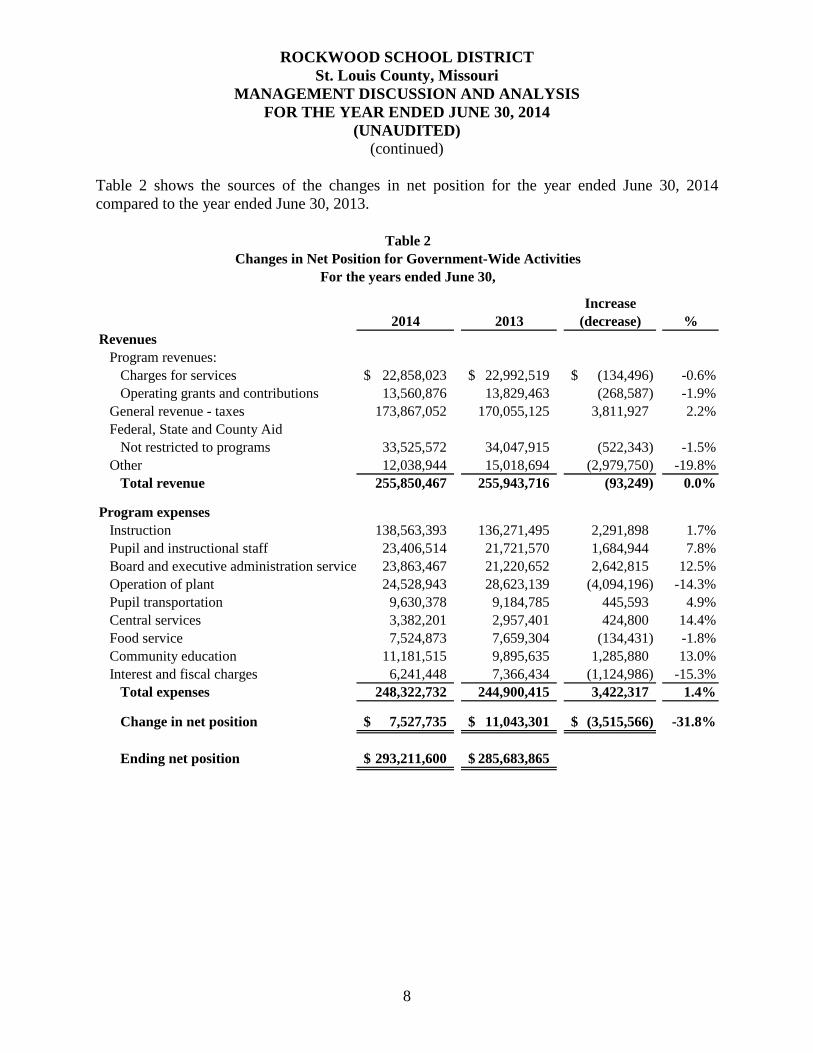
Table 2 shows the sources of the changes in net position for the year ended June 30, 2014 compared to the year ended June 30, 2013.
Increase2014 2013 (decrease) %
RevenuesProgram revenues:
Charges for services 22,858,023$ 22,992,519$ (134,496)$ -0.6%Operating grants and contributions 13,560,876 13,829,463 (268,587) -1.9%
General revenue - taxes 173,867,052 170,055,125 3,811,927 2.2%Federal, State and County Aid
Not restricted to programs 33,525,572 34,047,915 (522,343) -1.5%Other 12,038,944 15,018,694 (2,979,750) -19.8%
Total revenue 255,850,467 255,943,716 (93,249) 0.0%
Program expensesInstruction 138,563,393 136,271,495 2,291,898 1.7%Pupil and instructional staff 23,406,514 21,721,570 1,684,944 7.8%Board and executive administration service 23,863,467 21,220,652 2,642,815 12.5%Operation of plant 24,528,943 28,623,139 (4,094,196) -14.3%Pupil transportation 9,630,378 9,184,785 445,593 4.9%Central services 3,382,201 2,957,401 424,800 14.4%Food service 7,524,873 7,659,304 (134,431) -1.8%Community education 11,181,515 9,895,635 1,285,880 13.0%Interest and fiscal charges 6,241,448 7,366,434 (1,124,986) -15.3%
Total expenses 248,322,732 244,900,415 3,422,317 1.4%
Change in net position 7,527,735$ 11,043,301$ (3,515,566)$ -31.8%
Ending net position 293,211,600$ 285,683,865$
Table 2Changes in Net Position for Government-Wide Activities
For the years ended June 30,

ROCKWOOD SCHOOL DISTRICT St. Louis County, Missouri
MANAGEMENT DISCUSSION AND ANALYSIS FOR THE YEAR ENDED JUNE 30, 2014
(UNAUDITED) (continued)
9
The Statements of Activities show the cost of program services and any charges for services and grants offsetting those services, which are defined as net cost of services. Table 3 shows the total cost of services and the net cost of services. This table identifies the amount of the total cost of services, including depreciation, supported by tax revenue, other local effort, and unrestricted entitlements.
Total cost Net cost Total cost Net costof services of services of services of services
Instruction 138,563,393$ 124,324,104$ 136,271,495$ 121,648,880$ Pupil and instructional staff 23,406,514 23,027,970 21,721,570 21,377,871 Board and executive
administration services 23,863,467 23,862,764 21,220,652 21,212,779 Operation of plant 24,528,943 24,497,658 28,623,139 28,614,180 Pupil transportation 9,630,378 6,060,888 9,184,785 5,799,589 Central services 3,382,201 3,071,985 2,957,401 2,395,251 Food service 7,524,873 (755,695) 7,659,304 (682,200) Community education 11,181,515 1,572,711 9,895,635 345,649 Interest and fiscal charges 6,241,448 6,241,448 7,366,434 7,366,434
Total 248,322,732$ 211,903,833$ 244,900,415$ 208,078,433$
2014 2013
Table 3Total and Net Costs of Governmental Activities
For the years ended June 30,
ROCKWOOD SCHOOL DISTRICT St. Louis County, Missouri
MANAGEMENT DISCUSSION AND ANALYSIS FOR THE YEAR ENDED JUNE 30, 2014
(UNAUDITED) (continued)
10
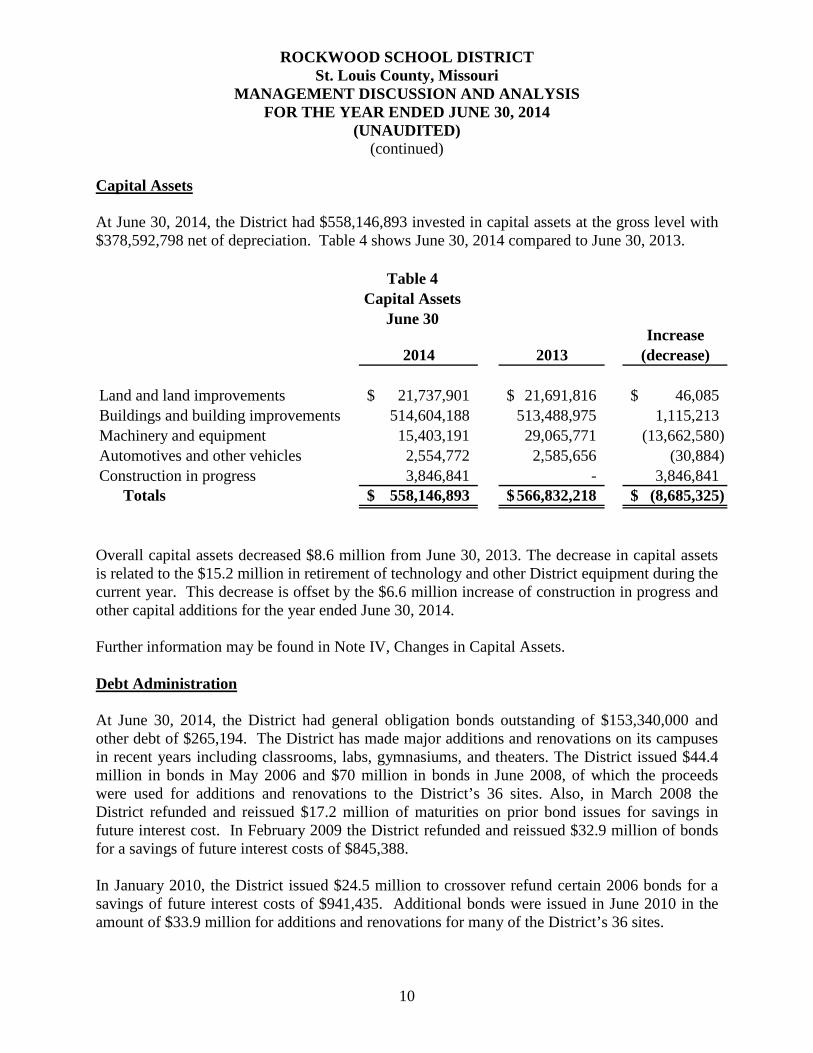
Capital Assets At June 30, 2014, the District had $558,146,893 invested in capital assets at the gross level with $378,592,798 net of depreciation. Table 4 shows June 30, 2014 compared to June 30, 2013.
Increase2014 2013 (decrease)
Land and land improvements 21,737,901$ 21,691,816$ 46,085$ Buildings and building improvements 514,604,188 513,488,975 1,115,213 Machinery and equipment 15,403,191 29,065,771 (13,662,580) Automotives and other vehicles 2,554,772 2,585,656 (30,884) Construction in progress 3,846,841 - 3,846,841
Totals 558,146,893$ 566,832,218$ (8,685,325)$
Table 4Capital Assets
June 30
Overall capital assets decreased $8.6 million from June 30, 2013. The decrease in capital assets is related to the $15.2 million in retirement of technology and other District equipment during the current year. This decrease is offset by the $6.6 million increase of construction in progress and other capital additions for the year ended June 30, 2014. Further information may be found in Note IV, Changes in Capital Assets. Debt Administration At June 30, 2014, the District had general obligation bonds outstanding of $153,340,000 and other debt of $265,194. The District has made major additions and renovations on its campuses in recent years including classrooms, labs, gymnasiums, and theaters. The District issued $44.4 million in bonds in May 2006 and $70 million in bonds in June 2008, of which the proceeds were used for additions and renovations to the District’s 36 sites. Also, in March 2008 the District refunded and reissued $17.2 million of maturities on prior bond issues for savings in future interest cost. In February 2009 the District refunded and reissued $32.9 million of bonds for a savings of future interest costs of $845,388. In January 2010, the District issued $24.5 million to crossover refund certain 2006 bonds for a savings of future interest costs of $941,435. Additional bonds were issued in June 2010 in the amount of $33.9 million for additions and renovations for many of the District’s 36 sites.

ROCKWOOD SCHOOL DISTRICT St. Louis County, Missouri
MANAGEMENT DISCUSSION AND ANALYSIS FOR THE YEAR ENDED JUNE 30, 2014
(UNAUDITED) (continued)
11
In September 2010, two issues were sold for $7.3 million and $13.8 million, respectively, for additions and renovations for many of the District’s 36 sites. In July 2011, the District issued $9.9 million to crossover refund certain 2006 bonds for a savings of future interest costs of $249,660. Table 5 shows June 30, 2014 compared to June 30, 2013.
Increase2014 2013 (decrease)
Bonds Issued2006 -$ 39,000,000$ (39,000,000)$ 2008 57,200,000 61,150,000 (3,950,000) 2009 10,470,000 20,290,000 (9,820,000) 2010 75,765,000 76,565,000 (800,000) 2011 9,905,000 9,905,000 -
Total bonded debt 153,340,000 206,910,000 (53,570,000)
Energy Financing 265,194 355,215 (90,021)
Total all obligations 153,605,194$ 207,265,215$ (53,660,021)$
June 30
Table 5Outstanding Obligations
Other long-term obligations include accrued compensated absences and other post-employment benefit obligations. Further information may be found in Note V, Changes in Long-Term Obligations. Missouri statute allows school districts to incur debt up to an amount equal to 15% of the most current assessed valuation. The District’s allowable debt level ceiling was $479.4 million at June 30, 2014, far above the District’s current level of debt. Missouri law also requires school districts to set a tax levy adequate to service the outstanding debt. The District’s Debt Service levy for FY14 was $ .68 on each $100 of assessed valuation. The Debt Service Fund balance at June 30, 2014, was $18.8 million. The District maintains an AAA bond rating.
ROCKWOOD SCHOOL DISTRICT St. Louis County, Missouri
MANAGEMENT DISCUSSION AND ANALYSIS FOR THE YEAR ENDED JUNE 30, 2014
(UNAUDITED) (continued)
12
Reporting the District’s Most Significant Funds The District’s Funds The District had actual revenues of $256.2 million and actual expenditures of $296.7 million, which resulted in an overall fund balance decrease of $40.5 million from $126.7 million in 2013 to $86.2 million in 2014. The General Fund balance decreased $3.6 million, the Teachers Fund decreased $7.7 million, the Debt Service Fund decreased $38.1 million and the Capital Projects Fund increased $8.8 million. Schedules showing the District’s original and final budget compared with actual operating results are provided in the CAFR on pages 54 and 55 for the General Fund and Teachers (Special Revenue) Fund and on pages 58 to 60 for the Debt Service Fund, Capital Projects Fund and all government funds. The District’s budget and reporting structure follow the statutes of the State of Missouri and as such consists of four major funds: the General Fund, the Teachers (Special Revenue) Fund, the Debt Service Fund and the Capital Projects Fund. At the fund level, the District accounts for the annual activities and prepares the budget using the modified accrual basis of accounting. Revenues are recognized in the accounting period in which they become measurable and available or collectible within sixty days after the end of the current period (June 30). Expenditures are recognized in the accounting period in which the liability is incurred, if measurable, except for unmatured interest on general long-term debt, which is recognized when due. The General Fund actual revenues of $85.1 million, $87.6 million of expenditures and $1.0 million in transfers resulted in a decrease in fund balance of $3.6 million to $36.4 million. The decrease in fund balance was from an increase in salary and benefits and in transportation of the District’s students. The Teacher’s (Special Revenue) Fund had actual revenues of $129.4 million and $137.0 million of expenditures resulting in a decrease in fund balance of $7.7 million to $19.3 million. With a healthy fund balance the District was able to redistribute a portion of the tax levy from the Teacher’s Fund to the Capital Projects Fund. This fund also realized approximately $2.5 million increase in salary and benefit costs in FY14 compared to FY13. The Debt Service Fund had revenues of $24.3 million and $62.4 million of expenditures to decrease the fund balance by $38.1 million to $18.8 million. The decrease in fund balance is directly related to the District paying off general obligation debt based on the current maturity schedules. Principal payments increased $37.5 million in FY14 over FY13.

ROCKWOOD SCHOOL DISTRICT St. Louis County, Missouri
MANAGEMENT DISCUSSION AND ANALYSIS FOR THE YEAR ENDED JUNE 30, 2014
(UNAUDITED) (continued)
13
The Capital Projects Fund revenue was $17.4 million against expenditures of $9.6 million. At June 30, 2014, the fund balance increased by $8.8 million to $11.8 million. With regards to capital purchases, the District has traditionally relied on bond issues to fund these needs. Certain capital projects, based on a detailed capital needs review, were determined to be necessary resulting in the redistribution of the 2013 tax levy for the purpose of funding these non-recurring capital needs. Included in the other financing sources were fund transfers from the General Fund to meet state accounting requirements. For the Future Rockwood School District continues to be in excellent financial health and is committed to wise financial management. The operating fund balances are 26% of expenditures. The current Board of Education policy is to ensure year-end operating fund balances equal to 18% of the subsequent budgeted annual operating expenditures plus an additional 4% of expenditures for a stabilization fund. Over the next few years the District will be faced with many financial constraints. Revenue sources are projected to remain relatively flat over next three fiscal years. The estimated modest increases in revenue from local sources will be partially offset by decreases in funding from the State formula as the recent trend of declining enrollment will impact future funding. The District adjusts its staff based on projected enrollment, but this decrease is more than offset by a commitment to raise average staff salaries to the St. Louis County school district median. The District is also planning to continue the reinstatement of funding for curriculum development that was put on hold during the recent downturn in the economy. The Rockwood School District has a long tradition of success and has demonstrated an ability to make appropriate changes to meet the needs of District students. The District’s systems for financial planning, budgeting and internal control are well regarded. The District will continue to be prudent in financial management in order to meet the challenges of the future.
ROCKWOOD SCHOOL DISTRICT St. Louis County, Missouri
MANAGEMENT DISCUSSION AND ANALYSIS FOR THE YEAR ENDED JUNE 30, 2014
(UNAUDITED) (continued)
14
Contacting the District’s Financial Management: This report is designed to give an overview of the financial conditions of the Rockwood School District. If you desire additional information, you may contact the following persons: Tim Rooney, CPA
Chief Financial and Legislative Officer 636-733-2020 Dan Steinbruegge, CPA Director of Finance 636-733-2058


The notes to the basic financial statements are an integral part of these statements.15
2014 2013ASSETS
Current assetsCash and temporary investments 111,621,213$ 148,021,920$ Taxes receivable - net of allowance for uncollectibles 5,566,958 3,959,654 Other receivables 1,071,597 666,954 Inventory 793,810 846,346 Prepaid items 1,105,968 1,107,599
Total current assets 120,159,546 154,602,473
Noncurrent assetsLand 13,659,234 13,659,234 Construction in progress 3,846,841 - Depreciated capital assets 540,640,818 553,172,984 Less accumulated depreciation (179,554,095) (182,644,383)
Total noncurrent assets 378,592,798 384,187,835
TOTAL ASSETS 498,752,344$ 538,790,308$
LIABILITIESCurrent liabilities
Accounts payable and other current liabilities 24,183,074$ 17,747,470$ Self-funded insurance 5,499,081 5,166,622 Unearned revenue 407,393 183,572 Current portion of long-term obligations 21,758,204 48,532,742
Total current liabilities 51,847,752 71,630,406
Noncurrent liabilitiesNoncurrent portion of long-term obligations 139,633,082 168,934,212 Other payables 14,059,910 12,541,825
Total noncurrent liabilities 153,692,992 181,476,037
Total liabilities 205,540,744 253,106,443
NET POSITIONNet investment in capital assets 221,357,283 206,063,602 Restricted for
Debt service 16,672,469 19,341,935 Certified employees compensation and benefits 20,835,465 28,778,181 Capital projects 12,221,554 3,037,288
Unrestricted 22,124,829 28,462,859 Total net position 293,211,600 285,683,865
TOTAL LIABILITIES AND NET POSITION 498,752,344$ 538,790,308$
ROCKWOOD R-VI SCHOOL DISTRICT
STATEMENTS OF NET POSITIONJUNE 30,
Governmental activities
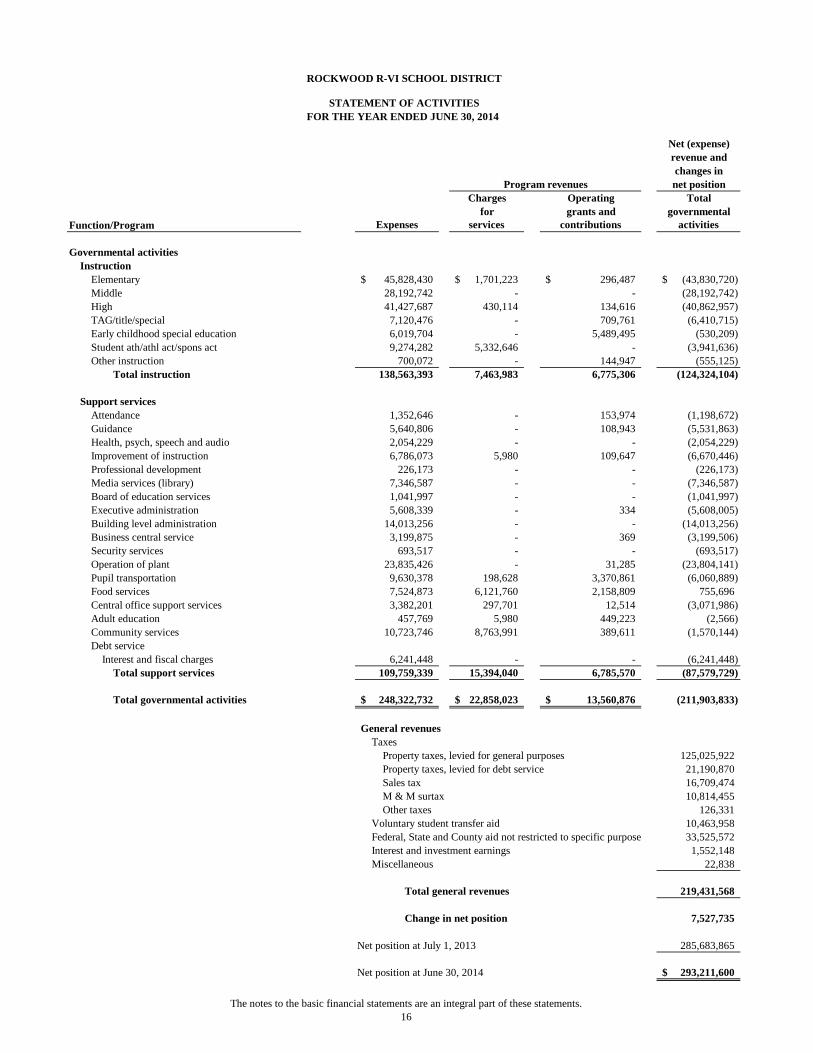
The notes to the basic financial statements are an integral part of these statements.16
Net (expense)revenue andchanges in
net positionCharges Operating Total
for grants and governmentalFunction/Program Expenses services contributions activities
Governmental activitiesInstruction
Elementary 45,828,430$ 1,701,223$ 296,487$ (43,830,720)$ Middle 28,192,742 - - (28,192,742) High 41,427,687 430,114 134,616 (40,862,957) TAG/title/special 7,120,476 - 709,761 (6,410,715) Early childhood special education 6,019,704 - 5,489,495 (530,209) Student ath/athl act/spons act 9,274,282 5,332,646 - (3,941,636) Other instruction 700,072 - 144,947 (555,125)
Total instruction 138,563,393 7,463,983 6,775,306 (124,324,104)
Support servicesAttendance 1,352,646 - 153,974 (1,198,672) Guidance 5,640,806 - 108,943 (5,531,863) Health, psych, speech and audio 2,054,229 - - (2,054,229) Improvement of instruction 6,786,073 5,980 109,647 (6,670,446) Professional development 226,173 - - (226,173) Media services (library) 7,346,587 - - (7,346,587) Board of education services 1,041,997 - - (1,041,997) Executive administration 5,608,339 - 334 (5,608,005) Building level administration 14,013,256 - - (14,013,256) Business central service 3,199,875 - 369 (3,199,506) Security services 693,517 - - (693,517) Operation of plant 23,835,426 - 31,285 (23,804,141) Pupil transportation 9,630,378 198,628 3,370,861 (6,060,889) Food services 7,524,873 6,121,760 2,158,809 755,696 Central office support services 3,382,201 297,701 12,514 (3,071,986) Adult education 457,769 5,980 449,223 (2,566) Community services 10,723,746 8,763,991 389,611 (1,570,144) Debt service
Interest and fiscal charges 6,241,448 - - (6,241,448) Total support services 109,759,339 15,394,040 6,785,570 (87,579,729)
Total governmental activities 248,322,732$ 22,858,023$ 13,560,876$ (211,903,833)
General revenuesTaxes
125,025,922 21,190,870 16,709,474 10,814,455
126,331 10,463,958 33,525,572
1,552,148 22,838
219,431,568
7,527,735
Net position at July 1, 2013 285,683,865
Net position at June 30, 2014 293,211,600$
M & M surtax
Total general revenues
Change in net position
Voluntary student transfer aidFederal, State and County aid not restricted to specific purposeInterest and investment earningsMiscellaneous
FOR THE YEAR ENDED JUNE 30, 2014 STATEMENT OF ACTIVITIES
ROCKWOOD R-VI SCHOOL DISTRICT
Property taxes, levied for general purposesProperty taxes, levied for debt service
Other taxes
Program revenues
Sales tax
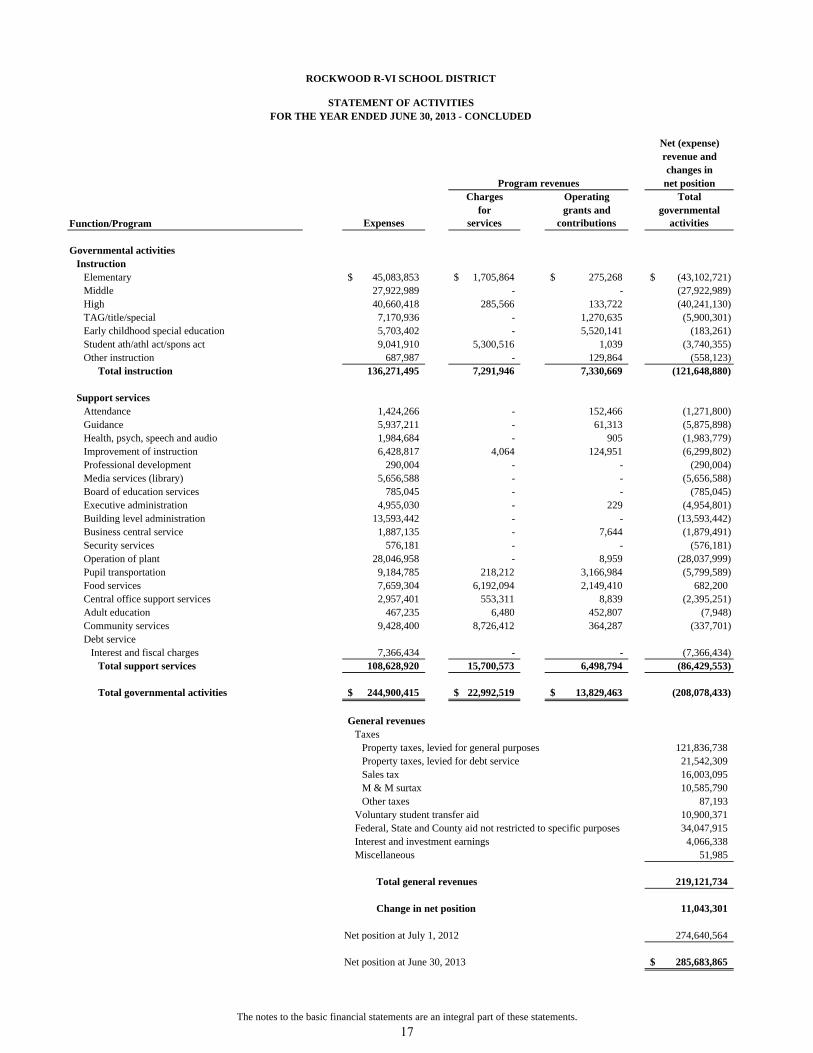
Net (expense)revenue andchanges in
net positionCharges Operating Total
for grants and governmentalFunction/Program Expenses services contributions activities
Governmental activitiesInstruction
Elementary 45,083,853$ 1,705,864$ 275,268$ (43,102,721)$ Middle 27,922,989 - - (27,922,989) High 40,660,418 285,566 133,722 (40,241,130) TAG/title/special 7,170,936 - 1,270,635 (5,900,301) Early childhood special education 5,703,402 - 5,520,141 (183,261) Student ath/athl act/spons act 9,041,910 5,300,516 1,039 (3,740,355) Other instruction 687,987 - 129,864 (558,123)
Total instruction 136,271,495 7,291,946 7,330,669 (121,648,880)
Support servicesAttendance 1,424,266 - 152,466 (1,271,800) Guidance 5,937,211 - 61,313 (5,875,898) Health, psych, speech and audio 1,984,684 - 905 (1,983,779) Improvement of instruction 6,428,817 4,064 124,951 (6,299,802) Professional development 290,004 - - (290,004) Media services (library) 5,656,588 - - (5,656,588) Board of education services 785,045 - - (785,045) Executive administration 4,955,030 - 229 (4,954,801) Building level administration 13,593,442 - - (13,593,442) Business central service 1,887,135 - 7,644 (1,879,491) Security services 576,181 - - (576,181) Operation of plant 28,046,958 - 8,959 (28,037,999) Pupil transportation 9,184,785 218,212 3,166,984 (5,799,589) Food services 7,659,304 6,192,094 2,149,410 682,200 Central office support services 2,957,401 553,311 8,839 (2,395,251) Adult education 467,235 6,480 452,807 (7,948) Community services 9,428,400 8,726,412 364,287 (337,701) Debt service
Interest and fiscal charges 7,366,434 - - (7,366,434) Total support services 108,628,920 15,700,573 6,498,794 (86,429,553)
Total governmental activities 244,900,415$ 22,992,519$ 13,829,463$ (208,078,433)
General revenuesTaxes
121,836,738 21,542,309 16,003,095 10,585,790
87,193 10,900,371 34,047,915
4,066,338 51,985
219,121,734
11,043,301
Net position at July 1, 2012 274,640,564
Net position at June 30, 2013 285,683,865$
Federal, State and County aid not restricted to specific purposesInterest and investment earningsMiscellaneous
Total general revenues
Change in net position
Property taxes, levied for general purposesProperty taxes, levied for debt serviceSales taxM & M surtaxOther taxes
Voluntary student transfer aid
ROCKWOOD R-VI SCHOOL DISTRICT
STATEMENT OF ACTIVITIESFOR THE YEAR ENDED JUNE 30, 2013 - CONCLUDED
Program revenues
The notes to the basic financial statements are an integral part of these statements.17
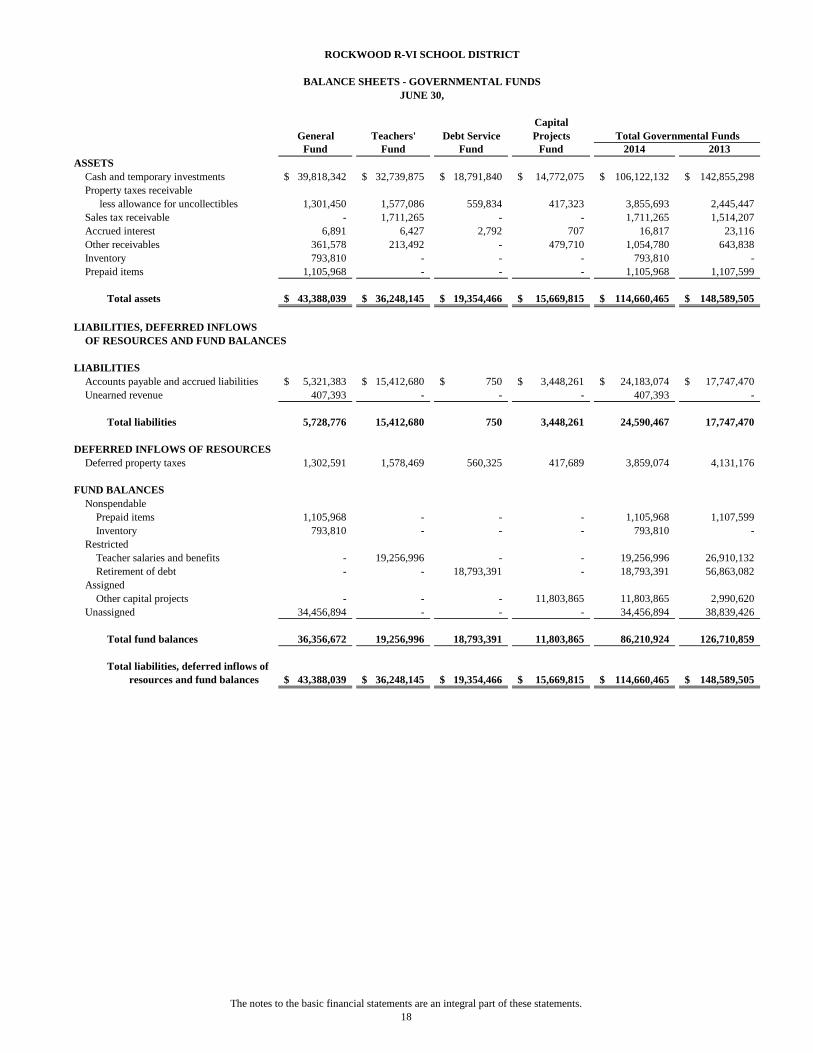
The notes to the basic financial statements are an integral part of these statements.18
CapitalGeneral Teachers' Debt Service Projects
Fund Fund Fund Fund 2014 2013ASSETS
Cash and temporary investments 39,818,342$ 32,739,875$ 18,791,840$ 14,772,075$ 106,122,132$ 142,855,298$ Property taxes receivable
less allowance for uncollectibles 1,301,450 1,577,086 559,834 417,323 3,855,693 2,445,447 Sales tax receivable - 1,711,265 - - 1,711,265 1,514,207 Accrued interest 6,891 6,427 2,792 707 16,817 23,116 Other receivables 361,578 213,492 - 479,710 1,054,780 643,838 Inventory 793,810 - - - 793,810 - Prepaid items 1,105,968 - - - 1,105,968 1,107,599
Total assets 43,388,039$ 36,248,145$ 19,354,466$ 15,669,815$ 114,660,465$ 148,589,505$
LIABILITIES, DEFERRED INFLOWS OF RESOURCES AND FUND BALANCES
LIABILITIESAccounts payable and accrued liabilities 5,321,383$ 15,412,680$ 750$ 3,448,261$ 24,183,074$ 17,747,470$ Unearned revenue 407,393 - - - 407,393 -
Total liabilities 5,728,776 15,412,680 750 3,448,261 24,590,467 17,747,470
DEFERRED INFLOWS OF RESOURCESDeferred property taxes 1,302,591 1,578,469 560,325 417,689 3,859,074 4,131,176
FUND BALANCES Nonspendable
Prepaid items 1,105,968 - - - 1,105,968 1,107,599 Inventory 793,810 - - - 793,810 -
RestrictedTeacher salaries and benefits - 19,256,996 - - 19,256,996 26,910,132 Retirement of debt - - 18,793,391 - 18,793,391 56,863,082
AssignedOther capital projects - - - 11,803,865 11,803,865 2,990,620
Unassigned 34,456,894 - - - 34,456,894 38,839,426
Total fund balances 36,356,672 19,256,996 18,793,391 11,803,865 86,210,924 126,710,859
Total liabilities, deferred inflows ofresources and fund balances 43,388,039$ 36,248,145$ 19,354,466$ 15,669,815$ 114,660,465$ 148,589,505$
ROCKWOOD R-VI SCHOOL DISTRICT
BALANCE SHEETS - GOVERNMENTAL FUNDSJUNE 30,
Total Governmental Funds

The notes to the basic financial statements are an integral part of this statement.19
Amounts reported for governmental activities in the statement of net position are different because:
Total fund balance - governmental funds 86,210,924$
The cost of capital assets is 558,146,893$ Accumulated depreciation is (179,554,095) 378,592,798
3,859,074
Bonds payable (153,340,000) Accrued interest payable (2,681,247) Other debt (265,194) Compensated absences (7,801,841) Postemployment benefits other than pensions (7,732,593) Bond premium - unamortized (4,123,449) Bond discount - unamortized 493,128 (175,451,196)
Total net position - governmental activities 293,211,600$
consist of:
Long-term liabilities, including bonds payable, are not due and payable in the current period(net of retirements) and therefore are not reported as liabilities in the funds. These liabilities
Capital assets reported in District activities are not financial resources and therefore arenot reported as assets in the funds statements.
ROCKWOOD R-VI SCHOOL DISTRICT
RECONCILIATION OF THE BALANCE SHEET OFGOVERNMENTAL FUNDS TO THE STATEMENT OF NET POSITION
JUNE 30, 2014
Property taxes receivable will be collected this year, but are not available soon enough topay for the current period's expenditures, and therefore are deferred in the funds statements.
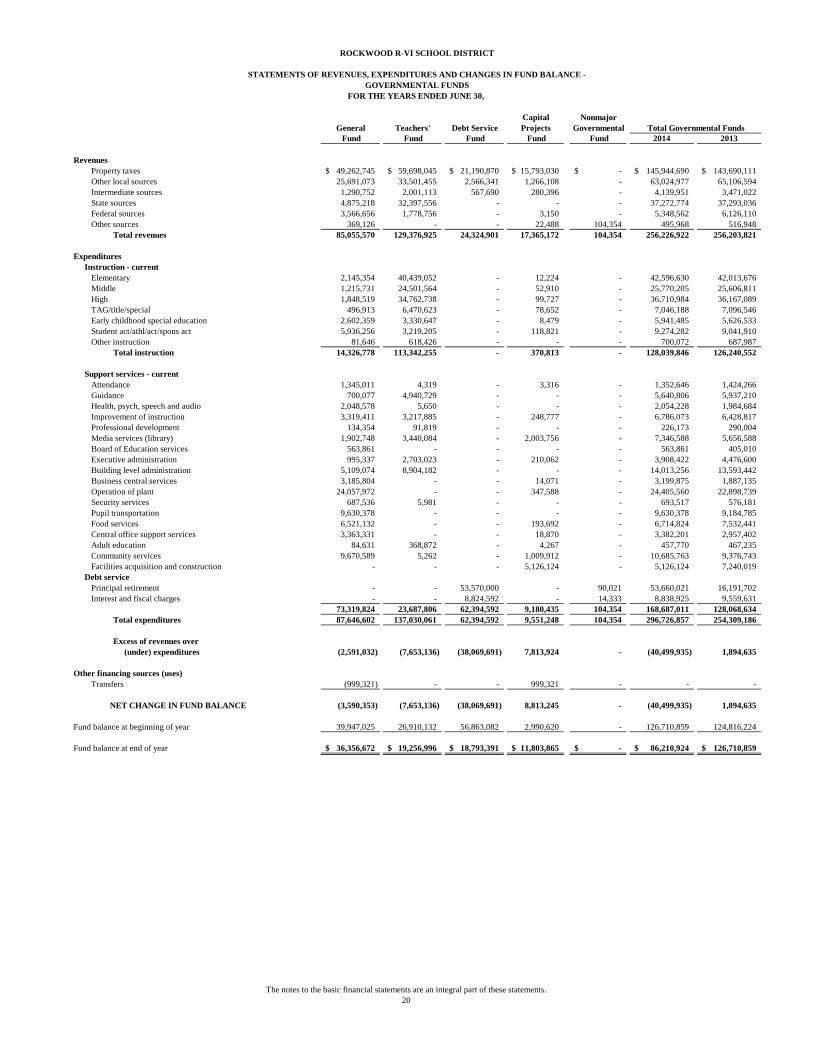
The notes to the basic financial statements are an integral part of these statements.20
Capital NonmajorGeneral Teachers' Debt Service Projects Governmental Fund Fund Fund Fund Fund 2014 2013
RevenuesProperty taxes 49,262,745$ 59,698,045$ 21,190,870$ 15,793,030$ -$ 145,944,690$ 143,690,111$ Other local sources 25,691,073 33,501,455 2,566,341 1,266,108 - 63,024,977 65,106,594 Intermediate sources 1,290,752 2,001,113 567,690 280,396 - 4,139,951 3,471,022 State sources 4,875,218 32,397,556 - - - 37,272,774 37,293,036 Federal sources 3,566,656 1,778,756 - 3,150 - 5,348,562 6,126,110 Other sources 369,126 - - 22,488 104,354 495,968 516,948
Total revenues 85,055,570 129,376,925 24,324,901 17,365,172 104,354 256,226,922 256,203,821
ExpendituresInstruction - current
Elementary 2,145,354 40,439,052 - 12,224 - 42,596,630 42,013,676 Middle 1,215,731 24,501,564 - 52,910 - 25,770,205 25,606,811 High 1,848,519 34,762,738 - 99,727 - 36,710,984 36,167,089 TAG/title/special 496,913 6,470,623 - 78,652 - 7,046,188 7,096,546 Early childhood special education 2,602,359 3,330,647 - 8,479 - 5,941,485 5,626,533 Student act/athl/act/spons act 5,936,256 3,219,205 - 118,821 - 9,274,282 9,041,910 Other instruction 81,646 618,426 - - - 700,072 687,987
Total instruction 14,326,778 113,342,255 - 370,813 - 128,039,846 126,240,552
Support services - currentAttendance 1,345,011 4,319 - 3,316 - 1,352,646 1,424,266 Guidance 700,077 4,940,729 - - - 5,640,806 5,937,210 Health, psych, speech and audio 2,048,578 5,650 - - - 2,054,228 1,984,684 Improvement of instruction 3,319,411 3,217,885 - 248,777 - 6,786,073 6,428,817 Professional development 134,354 91,819 - - - 226,173 290,004 Media services (library) 1,902,748 3,440,084 - 2,003,756 - 7,346,588 5,656,588 Board of Education services 563,861 - - - - 563,861 405,010 Executive administration 995,337 2,703,023 - 210,062 - 3,908,422 4,476,600 Building level administration 5,109,074 8,904,182 - - - 14,013,256 13,593,442 Business central services 3,185,804 - - 14,071 - 3,199,875 1,887,135 Operation of plant 24,057,972 - - 347,588 - 24,405,560 22,898,739 Security services 687,536 5,981 - - - 693,517 576,181 Pupil transportation 9,630,378 - - - - 9,630,378 9,184,785 Food services 6,521,132 - - 193,692 - 6,714,824 7,532,441 Central office support services 3,363,331 - - 18,870 - 3,382,201 2,957,402 Adult education 84,631 368,872 - 4,267 - 457,770 467,235 Community services 9,670,589 5,262 - 1,009,912 - 10,685,763 9,376,743 Facilities acquisition and construction - - - 5,126,124 - 5,126,124 7,240,019
Debt servicePrincipal retirement - - 53,570,000 - 90,021 53,660,021 16,191,702 Interest and fiscal charges - - 8,824,592 - 14,333 8,838,925 9,559,631
73,319,824 23,687,806 62,394,592 9,180,435 104,354 168,687,011 128,068,634 Total expenditures 87,646,602 137,030,061 62,394,592 9,551,248 104,354 296,726,857 254,309,186
Excess of revenues over (under) expenditures (2,591,032) (7,653,136) (38,069,691) 7,813,924 - (40,499,935) 1,894,635
Other financing sources (uses)
Transfers (999,321) - - 999,321 - - -
NET CHANGE IN FUND BALANCE (3,590,353) (7,653,136) (38,069,691) 8,813,245 - (40,499,935) 1,894,635
Fund balance at beginning of year 39,947,025 26,910,132 56,863,082 2,990,620 - 126,710,859 124,816,224
Fund balance at end of year 36,356,672$ 19,256,996$ 18,793,391$ 11,803,865$ -$ 86,210,924$ 126,710,859$
ROCKWOOD R-VI SCHOOL DISTRICT
STATEMENTS OF REVENUES, EXPENDITURES AND CHANGES IN FUND BALANCE -GOVERNMENTAL FUNDS
FOR THE YEARS ENDED JUNE 30,
Total Governmental Funds

The notes to the basic financial statements are an integral part of these statements.21
Total net change in fund balances - total governmental funds (40,499,935)$
Capital asset purchases 6,551,610$ Depreciation expense (12,146,647) (5,595,037)
(272,102)
53,660,021
(590,310)
(662,774)
998,781
The fund financial statements do not recognize the liability related to postemployment benefits otherthan pensions. This liability is recognized in the Statement of Activities. (1,109,606)
1,598,697
Change in net position of governmental activities 7,527,735$
ROCKWOOD R-VI SCHOOL DISTRICT
RECONCILIATION OF THE STATEMENT OF REVENUES, EXPENDITURESAND CHANGES IN FUND BALANCE OF GOVERNMENTAL FUNDS WITH
FOR THE YEAR ENDED JUNE 30, 2014
Because some property taxes and other revenues will not be collected for several months after the District's fiscal year ends, they are not considered as available revenues in the governmental funds, and
THE STATEMENT OF ACTIVITIES
Repayment of long-term obligations is an expenditure in the governmental funds, but it reduces long-term
government-wide statements.
These liabilities are not recognized in the fund statements.and are based on actual days outstanding and estimated employees who are affected.The changes in liabilities for compensated absences are recorded in the Statement of Activities
change in inventory.
Inventory on hand, including donated commodities from government sources, is an asset in the
are instead counted as deferred property taxes. They are, however, recorded as revenues in the Statementof Activities. This includes the reversal of the prior year and the accrual of the current year.
Capital outlays to purchase or build capital assets are reported in governmental funds as expenditures.
thus requires the use of current financial resources. In the Statement of Activities, however, interest
However, for government-wide activities those costs are shown in the Statement of Net Position and
obligations in the Statement of Net Position and does not affect the Statement of Activities in the
allocated over their estimated useful lives as annual depreciation expenses in the Statement of Activities.This is the amount by which capital assets exceed depreciation in the period.
governmental funds because interest is recorded as an expenditure in the funds when it is due, and
of issuance on the General Obligation Bonds or other debt outstanding.
reported in the Statement of Activities is inclusive of both accrued interest and the interestaccreted on the District's "capital appreciation" bonds.
The fund statements do not recognize the establishment or amortization of premium, discount or cost
Interest on long-term obligations in the Statement of Activities differs from the amount reported in the
governmental fund statements and the Statement of Activities. This amount represents the change
expense is recognized as the interest accrues, regardless of when it is due. The interest

The notes to the basic financial statements are an integral part of these statements.22
2014 2013
CURRENT ASSETSCash and cash equivalents 5,499,081$ 5,166,622$
CURRENT LIABILITIESAccounts payable and accrued liabilities 5,499,081 5,166,622
NET POSITIONUnrestricted - -
Total liabilities and net position 5,499,081$ 5,166,622$
Governmental Activities -Internal Service Fund
ROCKWOOD R-VI SCHOOL DISTRICT
STATEMENTS OF NET POSITION - PROPRIETARY FUNDJUNE 30,
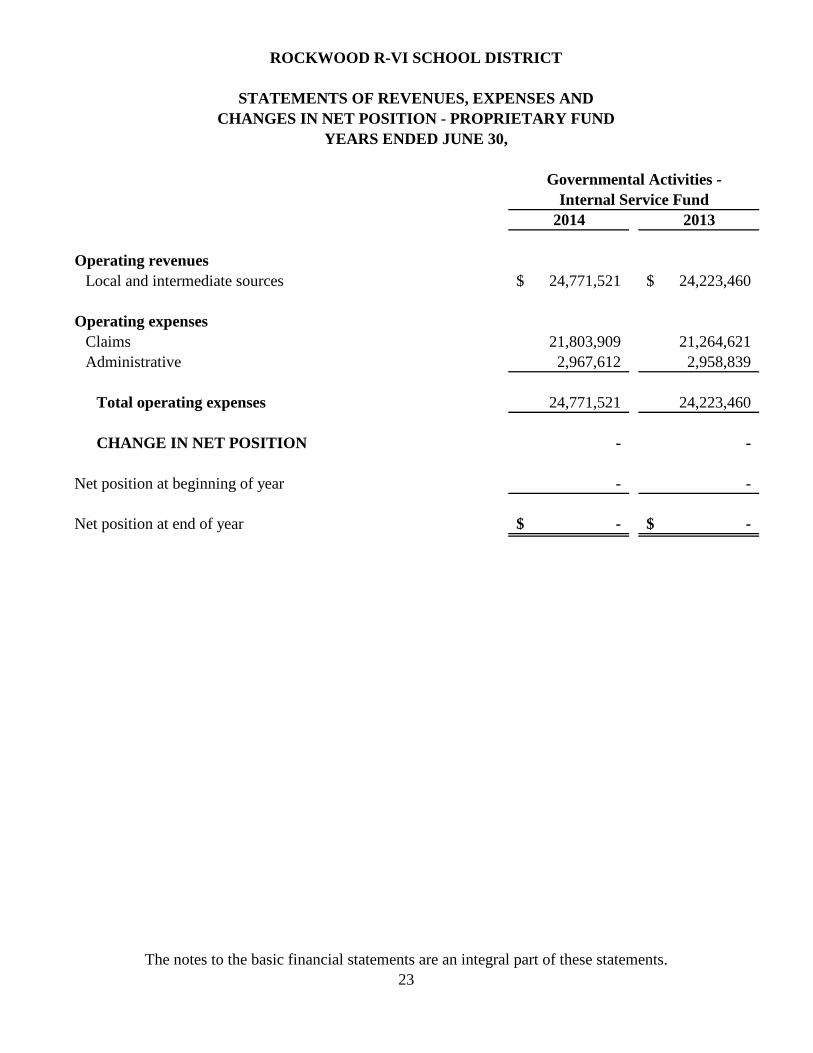
The notes to the basic financial statements are an integral part of these statements.23
2014 2013
Operating revenuesLocal and intermediate sources 24,771,521$ 24,223,460$
Operating expensesClaims 21,803,909 21,264,621 Administrative 2,967,612 2,958,839
Total operating expenses 24,771,521 24,223,460
CHANGE IN NET POSITION - -
Net position at beginning of year - -
Net position at end of year -$ -$
ROCKWOOD R-VI SCHOOL DISTRICT
CHANGES IN NET POSITION - PROPRIETARY FUNDYEARS ENDED JUNE 30,
Governmental Activities -Internal Service Fund
STATEMENTS OF REVENUES, EXPENSES AND
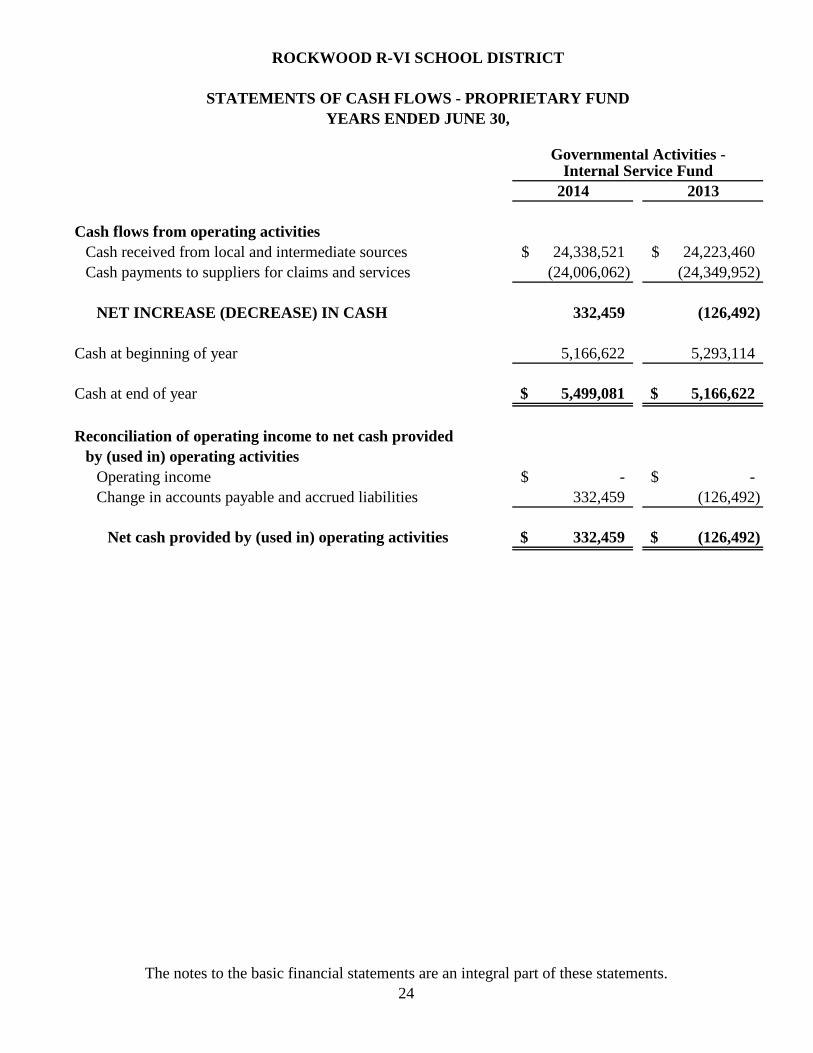
The notes to the basic financial statements are an integral part of these statements.24
2014 2013
Cash flows from operating activitiesCash received from local and intermediate sources 24,338,521$ 24,223,460$ Cash payments to suppliers for claims and services (24,006,062) (24,349,952)
NET INCREASE (DECREASE) IN CASH 332,459 (126,492)
Cash at beginning of year 5,166,622 5,293,114
Cash at end of year 5,499,081$ 5,166,622$
Reconciliation of operating income to net cash provided by (used in) operating activities
Operating income -$ -$ Change in accounts payable and accrued liabilities 332,459 (126,492)
Net cash provided by (used in) operating activities 332,459$ (126,492)$
ROCKWOOD R-VI SCHOOL DISTRICT
STATEMENTS OF CASH FLOWS - PROPRIETARY FUNDYEARS ENDED JUNE 30,
Governmental Activities -Internal Service Fund
ROCKWOOD R-VI SCHOOL DISTRICT
NOTES TO THE BASIC FINANCIAL STATEMENTS JUNE 30, 2014 AND 2013
I. SUMMARY OF SIGNIFICANT ACCOUNTING POLICIES
The financial statements of Rockwood R-VI School District have been prepared in conformity with accounting principles generally accepted in the United States of America (GAAP) as applied to governmental units. The Governmental Accounting Standards Board (GASB) is the accepted standard-setting body for establishing governmental accounting and financial reporting principles. Following are the more significant accounting policies of the District. Rockwood R-VI School District (the District) was established under the Statutes of the State of Missouri. The District operates as a "six director" district (with seven members of the Board of Education) as described in RSMo Chapter 162. The District provides educational services to primarily pre-kindergarten through high school students. The Rockwood School District Board of Education (The Board) is the basic level of government that has financial accountability and control over all activities related to public education in the District.
Reporting Entity
These financial statements present the District (primary government) and its component unit, the Rockwood School District Educational Facilities Authority (the Authority). As defined by applicable GASB statements, component units are legally separate entities that are included in the District’s reporting entity because of the significance of their operating or financial relationship with the District. The District is not a component unit of another reporting entity.
The District created the Authority, a nonprofit corporation, to partially finance construction of an Early Childhood Center and to pay off existing HVAC indebtedness. Although legally separate, the Authority is blended and presented as a “nonmajor governmental fund” in the accompanying financial statements. Separate financial statements for the Authority are not issued. Basis of Presentation The District’s basic financial statements consist of government-wide statements, including a Statement of Net Position and a Statement of Activities, and fund financial statements which provide a more detailed level of financial information. Summarized financial information for the year ended June 30, 2013, is presented for comparative purposes.
25

ROCKWOOD R-VI SCHOOL DISTRICT
NOTES TO THE BASIC FINANCIAL STATEMENTS JUNE 30, 2014 AND 2013
I. SUMMARY OF SIGNIFICANT ACCOUNTING POLICIES (CONTINUED)
Government-Wide Financial Statements
The Statement of Net Position and the Statement of Activities include the financial activities of the primary government, as a whole. Proprietary fund activity is eliminated to avoid ‘doubling up’ revenues and expenses. Governmental activities generally are financed through taxes, intergovernmental revenues and other non-exchange transactions.
The government-wide statements are prepared using the economic resources measurement focus and accrual basis of accounting. This is the same approach used in the preparation of proprietary fund financial statements but differs from the manner in which governmental fund financial statements are prepared. These financial statements include a reconciliation with brief explanations to better identify the differences between the government-wide statements and the statements for governmental funds.
The government-wide Statement of Net Position presents the financial condition of the governmental activities at year end. The government-wide Statement of Activities presents a comparison between direct expenses and program revenues for each program of the District’s governmental activities. Direct expenses are those that are specifically associated with a service, program, or department and therefore clearly identifiable to a particular function. Amounts reported as program revenues include (a) charges paid by the recipient of the goods or services offered by the programs and (b) grants and contributions that are restricted to meeting the operational or capital requirements of a particular program. Revenues, which are not classified as program revenues, are presented as general revenues of the District, with certain limited exceptions. The comparison of direct expenses with program revenues identifies the extent to which each governmental function is self-financing or draws from the general revenues of the District.
Fund Financial Statements
The fund financial statements report detailed information about the District’s funds. The District segregates transactions related to certain functions or activities into separate funds in order to aid financial management and to demonstrate legal compliance. Fund financial statements are designed to present financial information of the District at this more detailed level. The focus of governmental fund financial statements is on major funds. Each major fund is presented in a separate column. Non-major funds (if applicable) are aggregated and presented in a single column. The internal service fund, which funds the District’s self-insured health benefits, is presented in a single column on the face of the proprietary fund statements.
26

ROCKWOOD R-VI SCHOOL DISTRICT
NOTES TO THE BASIC FINANCIAL STATEMENTS JUNE 30, 2014 AND 2013
I. SUMMARY OF SIGNIFICANT ACCOUNTING POLICIES (CONTINUED)
Fund Financial Statements (Concluded)
The accounting and financial reporting treatment applied to a fund is determined by its measurement focus. All governmental fund types are accounted for using a flow of current financial resources measurement focus. The financial statements for governmental funds are the balance sheet, which generally includes only current assets and current liabilities, and a statement of revenues, expenditures and changes in fund balances, which reports on the sources (i.e., revenues and other financing sources) and uses (i.e., expenditures and other financing uses) of current financial resources.
Fund Accounting
The accounts of the District are organized on the basis of funds, each of which is considered to be a separate accounting entity. The operations of each fund are summarized by providing a separate set of self-balancing accounts which include its assets, liabilities and fund balances arising from revenues and expenditures. The measurement focus is upon determination of changes in the financial position rather than upon net income determination. District resources are allocated to and accounted for, in individual funds based upon the purposes for which they are to be spent and the means by which spending activities are controlled. The following are the District’s major funds:
Governmental Funds
General Fund: This fund is the general operating fund of the District, and accounts for expenditures for non-certified employees, pupil transportation costs, operation of plant, fringe benefits, student body activities, community services, the food service program and any expenditures not required or permitted to be accounted for in other funds. Special Revenue (Teachers) Fund: A special revenue fund is required to be established by state law which accounts for expenditures for certified employees involved in instruction and administration, and includes revenues restricted by the state and local tax levy allocations for the payment of teacher salaries and certain benefits.
Debt Service Fund: Accounts for the accumulation of resources for, and the payment of, principal, interest and fiscal charges on long-term obligations.
Capital Projects Fund: Accounts for the proceeds of long-term debt, taxes and other revenues designated for acquisition or construction of major capital assets.
27

ROCKWOOD R-VI SCHOOL DISTRICT
NOTES TO THE BASIC FINANCIAL STATEMENTS JUNE 30, 2014 AND 2013
I. SUMMARY OF SIGNIFICANT ACCOUNTING POLICIES (CONTINUED)
Fund Accounting (Concluded)
Proprietary Funds The Proprietary Fund focuses on the determination of changes in net position, financial position, and cash flows and is classified as either enterprise or internal service. The District does not have any enterprise funds. The District’s Proprietary Fund is: Internal Service Fund – Accounts for the financing of services provided by one department or agency to other departments or agencies of the District on a cost-reimbursement basis. This fund was established to account for the District’s self-funded medical and dental insurance benefits for participating employees and their families. The revenues received by the internal service fund represent District contributions and premiums withheld as payroll deductions from employees. Claims paid, direct insurance payments, and administrative costs are the only expenses of this fund. A liability for estimated claims incurred, but not reported, is recorded in this fund.
Basis of Accounting
Basis of accounting determines when transactions are recorded in the financial records and reported on the financial statements. Government-wide financial statements are prepared using the accrual basis of accounting. Governmental funds use the modified accrual basis of accounting. Proprietary funds also use the accrual basis of accounting. Differences in the accrual and the modified accrual basis of accounting arise in the recognition of revenue (property and sales taxes), the recording of deferred inflows and outflows, and in the presentation of expenses versus expenditures.
Government-wide financial statements prepared on the accrual basis of accounting recognize and record revenues when earned and expenses are recorded when a liability is incurred, regardless of the timing of the related cash flow. Property taxes, sales taxes, grants and similar revenue are susceptible to accrual and so have been recognized as revenues of the current fiscal year. Property taxes are recognized as revenues in the year they are levied. Grants and similar revenue are recognized as revenue as soon as all of the eligibility requirements have been met.
Government fund financial statements prepared on the modified accrual basis of accounting recognize revenues as soon as they are both measurable and available. The District considers available to mean collectible within sixty days after the end of the current period. Expenditures are recognized in the accounting period in which the fund liability is incurred, if measurable, except for unmatured interest on general long-term debt, which is recognized when due. Allocations of cost, such as depreciation and amortization, are not recognized in governmental funds at the fund reporting level.
28
ROCKWOOD R-VI SCHOOL DISTRICT
NOTES TO THE BASIC FINANCIAL STATEMENTS JUNE 30, 2014 AND 2013
I. SUMMARY OF SIGNIFICANT ACCOUNTING POLICIES (CONTINUED)
Basis of Accounting (Concluded)
Amounts reported as program revenues include 1) charges to users for goods, services, or privileges provided, 2) operating grants and contributions 3) capital grants and contributions (if applicable).
In the Statements of Net Position and the Statements of Activities, the District reports governmental activities. The District does not have any business-type activities. The Rockwood School District Facility Authority’s activities are reported as a blended component unit and shown with governmental activities.
Proprietary funds distinguish between operating and non-operating revenues and expenses. Operating revenues and expenses normally result from providing services and producing and delivering goods in connection with the fund’s principle function. The principal operating revenue in the internal service fund includes payroll withholdings or payments on insurance premiums. Operating expenses are related to providing insurance coverage and paying third party administrative fees. All revenues and expenses not meeting this definition are reported as non-operating revenues and expenses. The statement of cash flows provides information about how the District finances and meets the cash flow needs of its proprietary fund.
It is District policy to use restricted resources prior to unrestricted when both are available for use.
Revenues – Exchange and Non-Exchange Transactions
Revenues resulting from exchange transactions, in which each party receives essentially equal value, are recorded on the accrual basis when the exchange takes place. On the modified accrual basis, revenues are recorded in the fiscal year in which the resources are measurable and available. Available means that the resources will be collected within the current fiscal year or are expected to be collected soon enough thereafter to be used to pay liabilities of the current fiscal year. For the District, available means expected to be received within sixty days of the fiscal year-end.
29
ROCKWOOD R-VI SCHOOL DISTRICT
NOTES TO THE BASIC FINANCIAL STATEMENTS JUNE 30, 2014 AND 2013
I. SUMMARY OF SIGNIFICANT ACCOUNTING POLICIES (CONTINUED)
Revenues – Exchange and Non-Exchange Transactions (Concluded)
Non-exchange transactions, in which the District receives value without directly giving value in return, include property taxes, grants, entitlements and donations. On an accrual basis, revenue from property taxes is recognized in the fiscal year for which the taxes are levied. Revenue from grants, entitlements and donations is recognized in the fiscal year in which all eligibility requirements have been satisfied. Eligibility requirements include timing requirements, which specify the year when the resources are required to be used or the fiscal year when use is first permitted, matching requirements, in which the District must provide local resources to be used for a specified purpose, and expenditure requirements, in which the resources are provided to the District on a reimbursement basis. On a modified accrual basis, revenues from non-exchange transactions must also be available before they can be recognized.
Expenses/Expenditures
On the accrual basis of accounting, expenses are recognized at the time they are incurred.
The measurement focus of governmental fund accounting is on decreases in net financial resources (expenditures) rather than expenses. Expenditures are generally recognized in the accounting period in which the related fund liability is incurred, if measurable. Allocations of costs, such as depreciation and amortization, are not recognized in the governmental funds at the fund reporting level.
Pooled Cash and Temporary Investments
Cash resources are combined to form a pool of cash and temporary investments, which is managed by the District Treasurer, except resources from the Debt Service Fund, as state law requires these deposits to be separately maintained.
The District may invest in bonds of the State of Missouri, of the United States, or any wholly-owned corporation of the United States; or in other short-term obligations of the United States.
Interest income earned is allocated to contributing funds based on each funds’ proportionate shares of funds invested.
For purposes of the statement of cash flows, the District’s internal service fund considers all highly liquid investments with an original maturity of three months or less when purchased to be cash equivalents.
30
ROCKWOOD R-VI SCHOOL DISTRICT
NOTES TO THE BASIC FINANCIAL STATEMENTS JUNE 30, 2014 AND 2013
I. SUMMARY OF SIGNIFICANT ACCOUNTING POLICIES (CONTINUED)
Restricted Cash and Investments
Restricted cash and investments represent amounts whose use is limited by legal requirements and consist of amounts escrowed for future general obligation bond principal and interest payments in the Missouri Health and Educational Facilities Authority and Missouri Securities Investment Program, as discussed in Note II. Inventories and Prepaid Items Inventories are valued at cost, on a first-in, first-out (FIFO) basis, and consist of purchased food and supplies of $610,238 and donated government commodities of $183,572. An expenditure is recorded at the time the inventory is used. Prepaid items of $1,105,968 consist of insurance premiums on policies that provide coverage past the current year-end. These premiums will be expensed through the balance of the policy terms within one year. A current asset for the prepaid amount is recorded at the time of the purchase and an expenditure/expense is reported in the year in which services are consumed. Receivables
Taxes receivable include property taxes and sales taxes. Property taxes receivable is reported net of an allowance for uncollectible calculated from historical collection rates. Other receivables include interest earned but not yet credited to the District’s accounts, amounts due the District from the State, amounts due to the District from federal grants, and some miscellaneous receivables from various local activities.
Unearned Revenue
Deferred revenue arises when assets are recognized before revenue recognition criteria have been satisfied.
Capital Assets
Capital assets, which include land, buildings, machinery and equipment, automobiles and other vehicles, and construction in progress, are reported in the governmental activities column of the government-wide financial statements. The District defines capital assets as assets with an initial, individual cost of more than $5,000. All land purchases are capitalized. Assets are recorded at historical cost or estimated historical cost if actual historical cost is not available and are updated for additions and retirements during the year. Donated assets are recorded at their fair market values as of the date received. The District does not own any infrastructure.
The cost of routine maintenance and repairs that do not add to the value of the asset or materially extend the asset life are not capitalized.
31

ROCKWOOD R-VI SCHOOL DISTRICT
NOTES TO THE BASIC FINANCIAL STATEMENTS JUNE 30, 2014 AND 2013
I. SUMMARY OF SIGNIFICANT ACCOUNTING POLICIES (CONTINUED) Capital Assets (Concluded) Capital assets under construction and not yet in use by the District as of the date of the financial statements are reported as construction in progress. Assets reported as construction in progress will include individual assets with a cost less than $5,000. All reported capital assets except land and construction in progress are depreciated using the straight-line method over the useful lives of the assets.
Estimateduseful life
Land improvements 20Buildings 50Machinery and equipment 15Technology (including machinery
and equipment) 5Automobiles and other vehicles 5
Capital asset type
Compensated Absences and Early Retirement
An accrual for certain salary related payments associated with vacation time and unused sick leave are included in the government-wide financial statements.
District employees earn vacation time throughout the fiscal year to be taken by the end of the subsequent fiscal year except administrative employees who are allowed to carry over vacation time earned in the current year through August 31 of the subsequent fiscal year. Any unused vacation days remaining will be forfeited by the employee. Unused vacation is payable to the employee upon termination. Employees who meet certain requirements may receive compensation for unused sick leave payable at time of retirement.
32
ROCKWOOD R-VI SCHOOL DISTRICT
NOTES TO THE BASIC FINANCIAL STATEMENTS JUNE 30, 2014 AND 2013
I. SUMMARY OF SIGNIFICANT ACCOUNTING POLICIES (CONTINUED)
Accrued Liabilities and Long-term Obligations All payables, accrued liabilities and long-term obligations are reported in the government-wide financial statements. In general, payables and accrued liabilities that will be paid from governmental funds are reported on the governmental fund financial statements regardless of whether they will be liquidated with current resources. However, special termination benefits, claims and judgments, and compensated absences that will be paid from governmental funds are reported as a liability in the fund financial statements only to the extent that they are due for payment. In general, liabilities that mature or come due for payment during the fiscal year are considered to have been made with current available financial resources. Bonds, capital leases and other long-term obligations that will be paid from governmental funds are not recognized as a liability in the fund financial statements until due.
Post Employment Benefits
COBRA Benefits - Under the Consolidated Omnibus Budget Reconciliation Act (COBRA), the District provides healthcare benefits to eligible former employees and eligible dependents. Certain requirements are outlined by the federal government for this coverage. The premium is paid in full by the insured on or before the tenth (10th) day of the month for the actual month covered. This program is offered for eighteen months after the termination date.
There is no associated cost to the District under this program. The District prepares the initial COBRA enrollment forms and the former employee makes the premium payments directly to a division of the third party administrator.
The District also offers continued healthcare benefits to retired employees who elect to participate. The retiree pays the premium.
33

ROCKWOOD R-VI SCHOOL DISTRICT
NOTES TO THE BASIC FINANCIAL STATEMENTS JUNE 30, 2014 AND 2013
I. SUMMARY OF SIGNIFICANT ACCOUNTING POLICIES (CONTINUED)
Fund Balances – Governmental Funds
In the fund financial statements, governmental funds report the following classifications of fund balance:
Nonspendable – includes amounts that cannot be spent because they are either not spendable in form or are legally or contractually required to be maintained intact. Restricted – includes amounts restricted by external sources (creditors, laws of other governments, etc.) or by constitutional provision or enabling legislation. Committed – includes amounts that can only be used for specific purposes. Committed fund balance is reported pursuant to resolutions passed by the Board of Education, the District’s highest level of decision making authority. Commitments may be modified or rescinded only by the Board. The District does not have any committed fund balances. Assigned – includes amounts that the District intends to use for a specific purpose, but do not meet the definition of restricted or committed fund balance. Amounts are assigned by the District’s highest level of decision making authority or a body or official that has been given the authority to assign funds. Under the District’s adopted fund balance policy, amounts may be assigned by the Chief Financial Officer. Unassigned – includes amounts that have not been assigned to other funds or restricted, committed or assigned to a specific purpose within the General Fund. In other governmental funds, if expenditures incurred for specific purposes exceed the amounts restricted, committed or assigned to those purposes, a negative unassigned fund balance may be reported.
When an expenditure is incurred for purposes for which both restricted and unrestricted fund balance is available, the District considers restricted funds to have been spent first. When an expenditure is incurred for which committed, assigned, or unassigned fund balances are available, the District considers amounts to have been spent first out of committed funds, then assigned funds, and finally unassigned funds, as needed, unless the Board has provided otherwise in its commitment or assignment actions. The details of the fund balances are included in the Balance Sheet – Governmental Funds.
34

ROCKWOOD R-VI SCHOOL DISTRICT
NOTES TO THE BASIC FINANCIAL STATEMENTS JUNE 30, 2014 AND 2013
I. SUMMARY OF SIGNIFICANT ACCOUNTING POLICIES (CONCLUDED) Net Position
Net position represents the difference between assets and liabilities. Net investment in capital assets consists of capital assets, net of accumulated depreciation, reduced by the outstanding balances of any borrowings used for the acquisition, construction, or improvement of those assets. Net position is reported as restricted when there are limitations imposed on their use either through the enabling legislation adopted by the District or through external restrictions imposed by creditors, grantors or laws or regulations of other governments. The remaining balance of net position is reported as unrestricted. When both restricted and unrestricted resources are available for use, it is the District’s policy to use restricted resources first and then unrestricted resources as they are needed.
Interfund Activity
Interfund transfers are reported as other financing sources/(uses) in governmental funds. Missouri statute requires the District to report all equipment purchases in the Capital Projects Fund. During the year the District accounts for certain capital outlay expenditures in the various General Fund sub-categories (Student Activity, Community Education and Child Nutrition). The District then records a transfer for these expenditures to the Capital Projects Fund at year end. For the year ended June 30, 2014, these transfers amounted to $999,321.
Use of Estimates In preparing financial statements in conformity with accounting principles generally accepted in the United States of America, management is required to make estimates and assumptions that affect the reported amounts of assets and liabilities and disclosures of contingent assets and liabilities at the date of the financial statements and the reported amounts of revenues and expenses during the reporting period. Actual results could differ from those estimates. However, it is management’s belief that the actual results will materially approximate the estimates used.
Teachers’ Salaries
The salary payment schedule of the District for the 2013-14 school year requires the payment of salaries over a twelve month period. Consequently, the final three teacher payrolls related to the 2013-14 school year are included in accrued liabilities on the basic financial statements.
35

ROCKWOOD R-VI SCHOOL DISTRICT
NOTES TO THE BASIC FINANCIAL STATEMENTS JUNE 30, 2014 AND 2013
II. CASH AND TEMPORARY INVESTMENTS Cash balances from all funds, except the Debt Service Fund, are combined and invested to the
extent available in short-term securities. State laws require that all deposits of the Debt Service Fund be kept separate and apart from all other funds of the District. Earnings from such investments are allocated to the General Fund, Teachers Fund and Capital Projects Fund on the basis of the applicable cash balance participation by each fund. Separate accounts are maintained for the Debt Service Fund and the Internal Service Fund. Interest is deposited directly into these accounts. State statutes authorize the District to invest in obligations of the United States government or any agency or instrumentality, including repurchase agreements; bonds of the State of Missouri, or the United States, or of any wholly owned corporation of the United States, and other short-term obligations of the United States; under limited circumstances, commercial paper and bankers’ acceptances; and deposit accounts with insured financial institutions, provided the accounts are entirely insured by the Federal Deposit Insurance Corporation (FDIC) or collateralized with government securities that have a fair value exceeding the deposit amount. Investments with the Missouri Direct Deposit Program and escrow agents for refunding escrow accounts are regulated by investment contracts that only authorize investments in obligations of the United States government or any agency or instrumentality thereof.
The District’s investments are stated at fair value, which approximates cost as of June 30, 2014.
36

ROCKWOOD R-VI SCHOOL DISTRICT
NOTES TO THE BASIC FINANCIAL STATEMENTS JUNE 30, 2014 AND 2013
II. CASH AND TEMPORARY INVESTMENTS (CONTINUED)
The cash deposits and temporary investments are summarized and presented in the financial statements at fair value as follows as of June 30, 2014:
Cash deposits 43,981,886$ Cash on hand 11,952 Investments
Commercial paper 13,460,655 U.S. Treasury and agency securities 35,481,836 External investment pools 18,684,884
Total 111,621,213$
Cash and investments - governmental funds 87,437,248$ Restricted cash and investments - governmental
funds 18,684,884 Cash and investments - proprietary funds 5,499,081
Total reporting entity 111,621,213$
Deposits Missouri statutes require that all deposits with financial institutions be collateralized in an amount at least equal to uninsured deposits. At June 30, 2014, the carrying amount of the deposits under District control was $43,981,886 and the bank balance was $46,453,866, which was covered by federal depository insurance and collateral held at the Bank of New York, the District’s safekeeping agent, pledged in the name of the District.
Investments MISSOURI HEALTH AND EDUCATIONAL FACILIITES AUTHORITY (MOHEFA) Amounts reported under the Missouri Health and Education Facilities Authority Direct Deposit Program include amounts withheld from the District’s state aid and deposited into an external investment pool trust account at a bank selected by the Authority and the reported value of the pool is the same as the fair value of the pool shares. The investments are redeemed every six months to pay principal and interest obligations on the District’s general obligation bonds participating in the program. The Direct Deposit Program is established and regulated by state law. This investment is reported as maturing in less than one year because the District’s investment in the external investment pool is redeemed less than one year from the date of the financial statements. At June 30, 2014, the District had no funds invested in the MOHEFA program.
37
ROCKWOOD R-VI SCHOOL DISTRICT
NOTES TO THE BASIC FINANCIAL STATEMENTS JUNE 30, 2014 AND 2013
II. CASH AND TEMPORARY INVESTMENTS (CONTINUED) Investments (Concluded)
MISSOURI SECURITIES INVESTMENT PROGRAM (MOSIP)
At June 30, 2014, the District had $18,684,884 invested in the MOSIP program with an average maturity of 177 days. All funds in this program are invested in accordance with Section 165.061 RSMo. Each school district owns a pro-rata share of each investment or deposit, which is held in the name of the Fund. The fair value for the external investment pool is the same as the value of the pool shares. A separate financial report for the MOSIP program can be obtained from the PFM Asset Management LLC, 77 West Port Plaza Drive, Suite 220, St. Louis, Missouri 63146. The District may purchase any investments allowed by the State Treasurer. These include (1) obligations of the United States Government or any agency or instrumentality thereof maturing and becoming payable not more than three years from the date of purchase, or (2) repurchase agreements maturing and becoming payable within 90 days secured by U.S. Treasury obligations or obligations of U.S. Government agencies or instrumentalities of any maturity, as provided by law. As of June 30, 2014 the District had the following investments and maturities:
WeightedFair Average
Type Value Maturity (Years)
Commercial paper 13,460,655$ 0.014U.S. Treasury and agency securities 35,481,836 0.522External investment pools 18,684,884 0.484
Portfolio weighted average maturity 67,627,375$ 0.340
Interest Rate Risk Interest rate risk is the risk that changes in market interest rates will adversely affect the fair value of an investment. Generally, the longer the maturity of an investment, the greater the sensitivity of its fair value to changes in market interest rates. The District has a formal investment policy that limits investment maturities as a means of managing its exposure to fair value losses arising from increasing interest rates. One of the ways the District manages its exposure to interest rate risk is by purchasing investments with short-term maturities to provide the cash flow and liquidity needed for operations, and by timing cash flows from maturities so a portion of the portfolio is maturing or coming close to maturity evenly over time as necessary to provide the cash flow and liquidity needed for operations.
38
ROCKWOOD R-VI SCHOOL DISTRICT
NOTES TO THE BASIC FINANCIAL STATEMENTS JUNE 30, 2014 AND 2013
II. CASH AND TEMPORARY INVESTMENTS (CONTINUED)
Credit Risk Credit risk is the risk that an issuer of an investment will not fulfill its obligation to the holder of the investment. State law limits investments that can be held by government agencies to safe high quality securities. The investments authorized under the investment policy are limited to federal government-backed securities, certificates of deposit, bankers’ acceptance, repurchase agreements (under certain conditions), local and state government bonds (limited to one of the highest three credit ratings) and District policy is also to use diversification to minimize credit risk. The District has a formal policy and supporting regulation which governs the investment funds. District administrators will be guided by the criteria of legality, safety, liquidity and yield. This is measured by the assignment of a rating by a nationally recognized statistical rating organization. The District’s investments in MOSIP and commercial paper are rated AAAm and A-1 to A-1+ by Standard and Poor’s. Custodial Credit Risk Custodial credit risk is the risk that, in the event of the failure of the counterparty, the District will not be able to recover the value of its investment or collateral securities that are in possession of an outside party. The District’s investment policy states that the District will manage custodial credit risk by pre-qualifying the financial institutions and advisors with which the District will do business; and, diversifying the portfolio so that potential losses on individual securities will be minimized. The District’s investment policy further mandates that all securities purchased be perfected in the name of or for the account of the District and be held by a third-party custodian as evidenced by appropriate safekeeping receipts.
39

ROCKWOOD R-VI SCHOOL DISTRICT
NOTES TO THE BASIC FINANCIAL STATEMENTS JUNE 30, 2014 AND 2013
II. CASH AND TEMPORARY INVESTMENTS (CONCLUDED) Concentration of Credit Risk As a means of limiting its exposure to losses arising from concentration of investments, the District’s investment policy mandates that the portfolio not have a concentration of assets in specific maturity or specific class of securities. At a minimum, diversification standards by security type and issuer are established as (a) U.S. treasuries, securities issued by State of Missouri, and securities having principal and/or interest guaranteed by the U.S. Government – 100%; (b) collateralized time and demand deposits – 100%; (c) U.S. Government agencies, and government sponsored enterprises, no more than 60%; (d) collateralized repurchase agreements, no more than 50%; (e) U.S. Government callable securities, no more than 15%; (f) qualified commercial paper, no more than 25%; and (g) bankers’ acceptances, no more than 25%. The investment policy of the District contains no limitations on the amount that can be invested in any one issuer beyond what is provided by law. Investments in any one issuer representing 5% or more of total investments (excluding investments issued or explicitly guaranteed by the U.S. government, investments in mutual funds, external investment pools and other pooled investments) are as follows:
Investment Type Percentage
Bank Nova Scotia Disc C/P Commercial Paper 7%
Rabobank US Financial Corp Disc C/P Commercial Paper 6%
Issuer
III. TAXES
Property taxes attach as an enforceable lien on property as of January 1. Taxes are levied on November 1 and are payable by December 31. All unpaid taxes become delinquent January 1 of the following year. The county collects the property taxes and remits them to the District on a monthly basis. An allowance for uncollectible taxes has been provided for delinquent taxes. At the fund reporting level, property tax revenues are recognized when they become measurable and available. Available includes those property tax receivables expected to be collected within sixty (60) days after year-end. Revenue recognition of delinquent property taxes not collected within sixty (60) days of fiscal year end is deferred.
40

ROCKWOOD R-VI SCHOOL DISTRICT
NOTES TO THE BASIC FINANCIAL STATEMENTS JUNE 30, 2014 AND 2013
III. TAXES (CONTINUED) The District also receives sales tax collected by the State of Missouri and remitted to the District based on eligible pupil counts. The District is required to reduce its sales tax levy by one-half of the amount of sales tax estimated to be received in the subsequent calendar year, a prop C rollback. However, the District’s voters approved a full waiver of the Prop C rollback in the 1994/1995 school year, so sales taxes are not reduced to the District. The final assessed valuation of the tangible taxable property (excluding state assessed railroad and utilities) for the calendar year 2013 and 2012 for purposes of local taxation was:
2013 2012
Real estateResidential 2,122,467,030$ 2,193,724,990$ Agricultural 2,421,370 2,462,980 Commercial including locally assessed
railroad and utility 656,540,540 662,666,990 Personal property including locally assessed
railroad and utility 435,008,750 434,352,420 3,216,437,690 3,293,207,380
Less tax increment financing 20,395,050 19,971,090
3,196,042,640$ 3,273,236,290$
Accounts receivable-property taxes at June 30, 2014, were $4,284,104 (less an allowance for uncollectible taxes of $428,411). Accounts receivable-property taxes at June 30, 2013, were $4,797,896 (less an allowance for uncollectible taxes of $2,352,449). The decrease in the allowance for uncollectible taxes of approximately $1.9 million is due to State Tax Commission settlement of Chrysler’s protested taxes on one of its former properties during 2013 that was paid in 2014.
41

ROCKWOOD R-VI SCHOOL DISTRICT
NOTES TO THE BASIC FINANCIAL STATEMENTS JUNE 30, 2014 AND 2013
III. TAXES (CONCLUDED) The tax levy per $100 of the assessed valuation of tangible taxable property for the fiscal years ending June 30 for purposes of local taxation was:
Unadjusted Adjusted Unadjusted Adjusted
General Fund 1.5808$ 1.5808$ 1.6079$ 1.6079$ Special Revenue Fund 1.9156 1.9156 2.1878 2.1878 Debt Service Fund 0.6800 0.6800 0.6800 0.6800 Capital Projects Fund 0.5069 0.5069 0.0600 0.0600
4.6833$ 4.6833$ 4.5357$ 4.5357$
2013 2012
The receipts of current and delinquent property taxes during the fiscal year ended June 30, 2014 and 2013, aggregated approximately 97.5% and 98.5%, respectively, of the current assessment computed on the basis of the levy as shown above.
42
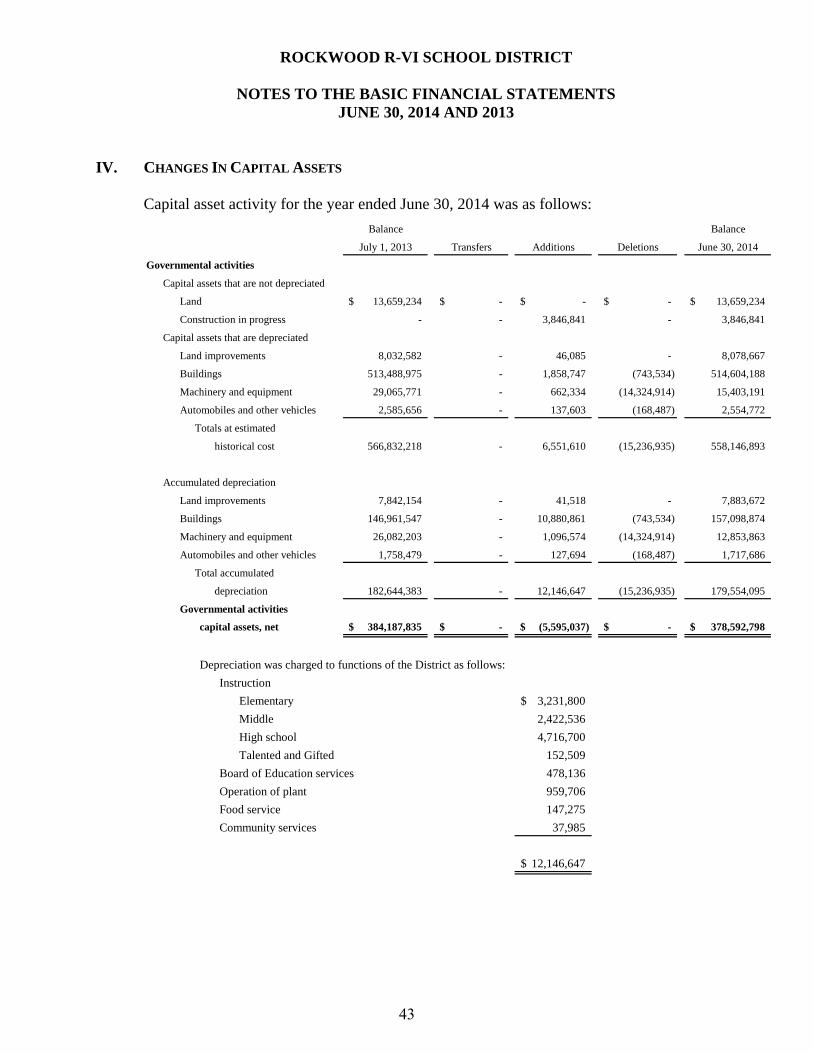
ROCKWOOD R-VI SCHOOL DISTRICT
NOTES TO THE BASIC FINANCIAL STATEMENTS JUNE 30, 2014 AND 2013
IV. CHANGES IN CAPITAL ASSETS
Capital asset activity for the year ended June 30, 2014 was as follows: Balance Balance
July 1, 2013 Transfers Additions Deletions June 30, 2014
Governmental activities
Capital assets that are not depreciated
Land 13,659,234$ -$ -$ -$ 13,659,234$
Construction in progress - - 3,846,841 - 3,846,841
Capital assets that are depreciated
Land improvements 8,032,582 - 46,085 - 8,078,667
Buildings 513,488,975 - 1,858,747 (743,534) 514,604,188
Machinery and equipment 29,065,771 - 662,334 (14,324,914) 15,403,191
Automobiles and other vehicles 2,585,656 - 137,603 (168,487) 2,554,772
Totals at estimated
historical cost 566,832,218 - 6,551,610 (15,236,935) 558,146,893
Accumulated depreciation
Land improvements 7,842,154 - 41,518 - 7,883,672
Buildings 146,961,547 - 10,880,861 (743,534) 157,098,874
Machinery and equipment 26,082,203 - 1,096,574 (14,324,914) 12,853,863
Automobiles and other vehicles 1,758,479 - 127,694 (168,487) 1,717,686
Total accumulated
depreciation 182,644,383 - 12,146,647 (15,236,935) 179,554,095
Governmental activities
capital assets, net 384,187,835$ -$ (5,595,037)$ -$ 378,592,798$
Depreciation was charged to functions of the District as follows:Instruction
Elementary 3,231,800$ Middle 2,422,536 High school 4,716,700 Talented and Gifted 152,509
Board of Education services 478,136 Operation of plant 959,706 Food service 147,275 Community services 37,985
12,146,647$
43

ROCKWOOD R-VI SCHOOL DISTRICT
NOTES TO THE BASIC FINANCIAL STATEMENTS JUNE 30, 2014 AND 2013
V. CHANGES IN LONG-TERM OBLIGATIONS
The following is a summary of changes in long-term obligations for the year ended June 30, 2014:
Balance Balance Amounts due
July 1, June 30, within
2013 Additions Reductions 2014 one year
Governmental activities
Bonds payable
General obligation bonds 206,910,000$ -$ (53,570,000)$ 153,340,000$ 17,540,000$
Deferred amounts for
issuance discounts (845,641) - 352,513 (493,128) -
Deferred amounts on
issuance premiums 6,074,659 - (1,951,210) 4,123,449 -
Total bonds payable, net 212,139,018 - (55,168,697) 156,970,321 17,540,000
Energy financing 355,215 - (90,021) 265,194 62,433
Interest 3,680,028 2,681,247 (3,680,028) 2,681,247 2,681,247
Compensated absences 7,211,531 7,801,841 (7,211,531) 7,801,841 1,474,524
Other postemployment benefit
obligation 6,622,987 1,109,606 - 7,732,593 -
Total governmental
activity long-term
obligations 230,008,779$ 11,592,694$ (66,150,277)$ 175,451,196$ 21,758,204$
Payments on the general obligation bonds are made by the Debt Service Fund. The obligations under capital leases are paid by the Capital Projects Fund. The compensated absences and other postemployment benefit obligation will be liquidated by the General Fund or the Teachers Fund depending on which fund the employee’s salary was charged. The District issues General Obligation bonds to provide funds to erect, improve and equip school buildings. The District has built three new elementary schools, one middle school and major renovations to each of the four high schools in addition to improvements to every school site in the District. From time to time the District issues General Obligation Bonds to refund prior bond issuances to reduce cash flows and interest costs.
44

ROCKWOOD R-VI SCHOOL DISTRICT
NOTES TO THE BASIC FINANCIAL STATEMENTS JUNE 30, 2014 AND 2013
V. CHANGES IN LONG-TERM OBLIGATIONS (CONTINUED)
Bonds payable consist of the following at June 30, 2014:
Original BalanceDate Maturity Rate of issue at June 30,
issued date interest amount 2014
6/5/08 2/1/22 3.50% - 5.00% 70,000,000$ 57,200,000$ 2/12/09 2/1/15 2.125% - 5.00% 32,945,000 10,470,000 12/1/09 2/1/20 3.00% - 4.00% 24,465,000 24,465,000 6/29/10 2/1/24 4.00% - 4.75% 33,905,000 33,905,000 9/10/10 2/1/27 4.75% 7,295,000 7,295,000 9/21/10 2/1/18 2.00% - 3.00% 13,800,000 10,100,000 7/21/11 2/1/16 2.00% - 4.00% 9,905,000 9,905,000
153,340,000$ The annual requirements to amortize all General Obligation (GO) bonded debt outstanding as of June 30, 2014, including interest payments are as follows:
Principal Interest TotalYear ending June 30,
2015 17,540,000$ 6,426,466$ 23,966,466$ 2016 16,660,000 5,690,316 22,350,316 2017 14,210,000 5,093,791 19,303,791 2018 14,015,000 4,507,591 18,522,591 2019 14,235,000 3,987,041 18,222,041 2020-2024 69,385,000 9,751,965 79,136,965 2025-2027 7,295,000 1,039,538 8,334,538
153,340,000$ 36,496,708$ 189,836,708$
45

ROCKWOOD R-VI SCHOOL DISTRICT
NOTES TO THE BASIC FINANCIAL STATEMENTS JUNE 30, 2014 AND 2013
V. CHANGES IN LONG-TERM OBLIGATIONS (CONTINUED)
ADVANCE REFUNDING In prior years, the District defeased certain general obligation bonds by placing the proceeds of the new bonds in irrevocable trusts to provide for all future debt service payments on the old bonds. Accordingly, the trust account assets and the liability for defeased bonds are not included in the District’s financial statements. At June 30, 2014, $10,565,000 of bonds outstanding are considered defeased.
LEGAL DEBT MARGIN Article VI, Section 26(b), Constitution of Missouri, limits the outstanding amount of authorized general obligation bonds of a district to fifteen percent of the assessed valuation of a district (including state-assessed railroad and utilities). The legal debt margin of the District calculated using the December 31, 2013, assessed valuation and excluding state-assessed railroad and utilities was as follows at June 30, 2014. Constitutional debt limit 479,406,396$ General obligation bonds payable (153,340,000) Amount available in Debt Service Fund 18,793,391
Available bonding capacity 344,859,787$
46

ROCKWOOD R-VI SCHOOL DISTRICT
NOTES TO THE BASIC FINANCIAL STATEMENTS JUNE 30, 2014 AND 2013
V. CHANGES IN LONG-TERM OBLIGATIONS (CONCLUDED)
ENERGY FINANCING
In 2008 the District entered into a $600,000 lease purchase agreement with Bank of America. Proceeds were used for an energy conservation lighting project which was finalized in 2009. The principal balance at June 30, 2014 was $265,194. The annual requirement to amortize the energy financing outstanding as of June 30, 2014, including interest payments are as follows:
Principal Interest TotalYear ending June 30,
2015 62,433$ 10,658$ 73,091$ 2016 64,942 8,149 73,091 2017 67,552 5,539 73,091 2018 70,267 2,824 73,091
265,194$ 27,170$ 292,364$
47
ROCKWOOD R-VI SCHOOL DISTRICT
NOTES TO THE BASIC FINANCIAL STATEMENTS JUNE 30, 2014 AND 2013
VI. PENSION PLANS
The District contributes to the Public School Retirement System of Missouri (PSRS), a cost-sharing multiple-employer defined benefit pension plan. PSRS provides retirement and disability benefits to certificated employees who work 17 or more hours per week and death benefits to members and beneficiaries. Positions covered by the PSRS are not covered by Social Security. PSRS benefit provisions are set forth in Chapter 169.010-.141 of the Missouri Revised Statutes. The statutes assign responsibility for the administration of the system to a seven-member Board of Trustees. PSRS issues a publicly available financial report that includes financial statements and required supplementary information. That report may be obtained by writing to: The Public School Retirement System of Missouri, P.O. Box 268, Jefferson City, Missouri 65102, or by calling 1-800-392-6848. PSRS members were required to contribute 14.5% of their annual covered salary and the District is required to contribute a matching amount. The contribution requirements of members and the District are established and may be amended by the PSRS Board of Trustees. The District's contributions to PSRS for the years ending June 30, 2014, 2013, and 2012 were $16,715,501, $16,389,607 and $16,291,296, respectively, equal to the required contributions.
The District also contributes to the Public Education Employee Retirement System of Missouri (PEERS), a cost-sharing multiple-employer defined benefit pension plan. PEERS provides retirement and disability benefits to employees of the District who work 20 or more hours per week and who do not contribute to the PSRS. Certain part-time certified employees may be covered by this plan. Positions covered by the PEERS are also covered by Social Security. Benefit provisions are set forth in Chapter 169.600-.715 of the Missouri Revised Statutes. The statutes assign responsibility for the administration of the system to the Board of Trustees of the PSRS. PEERS issues a publicly available financial report that includes financial statements and required supplementary information. That report may be obtained by writing to: The Public Education Employee Retirement System of Missouri, P.O. Box 268, Jefferson City, Missouri 65102 or by calling 1-800-392-6848.
PEERS members were required to contribute 6.86% of their annual covered salary and the District is required to contribute a matching amount. The contribution requirements of members and the District are established and may be amended by the Board of Trustees. The District's contributions to PEERS for the years ending June 30, 2014, 2013 and 2012, were $2,245,877, $2,177,898 and $2,112,254, respectively, equal to the required contributions.
48

ROCKWOOD R-VI SCHOOL DISTRICT
NOTES TO THE BASIC FINANCIAL STATEMENTS JUNE 30, 2014 AND 2013
VII. DEFERRED COMPENSATION PLANS
The District offers its employees a choice of deferred compensation plans created in accordance with Internal Revenue Code Sections 403(b) or 457(b). These plans, available to all District employees, permit them to defer a portion of their salary until future years. The District makes these Plans available to its employees as an accommodation only. The District’s role in connection with the Plans is generally limited to processing the paperwork necessary to remit participant’s salary withholdings (deferrals) to annuity providers and custodians.
VIII. OTHER POST-EMPLOYMENT BENEFIT OBLIGATION PLAN DESCRIPTION
In addition to providing the pension benefits described above, the District (under the provisions of the Rockwood Self-insurance Plan) provides continuation of medical, dental and vision insurance coverage, including prescription drugs to employees who are eligible for normal or early retirement under a single employer plan. Retirees who elect to participate must pay the premium in effect for the current plan year or any subsequent year at the premium rates in effect at that time. Since the retirees pay the premium for each year, the District’s share of any premium cost is determined on the basis of a blended rate or implicit rate subsidy calculation. The plan is not accounted for as a trust fund since an irrevocable trust has not been established. A stand-alone financial report is not available for the plan. FUNDING POLICY The District currently pays for the implicit rate subsidy associated with these postemployment health care benefits on a pay-as-you-go basis. The District determines contribution requirements and may be amended by the District. As of June 30, 2014 no trust fund has been established for the funding of the plan’s postemployment benefit obligation, resulting in the classification of the entire liability as unfunded. The schedule of funding progress is presented as required supplementary information.
49

ROCKWOOD R-VI SCHOOL DISTRICT
NOTES TO THE BASIC FINANCIAL STATEMENTS JUNE 30, 2014 AND 2013
VIII. OTHER POST-EMPLOYMENT BENEFIT OBLIGATION (CONTINUED) ANNUAL OTHER POSTEMPLOYMENT BENEFIT COST The District’s annual OPEB cost (expense) is calculated based on the annual required contribution of the employer (ARC). The ARC represents a level of funding that, if paid on an ongoing basis, is projected to cover normal cost each year and to amortize any unfunded actuarial liabilities (or funding excess) over a period not to exceed thirty years. As of June 30, 2014 the schedule of employer contributions and net OPEB obligation is as follows:
Annual required contribution 2,896,906$ Interest on net OPEB obligation 225,963 Adjustment to annual required contribution (163,076)
Annual OPEB cost (expense) 2,959,793 Contributions made 1,850,187
Increase in net OPEB obligation 1,109,606 Net OPEB obligation at July 1, 2013 6,622,987
Net OPEB obligation at June 30, 2014 7,732,593$
As of June 30, 2014 the annual OPEB cost, the percentage of annual OPEB cost contributed to the plan and the net OPEB obligation were as follows:
Percentage NetPlan Annual of OPEB Cost OPEBYear OPEB Cost Contributed Obligation
2014 2,959,793$ 62.51% 7,732,593$ 2013 2,835,045 91.42% 6,622,987 2012 2,239,500 67.96% 6,379,800
FUNDED STATUS AND FUNDING PROGRESS As of July 1, 2012, the actuarial accrued liability for benefits was $30,042,009, all of which was unfunded. The covered payroll (annual payroll of active employees covered by the plan) was $133,143,586, and the ratio of the unfunded actuarial liability to covered payroll was 22.56%.
50

ROCKWOOD R-VI SCHOOL DISTRICT
NOTES TO THE BASIC FINANCIAL STATEMENTS JUNE 30, 2014 AND 2013
VIII. OTHER POST-EMPLOYMENT BENEFIT OBLIGATION (CONCLUDED) FUNDED STATUS AND FUNDING PROGRESS (CONCLUDED) The projection of future benefit payments for an ongoing plan involves estimates of the value of reported amounts and assumptions about the probability of occurrence of events far into the future. Examples include assumptions about future employment, mortality, and the healthcare cost trend. Amounts determined regarding the funded status of the plan and the annual required contributions of the employer are subject to continual revisions as actual results are compared with past expectations and new estimates are made about the future. The schedule of funding progress, presented as required supplementary information following the notes to the financial statements, presents multi-year trend information about whether the actuarial value of plan assets is increasing or decreasing over time relative to the actuarial accrued liabilities for benefits. ACTUARIAL METHODS AND ASSUMPTIONS Projections of benefits for financial reporting purposes are based on the substantive plan (the plan understood by the employer and the plan members) and include the types of benefits provided at the time of each valuation and the historical pattern to that point. The methods and assumptions used include techniques that are designed to reduce the effects of short-term volatility in actuarial accrued liabilities consistent with the long-term prospective of the calculations. The initial unfunded actuarial accrued liability is being amortized as a level percentage of projected payroll on a open basis over 30 years. In the actuarial valuation, the liabilities were computed using the projected unit credit cost method. The actuarial assumptions utilized a 4.5% discount rate and a 5% inflation rate. Because the plan is unfunded, reference to general assets, which are short-term in nature, was considered in the selection of the 4.5% rate. The healthcare trends used are based on long term healthcare trends generated by the Getzen Model.
IX. SELF-INSURED MEDICAL BENEFITS
The District is under a self-insured plan to provide medical and dental benefits to participating employees and their families. The participating employees contribute to the self-insurance fund through payroll deductions based on their coverage election. The District's maximum liability for each employee and in the aggregate for a one-year period is limited by insurance coverage. Transactions for the self-funded insurance are recorded in the Internal Service Fund. Liabilities of the fund are recorded when it is probable that a loss has occurred and the amount of loss can be reasonably estimated. Liabilities include an amount for claims that have been incurred but not reported (IBNR). Claim liabilities are calculated based upon recent claim settlement trends. The District considers the liability to all be payable in the current year due to the potential of significant claims to occur at any time that would deplete the insurance reserves. Settlements have not exceeded coverage for each of the past three fiscal years.
51

ROCKWOOD R-VI SCHOOL DISTRICT
NOTES TO THE BASIC FINANCIAL STATEMENTS JUNE 30, 2014 AND 2013
IX. SELF-INSURED MEDICAL BENEFITS (CONCLUDED) Changes in the balance of claims liabilities are as follows for the years ended June 30,:
2014 2013
Unpaid claims, beginning of year 5,166,622$ 5,293,114$ Incurred claims (including IBNRs) 21,370,909 21,138,129 Claim payments (21,038,450) (21,264,621)
Unpaid claims, end of year 5,499,081$ 5,166,622$
X. INSURANCE PROGRAM
The District, along with various other local school districts, participates in the Missouri United School Insurance Council (MUSIC), an insurance association for workers' compensation, general liability and property casualty insurance. The purpose of MUSIC is to distribute the cost of self-insurance over similar entities. MUSIC requires an annual premium payment to cover estimated claims payable and reserves for claims for each entity. Part of the assessment then goes to buy excess insurance contracts for the group as a whole. Should the contributions received by MUSIC be in excess or not be sufficient, rebates or special assessments can be made of the member Districts. There have been no significant changes in insurance coverage from the prior year. Settlements have not exceeded coverage for each of the past three fiscal years.
XI. COMMITMENTS AND CONTINGENCIES
Litigation – Various claims and lawsuits are pending against the District. In the opinion of District management, the potential loss on all claims and lawsuits will not be significant to the District's financial statements taken as a whole. Grants – The District received financial assistance from federal and state agencies in the form of grants. The disbursements of funds received under these programs generally require compliance with terms and conditions specified in the grant agreements and are subject to audit by the grantor agencies. Any disallowed claims resulting from such audits could become a liability of the General Fund or other applicable funds. However, in the opinion of management, any such disallowed claims will not have a material effect on the overall financial position of the District at June 30, 2014.
Construction – The District has entered into various contracts for building and grounds renovations and improvements which are included in the amount designated in the capital projects fund in the fund financial statements.
52
ROCKWOOD R-VI SCHOOL DISTRICT
NOTES TO THE BASIC FINANCIAL STATEMENTS JUNE 30, 2014 AND 2013
XII. ACCOUNTING CHANGES AND NEW ACCOUNTING STANDARDS
In 2014, the District adopted (GASB) Statement No. 65, Items Previously Reported as Assets and Liabilities. The objective of this Statement is to either properly classify certain items that were previously reported as assets and liabilities as deferred outflows of resources or deferred inflows of resources and to recognize certain items that were previously reported as assets and liabilities as expenses or expenditures (outflows of resources) or revenue (inflows of resources). This Statement had no material effect on the District’s financial statements.
53


The notes to the required supplementary information are an integral part of this schedule.54
Original FinalOriginal Final Actual to final to actual
RevenuesProperty taxes 49,969,017$ 49,969,017$ 49,262,745$ -$ (706,272)$ Other local sources 26,684,723 26,687,861 25,691,073 3,138 (996,788)Intermediate sources 837,051 837,051 1,290,752 - 453,701State sources 4,190,305 4,217,052 4,875,218 26,747 658,166Federal sources 3,586,347 3,722,604 3,566,656 136,257 (155,948)Other sources 425,000 425,000 369,126 - (55,874)
Total revenues 85,692,443 85,858,585 85,055,570 166,142 (803,015)
ExpendituresInstruction
Elementary 2,123,543 2,364,155 2,145,354 (240,612) 218,801Middle 1,414,407 1,340,136 1,215,731 74,271 124,405High 1,833,940 2,028,886 1,848,519 (194,946) 180,367TAG/title/special 1,309,792 640,673 496,913 669,119 143,760Early childhood special education 2,434,757 2,353,380 2,602,359 81,377 (248,979)Student act/athl/act/spons act 7,113,015 6,865,955 5,936,256 247,060 929,699Other instruction 87,800 86,534 81,646 1,266 4,888
Total instruction 16,317,254 15,679,719 14,326,778 637,535 1,352,941
Support servicesAttendance 1,590,332 1,619,669 1,345,011 (29,337) 274,658Guidance 755,724 755,939 700,077 (215) 55,862Health, psych, speech and audio 2,087,969 2,077,846 2,048,578 10,123 29,268Improvement of instruction 5,622,277 4,518,934 3,319,411 1,103,343 1,199,523Professional development 325,951 205,538 134,354 120,413 71,184Media services (library) 2,088,264 2,013,758 1,902,748 74,506 111,010Board of Education services 351,500 616,412 563,861 (264,912) 52,551Executive administration 1,358,776 1,290,854 995,337 67,922 295,517Building level administration 5,800,472 5,709,114 5,109,074 91,358 600,040Business central services 2,405,652 3,032,214 3,185,804 (626,562) (153,590)Operation of plant 24,091,026 23,268,378 24,057,972 822,648 (789,594)Security services 679,042 716,543 687,536 (37,501) 29,007Pupil transportation 8,973,951 8,772,686 9,630,378 201,265 (857,692)Food services 8,519,833 8,385,715 6,521,132 134,118 1,864,583Central office support services 3,033,274 3,490,061 3,363,331 (456,787) 126,730Adult education 194,706 116,294 84,631 78,412 31,663Community services 10,410,298 10,575,968 9,670,589 (165,670) 905,379
Total support services 78,289,047 77,165,923 73,319,824 1,123,124 3,846,099Total expenditures 94,606,301 92,845,642 87,646,602 1,760,659 5,199,040
Excess of revenues over(under) expenditures (8,913,858) (6,987,057) (2,591,032) 1,926,801 4,396,025
Other financing sources (uses)Transfers (459,634) (1,458,955) (999,321) (999,321) 459,634
NET CHANGE IN FUND BALANCE (9,373,492)$ (8,446,012)$ (3,590,353) 927,480$ 4,855,659$
Fund balance at July 1, 2013 39,947,025
Fund balance at June 30, 2014 36,356,672$
positive (negative)Budgeted amounts
ROCKWOOD R-VI SCHOOL DISTRICT
SCHEDULE OF REVENUES, EXPENDITURES AND CHANGES IN
Variances--
FUND BALANCE - BUDGET AND ACTUAL - GENERAL FUND - UNAUDITEDFOR THE YEAR ENDED JUNE 30, 2014
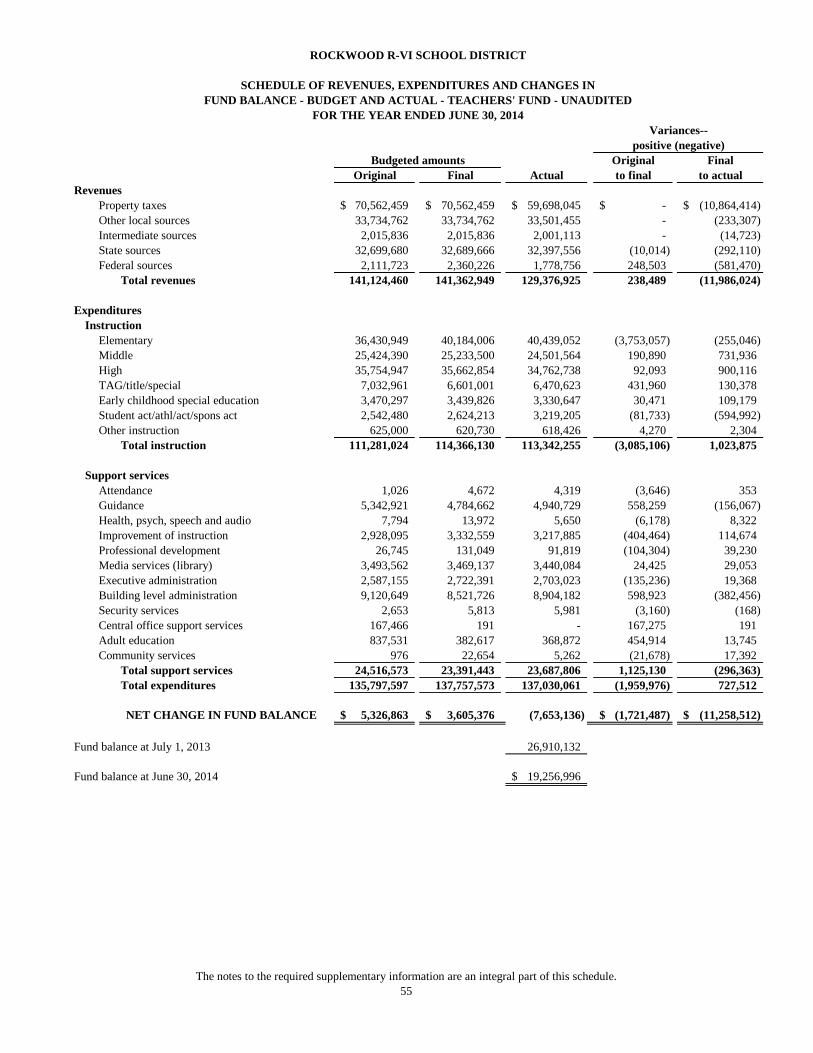
The notes to the required supplementary information are an integral part of this schedule.55
Original FinalOriginal Final Actual to final to actual
RevenuesProperty taxes 70,562,459$ 70,562,459$ 59,698,045$ -$ (10,864,414)$ Other local sources 33,734,762 33,734,762 33,501,455 - (233,307) Intermediate sources 2,015,836 2,015,836 2,001,113 - (14,723) State sources 32,699,680 32,689,666 32,397,556 (10,014) (292,110) Federal sources 2,111,723 2,360,226 1,778,756 248,503 (581,470)
Total revenues 141,124,460 141,362,949 129,376,925 238,489 (11,986,024)
ExpendituresInstruction
Elementary 36,430,949 40,184,006 40,439,052 (3,753,057) (255,046) Middle 25,424,390 25,233,500 24,501,564 190,890 731,936 High 35,754,947 35,662,854 34,762,738 92,093 900,116 TAG/title/special 7,032,961 6,601,001 6,470,623 431,960 130,378 Early childhood special education 3,470,297 3,439,826 3,330,647 30,471 109,179 Student act/athl/act/spons act 2,542,480 2,624,213 3,219,205 (81,733) (594,992) Other instruction 625,000 620,730 618,426 4,270 2,304
Total instruction 111,281,024 114,366,130 113,342,255 (3,085,106) 1,023,875
Support servicesAttendance 1,026 4,672 4,319 (3,646) 353 Guidance 5,342,921 4,784,662 4,940,729 558,259 (156,067) Health, psych, speech and audio 7,794 13,972 5,650 (6,178) 8,322 Improvement of instruction 2,928,095 3,332,559 3,217,885 (404,464) 114,674 Professional development 26,745 131,049 91,819 (104,304) 39,230 Media services (library) 3,493,562 3,469,137 3,440,084 24,425 29,053 Executive administration 2,587,155 2,722,391 2,703,023 (135,236) 19,368 Building level administration 9,120,649 8,521,726 8,904,182 598,923 (382,456) Security services 2,653 5,813 5,981 (3,160) (168) Central office support services 167,466 191 - 167,275 191 Adult education 837,531 382,617 368,872 454,914 13,745 Community services 976 22,654 5,262 (21,678) 17,392
Total support services 24,516,573 23,391,443 23,687,806 1,125,130 (296,363) Total expenditures 135,797,597 137,757,573 137,030,061 (1,959,976) 727,512
NET CHANGE IN FUND BALANCE 5,326,863$ 3,605,376$ (7,653,136) (1,721,487)$ (11,258,512)$
Fund balance at July 1, 2013 26,910,132
Fund balance at June 30, 2014 19,256,996$
positive (negative)Budgeted amounts
ROCKWOOD R-VI SCHOOL DISTRICT
SCHEDULE OF REVENUES, EXPENDITURES AND CHANGES IN
Variances--
FUND BALANCE - BUDGET AND ACTUAL - TEACHERS' FUND - UNAUDITEDFOR THE YEAR ENDED JUNE 30, 2014

56
ROCKWOOD R-VI SCHOOL DISTRICT
NOTES TO REQUIRED SUPPLEMENTARY INFORMATION JUNE 30, 2014
I. BUDGETS AND BUDGETARY ACCOUNTING
The District follows these procedures in establishing the budgetary data reflected in the financial statements: 1. In accordance with Chapter 67, RSMo, the District adopts a budget for
each major fund of the political subdivision.
2. Prior to July, the Chief Financial Officer, who serves as the budget officer, submits to the Board of Education a proposed modified accrual basis budget for the fiscal year beginning on the following July 1. The proposed budget includes estimated revenues and proposed expenditures for all funds. Budgeted expenditures cannot exceed available monies plus estimated reserves for the year.
3. A public hearing is conducted to obtain taxpayer comments. Prior to its
approval by the Board of Education, the budget document is available for public inspection.
4. In June 2013 the budget was legally enacted by a vote of the Board of
Education.
5. Subsequent to its formal approval of the budget, the Board of Education has the authority to make necessary adjustments to the budget by formal vote of the board. Adjustments made during the year are reflected in the budget information included in the budgetary comparison schedules
6. Budgets are presented on the modified accrual basis of accounting for all
governmental funds.
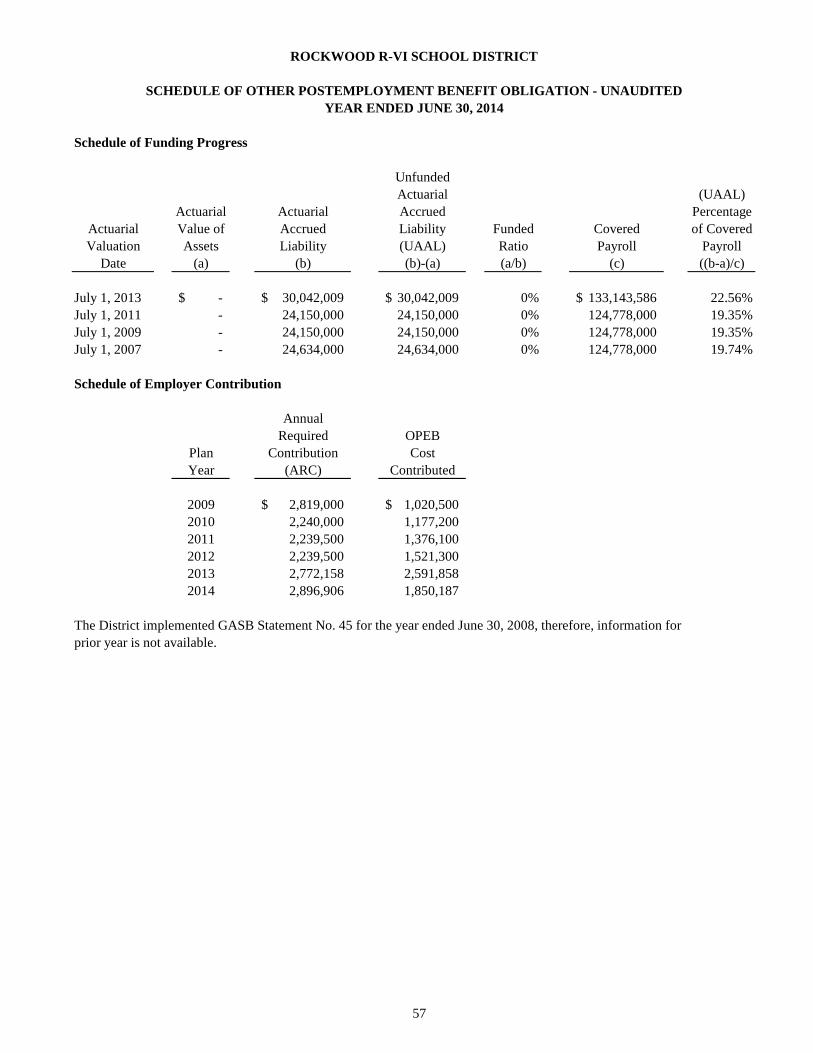
57
Schedule of Funding Progress
UnfundedActuarial (UAAL)
Actuarial Actuarial Accrued PercentageActuarial Value of Accrued Liability Funded Covered of CoveredValuation Assets Liability (UAAL) Ratio Payroll Payroll
Date (a) (b) (b)-(a) (a/b) (c) ((b-a)/c)
July 1, 2013 -$ 30,042,009$ 30,042,009$ 0% 133,143,586$ 22.56%July 1, 2011 - 24,150,000 24,150,000 0% 124,778,000 19.35%July 1, 2009 - 24,150,000 24,150,000 0% 124,778,000 19.35%July 1, 2007 - 24,634,000 24,634,000 0% 124,778,000 19.74%
Schedule of Employer Contribution
AnnualRequired OPEB
Plan Contribution CostYear (ARC) Contributed
2009 2,819,000$ 1,020,500$ 2010 2,240,000 1,177,200 2011 2,239,500 1,376,100 2012 2,239,500 1,521,300 2013 2,772,158 2,591,858 2014 2,896,906 1,850,187
The District implemented GASB Statement No. 45 for the year ended June 30, 2008, therefore, information forprior year is not available.
ROCKWOOD R-VI SCHOOL DISTRICT
SCHEDULE OF OTHER POSTEMPLOYMENT BENEFIT OBLIGATION - UNAUDITEDYEAR ENDED JUNE 30, 2014
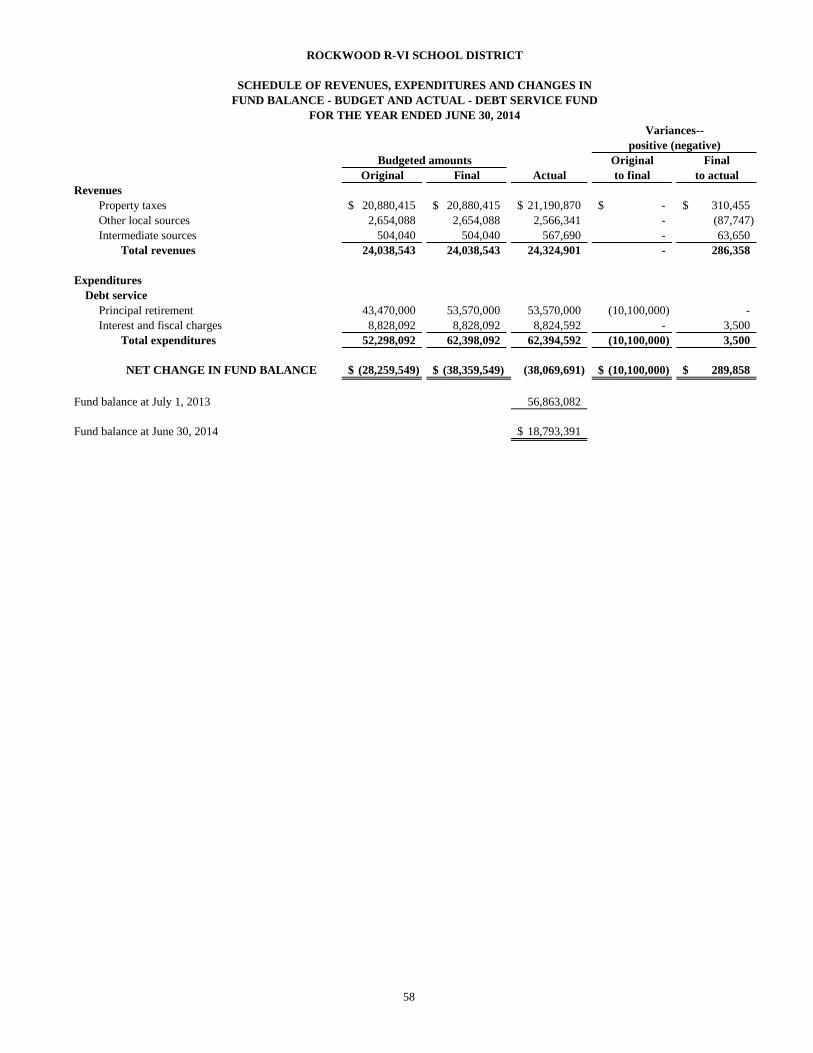
58
Original FinalOriginal Final Actual to final to actual
RevenuesProperty taxes 20,880,415$ 20,880,415$ 21,190,870$ -$ 310,455$ Other local sources 2,654,088 2,654,088 2,566,341 - (87,747)Intermediate sources 504,040 504,040 567,690 - 63,650
Total revenues 24,038,543 24,038,543 24,324,901 - 286,358
ExpendituresDebt service
Principal retirement 43,470,000 53,570,000 53,570,000 (10,100,000) - Interest and fiscal charges 8,828,092 8,828,092 8,824,592 - 3,500
Total expenditures 52,298,092 62,398,092 62,394,592 (10,100,000) 3,500
NET CHANGE IN FUND BALANCE (28,259,549)$ (38,359,549)$ (38,069,691) (10,100,000)$ 289,858$
Fund balance at July 1, 2013 56,863,082
Fund balance at June 30, 2014 18,793,391$
positive (negative)Budgeted amounts
ROCKWOOD R-VI SCHOOL DISTRICT
SCHEDULE OF REVENUES, EXPENDITURES AND CHANGES IN
Variances--
FUND BALANCE - BUDGET AND ACTUAL - DEBT SERVICE FUNDFOR THE YEAR ENDED JUNE 30, 2014

59
Original FinalOriginal Final Actual to final to actual
RevenuesProperty taxes 3,786,885$ 3,786,885$ 15,793,030$ -$ 12,006,145$ Other local sources 304,258 404,258 1,266,108 100,000 861,850 Intermediate sources 38,683 38,683 280,396 - 241,713 State sources 1,400 1,400 - - (1,400) Federal sources - - 3,150 - 3,150 Other sources 20,000 20,000 22,488 - 2,488
Total revenues 4,151,226 4,251,226 17,365,172 100,000 13,113,946
ExpendituresInstruction
Elementary - 42,999 12,224 (42,999) 30,775 Middle 33,316 62,138 52,910 (28,822) 9,228 High 126,615 121,657 99,727 4,958 21,930 TAG/title/special - 83,829 78,652 (83,829) 5,177 Early childhood special education - 32,600 8,479 (32,600) 24,121 Student act/athl/act/spons act 26,332 120,721 118,821 (94,389) 1,900
Total instruction 186,263 463,944 370,813 (277,681) 93,131
Support servicesAttendance - 3,600 3,316 (3,600) 284 Improvement of instruction - 640,824 248,777 (640,824) 392,047 Media services (library) - 2,500,000 2,003,756 (2,500,000) 496,244 Executive administration 246,236 640,452 210,062 (394,216) 430,390 Business central services - 23,918 14,071 (23,918) 9,847 Operation of plant 2,355,764 380,215 347,588 1,975,549 32,627 Food services - 193,692 193,692 (193,692) - Central office support services - 19,490 18,870 (19,490) 620 Adult education - 5,000 4,267 (5,000) 733 Community services 9,000 1,110,134 1,009,912 (1,101,134) 100,222 Facilities acquisition and construction 3,222,330 7,106,109 5,126,124 (3,883,779) 1,979,985
Total support services 5,833,330 12,623,434 9,180,435 (6,790,104) 3,442,999 Total expenditures 6,019,593 13,087,378 9,551,248 (7,067,785) 3,536,130
Excess of revenues over(under) expenditures (1,868,367) (8,836,152) 7,813,924 (6,967,785) 16,650,076
Other financing sources Transfers - 999,321 999,321 999,321 -
NET CHANGE IN FUND BALANCE (1,868,367)$ (7,836,831)$ 8,813,245 (5,968,464)$ 16,650,076$
Fund balance at July 1, 2013 2,990,620
Fund balance at June 30, 2014 11,803,865$
positive (negative)Budgeted amounts
ROCKWOOD R-VI SCHOOL DISTRICT
SCHEDULE OF REVENUES, EXPENDITURES AND CHANGES IN
Variances--
FUND BALANCE - BUDGET AND ACTUAL - CAPITAL PROJECTS FUNDFOR THE YEAR ENDED JUNE 30, 2014

60
Original FinalOriginal Final Actual to final to actual
RevenuesProperty taxes 145,198,776$ 145,198,776$ 145,944,690$ -$ 745,914$ Other local sources 63,377,831 63,480,969 63,024,977 103,138 (455,992) Intermediate sources 3,395,610 3,395,610 4,139,951 - 744,341 State sources 36,891,385 36,908,118 37,272,774 16,733 364,656 Federal sources 5,698,070 6,082,830 5,348,562 384,760 (734,268) Other sources 445,000 445,000 391,614 - (53,386)
Total revenues 255,006,672 255,511,303 256,122,568 504,631 611,265
ExpendituresInstruction
Elementary 38,554,492 42,591,160 42,596,630 (4,036,668) (5,470) Middle 26,872,113 26,635,774 25,770,205 236,339 865,569 High 37,715,502 37,813,397 36,710,984 (97,895) 1,102,413 TAG/title/special 8,342,753 7,325,503 7,046,188 1,017,250 279,315 Early childhood special education 5,905,054 5,825,806 5,941,485 79,248 (115,679) Student act/athl/act/spons act 9,681,827 9,610,889 9,274,282 70,938 336,607 Other instruction 712,800 707,264 700,072 5,536 7,192
Total instruction 127,784,541 130,509,793 128,039,846 (2,725,252) 2,469,947
Support servicesAttendance 1,591,358 1,627,941 1,352,646 (36,583) 275,295 Guidance 6,098,645 5,540,601 5,640,806 558,044 (100,205) Health, psych, speech and audio 2,095,763 2,091,818 2,054,228 3,945 37,590 Improvement of instruction 8,550,372 8,492,317 6,786,073 58,055 1,706,244 Professional development 352,696 336,587 226,173 16,109 110,414 Media services (library) 5,581,826 7,982,895 7,346,588 (2,401,069) 636,307 Board of education services 351,500 616,412 563,861 (264,912) 52,551 Executive administration 4,192,167 4,653,697 3,908,422 (461,530) 745,275 Building level administration 14,921,121 14,230,840 14,013,256 690,281 217,584 Business central services 2,405,652 3,056,132 3,199,875 (650,480) (143,743) Operation of plant 26,446,790 23,648,593 24,405,560 2,798,197 (756,967) Security Services 681,695 722,356 693,517 (40,661) 28,839 Pupil transportation 8,973,951 8,772,686 9,630,378 201,265 (857,692) Food services 8,519,833 8,579,407 6,714,824 (59,574) 1,864,583 Central office support services 3,200,740 3,509,742 3,382,201 (309,002) 127,541 Adult education 1,032,237 503,911 457,770 528,326 46,141 Community services 10,420,274 11,708,756 10,685,763 (1,288,482) 1,022,993 Facilities acquisition and construction 3,222,330 7,106,109 5,126,124 (3,883,779) 1,979,985
Debt service Principal retirement 43,470,000 53,570,000 53,570,000 (10,100,000) - Interest and fiscal charges 8,828,092 8,828,092 8,824,592 - 3,500
Total support services 160,937,042 175,578,892 168,582,657 (14,641,850) 6,996,235 Total expenditures 288,721,583 306,088,685 296,622,503 (17,367,102) 9,466,182
Excess of revenues over (under) expenditures (33,714,911) (50,577,382) (40,499,935) (16,862,471) 10,077,447
Other financing sources (uses)Transfers (459,634) (459,634) - - 459,634
NET CHANGE IN FUND BALANCE (34,174,545)$ (51,037,016)$ (40,499,935) (16,862,471)$ 10,537,081$
Fund balance at July 1, 2013 126,710,859
Fund balance at June 30, 2014 86,210,924$
positive (negative)Budgeted amounts
ROCKWOOD R-VI SCHOOL DISTRICT
SCHEDULE OF REVENUES, EXPENDITURES AND CHANGES IN
FOR THE YEAR ENDED JUNE 30, 2014Variances--
FUND BALANCE - BUDGET AND ACTUAL - ALL MAJOR FUNDS
ROCKWOOD R-VI SCHOOL DISTRICT
SUMMARY OF STATISTICAL INFORMATION JUNE 30, 2014
This part of the District’s comprehensive annual financial report presents detailed information as a context for understanding what the information in the financial statements, note disclosures and required supplementary information says about the District’s overall financial position.
Contents Page Continuing Disclosure Information 62-64
These schedules are required as part of the District’s ongoing general obligation bonded debt disclosures and give additional information to investors about the financial position of the District.
Financial Trends 65-68 These schedules contain trend information to help the reader understand how the District’s financial performance and position have changed over time.
Revenue Capacity 69-73 These schedules contain information to help the reader assess the District’s most significant local revenue source – the property tax.
Debt Capacity 74-77 These schedules present information to help the reader assess the affordability of the District’s current levels of outstanding debt and the District’s ability to issue additional debt in the future.
Demographic and Economic Information 78-79 These schedules offer demographic and economic indicators to help the reader understand the environment within which the District’s financial activities take place.
Operating Information 80-86 These schedules contain service and infrastructure data to help the reader understand how the information in the District’s financial report relates to the services the District provides and the activities it performs.
61
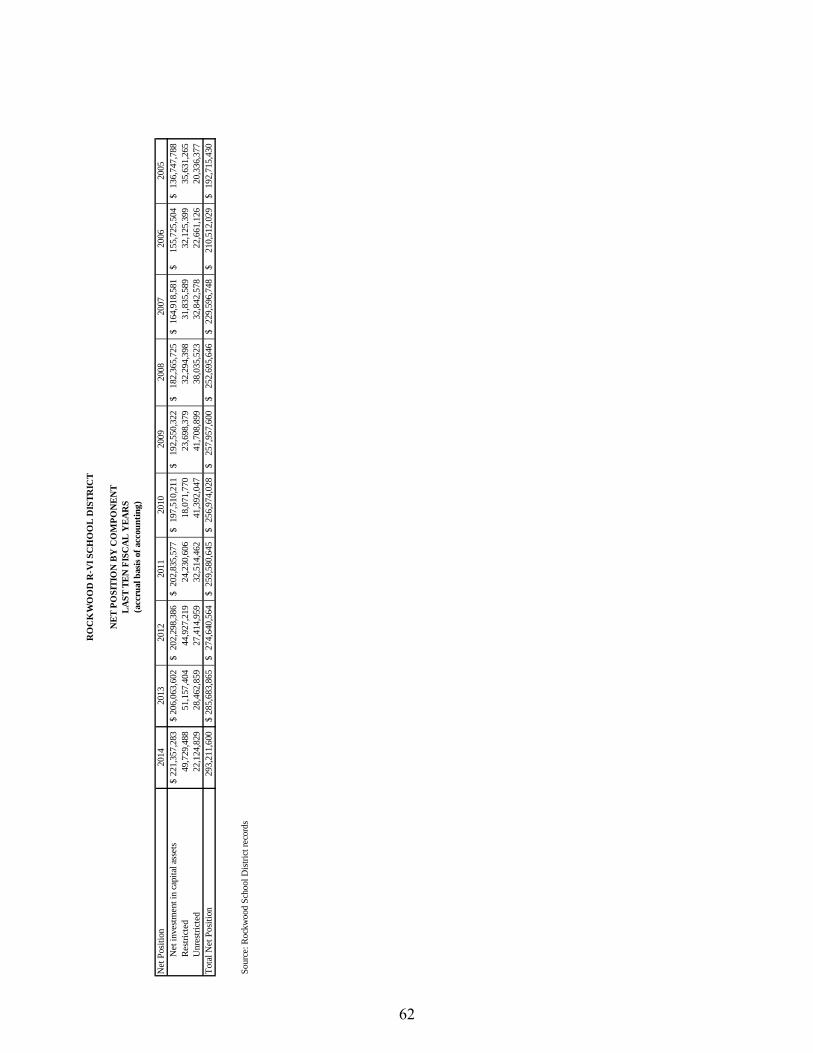
Net
Pos
ition
2014
2013
2012
2011
2010
2009
2008
2007
2006
2005
Net
inve
stmen
t in
capi
tal a
sset
s22
1,35
7,28
3$
20
6,06
3,60
2$
20
2,29
8,38
6$
20
2,83
5,57
7$
19
7,51
0,21
1$
19
2,55
0,32
2$
18
2,36
5,72
5$
16
4,91
8,58
1$
15
5,72
5,50
4$
136,
747,
788
$
Restr
icte
d49
,729
,488
51,1
57,4
04
44
,927
,219
24
,230
,606
18
,071
,770
23
,698
,379
32
,294
,398
31
,835
,589
32
,125
,399
35,6
31,2
65
Unr
estri
cted
22,1
24,8
29
28
,462
,859
27,4
14,9
59
32,5
14,4
62
41,3
92,0
47
41,7
08,8
99
38,0
35,5
23
32,8
42,5
78
22,6
61,1
26
20
,336
,377
To
tal N
et P
ositi
on29
3,21
1,60
0
28
5,68
3,86
5$
27
4,64
0,56
4$
25
9,58
0,64
5$
25
6,97
4,02
8$
25
7,95
7,60
0$
25
2,69
5,64
6$
22
9,59
6,74
8$
21
0,51
2,02
9$
192,
715,
430
$
Sour
ce: R
ockw
ood
Scho
ol D
istric
t rec
ords
RO
CK
WO
OD
R-V
I SC
HO
OL
DIS
TRIC
T
NET
PO
SITI
ON
BY
CO
MPO
NEN
TLA
ST T
EN F
ISC
AL
YEA
RS
(acc
rual
bas
is of
acc
ount
ing)
62
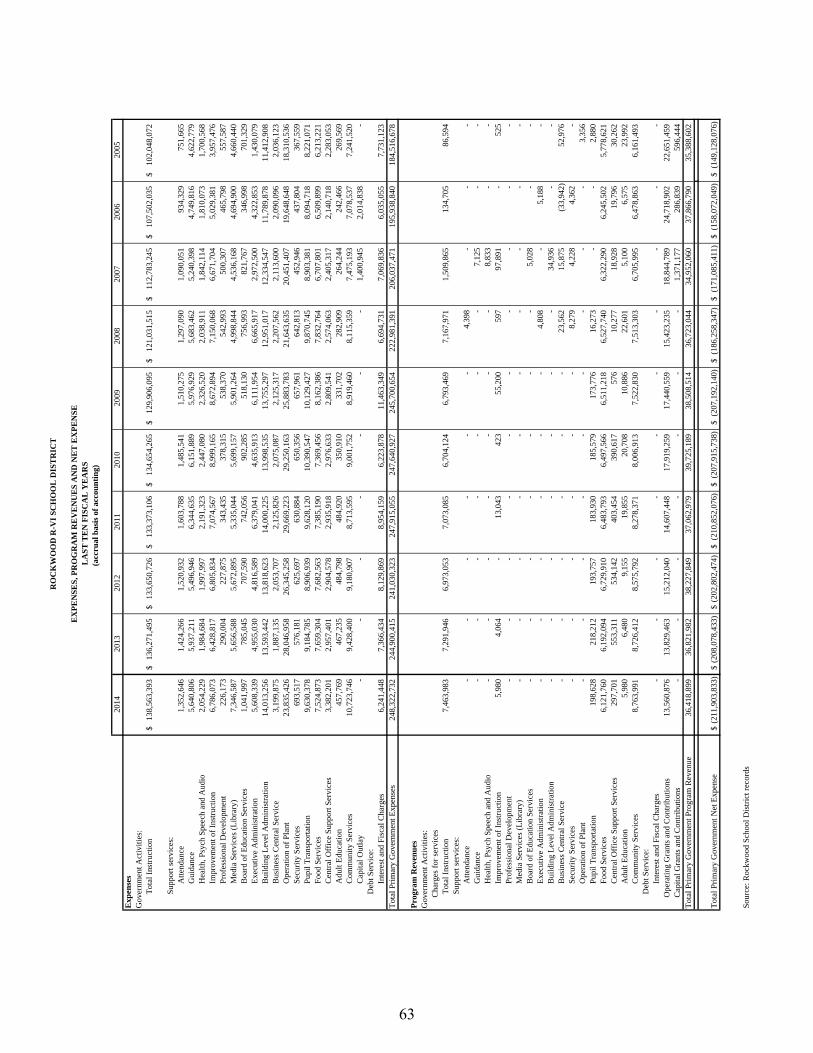
2014
2013
2012
2011
2010
2009
2008
2007
2006
2005
Exp
ense
sG
over
nmen
t Act
iviti
es:
Tota
l Ins
truct
ion
138,
563,
393
$
136,
271,
495
$
133,
650,
726
$
133,
373,
106
$
134,
654,
265
$
129,
906,
095
$
121,
031,
515
$
112,
783,
245
$
107,
502,
035
$
102,
048,
072
$
Supp
ort s
ervi
ces:
Atte
ndan
ce1,
352,
646
1,
424,
266
1,
520,
932
1,
603,
788
1,
485,
541
1,
510,
275
1,
297,
090
1,
090,
051
93
4,32
9
751,
665
G
uida
nce
5,64
0,80
6
5,93
7,21
1
5,49
6,94
6
6,34
4,63
5
6,15
1,88
9
5,97
6,92
9
5,68
3,46
2
5,24
0,39
8
4,74
9,81
6
4,62
2,77
9
Hea
lth, P
sych
Spe
ech
and
Aud
io2,
054,
229
1,
984,
684
1,
997,
997
2,
191,
323
2,
447,
080
2,
326,
520
2,
038,
911
1,
842,
114
1,
810,
073
1,
700,
568
Im
prov
emen
t of I
nstru
ctio
n6,
786,
073
6,
428,
817
6,
805,
834
7,
074,
567
8,
999,
165
8,
672,
894
7,
150,
068
6,
671,
704
5,
029,
381
3,
957,
476
Pr
ofes
sion
al D
evel
opm
ent
226,
173
29
0,00
4
227,
875
34
3,43
5
378,
315
53
8,37
0
542,
993
50
0,30
7
465,
798
55
7,58
7
Med
ia S
ervi
ces (
Libr
ary)
7,34
6,58
7
5,65
6,58
8
5,67
2,89
5
5,33
5,04
4
5,69
9,15
7
5,90
1,26
4
4,99
8,84
4
4,53
6,16
8
4,69
4,90
0
4,66
0,44
0
Boa
rd o
f Edu
catio
n Se
rvic
es1,
041,
997
78
5,04
5
707,
590
74
2,05
6
902,
285
51
8,13
0
756,
993
82
1,76
7
346,
998
70
1,32
9
Exec
utiv
e A
dmin
istra
tion
5,60
8,33
9
4,95
5,03
0
4,81
6,58
9
6,37
9,04
1
4,63
5,91
3
6,11
1,95
4
6,66
5,91
7
2,97
2,50
0
4,32
2,85
3
1,43
0,07
9
Bui
ldin
g Le
vel A
dmin
istra
tion
14,0
13,2
56
13,5
93,4
42
13,8
18,6
23
14,0
00,2
25
13,9
98,5
35
13,7
55,2
97
12,9
51,0
17
12,3
34,5
47
11,7
89,8
78
11,4
12,9
08
Bus
ines
s Cen
tral S
ervi
ce3,
199,
875
1,
887,
135
2,
053,
707
2,
125,
826
2,
075,
087
2,
125,
317
2,
207,
562
2,
113,
600
2,
090,
096
2,
036,
123
O
pera
tion
of P
lant
23,8
35,4
26
28,0
46,9
58
26,3
45,2
58
29,6
69,2
23
29,2
50,1
63
25,8
83,7
83
21,6
43,6
35
20,4
51,4
07
19,6
48,6
48
18,3
10,5
36
Secu
rity
Serv
ices
693,
517
57
6,18
1
625,
697
63
0,88
4
650,
356
65
7,96
1
642,
813
45
2,94
6
437,
804
36
7,55
9
Pupi
l Tra
nspo
rtatio
n9,
630,
378
9,
184,
785
8,
906,
939
9,
628,
120
10
,390
,547
10
,129
,427
9,
870,
745
8,
903,
381
8,
094,
718
8,
221,
071
Fo
od S
ervi
ces
7,52
4,87
3
7,65
9,30
4
7,68
2,56
3
7,38
5,19
0
7,36
9,45
6
8,16
2,38
6
7,83
2,76
4
6,70
7,80
1
6,50
9,89
9
6,21
3,22
1
Cen
tral O
ffic
e Su
ppor
t Ser
vice
s3,
382,
201
2,
957,
401
2,
904,
578
2,
935,
918
2,
976,
633
2,
809,
541
2,
574,
063
2,
405,
317
2,
140,
718
2,
283,
053
A
dult
Educ
atio
n45
7,76
9
467,
235
48
4,79
8
484,
920
35
0,91
0
331,
702
28
2,90
9
264,
244
24
2,46
6
269,
569
C
omm
unity
Ser
vice
s10
,723
,746
9,
428,
400
9,
180,
907
8,
713,
595
9,
001,
752
8,
919,
460
8,
115,
359
7,
475,
193
7,
078,
537
7,
241,
520
C
apita
l Out
lay
-
-
-
-
-
-
-
1,
400,
945
2,
014,
838
-
D
ebt S
ervi
ce:
Inte
rest
and
Fis
cal C
harg
es6,
241,
448
7,
366,
434
8,
129,
869
8,
954,
159
6,
223,
878
11
,463
,349
6,
694,
731
7,
069,
836
6,
035,
055
7,
731,
123
To
tal P
rimar
y G
over
nmen
t Exp
ense
s24
8,32
2,73
2
24
4,90
0,41
5
24
1,03
0,32
3
24
7,91
5,05
5
24
7,64
0,92
7
24
5,70
0,65
4
22
2,98
1,39
1
20
6,03
7,47
1
19
5,93
8,84
0
18
4,51
6,67
8
Prog
ram
Rev
enue
sG
over
nmen
t Act
iviti
es:
Cha
rges
for s
ervi
ces
Tota
l Ins
truct
ion
7,46
3,98
3
7,29
1,94
6
6,97
3,05
3
7,07
3,08
5
6,70
4,12
4
6,79
3,46
9
7,16
7,97
1
1,50
9,86
5
134,
705
86
,594
Su
ppor
t ser
vice
s:A
ttend
ance
-
-
-
-
-
-
4,
398
-
-
-
Gui
danc
e-
-
-
-
-
-
-
7,12
5
-
-
H
ealth
, Psy
ch S
peec
h an
d A
udio
-
-
-
-
-
-
-
8,
833
-
-
Impr
ovem
ent o
f Ins
truct
ion
5,98
0
4,
064
-
13
,043
42
3
55,2
00
597
97
,891
-
52
5
Prof
essi
onal
Dev
elop
men
t-
-
-
-
-
-
-
-
-
-
Med
ia S
ervi
ces (
Libr
ary)
-
-
-
-
-
-
-
-
-
-
B
oard
of E
duca
tion
Serv
ices
-
-
-
-
-
-
-
5,
028
-
-
Exec
utiv
e A
dmin
istra
tion
-
-
-
-
-
-
4,
808
-
5,18
8
-
B
uild
ing
Leve
l Adm
inis
tratio
n-
-
-
-
-
-
-
34,9
36
-
-
Bus
ines
s Cen
tral S
ervi
ce-
-
-
-
-
-
23,5
62
15,8
75
(33,
942)
52
,976
Se
curit
y Se
rvic
es-
-
-
-
-
-
8,27
9
4,
228
4,36
2
-
O
pera
tion
of P
lant
-
-
-
-
-
-
-
-
-
3,
356
Pupi
l Tra
nspo
rtatio
n19
8,62
8
218,
212
19
3,75
7
183,
930
18
5,57
9
173,
776
16
,273
-
-
2,
880
Food
Ser
vice
s6,
121,
760
6,
192,
094
6,
729,
910
6,
483,
793
6,
497,
566
6,
511,
218
6,
527,
740
6,
322,
290
6,
245,
502
5,
778,
621
C
entra
l Off
ice
Supp
ort S
ervi
ces
297,
701
55
3,31
1
534,
142
40
3,45
4
390,
617
57
6
10,2
77
18,9
28
19,7
96
30,2
62
Adu
lt Ed
ucat
ion
5,98
0
6,
480
9,15
5
19
,855
20
,708
10
,886
22
,601
5,
100
6,57
5
23
,992
C
omm
unity
Ser
vice
s8,
763,
991
8,
726,
412
8,
575,
792
8,
278,
371
8,
006,
913
7,
522,
830
7,
513,
303
6,
705,
995
6,
478,
863
6,
161,
493
D
ebt S
ervi
ce:
Inte
rest
and
Fis
cal C
harg
es-
-
-
-
-
-
-
-
-
-
Ope
ratin
g G
rant
s and
Con
tribu
tions
13,5
60,8
76
13,8
29,4
63
15,2
12,0
40
14,6
07,4
48
17,9
19,2
59
17,4
40,5
59
15,4
23,2
35
18,8
44,7
89
24,7
18,9
02
22,6
51,4
59
Cap
ital G
rant
s and
Con
tribu
tions
-
-
-
-
-
-
-
1,
371,
177
28
6,83
9
596,
444
To
tal P
rimar
y G
over
nmen
t Pro
gram
Rev
enue
36,4
18,8
99
36,8
21,9
82
38,2
27,8
49
37,0
62,9
79
39,7
25,1
89
38,5
08,5
14
36,7
23,0
44
34,9
52,0
60
37,8
66,7
90
35,3
88,6
02
Tota
l Prim
ary
Gov
ernm
ent N
et E
xpen
se(2
11,9
03,8
33)
$
(208
,078
,433
)$
(2
02,8
02,4
74)
$
(210
,852
,076
)$
(2
07,9
15,7
38)
$
(207
,192
,140
)$
(1
86,2
58,3
47)
$
(171
,085
,411
)$
(1
58,0
72,0
49)
$
(149
,128
,076
)$
Sour
ce: R
ockw
ood
Scho
ol D
istri
ct re
cord
s
EX
PEN
SES,
PR
OG
RA
M R
EV
EN
UE
S A
ND
NE
T E
XPE
NSE
LA
ST T
EN
FIS
CA
L Y
EA
RS
(acc
rual
bas
is o
f acc
ount
ing)
RO
CK
WO
OD
R-V
I SC
HO
OL
DIS
TR
ICT
63
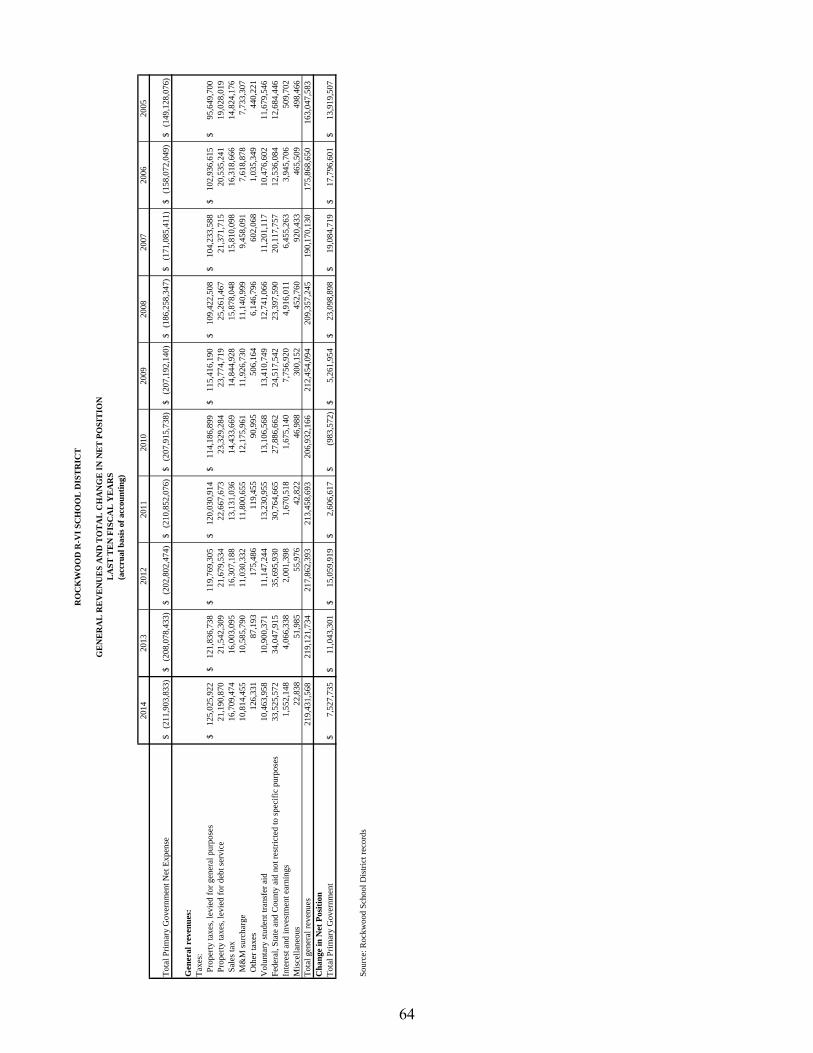
2014
2013
2012
2011
2010
2009
2008
2007
2006
2005
Tota
l Prim
ary
Gov
ernm
ent N
et E
xpen
se(2
11,9
03,8
33)
$
(208
,078
,433
)$
(2
02,8
02,4
74)
$
(210
,852
,076
)$
(2
07,9
15,7
38)
$
(207
,192
,140
)$
(1
86,2
58,3
47)
$
(171
,085
,411
)$
(1
58,0
72,0
49)
$
(149
,128
,076
)$
Gen
eral
rev
enue
s:Ta
xes:
Pro
perty
taxe
s, le
vied
for g
ener
al p
urpo
ses
125,
025,
922
$
12
1,83
6,73
8$
119,
769,
305
$
12
0,03
0,91
4$
114,
186,
899
$
11
5,41
6,19
0$
109,
422,
508
$
10
4,23
3,58
8$
102,
936,
615
$
95
,649
,700
$
P
rope
rty ta
xes,
levi
ed fo
r deb
t ser
vice
21,1
90,8
70
21,5
42,3
09
21,6
79,5
34
22,6
67,6
73
23,3
29,2
84
23,7
74,7
19
25,2
61,4
67
21,3
71,7
15
20,5
35,2
41
19,0
28,0
19
Sal
es ta
x16
,709
,474
16
,003
,095
16
,307
,188
13
,131
,036
14
,433
,669
14
,844
,928
15
,878
,048
15
,810
,098
16
,318
,666
14
,824
,176
M
&M
surc
harg
e10
,814
,455
10
,585
,790
11
,030
,332
11
,800
,655
12
,175
,961
11
,926
,730
11
,140
,999
9,
458,
091
7,61
8,87
8
7,
733,
307
Oth
er ta
xes
126,
331
87
,193
175,
486
11
9,45
5
90,9
95
506,
164
6,
146,
796
602,
068
1,
035,
349
440,
221
V
olun
tary
stud
ent t
rans
fer a
id10
,463
,958
10
,900
,371
11
,147
,244
13
,230
,955
13
,106
,568
13
,410
,749
12
,741
,066
11
,201
,117
10
,476
,602
11
,679
,546
Fe
dera
l, St
ate
and
Cou
nty
aid
not r
estri
cted
to sp
ecifi
c pu
rpos
es33
,525
,572
34
,047
,915
35
,695
,930
30
,764
,665
27
,886
,662
24
,517
,542
23
,397
,590
20
,117
,757
12
,536
,084
12
,684
,446
In
tere
st a
nd in
vest
men
t ear
ning
s1,
552,
148
4,06
6,33
8
2,
001,
398
1,67
0,51
8
1,
675,
140
7,75
6,92
0
4,
916,
011
6,45
5,26
3
3,
945,
706
509,
702
M
isce
llane
ous
22,8
38
51
,985
55,9
76
42,8
22
46,9
88
300,
152
45
2,76
0
920,
433
46
5,50
9
498,
466
To
tal g
ener
al re
venu
es21
9,43
1,56
8
219,
121,
734
21
7,86
2,39
3
21
3,45
8,69
3
20
6,93
2,16
6
21
2,45
4,09
4
20
9,35
7,24
5
19
0,17
0,13
0
175,
868,
650
163,
047,
583
Cha
nge
in N
et P
ositi
onTo
tal P
rimar
y G
over
nmen
t7,
527,
735
$
11,0
43,3
01$
15,0
59,9
19$
2,60
6,61
7$
(9
83,5
72)
$
5,26
1,95
4$
23
,098
,898
$
19
,084
,719
$
17
,796
,601
$
13
,919
,507
$
Sour
ce: R
ockw
ood
Scho
ol D
istri
ct re
cord
s
RO
CK
WO
OD
R-V
I SC
HO
OL
DIS
TR
ICT
GE
NE
RA
L R
EV
EN
UE
S A
ND
TO
TA
L C
HA
NG
E IN
NE
T P
OSI
TIO
NL
AST
TE
N F
ISC
AL
YE
AR
S(a
ccru
al b
asis
of a
ccou
ntin
g)
64

2009
2008
2007
2006
2005
Gen
eral
Fun
dR
eser
ved
1,05
4,93
8$
947,
071
$
987,
616
$
939,
627
$
845,
501
$
Unr
eser
ved
44,6
09,4
05
40
,361
,130
32,5
90,2
04
25
,135
,212
18,2
88,6
08
To
tal G
ener
al fu
nd45
,664
,343
$
41,3
08,2
01$
33
,577
,820
$
26,0
74,8
39$
19
,134
,109
$
All
Oth
er G
over
nmen
tal F
unds
Res
erve
d-D
ebt S
ervi
ce25
,258
,210
$
22,1
87,5
13$
21
,329
,873
$
19,8
45,6
49$
16
,624
,042
$
Unr
eser
ved
repo
rted
in:
Spec
ial R
even
ue F
und
10,7
32,2
78
17
,983
,125
16,9
73,4
14
16
,645
,139
12,4
63,8
72
C
apita
l Pro
ject
s Fun
d43
,584
,807
79,9
24,8
74
23
,837
,416
45,7
26,6
56
16
,161
,303
Tota
l all
othe
r gov
ernm
enta
l fun
ds79
,575
,295
120,
095,
512
62
,140
,703
82,2
17,4
44
45
,249
,217
Tota
l Fun
d B
alan
ce12
5,23
9,63
8$
16
1,40
3,71
3$
95,7
18,5
23$
10
8,29
2,28
3$
64
,383
,326
$
2014
2013
2012
2011
2010
Gen
eral
Fun
dN
onsp
enda
ble
Prep
aid
item
s1,
105,
968
$
1,
107,
599
$
1,
037,
790
$
1,
087,
100
$
1,
113,
673
$
In
vent
ory
793,
810
-
-
-
-
Una
ssig
ned
34,4
56,8
94
38
,839
,426
37,5
51,8
09
40
,165
,482
42,6
37,7
21
To
tal G
ener
al F
und
36,3
56,6
72$
39
,947
,025
$
38,5
89,5
99$
41
,252
,582
$
43,7
51,3
94$
All
Oth
er G
over
nmen
tal F
unds
Res
trict
edFe
dera
l gra
nts
-
-
-
46
9,33
1
2,
386,
610
Te
ache
r sal
arie
s and
ben
efits
19,2
56,9
96
26
,910
,132
21,2
56,6
14
7,
580,
285
4,
125,
585
R
etire
men
t of d
ebt
18,7
93,3
91
56
,863
,082
55,4
41,7
40
48
,215
,699
50,0
99,3
50
C
apita
l im
prov
emen
ts-
-
5,
738,
143
27
,999
,956
41,0
67,4
09
A
ssig
ned
Oth
er c
apita
l pro
ject
s11
,803
,865
2,99
0,62
0
3,79
0,12
8
2,05
1,27
2
1,19
9,75
4
Tota
l all
othe
r gov
ernm
enta
l fun
ds49
,854
,252
86,7
63,8
34
86
,226
,625
86,3
16,5
43
98
,878
,708
Tota
l Fun
d B
alan
ce86
,210
,924
$
126,
710,
859
$
124,
816,
224
$ 12
7,56
9,12
5$
14
2,63
0,10
2$
Sour
ce: R
ockw
ood
Scho
ol D
istri
ct re
cord
s
Not
e: G
ASB
54
was
impl
emen
ted
in 2
010
caus
ing
the
diff
eren
ce in
fund
bal
ance
cla
ssifi
catio
ns.
RO
CK
WO
OD
R-V
I SC
HO
OL
DIS
TR
ICT
FUN
D B
AL
AN
CE
S - G
OV
ER
NM
EN
TA
L F
UN
DS
LA
ST T
EN
FIS
CA
L Y
EA
RS
(mod
ified
acc
rual
bas
is o
f acc
ount
ing)
65

2014
2013
2012
2011
2010
2009
2008
2007
2006
2005
Rev
enue
sPr
oper
ty T
axes
145,
944,
690
$
143,
690,
111
$
142,
288,
500
$
142,
512,
111
$
137,
515,
532
$
142,
218,
514
$
134,
683,
975
$
125,
884,
804
$
123,
859,
355
$
117,
118,
710
$
Oth
er L
ocal
Sou
rces
63,0
24,9
77
65,1
06,5
94
64,3
58,1
17
62,5
76,4
66
63,8
24,6
56
66,4
73,2
86
73,2
06,0
02
63,6
35,2
07
59,4
50,0
75
55,4
38,7
21
Cou
nty
Sour
ces
4,13
9,95
1
3,47
1,02
2
4,25
2,94
9
2,61
2,65
9
3,11
7,99
9
2,85
9,87
5
2,92
0,46
5
2,89
8,67
4
2,47
8,22
9
2,88
9,22
9
Stat
e So
urce
s37
,272
,774
37
,293
,036
38
,136
,803
32
,844
,421
29
,459
,257
30
,822
,501
28
,742
,867
25
,369
,682
23
,046
,005
22
,390
,044
Fe
dera
l Sou
rces
5,34
8,56
2
6,12
6,11
0
8,22
0,64
1
8,51
4,39
5
12,2
29,4
85
6,84
7,04
1
5,64
2,01
0
5,17
0,61
4
5,25
5,06
7
4,99
8,80
4
Oth
er S
ourc
es49
5,96
8
51
6,94
8
1,
139,
852
2,
406,
485
71
5,21
6
53
2,60
5
60
1,77
3
44
2,70
6
10
,572
62
,518
To
tal R
even
ues
256,
226,
922
$
256,
203,
821
$
258,
396,
862
$
251,
466,
537
$
246,
862,
145
$
249,
753,
822
$
245,
797,
092
$
223,
401,
687
$
214,
099,
303
$
202,
898,
026
$
Sour
ce: R
ockw
ood
Scho
ol D
istri
ct re
cord
s
RO
CK
WO
OD
R-V
I SC
HO
OL
DIS
TRIC
T
GO
VER
NM
ENTA
L FU
ND
S R
EVEN
UES
LAST
TEN
FIS
CA
L Y
EAR
S(m
odifi
ed a
ccru
al b
asis
of a
ccou
ntin
g)
66

2014
2013
2012
2011
2010
2009
2008
2007
2006
2005
EXPE
ND
ITU
RES
T
otal
Inst
ruct
ion
128,
039,
846
$
126,
240,
552
$
124,
231,
269
$
124,
376,
072
$
124,
625,
713
$
121,
781,
654
$
111,
130,
902
$
105,
457,
619
$
100,
167,
315
$
95,8
57,3
61$
S
uppo
rt S
ervi
ces
Atte
ndan
ce1,
352,
646
1,
424,
267
1,
520,
932
1,
603,
788
1,
485,
540
1,
510,
275
1,
297,
090
1,
090,
051
93
4,32
9
75
3,16
7
G
uida
nce
5,64
0,80
6
5,93
7,21
0
5,49
6,94
5
6,34
4,63
4
6,15
1,88
9
5,97
6,92
9
5,68
3,46
2
5,24
0,39
8
4,74
9,81
6
4,62
4,65
8
Hea
lth, P
sych
Spe
ech
and
Aud
io2,
054,
228
1,
984,
684
1,
997,
996
2,
191,
323
2,
447,
080
2,
326,
520
2,
038,
911
1,
842,
114
1,
810,
073
1,
715,
687
Im
prov
emen
t of I
nstru
ctio
n6,
786,
073
6,
428,
817
6,
805,
834
7,
074,
567
8,
999,
165
8,
672,
894
7,
150,
068
6,
671,
704
5,
029,
381
4,
162,
957
Pr
ofes
siona
l Dev
elop
men
t22
6,17
3
29
0,00
4
22
7,87
5
34
3,43
5
37
8,31
5
53
8,37
0
54
2,99
3
50
0,30
7
46
5,79
8
55
7,58
7
M
edia
Ser
vice
s (Li
brar
y)7,
346,
588
5,
656,
588
5,
672,
894
5,
335,
044
5,
699,
157
5,
901,
264
4,
998,
844
4,
536,
168
4,
694,
900
4,
847,
647
Bo
ard
of E
duca
tion
Serv
ices
563,
861
405,
010
298,
051
416,
440
566,
216
415,
442
374,
663
404,
725
346,
998
297,
693
Exec
utiv
e A
dmin
istra
tion
3,90
8,42
2
4,47
6,60
0
4,01
6,45
0
4,63
6,65
5
3,77
0,00
8
3,81
3,39
8
4,15
9,24
8
3,81
8,77
0
4,23
7,58
3
4,65
8,14
6
Build
ing
Leve
l Adm
inist
ratio
n14
,013
,256
13,5
93,4
42
13
,818
,624
14,0
00,2
25
13
,998
,535
13,7
55,2
97
12
,951
,017
12,3
34,5
47
11
,789
,878
11,4
12,9
07
Bu
sines
s Cen
tral S
ervi
ces
3,19
9,87
5
1,88
7,13
5
2,05
3,70
7
2,12
5,82
6
2,07
5,08
7
2,12
5,31
7
2,20
7,56
2
2,11
3,60
0
2,09
0,09
6
2,04
1,71
9
Ope
ratio
n of
Pla
nt24
,405
,560
22,8
98,7
39
22
,777
,410
23,4
43,2
44
22
,772
,405
23,7
47,1
02
21
,113
,616
19,8
16,3
90
18
,964
,768
17,8
64,7
04
Se
curit
y Se
rvic
es69
3,51
7
57
6,18
1
62
5,69
7
63
0,88
4
65
0,35
5
65
7,96
1
64
2,81
3
45
2,94
6
43
7,80
4
36
7,55
9
Pu
pil T
rans
porta
tion
9,63
0,37
8
9,18
4,78
5
8,90
6,93
9
9,62
8,12
0
10,3
90,5
47
10
,129
,427
9,87
0,74
5
8,90
3,38
1
8,09
4,71
8
8,22
1,07
1
Food
Ser
vice
s6,
714,
824
7,
532,
441
7,
624,
468
7,
358,
150
7,
518,
460
8,
087,
804
7,
851,
794
6,
762,
511
6,
430,
018
6,
135,
205
Ce
ntra
l Offi
ce S
uppo
rt Se
rvic
es3,
382,
201
2,
957,
402
2,
904,
578
2,
935,
919
2,
976,
632
2,
765,
035
2,
532,
319
2,
381,
990
2,
238,
148
2,
293,
402
A
dult
Educ
atio
n45
7,77
0
46
7,23
5
48
4,79
8
48
4,92
0
35
0,91
1
33
1,70
2
28
2,90
9
26
4,24
4
24
2,46
6
27
1,05
7
Co
mm
unity
Ser
vice
s10
,685
,763
9,37
6,74
3
9,12
8,82
1
8,66
4,48
7
8,95
2,64
2
8,87
4,67
8
8,08
7,57
0
7,44
7,40
4
7,05
0,74
7
7,11
8,19
1
C
apita
l Out
lay
Capi
tal O
utla
y5,
126,
124
7,
240,
018
23
,924
,703
37,2
86,8
09
36
,942
,757
37,7
72,8
44
23
,119
,018
23,4
02,1
29
14
,033
,093
29,9
68,8
90
Deb
t Ser
vice
Prin
cipa
l Ret
irem
ent
53,6
60,0
20
16
,191
,702
19,3
03,4
71
19
,658
,460
20,1
54,2
06
18
,063
,295
23,7
59,5
73
16
,930
,810
12,4
84,6
51
12
,295
,470
Inte
rest
and
Fisc
al C
harg
es8,
838,
926
9,
559,
631
10
,228
,780
9,88
4,55
4
8,91
6,82
2
12,6
68,9
00
7,
962,
186
7,
603,
639
9,
020,
125
9,
219,
513
To
tal S
uppo
rt Se
rvic
es16
8,68
7,01
1
12
8,06
8,63
4
14
7,81
8,97
3
16
4,04
7,48
4
16
5,19
6,72
9
16
8,13
4,45
4
14
6,62
6,40
1
13
2,51
7,82
8
11
5,14
5,39
0
12
8,82
7,23
1
T
OTA
L EX
PEN
DIT
URE
S29
6,72
6,85
7$
25
4,30
9,18
6$
27
2,05
0,24
2$
28
8,42
3,55
6$
28
9,82
2,44
2$
28
9,91
6,10
8$
25
7,75
7,30
3$
23
7,97
5,44
7$
21
5,31
2,70
5$
22
4,68
4,59
1$
D
ebt S
ervi
ce a
s a %
of n
on-c
apita
l exp
endi
ture
s21
.43%
10.2
4%11
.74%
13.3
3%12
.99%
13.8
8%15
.58%
12.8
5%11
.92%
12.5
8%
Sour
ce: R
ockw
ood
Scho
ol D
istric
t rec
ords
RO
CK
WO
OD
R-V
I SC
HO
OL
DIS
TRIC
T
GO
VER
NM
ENTA
L FU
ND
S EX
PEN
DIT
UR
ES A
ND
DEB
T SE
RV
ICE
RA
TIO
LAST
TEN
FIS
CA
L Y
EAR
S(m
odifi
ed a
ccru
al b
asis
of a
ccou
ntin
g)
67

2014
2013
2012
2011
2010
2009
2008
2007
2006
2005
Exce
ss o
f rev
enue
s ove
r (un
der)
exp
endi
ture
s(4
0,49
9,93
5)$
1,
894,
635
$
(1
3,65
3,38
0)$
(3
6,95
7,01
9)$
(4
2,96
0,29
7)$
(4
0,16
2,28
5)$
(1
1,96
0,21
1)$
(1
4,57
3,76
0)$
(1
,213
,400
)$
(21,
786,
565)
$
Oth
er F
inan
cing
Sou
rces
(Use
s):
Cap
ital l
ease
obl
igat
ion
-
-
-
-
-
-
600,
000
2,00
0,00
0
-
-
Bon
d is
suan
ce-
-
-
21,0
95,0
00
33,9
05,0
00
-
74
,500
,000
-
44,4
00,0
00
-
Ref
undi
ng b
onds
issu
ed-
-
9,
905,
000
-
24,4
65,0
00
32,9
45,0
00
17
,165
,000
-
-
-
Dis
coun
t on
issu
ance
of b
onds
-
-
(39,
620)
-
-
-
-
-
-
-
Pa
ymen
t to
refu
nded
bon
d es
crow
age
nt-
-
-
-
-
(33,
030,
000)
(17,
165,
000)
-
-
-
Pr
emiu
m o
n is
suan
ce o
f bon
ds-
-
1,
035,
099
80
1,04
2
1,
980,
761
4,
083,
210
2,
545,
401
-
722,
358
-
O
ther
non
curr
ent/s
ale
of p
rope
rty-
-
-
-
-
-
-
-
-
-
N
et c
hang
e in
fund
bal
ance
s(4
0,49
9,93
5)$
1,
894,
635
$
(2
,752
,901
)$
(15,
060,
977)
$
17,3
90,4
64$
(36,
164,
075)
$
65,6
85,1
90$
(12,
573,
760)
$
43,9
08,9
58$
(2
1,78
6,56
5)$
Sour
ce: A
udito
rs' R
epor
ts-S
tate
men
t of R
even
ues,
Expe
nditu
res a
nd C
hang
es in
Fun
d B
alan
ceRO
CK
WO
OD
R-V
I SC
HO
OL
DIS
TR
ICT
OT
HE
R F
INA
NC
ING
SO
UR
CE
S A
ND
NE
T C
HA
NG
E IN
FU
ND
BA
LA
NC
ES
- GO
VE
RN
ME
NT
AL
FU
ND
SL
AST
TE
N F
ISC
AL
YE
AR
S(m
odifi
ed a
ccru
al b
asis
of a
ccou
ntin
g)
68

Real Property Real Property Personal Property Personal Property Total Property Total PropertyAssessed Est. Actual Assessed Est. Actual Assessed Est. Actual
Value 19% Value Value 33% Value Value Value2014 2,761,027,710$ 14,531,757,316$ 435,014,930$ 1,318,227,061$ 3,196,042,640$ 15,849,984,377$ 4.683$ 2013 2,838,883,870 14,941,494,053 434,352,420 1,316,219,455 3,273,236,290 16,257,713,508 4.536 2012 2,831,441,600 14,902,324,211 416,295,455 1,248,886,366 3,247,737,055 16,151,210,577 4.463 2011 2,913,895,060 13,907,448,560 471,239,160 1,396,342,694 3,385,134,220 15,303,791,254 4.275 2010 2,927,594,890 13,917,578,413 588,041,433 1,750,288,976 3,515,636,323 15,667,867,389 4.008 2009 3,066,281,780 15,080,643,936 618,308,932 1,503,589,824 3,684,590,712 16,584,233,760 3.923 2008 2,864,097,580 14,264,993,762 567,383,355 1,442,256,924 3,431,480,935 15,707,250,686 3.999 2007 2,304,350,860 11,571,546,935 586,267,350 1,470,342,818 2,890,618,210 13,041,889,753 4.418 2006 2,253,416,000 11,368,680,158 584,395,250 1,415,946,364 2,837,811,250 12,784,626,522 4.507 2005 1,960,277,630 9,982,273,334 574,062,700 1,345,245,515 2,534,340,330 11,327,518,849 4.633
Source: St. Louis and Jefferson County Assessor's Offices
ROCKWOOD R-VI SCHOOL DISTRICT
ASSESSED VALUE AND ACTUAL VALUE OF TAXABLE PROPERTYLAST TEN FISCAL YEARS
Property owners (both Real Estate and Personal Property) are taxed by the various taxing authorities (including the school district) in their county of residence. Tax levy rates (so much per $100 of assessed valuations) are set by the taxing authorities according the State law. Assessed valuations are set by the county in which the property resides and every other year is a reassessment year. The tax obligation is billed by the county department of revenue and paid through that department to the taxing authorities. The tax billed is simply the levy rate multiplied by the assessed valuation. There are normally multiple taxing authority obligations included on one tax bill which is typically mailed to tax payers in November with a due date of December 31. The District receives the majority of its revenue in late December and January.
Total Tax Rate per
$100 A/VFiscal Year Ending 6/30
Note: On January 1 of every second year the property values are rendered for appraisal (reassessment). The appraisal process for the Rockwood School District is conducted by the St. Louis or Jefferson county Assessor's office. For Rockwood School District residential real estate is appraised at 19% of market value, commercial at 32% of value, agricultural at 12% of value and personal property at 33% of value.
The Assessor's Office submits preliminary values to the school district by June. These values are usually a realistic estimate of the ultimate certified values that come by August. The preliminary values are good estimates upon which to base the tax levies for the operating and debt service budgets. Once the certified values are received by the district, the tax rate adoption is completed prior to September and the budgeting process can be begin for the subsequent fiscal year.
69

Taxing Districts 2014 2013 2012 2011 2010 2009 2008 2007 2006 2005Rockwood School District* 4.683$ 4.536$ 4.463$ 4.275$ 4.008$ 3.923$ 3.999$ 4.418$ 4.507$ 4.633$ General Fund 1.580 1.608 1.405 1.405 1.333 1.277 1.287 1.505 1.571 1.507 Special (Teacher's) Fund 1.916 2.188 2.238 2.050 1.855 1.776 1.791 2.093 2.186 2.186 Capital Fund 0.680 0.680 0.140 0.140 0.140 0.190 0.170 0.070 - 0.190 Debt Fund 0.507 0.060 0.680 0.680 0.680 0.680 0.750 0.750 0.750 0.750
OverlappingSt. Louis County 0.523 0.523 0.523 0.523 0.523 0.558 0.558 0.558 0.580 0.580 MunicipalitiesCity of Chesterfield 0.030 0.030 0.030 0.030 0.030 0.003 0.060 0.060 0.060 0.600 City of Clarkson Valley* 0.130 0.124 0.121 0.119 0.117 0.111 0.108 0.133 0.132 0.137 City of Ellisville 0.150 0.150 0.150 0.150 0.150 0.150 0.150 0.150 0.150 0.150 City of Eureka* 0.391 0.505 0.505 0.371 0.371 0.373 0.373 0.380 0.380 0.379 City of Winchester* 0.215 0.201 0.201 0.181 0.181 0.176 0.176 0.195 0.194 0.215 Fire DistrictsEureka 1.230 1.209 0.390 1.154 1.141 1.078 1.078 1.195 1.199 1.250 Fenton* 0.913 0.851 0.851 0.840 0.800 0.761 0.763 0.984 0.878 0.880 Metro West* 1.136 1.053 1.051 0.103 0.999 0.860 0.872 1.007 0.962 1.079 Monarch (Chesterfield)* 0.898 0.886 0.899 0.923 0.876 0.871 0.857 0.981 0.979 1.032 Special School District 1.240 1.012 1.013 0.995 0.938 0.918 0.908 0.824 0.870 0.870 Sewer DistrictMetropolitan Sewer District 0.874 0.064 0.082 0.079 - - 0.069 0.069 0.069 0.069
Note: Years listed are calendar years * Rates are blended, other entities' rates are averaged
Source: St. Louis County Department of Revenue
ROCKWOOD R-VI SCHOOL DISTRICT
DIRECT AND OVERLAPPING PROPERTY TAXESLAST TEN FISCAL YEARS
(rate per $100 of assessed value)
70
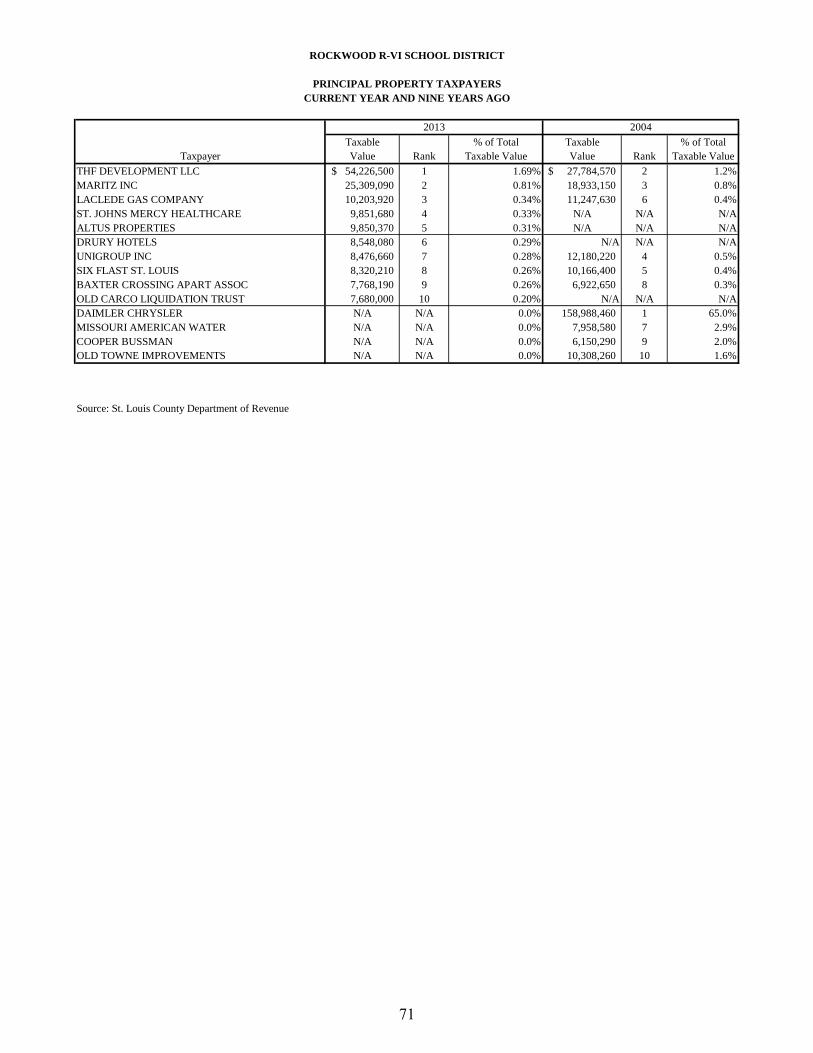
Taxable % of Total Taxable % of TotalTaxpayer Value Rank Taxable Value Value Rank Taxable Value
THF DEVELOPMENT LLC 54,226,500$ 1 1.69% 27,784,570$ 2 1.2%MARITZ INC 25,309,090 2 0.81% 18,933,150 3 0.8%LACLEDE GAS COMPANY 10,203,920 3 0.34% 11,247,630 6 0.4%ST. JOHNS MERCY HEALTHCARE 9,851,680 4 0.33% N/A N/A N/AALTUS PROPERTIES 9,850,370 5 0.31% N/A N/A N/ADRURY HOTELS 8,548,080 6 0.29% N/A N/A N/AUNIGROUP INC 8,476,660 7 0.28% 12,180,220 4 0.5%SIX FLAST ST. LOUIS 8,320,210 8 0.26% 10,166,400 5 0.4%BAXTER CROSSING APART ASSOC 7,768,190 9 0.26% 6,922,650 8 0.3%OLD CARCO LIQUIDATION TRUST 7,680,000 10 0.20% N/A N/A N/ADAIMLER CHRYSLER N/A N/A 0.0% 158,988,460 1 65.0%MISSOURI AMERICAN WATER N/A N/A 0.0% 7,958,580 7 2.9%COOPER BUSSMAN N/A N/A 0.0% 6,150,290 9 2.0%OLD TOWNE IMPROVEMENTS N/A N/A 0.0% 10,308,260 10 1.6%
Source: St. Louis County Department of Revenue
2013 2004
ROCKWOOD R-VI SCHOOL DISTRICT
PRINCIPAL PROPERTY TAXPAYERSCURRENT YEAR AND NINE YEARS AGO
71

Total PropertyResidential Commercial Agricultural Personal Total Taxable Total Direct Est. Actual
Property Property Property Property Assessed Value Tax Rate Value2014 2,114,332,970$ 644,270,840$ 2,423,900$ 435,014,930$ 3,196,042,640$ 4.683$ 15,849,984,377$ 2013 2,193,724,990 642,695,900 2,462,980 434,352,420 3,273,236,290 4.536 16,257,713,508 2012 2,182,922,740 646,062,150 2,456,710 416,295,455 3,247,737,055 4.463 16,151,210,577 2011 2,223,807,780 697,839,521 2,693,830 460,793,089 3,385,134,220 4.275 15,303,791,254 2010 2,208,816,180 726,651,471 2,573,310 577,595,362 3,515,636,323 4.008 15,667,867,389 2009 2,385,119,190 800,001,080 3,285,800 496,184,642 3,684,590,712 3.923 16,584,233,760 2008 2,344,027,180 608,236,700 3,272,270 475,944,785 3,431,480,935 3.999 15,707,250,686 2007 1,888,435,220 412,674,030 3,241,610 586,267,350 2,890,618,210 4.418 13,041,889,753 2006 1,844,389,120 405,739,930 3,286,950 584,395,250 2,837,811,250 4.507 12,784,626,522 2005 1,605,212,160 351,696,410 3,369,060 574,062,700 2,534,340,330 4.633 11,327,518,849
Source: St. Louis and Jefferson County Assessor's Offices
June 30,
ROCKWOOD R-VI SCHOOL DISTRICT
ASSESSED VALUE AND ESTIMATED ACTUAL VALUE OF TAXABLE PROPERTYLAST TEN FISCAL YEARS
72

2014
2013
2012
2011
2010
2009
2008
2007
2006
2005
Ass
esse
d V
alua
tions
3,19
6,04
2,64
0
3,27
3,23
6,29
0
3,24
7,73
7,05
5
3,38
5,13
4,22
0
3,51
5,63
6,32
3
3,68
4,59
0,71
2
3,43
1,48
0,93
5
2,89
0,61
8,21
0
2,
837,
811,
250
2,
534,
340,
330
Ta
x Ra
te4.
683
$
4.53
6$
4.
463
$
4.27
5$
4.
008
$
3.92
3$
3.
999
$
4.41
8$
4.
507
$
4.63
3$
Ta
xes L
evie
d fo
r the
Fisc
al Y
ear
149,
680,
265
$
148,
464,
178
$
144,
946,
505
$
144,
714,
488
$
140,
906,
704
$
144,
546,
494
$
137,
224,
923
$
127,
707,
513
$
12
7,90
0,15
3$
11
7,41
5,98
7$
C
olle
cted
with
in F
iscal
Yea
r of L
evy
Am
ount
146,
338,
778
$
144,
876,
201
$
139,
760,
984
$
135,
367,
916
$
137,
516,
184
$
139,
699,
137
$
134,
689,
879
$
125,
911,
057
$
12
3,85
6,71
0$
11
4,72
9,22
0$
%
of L
evy
97.8
%97
.6%
96.4
%93
.5%
97.6
%96
.6%
98.2
%98
.6%
96.8
%97
.7%
Colle
cted
(pai
d) in
Sub
sequ
ent Y
ears
(394
,088
)$
1,
341,
622
$
1,
687,
856
$
2,
204,
301
$
1,
392,
291
$
2,
549,
378
$
2,
506,
456
$
6,
740,
052
$
15,5
02,6
74$
2,44
3,81
2$
Tota
l Col
lect
ions
to D
ate
Am
ount
145,
944,
690
$
146,
217,
823
$
141,
448,
840
$
137,
572,
217
$
138,
908,
475
$
142,
248,
515
$
137,
196,
335
$
132,
651,
109
$
13
9,35
9,38
4$
11
7,17
3,03
2$
%
of L
evy
97.5
%98
.5%
97.6
%95
.1%
98.6
%98
.4%
100.
0%10
3.9%
109.
0%99
.8%
Not
e: B
ased
on
Fisc
al Y
ear
Sour
ce: R
ockw
ood
Scho
ol D
istric
t rec
ords
and
St.
Loui
s Cou
nty/
Jeffe
rson
Cou
nty
Dep
artm
ent o
f Rev
enue
RO
CK
WO
OD
R-V
I SC
HO
OL
DIS
TRIC
T
PRO
PER
TY T
AX
LEV
IES
AN
D C
OLL
ECTI
ON
S - S
T. L
OU
IS C
OU
NTY
LAST
TEN
FIS
CA
L Y
EAR
S
73
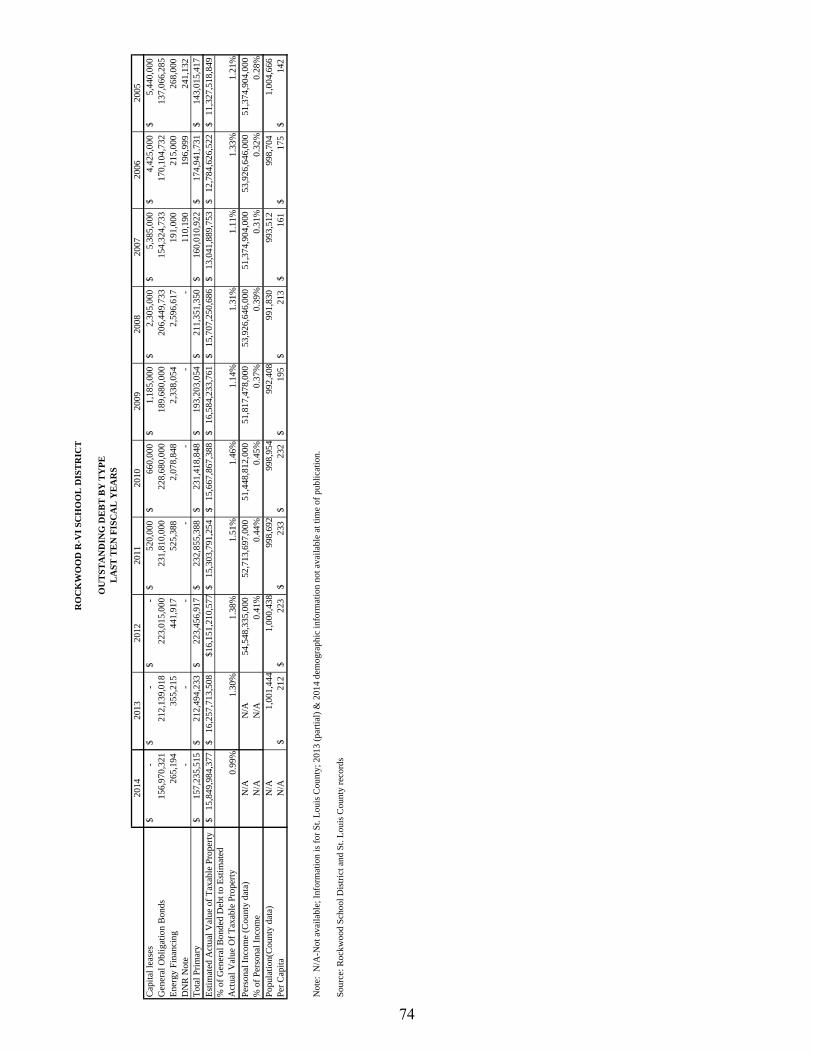
2014
2013
2012
2011
2010
2009
2008
2007
2006
2005
Cap
ital l
ease
s-
$
-
$
-
$
520,
000
$
660,
000
$
1,18
5,00
0$
2,30
5,00
0$
5,38
5,00
0$
4,42
5,00
0$
5,44
0,00
0$
Gen
eral
Obl
igat
ion
Bon
ds15
6,97
0,32
1
21
2,13
9,01
8
22
3,01
5,00
0
23
1,81
0,00
0
22
8,68
0,00
0
18
9,68
0,00
0
20
6,44
9,73
3
15
4,32
4,73
3
17
0,10
4,73
2
13
7,06
6,28
5
En
ergy
Fin
anci
ng26
5,19
4
35
5,21
5
44
1,91
7
52
5,38
8
2,
078,
848
2,
338,
054
2,
596,
617
19
1,00
0
21
5,00
0
26
8,00
0
D
NR
Not
e-
-
-
-
-
-
-
110,
190
196,
999
241,
132
Tota
l Prim
ary
157,
235,
515
$
212,
494,
233
$
223,
456,
917
$
232,
855,
388
$
231,
418,
848
$
193,
203,
054
$
211,
351,
350
$
160,
010,
922
$
174,
941,
731
$
143,
015,
417
$
Estim
ated
Act
ual V
alue
of T
axab
le P
rope
rty15
,849
,984
,377
$
16,2
57,7
13,5
08$
$1
6,15
1,21
0,57
715
,303
,791
,254
$
15,6
67,8
67,3
88$
16
,584
,233
,761
$
15,7
07,2
50,6
86$
13
,041
,889
,753
$
12,7
84,6
26,5
22$
11
,327
,518
,849
$
% o
f Gen
eral
Bon
ded
Deb
t to
Estim
ated
Act
ual V
alue
Of T
axab
le P
rope
rty0.
99%
1.30
%1.
38%
1.51
%1.
46%
1.14
%1.
31%
1.11
%1.
33%
1.21
%Pe
rson
al In
com
e (C
ount
y da
ta)
N/A
N/A
54,5
48,3
35,0
00
52
,713
,697
,000
51,4
48,8
12,0
00
51
,817
,478
,000
53,9
26,6
46,0
00
51
,374
,904
,000
53,9
26,6
46,0
00
51
,374
,904
,000
% o
f Per
sona
l Inc
ome
N/A
N/A
0.41
%0.
44%
0.45
%0.
37%
0.39
%0.
31%
0.32
%0.
28%
Popu
latio
n(C
ount
y da
ta)
N/A
1,00
1,44
41,
000,
438
998,
692
998,
954
992,
408
991,
830
993,
512
998,
704
1,00
4,66
6
Per C
apita
N/A
212
$
223
$
233
$
232
$
195
$
213
$
161
$
175
$
142
$
Not
e: N
/A-N
ot a
vaila
ble;
Info
rmat
ion
is fo
r St.
Loui
s Cou
nty;
201
3 (p
artia
l) &
201
4 de
mog
raph
ic in
form
atio
n no
t ava
ilabl
e at
tim
e of
pub
licat
ion.
Sour
ce: R
ockw
ood
Scho
ol D
istri
ct a
nd S
t. Lo
uis C
ount
y re
cord
s
RO
CK
WO
OD
R-V
I SC
HO
OL
DIS
TR
ICT
OU
TST
AN
DIN
G D
EB
T B
Y T
YPE
LA
ST T
EN
FIS
CA
L Y
EA
RS
74
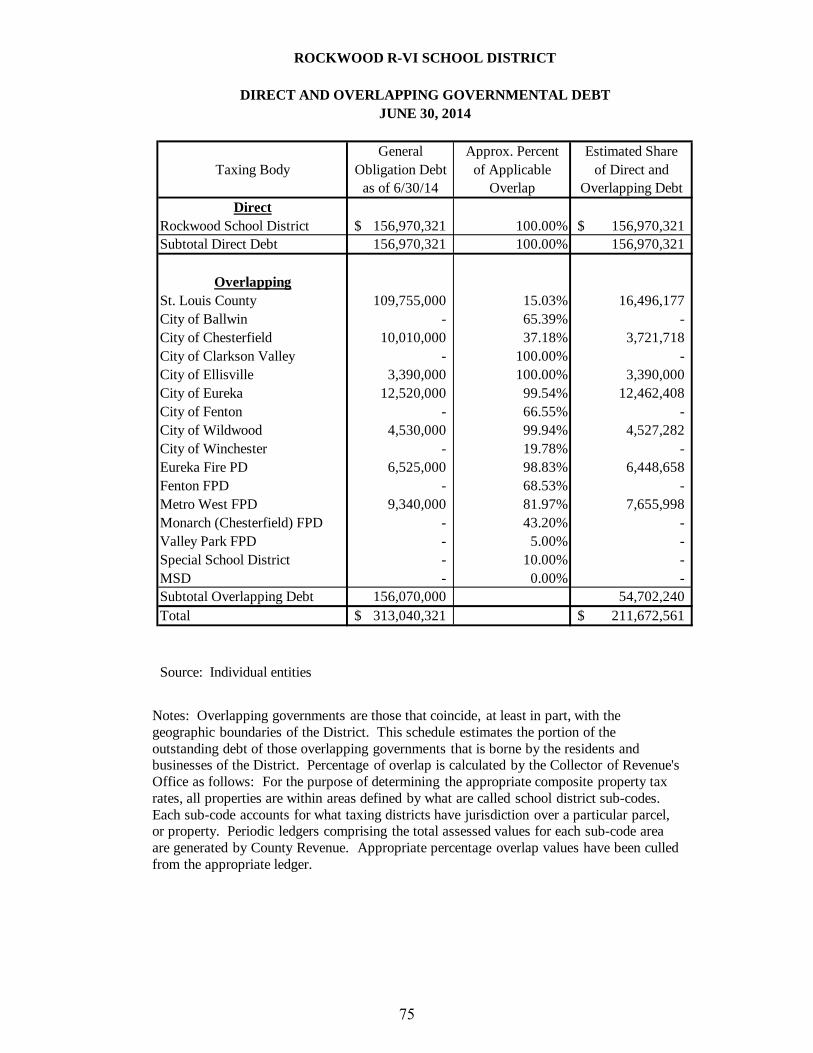
General Approx. Percent Estimated ShareTaxing Body Obligation Debt of Applicable of Direct and
as of 6/30/14 Overlap Overlapping DebtDirect
Rockwood School District 156,970,321$ 100.00% 156,970,321$ Subtotal Direct Debt 156,970,321 100.00% 156,970,321
OverlappingSt. Louis County 109,755,000 15.03% 16,496,177 City of Ballwin - 65.39% - City of Chesterfield 10,010,000 37.18% 3,721,718 City of Clarkson Valley - 100.00% - City of Ellisville 3,390,000 100.00% 3,390,000 City of Eureka 12,520,000 99.54% 12,462,408 City of Fenton - 66.55% - City of Wildwood 4,530,000 99.94% 4,527,282 City of Winchester - 19.78% - Eureka Fire PD 6,525,000 98.83% 6,448,658 Fenton FPD - 68.53% - Metro West FPD 9,340,000 81.97% 7,655,998 Monarch (Chesterfield) FPD - 43.20% - Valley Park FPD - 5.00% - Special School District - 10.00% - MSD - 0.00% - Subtotal Overlapping Debt 156,070,000 54,702,240 Total 313,040,321$ 211,672,561$
Source: Individual entities
ROCKWOOD R-VI SCHOOL DISTRICT
DIRECT AND OVERLAPPING GOVERNMENTAL DEBTJUNE 30, 2014
Notes: Overlapping governments are those that coincide, at least in part, with the geographic boundaries of the District. This schedule estimates the portion of the outstanding debt of those overlapping governments that is borne by the residents and businesses of the District. Percentage of overlap is calculated by the Collector of Revenue's Office as follows: For the purpose of determining the appropriate composite property tax rates, all properties are within areas defined by what are called school district sub-codes. Each sub-code accounts for what taxing districts have jurisdiction over a particular parcel, or property. Periodic ledgers comprising the total assessed values for each sub-code area are generated by County Revenue. Appropriate percentage overlap values have been culled from the appropriate ledger.
75
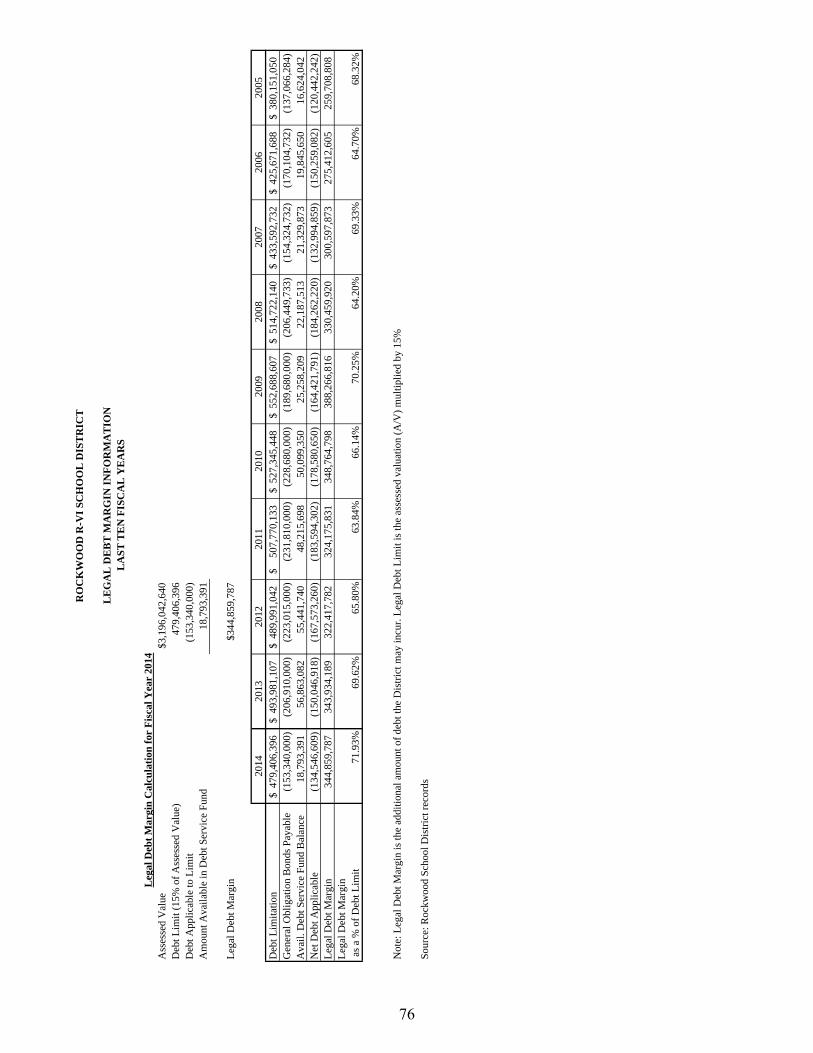
Ass
esse
d V
alue
$3,1
96,0
42,6
40D
ebt L
imit
(15%
of A
sses
sed
Val
ue)
479,
406,
396
Deb
t App
licab
le to
Lim
it(1
53,3
40,0
00)
Am
ount
Ava
ilabl
e in
Deb
t Ser
vice
Fun
d18
,793
,391
Lega
l Deb
t Mar
gin
$344
,859
,787
2014
2013
2012
2011
2010
2009
2008
2007
2006
2005
Deb
t Lim
itatio
n47
9,40
6,39
6$
49
3,98
1,10
7$
48
9,99
1,04
2$
50
7,77
0,13
3$
527,
345,
448
$
552,
688,
607
$
514,
722,
140
$
433,
592,
732
$
425,
671,
688
$
380,
151,
050
$
Gen
eral
Obl
igat
ion
Bon
ds P
ayab
le(1
53,3
40,0
00)
(2
06,9
10,0
00)
(2
23,0
15,0
00)
(2
31,8
10,0
00)
(228
,680
,000
)
(189
,680
,000
)
(206
,449
,733
)
(154
,324
,732
)
(170
,104
,732
)
(137
,066
,284
)
Ava
il. D
ebt S
ervi
ce F
und
Bal
ance
18,7
93,3
91
56,8
63,0
82
55,4
41,7
40
48,2
15,6
98
50,0
99,3
50
25,2
58,2
09
22,1
87,5
13
21,3
29,8
73
19,8
45,6
50
16,6
24,0
42
Net
Deb
t App
licab
le(1
34,5
46,6
09)
(1
50,0
46,9
18)
(1
67,5
73,2
60)
(1
83,5
94,3
02)
(178
,580
,650
)
(164
,421
,791
)
(184
,262
,220
)
(132
,994
,859
)
(150
,259
,082
)
(120
,442
,242
)
Lega
l Deb
t Mar
gin
344,
859,
787
343,
934,
189
322,
417,
782
324,
175,
831
34
8,76
4,79
8
38
8,26
6,81
6
33
0,45
9,92
0
30
0,59
7,87
3
27
5,41
2,60
5
25
9,70
8,80
8
Le
gal D
ebt M
argi
n a
s a %
of D
ebt L
imit
71.9
3%69
.62%
65.8
0%63
.84%
66.1
4%70
.25%
64.2
0%69
.33%
64.7
0%68
.32%
Not
e: L
egal
Deb
t Mar
gin
is th
e ad
ditio
nal a
mou
nt o
f deb
t the
Dis
trict
may
incu
r. Le
gal D
ebt L
imit
is th
e as
sess
ed v
alua
tion
(A/V
) mul
tiplie
d by
15%
Sour
ce: R
ockw
ood
Scho
ol D
istri
ct re
cord
s
Leg
al D
ebt M
argi
n C
alcu
latio
n fo
r Fi
scal
Yea
r 20
14
RO
CK
WO
OD
R-V
I SC
HO
OL
DIS
TR
ICT
LE
GA
L D
EB
T M
AR
GIN
INFO
RM
AT
ION
LA
ST T
EN
FIS
CA
L Y
EA
RS
76

2014
2013
2012
2011
2010
2009
2008
2007
2006
2005
Rev
enue
N/A
N/A
N/A
N/A
N/A
N/A
N/A
N/A
N/A
N/A
Deb
t Ser
vice
N/A
N/A
N/A
N/A
N/A
N/A
N/A
N/A
N/A
N/A
P
rinci
pal
N/A
N/A
N/A
N/A
N/A
N/A
N/A
N/A
N/A
N/A
I
nter
est
N/A
N/A
N/A
N/A
N/A
N/A
N/A
N/A
N/A
N/A
Cov
erag
eN
/AN
/AN
/AN
/AN
/AN
/AN
/AN
/AN
/AN
/A
Not
es:
Roc
kwoo
d do
es n
ot h
ave
any
pled
ged
reve
nue
RO
CK
WO
OD
R-V
I SC
HO
OL
DIS
TR
ICT
PLE
DG
ED
-RE
VE
NU
E C
OV
ER
AG
EL
AST
TE
N F
ISC
AL
YE
AR
S
77

UnemploymentRate
2014 N/A N/A N/A N/A2013 1,001,444 N/A N/A 6.5%2012 1,000,438 54,548,335,000$ 54,524$ 6.8%2011 998,692 52,713,697,000 52,783 8.1%2010 998,954 51,448,812,000 51,512 9.4%2009 992,408 51,817,478,000 52,214 8.9%2008 991,830 53,926,646,000 54,371 5.9%2007 993,512 51,374,904,000 51,710 4.9%2006 998,704 49,662,201,000 49,727 4.6%2005 1,004,666 46,311,739,000 47,023 5.1%
ROCKWOOD R-VI SCHOOL DISTRICT
DEMOGRAPHIC AND ECONOMIC STATISTICS - ST. LOUIS COUNTY ONLYLAST TEN FISCAL YEARS
Year PopulationPersonalIncome
Per Capita Personal Income
Source: Missouri Economic Research and Information Center
Note: N/A-Not available; Information is for St. Louis County; 2013 (partial) & 2014 information not available at time of publication.
78
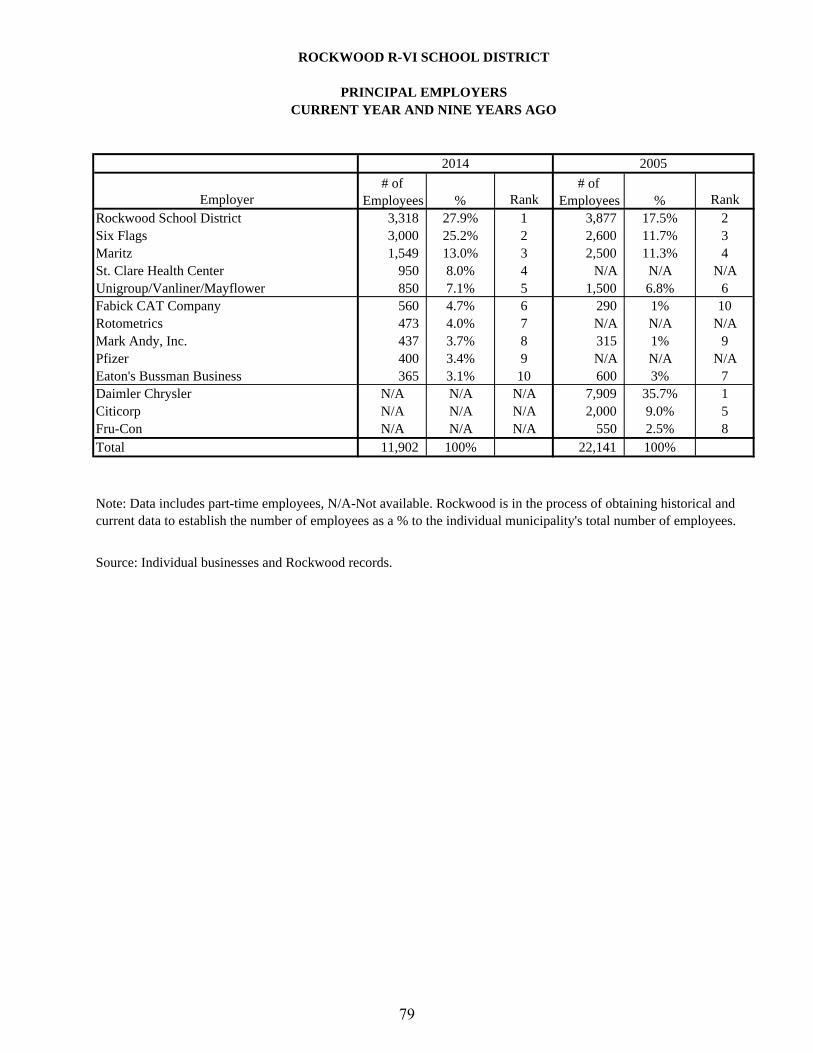
Employer Rank RankRockwood School District 3,318 27.9% 1 3,877 17.5% 2Six Flags 3,000 25.2% 2 2,600 11.7% 3Maritz 1,549 13.0% 3 2,500 11.3% 4St. Clare Health Center 950 8.0% 4 N/A N/A N/AUnigroup/Vanliner/Mayflower 850 7.1% 5 1,500 6.8% 6Fabick CAT Company 560 4.7% 6 290 1% 10Rotometrics 473 4.0% 7 N/A N/A N/AMark Andy, Inc. 437 3.7% 8 315 1% 9Pfizer 400 3.4% 9 N/A N/A N/AEaton's Bussman Business 365 3.1% 10 600 3% 7Daimler Chrysler N/A N/A N/A 7,909 35.7% 1Citicorp N/A N/A N/A 2,000 9.0% 5Fru-Con N/A N/A N/A 550 2.5% 8Total 11,902 100% 22,141 100%
Source: Individual businesses and Rockwood records.
Note: Data includes part-time employees, N/A-Not available. Rockwood is in the process of obtaining historical and current data to establish the number of employees as a % to the individual municipality's total number of employees.
# of Employees
# of Employees
ROCKWOOD R-VI SCHOOL DISTRICT
2014
%
2005
%
PRINCIPAL EMPLOYERSCURRENT YEAR AND NINE YEARS AGO
79
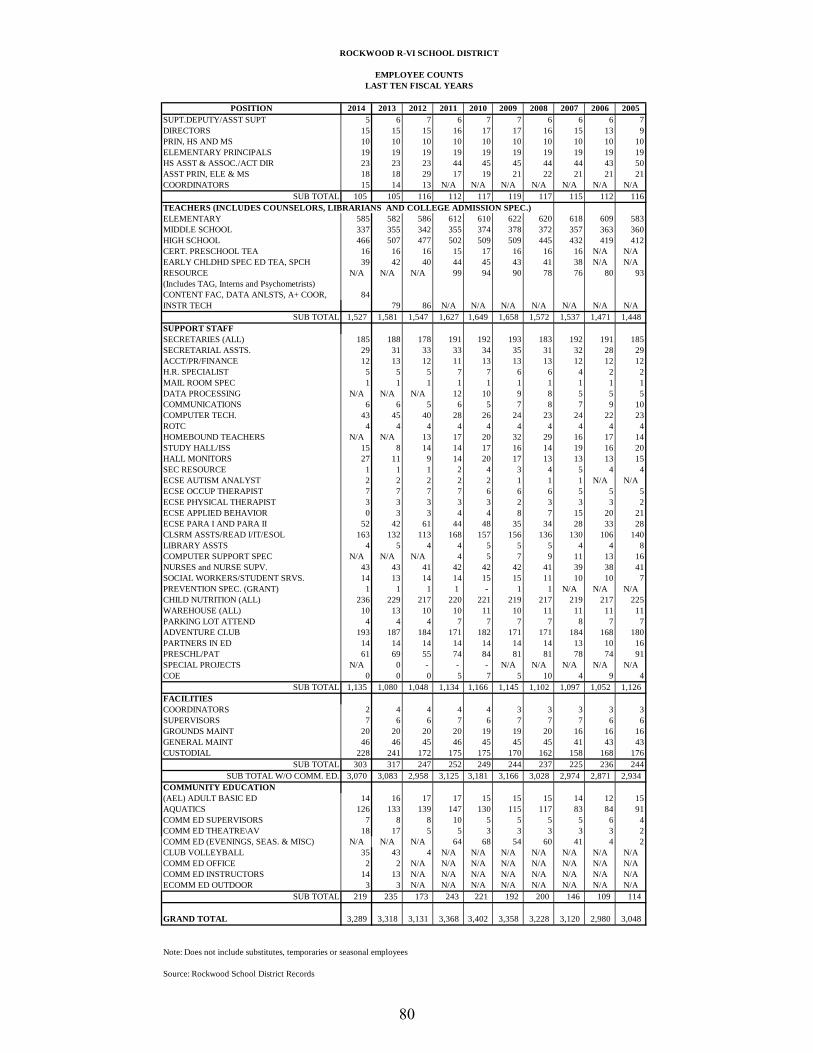
POSITION 2014 2013 2012 2011 2010 2009 2008 2007 2006 2005SUPT.DEPUTY/ASST SUPT 5 6 7 6 7 7 6 6 6 7DIRECTORS 15 15 15 16 17 17 16 15 13 9PRIN, HS AND MS 10 10 10 10 10 10 10 10 10 10ELEMENTARY PRINCIPALS 19 19 19 19 19 19 19 19 19 19HS ASST & ASSOC./ACT DIR 23 23 23 44 45 45 44 44 43 50ASST PRIN, ELE & MS 18 18 29 17 19 21 22 21 21 21COORDINATORS 15 14 13 N/A N/A N/A N/A N/A N/A N/A
SUB TOTAL 105 105 116 112 117 119 117 115 112 116TEACHERS (INCLUDES COUNSELORS, LIBRARIANS AND COLLEGE ADMISSION SPEC.) ELEMENTARY 585 582 586 612 610 622 620 618 609 583MIDDLE SCHOOL 337 355 342 355 374 378 372 357 363 360HIGH SCHOOL 466 507 477 502 509 509 445 432 419 412CERT. PRESCHOOL TEA 16 16 16 15 17 16 16 16 N/A N/AEARLY CHLDHD SPEC ED TEA, SPCH 39 42 40 44 45 43 41 38 N/A N/ARESOURCE N/A N/A N/A 99 94 90 78 76 80 93(Includes TAG, Interns and Psychometrists)CONTENT FAC, DATA ANLSTS, A+ COOR, 84INSTR TECH 79 86 N/A N/A N/A N/A N/A N/A N/A
SUB TOTAL 1,527 1,581 1,547 1,627 1,649 1,658 1,572 1,537 1,471 1,448 SUPPORT STAFFSECRETARIES (ALL) 185 188 178 191 192 193 183 192 191 185SECRETARIAL ASSTS. 29 31 33 33 34 35 31 32 28 29ACCT/PR/FINANCE 12 13 12 11 13 13 13 12 12 12H.R. SPECIALIST 5 5 5 7 7 6 6 4 2 2MAIL ROOM SPEC 1 1 1 1 1 1 1 1 1 1DATA PROCESSING N/A N/A N/A 12 10 9 8 5 5 5COMMUNICATIONS 6 6 5 6 5 7 8 7 9 10COMPUTER TECH. 43 45 40 28 26 24 23 24 22 23ROTC 4 4 4 4 4 4 4 4 4 4HOMEBOUND TEACHERS N/A N/A 13 17 20 32 29 16 17 14STUDY HALL/ISS 15 8 14 14 17 16 14 19 16 20HALL MONITORS 27 11 9 14 20 17 13 13 13 15SEC RESOURCE 1 1 1 2 4 3 4 5 4 4ECSE AUTISM ANALYST 2 2 2 2 2 1 1 1 N/A N/AECSE OCCUP THERAPIST 7 7 7 7 6 6 6 5 5 5ECSE PHYSICAL THERAPIST 3 3 3 3 3 2 3 3 3 2ECSE APPLIED BEHAVIOR 0 3 3 4 4 8 7 15 20 21ECSE PARA I AND PARA II 52 42 61 44 48 35 34 28 33 28CLSRM ASSTS/READ I/IT/ESOL 163 132 113 168 157 156 136 130 106 140LIBRARY ASSTS 4 5 4 4 5 5 5 4 4 8COMPUTER SUPPORT SPEC N/A N/A N/A 4 5 7 9 11 13 16NURSES and NURSE SUPV. 43 43 41 42 42 42 41 39 38 41SOCIAL WORKERS/STUDENT SRVS. 14 13 14 14 15 15 11 10 10 7PREVENTION SPEC. (GRANT) 1 1 1 1 - 1 1 N/A N/A N/ACHILD NUTRITION (ALL) 236 229 217 220 221 219 217 219 217 225WAREHOUSE (ALL) 10 13 10 10 11 10 11 11 11 11PARKING LOT ATTEND 4 4 4 7 7 7 7 8 7 7ADVENTURE CLUB 193 187 184 171 182 171 171 184 168 180PARTNERS IN ED 14 14 14 14 14 14 14 13 10 16PRESCHL/PAT 61 69 55 74 84 81 81 78 74 91SPECIAL PROJECTS N/A 0 - - - N/A N/A N/A N/A N/ACOE 0 0 0 5 7 5 10 4 9 4
SUB TOTAL 1,135 1,080 1,048 1,134 1,166 1,145 1,102 1,097 1,052 1,126 FACILITIESCOORDINATORS 2 4 4 4 4 3 3 3 3 3SUPERVISORS 7 6 6 7 6 7 7 7 6 6GROUNDS MAINT 20 20 20 20 19 19 20 16 16 16GENERAL MAINT 46 46 45 46 45 45 45 41 43 43CUSTODIAL 228 241 172 175 175 170 162 158 168 176
SUB TOTAL 303 317 247 252 249 244 237 225 236 244SUB TOTAL W/O COMM. ED. 3,070 3,083 2,958 3,125 3,181 3,166 3,028 2,974 2,871 2,934
COMMUNITY EDUCATION(AEL) ADULT BASIC ED 14 16 17 17 15 15 15 14 12 15AQUATICS 126 133 139 147 130 115 117 83 84 91COMM ED SUPERVISORS 7 8 8 10 5 5 5 5 6 4COMM ED THEATRE\AV 18 17 5 5 3 3 3 3 3 2COMM ED (EVENINGS, SEAS. & MISC) N/A N/A N/A 64 68 54 60 41 4 2CLUB VOLLEYBALL 35 43 4 N/A N/A N/A N/A N/A N/A N/ACOMM ED OFFICE 2 2 N/A N/A N/A N/A N/A N/A N/A N/ACOMM ED INSTRUCTORS 14 13 N/A N/A N/A N/A N/A N/A N/A N/AECOMM ED OUTDOOR 3 3 N/A N/A N/A N/A N/A N/A N/A N/A
SUB TOTAL 219 235 173 243 221 192 200 146 109 114
GRAND TOTAL 3,289 3,318 3,131 3,368 3,402 3,358 3,228 3,120 2,980 3,048
Note: Does not include substitutes, temporaries or seasonal employees
Source: Rockwood School District Records
ROCKWOOD R-VI SCHOOL DISTRICT
EMPLOYEE COUNTSLAST TEN FISCAL YEARS
80

2014
2013
2012
2011
2010
2009
2008
2007
2006
2005
Enro
lled
Pupi
ls (S
epte
mbe
r)21
,498
21
,916
22
,157
22
,436
22
,254
22
,159
22,2
68
22
,098
21,9
32
21
,798
Ope
ratin
g Ex
pend
iture
s21
4,18
6,08
9$
20
2,27
4,48
2$
19
9,85
7,98
0$
20
4,69
3,73
0$
20
5,77
0,31
7$
20
4,63
4,96
2$
188,
163,
324
$
174,
673,
222
$
164,
908,
920
$
15
8,35
8,11
2$
Cos
t Per
Enr
olle
d Pu
pil
9,96
3$
9,23
0$
9,02
0$
9,12
3$
9,24
6$
9,23
5$
8,45
0$
7,90
4$
7,51
9$
7,
265
$
%
chg
7.95
%2.
32%
-1.1
3%7.
97%
9.30
%16
.83%
6.90
%5.
13%
3.50
%1.
71%
Teac
hing
Sta
ff
1,52
7
1,58
1
1,54
7
1,62
7
1,64
9
1,65
8
1,57
2
1,53
7
1,47
1
1,
448
En
rolle
d Pu
pils
/Tea
cher
Rat
io18
:118
:114
:114
:113
:113
:114
:114
:115
:115
:1#
of F
ree
& R
educ
ed3,
127
3,
199
3,
251
3,
190
3,
111
2,
715
2,
778
2,
789
2,
653
2,61
5
% o
f Enr
olle
d Pu
pils
Qua
lify
for F
ree/
Red
uced
14.5
%14
.6%
14.7
%14
.2%
14.0
%12
.3%
12.5
%12
.6%
12.1
%12
.0%
Not
e: O
pera
ting
Expe
nditu
res a
re b
efor
e tra
nsfe
rs; E
nrol
led
Pup
ils in
clud
es re
side
nt, V
TS, P
art-t
ime
and
SSD
stud
ents
and
doe
s not
incl
ude
ILC
stud
ents
or 1
day
CC
L; T
each
ing
Staf
f inc
lude
s cou
nsel
ors,
excl
udes
Col
lege
Adm
in S
peci
alis
ts
Sour
ce: R
ockw
ood
Scho
ol D
istri
ct re
cord
s
RO
CK
WO
OD
R-V
I SC
HO
OL
DIS
TR
ICT
OPE
RA
TIN
G S
TA
TIS
TIC
SL
AST
TE
N F
ISC
AL
YE
AR
S
81

2014
2013
2012
2011
2010
2009
2008
2007
2006
2005
Roc
kwoo
d Sc
hool
Dist
rict (
RSD
)M
inim
um S
alar
y39
,826
$
39,2
37$
39
,097
$ 38
,794
$
38,2
50$
36
,600
$
35,0
00$
34
,000
$
32,5
00$
31
,500
$
Max
imum
Sal
ary
95,0
97
92,6
23
90,6
70
88,5
96
86,3
25
83,1
25
79,6
00
76,5
00
73,6
03
71,8
08
RSD
Ave
rage
Sal
ary
58,3
36
57,4
05
56,7
01
55,4
61
53,9
84
52,2
72
48,3
43
48,3
43
48,3
40
48,2
80
58,4
20$
58
,376
58
,833
57
,025
56
,839
55
,014
53
,986
53
,278
52
,010
50
,649
46
,754
$
46,2
13$
45
,723
$ 45
,315
$
45,0
97$
46
,099
$
43,2
56$
43
,533
$
42,0
83$
40
,686
$
Not
e: A
mou
nts d
o no
t inc
lude
ben
efits
such
as p
ensio
n, h
ealth
insu
ranc
e, d
isabi
lity,
etc
.
Sour
ce: S
tate
wid
e an
d C
ount
y da
ta fr
om D
ESE;
Dist
rict d
ata
from
Roc
kwoo
d Sc
hool
Dist
rict r
ecor
ds
Cou
nty
Ave
rage
Sal
ary
Stat
ewid
e A
vera
ge S
alar
y
RO
CK
WO
OD
R-V
I SC
HO
OL
DIS
TRIC
T
TE
AC
HE
R B
ASE
SA
LA
RIE
SL
AST
TE
N F
ISC
AL
YE
AR
S
82
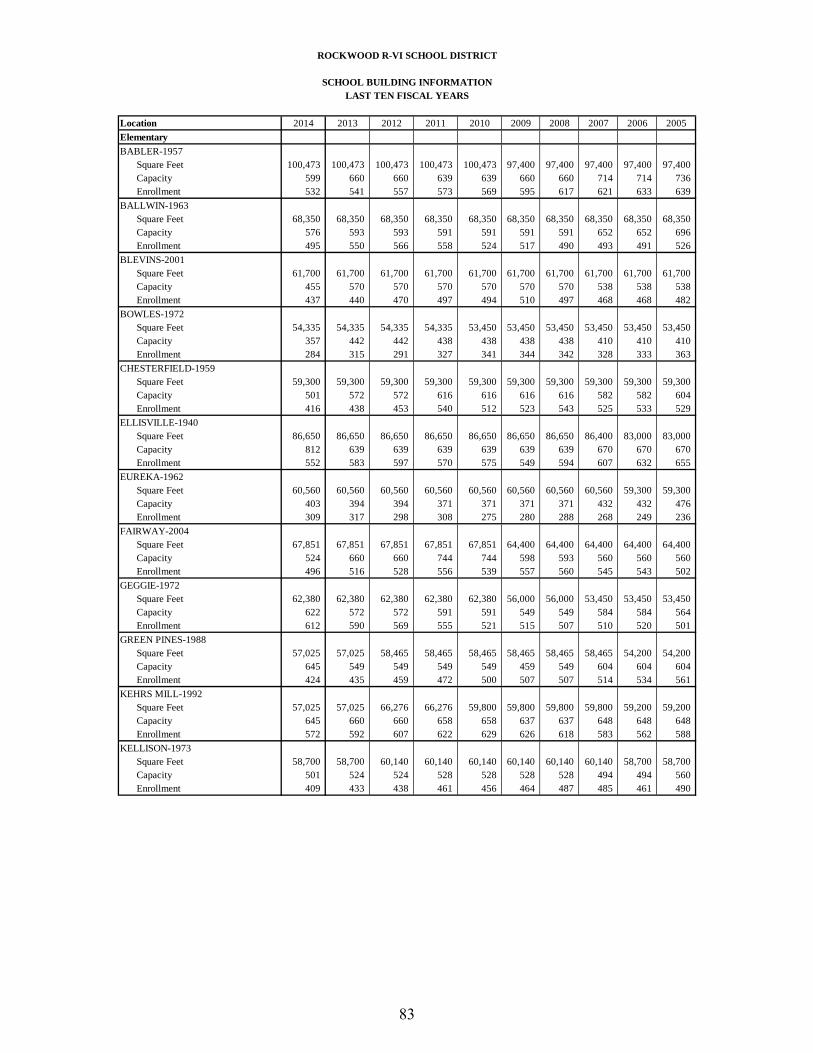
Location 2014 2013 2012 2011 2010 2009 2008 2007 2006 2005ElementaryBABLER-1957
Square Feet 100,473 100,473 100,473 100,473 100,473 97,400 97,400 97,400 97,400 97,400 Capacity 599 660 660 639 639 660 660 714 714 736 Enrollment 532 541 557 573 569 595 617 621 633 639
BALLWIN-1963Square Feet 68,350 68,350 68,350 68,350 68,350 68,350 68,350 68,350 68,350 68,350 Capacity 576 593 593 591 591 591 591 652 652 696 Enrollment 495 550 566 558 524 517 490 493 491 526
BLEVINS-2001Square Feet 61,700 61,700 61,700 61,700 61,700 61,700 61,700 61,700 61,700 61,700 Capacity 455 570 570 570 570 570 570 538 538 538 Enrollment 437 440 470 497 494 510 497 468 468 482
BOWLES-1972Square Feet 54,335 54,335 54,335 54,335 53,450 53,450 53,450 53,450 53,450 53,450 Capacity 357 442 442 438 438 438 438 410 410 410 Enrollment 284 315 291 327 341 344 342 328 333 363
CHESTERFIELD-1959Square Feet 59,300 59,300 59,300 59,300 59,300 59,300 59,300 59,300 59,300 59,300 Capacity 501 572 572 616 616 616 616 582 582 604 Enrollment 416 438 453 540 512 523 543 525 533 529
ELLISVILLE-1940Square Feet 86,650 86,650 86,650 86,650 86,650 86,650 86,650 86,400 83,000 83,000 Capacity 812 639 639 639 639 639 639 670 670 670 Enrollment 552 583 597 570 575 549 594 607 632 655
EUREKA-1962Square Feet 60,560 60,560 60,560 60,560 60,560 60,560 60,560 60,560 59,300 59,300 Capacity 403 394 394 371 371 371 371 432 432 476 Enrollment 309 317 298 308 275 280 288 268 249 236
FAIRWAY-2004Square Feet 67,851 67,851 67,851 67,851 67,851 64,400 64,400 64,400 64,400 64,400 Capacity 524 660 660 744 744 598 593 560 560 560 Enrollment 496 516 528 556 539 557 560 545 543 502
GEGGIE-1972Square Feet 62,380 62,380 62,380 62,380 62,380 56,000 56,000 53,450 53,450 53,450 Capacity 622 572 572 591 591 549 549 584 584 564 Enrollment 612 590 569 555 521 515 507 510 520 501
GREEN PINES-1988Square Feet 57,025 57,025 58,465 58,465 58,465 58,465 58,465 58,465 54,200 54,200 Capacity 645 549 549 549 549 459 549 604 604 604 Enrollment 424 435 459 472 500 507 507 514 534 561
KEHRS MILL-1992Square Feet 57,025 57,025 66,276 66,276 59,800 59,800 59,800 59,800 59,200 59,200 Capacity 645 660 660 658 658 637 637 648 648 648 Enrollment 572 592 607 622 629 626 618 583 562 588
KELLISON-1973Square Feet 58,700 58,700 60,140 60,140 60,140 60,140 60,140 60,140 58,700 58,700 Capacity 501 524 524 528 528 528 528 494 494 560 Enrollment 409 433 438 461 456 464 487 485 461 490
ROCKWOOD R-VI SCHOOL DISTRICT
SCHOOL BUILDING INFORMATIONLAST TEN FISCAL YEARS
83
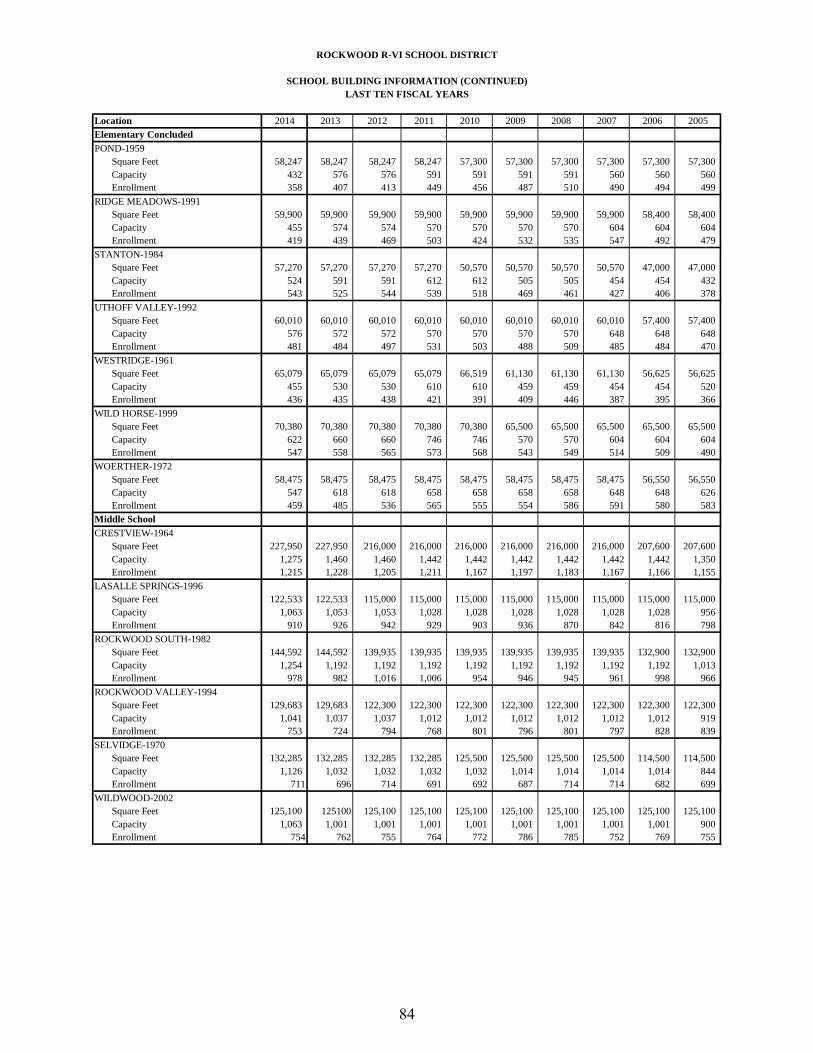
Location 2014 2013 2012 2011 2010 2009 2008 2007 2006 2005Elementary ConcludedPOND-1959
Square Feet 58,247 58,247 58,247 58,247 57,300 57,300 57,300 57,300 57,300 57,300 Capacity 432 576 576 591 591 591 591 560 560 560 Enrollment 358 407 413 449 456 487 510 490 494 499
RIDGE MEADOWS-1991Square Feet 59,900 59,900 59,900 59,900 59,900 59,900 59,900 59,900 58,400 58,400 Capacity 455 574 574 570 570 570 570 604 604 604 Enrollment 419 439 469 503 424 532 535 547 492 479
STANTON-1984Square Feet 57,270 57,270 57,270 57,270 50,570 50,570 50,570 50,570 47,000 47,000 Capacity 524 591 591 612 612 505 505 454 454 432 Enrollment 543 525 544 539 518 469 461 427 406 378
UTHOFF VALLEY-1992Square Feet 60,010 60,010 60,010 60,010 60,010 60,010 60,010 60,010 57,400 57,400 Capacity 576 572 572 570 570 570 570 648 648 648 Enrollment 481 484 497 531 503 488 509 485 484 470
WESTRIDGE-1961Square Feet 65,079 65,079 65,079 65,079 66,519 61,130 61,130 61,130 56,625 56,625 Capacity 455 530 530 610 610 459 459 454 454 520 Enrollment 436 435 438 421 391 409 446 387 395 366
WILD HORSE-1999Square Feet 70,380 70,380 70,380 70,380 70,380 65,500 65,500 65,500 65,500 65,500 Capacity 622 660 660 746 746 570 570 604 604 604 Enrollment 547 558 565 573 568 543 549 514 509 490
WOERTHER-1972Square Feet 58,475 58,475 58,475 58,475 58,475 58,475 58,475 58,475 56,550 56,550 Capacity 547 618 618 658 658 658 658 648 648 626 Enrollment 459 485 536 565 555 554 586 591 580 583
Middle SchoolCRESTVIEW-1964
Square Feet 227,950 227,950 216,000 216,000 216,000 216,000 216,000 216,000 207,600 207,600 Capacity 1,275 1,460 1,460 1,442 1,442 1,442 1,442 1,442 1,442 1,350 Enrollment 1,215 1,228 1,205 1,211 1,167 1,197 1,183 1,167 1,166 1,155
LASALLE SPRINGS-1996Square Feet 122,533 122,533 115,000 115,000 115,000 115,000 115,000 115,000 115,000 115,000 Capacity 1,063 1,053 1,053 1,028 1,028 1,028 1,028 1,028 1,028 956 Enrollment 910 926 942 929 903 936 870 842 816 798
ROCKWOOD SOUTH-1982Square Feet 144,592 144,592 139,935 139,935 139,935 139,935 139,935 139,935 132,900 132,900 Capacity 1,254 1,192 1,192 1,192 1,192 1,192 1,192 1,192 1,192 1,013 Enrollment 978 982 1,016 1,006 954 946 945 961 998 966
ROCKWOOD VALLEY-1994Square Feet 129,683 129,683 122,300 122,300 122,300 122,300 122,300 122,300 122,300 122,300 Capacity 1,041 1,037 1,037 1,012 1,012 1,012 1,012 1,012 1,012 919 Enrollment 753 724 794 768 801 796 801 797 828 839
SELVIDGE-1970Square Feet 132,285 132,285 132,285 132,285 125,500 125,500 125,500 125,500 114,500 114,500 Capacity 1,126 1,032 1,032 1,032 1,032 1,014 1,014 1,014 1,014 844 Enrollment 711 696 714 691 692 687 714 714 682 699
WILDWOOD-2002Square Feet 125,100 125100 125,100 125,100 125,100 125,100 125,100 125,100 125,100 125,100 Capacity 1,063 1,001 1,001 1,001 1,001 1,001 1,001 1,001 1,001 900 Enrollment 754 762 755 764 772 786 785 752 769 755
ROCKWOOD R-VI SCHOOL DISTRICT
SCHOOL BUILDING INFORMATION (CONTINUED)LAST TEN FISCAL YEARS
84
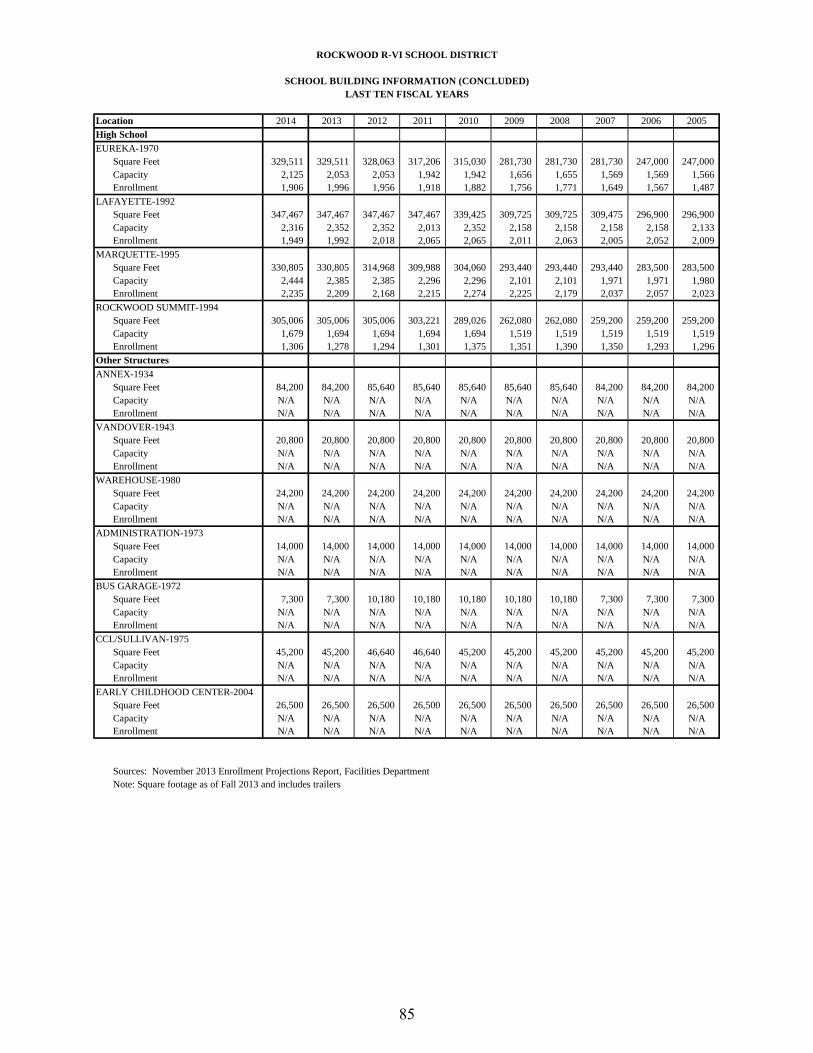
Location 2014 2013 2012 2011 2010 2009 2008 2007 2006 2005High SchoolEUREKA-1970
Square Feet 329,511 329,511 328,063 317,206 315,030 281,730 281,730 281,730 247,000 247,000 Capacity 2,125 2,053 2,053 1,942 1,942 1,656 1,655 1,569 1,569 1,566 Enrollment 1,906 1,996 1,956 1,918 1,882 1,756 1,771 1,649 1,567 1,487
LAFAYETTE-1992Square Feet 347,467 347,467 347,467 347,467 339,425 309,725 309,725 309,475 296,900 296,900 Capacity 2,316 2,352 2,352 2,013 2,352 2,158 2,158 2,158 2,158 2,133 Enrollment 1,949 1,992 2,018 2,065 2,065 2,011 2,063 2,005 2,052 2,009
MARQUETTE-1995Square Feet 330,805 330,805 314,968 309,988 304,060 293,440 293,440 293,440 283,500 283,500 Capacity 2,444 2,385 2,385 2,296 2,296 2,101 2,101 1,971 1,971 1,980 Enrollment 2,235 2,209 2,168 2,215 2,274 2,225 2,179 2,037 2,057 2,023
ROCKWOOD SUMMIT-1994Square Feet 305,006 305,006 305,006 303,221 289,026 262,080 262,080 259,200 259,200 259,200 Capacity 1,679 1,694 1,694 1,694 1,694 1,519 1,519 1,519 1,519 1,519 Enrollment 1,306 1,278 1,294 1,301 1,375 1,351 1,390 1,350 1,293 1,296
Other StructuresANNEX-1934
Square Feet 84,200 84,200 85,640 85,640 85,640 85,640 85,640 84,200 84,200 84,200 Capacity N/A N/A N/A N/A N/A N/A N/A N/A N/A N/AEnrollment N/A N/A N/A N/A N/A N/A N/A N/A N/A N/A
VANDOVER-1943Square Feet 20,800 20,800 20,800 20,800 20,800 20,800 20,800 20,800 20,800 20,800 Capacity N/A N/A N/A N/A N/A N/A N/A N/A N/A N/AEnrollment N/A N/A N/A N/A N/A N/A N/A N/A N/A N/A
WAREHOUSE-1980Square Feet 24,200 24,200 24,200 24,200 24,200 24,200 24,200 24,200 24,200 24,200 Capacity N/A N/A N/A N/A N/A N/A N/A N/A N/A N/AEnrollment N/A N/A N/A N/A N/A N/A N/A N/A N/A N/A
ADMINISTRATION-1973Square Feet 14,000 14,000 14,000 14,000 14,000 14,000 14,000 14,000 14,000 14,000 Capacity N/A N/A N/A N/A N/A N/A N/A N/A N/A N/AEnrollment N/A N/A N/A N/A N/A N/A N/A N/A N/A N/A
BUS GARAGE-1972Square Feet 7,300 7,300 10,180 10,180 10,180 10,180 10,180 7,300 7,300 7,300 Capacity N/A N/A N/A N/A N/A N/A N/A N/A N/A N/AEnrollment N/A N/A N/A N/A N/A N/A N/A N/A N/A N/A
CCL/SULLIVAN-1975Square Feet 45,200 45,200 46,640 46,640 45,200 45,200 45,200 45,200 45,200 45,200 Capacity N/A N/A N/A N/A N/A N/A N/A N/A N/A N/AEnrollment N/A N/A N/A N/A N/A N/A N/A N/A N/A N/A
EARLY CHILDHOOD CENTER-2004Square Feet 26,500 26,500 26,500 26,500 26,500 26,500 26,500 26,500 26,500 26,500 Capacity N/A N/A N/A N/A N/A N/A N/A N/A N/A N/AEnrollment N/A N/A N/A N/A N/A N/A N/A N/A N/A N/A
Sources: November 2013 Enrollment Projections Report, Facilities DepartmentNote: Square footage as of Fall 2013 and includes trailers
ROCKWOOD R-VI SCHOOL DISTRICT
SCHOOL BUILDING INFORMATION (CONCLUDED)LAST TEN FISCAL YEARS
85
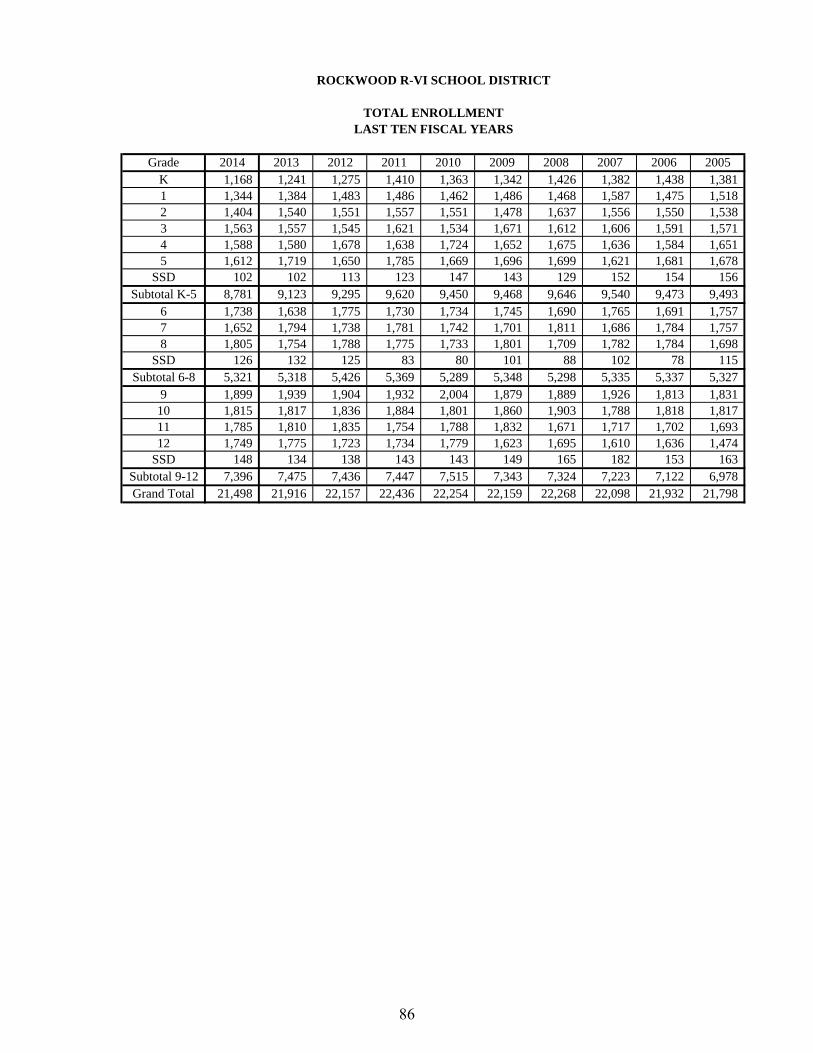
Grade 2014 2013 2012 2011 2010 2009 2008 2007 2006 2005K 1,168 1,241 1,275 1,410 1,363 1,342 1,426 1,382 1,438 1,381 1 1,344 1,384 1,483 1,486 1,462 1,486 1,468 1,587 1,475 1,518 2 1,404 1,540 1,551 1,557 1,551 1,478 1,637 1,556 1,550 1,538 3 1,563 1,557 1,545 1,621 1,534 1,671 1,612 1,606 1,591 1,571 4 1,588 1,580 1,678 1,638 1,724 1,652 1,675 1,636 1,584 1,651 5 1,612 1,719 1,650 1,785 1,669 1,696 1,699 1,621 1,681 1,678
SSD 102 102 113 123 147 143 129 152 154 156 Subtotal K-5 8,781 9,123 9,295 9,620 9,450 9,468 9,646 9,540 9,473 9,493
6 1,738 1,638 1,775 1,730 1,734 1,745 1,690 1,765 1,691 1,757 7 1,652 1,794 1,738 1,781 1,742 1,701 1,811 1,686 1,784 1,757 8 1,805 1,754 1,788 1,775 1,733 1,801 1,709 1,782 1,784 1,698
SSD 126 132 125 83 80 101 88 102 78 115 Subtotal 6-8 5,321 5,318 5,426 5,369 5,289 5,348 5,298 5,335 5,337 5,327
9 1,899 1,939 1,904 1,932 2,004 1,879 1,889 1,926 1,813 1,831 10 1,815 1,817 1,836 1,884 1,801 1,860 1,903 1,788 1,818 1,817 11 1,785 1,810 1,835 1,754 1,788 1,832 1,671 1,717 1,702 1,693 12 1,749 1,775 1,723 1,734 1,779 1,623 1,695 1,610 1,636 1,474
SSD 148 134 138 143 143 149 165 182 153 163 Subtotal 9-12 7,396 7,475 7,436 7,447 7,515 7,343 7,324 7,223 7,122 6,978 Grand Total 21,498 21,916 22,157 22,436 22,254 22,159 22,268 22,098 21,932 21,798
ROCKWOOD R-VI SCHOOL DISTRICT
TOTAL ENROLLMENTLAST TEN FISCAL YEARS
86


Other Locations Belleville, IL • Carbondale, IL • • Litchfield, IL • Springfield, IL • Cape Girardeau, MO • Milwaukee, WI
CPAs and Management Consultants
One South Memorial Drive Ninth Floor St. Louis, MO 63102 ph 314.231.6232 fax 314.880.9307 www.kebcpa.com
Independent Accountants’ Report on Management’s Assertions About Compliance with Specified Requirements of
Missouri State Laws and Regulations Board of Education Rockwood R-VI School District Report on Compliance with State Requirements We have examined management’s assertions that the Rockwood R-VI School District complied with the requirements of Missouri laws and regulations regarding budgetary and disbursement procedures; accurate disclosure by the District’s records of average daily attendance and average daily transportation of pupils, and other statutory requirements as list in the Schedule of Selected Statistics for the year ended June 30, 2014. Management’s Responsibility Management is responsible for the District's compliance with the aforementioned requirements. Accountants’ Responsibility Our responsibility is to express an opinion on management’s assertions about the District's compliance based on our examination. Our examination was made in accordance with the attestation standards established by the American Institute of Certified Public Accountants and, accordingly, includes examining, on a test basis, evidence about the District’s compliance with those requirements and performing such other procedures as we considered necessary in the circumstances. We believe that our examination provides a reasonable basis for our opinion. Our opinion does not provide a legal determination on the District's compliance with specified requirements. Opinion on Compliance with State Requirements In our opinion, management’s assertions that the Rockwood R-VI School District complied with the aforementioned requirements for the year ended June 30, 2014 are fairly stated, in all material respects. This report is intended solely for the information and use of the Board of Education, District management, the Missouri Department of Elementary and Secondary Education and other audit agencies and is not intended to be and should not be used by anyone other than these specified parties.
St. Louis, Missouri December 10, 2014
87

ROCKWOOD R-VI SCHOOL DISTRICT
SCHEDULE OF SELECTED STATISTICS - UNAUDITED FOR THE YEAR ENDED JUNE 30, 2014
88
1. Calendar The number and actual calendar hours and days classes were in session and pupils were under the direction of the teachers during this school year were as follows:
Days Hours Days Hours
Ballwin 172 1,084.12 Kindergarten A.M. 172 520.62 Bowles 171 1,077.62 Kindergarten P.M. 172 517.20 Chesterfield 172 1,084.12 Kindergarten Full Day 172 1,084.12 Ellisville 172 1,084.12 Grades 6 - 8 172 1,076.07 Ridge Meadows 172 1,084.12 Grades 9 - 12 172 1,047.43 Eureka 172 1,084.12 Green Pines 172 1,084.12 Geggie 172 1,084.12 Kellison 172 1,084.12 Pond 172 1,084.12 Stanton 172 1,084.12 Westridge 172 1,084.12 Babler 172 1,084.12 Kehrs Mill 172 1,084.12 Uthoff 172 1,084.12 Woerther 172 1,084.12 Wild Horse 172 1,084.12 Blevins 172 1,084.12 Fairway 172 1,084.12
Grades 1 - 5

ROCKWOOD R-VI SCHOOL DISTRICT
SCHEDULE OF SELECTED STATISTICS - UNAUDITED FOR THE YEAR ENDED JUNE 30, 2014
89
89
2. Average Daily Attendance (ADA)
Regular termFull-Time &
Part-Time Deseg In TotalKindergarten - A.M. 406.11 16.15 422.26 Kindergarten - P.M. 128.68 6.72 135.40 Kindergarten - Full Day 11.27 0.92 12.19 Grades 1 - 5 6,815.23 529.03 7,344.26 Grades 6 - 8 4,685.70 413.40 5,099.10 Grades 9 - 12 6,325.43 500.15 6,825.58
Subtotal regular term 18,372.42 1,466.37 19,838.79
Summer school 62.75 30.03 92.78
Total average daily attendance 18,435.17 1,496.40 19,931.57
3. September Membership
Full-Time &Part-Time Deseg In Total
September membership FTE count 19,787.37 1,608.67 21,396.04
4. Free and Reduced Priced Lunch FTE Count
Full-Time &Part-Time Deseg In Total
Free 1,292.39 1,304.25 2,596.64 Reduced 421.92 108.29 530.21
Total 1,714.31 1,412.54 3,126.85
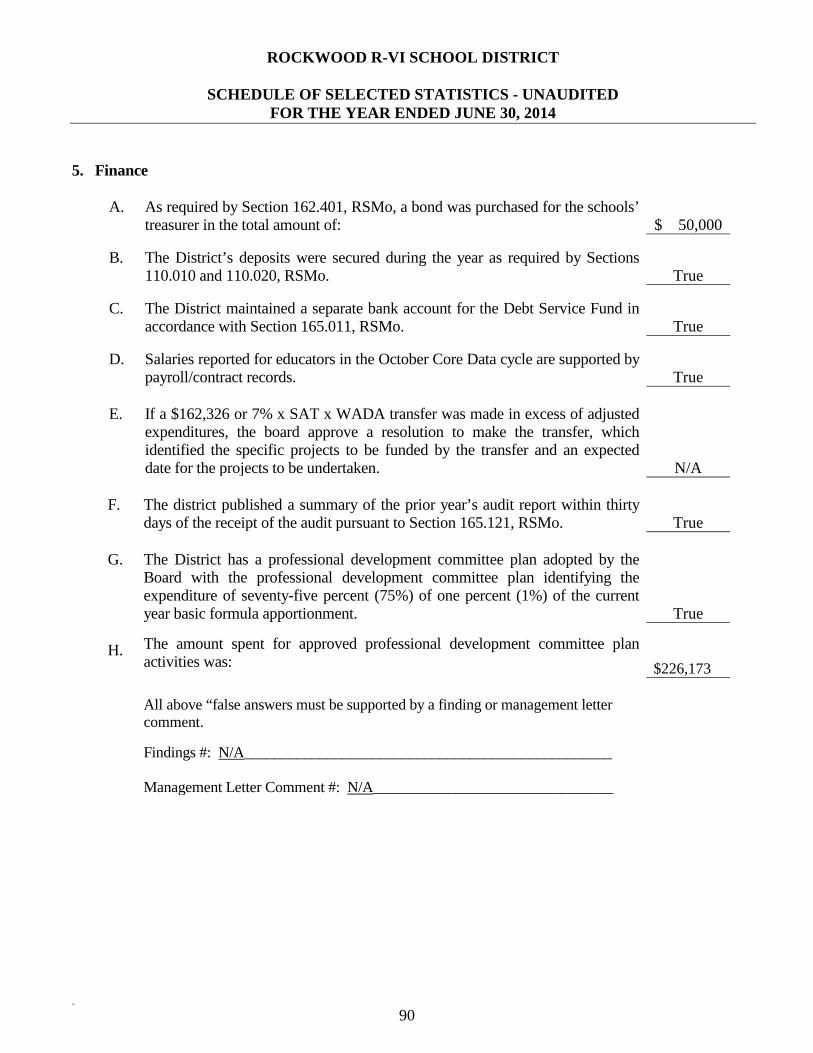
ROCKWOOD R-VI SCHOOL DISTRICT
SCHEDULE OF SELECTED STATISTICS - UNAUDITED FOR THE YEAR ENDED JUNE 30, 2014
90
90
5. Finance
A. As required by Section 162.401, RSMo, a bond was purchased for the schools’ treasurer in the total amount of: $ 50,000
B. The District’s deposits were secured during the year as required by Sections
110.010 and 110.020, RSMo. True C. The District maintained a separate bank account for the Debt Service Fund in
accordance with Section 165.011, RSMo. True D. Salaries reported for educators in the October Core Data cycle are supported by
payroll/contract records. True E. If a $162,326 or 7% x SAT x WADA transfer was made in excess of adjusted
expenditures, the board approve a resolution to make the transfer, which identified the specific projects to be funded by the transfer and an expected date for the projects to be undertaken. N/A
F. The district published a summary of the prior year’s audit report within thirty
days of the receipt of the audit pursuant to Section 165.121, RSMo. True G.
The District has a professional development committee plan adopted by the Board with the professional development committee plan identifying the expenditure of seventy-five percent (75%) of one percent (1%) of the current year basic formula apportionment. True
H.
The amount spent for approved professional development committee plan activities was: $226,173
All above “false answers must be supported by a finding or management letter
comment. Findings #: N/A_________________________________________________
Management Letter Comment #: N/A________________________________

ROCKWOOD R-VI SCHOOL DISTRICT
SCHEDULE OF SELECTED STATISTICS - UNAUDITED FOR THE YEAR ENDED JUNE 30, 2014
91
91
6. Transportation
A. The school transportation allowable costs substantially conform to 5 CSR 30-261.040, Allowable Costs for State Transportation Aid.
True B. The District’s school transportation ridership records are so maintained as to
accurately disclose in all material respects the average number of regular riders transported. True
C. Based on the ridership records, the average number of students (non-disabled K-12, K-12
students with disabilities and career education) transported on a regular basis (ADT) was:
Eligible ADT 10,407
Ineligible ADT
2,234
D. The District’s transportation odometer mileage records are so maintained as to
accurately disclose in all material respects the eligible and ineligible mileage for the year. True
E. Actual odometer records show the total district-operated and contracted mileage for the year was:
1,757,946
Of this total, the eligible non-disabled and students with disabilities route miles and the ineligible non-route and disapproved miles (combined) was:
Eligible Miles 1,555,216
Ineligible Miles (Non-Route/Disapproved)
202,730 F. Number of days the district operated the school transportation system during
the regular school year:
172
G. All above “False” answers must be supported by a finding or management letter comment.
Finding #: N/A
Management Letter Comment #: N/A
Other Locations Belleville, IL • Carbondale, IL • • Litchfield, IL • Springfield, IL • Cape Girardeau, MO • Milwaukee, WI
CPAs and Management Consultants
One South Memorial Drive Ninth Floor St. Louis, MO 63102 ph 314.231.6232 fax 314.880.9307 www.kebcpa.com
Independent Auditors’ Report on Internal Control Over Financial Reporting and on Compliance and Other
Matters Based on an Audit of Financial Statements Performed in Accordance with Government Auditing Standards
Board of Education Rockwood R-VI School District We have audited, in accordance with the auditing standards generally accepted in the United States of America and the standards applicable to financial audits contained in Government Auditing Standards issued by the Comptroller General of the United States, the financial statements of the governmental activities, each major fund and the aggregate remaining fund information of the Rockwood R-VI School District as of and for the year ended June 30, 2014, and the related notes to the financial statements, which collectively comprise the Rockwood R-VI School District’s basic financial statements, and have issued our report thereon dated December 10, 2014. Internal Control Over Financial Reporting
In planning and performing our audit of the financial statements, we considered Rockwood R-VI School District’s internal control over financial reporting (internal control) to determine the audit procedures that are appropriate in the circumstances for the purpose of expressing our opinions on the financial statements, but not for the purpose of expressing an opinion on the effectiveness of Rockwood R-VI School District’s internal control. Accordingly, we do not express an opinion on the effectiveness of Rockwood R-VI School District’s internal control.
A deficiency in internal control exists when the design or operation of a control does not allow management or employees, in the normal course of performing their assigned functions, to prevent, or detect and correct, misstatements on a timely basis. A material weakness is a deficiency, or a combination of deficiencies, in internal control, such that there is a reasonable possibility that a material misstatement of the District’s financial statements will not be prevented, or detected and corrected on a timely basis. A significant deficiency is a deficiency, or a combination of deficiencies, in internal control that is less severe than a material weakness, yet important enough to merit attention by those charged with governance.
92

93
Our consideration of internal control was for the limited purpose described in the first paragraph of this section and was not designed to identify all deficiencies in internal control that might be material weaknesses or significant deficiencies. Given these limitations, during our audit we did not identify any deficiencies in internal control that we consider to be material weaknesses. However, material weaknesses may exist that have not been identified. Compliance and Other Matters
As part of obtaining reasonable assurance about whether Rockwood R-VI School District’s financial statements are free from material misstatement, we performed tests of its compliance with certain provisions of laws, regulations, contracts, and grant agreements, noncompliance with which could have a direct and material effect on the determination of financial statement amounts. However, providing an opinion on compliance with those provisions was not an objective of our audit, and accordingly, we do not express such an opinion. The results of our tests disclosed no instances of noncompliance or other matters that are required to be reported under Government Auditing Standards. Purpose of this Report
The purpose of this report is solely to describe the scope of our testing of internal control and compliance and the results of that testing, and not to provide an opinion on the effectiveness of the District’s internal control or on compliance. This report is an integral part of an audit performed in accordance with Government Auditing Standards in considering the District’s internal control and compliance. Accordingly, this communication is not suitable for any other purpose.
St. Louis, Missouri December 10, 2014
Other Locations Belleville, IL • Carbondale, IL • • Litchfield, IL • Springfield, IL • Cape Girardeau, MO • Milwaukee, WI
CPAs and Management Consultants
One South Memorial Drive Ninth Floor St. Louis, MO 63102 ph 314.231.6232 fax 314.880.9307 www.kebcpa.com
Independent Auditors' Report on Compliance For Each Major Program and on Internal Control Over Compliance Required by OMB Circular A-133
Board of Education Rockwood R-VI School District Report on Compliance for Each Major Federal Program
We have audited Rockwood R-VI School District’s compliance with the types of compliance requirements described in the OMB Circular A-133 Compliance Supplement that could have a direct and material effect on each of Rockwood R-VI School District’s major federal programs for the year ended June 30, 2014. Rockwood R-VI School District’s major federal programs are identified in the summary of auditors’ results section of the accompanying schedule of findings and questioned costs. Management’s Responsibility
Management is responsible for compliance with the requirements of laws, regulations, contracts, and grants applicable to its federal programs. Auditors’ Responsibility
Our responsibility is to express an opinion on compliance for each of Rockwood R-VI School District’s major federal programs based on our audit of the types of compliance requirements referred to above. We conducted our audit of compliance in accordance with auditing standards generally accepted in the United States of America; the standards applicable to financial audits contained in Government Auditing Standards, issued by the Comptroller General of the United States; and OMB Circular A-133, Audits of States, Local Governments, and Non-Profit Organizations. Those standards and OMB Circular A-133 require that we plan and perform the audit to obtain reasonable assurance about whether noncompliance with the types of compliance requirements referred to above that could have a direct and material effect on a major federal program occurred. An audit includes examining, on a test basis, evidence about Rockwood R-VI School District’s compliance with those requirements and performing such other procedures as we considered necessary in the circumstances.
94
95
We believe that our audit provides a reasonable basis for our opinion on compliance for each major federal program. However, our audit does not provide a legal determination of Rockwood R-VI School District’s compliance. Opinion on Each Major Federal Program
In our opinion, Rockwood R-VI School District, complied, in all material respects, with the types of compliance requirements referred to above that could have a direct and material effect on each of its major federal programs for the year ended June 30, 2014. Report on Internal Control Over Compliance
Management of Rockwood R-VI School District, is responsible for establishing and maintaining effective internal control over compliance with the types of compliance requirements referred to above. In planning and performing our audit of compliance, we considered Rockwood R-VI School District’s internal control over compliance with the types of requirements that could have a direct and material effect on each major federal program to determine the auditing procedures that are appropriate in the circumstances for the purpose of expressing an opinion on compliance for each major federal program and to test and report on internal control over compliance in accordance with OMB Circular A-133, but not for the purpose of expressing an opinion on the effectiveness of internal control over compliance. Accordingly, we do not express an opinion on the effectiveness of Rockwood R-VI School District’s internal control over compliance.
A deficiency in internal control over compliance exists when the design or operation of a control over compliance does not allow management or employees, in the normal course of performing their assigned functions, to prevent, or detect and correct, noncompliance with a type of compliance requirement of a federal program on a timely basis. A material weakness in internal control over compliance is a deficiency, or combination of deficiencies, in internal control over compliance, such that there is a reasonable possibility that material noncompliance with a type of compliance requirement of a federal program will not be prevented, or detected and corrected, on a timely basis. A significant deficiency in internal control over compliance is a deficiency, or a combination of deficiencies, in internal control over compliance with a type of compliance requirement of a federal program that is less severe than a material weakness in internal control over compliance, yet important enough to merit attention by those charged with governance.
Our consideration of internal control over compliance was for the limited purpose described in the first paragraph of this section and was not designed to identify all deficiencies in internal control over compliance that might be material weaknesses or significant deficiencies. We did not identify any deficiencies in internal control over compliance that we consider to be material weaknesses. However, material weaknesses may exist that have not been identified.

96
The purpose of this report on internal control over compliance is solely to describe the scope of our testing of internal control over compliance and the results of that testing based on the requirements of OMB Circular A-133. Accordingly, this report is not suitable for any other purpose.
St. Louis, Missouri December 10, 2014

Pass-Federal ThroughCFDA Identification
Federal Grantor\Pass-through Grantor\Program Title Number Number Expenditures
U.S. Department of EducationPassed-through Missouri Department of Elementary and
Secondary Education:Special Education Grants to States 84.027 096-091 12,605$ Career and Technical Education - Basic Grants to States 84.048 096-091 138,559 Adult Education and Literacy - Basic Grants to States 84.002 096-091 428,904 Early Childhood Special Education 84.027 096-091 685,287 Title I - Grants to Local Educational Agencies 84.010 096-091 1,112,807 Title II - Improving Teacher Quality State Grants 84.367 096-091 406,315 Title III, English Language Acquisition Grants 84.365 096-091 83,394
Total U.S. Department of Education 2,867,871
U.S. Department of Health and Human ServicesPassed-through Missouri Department of Social Services
Drug-Free Communities Support Program Grants 93.276 096-091 147,635
U.S. Department of Air ForcePassed-through Missouri Department of Elementary and
Secondary Education:Buffer Zone Protection Program 97.078 096-091 122,615
U.S. Department of AgriculturePassed-through Missouri Department of Elementary and
Secondary Education:School Breakfast Program 10.553 096-091 1,631,968 National School Lunch Program 10.555 096-091
Cash assistance 339,468 Non-cash assistance (food distribution) 439,550
Total National School Lunch Program 779,018 Total U.S. Department of Agriculture 2,410,986
TOTAL EXPENDITURES OF FEDERAL AWARDS 5,549,107$
ROCKWOOD R-VI SCHOOL DISTRICT
SCHEDULE OF EXPENDITURES OF FEDERAL AWARDSFOR THE YEAR ENDED JUNE 30, 2014
The accompanying notes are an integral part of this schedule.97
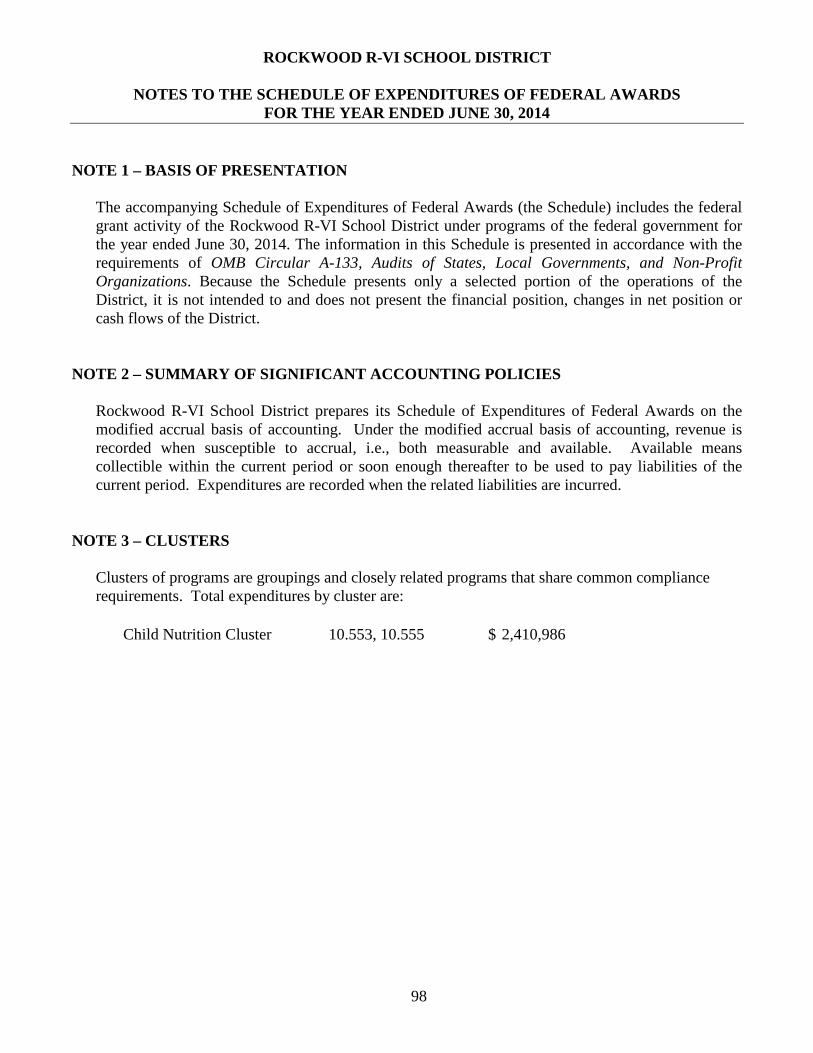
ROCKWOOD R-VI SCHOOL DISTRICT
NOTES TO THE SCHEDULE OF EXPENDITURES OF FEDERAL AWARDS FOR THE YEAR ENDED JUNE 30, 2014
98
NOTE 1 – BASIS OF PRESENTATION The accompanying Schedule of Expenditures of Federal Awards (the Schedule) includes the federal grant activity of the Rockwood R-VI School District under programs of the federal government for the year ended June 30, 2014. The information in this Schedule is presented in accordance with the requirements of OMB Circular A-133, Audits of States, Local Governments, and Non-Profit Organizations. Because the Schedule presents only a selected portion of the operations of the District, it is not intended to and does not present the financial position, changes in net position or cash flows of the District.
NOTE 2 – SUMMARY OF SIGNIFICANT ACCOUNTING POLICIES
Rockwood R-VI School District prepares its Schedule of Expenditures of Federal Awards on the modified accrual basis of accounting. Under the modified accrual basis of accounting, revenue is recorded when susceptible to accrual, i.e., both measurable and available. Available means collectible within the current period or soon enough thereafter to be used to pay liabilities of the current period. Expenditures are recorded when the related liabilities are incurred.
NOTE 3 – CLUSTERS
Clusters of programs are groupings and closely related programs that share common compliance requirements. Total expenditures by cluster are:
Child Nutrition Cluster 2,410,986$ 10.553, 10.555

ROCKWOOD R-VI SCHOOL DISTRICT
SCHEDULE OF FINDINGS AND QUESTIONED COSTS FOR THE YEAR ENDED JUNE 30, 2014
99
SECTION I – SUMMARY OF AUDITORS’ RESULTS
Financial Statements
Type of report issued on financial statements: Unmodified opinion Internal control over financial reporting:
Material weaknesses identified? No
Significant deficiency identified that are not considered to be material weaknesses? No
Noncompliance material to the financial statements noted? No
Federal Awards
Internal control over major programs:
Material weakness identified? No
Significant deficiency identified that are not considered to be material weaknesses? No
Type of auditors’ report issued on compliance for major programs: Unmodified opinion
Any audit findings disclosed that are required to be reported under section .510(a) of OMB Circular A-133? No The programs tested as a major program are as follows:
CFDA Number(s) Name of Program or Cluster
84.002 Adult Education and Literacy - Basic Grants to States84.027 Early Childhood Special Education 84.367 Title II - Improving Teacher Quality State Grants
The dollar threshold used to distinguish between type A and type B programs: $ 300,000
Auditee qualified as a low-risk auditee? Yes
ROCKWOOD R-VI SCHOOL DISTRICT
SCHEDULE OF FINDINGS AND QUESTIONED COSTS FOR THE YEAR ENDED JUNE 30, 2014
100
SECTION II – FINANCIAL STATEMENT FINDINGS
There were no findings which are required to be reported in accordance with Generally Accepted Governmental Auditing Standards.
SECTION III – FEDERAL AWARD FINDINGS AND QUESTIONED COSTS
There were no findings and questioned costs related to Federal Awards. SECTION IV – SCHEDULE OF PRIOR YEAR FINDINGS AND QUESTIONED COSTS There were no prior year findings and questioned costs related to Federal Awards.