rock–paper–scissors - department of education and … · rock–paper–scissors . in pairs,...
TRANSCRIPT
RRoocckk––PPaappeerr––SScciissssoorrss
Task Description Students explore the most likely winning gesture in the game ‘Rock–Paper–Scissors’. Firs the teacher poses the question: How could we work out the best way to win when playing rock paper scissors? The students discuss with their partner what data they might collect to answer the question. Following a class discussion, the students play the game and collect and record the data they suggested. The students are asked to prepare a graph to communicate their results.
Length of Task Approximately 60 minutes, including playing ‘Rock–Paper–Scissors’ and discussion time.
Materials • A2 paper for creating and displaying graph.
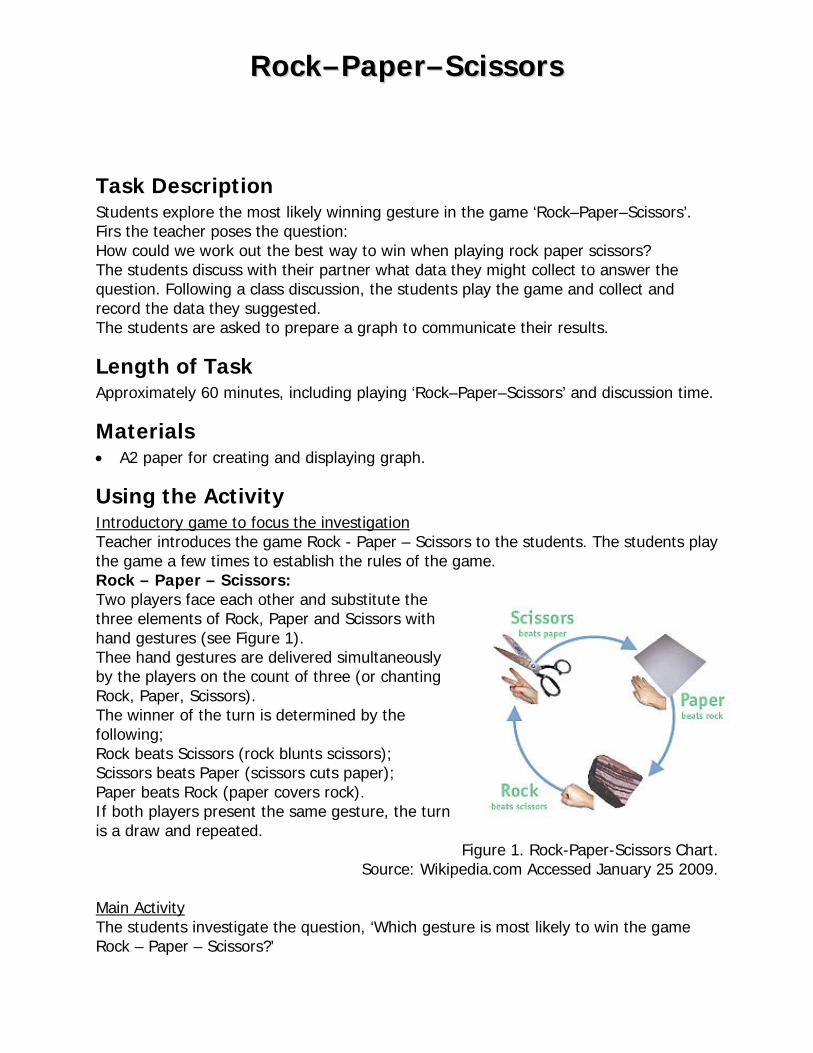
Using the Activity Introductory game to focus the investigation Teacher introduces the game Rock - Paper – Scissors to the students. The students play the game a few times to establish the rules of the game. Rock – Paper – Scissors: Two players face each other and substitute the three elements of Rock, Paper and Scissors with hand gestures (see Figure 1). Thee hand gestures are delivered simultaneously by the players on the count of three (or chanting Rock, Paper, Scissors). The winner of the turn is determined by the following; Rock beats Scissors (rock blunts scissors); Scissors beats Paper (scissors cuts paper); Paper beats Rock (paper covers rock). If both players present the same gesture, the turn is a draw and repeated.
Figure 1. Rock-Paper-Scissors Chart. Source: Wikipedia.com Accessed January 25 2009.
Main Activity The students investigate the question, ‘Which gesture is most likely to win the game Rock – Paper – Scissors?’
RRoocckk––PPaappeerr––SScciissssoorrss
In pairs, students play 100 games of Rock – Paper – Scissors and record the winning gestures for each game. Students transfer data to a graph. Students are given the opportunity to select their method for recording and presenting the data. Students come together with the class to reveal and discuss their results. Which gesture was more likely to arise? In theory, the gestures have an even chance, but what is altering that chance? Why are there differences between the groups? What possible conclusions can we draw from the data?
Students share the methods used to record and present the data. Students discuss the advantages and disadvantages of representing data in the various ways presented by the class.
Key Mathematical Concepts • Data collection, presentation, analysis, and interpretation. • Developing and testing conjectures.
Prerequisite Knowledge • Understanding the elements of a graph. • How to transfer data from a frequency table to a graph.
Dimension Standard Measurement, Chance and Data
Students use a column or bar graph to display the results of an experiment (for example, the frequencies of possible categories).
Measurement, Chance and Data
Students organise and present grouped and ungrouped data using displays such as simple frequency tables.
Working mathematically Students develop and test conjectures.
Assessment To be working at Level 4, students should be able to: • Investigate and analyse conjectures through the use of a frequency table; • Convert data from a frequency table to a graph; and, • Appropriately label a graph.
Extension Suggestions For students who would benefit from additional challenges:
RRoocckk––PPaappeerr––SScciissssoorrss
• Students can gather the results from each group and merge into a whole class data
set. Students explore variations between the partner data and the whole class data. Are there notable similarities or differences? Why would this have occurred?
• Students may be interested in exploring the probability of particular gestures winning at the World RPS Society website. http://www.worldrps.com/
• The World RPS Society recommends players creating their own tournaments. A whole school tournament will provide a range of opportunities to gather and present data on a larger scale.
Teacher Advice and Feedback Teachers were pleased that all students were able to access this investigation. Ensure children know the rules for playing Rock-Paper-Scissors. Many children may not have played this game before. Select student work samples that show a range of graphs if the choice is available. Teachers noted that the engagement level of students was higher noticeably during this activity as a result of playing Rock–Paper–Scissors. They felt that Data can be viewed a dry topic and through incorporating the winning results from a fun and simple game added a level of interest and motivation that they had not expected. Students were eager to test the conjecture. The students who have trialled this lesson selected suitable graphs to represent the data. The students appeared to appreciate that the necessity of clearly transferring information in a graph is an important factor and overrides the employment of more elaborate graphs, such as a bubble graph.
Potential Student Difficulties Teachers found that for students creating a pie graph without completing 100 turns it is more complex to transfer the data to the pie graph and calculate the percentages. However, this is an ideal learning opportunity that arises naturally from the data.
Sources Wikipedia.com Accessed January 25 2009. http://www.worldrps.com/ Accessed January 25 2009.
Acknowledgements
Thank you to the teachers and students from Timbarra Primary School for providing valuable feedback on the use of this activity.
RRoocckk––PPaappeerr––SScciissssoorrss
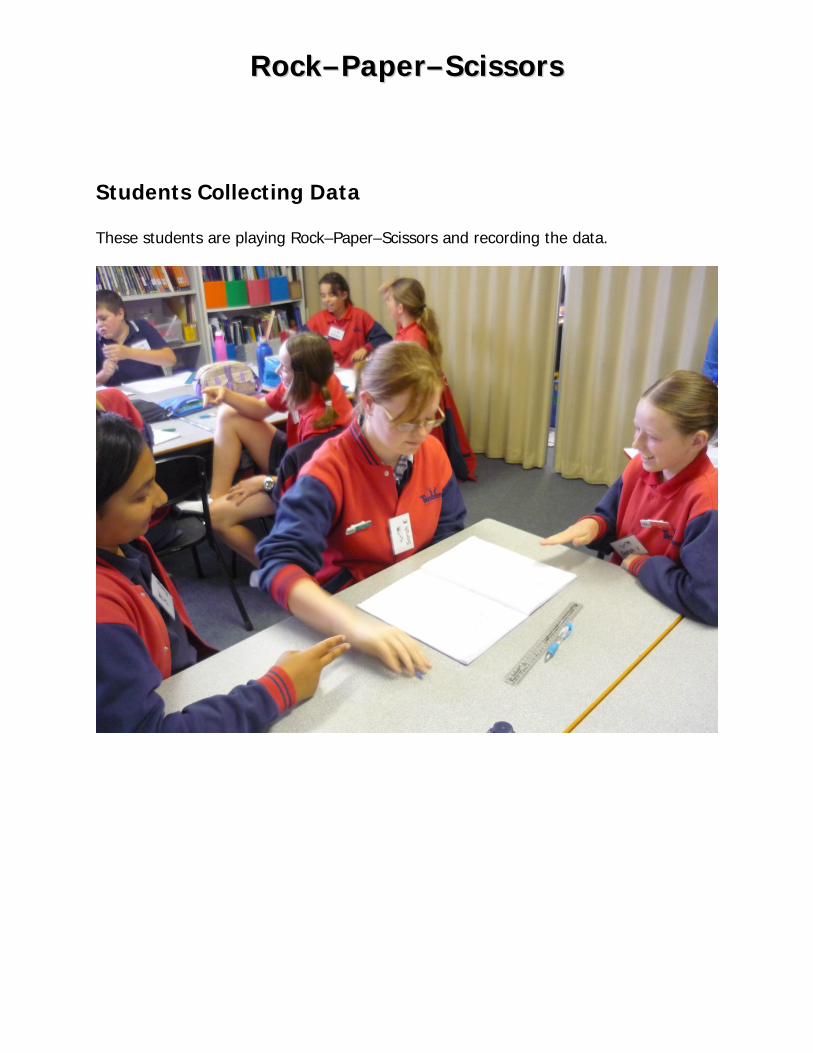
Students Collecting Data These students are playing Rock–Paper–Scissors and recording the data.
RRoocckk––PPaappeerr––SScciissssoorrss
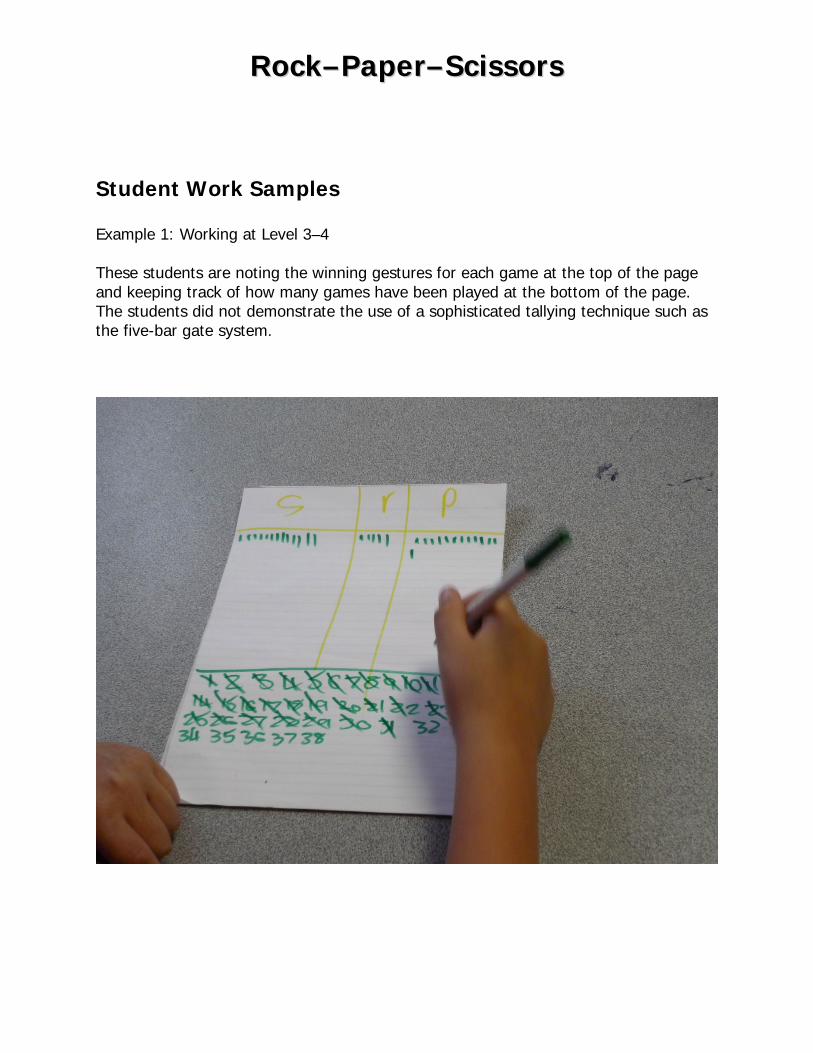
Student Work Samples Example 1: Working at Level 3–4 These students are noting the winning gestures for each game at the top of the page and keeping track of how many games have been played at the bottom of the page. The students did not demonstrate the use of a sophisticated tallying technique such as the five-bar gate system.
RRoocckk––PPaappeerr––SScciissssoorrss
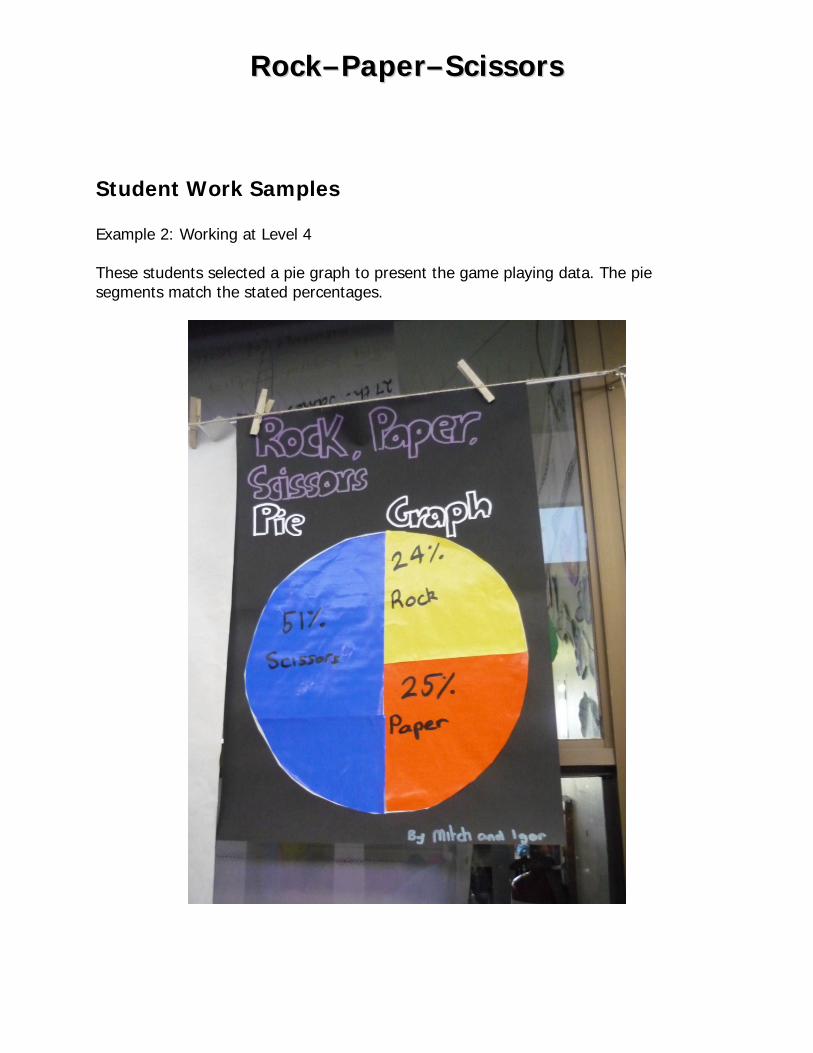
Student Work Samples Example 2: Working at Level 4 These students selected a pie graph to present the game playing data. The pie segments match the stated percentages.
RRoocckk––PPaappeerr––SScciissssoorrss
Student Work Samples
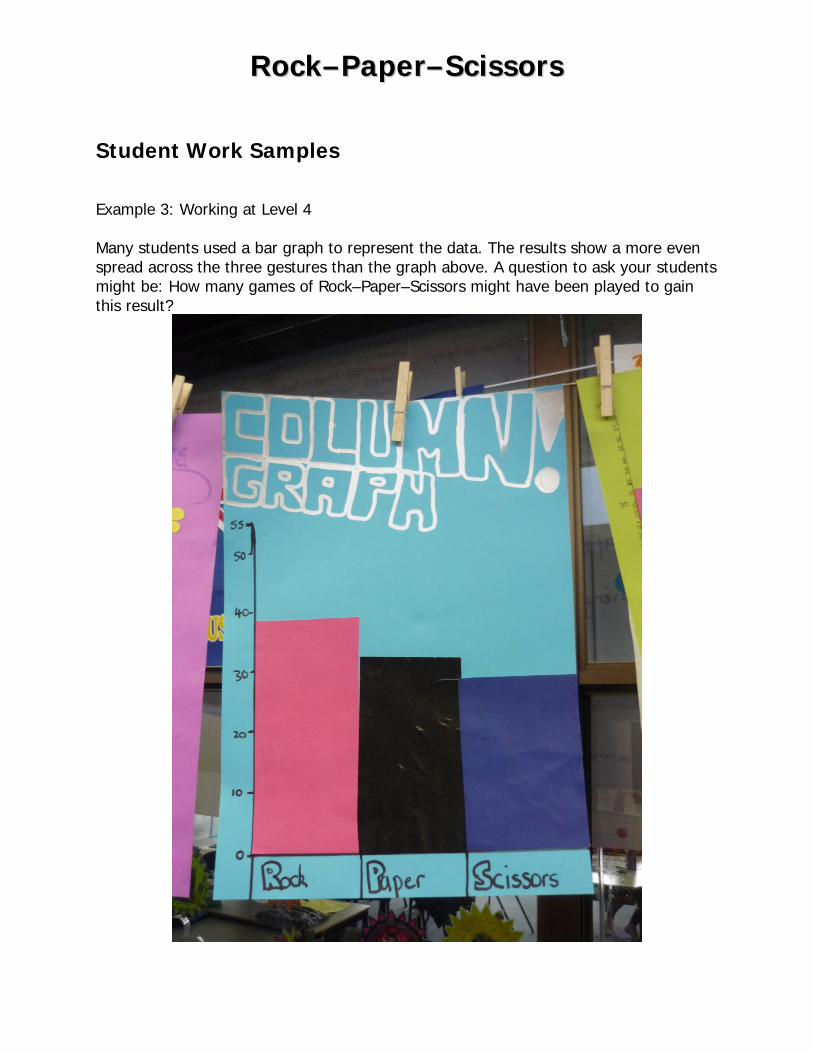
Example 3: Working at Level 4 Many students used a bar graph to represent the data. The results show a more even spread across the three gestures than the graph above. A question to ask your students might be: How many games of Rock–Paper–Scissors might have been played to gain this result?