road safety survey in montenegro - unicef, 2010
DESCRIPTION
Road Safety Survey in MontenegroTRANSCRIPT

Nobody’s UnpredictableJune 2010
Road Safety Survey in Montenegro
June 2010
For:
Road safety survey
© 2
009 I
psos
2
Summary
Citizens of Montenegro generally evaluate road traffic safety in their country with a medium grade. 58% say that they are personally worried because of road traffic safety, and more than 90% say that they feel jeopardized in road traffic at least sometimes.
Majority of citizens think that participants in traffic themselves are responsible for road traffic safety, but that the state has to be active as well: stricter laws are necessary, as well as better control.
One of the most striking findings is the discrepancy between the number of respondents who report violation of regulations and far smaller number of those who claim to have been sanctioned for that.
Only one percentage of citizens is sanctioned for violating regulations about driving children, in spite of widespread mistaken beliefs and practice. Only 6% of drivers are sanctioned for using their mobile phone while driving, opposite to 76% of those who admit having used their phone during driving. While 42% of drivers admit that it happens to them to drink and drive, only 8% were sanctioned for that. 14% of citizens report to have been sanctioned for not fastening safety belt, and 12% for overtaking.
In general, citizens of Montenegro know the basic traffic regulations and facts about traffic, although their knowledge may be characterized as general and superficial. Citizens are able to list many rules (for example when overtaking is forbidden), as well as to recognize correct actions (for example if a child should sit in the front or the rear seat).
However, only between 10 and 30 % of drivers know the correct legally stipulated limitation of speed on various roads. Additionally, only between 20 and 40 % of citizens are informed about age of children that specific rules refer to.
Citizens mainly have positive attitude towards adhering to traffic laws and regulations. Even 92% of citizens think that drinking and driving is dangerous. 74% think that mobile phone shouldn’t be used during driving, and more than two thirds of citizens think that safety belt protects from injuries.
Road safety survey
© 2
009 I
psos
3
Summary
However, it often happens that citizens show their positive attitude towards some regulation and that further analysis show their attitude is inconsistent. Impression is created that citizens have one set of attitudes that they adhere to in general, and another when the are involved.
For example, although 88% of citizens think that children’s safety seats are efficient and that they contribute to safety, approximately one third of parents don’t use them, since they think that they don’t need them, that they drive carefully or that it is safer to hold the child in their lap. Also, 73% of drivers think that using a phone while driving is dangerous, while 64% say that it is not a problem for them.
Between one forth and one third of citizens have openly negative attitude towards traffic regulations, for example they think that fastening a safety belt is unnecessary or uncomfortable or that high speed should be allowed because dangerous are those who drive too slowly.
Impression is created that the key problem is behavior – large number of citizens admit, however socially undesirable that response may be, that they at least sometimes don’t obey the rules. This information needs to be compared with information from other sources.
It seems that the most frequently violated ban is that for using mobile phone while driving (76%), driving over the speed limit (60%) or not allowed overtaking, as well as fastening seat belt (60%). 42% of drivers admit that they drink and drive at least sometimes, and one fourth passes through the red light.
There is a noticeable discrepancy between at least general knowledge about the regulations and positive attitude on one, and violating regulations on the other side. Citizens are aware of the danger and they know what they should do, but they still don’t do that. Some explanation may be the effect of irrational belief about personal inviolability (accidents happen to others, i drive carefully and it is enough etc.).

Road safety survey
© 2
009 I
psos
4
Summary
Particularly illustrative is citizens’ attitude towards traffic accidents – the largest number of citizens who have a traffic accident say that they have changed their behavior and that they are more careful now. However, while one third of them have not changed behavior, which means that even personal experience is sometimes not enough to root out some habits. Additionally, one half of those whose close ones had a traffic accident did not learn on someone else’s example and did not start to be any more careful in traffic.
Another important factor that influences drivers’ behavior is perception of behavior of other people and kind of informal social norms – perception of which rules to obey and which not. Closely connected with this is mistrust in penal policy – citizens think that it is corrupt and that same rules don't apply to all. For example, 70% of citizens think that at least sometimes a policeman stops a person who violates some regulation and doesn’t apply the stipulated sanction.
Observed in general, it seems that drivers who drive every day, men and young people have more casual attitude towards obeying traffic rules.
On the other side, women, older citizens and those who drive occasionally have the most positive attitude towards adhering to regulations and they adhere to them to a larger extent.
Additionally, it seems that there are also regional differences in terms of obeying rules and population of coastal area seems to obey them most.
Not enough attention is paid to road traffic safety in the media in Montenegro, or this issue is presented in a way that cannot make the audience interested. Majority of citizens say that they are not interested in obtaining more information about this topic.
TV is certainly the dominant source of information for the citizens, observed in general, as well as for information about road traffic safety. Significant source of information are also daily newspapers, but also contact with close ones. For young and educated, Internet is an important channel.

Road safety survey
© 2
009 I
psos
5
METHODOLOGY
• Sample universe: Drivers and other participants the traffic in Montenegro (Citizens with and
without driving license);
• Sampling frame: 2003 Census figures and estimated population dynamics
• Type of sample: Three stage random representative stratified sample of drivers and non
drivers
• Planed sample size: 1000 in total: Sample size of 1000 citizens is planed to be randomly
selected with overrepresentation of drivers: 800 citizens with driving license and 200 without
driving license will be interviewed. The main aim of this procedure is to enable the enough
sample size for analysis of disaggregated data on drivers (analysis by gender, age and other
characteristics of drivers). Both samples (of drivers and non drivers) will be selected so that the
distribution by region, age, education and type of settlement respect the distribution in the universe.
• Realized sample size: 1023 (822 drivers)
• Sampling error: Marginal error for n=1000 (95% confidence interval) +/-3.1%
• Number of sampling points: 100 (10 interviews per sampling point)
• Method of data collection: Face to face in respondent's household.

Road safety survey
© 2
009 I
psos
6
INTRODUCTORY

Road safety survey
© 2
009 I
psos
7
Which means of transport do you mainly use every day?
Base: Total target population
67%
11%
9%
1%
1%
11%
Car
Bus
Taxi
Bicycle
Motorcycle
I don`t use any
means of
transport every
day, I walk
78%
54%
89%
24%
9%
14%
4%
25%
5%
14%
2%
24%
2%
0%
1%
1%
1%
0%
1%
0%
6%
17%
3%
26%
Male
Female
Drivers
Non-
drivers
Car
Bus
Taxi
Bicycle
Motorcycle
I don`t use any means
of transport every day,
I w alk
• Two thirds of general population (67%) uses car most frequently.
• One ninth of citizens most frequently use the bus (11%), and one
ninth a taxi (9%). One out of ten citizens (11%) do not use any
transport.
• Male citizens use car to a higher extent in contrast to female citizens
who use taxi or go by foot to a higher extent.
• For drivers an absolutely dominant vehicle is car (89%). Non-drivers
are divided into 1/4 of those who usually use car, 1/4 who use bus, 1/4
of who use taxi and 1/4 who go by foot.
Ge
nd
er
Dri
vin
g

Road safety survey
© 2
009 I
psos
8
Does your household have a car?
Base: Total target population
Yes
80%
No
20% 97%
48%
3%
52%
Drivers
Non-drivers
Yes
No
• Eight out of ten households (80%) in general population possess a car.
• One half of non-drivers (52%) do not have a car in the household, while the same holds true for just 3% of drivers.

Road safety survey
© 2
009 I
psos
9
Do you have a driving license and for which category of vehicle?
Multiple answers; Base: Total target population
65%
14%
4%
2%
35%
Yes, for vehicle
of B category
Yes, for vehicle
of C category
Yes, for vehicle
of A category
Yes, for vehicle
of D category
No
83%
45%
64%
75%
61%
53%
50%
68%
70%
99%
0%
26%
1%
11%
17%
13%
13%
14%
15%
10%
21%
0%
5%
1%
3%
4%
3%
4%
2%
4%
2%
5%
0%
16%
54%
36%
24%
38%
46%
49%
32%
29%
0%
100%
Male
Female
18 - 29
30 - 44
45 - 54
55+
Elementary or less
Secondary
Higher or University
Drivers
Non-drivers
Yes, for vehicle of B category Yes, for vehicle of C category
Yes, for vehicle of A category No
Ge
nd
er
Two thirds of general population (65%) possesses driving license.
• A total of 99% of drivers have a driving license for B category. 21% have
a driving license for C category, while significantly lower percentage of
drivers have a driving license for vehicles of A category (5%) and D
category (4%).
• More than one half of female citizens (54%) do not have a driving license,
as well as significantly lower percentage of male citizens (16%).
• Percentage of citizens who have a driving license is lower in segment aged
55+ years, and among those with the lowest education.
Ag
eE
du
ca
tio
nD
rivin
g

Road safety survey
© 2
009 I
psos
10
How many years ago did you pass the driving test?
Base: Drivers (65% of target population)
Up to 5
years ago
26%
6 -15 years
ago
32%
16 - 25
years ago
21%
Over 25
years ago
21%
22%
33%
63%
18%
9%
0%
24%
29%
27%
31%
37%
37%
53%
15%
3%
35%
25%
36%
22%
18%
0%
29%
47%
8%
18%
23%
24%
25%
12%
0%
0%
30%
89%
24%
23%
13%
Male
Female
18 - 29
30 - 44
45 - 54
55+
Central
Coast
North
Up to 5 years ago 6 -15 years ago
16 - 25 years ago Over 25 years ago
• One fourth of drivers (26%) have 5 or les years of driving
experience. Circa one third of drivers have from 5 to 15, and
the remaining 42% more than 16 years of driving experience.
• The least experienced drivers are more present among
female drivers and those from northern part of the country.
Ge
nd
er
Ag
eR
eg
ion

Road safety survey
© 2
009 I
psos
11
How often do you drive a car?
71%
14%
4%
4%
1%
3%
1%
2%
1%
Every day
Several times a week
Once a week
Several times a
month
Once a month
Several times a year
Once a year
Less than once a
year
Never
Base: Drivers (65% of target population)
Majority of drivers (71%) drive car on daily basis.
Another 14% drive car several times a week, and
significantly smaller percentage just once a week
(4%), several times a month (4%) or less frequently.
How often do you drive a car?
2%
3%
2%
2%
2%
2%
1%
4%
83%
Every day
Several times a week
Once a week
Several times a
month
Once a month
Several times a year
Once a year
Less than once a year
Never
Majority of drivers (83%) do not drive a motorcycle. Only 2%
of drivers drive a motorcycle every day, 3% several times a
week, and 2% once a week.
How often do you drive a motorcycle?
Road safety survey
© 2
009 I
psos
12
USE OF SEAT SAFETY BELTS
Road safety survey
© 2
009 I
psos
13
In your opinion, how likely is it that seat belt would save
someone's life in case of car accident?
Base: Total target population
45%
30%
75%
18%
6%
5%
0%
2%
Very likely
Rather likely
Sum +
Fairly likely
Sum -
Little likely
Completely
unlikely
DK-Ref
72%
78%
74%
79%
74%
74%
77%
7%
4%
8%
3%
4%
6%
5%
Male
Female
Central
Coast
North
Drivers
Non-drivers
Sum + Sum -
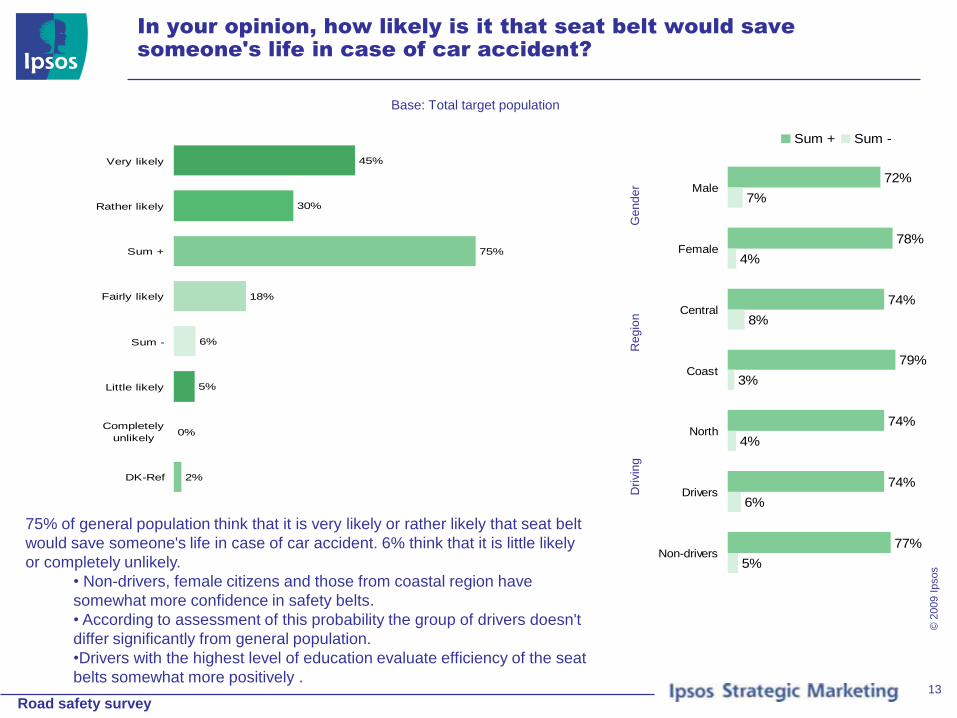
75% of general population think that it is very likely or rather likely that seat belt
would save someone's life in case of car accident. 6% think that it is little likely
or completely unlikely.
• Non-drivers, female citizens and those from coastal region have
somewhat more confidence in safety belts.
• According to assessment of this probability the group of drivers doesn't
differ significantly from general population.
•Drivers with the highest level of education evaluate efficiency of the seat
belts somewhat more positively .
Ge
nd
er
Reg
ion
Dri
vin
g
Road safety survey
© 2
009 I
psos
14
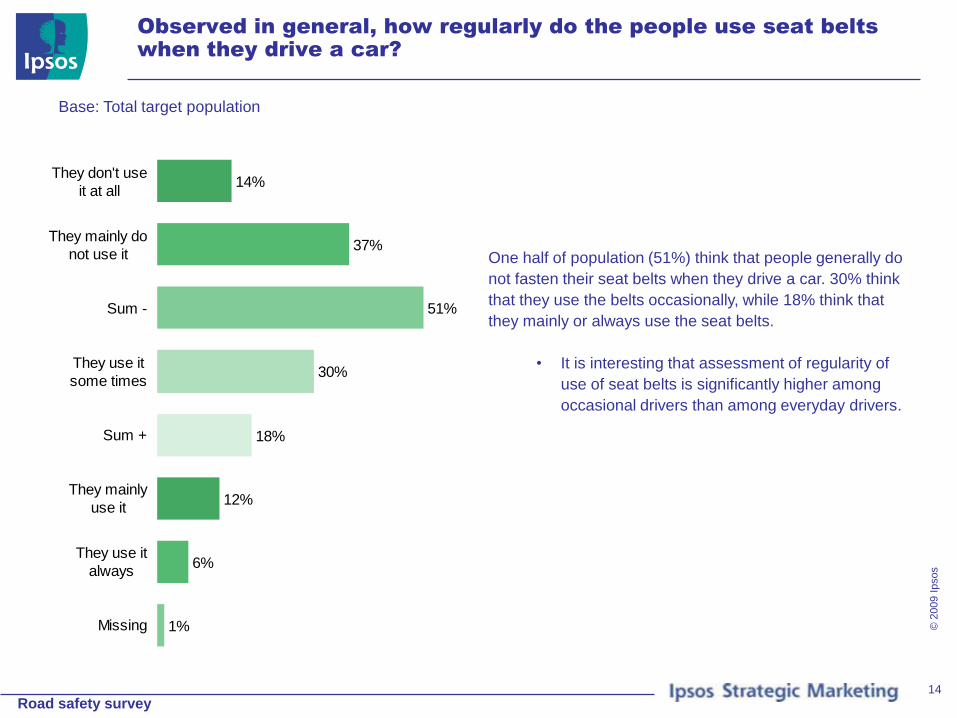
Observed in general, how regularly do the people use seat belts
when they drive a car?
Base: Total target population
14%
37%
51%
30%
18%
12%
6%
1%
They don't use
it at all
They mainly do
not use it
Sum -
They use it
some times
Sum +
They mainly
use it
They use it
always
Missing
One half of population (51%) think that people generally do
not fasten their seat belts when they drive a car. 30% think
that they use the belts occasionally, while 18% think that
they mainly or always use the seat belts.
• It is interesting that assessment of regularity of
use of seat belts is significantly higher among
occasional drivers than among everyday drivers.
Road safety survey
© 2
009 I
psos
15
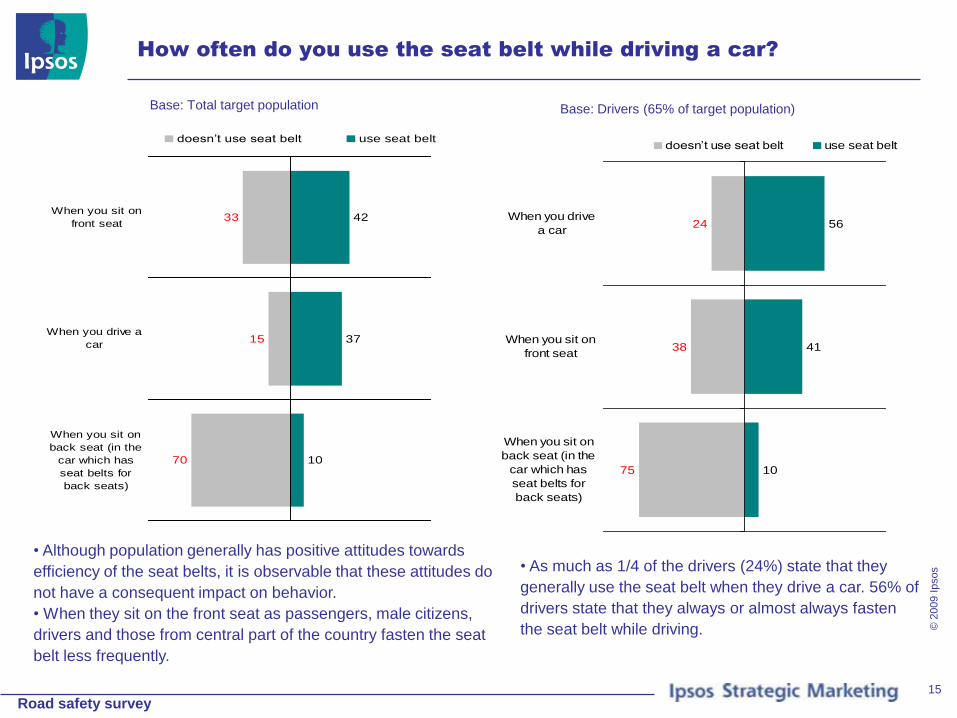
How often do you use the seat belt while driving a car?
Base: Total target population
70
15
33
10
37
42
When you sit on
back seat (in the
car which has
seat belts for
back seats)
When you drive a
car
When you sit on
front seat
doesn’t use seat belt use seat belt
75
38
24
10
41
56
When you sit on
back seat (in the
car which has
seat belts for
back seats)
When you sit on
front seat
When you drive
a car
doesn’t use seat belt use seat belt
Base: Drivers (65% of target population)
• Although population generally has positive attitudes towards
efficiency of the seat belts, it is observable that these attitudes do
not have a consequent impact on behavior.
• When they sit on the front seat as passengers, male citizens,
drivers and those from central part of the country fasten the seat
belt less frequently.
• As much as 1/4 of the drivers (24%) state that they
generally use the seat belt when they drive a car. 56% of
drivers state that they always or almost always fasten
the seat belt while driving.

Road safety survey
© 2
009 I
psos
16
How often do you use the seat belt while driving a car? – use seat
belt - ( 4 + 5 )
Base: Drivers (65% of target population)
41%
59%
50%
40%
69%
76%
63%
54%
56%
52%
51%
71%
37%
49%
41%
30%
61%
42%
44%
36%
36%
48%
34%
58%
10%
10%
11%
8%
6%
16%
9%
14%
13%
1%
9%
12%
Up to 100
eur
100.01-
200 eur
Over 200
eur
Central
Coast
North
Up to 5
years ago
6 -15
years ago
16 - 25
years ago
Over 25
years ago
Every day
Other
When you drive a car
When you sit on front seat
When you sit on back seat
(in the car w hich has seat
belts for back seats)
• The lowest percentage of drivers who regularly fasten the seat
belt is recorded among the citizens with the lowest income and
those from central part of the country.
• Drivers who occasionally drive a car fasten the set belts more
regularly, as well as the drivers from coastal and northern part of
the country.
• Drivers with the smallest experience fasten the seat belt more
regularly, while as much as 34% of drivers with 25+ years of
driving experience state that they rarely or never use the seat
belt .
Inc
om
eR
eg
ion
Dri
vin
g
ex
pe
rie
nc
eD
rivin
g
freq
ue
nc
y
Road safety survey
© 2
009 I
psos
17
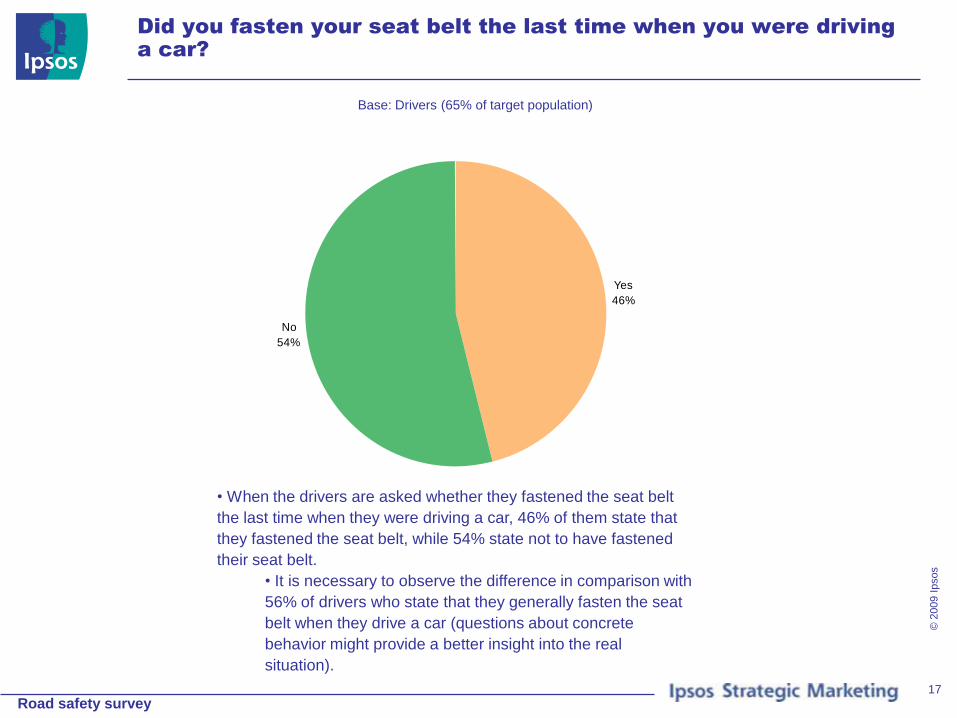
Did you fasten your seat belt the last time when you were driving
a car?
Base: Drivers (65% of target population)
Yes
46%
No
54%
• When the drivers are asked whether they fastened the seat belt
the last time when they were driving a car, 46% of them state that
they fastened the seat belt, while 54% state not to have fastened
their seat belt.
• It is necessary to observe the difference in comparison with
56% of drivers who state that they generally fasten the seat
belt when they drive a car (questions about concrete
behavior might provide a better insight into the real
situation).
Road safety survey
© 2
009 I
psos
18
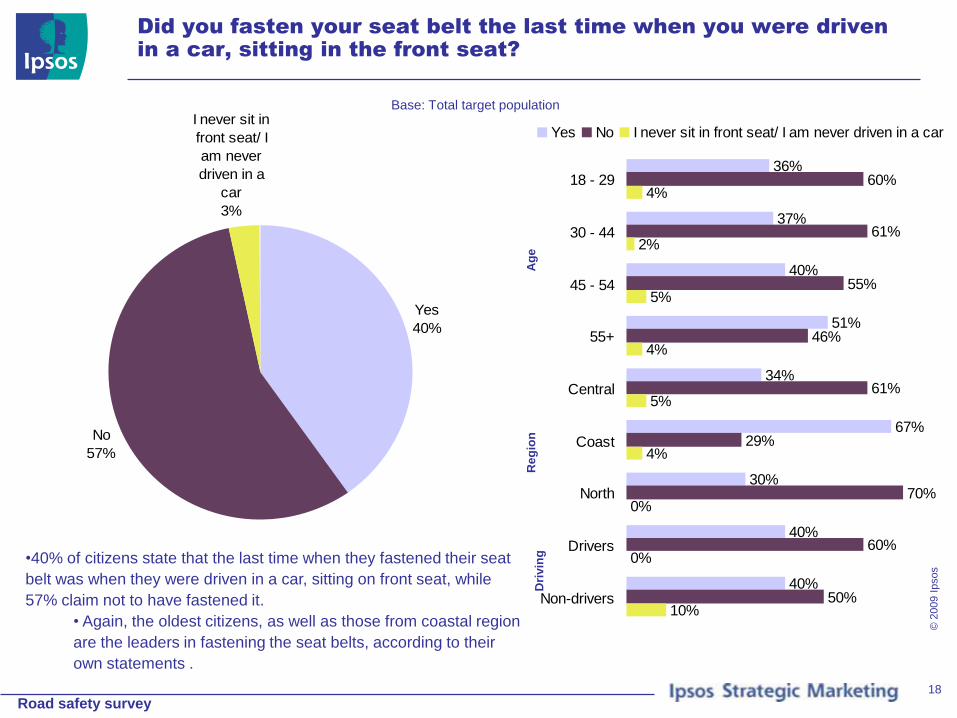
Did you fasten your seat belt the last time when you were driven
in a car, sitting in the front seat?
Base: Total target population
Yes
40%
No
57%
I never sit in
front seat/ I
am never
driven in a
car
3%
36%
37%
40%
51%
34%
67%
30%
40%
40%
60%
61%
55%
46%
61%
29%
70%
60%
50%
4%
2%
5%
4%
5%
4%
0%
0%
10%
18 - 29
30 - 44
45 - 54
55+
Central
Coast
North
Drivers
Non-drivers
Yes No I never sit in front seat/ I am never driven in a car
•40% of citizens state that the last time when they fastened their seat
belt was when they were driven in a car, sitting on front seat, while
57% claim not to have fastened it.
• Again, the oldest citizens, as well as those from coastal region
are the leaders in fastening the seat belts, according to their
own statements .
Ag
eR
eg
ion
Dri
vin
g

Road safety survey
© 2
009 I
psos
19
To what extent you agree with the following statements?
Base: Total target population
44
62
48
41
45
13
15
18
25
26
27
66
In case that the crash occurs, it
is better that the seat belt is
not fastened, because it can
lead to internal injuries and
bleeding.
If the driver is careful, there is
no need to fasten the seat
belts.
Fastening of seat belt is not
necessary in case of short
drives.
Fastening the seat belt is not
comfortable both for the driver
and for other passengers.
It is necessary to fasten a seat
belt in long-distance traffic,
while it is completely
unnecessary to do so within
urban areas.
Fastening of seat belt reduces
the risk from serious injuries in
case of crash.
Disagree ( 1 + 2 ) Agree ( 4 + 5 )
44
61
45
35
42
18
15
20
28
30
31
64
In case that the crash occurs, it is
better that the seat belt is not
fastened, because it can lead to
internal injuries and bleeding.
If the driver is careful, there is no
need to fasten the seat belts.
Fastening of seat belt is not
necessary in case of short
drives.
Fastening the seat belt is not
comfortable both for the driver
and for other passengers.
It is necessary to fasten a seat
belt in long-distance traffic, while
it is completely unnecessary to
do so within urban areas.
Fastening of seat belt reduces
the risk from serious injuries in
case of crash.
Disagree ( 1 + 2 ) Agree ( 4 + 5 )
Base: Drivers (65% of target population)
• Attitudes toward the use of seat belts are mainly positive: Majority of citizens think that Fastening of seat belt
reduces the risk from serious injuries in case of crash and that seat belt is necessary in case of short drives and
city driving. On the other hand, majority of citizens reject an argument that, If the driver is careful, there is no need
to fasten the seat belts , that it is uncomfortable, and in some situations unnecessary .

Road safety survey
© 2
009 I
psos
20
To what extent you agree with the following statements? – Agree
( 4 + 5 )
Base: Total target population
63%
69%
62%
81%
61%
64%
68%
29%
24%
32%
15%
25%
31%
19%
29%
24%
30%
32%
16%
30%
19%
28%
22%
30%
19%
20%
28%
19%
23%
12%
22%
17%
11%
20%
13%
17%
12%
18%
10%
13%
15%
14%
Male
Female
Central
Coast
North
Drivers
Non-
drivers
Fastening of seat belt
reduces the risk from
serious injuries in case of
crash.
It is necessary to fasten a
seat belt in long-distance
traffic, while it is completely
unnecessary to do so within
urban areas.
Fastening the seat belt is not
comfortable both for the
driver and for other
passengers.
Fastening of seat belt is not
necessary in case of short
drives.
If the driver is careful, there
is no need to fasten the seat
belts.
In case that the crash
occurs, it is better that the
seat belt is not fastened,
because it can lead to
internal injuries and
bleeding.
• It is obvious that drivers, male citizens, and citizens
from central and northern parts of the country have a
more tolerant attitude towards driving without the seat
belts, they think that it is uncomfortable, and in some
situations unnecessary. .
Inc
om
eR
eg
ion
Dri
vin
g

Road safety survey
© 2
009 I
psos
21
Were you ever fined during the past 3 years for not fastening the
seat belt, either as a driver or passenger?
Base: Total target population
Yes, once
11%
Yes, several
times
3%
DK-Ref
1%
No
85%
5%
1%
2%
1%
5%
3%
2%
4%
1%
17%
5%
7%
8%
21%
8%
17%
17%
1%
Male
Female
Central
Coast
North
Urban
Rural
Drivers
Non-
drivers
Yes, several times Yes, once
• Contrary to irregular use of seat belts are the data about penalties:
only 11% of the citizens claim to have been fined once, while another
3% state to have been fined several times because they didn't fasten
the seat belt..
• According to their own admittance, higher percentage of male drivers,
and citizens from northern and rural parts of the country were fined.
• Significantly higher percentage of drivers claim to have been fined
once (17% once, and 4% several times), as well as only 1% of non-
drivers. When the drivers are concerned, female drivers, the oldest
segment and the highest educated were fined to a lesser extent.
Ge
nd
er
Reg
ion
Dri
vin
g
Road safety survey
© 2
009 I
psos
22
Which of the following statements best reflects your attitude
towards fines for not fastening the seat belt?
Base: Total target population
I fasten the seat
belt when I see a
policeman in
vicinity
26%I think that the
seat belt should
be fastened
regardless of fine.
43%
DK-Ref
3%
I am not
concerned at all,
no one was fined
for that
6%
I prefer to fasten
the seat belt than
to pay a fee.
22%
7%
5%
6%
8%
31%
19%
31%
15%
23%
21%
24%
18%
37%
50%
38%
54%
1%
5%
1%
6%
Male
Female
Drivers
Non-
drivers
I am not concerned at all,
no one was fined for that
I fasten the seat belt when I
see a policeman in vicinity
I prefer to fasten the seat
belt than to pay a fee.
I think that the seat belt
should be fastened
regardless of fine.
DK-Ref
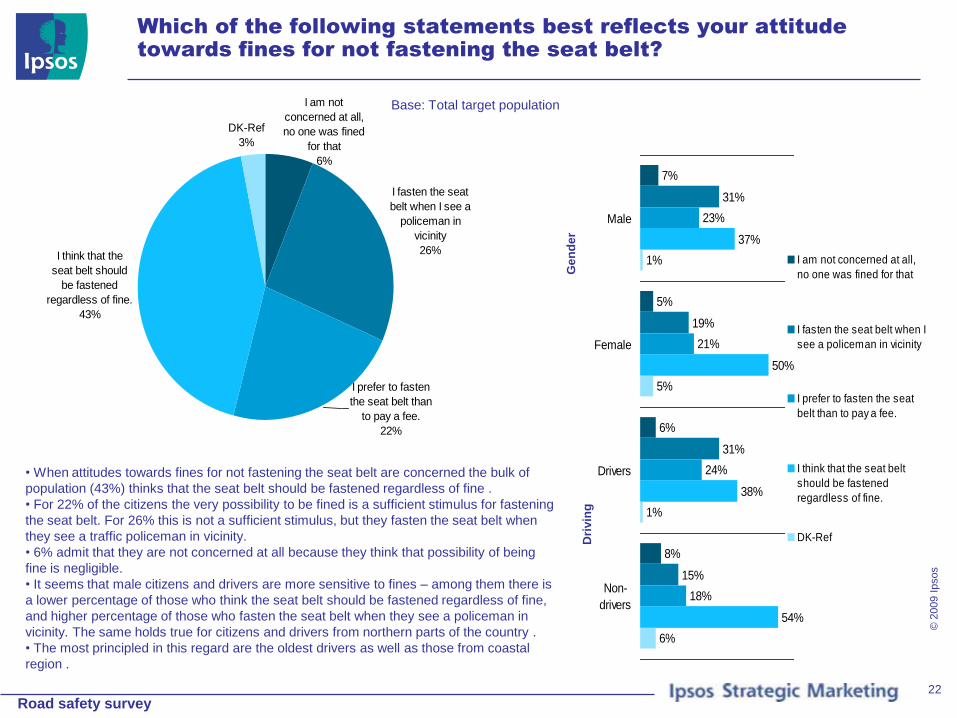
• When attitudes towards fines for not fastening the seat belt are concerned the bulk of
population (43%) thinks that the seat belt should be fastened regardless of fine .
• For 22% of the citizens the very possibility to be fined is a sufficient stimulus for fastening
the seat belt. For 26% this is not a sufficient stimulus, but they fasten the seat belt when
they see a traffic policeman in vicinity.
• 6% admit that they are not concerned at all because they think that possibility of being
fine is negligible.
• It seems that male citizens and drivers are more sensitive to fines – among them there is
a lower percentage of those who think the seat belt should be fastened regardless of fine,
and higher percentage of those who fasten the seat belt when they see a policeman in
vicinity. The same holds true for citizens and drivers from northern parts of the country .
• The most principled in this regard are the oldest drivers as well as those from coastal
region .
Ge
nd
er
Dri
vin
g
Road safety survey
© 2
009 I
psos
23
DRIVING CHILDREN

Road safety survey
© 2
009 I
psos
24
Does the law provide any special rules when it comes to driving
children in a car?
71%
6%
23%
78
6
16
58
5
37
Yes
No
I am not
informed about
that
Total Drivers Non-drivers
Base: Total target population
• Majority of the citizens (71%) are aware of the fact that law provides
special rules when it comes to driving children in a car.
• Non-drivers, the youngest drivers and those with the smallest
experience are the least familiar with this fact.
65%
7%
28%
79
7
13
88
3
10
82
8
9
Yes
No
I am not
informed about
that
Up to 5 years ago 6 -15 years ago
16 - 25 years ago Over 25 years ago
Drivers:

Road safety survey
© 2
009 I
psos
25
Which measures are in question?
Multiple answers; Base: Total target population - those who said that the law provide any special rules when it comes to driving children in a
car (71% of target population)
69%
49%
21%
9%
5%
2%
1%
1%
1%
1%
1%
5%
Children should be sitting at the
back
Special child safety seat
Fastening seat belt
Measures relative to child's age
Children under 12 years of age
should be sitting at the back
They shouldn't sit at the stirring
wheel, in driver's lap
An adult to sit with a child
Locking doors and windows
They shouldn't sit in their
parents' lap
To reduce speed
Other
DK-Ref
62%
86%
56%
32%
22%
18%
12%
0%
7%
1%
Drivers
Non-
drivers
Driv
ers
Children should besitting at the back
Special child safetyseat
Fastening seat belt
Measures relative tochild's age
Children under 12years of age shouldbe sitting at the back
• Concrete measures that the citizens are aware of are: having the children seated on back seat (69%),use of special seat for
children (49%), as well as having the children fastened with seat belts (21%).
• Drivers are more familiar with child safety seats, although it is apparent that they are not more aware of rules than
non-drivers.
Road safety survey
© 2
009 I
psos
26
In your opinion, what is the safest way to drive children in car?
Base: Total target population
A child
should sit on
the front
seat
4%
DK-Ref
2%
A child
should sit on
the back
seat
94%
A child should sit on the front seat OR A child should sit on
the back seat
A child should have a seat belt fastened OR A child does
not need a seat belt fastened
A child does
not need a
seat belt
fastened
17%
DK-Ref
3%
A child
should have
a seat belt
fastened
80%
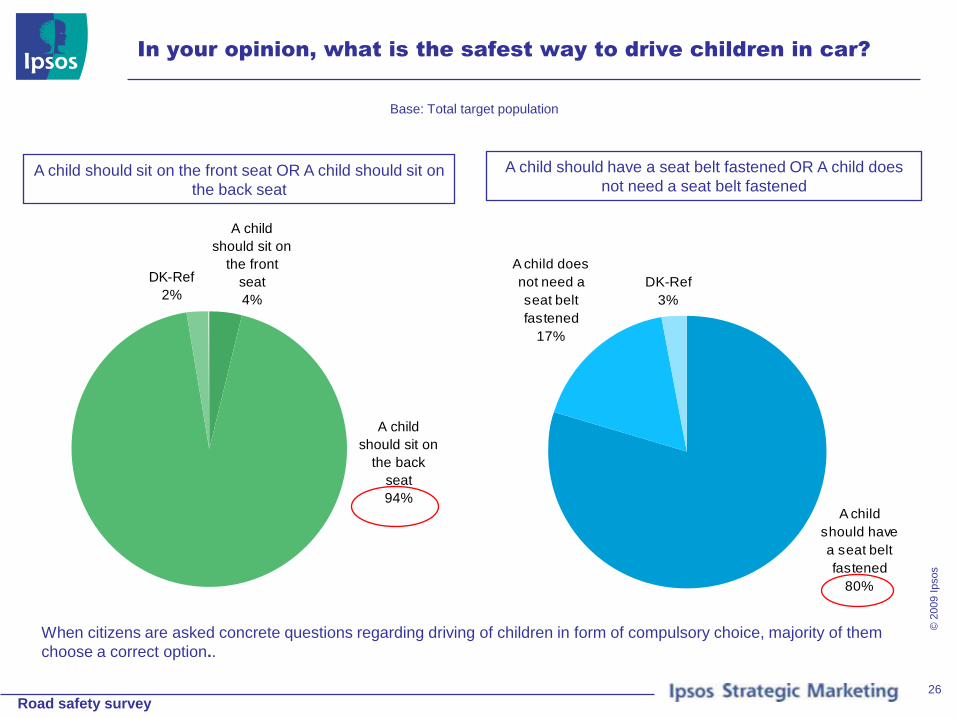
When citizens are asked concrete questions regarding driving of children in form of compulsory choice, majority of them
choose a correct option..
Road safety survey
© 2
009 I
psos
27
In your opinion, what is the safest way to drive children in car?
Base: Total target population
Small
children
should be
held in
hands
7%
DK-Ref
4%
A small child
should sit in
child safety
seat
89%
Small children should be held in hands OR A small child
should sit in child safety seat
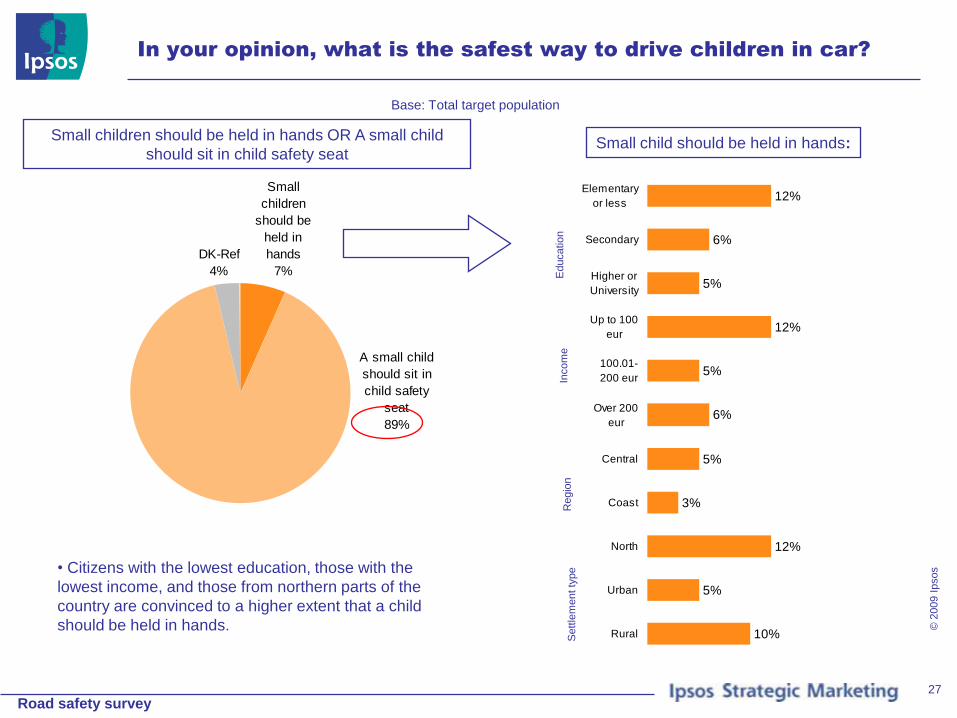
• Citizens with the lowest education, those with the
lowest income, and those from northern parts of the
country are convinced to a higher extent that a child
should be held in hands.
12%
6%
5%
12%
5%
6%
5%
3%
12%
5%
10%
Elementary
or less
Secondary
Higher or
University
Up to 100
eur
100.01-
200 eur
Over 200
eur
Central
Coast
North
Urban
Rural
Small child should be held in hands:
Incom
eE
ducatio
nR
egio
nS
ett
lem
ent ty
pe

Road safety survey
© 2
009 I
psos
28
How often do parents keep a small child in their lap while riding
in the front seat?
Base: Total target population
3%
6%
8%
21%
70%
26%
44%
1%
it never
happens
2
Sum -
3
Sum +
4
it happens very
frequently
DK-Ref
…while sitting in the front seat?
8%
25%
33%
25%
41%
18%
24%
1%
it never
happens
2
Sum -
3
Sum +
4
it happens very
frequently
DK-Ref
…while driving?
• 70% of citizens think that it often happens that parents hold their small child in their lap while they sit in front passenger
seat.
• 41% of citizens state that it often happens that the parents hold a small child in their lap while they drive a car.

Road safety survey
© 2
009 I
psos
29
How dangerous for the child do you consider this practice?
Base: Total target population
3%
3%
5%
14%
79%
18%
62%
2%
not dangerous
at all
2
Sum -
3
Sum +
4
Very dangerous
DK-Ref
…while sitting in the front seat?…while driving?
3%
3%
6%
5%
88%
12%
76%
2%
not dangerous
at all
2
Sum -
3
Sum +
4
Very dangerous
DK-Ref
Average risk rating on the scale from 1 to 5 is
4.4, without significant differences between
drivers and non-drivers.
Average risk rating is 4.6.
This practice is considered somewhat less risky among the citizens aged
between 18 and 29 years, those with the lowest education, as well as the
citizens from central part of the country and urban areas. The same holds
true for the drivers with the smallest experience and occasional drivers.
Negative attitudes towards this practice are more pronounced
among the drivers, particularly the ones who drive a car every day,
as well as among 55+ drivers.
Road safety survey
© 2
009 I
psos
30
Child safety seats
Base: Total target population
87.4
12.6
91
9
0 50 100
Yes
No
Drivers
Total
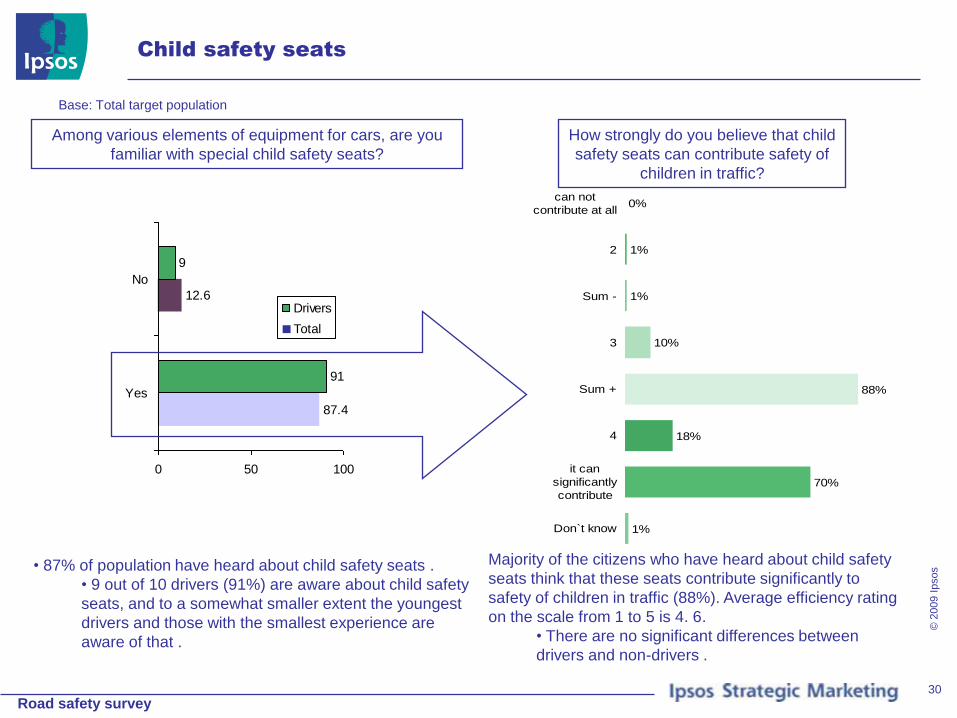
• 87% of population have heard about child safety seats .
• 9 out of 10 drivers (91%) are aware about child safety
seats, and to a somewhat smaller extent the youngest
drivers and those with the smallest experience are
aware of that .
0%
1%
1%
10%
88%
18%
70%
1%
can not
contribute at all
2
Sum -
3
Sum +
4
it can
significantly
contribute
Don`t know
Majority of the citizens who have heard about child safety
seats think that these seats contribute significantly to
safety of children in traffic (88%). Average efficiency rating
on the scale from 1 to 5 is 4. 6.
• There are no significant differences between
drivers and non-drivers .
How strongly do you believe that child
safety seats can contribute safety of
children in traffic?
Among various elements of equipment for cars, are you
familiar with special child safety seats?

Road safety survey
© 2
009 I
psos
31
Until which age should a child be driven in child safety seat?
Base: Total target population - those who are familiar with special child safety seats (87% of target population)
21%
23%
27%
16%
6%
7%
21
21
29
15
6
7
Up to 3 years
4 years
5 years
6-7 years
8+ years
DK-Ref
Total
Drivers
• 21% of the citizens who have heard about child safety seats think that they are intended for children up to 3 years of
age. Majority of the citizens think that they are intended also for older children (average mentioned age is 5 years)
• The drivers are not more aware of the rules than non-drivers. The least informed are the drivers aged 55+,
and those with 25+ years of driving experience .
Road safety survey
© 2
009 I
psos
32
Child seat usage
Base: Divers - those who are familiar with special child safety seats (60% of target population)
28.9
71.1
40
60
18
82
0 50 100
Yes
No
Total Has children in HH Does not have children in HH
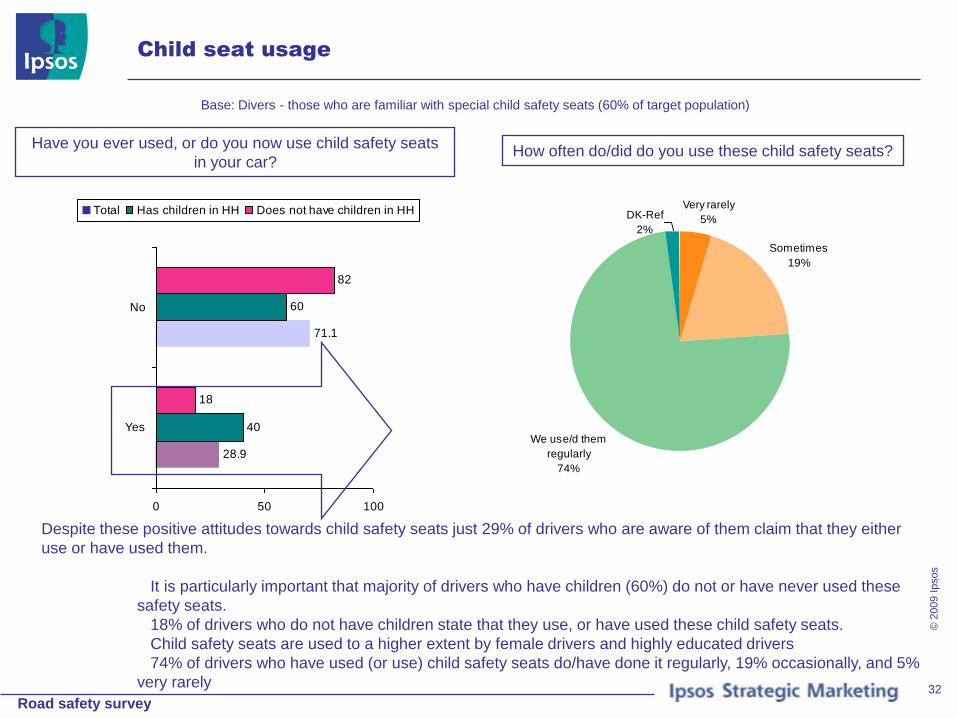
Have you ever used, or do you now use child safety seats
in your car?
Very rarely
5%
Sometimes
19%
We use/d them
regularly
74%
DK-Ref
2%
How often do/did do you use these child safety seats?
Despite these positive attitudes towards child safety seats just 29% of drivers who are aware of them claim that they either
use or have used them.
It is particularly important that majority of drivers who have children (60%) do not or have never used these
safety seats.
18% of drivers who do not have children state that they use, or have used these child safety seats.
Child safety seats are used to a higher extent by female drivers and highly educated drivers
74% of drivers who have used (or use) child safety seats do/have done it regularly, 19% occasionally, and 5%
very rarely

Road safety survey
© 2
009 I
psos
33
Why don't/didn’t you use the child safety seats?
54%
22%
16%
5%
1%
0%
8%
2%
I don't have children / don't drive
children / don't have a
They are very expensive, so I
can't afford them
I drive carefully when children
are in car, so I don't use t
I think that it is safer to hold the
child in lap
I don't want to restrain the child
The child safety seats do not
contribute to safety of childr
Other reason
DK-Ref
36%
33%
20%
7%
1%
1%
9%
Yes
I don't have children /
don't drive children /
don't have a They are very
expensive, so I can't
afford themI drive carefully when
children are in car, so
I don't use tI think that it is safer to
hold the child in lap
I don't want to restrain
the child
The child safety seats
do not contribute to
safety of childrOther reason
The most frequently mentioned reason why they don't use these seats are: high price (33%), conviction that careful
driving makes these seats unnecessary (20%), as well as conviction that it is safer to hold the child in lap (7%)
Drivers with children in HH
Road safety survey
© 2
009 I
psos
34
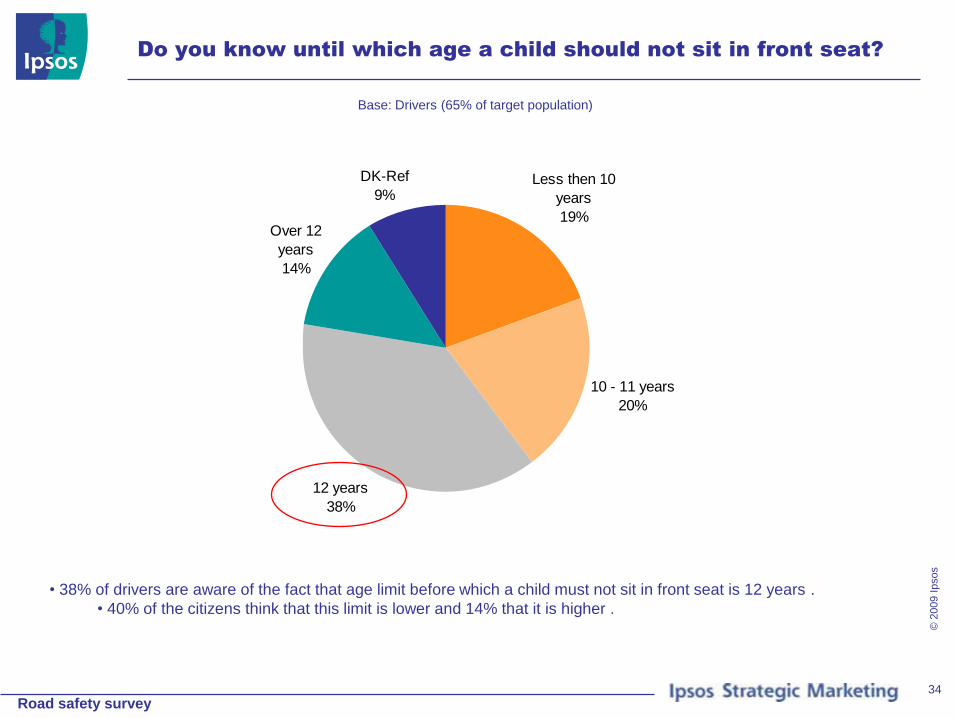
Do you know until which age a child should not sit in front seat?
Base: Drivers (65% of target population)
Less then 10
years
19%
10 - 11 years
20%
12 years
38%
Over 12
years
14%
DK-Ref
9%
• 38% of drivers are aware of the fact that age limit before which a child must not sit in front seat is 12 years .
• 40% of the citizens think that this limit is lower and 14% that it is higher .
Road safety survey
© 2
009 I
psos
35
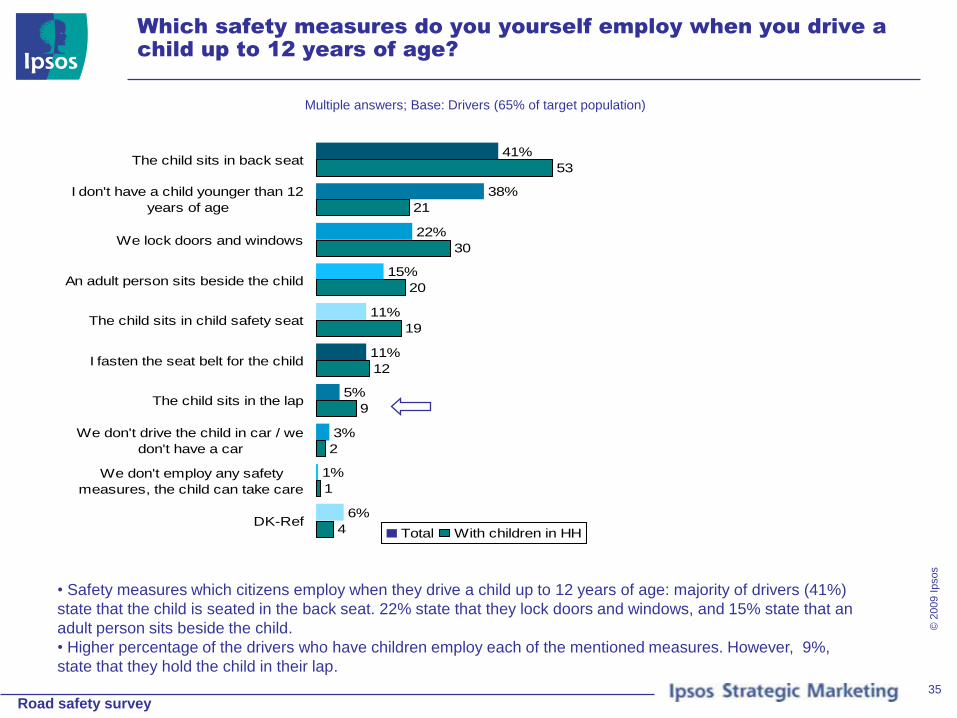
Which safety measures do you yourself employ when you drive a
child up to 12 years of age?
Multiple answers; Base: Drivers (65% of target population)
41%
38%
22%
15%
11%
11%
5%
3%
1%
6%
53
21
30
20
19
12
9
2
1
4
The child sits in back seat
I don't have a child younger than 12
years of age
We lock doors and windows
An adult person sits beside the child
The child sits in child safety seat
I fasten the seat belt for the child
The child sits in the lap
We don't drive the child in car / we
don't have a car
We don't employ any safety
measures, the child can take care
DK-RefTotal With children in HH
• Safety measures which citizens employ when they drive a child up to 12 years of age: majority of drivers (41%)
state that the child is seated in the back seat. 22% state that they lock doors and windows, and 15% state that an
adult person sits beside the child.
• Higher percentage of the drivers who have children employ each of the mentioned measures. However, 9%,
state that they hold the child in their lap.

Road safety survey
© 2
009 I
psos
36
Were you sanctioned for improper child ride in the car/motorcycle
during the past three years?
Base: Drivers (65% of target population)
Yes, once
1%DK-Ref
3%
No
96%
Yes, several
times
0%
Percentage of fined citizens is in contrast with the widespread wrong convictions and practice: only 1% of the drivers
claim to have been fined for irregular driving of children during the past 3 years, while 0.4% have been fined several
times .

Road safety survey
© 2
009 I
psos
37
USE OF MOBILE PHONE WHILE DRIVING A CAR

Road safety survey
© 2
009 I
psos
38
How often do you find yourself in situation when you have to use
mobile phone while driving a car?
Base: Drivers - those who have mobile phone (64% of target population)
19%
30%
15%
18%
28%
41%
22%
36%
14%
27%
16%
18%
36%
Male
Female
18 - 29
30 - 44
45 - 54
55+
Central
Coast
North
Urban
Rural
Every day
Other
• 97% of drivers possess mobile phone .
• Out of this percentage of drivers as much as 76% find themselves in
situation when they have to make a call while driving the car
(according to their own admission) .
• Majority of drivers make phone calls while driving on daily basis:
36% make calls several times a day, and another 10% once a day .
• Male citizens, younger citizens, drivers who drive a car every
day, citizens from northern parts of the country and those from
rural areas make calls while driving more frequently .
36%
10%
14%
7%
6%
5%
23%
Several times a
day
Once a day
Several times a
week
Once a week
Once a month
Once a year
I never use the
mobile phone
while driving
Claiming that they never use
mobile phone while driving:
Ge
nd
er
Ag
eR
eg
ion
Se
ttle
me
nt
Dri
vin
g

Road safety survey
© 2
009 I
psos
39
Making phone calls while driving
Base: Drivers - those who have mobile phone (64% of target population)
32%
13%
9%
7%
6%
14%
19%
Several times a
day
Once a day
Several times a
week
Once a week
Once a month
Once a year
I never use the
mobile phone
while driving
How often do you MAKE A MOBILE PHONE CALL to
someone while driving a car?
What are the most frequent reasons why you MAKE A
MOBILE PHONE CALL while driving a car?
45%
32%
31%
13%
6%
Business calls
Arrangements
with
friends/relatives
Urgent situations
– when
something
unexpected
happens
Casual
conversation with
relatives/ friends
Seeking
information about
how to manage
the road
• Almost a half of the citizens daily make phone calls while driving (32% do it several times a day) while 19% claim that they never do that .
• Most frequently mentioned reason for making the calls is Business call (45%), making arrangements with friends and relatives (32%) and unexpected
situations (31%) .
• As much as 13% of drivers who use mobile phone while driving admit that they have casual chatting with friends or family .
• Drivers who occasionally drive a car make sure that they telephone while driving only in urgent situations, or in order to find road assistance
service .

Road safety survey
© 2
009 I
psos
40
Sanctioning
Base: Drivers - those who have mobile phone (64% of target population)
Yes
9%
No
83%
DK-Ref
8%
Do you use accessories that enable talking without taking
hands off the stirring wheel (earphones, Bluetooth, hands
free...)?
No
89%
Yes, several
times
1%DK-Ref
5%
Yes, once
5%
Were you sanctioned for using mobile phone while
driving during the past three years?
• Only 9% of the drivers who have mobile phone use some kind of device which makes possible for them to keep
hands on steering wheel while driving a car (handsfree, bluetooth, earphones).
• Despite considerable percentage of the drivers who make phone calls while driving, just 5% claim to have been
fined for this once during the past 3 years, and 1% several times.

Road safety survey
© 2
009 I
psos
41
To what extent does mobile phone distract you personally while
you are driving a car (if at all)?
Base: Drivers - those who have mobile phone (64% of target population)
27%
37%
64%
29%
15%
14%
7%
Not at all
A little, but I
manage to
keep attention
Sum -
Sum +
Partly
Fully
DK-Ref
67%
56%
55%
58%
66%
67%
59%
61%
73%
38%
26%
35%
32%
34%
26%
23%
35%
35%
21%
49%
Male
Female
Up to 100
eur
100.01-200
eur
Over 200
eur
Central
Coast
North
Every day
Other
Sum -
Sum +
• 64% of drivers who have a mobile phone think that it doesn't hinder them considerably while they drive a car (27% of
whom claim that it doesn't obstruct them at all).
• 15% state that mobile phone partly obstructs them, and 14% that it obstructs them completely .
• By their opinion, mobile phone obstructs the least male drivers, those who drive car every day, citizens with
higher income and those from central region .
Ge
nd
er
Inc
om
eR
eg
ion
Dri
vin
g
Road safety survey
© 2
009 I
psos
42
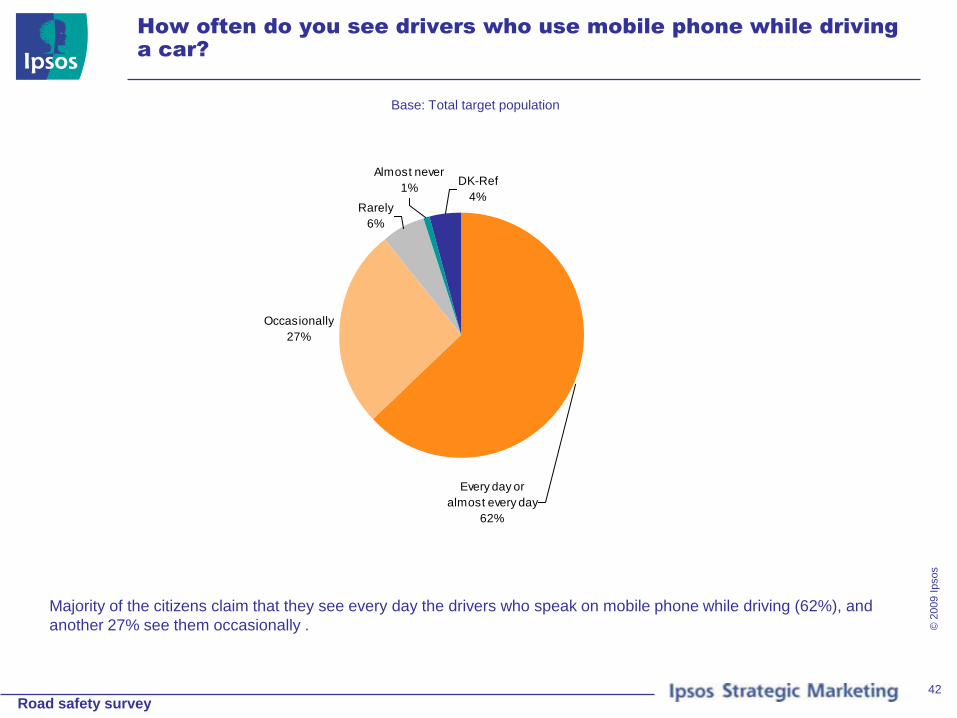
How often do you see drivers who use mobile phone while driving
a car?
Base: Total target population
Occasionally
27%
Rarely
6%
Every day or
almost every day
62%
Almost never
1%DK-Ref
4%
Majority of the citizens claim that they see every day the drivers who speak on mobile phone while driving (62%), and
another 27% see them occasionally .
Road safety survey
© 2
009 I
psos
43
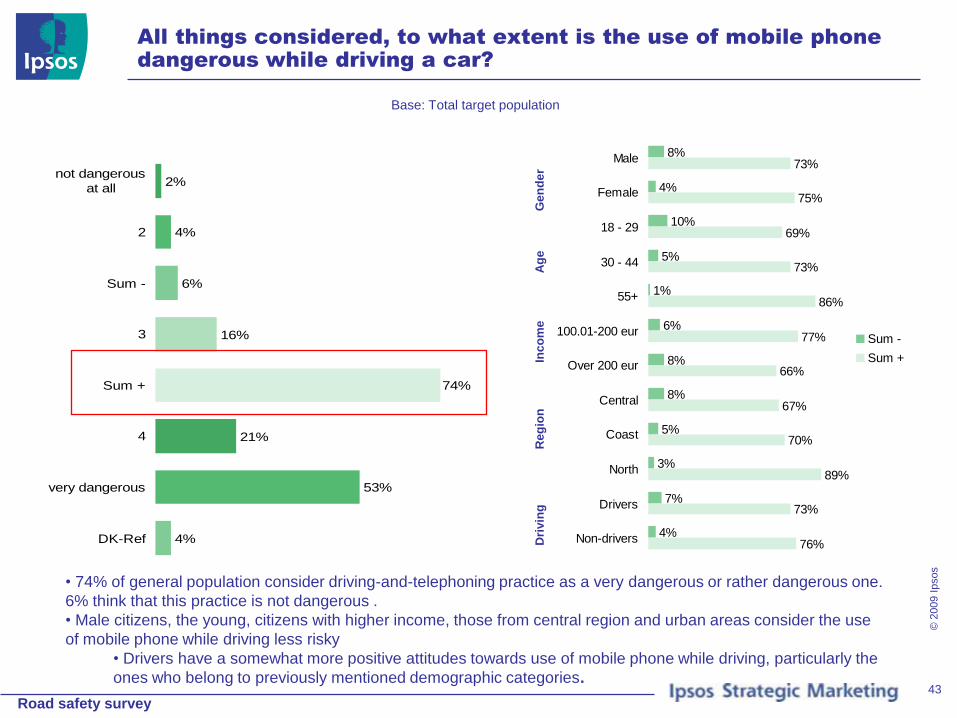
All things considered, to what extent is the use of mobile phone
dangerous while driving a car?
Base: Total target population
2%
4%
6%
16%
74%
21%
53%
4%
not dangerous
at all
2
Sum -
3
Sum +
4
very dangerous
DK-Ref
8%
4%
10%
5%
1%
6%
8%
8%
5%
3%
7%
4%
73%
75%
69%
73%
86%
77%
66%
67%
70%
89%
73%
76%
Male
Female
18 - 29
30 - 44
55+
100.01-200 eur
Over 200 eur
Central
Coast
North
Drivers
Non-drivers
Sum -
Sum +
• 74% of general population consider driving-and-telephoning practice as a very dangerous or rather dangerous one.
6% think that this practice is not dangerous .
• Male citizens, the young, citizens with higher income, those from central region and urban areas consider the use
of mobile phone while driving less risky
• Drivers have a somewhat more positive attitudes towards use of mobile phone while driving, particularly the
ones who belong to previously mentioned demographic categories.
Ge
nd
er
Inc
om
eR
eg
ion
Dri
vin
gA
ge
Road safety survey
© 2
009 I
psos
44
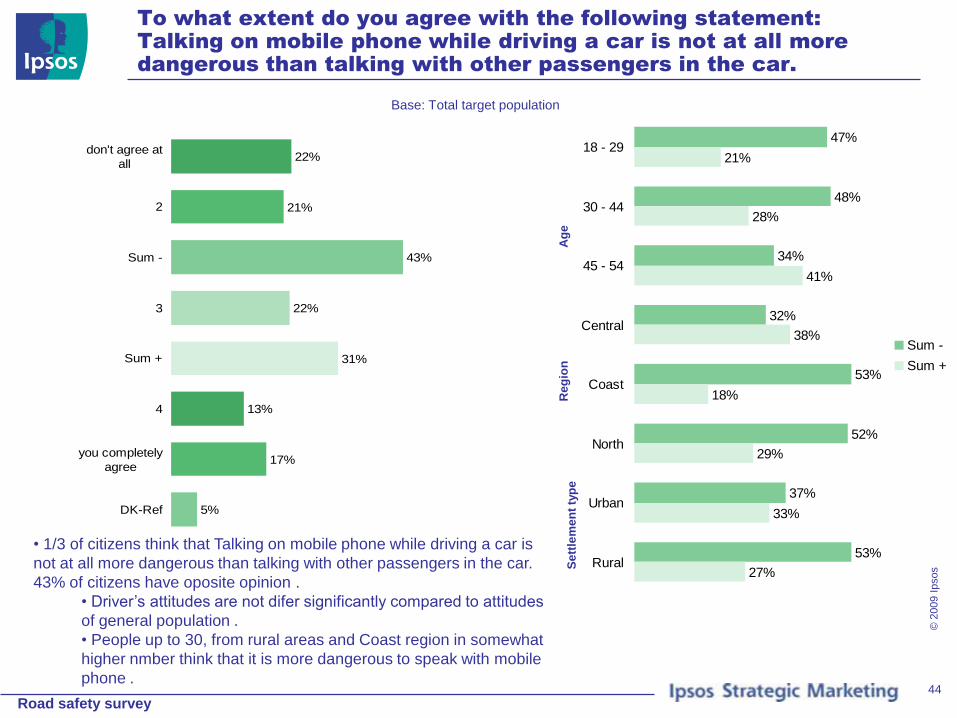
To what extent do you agree with the following statement:
Talking on mobile phone while driving a car is not at all more
dangerous than talking with other passengers in the car.
Base: Total target population
22%
21%
43%
22%
31%
13%
17%
5%
don't agree at
all
2
Sum -
3
Sum +
4
you completely
agree
DK-Ref
47%
48%
34%
32%
53%
52%
37%
53%
21%
28%
41%
38%
18%
29%
33%
27%
18 - 29
30 - 44
45 - 54
Central
Coast
North
Urban
Rural
Sum -
Sum +
• 1/3 of citizens think that Talking on mobile phone while driving a car is
not at all more dangerous than talking with other passengers in the car.
43% of citizens have oposite opinion .
• Driver’s attitudes are not difer significantly compared to attitudes
of general population .
• People up to 30, from rural areas and Coast region in somewhat
higher nmber think that it is more dangerous to speak with mobile
phone .
Se
ttle
me
nt
typ
eA
ge
Reg
ion

Road safety survey
© 2
009 I
psos
45
FAST DRIVING

Road safety survey
© 2
009 I
psos
46
In your opinion, how much do the generally drivers abide by
prescribed speed limitations on main/regional roads in
Montenegro?
Base: Total target population
4%
31%
35%
28%
36%
32%
4%
1%
5
30
34
31
34
30
4
0
Always
In majority of cases
Sum +
Sometimes
Sum -
In small number of cases
Never
DK-RefTotal Drivers
...main/regional roads in Montenegro?...in towns?
3%
41%
44%
27%
28%
24%
4%
1%
3
45
48
27
24
20
4
1
Always
In majority of
cases
Sum +
Sometimes
Sum -
In small
number of
cases
Never
DK-Ref
• Citizens have divided opinions on how much the drivers generally abide by prescribed speed limitations on highways
and regional roads in Montenegro: 35% think that they mainly abide by prescribed speed limitations, while 36% have an
opposite opinion .
• There are no differences between drivers and non-drivers in this regard .
• Somewhat higher percentage of the citizens (44%) think that speed limitations are abode by in towns, while 28% have
opposite opinion .
• Somewhat higher percentage of drivers think that these speed limitations are respected, particularly the ones
from coastal and northern regions and rural settlements .

Road safety survey
© 2
009 I
psos
47
Are you perhaps familiar with the speed limits that are prescribed
by law on the following types of roads (km/h)?
Base: Drivers (65% of target population)
52%
36%
78%
31%
14%
9%
11%
1%
4%
5.9
23.8
8.4
In populated
settlements
On roads for
motor trafffic
On highways
Lower Exact Higher DK
• Only 31% of drivers are aware of the fact that current speed limitation in populated places is 50 km/h, 52% think that speed limitation is
lower (mainly 40 km/h), and 11% that it is higher .
• Drivers with the lowest income and those from central region know about speed limitations the least .
• Even smaller percentage of drivers (14%) is aware of exact speed limitations for motor transport (100km/h). As much as 24% of drivers
state that they know the answer, while others think that smaller speed is in question. Only 1% of drivers think that higher speed is in question
.
•9% of drivers think that valid speed limitation on highways is 130 km/h. 79% of drivers think that speed limitation is higher, while the biggest
percentage of drivers believe that speed limitation is 120 km/h. 4% think that speed limitation is lower .
•The youngest drivers who have recently obtained the drivers license are the most aware of this limitation, as well as citizens from
the coastal region .
Road safety survey
© 2
009 I
psos
48
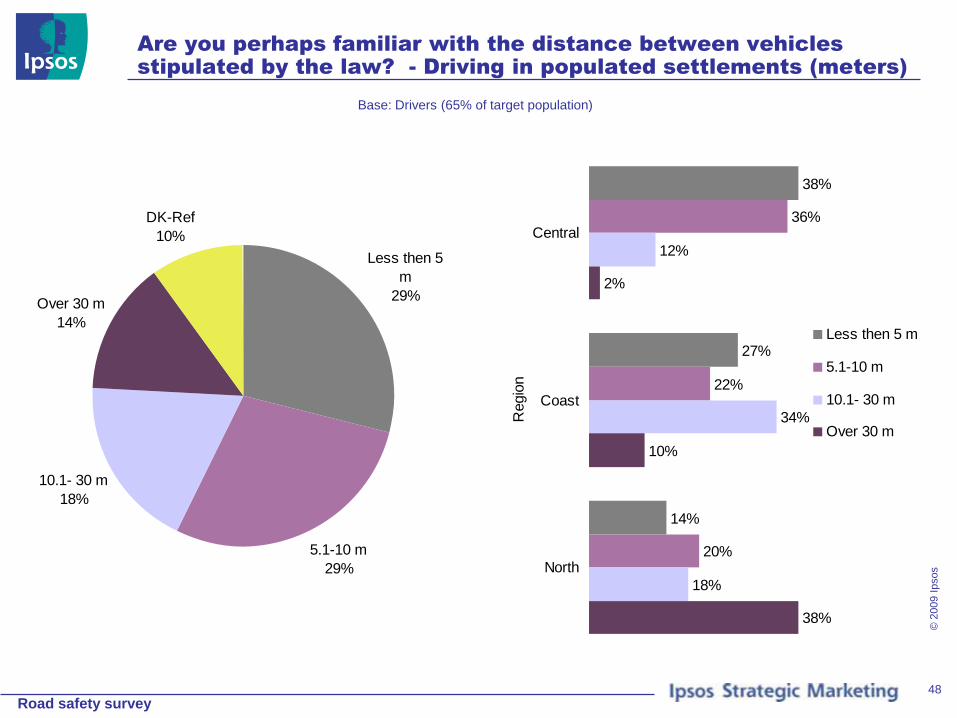
Are you perhaps familiar with the distance between vehicles
stipulated by the law? - Driving in populated settlements (meters)
Base: Drivers (65% of target population)
Less then 5
m
29%
5.1-10 m
29%
10.1- 30 m
18%
Over 30 m
14%
DK-Ref
10%
38%
27%
14%
36%
22%
20%
12%
34%
18%
2%
10%
38%
Central
Coast
North
Regio
n
Less then 5 m
5.1-10 m
10.1- 30 m
Over 30 m
Road safety survey
© 2
009 I
psos
49
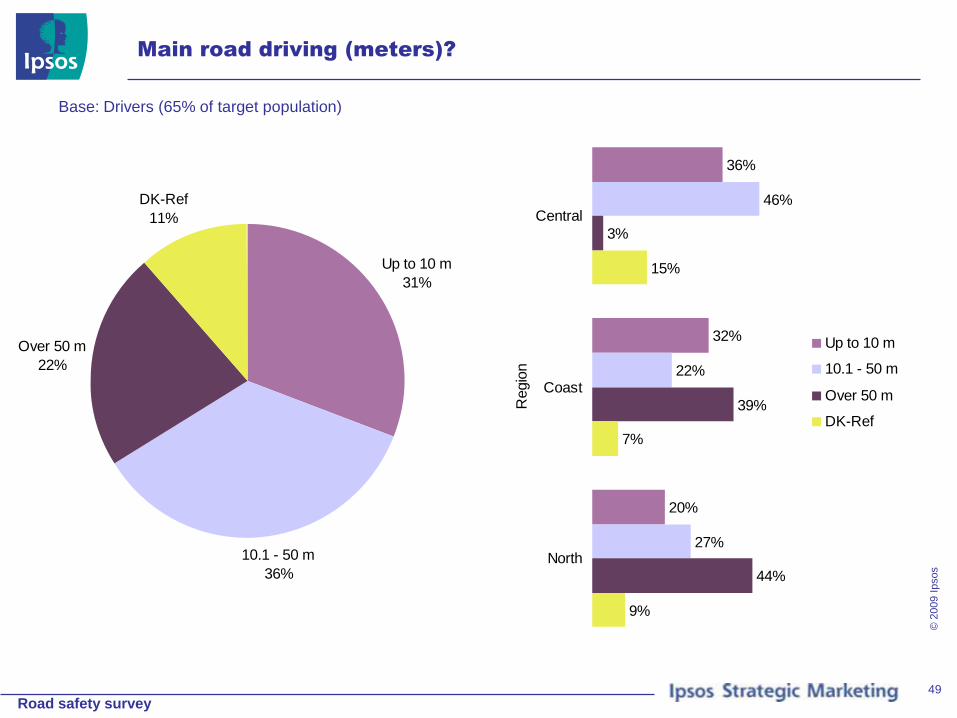
Main road driving (meters)?
Base: Drivers (65% of target population)
Up to 10 m
31%
10.1 - 50 m
36%
Over 50 m
22%
DK-Ref
11%
36%
32%
20%
46%
22%
27%
3%
39%
44%
15%
7%
9%
Central
Coast
North
Regio
n
Up to 10 m
10.1 - 50 m
Over 50 m
DK-Ref
Road safety survey
© 2
009 I
psos
50
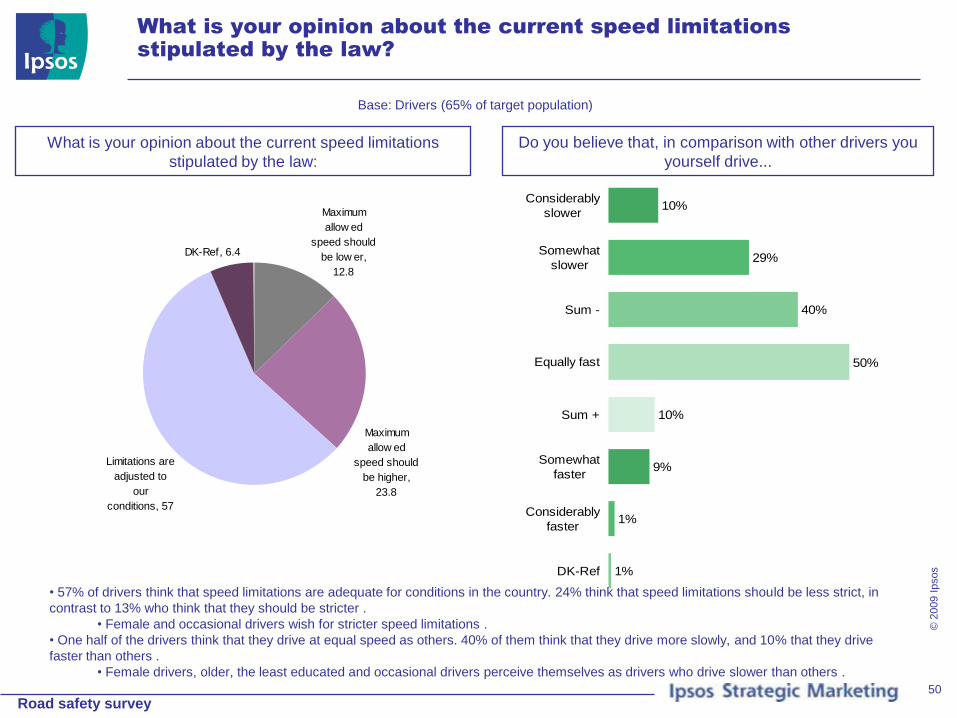
What is your opinion about the current speed limitations
stipulated by the law?
Base: Drivers (65% of target population)
DK-Ref, 6.4
Maximum
allow ed
speed should
be low er,
12.8
Maximum
allow ed
speed should
be higher,
23.8
Limitations are
adjusted to
our
conditions, 57
What is your opinion about the current speed limitations
stipulated by the law:
10%
29%
40%
50%
10%
9%
1%
1%
Considerably
slower
Somewhat
slower
Sum -
Equally fast
Sum +
Somewhat
faster
Considerably
faster
DK-Ref
Do you believe that, in comparison with other drivers you
yourself drive...
• 57% of drivers think that speed limitations are adequate for conditions in the country. 24% think that speed limitations should be less strict, in
contrast to 13% who think that they should be stricter .
• Female and occasional drivers wish for stricter speed limitations .
• One half of the drivers think that they drive at equal speed as others. 40% of them think that they drive more slowly, and 10% that they drive
faster than others .
• Female drivers, older, the least educated and occasional drivers perceive themselves as drivers who drive slower than others .

Road safety survey
© 2
009 I
psos
51
Statistical data show that it happens to almost each driver to
exceed the allowed speed occasionally. How often does it happen
to you?
Base: Drivers (65% of target population)
2%
12%
14%
47%
40%
26%
14%
Always
In majority of
cases
Sum +
Sometimes
Sum -
In small
number of
cases
Never
15%
10%
16%
14%
13%
10%
15%
8%
34%
51%
33%
31%
39%
62%
33%
56%
Male
Female
Up to 5
years ago
6 -15 years
ago
16 - 25
years ago
Over 25
years ago
Every day
Other
Sum +
Sum -
• Almost one half of the drivers (47%) admit that it occasionally happens to them to exceed speed limit. 14% admit that it
happens to them frequently, while 40% claim that it happens to them rarely or never . • According to their own confession, it happens more frequently to everyday drivers, male drivers, young and inexperienced drivers and those from northern region .
Dri
vin
g f
req
ue
nc
yG
en
de
rD
rivin
g e
xp
eri
en
ce

Road safety survey
© 2
009 I
psos
52
What is usually the reason why you exceed the speed limit?
Base: Drivers (65% of target population)
48%
13%
13%
6%
2%
5%
12%
I hurry up to reach some place
Others also exceed the speed
limit, so it is becoming danger
Too slow driving exhausts me
I have good reflexes and a lot of
experience
If one drives a good car, it is not
dangerous to drive fast
Other:
DK-Ref
56%
44%
37%
45%
55%
47%
41%
4%
14%
29%
11%
16%
15%
10%
11%
10%
19%
20%
13%
14%
5%
6%
5%
6%
5%
6%
10%
2%
2%
1%
3%
4%
1%
2%
2%
Central
Coast
North
Up to 5 years
ago
6 -15 years ago
16 - 25 years
ago
Over 25 years
ago
I hurry up to reach
some place
Others also exceed the
speed limit, so it is
becoming danger
Too slow driving
exhausts me
I have good reflexes
and a lot of experience
If one drives a good
car, it is not dangerous
to drive fast
• The main reason for exceeding the speed limit is the fact that the driver was in a hurry to arrive somewhere (48%).
• 13% of drivers, particularly the ones from rural areas and northern region express conviction that slow driving is dangerous because the others
drive at high speed.
• Another 13% state that slow driving exhausts them, and the most impatient drivers are the least experiences and those from northern region .
• 6% of drivers have unlimited confidence in their reflexes and experience, so they think that it is not dangerous to drive fast .
Reg
ion
Dri
vin
g e
xp
eri
en
ce
Road safety survey
© 2
009 I
psos
53
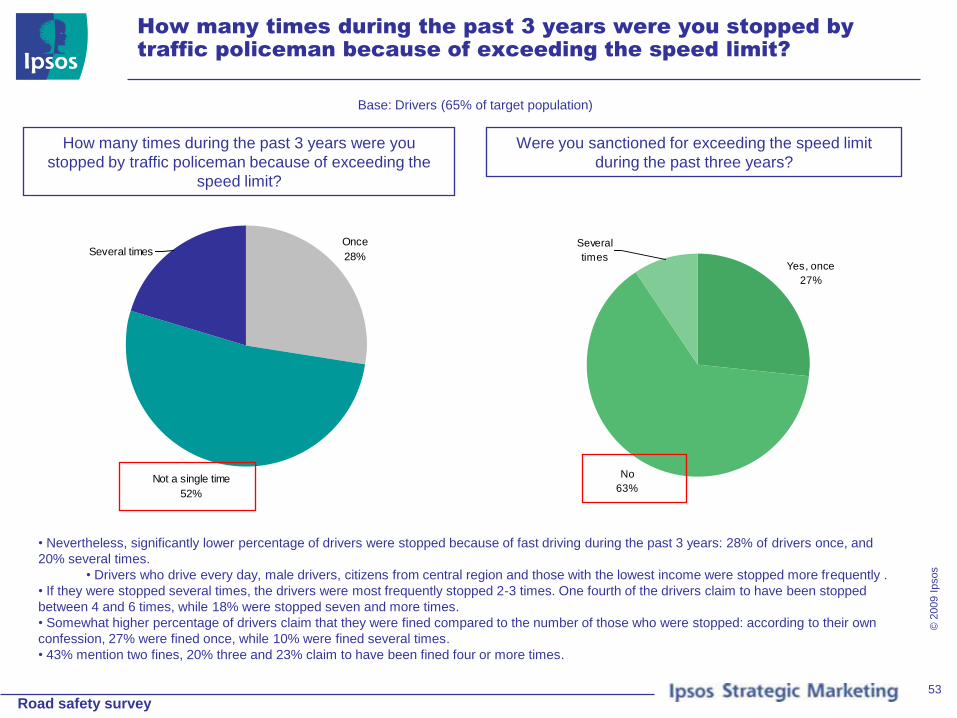
How many times during the past 3 years were you stopped by
traffic policeman because of exceeding the speed limit?
Base: Drivers (65% of target population)
Once
28%
Not a single time
52%
Several times
How many times during the past 3 years were you
stopped by traffic policeman because of exceeding the
speed limit?
Were you sanctioned for exceeding the speed limit
during the past three years?
Yes, once
27%
No
63%
Several
times
• Nevertheless, significantly lower percentage of drivers were stopped because of fast driving during the past 3 years: 28% of drivers once, and
20% several times.
• Drivers who drive every day, male drivers, citizens from central region and those with the lowest income were stopped more frequently .
• If they were stopped several times, the drivers were most frequently stopped 2-3 times. One fourth of the drivers claim to have been stopped
between 4 and 6 times, while 18% were stopped seven and more times.
• Somewhat higher percentage of drivers claim that they were fined compared to the number of those who were stopped: according to their own
confession, 27% were fined once, while 10% were fined several times.
• 43% mention two fines, 20% three and 23% claim to have been fined four or more times.

Road safety survey
© 2
009 I
psos
54
Which of the following statements best describes your attitude
towards fines for speeding?
Base: Drivers (65% of target population)
9%
20%
15%
26%
30%
1%
I want to reach my destination
as soon as possible, so it
doesn't matter if I occasionally
pay a fine
Chances for being fined are
minimal, so I am not concerned
about the fine
It is always possible to strike a
deal with traffic policeman not to
write a fine
I don't want to lose money on
fines, so I abide by speed limits
I always abide by regulations, so
there is no reason to be
concerned about the fines
DK-Ref
23%
43%
28%
46%
20%
28%
21%
27%
23%
46%
Male
Female
Central
Coast
North
Up to 5 years
ago
6 -15 years ago
16 - 25 years
ago
Every day
Other
• A total of 56% of drivers state that they abide by speed limitations, of which 30% do it regardless of
fines, while 26% are motivated by unwillingness to lose money.
• One out of five drivers do not care about fines, because they think that chances to be fined are
minimal. Another 15% think that it is always possible to make a deal with traffic policeman in order to
avoid the fine.
• 9% of drivers do not mind to pay fine occasionally, because it is the most important for them to
arrive quickly where they need to arrive .
• Citizens from rural areas and northern region evaluate that they have the smallest chance
to be caught.
• Female citizens, the oldest and the most experienced citizens, those from coastal region
and occasional drivers abide by rule in more principled way (regardless of fine) .
Abiding by regulations regardless of fines
Dri
vin
gG
en
de
rD
rivin
g e
xp
eri
en
ce
Reg
ion
Road safety survey
© 2
009 I
psos
55
OVERTAKING
Road safety survey
© 2
009 I
psos
56
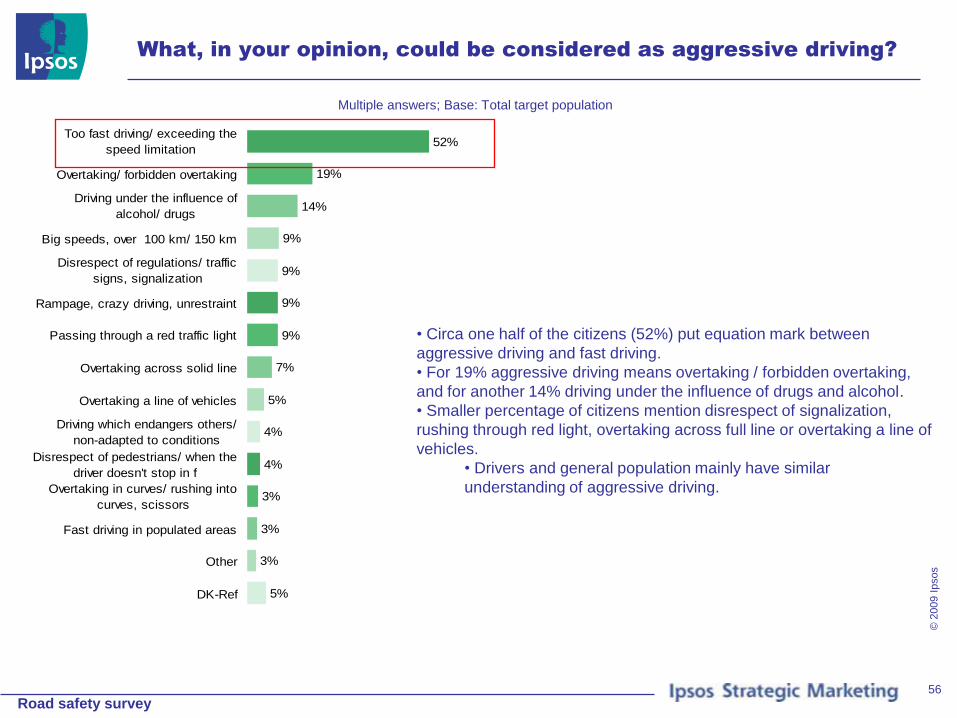
What, in your opinion, could be considered as aggressive driving?
Multiple answers; Base: Total target population
52%
19%
14%
9%
9%
9%
9%
7%
5%
4%
4%
3%
3%
3%
5%
Too fast driving/ exceeding the
speed limitation
Overtaking/ forbidden overtaking
Driving under the influence of
alcohol/ drugs
Big speeds, over 100 km/ 150 km
Disrespect of regulations/ traffic
signs, signalization
Rampage, crazy driving, unrestraint
Passing through a red traffic light
Overtaking across solid line
Overtaking a line of vehicles
Driving which endangers others/
non-adapted to conditions
Disrespect of pedestrians/ when the
driver doesn't stop in f
Overtaking in curves/ rushing into
curves, scissors
Fast driving in populated areas
Other
DK-Ref
• Circa one half of the citizens (52%) put equation mark between
aggressive driving and fast driving.
• For 19% aggressive driving means overtaking / forbidden overtaking,
and for another 14% driving under the influence of drugs and alcohol.
• Smaller percentage of citizens mention disrespect of signalization,
rushing through red light, overtaking across full line or overtaking a line of
vehicles.
• Drivers and general population mainly have similar
understanding of aggressive driving.

Road safety survey
© 2
009 I
psos
57
Are there any situations in which it is not allowed to overtake
other vehicles?
Base: Drivers (65% of target population)
Yes
95%
No
1%
DK-Ref
4%
Are there any situations in which it is not allowed to overtake
other vehicles?
94%
53%
28%
23%
19%
7%
7%
5%
4%
3%
3%
3%
2%
2%
2%
Overtaking with a solid line
Overtaking a line of vehicles
Overtaking in a tunnel
Overtaking at curves/ poor visibility
Overtaking on a bridge
Overtaking on a junction, traffic light
Overtaking in a populated area
Overtaking during bad weather
conditions/ poor visibility/ fTraffic signs for not allowed
overtaking
When road is under construction
Overtaking when road is slippery
Overtaking vehicles with escort
Overtaking when speed is limited
If someone in front has already
started to overtake
Overtaking at a railroad crossing
Which situations are these?
• 95% of drivers are aware of situations in which overtaking of other vehicles is
forbidden. 1% of drivers think that such situations do not exist, while another 4% do
not know the answer or refuse to answer.
• Majority of drivers spontaneously recall that such situation is overtaking across full
line (94%). One half of the drivers (54%) state that overtaking a line of vehicles is
forbidden.
• Less than 1/3 of the drivers recall that that it is also forbidden to overtake other
vehicles in tunnel (28%) or in curves / when the view is limited (23%) .
• Only 7% of the drivers spontaneously mention forbidden overtaking on crossroads
or pedestrian crossing, and just 2% mention forbidden overtaking in situation when
the vehicle in front blockades the started overtaking.
Road safety survey
© 2
009 I
psos
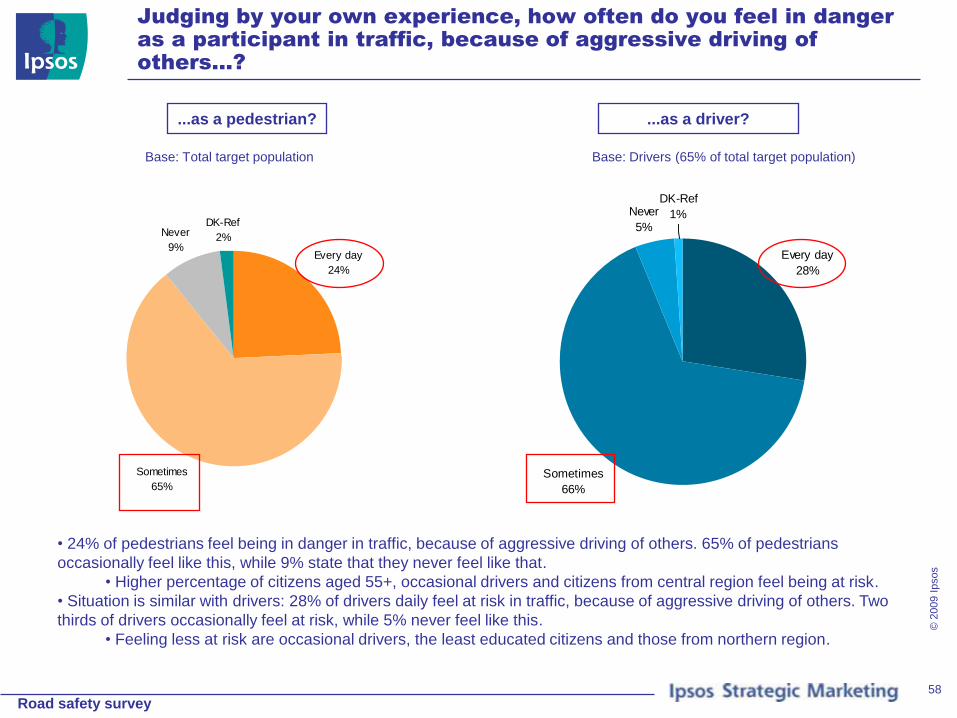
58
Judging by your own experience, how often do you feel in danger
as a participant in traffic, because of aggressive driving of
others...?
Base: Total target population
Every day
24%
Sometimes
65%
Never
9%
DK-Ref
2%
...as a pedestrian? ...as a driver?
Every day
28%
Sometimes
66%
Never
5%
DK-Ref
1%
Base: Drivers (65% of total target population)
• 24% of pedestrians feel being in danger in traffic, because of aggressive driving of others. 65% of pedestrians
occasionally feel like this, while 9% state that they never feel like that.
• Higher percentage of citizens aged 55+, occasional drivers and citizens from central region feel being at risk.
• Situation is similar with drivers: 28% of drivers daily feel at risk in traffic, because of aggressive driving of others. Two
thirds of drivers occasionally feel at risk, while 5% never feel like this.
• Feeling less at risk are occasional drivers, the least educated citizens and those from northern region.

Road safety survey
© 2
009 I
psos
59
Did it ever happen to you during the last three years that you...?
4 7 24 28 37Hardly managed
to overtake
another vehicle
Every day
Several times s week
Several times a month
Once a year
Never
9.5
9.5
56.7
57.233.3
33.7Overtake a line of
vehicles
Overtake over solid
line
Often Once Never
Base: Drivers (65% of target population)
• Majority of drivers (63%) admit that they
occasionally find themselves in situations when they
hardly manage to overtake another vehicle: 24%
confess that it often happens to them, and 28%
claim that it occasionally happens to them.
• Occasional drivers, female drivers, the
oldest and most experienced drivers and
those from rural areas and northern region
find themselves in such situation most rarely.
• Almost one half of the drivers (44%) admit that,
during the past 3 years, they happened to overtake
a line of vehicles: 34% - once, and 10% - frequently.
• The least experienced drivers as well as
those from northern region do it the most
frequently according to their own admission. It
happens the least frequently to female drivers
and the oldest ones.
• 43% of drivers admit to have overtaken other
vehicles across full line during the past 3 years: one
third state that this has happened only once, while
10% admit that it happens frequently.
• Male drivers overtake other vehicles over
full line more frequently, while female and
older drivers are the most careful in this
sense .
Road safety survey
© 2
009 I
psos
60
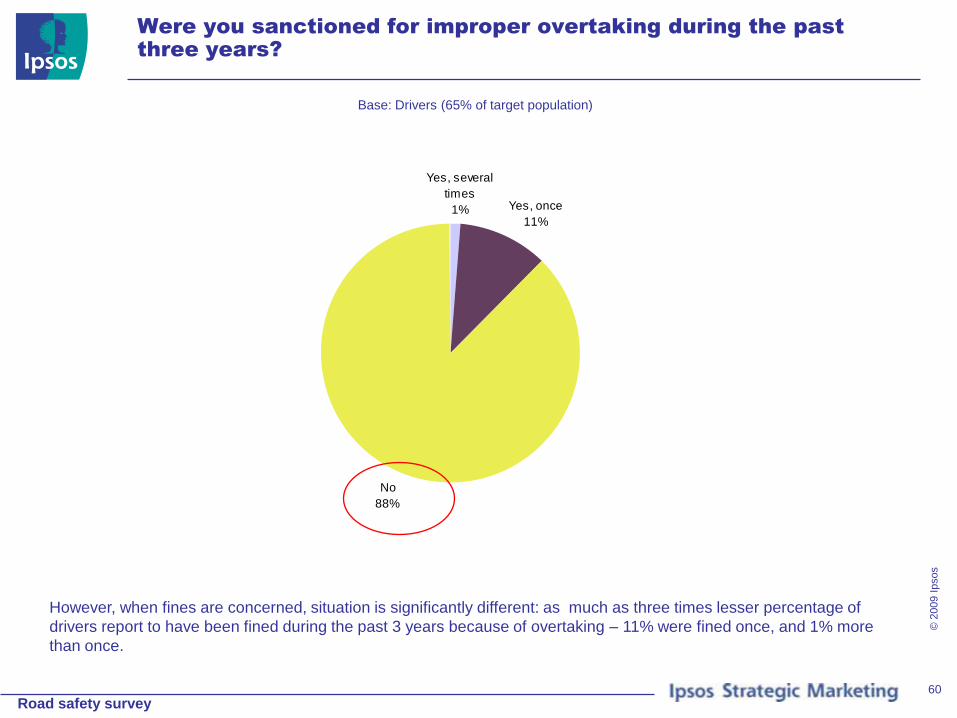
Were you sanctioned for improper overtaking during the past
three years?
Base: Drivers (65% of target population)
Yes, several
times
1% Yes, once
11%
No
88%
However, when fines are concerned, situation is significantly different: as much as three times lesser percentage of
drivers report to have been fined during the past 3 years because of overtaking – 11% were fined once, and 1% more
than once.
Road safety survey
© 2
009 I
psos
61
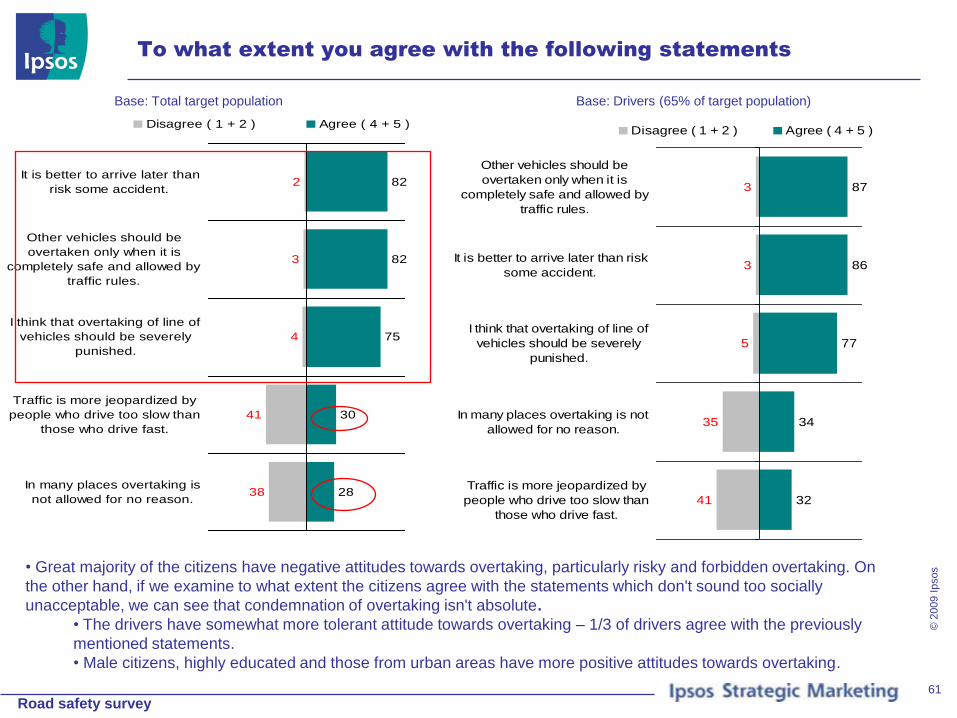
To what extent you agree with the following statements
Base: Total target population
38
41
4
3
2
28
30
75
82
82
In many places overtaking is
not allowed for no reason.
Traffic is more jeopardized by
people who drive too slow than
those who drive fast.
I think that overtaking of line of
vehicles should be severely
punished.
Other vehicles should be
overtaken only when it is
completely safe and allowed by
traffic rules.
It is better to arrive later than
risk some accident.
Disagree ( 1 + 2 ) Agree ( 4 + 5 )
41
35
5
3
3
32
34
77
86
87
Traffic is more jeopardized by
people who drive too slow than
those who drive fast.
In many places overtaking is not
allowed for no reason.
I think that overtaking of line of
vehicles should be severely
punished.
It is better to arrive later than risk
some accident.
Other vehicles should be
overtaken only when it is
completely safe and allowed by
traffic rules.
Disagree ( 1 + 2 ) Agree ( 4 + 5 )
Base: Drivers (65% of target population)
• Great majority of the citizens have negative attitudes towards overtaking, particularly risky and forbidden overtaking. On
the other hand, if we examine to what extent the citizens agree with the statements which don't sound too socially
unacceptable, we can see that condemnation of overtaking isn't absolute.
• The drivers have somewhat more tolerant attitude towards overtaking – 1/3 of drivers agree with the previously
mentioned statements.
• Male citizens, highly educated and those from urban areas have more positive attitudes towards overtaking.

Road safety survey
© 2
009 I
psos
62
DRIVING UNDER THE INFLUENCE PF
ALCOHOLIC DRINKS

Road safety survey
© 2
009 I
psos
63
In different countries there are different legal limits for the
allowable concentration of alcohol in the blood of the driver. Do
you might know what is the legal limits stipulated in our country?
Base: Total target population
24.9
41.7
13.8
19.5
26
48
13
13
0 20 40 60
Less then
0.5
0.5
Over 0.5
DK-Ref
Total Drivers
• 41% of general population thinks that legally allowed concentration of alcohol in blood (blood alcohol content) is 0.5
per mill. 25% of it thinks that allowed concentration is lower, and 13% that it is higher.
• Drivers are better informed about this issue – total of 48% is correctly informed about the allowed concentration
• Better informed are also men, young (18 to 30 years of age) and population of rural areas .
• Majority of citizens think that it is safe to drink one bottle a beer (42%) or one glass of spirit (48%) the most.
• Men, as well as drivers on daily bases think more frequent it is safe to drink more than that.
• It is worth noticing that also every fifth driver does not know what the legal constriction actually present.
7.1
35.6
19
14.7
23.7
6.8
37.5
16.9
15.4
23.4
0 10 20 30 40
Less
then 1
1
1.1-2.5
Over 2.5
DK-Ref
Spirits (glasses)
Beer (0.5l)
That means that it is safe to drink....

Road safety survey
© 2
009 I
psos
64
To what extent, in your opinion, is driving under the influence of
alcohol a serious risk to road traffic safety?
Base: Total target population
0%
2%
2%
5%
92%
14%
78%
1%
It is no risk at all
2
Sum -
3
Sum +
4
It�s a great risk
DK-Ref
41%
24%
17%
17%
10%
9%
8%
6%
5%
5%
5%
5%
3%
2%
3%
6%
Causing accident/ car crash
Drowsiness, decrease of concentration,
slow reflexes
Fast driving/ exceeding speed limitations
Putting own life and life of others in
danger/ lethal outcomJeopardizing safety of all participants in
trafficUncontrolled driving/ inability to control
the vehicle
Negligence/ careless driving
Rushing out of road (blows, fall into the
abyss...)
Causing material damage
Aggression, mental incompetence,
changed consciousness
Causing injuries/ severe injuries
Inability to estimate/ poor attention
Accidents with pedestrians/ endangering
pedestrians
Disrespect of regulations
Other
DK-Ref
The main dangers are:
•92% of general population thinks that driving under the influence of alcohol
is a serious risk to road traffic safety. Only 2% thinks that it is not much of a
risk.
•Men, as well as those with the lowest level of education, population
of urban areas and population of northern areas have somewhat
more tolerant attitude towards driving under the influence of alcohol.
•There are no significant differences between attitudes towards
alcohol of drivers and non-drivers.
•As major dangers of driving under the influence of alcohol mentioned are
general ones, while As major dangers of driving under the influence of
alcohol mentioned are general ones.

Road safety survey
© 2
009 I
psos
65
In general, to what extent do people abstain from alcohol
consumption while driving?
Base: Total target population
Almost no one
does
8%
Very few
people do
46%
Majority of
people do
42%
DK-Ref
4%
• Citizens’ opinions about the extent to which people abstain
from drinking while driving are opposite: while 46% thinks
that very few people abstain, 42% believes that majority of
them do.
• Particularly skeptical towards this issue are non-
drivers, women, older citizens, as well as those with
the lowest income and population of the central part
of the country.
• Drivers’ attitude is in line with the attitude of general
population.
45%
39%
36%
45%
43%
43%
32%
43%
42%
31%
53%
51%
45%
36%
Male
Female
18 - 29
30 - 44
45 - 54
55+
Up to 100 eur
100.01-200 eur
Over 200 eur
Central
Coast
North
Drivers
Non-drivers
Majority of people:
Dri
vin
gG
en
de
rIn
co
me
Ag
eR
eg
ion
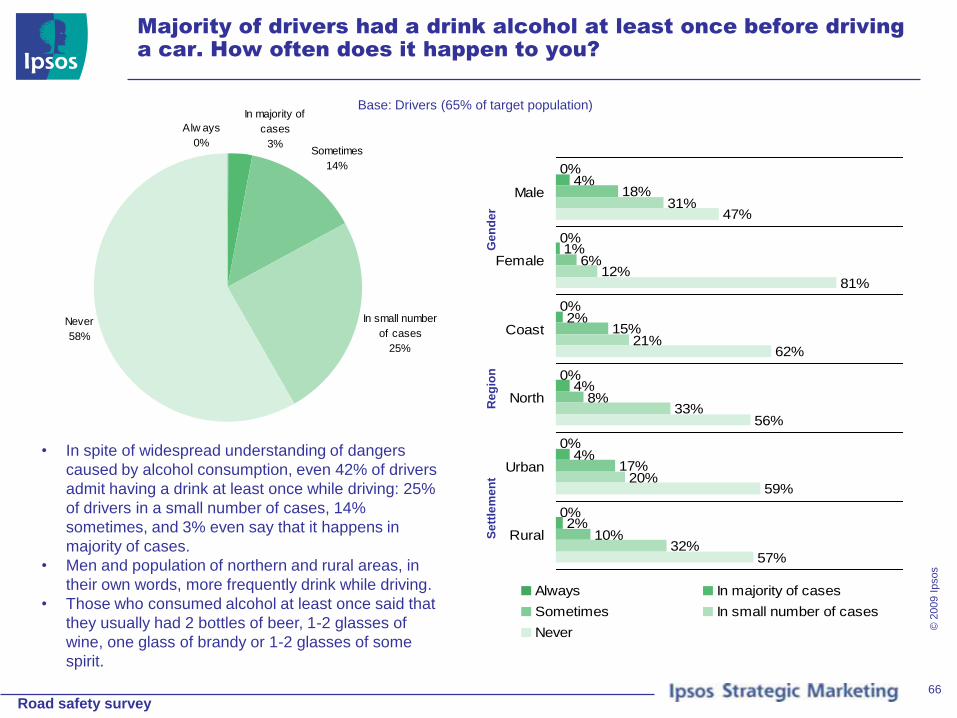
Road safety survey
© 2
009 I
psos
66
Majority of drivers had a drink alcohol at least once before driving
a car. How often does it happen to you?
Base: Drivers (65% of target population)
0%
0%
0%
0%
0%
0%
4%
1%
2%
4%
4%
2%
18%
6%
15%
8%
17%
10%
31%
12%
21%
33%
20%
32%
47%
81%
62%
56%
59%
57%
Male
Female
Coast
North
Urban
Rural
Always In majority of cases
Sometimes In small number of cases
Never
• In spite of widespread understanding of dangers
caused by alcohol consumption, even 42% of drivers
admit having a drink at least once while driving: 25%
of drivers in a small number of cases, 14%
sometimes, and 3% even say that it happens in
majority of cases.
• Men and population of northern and rural areas, in
their own words, more frequently drink while driving.
• Those who consumed alcohol at least once said that
they usually had 2 bottles of beer, 1-2 glasses of
wine, one glass of brandy or 1-2 glasses of some
spirit.
Sometimes
14%
In small number
of cases
25%
Never
58%
Alw ays
0%
In majority of
cases
3%
Ge
nd
er
Reg
ion
Se
ttle
me
nt
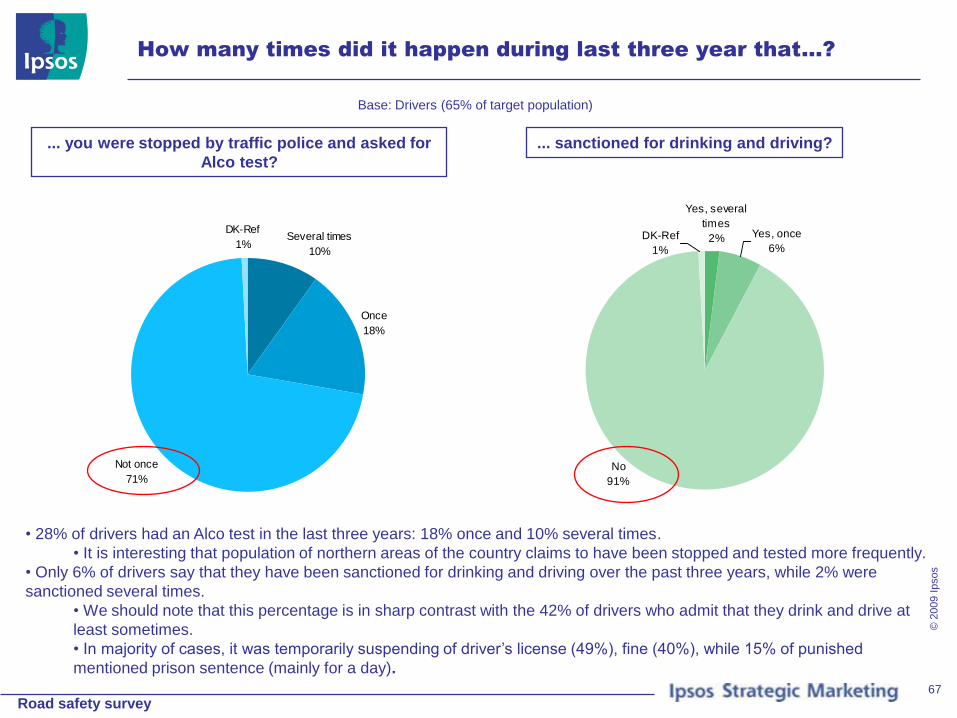
Road safety survey
© 2
009 I
psos
67
How many times did it happen during last three year that...?
Base: Drivers (65% of target population)
Several times
10%
Once
18%
Not once
71%
DK-Ref
1%
... you were stopped by traffic police and asked for
Alco test?
... sanctioned for drinking and driving?
Yes, several
times
2%DK-Ref
1%
Yes, once
6%
No
91%
• 28% of drivers had an Alco test in the last three years: 18% once and 10% several times.
• It is interesting that population of northern areas of the country claims to have been stopped and tested more frequently.
• Only 6% of drivers say that they have been sanctioned for drinking and driving over the past three years, while 2% were
sanctioned several times.
• We should note that this percentage is in sharp contrast with the 42% of drivers who admit that they drink and drive at
least sometimes.
• In majority of cases, it was temporarily suspending of driver’s license (49%), fine (40%), while 15% of punished
mentioned prison sentence (mainly for a day).
Road safety survey
© 2
009 I
psos
68
ATTITUDE TOWARDS PEDESTRIANS

Road safety survey
© 2
009 I
psos
69
How frequently you personally practice each of the following…?
Base: Total target population
57
39
42
33
18
28
33
33
...crossing the streets on a
pedestrian crossing when the
red light is on for pedestrians?
...running across the street
when you are in a hurry, out of
a pedestrian crossing?
...using mobile phone while
crossing the street?
... crossing the street out of a
pedestrian crossing?
does not practice ( 1 + 2 ) practice ( 4 + 5 )
• One third of citizens admit that they frequently or relatively frequently cross the street out of a pedestrian crossing, as well as
that they use mobile phone while crossing the street.
• Among pedestrians with the lowest level of education, as well as among residents of northern areas of the country, this
type of conduct is generally more widespread, while things are opposite among the oldest pedestrians, highly educated, as
well as among residents of the central areas and the coastal area.
• Drivers and non-drivers behave in a similar way when they participate in traffic as pedestrians.

Road safety survey
© 2
009 I
psos
70
Attitudes towards pedestrians
Base: Total target population
4.8
94.7
0.5
5
94
1
0 20 40 60 80 100
Car or other
vehicle
Pedestrian
DK-Ref
Total Drivers
0.7
13
86
1
85.9
13.4
0 20 40 60 80 100
Drivers shouldn’t take care
of pedestrians, but they
themselves should do it
Drivers have to pay attention
to pedestrians, even w hen
they cross the street out of
a pedestrian crossing.
DK-Ref
Drivers
Total
Which of the following statements describes best your attitude
towards moving of pedestrians
Who should have the priority of moving on a pedestrian
crossing:
• 94% of citizens think that pedestrians have the priority of moving on a pedestrian crossing, while 5% think that a car or other
vehicle have the priority.
• Drivers and non-drivers agree on this.
• 86% of citizens think that drivers have to pay attention to pedestrians, even when they cross the street out of a pedestrian
crossing, while 13% think that pedestrians should take care of themselves.
•Majority of drivers think that pedestrians are primarily their responsibility. Somewhat smaller number of the youngest
drivers shares this opinion (under 30 years of age).

Road safety survey
© 2
009 I
psos
71
When you are in traffic as a pedestrian, how often do drivers stop
to let you cross the street on a pedestrian crossing when there
are no traffic lights in the vicinity?
5%
46%
51%
48%
40%
8%
1%
Never
More frequently
they don`t than
they do stop
Sum -
Sum +
More frequently
they stop than
they don`t stop
They always
stop
DK-Ref
Pedestrians:Drivers
1%
13%
15%
83%
40%
43%
3%
Never
More frequently
I don`t than I do
stop
Sum -
Sum +
More frequently
I stop than I
don`t stop
I always stop
Missing
• 83% of drivers say that they generally stop to let pedestrians cross the street on a pedestrian crossing.
• O Drivers who drive every day, men, young, drivers with the lowest level of education, as well as residents of
rural and northern areas take less care of pedestrians.
• From pedestrians’ point of view, however, behavior of drivers seems a lot different: 51% of citizens say that drivers
don’t stop to let them pass on a pedestrian crossing without a traffic light in the vicinity more frequently than they do,
while 48% say that they still rather let them pass than they don’t.

Road safety survey
© 2
009 I
psos
72
Do you regularly ride bicycle?
Base: v
Yes
13%
No
83%
DK-Ref
4%
79%
78%
29%
16%
9%
61%
5%
13%
10%
Wear helmet
Passanger
wears helmet
Drive on the right
side of the road
No Yes DK/Ref
• 13% of population rides a bicycle regularly, largely young and residents of coastal area.
• In their own words:
• Only 16% of bicyclists regularly wear a helmet.
• In 9% also passenger wears a helmet.
• 61% of bicyclists always ride on the right side of the road.
When riding a bicycle, do you:
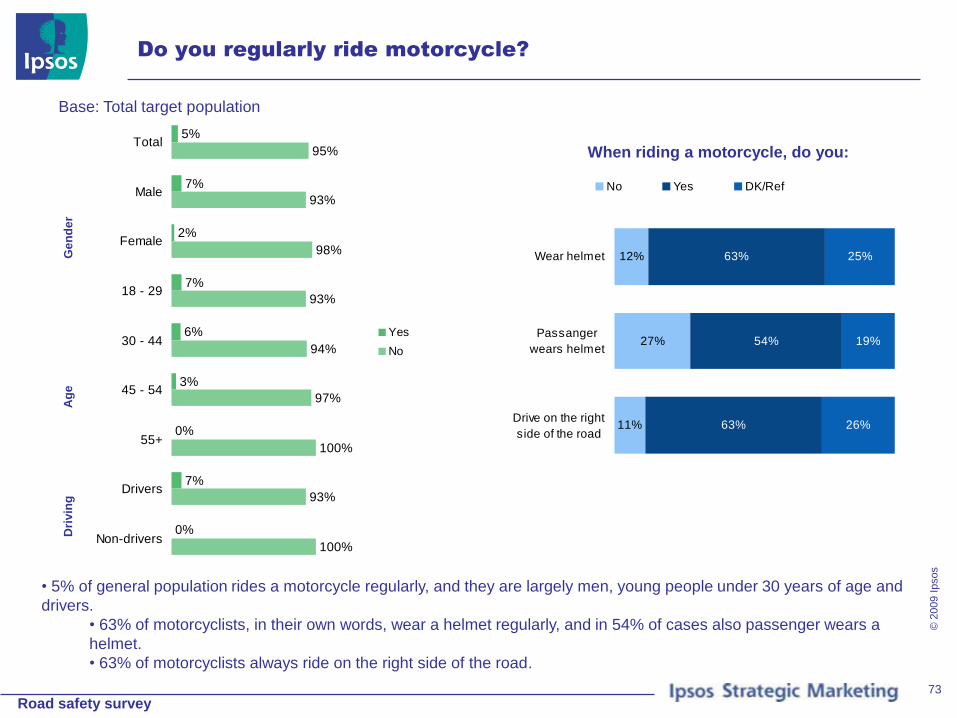
Road safety survey
© 2
009 I
psos
73
Do you regularly ride motorcycle?
12%
27%
11%
63%
54%
63%
25%
19%
26%
Wear helmet
Passanger
wears helmet
Drive on the right
side of the road
No Yes DK/Ref
Base: Total target population
• 5% of general population rides a motorcycle regularly, and they are largely men, young people under 30 years of age and
drivers.
• 63% of motorcyclists, in their own words, wear a helmet regularly, and in 54% of cases also passenger wears a
helmet.
• 63% of motorcyclists always ride on the right side of the road.
5%
7%
2%
7%
6%
3%
0%
7%
0%
95%
93%
98%
93%
94%
97%
100%
93%
100%
Total
Male
Female
18 - 29
30 - 44
45 - 54
55+
Drivers
Non-drivers
Yes
No
Ge
nd
er
Ag
eD
rivin
g
When riding a motorcycle, do you:

Road safety survey
© 2
009 I
psos
74
PASSING THROUGH A RED TRAFFIC LIGHT
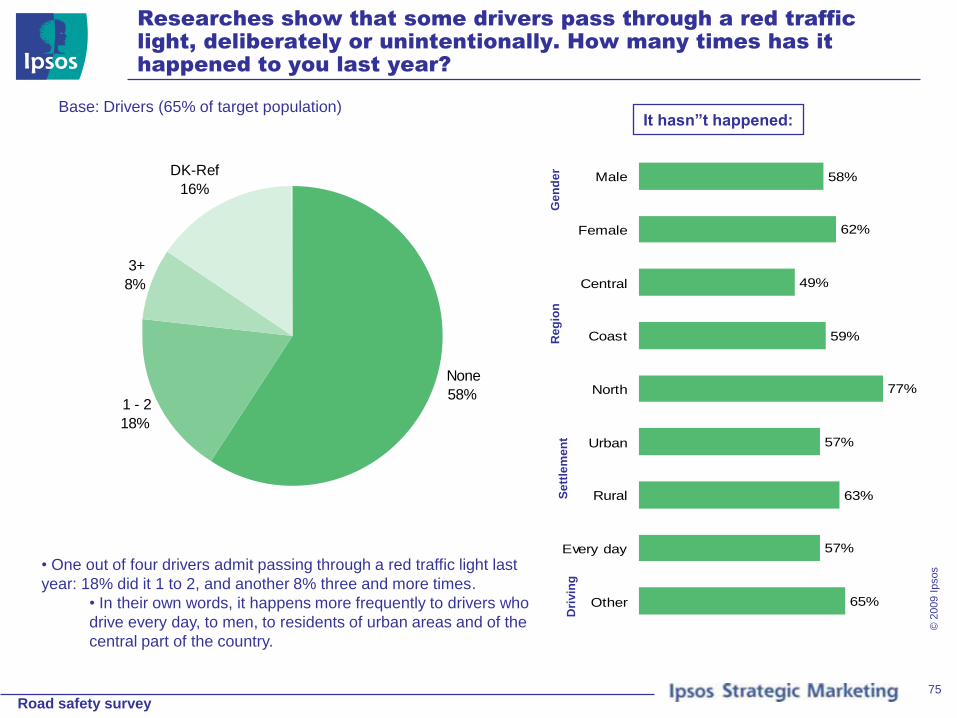
Road safety survey
© 2
009 I
psos
75
Researches show that some drivers pass through a red traffic
light, deliberately or unintentionally. How many times has it
happened to you last year?
Base: Drivers (65% of target population)
None
58% 1 - 2
18%
3+
8%
DK-Ref
16%58%
62%
49%
59%
77%
57%
63%
57%
65%
Male
Female
Central
Coast
North
Urban
Rural
Every day
Other
• One out of four drivers admit passing through a red traffic light last
year: 18% did it 1 to 2, and another 8% three and more times.
• In their own words, it happens more frequently to drivers who
drive every day, to men, to residents of urban areas and of the
central part of the country.
It hasn”t happened:
Ge
nd
er
Reg
ion
Dri
vin
gS
ett
lem
en
t
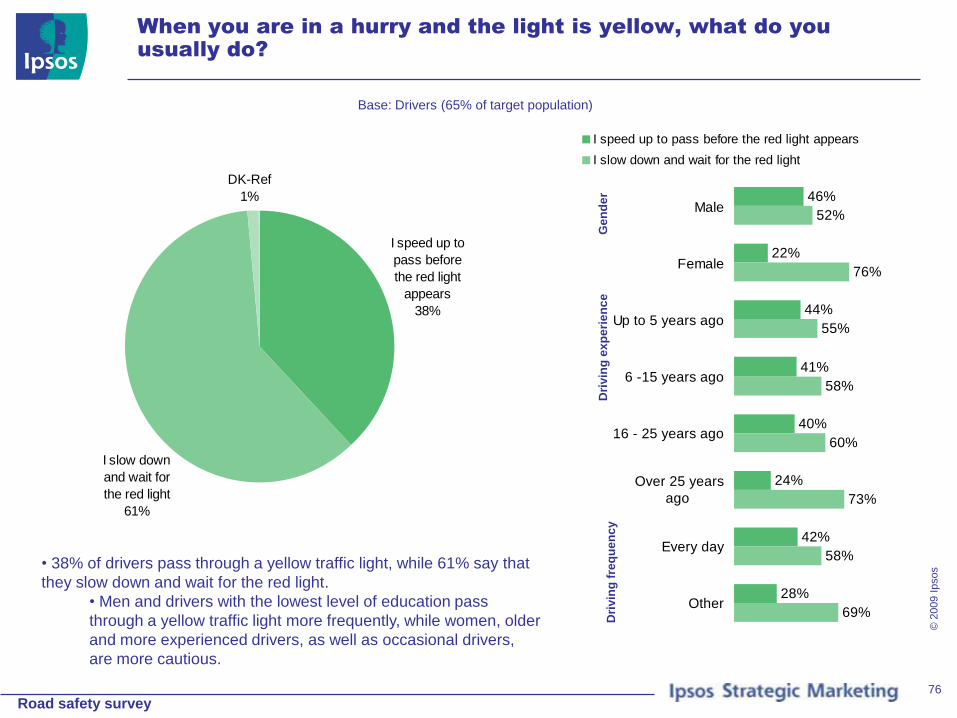
Road safety survey
© 2
009 I
psos
76
When you are in a hurry and the light is yellow, what do you
usually do?
Base: Drivers (65% of target population)
I speed up to
pass before
the red light
appears
38%
DK-Ref
1%
I slow down
and wait for
the red light
61%
46%
22%
44%
41%
40%
24%
42%
28%
52%
76%
55%
58%
60%
73%
58%
69%
Male
Female
Up to 5 years ago
6 -15 years ago
16 - 25 years ago
Over 25 years
ago
Every day
Other
I speed up to pass before the red light appears
I slow down and wait for the red light
• 38% of drivers pass through a yellow traffic light, while 61% say that
they slow down and wait for the red light.
• Men and drivers with the lowest level of education pass
through a yellow traffic light more frequently, while women, older
and more experienced drivers, as well as occasional drivers,
are more cautious.
Ge
nd
er
Dri
vin
g e
xp
eri
en
ce
Dri
vin
g f
req
ue
nc
y
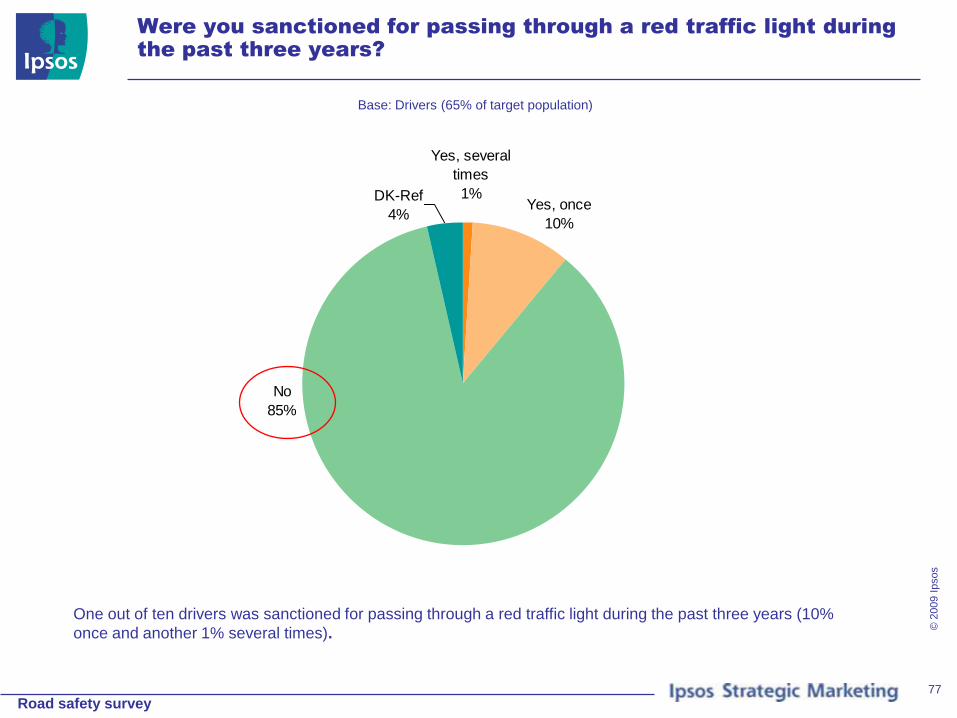
Road safety survey
© 2
009 I
psos
77
Were you sanctioned for passing through a red traffic light during
the past three years?
Base: Drivers (65% of target population)
Yes, once
10%
Yes, several
times
1%DK-Ref
4%
No
85%
One out of ten drivers was sanctioned for passing through a red traffic light during the past three years (10%
once and another 1% several times).

Road safety survey
© 2
009 I
psos
78
EFFECT OF SANCTIONS ON ATTITUDES AND
BEHAVIOR DURING DRIVING

Road safety survey
© 2
009 I
psos
79
Observed in general, do you think that sanctioned for traffic
violations are:
Base: Total target population
19%
17%
21%
35%
33%
38%
29%
30%
26%
17%
18%
14%
Total
Drivers
Non-drivers
Almost everyone whocommits violation
Great majority ofviolators
Less than a half ofviolators
Only some whocommit violations
• Citizens have different opinions about the
number of sanctioned traffic violators: 19%
think that almost each of them is sanctioned,
and another 34% that majority is sanctioned.
Others think that only some or less than one
half are sanctioned.
• Likelihood of being sanctioned is
evaluated similarly by drivers as well,
while the least educated drivers
evaluate it as somewhat bigger, as well
as residents of coastal area do.

Road safety survey
© 2
009 I
psos
80
In your opinion, why do some violations stay unsanctioned?
Base: Total target population
37%
18%
7%
4%
2%
2%
2%
1%
1%
26%
Connections, acquaintances, favoritism
Giving bribes
Small number of policemen/ they can
not control everything/
Carelessness of Police/ unscrupulous
work
Agreements with Police
Lenience of Police
Small traffic offenses can result in just
warning
The rich/ functionaries/ their children are
privileged
Other
DK-Ref
First spontaneous answer
47%
27%
7%
5%
4%
3%
3%
2%
2%
26%
Connections, acquaintances,
favoritism
Giving bribes
Small number of policemen/ they
can not control everything/
Carelessness of Police/
unscrupulous work
Lenience of Police
Agreements with Police
Small traffic offenses can result
in just warning
The rich/ functionaries/ their
children are privileged
Other
DK-Ref
All spontaneous answers
•The first reason that citizens spontaneously associate with absence of sanctions is corruption: connections, acquaintances
(37%) and bribing (18%).
•When all spontaneously listed reasons for absence of sanctions are taken into account, corruption is again the first:
connections, acquaintances (47%), bribing (27%).
•Small number of citizens think that the number of policemen is too small or that they are not doing their job well,
and they are mainly drivers, men and residents of rural areas.
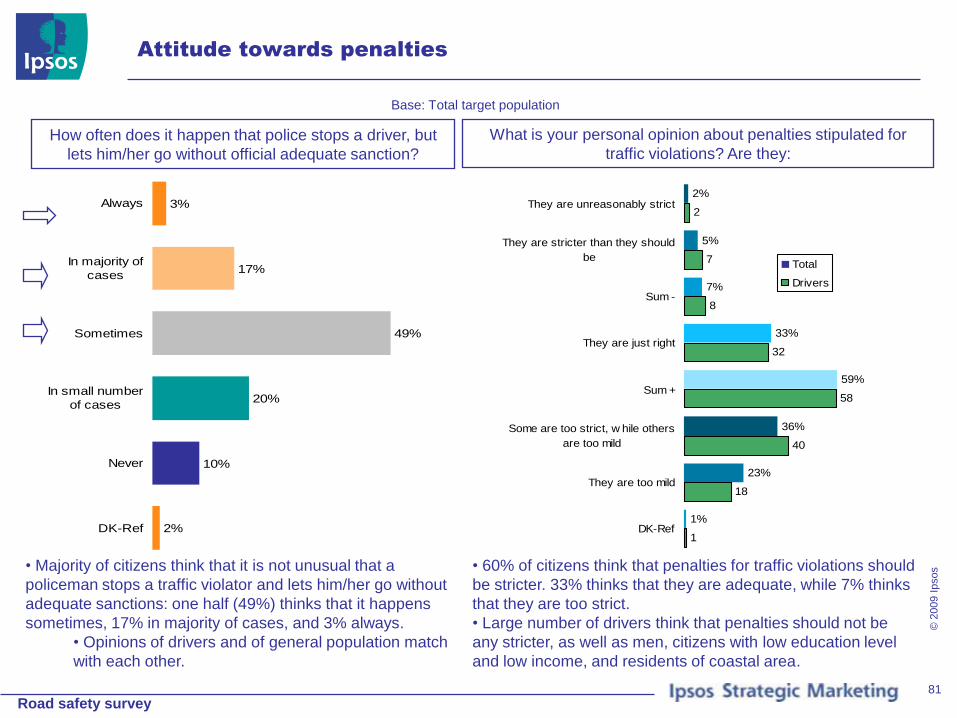
Road safety survey
© 2
009 I
psos
81
Attitude towards penalties
Base: Total target population
3%
17%
49%
20%
10%
2%
Always
In majority of
cases
Sometimes
In small number
of cases
Never
DK-Ref
How often does it happen that police stops a driver, but
lets him/her go without official adequate sanction?
• Majority of citizens think that it is not unusual that a
policeman stops a traffic violator and lets him/her go without
adequate sanctions: one half (49%) thinks that it happens
sometimes, 17% in majority of cases, and 3% always.
• Opinions of drivers and of general population match
with each other.
2%
5%
7%
33%
59%
36%
23%
1%
2
7
8
32
58
40
18
1
They are unreasonably strict
They are stricter than they should
be
Sum -
They are just right
Sum +
Some are too strict, w hile others
are too mild
They are too mild
DK-Ref
Total
Drivers
What is your personal opinion about penalties stipulated for
traffic violations? Are they:
• 60% of citizens think that penalties for traffic violations should
be stricter. 33% thinks that they are adequate, while 7% thinks
that they are too strict.
• Large number of drivers think that penalties should not be
any stricter, as well as men, citizens with low education level
and low income, and residents of coastal area.
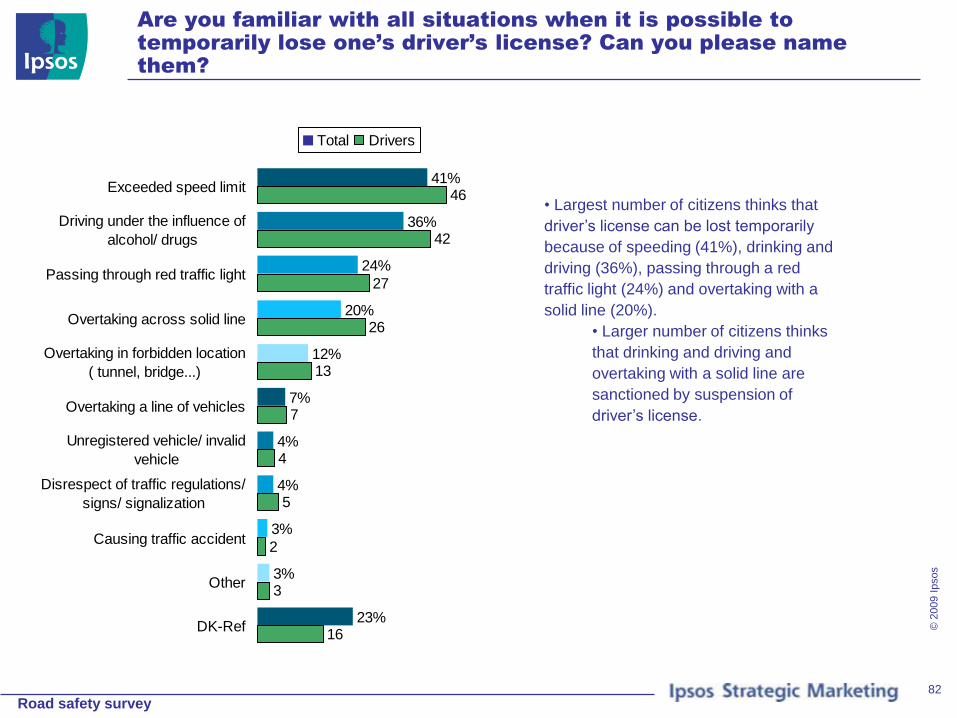
Road safety survey
© 2
009 I
psos
82
Are you familiar with all situations when it is possible to
temporarily lose one’s driver’s license? Can you please name
them?
41%
36%
24%
20%
12%
7%
4%
4%
3%
3%
23%
46
42
27
26
13
7
4
5
2
3
16
Exceeded speed limit
Driving under the influence of
alcohol/ drugs
Passing through red traffic light
Overtaking across solid line
Overtaking in forbidden location
( tunnel, bridge...)
Overtaking a line of vehicles
Unregistered vehicle/ invalid
vehicle
Disrespect of traffic regulations/
signs/ signalization
Causing traffic accident
Other
DK-Ref
Total Drivers
• Largest number of citizens thinks that
driver’s license can be lost temporarily
because of speeding (41%), drinking and
driving (36%), passing through a red
traffic light (24%) and overtaking with a
solid line (20%).
• Larger number of citizens thinks
that drinking and driving and
overtaking with a solid line are
sanctioned by suspension of
driver’s license.
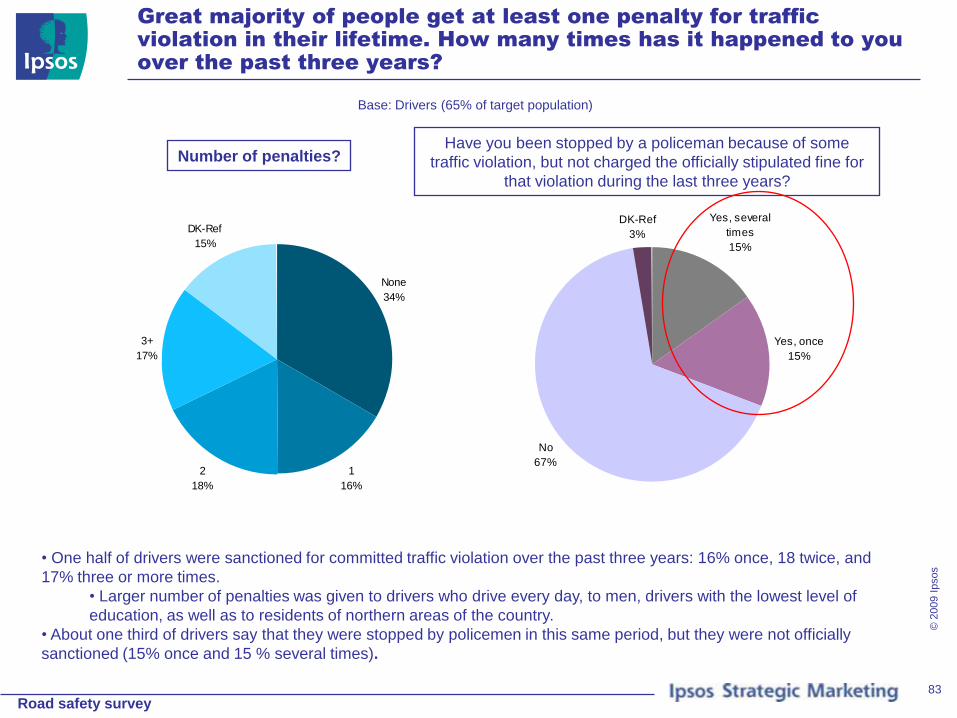
Road safety survey
© 2
009 I
psos
83
Great majority of people get at least one penalty for traffic
violation in their lifetime. How many times has it happened to you
over the past three years?
Base: Drivers (65% of target population)
None
34%
1
16%
2
18%
3+
17%
DK-Ref
15%
Number of penalties?
Yes, several
times
15%
Yes, once
15%
No
67%
DK-Ref
3%
Have you been stopped by a policeman because of some
traffic violation, but not charged the officially stipulated fine for
that violation during the last three years?
• One half of drivers were sanctioned for committed traffic violation over the past three years: 16% once, 18 twice, and
17% three or more times.
• Larger number of penalties was given to drivers who drive every day, to men, drivers with the lowest level of
education, as well as to residents of northern areas of the country.
• About one third of drivers say that they were stopped by policemen in this same period, but they were not officially
sanctioned (15% once and 15 % several times).

Road safety survey
© 2
009 I
psos
84
COMMUNICATION CHANNELS

Road safety survey
© 2
009 I
psos
85
What are your sources of information about road traffic safety?
Multiple answers; Base: Total target population
82%
42%
29%
20%
15%
14%
9%
3%
2%
TV
Newspapers
and magazines
Friends/relatives
Radio
Laws and
regulations
Internet
Billboards and
posters
Brochures,
leaflets
DK-Ref
Sources of information
62%
9%
8%
7%
5%
3%
1%
1%
5%
TV
Laws and
regulations
Friends/relatives
Newspapers
and magazines
Internet
Radio
Billboards and
posters
Brochures,
leaflets
DK-Ref
The most important source
• The main source of information about road traffic safety is television (82%). Citizens also get informed by means of
printed media (42%), as well as from friends or relatives (29%).
• Drivers use same sources of information as general population does.
• Printed media are used less by women, by the least educated and by residents of coastal area. Internet is mainly
used by young people, by highly educated and by citizens with high income.
•Televizija je takođe ocenjena kao
najznačajniji izvor informacija o
bezbednosti u saobraćaju (62%).
•Samo 9% građana kao najvažniji
izvor navodi zakone i propise. U
manjim procentima navode se i rođaci
i prijatelji, štampani mediji i internet.
•Zanimljivo je da su zakoni i propisi
ocenjeni kao najznačajniji izvor od
nešto većeg broja povemenih, a
manjeg broja vozača koji
svakodnevno voze.
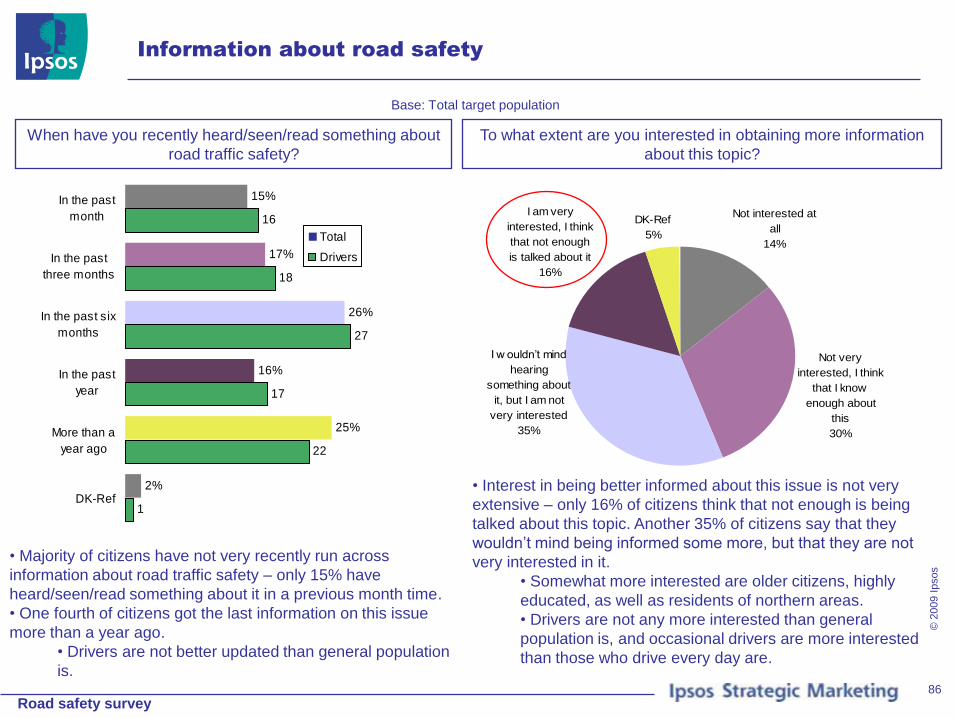
Road safety survey
© 2
009 I
psos
86
Information about road safety
Base: Total target population
15%
17%
26%
16%
25%
2%
16
18
27
17
22
1
In the past
month
In the past
three months
In the past six
months
In the past
year
More than a
year ago
DK-Ref
Total
Drivers
When have you recently heard/seen/read something about
road traffic safety?
• Majority of citizens have not very recently run across
information about road traffic safety – only 15% have
heard/seen/read something about it in a previous month time.
• One fourth of citizens got the last information on this issue
more than a year ago.
• Drivers are not better updated than general population
is.
To what extent are you interested in obtaining more information
about this topic?
Not interested at
all
14%
Not very
interested, I think
that I know
enough about
this
30%
I am very
interested, I think
that not enough
is talked about it
16%
DK-Ref
5%
I w ouldn’t mind
hearing
something about
it, but I am not
very interested
35%
• Interest in being better informed about this issue is not very
extensive – only 16% of citizens think that not enough is being
talked about this topic. Another 35% of citizens say that they
wouldn’t mind being informed some more, but that they are not
very interested in it.
• Somewhat more interested are older citizens, highly
educated, as well as residents of northern areas.
• Drivers are not any more interested than general
population is, and occasional drivers are more interested
than those who drive every day are.

Road safety survey
© 2
009 I
psos
87
TRAFFIC ACCIDENTS
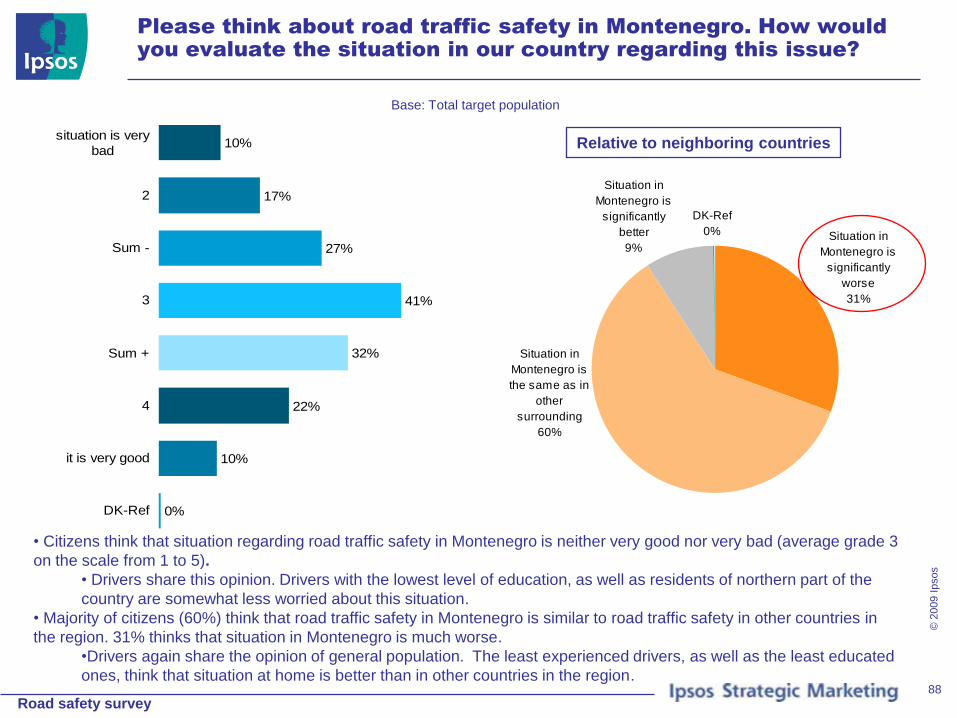
Road safety survey
© 2
009 I
psos
88
Please think about road traffic safety in Montenegro. How would
you evaluate the situation in our country regarding this issue?
Base: Total target population
10%
17%
27%
41%
32%
22%
10%
0%
situation is very
bad
2
Sum -
3
Sum +
4
it is very good
DK-Ref
Situation in
Montenegro is
significantly
worse
31%
DK-Ref
0%
Situation in
Montenegro is
significantly
better
9%
Situation in
Montenegro is
the same as in
other
surrounding
60%
Relative to neighboring countries
• Citizens think that situation regarding road traffic safety in Montenegro is neither very good nor very bad (average grade 3
on the scale from 1 to 5).
• Drivers share this opinion. Drivers with the lowest level of education, as well as residents of northern part of the
country are somewhat less worried about this situation.
• Majority of citizens (60%) think that road traffic safety in Montenegro is similar to road traffic safety in other countries in
the region. 31% thinks that situation in Montenegro is much worse.
•Drivers again share the opinion of general population. The least experienced drivers, as well as the least educated
ones, think that situation at home is better than in other countries in the region.

Road safety survey
© 2
009 I
psos
89
Situation in Montenegro regarding road safety
Base: Total target population
Worsened
17%Improved
24%
DK-Ref
0%
Stayed the
same
59%
Do you think that situation in Montenegro regarding road
traffic safety has improved, worsened or stayed the same
over the past 3 years?
• Majority of citizens (59%) think that status of road traffic
safety has not changed much over the past three years. 24%
thinks that it has improved, while 17% thinks that it has
worsened.
• Drivers share the opinion of general population here.
8%
33%
41%
58%
39%
19%
1%
Not concerned
at all
Somewhat
concerned
Sum -
Sum +
Quite
concerned
Very concerned
DK-Ref
How concerned are you personally regarding road traffic safety?
•58% of citizens claim to be personally concerned for
road traffic safety. 41% is not particularly concerned.
•This situation is particularly worrying for women, older
and highly educated citizens, as well as citizens of the
central part of the country.

Road safety survey
© 2
009 I
psos
90
Participants in traffic
Base: Total target population
34%
30%
27%
2%
2%
1%
37
28
25
2
2
1
Drivers
Pedestrians
Children
I don`t think
that anyone
is
endangered
Bicycle
riders
Motorcycle
riders
Total
Drivers
Who do you think is (if anyone) endangered
most in traffic?
85%
4%
4%
3%
1%
1%
85
3
4
4
1
1
Drivers
Motorcycle riders
I don`t think that anyone in
particular causes traffic
accid
Pedestrians
Bicycle riders
Children
Total
Drivers
In your opinion, who causes traffic accidents most?
• Almost equal number of citizens says that drivers (34%) and pedestrians (30%) are most endangered in traffic.
• 27% of citizens (particularly women, older and highly educated citizens) think that children are the most endangered category.
• Drivers share this opinion.
• Great majority of citizens think that, on the other hand, drivers cause the largest number of accidents (85%). 4% think that motorcyclists are to be
blamed most for accidents.
• Drivers again agree with general population.
• It is interesting that 4% of citizens think that no one in particular is responsible for traffic accidents. This is the opinion of a larger number of
the least educated citizens.

Road safety survey
© 2
009 I
psos
91
In your opinion , what are the main causes for traffic accidents in
your country?
Base: Total target population
11
7
9
5
3
2
74
74
77
82
86
90
Not applying penal policy
Lack of training for driving
Defective vehicles
Road conditions
Lack of participants’ awareness
of road traffic hazards
Failure to comply with
regulations
not important causes ( 1 + 2 ) important causes ( 4 + 5 )
12
8
10
4
2
2
73
76
77
86
87
90
Not applying penal policy
Lack of training for driving
Defective vehicles
Road conditions
Lack of participants’ awareness
of road traffic hazards
Failure to comply with regulations
not important causes ( 1 + 2 ) important causes ( 4 + 5 )
Base: Drivers (65% of target population)
• Citizens evaluate each of the following potential causes of traffic accidents as very or rather important.
• Drivers evaluate potential causes of traffic accidents in the same way.
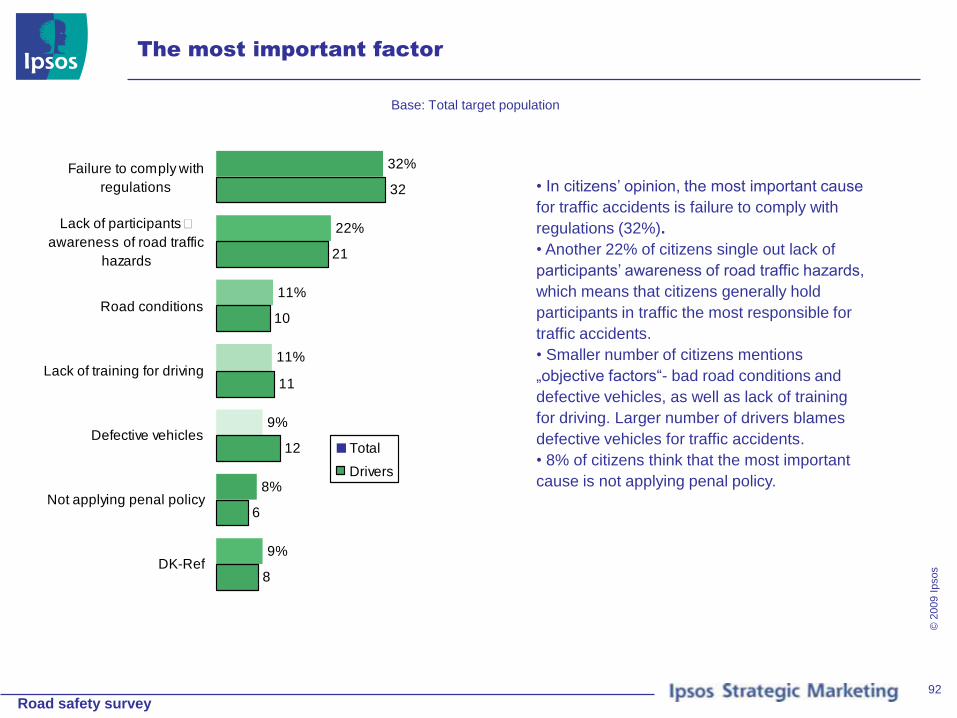
Road safety survey
© 2
009 I
psos
92
The most important factor
Base: Total target population
32%
22%
11%
11%
9%
8%
9%
32
21
10
11
12
6
8
Failure to comply with
regulations
Lack of participants�
awareness of road traffic
hazards
Road conditions
Lack of training for driving
Defective vehicles
Not applying penal policy
DK-Ref
Total
Drivers
• In citizens’ opinion, the most important cause
for traffic accidents is failure to comply with
regulations (32%).
• Another 22% of citizens single out lack of
participants’ awareness of road traffic hazards,
which means that citizens generally hold
participants in traffic the most responsible for
traffic accidents.
• Smaller number of citizens mentions
„objective factors“- bad road conditions and
defective vehicles, as well as lack of training
for driving. Larger number of drivers blames
defective vehicles for traffic accidents.
• 8% of citizens think that the most important
cause is not applying penal policy.
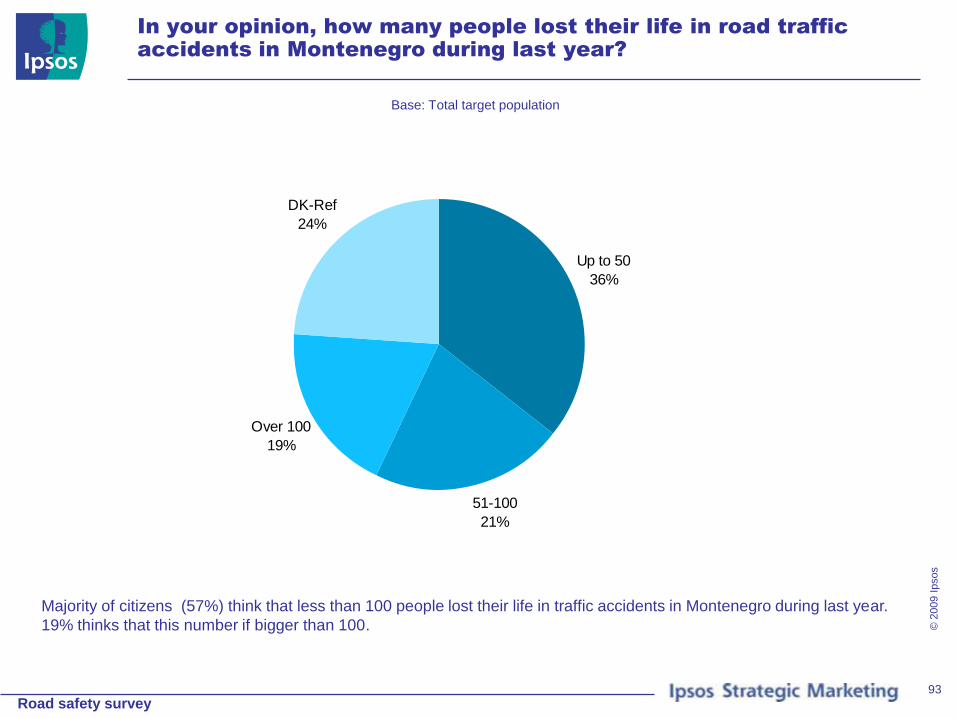
Road safety survey
© 2
009 I
psos
93
In your opinion, how many people lost their life in road traffic
accidents in Montenegro during last year?
Base: Total target population
Up to 50
36%
51-100
21%
Over 100
19%
DK-Ref
24%
Majority of citizens (57%) think that less than 100 people lost their life in traffic accidents in Montenegro during last year.
19% thinks that this number if bigger than 100.
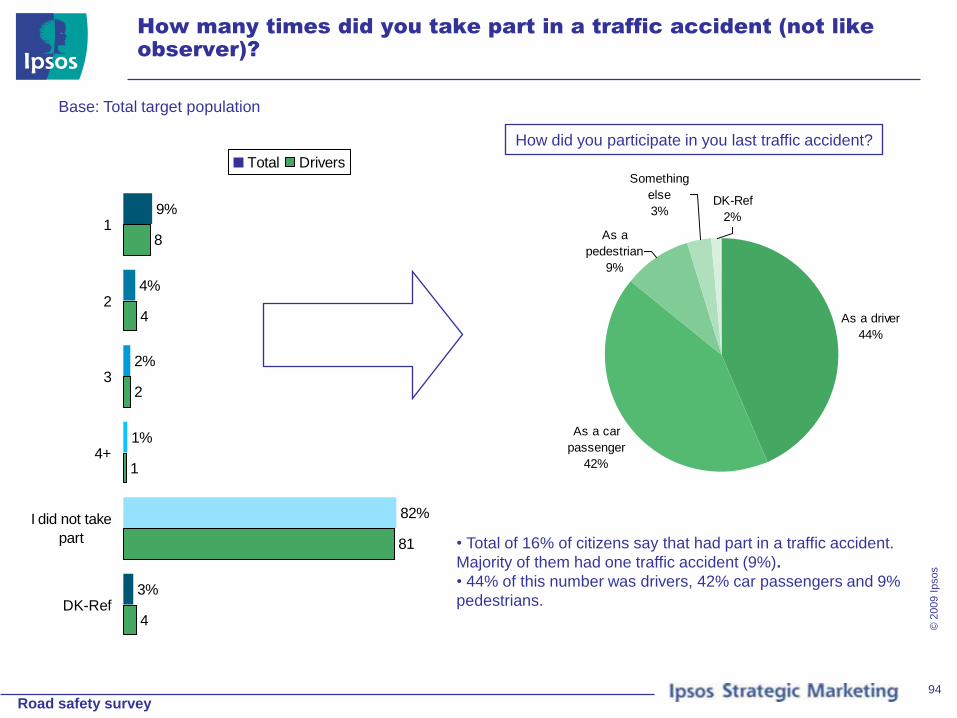
Road safety survey
© 2
009 I
psos
94
How many times did you take part in a traffic accident (not like
observer)?
Base: Total target population
9%
4%
2%
1%
82%
3%
8
4
2
1
81
4
1
2
3
4+
I did not take
part
DK-Ref
Total Drivers
As a driver
44%
As a car
passenger
42%
As a
pedestrian
9%
Something
else
3%DK-Ref
2%
How did you participate in you last traffic accident?
• Total of 16% of citizens say that had part in a traffic accident.
Majority of them had one traffic accident (9%).
• 44% of this number was drivers, 42% car passengers and 9%
pedestrians.

Road safety survey
© 2
009 I
psos
95
What kind of accident was it and what were the consequences?
Base: Total target population - those who ever took part in a traffic accident (not like observer) (18% of target population)
65%
9%
8%
6%
2%
8%
3%
Crash of two
cars
Chain car
accident
A car hit a
pedestrian
Crash of a car
and a bus or
truck
Crash of car
and motorcycle
Other
DK-Ref
What kind of accident was it?
37%
26%
25%
20%
14%
9%
2%
Light bodily
injury
Minor damage
to the vehicle
Mental trauma
Major damage
to the vehicle
There were no
consequences
Serious bodily
injury
DK-Ref
What were the consequences of this accident for you?
• Out of total number of these traffic accidents, two thirds were crashes of two cars (65%).
• 9% of citizens participated in a chain crash, and 8% in an accident when a car hit a pedestrian.
• Citizens who participated in a traffic accident mainly mention as consequences light bodily injury (37%), minor damage to the vehicle (26%) and
mental trauma(25%).
• In 9% of cases it was a serious bodily injury.
• Consequences were similar among drivers and in general population.
• Citizens say that other participants in traffic accident that they participated in had similar consequences.

Road safety survey
© 2
009 I
psos
96
Has your behavior in road traffic changed after the accident?
Multiple answers; Base: Total target population - those who ever took part in a traffic accident (not like observer) (18% of target population)
33%
24%
17%
12%
11%
9%
9%
7%
7%
5%
5%
5%
3%
1%
4%
3%
36
35
13
3
2
11
12
11
10
5
5
1
0
1
3
2
No, it hasn�t
changed
I drive slower
I fasten seat belt
I cross the street
only on aI don`t cross the
streets when theI don`t use mobile
phone while drivingI don`t exceed
allowed speedI don`t improperly
overtake otherI don`t drive when I
drink alcoholI stop at a
pedestrian crossingI stop when traffic
light is yellowI don`t use mobile
phone whileI walk only on
pavementI wear helmet when
riding
Other
DK-Ref
Total Drivers
• As for those who participated in a traffic accident, one
third of them say that their behavior has not changed
since. Others say that they became more cautious.
• Among drivers, increased cautiousness is
usually visible in slower driving, fastening seat
belts, not using a mobile phone while driving, not
drinking and driving, observing the rules when
overtaking. However, 36% of them say that their
behavior hasn’t changed.
• Pedestrians who had an accident now cross the
street on pedestrian crossing only (12%) and they
never cross the street when red traffic light is on
(11%).

Road safety survey
© 2
009 I
psos
97
Did any member of your family or close friend take part in traffic
accident (not like observer)?
Base: Total target population
Yes
35%
No
65%
48%
25%
24%
22%
17%
16%
15%
5%
21.7
0
10.5
47
11
7.5
6.3
5
He/she drives slower
He/she doesn’t drive
when I drink alcohol
He/she doesn’t
improperly overtake
other vehicle
No, it hasn’t changed
He/she fastens seat
belt
He/she doesn’t use
mobile phone while
driving
He/she doesn’t
exceed allowed speed
He/she stop at a
pedestrian crossing
Of the person who took part in the accident Of the respondent
Changes in behaviour
• 35% of citizens say that some of their relatives or
close friends had a traffic accident.
• Majority of these citizens noticed a change of behavior
in traffic of that person (78%).
• On the other hand, half of citizens do not learn on
examples of others – 47% of citizens say that their
behavior didn’t change after their close ones had a
traffic accident.

Road safety survey
© 2
009 I
psos
98
FINAL QUESTIONS

Road safety survey
© 2
009 I
psos
99
What measures would you take to improve the safety in traffic...?
Multiple answers; Base: Total target population
21%
18%
14%
10%
6%
5%
4%
4%
4%
4%
More careful driving/ caution/
consciousness
Compliance with regulations
More strict penalties/ More strict law
Slower driving/ Compliance with
speed limit
Better car (car in good condition,
new, serviced)
Increased, more strict control of
traffic
Better education of all/ being
informed
Careful/ proper crossing of street
Wearing a seat belt
Avoid use of mobile phone while
driving
...of your own family?
34%
15%
13%
13%
7%
5%
3%
3%
3%
3%
More strict penalties/ More strict law
Better roads/ repair of roads
Increased, more strict control of
traffic
Compliance with regulations
Equality/ equal punishments for all
violators
Better education of all/ being
informed
Application of Traffic Law
More careful driving/ caution/
consciousness
Slower driving/ Compliance with
speed limit
Better signalization/ more
signalization
...in general?
• Largest number of citizens thinks that it is most important for improvement of personal and family safety in road traffic to be careful and conscientious (21%),
as well as to obey the rules (18%).
• 14% of citizens think that the law should be harsher. Some citizens also mention slower driving, better cars, stricter road traffic control, as well as
being better informed.
• Drivers rather stress flawless functioning of car as important, as well as the need for stricter road traffic control.
• When asked about measures for improvement of general road traffic safety, citizens mention stricter laws (34%) and better control (15%) as the most
important measures.
• 15% mentions better roads, and 13% obeying rules.
• It is interesting that 7% of citizens say that it would be good if all traffic violators were treated the same.
• Drivers mention similar measures as the rest of population does.

Road safety survey
© 2
009 I
psos
100
Factors influencing children’s knowledge about behavior in road
traffic?
Yes, I think
that sufficient
attention is
paid
21%
DK-Ref
6%
No, I don’t
think that
sufficient
attention is
paid
73%
Base: Total target population
Greatest influence on children’s knowledge Do you think that schools pay sufficient attention to behavior in
traffic?
• 60% of citizens think that parents influence children most regarding their knowledge about behavior in traffic. 33%
thinks that it is the school.
• Role of parents is particularly stressed in the North of the country, and role of school in coastal area.
• Drivers and general population share the same beliefs.
• 73% of citizens think that school does not pay enough attention to behavior of children in traffic.
Parents
61%
School
31%
Other
4%
DK-Ref
4%
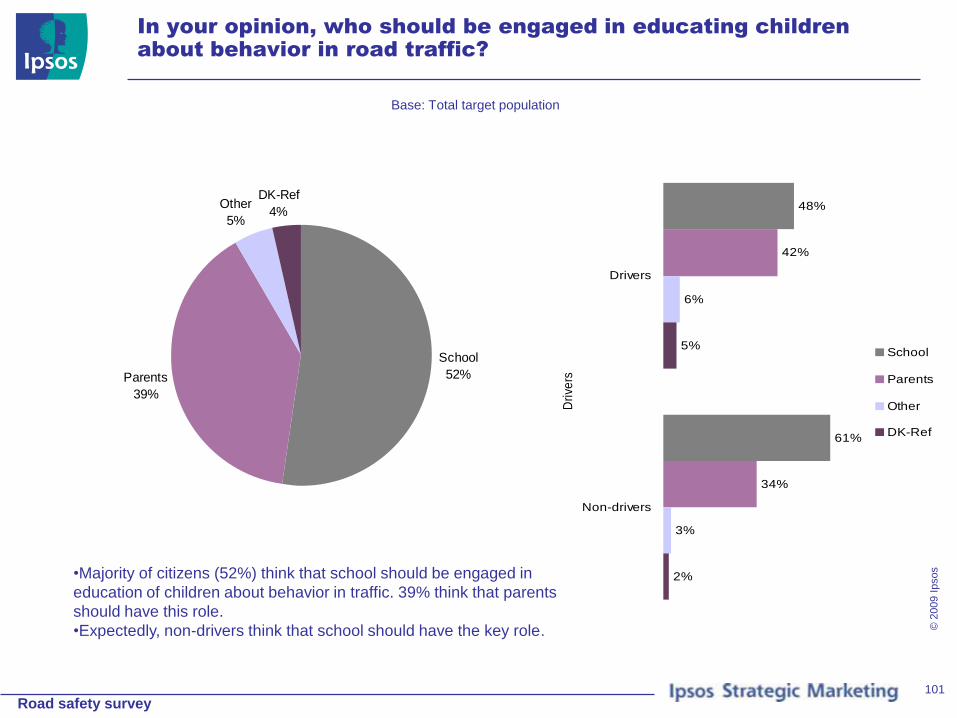
Road safety survey
© 2
009 I
psos
101
In your opinion, who should be engaged in educating children
about behavior in road traffic?
Base: Total target population
School
52%Parents
39%
Other
5%
DK-Ref
4% 48%
61%
42%
34%
6%
3%
5%
2%
Drivers
Non-drivers
Dri
vers
School
Parents
Other
DK-Ref
•Majority of citizens (52%) think that school should be engaged in
education of children about behavior in traffic. 39% think that parents
should have this role.
•Expectedly, non-drivers think that school should have the key role.