2021 unicef changing childhood survey technical report
TRANSCRIPT

Copyright © 2021 Gallup, Inc. All rights reserved.
1
2021 UNICEF Changing Childhood Survey
Technical Report

Copyright © 2021 Gallup, Inc. All rights reserved.
2
Table of Contents
Argentina ................................................................................................................................... 4
Bangladesh ................................................................................................................................ 8
Brazil........................................................................................................................................ 11
Cameroon ................................................................................................................................ 14
Ethiopia .................................................................................................................................... 17
France ..................................................................................................................................... 20
Germany .................................................................................................................................. 24
India ......................................................................................................................................... 28
Indonesia ................................................................................................................................. 31
Japan ....................................................................................................................................... 34
Kenya ...................................................................................................................................... 37
Lebanon ................................................................................................................................... 40
Mali .......................................................................................................................................... 43
Morocco ................................................................................................................................... 46
Nigeria ..................................................................................................................................... 49
Peru ......................................................................................................................................... 52
Spain ....................................................................................................................................... 55
Ukraine .................................................................................................................................... 59
United Kingdom. ...................................................................................................................... 62
United States ........................................................................................................................... 62
Zimbabwe ................................................................................................................................ 69

Copyright © 2021 Gallup, Inc. All rights reserved.
3
Copyright Standards This document contains proprietary research, copyrighted materials and literary property of Gallup, Inc. It is for the guidance of your organization only and is not to be copied, quoted, published or divulged to others outside your organization. All of Gallup, Inc.’s content is protected by copyright. Neither the client nor the participants shall copy, modify, resell, reuse or distribute the program materials beyond the scope of what is agreed upon in writing by Gallup, Inc. Any violation of this Agreement shall be considered a breach of contract and misuse of Gallup, Inc.’s intellectual property. This document is of great value to Gallup, Inc. Accordingly, international and domestic laws and penalties guaranteeing patent, copyright, trademark and trade secret protection safeguard the ideas, concepts and recommendations related within this document. No changes may be made to this document without the express written permission of Gallup, Inc. Gallup® is a trademark of Gallup, Inc. All rights reserved. All other trademarks and copyrights are property of their respective owners.

2021 UNICEF Changing Childhood Survey Technical Report
Copyright © 2021 Gallup, Inc. All rights reserved. 4
Argentina
Sampling:
A dual-frame (landline and mobile) sample design was used to complete 1,005 telephone surveys in Argentina, with 503 interviews among those aged 15 to 24 and 502 interviews among those aged 40 or older. A dual-frame sample design was selected to increase the coverage rate of the target population. Based on the International Telecommunication Union’s 2018 report on fixed-telephone and mobile subscriptions, there were 9,764,014 landline subscriptions — about 22 landline subscriptions per 100 inhabitants — and 58,598,041 mobile subscriptions, about 132.1 mobile subscriptions per 100 inhabitants.
Target Population/Coverage:
The target population of the survey was the adult population aged 15 to 24 or 40 or older in Argentina. The sampling frame excluded individuals who neither lived in households with landline phones nor had any access to mobile phones (i.e., those who were neither living in households with a landline phone nor had their own mobile phones). The coverage error (percentage of target population not accessible for sampling) was expected to be about 10% based on 2019 estimates from the World Poll.
Stratification:
The landline and mobile sampling frames were constructed based on the Geographic Numbering Assignment from Ente Nacional de Comunicaciones. Both landline and mobile sampling frames were explicitly stratified by the following 24 regions: Capital Federal, Buenos Aires, Catamarca, Chaco, Chubut, Cordoba, Corrientes, Entre Ríos, Formosa, Jujuy, La Pampa, La Rioja, Mendoza, Misiones, Neuquen, Río Negro, Salta, San Juan, San Luis, Santa Cruz, Santa Fe, Santiago del Estero, Tierra del Fuego and Tucumán. The landline and mobile samples were allocated into their corresponding 24 strata proportional to each region’s 15 and older population.
Sample Selection:
A simple stratified sample design was used for selecting landline and mobile numbers. Within each explicit stratum (the 24 regions) a sample of specified size was drawn using pure Random Digit Dial (RDD) procedures. Sampling was done independently within each stratum. The generated landline and mobile samples were screened to identify and remove nonworking numbers. Business phone numbers and telephone numbers on blacklists (such as “do not call lists”) were screened out of the sample as well. In the case of landline households with more than one adult respondent, a respondent was randomly selected among all the adults aged 15 to 24 or 40 and older living in the household by asking for the person in the chosen age category who had the next birthday. Respondents reached via mobile phone did not have any further selection other than ensuring they fell into one of the two age categories: 15 to 24 or 40 and older. In addition to the RDD sample, to meet sample size requirements particularly for the 15 to 24 age group, a random sample of respondents was selected from three additional sources. One involved recontact sample collected for Gallup’s World Poll project, an RDD mobile sample with high probability of being associated with individuals in the 15 to 24 age range, and an age-targeted list sample. In the case of individuals contacted using the latter three sample sources, there was no respondent selection, just confirmation of age and gender to ensure eligibility.

2021 UNICEF Changing Childhood Survey Technical Report
Copyright © 2021 Gallup, Inc. All rights reserved. 5
For the purpose of data collection, the total initial sample was split into random subsamples (replicate samples) and released sequentially based on the progress of interviewing in different strata. The targeted samples constituted their own replicates, so it was easy to release the samples as required. The goal was to release an optimum amount of sample each time to achieve a high response rate while completing the targeted number of interviews within the field period. Each sampled number was dialed up to five times at different times of day and different days of the week, including weekends, to increase the chances of contacting and selecting a respondent. The outcome of each call attempt was recorded using a standard set of 25 disposition codes to facilitate the calculation of response rates based on American Association of Public Opinion Research (AAPOR) standards.
Data Collection:
Data was gathered between February 25-June 3, 2021. AAPOR3 response rate: 2%
Language of Interviews:
Spanish
Weighting:
The sample data was weighted to minimize bias in survey-based estimates. The weighting procedure was formulated based on the sample design and was carried out in multiple stages. For each sample (RDD sample, WP recontact sample, high probability sample and age-targeted sample), a probability weight factor (base weight) was constructed to account for selection of telephone numbers from each sampling stratum, dual users of landline and mobile, and unequal selection probabilities due to selection of one eligible person from the selected household. The whole data set was divided into three groups based on sample source and respondent’s age group: RDD/WP 15 to 24, RDD/WP 40 and older, high probability 15 to 24 and age-targeted 15 to 24. The RDD sample and World Poll recontact sample were treated as one sample source since the World Poll 2020 sample was generated in the same way as the RDD sample used for this project. The base weights of each group were projected to its corresponding target population (15 to 24 or 40 and older persons living in Argentina). The projected weights for RDD/WP 15 to 24, high probability 15 to 24 and age-targeted 15 to 24 groups were then combined using the following composite weighting procedure. Let n1, n2, n3 be the sample sizes for RDD/WP 15 to 24, high probability 15 to 24 and age-targeted 15 to 24 groups, respectively. Suppose deff1, deff2, deff3 are the design effects associated with RDD/WP 15 to 24, high probability 15 to 24 and age-targeted 15 to 24 groups, respectively. These deff numbers could be estimated from the respective samples using Kish’s approximate method [Estimated Design Effect = (Sample size) * (Sum of the squared weights)/(Square of the sum of weights)]. The combined projection weights (fnwt) assigned to each case in the combined (RDD/WP 15 to 24, high probability 15 to 24 and age-targeted 15 to 24 cases) data set of size (n1 + n2 + n3) were calculated as:
𝑓𝑛𝑤𝑡𝑖 =[(
n1deff1
) ∗ RWi + (n2deff2
) ∗ HWi + (n3deff3
) ∗ AWi]
[(n1deff1
) + (n2deff2
) + (n3deff3
)]
[i=1, 2, 3, …, (n1 + n2 + n3)]

2021 UNICEF Changing Childhood Survey Technical Report
Copyright © 2021 Gallup, Inc. All rights reserved. 6
At the next step, the combined samples with the combined projection weights as the initial weights were post-stratified separately to adjust for nonresponse and to match the weighted sample totals to known target population totals obtained from country-level census data. The variables included in post-stratification were age groups, age by gender, age by education and age by region. In the end, the post-stratified weights were trimmed to avoid extreme weights and then normalized to ensure the total weights sum to the number of completed interviews.
Design Effect:
1.83 for age group 15 to 24, 2.34 for age group 40 and older
Margin of Error:
5.91 for age group 15 to 24, 6.69 for age group 40 and older
Population Sources Used for Constructing Weights:
Age, education, gender, region: National Institute of Statistics and Censuses (INDEC), Population and Housing Census 2010
AGE_GROUP SAMPLE_UNWTD TARGET SAMPLE_WTD
15 to 19 16.72 16.88 17.82
20 to 24 33.33 15.72 17.45
40 to 49 16.62 21.48 21.65
50 and older 33.33 45.92 43.09
AGE_SEX SAMPLE_UNWTD TARGET SAMPLE_WTD
15 to 24, Male 26.87 16.36 17.80
15 to 24, Female 23.18 16.24 17.47
40 and older, Male 25.77 31.01 30.97
40 and older, Female 24.18 36.39 33.76
AGE_EDUCATION SAMPLE_UNWTD TARGET SAMPLE_WTD
15 to 24, Primary complete and below 3.68 7.55 7.95
15 to 24, Secondary incomplete and complete 30.05 18.89 20.35
15 to 24, Some/Complete tertiary (technical) and some/complete university
16.32 6.17 6.97
40 and older, Primary complete and below 8.56 34.24 29.80
40 and older, Secondary incomplete and complete
17.81 19.87 20.94
40 and older, Some/Complete tertiary (technical) and some/complete university
23.58 13.28 14.00

2021 UNICEF Changing Childhood Survey Technical Report
Copyright © 2021 Gallup, Inc. All rights reserved. 7
AGE_REGION SAMPLE_UNWTD TARGET SAMPLE_WTD
15 to 24, Metropolitana/Pampeana 35.42 19.74 21.64
15 to 24, Cuyo 2.59 2.69 2.84
15 to 24, N.O.A. (Noroeste Argentino) 4.68 4.05 4.27
15 to 24, N.E.A. (Noreste Argentino) 5.17 4.37 4.67
15 to 24, Patagonia 2.19 1.75 1.85
40 and older, Metropolitana/Pampeana 32.24 45.40 41.88
40 and older, Cuyo 3.88 5.10 5.37
40 and older, N.O.A. (Noroeste Argentino) 5.47 6.50 6.85
40 and older, N.E.A. (Noreste Argentino) 5.77 7.23 7.29
40 and older, Patagonia 2.59 3.18 3.35

2021 UNICEF Changing Childhood Survey Technical Report
Copyright © 2021 Gallup, Inc. All rights reserved. 8
Bangladesh
Sampling:
A mobile-only sample design was used to complete 1,013 telephone surveys in Bangladesh, with 506 interviews among those aged 15 to 24 and 507 interviews among those aged 40 or older. A mobile-only sample design was selected due to the high mobile penetration rate in Bangladesh. Based on the International Telecommunication Union’s 2018 report on fixed-telephone and mobile subscriptions, there were 1,449,646 landline subscriptions — about 0.90 landline subscriptions per 100 inhabitants — and there were 161,771,617 mobile subscriptions, about 100.24 mobile subscriptions per 100 inhabitants. Based on the Bangladesh Demographic and Health Survey 2014, 1.6% of households possessed a landline phone and 88.5% of households possessed a mobile phone; 91.4% of individuals 15 and older had a mobile phone.
Target Population/Coverage:
The target population of this survey was the adult population aged 15 to 24 or 40 and older in Bangladesh. The sampling frame excluded individuals who had no access to mobile phones (i.e., those who were neither living in households with a mobile phone nor had their own mobile phones). The exact coverage error (percentage of target population not accessible for sampling) was unknown but was expected to be less than 10% based on 2019 World Poll estimates.
Stratification:
The mobile sampling frames were constructed based on the Bangladesh National Numbering Plan 2017 from the Bangladesh Telecommunication Regulatory Commission. The mobile sampling frame was explicitly stratified by the following four mobile providers: Banglink Digital Communications Ltd., Grameenphone Ltd., Robi Axiata Ltd. and Teletalk Bangladesh Ltd. For the mobile frame, samples were allocated into the four strata proportional to each provider’s market share.
Sample Selection:
A simple stratified sample design was used for selecting mobile numbers. Within each explicit stratum (the four mobile providers) a sample of specified size was drawn using pure Random Digit Dial (RDD) procedures. Sampling was done independently within each stratum. The generated mobile sample was screened to identify and remove nonworking numbers. Business phone numbers and telephone numbers on blacklists (such as “do not call lists”) were screened out of the sample as well. In the case of households with more than one adult respondent, a respondent was randomly selected among all the adults aged 15 to 24 or 40 and older living in the household by asking for the person in the chosen age and gender category who had the next birthday. For the purpose of data collection, the total initial sample was split into random subsamples (replicate samples) and released sequentially based on the progress of interviewing in different strata. The goal was to release an optimum amount of sample each time to achieve a high response rate while completing the targeted number of interviews within the field period. Each sampled number was dialed up to five times at different times of day and different days of the week, including weekends, to increase the chances of contacting and selecting a respondent. The outcome of each call attempt was recorded using a standard set of 25 disposition codes to facilitate the calculation of response rates based on American Association of Public Opinion Research (AAPOR) standards.

2021 UNICEF Changing Childhood Survey Technical Report
Copyright © 2021 Gallup, Inc. All rights reserved. 9
Data Collection:
Data was gathered between February 21-April 15, 2021. AAPOR3 response rate: 20%
Language of Interviews:
Bengali
Weighting:
The sample data was weighted to minimize bias in survey-based estimates. The weighting procedure was formulated based on the sample design and carried out in multiple stages. A probability weight factor (base weight) was constructed to account for unequal selection probabilities as a result of selection of phone numbers from the respective mobile strata, households with multiple mobile numbers, and selecting one adult among the chosen age and gender category within households. At the next step, the base weights were post-stratified on age, age by gender, age by education and age by region to adjust for nonresponse and to match the weighted sample totals to known target population totals obtained from country-level census data. In the end, the post-stratified weights were trimmed to avoid extreme weights and then were normalized to ensure the total weights sum the number of completed interviews.
Design Effect:
2.34 for age group 15 to 24, 2.13 for age group 40 and older
Margin of Error:
6.7% for age group 15 to 24, 6.4% for age group 40 and older
Population Sources Used for Constructing Weights:
Age, education, gender, region: Population & Housing Census 2011
AGE_GROUP SAMPLE_UNWTD TARGET SAMPLE_WTD
15 to 19 14.81 21.22 18.93
20 to 24 35.14 21.94 26.84
40 to 49 33.76 24.15 27.15
50 and older 16.29 32.70 27.08
AGE_SEX SAMPLE_UNWTD TARGET SAMPLE_WTD
15 to 24, Male 27.05 20.27 24.36
15 to 24, Female 22.90 22.89 21.41
40 and older, Male 26.55 30.09 26.46
40 and older, Female 23.49 26.75 27.77

2021 UNICEF Changing Childhood Survey Technical Report
Copyright © 2021 Gallup, Inc. All rights reserved. 10
AGE_EDUCATION SAMPLE_UNWTD TARGET SAMPLE_WTD
15 to 24, Illiterate or no school (1-3) 0.69 7.10 2.45
15 to 24, Primary (4) 2.76 10.04 7.98
15 to 24, Secondary (5) 9.48 16.01 18.72
15 to 24, Post-secondary (6-12) 37.02 10.00 16.61
40 and older, Illiterate or no school (1-3) 8.09 32.37 22.45
40 and older, Primary (4) 7.40 11.67 12.25
40 and older, Secondary (5) 8.09 6.60 9.21
40 and older, Post-secondary (6-12) 26.46 6.21 10.32
AGE_REGION SAMPLE_UNWTD TARGET SAMPLE_WTD
15 to 24, Dhaka/Mymensingh 16.19 14.21 12.98
15 to 24, Chittagong 12.24 8.51 10.67
15 to 24, Khulna 4.34 4.70 5.08
15 to 24, Rajshahi 5.53 5.54 6.25
15 to 24, Sylhet 7.11 2.97 4.66
15 to 24, Barisisal 2.27 2.49 2.52
15 to 24, Rangpur 2.27 4.73 3.60
40 and older, Dhaka/Mymensingh 17.77 18.72 15.52
40 and older, Chittagong 11.75 11.22 12.15
40 and older, Khulna 4.64 6.19 5.75
40 and older, Rajshahi 4.74 7.30 6.65
40 and older, Sylhet 5.43 3.91 5.49
40 and older, Barisisal 2.96 3.29 4.04
40 and older, Rangpur 2.76 6.23 4.64

2021 UNICEF Changing Childhood Survey Technical Report
Copyright © 2021 Gallup, Inc. All rights reserved. 11
Brazil
Sampling:
A dual-frame (landline and mobile) sample design was used to complete 1,007 telephone surveys in Brazil, with 500 interviews among those aged 15 to 24 and 507 interviews among those aged 40 or older. A dual-frame sample design was selected to increase the coverage rate of the target population. Based on the International Telecommunication Union’s (ITU) 2018 report on fixed-telephone and mobile subscriptions, there were 38,311,930 landline subscriptions — about 18.3 landline subscriptions per 100 inhabitants — and there were 207,046,810 mobile subscriptions, about 98.8 mobile subscriptions per 100 inhabitants. Based on ITU’s estimates on core household indicators, 24.1% of households had a fixed-line telephone and 92.8% of households had a mobile telephone in 2018.
Target Population/Coverage:
The target population of this survey was the adult population aged 15 to 24 or 40 and older in Brazil. The sampling frame excluded individuals who neither lived in households with landline phones nor had any access to mobile phones (i.e., those who were neither living in households with a landline phone nor had their own mobile phones). The exact coverage error (percentage of target population not accessible for sampling) was expected to be less than 10% based on 2019 estimates from the World Poll.
Stratification:
The landline and mobile sampling frames were constructed based on the National Numbering Plan from the Agência Nacional de Telecomunicações. Both the landline and mobile sampling frames were explicitly stratified by the following 27 regions: Roraima, Amazonas, Pará, Tocantins, Maranhão, Piauí, Ceará, Rio Grande do Norte, Paraíba, Pernambuco, Alagoas, Sergipe, Bahia, Minas Gerais, Rio de Janeiro, São Paulo, Paraná, Santa Catarina, Rio Grande do Sul, Mato Grosso do Sul, Mato Grosso, Goiás, Distrito Federal, Espirito Santo, Amapá, Rondonia and Acre. The landline and mobile samples were allocated into their corresponding 27 strata proportional to each region’s 15 and older population.
Sample Selection:
A simple stratified sample design was used for selecting landline and mobile numbers. Within each explicit stratum (the 27 regions) a sample of specified size was drawn using list-assisted Random Digit Dial (RDD) procedures. Sampling was done independently within each stratum. The generated landline and mobile samples were screened to identify and remove nonworking numbers. Business phone numbers and telephone numbers on blacklists (such as “do not call lists”) were screened out of the sample as well. In the case of landline households with more than one adult respondent, a respondent was randomly selected among all the adults aged 15 to 24 or 40 and older living in the household by asking for the person in the chosen age category who had the next birthday. Respondents reached via mobile phone did not have any further selection other than ensuring they fell into one of the two age categories, 15 to 24 or 40 and older. In addition to the RDD sample, to meet sample size requirements particularly for the 15 to 24 age group, a random sample of respondents from the recontact sample collected from Gallup’s World Poll 2020 project was used. In the case of individuals contacted from this targeted list, there was no respondent selection, just confirmation of age and gender to ensure eligibility.

2021 UNICEF Changing Childhood Survey Technical Report
Copyright © 2021 Gallup, Inc. All rights reserved. 12
For the purpose of data collection, the total initial sample was split into random subsamples (replicate samples) and released sequentially based on the progress of interviewing in different strata. The targeted sample constituted its own replicate, so it was easy to release this sample as required. The goal was to release an optimum amount of sample each time to achieve a high response rate while completing the targeted number of interviews within the field period. Each sampled number was dialed up to five times at different times of day and different days of the week, including weekends, to increase the chances of contacting and selecting a respondent. The outcome of each call attempt was recorded using a standard set of 25 disposition codes to facilitate the calculation of response rates based on American Association of Public Opinion Research (AAPOR) standards.
Data Collection:
Data was gathered between February 23-April 17, 2021. AAPOR3 response rate: 8%
Language of Interviews:
Portuguese
Weighting:
The sample data was weighted to minimize bias in survey-based estimates. The weighting procedure was formulated based on the sample design and was carried out in multiple stages. Considering the fact that the sample used for the World Poll 2020 project was generated in the same way as the RDD sample used for this project and only 58 completed interviews were from the recontact sample, the recontact sample was treated as part of the RDD sample during weighting. A probability weight factor (base weight) was constructed to account for selection of telephone numbers from the respective frames and correct for unequal selection probabilities as a result of selecting one adult in landline households and for dual users coming from both the landline and mobile frame. At the next step, the base weights were post-stratified on age, age by gender, age by education and age by region to adjust for nonresponse and to match the weighted sample totals to known target population totals obtained from country-level census data. In the end, the post-stratified weights were trimmed to avoid extreme weights and then normalized to ensure the total weights sum to the number of completed interviews.
Design Effect:
4.26 for age group 15 to 24, 4.24 for age group 40 and older
Margin of Error:
6.4% for age group 15 to 24, 6.4% for age group 40 and older
Population Sources Used for Constructing Weights:
Age, education, gender, region: Brasilian Institute of Geography and Statistics (IBGE), Census of Population 2010
AGE_GROUP SAMPLE_UNWTD TARGET SAMPLE_WTD
15 to 19 22.34 17.32 18.98
20 to 24 27.31 17.58 20.93
40 to 49 20.56 25.33 27.64
50 and older 29.79 39.77 32.46

2021 UNICEF Changing Childhood Survey Technical Report
Copyright © 2021 Gallup, Inc. All rights reserved. 13
AGE_EDUCATION SAMPLE_UNWTD TARGET SAMPLE_WTD
15 to 24, High school incomplete and below 14.70 22.64 25.09
15 to 24, High school complete to superior studies incomplete
31.58 11.21 13.57
15 to 24, Superior studies complete and above 3.38 1.04 1.25
40 and older, High school incomplete and below 18.57 47.06 39.51
40 and older, High school complete to superior studies incomplete
17.18 11.48 12.83
40 and older, Superior studies complete and above 14.60 6.57 7.75
AGE_SEX SAMPLE_UNWTD TARGET SAMPLE_WTD
15 to 24, Male 22.44 17.52 19.27
15 to 24, Female 27.21 17.38 20.63
40 and older, Male 23.73 30.49 28.86
40 and older, Female 26.61 34.61 31.23
AGE_REGION SAMPLE_UNWTD TARGET SAMPLE_WTD
15 to 24, South 5.96 4.78 5.47
15 to 24, Southeast 21.85 13.86 15.01
15 to 24, Centre-west 3.87 2.62 3.13
15 to 24, North 3.97 3.26 3.88
15 to 24, Northeast 14.00 10.38 12.42
40 and older, South 7.35 10.42 8.28
40 and older, Southeast 21.85 29.89 27.62
40 and older, Centre-west 3.77 4.45 5.01
40 and older, North 3.87 3.93 3.70
40 and older, Northeast 13.51 16.41 15.49

2021 UNICEF Changing Childhood Survey Technical Report
Copyright © 2021 Gallup, Inc. All rights reserved. 14
Cameroon
Sampling:
A mobile-only sample design was used to complete 1,006 telephone surveys in Cameroon, with 506 interviews among those aged 15 to 24 and 500 interviews among those aged 40 or older. Random selection of respondents among all adults aged 15 to 24 or 40 and older living in households reached by mobile was used to increase the coverage rate of the target population, considering the mobile penetration rate in Cameroon is not very high. Based on the International Telecommunication Union (ITU)’s 2018 report on fixed-telephone and mobile subscriptions, there were 902,253 landline subscriptions — about 3.6 landline subscriptions per 100 inhabitants — and there were 18,455,836 mobile subscriptions, about 73.2 mobile subscriptions per 100 inhabitants. Based on the Demographic and Health Survey 2011, 2.7% of households possessed a landline phone and 67.2% of households possessed a mobile phone; 72.1% of individuals 15 and older had a mobile phone.
Target Population/Coverage:
The target population of this survey was the adult population aged 15 to 24 or 40 and older in Cameroon. The sampling frame excluded individuals who had no access to mobile phones (i.e., those who were neither living in households with a mobile phone nor had their own mobile phones). The coverage error (percentage of target population not accessible for sampling) was expected to be approximately 20% based on 2019 estimates from the World Poll.
Stratification:
The mobile sampling frame was constructed based on the National Numbering Plan of Cameroon from the Agence de Régulation des Télécommunications. The mobile sampling frame was explicitly stratified by the following three service providers: MTN Cameroon, Nextel and Orange Cameroon. For the mobile frame, samples were allocated into the three strata proportional to each provider’s market share.
Sample Selection:
A simple stratified sample design was used for selecting mobile numbers. Within each explicit stratum (the three providers) a sample of specified size was drawn using pure Random Digit Dial (RDD) procedures. Sampling was done independently within each stratum. The generated mobile sample was screened to identify and remove nonworking numbers. Business phone numbers and telephone numbers on blacklists (such as “do not call lists”) were screened out of the sample as well. In the case of households with more than one adult respondent, a respondent was randomly selected among all the adults aged 15 to 24 or 40 and older living in the household by asking for the person in the chosen age and gender category who had the next birthday. In addition to the RDD sample, to meet sample size requirements particularly for the 15 to 24 age group, a random sample of respondents from the recontact sample collected from Gallup’s World Poll 2020 project was used. In the case of individuals contacted from this sample source, there was no respondent selection, just confirmation of age and gender to ensure eligibility. For the purpose of data collection, the total initial sample was split into random subsamples (replicate samples) and released sequentially based on the progress of interviewing in different strata. The targeted sample constituted its own replicate, so it was easy to release this sample as required. The goal was to release an optimum amount of sample each time to achieve a high response rate while

2021 UNICEF Changing Childhood Survey Technical Report
Copyright © 2021 Gallup, Inc. All rights reserved. 15
completing the targeted number of interviews within the field period. Each sampled number was dialed up to five times at different times of day and different days of the week, including weekends, to increase the chances of contacting and selecting a respondent. The outcome of each call attempt was recorded using a standard set of 25 disposition codes to facilitate the calculation of response rates based on American Association of Public Opinion Research (AAPOR) standards.
Data Collection:
Data was gathered between March 3-22, 2021. AAPOR3 response rate: 34%
Language of Interviews:
English, French, Fulfulde
Weighting:
The sample data was weighted to minimize bias in survey-based estimates. The weighting procedure was formulated based on the sample design and was carried out in multiple stages. Considering the fact that the sample used for the World Poll 2020 project was generated in the same way as the RDD sample used for this project and only 40 completed interviews were from the recontact sample, the recontact sample was treated as part of the RDD sample during weighting. A probability weight factor (base weight) was constructed to account for unequal selection probabilities as a result of selection of phone numbers from the respective mobile strata, households with multiple mobile numbers, and selecting one adult among the chosen age and gender category within households. At the next step, the base weights were post-stratified on age, age by gender, age by education and age by region to adjust for nonresponse and to match the weighted sample totals to known target population totals obtained from country-level census data. In the end, the post-stratified weights were trimmed to avoid extreme weights and then normalized to ensure the total weights sum to the number of completed interviews.
Design Effect: 6.52 for age group 15 to 24, 5.19 for age group 40 and older
Margin of Error: 7.9% for age group 15 to 24, 7.0% for age group 40 and older
Population Sources Used for Constructing Weights:
Age, gender: U.S. Census IDB 2020 Education: MICS 2011 Region: Census 2005
AGE_GROUP SAMPLE_UNWTD TARGET SAMPLE_WTD
15 to 19 10.64 28.85 22.15
20 to 24 39.66 24.69 26.02
40 to 49 24.35 20.50 22.20
50 and older 25.35 25.97 29.64

2021 UNICEF Changing Childhood Survey Technical Report
Copyright © 2021 Gallup, Inc. All rights reserved. 16
AGE_EDUCATION SAMPLE_UNWTD TARGET SAMPLE_WTD
15 to 24, Secondary incomplete and below 16.70 50.11 44.03
15 to 24, Secondary complete and above 33.60 3.42 4.13
40 and older, Secondary incomplete and below 22.17 43.55 48.35
40 and older, Secondary complete and above 27.53 2.91 3.48
AGE_SEX SAMPLE_UNWTD TARGET SAMPLE_WTD
15 to 24, Male 24.75 26.79 23.80
15 to 24, Female 25.55 26.74 24.36
40 and older, Male 26.94 22.58 24.91
40 and older, Female 22.76 23.88 26.93
AGE_REGION SAMPLE_UNWTD TARGET SAMPLE_WTD
15 to 24, Coastal region 11.53 11.73 10.76
15 to 24, North 16.50 17.42 17.92
15 to 24, South 12.82 13.81 10.53
15 to 24, West 9.44 10.57 8.96
40 and older, Coastal region 11.13 10.18 10.63
40 and older, North 15.81 15.12 16.92
40 and older, South 12.82 11.98 13.73
40 and older, West 9.94 9.18 10.56

2021 UNICEF Changing Childhood Study Technical Report
Copyright © 2021 Gallup, Inc. All rights reserved. 17
Ethiopia
Sampling:
A mobile-only sample design was used to complete 1,049 telephone surveys in Ethiopia, with 508 interviews among those aged 15 to 24 and 541 interviews among those aged 40 or older. Random selection of respondents among all adults aged 15 to 24 or 40 and older living in households reached by mobile was used to increase the coverage rate of the target population, considering the mobile penetration rate in Ethiopia is not very high. Based on the Demographic and Health Survey 2016, 3.6% of households possessed a landline phone, 55.5% of households possessed a mobile phone and 60.4% of individuals had a mobile phone.
Target Population/Coverage:
The target population of this survey was the adult population aged 15 to 24 or 40 and older in Ethiopia. The sampling frame excluded individuals who had no access to mobile phones (i.e., those who were neither living in households with a mobile phone nor had their own mobile phone). The coverage error (percentage of target population not accessible for sampling) was expected to be approximately 40%.
Stratification:
The mobile sampling frame was constructed based on the national numbering plan for telecommunications services from the Ethiopia Telecommunications Agency. There was no stratification for mobile since there is only one main mobile service provider, Ethio Telecom, in Ethiopia.
Sample Selection:
A simple random sampling was used for selecting mobile numbers. A sample of specified size was drawn using pure Random Digit Dial (RDD) procedures. The generated mobile sample was screened to identify and remove nonworking numbers. Business phone numbers and telephone numbers on blacklists (such as “do not call lists”) were screened out of the sample as well. In the case of households with more than one adult respondent, a respondent was randomly selected among all the adults aged 15 to 24 or 40 and older living in the household by asking for the person in the chosen age and gender category who had the next birthday. In addition to the RDD sample, to meet sample size requirements particularly for the 15 to 24 age group, a random sample of respondents from the recontact sample collected from Gallup’s World Poll 2020 project was used. In the case of individuals contacted from this sample source, there was no respondent selection, just confirmation of age and gender to ensure eligibility. For the purpose of data collection, the total initial sample was split into random subsamples (replicate samples) and released sequentially based on the progress of interviewing in different strata. The targeted sample will constitute its own replicate so it was easy to release this sample as required. The goal was to release an optimum amount of sample each time to achieve a high response rate while completing the targeted number of interviews within the field period. Each sampled number was dialed up to five times at different times of day and different days of the week, including weekends, to increase the chances of contacting and selecting a respondent. The outcome of each call attempt was recorded using a standard set of 25 disposition codes to facilitate the calculation of response rates based on American Association of Public Opinion Research (AAPOR) standards.

2021 UNICEF Changing Childhood Study Technical Report
Copyright © 2021 Gallup, Inc. All rights reserved. 18
Data Collection:
Data was gathered between March 6-April 5, 2021. AAPOR3 response rate: 17%
Language of Interviews:
Amharic, English, Oromo, Tigrinya
Weighting:
The sample data was weighted to minimize bias in survey-based estimates. The weighting procedure was formulated based on the sample design and was carried out in multiple stages. Because the sample used for the World Poll 2020 project was generated in the same way as the RDD sample used for this project and only 62 completed interviews were from the recontact sample, the recontact sample was treated as part of the RDD sample during weighting. A probability weight factor (base weight) was constructed to account for unequal selection probabilities because of selection of phone numbers from the mobile frame, households with multiple mobile numbers, and selecting one adult among the chosen age and gender category within households. At the next step, the base weights were post-stratified on age by gender, age by education and age by region to adjust for nonresponse and to match the weighted sample totals to known target population totals obtained from country-level census data. In the end, the post-stratified weights were trimmed to avoid extreme weights and then normalized to ensure the total weights sum to the number of completed interviews.
Design Effect:
4.42 for age group 15 to 24, 6.56 for age group 40 and older
Margin of Error:
6.4% for age group 15 to 24, 7.8% for age group 40 and older
Population Sources Used for Constructing Weights:
Age, gender: U.S. Census IDB 2020 Education: DHS 2016 Region: 2007 general Population and Housing Census
AGE_EDUCATION SAMPLE_UNWTD TARGET SAMPLE_WTD
15 to 24, Completed primary and below 8.20 32.96 28.76
15 to 24, Some secondary and above 40.23 16.71 26.82
40 and older, Completed primary and below 10.01 44.56 34.78
40 and older, Some secondary and above 41.56 5.77 9.64
AGE_SEX SAMPLE_UNWTD TARGET SAMPLE_WTD
15 to 24, Male 25.07 24.79 26.95
15 to 24, Female 23.36 24.88 28.63
40 and older, Male 35.08 24.75 24.39
40 and older, Female 16.49 25.58 20.03

2021 UNICEF Changing Childhood Study Technical Report
Copyright © 2021 Gallup, Inc. All rights reserved. 19
AGE_REGION SAMPLE_UNWTD TARGET SAMPLE_WTD
15 to 24, Central 19.35 20.24 21.37
15 to 24, Southwest 10.20 10.33 11.96
15 to 24, Northwest 11.82 12.03 12.75
15 to 24, East 7.05 7.07 9.50
40 and older, Central 22.59 20.51 15.86
40 and older, Southwest 8.29 10.47 7.26
40 and older, Northwest 12.39 12.19 15.38
40 and older, East 8.29 7.16 5.93

2021 UNICEF Changing Childhood Survey Technical Report
Copyright © 2021 Gallup, Inc. All rights reserved. 20
France
Sampling:
A dual-frame (landline and mobile) sample design was used to complete around 1,000 telephone surveys in France, with roughly 500 interviews among those aged 15 to 24 and roughly 500 interviews among those aged 40 or older. The number of surveys completed for the 15 to 24 and 40 and older age groups was 500 each. The number of completed landline and mobile surveys was 250 and 750, respectively. A dual-frame sample design was employed to increase the coverage of the target population. Based on the International Telecommunication Union’s (ITU) report on fixed-telephone and mobile subscriptions in 2019, there were 37,797,000 landline subscriptions in France — about 58.03 landline subscriptions per 100 inhabitants — and there were 72,043,000 mobile subscriptions, about 110.61 mobile subscriptions per 100 inhabitants.
Target Population/Coverage:
The target population of this survey was the population aged 15 to 24 or 40 and older in France, excluding the overseas areas. Note that people in the age group 25 to 39 were not eligible for this survey. The sampling frame excluded individuals who neither lived in households with landline phones nor had any access to mobile phones (i.e., those who were neither living in households with a landline phone nor had their own mobile phones). The exact coverage error (percentage of target population not accessible for sampling) was unknown but was expected to be around 1.4% after accounting for the percentage of people who had no telephone coverage.
Stratification:
The landline sampling frame was explicitly stratified by NUTS2 (Nomenclature of Territorial Units) regions with implicit stratification by NUTS3 regions within each NUTS2 region. For this stratification, the 2016 definition of the NUTS regions was used. The mobile sampling frame was explicitly stratified into the following three strata — Stratum 1: mobile high probability 15 to 24; Stratum 2: mobile high probability 40 and older; Stratum 3: mobile (rest of the sample not included in Stratum 1 or 2). The sample vendor first drew a simple random sample and then used relevant information (sample enrichment data from social media platforms and other publicly available sources) to stratify the initial RDD sample into the three strata described above. Telephone numbers more likely to be linked to individuals in the 15 to 24 age group were flagged and assigned to Stratum 1. Similarly, telephone numbers more likely to be linked to individuals in the age group 40 and older were assigned to Stratum 2. The remaining numbers in the sample were assigned to the residual stratum, or Stratum 3.
Sample Selection:
A stratified sample design was used for selecting landline numbers. Within each explicit stratum (the 22 regions) a sample of specified size was drawn using list-assisted Random Digit Dial (RDD) procedures. Sampling was done independently within each stratum. For landline numbers, once a household was reached, one person from the eligible age range (15 to 24 or 40 and older) was selected at random (using the “next birthday method”) from all eligible persons living in that household. The “next birthday method” involved asking the respondent answering the phone to identify among those living in the household the person who had the next birthday. For the mobile frame, sampling was also done independently within each of the three mobile strata described above. A simple random sample of specified size was drawn from each stratum. The person answering the mobile phone number was selected so no within-household selection method was used for the mobile sample. To

2021 UNICEF Changing Childhood Survey Technical Report
Copyright © 2021 Gallup, Inc. All rights reserved. 21
achieve the targeted number (500) of interviews from the 15 to 24 age group, a disproportional sample allocation across the three strata was used. This involved oversampling of the Stratum 1. Business phone numbers and telephone numbers on blacklists (such as “do not call lists”) were screened out of the sample as well. For the purpose of data collection, the total initial sample was split into random subsamples (replicates) and released sequentially based on the progress of interviewing in different strata. The goal was to release an optimum amount of sample each time to achieve a high response rate while completing the targeted number of interviews within the field period. Each sampled number was dialed up to five times at different times of day and different days of the week, including weekends, to increase the chances of contacting and selecting a respondent. The outcome of each call attempt was recorded using a standard set of 25 disposition codes to facilitate the calculation of response rates based on American Association of Public Opinion Research (AAPOR) standards.
Data Collection:
Data was gathered between February 5-March 10, 2021. AAPOR3 response rate: 7%
Language of Interviews:
French
Weighting:
The sample data was weighted to minimize bias in survey-based estimates. The weighting procedure was formulated based on the sample design and was carried out in multiple stages. The landline and mobile samples were first separately weighted and then combined using composite weighting procedures described below. For each sample (landline and mobile), a probability weight factor (base weight) was constructed to account for selection of telephone numbers from each sampling stratum. For the landline sample involving within-household selection, the base weights were also adjusted to account for unequal selection probabilities due to selection of one eligible person from the selected household. At the next step, the landline and mobile samples with the base weights as the initial weights were post-stratified separately to adjust for nonresponse and to match the weighted sample totals to known target population totals obtained from country-level census data. The variables included in post-stratification were age groups; age by gender; age by education; region (landline) and age by region (mobile). Once each sample (landline and mobile) was weighted to project to the target population (15 to 24 and 40 and older persons living in France), the two sets of weights were then combined using the following composite weighting procedure. Let n1 and n2 be the sample sizes for the landline and mobile samples, respectively. Suppose deff1 and deff2 are the design effects associated with the landline and mobile samples. These deff numbers could be estimated from the respective samples using Kish’s approximate method [Estimated Design Effect = (Sample size) * (Sum of the squared weights)/(Square of the sum of weights)]. The final weight (𝑓𝑛𝑤𝑡𝑖) assigned to each case in the combined (landline and mobile sample completed cases) data set of size (n1 + n2) was calculated as:
𝑓𝑛𝑤𝑡𝑖 =[(
n1deff1
) ∗ LLWi + (n2deff2
) ∗ CWi]
[(n1deff1
) + (n2deff2
)]
[i=1, 2, 3, …, (n1 + n2)]

2021 UNICEF Changing Childhood Survey Technical Report
Copyright © 2021 Gallup, Inc. All rights reserved. 22
In the end, the post-stratified weights were trimmed to avoid extreme weights and then normalized to ensure the total weights sum to the number of completed interviews.
Design Effect:
4.85 for age group 15 to 24, 1.74 for age group 40 and older
Margin of Error:
9.65% for age group 15 to 24, 5.79% for age group 40 and older
Population Sources Used for Constructing Weights:
Age, education, gender: Eurostat – Census Hub, Census 2011 Region: Eurostat 2018
AGE_GROUP SAMPLE_UNWTD TARGET SAMPLE_WTD
15 to 19 10.00 9.98 9.78
20 to 24 40.00 9.89 10.65
40 to 49 10.50 22.42 20.89
50 and older 39.50 57.71 58.68
AGE_GENDER SAMPLE_UNWTD TARGET SAMPLE_WTD
15 to 24, Male 22.90 10.06 10.18
15 to 24, Female 27.10 9.81 10.25
40 and older, Male 25.20 37.19 36.86
40 and older, Female 24.80 42.94 42.71
AGE_EDUCATION SAMPLE_UNWTD TARGET SAMPLE_WTD
15 to 24, Lower sec or less 12.00 8.13 8.34
15 to 24, Sec/Voc/Technical college 23.10 8.65 7.64
15 to 24, Short cycle university and up 14.90 3.09 4.45
40 and older, Lower sec or less 9.10 34.38 31.16
40 and older, Sec/Voc/Technical college 15.00 30.14 31.74
40 and older, Short cycle univ and up 25.90 15.61 16.67

2021 UNICEF Changing Childhood Survey Technical Report
Copyright © 2021 Gallup, Inc. All rights reserved. 23
AGE_REGION SAMPLE_UNWTD TARGET SAMPLE_WTD
15 to 24, Grand Est 3.50 1.70 1.65
15 to 24, Nouvelle-Aquitaine 3.90 1.70 1.62
15 to 24, Auvergne Rhone-Alps 6.90 2.47 2.71
15 to 24, Bourgogne Franche-Comte 2.50 0.81 0.82
15 to 24, Brittany 3.00 0.99 0.96
15 to 24, Center-Val De Loire 2.60 0.73 0.55
15 to 24, Corsica 0.70 0.08 0.78
15 to 24, Paris-Isle-of-France 10.50 4.05 4.58
15 to 24, Occitanie 4.30 1.76 1.31
15 to 24, Hauts-De-France 4.20 1.98 2.45
15 to 24, Normandy 2.30 1.01 1.28
15 to 24, Pays De La Loire 2.20 1.16 0.86
15 to 24, Provence - Alpes - Azur 3.40 1.43 0.87
40 and older, Grand Est 3.60 6.97 6.23
40 and older, Nouvelle-Aquitaine 5.70 8.04 8.77
40 and older, Auvergne Rhone-Alps 6.40 9.77 9.67
40 and older, Bourgogne Franche-Comte 1.40 3.69 1.92
40 and older, Brittany 3.00 4.33 4.72
40 and older, Center-Val De Loire 2.20 3.34 4.65
40 and older, Corsica 0.50 0.46 0.79
40 and older, Paris-Isle-of-France 9.80 13.33 13.33
40 and older, Occitanie 3.90 7.64 8.02
40 and older, Hauts-De-France 3.20 7.05 6.68
40 and older, Normandy 2.80 4.22 4.13
40 and older, Pays De La Loire 3.60 4.69 4.75
40 and older, Provence - Alpes – Azur 3.90 6.60 5.92

2021 UNICEF Changing Childhood Survey Technical Report
Copyright © 2021 Gallup, Inc. All rights reserved. 24
Germany
Sampling:
A dual-frame (landline and mobile) sample design was used to complete around 1,000 telephone surveys in Germany, with roughly 500 interviews among those aged 15 to 24 and roughly 500 interviews among those aged 40 or older. The number of surveys completed for the 15 to 24 and 40 and older age groups was 500 each. The number of completed landline and mobile surveys was 252 and 748, respectively. A dual-frame sample design was employed to increase the coverage of the target population. Based on the International Telecommunication Union (ITU)’s report on fixed-telephone and mobile subscriptions in 2019, there were 40,400,000 landline subscriptions in Germany — about 48.37 landline subscriptions per 100 inhabitants — and there were 107,200,000 mobile subscriptions, about 128.36 mobile subscriptions per 100 inhabitants.
Target Population/Coverage:
The target population of this survey was the population aged 15 to 24 or 40 and older in Germany. Note that people in the age group 25 to 39 were not eligible for this survey. The sampling frame excluded individuals who neither lived in households with landline phones nor had any access to mobile phones (i.e., those who were neither living in households with a landline phone nor had their own mobile phones). The exact coverage error (percentage of target population not accessible for sampling) was unknown but was expected to be around 0.6% after taking into account the percentage of people who had no telephone coverage.
Stratification:
The landline sampling frame was explicitly stratified by NUTS2 (Nomenclature of Territorial Units) regions with implicit stratification by NUTS3 regions within each NUTS2 region. For this stratification, the 2016 definition of the NUTS regions was used. The mobile sampling frame was explicitly stratified into the following three strata — Stratum 1: mobile high probability 15 to 24; Stratum 2: mobile high probability 40 and older; Stratum 3: mobile (rest of the sample not included in Stratum 1 or 2). The sample vendor first drew a simple random sample and then used relevant information (sample enrichment data from social media platforms and other publicly available information) to stratify the initial RDD sample into the three strata described above. Telephone numbers more likely to be linked to individuals in the 15 to 24 age group were flagged and assigned to Stratum 1. Similarly, telephone numbers more likely to be linked to individuals in the age group 40 and older were assigned to Stratum 2. The remaining numbers in the sample were assigned to the residual stratum, or Stratum 3.
Sample Selection:
A stratified sample design was used for selecting landline numbers. Within each explicit stratum (the 38 regions) a sample of specified size was drawn using list-assisted Random Digit Dial (RDD) procedures. Sampling was done independently within each stratum. For landline numbers, once a household was reached, one person from the eligible age range (15 to 24 or 40 and older) was selected at random (using the “next birthday method”) from all eligible persons living in that household. The “next birthday method” involved asking the respondent answering the phone to identify among those living in the household the person who had the next birthday. For the mobile frame, sampling was also done independently within each of the three mobile strata described above. A simple random sample of specified size was drawn from each stratum. The person answering the mobile phone number was selected so no within-household selection method had to be used for the mobile sample. In order to

2021 UNICEF Changing Childhood Survey Technical Report
Copyright © 2021 Gallup, Inc. All rights reserved. 25
achieve the targeted number (500) of interviews from the 15 to 24 age group, a disproportional sample allocation across the three strata had to be used. This involved oversampling of the Stratum 1. Business phone numbers and telephone numbers on blacklists (such as “do not call lists”) were screened out of the sample as well. For data collection, the total initial sample was split into random subsamples (replicates) and released sequentially based on the progress of interviewing in different strata. The goal was to release an optimum amount of sample each time to achieve a high response rate while completing the targeted number of interviews within the field period. Each sampled number was dialed up to five times at different times of day and different days of the week, including weekends, to increase the chances of contacting and selecting a respondent. The outcome of each call attempt was recorded using a standard set of 25 disposition codes to facilitate the calculation of response rates based on American Association of Public Opinion Research (AAPOR) standards.
Data Collection:
Data was gathered between February 5-March 11, 2021. AAPOR3 response rate: 6%
Language of Interviews:
German
Weighting:
The sample data was weighted to minimize bias in survey-based estimates. The weighting procedure was formulated based on the sample design and was carried out in multiple stages. The landline and mobile samples were first separately weighted and then combined using composite weighting procedures described below. For each sample (landline and mobile), a probability weight factor (base weight) was constructed to account for selection of telephone numbers from each sampling stratum. For the landline sample involving within-household selection, the base weights were also adjusted to account for unequal selection probabilities due to selection of one eligible person from the selected household. At the next step, the landline and mobile samples with the base weights as the initial weights were post-stratified separately to adjust for nonresponse and to match the weighted sample totals to known target population totals obtained from country-level census data. The variables included in post-stratification were age groups; age by gender; age by education; region (landline) and age by region (mobile). Once each sample (landline and mobile) was weighted to project to the target population (15 to 24 and 40 and older persons living in Germany), the two sets of weights were then combined using the following composite weighting procedure. Let n1 and n2 be the sample sizes for landline and mobile samples, respectively. Suppose deff1 and deff2 are the design effects associated with the landline and mobile samples. These deff numbers could be estimated from the respective samples using Kish’s approximate method [Estimated Design Effect = (Sample size) * (Sum of the squared weights)/(Square of the sum of weights)]. The final weight (𝑓𝑛𝑤𝑡𝑖) assigned to each case in the combined (landline and mobile sample completed cases) data set of size (n1 + n2) was calculated as:
𝑓𝑛𝑤𝑡𝑖 =[(
n1deff1
) ∗ LLWi + (n2deff2
) ∗ CWi]
[(n1deff1
) + (n2deff2
)]
[i=1, 2, 3, …, (n1 + n2)]

2021 UNICEF Changing Childhood Survey Technical Report
Copyright © 2021 Gallup, Inc. All rights reserved. 26
In the end, the post-stratified weights were trimmed to avoid extreme weights and then normalized to ensure the total weights sum to the number of completed interviews.
Design Effect:
5.01 for age group 15 to 24, 1.44 for age group 40 and older
Margin of Error:
9.81% for age group 15 to 24, 5.25% for age group 40 and older
Population Sources Used for Constructing Weights:
Age, education, gender: Eurostat – Census Hub, Census 2011 Region: Eurostat 2018
AGE_GROUP SAMPLE_UNWTD TARGET SAMPLE_WTD
15 to 19 11.60 7.31 7.15
20 to 24 38.40 8.87 9.37
40 to 49 8.70 24.24 22.54
50 and older 41.30 59.58 60.94
AGE_GENDER SAMPLE_UNWTD TARGET SAMPLE_WTD
15 to 24, Male 27.50 8.25 8.71
15 to 24, Female 22.50 7.93 7.81
40 and older, Male 26.20 39.66 40.24
40 and older, Female 23.80 44.16 43.24
AGE_EDUCATION SAMPLE_UNWTD TARGET SAMPLE_WTD
15 to 24, Gen sec or less 13.60 8.71 8.60
15 to 24, Sec/Voc/HS diploma 33.50 6.67 7.22
15 to 24, Univ or higher 2.90 0.80 0.70
40 and older, Gen sec or less 5.00 17.34 15.42
40 and older, Sec/Voc/HS diploma 30.60 44.00 45.18
40 and older, Univ or higher 14.40 22.48 22.88

2021 UNICEF Changing Childhood Survey Technical Report
Copyright © 2021 Gallup, Inc. All rights reserved. 27
AGE_REGION SAMPLE_UNWTD TARGET SAMPLE_WTD
15 to 24, Schleswig-Holstein 1.50 0.57 0.42
15 to 24, Hamburg 0.80 0.33 0.24
15 to 24, Niedersachsen 5.70 1.61 1.23
15 to 24, Bremen 0.60 0.14 0.18
15 to 24, Nordrhein-Westfalen 11.30 3.67 3.78
15 to 24, Hessen 4.30 1.20 0.88
15 to 24, Rheinland-Pfalz 2.40 0.85 0.93
15 to 24, Baden-Württemberg 5.30 2.28 3.43
15 to 24, Bayern 9.50 2.60 2.43
15 to 24, Saarland 0.50 0.20 0.14
15 to 24, Berlin 2.10 0.63 0.45
15 to 24, Brandenburg 1.20 0.40 0.29
15 to 24, Mecklenburg-Vorpommern 0.50 0.28 0.21
15 to 24, Sachsen 2.10 0.67 0.49
15 to 24, Sachsen-Anhalt 1.30 0.39 0.78
15 to 24, Thüringen 0.90 0.38 0.65
40 and older, Schleswig-Holstein 2.00 3.00 3.66
40 and older, Hamburg 1.40 1.65 1.52
40 and older, Niedersachsen 3.20 8.16 8.08
40 and older, Bremen 0.70 0.66 0.74
40 and older, Nordrhein-Westfalen 10.20 18.23 17.31
40 and older, Hessen 2.60 6.18 6.60
40 and older, Rheinland-Pfalz 3.20 4.22 4.97
40 and older, Baden-Württemberg 6.30 10.56 9.38
40 and older, Bayern 5.80 12.63 12.16
40 and older, Saarland 0.50 1.11 0.67
40 and older, Berlin 2.90 3.27 3.64
40 and older, Brandenburg 1.60 2.81 3.08
40 and older, Mecklenburg-Vorpommern
1.20 1.78 1.91
40 and older, Sachsen 4.40 4.49 4.94
40 and older, Sachsen-Anhalt 1.40 2.63 2.40
40 and older, Thüringen 2.60 2.46 2.43

2021 UNICEF Changing Childhood Survey Technical Report
Copyright © 2021 Gallup, Inc. All rights reserved. 28
India
Sampling:
A mobile-only sample design was used to complete 1,500 telephone surveys in India, with 750 interviews among those aged 15 to 24 and 750 interviews among those aged 40 or older. A mobile-only sample design was used due to the high mobile penetration in India. Based on the International Telecommunication Union (ITU)’s 2018 report on fixed-telephone and mobile subscriptions, there were 21,868,192 landline subscriptions — about 1.6 landline subscriptions per 100 inhabitants — and there were 1,176,021,869 mobile subscriptions, about 86.9 mobile subscriptions per 100 inhabitants. Based on the Demographic and Health Survey 2015-16, 3.9% of households possessed a landline phone and 90.4% of households possessed a mobile phone.
Target Population/Coverage:
The target population of this survey was the adult population aged 15 to 24 or 40 and older in India. The sampling frame excluded individuals who had no access to mobile phones (i.e., those who were neither living in households with a mobile phone nor had their own mobile phones). The coverage error (percentage of target population not accessible for sampling) was expected to be approximately 10%.
Stratification:
The mobile sampling frame was constructed based on the National Numbering Plan 2003 from the Department of Telecommunications. The mobile sampling frame was explicitly stratified by the following 18 regions: Andhra Pradesh & Telangana, Assam, Bihar & Jharkhand, Delhi, Gujarat, Haryana, Himachal Pradesh, Jammu & Kashmir, Karnataka, Kerala & Lakshadweep, Madhya Pradesh & Chhattisgarh, Maharashtra & Goa (including Mumbai), Odisha, Punjab & Chandigarh, Rajasthan, Tamil Nadu, UP (East and West) and West Bengal (including Kolkata). For the mobile frame, samples were allocated into the 18 strata proportional to each region’s 15 and older population.
Sample Selection:
A simple stratified sample design was used for selecting mobile numbers. Within each explicit stratum (the 18 regions) a sample of specified size was drawn using pure Random Digit Dial (RDD) procedures. Sampling was done independently within each stratum. The generated mobile sample was screened to identify and remove nonworking numbers. Business phone numbers and telephone numbers on blacklists (such as “do not call lists”) were screened out of the sample as well. In the case of households with more than one adult respondent, a respondent was randomly selected among all the adults aged 15 to 24 or 40 and older living in the household by asking for the person in the chosen age and gender category who had the next birthday. For data collection, the total initial sample was split into random subsamples (replicate samples) and released sequentially based on the progress of interviewing in different strata. The goal was to release an optimum amount of sample each time to achieve a high response rate while completing the targeted number of interviews within the field period. Each sampled number was dialed up to five times at different times of day and different days of the week, including weekends, to increase the chances of contacting and selecting a respondent. The outcome of each call attempt was recorded using a standard set of 25 disposition codes to facilitate the calculation of response rates based on American Association of Public Opinion Research (AAPOR) standards.

2021 UNICEF Changing Childhood Survey Technical Report
Copyright © 2021 Gallup, Inc. All rights reserved. 29
Data Collection:
Data was gathered between March 6-April 20, 2021. AAPOR3 response rate: 4%
Language of Interviews:
Bengali, Gujarati, Hindi, Kannada, Malayalam, Marathi, Tamil, Telugu, Oriya, Punjabi, Assamese
Weighting:
The sample data was weighted to minimize bias in survey-based estimates. The weighting procedure was formulated based on the sample design and was carried out in multiple stages. A probability weight factor (base weight) was constructed to account for unequal selection probabilities because of selection of phone numbers from the respective mobile strata, households with multiple mobile numbers, and selecting one adult among the chosen age and gender category within households. At the next step, the base weights were post-stratified on age, age by gender, age by education, age by region and age by religion to adjust for nonresponse and to match the weighted sample totals to known target population totals obtained from country-level census data. In the end, the post-stratified weights were trimmed to avoid extreme weights and then normalized to ensure the total weights sum to the number of completed interviews.
Design Effect:
2.51 for age group 15 to 24, 1.98 for age group 40 and older
Margin of Error:
5.7% for age group 15 to 24, 5.0% for age group 40 and older
Population Sources Used for Constructing Weights:
Age, education, gender, region, religion: India Census 2011, Office of the Registrar General & Census Commissioner, India
AGE_GROUP SAMPLE_UNWTD TARGET SAMPLE_WTD
15 to 19 18.00 21.57 22.08
20 to 24 32.00 19.94 20.81
40 to 49 33.47 24.12 27.86
50 and older 16.53 34.37 29.26
AGE_SEX SAMPLE_UNWTD TARGET SAMPLE_WTD
15 to 24, Male 33.60 21.76 23.04
15 to 24, Female 16.40 19.75 19.85
40 and older, Male 31.80 29.72 29.79
40 and older, Female 18.20 28.77 27.33

2021 UNICEF Changing Childhood Survey Technical Report
Copyright © 2021 Gallup, Inc. All rights reserved. 30
AGE_EDUCATION SAMPLE_UNWTD TARGET SAMPLE_WTD
15 to 24, Illiterate or no school (1) 2.33 5.75 5.25
15 to 24, Below secondary (2) 9.47 18.08 17.59
15 to 24, SSC/HSC (3) 15.40 14.68 16.14
15 to 24, College and above (4-6) 22.80 3.00 3.90
40 and older, Illiterate or no school (1) 8.27 26.67 21.31
40 and older, Below secondary (2) 14.27 19.51 20.96
40 and older, SSC/HSC (3) 14.00 7.73 9.30
40 and older, College and above (4-6) 13.47 4.58 5.54
AGE_REGION SAMPLE_UNWTD TARGET SAMPLE_WTD
15 to 24, Central 5.07 3.31 3.84
15 to 24, East 11.27 10.09 9.87
15 to 24, West 8.33 6.35 7.12
15 to 24, North 15.07 12.26 13.53
15 to 24, South 10.27 9.51 8.53
40 and older, Central 3.27 4.66 4.63
40 and older, East 13.53 14.21 15.26
40 and older, West 6.87 8.95 8.77
40 and older, North 14.47 17.27 16.41
40 and older, South 11.87 13.40 12.05
AGE_RELIGION SAMPLE_UNWTD TARGET SAMPLE_WTD
15 to 24, Muslim 6.47 6.41 5.84
15 to 24, Hindu 37.93 32.75 34.24
15 to 24, Christian 1.07 0.90 1.00
15 to 24, Other 4.53 1.45 1.80
40 and older, Muslim 5.40 6.66 6.30
40 and older, Hindu 39.60 47.97 46.97
40 and older, Christian 0.53 1.57 1.08
40 and older, Other 4.47 2.29 2.76

2021 UNICEF Changing Childhood Survey Technical Report
Copyright © 2021 Gallup, Inc. All rights reserved. 31
Indonesia
Sampling:
A mobile-only sample design was used to complete 1,041 telephone surveys in Indonesia, with 529 interviews among those aged 15 to 24 and roughly 512 interviews among those aged 40 or older. A mobile-only sample design was used due to the high penetration rate in Indonesia. Based on the International Telecommunication Union (ITU)’s 2018 report on fixed-telephone and mobile subscriptions, there were 8,303,511 landline subscriptions — about 3.1 landline subscriptions per 100 inhabitants — and there were 319,434,605 mobile subscriptions, about 119.3 mobile subscriptions per 100 inhabitants. Based on ITU’s estimates on core household indicators, 2.6% of households had a fixed-line telephone, 89.9% of households had a mobile telephone and 73.8% of individuals (15 or older) used a mobile telephone in 2018.
Target Population/Coverage:
The target population of this survey was the adult population aged 15 to 24 or 40 and older in Indonesia. The sampling frame excluded individuals who had no access to mobile phones (i.e., those who were neither living in households with a mobile phone nor had their own mobile phones). The coverage error (percentage of target population not accessible for sampling) was expected to be approximately 20%.
Stratification:
The mobile sampling frame was constructed based on the numbering regulations from the Minister of Communication and Information in the Republic of Indonesia. The mobile sampling frame was implicitly stratified by the following six service providers: PT Hutchison 3 Indonesia, PT Indosat, PT Sampoerna Telekomunikasi Indonesia, PT Smartfren Telecom/PT Smart Telecom, PT Telkomsel and PT XL Axiata.
Sample Selection:
Pure Random Digit Dial was used to draw a required sample size of mobile numbers. The generated mobile sample was screened to identify and remove nonworking numbers. Business phone numbers and telephone numbers on blacklists (such as “do not call lists”) were screened out of the sample as well. In the case of households with more than one adult respondent, a respondent was randomly selected among all adults aged 15 to 24 or 40 and older living in the household by asking for the person in the chosen age and gender category who had the next birthday. In addition to the RDD sample, to meet sample size requirements particularly for the 15 to 24 age group, a random sample of respondents from the recontact sample collected from Gallup’s World Poll 2020 project was used. In the case of individuals contacted from this sample source, there was no respondent selection, just confirmation of age and gender to ensure eligibility. For the purpose of data collection, the total initial sample was split into random subsamples (replicate samples) and released sequentially based on the progress of interviewing in different strata. The targeted sample constituted its own replicate so it was easy to release this sample as required. The goal was to release an optimum amount of sample each time to achieve a high response rate while completing the targeted number of interviews within the field period. Each sampled number was dialed up to five times at different times of day and different days of the week, including weekends, to increase

2021 UNICEF Changing Childhood Survey Technical Report
Copyright © 2021 Gallup, Inc. All rights reserved. 32
the chances of contacting and selecting a respondent. The outcome of each call attempt was recorded using a standard set of 25 disposition codes to facilitate the calculation of response rates based on American Association of Public Opinion Research (AAPOR) standards.
Data Collection:
Data was gathered between March 1-April 28, 2021. AAPOR3 response rate: 7%
Language of Interviews:
Bahasa Indonesian
Weighting:
The sample data was weighted to minimize bias in survey-based estimates. The weighting procedure was formulated based on the sample design and was carried out in multiple stages. Because the sample used for the World Poll 2020 project was generated in the same way as the RDD sample used for this project and only 24 completed interviews were from the recontact sample, the recontact sample was treated as part of the RDD sample during weighting. A probability weight factor (base weight) was constructed to account for unequal selection probabilities because of selection of phone numbers from the mobile frame, households with multiple mobile numbers, and selecting one adult among the chosen age and gender category within households. At the next step, the base weights were post-stratified on age, age by gender, age by education and age by region to adjust for nonresponse and to match the weighted sample totals to known target population totals obtained from country-level census data. In the end, the post-stratified weights were trimmed to avoid extreme weights and then normalized to ensure the total weights sum to the number of completed interviews.
Design Effect:
3.56 for age group 15 to 24, 4.35 for age group 40 and older
Margin of Error:
5.7% for age group 15 to 24, 6.3% for age group 40 and older
Population Sources Used for Constructing Weights:
Age, education, gender: Indonesia Population Census 2010, National Bureau of Statistics Region: 2015 Intercensal Population Survey, Statistics Indonesia
AGE_GROUP SAMPLE_UNWTD TARGET SAMPLE_WTD
15 to 19 23.34 19.09 20.64
20 to 24 27.47 18.18 20.69
40 to 49 30.64 27.94 28.31
50 and older 18.54 34.79 30.35
2021 UNICEF Changing Childhood Survey Technical Report
Copyright © 2021 Gallup, Inc. All rights reserved. 33
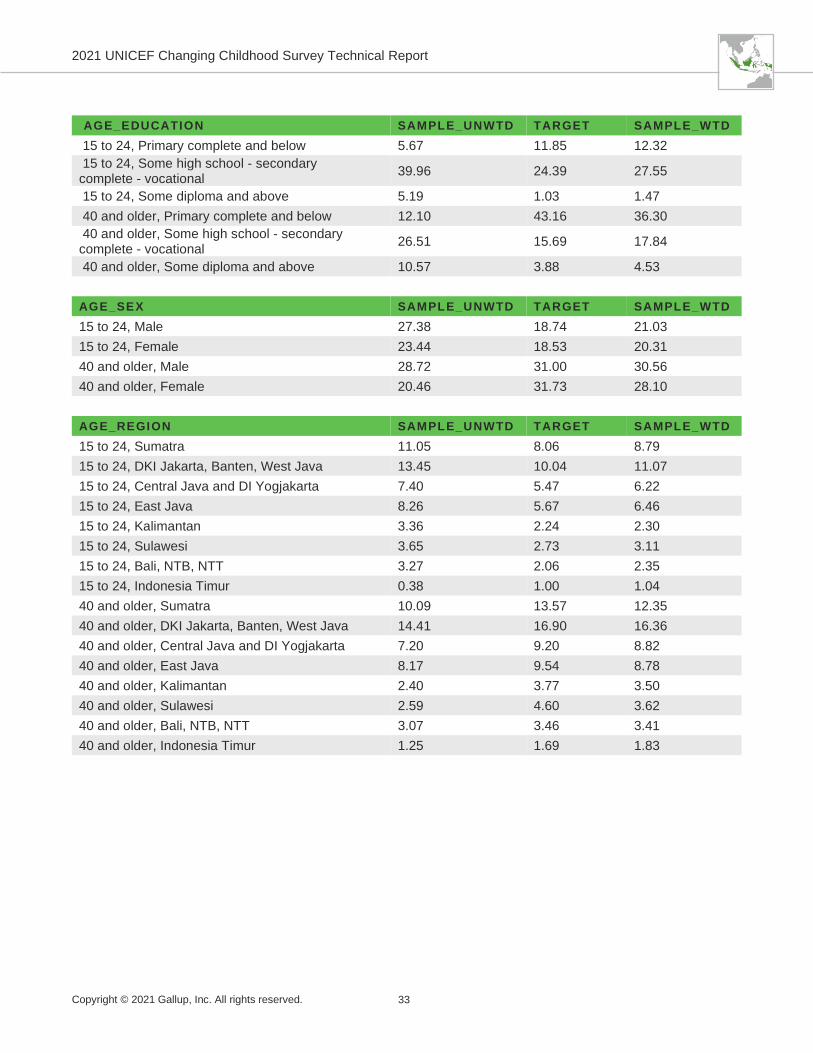
AGE_EDUCATION SAMPLE_UNWTD TARGET SAMPLE_WTD
15 to 24, Primary complete and below 5.67 11.85 12.32
15 to 24, Some high school - secondary complete - vocational
39.96 24.39 27.55
15 to 24, Some diploma and above 5.19 1.03 1.47
40 and older, Primary complete and below 12.10 43.16 36.30
40 and older, Some high school - secondary complete - vocational
26.51 15.69 17.84
40 and older, Some diploma and above 10.57 3.88 4.53
AGE_SEX SAMPLE_UNWTD TARGET SAMPLE_WTD
15 to 24, Male 27.38 18.74 21.03
15 to 24, Female 23.44 18.53 20.31
40 and older, Male 28.72 31.00 30.56
40 and older, Female 20.46 31.73 28.10
AGE_REGION SAMPLE_UNWTD TARGET SAMPLE_WTD
15 to 24, Sumatra 11.05 8.06 8.79
15 to 24, DKI Jakarta, Banten, West Java 13.45 10.04 11.07
15 to 24, Central Java and DI Yogjakarta 7.40 5.47 6.22
15 to 24, East Java 8.26 5.67 6.46
15 to 24, Kalimantan 3.36 2.24 2.30
15 to 24, Sulawesi 3.65 2.73 3.11
15 to 24, Bali, NTB, NTT 3.27 2.06 2.35
15 to 24, Indonesia Timur 0.38 1.00 1.04
40 and older, Sumatra 10.09 13.57 12.35
40 and older, DKI Jakarta, Banten, West Java 14.41 16.90 16.36
40 and older, Central Java and DI Yogjakarta 7.20 9.20 8.82
40 and older, East Java 8.17 9.54 8.78
40 and older, Kalimantan 2.40 3.77 3.50
40 and older, Sulawesi 2.59 4.60 3.62
40 and older, Bali, NTB, NTT 3.07 3.46 3.41
40 and older, Indonesia Timur 1.25 1.69 1.83

2021 UNICEF Changing Childhood Survey Technical Report
Copyright © 2021 Gallup, Inc. All rights reserved. 34
Japan
Sampling:
A dual-frame (landline and mobile) sample design was used to complete 1,019 telephone surveys in Japan, with 501 interviews among those aged 15 to 24 and 518 interviews among those aged 40 or older. A dual-frame sample design was selected to increase the coverage rate of the target population. Based on the International Telecommunication Union’s 2018 report on core household indicators, Japan has about 50 landline subscriptions per 100 inhabitants and about 144 mobile subscriptions per 100 inhabitants.
Target Population/Coverage:
The target population of this survey was the adult population aged 15 to 24 or 40 and older in Japan. The sampling frame excluded individuals who neither lived in households with landline phones nor had any access to mobile phones (i.e., those who were neither living in households with a landline phone nor had their own mobile phones). The exact coverage error (percentage of target population not accessible for sampling) was unknown but was expected to be less than 1%.
Stratification:
The landline and mobile sampling frames were constructed based on the database of six-digit landline and mobile prefixes issued by the Ministry of Internal Affairs and Communications. The landline sampling frame was explicitly stratified by the following 11 regions: Hokkaido, Tohoku, Kanto, Hokuriku, Koshinetsu, Tokai, Chukyo, Kansai, Chugoku, Shikoku and Kyushu. The mobile sampling frame was implicitly stratified by service providers. For the landline frame, samples were allocated into the 11 strata proportional to each region’s 15 and older population.
Sample Selection:
A simple stratified sample design was used for selecting landline numbers. Within each explicit stratum (the 11 regions) a sample of specified size was drawn using list-assisted Random Digit Dial (RDD) procedures. Sampling was done independently within each stratum. In the case of the mobile frame, pure RDD was used to draw the required sample size. The generated mobile sample was screened to identify and remove nonworking numbers. Business phone numbers and telephone numbers on blacklists (such as “do not call lists”) were screened out of the sample as well. In the case of landline households with more than one adult respondent, a respondent was randomly selected among all adults aged 15 to 24 or 40 and older living in the household by asking for the person in the chosen age category who had the next birthday. Respondents reached via mobile phone did not have any further selection other than ensuring they fell into one of the two age categories: 15 to 24 or 40 and older. In addition to the RDD sample, to meet sample size requirements particularly for the 15 to 24 age group, a random sample of respondents from an age-targeted database using opt-in methodology was used. In the case of individuals contacted from this sample source, there was no respondent selection, just confirmation of age and gender to ensure eligibility.
For data collection, the total initial sample was split into random subsamples (replicate samples) and released sequentially based on the progress of interviewing in different strata. The targeted sample constituted its own replicate, so it was easy to release this sample as required. The goal was to release

2021 UNICEF Changing Childhood Survey Technical Report
Copyright © 2021 Gallup, Inc. All rights reserved. 35
an optimum amount of sample each time to achieve a high response rate while completing the targeted number of interviews within the field period. Each sampled number was dialed up to five times at different times of day and different days of the week, including weekends, to increase the chances of contacting and selecting a respondent. The outcome of each call attempt was recorded using a standard set of 25 disposition codes to facilitate the calculation of response rates based on American Association of Public Opinion Research (AAPOR) standards.
Data Collection:
Data was gathered between January 15-March 2, 2021. AAPOR3 response rate: 13%
Language of Interviews:
Japanese
Weighting:
The sample data was weighted to minimize bias in survey-based estimates. The weighting procedure was formulated based on the sample design and was carried out in multiple stages. For the RDD sample, a probability weight factor (base weight) was constructed to account for selection of telephone numbers from each sampling stratum and unequal selection probabilities due to selection of one eligible person from the selected household. For the age-targeted sample, the base weights were set to 1 for all respondents since they were selected from the targeted list with equal probability. At the next step, the RDD and age-targeted samples with the base weights as the initial weights were post-stratified separately to adjust for nonresponse and to match the weighted sample totals to known target population totals obtained from country-level census data. For the RDD sample, the variables included in post-stratification were age groups, age by gender, age by education and age by region, since it included both 15 to 24 and 40 and older completes. For the age-targeted sample, the variables included in post-stratification were age groups, gender, education and region, since it included completes aged 15 to 24 only. Once each sample (RDD and age-targeted samples) was weighted to project to the target population (15 to 24 and 40 and older persons living in Japan), the 15 to 24 completes of the RDD and age-targeted samples were then combined using the following composite weighting procedure. Let n1 and n2 be the sample sizes for RDD 15 to 24 and age-targeted 15 to 24 samples, respectively. Suppose deff1 and deff2 are the design effects associated with the RDD 15 to 24 and age-targeted 15 to 24 samples. These deff numbers could be estimated from the respective samples using Kish’s approximate method [Estimated Design Effect = (Sample size) * (Sum of the squared weights)/(Square of the sum of weights)]. The final weight (𝑓𝑛𝑤𝑡𝑖) assigned to each case in the combined (RDD and age-targeted cases) data set of size (n1 + n2) was calculated as:
𝑓𝑛𝑤𝑡𝑖 =[(
n1deff1
) ∗ RWi + (n2deff2
) ∗ 𝐴𝑊𝑖
[(n1deff1
) + (n2deff2
)]
[i=1, 2, 3, …, (n1 + n2)] Once the final weights were derived, weight trimming was used to avoid extreme weights.

2021 UNICEF Changing Childhood Survey Technical Report
Copyright © 2021 Gallup, Inc. All rights reserved. 36
Design Effect:
1.99 for age group 15 to 24, 1.13 for age group 40 and older
Margin of Error:
6.2% for age group 15 to 24, 4.6% for age group 40 and older
Population Sources Used for Constructing Weights:
Age, gender, region: Ministry of Internal Affairs and Communications 2019 Education: Employment Status Survey 2017
AGE_GROUP SAMPLE_UNWTD TARGET SAMPLE_WTD
15 to 19 14.43 6.56 6.98
20 to 24 34.74 6.76 7.62
40 to 49 10.40 20.94 21.45
50 and older 40.43 65.74 63.95
AGE_SEX SAMPLE_UNWTD TARGET SAMPLE_WTD
15 to 24, Male 30.32 6.82 7.66
15 to 24, Female 18.84 6.50 6.94
40 and older, Male 30.52 41.00 41.98
40 and older, Female 20.31 45.68 43.42
AGE_EDUCATION SAMPLE_UNWTD TARGET SAMPLE_WTD
15 to 24, Senior high and below 34.74 7.76 8.70
15 to 24, Professional training college - junior college
4.32 4.18 4.37
15 to 24, College, university, graduate 10.11 1.38 1.52
40 and older, Senior high and below 26.10 53.46 48.78
40 and older, Professional training college - junior college
10.79 16.17 17.72
40 and older, College, university, graduate 13.94 17.05 18.90
AGE_REGION SAMPLE_UNWTD TARGET SAMPLE_WTD
15 to 24, Northern Japan 3.83 1.40 1.55
15 to 24, Kanto 20.02 4.54 5.11
15 to 24, Chubu 9.72 2.47 2.75
15 to 24, Kansai 8.73 2.25 2.51
15 to 24, Southwestern Region 6.87 2.65 2.68
40 and older, Northern Japan 5.59 10.24 9.62
40 and older, Kanto 16.39 28.76 30.17
40 and older, Chubu 8.83 15.89 13.50
40 and older, Kansai 7.36 14.04 13.45
40 and older, Southwestern Region 12.66 17.76 18.66

2021 UNICEF Changing Childhood Survey Technical Report
Copyright © 2021 Gallup, Inc. All rights reserved. 37
Kenya
Sampling:
A mobile sample design was used to complete 1,006 telephone surveys in Kenya, with 506 interviews among those aged 15 to 24 and 500 interviews among those aged 40 or older. A mobile-only design was selected due to the high mobile penetration rate in Kenya. Based on the International Telecommunication Union (ITU)’s 2018 report on fixed-telephone and mobile subscriptions, there were 65,644 landline subscriptions — about 0.1 landline subscriptions per 100 inhabitants — and there were 49,501,430 mobile subscriptions, about 96.3 mobile subscriptions per 100 inhabitants. Based on the Demographic and Health Survey 2015 (MIS), 1.2% of households possessed a landline phone and 90.1% of households possessed a mobile phone.
Target Population/Coverage:
The target population of this survey was the adult population aged 15 to 24 or 40 and older in Kenya. The sampling frame excluded individuals who had no access to mobile phones (i.e., those who were neither living in households with a mobile phone nor had their own mobile phones). The coverage error (percentage of target population not accessible for sampling) was expected to be approximately 10%.
Stratification:
The mobile sampling frame was constructed based on the Telecommunication Numbering Plan for Kenya, from the Communications Authority of Kenya. The mobile sampling frame was implicitly stratified by the following six service providers: Airtel Networks Kenya Ltd, Safaricom PLC, Telkom Kenya Ltd, Jamii Telecoms Ltd, Infura and WiAfrica.
Sample Selection:
Pure Random Digit Dial was used to draw a required sample size of mobile numbers. The generated mobile sample was screened to identify and remove nonworking numbers. Business phone numbers and telephone numbers on blacklists (such as “do not call lists”) were screened out of the sample as well. In the case of households with more than one adult respondent, a respondent was randomly selected among all adults aged 15 to 24 or 40 and older living in the household by asking for the person in the chosen age and gender category who had the next birthday. For data collection, the total initial sample was split into random subsamples (replicate samples) and released sequentially based on the progress of interviewing in different strata. The goal was to release an optimum amount of sample each time to achieve a high response rate while completing the targeted number of interviews within the field period. Each sampled number was dialed up to five times at different times of day and different days of the week, including weekends, to increase the chances of contacting and selecting a respondent. The outcome of each call attempt was recorded using a standard set of 25 disposition codes to facilitate the calculation of response rates based on American Association of Public Opinion Research (AAPOR) standards.

2021 UNICEF Changing Childhood Survey Technical Report
Copyright © 2021 Gallup, Inc. All rights reserved. 38
Data Collection:
Data was gathered between March 8-30, 2021. AAPOR3 response rate: 24%
Language of Interviews:
English, Swahili, Kiswahili
Weighting:
The sample data was weighted to minimize bias in survey-based estimates. The weighting procedure was formulated based on the sample design and was carried out in multiple stages. A probability weight factor (base weight) was constructed to account for unequal selection probabilities because of selection of phone numbers from the mobile frame, households with multiple mobile numbers, and selecting one adult among the chosen age and gender category within households. At the next step, the base weights were post-stratified on age by gender, age by education and region to adjust for nonresponse and to match the weighted sample totals to known target population totals obtained from country-level census data. In the end, the post-stratified weights were trimmed to avoid extreme weights and then normalized to ensure the total weights sum to the number of completed interviews.
Design Effect:
3.10 for age group 15 to 24, 3.24 for age group 40 and older
Margin of Error:
7.7% for age group 15 to 24, 7.9% for age group 40 and older
Population Sources Used for Constructing Weights:
Age, gender, region: Kenya Population and Housing Census 2019, Kenya National Bureau of Statistics Education: DHS 2014
AGE_SEX SAMPLE_UNWTD TARGET SAMPLE_WTD
15 to 24, Male 25.25 25.33 23.97
15 to 24, Female 25.05 26.04 28.85
40 and older, Male 28.73 23.91 22.36
40 and older, Female 20.97 24.72 24.83
AGE_REGION SAMPLE_UNWTD TARGET SAMPLE_WTD
Nairobi 12.52 5.24 6.17
Central 4.37 11.53 8.48
Eastern 14.31 14.34 15.49
Nyanza 14.31 13.18 14.13
Rift Valley 26.24 26.81 27.14
Western 8.65 10.56 11.78
North Eastern 3.78 9.24 6.66
Coast 15.81 9.10 10.15

2021 UNICEF Changing Childhood Survey Technical Report
Copyright © 2021 Gallup, Inc. All rights reserved. 39
AGE_EDUCATION SAMPLE_UNWTD TARGET SAMPLE_WTD
15 to 24, Secondary and below (0-14) 24.55 47.09 47.72
15 to 24, Middle level/tech/univ (15-23) 25.75 4.29 5.09
40 and older, Secondary and below (0-14) 22.96 44.75 42.56
40 and older, Middle level/tech/univ (15-23) 26.74 3.88 4.62

2021 UNICEF Changing Childhood Survey Technical Report
Copyright © 2021 Gallup, Inc. All rights reserved. 40
Lebanon
Sampling:
A mobile-only sample design was used to complete 1,017 telephone surveys in Lebanon, with 503 interviews among those aged 15 to 24 and 514 interviews among those aged 40 or older. A mobile-only sample design was selected due to the high mobile penetration in Lebanon. Based on the International Telecommunication Union (ITU)’s 2018 report on fixed-telephone and mobile subscriptions in 2018, there were 893,529 landline subscriptions — about 13 landline subscriptions per 100 inhabitants — and there were 4,424,185 mobile subscriptions, about 64.5 mobile subscriptions per 100 inhabitants. Based on the Mobile Technology and Its Social Impact Survey 2018, conducted by Pew Research Center, about 89% of adults in Lebanon own or share a mobile phone.
Target Population/Coverage:
The target population of this survey was the adult population aged 15 to 24 or 40 and older in Lebanon. The sampling frame excluded individuals who do not own mobile phones for personal calls. The coverage error (percentage of target population not accessible for sampling) was expected to be less than 8% based on 2019 estimates from the World Poll.
Stratification:
The mobile sampling frames were constructed based on the National Numbering Plan of Lebanon from the Lebanese Ministry of Telecommunications. The mobile sampling frame was explicitly stratified by the following two mobile providers: Alfa and Touch. For the mobile frame, samples were allocated into the two strata proportional to each provider’s market share.
Sample Selection:
A simple stratified sample design was used for selecting mobile numbers. Within each explicit stratum (the two mobile providers) a sample of specified size was drawn using pure Random Digit Dial (RDD) procedures. Sampling was done independently within each stratum. The generated mobile sample was screened to identify and remove nonworking numbers. Business phone numbers and telephone numbers on blacklists (such as “do not call lists”) were screened out of the sample as well. Respondents reached via mobile phone did not have any further selection other than ensuring they fell into one of the two age categories: 15 to 24 or 40 and older. For data collection, the total initial sample was split into random subsamples (replicate samples) and released sequentially based on the progress of interviewing in different strata. The goal was to release an optimum amount of sample each time to achieve a high response rate while completing the targeted number of interviews within the field period. Each sampled number was dialed up to five times at different times of day and different days of the week, including weekends, to increase the chances of contacting and selecting a respondent. The outcome of each call attempt was recorded using a standard set of 25 disposition codes to facilitate the calculation of response rates based on American Association of Public Opinion Research (AAPOR) standards.

2021 UNICEF Changing Childhood Survey Technical Report
Copyright © 2021 Gallup, Inc. All rights reserved. 41
Data Collection:
Data was gathered between February 10-April 13, 2021. AAPOR3 response rate: 21%
Language of Interviews:
Arabic
Weighting:
The sample data was weighted to minimize bias in survey-based estimates. The weighting procedure was formulated based on the sample design and was carried out in multiple stages. A probability weight factor (base weight) was constructed to account for unequal selection probabilities as a result of selection of phone numbers from the respective mobile strata. At the next step, the base weights were post-stratified on age, age by gender, age by education and age by region to adjust for nonresponse and to match the weighted sample totals to known target population totals obtained from country-level census data. In the end, the post-stratified weights were trimmed to avoid extreme weights and then normalized to ensure the total weights sum to the number of completed interviews.
Design Effect:
1.48 for age group 15 to 24, 1.09 for age group 40 and older
Margin of Error:
5.3% for age group 15 to 24, 4.5% for age group 40 and older
Population Sources Used for Constructing Weights:
Age, gender: US Census IDB 2019 Education: MICS 2009 Region: Labour Force and Household Living Conditions Survey 2018-2019
AGE_GROUP SAMPLE_UNWTD TARGET SAMPLE_WTD
15 to 19 14.36 14.91 14.94
20 to 24 35.10 14.75 14.84
40 to 49 26.06 27.92 27.97
50 and older 24.48 42.41 42.26
AGE_SEX SAMPLE_UNWTD TARGET SAMPLE_WTD
15 to 24, Male 23.60 15.18 15.23
15 to 24, Female 25.86 14.49 14.55
40 and older, Male 27.63 33.90 33.94
40 and older, Female 22.91 36.44 36.28

2021 UNICEF Changing Childhood Survey Technical Report
Copyright © 2021 Gallup, Inc. All rights reserved. 42
AGE_EDUCATION SAMPLE_UNWTD TARGET SAMPLE_WTD
15 to 24, no education-primary complete inter incomp (0-3)
9.14 3.01 3.07
15 to 24, inter comp-secondary comp (4-6) 19.27 17.47 17.50
15 to 24, postsecondary comp (7-9) 21.04 9.19 9.21
40 and older, no educ-primary complete inter incomp (0-3)
22.81 34.75 34.64
40 and older, inter comp-secondary comp (4-6) 18.29 26.04 26.03
40 and older, postsecondary comp (7-9) 9.44 9.54 9.56
AGE_REGION SAMPLE_UNWTD TARGET SAMPLE_WTD
15 to 24, Beirut governorate 3.93 2.23 2.23
15 to 24, Nabatieh governorate 3.54 2.25 2.25
15 to 24, Beqaa governorate 6.19 1.80 1.83
15 to 24, North governorate 5.60 3.83 3.83
15 to 24, Mt Lebanon governorate 15.04 12.86 12.88
15 to 24, South governorate 6.39 3.49 3.49
15 to 24, Akkar governorate 3.83 1.78 1.78
15 to 24, Baalbak & Hermel 4.92 1.44 1.47
40 and older, Beirut governorate 3.34 5.28 5.27
40 and older, Nabatieh governorate 3.93 5.33 5.34
40 and older, Beqaa governorate 3.44 4.27 4.28
40 and older, North governorate 6.29 9.07 8.99
40 and older, Mt Lebanon governorate 22.32 30.48 30.47
40 and older, South governorate 6.00 8.26 8.25
40 and older, Akkar governorate 3.05 4.22 4.23
40 and older, Baalbak & Hermel 2.16 3.41 3.41

2021 UNICEF Changing Childhood Survey Technical Report
Copyright © 2021 Gallup, Inc. All rights reserved. 43
Mali
Sampling:
A mobile-only sample design was used to complete 1,004 telephone surveys in Mali, with 500 interviews among those aged 15 to 24 and 504 interviews among those aged 40 or older. A mobile-only sampling design was selected because of the high mobile penetration rate in Mali. Based on the International Telecommunication Union (ITU)’s 2018 report on fixed-telephone and mobile subscriptions in 2018, there were 228,097 landline subscriptions — about 1.2 landline subscriptions per 100 inhabitants — and there were 21,955,565 mobile subscriptions, about 115.1 mobile subscriptions per 100 inhabitants. Based on ITU’s estimates on core household indicators, 1.3% of households had a fixed-line telephone in 2018, and 89.8% of households had a mobile telephone in 2018.
Target Population/Coverage:
The target population of this survey was the adult population aged 15 to 24 or 40 and older in Mali. The sampling frame excluded individuals who had no access to mobile phones (i.e., those who were neither living in households with a mobile phone nor had their own mobile phones). The exact coverage error (percentage of target population not accessible for sampling) was unknown but was expected to be about 10%.
Stratification:
The mobile sampling frame was constructed based on the National Numbering Plan from the Autorité Malienne de Régulation des Télécommunications/TIC et des Postes (AMRTP), Bamako. The mobile sampling frame was explicitly stratified by the following three mobile service providers: Malitel, Telecel and Orange Mali SA. For the mobile frame, samples were allocated into the eight strata proportional to each provider’s market share.
Sample Selection:
A simple stratified sample design was used for selecting mobile numbers. Within each explicit stratum (the three providers) a sample of specified size was drawn using pure Random Digit Dial (RDD) procedures. Sampling was done independently within each stratum. The generated mobile sample was screened to identify and remove nonworking numbers. Business phone numbers and telephone numbers on blacklists (such as “do not call lists”) were screened out of the sample as well. In the case of landline households with more than one adult respondent, a respondent was randomly selected among all adults aged 15 to 24 or 40 and older living in the household by asking for the person in the chosen age and gender category who had the next birthday. In addition to the RDD sample, to meet sample size requirements particularly for the 40 and older age group, a random sample of respondents from the recontact list of Gallup’s World Poll project was used. In the case of individuals contacted from this sample source, there was no respondent selection, just confirmation of age and gender to ensure eligibility. For data collection, the total initial sample was split into random subsamples (replicate samples) and released sequentially based on the progress of interviewing in different strata. The targeted sample constituted its own replicate, so it was easy to release this sample as required. The goal was to release an optimum amount of sample each time to achieve a high response rate while completing the targeted number of interviews within the field period. Each sampled number was dialed

2021 UNICEF Changing Childhood Survey Technical Report
Copyright © 2021 Gallup, Inc. All rights reserved. 44
up to five times at different times of day and different days of the week, including weekends, to increase the chances of contacting and selecting a respondent. The outcome of each call attempt was recorded using a standard set of 25 disposition codes to facilitate the calculation of response rates based on American Association of Public Opinion Research (AAPOR) standards.
Data Collection:
Data was gathered between March 9-26, 2021. AAPOR3 response rate: 50%
Language of Interviews:
Bambara, French
Weighting:
The sample data was weighted to minimize bias in survey-based estimates. The weighting procedure was formulated based on the sample design and was carried out in multiple stages. For each sample (RDD and recontact), a probability weight factor (base weight) was constructed to account for selection of telephone numbers from each sampling stratum and unequal selection probabilities due to selection of one eligible person from the selected household. The whole data set was divided into three groups based on sample source and the respondent’s age group: RDD 15 to 24, RDD 40 and older, and recontact 40 and older. The base weights of each group were projected to its corresponding target population (15 to 24 or 40 and older persons living in Mali). The projected weights for RDD 40 and older and recontact 40 and older groups were then combined using the following composite weighting procedure. Let n1 and n2 be the sample sizes for RDD 40 and older and recontact 40 and older samples, respectively. Suppose deff1 and deff2 are the design effects associated with the RDD and recontact sample. These deff numbers could be estimated from the respective samples using Kish’s approximate method [Estimated Design Effect = (Sample size) * (Sum of the squared weights)/(Square of the sum of weights)]. The combined projection weights (𝑓𝑛𝑤𝑡𝑖) assigned to each case in the combined (RDD 40 and older and recontact 40 and older completed cases) data set of size (n1 + n2) was calculated as:
𝑓𝑛𝑤𝑡𝑖 =[(
n1deff1
) ∗ RWi + (n2deff2
) ∗ CWi]
[(n1deff1
) + (n2deff2
)]
[i=1, 2, 3, …, (n1 + n2)] At the next step, the combined RDD and recontact samples with the combined projection weights as the initial weights were post-stratified separately to adjust for nonresponse and to match the weighted sample totals to known target population totals obtained from country-level census data. The variables included in post-stratification were age groups, age by gender, age by education, age by region and age by urbanicity. In the end, the post-stratified weights were trimmed to avoid extreme weights and then normalized to ensure the total weights sum to the number of completed interviews.
Design Effect:
2.54 for age group 15 to 24, 6.99 for age group 40 and older
Margin of Error:
2.7% for age group 15 to 24, 7.1% for age group 40 and older

2021 UNICEF Changing Childhood Survey Technical Report
Copyright © 2021 Gallup, Inc. All rights reserved. 45
Population Sources Used for Constructing Weights:
Age, gender, region: 2009 Census Education: DHS 2019
AGE_GROUP SAMPLE_UNWTD TARGET SAMPLE_WTD
15 to 19 12.25 30.16 24.36
20 to 24 37.55 22.71 25.16
40 to 49 22.91 19.74 20.93
50 and older 27.29 27.39 29.54
AGE_SEX SAMPLE_UNWTD TARGET SAMPLE_WTD
15 to 24, Male 23.90 25.10 24.60
15 to 24, Female 25.90 27.77 24.93
40 and older, Male 24.90 23.95 25.60
40 and older, Female 25.30 23.18 24.88
AGE_EDUCATION SAMPLE_UNWTD TARGET SAMPLE_WTD
15 to 24, No schooling to 5 years primary (primary incomplete)
8.57 28.46 22.29
15 to 24, Primary complete (6 yrs) and over 41.24 24.41 27.23
40 and older, No schooling to 5 years primary (primary incomplete)
19.42 41.09 43.21
40 and older, Primary complete (6 yrs) and over 30.78 6.04 7.27
AGE_REGION SAMPLE_UNWTD TARGET SAMPLE_WTD
15 to 24, Bamako 6.27 6.59 6.75
15 to 24, Gao 2.19 1.97 1.92
15 to 24, Kayes 6.57 7.25 5.42
15 to 24, Kidal 0.20 0.25 0.29
15 to 24, Koulikoro 7.87 8.81 7.33
15 to 24, Mopti 6.47 7.41 7.42
15 to 24, Segou 8.86 8.51 8.75
15 to 24, Sikasso 9.16 9.62 9.16
15 to 24, Tombouctou 2.19 2.46 2.49
40 and older, Bamako 5.98 5.87 6.34
40 and older, Gao 1.79 1.76 2.02
40 and older, Kayes 7.27 6.47 7.48
40 and older, Kidal 0.20 0.22 0.25
40 and older, Koulikoro 8.27 7.86 7.66
40 and older, Mopti 7.07 6.61 6.62
40 and older, Segou 7.87 7.59 8.12
40 and older, Sikasso 9.46 8.57 9.43
40 and older, Tombouctou 2.29 2.19 2.53

2021 UNICEF Changing Childhood Survey Technical Report
Copyright © 2021 Gallup, Inc. All rights reserved. 46
Morocco
Sampling:
A mobile sample design was used to complete 1,015 telephone surveys in Morocco, with 504 interviews among those aged 15 to 24 and 511 interviews among those aged 40 or older. A mobile-only sample design was selected due to the high mobile penetration rate in Morocco. Based on the International Telecommunication Union (ITU)’s 2018 report on fixed-telephone and mobile subscriptions, there were 21,99,140 landline subscriptions — about 6.1 landline subscriptions per 100 inhabitants — and there were 44,737,885 mobile subscriptions, about 124.2 mobile subscriptions per 100 inhabitants. Based on ITU’s estimates on core household indicators, 21.8% of households had a fixed-line telephone, 99.9% of households had a mobile telephone and 95.4% of individuals (15 or older) used a mobile telephone in 2018.
Target Population/Coverage:
The target population of this survey was the adult population aged 15 to 24 or 40 and older in Morocco. The sampling frame excluded individuals who had no access to mobile phones (i.e., those who were neither living in households with a mobile phone nor had their own mobile phones). The coverage error (percentage of target population not accessible for sampling) was expected to be less than 10% based on 2019 estimates from the World Poll.
Stratification:
The mobile sampling frames were constructed based on the National Numbering Plan from the National Telecommunications Regulatory Agency. The mobile sampling frame was explicitly stratified by the following three service providers: Itissalat Al-Maghrib, Médi Telecom and Wana Corporate. For the mobile frame, samples were allocated into the three strata proportional to each provider’s market share.
Sample Selection:
A simple stratified sample design was used for selecting mobile numbers. Within each explicit stratum (the three providers) a sample of specified size was drawn using pure Random Digit Dial (RDD) procedures. Sampling was done independently within each stratum. The generated mobile sample was screened to identify and remove nonworking numbers. Business phone numbers and telephone numbers on blacklists (such as “do not call lists”) were screened out of the sample as well. Respondents reached via mobile phone did not have any further selection other than ensuring they fell into one of the two age categories: 15 to 24 or 40 and older. In addition to the RDD sample, to meet sample size requirements particularly for the 15 to 24 age group, a random sample of respondents from the recontact sample collected from Gallup’s World Poll 2020 project was used. In the case of individuals contacted from this targeted list, there was no respondent selection, just confirmation of age and gender to ensure eligibility. For the purpose of data collection, the total initial sample was split into random subsamples (replicate samples) and released sequentially based on the progress of interviewing in different strata. The targeted sample constituted its own replicate so it was easy to release this sample as required. The goal was to release an optimum amount of sample each time to achieve a high response rate while completing the targeted number of interviews within the field period. Each sampled number was dialed up to five times at different times of day and different days of the week, including weekends, to increase

2021 UNICEF Changing Childhood Survey Technical Report
Copyright © 2021 Gallup, Inc. All rights reserved. 47
the chances of contacting and selecting a respondent. The outcome of each call attempt was recorded using a standard set of 25 disposition codes to facilitate the calculation of response rates based on American Association of Public Opinion Research (AAPOR) standards.
Data Collection:
Data was gathered between February 25-March 18, 2021. AAPOR3 response rate: 21%
Language of Interviews:
Moroccan Arabic
Weighting:
The sample data was weighted to minimize bias in survey-based estimates. The weighting procedure was formulated based on the sample design and was carried out in multiple stages. Considering that the sample used for the World Poll 2020 project was generated in the same way as the RDD sample used for this project and only 24 completed interviews were from the recontact sample, the recontact sample was treated as part of the RDD sample during weighting. A probability weight factor (base weight) was constructed to account for unequal selection probabilities as a result of selection of phone numbers from the respective mobile strata. At the next step, the base weights were post-stratified on age, age by gender, age by education and region to adjust for nonresponse and to match the weighted sample totals to known target population totals obtained from country-level census data. In the end, the post-stratified weights were trimmed to avoid extreme weights and then normalized to ensure the total weights sum to the number of completed interviews.
Design Effect:
2.15 for age group 15 to 24, 1.34 for age group 40 and older
Margin of Error:
6.4% for age group 15 to 24, 5.0% for age group 40 and older
Population Sources Used for Constructing Weights:
Age, gender, region: Census 2014 Education: Department of Statistics. Activity, employment and unemployment in 2013
AGE_GROUP SAMPLE_UNWTD TARGET SAMPLE_WTD
15 to 19 19.31 18.19 15.56
20 to 24 30.34 18.60 18.93
40 to 49 27.78 24.36 25.49
50 and older 22.56 38.85 40.02
AGE_SEX SAMPLE_UNWTD TARGET SAMPLE_WTD
15 to 24, Male 27.98 18.33 17.99
15 to 24, Female 21.67 18.46 16.50
40 and older, Male 29.75 31.14 32.58
40 and older, Female 20.59 32.07 32.92

2021 UNICEF Changing Childhood Survey Technical Report
Copyright © 2021 Gallup, Inc. All rights reserved. 48
AGE_REGION SAMPLE_UNWTD TARGET SAMPLE_WTD
Tanger-Tetouan-Al Hoceima Region 10.54 10.51 10.34
Oriental Region 7.00 6.84 7.14
Fes-Meknes Region 12.51 12.52 11.90
Rabat-Sale-Kenitra Region 13.60 13.53 13.88
Beni Mellal-Khenifra Region 6.60 7.45 7.15
Casablanca-Settat Region 21.48 20.27 20.72
Marrakech-Safi Region 13.60 13.36 13.82
Draa-Tafilalet Region 4.24 4.83 4.90
Souss-Massa Region 7.88 7.91 7.49
Guelmim-Oued Noun Region 1.28 1.28 1.08
Laayoune-Sakia El Hamra Region 0.89 1.09 1.14
Dakhla-Oued Ed-Dahab Region 0.39 0.42 0.44
AGE_EDUCATION SAMPLE_UNWTD TARGET SAMPLE_WTD
15 to 24, No education-> primary complete (0-2) 4.14 15.13 11.68
15 to 24, Middle and high school (3-6) 30.25 10.98 11.64
15 to 24, Above high school (7-9) 15.27 10.68 11.17
40 and older, No education-> primary complete (0-2) 25.32 43.38 44.75
40 and older, Middle and high school (3-6) 18.33 11.47 12.00
40 and older, Above high school (7-9) 6.70 8.36 8.74

2021 UNICEF Changing Childhood Survey Technical Report
Copyright © 2021 Gallup, Inc. All rights reserved. 49
Nigeria
Sampling:
A mobile-only sample design was used to complete 1,020 telephone surveys in Nigeria, with 516 interviews among those aged 15 to 24 and 504 interviews among those aged 40 or older. A mobile-only frame sample design was selected due to the high mobile penetration rate in Nigeria. Based on the International Telecommunication Union (ITU)’s 2018 report on fixed-telephone and mobile subscriptions, there were 140,491 landline subscriptions — about 0.1 landline subscriptions per 100 inhabitants — and there were 172,730,603 mobile subscriptions, about 88.2 mobile subscriptions per 100 inhabitants. Based on the Demographic and Health Survey 2018, 0.7% of households possessed a landline phone and 87.9% of households possessed a mobile phone.
Target Population/Coverage:
The target population of this survey was the adult population aged 15 to 24 or 40 or older in Nigeria. The sampling frame excluded individuals who had no access to mobile phones (i.e., those who were neither living in households with a mobile phone nor had their own mobile phones). The coverage error (percentage of target population not accessible for sampling) was expected to be approximately 10%.
Stratification:
The mobile sampling frames were constructed based on the National Numbering Plan from the Nigerian Communications Commission. The mobile sampling frame was explicitly stratified by the following four mobile providers: 9Mobile, AIRTEL, Globacom and MTN. For the mobile frame, samples were allocated into the four strata proportional to each provider’s market share.
Sample Selection:
A simple stratified sample design was used for selecting mobile numbers. Within each explicit stratum (the four mobile providers) a sample of specified size was drawn using pure Random Digit Dial (RDD) procedures. Sampling was done independently within each stratum. The generated mobile sample was screened to identify and remove nonworking numbers. Business phone numbers and telephone numbers on blacklists (such as “do not call lists”) were screened out of the sample as well. In the case of households with more than one adult respondent, a respondent was randomly selected among all adults aged 15 to 24 or 40 or older living in the household by asking for the person in the chosen age and gender category who had the next birthday. For data collection, the total initial sample was split into random subsamples (replicate samples) and released sequentially based on the progress of interviewing in different strata. The goal was to release an optimum amount of sample each time to achieve a high response rate while completing the targeted number of interviews within the field period. Each sampled number was dialed up to five times at different times of day and different days of the week, including weekends, to increase the chances of contacting and selecting a respondent. The outcome of each call attempt was recorded using a standard set of 25 disposition codes to facilitate the calculation of response rates based on American Association of Public Opinion Research (AAPOR) standards.
Data Collection:
Data was gathered between February 25-March 16, 2021. AAPOR3 response rate: 29%

2021 UNICEF Changing Childhood Survey Technical Report
Copyright © 2021 Gallup, Inc. All rights reserved. 50
Language of Interviews:
English, Hausa, Igbo, Yoruba, Pidgin English
Weighting:
The sample data was weighted to minimize bias in survey-based estimates. The weighting procedure was formulated based on the sample design and was carried out in multiple stages. A probability weight factor (base weight) was constructed to account for unequal selection probabilities because of selection of phone numbers from the respective mobile strata, households with multiple mobile numbers, and selecting one adult among the chosen age and gender category within households. Within each age group (15 to 24 and 40 or older), the base weights were first post-stratified on age, gender, education and region to adjust for nonresponse and to match the weighted sample totals to known target population totals obtained from country-level census data. In the end, the post-stratified weights were trimmed to avoid extreme weights and then normalized to ensure the total weights sum to the number of completed interviews.
Design Effect:
4.0 for age group 15 to 24, 5.3 for age group 40 and older
Margin of Error:
8.3% for age group 15 to 24, 10.4% for age group 40 and older
Population Sources Used for Constructing Weights:
Age, gender: U.S. Census IDB 2020 Education: DHS 2013 Region: 2016 Nigeria Bureau of Statistics projection
AGE SAMPLE_UNWTD TARGET SAMPLE_WTD
15 to 19 6 54.98 27
20 to 24 45 45.02 25
40 to 49 40 44.77 25
50 or older 9 55.23 23
AGE_GENDER SAMPLE_UNWTD TARGET SAMPLE_WTD
15 to 24, Male 56 50.77 53
15 to 24, Female 44 49.23 47
40 or older, Male 50 49.24 49
40 or older, Female 50 50.76 51

2021 UNICEF Changing Childhood Survey Technical Report
Copyright © 2021 Gallup, Inc. All rights reserved. 51
AGE_EDUCATION SAMPLE_UNWTD TARGET SAMPLE_WTD
15 to 24, Senior high and below 7 37.43 33
15 to 24, Professional training college - junior college 52 56.62 53
15 to 24, College, university, graduate 41 5.96 14
40 or older, Senior high and below 7 73.36 50
40 or older, Professional training college - junior college 35 16.83 19
40 or older, College, university, graduate 58 9.80 31
AGE_REGION SAMPLE_UNWTD TARGET SAMPLE_WTD
15 to 24, North Central 15 15.12 14
15 to 24, North East 14 13.57 14
15 to 24, North West 26 25.29 26
15 to 24, South East 11 11.35 10
15 to 24, South South 15 14.90 13
15 to 24, South West 18 19.77 23
40 or older, North Central 16 15.12 16
40 or older, North East 13 13.57 14
40 or older, North West 24 25.29 24
40 or older, South East 12 11.35 10
40 or older, South South 15 14.90 16
40 or older, South West 20 19.77 21

2021 UNICEF Changing Childhood Survey Technical Report
Copyright © 2021 Gallup, Inc. All rights reserved. 52
Peru
Sampling:
A dual-frame (landline and mobile) sample design was used to complete 1,009 telephone surveys in Peru, with 506 interviews among those aged 15 to 24 and 503 interviews among those aged 40 or older. A dual-frame sample design was selected to increase the coverage rate of the target population. Based on the International Telecommunication Union (ITU)’s estimates on core household indicators, 20.6% of households had a fixed-line telephone, 90.9% of households had a mobile telephone, and 80.7% of individuals (16 or older) used a mobile telephone in 2018. Based on the Demographic and Health Survey 2012, 26.4% of households possessed a landline phone and 81.9% of households possessed a mobile phone.
Target Population/Coverage:
The target population of this survey was the adult population aged 15 to 24 or 40 and older in Peru. The sampling frame excluded individuals who neither lived in households with landline phones nor had any access to mobile phones (i.e., those who were neither living in households with a landline phone nor had their own mobile phones). The coverage error (percentage of target population not accessible for sampling) was expected to be less than 15% based on 2019 estimates from the World Poll.
Stratification:
The landline and mobile sampling frames were constructed based on the National Numbering Plan for landline and mobile of Peru. The landline sampling frame was explicitly stratified by the following 24 regions: Amazonas, Ancash, Apurimac, Arequipa, Ayacucho, Cajamarca, Cusco, Huancavelica, Huanuco, Ica, Junín, La Libertad, Lambayeque, Lima, Loreto, Moquegua, Pasco, Piura, Puno, San Martín, Tacna, Tumbes, Ucayali and Madre de Dios. The mobile sampling frame was explicitly stratified by the following four service providers: Bitel (Viettel Peru SAC), Claro Peru (America Movil Peru SAC), Entel Peru and Movistar Peru (Telefonica Moviles S.A.). The landline samples were allocated into the 24 strata proportional to each region’s 15 and older population, and the mobile samples were allocated into the four strata proportionally to each provider’s market share.
Sample Selection:
A simple stratified sample design was used for selecting landline and mobile numbers. Within each explicit stratum (the 24 regions and four service providers) a sample of specified size was drawn using list-assisted Random Digit Dial (RDD) procedures. Sampling was done independently within each stratum. The generated landline and mobile samples were screened to identify and remove nonworking numbers. Business phone numbers and telephone numbers on blacklists (such as “do not call lists”) were screened out of the sample as well. In the case of landline households with more than one adult respondent, a respondent was randomly selected among all adults aged 15 to 24 or 40 and older living in the household by asking for the person in the chosen age category who had the next birthday. Respondents reached via mobile phone did not have any further selection other than ensuring they fell into one of the two age categories: 15 to 24 or 40 and older. For the purpose of data collection, the total initial sample was split into random subsamples (replicate samples) and released sequentially based on the progress of interviewing in different strata. The goal was to release an optimum amount of sample each time to achieve a high response rate while

2021 UNICEF Changing Childhood Survey Technical Report
Copyright © 2021 Gallup, Inc. All rights reserved. 53
completing the targeted number of interviews within the field period. Each sampled number was dialed up to five times at different times of day and different days of the week, including weekends, to increase the chances of contacting and selecting a respondent. The outcome of each call attempt was recorded using a standard set of 25 disposition codes to facilitate the calculation of response rates based on American Association of Public Opinion Research (AAPOR) standards.
Data Collection:
Data was gathered between February 17-April 28, 2021. AAPOR3 response rate: 4%
Language of Interviews:
Spanish
Weighting:
The sample data was weighted to minimize bias in survey-based estimates. The weighting procedure was formulated based on the sample design and was carried out in multiple stages. A probability weight factor (base weight) was constructed to account for selection of telephone numbers from the respective frames and correct for unequal selection probabilities as a result of selecting one adult in landline households and for dual users coming from both the landline and mobile frame. At the next step, the base weights were post-stratified on age, age by gender, age by education and age by region to adjust for nonresponse and to match the weighted sample totals to known target population totals obtained from country-level census data. In the end, the post-stratified weights were trimmed to avoid extreme weights and then normalized to ensure the total weights sum to the number of completed interviews.
Design Effect:
4.24 for age group 15 to 24, 3.48 for age group 40 and older
Margin of Error:
6.4% for age group 15 to 24, 5.8% for age group 40 and older
Population Sources Used for Constructing Weights:
Age, education, gender, region: National Institute of Statistics and Informatics (INEI), Census of Population and Housing 2017
AGE_GROUP SAMPLE_UNWTD TARGET SAMPLE_WTD
15 to 19 16.95 16.30 17.01
20 to 24 33.20 16.88 18.78
40 to 49 22.99 24.63 26.37
50 and older 26.86 42.19 37.84

2021 UNICEF Changing Childhood Survey Technical Report
Copyright © 2021 Gallup, Inc. All rights reserved. 54
AGE_EDUCATION SAMPLE_UNWTD TARGET SAMPLE_WTD
15 to 24, Primary and below 4.16 11.29 11.52
15 to 24, Secondary 40.54 20.55 22.56
15 to 24, Superior 5.45 1.34 1.71
40 and older, Primary and below 8.03 32.85 27.25
40 and older, Secondary 24.38 24.64 26.75
40 and older, Superior 17.44 9.33 10.21
AGE_SEX SAMPLE_UNWTD TARGET SAMPLE_WTD
15 to 24, Male 25.57 16.48 17.80
15 to 24, Female 24.58 16.70 17.99
40 and older, Male 27.25 32.12 32.47
40 and older, Female 22.60 34.70 31.74
AGE_REGION SAMPLE_UNWTD TARGET SAMPLE_WTD
15 to 24, Centro 4.26 3.06 3.34
15 to 24, Lima Metropolitana 19.62 11.80 12.87
15 to 24, Norte 12.78 8.29 8.82
15 to 24, Oriente 3.87 2.94 3.06
15 to 24, Sur 9.61 7.09 7.70
40 and older, Centro 3.96 5.45 4.98
40 and older, Lima Metropolitana 18.93 25.40 24.00
40 and older, Norte 12.69 16.79 16.15
40 and older, Oriente 3.87 5.17 5.35
40 and older, Sur 10.41 14.02 13.73

2021 UNICEF Changing Childhood Survey Technical Report
Copyright © 2021 Gallup, Inc. All rights reserved. 55
Spain
Sampling:
A dual-frame (landline and mobile) sample design was used to complete around 1,000 telephone surveys in Spain, with roughly 500 interviews among those aged 15 to 24 and roughly 500 interviews among those aged 40 or older. The number of surveys completed for the 15 to 24 and 40 and older age groups was 500 each. The number of completed landline and mobile surveys was 250 and 750, respectively. A dual-frame sample design was employed to increase the coverage of the target population. Based on the International Telecommunication Union (ITU)’s report on fixed-telephone and mobile subscriptions in 2019, there were 19,816,000 landline subscriptions in Spain — about 42.40 landline subscriptions per 100 inhabitants — and there were 55,267,594 mobile subscriptions, about 118.25 mobile subscriptions per 100 inhabitants.
Target Population/Coverage:
The target population of this survey was the population aged 15 to 24 or 40 and older in Spain. Note that people in the age group 25 to 39 were not eligible for this survey. The sampling frame excluded individuals who neither lived in households with landline phones nor had any access to mobile phones (i.e., those who were neither living in households with a landline phone nor had their own mobile phones). The exact coverage error (percentage of target population not accessible for sampling) was unknown but was expected to be around 1.9% after taking into account the percentage of people who had no telephone coverage.
Stratification:
The landline sampling frame was explicitly stratified by NUTS2 (Nomenclature of Territorial Units) regions with implicit stratification by NUTS3 regions within each NUTS2 region. For this stratification, the 2016 definition of the NUTS regions was used. The mobile sampling frame was explicitly stratified into the following three strata — Stratum 1: mobile high probability 15 to 24; Stratum 2: mobile high probability 40 and older; Stratum 3: mobile (rest of the sample not included in Stratum 1 or 2). The sampling vendor first drew a simple random sample and then used relevant information (sample enrichment data from social media platforms and other publicly available sources) to stratify the initial Random Digit Dial (RDD) sample into the three strata described above. Telephone numbers more likely to be linked to individuals in the 15 to 24 age group were flagged and assigned to Stratum 1. Similarly, telephone numbers more likely to be linked to individuals in the age group 40 and older were assigned to Stratum 2. The remaining numbers in the sample were assigned to the residual stratum, or Stratum 3.
Sample Selection:
A stratified sample design was used for selecting landline numbers. Within each explicit stratum (the 19 regions) a sample of specified size was drawn using list-assisted RDD procedures. Sampling was done independently within each stratum. For landline numbers, once a household was reached, one person from the eligible age range (15 to 24 or 40 and older) was selected at random (using the “next birthday method”) from all eligible persons living in that household. The “next birthday method” involved asking the respondent answering the phone to identify among those living in the household the person who had the next birthday. For the mobile frame, sampling was also done independently within each of the three mobile strata described above. A simple random sample of specified size was drawn from each stratum. The person answering the mobile phone number was selected so no within-household selection method had to be used for the mobile sample. In order

2021 UNICEF Changing Childhood Survey Technical Report
Copyright © 2021 Gallup, Inc. All rights reserved. 56
to achieve the targeted number (500) of interviews from the 15 to 24 age group, a disproportional sample allocation across the three strata had to be used. This involved oversampling of the Stratum 1. Business phone numbers and telephone numbers on blacklists (such as “do not call lists”) were screened out of the sample as well. For data collection, the total initial sample was split into random subsamples (replicates) and released sequentially based on the progress of interviewing in different strata. The goal was to release an optimum amount of sample each time to achieve a high response rate while completing the targeted number of interviews within the field period. Each sampled number was dialed up to five times at different times of day and different days of the week, including weekends, to increase the chances of contacting and selecting a respondent. The outcome of each call attempt was recorded using a standard set of 25 disposition codes to facilitate the calculation of response rates based on American Association of Public Opinion Research (AAPOR) standards.
Data Collection:
Data was gathered between February 5-March 9, 2021. AAPOR3 response rate: 6%
Language of Interviews:
Spanish
Weighting:
The sample data was weighted to minimize bias in survey-based estimates. The weighting procedure was formulated based on the sample design and was carried out in multiple stages. The landline and mobile samples were first separately weighted and then combined using composite weighting procedures described below. For each sample (landline and mobile), a probability weight factor (base weight) was constructed to account for selection of telephone numbers from each sampling stratum. For the landline sample involving within-household selection, the base weights were also adjusted to account for unequal selection probabilities due to selection of one eligible person from the selected household. At the next step, the landline and mobile samples with the base weights as the initial weights were post-stratified separately to adjust for nonresponse and to match the weighted sample totals to known target population totals obtained from country-level census data. The variables included in post-stratification were age groups, age by gender, age by education, region (landline) and age by region (mobile). Once each sample (landline and mobile) was weighted to project to the target population (15 to 24 and 40 and older persons living in Spain), the two sets of weights were then combined using the following composite weighting procedure. Let n1 and n2 be the sample sizes for the landline and mobile samples, respectively. Suppose deff1 and deff2 are the design effects associated with the landline and mobile samples. These deff numbers could be estimated from the respective samples using Kish’s approximate method [Estimated Design Effect = (Sample size) * (Sum of the squared weights)/(Square of the sum of weights)]. The final weight (𝑓𝑛𝑤𝑡𝑖) assigned to each case in the combined (landline and mobile sample completed cases) data set of size (n1 + n2) was calculated as:
𝑓𝑛𝑤𝑡𝑖 =[(
n1deff1
) ∗ LLWi + (n2deff2
) ∗ CWi]
[(n1deff1
) + (n2deff2
)]
[i=1, 2, 3, …, (n1 + n2)]

2021 UNICEF Changing Childhood Survey Technical Report
Copyright © 2021 Gallup, Inc. All rights reserved. 57
In the end, the post-stratified weights were trimmed to avoid extreme weights and then normalized to ensure the total weights sum to the number of completed interviews.
Design Effect:
4.09 for age group 15 to 24, 1.83 for age group 40 and older
Margin of Error:
8.86% for age group 15 to 24, 5.92% for age group 40 and older
Population Sources Used for Constructing Weights:
Age, education, gender, region: Eurostat – Census Hub, Census 2011
AGE_GROUP SAMPLE_UNWTD TARGET SAMPLE_WTD
15 to 19 14.90 7.68 8.02
20 to 24 35.10 8.78 9.98
40 to 49 15.40 25.97 25.14
50 and older 34.60 57.57 56.86
AGE_GENDER SAMPLE_UNWTD TARGET SAMPLE_WTD
15 to 24, Male 22.40 8.42 9.21
15 to 24, Female 27.60 8.04 8.80
40 and older, Male 24.30 39.70 37.70
40 and older, Female 25.70 43.83 44.30
AGE_EDUCATION SAMPLE_UNWTD TARGET SAMPLE_WTD
15 to 24, Primary or less 1.60 2.43 1.59
15 to 24, Sec/Higher education 42.20 11.50 14.36
15 to 24, University 6.20 2.53 2.06
40 and older, Primary or less 3.40 29.81 20.88
40 and older, Sec/Higher education 24.20 36.86 41.69
40 and older, University 22.40 16.87 19.43

2021 UNICEF Changing Childhood Survey Technical Report
Copyright © 2021 Gallup, Inc. All rights reserved. 58
AGE_REGION SAMPLE_UNWTD TARGET SAMPLE_WTD
15 to 24, North-West 5.00 1.33 1.09
15 to 24, North-East 4.80 1.41 2.31
15 to 24, Community of Madrid 8.00 2.18 2.03
15 to 24, Centre 4.80 2.09 1.99
15 to 24, East 14.30 4.65 5.15
15 to 24, South 10.90 4.01 4.42
15 to 24, The Canaries 2.20 0.79 1.01
40 and older, North-West 4.10 8.93 8.11
40 and older, North-East 4.90 8.56 8.09
40 and older, Community of Madrid 9.50 11.01 11.70
40 and older, Centre 4.60 10.83 10.66
40 and older, East 14.70 23.98 23.28
40 and older, South 10.30 16.66 16.65
40 and older, The Canaries 1.90 3.56 3.51

2021 UNICEF Changing Childhood Survey Technical Report
Copyright © 2021 Gallup, Inc. All rights reserved. 59
Ukraine
Sampling:
A mobile-only sample design was used to complete 1,011 telephone surveys in Ukraine, with 501 interviews among those aged 15 to 24 and 510 interviews among those aged 40 or older. A mobile-only sample design was selected because of the high mobile penetration rate in Ukraine. Based on the International Telecommunication Union (ITU)’s 2018 report on fixed-telephone and mobile subscriptions, there were 6,074,255 landline subscriptions — about 14.4 landline subscriptions per 100 inhabitants — and there were 53,933,592 mobile subscriptions, about 127.8 mobile subscriptions per 100 inhabitants. Based on ITU’s estimates on core household indicators, 23.8% of households had a fixed-line telephone in 2017 and 96.5% of households had a mobile telephone in 2017.
Target Population/Coverage:
The target population of this survey was the adult population aged 15 to 24 or 40 and older in Ukraine. The sampling frame excluded individuals who did not own mobile phones for personal use. The coverage error (percentage of target population not accessible for sampling) was expected to be about 10% based on 2019 estimates from the World Poll.
Stratification:
The mobile sampling frame was constructed based on the National Numbering Plan of Ukraine, from the State Service of Special Communications and Information. The mobile sampling frame was explicitly stratified by the following four aggregated mobile service providers: Kyivstar, Lifecell, Vodafone Ukraine, and 3Mob & Intertelecom & Telesystems of Ukraine. For the mobile frame, samples were allocated into the four strata proportional to each provider’s market share.
Sample Selection:
A simple stratified sample design was used for selecting mobile numbers. Within each explicit stratum (the four aggregated mobile providers) a sample of specified size was drawn using pure Random Digit Dial (RDD) procedures. Sampling was done independently within each stratum. The generated mobile sample was screened to identify and remove nonworking numbers. Business phone numbers and telephone numbers on blacklists (such as “do not call lists”) were screened out of the sample as well. Respondents reached via mobile phone did not have any further selection other than ensuring they fell into one of the two age categories: 15 to 24 or 40 and older. In addition to the RDD sample, to meet the sample size requirements (roughly 500 per age group), a random sample of respondents aged 15 to 24 or 40 and older from the recontact list of Gallup’s World Poll project was used. In the case of individuals contacted from this sample source, there was no respondent selection, just confirmation of age and gender to ensure eligibility. For the purpose of data collection, the total initial sample was split into random subsamples (replicate samples) and released sequentially based on the progress of interviewing in different strata. The targeted sample constituted its own replicate so it was easy to release this sample as required. The goal was to release an optimum amount of sample each time to achieve a high response rate while completing the targeted number of interviews within the field period. Each sampled number was dialed up to five times at different times of day and different days of the week, including weekends, to increase the chances of contacting and selecting a respondent. The outcome of each call attempt was recorded

2021 UNICEF Changing Childhood Survey Technical Report
Copyright © 2021 Gallup, Inc. All rights reserved. 60
using a standard set of 25 disposition codes to facilitate the calculation of response rates based on American Association of Public Opinion Research (AAPOR) standards.
Data Collection:
Data was gathered between February 7-17, 2021. AAPOR3 response rate: 8%
Language of Interviews:
Russian, Ukrainian
Weighting:
The sample data was weighted to minimize bias in survey-based estimates. The weighting procedure was formulated based on the sample design and was carried out in multiple stages. The pure RDD sample and the recontact sample were first separately weighted and then combined using composite weighting procedures described below. For each sample (RDD and recontact), a probability weight factor (base weight) was constructed to account for selection of telephone numbers from each sampling stratum. At the next step, the RDD and recontact samples with the base weights as the initial weights were post-stratified separately to adjust for nonresponse and to match the weighted sample totals to known target population totals obtained from country-level census data. The variables included in post-stratification were age groups, age by gender, age by education, age by region and age by urbanicity. Once each sample (RDD and recontact) was weighted to project to the target population (15 to 24 and 40 and older persons living in Ukraine), the two sets of weights were then combined using the following composite weighting procedure. Let n1 and n2 be the sample sizes for the RDD and recontact samples, respectively. Suppose deff1 and deff2 are the design effects associated with the RDD and recontact samples. These deff numbers could be estimated from the respective samples using Kish’s approximate method [Estimated Design Effect = (Sample size) * (Sum of the squared weights)/(Square of the sum of weights)]. The final weight (fnwt) assigned to each case in the combined (RDD and recontact completed cases) data set of size (n1 + n2) was calculated as:
𝑓𝑛𝑤𝑡𝑖 =[(
n1deff1
) ∗ RWi + (n2deff2
) ∗ CWi]
[(n1deff1
) + (n2deff2
)]
[i=1, 2, 3, …, (n1 + n2)] In the end, the post-stratified weights were trimmed to avoid extreme weights and then normalized to ensure the total weights sum to the number of completed interviews.
Design Effect:
2.40 for age group 15 to 24, 1.41 for age group 40 and older
Margin of Error:
6.8% for age group 15 to 24, 5.2% for age group 40 and older

2021 UNICEF Changing Childhood Survey Technical Report
Copyright © 2021 Gallup, Inc. All rights reserved. 61
Population Sources Used for Constructing Weights:
Age, gender, region, urbanicity: State Statistics Service of Ukraine (estimated data as of Jan. 1, 2020) Education: State Statistics Service of Ukraine (Census 2001)
AGE_GROUP SAMPLE_UNWTD TARGET SAMPLE_WTD
15 to 19 23.15 7.28 8.68
20 to 24 26.41 8.15 9.62
40 to 49 19.49 23.48 25.22
50 and older 30.96 61.10 56.48
AGE_SEX SAMPLE_UNWTD TARGET SAMPLE_WTD
15 to 24, Male 25.42 7.94 9.43
15 to 24, Female 24.13 7.49 8.87
40 and older, Male 21.17 35.48 34.78
40 and older, Female 29.28 49.09 46.92
AGE_EDUCATION SAMPLE_UNWTD TARGET SAMPLE_WTD
15 to 24, Sec compl/Sec voc/Higher incomplete or less 28.29 14.35 16.89
15 to 24, Higher complete and up 21.27 1.08 1.41
40 and older, Sec compl/Sec voc/Higher incomplete or less
26.01 71.76 66.64
40 and older, Higher complete and up 24.43 12.81 15.06
AGE_REGION SAMPLE_UNWTD TARGET SAMPLE_WTD
15 to 24, Kiev 3.56 1.12 1.34
15 to 24, East 15.53 4.51 5.36
15 to 24, South 5.74 1.70 2.03
15 to 24, West 12.36 4.49 5.27
15 to 24, North 6.23 1.78 2.14
15 to 24, Center 6.13 1.82 2.17
40 and older, Kiev 3.46 5.59 4.77
40 and older, East 17.11 29.75 28.15
40 and older, South 5.44 8.87 8.16
40 and older, West 12.17 19.58 20.00
40 and older, North 6.03 10.26 9.52
40 and older, Center 6.23 10.52 11.10
AGE_URBANICITY SAMPLE_UNWTD TARGET SAMPLE_WTD
15 to 24, Urban 39.96 10.22 12.19
15 to 24, Rural 9.59 5.21 6.11
40 and older, Urban 36.60 59.01 55.94
40 and older, Rural 13.85 25.57 25.76

2021 UNICEF Changing Childhood Survey Technical Report
Copyright © 2021 Gallup, Inc. All rights reserved. 62
United Kingdom
Sampling:
A dual-frame (landline and mobile) sample design was used to complete around 1,000 telephone surveys in the U.K., with roughly 500 interviews among those aged 15 to 24 and roughly 500 interviews among those aged 40 or older. The number of surveys completed for the 15 to 24 and 40 and older age groups was 500 each. The number of completed landline and mobile surveys was 250 and 750, respectively. A dual-frame sample design was employed to increase the coverage of the target population. Based on the International Telecommunication Union (ITU)’s report on fixed-telephone and mobile subscriptions in 2018, there were 31,919,894 landline subscriptions in the U.K. — about 47.54 landline subscriptions per 100 inhabitants — and there were 79,472,341 mobile subscriptions, about 118.37 mobile subscriptions per 100 inhabitants.
Target Population/Coverage:
The target population of this survey was the population aged 15 to 24 or 40 and older in the U.K. Note that people in the age group 25 to 39 were not eligible for this survey. The sampling frame excluded individuals who neither lived in households with landline phones nor had any access to mobile phones (i.e., those were neither living in households with a landline phone nor had their own mobile phones). The exact coverage error (percentage of target population not accessible for sampling) was unknown but was expected to be around 0.5% after accounting for the percentage of people who had no telephone coverage.
Stratification:
The landline sampling frame was explicitly stratified by NUTS2 (Nomenclature of Territorial Units) regions with implicit stratification by NUTS3 regions within each NUTS2 region. For the purpose of this stratification, the 2016 definition of the NUTS regions was used. The mobile sampling frame was explicitly stratified into the following three strata — Stratum 1: mobile high probability 15 to 24; Stratum 2: mobile high probability 40 and older; Stratum 3: mobile (rest of the sample not included in Stratum 1 or 2). The sampling vendor first drew a simple random sample and then used relevant information (sample enrichment data from social media platforms and other publicly available sources) to stratify the initial Random Digit Dial (RDD) sample into the three strata described above. Telephone numbers more likely to be linked to individuals in the 15 to 24 age group were flagged and assigned to Stratum 1. Similarly, telephone numbers more likely to be linked to individuals in the age group 40 and older were assigned to Stratum 2. The remaining numbers in the sample were assigned to the residual stratum, or Stratum 3.
Sample Selection:
A stratified sample design was used for selecting landline numbers. Within each explicit stratum (the 41 regions) a sample of specified size was drawn using list-assisted RDD procedures. Sampling was done independently within each stratum. For landline numbers, once a household was reached, one person from the eligible age range (15 to 24 or 40 and older) was selected at random (using the “next birthday method”) from all eligible persons living in that household. The “next birthday method” involved asking the respondent answering the phone to identify among those living in that household the person who had the next birthday. For mobile frame, sampling was also done independently within each of the three mobile strata described above. A simple random sample of specified size was drawn from each stratum. The person answering the mobile phone number was selected so no within-household selection method had to be used for the mobile sample. In order to achieve the targeted number (500)

2021 UNICEF Changing Childhood Survey Technical Report
Copyright © 2021 Gallup, Inc. All rights reserved. 63
of interviews from the 15 to 24 age group, a disproportional sample allocation across the three strata had to be used. This involved oversampling of the Stratum 1. Business phone numbers and telephone numbers on blacklists (such as “do not call lists”) were screened out of the sample as well. For the purpose of data collection, the total initial sample was split into random subsamples (replicates) and released sequentially based on the progress of interviewing in different strata. The goal was to release an optimum amount of sample each time to achieve a high response rate while completing the targeted number of interviews within the field period. Each sampled number was dialed up to five times at different times of day and different days of the week, including weekends, to increase the chances of contacting and selecting a respondent. The outcome of each call attempt was recorded using a standard set of 25 disposition codes to facilitate the calculation of response rates based on American Association of Public Opinion Research (AAPOR) standards.
Data Collection:
Data was gathered between February 5-March 6, 2021. AAPOR3 response rate: 6%
Language of Interviews:
English
Weighting:
The sample data was weighted to minimize bias in survey-based estimates. The weighting procedure was formulated based on the sample design and was carried out in multiple stages. The landline and mobile samples were first separately weighted and then combined using composite weighting procedures described below. For each sample (landline and mobile), a probability weight factor (base weight) was constructed to account for selection of telephone numbers from each sampling stratum. For the landline sample involving within-household selection, the base weights were also adjusted to account for unequal selection probabilities due to selection of one eligible person from the selected household. At the next step, the landline and mobile samples with the base weights as the initial weights were post-stratified separately to adjust for nonresponse and to match the weighted sample totals to known target population totals obtained from country-level census data. The variables included in post-stratification were age groups, age by gender, age by education, region (landline) and age by region (mobile). Once each sample (landline and mobile) was weighted to project to the target population (15 to 24 and 40 and older persons living in the U.K.), the two sets of weights were then combined using the following composite weighting procedure. Let n1 and n2 be the sample sizes for the landline and mobile samples, respectively. Suppose deff1 and deff2 are the design effects associated with the landline and mobile samples. These deff numbers could be estimated from the respective samples using Kish’s approximate method [Estimated Design Effect = (Sample size) * (Sum of the squared weights)/(Square of the sum of weights)]. The final weight (𝑓𝑛𝑤𝑡𝑖) assigned to each case in the combined (landline and mobile sample completed cases) data set of size (n1 + n2) was calculated as:
𝑓𝑛𝑤𝑡𝑖 =[(
n1deff1
) ∗ LLWi + (n2deff2
) ∗ CWi]
[(n1deff1
) + (n2deff2
)]
[i=1, 2, 3, …, (n1 + n2)]

2021 UNICEF Changing Childhood Survey Technical Report
Copyright © 2021 Gallup, Inc. All rights reserved. 64
In the end, the post-stratified weights were trimmed to avoid extreme weights and then normalized to ensure the total weights sum to the number of completed interviews.
Design Effect:
4.81 for age group 15 to 24, 1.58 for age group 40 and older
Margin of Error:
9.61% for age group 15 to 24, 5.5% for age group 40 and older
Population Sources Used for Constructing Weights:
Age, education, gender region: Eurostat – Census Hub, Census 2011
AGE_GROUP SAMPLE_UNWTD TARGET SAMPLE_WTD
15 to 19 11.60 10.13 7.97
20 to 24 38.40 10.89 13.26
40 to 49 9.00 23.49 22.40
50 and older 41.00 55.49 56.37
AGE_GENDER SAMPLE_UNWTD TARGET SAMPLE_WTD
15 to 24, Male 25.20 10.66 9.44
15 to 24, Female 24.80 10.36 11.78
40 and older, Male 26.90 37.65 37.87
40 and older, Female 23.10 41.33 40.90
AGE_EDUCATION SAMPLE_UNWTD TARGET SAMPLE_WTD
15 to 24, Higher ed or less 37.70 17.64 17.40
15 to 24, University degree or higher 12.30 3.38 3.83
40 and older, Higher ed or less 24.10 57.17 56.39
40 and older, University degree or higher 25.90 21.81 22.39

2021 UNICEF Changing Childhood Survey Technical Report
Copyright © 2021 Gallup, Inc. All rights reserved. 65
AGE_REGION SAMPLE_UNWTD TARGET SAMPLE_WTD
15 to 24, East Midlands 2.70 1.53 1.51
15 to 24, East of England 4.50 1.80 2.58
15 to 24, London 7.90 2.79 2.52
15 to 24, North East 2.20 0.90 1.18
15 to 24, North West 5.50 2.40 2.09
15 to 24, Scotland 4.60 1.76 2.99
15 to 24, South East 7.30 2.73 2.70
15 to 24, South West 4.60 1.68 1.56
15 to 24, Wales 1.90 1.04 0.69
15 to 24, West Midlands 3.60 1.90 1.27
15 to 24, Yorkshire and the Humber 3.70 1.85 1.72
15 to 24, Northern Ireland 1.50 0.64 0.41
40 and older, East Midlands 3.50 5.85 5.98
40 and older, East of England 4.40 7.57 6.81
40 and older, London 8.10 8.23 8.84
40 and older, North East 2.60 3.40 3.23
40 and older, North West 4.50 8.93 8.99
40 and older, Scotland 3.50 6.94 5.79
40 and older, South East 7.90 11.10 10.93
40 and older, South West 4.50 7.19 7.55
40 and older, Wales 2.90 4.03 4.48
40 and older, West Midlands 4.20 7.00 7.24
40 and older, Yorkshire and the Humber 2.90 6.62 6.51
40 and older, Northern Ireland 0.90 2.12 2.29
Missing Region 0.10 – 0.13

2021 UNICEF Changing Childhood Survey Technical Report
Copyright © 2021 Gallup, Inc. All rights reserved. 66
United States
Sampling:
The sample for this study was drawn from the Gallup Panel, which is a probability-based panel, using the following design. Stratified sampling was done for three separate age groups.
1. Sample of 15- to 17-year-olds. This group was covered through their parents who were Gallup panel members. Gallup panel members who had a flag indicating they were parents of at least one 12- to 17-year-old child (there were no flags for parents of 15- to 17-year-olds specifically) were selected for this sample. These panel members were later screened for eligibility to confirm they were parents of a child aged 15 to 17. Then they were asked to have one of their eligible children (randomly selected in the case of more than one child) complete an interview.
2. Sample of 18- to 24-year-olds. There were a relatively low number of such panel members in the database, and because of expected low response rates for this target group, all available members in the panel were included in the sample.
3. Sample of those 40 and older. This sample was stratified by age, gender, education, race and ethnicity. The sample was drawn to achieve at least 500 completes. However, after the completion of fieldwork, it turned out that respondents with less education were significantly under-represented due to higher nonresponse. To balance the sample, an additional sample of 40-and-older members with less education was drawn. This resulted in a total of 785 completes for the 40 and older group instead of the targeted 500.
Gallup completed 1,291 telephone surveys in the U.S., with 506 interviews among those aged 15 to 24 and 785 interviews among those aged 40 or older.
Target Population/Coverage:
The target population of this survey was the adult population aged 15 to 24 or 40 and older in the U.S. The Gallup panel was designed to represent the entire adult population of the United States.
Data Collection:
Data was gathered via telephone between January 11-Februray 23, 2021. AAPOR3 response rate: 39% among Gallup panel members.
Language of Interviews:
English, Spanish
Weighting:
The sample data was weighted to minimize bias in survey-based estimates. The weighting procedure was formulated based on the sample design and was carried out in multiple stages. Gallup panel members have base weights that reflect their selection probability in the surveys through which they were recruited into the panel. Base weights for respondents aged 15 to 17 were adjusted to account for subsampling in cases where there was more than one eligible child in the household of selected panel members.

2021 UNICEF Changing Childhood Survey Technical Report
Copyright © 2021 Gallup, Inc. All rights reserved. 67
At the next step, with the base weights as the initial weights, the sample was post-stratified separately by the two age groups — 15 to 24 and 40 and older — to adjust for nonresponse and to match the weighted sample totals to known target population totals obtained from country-level census data. The two age groups were then combined and, as a last stage of weighting, adjusted to reflect their relative proportions. The post-stratification variables included age, sex, race, ethnicity, education and census region. The targets came from Current Population Survey 2020 data. In the end, the post-stratified weights were trimmed to avoid extreme weights and then normalized to ensure the total weights sum to the number of completed interviews.
Design Effect:
1.2 for age group 15 to 24, 2.8 for age group 40 and older
Margin of Error:
8.8% for age group 15 to 24, 4.5% for age group 40 and older
Population Sources Used for Constructing Weights:
Current Population Survey – 2020
SAMPLE TYPE DEMOGRAPHICS UNWEIGHTED TARGET WEIGHTED
Age 15 to 24 Male 64% 50% 51%
Age 15 to 24 Female 36% 50% 49%
Age 40 and older Male 53% 47% 47%
Age 40 and older Female 47% 53% 53%
Age 15 to 24 15 to 17 34% 31% 29%
Age 15 to 24 18 to 24 66% 69% 71%
Age 40 and older 40 to 49 26% 25% 25%
Age 40 and older 50 to 59 26% 26% 27%
Age 40 and older 60 to 69 26% 25% 24%
Age 40 and older 70 and older 22% 24% 24%
Age 15 to 24 High school or less 47% 61% 60%
Age 15 to 24 Above high school but less than B.A. 31% 29% 30%
Age 15 to 24 Bachelor 21% 9% 9%
Age 15 to 24 Postgraduate 1% 1% 1%
Age 40 and older High school or less 20% 39% 38%
Age 40 and older Above high school but less than B.A. 14% 26% 25%
Age 40 and older Bachelor 10% 21% 21%
Age 40 and older Postgraduate 56% 14% 16%
Age 15 to 24 Hispanic 18% 24% 24%
Age 15 to 24 Non-Hispanic 82% 76% 76%
Age 40 and older Hispanic 18% 14% 14%
Age 40 and older Non-Hispanic 82% 86% 86%
Age 15 to 24 White only 76% 73% 73%
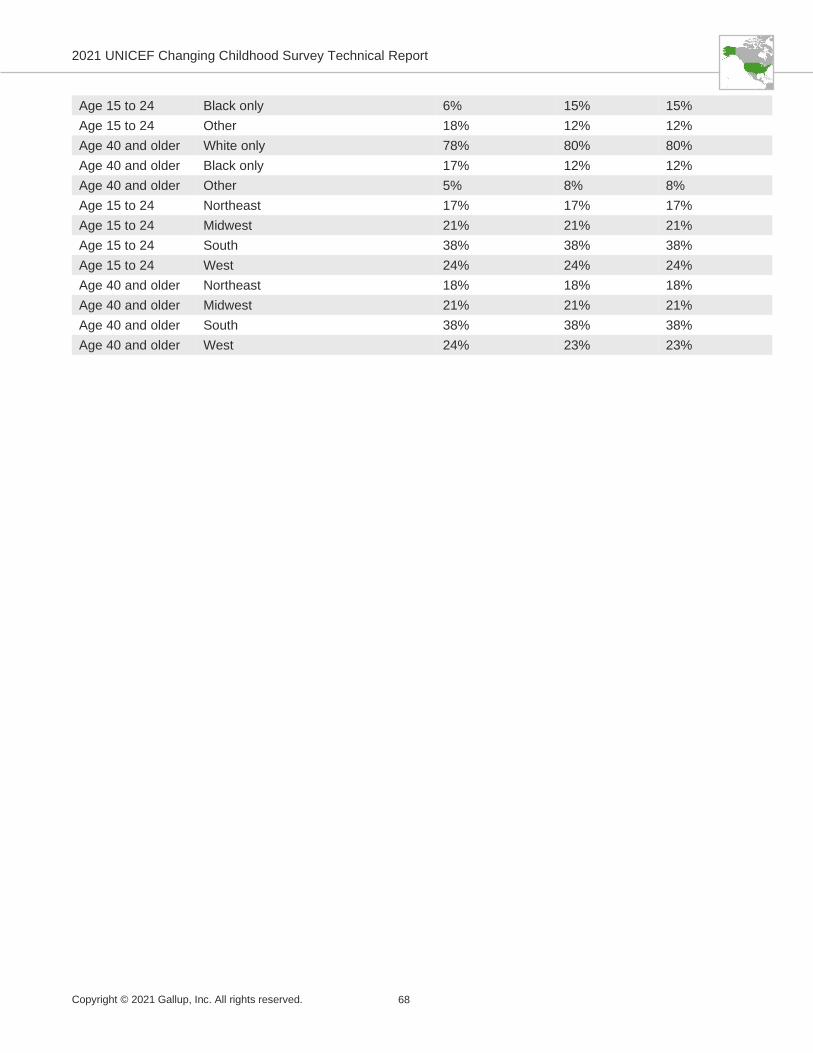
2021 UNICEF Changing Childhood Survey Technical Report
Copyright © 2021 Gallup, Inc. All rights reserved. 68
Age 15 to 24 Black only 6% 15% 15%
Age 15 to 24 Other 18% 12% 12%
Age 40 and older White only 78% 80% 80%
Age 40 and older Black only 17% 12% 12%
Age 40 and older Other 5% 8% 8%
Age 15 to 24 Northeast 17% 17% 17%
Age 15 to 24 Midwest 21% 21% 21%
Age 15 to 24 South 38% 38% 38%
Age 15 to 24 West 24% 24% 24%
Age 40 and older Northeast 18% 18% 18%
Age 40 and older Midwest 21% 21% 21%
Age 40 and older South 38% 38% 38%
Age 40 and older West 24% 23% 23%

2021 UNICEF Changing Childhood Survey Technical Report
Copyright © 2021 Gallup, Inc. All rights reserved. 69
Zimbabwe
Sampling:
A mobile-only sample design was used to complete 1,030 telephone surveys in Zimbabwe, with 522 interviews among those aged 15 to 24 and 508 interviews among those aged 40 or older. Random selection of respondents among all adults aged 15 to 24 or 40 and older living in households reached by mobile was used to increase the coverage rate of the target population, considering the mobile penetration rate in Zimbabwe is not very high. Based on the International Telecommunication Union (ITU)’s 2018 report on fixed-telephone and mobile subscriptions, there were 268,849 landline subscriptions — about 1.9 landline subscriptions per 100 inhabitants — and there were 12,908,992 mobile subscriptions, about 89.4 mobile subscriptions per 100 inhabitants. Based on the Demographic and Health Survey 2015, 3.3% of households possessed a landline phone and 86.9% of households possessed a mobile phone.
Target Population/Coverage:
The target population of this survey was the adult population aged 15 to 24 or 40 and older in Zimbabwe. The sampling frame excluded individuals who had no access to mobile phones (i.e., those who were neither living in households with a mobile phone nor had their own mobile phones). The coverage error (percentage of target population not accessible for sampling) was expected to be approximately 10%.
Stratification:
The mobile sampling frame was constructed based on the National Numbering Sampling Plan of Zimbabwe, from the Postal and Telecommunications Regulatory Authority of Zimbabwe. The mobile sampling frame was explicitly stratified by the following three service providers: NetOne Cellular, Telecel Zimbabwe and Econet Wireless Zimbabwe. For the mobile frame, samples were allocated into the three strata proportional to each provider’s market share.
Sample Selection:
A simple stratified sample design was used for selecting mobile numbers. Within each explicit stratum (the three providers) a sample of specified size was drawn using pure Random Digit Dial (RDD) procedures. Sampling was done independently within each stratum. The generated mobile sample was screened to identify and remove nonworking numbers. Business phone numbers and telephone numbers on blacklists (such as “do not call lists”) were screened out of the sample as well. In the case of households with more than one adult respondent, a respondent was randomly selected among all adults aged 15 to 24 or 40 and older living in the household by asking for the person in the chosen age and gender category who had the next birthday. In addition to the RDD sample, to meet sample size requirements particularly for the 15 to 24 age group, a random sample of respondents from the recontact sample collected from Gallup’s World Poll 2020 project was used. In the case of individuals contacted from this sample source, there was no respondent selection, just confirmation of age and gender to ensure eligibility. For data collection, the total initial sample was split into random subsamples (replicate samples) and released sequentially based on the progress of interviewing in different strata. The targeted sample constituted its own replicate, so it was easy to release this sample as required. The goal was to release

2021 UNICEF Changing Childhood Survey Technical Report
Copyright © 2021 Gallup, Inc. All rights reserved. 70
an optimum amount of sample each time to achieve a high response rate while completing the targeted number of interviews within the field period. Each sampled number was dialed up to five times at different times of day and different days of the week, including weekends, to increase the chances of contacting and selecting a respondent. The outcome of each call attempt was recorded using a standard set of 25 disposition codes to facilitate the calculation of response rates based on American Association of Public Opinion Research (AAPOR) standards.
Data Collection:
Data was gathered between March 6-30, 2021. AAPOR3 response rate: 30%
Language of Interviews:
English, Ndebele, Shona
Weighting:
The sample data was weighted to minimize bias in survey-based estimates. The weighting procedure was formulated based on the sample design and was carried out in multiple stages. Because the sample used for the World Poll 2020 project was generated in the same way as the RDD sample used for this project and only 50 completed interviews were from the recontact sample, the recontact sample was treated as part of the RDD sample during weighting. A probability weight factor (base weight) was constructed to account for unequal selection probabilities because of selection of phone numbers from the mobile frame and selecting one adult among the chosen age and gender category within households. At the next step, the base weights were post-stratified on age, age by gender, age by education and region to adjust for nonresponse and to match the weighted sample totals to known target population totals obtained from country-level census data. In the end, the post-stratified weights were trimmed to avoid extreme weights and then normalized to ensure the total weights sum to the number of completed interviews.
Design Effect:
1.97 for age group 15 to 24, 2.07 for age group 40 and older
Margin of Error:
6.0% for age group 15 to 24, 6.3% for age group 40 and older
Population Sources Used for Constructing Weights:
Age, gender: U.S. Census IDB, 2020 Region: 2012 General Population and Housing Census Education: DHS 2015
AGE_GROUP SAMPLE_ UNWTD TARGET SAMPLE_ WTD
15 to 19 26.50 28.21 27.52
20 to 24 24.17 24.64 24.94
40 to 49 26.80 19.34 18.95
50 and older 22.52 27.81 28.58

2021 UNICEF Changing Childhood Survey Technical Report
Copyright © 2021 Gallup, Inc. All rights reserved. 71
AGE_SEX SAMPLE_ UNWTD TARGET SAMPLE_ WTD
15 to 24, Male 22.43 25.90 24.52
15 to 24, Female 28.25 26.95 27.94
40 and older, Male 26.41 21.35 22.09
40 and older, Female 22.91 25.80 25.45
REGION SAMPLE_ UNWTD TARGET SAMPLE_ WTD
Bulawayo 4.95 5.02 5.35
Harare 16.50 16.33 16.72
Manicaland Province 13.88 13.48 12.61
Mashonaland Central Province 8.54 8.86 8.85
Mashonaland East Province 9.81 9.90 9.91
Mashonaland West Province 12.33 11.55 11.19
Masvingo Province 11.65 11.42 11.80
Matabeleland North Province 5.44 5.76 6.08
Matabeleland South Province 4.76 5.26 4.69
Midlands Province 12.14 12.42 12.81
AGE_EDUCATION SAMPLE_ UNWTD TARGET SAMPLE_ WTD
15 to 24, Primary and below (0-7) 7.38 12.99 12.33
15 to 24, Sec incomplete and above (8-16) 43.30 39.86 40.13
40 and older, Primary and below (0-7) 16.50 27.43 26.67
40 and older, Secondary incomplete (8-12) 29.51 15.30 16.38
40 and older, Sec complete and above (13-16) 3.30 4.42 4.48