road safety report - icbc home · road safety report greater vancouver region regional contact road...
TRANSCRIPT
road safety reportGreater Vancouver region
regional contact
road safety
Clay SteiroManager, Road Safety Program [email protected]
Get quick statistics and crash maps for the Greater Vancouver at:www.icbc.com/about-icbc/newsroom/Pages/Statistics.aspx
AUG 2017
Auto crime
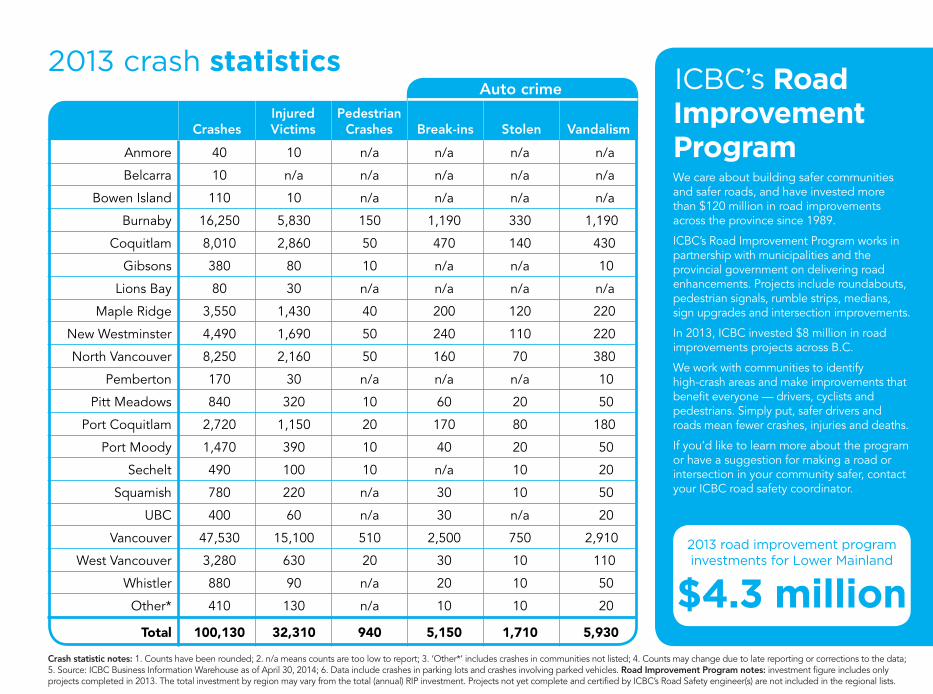
Crash statistic notes: 1. Counts have been rounded; 2. n/a means counts are too low to report; 3. ‘Other*’ includes crashes in communities not listed; 4. Counts may change due to late reporting or corrections to the data; 5. Source: ICBC Business Information Warehouse as of April 30, 2014; 6. Data include crashes in parking lots and crashes involving parked vehicles. Road Improvement Program notes: investment figure includes only projects completed in 2013. The total investment by region may vary from the total (annual) RIP investment. Projects not yet complete and certified by ICBC’s Road Safety engineer(s) are not included in the regional lists.
ICBC’s Road Improvement Program We care about building safer communities and safer roads, and have invested more than $120 million in road improvements across the province since 1989.
ICBC’s Road Improvement Program works in partnership with municipalities and the provincial government on delivering road enhancements. Projects include roundabouts, pedestrian signals, rumble strips, medians, sign upgrades and intersection improvements.
In 2013, ICBC invested $8 million in road improvements projects across B.C.
We work with communities to identify high-crash areas and make improvements that benefit everyone — drivers, cyclists and pedestrians. Simply put, safer drivers and roads mean fewer crashes, injuries and deaths.
If you’d like to learn more about the program or have a suggestion for making a road or intersection in your community safer, contact your ICBC road safety coordinator.
2013 road improvement program investments for Lower Mainland
$4.3 million
2013 crash statistics
CrashesInjured Victims
Pedestrian Crashes Break-ins Stolen Vandalism
Anmore 40 10 n/a n/a n/a n/a
Belcarra 10 n/a n/a n/a n/a n/a
Bowen Island 110 10 n/a n/a n/a n/a
Burnaby 16,250 5,830 150 1,190 330 1,190
Coquitlam 8,010 2,860 50 470 140 430
Gibsons 380 80 10 n/a n/a 10
Lions Bay 80 30 n/a n/a n/a n/a
Maple Ridge 3,550 1,430 40 200 120 220
New Westminster 4,490 1,690 50 240 110 220
North Vancouver 8,250 2,160 50 160 70 380
Pemberton 170 30 n/a n/a n/a 10
Pitt Meadows 840 320 10 60 20 50
Port Coquitlam 2,720 1,150 20 170 80 180
Port Moody 1,470 390 10 40 20 50
Sechelt 490 100 10 n/a 10 20
Squamish 780 220 n/a 30 10 50
UBC 400 60 n/a 30 n/a 20
Vancouver 47,530 15,100 510 2,500 750 2,910
West Vancouver 3,280 630 20 30 10 110
Whistler 880 90 n/a 20 10 50
Other* 410 130 n/a 10 10 20
Total 100,130 32,310 940 5,150 1,710 5,930