transport road safety: towards a european road safety area: policy orientations on road safety...
TRANSCRIPT
TransportTransport
ROAD SAFETY:Towards a European Road Safety Area: Policy orientations on road safety 2011-2020

TransportTransport
TWO MAIN POLICY PAPERS
• WHITE PAPER 2011: WHITE PAPER 2011: Towards Towards a ‘zero-vision’ on road safetya ‘zero-vision’ on road safety
• POLICY ORIENTATIONS ON POLICY ORIENTATIONS ON ROAD SAFETY 2011 - 2020ROAD SAFETY 2011 - 2020

TransportTransport
Policy orientations on road safety 2011-2020
• Quantitative target: - 50% reduction of number of road fatalities by 2020, starting from 2010
• 3 Pillars• A common European road
safety area• An integrated approach with
other policies (health, environment, employment, etc.)
• Shared responsibility (EU, national, local…)
• 7 Strategic Objectives:
1. Education and training
2. Compliance with road traffic rules
2. Safer road infrastructure
3. Safer vehicles
4. Intelligent Transport Systems (ITS)
6. Emergency and post-injuries services
6. Vulnerable road users

TransportTransport
“A shared responsibility”
Action by ALL stakeholders is needed
• Public Authorities: EU + Central • Governments + Local Authorities…
• Private Companies: Car industry + • Transport companies + Road operators
• Users: everybody !
The EU acts wherever it provides an added value

TransportTransport
The “-50%” objective
• A political & global commitment
• - 43% achieved ( 2001 – 2010)

TransportTransport
Fatalities – evolution 2001-2010
--- EU27 fatalities / year--- EU27 target for 2010 (-50%)
-43%-43%
54.000
49.900
46.200
42.800
39.600
36.700
34.000
31.500
29.200
27.000
30.800
46.800
50.000
54.000
45.00043.000 42.500
34.800
38.941
20.000
30.000
40.000
50.000
60.000
2001 2002 2003 2004 2005 2006 2007 2008 2009 2010

TransportTransport
Fatalities – evolution 2001-2020
Objectif 2010 - 2020EU fatalities
56.40054.000 53.300
50.400
47.30045.400
43.100 42.500
38.900
34.800
31.000 30.300
10000
15000
20000
25000
30000
35000
40000
45000
50000
55000
60000
2000 2001 2002 2003 2004 2005 2006 2007 2008 2009 2010 2011 2012 2013 2014 2015 2016 2017 2018 2019 2020
Source: - CARE (EU road accidents database) - National data
2020 objectif
EU fatalities
objectif 2010

TransportTransport
Contrasted progress by Country
-70%
-60%
-50%
-40%
-30%
-20%
-10%
0%
LV EE LT ES SE LU SK FR SI PT IE DE UK NL BE IT EU AT DK HU CZ CY FI EL PL BG MT RO
Source: CARE (EU road accidents database) 2010-2001 EU

TransportTransport
The EU instruments
• Road accident data and information
• Financial support to research and studies
• Best practice guidelines
• Legislation (only when necessary)
TransportTransport
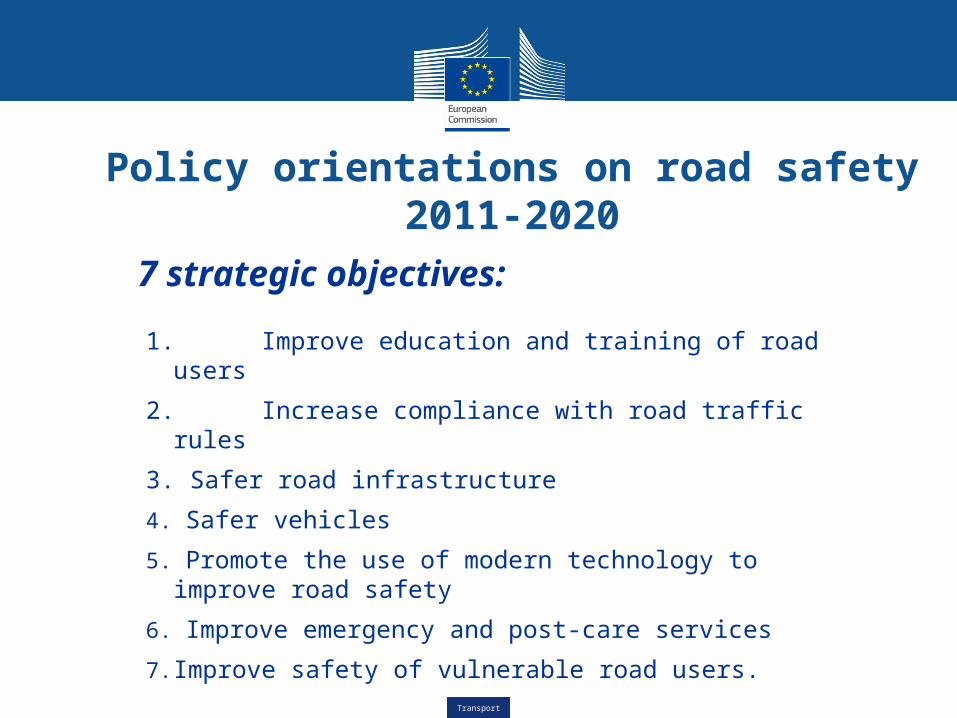
Policy orientations on road safety 2011-2020
7 strategic objectives:
1. Improve education and training of road users
2. Increase compliance with road traffic rules
3. Safer road infrastructure
4. Safer vehicles
5. Promote the use of modern technology to improve road safety
6. Improve emergency and post-care services
7. Improve safety of vulnerable road users.

TransportTransport
Policy orientations on road safety 2011-2020
How to reach the objectives ?
• Improved cooperationCooperation framework, twinnings, exchange of best practices
• Improved participationInformation and awareness campaigns, improvement of the European Road Safety Charter
• Improved monitoringEnhance CARE accidents database, extend the tasks of ERSO (European Road safety Observatory), common principles for road accidents investigation
• Improved enforcementPriority given to the control of the implementation and correct application of EU legislation on road safety

TransportTransport
Policy orientations on road safety 2011-2020
Objective n°6: Improve emergency and post-injuries services
Setting-up of a global strategy of action on road injuries including:
•Harmonization of definitions and concepts•Setting-up an EU target for the reduction of injuries•Enhance post-crash intervention organization
TransportTransport

TransportTransport
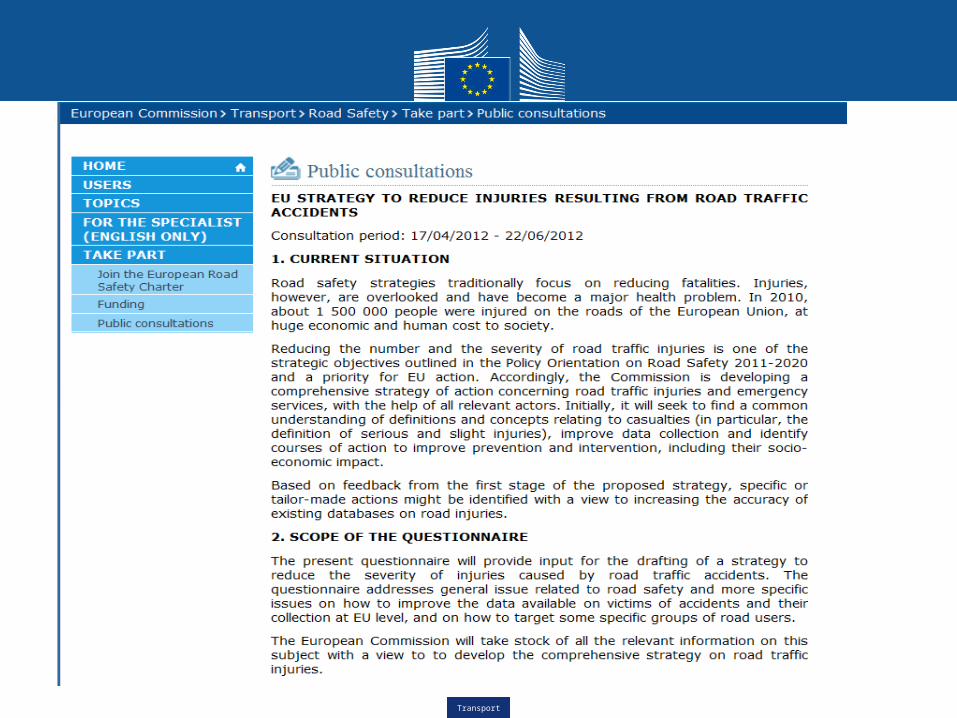
• Public consultations
• EU STRATEGY TO REDUCE INJURIES RESULTING FROM ROAD TRAFFIC ACCIDENTS
• Consultation period: 17/04/2012 - 22/06/2012

TransportTransport
ROAD SAFETY DATA
- Accidents data : CARE database
Legal base, Council Decision 93/704/EC
• - Exposure DATA : Eurostat data Transport data Othe data : population
- Safety Performance Indicators : no legal base
TransportTransport
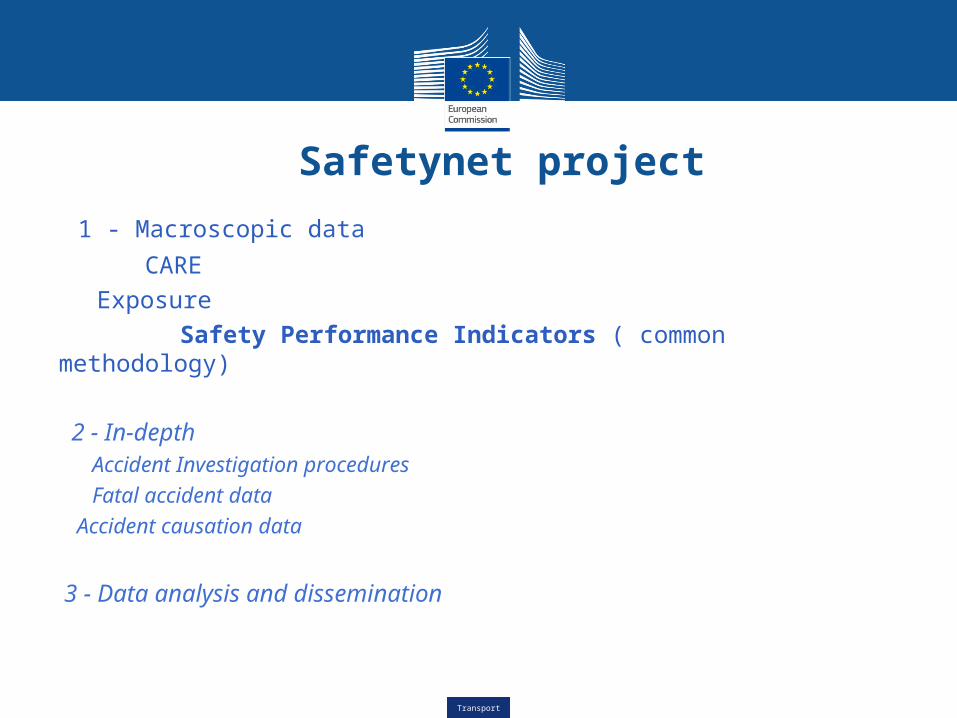
Safetynet project
1 - Macroscopic data
CARE• Exposure Safety Performance Indicators ( common methodology)
2 - In-depth Accident Investigation procedures Fatal accident data• Accident causation data
3 - Data analysis and dissemination

TransportTransport
Safetynet projectPerformance indicatorshttp://ec.europa.eu/transport/road_safety
TransportTransport
Safetynet projectPerformance indicatorshttp://ec.europa.eu/transport/road_safety
……..

TransportTransport
Dacota project
Data Collection, Transfer and Analysis
FP 7 funded project
• •Started in 2010 and will finish in 2012 • •18 Partners and a total budget of €7m, €5m funded by Commission • •Take development of ERSO to next stage Enriching the information content
•Amalgamating and structuring existing data •New in-depth data gathering infrastructure •Gathering new types data •Linking data to policy

TransportTransport
Dacota project
1- Policy-making and Safety Management
2 - Developing a Pan-European In-depth Accident Investigation
3 - Web-based access to data - developing a safety data and knowledge system (Data Warehouse)
4 - Decision Support
5 - Safety and eSafety
6 - Driver Behaviour Monitoring through Naturalistic Driving

TransportTransport
Dacota project WP3

TransportTransport
Dacota project WP3

TransportTransport
Dacota project WP3

TransportTransport
Dacota project WP3

TransportTransport
http://ec.europa.eu/roadsafety

TransportTransport
Thank you
TransportTransport
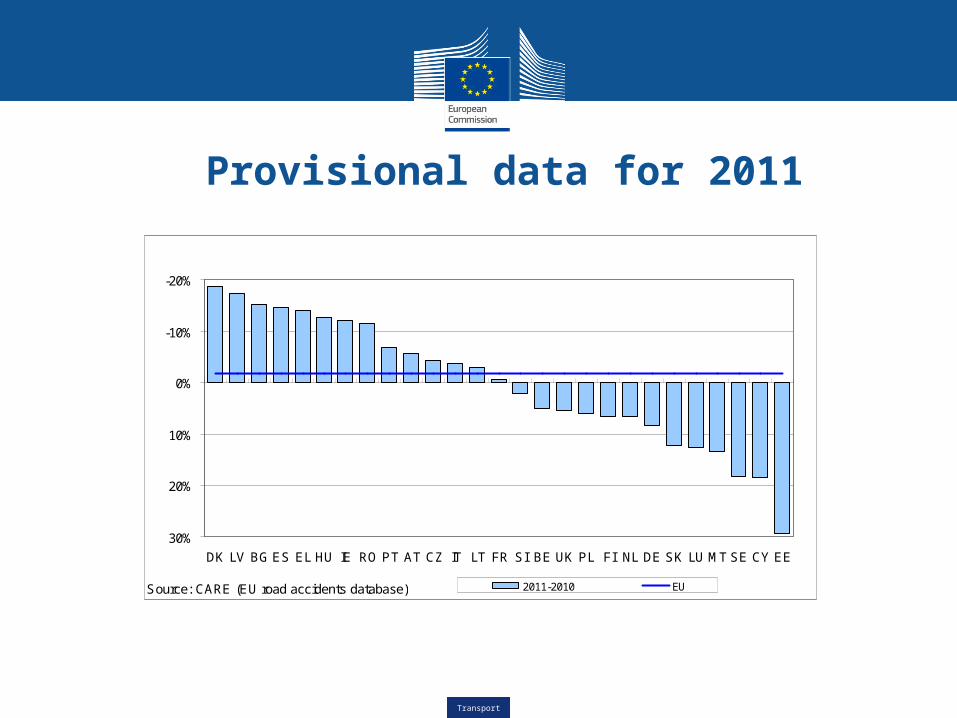
Provisional data for 2011
-20%
-10%
0%
10%
20%
30%
DK LV BG ES EL HU IE RO PT AT CZ IT LT FR SI BE UK PL FI NL DE SK LU MT SE CY EE
Source: CARE (EU road accidents database) 2011-2010 EU

TransportTransport
Fatalities by population - 2010
Fatalities by population Evolution 2001- 2010
0
50
100
150
200
250
SE UK NL MT DE DK IE FI SK ES EE EU FR LU AT IT SI HU CY CZ BE PT LT LV PL BG RO EL
Source: CARE (EU road accidents database) 2001 2010 EU EU 2001

TransportTransport
Contrasted progress by transport mode
EU motorcycle drivers fatalities evolution 2001 - 2010
-60%
-40%
-20%
0%
20%
40%
60%
15-17 18-24 25-49 50-64 >=65
Source: CARE (EU road accidents database)

TransportTransport
Contrasted progress by age
EU fatalities evolution 2001 - 2009
-60%
-50%
-40%
-30%
-20%
-10%
0%
<15 15-17 18-24 25-49 50-64 >=65
Sour ce: CARE (EU r oad accidents database)

TransportTransport
Contrasted progress by car drivers ages
EU car drivers fatalities evolution 2001 - 2009
-0,6
-0,5
-0,4
-0,3
-0,2
-0,1
0
15-17 18-24 25-49 50-64 >=65
Source: CARE (EU road accidents database)

TransportTransport
Contrasted progress by motorcycle drivers ages
EU motorcycle drivers fatalities evolution 2001 - 2009
-60%
-40%
-20%
0%
20%
40%
60%
80%
15-17 18-24 25-49 50-64 >=65
Sour ce: CARE (EU r oad accidents database)

TransportTransport
18-24 years old fatalities by day of the week and hour
0
10
20
30
40
50
60
Monday Tuesday Wednesday Thrusday Friday Saturday Sunday
male female
TransportTransport
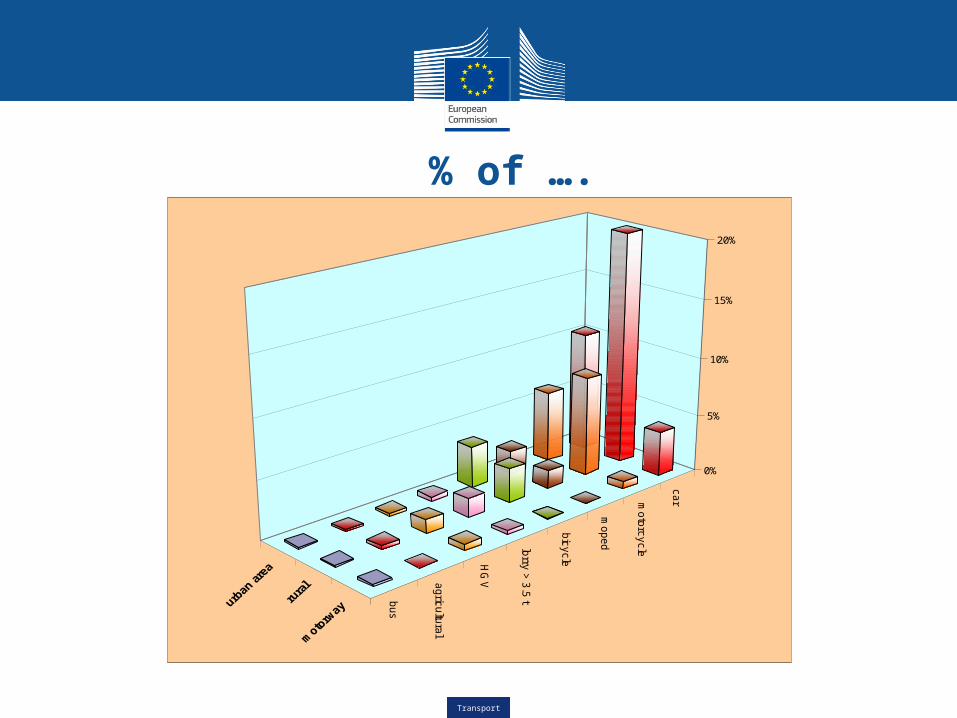
% of ….
carm
oto
rcycle
moped
bic
ycle
lorry
> 3
.5 t
HG
Vagric
ultu
ral
bus
0%
5%
10%
15%
20%
TransportTransport
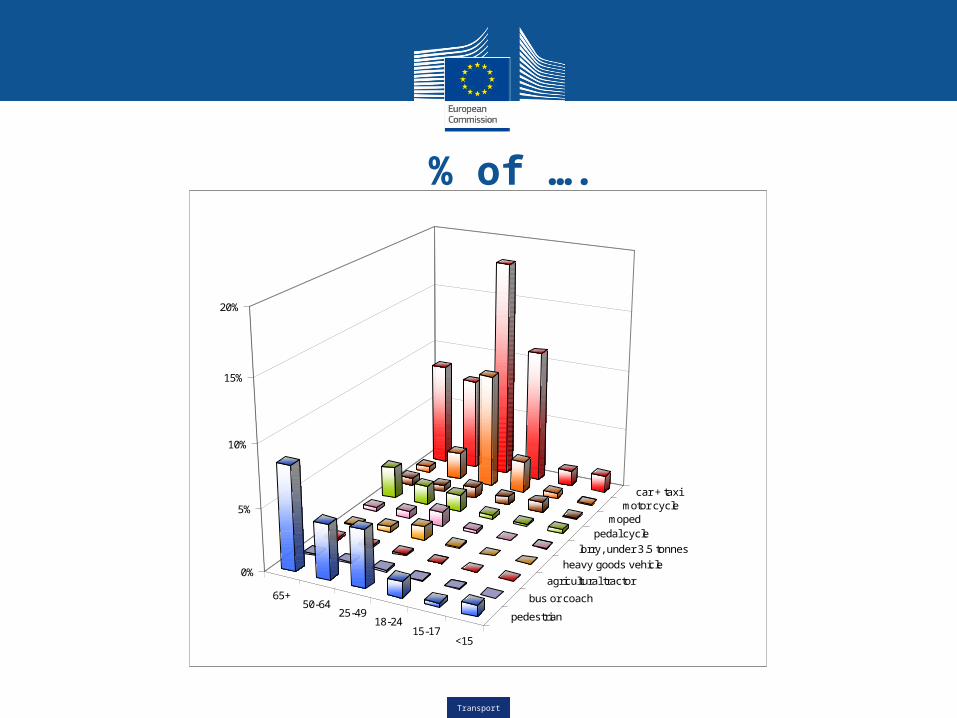
% of ….
65+50-64
25-4918-24
15-17<15
car + taximotor cycle
mopedpedal cycle
lorry, under 3.5 tonnes
heavy goods vehicle
agricultural tractor
bus or coach
pedestrian
0%
5%
10%
15%
20%