road safety progress report - south australia
TRANSCRIPT

Road Safety Progress Report
A quarterly report of road crashes in South Australia - March 2010
The 125 fatalities reported for the 12 months to the end of March 2010 were 6 more
than the 119 fatalities recorded January to December 2009. Overall crashes and
casualties in the last 5 years have continued decreasing. In recent years, serious
injuries are also decreasing in number. In 2009 serious injuries decreased to 1101,
the lowest number on record.
The South Australian State Strategic Plan has a target to reduce fatalities to less
than 90 persons per year and serious injuries to less than 1000 per year by 2010.
South Australian road fatalities and serious injuries – progression towards the target:
2003 2008 2010 current figure 2010 Target
Fatalities 156 99 125 (12 months to March 2010)
less than 90
Serious injuries 1468 1218
1101 (12 months to December 09)
less than 1000
There were 125 fatalities for the 12 months to the end of March 2010 compared to
119 last quarter (12 months to the end of December 2009). There were 1101 serious
injuries for the 12 months to the end of December 2009 compared to 1102 serious
injuries for the previous quarter (12 months to the end of September 2009).

2
Fatalities per month
Month 2003 2004 2005 2006 2007 2008 2009 2010 January 10 13 6 13 12 5 6 21 February 14 10 9 8 9 9 15 9 March 17 8 27 12 10 7 13 10 April 8 10 10 10 14 9 7 May 12 12 14 12 8 5 20 June 13 14 7 16 6 6 9 July 12 18 17 8 7 8 5 August 16 12 14 8 11 11 9 September 12 11 8 8 10 14 11 October 16 15 7 4 11 6 7 November 10 7 14 8 13 9 9 December 16 9 14 10 14 10 8 Total 156 139 147 117 125 99 119
Month 2003 2004 2005 2006 2007 2008 2009 January 129 146 101 114 102 102 103 February 138 104 94 102 109 94 66 March 141 118 131 141 108 112 107 April 118 110 103 116 135 101 87 May 128 111 111 118 106 125 83 June 106 103 91 103 127 87 94 July 131 103 93 87 92 95 112 August 99 108 111 115 113 106 83 September 102 98 113 123 113 119 74 October 120 107 95 135 102 94 93 November 128 110 126 86 125 99 106 December 128 113 127 118 129 84 93 Total 1468 1331 1296 1358 1361 1218 1101
Serious injuries per month

3
The following graph compares the fatality rate per 100,000 population for the 12 months to
the end of March 2010 compared to the previous 12 months for all States and Territories of
Australia. Fatality numbers are from the Australian Department of Infrastructure, Transport
Regional Development and Local Government’s latest release ‘Road Deaths Australia,
Monthly Bulletin March 2010’1.
South Australia continues to perform well. As of March 2010 South Australia has achieved the
greatest average annual percentage change of any state in Australia since 2005 – a 4.4%
decrease, compared to states such as NSW with a 3.3% decrease, Victoria 3.8% decrease,
Qld which has had a 0.5% decrease and WA a 1.9% increase.
Figure 1 – Fatalities per 100,000 population by State and Territory, Australia
5.75.7
34.1
6.84.18.0
9.77.66.2 5.5 6.76.6 6.7
15.1
4.8
10.7
7.97.7
0
5
10
15
20
25
30
35
40
SA NSW Vic Qld WA Tas NT ACT Australia
2008 April 2009-March 2010Fatalities
per 100,000 population
National Target 5.6
1 Fatality numbers from the Department of Infrastructure, Transport, Regional Development and Local Government ‘Road Deaths Australia, Monthly Bulletin, March 2010’.
Fatalities National Comparison

4
Fatalities Trend in South Australia
Fatalities have decreased in recent years. In 2008 the
number of fatalities was below 100 for the first time in
over 60 years, reaching a total of just 99. May 2009 and
January 2010 had high monthly totals. This has brought
the 12 month fatality total to the end of March 2010 to
125.
The 125 fatalities recorded for the 12 months to the end of March 2010 is 39% above the 2010
target of less than 90. The general decline in the number of fatalities in South Australia has
been achieved despite a steadily rising population and an escalation in the number of motor
vehicles on register. From the current trend, the number of fatalities will reach approximately
102 by 2010.
Figure 2 – Number of fatalities in South Australia (rolling 12 monthly data)
0
20
40
60
80
100
120
140
160
180
Jan-0
3Ju
l-03
Jan-0
4Ju
l-04
Jan-0
5Ju
l-05
Jan-0
6Ju
l-06
Jan-0
7Ju
l-07
Jan-0
8Ju
l-08
Jan-0
9Ju
l-09
Jan-1
0Ju
l-10
Number of fatalities Current trend
March 2010 - 107 fatalities
Target: less than
90 fatalities by 2010
Current trend: 102 by 2010
Actual numberMarch 2010
- 125 fatalities
Note: Each point represents the number of fatalities in the preceding 12 months.
Fatalities by road user type: April 09-March 10 2004-2008 Difference Drivers 65 63 +2 Passengers 32 28 +4 Motorcyclists 18 18 - Cyclists 3 3 - Pedestrians 7 12 -5 Motorised wheelchair - 1 - Total 125 125 -
Annual Road Deaths:
Target 2010: 90
2003: 156 2008: 99
(12 month to the end of Mar.) 2010: 125

5
Serious injuries Trend in South Australia
Since 2000 serious injuries have decreased each year
except in 2006 and 2007 when they once again
increased. In 2009 the total reached 1101, the lowest
yearly total of serious injuries since systematic
recording began in 1968. This is just 10% above the
2010 target. The current trend shows that serious
injuries will not reach the 2010 target and instead will
reach approximately 1145 by 2010.
Figure 3 – Number of fatalities in South Australia (rolling 12 monthly data)
0
200
400
600
800
1000
1200
1400
1600
1800
Jan-0
3Ju
l-03
Jan-0
4Ju
l-04
Jan-0
5Ju
l-05
Jan-0
6Ju
l-06
Jan-0
7Ju
l-07
Jan-0
8Ju
l-08
Jan-0
9Ju
l-09
Jan-1
0Ju
l-10
Number of serious injuries Actual number 1099
serious injuriesDecember 2009
Current trend 1182 serious injuriesDecember 2009
Target: less
than 1000
serious injuries by 2010
Current trend
1145 by 2010
Note: Each point represents the number of fatalities in the preceding 12 months.
Serious injuries by road user type: 2009 2004-2008 Difference Drivers 548 655 -107 Passengers 241 314 -73 Motorcyclists 168 171 -3 Cyclists 59 62 -3 Pedestrians 81 109 -28 Motorised wheelchair 4 1 +3 Total 1101 1312 -211
Annual Serious Injuries:
Target 2010: 1000
2003: 1468 2008: 1218 2009: 1101

6
Road crashes in South Australia cost the state over $1 billion per year, the majority of the
cost attributed to serious injury crashes. Even a relatively small reduction in crash numbers
would result in considerable savings to the economy.
The following graph shows the number of casualty crashes (including those that result in
minor injury) since 1981. In a 25 year period the costs of crashes have decreased
considerably. While crashes increased and then decreased between 1997 and 2005, the
relative crash costs stayed steady over the same period. This is mainly because crash
numbers varied, in particular an increase in minor crashes, however the accompanying
decrease in fatal crashes made a considerable impact on total cost.
Figure 4 – Reported casualty crashes and estimated costs, 1981-2009
0
1000
2000
3000
4000
5000
6000
7000
8000
9000
10000
198119
8219
8319
8419
8519
8619
8719
8819
8919
9019
9119
9219
9319
9419
9519
9619
9719
9819
9920
0020
0120
0220
0320
0420
0520
0620
0720
0820
09
Number of crashes
0
500
1000
1500
2000
2500
Cost ($ million)
Reported casualty crashes
Estimated Costs
These crash costs are based on the Bureau of Transport Economic report released in 2000
and indexed using CPI. The costs are estimated based on ’human costs’ and include lost
labour in the work place, household and community, quality of life, ambulance, hospital and
medical care, vehicle and other associated costs.
Cost of crashes Crashes reported to Police
7
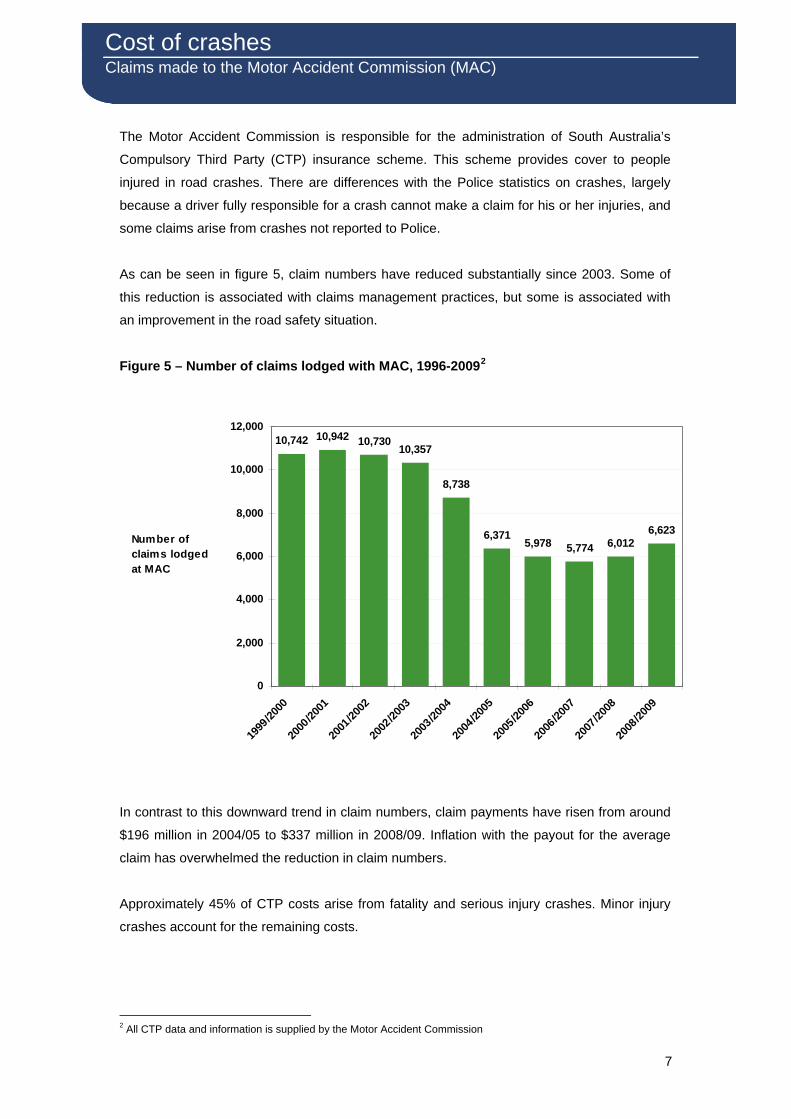
The Motor Accident Commission is responsible for the administration of South Australia’s
Compulsory Third Party (CTP) insurance scheme. This scheme provides cover to people
injured in road crashes. There are differences with the Police statistics on crashes, largely
because a driver fully responsible for a crash cannot make a claim for his or her injuries, and
some claims arise from crashes not reported to Police.
As can be seen in figure 5, claim numbers have reduced substantially since 2003. Some of
this reduction is associated with claims management practices, but some is associated with
an improvement in the road safety situation.
Figure 5 – Number of claims lodged with MAC, 1996-20092
10,742 10,942 10,73010,357
8,738
6,3715,978 5,774 6,012
6,623
0
2,000
4,000
6,000
8,000
10,000
12,000
1999
/2000
2000
/2001
2001
/2002
2002
/2003
2003
/2004
2004
/2005
2005
/2006
2006
/2007
2007
/2008
2008
/2009
Number of claims lodged at MAC
In contrast to this downward trend in claim numbers, claim payments have risen from around
$196 million in 2004/05 to $337 million in 2008/09. Inflation with the payout for the average
claim has overwhelmed the reduction in claim numbers.
Approximately 45% of CTP costs arise from fatality and serious injury crashes. Minor injury
crashes account for the remaining costs.
2 All CTP data and information is supplied by the Motor Accident Commission
Cost of crashes Claims made to the Motor Accident Commission (MAC)

8
In these charts, quarterly indicators relevant to road safety are indexed to a common fixed
point (December 2003) to directly compare the various trends.
Figure 6 shows from June 2006 annual fatalities fell steeply until June 2007 and then once
again declined over 2008. In 2009 fatalities have increased. The average Adelaide fuel price
rose dramatically from September 2007 but had a notable drop in the December 2008
quarter. Since the start of 2009 the price has been on the rise again. Unemployment rose
slightly in late 2008 while serious injuries have decreased slightly in the later half of 2008 and
have continued to do so in 2009.
Figure 6 – Economic indicators and road toll3 (Indexed to December 2003=100)
50
70
90
110
130
150
170
190
Mar-03
Sep-03
Mar-04
Sep-04
Mar-05
Sep-05
Mar-06
Sep-06
Mar-07
Sep-07
Mar-08
Sep-08
Mar-09
Sep-09
Index annual GDP $
road fatalities
Average Adelaide fuel price
unemployment
serious injuries
3 Annual GDP data is from the Australian Bureau of Statistics Table 3. Expenditure on Gross Domestic Product (GDP), Current Prices, Cat No. 5206.0 Australian National Accounts: National Income, Expenditure and Product, Commonwealth of Australia, 2008. Average Fuel Price Adelaide is sourced from the Australian Automobile Association Unemployment data is from the Australian Bureau of Statistics Table 7. Labour force status by Sex – South Australia – Trend, Seasonally adjusted and Original, Cat No. 6202.0.55.001 Labour Force, Australia, 2008 (data is not available yet for 2009)
Travel, economic and crash casualty indicators

9
Figure 7 shows that new motorcycle registrations have grown steadily over time, but have
fallen in 2009. New truck registrations declined for the first quarter of 2009 and then
increased again for the second quarter. Figure 8 shows that the number of motorcyclists
seriously injured have shown some decline in 2009 and then increased again in the last
quarter.
Figure 7 – Annual new vehicle registrations4 (Indexed to December 2003=100)
60
80
100
120
140
160
180
200
220
Mar-03
Sep-03
Mar-04
Sep-04
Mar-05
Sep-05
Mar-06
Sep-06
Mar-07
Sep-07
Mar-08
Sep-08
Mar-09
Sep-09
Index
new cars
new motorcycles
new trucks
Figure 8 – Serious casualties by road user type5 (Indexed to December 2003=100)
40
60
80
100
120
140
160
180
200
220
Mar-03
Sep-03
Mar-04
Sep-04
Mar-05
Sep-05
Mar-06
Sep-06
Mar-07
Sep-07
Mar-08
Sep-08
Mar-09
Sep-09
Index
motorcyclists
drivers
pedestrians
4 New vehicle registrations are supplied by Safety Regulation Division, DTEI, 2008
New cars includes cars, station wagons and panel vans New trucks includes trucks, prime movers, other commercial and commercial trailers >2.5T
5 Please note that in Figure 8 ‘motorcyclist’ does not include pillion passengers
Travel, economic and crash casualty indicators

10
Crashes on AusLink and DTEI roads Nearly 20% of all road travel in South Australia is on AusLink roads and 58% is on DTEI
roads. DTEI and AusLink roads together account for nearly 72% of all fatal crashes and 60%
of serious injury crashes.
Figure 9 – Number of fatal and serious crashes by road type
0
20
40
60
80
100
120
140
160
180
200
Mar-03
Sep-03
Mar-04
Sep-04
Mar-05
Sep-05
Mar-06
Sep-06
Mar-07
Sep-07
Mar-08
Sep-08
Mar-09
Sep-09
Number of serious casualty crashes
DTEI roads
AusLink roads
There was a general decline in the number of serious casualty crashes on DTEI roads from
March to September 2009. The crashes on AusLink roads have shown a slight decrease in
the last half of 2009.
Top 5 crash types There were 1008 crashes resulting in serious injury or death reported in the 12 months to
December 2009. Crash movement patterns remain fairly constant over time with police
reporting crash types such as hit fixed object, right angle, hit pedestrian and vehicle rollover
crashes to be the most common serious crash types in the State. The five leading collision
types for crashes resulting in death or serious injury for metro and rural areas for the 12
months to the end of December 2009 were:
Metropolitan Adelaide Rural SA 131 Hit fixed object crashes 199 Hit fixed object crashes 77 Right angle crashes 117 Vehicle rollover crashes 68 Hit pedestrian crashes 47 Right angle crashes 68 Right turn crashes 28 Head on crashes 59 Rear end crashes 17 Hit pedestrian
Serious casualty crashes

11
Intersection and midblock crashes In the 12 months to December 2009, there were 347 serious casualty crashes at intersections
and 673 serious casualty crashes on midblock sections (those sections of road where there
are no intersecting roads). On average 57% of midblock crashes occur on rural roads, while
the majority of intersection crashes (71%) occur on metropolitan roads.
Since 2003 while midblock crashes have had a slight decrease, intersection crashes have
remained steady. Both have shown a decrease during 2009 with a jump in the last quarter of
2009.
Figure 10 – Number of fatal and serious injury crashes at intersections and midblock sections per quarter
0
50
100
150
200
250
Mar-03
Sep-03
Mar-04
Sep-04
Mar-05
Sep-05
Mar-06
Sep-06
Mar-07
Sep-07
Mar-08
Sep-08
Mar-09
Sep-09
Number of serious casualty
crashes
Midblock crashes
Intersection crashes
Crashes by speed limit In the 12 months to December 2009 there have been 210 serious casualty crashes on
50km/h roads, 296 crashes on 60km/h roads, 162 crashes on 100km/h roads and 175
crashes on 110km/h roads. Crashes resulting in death or serious injury for metro and rural
areas by speed limit for the 12 months to the end of December 2009:
Speed limit of road Metropolitan Adelaide Rural SA 2009 5 year average
2004-08 2009 5 year average 2004-08
Below 50km/h 8 15 5 7 50km/h 144 170 66 76 60km/h 258 318 38 43 70, 80 or 90km/h 90 90 61 62 100km/h 26 24 136 171 110km/h 1 5 174 175
Serious casualty crashes

12
Speed enforcement Figure 11 – Number of expiations issued for speed camera and non speed camera enforcement per quarter, 2003-106 (Speed cameras include mobile cameras and static safety cameras. Non speed camera enforcement includes car mounted mobile radar, hand held laser/radar devices or police vehicle speedometer).
0
10000
20000
30000
40000
50000
60000
70000
80000
90000
100000
Mar-03
Jun-0
3
Sep-03
Dec-03
Mar-04
Jun-0
4
Sep-04
Dec-04
Mar-05
Jun-0
5
Sep-05
Dec-05
Mar-06
Jun-0
6
Sep-06
Dec-06
Mar-07
Jun-0
7
Sep-07
Dec-07
Mar-08
Jun-0
8
Sep-08
Dec-08
Mar-09
Jun-0
9
Sep-09
Dec-09
May-10
Number of Speed camera
expiations
Speed camera expiationsNon speed camera expiations
The 50km/h default urban speed limit was introduced in March 2003. Since then the number
of speed expiations from non speed camera enforcement such as hand held laser devices
have averaged nearly 17,000 expiations per year, while speed camera expiations have
fluctuated. Speed camera expiations include mobile cameras and static speed/red light traffic
safety cameras at intersections. Static traffic safety cameras have been in operation since
December 2003. The obvious decrease in speed camera expiations in late 2005 is due to a
low number of non-fixed speed camera detection hours for that quarter. There was a sharp
increase in the number speed camera expiations in late 2007. One of the contributing factors
to this rise is the increase in the number of non-fixed speed cameras used for speed
enforcement. Since the March 2008 quarter speed camera expiations have declined.
Driver behaviour
6 Enforcement data supplied by Traffic Intelligence Section, South Australian Police 7Blood alcohol concentration for fatalities is supplied directly from Forensic Science SA 8 Please note that these figures are preliminary and may change with future updates

13
Alcohol and drugs The proportion of driver and rider fatalities with an illegal blood alcohol concentration has
been on the increase in recent years to reach levels similar to that of nearly 25 years ago. In
1981, 44 percent of all drivers and riders killed in road crashes had a BAC of 0.05 or greater.
Over time this has decreased to a low of 22 percent in 1998. Since then the incidence of drink
driving amongst drivers and riders killed has generally increased. On average 20% of the
drivers and riders seriously injured that are tested for blood alcohol concentration have a BAC
of 0.05 or above.
In 2009, 27 of the 73 drivers or riders killed (or 37%) who were tested for BAC had an illegal
limit of 0.05 or above7. A further 88 of the 441 drivers and riders tested (or 20%) who were
hospitalised recorded a BAC over 0.058.
On average 23% of driver and rider fatalities that have been tested for the presence of
cannabis, methamphetamine or ecstasy, test positive to one or a combination of these drugs.
In 2009, 17 of the 73 drivers or riders killed (or 23%) who were tested had the presence of
one or a combination of these drugs9 10.
Figure 12 and 13 show enforcement operations and effectiveness of Driver Screening Tests
(previously called random breath testing) by South Australia Police. The data includes both
static and mobile Driver Screening Tests (DST).
Mobile DST (alcohol) was introduced in June 2003 for ‘prescribed periods’ such as long
weekends and school holidays. In June 2005, this was extended to full time mobile DST,
where detections by mobile DST increased. Expiations for both static and mobile DST
peaked in the first quarter of 2006. There has been a second peak of positive tests from
mobile DST in late 2007, a reflection of an increase in testing over this period. Figure 13
shows another rise in positive tests from both static and mobile DST in December 2008, once
again a reflection of the increase in the number of tests conducted at this time as shown in
Figure 12.
7 Blood alcohol concentration for fatalities is supplied directly from Forensic Science SA 8 Please note that these figures are preliminary and may change with future updates 9 Drug results for fatalities is supplied directly from Forensic Science SA 10 Please note that these figures are preliminary and may change with future updates
Driver behaviour

14
Figure 12 – Number of Driver Screening Tests conducted per quarter 2003-201011
0
50000
100000
150000
200000
250000
Mar-03
Sep-03
Mar-04
Sep-04
Mar-05
Sep-05
Mar-06
Sep-06
Mar-07
Sep-07
Mar-08
Sep-08
Mar-09
Sep-09
Mar-10
Number of Driver Screening Tests conducted
Figure 13 – Number of expiations by static and mobile DST per quarter, 2003-201012
0
500
1000
1500
2000
2500
Mar-03
Jun-0
3
Sep-03
Dec-03
Mar-04
Jun-0
4
Sep-04
Dec-04
Mar-05
Jun-0
5
Sep-05
Dec-05
Mar-06
Jun-0
6
Sep-06
Dec-06
Mar-07
Jun-0
7
Sep-07
Dec-07
Mar-08
Jun-0
8
Sep-08
Dec-08
Mar-09
Jun-0
9
Sep-09
Dec-09
Mar-10
Number of peopledetected with
an illegal BAC from DST
Positive tests from static DSTPositive tests from mobile DST
11 Enforcement data supplied by the Traffic Intelligence Section, South Australia Police 12 Enforcement data supplied by the Traffic Intelligence Section, South Australia Police
Driver Behaviour

15
Inattention Driving is a complex task, requiring drivers to use and coordinate a number of skills. Any
lapse in concentration increases the risk of the vehicle being involved in a crash.
In 2009, inattention was reported as a contributing cause of 54% of fatal crashes and 47% of
serious injury crashes.
There are over 160 different offences related to inattentive driving. One of the most common
inattentive driving offences is using a hand held mobile phone. The number of expiations for
hand held mobile phone use and all other inattentive driving offences are shown in figure 14.
There has been an obvious increase in the number of expiations given for hand held mobile
phone use since 2005. Expiations for using a hand-held mobile phone and other inattentive
driving has had a sharp rise since late 2007. The increase in expiations for using a hand held
mobile phone has had a large influence on the number of expiations for inattentive driving
since 2007. The variation in inattentive driving offences over time could be due to differences
in the incidence of inattentive driving or to varying enforcement activity by police.
Figure 14 – Number of expiations for inattentive driving offences per quarter, 2003-201013
0
500
1000
1500
2000
2500
3000
3500
Mar-03
Jun-0
3
Sep-03
Dec-03
Mar-04
Jun-0
4
Sep-04
Dec-04
Mar-05
Jun-0
5
Sep-05
Dec-05
Mar-06
Jun-0
6
Sep-06
Dec-06
Mar-07
Jun-0
7
Sep-07
Dec-07
Mar-08
Jun-0
8
Sep-08
Dec-08
Mar-09
Jun-0
9
Sep-09
Dec-09
Mar-10
Number of expiations for
using a hand-held mobile phone
0
1000
2000
3000
4000
5000
6000
Number of expiations for inattentive driving
Hand held mobile phone useOther inattentive driving
13 Enforcement data supplied by the Traffic Intelligence Section, South Australia Police
Driver Behaviour

16
The 2009 National Community Attitudes to Road Safety Survey14 showed that 92% of South
Australian drivers had a mobile phone and 61% reported that they used a mobile phone while
driving. This is a significant increase from the 2006 Community Attitudes Survey where 42%
of South Australian drivers admitted to using a mobile phone while driving.
Unlicensed or disqualified drivers Of all drivers and riders who were responsible for fatal crashes for the 12 months to March
2010, 73% had at least one previous driving offence in the last 5 years. The majority of
offence types included speeding and driving under the influence (DUI).
From those responsible over the same period, 44% had previously had their licence
disqualified on at least one occasion, and 15% of the drivers responsible did not hold a
licence at the time of the crash.
Unrestrained vehicle occupants In the 12 months to December 2009, 25 people killed and 52 people seriously injured were
not wearing seatbelts.
On average 36% of all drivers and passengers killed and 10% of vehicle occupants seriously
injured are not wearing a seatbelt at the time of the crash.
Intoxicated drivers involved in fatal crashes are less likely than sober drivers to be wearing a
seatbelt at the time of the crash. On average 58% of drivers killed who had a BAC of 0.05 or
above were not wearing a seatbelt at the time of the crash, compared to 20% of sober
drivers.
The proportion of people aged 15 years and over that always wears a seat belt when
travelling in the front seat of a car has remained steady (97% in 2009) at between 95% and
97% since 199315.
Figure 15 shows the total number of restraint expiation notices given per quarter. There are
seven different types of restraint-related offences. The driver of the vehicle is held legally
responsible for four of the offences. Consistently the most common restraint offence involved
the driver failing to wear a seatbelt adjusted and fastened properly.
14 Community Attitudes to Road Safety: 2009 survey report, Social Research Centre, Department of Infrastructure, Transport, Regional Development and Local Government, December 2009. 15 Community Attitudes to Road Safety: 2009 survey report, Social Research Centre, Department of Infrastructure, Transport, Regional Development and Local Government, December 2009
Driver Behaviour

17
Figure 15 –Number of expiations for restraint use offences per quarter 2003-200916
0
500
1000
1500
2000
2500
3000
3500
4000
Mar-0
3
Sep-03
Mar-0
4
Sep-04
Mar-0
5
Sep-05
Mar-0
6
Sep-06
Mar-0
7
Sep-07
Mar-0
8
Sep-08
Mar-0
9
Sep-09
Mar-1
0
Total number of seatbelt expiations
There was a peak of seatbelt expiations in the March 2008 quarter. This coincided with
SAPOLs ‘Operation Belt Up’ targeting seatbelt offence. Another rise can be seen in
December 2009
New seatbelt legislation was introduced on 1 March 2008. Drivers are responsible for
ensuring that their adult passengers aged 16 and over, are properly restrained in the same
way they are responsible for passengers aged less than 16 years.
The variation in the number of restraint-related offences recorded over time could be due to
differences in wearing rates or to varying enforcement activity by police.
16 Enforcement data supplied by the Traffic Intelligence Section , South Australia Police
Road User Behaviour

18
Children Four children aged up to 15 years were killed and 59 were seriously injured in road crashes
for the 12 months to the end of December 2009. This is two fewer fatalities and 8 fewer
serious injuries than the average for the 5 years 2004-2008.
The serious casualties for the 12 months to December 2009 included 4 drivers, 46
passengers, 1 pillion passenger, 3 cyclists and 9 pedestrians. Eight of the vehicle occupant
casualties were not wearing a seatbelt or child restraint at the time of the crash. One of the
cyclists was not wearing a helmet.
Younger road users For the 12 months to the end of December 2009, 42 people aged 16-24 years were killed in
road crashes and 275 people were seriously injured. The majority were vehicle occupants, 22
driver fatalities and 146 drivers seriously injured, 16 passenger fatalities and 65 passengers
seriously injured. In addition there were 2 motorcycle rider fatalities, 32 motorcycle riders
seriously injured, 3 pillion passengers seriously injured, 11 cyclists seriously injured, 2
pedestrians killed and 18 pedestrians seriously injured in this younger age group.
The over involvement of young drivers in road crashes continues to be a serious road safety
problem. In South Australia young people aged 16 to 24 make up 13% of the population but
account for 27% of fatalities and 28% of serious injuries each year. Young drivers in particular
have significantly higher risk of death relative to the number of kilometres driven compared to
other age groups.
Figure 16 – Number of 16-24 year old serious casualties per month 2004-2009
0
5
10
15
20
25
30
35
40
45
50
Janu
ary
Febr
uary
Mar
chA
pril
May
June
July
Aug
ust
Sep
tem
ber
Oct
ober
Nov
embe
rD
ecem
ber
Janu
ary
Febr
uary
Mar
chA
pril
May
June
July
Aug
ust
Sep
tem
ber
Oct
ober
Nov
embe
rD
ecem
ber
Janu
ary
Febr
uary
Mar
chA
pril
May
June
July
Aug
ust
Sep
tem
ber
Oct
ober
Nov
embe
rD
ecem
ber
Janu
ary
Febr
uary
Mar
chA
pril
May
June
July
Aug
ust
Sep
tem
ber
Oct
ober
Nov
embe
rD
ecem
ber
Janu
ary
Febr
uary
Mar
chA
pril
May
June
July
Aug
ust
Sep
tem
ber
Oct
ober
Nov
embe
rD
ecem
ber
Janu
ary
Febr
uary
Mar
chA
pril
May
June
July
Aug
ust
Sep
tem
ber
Oct
ober
Nov
embe
rD
ecem
ber
2004 2005 2006 2007 2008 2009
Road Users

19
Older road users In the 12 months to December 2009, 12 people aged 70 years or over were killed in road
crashes and 93 people were seriously injured.
Deaths and serious injury among older road users aged 70 or over have decreased over the
last 10 years despite an increase in their population.
The serious casualties for the 12 months to December 2009 included 68 drivers, 20
passengers, 5 motorcyclists, 1 cyclists, 8 pedestrians and 3 motorised wheelchair operators.
Three of the vehicle occupant casualties were not wearing a seatbelt at the time of the crash.
Older people generally suffer more serious injury when involved in a road crash because of
their fragility. In the same crash circumstances, a 75 year old is four times more likely to be
seriously injured than a younger person, or suffer minor injuries when a younger person may
have remained uninjured.
Motorcyclists Serious crashes involving motorcycles were relatively low between 1997 and 2001, but have
been increasing since 2002 while other road user trauma has generally decreased. On
average 45% of serious motorcycle crashes are ‘motorcycle only’ crashes and do not involve
another vehicle.
In the 12 months to December 2009 there were 15 motorcycle fatalities and 155 motorcyclists
seriously injured (including pillion passengers). The number of fatalities and serious injuries is
similar to the 2008 totals. Over half of the serious crashes reported were in metropolitan
Adelaide.
Cyclists and Pedestrians In the 12 months to December 2009 there was 2 cyclist deaths and 59 cyclists reported as
seriously injured. Over the same period there have also been 9 pedestrian fatalities and 81
pedestrians seriously injured.
There are approximately 3 cyclists killed and 62 injured per year. On average, most cycling
injuries occur in the metropolitan area (76%), with around 9% of cyclists killed or seriously
injured reported as not wearing a helmet at the time of the collision. A recent survey in the
City of Adelaide reported that 99% of cyclists were wearing helmets.
Road Users

20
Over the last 5 years nearly 1 in every 10 road deaths in South Australia was a pedestrian.
The 9 pedestrian fatalities recorded in the 12 months to December 2009 is three fewer than
the reported total in 2008 and the 5 year average 2004-08.
On average 36% of pedestrian fatalities are found to have a blood alcohol concentration
above the legal driving limit of 0.05. Over half of those that had been alcohol-affected were
found to have had a blood alcohol concentration more than 4 times the legal driving limit.
Heavy vehicles Heavy vehicles travel more than 1 billion kilometres per year in SA. Although they make up
around 3% of vehicles registered in SA, heavy vehicles represent 8% of the kilometres
travelled in the State.
In the 12 months to December 2009, 13 fatal crashes and 63 serious injury crashes were
reported as involving a heavy vehicle. The heavy vehicle driver was deemed to be
responsible in 47% of these serious crashes. Since 2003, serious crashes involving trucks
have averaged around 25 crashes per quarter. The lowest number of serious casualty
crashes involving heavy vehicles occurred in the 2009 September quarter, with just 12
crashes, 3 fatal and 9 resulting in serious injury.
Figure 17 - Number of serious casualty crashes per quarter that involved a heavy vehicle, 2003-2009
0
5
10
15
20
25
30
35
40
Mar-03
Sep-03
Mar-04
Sep-04
Mar-05
Sep-05
Mar-06
Sep-06
Mar-07
Sep-07
Mar-08
Sep-08
Mar-09
Sep-09
Road Users
21
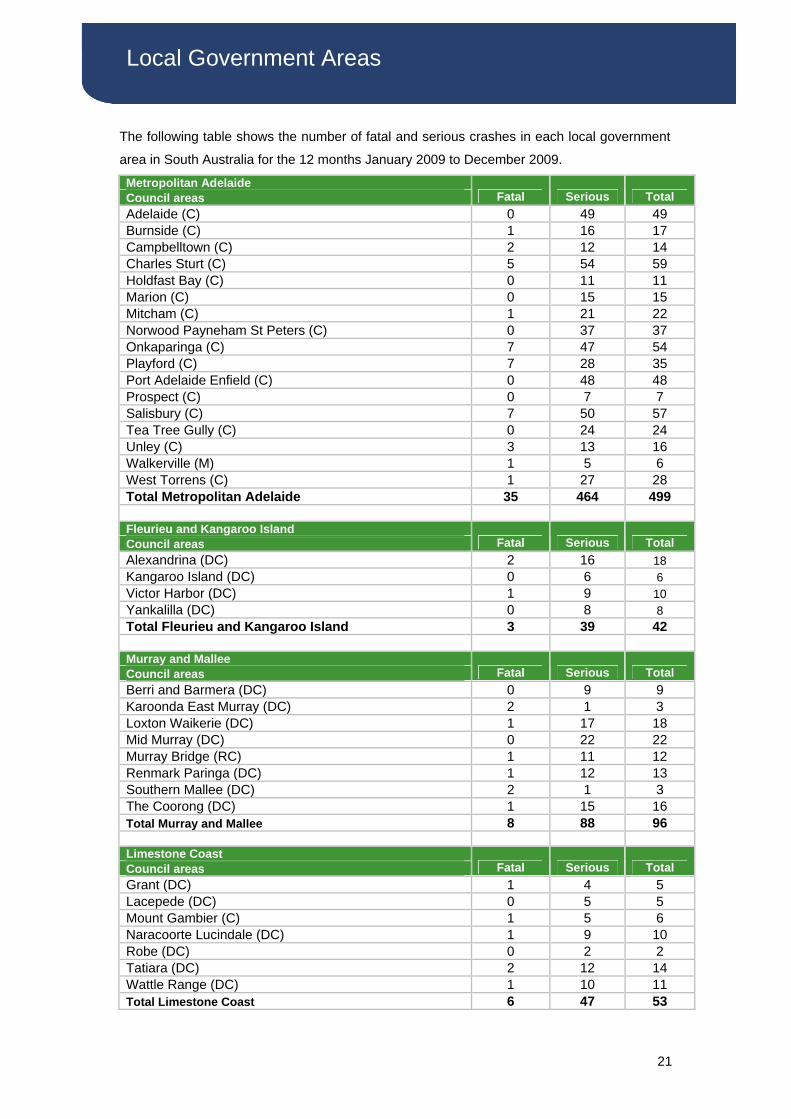
The following table shows the number of fatal and serious crashes in each local government
area in South Australia for the 12 months January 2009 to December 2009.
Metropolitan Adelaide Council areas Fatal Serious Total Adelaide (C) 0 49 49 Burnside (C) 1 16 17 Campbelltown (C) 2 12 14 Charles Sturt (C) 5 54 59 Holdfast Bay (C) 0 11 11 Marion (C) 0 15 15 Mitcham (C) 1 21 22 Norwood Payneham St Peters (C) 0 37 37 Onkaparinga (C) 7 47 54 Playford (C) 7 28 35 Port Adelaide Enfield (C) 0 48 48 Prospect (C) 0 7 7 Salisbury (C) 7 50 57 Tea Tree Gully (C) 0 24 24 Unley (C) 3 13 16 Walkerville (M) 1 5 6 West Torrens (C) 1 27 28 Total Metropolitan Adelaide 35 464 499 Fleurieu and Kangaroo Island Council areas Fatal Serious Total Alexandrina (DC) 2 16 18 Kangaroo Island (DC) 0 6 6 Victor Harbor (DC) 1 9 10 Yankalilla (DC) 0 8 8 Total Fleurieu and Kangaroo Island 3 39 42 Murray and Mallee Council areas Fatal Serious Total Berri and Barmera (DC) 0 9 9 Karoonda East Murray (DC) 2 1 3 Loxton Waikerie (DC) 1 17 18 Mid Murray (DC) 0 22 22 Murray Bridge (RC) 1 11 12 Renmark Paringa (DC) 1 12 13 Southern Mallee (DC) 2 1 3 The Coorong (DC) 1 15 16 Total Murray and Mallee 8 88 96 Limestone Coast Council areas Fatal Serious Total Grant (DC) 1 4 5 Lacepede (DC) 0 5 5 Mount Gambier (C) 1 5 6 Naracoorte Lucindale (DC) 1 9 10 Robe (DC) 0 2 2 Tatiara (DC) 2 12 14 Wattle Range (DC) 1 10 11 Total Limestone Coast 6 47 53
Local Government Areas

22
Adelaide Hills Council areas Fatal Serious Total Adelaide Hills (DC) 4 37 41 Mount Barker (DC) 7 19 26 Total Adelaide Hills 11 56 67 Barossa Council Areas Fatal Serious Total Barossa (DC) 4 15 19 Light (DC) 2 21 23 Mallala (DC) 3 7 10 Gawler (M) 0 7 7 Total Barossa 9 50 59 Yorke and Mid North Council Areas Fatal Serious Total Barunga West (DC) 3 5 8 Clare and Gilbert Valleys (DC) 3 4 7 Copper Coast (DC) 2 10 12 Goyder (DC) 3 6 9 Mount Remarkable (DC) 2 9 11 Northern Areas (DC) 0 7 7 Peterborough (DC) 0 1 1 Port Pirie C, Dists (M) 3 9 12 Wakefield (DC) 1 12 13 Yorke Peninsula (DC) 0 14 14 Total Yorke and Mid North 17 77 94 Eyre Peninsula and Western Council areas Fatal Serious Total Ceduna (DC) 2 7 9 Cleve (DC) 1 0 1 Elliston (DC) 0 1 1 Kimba (DC) 0 1 1 Le Hunte (DC) 0 3 3 Lower Eyre Peninsula (DC) 1 5 6 Port Lincoln © 0 4 4 Streaky Bay (DC) 1 0 1 Tumby Bay (DC) 1 5 6 Whyalla (C) 0 8 8 Total Eyre Peninsula and Western 6 34 40 Far North Council areas Fatal Serious Total Coober Pedy (DC) 1 4 5 Flinders Ranges (DC) 1 2 3 Port Augusta (C) 1 11 12 Roxby Downs (M) 0 1 1 Unincorporated Far North, Pirie, West Coast, Whyalla, Lincoln & Flinders Ranges 6 31 37 Total Far North 9 49 58
Local Government Areas

23
Casualty Crash - A crash where at least one fatality, serious injury or minor injury occurs.
Casualty – A fatality, serious injury or minor injury.
Fatal Crash - A crash for which there is at least one fatality.
Fatality - A person who dies within 30 days of a crash as a result of injuries sustained in that
crash.
Minor Injury Crash - A crash for at least one person sustains injury but no person is
admitted to hospital or dies within 30 days of the crash.
Minor Injury – A person who sustains injuries requiring medical treatment, either by a doctor
or in a hospital, as a result of a road crash and who does not die as a result of those injuries
with 30 days of the crash.
Property Damage Only Crash – A crash resulting in property damage in excess of the
prescribed amount in which no person is injured or dies within 30 days of the crash.
Serious Casualty Crash – A crash where at least one fatality or serious injury occurs.
Serious Casualty – A fatality or serious injury
Serious Injury Crash - A non-fatal crash in which at least one person is seriously injured.
Serious Injury - A person who sustains injuries and is admitted to hospital as a result of a
road crash and who does not die as a result of those injuries within 30 days of the crash.
Enquiries For further information about data in this report, contact:
Safer People, Department for Transport, Energy and Infrastructure
GPO Box 1533
Adelaide SA 5001
Email: [email protected]
Internet: www.dtei.sa.gov.au/roadsafety
Data Sources The data presented in this report is obtained from the following sources:
Department for Transport, Energy and Infrastructure
Motor Accident Commission
South Australia Police
Road deaths and injury from recent months are preliminary and subject to revision
Definitions