rmonitor one - netshield south africa one - netshield - manual... · 1hwvklhog 0rqlwru 2qh...
TRANSCRIPT

Netshield Monitor One Manual/Help file
Table of ContentsAbout this Manual/Help file........................................................................................................................1Chapter 1. Introduction.............................................................................................................................7
About Netshield...........................................................................................................................7About Network Management..................................................................................................................7About this manual................................................................................................................................8
Chapter 2. System requirements and recommendations...............................................................................16System requirements..........................................................................................................................16Recommendations..............................................................................................................................16Installation tasks................................................................................................................................16The installation directory structure:.......................................................................................................17Rights...............................................................................................................................................17The License information window...........................................................................................................17
Chapter 3. The Graphical network map......................................................................................................19About the Graphical network map.........................................................................................................19The Monitor one control panel..............................................................................................................19Objects.............................................................................................................................................21Operator and Designer mode................................................................................................................22
Switching between modes...............................................................................................................22Setting the Designer password.........................................................................................................22
Projects............................................................................................................................................22Creating a new Project........................................................................................................................23
Changing the default Firebird username and password / Securing your project........................................23Adding, Modifying, Removing or Moving a Device- or Virtual object........................................................24
Adding a new Device- or Virtual object to the map..........................................................................24Modifying a Device- or Virtual object.............................................................................................26Removing a Device- or Virtual object............................................................................................26Moving a Device- or Virtual object................................................................................................26
Building network maps using IP-nodes found by Discovery...................................................................26Adding, Resizing, Removing or Moving a Shared Medium object............................................................27
Adding a shared medium object to a network map..........................................................................27Resizing a shared medium object.................................................................................................27Removing a shared medium object...............................................................................................27Moving a shared medium object...................................................................................................27
Adding, Modifying, Removing or Moving a Free-Text object..................................................................27Adding a Free-Text object...........................................................................................................27Modifying a Free-Text object........................................................................................................28Removing a Free-Text object.......................................................................................................28Moving a Free-Text object...........................................................................................................29
Adding or Removing links between objects.........................................................................................29Selecting a link type...................................................................................................................29
Page 2 of 180

Adding a link between objects......................................................................................................29Removing a link between objects.................................................................................................29
Background images........................................................................................................................30Adding a background image to a network map...............................................................................30
Background image requirements:.............................................................................................30Removing a background image from a network map.......................................................................30
Building a hierarchical multi-level map structure.................................................................................30Creating a child map (sub-map)...................................................................................................30Moving between maps................................................................................................................31
Error control..................................................................................................................................31About error control.....................................................................................................................31How Error Control determines the root-cause of a "No response from device" event.............................33Enabling Error control.................................................................................................................33
Verifying Error Control activity.................................................................................................34Verifying network paths used by Error control............................................................................34
The Desktop feature.......................................................................................................................38Saving a Desktop setup..............................................................................................................38Updating a Desktop setup...........................................................................................................39Removing a Desktop setup..........................................................................................................39
Opening an existing project..................................................................................................................39Opening a project via the GUI..........................................................................................................39Monitor one commandline switches...................................................................................................39
Database maintenance........................................................................................................................40Making a backup............................................................................................................................40
Midnight backups.......................................................................................................................40Instant backups.........................................................................................................................40
Restoring a backup.........................................................................................................................41Database reorganization..................................................................................................................41
The Event control window....................................................................................................................41Chapter 4. Classes..................................................................................................................................43
Understanding Classes........................................................................................................................43Adding, Modifying or Removing a Class..................................................................................................43
Adding a new Class........................................................................................................................43Adding, Modifying or Removing a custom menu-item......................................................................47Defining your own Class images...................................................................................................48
Modifying a Class...........................................................................................................................49Removing a Class...........................................................................................................................49
Class files / Class Packages..................................................................................................................49About Class packages.....................................................................................................................49Creating a Class file or Class package................................................................................................49Importing a Class package...............................................................................................................50
Chapter 5. SNMP data retrieval with Shooters.............................................................................................52About Shooters..................................................................................................................................52Shooter Types....................................................................................................................................52
Table shooter................................................................................................................................53Graph shooter................................................................................................................................54Threshold shooter..........................................................................................................................56History shooter..............................................................................................................................57Set shooter...................................................................................................................................57Meter shooter................................................................................................................................58SnipMon Gauge and SnipMon Graph shooters.....................................................................................59Pie Shooter...................................................................................................................................60
Shooters – Glossary and terms.............................................................................................................61Starting Shooters...............................................................................................................................62
Starting Foreground Shooters..........................................................................................................62Using SpeedShooters..................................................................................................................62
Setting the "SpeedShooter" property of a Shooter......................................................................63Starting Background Shooters..........................................................................................................64
Starting a Background Shooter at the device level..........................................................................64Starting a Background Shooter at the Class level............................................................................64
Creating Shooters...............................................................................................................................64Creating a Shooter with the wizard...................................................................................................65Creating a new Shooter directly from the MIB tree..............................................................................65
Page 3 of 180
Manually creating a new Shooter......................................................................................................68About Formulas.........................................................................................................................71
Adding a formula to a Shooter.................................................................................................71Example 1. Manually building a Shooter that monitors port 7 of a switch................................................73
Modifying or Removing Shooters...........................................................................................................77Using SNMP for status polling...............................................................................................................78
Chapter 6. Logging SNMP data for trending and long-term analysis................................................................79About logging SNMP data.....................................................................................................................79
The native Monitor one history database versus the RRD......................................................................79Accessing the native Monitor one database.............................................................................................79
The History control window..............................................................................................................79Showing History data from the native database in a graph...................................................................80Exporting History information to a *.txt file........................................................................................81
How to import an export file into Microsoft Excel.............................................................................83Automatic database cleanup............................................................................................................83
Accessing the RRD..............................................................................................................................83RRDTool........................................................................................................................................83Location, Format and Fields in an RRD ..............................................................................................83Showing History data from the RRD in a graph...................................................................................84Building new Graph definitions.........................................................................................................85Exporting RRD History information to a *.txt file.................................................................................87
The epoch UTC issue..................................................................................................................92Chapter 7. Alerting..................................................................................................................................93
About Alerting....................................................................................................................................93Defining when to Alert.........................................................................................................................93
Customizing Alerting.......................................................................................................................93Defining how to Alert..........................................................................................................................94
Configuring audible alerting.............................................................................................................94Configuring e-mail alerting..............................................................................................................95
About Recipient Groups and Addresses..........................................................................................97Defining Alert-groups and Recipients........................................................................................97
Executing a program or script triggered by an event............................................................................99Parameters and Passing mode....................................................................................................101Examples................................................................................................................................101
Send (SMS) messages to Pagers, Cell phones or Handhelds triggered by an event.................................102Generic Messaging Gateway.......................................................................................................102PageGate Messaging Gateway....................................................................................................102
How long does Alerting remain active?.................................................................................................103Reverse Alerting...............................................................................................................................104Example 2. Sending an email alert message triggered by a Threshold exceeded event................................104
Chapter 8. The WEB interface.................................................................................................................106About the Monitor one WEB interface...................................................................................................106Setting up the Monitor one WEB server................................................................................................106
Managing WEB interface users........................................................................................................107Web user roles.........................................................................................................................108
Accessing the WEB interface..........................................................................................................109Working with the Web interface..........................................................................................................109
Zooming-in on device objects and executing Shooters using the web interface......................................110Chapter 9. Traps, the Monitor one Trap receiver........................................................................................115
About traps......................................................................................................................................115Trap versions...................................................................................................................................115Enabling the Trap receiver..................................................................................................................115Viewing received Traps......................................................................................................................116Defining Trap filters / Adding trap filter rules........................................................................................117Unblocking traps / Removing Trap filter rules........................................................................................120
How Monitor one Trap filtering exactly works....................................................................................121Chapter 10. Discovery and Extensive Monitoring........................................................................................123
About Discovery and Extensive Monitoring............................................................................................123Running Discovery and Extensive Monitoring version 1 (EM1) periodically.................................................123
Discovery and Intrusion Detection systems......................................................................................125Working with Discovery.....................................................................................................................125
Viewing the discovered nodes in a range..........................................................................................125Associating discovered IP nodes with Monitor one classes...................................................................126
Page 4 of 180

Adding, Modifying or Removing IP ranges.........................................................................................127Discovering an IP range.................................................................................................................128Building network maps using IP-nodes found by Discovery.................................................................128
Working with Extensive Monitoring (EM1).............................................................................................128How does EM1 work?....................................................................................................................128Which potential problems is EM1 able to find....................................................................................128Viewing EM1 messages..................................................................................................................129
Chapter 11. Utilities...............................................................................................................................131FinePing..........................................................................................................................................131
Using FinePing via its GUI..............................................................................................................131One by one mode.....................................................................................................................132Generator mode.......................................................................................................................133
Using FinePing on the commandline or in a command file...................................................................134FineTrace........................................................................................................................................135The system Logbook.........................................................................................................................135TFTP server......................................................................................................................................136
Configuring the TFTP server...........................................................................................................136Viewing TFTP server activity...........................................................................................................136
MIB Compiler...................................................................................................................................137About compiling MIB files and the default Monitor one MIB tree...........................................................137Compiling new MIB files.................................................................................................................137Compiling multiple MIB files in one action........................................................................................138MIB resources on the WWW...........................................................................................................138Backing-up or Restoring the default MIB tree....................................................................................138
Syslog server...................................................................................................................................139About the Syslog server................................................................................................................139
Viewing syslog messages..........................................................................................................140Filtering Syslog messages..............................................................................................................140Syslog messages and alerting.........................................................................................................141
Chapter 12. How to get the best out of monitoring your network with Monitor one..........................................142Network monitoring - a six step guide..................................................................................................142
Step one: visualize your network....................................................................................................142Step two: setup Alerting and logging...............................................................................................142Step three: collect historic information for baselining and trending purposes.........................................142Step four: set up threshold monitoring............................................................................................143Step five: define real-time graphing................................................................................................143Step six: stay alert!......................................................................................................................144
Checklist.........................................................................................................................................144Appendix A. What you need to know before you start building Shooters........................................................145
Part 1. SNMP....................................................................................................................................145SNMP key terms...........................................................................................................................145Examples....................................................................................................................................146
Part 2. The Monitor one Shooter concept..............................................................................................148About.........................................................................................................................................148Examples....................................................................................................................................148
Example 1. Querying a device’s name and description...................................................................149Example 2. Querying the whole system branch.............................................................................149Example 3. Querying the whole interfaces branch and showing the values in a simple table................150Example 4. Querying all ifInOctets and ifOutOctets fields from the interfaces branch and showing the values in a multicolumn Table (rows and columns)........................................................................151Example 5. About Tables and complex instances...........................................................................152Example 6. A simple Graph Shooter that retrieves the incoming and outgoing bytes per second of the second interface of a host..........................................................................................................155Example 7. Using the formula option in a Graph Shooter................................................................155Example 8. Graph Shooters and the use of the keywords: "All instances" or "On runtime"...................157Example 9. The Alternate Legend option......................................................................................160Example 10. Threshold Shooters................................................................................................161
The IDFFS ("Is different from first sample") and the HCF ("Has Changed From") operators.............163Example 11. Special Formula options for SnipMon Shooters............................................................165Example 12. The "Instance Filtering" option for Threshold and History Shooters................................167
Appendix B. Various program windows.....................................................................................................170The network map..............................................................................................................................170
Adding a new device to the map.....................................................................................................170
Page 5 of 180

Adding a shared medium (thin/thick coax) to the map.......................................................................170Adding Free Text to the map..........................................................................................................170Building hierarchical network map structures by using "Network objects"..............................................171Adding links/connections between objects........................................................................................171Removing a device, Free text or Shared medium...............................................................................171Removing a network map..............................................................................................................171Removing a link between objects....................................................................................................171Moving a device, Free text, Shared medium or network object............................................................172Resizing the width of a shared medium object..................................................................................172Adding a background image to a map..............................................................................................172Removing a background image.......................................................................................................172Working with objects on the map....................................................................................................172
The <DeviceName> a closer look window.............................................................................................174The Manage Classes window...............................................................................................................175Customizing the Status poller.............................................................................................................175The Customizing Trap management window..........................................................................................176The Customizing Threshold management window..................................................................................176The Syslog server.............................................................................................................................177The Customize Alerting window...........................................................................................................177The TFTP server log window...............................................................................................................178The Add/Modify a Shooter window.......................................................................................................178The Namelist....................................................................................................................................178The Define <ClassName> Shooters window..........................................................................................179The Add/Modify a <ClassName> Shooter-target window.........................................................................179The Add/Modify formula: <FormulaName> window................................................................................179The Threshold control window.............................................................................................................179
Page 6 of 180

Chapter 1. Introduction
About Netshield
About Network ManagementIn today's connected world, real-world usage of computing revolves around the concept of networking, and thorough network management is extremely important. It is therefore somewhat surprising to discover that so many businesses and organizations fail to spend a reasonable amount of time and money to set up some kind of reliable and useful network management.
The obvious (yet often overlooked) fact is that without a reliable network, there can be no reliable networking! Yet details of what the network is doing, how it is performing and where the problematic areas are, is often simply not available.
Why would you implement raid-technology, server clustering, fail-over systems and use other fault-tolerant and redundant equipment and yet still tolerate complete invisibility of possibly the most important (in terms of need for availability) computer on the network (the network itself).
Page 7 of 180
The importance of a business's network is often overlooked or dismissed as "simply there", yet the critical nature and growing importance of LANs in a business organization make it obvious why network management is absolutely vital, and cannot be omitted or neglected!
Possibly one of the reasons for the small number of network management applications in use is the unfamiliarity with the network management approach, and the complexity of many suitable applications in general.
• Using a network management solution allows you to track the performance of your network and quickly identify problems before they affect your users.
• Network downtime can affect your business and its productivity. • Reactive network management does reduce downtime by responding to device and link failures.
Proactive network management however enables you to detect potential problems before they actually occur which reduces the number and severity of failures and can help reduce downtime.
• Network topology and monitoring information give you the necessary accurate view of your network's structure and traffic rates, which enables you improving overall network performance.
• Network management enables you to make better use of current equipment, delaying expensive upgrades.
About this manualThis manual is intended to provide information about the features and functions of Monitor one, and describes how they can be combined to make the most out of Network Management. This manual is written for technical staff responsible for Network Management, Maintenance and Monitoring. The reader is expected to have good knowledge of (IP) networking technology in general and of the protocols ICMP and SNMP in particular.
Page 8 of 180

Chapter 2. System requirements and recommendations
System requirements• Pentium-class processor >= 1Ghz MHz • Video adapter, supporting at least High Color (16bit) and 1024x768 pixels screen size. • Sound card for audible Alerting (Beeping and Speech) • Microsoft Windows 2000/2003/XP (Workstation and server) • The Minimum amount of RAM depends on the number of monitored nodes in the network: >= 512
Mbytes • The Minimum amount of free hard disk space depends on the number of nodes in the monitored
network and the number of running History Shooters for trending and long-term analysis. > 5 Gbyte • Microsoft Internet Explorer version 6 or Mozilla Firefox version 1.0/1.1
Optional: a connection to the Internet (For accessing additional information, Monitor one bulletins and MIB resources)
If you want to use the "alerting by Speech" option, you need an English Windows platform with Speech capability!
Recommendations• It is recommended that Monitor one is run on a separate workstation (not the workstation you use as
your day-to-day workstation) • The Monitor one software and the project database files must be installed/created locally - do not install
them on a server drive. A connection to a server can be lost in case of a major network failure - and this is just the event where Monitor one is supposed to help.
• Use a fixed IP-address for the Monitor one workstation. (traps and syslog messages are usually sent to a fixed IP-address)
• For best monitoring results, connect - if possible - the Monitor one station to the backbone of your network.
Installation tasks1. Before you start installing a new Monitor one version, make a backup of your existing projects. A new
version usually makes changes to the names and format of fields in database. 2. Make sure you have administrative rights before you begin the installation. 3. If you are running the Monitor one installation file in a terminal-server session (mstsc.exe), make sure
you have specified the /console option. The database engine included in the installation file (Firebird) can only be installed via the system console OR via a terminal-server session with the /console option!
4. If you want to upgrade to a newer version, de-install your existing Monitor one installation including all components (Firebird and Apache) first.
Because of the special-purpose nature of an NMS (Network Monitoring Station) Monitor one is installed on the local hard disk of a Windows workstation (or server) and uses a fixed LOCAL installation directory structure to prevent system crashes if serious network failures occurs!
Page 16 of 180

The installation directory structure:<WINDISK>:\Program Files\FineConnection\Monitor one <WINDISK>:\Program Files\FineConnection\Monitor one\Backgrounds <WINDISK>:\Program Files\FineConnection\Monitor one\Defaults <WINDISK>:\Program Files\FineConnection\Monitor one\FinePing <WINDISK>:\Program Files\FineConnection\Monitor one\FineTrace <WINDISK>:\Program Files\FineConnection\Monitor one\Images <WINDISK>:\Program Files\FineConnection\Monitor one\Online Help <WINDISK>:\Program Files\FineConnection\Monitor one\Spool <WINDISK>:\Program Files\FineConnection\Monitor one\WEB
<WINDISK> This specifier is replaced with the drive letter of the disk containing the Windows directory.
RightsMonitor one needs Full control rights during operation in directories listed above. Grant access to these directories manually if you prefer to log on as a different user than Administrator or Power user.
The License information windowThe Monitor one licence information window provides information about the license type, the number of device objects to monitor and is the right place to enter your license key. To open the License information window select Info|License information from the menu on the Monitor one control panel
The Monitor one licensing structure is simple and straightforward. The license type determines how many device objects on the network map can be polled for status. Polling is automatically suspended for all device objects that are added after the maximum has been reached. There are 7 different license types available:
Primary License types Max #devices to monitor #SNMP monitors (Shooters)
S-type 50 Unlimited
M-type 200 Unlimited
L-type Unlimited Unlimited
Upgrade License types
Upgrade S-to-M type 200 Unlimited
Upgrade S-to-L type Unlimited Unlimited
Upgrade M-to-L type Unlimited Unlimited
Enterprise license types
Enterprise M-type 200 Unlimited
Enterprise L-type Unlimited Unlimited
A Single Monitor one license A single Monitor one license entitles the licensee to install and run one Monitor one instance on one single machine/workstation within the licensee's Company, Organization or Enterprise.
An Enterprise license An enterprise License entitles the licensee to install and run multiple Monitor one instances on multiple
Page 17 of 180

machines/workstations and use multiple domains within the licensee's Company, Organization or Enterprise. If you are a Network Operations Center (or similar business) delivering monitoring and management services to external customers, you are entitled to use the enterprise license for monitoring and management of all your customers networks as long as the running Monitor one instances stay within your company, organization or Enterprise. It is not allowed to use an enterprise license to run Monitor one instances on machines at customer locations!
Without a license key, Monitor one runs in evaluation mode, with no time restrictions whatsoever. The evaluation mode allows you add 8 device objects. There is no functional difference between running in evaluation mode and normal mode - it is the same software! Without a purchased license key, only the number of devices that can be monitored is limited!
If you are a new Monitor one user and you want to buy a license, you must choose one of the available primary license types. Existing users (with a primary key) can upgrade their license type by buying an upgrade key.
Upgrade keys can only be used in combination with a primary key. An upgrade key does not work without a primary key!
License types cannot be downgraded!
Page 18 of 180

Chapter 3. The Graphical network map
About the Graphical network mapTo achieve a better understanding of the network, for better availability- and health monitoring and to understand the consequences of a failure more quickly, Monitor one allows you to create a graphical multilevel representation of your network that lets you move easily between parent maps and sub-maps (zooming-in and zooming-out).
The graphical network map uses colors and icons to indicate network status at a glance. The Map makes it easy to view the IP subnets and the IP hosts that have either been added manually or with help from the Discovery utility.
Monitor one has been designed to run on a Windows station in the network manager(s) control room or NOC and cannot be run as a service! The network maps can be viewed and accessed locally via the native interface and/or remotely by using the web-interface. The web interface provides limited functionality!
Uptime and Health monitoring is done by polling. Uptime monitoring is performed by periodically sending each device an ICMP echo request (ping), health monitoring by sending SNMP requests. In those special cases where devices are behind a firewall blocking ICMP, also SNMP can be used for uptime monitoring.
The Monitor one control panelThe Monitor one main window (sometimes also referred to as control panel) provides general information about the status of the network being monitored. The main window stays always on top. All navigation through the program starts from here.
Page 19 of 180

Start a new project Click the speedbutton or select File|New project to start a new project. Select the directory for the database of your project and assign a unique project name. The name may consist of up to 16 characters (a..z,A..Z,0..9,_) and may not contain spaces. The project's name of an existing project cannot be modified! It is strongly recommended to select a directory on your local drive (not a server drive). This guarantees availability in case of serious network failures!A project database consists of a set of database files all beginning with <Projectname>_. A project is uniquely identified by a file named "<Projectname>.amd". By default Monitor one creates new projects in the c:\Monitor one Maps\ directory that has been created during installation.
Open an existing project Click the speedbutton or select File|Open project to select and open an existing project. Browse to the directory that contains the project database and select the <Projectname>.amd file.
Bring Rootmap to front Use the speedbutton or select File|Bring rootmap to front to open a project's root map in case you've closed all maps.
The Discovery window Click the speedbutton or select Options|Discovery / Discover IP nodes to open the Discovery window. The Discovery feature allows you to define IP ranges (subnets) and scan these ranges for IP nodes. You can use the discovered nodes to easily setup and draw your project by copying and pasting them to your network maps.
Manage classes Click the speedbutton or choose Edit|Manage Classes to open the "Manage classes" window in order to Add, Modify or Remove Monitor one Classes.
New user Help By default, Monitor one opens a Help window that provides basic information for new users each time Monitor one is started. The speedbutton lets you toggle this help on/off. You can control this Help feature by selecting Options|Global configuration and then the Various tab.
Operator and Designer mode Use the speedbutton (or select the menu item Operation mode) to toggle between Operator and Designer mode. In "Operator mode", you can use all program functions but you cannot make any modifications to the project. In "Designer mode", you can use all program functions and you can also make changes to a project's configuration, it's (sub) maps or functionsBy default, Monitor one switches from Designer mode to Operator mode automatically after ten minutes in Designer mode. You can change this behavior by selecting Options|Global configuration and then the Various tab.
Audible alerting Use the speedbutton to toggle audible Alerting on/off.
Ping You can use the speedbutton to start FinePing (Monitor one's implementation of the ICMP Ping command tool)
Traceroute Use the speedbutton to start FineTrace (Monitor one's implementation of a traceroute tool)
Find a device on the map Use the speedbutton to find a device (or a sub-string of a device name) on the map. Monitor one will automatically open all maps that contain the requested device (or the sub string). All others maps are closed!
Namelist Click the speedbutton to open the namelist window. The namelist window gives access to information about IP addresses, MAC addresses etc... that Monitor one has collected from several sources. Note that this is a learning process! For new projects, there will not be much information available but the amount information will rapidly grow.
Global configuration Click the Speedbutton to access the Global configuration database. This Speedbutton is only enabled in Designer mode.
Error control ready indicator You can verify whether your map is "EC proof" by enabling EC and after that clicking the speedbutton on the Monitor one control panel.
No response indicators
Page 20 of 180

The 10 green or red lights are "No response indicators". The lights indicate how many devices at a time have the 'No response' status subdivided by increasing priority level from left to right. If the mouse is moved over a light, a hint box shows all devices with the no response status for that level.
The Alert, EC and Lic indicators • The indicator labeled Alert is used for visual alerting. In the event of an alert, it turns red. If the Alert
indicator is clicked, the Event control windows opens showing all currently pending "No response" and "Threshold exceeded" events!
• The indicator labeled EC is used to indicate whether 'Error control' is disabled (white), enabled but idle (green) or active (yellow).
• If the indicator labeled Lic turns red, it indicates that there are not enough license related resources to monitor your network. A green indicator indicates "license Ok" (sufficient license related resources). When this indicator is clicked, the license information window opens!
The control tabs The tabs at the right of the control panel give access to various program options. By default, the Event control tab is selected.
• The Event control tab and its speedbuttons provide information about events that have occurred. • The Trap control tab and its speedbutton lets you zoom-in on received traps. • The Threshold control tab gives access to the list of running Threshold monitors (Shooters in Monitor one
terminology) and their status. • Use the History control tab to view all running History monitors (Shooters) and to get access to their
collected data. • Use the TFTP server tab to view the received TFTP read and write requests. • The Desktop tab lets you save your current desktop configuration (open maps, running real-time graphs
or tables etc...) to the database for later use.
ObjectsA Monitor one network map is built using icons, lines and text-labels on one or more maps, representing the physical nodes and networks in buildings, rooms, subnets etc. These icons, lines and labels are called map objects.
If you are planning to enable Error Control then it’s important to setup your network maps as factually as possible. Monitor one uses the map information for determining the root-cause of "Device down" event.
There are different types of objects:
• Device objects are objects that represent physical devices in a network. Monitor one polls device objects
periodically for status and health. • The representation of a physical link between device objects is called a link object. You can choose
between different link types as: UTP/STP, Fiber, Coax etc. • Virtual objects are objects that do not represent any physical device or link. Virtual objects are used for
drawing reasons only. • For better readability and presentation, you can also use free text objects. Free text objects are text
labels from which the font, color and size can be adjusted.
• The ThisStation object is a special purpose object. It represents the physical workstation (or server) that runs the Monitor one software. The ThisStation object is the key object for the "Error control" feature. Error Control is automatically enabled when the ThisStation object is added to the map. Error Control is a Monitor one feature that tries to find the root-cause of a failure in the network in order to prevent superfluous alert messages.
Page 21 of 180

Operator and Designer modeIn order to protect a Monitor one project (network maps, configuration) from unauthorized or unintended modification, two user-levels have been defined.
• In Operator mode you can use all program functions but you cannot make any modifications to the project.
• In Designer mode you can use all program functions and you can also make changes to a project’s configuration, it’s (sub) maps or functions.
The title of the main program window provides information about the selected working mode. The designer mode is password protected.
Switching between modesFollow these steps:
1. Select Operation mode on the main window. 2. Select either To Designer mode or To Operator mode depending on the current mode. 3. If you select To Designer mode, the Designer mode password window opens. Enter the correct password
and press OK. 4. The title of the main program window changes according to the selected mode.
For better security, Monitor one returns to Operator mode after having been 10 minutes in Designer mode. To change this default behavior:
1. Switch to Designer mode. 2. Select Options|Global configuration from the menu on the main window 3. Select the Various tab. 4. Uncheck the Return to … control
Setting the Designer passwordThe Monitor one, "out of the box" password, is "CCS". To change this password:
1. Switch to Designer mode 2. Select Options|Global configuration from the menu on the main window 3. Select the Various tab. 4. Enter the new password into the New box 5. Re-enter the new password 6. Press the Save button
ProjectsAll files belonging to one project are saved in one directory. The Monitor one installer creates - besides the directories for the program files - also a directory "c:\Monitor one Maps\". This is the default directory for new projects. You can of course override this default directory and choose another one.
We strongly recommend creating new projects on the local hard disk of the workstation that runs Monitor one. If you create the project databases on a network-drive, Monitor one can loose connection to its database files in case a serious network problem occurs.
Page 22 of 180

All files of a project have a name starting with <Project name>. You can save more than one project in one directory however, for readability reasons it is better to have separate directories for different projects.
Creating a new ProjectIt takes five steps to start a new project
1. Select File|New map from the menu on the main window. 2. A message box pops up. Read the information carefully and press Ok. The "New project" window opens.
3. Click the browse control of the Project Path and Name. 4. The Specify a Folder and a Name for the new Project dialog opens. 5. Enter the requested information and click Save. 6. Use the browse control of the BIN directory box to select the location of the Firebird BIN directory on
your system (if not already filled in) 7. Enter the Firebird username and password into the appropriate boxes and click the Ok button. 8. Monitor one creates the initial database and opens the new project in Designer mode, showing a blank
root map.
Changing the default Firebird username and password / Securing your project
The default Firebird username/password is "sysdba/password". If you do not want to use the default password, you can change it with the Firebird gsec utility, which can be found in the Firebird BIN directory. An example of the command needed for changing the sysdba password is:
Page 23 of 180

"gsec -user SYSDBA -password masterkey -modify sysdba -pw MyKey37".
For more information on how to secure Firebird database access see: http://www.firebirdsql.org/manual/fbutils-gsec.html
For reasons of easier access to a project's database, the username and password are written to the project's .amd file (<Project directory>\<ProjectName>.amd). If you find this unacceptable for security reasons, you can remove the username and password strings (leave the 'DBUser=' and 'DBPassword=' keywords - only remove the username and password strings) from this file. After this, Monitor one will prompt you to enter the username and password each time you start the program.
Adding, Modifying, Removing or Moving a Device- or Virtual object.
Adding a new Device- or Virtual object to the map
1. Switch to Designer mode. 2. Browse to the map on which to add a device object. 3. Right-click anywhere on the map and choose Add object|Add a new device- or virtual object from the
popup menu. 4. The "Add/Modify a device- or virtual object window" opens. (See a snapshot of this window below).
Page 24 of 180

5. Fill out all fields of the window and click the Save button. 6. The cursor of the map to which you want to add a device, changes from a normal cursor to a drag
symbol. 7. Point to the right location on the map and click to add the device.
Name Enter the device name in the Name box. A name may consist of up to 100 characters and may contain any arbitrary character. When the Name box is exited, a DNS lookup is performed in order to find the IP address of the device. If the lookup succeeds, the IP address of the device is shown in the IP address box. The IP address box is left blank if the lookup fails.
Class Each device must be linked to a Class. Assign the Class for the device by selecting it from the Available Classes box and double-clicking its icon. The Class image appears in the Image box. Once assigned, an object’s Class cannot be modified!
Ser#/Reg#
Page 25 of 180

The Ser.# and the Reg.# fields can be used for administrative and support purposes. IP address
Enter a valid IP address of the form X.X.X.X in the IP address box. The current Monitor one release does not support IPv6. Leave the field blank if no polling should be performed.
R/W Communities Enter the Read- and Write communities for Health monitoring via SNMP into the appropriate boxes. By default, the read-community, defined at the Class level is provided. A community string may consist of up to 16 characters in length.
Maintenance window Use the Maintenance window box to define a maintenance plan for a device object. Within the maintenance period, all events are normally processed but Alerting for the device is suppressed. This option can be useful if - for instance - a server is scheduled to reboot nightly or weekly at a certain time in order to prevent the "Running low on virtual memory" message due to memory leaks etc.
Alert group The Alert-group selection box can be used to assign an Alert-group to the device. By default, the "Default" group is assigned. If Alerting by email is enabled and you have set up an Alerting scheme (groups and recipients), the Alert-group specifies which people get an email alert message in case a major event occurs for the device. An alert-group can contain multiple recipients and one recipient can belong to multiple alert-groups.
If the IPaddress box is double-clicked, Monitor one automatically assigns the local-host address: "127.0.0.1". This option makes it easy to make use of Monitor one as a drawing tool for presentation purposes.
Modifying a Device- or Virtual object
1. Switch to Designer mode. 2. Right-click the device object to modify and select Modify this object from the popup menu. 3. The "Add/Modify a device- or virtual object window" opens. 4. Make the desired modifications and click the Save button. 5. The modified settings are immediately in effect.
Removing a Device- or Virtual object
1. Switch to Designer mode. 2. Right-click the object to remove. 3. Select Remove this object from the menu.
It is not necessary to remove all links of an object before removing the object itself. All links to other objects are removed automatically.
When an object is removed, all object-related data (logging, history) is also removed from the database.
Moving a Device- or Virtual object
1. Switch to Designer mode. 2. Press and hold-down the [Alt] button and drag the object to its new position. 3. Release all buttons.
Building network maps using IP-nodes found by Discovery.You can use the Discovery utility to scan a subnet or IP range to find out which IP nodes exists. The list of found nodes can be used to easily add devices to the network map. For more information, see the chapter: Discovery
Page 26 of 180

and Extensive Monitoring further in this manual.
Adding, Resizing, Removing or Moving a Shared Medium object
Adding a shared medium object to a network map
1. Switch to Designer mode. 2. Move to the map to add a shared medium to. 3. Right-click anywhere on the map and select Add object|Add a shared medium from the popup menu. 4. Select a shared medium type. 5. The cursor of the map to add a shared medium to, changes from a normal- to a drag symbol. 6. Click on the map to add the shared medium.
Resizing a shared medium object
1. Switch to Designer mode. 2. Press and hold down the [Alt] key. 3. Click the shared medium at its right side. 4. Stretch the shared medium to the desired size by dragging. 5. Release all keys.
There is a minimum size defined for a shared medium. The maximum length is undefined!
You can resize a shared medium by clicking it at the right.
Removing a shared medium object
1. Switch to Designer mode. 2. Right-click the shared medium and select Remove this object from the menu.
Moving a shared medium object
1. Switch to Designer mode. 2. Press and hold-down the [Alt] button and drag the shared medium (somewhere in the middle) to its
new position. 3. Release all buttons.
Adding, Modifying, Removing or Moving a Free-Text object
Adding a Free-Text object
1. Switch to Designer mode. 2. Move to the map to add a Free text object to.
Page 27 of 180

3. Right-click anywhere on the submap and select Add object|Add Free text. 4. The "Add Free text" window opens.
5. Enter text in the Text box (Max 50 characters). This is the text that will be displayed on screen. 6. If you want the FreeText object to behave as a hyperlink, you need to enter the hyperlink information
into the hyperlink box. The hyperlink box accepts various formats:• http://www.netshieldsa.com --> For accessing a host on the internet.• mailto:[email protected] --> Opens the default mail client on the system.• C:\images\Web\example1.jpg --> Shows a picture in a directory on your system in the system's
default image viewer.7. Press Ok to save. 8. The cursor of the map to add an object to, changes from a normal to a drag symbol. 9. Click on the map to add the object.
If no specific font is specified, the default font is used. You can set the default font by selecting Options|Global configuration from the menu on the main window and than the Various tab.
Modifying a Free-Text object
1. Switch to Designer mode. 2. Right-click the Free-Text object to modify. 3. Select Modify this object. 4. The "Add Free text" window opens. 5. Modify the text in the Text box. (Max 50 characters) 6. Press Ok to save.
Removing a Free-Text object
1. Switch to Designer mode. 2. Right-click the Free-Text object and select Remove this object from the popupmenu.
Page 28 of 180

Moving a Free-Text object
1. Switch to Designer mode. 2. Press and hold-down the [Alt] button and drag the Free-text object to its new position. 3. Release all buttons.
Adding or Removing links between objectsFor better readability Monitor one uses different line styles and colors for different link types. You can set the default link type for each individual map. The selected link type for a map is shown at the bottom of the map window. The default link type setting for a map is NOT saved to the database and defaults to "UTP/STP" each time Monitor one is restarted!
The current Monitor one version supports four different link types.
• UTP/STP, blue line • Fiber, green line • Serial, thin gray line • "Point to point or Shared coax", thick gray line
Selecting a link type
1. Switch to Designer mode. 2. Move to the map from which to set the default link type. 3. Right-click anywhere on the map and select Set link type from the popup menu. 4. Select one of the available link types. 5. The status bar changes according to your selection.
Adding a link between objects
1. Switch to Designer mode. 2. Press and hold-down the [Ctrl] key. 3. Click the first object that will participate in the link. The cursor changes to a cross-symbol. 4. Click the other participant (object at the other side) of the link. 5. The link is drawn, the default cursor is restored and the database is updated. 6. Release all keys.
Clicking the same object twice cancels the operation.
Removing a link between objects
1. Switch to Designer mode. 2. Press and hold-down the [Ctrl] key. 3. Click the first object participating in the link to remove. The cursor changes to a cross-symbol. 4. Click the second object at the other side of the link. 5. A confirmation window pops up. 6. Confirm the removal of the link. 7. The link is removed from the map, the default cursor is restored and the database is updated.
Clicking the same object twice cancels the operation.
Page 29 of 180

Background imagesMonitor one allows you to add background images to your network maps. Background images help you identify the location of malfunctioning equipment and the consequences of a failure more quickly.
If you are the network manager of a WAN you could add a country-map to your network map, if you are managing a LAN you could add the floor plan or a campus plan.
Building network maps as factually as possible, will positively affect the error tracking process and the speed of solving network problems.
Adding a background image to a network map
1. Switch to Designer mode. 2. Move to the map to add a background image to. 3. Right-click anywhere on the map and select Add background image from the popup menu. 4. A "Browse for bitmap" dialog window opens 5. Select the bitmap file to add as a background and click Open. 6. If the selected bitmap meets with some requirements the bitmap will appear as background image,
otherwise an Informational or an Error message will popup.
Background image requirements:
1. It must be a *.bmp file. 2. The size of the bitmap must be equal to (or greater than) the size of the network map to cover.
Removing a background image from a network map
1. Switch to Designer mode. 2. Move to the map with the background image to remove. 3. Right-click on a blank portion of the map and select Remove background image.
Assigned background images are saved (as bitmap files) with random names in the project directory.
Building a hierarchical multi-level map structureMonitor one allows you to create a hierarchical multi-level map structure that lets you move easily between the individual maps by using the virtual "Network" object. You can build maps that represent IP subnets, buildings, floors, wiring closets etc.
There is no limit to the depth of a hierarchical structure.
Creating a child map (sub-map)
1. Switch to Designer mode. 2. Add a "Network object" icon (see the image below) on the same way as you add a device icon. 3. Double-click the icon of the new Network object. 4. The child map opens
Page 30 of 180

5. Monitor one automatically adds a network object at the upper left corner of the new (child) map. Double-clicking this icon lets you return to the parent map!
The icon of a "Network object"
Moving between maps
You can move between maps by double-clicking "Network objects". Each child map has a Network object pointing to its parent in the upper left corner. By double-clicking this object, you can return to the parent map.
The name of the icon on the parent map representing the child map has the name of the child map and vise versa. The icon on the child map representing the parent map has the name of the parent map!
The naming convention of a Network object differs from the naming convention of a device object. The name of a network is limited to 16 characters in length and may not contain spaces.
Error control
About error control
Error control (EC) is a very powerful feature that helps you quickly locate a problem, prevents superfluous Alerting and incorrect interpretation of a problem. EC tries to find the root-cause of a device that doesn’t respond to status requests anymore.
To be more precise, the above means that if a "No response" event occurs for a device, EC tries to find out whether the event is caused by a definite failure of the device itself OR by another device experiencing problems in the chain of devices (network paths) between the station running Monitor one (the "ThisStation" object on the map) and the device!
EC uses the information provided by the network map (connections and device types) to find out which device causes a "No response" event. It is therefore extremely important to set up your network maps as accurately/factually as possible. If a device "A" is physically connected to device "B", draw a link between them on your network map accordingly!
Page 31 of 180

Without EC
By a failure of "Switch 10", four servers get the "No response" status. If Alerting by email is enabled, the network manager receives 5 email alerts (from which 4 are superfluous and incorrect!).
With Error control
Page 32 of 180

Only "Switch 10" gets the "No response" status. The servers all get the "Unknown" status (blue tick). The network manager only receives one alert email.
How Error Control determines the root-cause of a "No response from device" event
Every time a device stops responding to status requests, EC verifies the status of all devices in the chain (network path) of devices from the ThisStation object to the device that stops responding. If one of the devices in the chain already has the "No response" status, Monitor one assumes this the root-cause of the event. In this case, the device that stops responding gets the blue tick.
If more than just one chain exists (because of network redundancy), Monitor one verifies all possible network paths!
In order to determine all possible network path(s) from the "ThisStation object" to a device, Monitor one needs two pieces of information:
1. Link or connection information (which device is connected to which other device) 2. If a device has more than one connected interface, does this device forward traffic? Does it route or
switch packets or is the second interface just used for redundancy reasons and is it "hot-standby"?
Monitor one extracts link or connection information from the network map. It is therefore extremely important to draw network maps as factually as possible. The information whether or not a device forwards traffic comes from the definition of the Class each device belongs to (The checkbox This device forwards traffic via routing, switching, bridging or repeating on the Add/Modify a Class window). It is obvious that if you fail to set this option correctly, EC will not work as expected!
The list below shows some examples of device Classes that forward traffic.
• Routers, switches, hubs and/or repeaters. • Firewalls. • Modems. • Wireless Access-points. • Multi-homed Windows servers with running RRAS services (routing enabled)
The list below shows examples of devices with more than one connected interface that do not forward traffic
• Windows servers with more than one interface connected to one ore more switches, from which only one interface is active and the others "hot-standby".
• Servers in a SAN cluster that have an interface connected to the network and another interface connected to a fiber switch in order to access data on a central storage. The latter interface is not used for forwarding traffic but only for accessing the data on the central storage.
Enabling Error control
Enabling Error Control is simple; just add the ThisStation object to the network map and add a link object between the object and the switch or hub to which it is actually connected. The ThisStation object is a special purpose object representing the physical workstation (or server) that runs the Monitor one software. The ThisStation object is the key object for the "Error control" feature.
After adding the "ThisStation" object (and also after each time you add or remove links between device objects)
Page 33 of 180

the EC information database needs to synchronize. The EC icon on the Monitor one control panel has changed to the Sync icon: . In order to start synchronizing, just click this icon. After seconds the Icon will change back to the normal EC Icon.
During synchronizing, Monitor one automatically switches to Designer mode and will prevent you from entering Designer mode while processing!
The time it takes to synchronize the EC information database heavily depends on the amount of redundancy (the number of redundant paths) in your network and can take from less than a second to a couple of minutes!
Verifying Error Control activity
If Error Control is enabled, it takes more time before a "No response" status is propagated to the multilevel network map structure and the control panel. The color of the "EC panel" on the Monitor one main window shows Error Control activity.
• A white EC panel indicates: Error Control disabled (The "ThisStation" object has not been added to the map).
• A Green EC panel indicates: Error Control is enabled and Idle • A yellow EC panel indicates: Error Control is enabled and currently busy trying to determine the root-
cause of a "No response" event!
The "ThisStation" object can only be added once (of course!)
Verifying network paths used by Error control
You can verify whether your map is "EC proof" by enabling EC and after that clicking the speedbutton on the Monitor one control panel.
Example 1.
A small company has two offices in different cities connected by internet via ADSL. The Firewall in the main
Page 34 of 180

office has a problem and is down. As you can see from the screenshot, EC is enabled (the "ThisStation" object is present on the map) but nevertheless all devices in the remote office have been marked "down" (erroneously)!
In the above case, the problem is caused by not checking the "This device forwards traffic…." checkbox for the Class the device "InternetCloud" belongs to. As a result, Monitor one "thinks" that it cannot reach the remote office devices at the other end of the WAN link. Monitor one "thinks" that there are no network paths available from the "ThisStation" object to the devices in the remote offices and displays the little "network disconnected" symbols at the bottom left of each device in the remote office. The "InternetCloud" device represents the huge internet routing network in one device.
After checking the "This device forwards traffic……" checkbox for the Class the "InternetCloud" device belongs to, the network map shows:
Example 2.
Page 35 of 180

The screenshot above shows another interesting example. For reasons of redundancy, a cluster system has two connections to two different switches. Only the first NIC is active, the second one is "Hot-standby". By mistake, the "Forward" setting of the Class the device "Cluster1" belongs to is checked. Switch4 is actually down! Because of the "forward" setting of Cluster1, Monitor one "thinks" that there is an alternate network path to device Switch3, gets no reply from device Switch3 and marks it accordingly.
After clicking the EC verifier speedbutton on the Monitor one control panel, the map shows:
Page 36 of 180

Only TestServer1 has the "No Error Control information available" indicator (it is not connected).
After resetting the "Forward" control (unchecking the checkbox) of the Class the device Cluster1 belongs to, the map shows:
Page 37 of 180

The Desktop featureThe Desktop feature allows you to save frequently used desktop setups to the database for easy restoring later. A desktop setup contains the size and position of opened map- and Shooter-windows. The Desktop feature is especially useful in large networks with many "areas of interest" or trouble spots.
Saving a Desktop setup
To save the current desktop settings, click the Desktop tab on the Monitor one main window and after that click the speedbutton. Enter a descriptive name into the Desktop name popup window and click the Save button. The new Desktop in immediately in effect and appears in the combobox.
Page 38 of 180

Updating a Desktop setup
If you change the desktop (if you close maps or if you start new real-time Shooters) you can save these modifications to the currently selected Desktop by clicking the speedbutton.
Removing a Desktop setup
A Desktop setup can be removed from the database by selecting it from the combobox and clicking the speedbutton.
Opening an existing project
Opening a project via the GUI1. Start Monitor one 2. Select File|Open project from the menu on the main window 3. Browse to the <project name>.amd file 4. Select and open the project file
Monitor one commandline switchesMonitor one can be started with various commandline switches. The commandline switches can be entered by right-clicking the Monitor one icon on the desktop and choosing Properties. You can append your commandline switches at the end of the string in the Target box ("C:\Program Files\FineConnection\Monitor one\Monitor1.exe"). Do not forget to use double quotes for parameters that contain spaces! See the example below:
"C:\Program Files\FineConnection\Monitor one\Monitor1.exe" /MAP=MyProject.amd /DESKTOP=SalesDepartment /DEFAULTSRCUDPPORT=2000
Monitor one supports the following commandline switches:
/MAP=<Projectname.amd> Automatically opens the specifile project.
/DESKTOP=<Desktop name> Automatically opens the specified desktop after the project has been loaded.
/SNMPDELAY This switch introduces a delay in consecutive GET-NEXT SNMP requests. It can be useful in order to reduce bandwidth usage when monitoring devices over slow lines. Be aware that this switch slightly affects the performance of your Monitor one system!
/USESHORTREQUESTS Limits the maximum number of requested OID fields in one SNMP request PDU to 10. The default maximum is 18. This switch can be useful if you cannot retrieve SNMP data from devices because of SNMP "too big" errors.
/NOAUTODETERMINESNMPVERSION By default, Monitor one automatically tries to determine the supported SNMP version for a Class of devices. If a mismatch is found (the version specified at the Class level differs from the actual supported version), the Class level version is updated in the database and a message is shown on screen. Devices that support both SNMP version (SNMPv1 & SNMPv2) can cause unwanted toggling. The /NOAUTODETERMINESNMPVERSION switch can be used to switch off this Monitor one option.
/DEFAULTSRCUDPPORT=<1..65535 | none> By default, Monitor one uses UDP port 6115 as the source port in SNMP requests. The default port can be
Page 39 of 180

specified on the commandline. • Monitor one will use the port specified after the "=" symbol. • When "none" is specified, Monitor one will choose an arbitrary port (>1024). • If the commandline switch is omitted, Monitor one will use the default port 6115!
Database maintenance
Making a backupIn order to project your project data, it is recommended to make a backup of your project database regularly.
There are two options:
1. "Midnight backups" - Monitor one can make an online, unattended backup of the running project every Midnight (at 0:00).
2. Instant backups - An online backup (snapshot) of the project database can be made instantly.
Midnight backups
To enable online Midnight backups:
1. Switch to Designer mode. 2. Select Options|Global configuration from the menu on the main window. 3. Select the Database maintenance tab 4. Check the "Midnight backups.." checkbox.
It is recommended to leave the "Midnight" option checked!
All Midnight backups are made to separate directories.
• Every day Monitor one makes a (database only – Projectname.fdb) backup to a directory of the form: <ProjectDirectory>\<ProjectName>_Midnight_Day_Day#
• At a week boundary (Sunday to Monday night) a full backup to a directory of the form: <ProjectDirectory>\<ProjectName>_Midnight_Week_Week#
• At a month boundary a full backup to a directory of the form: <ProjectDirectory>\<ProjectName>_Midnight_Month_Month#
Instant backups
To make an instant backup:
1. Switch to Designer mode. 2. Select Options|Global configuration from the menu on the main window. 3. Select the Database maintenance tab 4. Select one of the two backup options and click the <Start> buttons to make an instant full backup.
Page 40 of 180

Restoring a backupEach time Monitor one performs a backup, it also creates a command file that can be used to restore the backup. This command file is saved in the same backup directory and has the name: <Project name>_Restore.cmd.
The restore operation can be started by typing <Project name>_Restore.cmd in a command box and providing the Database Username and Password as command-line parameters. The Username/Password must have CREATE DATABASE rights!
All backups types are made online however; DO NOT RESTORE A BACKUP ON A RUNNING PROJECT. It will definitely corrupt your project’s database! Before you perform a restore, shutdown Monitor one first!
Database reorganizationMonitor one uses the services of the Firebird database engine for storing and maintaining project data. Every DBA has experienced a situation in which an application slows down after it has been in production for a while. However, why this happens is not always evident. Perhaps the number of transactions issued has increased or maybe the volume of data has increased. However, for some problem, these factors alone will not cause large performance degradation. In fact, the problem might be with disorganized data in the database.
Database disorganization occurs when a database's logical and physical storage allocations contain many scattered areas of storage that are too small, not physically contiguous, or too disorganized to be used productively.
To minimize fragmentation and row chaining, as well as to re-establish clustering, database objects need to be restructured on a regular basis. This process is known as database reorganization. The primary benefit is the resulting speed and efficiency of database functions because the data is organized in a more optimal fashion on disk.
The Monitor one backup/restore options mentioned above can be used for database reorganization.
Follow the steps described below:
1. Switch to Designer mode. 2. Select Options|Global configuration from the menu on the main window. 3. Select the Database maintenance tab. 4. Press the Start button of the second Instant backup option. 5. Wait for the backup to finish. 6. Shutdown Monitor one 7. Copy the <Projectname>.fdb file in the project directory to another directory on disk (or rename the
file) 8. Run the <ProjectName>_Restore.cmd file that can be found in the backup directory that was created by
the Instant backup. 9. Your project’s database is now in well organized condition again.
The Event control windowThe Event control window is the central point for viewing and acknowledging events and alerts that occur in the network. To open the Event control window, Select Options|Event control from the menu on the Monitor one control panel. See the screenshot below:
Page 41 of 180

The eventcontrol window has an upper and a lower pane. The upper pane contains two tabs.
Pending events list The "Pending events" list shows all currently pending events ("No response", "Threshold exceeded"). Trap, Syslog and Sensitivity events (TSS) are also show in the list but are treated differently. "No response" and "Threshold exceeded" event stays in the list as long as they stay pending. If a device is responding again or if a threshold is no longer exceeded, the event is automatically removed from the list. TSS events are so called "one-shot events". They can not have the pending status. However they are displayed in the list in order to prevent you from missing important messages. TSS events stay in the list until acknowledged or removed OR for a customizable short period. You can set the desired behavior by selecting Options|Global configuration from the menu on the main window and after that choosing the Alerting tab. If you double-click on Trap or Syslog events (or right-click an event and select Show details), the full content of the event frame is showed in a separate vierwer window. You can mute audible alerting by clicking the Audible alerting control (the little speaker) on the Monitor one control panel!
Extensive Monitoring events list The EM1 list shows Extensive Monitoring events. Each device on the map is automatically inspected for potential problems every four hours. An unhappy smiley at the beginning of row of the EM1 list indicates a pending EM1 event. A green checkmark indicates that the event has occurred but is no longer pending! You can adjust EM1 settings and fine-tune thresholds by selecting Options|Global configuration from the Monitor one control panel and than choosing the Discovery + EM1 tab. The way EM1 messages are displayed slightly differs from what you would expect! Not the last measured "EM1 threshold exceeded" event is kept in the list but the "EM1 threshold exceeded" event with the highest error percentage (most severe event) is kept in the list!
Today's logbook The lower pane lists all events that have taken place since midnight. It's for quick reference only. For filtering functionality, you should open the events log in the external MLogBook viewer!
Page 42 of 180

Chapter 4. Classes
Understanding ClassesNetworks are usually designed and build using hardware - routers, switches etc - of a certain type. For example in a company’s network all routers are of type Cisco 3600, the switches are Hewlett Packard 5300, the workstations are Windows XP etc.
Monitor one takes advantage of this fact by using the Class model to group objects that share certain characteristics and provides class-assigned functionality to the individual objects of the same Class. Each individual object is an instance of the Class it belongs to. It is recommended to create a Class for each different type of device.
The SNMP agent of Windows NT4 pretty much differs from the agent implemented in Windows 2000/2003/XP. Therefore, it is preferable to define separate Classes for each OS version.
Adding, Modifying or Removing a Class
Adding a new Class1. Switch to Designer mode. 2. Select Edit|Manage Classes to open the "Manage classes" window. 3. Right-click anywhere on this window and select Add a new Class. 4. The "Add/Modify a class" window opens. (See the snapshot below) 5. Fill out the form. 6. Press Save. 7. The new Class appears in the "Manage classes" window.
Page 43 of 180

Class name A Class name can be up to 16 in length and may not contain spaces. Use descriptive names for better readability.
R/W Communities Use the Read- and Write Community boxes to assign default communities for devices of the Class. The community names entered here are automatically filled-in if a new device object is added to the map, but can be overridden at the device level. The default read/write community is "public".
SNMP Version Most equipment support SNMP version 1. You can use the SNMP Version control to modify the supported SNMP version to v2 for a Class of devices that don not support v1.
SNMP Port The SNMP Port control lets you specify the default port to use for SNMP querying at the Class level. The SNMP port setting at the Shooters level overrules this "Class level" setting!
Page 44 of 180
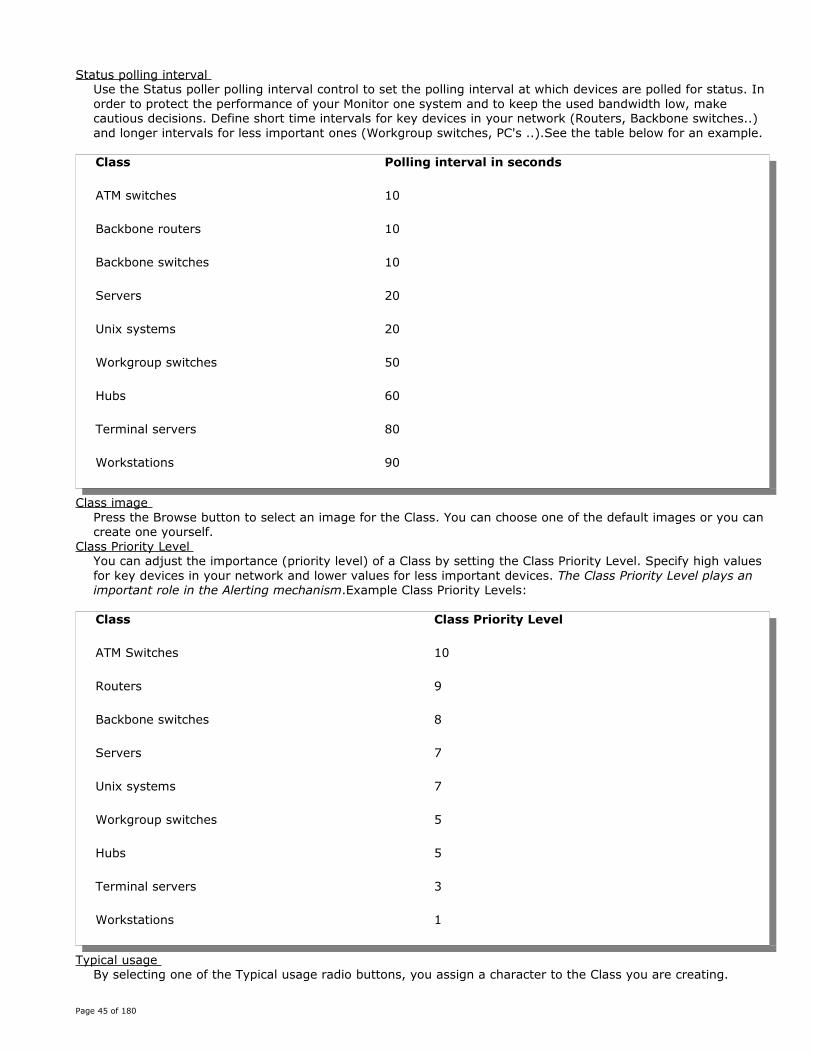
Status polling interval Use the Status poller polling interval control to set the polling interval at which devices are polled for status. In order to protect the performance of your Monitor one system and to keep the used bandwidth low, make cautious decisions. Define short time intervals for key devices in your network (Routers, Backbone switches..) and longer intervals for less important ones (Workgroup switches, PC's ..).See the table below for an example.
Class Polling interval in seconds
ATM switches 10
Backbone routers 10
Backbone switches 10
Servers 20
Unix systems 20
Workgroup switches 50
Hubs 60
Terminal servers 80
Workstations 90
Class image Press the Browse button to select an image for the Class. You can choose one of the default images or you can create one yourself.
Class Priority Level You can adjust the importance (priority level) of a Class by setting the Class Priority Level. Specify high values for key devices in your network and lower values for less important devices. The Class Priority Level plays an important role in the Alerting mechanism.Example Class Priority Levels:
Class Class Priority Level
ATM Switches 10
Routers 9
Backbone switches 8
Servers 7
Unix systems 7
Workgroup switches 5
Hubs 5
Terminal servers 3
Workstations 1
Typical usage By selecting one of the Typical usage radio buttons, you assign a character to the Class you are creating.
Page 45 of 180

Monitor one uses this setting to automatically create a number of Class specific default Shooters (i.e. if you select "Router", a Shooter that retrieves the routing table is created, if you select "Host/Server with TCP", a Shooter that retrieves the IP sessions table is created..)
This device forwards traffic This setting is extremely important for Error control. Error Control does not work correctly if you do not set this option correctly. Checking this checkbox means that this device routes data between one or more network interfaces. Leaving this option unchecked indicates that this device is an end-node and does not route data. Examples:
• For routers, switches and hubs (or repeaters) check this checkbox. • Firewalls, check the checkbox. • Modems used in a WAN link, check the checkbox. • Multi-homed Windows servers with routing disabled, uncheck the box • Multi-homed Windows servers with routing enabled, check the box • Windows servers with more than one interface connected to one ore more switches, from which only one
interface is active and the others "hot-standby", uncheck the box. Description
The Description box is for informational use only. Alarm parameters
Use the Alarm parameters portion of the window to specify how to react on different type of events. You can specify which script or executable to execute and which arguments to provide to the executed program or script regarding the event type. Note that what you specify here has nothing to do with the Monitor one Alerter! The Monitor one Alerter computes the severity of an event by multiplying the Class Priority Level and the Event Weight and compares it against a threshold! If the result exceeds the threshold value, an alert is generated (A signal is sent to a message-gateway or a program or script is start etc…). The programs you specify here are executed regardless of whatever level or weight and are not controlled by the Alerter! See the chapter that discusses Alerting for more information about executing programs or scripts triggered by events!
Custom Menu Items The Custom menu-items box allows you to define customized menu-items for a device's right-click menu. This can be very useful when you - for example - regularly connect to a host using SSH instead of telnet (SSH is not a default right-click menu option for a device). The Custom menu-item box allows you to specify which external program to execute and which parameters to provide to the executed program.
Page 46 of 180

The image above shows an example of how SSH (we used putty as the SSH terminal program in the example) can be added to a device's right-click menu. The -ssh parameter in the command line is used to tell putty.exe to use it's SSH mode, the <IPaddress> parameter is replaced at runtime by the actual IP address of the device that is being right-clicked. Another example of a frequently used program for server management is Microsoft Terminal-server Client --> MSTSC /v: <IPaddress>
Adding, Modifying or Removing a custom menu-item
• To add a new right-click menu item, right-click anywhere in the Custom menu-items box and choose Add a custom menu-item. The "Add a custom menu-item" window opens (see the snapshot below)
Page 47 of 180

• To modify an existing item, right-click the item and choose: Modify this custom menu-item. • Finally, an existing menu-item can be removed by right-clicking the item and choosing Remove this
custom menu-item.
Custom Menu Items are also available in the web interface via java scripting, provided that your browser's security policy supports this and that the directory where the external program resides is accessible via the system path!
In Microsoft Internet Explorer you can add the IP address of your Monitor one station as a trusted site (In IE select Tools|Internet options, Security tab, click Trusted sites and click the Sites button, uncheck the Require server verification checkbox and add the IP address)
Defining your own Class images
By default, a number of predefined Class images are available for creating new and/or modifying existing Classes. You can use these default images but you can also create your own images and make them available by adding them to the Monitor one "Images" folder.
An image must meet with the following requirements:
1. It must be a bitmap file (*.bmp) 2. Its size must be 32 x 32 pixels. 3. Use a background color that is not already used in the image itself. (Usually fuchsia is doing fine!) This
background color is treated as the transparent color for the image!
Make your images accessible for Monitor one by copying them to the Monitor one "Images" directory "c:\Program Files\FineConnection\Monitor one\Images\"
It is not important which program you use to create your images. Only the format (*.bmp) matters.
Page 48 of 180
Modifying a Class1. Switch to Designer mode. 2. Select Edit|Manage Classes to open the "Manage classes" window. 3. Right-click a Class icon and select Modify this Class. 4. The "Add/Modify a class" window opens. 5. Modify the Class properties of your choice 6. Press Save.
Removing a Class1. Switch to Designer mode. 2. Select Edit|Manage Classes to open the "Manage classes" window. 3. Right-click a Class icon and select Remove this Class.
A Class can only be removed if all instances of the Class have been removed from the map first!
Class files / Class Packages
About Class packagesAll Class related data can be saved to a so called Class file or Class Package. Class packages let you transfer Classes from one Monitor one station to another or from a test project to an operational project.
A Class file contains:
• The Class definition. • The Class properties (Polling interval, Image ..) • Its Shooters and related MIB files • All related Trap definitions
Creating a Class file or Class package1. Switch over to Designer mode 2. Select Edit|Manage Classes to open the Manage Classes window. 3. Right-click a Class icon and select Create a Class Package (export a class). 4. The "Create a Class Package: Export Class <ClassName>" window opens. See the snapshot below.
Page 49 of 180

ClassName, Created with Monitor one version and CreationDate The boxes ClassName, Created with Monitor one version and CreationDate are automatically filled-in and cannot be updated.
Author and email The Author and email fields are optional and can be left blanc
Vendor Hard- and Software Enter the Vendor’s Name and the hardware or software that your Class file describes, into the appropriate fields.
Free text from author Use the Free text from the author box to enter some comments. Use this box to enter a few lines about the Shooters you added to the class, about exceptions, special instructions for use etc....
Export Press the Export button to create the Class Package. A Class file named <Class name>.pck is saved into the directory: "<Project directory>\ClassPackageFiles\". If this directory not already exists, it is created automatically.
Importing a Class package1. Switch over to Designer mode
Page 50 of 180

2. Select Edit|Manage Classes to open the "Manage classes" window. 3. Right-click anywhere in the Manage Classes window and select Import a Class Package (import a class). 4. The "Import a Class Package" window opens. 5. Use the Browse button at the right of the File to import box to select the Package file to import. 6. Click the Import button
If the Class package defines a Class that already exists in your project than a message box will pop up asking you to confirm updating the existing Class!
Not all Class parameters are updated. From existing Classes only Shooters and MIB related data is updated. Project specific Class settings as polling intervals, community names, severity levels etc is kept unchanged!
Page 51 of 180

Chapter 5. SNMP data retrieval with Shooters
About ShootersMonitor one distinguishes from other network monitoring software in its revolutionary and powerful approach of querying and processing SNMP information!
A Shooter is Monitor one terminology for what in other NMS products is called a "sensor" or a "monitor". A Shooter is in fact nothing more or nothing less than an SNMP request definition that can be saved to disk and can be read and executed whenever needed. A Shooter is defined at the Class level. Once created, you can use a Shooter to retrieve SNMP data for all devices of the same Class as the Shooter was defined for.
A Shooter defines which object values to retrieve from the SNMP agent of the device being monitored (OID + Instance), how to process these values (calculations) and how to display them (Table, Pie, Graph, Threshold etc…).
A Shooter is built of two parts; the Shooter-body (container) and targets (requests). The Shooter-body has a number of properties that control how the Shooter behaves and how the output is showed.
The most important Shooter properties are:
• Name • The Class (for which it is created) • The type (Table, Graph, Meter, Pie, Threshold, History…) • The polling interval (one shot or each 1, 10, 60, 100, 600 or 1000 seconds)
The most important Target properties:
• The Object Identifier (OID) of the SNMP field to retrieve. • The Instance (hard coded as in .1, .9 etc or one of the keywords At runtime, All instances)
You can build Shooters that:
• Read one or more SNMP MIB fields from a device and show them in a table. • Show SNMP counters in 3 dimensional graphs in real-time. • Monitor thresholds and trigger alarms • Allows you to SET or WRITE SNMP fields • Retrieve SNMP values and save them directly into the database as historic data for trending and long
term analysis
Detailed information about Shooters: how they work, what you can use them for, what they do, how you can use them and how they are build or configured can be find in Appendix A., at the end of this manual!
Shooter TypesCurrently Monitor one supports 9 different Shooter types, all developed for a specific task. The different types available are:
Page 52 of 180

Table shooter
A Table Shooter can be used to retrieve individual SNMP fields or complete SNMP tables with a Get or Get-Next SNMP command. All retrieved data is displayed in a two- or multicolumn table structure depending on whether a GET or a GET-Next (walk) request was used.
A simple two-column table.
A device’s Connections table displayed in a multi-column table as the result of a GET-Next (walk) request.
Page 53 of 180

Graph shooter
Graph Shooters can be used to retrieve and show numeric SNMP fields in real-time graphs. The number in the upper-left corner of the Shooter icon indicates the polling interval.
If the "At runtime" keyword is used (in the Shooter definition) as the Target instance, the Graph will prompt for selecting the desired instance at runtime. This option makes it easy to zoom-in on different ports of a multi-port switch when trying to find performance bottlenecks.
The Inst control lets you choose the instance at runtime!
If the "All Instances" keyword is used in the Shooter definition then the values of ALL instances of the OID specified as the Target are shown in one Graph! The All Instances option makes it easy to show - for example - the load of all ports of a switch in one Graph!
Page 54 of 180

The output of a Graph Shooter in which the All Instances keyword is used.
Graph types The current version of Monitor one supports 4 different graph-types: an 2 dimensional line-graph, the same line-graph but with a 3 dimensional look, a bar- and an area-graph. You can select the desired graph-type by clicking one of the Graph type speedbuttons
Raw/Delta Use the Raw and Delta speedbuttons to select how to display the retrieved SNMP values. Use Raw for displaying utilization or percentage statistics. Delta displays the difference between the last retrieved values and the previous ones. Delta is usually used for showing Bytes/sec, Frames/sec etc...
Lin/Log/Automatic UpDown scaling Use the Lin (Linear) or Log (Logarithmic) speedbuttons to set the desired y-axis scaling. If you select Options|Automatic UpDown scaling then Monitor one automatically scales the Y-axis up/down each time new data is added to the graph. In web mode Automatic UpDown scaling is always ON.
Top-20 series only If an "All Instances" graph is shown, it might happen that there are so many series to show that the size of the graph does not fit into the window/screen. This is where the Top-20 switch is meant for! Click the Show Top-20 series only speedbutton to limit the number of displayed series to the top-20 only.
Title and Axis/Background color Right-click somewhere on the graph and choose the desired menu-item in order to change the Title and Axis of a graph or change the background color.
Graph/Data tabs
The Graph and Data tabs speak for themselves. The Data tab lists besides the Min, Max and AVG of the retrieved values also the most recent 5 retrieved values. See the screenshot below
Page 55 of 180

The real-time Graph windows are available in native- as well as in web mode. In native mode, all graph settings as: graph type, colors, window size, Abs/Rel etc... are saved to the database and are restored again the next time you start the same Graph Shooter. You can also change the look and feel of the Graph window in web mode but these modifications are not saved to the database!
Threshold shooter
A Threshold Shooter can be used to monitor numeric values and compare them with a threshold value. An event is generated if the value of the value exceeds a defined threshold.
Page 56 of 180
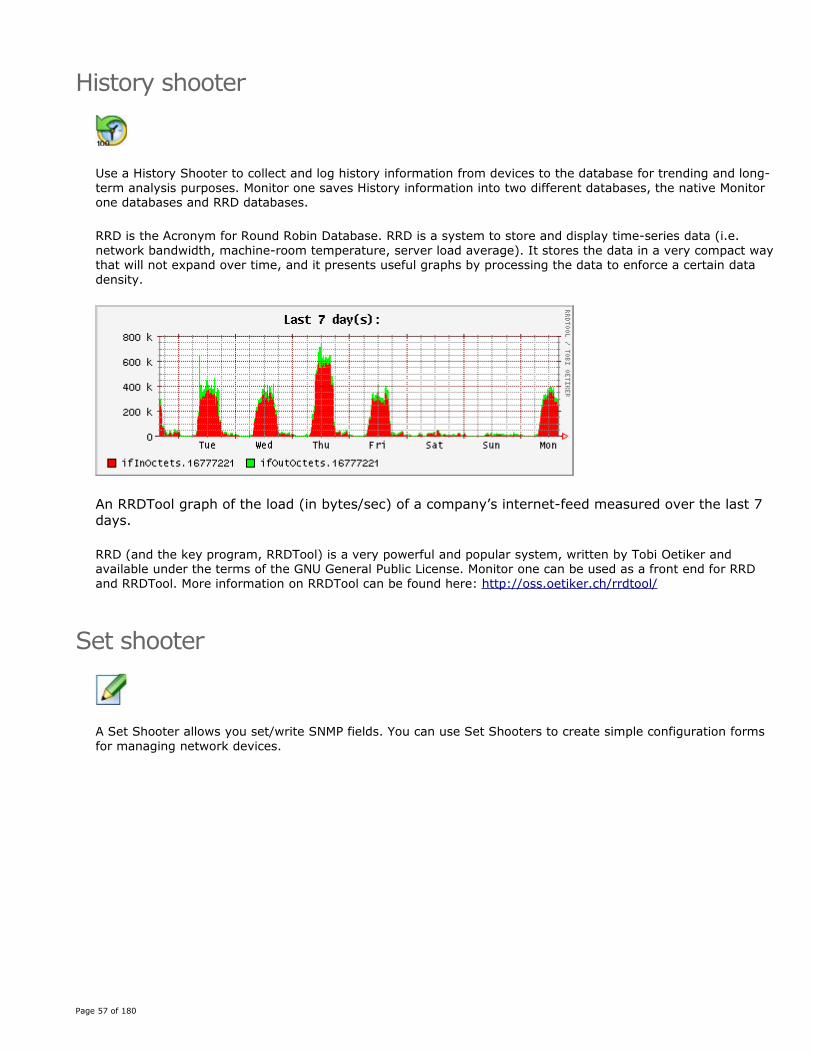
History shooter
Use a History Shooter to collect and log history information from devices to the database for trending and long-term analysis purposes. Monitor one saves History information into two different databases, the native Monitor one databases and RRD databases.
RRD is the Acronym for Round Robin Database. RRD is a system to store and display time-series data (i.e. network bandwidth, machine-room temperature, server load average). It stores the data in a very compact way that will not expand over time, and it presents useful graphs by processing the data to enforce a certain data density.
An RRDTool graph of the load (in bytes/sec) of a company’s internet-feed measured over the last 7 days.
RRD (and the key program, RRDTool) is a very powerful and popular system, written by Tobi Oetiker and available under the terms of the GNU General Public License. Monitor one can be used as a front end for RRD and RRDTool. More information on RRDTool can be found here: http://oss.oetiker.ch/rrdtool/
Set shooter
A Set Shooter allows you set/write SNMP fields. You can use Set Shooters to create simple configuration forms for managing network devices.
Page 57 of 180

Meter shooter
The AnalogMeter Shooter (also called just "Meter") can be used to show a value on an old-fashioned VDO-like meter. The Meter is especially useful to display Utilization and Usage etc. Be aware that a Meter Shooter is not able to show more than one value at a time because the Meter has only one needle!
Page 58 of 180

A Meter Shooter showing the CPU-Utilization.
The real-time Meter windows are available in native mode as well as in web mode. In native mode, all Meter settings as: Colors, window size, Abs/Rel etc… are saved to the database and are restored automatically the next time you use the same Meter again.
You can also change the look and feel of the Meter in web mode but these modifications are not saved to the database!
Raw/Delta Use the Raw and Delta speedbuttons to select how to display the retrieved SNMP values. Use Raw for displaying utilization or percentage statistics. Delta displays the difference between the last retrieved values and the previous ones. Delta is usually used for showing Bytes/sec, Frames/sec etc...
Title, Meter appearance and Needle colors Right-click somewhere on the Meter and choose Set Meter properties. This lets you customize the look of the Meter.
SnipMon Gauge and SnipMon Graph shooters
SnipMon Shooters appear as small images below a device icon on the network map. They are updated in real-time and are especially useful if you want to have important or critical device information always directly at hand.
A SnipMon Gauge (a small meter) can for instance be used to display CPU- or memory utilization, temperature or used disk space.
A SnipMon Graph is very useful for displaying interface utilization, number of running processes etc over a short period in a graph. If the mouse moves over a SnipMon, detailed information such as a description of the SnipMon and the last/most recent value is shown.
Page 59 of 180

The example SnipMons above (from left to right) show: CPU utilization, interface utilization and percentage used disk space of a certain drive.
Pie Shooter
A Pie Shooter is useful for displaying things like the Top-talkers or the Top-5 busiest ports etc. The Pie graph is available in native mode as well as in web mode. In native mode, all Pie settings as: Number of slices, colors, window size, Raw/Delta etc… are saved to the database and are restored automatically again the next time you use the same Pie Shooter.
You can also change the look and feel of the Pie window in web mode but these modifications are not saved to the database!
Raw/Delta Use the Raw and Delta speedbuttons to select how to display the retrieved SNMP values. Use Raw for displaying utilization or percentage statistics. Delta displays the difference between the last retrieved values and the previous ones. Delta is usually used for showing Bytes/sec, Frames/sec etc...
#Slices The #Slices control lets you adjust how many slices to show. For example: If you select 5 slices then the Top-4 is shown and slice #5 (labeled "Other") shows the summation of all other slices not in the top 4!
Title and Axis/Background color Right-click somewhere on the graph and choose the desired option to customize the Title and Axis of a graph or in order to change the background color.
Page 60 of 180

The top-8 most "talking" ports of a backbone switch
Shooters – Glossary and termsIn order to get full understanding about how Shooters work, how they are built and what properties they have, below a short explanation of the used terms.
Shooter Netshield terminology for "SNMP request definition" used for MIB querying. A Shooter defines which device SNMP MIB fields to query and how to process and display the results. Each Shooter contains one or more entries called "Targets" that describe the MIB fields to retrieve.
Foreground and Background Shooters Looking at the way they work, Shooters can be divided into Foreground and Background Shooters. Users can start foreground Shooters at any time when they need real-time information by double-clicking a Shooter’s icon. Table, Graph, Meter, Pie and Set Shooters are Foreground Shooters. Background Shooters do their job in background. They are used to periodically collect SNMP information for threshold monitoring or history logging. Background Shooters cannot be used interactively. The work like background jobs on mainframe computers. Threshold, History and SnipMon Shooters are Background Shooters.
Object identifier An Object Identifier is the identification value of an object that is defined in a MIB. Object identifiers are arranged in a hierarchical tree structure that is compliant with Internet standard and that consists of roots and branches. An object identifier is written as a sequence of sub-identifiers, starting with the tree root, in dotted decimal notation. For example, the Cisco branch of the MIB naming tree is expressed as 1.3.6.1.4.1.9.
Instance An instance specifies the row in which an object that is part of a table is located. The instance is appended to the object identifier and has a format that is similar to the latter. For objects that are not part of a table, the instance is zero. For more flexibility and enhanced features, Monitor one also allows you to replace an instance by one of the keywords: At runtime or All instances.
Page 61 of 180

Starting Shooters
Starting Foreground Shooters1. Right-click the device on the map from which you want to retrieve SNMP information, and choose
Shooters/Properties from the popup-menu. 2. The "<Devicename> a closer look" window opens.
3. Select the Foreground Shooters tab. 4. Double-click the icon of the Shooter to start.
Using SpeedShooters
A SpeedShooter is a Foreground Shooter from which the "SpeedShooter" property is set to "True". SpeedShooters appear as menu-items in a device’s right-click menu. The SpeedShooter option provides easier access to the most frequently used Shooters. Foreground Shooters can be started by right-clicking the device from which to retrieve SNMP information and selecting the desired SpeedShooter.
Page 62 of 180
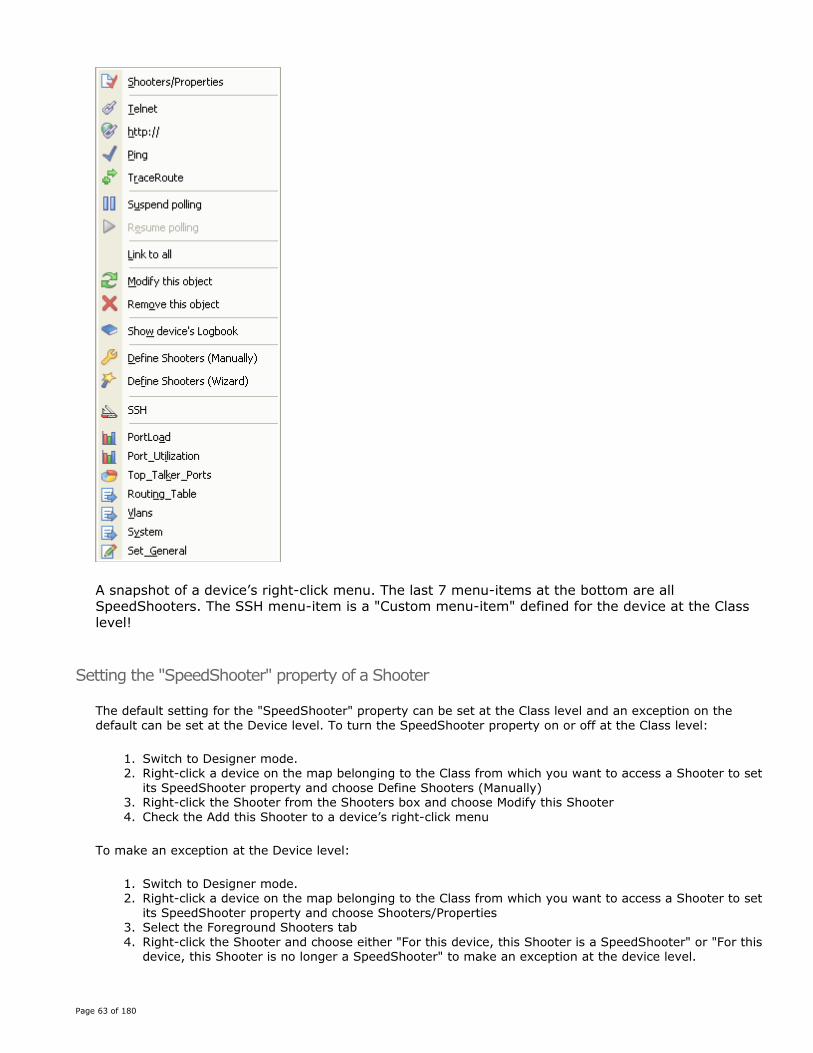
A snapshot of a device’s right-click menu. The last 7 menu-items at the bottom are all SpeedShooters. The SSH menu-item is a "Custom menu-item" defined for the device at the Class level!
Setting the "SpeedShooter" property of a Shooter
The default setting for the "SpeedShooter" property can be set at the Class level and an exception on the default can be set at the Device level. To turn the SpeedShooter property on or off at the Class level:
1. Switch to Designer mode. 2. Right-click a device on the map belonging to the Class from which you want to access a Shooter to set
its SpeedShooter property and choose Define Shooters (Manually) 3. Right-click the Shooter from the Shooters box and choose Modify this Shooter 4. Check the Add this Shooter to a device’s right-click menu
To make an exception at the Device level:
1. Switch to Designer mode. 2. Right-click a device on the map belonging to the Class from which you want to access a Shooter to set
its SpeedShooter property and choose Shooters/Properties 3. Select the Foreground Shooters tab 4. Right-click the Shooter and choose either "For this device, this Shooter is a SpeedShooter" or "For this
device, this Shooter is no longer a SpeedShooter" to make an exception at the device level.
Page 63 of 180

Starting Background ShootersBackground Shooters can be started at two different levels. If you start a Background Shooter at the device level, the Shooter only runs for that specific device. If a Background Shooter is started at the Class level, the Shooter runs for all devices (on the map) of that Class!
Each time Monitor one is restarted, all Background Shooters that were running the moment Monitor one was shut, are restarted automatically!
Starting a Background Shooter at the device level
1. Right-click the device on the map for which to start a Background Shooter and select Shooters/Properties.
2. The "<Devicename> a closer look" window opens. 3. Select the Background Shooters tab. 4. Select the Shooter to start from the Available box. 5. Right-click the Shooter and choose Start this Shooter... 6. The shooter-icon moves from the Available to the Launched box.
Starting a Background Shooter at the Class level
1. Switch to Designer mode. 2. Select Edit|Manage Classes from the menu on the main window 3. Select and right-click the Class for which to start the Shooter and choose Start/Stop Shooters at the
Class level 4. The "Start/Stop Shooters for Class: <ClassName>" window opens. 5. Select the Shooter to start from the Available box. 6. Right-click the Shooter and choose Start this Shooter for all ... 7. The Shooter-icon moves from the Available to the Launched box.
Every time a new device is added to a map, all Background Shooters defined to run at the Class level, are also started automatically for the new device!
Creating ShootersAs said before, SNMP data retrieval is based on the Shooter concept - a powerful SNMP MIB query manager. You are not only limited to using the standard, predefined Shooters to retrieve SNMP information but you can also create them yourself with just a few mouse-clicks.
The reader is expected to have good knowledge of the SNMP protocol to get all out of it. Because it is unrealistic to believe that this is always the case, Monitor one provides 3 ways to build new Shooters, varying in level of complexity and flexibility.
Generally spoken, building a new Shooter takes three steps:
1. Create the Shooter body. Define the name, type and the polling interval and define whether you want to work with the RAW counter values or that you are interested in the DELTA of the counter values.
2. Choose the Shooter targets (OID & Instance) and add them to the Shooter. 3. Fine-tune the Shooter by defining how to process the SNMP data. Add one or more Formulas, define and
set Threshold values or set a Graph’s Title, X- and Y-axes.
Page 64 of 180

Creating a Shooter with the wizardThe Shooter wizard guides you step-by-step through the process of creating some basic Shooters. The number of Shooters built with the wizard is of course limited but in case the wizard is not able to help you building the precise Shooter of your choice, then you could possibly build one that comes close and modify it afterwards until it meets your needs.
1. Switch to Designer mode. 2. Right-click the device for which you want to build a new Shooter and choose Define Shooters (Wizard)
As you’ll understand, the Shooter is not built for the right-clicked device but of course for the Class the device belongs to.
3. Follow the instructions on the screens that follow.
Note that:
• The wizard sends SNMP requests to the device in order to find out which MIB nodes the device supports! Which Shooters can be build depend on which MIB fields are supported by the device!
• The wizard uses the Community and IPaddress of the right-clicked device. It is obvious that devices that do not support SNMP cannot be used!
• Shooters are always defined at the Class level. The Class of the right-clicked device determines the Class type the Shooter is build for.
• Some Shooter types (i.e. SnipMons and Meters) only support "hard-coded" instances, others also support At Runtime and All instances.
Creating a new Shooter directly from the MIB treeFirst, open the Define <ClassName> Shooters window…
1. Switch to Designer mode. 2. Select Edit|Manage Classes from the menu on the main window. 3. The "Manage classes" window opens 4. Right-click a Class icon and select Define Shooters from the menu. 5. The Shooter configuration window opens.
Page 65 of 180

OR
1. Switch to Designer mode. 2. Right-click a device on the map and select Define Shooters from the right-click menu. 3. The Shooter configuration window opens.
…then, start building the Shooter container…
1. Enter the IP address and Community name of a test-device into the appropriate fields of the Test and Inspect box (if not already automatically provided by Monitor one)
2. Browse through the MIB tree and select the MIB node from which to create a Shooter. 3. Right-click the node and choose Inspect from the popup menu in order to verify whether the test device
supports the selected MIB node. 4. The MIB node turns green if the test device supports the MIB node. Only green nodes can be used in
Shooters! 5. Right-click the node again and use the menu items to select the desired Shooter-type and the Polling
interval. See the snapshot below.
6. The "New Shooter properties" window opens.
Page 66 of 180

7. Use this window to assign a Shooter name, to select the desired table type or to select how integer and
counter values are to be processed. If you select RAW, Monitor one leaves all numeric values as they are. If you select DELTA, Monitor one computes and uses the difference between the last and the previous sample for further processing! You usually use RAW for things like CPU utilization, Temperature or power-provisioning etc. DELTA is used for things like transmitted/received bytes/sec, errors/100 sec etc.
8. Click the Ok button. The "Add/Modify a <Shooter name> Shooter-target" window opens.
9. Use this window to set the Shooter-target properties. Select the instance to use from the OID/Instance
box. In the example above, we selected the All instances keyword. This means that the Graph will show the number of etherStatOctets of all instances (ports) of the device in one graph! If you select the Provide at Runtime radio-button, the Graph window will prompt you for an instance when it opens. You can also check the Append radio-button and enter a "hard-coded" instance directly into the edit box. The Show this field on screen checkbox allows you to show or to hide series in the Shooter. If you choose to hide the series, then you can still use the retrieved values in a formula. If you are building a new Threshold Shooter, you can use the controls in the Threshold settings box to define additional threshold parameters.
10.Click the Add/Modify button to save the new Shooter into the database. The icon of the new Shooter appears in the Shooters box and its targets in the box under it.
Page 67 of 180
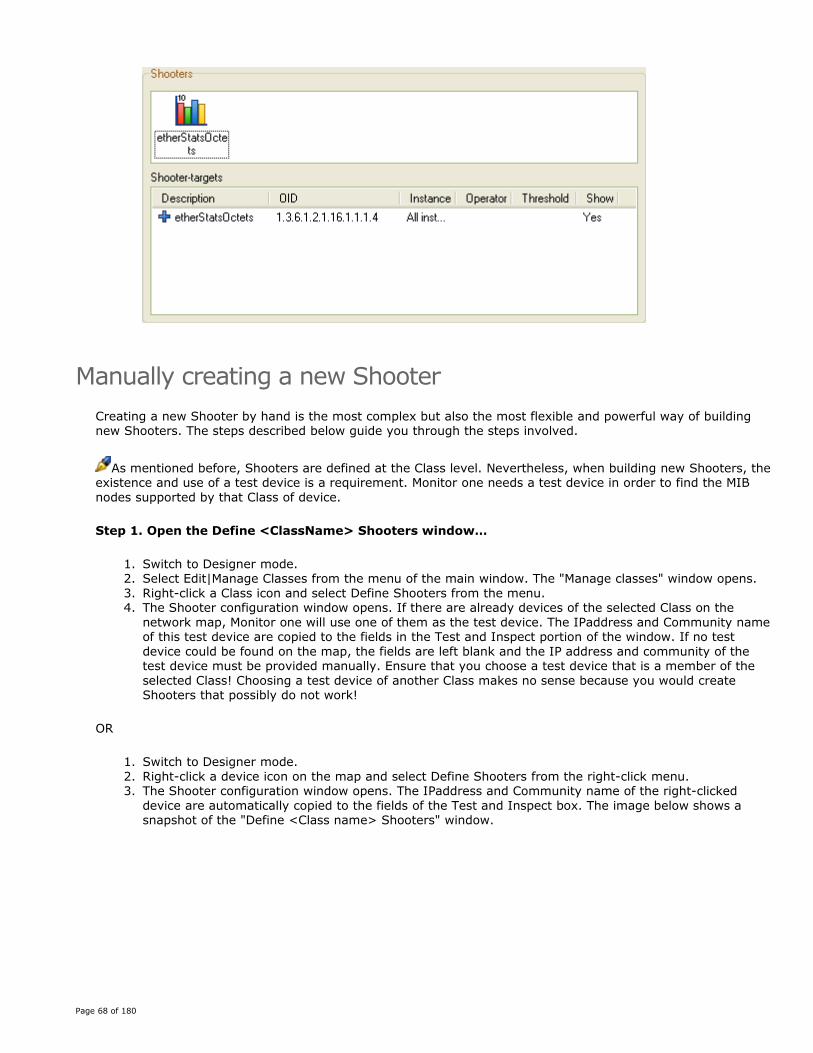
Manually creating a new ShooterCreating a new Shooter by hand is the most complex but also the most flexible and powerful way of building new Shooters. The steps described below guide you through the steps involved.
As mentioned before, Shooters are defined at the Class level. Nevertheless, when building new Shooters, the existence and use of a test device is a requirement. Monitor one needs a test device in order to find the MIB nodes supported by that Class of device.
Step 1. Open the Define <ClassName> Shooters window…
1. Switch to Designer mode. 2. Select Edit|Manage Classes from the menu of the main window. The "Manage classes" window opens. 3. Right-click a Class icon and select Define Shooters from the menu. 4. The Shooter configuration window opens. If there are already devices of the selected Class on the
network map, Monitor one will use one of them as the test device. The IPaddress and Community name of this test device are copied to the fields in the Test and Inspect portion of the window. If no test device could be found on the map, the fields are left blank and the IP address and community of the test device must be provided manually. Ensure that you choose a test device that is a member of the selected Class! Choosing a test device of another Class makes no sense because you would create Shooters that possibly do not work!
OR
1. Switch to Designer mode. 2. Right-click a device icon on the map and select Define Shooters from the right-click menu. 3. The Shooter configuration window opens. The IPaddress and Community name of the right-clicked
device are automatically copied to the fields of the Test and Inspect box. The image below shows a snapshot of the "Define <Class name> Shooters" window.
Page 68 of 180

The window contains 4 panes. The one at the left shows the MIB tree. The Node descriptions box (top right) is used to display information about the selected MIB node in the MIB tree. The Test and Inspect pane is used for accessing the test device and the bottom right pane provides information on the existing Shooters and their Targets.
Step 2. Start building the Shooter body (container).
1. Right-click anywhere in the Shooters box and select Add a Shooter. 2. The "Add/Modify a Shooter" window opens. See the snapshot below. 3. Enter the correct information into all boxes and press the Save button to save the new Shooter.
Page 69 of 180

ShooterName A Shooter name may consist of up to 30 characters (no spaces) and must be unique within the selected Class.
Shooter-type Select a Shooter-type by selecting the type from the Shooter-type listbox.
Speedshooter (Add this Shooter to a Device's right-Click menu) Speedshooters provide a way for easily accessing the most frequently used Shooters for a device. When for a Shooter the SpeedShooter property is set to true (checked) then it appears as a menu item in the device’s right-click menu. Only foreground Shooters can be marked as "SpeedShooter". Do not set the SpeedShooter property by default. Mark only the most frequently used Shooters as SpeedShooter to prevent over-configured, badly readable right-click menus!
Port to use for SNMP data retrieval. Some vendors use alternate ports for their SNMP agents. The default SNMP port has port-number 161. By default Monitor one uses the SNMP port defined at the Class level but you can use the Port to use… box to overrule the Class setting and define an alternate port at the Shooter level.
Active Period (When will this Shooter be active) Most networks experience different load during daytime than during the night. In order to minimize the chance of incorrect or superfluous alerting, you can fine-tune Threshold monitoring by specifying an active period for a
Page 70 of 180

threshold Shooter. When the From setting is greater than the Till setting, an active period during the night is assumed.
Additional Shooter settings The most important controls from this box are the RAW and the DELTA controls. Use these controls to define how to interpret received SNMP values. Select DELTA if you are interested in the difference between the last measured value and the previous one. Use DELTA if you - for example - want to show the traffic of an interface in bytes/sec in a graph. Use RAW if you are interested in raw values like room temperature, CPU utilization and UPS output-power. Be aware that the Additional Shooter settings box contains two tabs: one for all native Monitor one Shooters and one for RRD Shooters!
Step 3. Define one or more Shooter targets (SNMP requests) and add them to the Shooter.
1. Browse through the MIB tree and select the MIB node to add to the Shooter. 2. Right-click the node and choose Inspect to verify whether the selected node is supported by the test
device. 3. If the test turns out to be positive (the node turns green), right-click the node again and choose Add to
the selected Shooter. 4. The "Add/Modify a <ClassName> Shooter-target" window opens. 5. Depending on the selected Shooter-type, fields and/or boxes are either enabled or disabled. Select the
instance to use and provide valid data into all mandatory fields before pressing the Add/Modify button. 6. The Shooter-target is added to the Shooter and appears in the Shooter-targets box.
About Formulas
Formulas provide a way to manipulate SNMP values before displaying or using them. With a Formula you can for example change the format of data (from bytes/s to Mbytes/sec etc). A formula can be added to a Shooter as if it was a Shooter-target. A Shooter can contain more than one formula.
Not all Shooter types support the Formula option!
Using a formula requires entering one or more arguments. Arguments are pieces of data used as input for the formula. You can use retrieved SNMP values and constant values as arguments.
Formula's must be entered in infix notation. For instance ((a+b)/c/8)*100 or (A+(B/C))/(D-A)*35 etc. The characters A, B, C etc represent retrieved SNMP values (target data). You can also enter constant values directly, as in: (A+B)/10
Adding a formula to a Shooter
1. Right-click anywhere in the Shooter-targets box and select Add a formula. 2. The "Add/Modify formula: <Formula name>" window opens. See the snapshot below. 3. Fill out the form and press the Save button to save the new formula. The formula is added (as if it were
a Shooter-target) to the target list.
Page 71 of 180

Available OIDs The Available OIDs box shows the table of available arguments that can be used in the formula.
Formula Use the Formula box to enter the formula in infix notation. Be aware of the following limitations:
• Allowed operators: * / + - • Allowed operands: The characters A..Z (not case-sensitive!), Positive integers.
Result name Use the Result name box to assign a name to the result of the calculations. This name appears in the legend of the Graph or Meter etc..
Examples
In the examples described below, we use the retrieved values from:
• A = ifInOctets.3 – incoming bytes on interface 3 • B = ifOutOctets.3 – outgoing bytes on interface 3 • C = ifSpeed.3 – interface speed of interface 3 in bits/sec
1. To show the sum of incoming and outgoing bytes per second in KB/s: --> Formula = (A+B)/1024
2. You cannot enter fractions directly into the formula box, so we need a trick. If you want to use the fraction value 0.5: --> Formula = (A+B)*(5/10)
3. You cannot enter negative values directly into the formula box, so again a trick. If you want to use negative constant values like -1: --> Formula = (A+B)*(0-1)
4. If you want to calculate the utilization of interface 3. Note that ifSpeed is in bits/s! --> Formula = (A+B)/(c/8)*100 OR ((a+b)/c)*800 OR ((a+b)*800)/c
The utilization can be calculated by adding ifInOctets to ifOutOctets and dividing the result by the speed in bytes/s. After that, multiply the result by 100 to get the utilization!
In the graph below, we used a formula to negate the ifOutOctets. The result gives a perfect idea of a server’s
Page 72 of 180

NIC "Incoming and Outgoing byes" ratio.
We used the following formula:
Example 1. Manually building a Shooter that monitors port 7 of a switch.
This example demonstrates how to build a Threshold Shooter that monitors port 7 of a HP2524 switch. If the link on that port goes down, a "Threshold exceeded" event is generated. Port 7 only needs to be monitored
Page 73 of 180
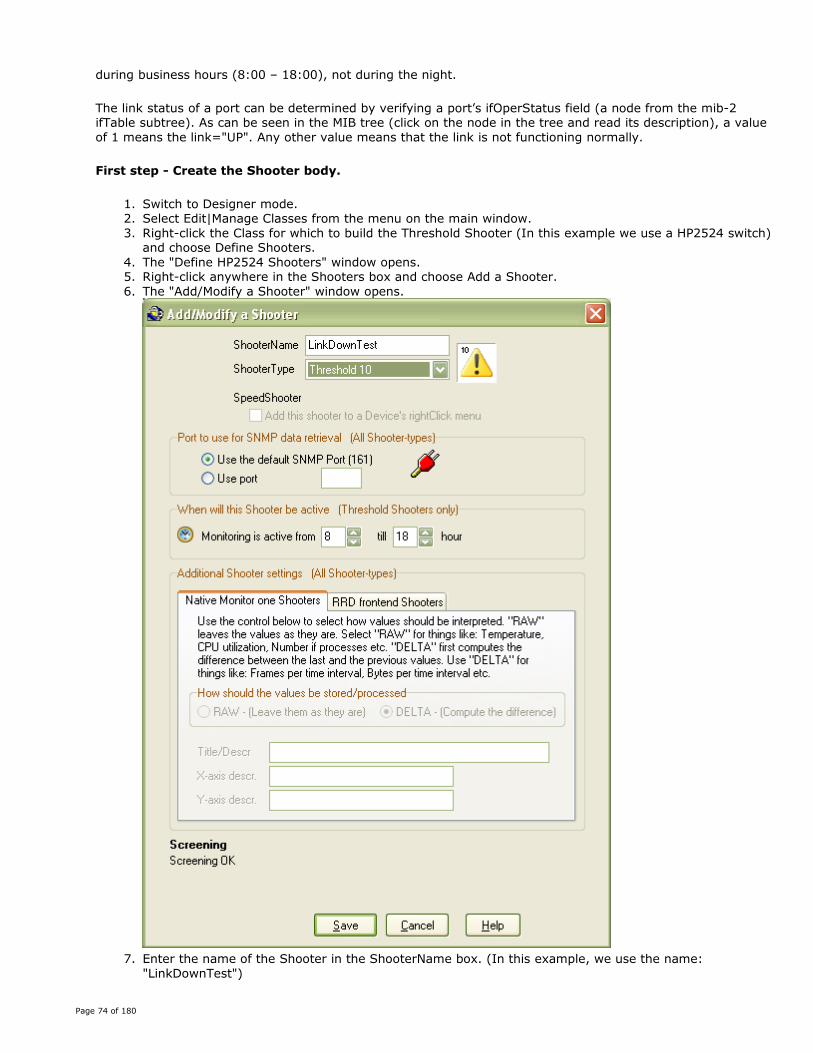
during business hours (8:00 – 18:00), not during the night.
The link status of a port can be determined by verifying a port’s ifOperStatus field (a node from the mib-2 ifTable subtree). As can be seen in the MIB tree (click on the node in the tree and read its description), a value of 1 means the link="UP". Any other value means that the link is not functioning normally.
First step - Create the Shooter body.
1. Switch to Designer mode. 2. Select Edit|Manage Classes from the menu on the main window. 3. Right-click the Class for which to build the Threshold Shooter (In this example we use a HP2524 switch)
and choose Define Shooters. 4. The "Define HP2524 Shooters" window opens. 5. Right-click anywhere in the Shooters box and choose Add a Shooter. 6. The "Add/Modify a Shooter" window opens.
7. Enter the name of the Shooter in the ShooterName box. (In this example, we use the name:
"LinkDownTest")
Page 74 of 180

8. Select "Threshold 10" from the ShooterType box. (The port status is polled every 10 seconds) 9. Use the "from" and "until" spin-edit controls to define when the Shooter must be active (from 8:00 until
18:00) 10.Press the Save button. 11.The "Add/Modify a Shooter" window closes. The new LinkDownTest Shooter appears in the Shooters box
and has focus (See the Sel.Shooter box in the upper left corner of the screen)
Second step - Add a shooter-target to the LinkDownTest Shooter.
1. Verify the Community and IPaddress fields of the Test and Inspect box. Enter the Community name and the IP address of a test device manually if Monitor one was unable to assign these values automatically.
2. Walk through the MIB tree and right-click the ifOperStatus node from the mib-2 ifTable branch. (path: iso.org.dod.internet.mgmt.mib-2.interfaces.iftable.ifEntry.ifOperStatus)
3. Right-click the ifOperStatus node and select Inspect. 4. An SNMP request frame is sent to the test device. The MIB node turns green if the test device returns a
valid response. Note that only green MIB nodes can be used as Shooter-targets. 5. Right-click the green node again and choose Add to the selected Shooter. 6. The "Add/Modify a LinkDownTest shooter-target" window opens.
7. Check the Append radiobutton from the OID/Instance box and enter .7 in the edit box. (.7 means port 7
from the switch) 8. Select the "not equal to" sign (<>) from the Threshold settings box, enter "1" (=UP, see the nodes
description) into the edit box and check the RAW radiobutton. 9. Optionally, check also the Custom message radiobutton and enter a warning message (i.e. "The link on
port 7 is down!"). This message is shown in the event message if a "link-down" event occurs! 10.Check the Show this field on screen control. 11.Press the Add/Modify button. The shooter-target is added to the LinkDownTest Shooter. See the
snapshot below.
Page 75 of 180

Third step - Start the threshold Shooter.
1. Right-click the device on the map for which to start the threshold Shooter and choose Shooters/Properties.
2. Click the Background Shooters tab. The LinkDownTest Shooter appears in the Available box.
3. Right-click the LinkDownTest Shooter and choose Start this Shooter for device <DeviceName> 4. The LinkDownTest Shooter icon moves to the Launched box. 5. The LinkDownTest Shooter is now started. You can verify its status by selecting Options|Threshold
control from the menu on the main window. If port 7 is "up" then the "Threshold control" window shows:
Page 76 of 180

and if port 7 goes down:
Modifying or Removing ShootersModifications to a Shooter can be made at two levels: You can make changes to one or more properties of the Shooter body OR you can make changes to one or more Shooter-targets.
First, Open the Define <Class name> Shooters window...
1. Switch to Designer mode. 2. Select Edit|Manage Classes from the menu of the main window to open the Manage Classes window. 3. Right-click a Class icon and select Define Shooters from the menu. 4. The Shooter configuration window opens.
OR
1. Switch to Designer mode. 2. Right-click a device object on the map and select Define Shooters from the object’s right-click menu. 3. The Shooter configuration window opens.
Then, Select the Shooter to modify...
1. Select the Shooter to modify from the Shooters box and click its icon 2. The selected Shooter now appears in the Sel. Shooter portion in the upper left corner of the window and
the list of Shooter-targets is shown in the Target box at the bottom right corner of the window.
If you right-click the Shooter in the Shooters box, a popup menu appears. Use these menu-items to modify or remove a Shooter.
You can also right-click one of the Shooter-targets. The popup menu that appears allows you to modify or
Page 77 of 180

remove a Shooter-target.
Shooter-targets that are used in a formula cannot be removed without the formula being removed first.
If you make changes to a running Background Shooter then this Background Shooter is restarted the moment you close the "Define <Class name> Shooters" window.
Foreground Shooters can be renamed. Background cannot!
Using SNMP for status pollingNormally, Monitor one monitors the status of devices by sending a "ping" periodically. There are, however, situations in which you would like to use another protocol, for instance if a device does not reply to a ping echo-request because of a firewall blocking this protocol.
If the device does respond to SNMP requests, you can also use SNMP for status polling. The only requirement is that you define and run a background Shooter with a 10 seconds polling interval!
To use SNMP polling for status monitoring follow the steps described below:
Step A. enable the option
1. Switch to Designer mode. 2. Select Options|Global configuration from the menu on the main window. 3. Click the StatusPoller tab 4. Check the Use Shooter information also for Status monitoring checkbox
Step B. Start a 10 seconds background Shooter for the device
It makes no difference which background Shooter you choose as long as it uses a 10 seconds polling interval. If such a Shooter is not yet available, you must create one. If you cannot find a meaningful Shooter you can use the predefined "SNMPStatusPolling" Shooter.
To create the SNMPStatusPolling Shooter:
1. Switch to Designer mode. 2. Select Edit|Manage Classes from the menu on the main window. 3. Right-click the Class for which to create the Shooter and choose Define Shooters. 4. The "Define <ClassName> shooters" window opens. 5. Right-click anywhere in the Shooters box and choose Special. 6. Select the SNMPStatusPolling Shooter. 7. Right-click the device on the map for which to start the SNMPStatusPolling Shooter and choose
Shooters/Properties. 8. Click the Background Shooters tab, right-click the SNMPStatusPolling Shooter and choose Start this
Shooter…
Page 78 of 180

Chapter 6. Logging SNMP data for trending and long-term analysis
About logging SNMP data"History" Shooters do the work of collecting and logging SNMP data. History Shooters poll devices regularly for SNMP data and store the responses into two different databases simultaneously: the native Monitor one database and the RRD.
RRD is the Acronym for Round Robin Database. RRD is a system to store and display time-series data (i.e. network bandwidth, machine-room temperature, server load average). It stores the data in a very compact way that will not expand over time, and it presents useful graphs by processing the data to enforce a certain data density.
Monitor one is used as a front-end for RRD. A front-end is a program that acts as an interface for another! Monitor one History Shooters collect all kinds of SNMP data from network devices. In older versions, all this device specific SNMP information was only saved in the native Monitor one database!
The native Monitor one history database versus the RRDThe reason for the usage of two different databases is to get the best out of both worlds. Generally spoken, the native Monitor one database allows better, more powerful and more flexible graphing and the RRD approach outclasses the native Monitor one database when it comes to long-term logging. Both database structures support the exporting of logged SNMP data to flat *.txt files for reporting and further processing purposes.
Although both databases are fed with the same data, the two databases handle the data differently. The native Monitor one database is able to handle all kinds of data, raw data as well as formula output and stores counter values "as is" without processing of any kind. Counter values are stored in RRD files as "per second" rates.
Accessing the native Monitor one database
The History control windowThe History control window shows a treeview of all started History Shooters along with their sessions. The tree contains three levels. The first level shows the device, the second level shows the History Shooters and the third level shows the sessions belonging to each Shooter.
To open the History control window
1. Select Options|History control from the menu on the main window.
Page 79 of 180

An example History control window
Showing History data from the native database in a graph1. Right-click on the node (the item with the yellow cog) representing the History session of your choice
and select Show graph. (The node-text shows the session-ID and the starting Date/Time of the session) 2. The History graph window opens.
Page 80 of 180

The screenshot above shows the top 20 of the most transmitting or receiving ports of an Ethernet backbone switch. For quick access to logged data, you can also use the "History" menu-item on a device’s right-click menu. The History item is only enabled if there is at least one History Shooter running for the device.
Exporting History information to a *.txt fileHistory information can be exported to a flat *.txt file in order to be used in a spreadsheet, report or for further processing. Follow the steps described below:
1. Right-click the node representing the History session of your choice and select Export history data. 2. A message box pops up. Read the message and confirm if OK 3. A new export file is created named: Exp_ <devicename>_<sessionID>.log. The file is saved in the
directory: <Project directory>\HistoryData.\ If this folder does not already exist, it will be created automatically.
Note: An export file overrides an existing one without any warning!
Page 81 of 180

38184.3233787153?57?TranReceiBytesPerInterHI100I11?Router?1.3.6.1.2.1.2.2.1.10.1?3734716333?1.3.6.1.2.1.2.2.1.16.1?1486642760?
38184.3245375694?57?TranReceiBytesPerInterHI100I11?Router?1.3.6.1.2.1.2.2.1.10.1?3734745279?1.3.6.1.2.1.2.2.1.16.1?1486660618?
38184.3256964236?57?TranReceiBytesPerInterHI100I11?Router?1.3.6.1.2.1.2.2.1.10.1?3734773153?1.3.6.1.2.1.2.2.1.16.1?1486678212?
38184.3268556481?57?TranReceiBytesPerInterHI100I11?Router?1.3.6.1.2.1.2.2.1.10.1?3734800959?1.3.6.1.2.1.2.2.1.16.1?1486696050?
38184.3280141319?57?TranReceiBytesPerInterHI100I11?Router?1.3.6.1.2.1.2.2.1.10.1?3734828415?1.3.6.1.2.1.2.2.1.16.1?1486713614?
38184.3291729861?57?TranReceiBytesPerInterHI100I11?Router?1.3.6.1.2.1.2.2.1.10.1?3734856221?1.3.6.1.2.1.2.2.1.16.1?1486731208?
38184.3303322107?57?TranReceiBytesPerInterHI100I11?Router?1.3.6.1.2.1.2.2.1.10.1?3734882973?1.3.6.1.2.1.2.2.1.16.1?1486748508?
38184.3314906944?57?TranReceiBytesPerInterHI100I11?Router?1.3.6.1.2.1.2.2.1.10.1?3734910577?1.3.6.1.2.1.2.2.1.16.1?1486766166?
38184.3326495486?57?TranReceiBytesPerInterHI100I11?Router?1.3.6.1.2.1.2.2.1.10.1?3734938099?1.3.6.1.2.1.2.2.1.16.1?1486783852?
38184.3338084028?57?TranReceiBytesPerInterHI100I11?Router?1.3.6.1.2.1.2.2.1.10.1?3734965271?1.3.6.1.2.1.2.2.1.16.1?1486801352?
38184.3349672569?57?TranReceiBytesPerInterHI100I11?Router?1.3.6.1.2.1.2.2.1.10.1?3734992913?1.3.6.1.2.1.2.2.1.16.1?1486819226?
38184.3361261111?57?TranReceiBytesPerInterHI100I11?Router?1.3.6.1.2.1.2.2.1.10.1?3735020827?1.3.6.1.2.1.2.2.1.16.1?1486837006?
Fields and format in the export file
The fields in the export file are separated by the "?" character! The image above shows an example of the contents of an export file.
Field #1 - The Date/Time stamp the data was collected in serial DateTime format that can easily be read into a spreadsheet like Microsoft Excel.
Field #2 - Session ID"
Field #3 - The name of the Shooter that collected the data
Field #4 - The name of the device the data was retrieved from
Field #5+#6, #7+#8, #9+#10 ........ - A repeating group of Fieldname and Field value.
(The fieldname can either be an ObjectIdentifier (1.3.6.1.2.1.. etc) OR the name of a formula and the computed value)
Page 82 of 180
How to import an export file into Microsoft Excel
1. Start Excel 2. Choose File|Open 3. Select the Export file (location is <Project directory>\HistoryData\Exportfile.log) 4. Check radiobutton Delimited (=default) 5. Click Next 6. Check the Others checkbox and enter "?" in the separator field (uncheck all other checkboxes!) 7. Press the Next button 8. Leave all Column data formats as they are (=General) 9. Click the Finish button 10.Right-click the DateTime column and choose Format cells 11.Choose Category Date and select the type of your choice 12.Click Ok 13.The DateTime column should now show readable Date and Time strings!
Automatic database cleanupHistory data is not stored forever. Every midnight, various cleanup processes are automatically started to keep various Monitor one databases in a healthy and accessible state.
You can specify how long History data must be kept in the database by choosing Options|Global configuration from the main window and selecting the History tab. Use the spin-edit control to adjust the storage time. The minimum is 7 days, the maximum is 31 days and the default is 14 days.
Accessing the RRD
RRDToolAll reading from and writing to the RRD if done through RRDTool. RRDTool refers to Round Robin Database tool. Round robin is a technique that works with a fixed amount of data, and a pointer to the current element. Think of a circle with some dots plotted on the edge, these dots are the places where data can be stored. Draw an arrow from the center of the circle to one of the dots, this is the pointer. When the current data is read or written, the pointer moves to the next element. As we are on a circle there is no beginning nor an end, you can go on and on. After a while, all the available places will be used and the process automatically reuses old locations. This way, the database will not grow in size and therefore requires no maintenance. RRDTool works with Round Robin Databases (RRDs). It stores and retrieves data from them.
Tobias Oetiker writes RRDTool with contributions from many people all around the world. The official RRDTool website can be found at http://oss.oetiker.ch/rrdtool/
RRDtool is available under the terms of the GNU General Public License. RRDTool.exe is stored in the directory "c:\Program Files\FineConnection\Monitor one".
Location, Format and Fields in an RRD All RRD files have the *.rrd extension and are saved in the project directory.
The name of an RRD is built up using the following format: <MapName>_<Monitor one internal DeviceName>_<ShooterName>_<Index#>.rrd
Page 83 of 180

Each *.rrd file has a corresponding *.rif file. The extension *.rif is an acronym for Reference Information File. A *.rif file is used internally by Monitor one and describes things as: What commandline parameters were used to initially build the RRD, the creation date of the RRD and the field reference map.
The Field Reference Map is used to map Monitor one fields-names to RRD-fieldnames! Field mapping is necessary because of certain restrictions in the RRD fieldnames.
DO NOT EDIT A RIF FILE BY HAND!
A new RRD is created automatically the first time retrieved data is written to the RRD and the RRD does not already exist! An RRD (and corresponding .rif file) is built using the following parameters:
1. The polling interval of the History Shooter that collects the data 2. The RRD Abs/Rel property (See: Adding or Modifying a Shooter) 3. The fields names and the field-types to save.
If the RRD already exists but its format does not match the required format, (i.e. the History Shooter was modified) then a new (empty) RRD is created. The name of this new file is the same as the old name, only the Index# is incremented by one.
Showing History data from the RRD in a graphThe SNMP information saved in an RRD can be made visible by the use of Graph definitions. There are two different types of definitions: the Default (auto-generated) and the Customized Graph definitions. Both types are available in the native- as well as in the web-interface.
A Graph definition describes:
1. From which RRD to read data 2. The begin- and the end date/time (period) 3. Which fields to include in the graph 4. The graph type (line, stack,area etc) 5. The step interval 6. The title and axes descriptions of the graph
The combination of all descriptions is used to compose a commandline string. This commandline string is passed to RRDTool.exe. RRDTool parses the commandline and builds a graph accordingly!
To view the Default Graphs in the native Monitor one user-interface follow these steps:
1. Select the History control tab on the main window 2. Click the History control speedbutton to open the History control window 3. Double-click the small glyph representing the device from which you want to view the default Graphs.
(The glyph expands/unfolds) 4. Right-click the small glyph (two blue squares) at the second level representing the Shooter and choose
RRDTool|Show default quick view graph 5. Your default system browser opens and shows the default (3) graphs!
Note that you right-clicked the glyph representing the Shooter and not a Session. Sessions are only used with respect to the native history database. An RRD does not work with sessions!
To view the default Graphs in the Web-interface follow these steps:
1. Logon to the web interface 2. Click the History Icon on the Web-interface control panel 3. The History page opens showing all available RRD Graphs
Page 84 of 180

4. Select the device from which you want to view the default Graphs and click the Default quick view Graph hyperlink
Building new Graph definitionsAs mentioned before, Monitor one does not create RRD Graphs itself. It builds a commandline string from the parameters you provide and calls RRDTool.exe. RRDTool parses the commandline and creates a *.gif image on disk from the data in the RRD. After that, Monitor one opens the new Graph image in the system's default browser.
For the default Graphs, Monitor one uses predefined/canned (not editable) definitions. You can however define your own definitions, save them to disk and make them available - just like the default Graphs - in the native and in the web interfaces.
To build a new "Definition" follow these steps:
1. Switch to Designer mode. 2. Click the History control speedbutton to open the History control window 3. Double-click the small glyph representing the device for which you want to create a new Definition in
order to unfold/expand it. 4. Right-click the small glyph (two blue squares) at the second level representing the Shooter and choose
RRDTool|Customize RRDTool Graphs/Tables 5. The "Customize RRDTool Graphs/Tables for device: <DeviceName>, Shooter: <ShooterName>" window
opens. See the image below!
Page 85 of 180

6. Right-click in the uppermost listbox and select New RRD Graph definition from the popupmenu. 7. Enter a descriptive name for the new Definition into the Name box. This name will appear (as a clickable
menu-item) in the native and the web user-interfaces! 8. Use the Title and the Y-axis boxes to specify the title (that appears above the Graph) and the Y-axis. Be
aware that RRDTool stores counters as per/second rate by default! So choose your Y-axis carefully! 9. Select the desired Graph-type and use the Date/Time interval box to specify the start- and the end-time
of the Graph. 10.Select the fields to include in your Graph from the Available fields box and click either the Add or the All
buttons. 11.If all fields have been entered correctly, you should now see a commandline in the System... box. This
is the commandline string that is passed to rrdtool.exe in order to create a Graph. 12.You can preview your Graph by clicking the Preview button. 13.If the Graph meets your needs, Press Save to save the new Definition. Your new Graph Definition is now
visible in History control (select Options|History control from the menu on the main window, select the correct device and right-click the running History Shooter)
Page 86 of 180

The bottommost (Custom RRDTool...) box can be used to enter a commandline by hand. Be aware of the fact that Monitor one does not perform any screening or syntax checking. You can also make modifications to the "System RRDTool…" commandline by clicking the Copy to box below control and edit the commandline settings by hand. As you can see in the snapshot above, we have copied the system generated RRDTool Graph commandline string to the "Custom RRDTool…" box and we have changed the height of the graph to 100 pixels!
Use the Click here to see the RRD file properties control to get detailed information on how the underlying RRD is formatted, which fields are included and what the mapping is between the Monitor one fieldnames and the RRD fieldnames!
Monitor one gives priority to the commandline string in the Custom modified... box by default! If no custom commandline is available, it will use the default (auto-generated) commandline (System generated RRDTool.exe...)
Because Monitor one does not interpret the "custom" commandline it is not aware of incorrect syntax etc. Also, if you change the *.gif filename, RRDTool.exe will just create this image on disk if the Preview button is pressed (assumed that the commandline is correct) but it will not appear on screen since Monitor one only searches for an image filename as in the auto generated commandline! If the syntax of the commandline is incorrect, RRDTool.exe will not create the Graph and a Timeout message will popup after approx 20 seconds.
We advise to read the RRD Graph manual for a complete description of all the features. See: http://oss.oetiker.ch/rrdtool/doc/rrdgraph.en.html
Exporting RRD History information to a *.txt fileThis topic describes how to build a "Fetch" definition that extracts data from an RRD and saves this data in a text formatted, space delimited export file. The export file can be used to build reports and spreadsheets or can be imported into databases for further processing. For a better understanding, we will use an example that takes three steps.
1. In the first step we'll create a History Shooter that queries a Windows XP workstation every 100 seconds for its transmitted and received bytes. We will use the Shooter wizard to build the Shooter.
2. In the second step, we will build a "Fetch definition" which describes the "Fetch" command. 3. In the third step, we will build a simple command file that extracts data from the RRD, formats this data
to a friendlier format and shows the data in notepad.exe. If notepad.exe is replaced by an "import utility" and the command file is scheduled to run unattended periodically, this example can be used to update an external database automatically.
First step - Creating a History Shooter that queries a Windows XP workstation for transmitted and received bytes, using the Shooter Wizard.
This example assumes that there is a Windows XP workstation (supporting SNMP) on you network map!
1. Switch to Designer mode. 2. Right-click the Workstation on the map and choose Define Shooters (Wizard) 3. The Shooter Wizard window opens. 4. Click the Next button 5. The Wizard starts inspecting the workstation in order to find out which MIB nodes are supported 6. If the Inspection process has finished click the Next button again 7. Choose B. Interfaces from the selection box and click the Next button 8. Choose B. Transmitted/Received bytes per Interface and click the Next button 9. Choose G. History Shooter and click the Next button 10.Choose C. 100 seconds for the polling interval and click Next 11.Choose A. Fixed and enter .2 (dot two!) in the edit box. .2 (dot two) is the interface instance of the NIC
on my XP workstation! If you do not know the instance of your NIC you can run the default "ifEntry" table Shooter to find out the instance of your system's NIC. If you have entered the correct instance, click Next.
Page 87 of 180

12.Enter a descriptive name for the Shooter in the Shooter name box (I chose TXRXBytesXPNIC) and click Next
13.Verify all settings and if OK click Build 14.Choose B. Start the Shooter for the Right-clicked device as the Start option and click Finish 15.The new History Shooter has now been created and is running!
Note that it takes at least 100 seconds before the first value is written to the RRD. For the rest of the example it would be nice to have more than just one value.
Second step - Building a "Fetch" definition.
A Fetch definition reads data from an RRD and saves this data in a text-formatted file. We will create a Fetch definition that extracts the amount of transmitted and received bytes of my system's NIC, measured over the last 24 hours.
1. Switch to Designer mode. 2. Select the History control tab and after that the History control speedbutton to open the History control
window. 3. Double-click the small glyph representing the workstation for which we created the TXRXBytesXPNIC
History Shooter in order to unfold/expand it. 4. Right-click the small glyph (two blue squares) at the second level representing the Shooter and choose
RRDTool|Customize RRDTool Graphs/Tables 5. The "Building RRDTool Graphs/Tables for device: <DeviceName>, Shooter: <ShooterName>" window
opens. 6. Right-click in the Available custom RRDTool Graph and Fetch-data definitions box and choose New RRD
fetch-data definition 7. We'll now have to assign a number of property values 8. Enter a descriptive name for the definition into the Name box (I chose FetchLast24Hours) 9. Select Last day (now - 24 hours) from the Date/Time interval box 10.Click Preview
Page 88 of 180

Timestamp F0 F1
1088490400: -1.#IND000000e+000 -1.#IND000000e+000
1088490500: -1.#IND000000e+000 -1.#IND000000e+000
1088490600: -1.#IND000000e+000 -1.#IND000000e+000
1088490700: -1.#IND000000e+000 -1.#IND000000e+000
1088490800: -1.#IND000000e+000 -1.#IND000000e+000
1088490900: -1.#IND000000e+000 -1.#IND000000e+000
1088491000: 5.5782000000e+002 9.1698000000e+002
1088491100: 5.0252110000e+002 8.9025630000e+002
1088491200: 3.2593910000e+002 8.2502050000e+002
1088491300: 3.5305580000e+002 8.9994380000e+002
1088491400: 3.4331880000e+002 8.6299650000e+002
1088491500: 3.3490679802e+002 8.2840304455e+002
1088491600: 3.5564820198e+002 8.8951025545e+002
1088491700: 3.3589060000e+002 8.5575420000e+002
1088491800: 3.2245460000e+002 8.1654680000e+002
1088491900: 3.5240000000e+002 8.8883040000e+002
You should now see a text file like the output above (opened in notepad.exe). This is the default output generated by RRDTool.exe. The first two lines are headers. The three columns represent, the Date/Time of the measurement in epoch notation, the number of ifInOctets and the number of ifOutOctets.
Almost all counters look like -1.#IND000000e+000. This is the way RRDTool displays the value NIL or NULL meaning "Unknown-" or "No" value. RRDTool tries to extract data from 24 hours ago but fails and returns a NIL value, because our Shooter just started collecting data a half an hour ago. If you scroll to the end of the file then you should see some "readable" output. As you can see, the counters are in scientific notation!
We have only previewed our definition. We have not saved it yet, so press the Save button. The new "Fetch" definition appears as an icon in the uppermost listbox of the window.
Step3. Building a command file (that can be run periodically unattended) that formats the extracted data and saves it to a text file.
In this step, we will use a small program "MCnvrt.exe" in order to format the fields in the export file to a friendlier format. MCnvrt.exe is written by Netshield and can be found in the Monitor one installation directory (c:\Program Files\FineConnection\Monitor one\)
MCnvrt.exe lets you convert the Date/Time epoch values to a Microsoft serial Date/Time value or to YYYYMMDDHHSS values. MCnvrt.exe also lets you convert the RRDTool -1.#IND000000e+000 values to a "NULL" string and the scientific notation to 'normal' decimal point strings.
Page 89 of 180

We will use the "FetchLast24Hours" definition from the previous step! Open notepad (or any other editor) and copy/paste the text below.
echo off
rem // Extract the data from the RRD file
"c:\Program Files\FineConnection\Monitor one\rrdtool.exe" <RRDTool Fetch Commandline>
rem
rem // Convert the values in the export file to more user friendly strings
"c:\Program Files\FineConnection\Monitor one\MCnvrt.exe" <Default Export Filename> /DTF /NULL /VST
rem
rem // Read the new formatted export file into notepad to see the results
notepad <Default Export Filename>
1. Click the "FetchLast24Hours" definition icon in the Available custom RRDTool Graph and Fetch-data definitions box.
2. Copy the contents of the System generated RRDTool.exe commandline box to the clipboard by right-clicking in the box and choosing Copy.
3. Replace the string <RRDTool Fetch Commandline> in the command file that were are building by the string in your clipboard by copying/pasting.
4. Replace all <Default Export Filename> strings by the actual export filename (the filename that comes after the "pipe" character '>' in the clipboard string)
5. Save the command file in the same directory as where your .rrd files reside (project directory). Use a descriptive name and use the .cmd extension!
6. Open a DOS box and go the directory where you saved your command file and run it.
The output is now changed and looks like
Page 90 of 180

20040629062500 NULL NULL
20040629062640 NULL NULL
20040629062820 NULL NULL
20040629063000 NULL NULL
20040629063140 NULL NULL
20040629063320 NULL NULL
20040629063500 NULL NULL
20040629063640 557.82 916.98
20040629063820 502.5211 890.2563
20040629064000 325.9391 825.0205
20040629064140 353.0558 899.9438
20040629064320 343.3188 862.9965
20040629064500 334.90679802 828.40304455
20040629064640 355.64820198 889.51025545
20040629064820 335.8906 855.7542
20040629065000 322.4546 816.5468
20040629065140 352.4 888.8304
20040629065320 338.4104 856.286
20040629065500 322.3174 814.7074
20040629065640 352.8304 892.7658
As you can see, the epoch Date/Time field is reformatted to YYYYMMDDHHMMSS, the -1.#IND000000e+000 values are changed to NULL strings and also the counter values are reformatted.
The new file can easily be imported into Excel in order to create a report. In the commandline, we use notepad.exe to show the results on screen. If you replace notepad.exe to an import-utility.exe and this command file is run every day at the same time (unattended), you can save all data in an external database (Oracle, SQL-server etc) for further processing.
In the example, we used "Last 24 hours" as the interval. This means that you have to run the command file every day at the same time in order to prevent "gaps" or "lost data". Specifying another (less critical and overlapping) interval could overcome this difficulty.
In this example, the History Shooter feeds the RRD with "counter" values. (ifInOctets and ifOutOctets are defined as counters (positive integers) in the rfc1213 MIB file) In spite of this, RRDTool.exe returns broken numbers. For an explanation, we recommend to read http://oss.oetiker.ch/rrdtool/doc/rrdcreate.en.html (Topic
Page 91 of 180

The Heartbeat and the Step)
For a good understanding of the various parameters and features of RRDTool read: http://oss.oetiker.ch/rrdtool/doc/rrdfetch.en.html Pay special attention to:
• RRDTool Date/Time values in epoch UTC time specification • Resolution interval • AT-Style specification, TIME REFERENCE specification, TIME OFFSET specification
The epoch UTC issue
RRDTool is not aware of any time zone. RRDTool works with epoch UTC. Coordinated Universal Time or UTC, also sometimes referred to as "Zulu time", the basis for civil time, is the successor of Greenwich Mean Time, abbreviated as GMT, and is still colloquially called GMT sometimes. All time references in RRDTool are based on this epoch UTC. Keep this in mind when building "time" critical fetch definitions.
fetch Home_D10_TXRXBytesXPNIC_0.rrd AVERAGE --start midnight-1day --end midnight >Home_D10_TXRXBytesXPNIC_Export.txt
In a time-critical situation, the commandline needs a correction. For the Netherlands this means adding 2 hours. The new commandline now becomes:
fetch Home_D10_TXRXBytesXPNIC_0.rrd AVERAGE --start midnight-1day+2hours --end midnight+2hours >Home_D10_TXRXBytesXPNIC_Export.txt
Page 92 of 180

Chapter 7. Alerting
About AlertingIn large networks, possibly a large number of events occur. In general, network managers only want to be alerted about major network events such as a power failure in a backbone switch or a crash of the corporate mail-server. A non-functioning printer is simply less important and can wait - especially when Alerts are sent to a pager or mobile phone during the weekends. The Monitor one Alerting facility called "The Alerter" allows you to define when and how to alert.
Monitor one distinguishes 6 event types:
1. Status events --> No response from device, Responding again, Status unknown 2. Threshold events --> Threshold exceeded, Below threshold value 3. Trap received events 4. Sensitivity events 5. Syslog message received events 6. Extensive Monitoring events
All event types except the Extensive Monitoring events can generate an alert!
Defining when to AlertEach event that occurs in the network and that is noticed by Monitor one is processed by a Monitor one component called "the Alerter" in order to determine whether alerts should be sent out. The decision on whether or not to alert is based on a calculation in which the Event-Severity, the Class Priority Level and the Alert-Threshold are involved.
The Event Severity level is multiplied by the Class Priority Level and the result is compared against the Alert-threshold. If the result exceeds the threshold, an alert is sent out.
You can customize Alerting by editing the Alert-table.
Customizing AlertingFollow these steps to open the Configuring Alerting window
1. Switch to Designer mode. 2. Select Options|Global configuration from the menu on the main window 3. Select the Alerting tab 4. The "Configuring Alerting" window opens.
Page 93 of 180
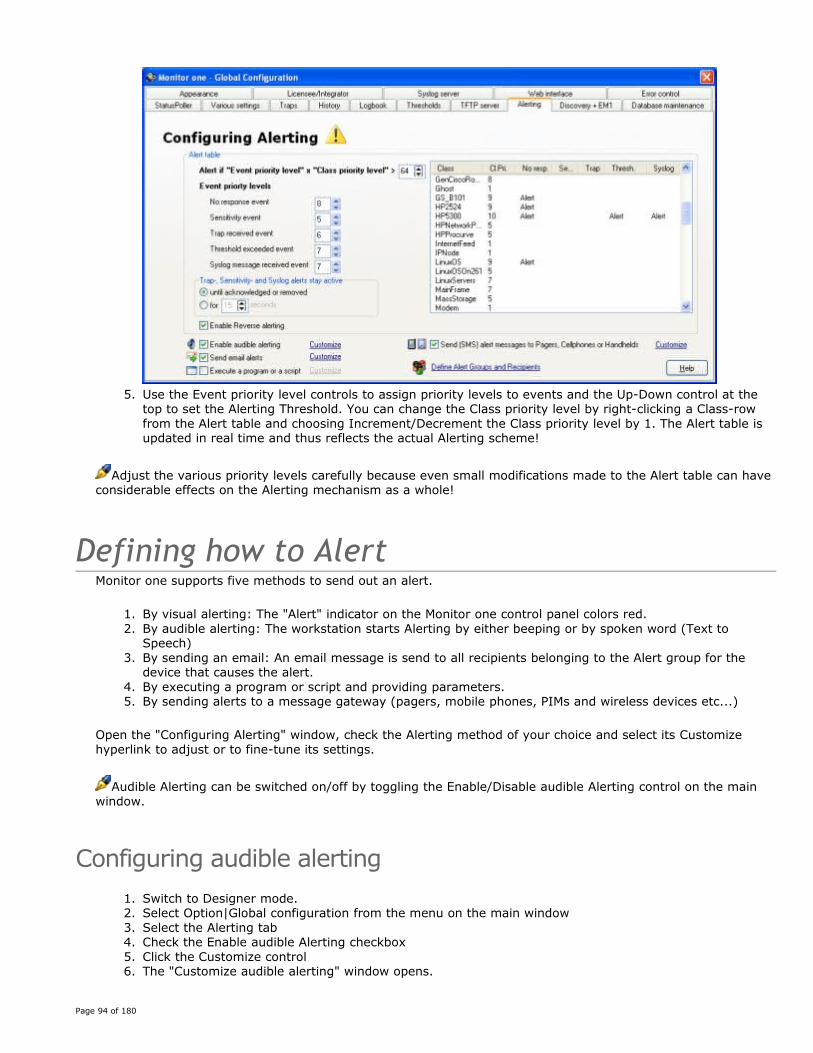
5. Use the Event priority level controls to assign priority levels to events and the Up-Down control at the
top to set the Alerting Threshold. You can change the Class priority level by right-clicking a Class-row from the Alert table and choosing Increment/Decrement the Class priority level by 1. The Alert table is updated in real time and thus reflects the actual Alerting scheme!
Adjust the various priority levels carefully because even small modifications made to the Alert table can have considerable effects on the Alerting mechanism as a whole!
Defining how to AlertMonitor one supports five methods to send out an alert.
1. By visual alerting: The "Alert" indicator on the Monitor one control panel colors red. 2. By audible alerting: The workstation starts Alerting by either beeping or by spoken word (Text to
Speech) 3. By sending an email: An email message is send to all recipients belonging to the Alert group for the
device that causes the alert. 4. By executing a program or script and providing parameters. 5. By sending alerts to a message gateway (pagers, mobile phones, PIMs and wireless devices etc...)
Open the "Configuring Alerting" window, check the Alerting method of your choice and select its Customize hyperlink to adjust or to fine-tune its settings.
Audible Alerting can be switched on/off by toggling the Enable/Disable audible Alerting control on the main window.
Configuring audible alerting1. Switch to Designer mode. 2. Select Option|Global configuration from the menu on the main window 3. Select the Alerting tab 4. Check the Enable audible Alerting checkbox 5. Click the Customize control 6. The "Customize audible alerting" window opens.
Page 94 of 180

- Select the Use the system beeper radiobutton if you want to be notified of an event by a simple system repeating "beep" signal. - Select Use Text to Speech to let the speech-engine of your monitoring station notify you of major network events by spoken word.
If Use Text To Speech is selected then you can control which parameters to include into the spoken message by (un)checking the checkboxes of your choice. Use the Test button to hear an example and test the system.
Text to Speech will only work if your system has some kind of audio device and if your system has Text-To-Speech capability.
Configuring e-mail alerting1. Switch to Designer mode. 2. Open the Global configuration window 3. Select the Alerting tab. 4. Check the Send e-mail alerts. 5. Press the Customize control. 6. The "Customize e-mail alerting" window opens.
Page 95 of 180

Name The Sender information Name box specifies the name of the sender of the E-Mail message. The content of this field appears in the "From" field of the email. The default string is "Netshield Monitor one", but of course you can modify this setting to whatever you like. In case you use more than one Monitor one station, you could use this field to uniquely identify the station that sends an e-mail message by, for example, entering the IPaddress of the station.
Address The Sender information Address box specifies the E-Mail address of the sender of the message. Use this box to specify the address that recipients of the message can use to reply to the message. Specify a dummy if you do not want to or are not able to receive reply messages. The default content is NetworkManagementConsole.
SMTP relay servers For redundancy reasons, Monitor one allows you to enter two different SMTP relay servers (port 25). The primary SMTP host is mandatory; the Secondary SMTP host is optional. The primary and the secondary Host IP/Name boxes contain the names or IP addresses of the remote relay hosts to connect to. Usually the name of the local (intranet) mail or exchange-server is filled in here but of course you can enter an arbitrary SMTP host that accepts and forwards your e-mail messages.
Username/Password The primary and secondary Username/Password boxes are used for authentication with the remote relay servers. A Username and Password is not always required to connect to an SMTP host, but many servers will not allow sending of mail without a valid Username/Password. The current Monitor one version only supports basic SASL "AUTH LOGIN" authentication. Future versions will also support SASL MD5-CRAM en MD5-DIGEST. If you want to use "AUTH LOGIN" authentication do not forget to check the Use SASL "AUTH.. checkbox.
Email formatting For better support for e-mail to SMS messaging, the email message is highly customizable. The fields to include into the Subject-line and the Body-text of the message can be selected separately by checking the appropriate checkboxes. The field-values added to the Subject-line are separated from each other by a slash (/) for better readability. By default, only the Device-name and the Event-message fields are included into the header. The body-text contains all available fields by default.
Page 96 of 180

Select an event-type and click the Send button to verify proper operation of Alerting by e-mail.
Many cell phones that have text messaging via email are limited to the number of characters they can receive. By being able to customize the trap alert message, you can get just the information you need in the limited allowed characters!
About Recipient Groups and Addresses
The possibility to define Alert-groups and to assign recipients to these groups allow you to send email alert messages to a specific group of people, depending on which device caused an alert.
Suppose you're working for a company that has separate units for specific (operating) systems (Network, Unix, Windows NT etc) then by using Alert-groups, it is possible to send email alerts from Unix hosts directly to the Unix-team and alerts from backbone switches directly to the Network team etc.
An Alert-group is a collection of recipients doing the same job or belonging to the same team that will receive an alert email message in case of a major event.
One group can contain multiple recipients and a recipient can belong to multiple groups. An alert email message is always send to an Alert-group, not to a single person. The "Default" group is a predefined Alert-group that cannot be removed.
If an event occurs for a group in which no recipients are defined, Monitor one will send the alert to the default group instead!
Defining Alert-groups and Recipients
To manage Groups and Recipients, click the Add, Modify or Delete Alert Groups and Recipients button on the "Customize E-mail alerting" window or use the control with the same name on the "Configuring Alerting" window. The "Alert Groups and Recipients" window opens.
Page 97 of 180

Adding an new Alert-group.
1. Right-click anywhere in the Alert Groups box and choose Add a new Alert-group. 2. The Add an Alert-group window opens.
3. Enter an arbitrary non-existing group number into the Group# box. This number is only used internally
by Monitor one and has no further meaning. Enter a descriptive name for the group into the Group description box.
4. Press the Save button. 5. The new group is added to the Groups box.
Removing an Alert-group
Page 98 of 180

1. Remove all recipients from the group that you are about to remove. 2. Right-click the Alert-group in the Alert Groups box and choose Delete this alert-group.
The Default group (Group 0) cannot be removed!
Adding a recipient
1. Ensure that the Alert-group, to which a new recipient is to be assigned, exists! 2. Right-click anywhere in the Alert Recipients box and select Add a recipient. 3. The Add a recipient window opens.
4. Use the Alert-group box to select the correct Alert-group. 5. Enter a valid e-mail address into the Email address box. 6. Eventually (if you are using PageGate from Notepager.com as your Message gateway) specify a
PageGate username. 7. Press the Save button.
Removing a recipient:
1. Right-click the recipient to remove in the Recipient box and select Remove this recipient.
Each device on the network map has an Alert-group assigned to it. The Alert-group is a property of a device. To assign or modify the Alert-group for a device, switch to Designer-mode, right-click a device on the map and choose Modify device.
PageGate is rich featured third party Message Gateway software from NotePager.com http://www.notepager.com. PageGate provides powerful options to define users along with their properties (cell-phones/pager numbers, email addresses etc). Monitor one allows you to assign a PageGate username to each recipient, keeping the Groups and Recipients functionality intact! More information on PageGate further on in this document!
Executing a program or script triggered by an eventThe Customize Program or Script execution window can be used to define which program or script to run and which parameters to provide in case of a serious event. Examples where this feature could be useful are for example:
• Using external SMS or Pager software that is especially developed to send out messages to all kinds of mobile equipment.
• Executing scripts that can automatically login to systems in order to solve certain problems. • To run a program that is able to shutdown a firewall (or disable an interface) if a major security thread
is detected on a firewall.
Page 99 of 180

To open the Customize Program or Script execution window:
1. Switch to Designer mode. 2. Select Options|Global configuration from the menu on the main window 3. Select the Alerting tab 4. Check the Execute a program or Script checkbox 5. Click the Customize control. 6. The "Customize Program or Script execution" window opens.
Currently five different event types can trigger the execution of a program or script:
1. No response events 2. Threshold exceeded events 3. Sensitivity events 4. Trap received events 5. Syslog message received events.
All event types can trigger the execution of the file specified in the uppermost box. In order to provide more flexibility for trap handling, you can use the second box to define which executable to start triggered by a trap.
To be more precise:
Page 100 of 180

If you only specify a program or script in the first edit box and you leave the second box blank then this program is used for all event types. If you also specify a second program then the first program is used for all event types except for the "Trap received" event. "Trap received" events trigger the second program!
Parameters and Passing mode
For maximum flexibility Monitor one allows you to configure exactly how parameters must be passed to the program or script specified.
Use the Parameter checkboxes to specify which parameters to pass to the program or script to execute. If you have specified a separate program for "trap received" event handling, you can also choose parameters from the right column to pass to the executed program.
The passing mode box lets you specify how the parameters are passed. If you check the uppermost radiobutton of the Format box(as in the snapshot above) then all parameters are passed individually and enclosed by double quotes.
If you check the second radiobutton then all parameters are concatenated into one string, also enclosed by double quotes. You can use the radiobuttons in the Separation box to choose the desired separation type. See the examples below
Format: Pass all parameters individually Parameters passed: "MyClass" "MyDevice" "MyCommunity" "127.0.0.1" "MyMessage"
Format: Pass all parameters as one string Separation: Not separated Parameters passed: "MyClass MyDevice MyCommunity 127.0.0.1 MyMessage"
Format: Pass all parameters as one string Separation: Comma separated Parameters passed: "MyClass,MyDevice,MyCommunity,127.0.0.1,MyMessage"
Format: Pass all parameters as one string Separation: Tab separated Parameters passed: "MyClass MyDevice MyCommunity 127.0.0.1 MyMessage"
Format: Pass all parameters as one string Separation: CSV (comma separated values) Parameters passed: ""MyClass","MyDevice","MyCommunity","127.0.0.1","MyMessage""
You can use the Fire off button to test the whole system and verify proper operation.
Examples
Both examples assume that all parameters of the left column are provided (%1..%5).
Example 1.
The example below uses the windows-NT net send command to send a message to the network manager's workstation! All available parameters (Class name, Device name, Community name, IP address, Event Message) are provided as commandline parameters..
net send NMStation %1 %2 %3 %4 %5
All parameters are passed to the executed program or script as commandline parameters. In order to avoid problems with parameters that contain spaces, Monitor one add double-quotes to all parameters, regardless of whether they contain spaces or not!
Page 101 of 180

Example 2.
Example 2 shows how to send a message to the network manager console if the device with IPaddress 192.168.2.23 does not respond to echo requests. All available parameters (Class name, Device name, Community name, IP address, Event Message) are provided as commandline parameters..
echo off
if NOT %4 EQU "192.168.2.23" goto end
if NOT %5 EQU "No response from device!" goto end
net send NMStation %2 " needs attention!"
:end
Send (SMS) messages to Pagers, Cell phones or Handhelds triggered by an event.
Monitor one can send alert messages to pagers, mobile phones, PIMs and wireless devices by providing the option to send these alert messages to a messaging server.
Generic Messaging Gateway
Most messaging gateways allow you to define a directory on the local- or on a server drive where you can save text files. This log directory is polled periodically by a messaging service and the text files that are found are sent to a pager or cell phone. Monitor one supports this messaging gateway type by providing the option to write messages as "tmpxxxxxx.txt" files to a messaging gateway's log directory.
When using a generic messaging gateway, the powerful Monitor one Groups and Recipients functionality is lost.
PageGate Messaging Gateway
PageGate is rich featured third party software from NotePager.com, http://www.notepager.com. PageGate is not part of the Monitor one suite and must be bought separately. Alert messages can be delivered via the Internet (SNPP, WCTP and SMTP), modems (TAP, UCP, GSM and TONE) and direct serial connections (TAP). PageGate also supports redundant outbound connections, message rerouting on failure.
PageGate provides powerful options to define users along with their properties (cell-phone/pager numbers, email addresses etc). Monitor one allows you to assign a PageGate username to each alert recipient, keeping the Groups and Recipients functionality intact!
If you select "PageGate" as your messaging server then Monitor one will use PageGate's sendpage32.exe commandline utility to transfer messages.
To open the Configure the interface to a Messaging Gateway Server window
1. Switch to Designer mode. 2. Select Options|Global configuration from the menu on the main window 3. Select the Alerting tab 4. Check the Send (SMS) Alert messages to Pagers, Cell phones or Handhelds
Page 102 of 180

5. Click the Customize control.
How long does Alerting remain active?An alert triggered by a "No response" or "Threshold exceeded" event remains active as long as the event is pending! Alerting stops if the event is not active anymore (the device is responding again or the threshold is no longer exceeded) OR the event is acknowledged by the network manager on the "Event control" window!
Alerts triggered by "Trap received", "Syslog message received" or "Sensitivity" events (TSS events) are treated slightly different. TSS are so called "One-shot events" and cannot be "pending". Alerting remains active for a customizable period, ranging from 15 to 99 seconds OR until the alert is acknowledged or removed. Use the appropriate controls (checkbox and spin-edit) on the "Customize Alerting window" (select Options|Global configuration from the menu on the main window and choose the Alerting tab) in order to adjust the settings of your choice.
Page 103 of 180

Reverse AlertingIf the Enable reverse Alerting checkbox is checked, Alerting is not only performed when an event occurs but also when it clears. If email Alerting is ON, an email is sent when a device goes down AND when it comes up again! If a value exceeds a certain threshold and a script is launched, the same script is launched again when the value drops below the threshold etc..
A default message is e-mailed or spoken if the Enable reverse Alerting checkbox is checked and a pending alert is acknowledged by the network-manager!
Example 2. Sending an email alert message triggered by a Threshold exceeded event.
Note! This example uses the Threshold Shooter created in Example 1 of chapter 5.
This example shows how to set up Alerting by e-mail triggered by a "Threshold exceeded" event. Note that this example can also be used for all other event types.
First step - verify and adjust the Alert table
The Monitor one "Alerter" examines every event that occurs. The Alerter algorithms determine whether to alert for an event by performing a lookup in the Alert-table. The Alert-table is built by multiplying the "Event priority" and the "Class priority" and comparing the result with a Threshold value.
To view the Alert table:
1. Switch to Designer mode. 2. Select Options|Global configuration from the menu on the main window. 3. Select the Alerting tab.
As can be seen from the above snapshot, an alert is generated for an instance of a HP2524 switch, if a threshold exceeds the value 64
Page 104 of 180

When an event occurs for a device from which the entry in the Alert table is left blank, the event is added to the Event list (see Event control window) and also written to the database but no special Alerting is performed!
Second step - Configure e-mail settings
1. Check the Send e-mail alerts checkbox and press the Customize control. The "Customize E-mail alerting" window opens.
2. Enter a sender's Name and Address into the Sender information boxes. If you use more then one
Monitor one NMS, you can use these fields to uniquely identify the Monitor one station that sends the email!
3. Enter the primary SMTP relay host into the Primary SMTP Host box. In the example above, we use an internal SMTP Host as primary and an external SMTP Host as secondary. The internal SMTP relay host requires SASL "LOGIN" authentication, the secondary host does not require authentication. If you only have one SMTP host, use that one as primary and leave the secondary blank.
4. The E-mail formatting box allows you to define how to compose the e-mail’s subject field and body-text. In the example, we have chosen to keep the subject field short and relevant because we use an email to SMS gateway to receive messages on a cellular phone! (see the SMS recipient in the Recipient addresses box)
5. Check the Alert Groups and Recipients pane on the window to verify the currently listed recipients. Eventually click the Add, Modify or Delete Alert Groups and Recipients button to modify the Groups and Recipients database.
6. Send a test through the system by pressing one of the two test buttons.
Page 105 of 180
Chapter 8. The WEB interface
About the Monitor one WEB interfaceA web interface is the most frequently requested of all feature requests that we receive. The main design goal has been to get as close as possible to the look and feel of the native Monitor one interface.
The web interface allows you to browse through the network maps, to view the status of your network at a glance and to execute Table, Graph and Pie and Meter Shooters. Although the html code used for the web pages is kept as simple as possible and is not optimized for a specific web browser in particular, it cannot be guaranteed that all browsers will work fine. The web interface has been tested with Microsoft Internet Explorer version 6 and Mozilla FireFox 1.01
Web-browser requirements:
• The web pages can best be viewed with a resolution of at least 1024x768 pixels. • Support for *.png images
The current version of the web interface only allows you to operate in Operator mode, which means that the web interface cannot be used to make modifications to your network maps or Monitor one system.
Setting up the Monitor one WEB serverThe web interface is disabled by default. Previous versions of Monitor one used an internal web server. In this version Apache 2.0.39 for windows substitutes the old internal webserver. Newer versions of Apache are not supported yet! The Monitor one installation file includes a copy of the installation file of Apache 2.0.39. It is recommended to use the default Apache installation settings! Apache is started automatically as a service after installation.
To set up the Web server and to enable the Monitor one web interface follow the steps described below:
1. Switch to Designer mode. 2. Select Options|Global configuration from the menu on the main window. 3. Select the Web interface tab. 4. The "Web server settings" page appears. See the screenshot below.
Page 106 of 180
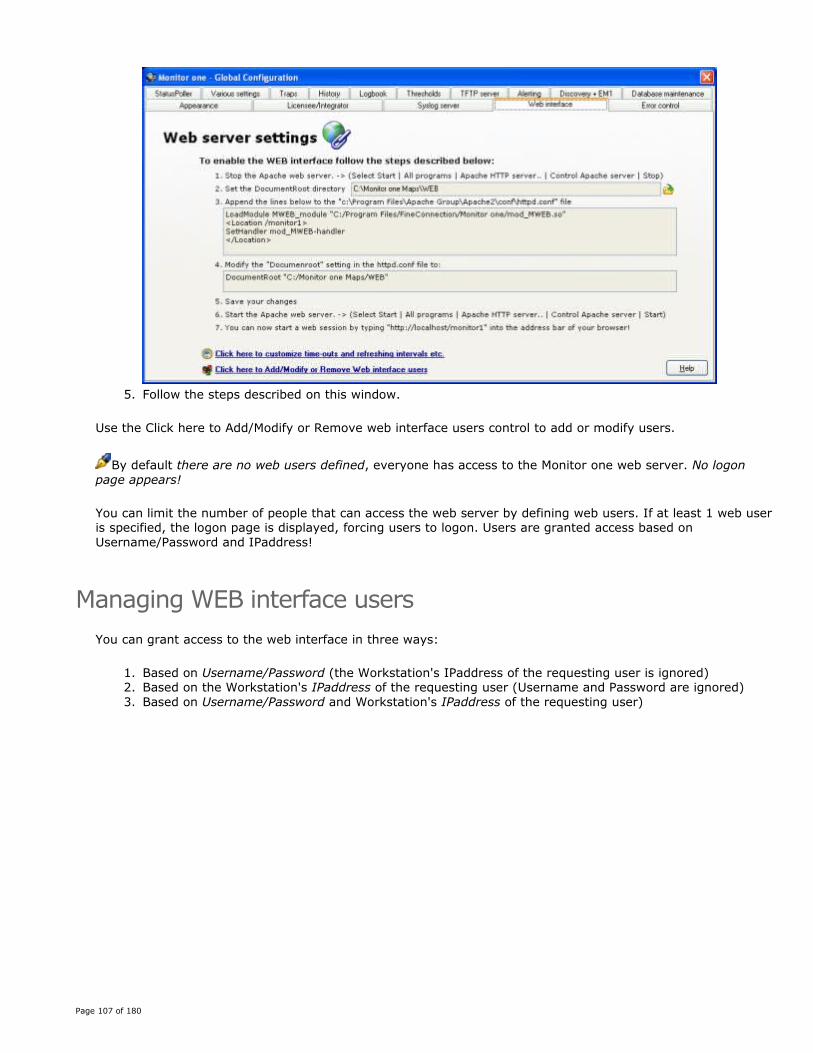
5. Follow the steps described on this window.
Use the Click here to Add/Modify or Remove web interface users control to add or modify users.
By default there are no web users defined, everyone has access to the Monitor one web server. No logon page appears!
You can limit the number of people that can access the web server by defining web users. If at least 1 web user is specified, the logon page is displayed, forcing users to logon. Users are granted access based on Username/Password and IPaddress!
Managing WEB interface usersYou can grant access to the web interface in three ways:
1. Based on Username/Password (the Workstation's IPaddress of the requesting user is ignored) 2. Based on the Workstation's IPaddress of the requesting user (Username and Password are ignored) 3. Based on Username/Password and Workstation's IPaddress of the requesting user)
Page 107 of 180

To add a new web interface user follow these steps
1. Right-click in the Username/Password/IPaddress box and choose Add a new Web user from the popup menu.
2. Select one of the three authorization methods by clicking the appropriate radio-button. 3. Enter - depending on the authorization method – the values for Username/Password/IPaddress, select a
Role and click the Save button.
To remove an existing entry
1. Select the entry to remove by right-clicking it and choose Remove this Web user
To Modify an existing entry
1. Click the entry 2. Make your changes 3. Press Save
Web user roles
The current version supports three different user roles. Viewer, Operator and Designer. In this RC1 release (Release Candidate 1) only the first two mentioned are in effect. The "Designer" role is reserved for future use. In this RC1 release, the "Designer" role and the "Operator" role provide the same rights.
• Users with "Viewer" rights can browse through all maps and can view the status pages but cannot start Shooters.
• Users with "Operator" rights can do all things "Viewers" can and can also start Shooters. • With the current version users with "Designer" rights can do all things "Operators" can.
Page 108 of 180

Accessing the WEB interfaceThe Monitor one web interface can be accessed by starting your browser and typing http://<host or IPaddress>/monitor1 into the address bar. If you have defined (at least one) web users, the web interface will prompt you to logon. If no web users have been defined, the web interface will show the root map of your project.
For all options regarding the use of a different port number or a different interface etc for the web server we refer to the Apache documentation which can be found in the installation directories on your system OR on the web via http://www.apache.org/
Working with the Web interfaceWorking with the Monitor one web interface is easy, straightforward and intuitive. We have put much effort in giving the web interface the same look and feel as the native Monitor one interface. The current version of the web interface only allows you to view all kinds of information and to start Shooters. The web interface cannot be used to draw new network maps or to create new Shooters etc. New features and options will be added to the web interface in future versions.
Verify your browser version! The web interface uses *.png and *.bmp images for presentation and performance reasons (more colors and smaller file size). We have tested the web interface with Microsoft Internet Explorer 6 and Mozilla FireFox 1.01
The image below shows an example of the web interface. For privacy reasons some IP addresses are set to localhost!
Page 109 of 180

Zooming-in on device objects and executing Shooters using the web interface
To zoom-in on a device using the web interface, click it's icon on the network map. The <DeviceName> a closer look web page opens.
Page 110 of 180

The left part of the window shows static information such as: the DeviceName, IPaddress etc and provides hyperlinks for accessing the device using telnet, HTTP or other "Custom menu items". The right side of the page shows the available Shooters for the device.
For performance reasons, the current version of the web interface does not support Graph, Pie and Meter-Shooters with a polling interval of 1 second.
To start a shooter, just click its icon. Be aware that only users with at least Operator rights can start Shooters! Shooter-output is shown in a new window. The current WEB interface version supports Table Shooters and 10 + 100 seconds Graph, Pie and Meter Shooters. Set Shooters are not (yet) supported.
Page 111 of 180

The Table Shooter in "Web look".
Page 112 of 180
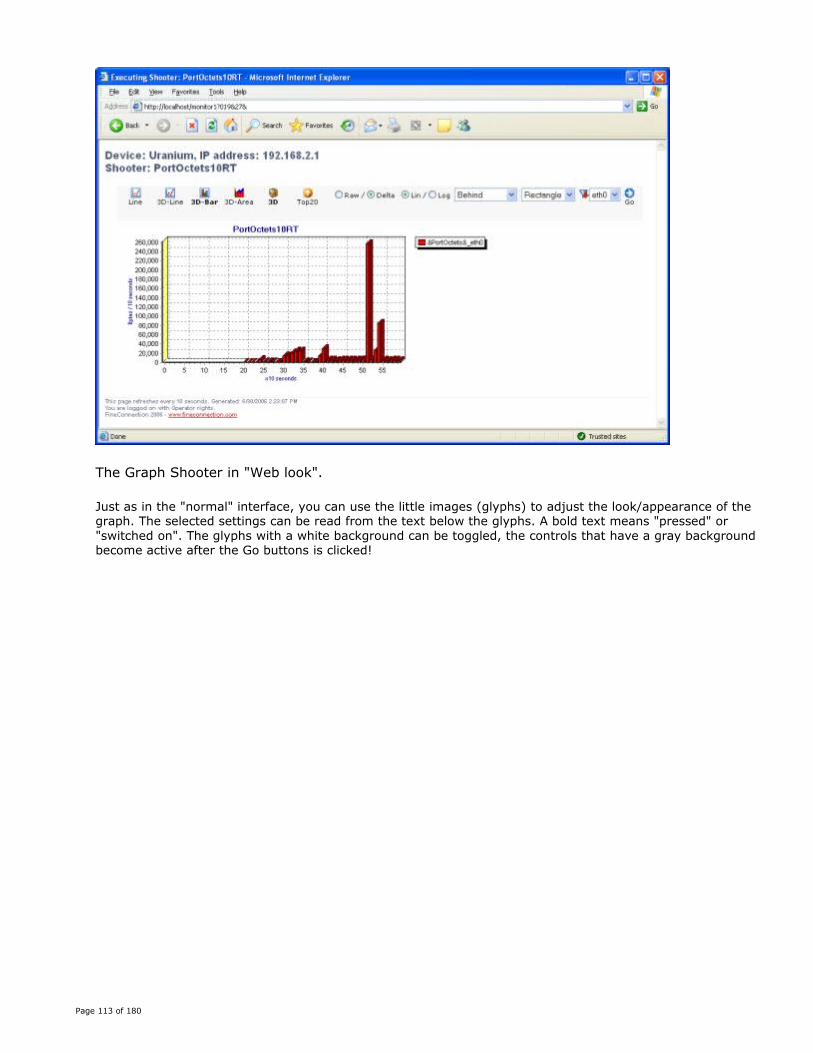
The Graph Shooter in "Web look".
Just as in the "normal" interface, you can use the little images (glyphs) to adjust the look/appearance of the graph. The selected settings can be read from the text below the glyphs. A bold text means "pressed" or "switched on". The glyphs with a white background can be toggled, the controls that have a gray background become active after the Go buttons is clicked!
Page 113 of 180

The Pie Shooter in "Web look".
Page 114 of 180
Chapter 9. Traps, the Monitor one Trap receiver
About trapsA Trap is an unsolicited message sent by an SNMP agent to an SNMP management system when the agent detects that a certain type of event has occurred locally on the managed host. The SNMP management console that receives a trap message is known as a trap destination. For example, a trap message might be sent on a system restart (Cold- or Warm start trap) event or in case of an eminent disk failure.
In order to prevent you from missing important traps due to the receiving of too many unimportant ones, Monitor one provides a sophisticated trap filtering mechanism. A trap filter’s decision is based on 3 different trap properties:
1. the Trap type (Generic, Enterprise specific) 2. the Enterprise (3Com, HP, Cisco, IBM etc..) 3. the Trap number (value)
Trap versionsThe current Monitor one version fully supports decoding, filtering and processing of SNMPv1 and SNMPv2 traps. However, due to the different format of SNMPv2 traps, filtering of SNMPv2 traps slightly differs from filtering of SNMPv1 traps!
Enabling the Trap receiver1. Switch to Designer mode. 2. Select Options|Global configuration from the menu on the main window 3. Select the Traps tab. 4. The Customize Trap management window opens. See the screenshot below.
Page 115 of 180
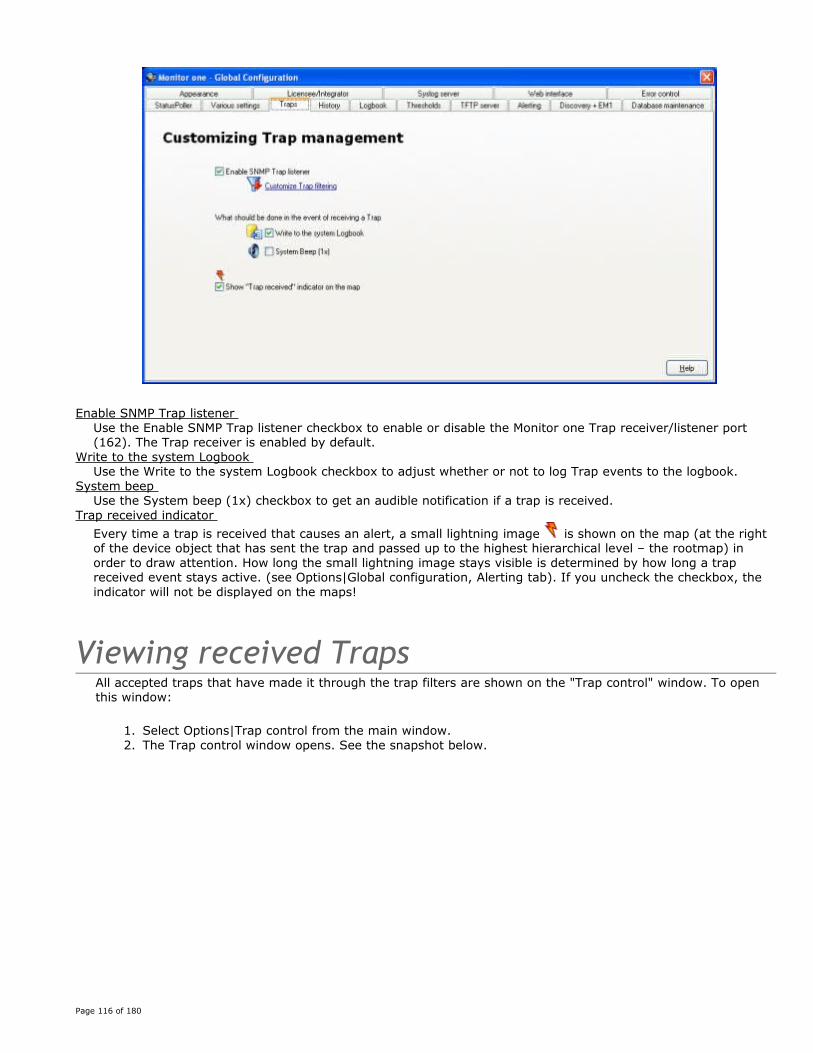
Enable SNMP Trap listener Use the Enable SNMP Trap listener checkbox to enable or disable the Monitor one Trap receiver/listener port (162). The Trap receiver is enabled by default.
Write to the system Logbook Use the Write to the system Logbook checkbox to adjust whether or not to log Trap events to the logbook.
System beep Use the System beep (1x) checkbox to get an audible notification if a trap is received.
Trap received indicator Every time a trap is received that causes an alert, a small lightning image is shown on the map (at the right of the device object that has sent the trap and passed up to the highest hierarchical level – the rootmap) in order to draw attention. How long the small lightning image stays visible is determined by how long a trap received event stays active. (see Options|Global configuration, Alerting tab). If you uncheck the checkbox, the indicator will not be displayed on the maps!
Viewing received TrapsAll accepted traps that have made it through the trap filters are shown on the "Trap control" window. To open this window:
1. Select Options|Trap control from the main window. 2. The Trap control window opens. See the snapshot below.
Page 116 of 180

Panes The Trap control window is divided into two panes. The upper-section of the window shows the list of traps received since Monitor one was started.
Trap translation By clicking one of the entries from the list, the translated and formatted content of the selected trap frame is shown in the Trap properties box.
Trap statistics The Trap filter statistics box at the bottom of the window provides meta information about the number of traps that have been received, blocked and accepted by the filters since Monitor one was started.
Adding a new filtering rule to the Trap filter You can add a new rule to the Trap filters by right-clicking a Trap entry and choosing Block this Trap type from now on. For Trap filter details select Options|Global configuration from the menu on the main window and select the Traps tab.
Monitor one extracts trap descriptions from MIB files. MIB files can be compiled with the Monitor one MIB compiler. It is obvious that Monitor one can only show trap descriptions from traps from which the appropriate MIB files have been compiled!
Defining Trap filters / Adding trap filter rules1. Switch to Designer mode.
Page 117 of 180

2. Select Option|Global configuration from the menu on the main window 3. Select the Traps tab. 4. Click the Customize Trap filtering control. 5. The "Customize Trap filtering" window opens. See the snapshot below.
The "Customize Trap filtering" window contains 4 tabs:
General Filter rules
By default, Monitor one accepts traps from any host. UNCHECK the Accept Traps from any host checkbox to accept only traps from devices that have been added to the network map. The advantage of not-checking this checkbox is of course that you only get traps of "known" devices. The disadvantage is that you could "miss" traps sent by devices that have been added to the network map but that use other IP addresses than the ones specified on the network map! This could be the case when devices have more than one interface and IPaddress (Routers, multi-homed Hosts etc).
Generic Trap filter filter rules (SNMPv1)
See the screenshot below:
Page 118 of 180

The screenshot shows some generic trap filter rules. All Generic traps are accepted except the Authentication failure trap for all enterprises, LinkUp and LinkDown traps received from HP j4813A switches and the coldStart and linkup traps received from Microsoft systems.
Use the "PHASE I" checkboxes to specify which Generic traps to accept or to block regardless of the enterprise. The "PHASE II" filter rules take the enterprise of the received traps into account.
"PHASE II" rules cannot be entered directly into the filtering table above. Monitor one provideds another way to add PHASE II filter rules. By default, all Generic traps that pass through the "PHASE I" filter are shown in the "Trap control" (select Options|Trap control from the main Monitor one window) window. If you are certain that you do not want to receive a specific generic trap any longer, you can right-click the trap in the "Trap control" window and select Block this trap type from now on (Add a new filter rule). A new filter rule (describing the trap you want to block in the future) is added automatically to the PHASE II table!
Enterprise Specific trap filter rules (SNMPv1,SNMPv2).
Page 119 of 180

EnterpriseSpecific Trap filtering slightly differs from Generic Trap filtering!
Use the Enterprise listbox to select an enterprise. The filter rules belonging to the selected Enterprise are shown in the list. New Enterprises and trap descriptions come available when new MIB files are compiled.
If you right-click a filter rule you can choose either Block this Trap type or Accept this Trap type.
Check the Accept unknown EnterpriseSpecific Traps… checkbox to specify what needs to be done in case of receiving a trap for which no MIB information is available.
Just as with Generic Traps, new rules can be added to the set of Enterprise Specific filter rules by right-clicking traps in the "Trap control" window and choosing Block this trap type from now on.
Unblocking traps / Removing Trap filter rulesAll traps that have been blocked since Monitor one was started are kept in a "Blocked Traps" list. You can use this list to "unblock traps" or – in other words – remove the rules that blocked these traps.
To see the Blocked Traps list:
1. Switch to Designer mode. 2. Select Option|Global configuration from the menu on the main window 3. Select the Traps tab. 4. Click the Customize Trap filtering control. 5. Select the Blocked traps tab.
Page 120 of 180

A Trap filter rule can be removed (so that new traps of a certain type will no longer be blocked), by right-clicking an entry from the list and selecting Unblock this trap type (Accept new traps of this type).
How Monitor one Trap filtering exactly worksBelow is a detailed (step-by-step) explanation about how the Trap receiver and its filtering mechanism works.
1. A trap is received. 2. The trap is decoded. If it is an SNMP v1 trap then go to step 3. If it is an SNMPv2 trap then go to step 8. 3. Monitor one determines whether the trap is a "Generic" or an "Enterprise specific" trap. If "Generic trap"
go to Step 4, If "Enterprise Specific trap" go to Step 7. 4. A PHASE-I filter lookup is performed in order to determine whether to accept the trap based on the
value of the Generic trap# field. If the trap is not allowed to pass through the filter, trap statistics are updated and further processing of the trap is stopped ELSE go to Step 5. An example of a rule in this step could be: Block all "Cold start" traps (generic trap 0)
5. A PHASE-II filter lookup is performed to determine whether the trap is accepted based on the values of the Enterprise and trap# fields. If the trap is not allowed to pass through the filter, trap statistics are updated and further processing of the trap is stopped ELSE go to Step 6. An example of a rule in step 5 could be: Block all "Cold start" traps from enterprise "3Com".
6. A database lookup is performed, based on the value of the IPaddress field of the trap in order to determine if the sender of the trap is added to the network map. If not so and only traps from "known" devices are accepted (General filter rule), then trap statistics are updated and further processing of the trap is stopped ELSE
1. the trap is displayed on the "Trap control" window 2. the contents of the trap frame are stored to the database for future use 3. the Alerter is invoked to determine if an alert must be generated!
7. A filter lookup is performed to determine if the trap must be blocked based on the values of the Enterprise and the trap# fields. There are two scenarios: A: If the appropriate entry is found then further processing depends on the Filtering action field. If the trap is not allowed to pass through the
Page 121 of 180
filter, trap statistics are updated and processing of the trap is finished ELSE go to Step 6. B: If no entry is found that matches the trap Enterprise and Trap# fields (it is an "Unknown trap" - the MIB file describing the received trap, has not been compiled yet) further processing of the trap depends on the setting of the Accept unknown Enterprise ... checkbox. If not checked, Trap statistics are updated and processing of the trap is finished ELSE go Step 6.
8. A filter lookup is performed to determine whether the trap must be accepted based on the value of the snmpTrapOID.0 field. If the trap is not allowed to pass through the filter, trap statistics are updated and further processing of the trap is stopped ELSE go to Step 9.
9. A database lookup is performed, based on the value of the sender’s IPaddress in order to determine if this sender is added to the network map. If not so and only traps from "known" devices are accepted (General filter rule), then trap statistics are updated and further processing of the trap is stopped ELSE
1. the trap is displayed on the "Trap control" window 2. the contents of the trap frame are stored to the database for future use 3. the Alerter is invoked to determine if an alert must be generated!
Page 122 of 180

Chapter 10. Discovery and Extensive Monitoring
About Discovery and Extensive MonitoringDiscovery
The Monitor one Discovery utility can be used to scan (sub) networks or IP-ranges to find out which nodes exist. The utility not only discovers IP addresses but also tries to retrieve SNMP data from each discovered IP node to build a knowledgebase of nodes along with their properties. The knowledgebase is used by several Monitor one functions such as: Extensive Monitoring (EM1), NameList lookup, Event control etc.
You can also use the Discovery feature when setting up a new network map. Discovered nodes can be added to the new map! For more information see the topic "Building network maps using IP-nodes found by Discovery" further on in this chapter.
If you want to keep the knowledge base up-to-date, you can schedule Discovery to run periodically! Only with an up-to-date list, Monitor one is able to provide accurate and extended information. With an up-to-date list, MAC –addresses can be mapped to IP-addresses or to device names etc.
Extensive Monitoring (EM1)
Extensive monitoring is a powerful feature that is able to scan network devices (routers, switches, servers and even workstations) for bad interfaces, auto-sensing problems on switch ports, poor performing WAN links etc.
Besides advantages, there is also one important drawback on enabling the two features mentioned; the generated network load and the use of system resources in terms of CPU- and Disc utilization of the Monitor one station. On fast Local Area Networks, the generated traffic should be no problem. On slow WAN links, the generated traffic might have some effect on link performance! It is therefore important to carefully determine IF, and if so, HOW to adjust Discovery and EM1.
Running Discovery and Extensive Monitoring version 1 (EM1) periodically
When you decide to run Discovery and EM1 periodically, pay attention to the following:
• For best Discovery and EM1 results, enable SNMP support on as many network devices as possible and preferably use a standard set of community names.
• If you decide not to draw your complete network in the Monitor one network maps, add at the least the backbone with its core routers and switches and enable EM1.
• If you are managing a WAN with relatively slow and/or expensive network links, do not specify additional IP ranges that are behind those slow lines!
To adjust the Discovery and EM1 settings:
1. Switch to Designer mode. 2. Select Options|Global configuration from the menu on the main window 3. Select the Discovery + EM1 tab
Page 123 of 180
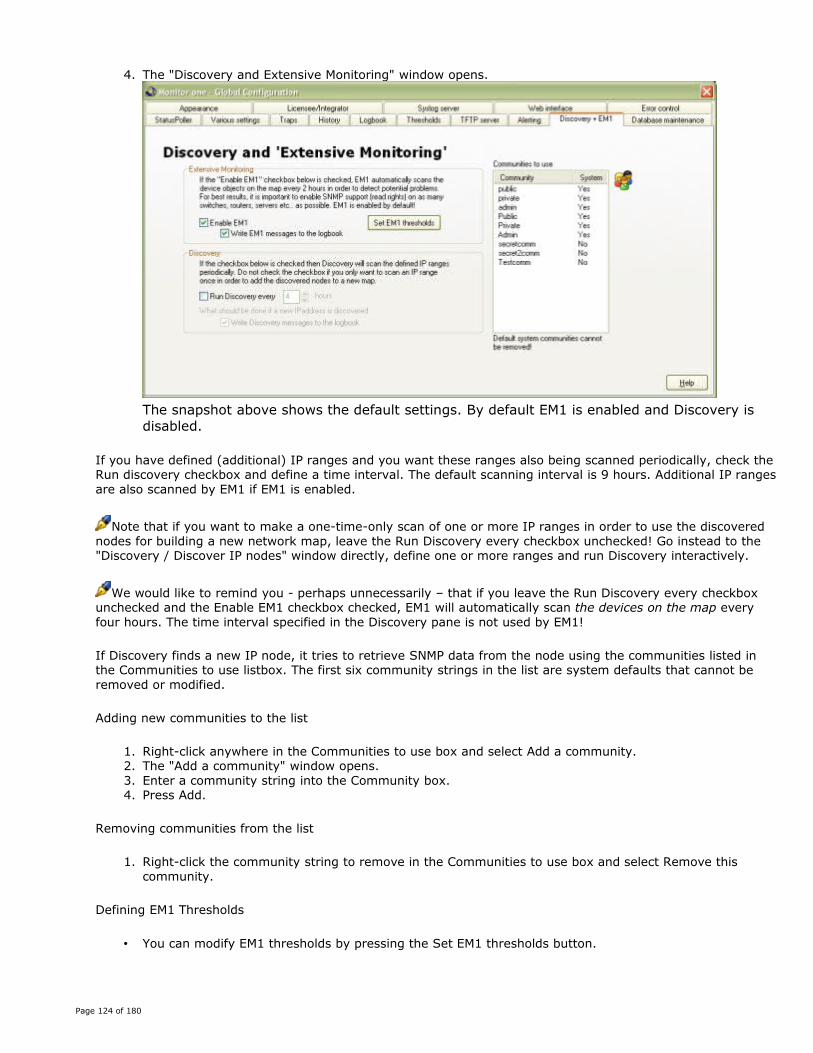
4. The "Discovery and Extensive Monitoring" window opens.
The snapshot above shows the default settings. By default EM1 is enabled and Discovery is disabled.
If you have defined (additional) IP ranges and you want these ranges also being scanned periodically, check the Run discovery checkbox and define a time interval. The default scanning interval is 9 hours. Additional IP ranges are also scanned by EM1 if EM1 is enabled.
Note that if you want to make a one-time-only scan of one or more IP ranges in order to use the discovered nodes for building a new network map, leave the Run Discovery every checkbox unchecked! Go instead to the "Discovery / Discover IP nodes" window directly, define one or more ranges and run Discovery interactively.
We would like to remind you - perhaps unnecessarily – that if you leave the Run Discovery every checkbox unchecked and the Enable EM1 checkbox checked, EM1 will automatically scan the devices on the map every four hours. The time interval specified in the Discovery pane is not used by EM1!
If Discovery finds a new IP node, it tries to retrieve SNMP data from the node using the communities listed in the Communities to use listbox. The first six community strings in the list are system defaults that cannot be removed or modified.
Adding new communities to the list
1. Right-click anywhere in the Communities to use box and select Add a community. 2. The "Add a community" window opens. 3. Enter a community string into the Community box. 4. Press Add.
Removing communities from the list
1. Right-click the community string to remove in the Communities to use box and select Remove this community.
Defining EM1 Thresholds
• You can modify EM1 thresholds by pressing the Set EM1 thresholds button.
Page 124 of 180

Modifying EM1 thresholds is not recommended! The default settings have been determined by extensive testing.
Discovery and Intrusion Detection systemsNote that, if Discovery is running, some intrusion detection systems may start sending alerts in order to inform the network manager that someone is trying to connect to an abnormally high number of hosts with an abnormally high number of different community names, which may indicate that a network attack is under course.
Working with Discovery
Viewing the discovered nodes in a rangeThe list of discovered nodes along with some of their key properties can be viewed by opening the "Discovery / Discover IP Nodes window".
To open this window, select Options|Discovery / Discover IP nodes from the main menu.
To view the discovered nodes in a subnet or IP range, select the Range from the available tabs.
If for a node only its IP address is shown, Monitor one was not able to retrieve any SNMP data from the node.
Page 125 of 180

This might have been caused by:
1. No SNMP agents are installed or running on the node. 2. Discovery was not able to determine the community name for the node. The node’s community name is
not added to the list of communities to use.
If for a node at least the IP address- and the sysObjectID.0 has been retrieved, the node can be linked to-, or associated with an existing Monitor one Class. By associating a node, the node can be queried with SNMP by launching foreground Shooters defined for that particular Class. Without an association, no SNMP data can be retrieved.
To start a Shooter:
1. Right-click an entry from the list 2. Choose either Shooters / Properties or select one of the SpeedShooters from the popupmenu
Associating discovered IP nodes with Monitor one classesThe sysObjectID.0 field uniquely identifies the type of device. It is a vendor specific identifier. Monitor one uses this identifier to link a node with Class. The Association column (see the snapshot above) shows the current associations. It is obvious that nodes that have the string "No association" in their Association field have not been linked yet to a Class. Ensure that the needed Monitor one Classes exist before you start associating nodes.
Adding a new association
1. Right-click the entry of the node you want to make an association for and choose Manage Association(s) 2. The Manage Association(s) window opens. See the screenshot below.
The box labeled Existing associations shows the currently active associations. You can link more than one
Page 126 of 180

sysObjectID.0 to a Monitor one Class but it is recommended to create a different Class for every different type of device.
The boxes labeled Associate and Description show the contents of the sysObjectID.0 and the sysDescr.0 fields of the node you right-clicked.
1. Select one of the available Classes by Double-clicking its icon. 2. When the confirmation box pops up, either confirm or cancel your changes. 3. Click the Close button to close the "Manage Associations" window. 4. The Discovery / Discover IP nodes window now shows the new association.
Removing an association
1. Right-click the entry from the Existing associations box and select Remove this association. 2. When the confirmation box pops up confirm your changes. 3. Use the Close button to close the "Manage Associations" window.
When modifying an association, it is not necessary to remove the existing association first. By double-clicking another icon, Monitor one automatically assumes a modification.
Adding, Modifying or Removing IP rangesIP ranges can be added manually or with help from the range wizard.
Manually adding a new IP Range
1. Press the Add range button on the "Discovery / Discover IP nodes" window 2. The "Add/Modify a Discovery range" window opens. 3. Fill in the form. 4. Press Save to save the new Discovery range. 5. The new range appears as a new tab.
Using the wizard to add one or more new IP ranges
IP Ranges (<= 16 subnet bits) can also be added automatically by using the route information from a central router in a network. The central router must support SNMP! By selecting Options|Range wizard from the menu on the "Discovery / Discover IP nodes" window, the Range wizard window opens, which allows you to collect router information from the central router and use this information to define Ranges that span your entire network automatically.
Removing an IP Range
1. Select the range to Remove by clicking its tab. 2. Press Remove range button. 3. The nodes are removed from the database and from the page.
Modifying an IP Range
1. Select the range to modify by clicking its tab. 2. Press the Modify range button. 3. The Add/Modify Discovery range window opens. 4. Modify one or more range properties and press the Save button.
Page 127 of 180
Discovering an IP rangeIf Discovery is not already running, (check the status bar at the bottom of the page) you can start it by either pressing the Discover selected range or the Discover all ranges button. You can watch the utility’s progress by pressing the Show pollers activity button. Once started, Discovery cannot be paused or stopped!
Building network maps using IP-nodes found by Discovery.The IP nodes discovered by the Discovery utility can be copied to network maps.
Follow the steps described below
1. Switch to Designer mode. 2. Open the "Discovery / Discover IP nodes" window by selecting Options|Discovery / Discover IP nodes
from the menu on the main window. 3. Add one or more ranges that reflect the subnet structure of your network. 4. If the Discovery utility is not already running (started automatically performing a periodic scan) you can
start the utility EITHER for each individual range one after another by selecting the range and pressing the Discover selected Range button OR by pressing the Discover all Ranges button.
5. If the Discovery utility has finished (The statusbar at the bottom of the page shows: "Discovery is idle"), verify and eventually add or modify the Class associations.
6. Select the nodes to copy (multiple items in the list can be selected at the same time), right-click the selected nodes and select Copy node(s) from the popupmenu.
7. Go to the map to which you want to add the nodes, right-click anywhere on the map and choose Paste node(s).
8. The nodes are added to the map.
If a node with the same name already exists on the map, an index between parentheses is appended to node’s name.
Only nodes that are associated with existing Monitor one Classes can be copied and pasted.
Working with Extensive Monitoring (EM1)
How does EM1 work?EM1 tries to collect a specific number of SNMP MIB fields from each IP node being scanned, performs a number of calculations in which also the scan results of the previous run are involved and compares the results with a threshold. It is obvious that EM1 needs to run at least twice to produce any results!
If an EM1 threshold is exceeded, EM1 informs the network manager by adding a message to the Event control window and the logbook.
EM1 messages do not generate alerts!
Which potential problems is EM1 able to find• Many collisions on a switch port! A switch port does not "stop collisions", but it is the barrier of a
collision domain. Even with a single device plugged into a switch port, if both are set to half-duplex than
Page 128 of 180

collisions can and will happen. Therefore, collisions are not indicitive that a hub is present, but instead indicates that either half-duplex communications are present and normal operation is occurring or a duplex-mismatch is present (auto-sensing problem!)
• Inbound/Outbound Error-rate too high! High error rates can lead to bad performance, connectivity problems and slow or lost connections etc. It can cause latency in data transmission.
• Inbound/Outbound Discard rate too high! The number of inbound or outbound packets which were chosen to be discarded even though no errors had been detected to prevent their being deliverable to a higher-layer protocol. One possible reason for discarding such a packet could be to free up buffer space. It can obviously cause some latency in data transmission, so the fewer packet discards you have, the better it is.
• Too many tcpRetransmissions The total number of segments retransmitted - that is, the number of TCP segments transmitted containing one or more previously transmitted octets. Too many retransmissions can dramatically decrease host/server performance. The impact of retransmissions on overall network performance is much larger than the impact of for example collisions etc. Collisions are handled on the datalink layer (II) while tcp retransmissions are handled in the transport layer (IV). Healthy Hosts/Servers in a healthy network should have a retransmission rate lower than 0,3% EM1 uses 0,6% as the default retransmission threshold!
• Link Utilization. • Collisions detected on a FULL-DUPLEX switch/bridge port!! If both sides of a link (the switch as well as
the host/server) have set their NICs in full duplex mode then collision detection is disabled and collisions may not occur anymore. If collisions still occur, it is most likely a failing auto-sensing issue.
• Carrier sensing errors • Memory usage problems. Systems supporting the hrStorage branch of the rfc1514 host MIB are scanned
for memory usage. When the amount of Allocated virtual memory exceeds a certain threshold (by default 130% of the installed RAM) an EM1 message is generated.
• Allocated disk space on servers. Systems supporting the hrStorage branch of the rfc1514 host MIB are scanned for Allocated physical disk space. When the amount of Allocated disk space exceeds a certain thresold (by default 90%) an EM1 message is generated.
Extensive Monitoring will be a constantly evolving process. Every future release will do better and more testing.
Viewing EM1 messages1. Select Options|Event control from the menu on the main window. 2. Press the EM1 button at the bottom left corner of the window. 3. The Extensive Monitoring window opens. See the snapshot below.
Page 129 of 180

The EM1 list shows Extensive Monitoring events. Each device on the map is inspected every four hours for potential problems. An unhappy smiley at the beginning of a row indicates a pending EM1 event. A green checkmark indicates that an event has occurred but has cleared!
You can adjust EM1 settings and fine-tune thresholds by selecting Options|Global configuration from the Monitor one control panel and than choosing the Discovery + EM1 tab.
The way EM1 messages are displayed slightly differs from what you would expect! Not the most recent EM1 threshold exceeded event is kept in the list but the event with the highest error percentage (most severe event) is kept in the list!
Page 130 of 180

Chapter 11. Utilities
FinePingFinePing is the Monitor one replacement for the standard Ping utility. Besides performing a basic echo request, FinePing provides some handy additional features.
FinePing can be started in three ways:
1. Select Utilities|Ping from the menu on the main window. 2. Right-click a device-object on the map and choose Ping from the popup menu. The FinePing utility will
immediately start performing a "ping" to the device! 3. From the commandline as in the examples: FinePing /H www.mycompany.com or FinePing /H
123.23.1.16 /W 2 /C 5 /M
Using FinePing via its GUIThere are two "Pinging" 'modes' defined:
1. One by one mode. 2. Generator mode.
Page 131 of 180

One by one mode
In One by one mode, FinePing behaves as a normal "Ping" utility. It can be used to verify a network connection to a remote host. To start pinging, enter the IP address or Host name into the Host box, select the Normal ping tab and press the Start button. If you enter a Host name into the Host field, FinePing starts resolving the IP address of the Host specified by performing a Wins or DNS lookup.
The Frame size, Timeout and Use random data controls can be adjusted or modified while pinging. The Frame size is the size of the actual Ethernet frame (ICMP-header + payload). Be aware that this slightly differs from the Microsoft ping command. Microsoft displays the payload size (bytes=x etc).
When testing WAN links, you can get unrealistic statistics if the WAN link uses compression for performance improvement. If the Use random data checkbox is checked, the payload is filled with randomly generated data. In some cases, this will produce statistics that are more realistic.
The Stats box shows a number of fields. The number of Send, Received and Lost frames need no further explanation since they are self-explanatory. RTT stands for "Round Trip Time" and is a running average of the time it takes to get a response from the remote host.
Page 132 of 180

Generator mode
The Generator mode gives you the possibility to use FinePing as a controllable load-generator. The number of ICMP echo request packets sent per second can be controlled by adjusting the value of the Time between packets field. The entered value is the time in milliseconds that is waited before a consecutive ICMP echo request packet is sent after a reply packet is received. If Time between packets = 0 ms, the maximum number of sent packets per second is determined by the speed of the network connection between the two hosts and the CPU speed of the involved devices on both sides.
The Generator mode can be used to test the behavior of a network connection under heavier load.
In Generator mode, the Stats box slightly differs from when being in One by one mode. Instead of Send and Received packets, now the average/sec is calculated and displayed!
Another interesting feature (only enabled in Generator mode) is the possibility to get a rough indication of how well (in terms of variation of RTT delay "Jitter") the network between the two hosts involved, is performing.
More and more delay sensitive applications such as Voice and Video over IP but also Terminal Server applications make use of internet or VPN based networks these days. For best results, delay critical applications should normally only use QOS enabled or "Application aware" networks. For this category of applications the "Jitter rate" is often more important then the speed of the connection!
The FinePing Generator mode can be used to get an indication of the variation in delay (Jitter) on a network link. The RTT deviation against the reference RTT (average RTT) is shown as a pie chart. Some examples:
The image below shows an example of a network connection suffering from Jitter. This connection is not suitable for delay sensitive applications like VOIP etc. The green portion in the pie means: almost half of the echo replies have a RTT deviating more than 20% and less than 40% of the average of 50msec!
The image below shows a better network link. As can be seen from the figure, nearly 95% of the packets have a RTT deviating no more than 20% from the average RTT. This network link should be suitable for Terminal server- or Citrix sessions.
This network link is OK and should be able to carry VOIP as well as Terminal- or Citrix sessions.
Page 133 of 180

Using FinePing on the commandline or in a command fileFinePing can also be started from the commandline. This can be useful if you need the results of a "ping" as the trigger for some action.
FinePing calling syntax: FinePing [/H <Host | IPaddress>] [/W <Timeout>] [/C <Count>] [/M]
/H <value> = The hostname or IPaddress of the remote host to "ping". /W <value> = The timeout in seconds to wait for each reply. /C <value> = The number of echo-requests to send. /M = Run FinePing minimized!
If FinePing closes, it returns an exit-code (for ERRORLEVEL checking) to the operating system reflecting the number of received ECHO-REPY packets. See the example command file below:
@echo off
fineping /H %1 /C 1 /M
if %ERRORLEVEL% EQU 1 goto alive
fineping /H %1 /C 5 /M
if NOT %ERRORLEVEL% EQU 0 goto poor
echo Host is dead.
goto end
:poor
echo Host is alive but has poor responce.
echo Responce was %ERRORLEVEL% out of 5
goto end
:alive
echo Host is alive.
:end
Page 134 of 180
FineTraceFineTrace is the Monitor one replacement for the standard tracert utility. FineTrace does not provide special features but was primarily developed to get the highest possible performance.
FineTrace can be started in three ways:
1. Select Utilities|TraceRoute from the menu on the main window. 2. Right-click a device-object on the map and choose TraceRoute from the menu that pops up. The
FineTrace utility will immediately start tracing the route to the device! 3. From the commandline as in: FineTrace www.mycompany.com or FineTrace 123.23.1.16
The system LogbookYou can use the "MLogbook" application to view the events logfile on disk. For performance reasons (reading from disk) only the events occurred in the last 2 days (48 hours) are shown by default, the most recent event on top. The Logbook window does not automatically refresh when a new event occurs. Use the Refresh button to refresh the window manually.
The MLogbook viewer can be started in two ways:
1. Choose Options|View logbook from the menu on the main window. 2. Right-click a device object on the map and select Show device’s logbook from the popupmenu. (Only
events in which the right-clicked device was involved are shown).
The window text can easily be copied to the clipboard or written to a textfile on disk for further processing in other applications (Microsoft excel etc). If you right-click the window, you can copy the window text to clipboard as tab separated-, html- or CSV formatted text. You can also use the Save to file button to write the window text directly to a formatted file on disk.
Trap and Syslog events often contain long strings of text that don't fit the column width. You can make the entire frame content visible by double-clicking the event OR by right-clicking the event and choosing Show details.
At regular times Monitor one starts a couple of cleanup processes in order to keep the database clean and in a healthy state. You can specify how long events must be kept in the database. Open the Global configuration window and select the Logbook tab (Options|Global configuration, Logbook tab). See the screenshot below
Page 135 of 180

Event messages that are written to the logfile, can also be sent to a syslog server. The format of the syslog message is:
[M1-fwd] Dev=<Device name>, IP=<IP address>, Event=<Event message>
TFTP serverMany devices like routers, switches, terminal servers etc.. use a TFTP server to load their program images. Usually a separate TFTP server is needed to provide this functionality in a network. This is not a very cost effective solution. Monitor one provides in a TFTP server to eliminate the need of a separate server. The Monitor one TFTP server is able to handle multiple TFTP read/write requests concurrently!
This is NOT an FTP Server, TFTP and FTP are different protocols!
Configuring the TFTP server1. Switch to Designer mode. 2. Select Options|Global configuration from the menu on the main window 3. Select the TFTP Server tab
You can specify two different TFTP folders for reading and writing files.
Check the Overwrite existing files checkbox if you allow existing files to be overwritten. If you do not allow existing files to be overwritten, the sender of a file receives an error message.
Viewing TFTP server activityYou can view TFTP server activity by selecting the TFTP server tab on the main window and clicking the Show TFTP server log speedbutton.
Page 136 of 180

MIB Compiler
About compiling MIB files and the default Monitor one MIB treeThe default Monitor one MIB tree is build up of more than 80 precompiled rfc and vendor specific MIB files. In order to build Shooters for new equipment with specific features you sometimes need new MIB files describing these specific features. The default Monitor one MIB tree can be extended by adding new Object Identifiers (OIDs) by compiling new MIB files.
Before you start compiling MIB files pay attention to the following:
• Although definition and syntax of MIB files is well described in RFC's, compiling MIB files can sometimes be hard! We have put considerable effort into making the MIB compiler as flexible and stable as possible but we simply cannot guarantee that every MIB file can be compiled successfully.
• We recommend compiling MIB files in a separate test environment first in order to keep the operational MIB tree orderly and clean.
Compiling new MIB filesTo compile a MIB file
1. Switch to Designer mode. 2. Open the Define <ClassName> Shooters window by right-clicking an arbitrary device object on the map.
Be aware that it is not important which device is right-clicked because the MIB tree is a shared resource!
3. Before the MIB compiler window opens, you are given the possibility to mark the current MIB tree as a restore point.
4. Select Compile new MIB files from the popup menu. 5. The MIB compiler window opens.
6. Use the browse button at the right of the File(s) to compile box to select the MIB file(s) to compile. You
Page 137 of 180

can select multiple files at the same time. This option allows you to compile for example all MIB files of one vendor in one action!
7. Press the Compile button at the bottom of the window to start compiling. 8. If compiling has finished, press the Close button to close the window and to reload the (new and
extended) MIB tree.
Things to keep in mind
• The format of MIB files: You can only compile text formatted MIB files. Microsoft Word files or files in rich text format (containing control characters) cannot be compiled and are ignored.
• Use the default settings! Although a number of options are provided that allow you to control some aspects of the compilation process, we advice to use the default settings (Logging level=2, Intervention=1. No questions). The default setting is the most time consuming of the three, but usually also the most effective.
• Watching compilation progress. Compilation progress is showed in the Progress box of the window. Detailed information is also logged to disk. Use the Logging level box to select the desired logging level. The compilation log file is named "yymmddhhmmss.log" and is saved in the directory: <project-directory>\CompilerLogging\. If this folder does not exist, one is created automatically.
• Changing MIB-node names. Sometimes, as product ranges change, Vendors also change their MIB-node names. Check the Existing MIBNode names can be modified box if you want the nodes from your tree to be modified correspondingly. Checking this box has also a positive effect on the efficiency of the compilation process! This box is checked by default.
• When compilation has finished, the MIB tree automatically reloads and the Compiler window closes.
Compiling multiple MIB files in one actionMIB files can be nested, which means that MIB files can contain links to other MIB files. If the compiler detects a link to another file, it starts compiling that file first. Sometimes the filename mentioned in the MIB file does not match the actual filename on disk. If the compiler detects such a situation, it searches for the filename that matches most closely to the filename in the MIB file and - depending on the selection from the Intervention box - prompts the user for confirmation. If the setting of the Intervention box is "No questions" (the default), the compiler uses an intelligent algorithm to overcome the "loading order" problem.
You should only use the Intervention box to select another approach if the default settings do not perform well. If you select "Suggestions only", the Compiler sometimes pops up with a suggestion dialog box asking for confirmation. You can gain full control by selecting "Full control" from the Intervention box. This setting lets you select all required MIB files manually. This setting is not intended for inexperienced users!
MIB resources on the WWW• http://www.oidview.com/mibs/detail.html • http://www.snmplink.org/ • http://www.somix.com/support/mib_resources.php
Backing-up or Restoring the default MIB treeIt is good practice to save the current MIB tree, before compiling new MIB files. The current MIB tree can be saved as a "Restore point".
There can only be one restore point at a time!
Follow these steps to define a Restore point
Page 138 of 180

1. Switch to Designer mode. 2. Open the "Define <ClassName> Shooters" window by right-clicking an arbitrary device object on the
map (or by selecting Edit|Manage Classes from the menu on the main window and right-clicking a Class icon).
3. Right-click anywhere in the MIB tree box and select MIB tree|Save the current MIB tree as a Restore Point from the popup menu.
Follow these steps to restore the last Restore point.
1. Switch to Designer mode. 2. Open the "Define <ClassName> Shooters" window by right-clicking an arbitrary device object on the
map (or by selecting Edit|Manage Classes from the menu on the main window and right-clicking a Class icon).
3. Right-click anywhere in the MIB tree box and select MIB tree|Restore the last Restore Point from the menu.
4. The MIB tree is reloaded if processing has finished.
Follow these steps to restore the default MIB tree
1. Switch to Designer mode. 2. Open the "Define <ClassName> Shooters" window by right-clicking an arbitrary device object on the
map (or by selecting Edit|Manage Classes from the menu on the main window and right-clicking a Class icon).
3. The factory default MIB tree is restored.
Syslog server
About the Syslog serverBesides traps, devices such as routers, switches or hosts can use syslog messaging to inform the network manager of events that have occurred on them. Syslog messaging was originally used on UNIX systems for application, network and operating-system logging. Many network devices can now also be configured to generate Syslog messages.
The Monitor one Syslog server can be used to receive, log and display Syslog messages from any syslog enabled device. Be aware that Syslog messaging is based on the "unreliable" UDP protocol, which means that delivery of a sent Syslog message at the Monitor one Syslog server can not be guaranteed!
Each Syslog message contains a number of fields such as, a time-stamp field, a field containing the actual message string and a decimal severity level indicator field. The severity level table is shown below.
Page 139 of 180

Numerical code Severity level
0 Emergency: system is unusable
1 Alert: action must be taken immediately
2 Critical: critical conditions
3 Error: error conditions
4 Warning: warning conditions
5 Notice: normal but significant condition
6 Informational: informational messages
7 Debug: debug-level messages
Viewing syslog messages
Syslog messages can be viewed on the Event control window (Select Options|Event control from the menu on the main window and click the Notify button at the bottom of the page).
A syslog message is displayed with the following format: Severity(x) – TS=<DateTime> - <syslog message>.TS stands for Time-Stamp and holds the time of the remote host that sent the message when the event occurred!
Filtering Syslog messagesTo prevent receiving and logging many unimportant syslog messages and missing important, you can set the maximum severity level. Messages with a higher severity level (lower priority!!!!) than the level specified, will be ignored.
By default, Monitor one accepts syslog messages matching the severity setting from any host. UNCHECK the Accept Syslog messages from any host checkbox in order to accept only syslog messages from hosts that have been added to the network map!
Page 140 of 180

Every time a syslog message is received that causes an alert, a small green pencil is shown on the map (at the right of the device object that has sent the message) in order to draw attention. How long the small pencil stays visible is determined by how long a syslog alert stays active. (see Options|Global configuration, Alerting tab). Uncheck the checkbox if you do not want the indicator to be visible on the map!
Syslog messages and alertingThe Syslog server is fully integrated into the Monitor one Alerting mechanism. Follow the steps below to get an alert when a syslog messages is received from a specific host:
1. Enable Syslog server and set the severity level. 2. Add the host from which to accept syslog messages to the map (the host's IP address must match the
IP address in the Syslog message) 3. Verify and/or modify the Alert table (Global configuration window, Alerting tab).
Page 141 of 180

Chapter 12. How to get the best out of monitoring your network with Monitor one
Network monitoring - a six step guide
Step one: visualize your network.The best way of truly understanding how a network functions is to use a network management application that can display a graphical representation of your network.
Avoid management applications that only allow you to monitor network health via lists of detected hardware in your network. These applications only focus on individual devices and do not take the important network relationships into account
Building your network maps as accurately as possible will improve the error tracking process and the speed of solving network problems. It will also help you to locate the trouble spots, and will help you to decide where to add new hardware to introduce fault-tolerance.
Step two: setup Alerting and logging.Before setting up an effective Alerting mechanism, consider the following:
• To check the status of a network device, the device must be able to respond to status requests of a management station. Only manageable equipment will respond to polling. If possible, the amount of unmanageable equipment should be limited, as it will create black spots.
• Not all network equipment is of equal importance. Backbone ATM switches are usually much more important - in terms of impact for continuity in case of failure - than for example a terminal server or printer.
• In general, network managers want to be informed about major network events such as a power failure of a backbone switch or a crash of the corporate mail-server. A non-functioning printer is less important and can wait - especially when Alerting is performed via a pager or mobile phone during the weekends.
• Network managers should only be alerted once about the same failure. The management application should be able to evaluate the event stream to pinpoint the root cause of the failure and prevent superfluous and incorrect alerting.
• To provide this level of alerting, use a management application that allows you to assign different priority levels to different types of equipment and one that also includes a suitable Error Control feature to provide the intelligent alerting.
• An often-encountered negative side-effect of intelligent Alerting is that sometimes not only incorrect and superfluous, but also less important events will be hidden. Less important events are events that do not require immediate action but are nevertheless important since they can indicate potential problems. So, pay also attention to these events, enable logging and check them regularly.
Step three: collect historic information for baselining and trending purposes.
Baselining is a broad term for any analysis method that compares changes in actual data against a baseline.
Page 142 of 180

The most common use of baselining is as a tool in performance management for trending analysis - comparing a performance metric to a historical value to find a trend that can be used to estimate future performance or needs.
A second use of baselining is for monitoring network health (watching for changes in problem indicators), which is a proactive form of fault management.
Before you can define thresholds for proactive network problem detection, it is essential to know the normal behavior (baselines) of your network. Determine which information to collect from every different type of device to get a clear picture of its typical behavior. Keep in mind that the collected data is also to be used later to determine threshold values!
Collecting historic data also allows you to trace back why and when a problem occurred in the past, and why and when it may happen again in the future!
Historic information combined with well-defined threshold monitoring are essentials that help you to discover potential problems before they actually occur.
Step four: set up threshold monitoring.In general, you can rely on two different approaches to monitor network health, or specifically, to monitor the individual devices that form the network.
Health monitoring by polling usually requires a management application that can read individual SNMP MIB fields of a network device, and can check these values against known baseline values to determine whether there is a potential problem. You can also rely on the trap mechanism however polling is preferable. If network connectivity is lost, polling will reveal this failure. While a device does send traps when experiencing problems there is no guarantee that a trap will be delivered to the monitoring station in case of serious network troubles.
The network traffic generated by polling is limited. Depending on your needs you can define polling periods ranging from 1 minute to 1 hour. For example: 1000 threshold data reads based on a 10 minutes time period will result in 2000/600 = 4 frames per second! - Even a 9k6 dial-up line can be used!
When you start defining thresholds, first concentrate on thresholds that will monitor known problems.
If a server is frequently suffering from hanging processes, define a threshold that detects 100% CPU utilization within - for example - a 15 minutes time-period. Define specific thresholds for every different type of equipment and activate them by default. Define thresholds to monitor all or at least the most important - services of the monitored equipment. For a file server for example - define thresholds that keep track of free disk space, disk failures, server temperature and network interface error rates, for uninterruptible power supplies define thresholds to trigger power failures and monitor output power load.
Step five: define real-time graphing.While collected historic data can tell you how your network will behave and what can be expected of it in terms of performance and reliability, real-time statistics are important for allowing you to perform detailed in-depth analysis.To better serve your users you also need real-time tables and graphs, which allow you to immediately respond to basic user requests.
Monitor one allows you to create and save Shooters (SNMP request definition) to show real-time tables, graphs or Meters.To view these statistics, you only need to execute the appropriate Shooter.
Define essential real-time graphs and tables, and keep them at hand for immediate assistance in case you need them. Before building a new shooter, always ask yourself what type of user question it can help you giving the
Page 143 of 180

answer.
Define Shooters that help you answer the most frequently asked questions. Use standards: for every SNMP enabled device, define - for example - at least definition files to retrieve the mib-2 system and ifEntry tables. For routers add also definition files to read the ipRouteEntry table and to graphically display the traffic/load per interface. For application servers create files to show CPU utilization, user sessions, disk usage, buffer usage etc.
Step six: stay alert!• Never lay back! Downtime is not an option! • Check your log files every day. • Pay attention to changing circumstances. • Try to interpret and to explain repeating events. • Fine-tune threshold settings, but do not change them every day!
ChecklistMonitor one provides a number of powerful features and utilities to retrieve as much information as possible from your network in order to keep track of its performance and health.
Below you will find a short list of important Monitor one features and functions along with some suggestions that can help you with your day-to-day network monitoring activities.
1. Enable SNMP agents on as many devices in the network as possible. The more agents are installed and enabled the better Monitor one can do its job. It is not necessary to enable the write community, a read-only community is sufficient
2. For best statistics and monitoring results, preferably connect the Monitor one station to the backbone of the network (if possible of course).
3. Create Classes for each different type of network equipment used. 4. Draw/Set up the network maps as factually as possible and do not forget to add the existing links
between them. Do not leave devices "stand alone". 5. Enable Error-control by adding the "ThisStation" object to the network map. 6. Enable sensitivity control to discover weak links. 7. Create foreground Shooters and use the SpeedShooter option for the most frequently used ones. 8. Define and run SnipMon Shooters to view the most important sanity indicators (such as CPU utilization,
disk-usage etc) instantly. 9. Create Threshold Shooters to monitor temperature, fan-status, CPU utilization, power supply etc.. and
activate these Shooters by default. 10.Create History Shooters in order to collect historic data for trending and long-term analysis purposes. 11.Enable the Syslog server in order to receive important syslog messages from hosts and servers. 12.Enable the Trap receiver and adjust trap filtering in order not to miss important traps about disk
failures, overheated power supplies or security violations. 13.Define IP ranges that cover your network and run Discovery periodically. 14.Enable Extensive Monitoring (EM1) to be kept informed about malfunctioning network equipment and
failures at the port level. 15.Setup and adjust Alerting.
Page 144 of 180

Appendix A. What you need to know before you start building Shooters.
The following is a brief introduction to the Monitor one Shooter mechanism. It consists of two parts. The first part is a short introduction to SNMP. It describes what SNMP is, what it does and how it works. The second part explains the Monitor one Shooter basics. It explains how it works, what options are available and what you can do to get the best out of it.
Please do not skip ahead in this document! The first part of this document explains the basics of SNMP and may be boring. However, if you do not understand the basics, the examples will not be as meaningful to you.
Part 1. SNMP
SNMP key termsSNMP
Simple Network Management Protocol. A set of standards for communication with devices connected to a TCP/IP network, widely accepted as the de facto standard for network management. Examples of these devices include routers, hubs, servers and switches. Software for managing devices via SNMP is available for every kind of commonly used computer and is often bundled along with the device they are designed to manage
SNMP compatible A device is said to be "SNMP compatible" if it can be monitored and/or controlled using SNMP messages. Devices that are SNMP compatible contain SNMP "agent" software. An SNMP Agent is an application running on the device that performs the operational role of receiving and processing SNMP messages, sending responses to the SNMP manager, and sending traps when an event occurs.
SNMP Manager An SNMP Manager or SNMP Service is an application that performs the operational roles of generating SNMP messages/requests to modify and retrieve management information, and receiving the requested information and trap-event reports that are generated by the SNMP agent. Monitor one is an SNMP Manager!
SNMP Messages The most commonly used SNMP versions are SNMPv1 and SNMPv2. SNMPv1 defines five operation types: GetRequest, GetNextRequest, SetRequest, GetResponse and Trap. SNMPv2 defines an additional type: GetBulk. The SNMP agent responds to a received request by sending a GetResponse message. If a predefined condition or an extraordinary event occurs, the SNMP agent can also send a Trap message to the SNMP Manager system. An SNMP message is build upon several fields from which the most important ones are: the operation type and (one or more repeating groups of) an Object identifier string and a value. An Object Identifier string consists of an Object Identifier and an Instance and is used to uniquely identify SNMP agent fields.
Object Identifier (OID) An Object Identifier is the identification value of an object that is defined in a MIB. Object identifiers are arranged in a hierarchical tree structure (MIB tree) that is compliant with Internet standard and that consists of roots and branches. An object identifier is written as a sequence of sub-identifiers, starting with the tree root, in dotted decimal notation. For example, the Cisco branch of the MIB naming tree is expressed as 1.3.6.1.4.1.9
Instance An instance specifies the row in which an object that is part of a table is located. The instance is appended to the object identifier and has a format that is similar to the latter. For objects that are not part of a table, the instance is zero (.0)
MIB A Management Information Base (MIB) is a schema or blueprint that contains the hierarchical order of all of the managed objects. Each managed object has a unique identifier (OID) and includes the type (such as counter, string, gauge, or address), access level (such as read/write), size restrictions, and range information of the object. Below is a snapshot of (a part of) the Monitor one MIB tree.
Page 145 of 180
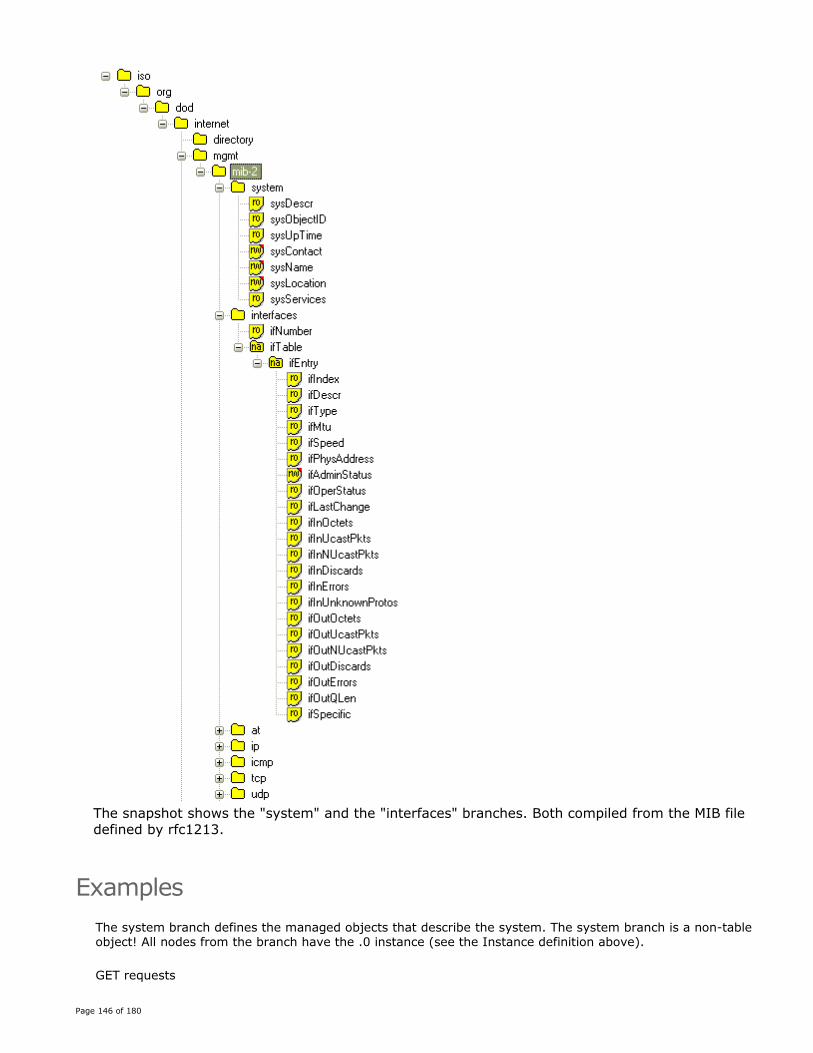
The snapshot shows the "system" and the "interfaces" branches. Both compiled from the MIB file defined by rfc1213.
ExamplesThe system branch defines the managed objects that describe the system. The system branch is a non-table object! All nodes from the branch have the .0 instance (see the Instance definition above).
GET requests
Page 146 of 180

The Object Identifier of the sysDescr object is: 1.3.6.1.2.1.1.1 The value of the sysDescr object of a monitored device can be retrieved by sending an SNMP GET request for "sysDescr.0" (GET 1.3.6.1.2.1.1.1.0, OID=1.3.6.1.2.1.1.1 Instance=.0) to the SNMP agent running on the device.
Also:
• A GET request for sysName.0 (= GET 1.3.6.1.2.1.1.5.0) retrieves the value of the sysName.0 object. • A GET request for sysName.3 returns an an SNMP "NoSuchName error" because sysName.3 does not
exist!
You can specify more than just one Object Identifier string in one request. A request for sysDescr.0, sysName.0 and sysLocation.0 in one SNMP GET request, retrieves all three requested values in one GET response message!
GET-NEXT requests
A successful GET-NEXT operation, returns the value of the object following the Object Identifier String mentioned in the request. For example: a GET-NEXT request for "system" (no Instance!) retrieves the value of the sysDescr.0 object!
Also:
• A GET-NEXT request for sysUptime retrieves the value of the sysUptime.0 object! • A GET-NEXT request for sysUptime.0 retrieves the value of the sysContact.0 object! • A GET-NEXT request for sysServices.0 retrieves the value of the first object of the interfaces table! (see
the image above)
Monitor one provides the TABLE Shooter-type. A TABLE Shooter-type can be used to build and generate GET and GET-NEXT requests. With the "walk" feature of a TABLE Shooter you can for example retrieve all objects of the system branch by only mentioning the "system" object in the request!
Devices often have more than one interface (routers, switches…). The interfaces branch is an example of an SNMP table. An SNMP table consists just as an ordinary table of rows and columns. The objects of the interfaces branch form the table columns. A row-instance (in this case an interface index) specifies the row in which an object is located.
The next examples assume a device with 3 interfaces!
• GET ifDescr.2 (1.3.6.1.2.1.2.2.1.2.2) retrieves the interface description of the second device interface -> OID=1.3.6.1.2.1.2.2.1.2, Instance=.2
• GET ifInErrors.1 (1.3.6.1.2.1.2.2.1.14.1) retrieves the number of inbound errors on the first interface -> OID=1.3.6.1.2.1.2.2.1.14, Instance=.1
• A GET request for ifInOctets.0 returns an SNMP NoSuchName error because row .0 does not exist! • A GET-NEXT request for ifInOctets (no instance) retrieves the value of the ifInOctets.1 object! • A GET-NEXT request for ifInOctets.2 retrieves the value of the ifInOctets.3 object! • A GET-NEXT request for ifInOctets.3 retrieves the value of the ifInUcastPkts.1 object!!!!
Just as with non-table branches, you can add multiple Object Identifier strings in one request. GET ifInErrors.1, ifInErrors.2, ifInErrors.2 retrieves the inbound interface errors of the three interfaces in the system. Be aware that if the remote SNMP agent does not support one of the Object Identifier Strings in the request, the whole request fails! In this case the Error Index field in the response frame indicates the unsupported OID.
The "walk" feature of the Monitor one TABLE Shooter type lets you retrieve the whole interfaces branch in a two dimensional table!
Complex Instances
In the interfaces example above we used a simple Instance as the row-index; .1, .2, .3 etc… However, an
Page 147 of 180

Instance can also be more complex and can even be composed of more than one (sub-)index.
Imagine a switch with 4 blades and 24 ports per blade. A possible way of indexing individual ports could be to take the Blade# and the Port# on the blade as the Instance. The output of a GET-NEXT walk from ifInOctets would be like: ifInOctets.1.1, ifInOctets.1.2 …. ifInOctets.1.24, ifInOctets.2.1 …. ifInOctets.2.24, ifInOctets.3.1 etc
Another example of a complex Instance is the Instance from the ipAddrTable (also defined in rfc1213 - not visible in the image above). A device can have multiple interfaces and IP addresses and even a single interface can have more than one IP address. In this table the Instance is formed by the IP address. The netmask of the interface with IP address 192.168.23.3 can be retrieved by a GET ipAdEntNetMask.192.168.23.3 request.
Part 2. The Monitor one Shooter concept
AboutMonitor one distinguishes from other network monitoring software in its revolutionary new and powerful approach of querying and processing SNMP information!
Shooter
A Shooter is Monitor one terminology for what in other NMS products is called a "sensor" or a "monitor". A Shooter is in fact nothing more or nothing less than an SNMP request definition that can be saved to disk and can be read and started whenever needed. A Shooter is defined at the Class level. Once created, you can use a Shooter to retrieve SNMP data for all devices of the Class the Shooter was defined for.
A Shooter defines which object values to retrieve from the SNMP agent of the device being monitored (OID + Instance), how to process these values (calculations) and how to display them (Table, Pie, Graph, Threshold etc…).
A Shooter is built of two parts; the Shooter body (container) and targets (requests). A Shooter-body has a number of properties that control how the Shooter behaves and how the output is showed.
The most important Shooter properties are:
• Name • The Class (for which it is created) • The type (Table, Graph, Meter, Pie, Threshold, History…) • The polling interval (one shot or each 1, 10, 60, 100, 600 or 1000 seconds)
The most important Target properties:
• Object Identifier • Instance (hard coded as in .1, .9 etc or one of the keywords "At runtime", "All instances")
The user cannot specify whether a GET or a GET-NEXT SNMP operation-type must be used. The operation-type is determined by Monitor one itself by looking at the Target Instances.
ExamplesNow we will look at how Shooters are built. Note that these are just a couple of examples meant to give you just an idea of how it works and that you can use to build your own first simple Shooters. With each example,
Page 148 of 180

we will provide a snapshot of the Shooter configuration and its output.
Example 1. Querying a device’s name and description
As already mentioned above, the values of the sysName and the sysDescr objects of a monitored device can be retrieved by sending an SNMP GET request for "sysName.0" and sysDescr.0 (GET 1.3.6.1.2.1.1.5.0 and 1.3.6.1.2.1.1.1.0) to the SNMP agent running on the device. Both objects are part of the system branch. The system branch is a non-table object so all member objects have the .0 Instance.
The icon with the name "Example_1" represents a Table-type Shooter. This Shooter type can be used to retrieve individual objects or complete SNMP tables with the GET or GET-NEXT SNMP command. We have added the two objects, from which we want to retrieve the values, to the Shooter as Targets. The OID and the Instance are specified separately. When this Shooter is run, Monitor one will check the Target Instances and will determine to compose a GET request. The decision to use a GET request is based on the fact that we "hard-coded" the instances (.0)!
When this request is sent to an SNMP agent, the response (if successfully processed) looks like:
Example 2. Querying the whole system branch
In Example_1 we added two fields of the system branch as Targets to a Table Shooter. Because we hard-coded the Target Instances as .0, Monitor one decided to build an SNMP GET request.
In this example, we will retrieve the whole system branch by just adding the system object (without an Instance) as a Target. Not specifying the Instance forces Monitor one to build a GET-NEXT request!
Page 149 of 180

As you can see, there is only one target: system. The Instance has been omitted. Because of this, Monitor one builds a "GET-NEXT system" request.
The output looks like:
This needs some clarification. From part 1 we learned that a successful GET-NEXT request only returns the value of the object following the one mentioned in the request! The Target in this example is "system". The first object following "system" is sysDescr.0! What we see in the example is that the whole system branch is retrieved!
The cause of this is in the fact that Monitor one not only uses a GET-NEXT in the request but also performs a walk! It walks through the whole system branch while retrieving all values of all member objects! In a walk, the response OID from the last GET-NEXT request is used as the Target in a new GET-NEXT request. This goes on as long as the response OID is a child/member of the initial Target OID.
Example 3. Querying the whole interfaces branch and showing the values in a simple table.
In Example 3 we will build a Shooter that retrieves all objects of the interfaces branch. Remember, the interfaces branch is a "table" object because devices can have more than one interface! Just as in the previous example, we will add the "parent" object ifEntry of all child objects as the Target and we will omit the Instance.
Page 150 of 180

and the output looks like:
As you can see, the device responding to the requests has two interfaces: the loopback interface and the network interface. All values are shown in a list (not a table with rows and columns).
Example 4. Querying all ifInOctets and ifOutOctets fields from the interfaces branch and showing the values in a multicolumn Table (rows and columns).
Telling Monitor one that we want to see all retrieved data in a real table is quite simple. We just need a little trick.
Page 151 of 180
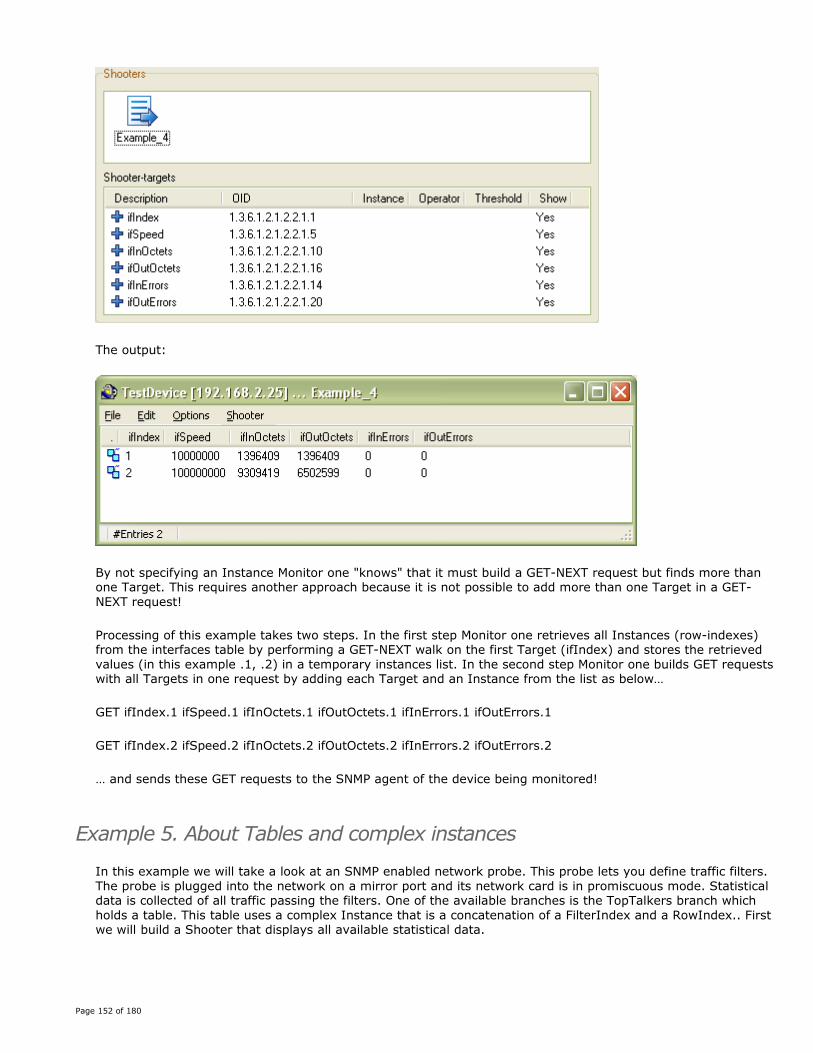
The output:
By not specifying an Instance Monitor one "knows" that it must build a GET-NEXT request but finds more than one Target. This requires another approach because it is not possible to add more than one Target in a GET-NEXT request!
Processing of this example takes two steps. In the first step Monitor one retrieves all Instances (row-indexes) from the interfaces table by performing a GET-NEXT walk on the first Target (ifIndex) and stores the retrieved values (in this example .1, .2) in a temporary instances list. In the second step Monitor one builds GET requests with all Targets in one request by adding each Target and an Instance from the list as below…
GET ifIndex.1 ifSpeed.1 ifInOctets.1 ifOutOctets.1 ifInErrors.1 ifOutErrors.1
GET ifIndex.2 ifSpeed.2 ifInOctets.2 ifOutOctets.2 ifInErrors.2 ifOutErrors.2
… and sends these GET requests to the SNMP agent of the device being monitored!
Example 5. About Tables and complex instances
In this example we will take a look at an SNMP enabled network probe. This probe lets you define traffic filters. The probe is plugged into the network on a mirror port and its network card is in promiscuous mode. Statistical data is collected of all traffic passing the filters. One of the available branches is the TopTalkers branch which holds a table. This table uses a complex Instance that is a concatenation of a FilterIndex and a RowIndex.. First we will build a Shooter that displays all available statistical data.
Page 152 of 180
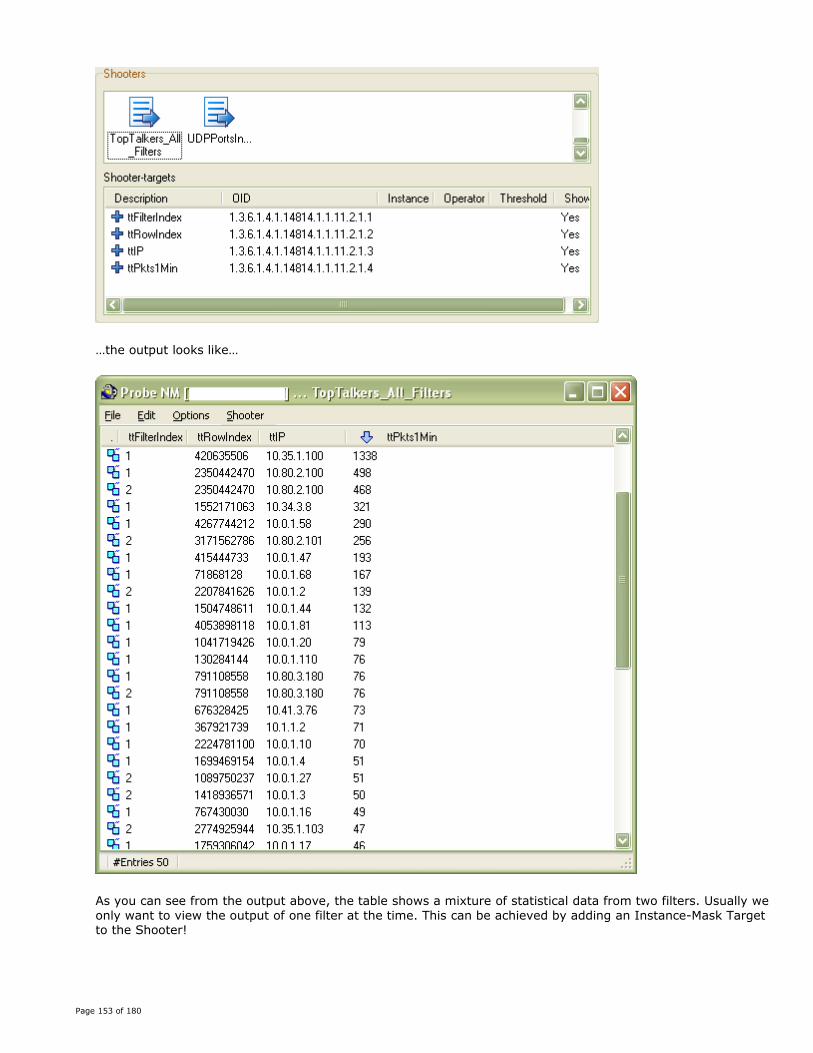
…the output looks like…
As you can see from the output above, the table shows a mixture of statistical data from two filters. Usually we only want to view the output of one filter at the time. This can be achieved by adding an Instance-Mask Target to the Shooter!
Page 153 of 180

As you can see the Description and the OID of the target is "&IM=RT.-.-". The first part of the Target "&IM=" is just a keyword that Monitor one recognizes as an Instance-Mask. The actual Mask is "RT.-.-". An Instance Mask can be used for Instances composed of up to three fields. The characters RT stand for: "the Instance is specified at Runtime" meaning that when the Shooter is run, the user is given the possibility to select the desired Instances from a list of possible ones.
Other possible Instance-Mask could be:
• "2.-.-" (Shows only filter2 data) • "-.2.-" (Shows only the second row of all filters) • "-,RT,-" (Prompts you to select a row at runtime and than shows this row of all filters)
The new output looks like:
As you can see, we selected the second filter from the Instance-Mask control!
Page 154 of 180

Example 6. A simple Graph Shooter that retrieves the incoming and outgoing bytes per second of the second interface of a host.
Building Graph Shooters is just as straightforward as building Tables, although a bit more tedious because there are more options available. The images below show the setup and the output of a Graph Shooter with a 1 second polling interval (see the cipher in the upper left corner of the image), two Targets and "hard-coded" Instances.
… and the output looks like...
Example 7. Using the formula option in a Graph Shooter.
The graph of example 6 shows two bar series, ifInOctets.2 and ifOutOctets.2. Sometimes you may want to process the data before displaying the results. Monitor one provides the "Formula" option which allows you to specify a function to process the retrieved values. A formula is added (just like the Instance-Mask from example 5) as a special Target. In this example, we will add the values of ifInOctets.2 and ifOutOctets.2 and display the result in Kbytes/s.
Page 155 of 180

The Shooter configuration…
In this example, we are only interested in the output of the formula. We are not interested in the individual values of ifInOctets.2 and ifOutOctets. That’s why we have changed the values of the "Show" fields of the first two Targets to "No".
As you can see, the name of the third Target is "Formula1". The ampersand indicates that it is a special Target, not an OID (all special targets start with the ampersand character). If the formula row is right-clicked, you can see how the Formula looks…
There is neither a limitation on the complexity of the formula, nor on the length of the formula string. You can use the operators +, -, /, * and you can enter positive integer values! You can add up to 10 formulas per Graph. "LoadPort2" is the name of the function result. This string appears as legend text in the Graph.
Finally the output…
Page 156 of 180

As you can see, not only the Graphs series have changed but also the Y-axis text. The X-axis text is not automatically adjusted. We did it by hand (not described here)!
Example 8. Graph Shooters and the use of the keywords: "All instances" or "On runtime".
All instances
Sometimes it can be very handy (to get a clear picture or for trouble-shooting reasons etc) to see the traffic on all ports of a switch, router or a host in one Graph. This can be accomplished by specifying the keyword "All instances" as the Target Instance. The next example shows how it is done. We will not only use the "All instances" keyword, but we will also use the formula from the previous example.
The Shooter setup…
The formula…
Page 157 of 180

…and the output…
From the last snapshot, we can see that device "TestDevice" has 7 ports (interfaces). By default, the Graph series legend text for each interface is composed of the Formula’s Result name and the interface’s Instance. In example 9 we will demonstrate how the legend text can be modified to a more user friendly and more meaningful one.
On runtime
The counterpart of the "All instances" option for Instances is the "On runtime" option. The "All instances" option has been designed to provide the best possible way to get a top-view or a first impression. The "All instances"
Page 158 of 180

option can give you the answer on questions like; Are there switch or router ports that behave abnormally? In addition, if so, which ones do?
The "On runtime" option provides a way to zoom-in on a specific Instance (port). It provides a listbox with all available Instances and lets you select one to zoom-in on. We will now replace the "All instances" keyword by the "On runtime" keyword.
The Shooter configuration changes to…
… and the output …
As you can see, we selected Instance .3 from the listbox.
A little note on the difference between the "On runtime" (OR) option and the "Instance Mask" (IM) option (demonstrated in example 5).
Although they may look the same, they work very differently. The IM option can only be used in conjunction with the "All instances" keyword and operates on a set of complex Instances. It analyses each individual
Page 159 of 180

complex Instance of the set and compares it with the specified mask. The result is a subset of the original one with usually more than one item. The resulting Graph displays consequently usually also more than one series.
Just as with an IM, the input for the OR option is a set of (simple or complex) Instances. The OR option does not analyze each Instance, it just adds them to a listbox and asks the user to make a choice. The user can only select just one Instance!
Example 9. The Alternate Legend option
The "Alternate Legend" option allows you to assign an arbitrary object (from the same branch as where all other Targets of the Shooter have been chosen from), as the legend for a Graph series. The retrieved value of the object replaces the Instance part of the default legend. In the MIB tree on top of this document, we can see that the ifDescr object (a member of the interfaces branch) provides a meaningful description of an interface. We will now use the "Alternate legend" option and the ifDescr field to improve the legend text. As usual, the "Alternate legend" option can be added to the Shooter as a special Target.
The Shooter setup…
The Description column of the "Alternate legend" row show the name of the object that has been assigned the special role of being part of the new legend text and the OID column shows its object identifier.
The output…
Page 160 of 180

Example 10. Threshold Shooters
A Threshold Shooter polls the SNMP agent of a device periodically in order to retrieve the values of the objects being monitored, eventually performs some calculations and compares the results with defined threshold values. An alert is generated for those objects that exceed the threshold values(s).
In this example, we will first build a Threshold Shooter that monitors the inbound traffic on the second interface of a Linux host and generates a "Threshold exceeded" event if it exceeds 1,000,000 bytes in 10 seconds (=100,000 bytes/s)
The Shooter configuration looks like…
As you can see from the image, a Threshold Shooter is represented by a yellow triangle. The number (10) in the upper left corner indicates the poling interval. The instance is of the type "hard-coded " and also the operator and the threshold value speak for themselves. However, there is one important thing left that is not shown in
Page 161 of 180

this image and that is how the retrieved values of the ifInOctets.2 object should be processes.
This picture shows a snapshot of the window that is used to define targets. Pay special attention to the Raw/Delta control. We have checked the "Delta" radiobutton. The Raw/Delta control is used to indicate how the retrieved values must be processed. If "Raw" is selected then the Raw value is compared with the threshold value. If "Delta" is selected, the difference is computed between the last value and the previous value and the result is compared with the threshold value. From the MIB tree we learn (not shown here) that the syntax of the ifInOctets object is COUNTER. A counter is a 32 or 64 bits unsigned integer that simply counts the number of inbound bytes. It should now be clear why we compare the Delta (and not the Raw counter value) with the threshold value!
We will now slightly modify the Threshold Shooter configuration so that we first compute the total traffic (in- and outbound) per interface for all interfaces of the Linux server and compare the results with the threshold value.
The Shooter configuration…
As you can see, the operator and threshold fields of the first two targets are now left blank. This is because we are not interested in comparing their individual values but the SUM of their values with the threshold. That is why we have also set the "Show" field to false. The use of the "All instances" option makes sure that we retrieve
Page 162 of 180

the desired data of all interfaces and we have added a Formula to compute the sum. From the image, you can also learn that the "threshold part" has moved to the Formula row! Below the snapshot of the Formula window.
The IDFFS ("Is different from first sample") and the HCF ("Has Changed From") operators
IDFFS
With threshold shooters, monitored values are usually compared with predefined values. However, there are situations in which you want to be informed about the change of a monitored value and is the value less important. For example, in critical ISP backbone networks it is important to become informed if the operational status of one of the router’s interfaces has changed with respect to the first sample. Monitor one provides the special IDFFS operator ("Is Different From First Sample") that compares the last retrieved value with the value of the first sample (the first value that was retrieved when the Shooter became active).
This example, we will build a Threshold Shooter (100 seconds polling interval) that monitors the operational status of all interfaces of a switch and generates a message when a change occurs. The operational status of a network interface or port of a switch can be monitored by checking the value of the ifOperStatus field, which is a object of the interfaces branch.
The Shooter configuration
Page 163 of 180
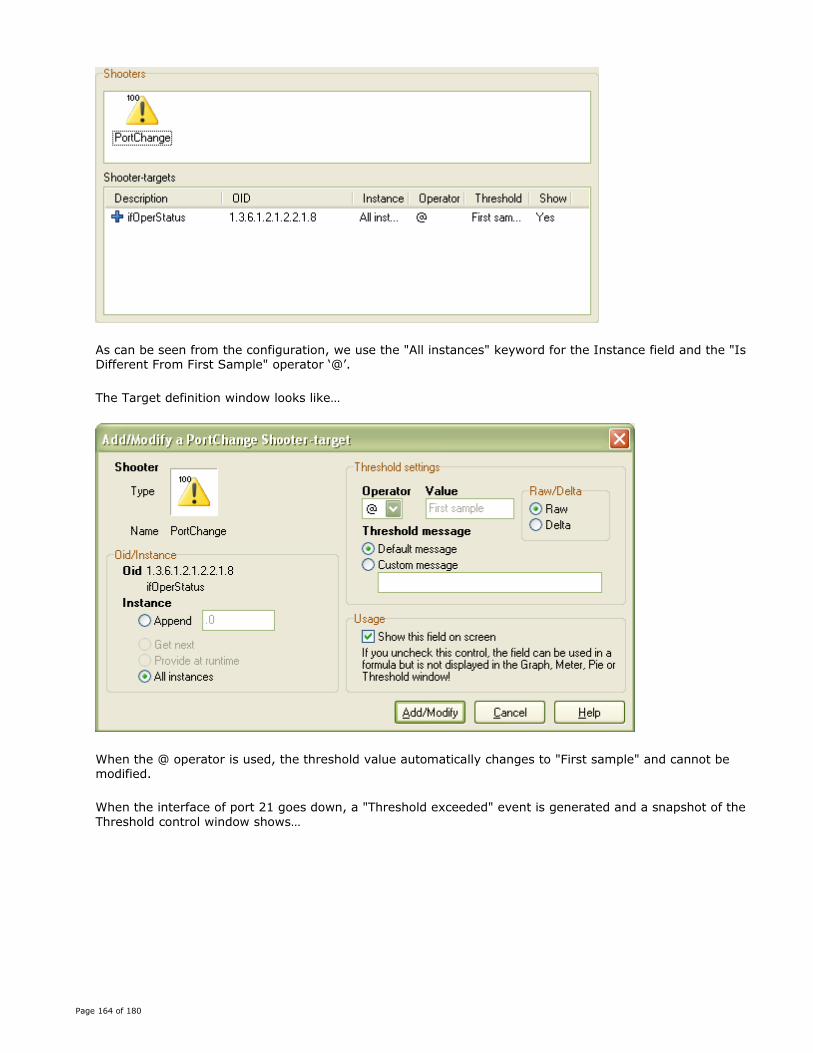
As can be seen from the configuration, we use the "All instances" keyword for the Instance field and the "Is Different From First Sample" operator ‘@’.
The Target definition window looks like…
When the @ operator is used, the threshold value automatically changes to "First sample" and cannot be modified.
When the interface of port 21 goes down, a "Threshold exceeded" event is generated and a snapshot of the Threshold control window shows…
Page 164 of 180

In this case, the operational status of port .21 of the switch changed from "UP" to "DOWN". This means that the status of port .21 was "UP" when the Shooter was started!
Be aware that when a port was in the "DOWN" status when the Shooter became active, a "Threshold exceeded" is generated if the status of the port changes to "UP"!!!!
HCF
A variation on the IDFFS operator is the HCF ("Has Changed From") operator. The HCF operator compares retrieved values with the specified threshold value and generates a "Threshold exceeded event" when the value changes from the threshold value to another value.
The HCF operator is ideal for health monitoring!
Example 11. Special Formula options for SnipMon Shooters.
SnipMon Shooters are normal Shooters that show their output as small images below a device icon on the network map. They are especially useful if you want to have important or critical device information always directly at hand. There are two different SnipMon types: a SnipMon Gauge and a SnipMon graph. A SnipMon Gauge (a small meter) for instance, can be used to display CPU or memory utilization, temperature or Used disk space. A SnipMon Graph (a small graph with only one series) is very useful for displaying interface utilization, number of running processes etc.
A common problem with SnipMons is caused by the fact that both types can only display one series. A problem arises if you want to display CPU utilization of a host that has more than one CPU (you can, of course, build separate SnipMons for each CPU but what if a host has 8 or 16 CPUs!). Monitor one provides (in the current version yet only for SnipMons) some additional Formula options. This example demonstrates the use of the SUM and CNT options in Formulas. Below is the Shooter configuration of a SnipMon Gauge that displays the average utilization of all CPUs in a system!
Page 165 of 180

We use the hrProcessorLoad object (which is part of the host branch described in rfc1514) and the "All instances" keyword to ensure that all the data we need is collected. We have also added a Formula from which the configuration is shown in the image below.
Besides the "hard-coded" Target hrProcessorLoad, there are also two "virtual" Targets available (B, C). The variables B and C are so called "Target Macros". There are five different Target Macros available:
1. SUM – computes the sum of all occurrences of the target (OID) attached. 2. AVG – computes the avg of all occurrences of the target (OID) attached. 3. MIN – provides the minimum value of all occurrences of the target (OID) attached. 4. MAX – provides the maximum of all occurrences of the target (OID) attached. 5. CNT – provides the number of Instances.
Target Macros can be used in the Formula as if they were just normal Targets. In the example above, we divided the SUM by the CNT. It would also have worked fine if we had just added and used the AVG Macro! You can add a Target Macro by right-clicking the Target and choosing a Macro.
Page 166 of 180

Example 12. The "Instance Filtering" option for Threshold and History Shooters.
SNMP tables often contain rows that provide information about objects that you are not interested in. If you build Threshold or History Shooters with the "All-instances" keyword, these Shooters also scan or collect data from those rows. As a result you not only get the information you asked for but you also get information that is of no value. The "Instance Filtering" option can be used to limit the number of rows returned to only those of interest. See the screenshot below .
Suppose that you want to build a Threshold Shooter that generates a "Threshold exceeded" event when the amount of allocated space on one (or more) fixed disk(s) of a server exceed(s) 85%. The following screenshots show how to create such a Threshold Shooter
Page 167 of 180

Allocated disk space is calculated by (hrStorageUsed * 100) / hrStorageSize. We are using the "All-instances" keyword because a server can have more than just one fixed disk. From the first table we learn that we're only interested in rows from which the hrStorageType = "1.3.6.1.2.1.25.2.1.4". We'll now add an "Instance Filter" so that only rows that meet this criteria are processed by the Threshold Shooter.
The Shooter configuration now shows
Page 168 of 180
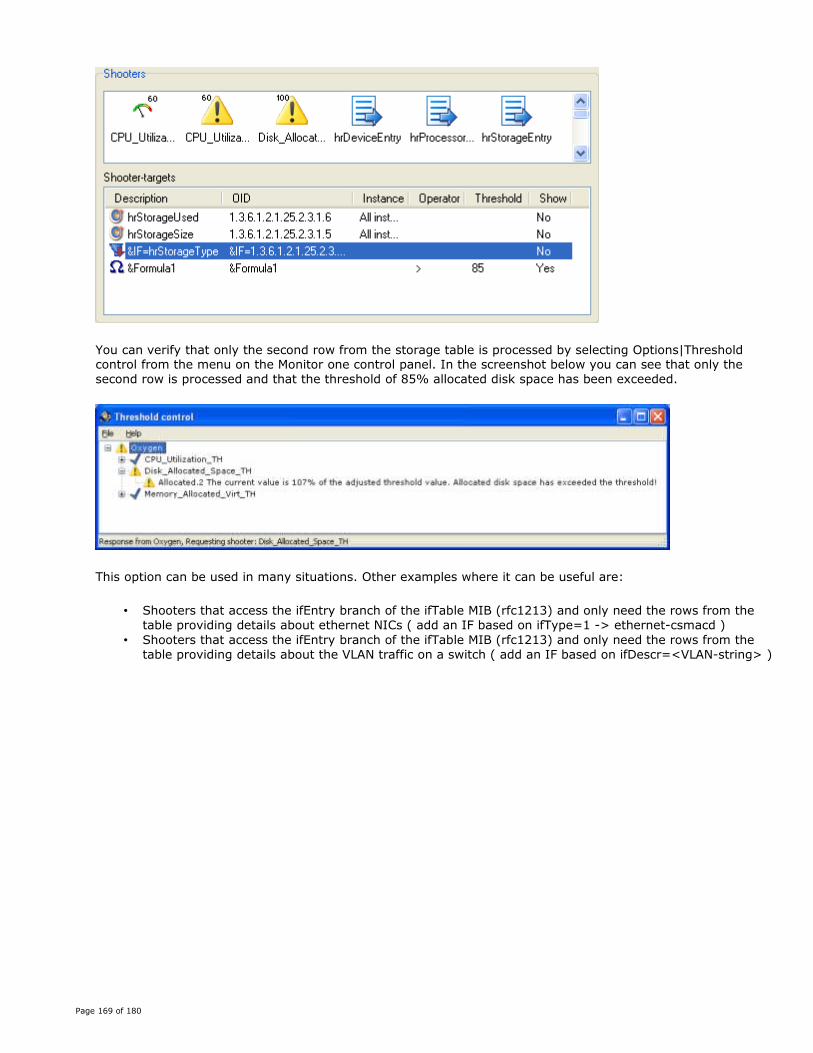
You can verify that only the second row from the storage table is processed by selecting Options|Threshold control from the menu on the Monitor one control panel. In the screenshot below you can see that only the second row is processed and that the threshold of 85% allocated disk space has been exceeded.
This option can be used in many situations. Other examples where it can be useful are:
• Shooters that access the ifEntry branch of the ifTable MIB (rfc1213) and only need the rows from the table providing details about ethernet NICs ( add an IF based on ifType=1 -> ethernet-csmacd )
• Shooters that access the ifEntry branch of the ifTable MIB (rfc1213) and only need the rows from the table providing details about the VLAN traffic on a switch ( add an IF based on ifDescr=<VLAN-string> )
Page 169 of 180

Appendix B. Various program windows
The network map
Adding a new device to the map1. Switch to Designer mode. 2. Right-click somewhere on the map and select Add object|Add a new device- or virtual object. The
Add/Modify a device- or virtual object window opens. 3. Fill out this window and press the Save button. 4. The cursor of the map changes to a drag symbol indicating that a new object can be dropped. Add the
object by pointing to the desired position on the map and click to drop it.
You can change the font and the font size of the object labels by selecting Options|Global configuration from the menu on the Monitor one control panel and then selecting the Appearance tab.
The image for an object is determined at the Class level. You can change an object's image by selecting Edit|Manage classes from the control panel menu, right-clicking the Class and choosing Modify this Class. You can choose an image from the available set or you can create an image yourself!
You can speed up the drawing of your maps by copying/pasting IP nodes found by the Discovery utility. For example, if you want to add all IP nodes within a range of IP addresses (or a subnet), simply create the range in the Discovery window, start the Discovery utility for the range and when it has finished associate (link to) the found nodes with existing Monitor one Classes. After that, select all nodes to copy (multiselect) by choosing Copy nodes from the rightclick menu, go to the map where to add the objects and choose Paste nodes from the map's right-click menu.
Adding a shared medium (thin/thick coax) to the map1. Switch to Designer mode. 2. Right-click somewhere on the map and select Add object|Add a shared medium and select the desired
coax type. 3. The cursor of the network map changes to a drag symbol indicating that a new shared medium can be
dropped. Point and click at the desired position on the network map to drop the object.
Adding Free Text to the map1. Switch to Designer mode. 2. Right-click somewhere on the map and select Add object|Add Free text. The Add Free text window
opens. 3. Enter text into the Text box. You can change the font by pressing the Font button.The default Font is
determined by the settings on the Various tab (Options|Global configuration, Various tab) 4. The cursor of the network map has changed to a drag symbol indicating that the new Free text object
can be dropped. Point and click on the map to add the Text object.
Page 170 of 180

Building hierarchical network map structures by using "Network objects"
1. Switch to Designer mode. 2. Right-click somewhere on the map and select Add object|Add a new device- or virtual object. The
Add/Modify a device- or virtual object window opens. 3. Select the "Network" Class from the Available Classes box by double-clicking its icon. Enter the network
name (max 16 characters, no spaces) into the Name field and press the Save button. 4. The cursor of the (parent) network map has changed to a drag symbol indicating that the new
"Network" object can be dropped. Point to the desired position on the network map and click. 5. Double-click the icon of the new network map. The new network map opens!
Adding links/connections between objects1. Switch to Designer mode. 2. Check the default link type for the map by verifying the status bar at the bottom of the window. To
change the default link type right-click somewhere on the network map and use Set link type to select a different link type. The status bar changes accordingly.
3. Press and hold down the [Ctrl] key and click the first object. The cursor changes to a cross symbol. 4. Press and hold down the [Ctrl] key and click the second object. The link is added.
Free text objects cannot be linked.
Device objects can be linked many times (multi-homing, router interface cards etc..)
A "Network object" can only be linked once!
If you link a device object to a shared medium, a link will be add using the same shared medium "wire" type.
Removing a device, Free text or Shared medium.1. Switch to Designer mode. 2. Right-click the object and select Remove this object.
Removing a network map
Before you can remove a network map, all its objects (except for the network object that points to the parent network map) must be removed first!(Right-click somewhere on the map canvas and choose Remove all objects from the map)
1. Switch to Designer mode. 2. Open the child network map and remove all its objects. 3. Browse to the parent network map and remove the child network icon.
Removing a link between objects1. Switch to Designer mode.
Page 171 of 180

2. Press and hold down the [Ctrl] key and click the first object. 3. Press and hold down the [Ctrl] key and click the object at the other side of the link. 4. A confirmation box pops up. Confirm!
Moving a device, Free text, Shared medium or network object1. Switch to Designer mode. 2. Press and hold down the [Alt] key. 3. Drag the object to its new position. 4. Release all keys and buttons.
To drag a shared medium, point the mouse somewhere in the middle of the object. Pointing the mouse at the right end of the shared medium object will resize it!
Resizing the width of a shared medium object1. Switch to Designer mode. 2. Press and hold down the [Alt] key and click the shared medium at its right end. 3. Resize the object. 4. Release all keys and buttons.
Adding a background image to a map1. Switch to Designer mode. 2. Right-click anywhere on the map and select Add background image. A "Browse for bitmap" dialog
window opens. 3. Select the bitmap file to add as a background and click Open. If the selected bitmap meets with some
requirements the bitmap will appear as background image, otherwise an Informational or an Error message will popup.
An image to add as background must meet with the following requirements: - It must be a bitmap *.bmp file. - The size of the bitmap must be equal to or greater than the size of the network map to cover.
To assign a background image to a map that already has a background image, the existing background must be removed first. Maps with backgrounds cannot be re-sized. If the background image is removed, the form-style of the map will change to "sizable" again. Assigned background images will be saved under a unique name in the project directory.
Removing a background image1. Switch to Designer mode. 2. Right-click anywhere on the map and select Remove background image.
Working with objects on the mapMoving the mouse over a device object
If the mouse is moved over (or held above) a device object on the map, a yellow hint box pops up. This first line of the hint box shows the Name, Class and IPaddress of the object. If a device supports SNMP and the correct
Page 172 of 180

IPaddress and Community name has been assigned, the yellow hint box should have two lines. The information in the second line has been retrieved by an SNMP request, triggered by moving the mouse over the device!
Right-clicking a device object If you right-click a device object on the map the device's right-click menu pops up. An example is shown below.
Shooters/Properties
The Shooters/Properties menu item provides access to a window where you can start Shooters defined for the Class the device belongs to, where you can see detailed device properties and where you can leave notes or memos.
Telnet, HTTP, Desktop, Ping and Traceroute The Telnet, HTTP, Desktop, Ping and Traceroute menu-items are generic and are enabled regardless of whether the device supports the protocols.
Suspend polling/Resume polling Each device object on the map is periodically polled for status. If a device does not respond to these queries, Monitor one assumes the device down and tags it accordingly (red cross). If a device is down for a longer period of time (because it needs maintenance) you can use the Suspend Polling menu-item to stop polling the device. The red cross mark is replaced by a blue checkmark, meaning "Status unknown" and a small spanner (maintenance) appears left from the device. If the device is up and running again, you can use the Resume polling menu-item to resume polling! The small spanner also appears if a device's IP address is invalid or if the polling period is 0 (defined at the Class level)!
Link to all When clicked, the Link to all menu-item draws connection lines from the right-clicked devive object to all other objects on the same map using the selected link-type
Modify/Remove object You can use these menu-items (only enabled in Designer mode) to modify object settings or to remove an
Page 173 of 180
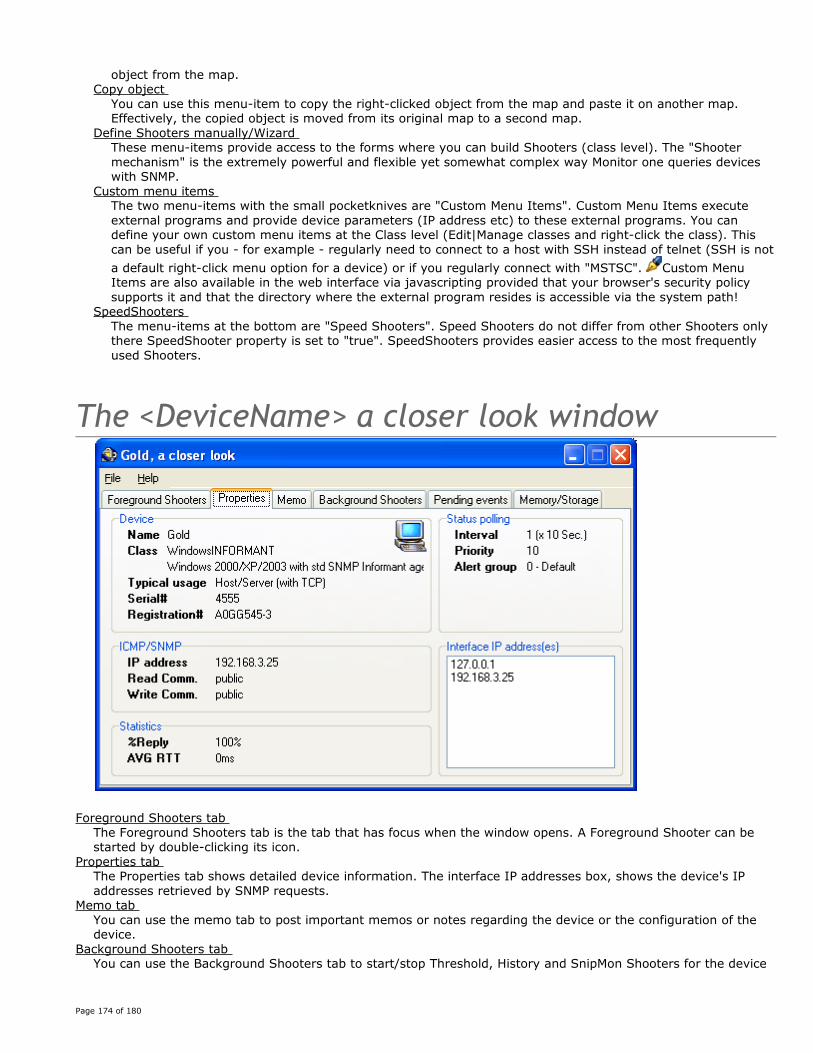
object from the map. Copy object
You can use this menu-item to copy the right-clicked object from the map and paste it on another map. Effectively, the copied object is moved from its original map to a second map.
Define Shooters manually/Wizard These menu-items provide access to the forms where you can build Shooters (class level). The "Shooter mechanism" is the extremely powerful and flexible yet somewhat complex way Monitor one queries devices with SNMP.
Custom menu items The two menu-items with the small pocketknives are "Custom Menu Items". Custom Menu Items execute external programs and provide device parameters (IP address etc) to these external programs. You can define your own custom menu items at the Class level (Edit|Manage classes and right-click the class). This can be useful if you - for example - regularly need to connect to a host with SSH instead of telnet (SSH is not a default right-click menu option for a device) or if you regularly connect with "MSTSC". Custom Menu Items are also available in the web interface via javascripting provided that your browser's security policy supports it and that the directory where the external program resides is accessible via the system path!
SpeedShooters The menu-items at the bottom are "Speed Shooters". Speed Shooters do not differ from other Shooters only there SpeedShooter property is set to "true". SpeedShooters provides easier access to the most frequently used Shooters.
The <DeviceName> a closer look window
Foreground Shooters tab The Foreground Shooters tab is the tab that has focus when the window opens. A Foreground Shooter can be started by double-clicking its icon.
Properties tab The Properties tab shows detailed device information. The interface IP addresses box, shows the device's IP addresses retrieved by SNMP requests.
Memo tab You can use the memo tab to post important memos or notes regarding the device or the configuration of the device.
Background Shooters tab You can use the Background Shooters tab to start/stop Threshold, History and SnipMon Shooters for the device
Page 174 of 180

at the device level. You can also start or stop a Background Shooter for all devices of a certain Class at the Class level in one action. Select Edit|Manage classes from the menu on the Monitor one control panel, right-click the Class and choose Start/Stop Shooters at the Class level. Each time a new device object of the same Class is added to the map, all "class level" Background Shooters are also started automatically for the new device!
Pending events tab The Pending events tab lists the pending events for the device in a tree view structure.
Memory/Storage The Memory/Storage tab provides information about the amount of installed (physical) and allocated memory in systems that support the hrStorage branch of the rfc1514 host MIB. See the screenshot below
The Manage Classes windowAdding, Modifying or Removing Classes
Right-click a Class image and choose the desired option. Starting Shooters at the Class level
You can start or stop Background Shooters for all devices of a certain Class in one action. Right-click the Class and choose Start/Stop Shooters at the Class level. If a new device object belonging to the Class is added to the map, the "Class level" Background Shooters are also started automatically for the new device!
Class Files or Class Packages A Class definition can be saved to a text file on disk, which can be used to share Class definitions between Monitor one stations. Class Packages allow you to first create and extensively test classes in the save environment of a test project, before importing them into an operational project. A Class file contains: The Class definition. The Class properties (Polling interval, Image ..) Shooters and related MIB files Trap definitions
If you try to import a Class file of a Class that already exists in your project, a confirmation box will pop-up asking you whether you want to modify the existing Class.
Customizing the Status pollerStatus polling
The StatusPoller periodically sends an ICMP ping to every pollable device on the network. A device is assumed pollable if it has a valid IP address and if the Class it belongs to has a valid poll period. Each time the
Page 175 of 180

StatusPoller sends a ping request to a device, it waits a certain time (timeout) for the device to respond. After a timeout, the poller either retransmits the request or assumes the device "down" and takes appropriate action. You can fine-tune the StatusPoller by modifying the retransmit and timeout properties. The default settings are "Try 3 times to contact a device and use a timeout of 2 seconds" (3,2). These default parameters are doing fine for most mixed LAN/WAN environments. However, you can modify the settings to (3,3) or (3,4) when you are monitoring a WAN network with low speed connections (International leased lines, low speed internet VPN links etc..) and you're noticing superfluous "No response" events. When monitoring high speed networks you should consider (2,2) or (2,1).
Sensitivity control "Sensitivity control" is a StatusPoller related function that keeps you informed about weak or poor links in a network. Poor links are links that neither completely fail nor work fine. Poor links can be caused by overloaded leased lines, failing hardware, overloaded CPU's, bad connectors, badly implemented protocol software etc... When monitoring a WAN network with low speed internet links or leased lines the setting (7,30) should do fine.
Anomaly ICMP messages Use the '.. anomaly ..' checkbox when you want to be kept informed about anomaly ICMP messages. Anomaly ICMP messages are all ICMP messages other than "Success" or "Timeout" ? "Destination net unreachable", "Destination host unreachable", "Source quench" etc…
Use Shooter information for status polling Normally, Monitor one checks for device status by sending a "ping" periodically. However, there are situations in which you would like to use another protocol, for instance if a device does not reply to a ping echo-request because of a firewall blocking this protocol. You can also use SNMP information for status polling. The only requirement is that you define and run a background Shooter with a 10 seconds polling interval and that you check the Use Shooter information for status polling checkbox.
The Customizing Trap management windowA Trap is an unsolicited message sent by an SNMP agent to an SNMP management system when the agent detects that a certain type of event has occurred locally on the managed host. The SNMP management console that receives a trap message is known as a trap destination. For example, a trap message might be sent on a system restart (Cold- or Warm start trap) event or in case of an eminent disk failure.
Trap filtering Use the Customize Trap Filtering control to define trap filter rules.
Traps and alerting The Trap listener is fully integrated into the Monitor one alerting mechanism. The steps below describe how to get an alert in case a trap is received.
1. Add the device that sends the traps to the network map. The IPaddress in the trap message must match the object's IP address.
2. Verify and/or adjust the Alert table. (Select Options|Global configuration and than the Alerting tab). Trap received indicator
Every time a trap is received that causes an alert, a small lightning image is shown on the map (at the right of the device object that has sent the trap) in order to draw attention. How long the small lightning image stays visible is determined by how long a trap received event stays active. (see Options|Global configuration, Alerting tab). Uncheck the checkbox if you do not want the indicator to be visible on the map!
The Customizing Threshold management windowThreshold exceeded indicator
Every time a threshold exceeds a threshold value and causes an alert, a small alert or warning glyph is shown on the map (at the left of the device that causes the event) in order to draw attention. The glyph stays on the map as long as the threshold event is pending. Uncheck the checkbox if you do not want the indicator to appear on the map!
Page 176 of 180

The Syslog serverSeverity
Each Syslog message contains a number of fields such as, a time-stamp field, a field containing the actual message string and a decimal severity level indicator field. The severity level table is shown below. Numerical code Severity description
0 Emergency: system is unusable
1 Alert: action must be taken immediately
2 Critical: critical conditions
3 Error: error conditions
4 Warning: warning conditions
5 Notice: normal but significant condition
6 Informational: informational messages
7 Debug: debug-level messages
Filtering Syslog messages To prevent receiving and logging many unimportant syslog messages and missing important, you can set the maximum severity level. Messages with a higher severity level (lower priority!!!!) than the level specified, will be ignored. By default, Monitor one accepts syslog messages matching the severity setting from any host. UNCHECK the Accept Syslog messages from any host checkbox to only accept syslog messages from hosts that are added to the network map!
Syslog messages and alerting The Syslog server is fully integrated into the Monitor one alerting mechanism. Follow the steps below to get an alert when a syslog messages is received from a specific host:
1. Enable Syslog server and set the severity level. 2. Add the host from which to accept syslog messages to the map (the host's IP address must match the IP
address in the Syslog message) 3. Verify and/or modify the Alert table (Global configuration window, Alerting tab).
Syslog message indicator Every time a syslog message is received that causes an alert, a small green pencil is shown on the map (at the right of the device object that has sent the message) in order to draw attention. How long the small pencil stays visible is determined by how long a syslog alert stays active. (see Options|Global configuration, Alerting tab). Uncheck the checkbox if you don't want the indicator to be visible on the map!
The Customize Alerting windowDefine when to Alert
Each event that occurs in the network and that is noticed by Monitor one is processed by the "Alerter" in order to determine whether alerts should be sent out. The decision on whether or not to alert is based on a calculation in which the Event-Severity, the Class Priority Level and the Alert-Threshold are involved. The Event Severity level is multiplied by the Class Priority Level and the result is compared against the Alert-threshold. If the result exceeds the threshold, an alert is sent. You can modify the Alert table by using the updown controls of the Event priorities or the Alert threshold. The Class priority can be changed by right-clicking an entry from the table and choosing Increment or Decrement! If you check the Reverse Alerting checkbox, an alert will also be sent if a device "is responding again" or if a threshold "is no longer exceeded".
Define how to alert Supported methods
• Audible alerting
Page 177 of 180

• Alerting by email • Executing a program or script • Sending alerts to a Message gateway (SMS, pager etc…)
Check the checkbox of the desired alerting method and click the corresponding Customize control to setup alerting.
Adjust how long an Alert stays active "No response" and "Threshold exceeded" events
An alert triggered by a 'No response' or Threshold exceeded' event stays active as long as the event is pending. Alerting stops if the event is not pending anymore (the device is responding again or the threshold is no longer exceeded) OR the event is acknowledged by the network manager.
"Trap received", "Syslog message received" and "Sensitivity" events Alerts triggered by these event-types cannot be acknowledged. Alerting stays active for a customizable period, ranging from 20 to 99 seconds
The TFTP server log windowTo configure the TFTP server select Options|Global configuration from the Monitor one main menu and select the TFTP server tab.
The Add/Modify a Shooter windowShooterName
Shooters are created at the Class level. A ShooterName may consist of up to 30 characters (no spaces) and must be unique within the selected Class. The ShooterName of foreground (real-time) Shooters can be modified. The ShooterName of background Shooters can not be modified!
Speedshooter Check the SpeedShooter checkbox to set the SpeedShooter property for a Shooter. SpeedShooters appear as menu-items if a device on the map is right-clicked. Do not set the SpeedShooter property by default. Use it only for the most frequently used Shooters. This will prevent over-configured, badly readable right-click menu's.
Port to use for SNMP data retrieval. Some vendors use alternative ports for their SNMP agents. The (rfc) default SNMP port number is 161. In Monitor one, the default SNMP port to use for SNMP querying is set at the Class level. You can use this control to overrule the Class setting and assign a different port for the Shooter!
ActivePeriod Most networks experience different load during daytime than during nighttime. In order to minimize the chance of incorrect alerting, you can fine-tune threshold monitoring by specifying an active period for a threshold Shooter. When the "from" setting is greater than the "till" setting, an active period during the night is assumed!
Additional Shooter settings Use the tabs/controls from the Additional Shooter settings box to set additional Shooter properties. The controls on the RRD Graph tab are only enabled if a History Shooter is selected! Be aware that there is a big difference in how data is stored into the native Monitor one database and in the RRDTool database. In a Monitor one database, data is stored "as is". RRDTool stores counter values into it's RRA's as "per second" rates!
Abs/Rel You can use the Abs/Rel controls to specify how to process retrieved SNMP values. Select Rel if you're interested in the difference between the last measured value and the previous one. Use Rel if you - for example - want to show the traffic of an interface in bytes/sec in a graph. Use Abs if you're interested in the "raw" data. Things like room temperature, CPU utilization and UPS output power are examples in wich you normally work with raw data values.
The NamelistTo convert IP addresses to Object-names, MAC addresses to IP addresses etc, Monitor one uses an internal name list. The data shown in the list is collected by various Monitor one program modules.
Page 178 of 180

Click on one of the radio buttons to select the lookup method and enter a search-string into the edit box. The description of the edit box changes according to the selected lookup method. A new lookup is performed after each character you type. For performance reasons, the number of resulting entries in the list is limited!
The "Source" column shows from what resource the data was collected. If the data was taken from the map, it shows "Static" or "DevicesOnTheMap". If the information was collected by the Discovery utility, the range in which the node was found is show.
The Define <ClassName> Shooters windowThe Define <ClassName> Shooters window is used to Add, Modify or Remove Shooters.
The reader is expected to have good knowledge of the SNMP protocol and the Monitor one Shooter functionality to get all out of it. For new or inexperienced users it is therefore recommended to read the information provided in Chapter 5 and Appendix A. of this manual. These chapters guide you step-by-step through the process of building Shooters. After that we are confident that you will understand how to use the options provided on this window.
The Add/Modify a <ClassName> Shooter-target window
The Add/Modify a <ClassName> Shooter-target window is used to set the properties for the selected node from the MIB tree that is added to a Shooter as a Shooter-target.
The reader is expected to have good knowledge of the SNMP protocol and the Monitor one Shooter functionality to get all out of it. For new or inexperienced users it is therefore recommended to read the information provided in Chapter 5 and Appendix A. of this manual. These chapters guide you step-by-step through the process of building Shooters. After that we are confident that you will understand how to use the options provided on this window.
The Add/Modify formula: <FormulaName> windowAvailable OIDs
The upper part of the screen shows the table of available SNMP OID's that can be used in the formula. Entering a formula
Use the Formula box to enter the formula in infix notation. Be aware of the following limitations: Allowed operators: * / + - Allowed operands: The characters A..Z from the table, representing the OID's. Only positive integers as constant values are allowed.
Result name The string you enter in the Result name field is used in a Shooter's legend.
The Threshold control windowThe Threshold control window shows all running Threshold Shooters and their status.
Page 179 of 180
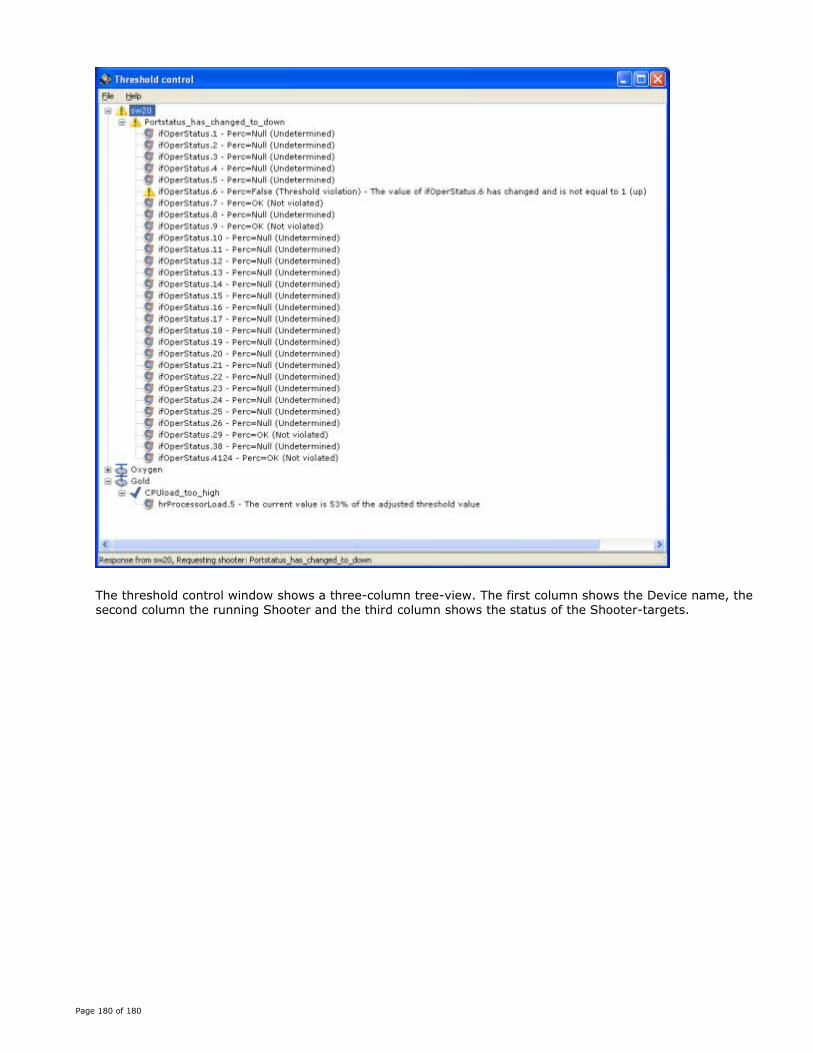
The threshold control window shows a three-column tree-view. The first column shows the Device name, the second column the running Shooter and the third column shows the status of the Shooter-targets.
Page 180 of 180