river flow 2
TRANSCRIPT

8/2/2019 River Flow 2
http://slidepdf.com/reader/full/river-flow-2 1/7
River Flow 2Lab experiment
This experiment was carried out on the 25th of October in the Fluids Lab. We
simulated a river flowing and studied how it performs with the addition of
bridge abutments and water features, the results of which are featured in this
report.
2012
Joe McCormack
Engineering Geology, Civil 4
3rd
Nov 2011
8/2/2019 River Flow 2
http://slidepdf.com/reader/full/river-flow-2 2/7
Joe McCormack River Flow 2 Engineering Geology
2
River Flow 2
This was our second river flow experiment on the Hydrology bench. This time we
were investigating the behaviour of our river with respect to.....
• Bridge abutments
• “Rip Raps”
• Bank erosion
• “Pools & Riffles”
• Bars
• Sediment transportation
The set up for this experiment was the same as River Flow 1. We turned theapparatus on an hour previous to get the river flowing at full capacity. When we
arrived to the lab, the first thing we did was record the flow, which was 2.5
l/min at the inlet and 3.0 l/min at the outlet. Again, similar to the previous
experiment, the difference in flow had to do with the build up of groundwater
which filters through the system, flows down the bench (2% gradient toward
outlet) and exits through the outlet. This process tends to give a small increase
in flow which we read at the outlet.
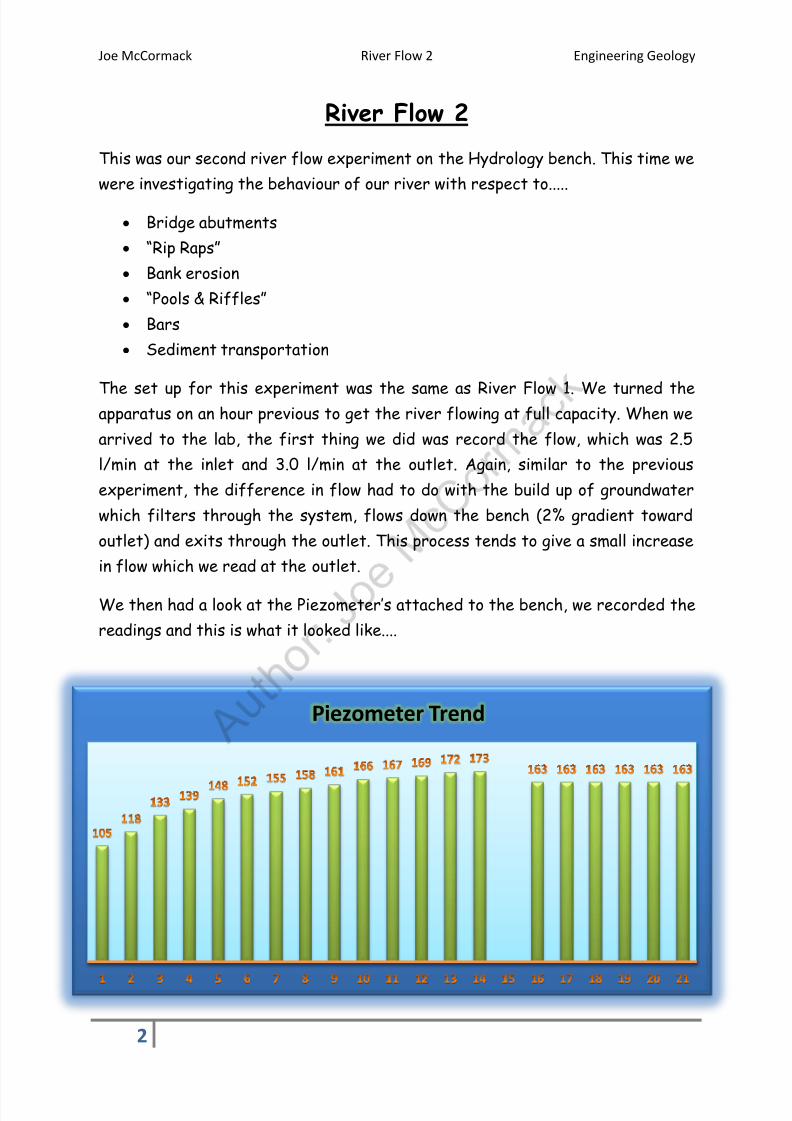
We then had a look at the Piezometer’s attached to the bench, we recorded the
readings and this is what it looked like....
Piezometer Trend

8/2/2019 River Flow 2
http://slidepdf.com/reader/full/river-flow-2 3/7
Joe McCormack River Flow 2 Engineering Geology
3
One thing which was visually evident was the increase in sediment transport
compared with the last experiment. This has probably got to do with the
increase in velocity due to flow rate which was not as forceful as before. We
found ourselves cleaning out sand from the trap beneath the outlet more often.
It was easy enough to spot the sediment transport due to the movement of
black particles in the sand, probably mica which were about 1mm in size.
Another outcome of increased velocity was the greater width in the channel.
This was particularly evident at both the inlet and the outlet, the velocity due
to the flow of the river was obviously causing havoc to the banks of the river
through erosion.
One thing we were going to concentrate more on this time was the developmentof “bars” (an elevated region of sediment) as a result of changing circumstances
further up in the river. However there was a bar formed at the start of the
experiment, with no real evident cause for a bar to form. On consulting our
lecturer and through looking closely at the set up, we discovered a slight curve
in the bank, further up, on the opposite which was causing the sediment to be
guided in the direction of the bar (illustrated below). This is commonly known as
sinuosity in a river, where the watercourse naturally meanders, eroding banks
which can turn up again downstream. The level of this erosion can cause real lifeengineering problems and effect people who occupy houses, business or land
adjoining river banks.

8/2/2019 River Flow 2
http://slidepdf.com/reader/full/river-flow-2 4/7
Joe McCormack River Flow 2 Engineering Geology
4
As seen above we tried to barricade the bank by adding an imitation wall, which
would shield the bank and protect it from further erosion. This did not have the
desired effect as there were obvious gaps between the stones which led to the
flowing water passing through and eroding the bank behind the stones. If this
were a full scale project, the erosion taking place behind the rocks could have
been avoided by grouting the joints. The wall did however deflect the flow to
the other side of the bank which brought new issues to the fore. Thinking we
were going to save the bank on the left, we caused the bank on the right suffer
additional erosion. A significant increase in sediment transportation was
recorded as a result of the wall either side.
We then removed the wall and put
the stones across the river creating
a wall and a “rip rap”. The “rip rap”
consists of stones placed flat on the
river bed. Combined with the wall in
front, the system resulted in a
decrease in the transportation of
sediment. When the flowing water
passed over the stones it meant the
velocity of the flow was disturbed,
it also meant the river wasn’t as deep in that section. The two factors combined
led to a decrease in the velocity.

8/2/2019 River Flow 2
http://slidepdf.com/reader/full/river-flow-2 5/7
Joe McCormack River Flow 2 Engineering Geology
5
We then added the first bridge
abutment to the sequence. We left the
“rip rap” in place to see the effect it
would have on the process. We noticed
a pattern develop almost immediately,
where a bar formed either end of the
abutment and a channel grove became
deeper and wider at the sides of the
abutment. It was clear when looking at
the outlet that a change had occurred,
the width of the channel was becoming wider. The banks were being eroded at
considerable pace and the bar which formed at outlet left, had been washedaway.
We then removed the “rip rap” and waited to see what would happen next. Thebars at either end became significantly bigger and new bars were developing.
The increase in velocity, due to the removal of the “rip rap”, lead to bank
erosion becoming a real problem on the right bank. It is wise to observe the
consequences of small change on a river system, if this experiment is anything
to go by.
Next we were to witness another fault arise from the addition of the second
bridge abutment. This abutment was more angular than the previous one and so
we examined it in order to see what would happen in the river system.
8/2/2019 River Flow 2
http://slidepdf.com/reader/full/river-flow-2 6/7
Joe McCormack River Flow 2 Engineering Geology
6
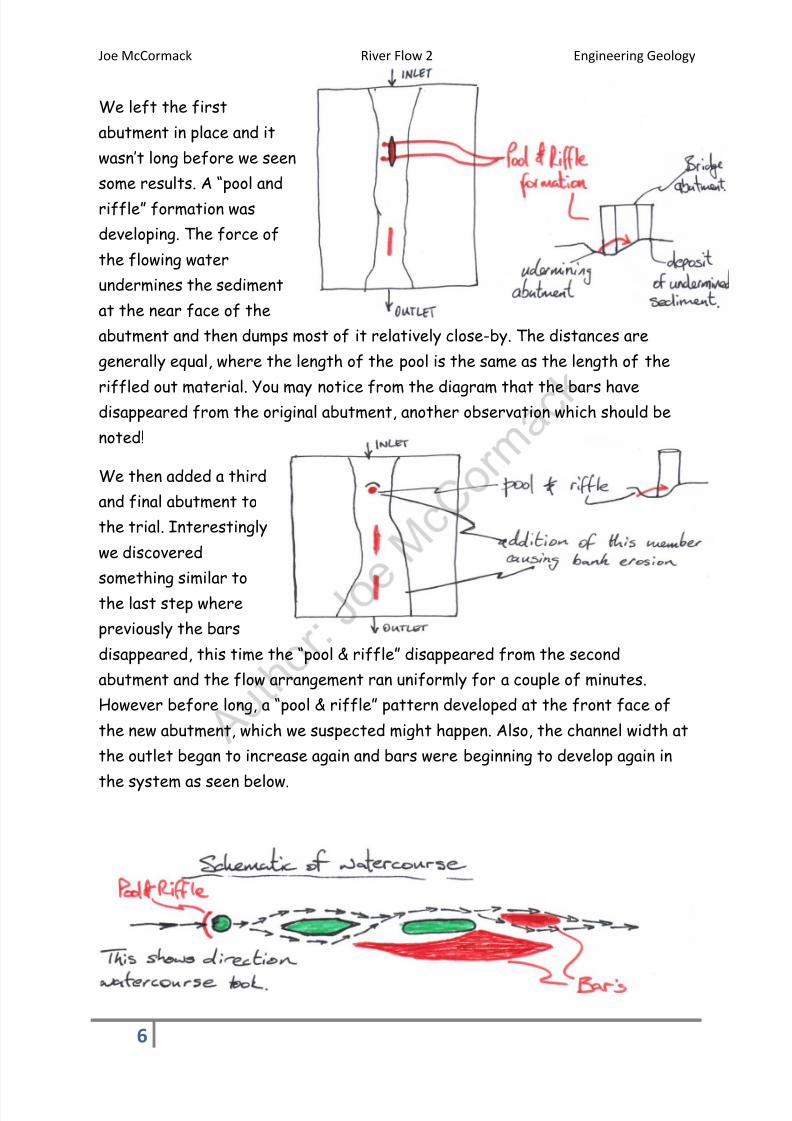
We left the first
abutment in place and it
wasn’t long before we seen
some results. A “pool and
riffle” formation was
developing. The force of
the flowing water
undermines the sediment
at the near face of the
abutment and then dumps most of it relatively close-by. The distances are
generally equal, where the length of the pool is the same as the length of the
riffled out material. You may notice from the diagram that the bars havedisappeared from the original abutment, another observation which should be
noted!
We then added a third
and final abutment to
the trial. Interestingly
we discovered
something similar to
the last step where
previously the bars
disappeared, this time the “pool & riffle” disappeared from the second
abutment and the flow arrangement ran uniformly for a couple of minutes.
However before long, a “pool & riffle” pattern developed at the front face of
the new abutment, which we suspected might happen. Also, the channel width at
the outlet began to increase again and bars were beginning to develop again in
the system as seen below.

8/2/2019 River Flow 2
http://slidepdf.com/reader/full/river-flow-2 7/7
Joe McCormack River Flow 2 Engineering Geology
7
I think one of the most important observations is the varying width of the
channel at the outlet. This is a good representation of the potential
vulnerability associated with river systems, where reasonably small
modifications can have detrimental effects further downstream.
The increasing channel
width became our
priority. In an attempt
to remedy the situation,
we installed a “rip rap”
at the first abutment.
This worked fine for a
while and it seemed as
though the river had
stabilised, with no
expansion of the
channel at the outlet.
After a few minutes, the river began a downhill trend yet again. The rivers
banks began to depreciate and new bar formations were evident. The “pool &
riffle” which was positioned at the first abutment remained there. As shownabove, the “rip rap” enabled the water flow over the top of the stones but after
some time the watercourse began to develop a new path at the bank, left and
right of the “rip rap”. The creation of this new watercourse meant that the
banks were going to erode at a swift pace and so we removed the “rip rap” so as
not to create any more problems than we already had.
For the next 10 minutes, we experimented with different configurations of the
system, trying to find the best means of leaving all of the abutments in placewhilst altering everything else around. This proved to be very difficult as it
seemed that as soon as we repaired one aspect of fault, another would appear
somewhere else. By carrying out this experiment, one could sum up the
proceedings with a quote:
‘Rivers are changed by the landscape through which they flow, and in turn
change the landscape.’ 1
1‘River Systems’ http://www.traleetimes.com/files/Geography/River_Systems_-_NOTES.pdf [accessed on 3
November 2011] p. 1.