risks and vulnerability to poverty of the informal sector workers in nigeria (autosaved)
TRANSCRIPT

Prepared for: Nigerian Social Insurance Trust Fund (NSITF)
“Work that respects human dignity is the essence of decent work,
the mission of the ILO. Decent work must be safe work.”
Juan Somavia – ILO Director-General (1999–2012)
©2014

Arbitrage Consult TeamAdeyemi OnafuyeAmina Aro-lamboAndrew AchilleBernard H. BasasonDaniel OghojaforJoy OballumNancy EneOlasubomi BelloOlatayo BabalolaOluwajuwonlo OluwoleProf. Olaseni Akintola-Bello (Lead Consultant)
i

Acronyms
ADB – Asian Development Bank
FCT- Federal Capital Territory
FGN – Federal Government of Nigeria
GDP - Gross Domestic Product
IADB – Inter-American Development Bank
ILO – International Labour Organization
NAPEP - National Poverty Eradication Program
NBS - National Bureau of Statistics
NDE - National Directorate of Employment
NGO- Non-Governmental Organization
NHIS – National Health Insurance Scheme
NPC - National Planning Commission
PSoL – Primary Source of Livelihood
SSCE – Senior Secondary School Certificate Examination
SURE-P - Subsidy Re-investment Program
UNDP - United Nations Development Program
WEIGO - Women in Informal Employment: Globalizing and Organizing
WHO – World Health Organization
YOUWIN - Youth Enterprise with Innovation
ii

Lists of Tables
Table 1. Gender Distribution of Respondents
Table 2. Age Distribution of Respondents
Table 3. Marital Status of Respondents
Table 4. Highest Educational Qualification of Respondents
Table 5. Primary Sources of Livelihood of Respondents
Table 6. Risks and hazards of the informal sector workers in Nigeria
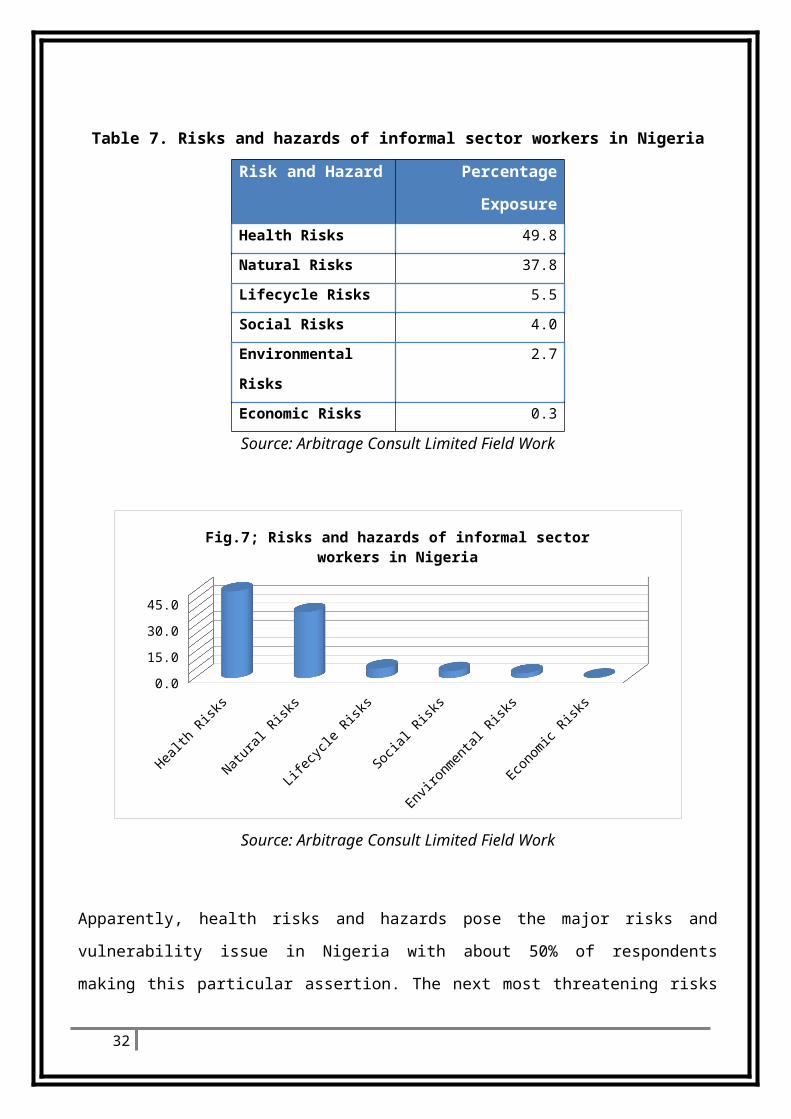
Table 7. Risks and hazards of informal sector workers in Nigeria
Table 8. Showing the Spread of Natural Risks and Hazards across the States
Table 9. Displays the health related risks and hazards of informal sector workers in Nigeria
Table 10. Displays the lifecycle Risks and Hazards faced by the Informal Sector Workers in
Nigeria
Table 11. Shows the economic risks and hazards threatening Nigerian informal sector
workers
Table 12. Displays social risks and hazards
Table 13. Environmental risks
Table 14. Displays the coping strategies of the informal sector workers
Table 15. How do you cope with the risks when they occur?
Table 16. Cross tab of gender and age brackets of informal sector workers
Table 17. Cross tab of risks and hazards with age brackets
Table 18. Cross tab of risks and hazards with primary sources of livelihood
iii

List of Figures
Fig.1; Displays the link between people, risks and disasters
Fig.2; Percentage Gender Distribution of Informal Sector Workers in Nigeria
Fig.3; Percentage Age Distribution of Informal Sector workers in Nigeria
Fig.4; Marital Status of Informal Sector workers in Nigeria
Fig.5; Highest Educational Qualification
Fig.6; Ranked PSoL of Nigerian Informal Sector Workers
Fig.7; Risks and hazards of informal sector workers in Nigeria
Fig.8; Natural Risks and Hazards Across States
Fig.9; Health Risks
Fig.10; Life cycle risks
Fig.11; Economic risks
Fig.12; Social Risks
Fig.13; Environmental risks
Fig.14; Coping Strategies
iv

Table of ContentsAcronyms............................................................................................................................................... ii
Lists of Tables........................................................................................................................................ iii
List of Figures........................................................................................................................................ iv
Table of Contents...................................................................................................................................v
Executive Summary..............................................................................................................................vii
Section 1................................................................................................................................................1
Introduction...........................................................................................................................................1
1.1. Background of the Study......................................................................................................1
1.2. Social Protection and the Rationale for Providing it..........................................................2
1.3. Definition of the Informal Sector.........................................................................................3
1.4. The Concept of Risk and Vulnerability................................................................................3
1.5. Problem Statement................................................................................................................4
1.6. Research Methodology..........................................................................................................5
1.7. Aim and objectives.................................................................................................................6
1.8. Significance............................................................................................................................7
1.9. Organization of the Study......................................................................................................7
Section 2................................................................................................................................................9
Risks and Vulnerability to Poverty.........................................................................................................9
2.1. Risk and Vulnerability to Poverty in Nigeria...........................................................................9
2.2. What is Poverty, Risk and Vulnerability?.............................................................................10
2.3. Why Should We Worry About Poverty, Risks and Vulnerability?.........................................10
2.5. Coping Strategies of Destitute and Vulnerable Households................................................12
2.6. Why is Risk and Vulnerability to Poverty Considered Multi-dimensional?...........................13
Section 3..............................................................................................................................................14
3.1. Socio-demographic Characteristics......................................................................................14
3.2. Understanding Risks and Hazards........................................................................................19
3.2.1. Natural Risks and Hazards............................................................................................24
3.2.2. Health Risks and Hazards.............................................................................................25
3.2.3. Lifecycle Risks and Hazards..........................................................................................26
3.2.4. Economic Risks and Hazards........................................................................................28
3.2.5. Social Risks and Hazards..............................................................................................29
3.2.6. Environmental Risks and Hazards................................................................................30
3.3. Coping Strategies.................................................................................................................31
v

3.4. Cross Tabulation of Some Key Variables..............................................................................34
3.4.1. Gender and age of informal sector workers in Nigeria................................................34
3.4.2. Risks and hazards with respect to the age brackets.....................................................35
3.4.3. Risks and hazards with respect to primary sources of livelihood.................................37
Section 4..............................................................................................................................................40
Recommendations...............................................................................................................................40
References...........................................................................................................................................42
vi

Executive Summary
In Nigeria, the issue of poverty has been a very serious one, especially when one
looks at the country’s endowment in terms of human and natural resources, which has
qualified the situation to be described as suffering in the midst of plenty. Unemployment
rate has been on the increase in Nigeria over the years. It was 13.1 per cent in 2000; rose to
14.8 percent in 2003 and 19.7 percent in 2009 (NBS 2009)1. With current unemployment
rate at 23.9 percent and unemployed youth population put at 20.3 million, Nigeria
generates about 4.5 million new entrants into the labour market annually. 2.2 million
primary school leavers not proceeding to secondary school, one million secondary school
leavers not proceeding to the tertiary level and 300,000 graduates finding no placement
anywhere for productivity, and yearly graduate turnover at over 600,000 (NBS, 2012)2.
Globally, processes and crises are constantly changing and intensifying the risks
already faced by poor and vulnerable people especially those involved in informal sector
dependent livelihoods and particularly leaving in the suburbs of major cities/towns and rural
areas. Reliance on informal livelihoods means the impact of stresses and shocks (such as
floods, erosion, harvest collapse, business or financial failure, birth and maternity, oil
spillage domestic violence accidents, injuries etc.) are enormously felt by informal sector
workers, who depend directly on daily income for their survival. This has profound
implications for the security of their livelihoods and for their welfare.
The informal sector refers to “a diversified set of economic activities, enterprises,
and workers that are not regulated or protected by the state” or “Units engaged in the
production of goods and services with the primary objective of generating employment and
incomes to the persons concerned”.
This study was carried out in eight select States in Nigeria. Geopolitical zoning was
part of the criteria for selection, in which Oyo state was selected from the South-west and
Anambra from the South-east. Rivers and Delta states from the South-south while
Abuja/FCT from North-central. Kano state from North-west while Adamawa and Bauchi
states from North-east.
1 National Bureau of Statistics (2009), Annual Abstract of Statistics: Abuja 2 National Bureau of Statistics (2012), Annual Abstract of Statistics: Abuja
vii

The survey found that in Nigeria overall, 62% informal sector workers are males
while 38% are females. Across the States the trend is the same with more males engaged in
the informal sector than females. However, Oyo State had the highest percentage of
females (41.9%) while Kano State had the least percentage of females (14.7%).
The most recurring age bracket of informal workers in Nigeria is between 30-44
years, followed by 15-29 years and the least is below 14 years. This particular trend is similar
to Adamawa, Delta and Kano States.
Overall, about 64.9% informal sector workers in Nigeria are married, 27% are not yet
married, and 4.9% are either widows or widowers while 3.3% are divorced. This is a
repeated trend across the States except for Kano, Oyo and Rivers States where the survey
found that there were more divorcees than widows and widowers aside the predominating
married and singles populations.
Generally, the highest educational qualification of respondents across the States is
SSCE followed by first school leaving certificate. Rivers State (47.1%) had the highest
population of SSCE holders while Bauchi State (10.3%) had the least in that educational
level. However, the most recurring educational qualification in Bauchi (29.1%) and Kano
(24.8%) States is Quranic education.
Overall, the three major sources of livelihood of informal sector workers are private
services, trade and agriculture. However, the states with the highest percentages in private
services, trade and agriculture are Abuja/FCT (43.7%), Anambra State (28.5%) and Kano
State (29.0%) respectively.
Individuals, households, social groups or communities suffer a loss of well-being,
because of their exposure to a number of impoverishing forces. These risks and hazards are
either natural, health, lifecycle, economic, social, or environmental in nature depending on
the location and type of occupational activities. Apparently, health risks and hazards pose
the major risks and vulnerability issue in Nigeria with about 50% of respondents making this
particular assertion. The next most threatening risk and vulnerability issue is natural risk and
hazard, with about 37.8% making this claim. Entirely, about 87.5% of risk and vulnerability
issues according to results from the survey show that they are related to health and natural
viii
risks and hazards; as only about 12.5% comprise the other risks and hazards in varying
percentages.
Across Nigeria, heavy rainfall (36.6%) accounts for the highest natural risk and
hazard according to the findings of this survey, followed by flood (24.9%) and erosion
(10.6%). illness (39.0%) poses the most vicious health risk and hazard, which is immediately
followed by work injuries (26.4%) and accidents (16.7%). The most sinister lifecycle risk is
death (35.2%), followed by birth (19.3%) and old age (16.8%). Business/financial failure
(35.6%) accounts for the highest economic risk, and then closely followed by unemployment
(32.0%) as well as harvest collapse (18.7%). The most predominant social risk across the
country is conflict (51.8%), followed by crime (27.5%) and domestic violence (20.7%). The
major environmental risk is air pollution (38.6%), followed by oil spillage (33.0%), land
degradation (18.2%) and Land deforestation (10.2%).
The coping strategies illustrate ways the informal sector workers/employers resort
to meeting their needs. Examples includes; using own savings, receive assistance from
government, NGO, family, workers/town/religious unions etc. Overall, about 48.9% of
Nigerian informal sector workers individually deal with shocks whenever they occur, while
about 31.2% receive assistance from family members. The other forms of assistance make
up the remaining 20% in varying percentages.
It is therefore not just about building new systems and new programs. It is also about
assessing the effectiveness or rather weaknesses of existing systems and programs. Policies
should be geared towards:
Health insurance schemes for informal sector workers: A special health insurance
scheme to cover informal sector workers should be designed or better still the NHIS
coverage be extended to informal sector workers;
Economic policies to encapsulate the informal sector workers: Streamlining existing
micro-credit schemes to suit the financial capacity of informal sector workers and
repayments should be made more flexible with competitive interest rates, as the
current economic policies do not truly consider the low income earners;
Lifecycle insurance for informal sector workers: Contributory old age pension and
retirement schemes should be designed for informal sector workers;
ix

Natural disaster management and contributory schemes: Especially for agriculturists
who face the highest natural risks and hazards, special intervention programs such
as agricultural insurance schemes should be designed for informal sector farmers to
be able to withstand the long lasting effects of natural shocks; and enlightenment
campaigns on natural disaster management for informal sector workers be
conducted more regularly;
Reducing social risks: Improve response to domestic violence, create strategic
community safety measures such as vigilante groups to keep watch of immediate
communities against intruders while promoting capacity building programs to
enlighten the vigilante groups. Encourage partnership between security forces and
socio-economic activities of citizens; reduce commercial robbery by improving
situational prevention measures (improve surveillance, etc.)
x

Section 1
Introduction
1.1. Background of the Study
In Nigeria, the issue of poverty has been a very serious one, especially when one
looks at the country’s endowment in terms of human and natural resources, which has
qualified the situation to be described as suffering in the midst of plenty. Aside the
overwhelming evidence, which suggests that, the country belongs to the group of the lower-
income countries despite being globally known to among the largest exporters of crude oil
in the world, earning millions of naira annually from oil exports. In spite of the oil wealth
that generates over $18.24 million daily from oil exportation, poverty and unemployment
have been on the increase. Poverty still remains significant at 33.1% in Africa's biggest economy. A
country with massive wealth and a huge population to support commerce, the level of poverty
remains unacceptable.
Unemployment rate has been on the increase in Nigeria over the years. It was 13.1
per cent in 2000; rose to 14.8 percent in 2003 and 19.7 percent in 2009 (NBS 2009) 3. With
current unemployment rate at 23.9 percent and unemployed youth population put at 20.3
million, Nigeria generates about 4.5 million new entrants into the labour market annually.
2.2 million primary school leavers not proceeding to secondary school, one million
secondary school leavers not proceeding to the tertiary level and 300,000 graduates finding
no placement anywhere for productivity, and yearly graduate turnover at over 600,000
(NBS, 2012)4. Therefore, reducing poverty in Nigeria relies mainly on sustaining the sources
of livelihood of the informal sector and creating an enhancing atmosphere for such
employment and activities.
Globally, processes and crises are constantly changing and intensifying the risks
already faced by poor and vulnerable people especially those involved in informal sector
dependent livelihoods and particularly leaving in the suburbs of major cities/towns and rural
3 National Bureau of Statistics (2009), Annual Abstract of Statistics: Abuja 4 National Bureau of Statistics (2012), Annual Abstract of Statistics: Abuja
1

areas. Reliance on informal livelihoods means the impact of stresses and shocks (such as
floods, erosion, harvest collapse, business or financial failure, birth and maternity, oil
spillage domestic violence accidents, injuries etc.) are enormously felt by informal sector
workers, who depend directly on daily income for their survival. This has profound
implications for the security of their livelihoods and for their welfare. Recently, the
perspectives on social protection have shifted focus to risk and vulnerability leading to
poverty, in an attempt to incorporate wide-ranging interventions to prevent risk, reduce
vulnerability, and ameliorate the impact of risks. Risk and vulnerability contribute to poverty
directly, e.g. through the depletion of productive assets, response of poor households to
risks is also debilitating: withdrawal of children from school, increased fertility, low
productivity adaptation (crops, technology, etc.).
1.2. Social Protection and the Rationale for Providing it.
In this study, social protection is referred to as “the public actions taken in response
to levels of vulnerability, risk and deprivation which are deemed socially unacceptable
within a given society”. Social protection thus deals with both the absolute deprivation and
vulnerabilities of the poorest, as well as the need of the currently non-poor for security in
the face of shocks and life-cycle events. The public character of this response may be
governmental or non-governmental, or may involve a combination of institutions from both
sectors providing various rationales for the development of social protection as a policy tool.
These include (among others) the need to develop social support for economic
reform programs, or to make growth more efficient and sustainable; the pursuit of social
justice and equity, or the obligation to provide all citizens with a minimum acceptable
livelihood and protection against risk; and the promotion of social cohesion, solidarity and
stability. Drawing on these public actions, we can say that the overall rationale for pursuing
social protection is to promote dynamic, cohesive and stable societies through increased
equity and security.
2

1.3. Definition of the Informal Sector
WEIGO defines the informal sector as
“A diversified set of economic activities, enterprises, and workers that are not
regulated or protected by the state. Informal sector employment includes: Self-
employment in informal enterprises: employers own account operators, unpaid
contributing family workers, Wage employment in informal jobs: non-standard
employees of informal enterprises Non-standard employees of formal enterprises,
casual or day labourers, industrial outworkers (also called homeworkers)”
Dennis Batangan and Theresa D.U. Batangan, (2007)5, defines the informal sector as
“Units engaged in the production of goods and services with the primary objective of
generating employment and incomes to the persons concerned. It consists of
household unincorporated enterprises that are market and non-market producers of
goods as well as market producers of services.”
1.4. The Concept of Risk and Vulnerability
In the context of this study, the term risk and vulnerability is used to mean
vulnerability to poverty, which we define as the probability of individuals, households, social
groups or communities to suffer a loss of well-being, because of their exposure to a number
of impoverishing forces. It is essential to note that the nature and extent of risks and
vulnerability differs among different age groups and gender class as well their occupation,
depending on the nature and character of impoverishing forces facing them. For example,
while children less than 5 years of age are mostly vulnerable to diseases, malnutrition, and
inadequate care, young women face risks of early pregnancy, neglect, poor ante natal care,
so are farmers, mechanics more prone to cuts, injuries, bruises dislocations etc. as a result
of their exposure to certain hazards.
5 D.Batangan and TDU Batangan, (2007). ILO-SRO Manila: Social Security Needs Assessment of the Informal Sector in the Philippines
3

Fig.1 displays the link between people, risks and disasters
The figure above identifies the link between the low income sources and
vulnerabilities among informal sector workers, and the hazards, which depends on their
levels of preparedness or unpreparedness to shocks, as well as the disasters they can or
cannot quickly recover from i.e. crises that further plunges them into destitution. The plight
of Informal sector workers is their exclusion from formal labour markets and ineligibility to
the conventional forms of protection available to their counterparts in the formal sector
making them vulnerable to poverty. Unpreparedness to shocks for informal sector workers
could be so devastating to recover.
1.5. Problem Statement
Worldwide, millions of workers have never had or are losing access to their rights to
social benefits through work – retirement funds, maternity benefits and reproductive health
services, compensation for work-related accidents and diseases. Millions more will never
gain the kind of jobs that carry such benefits.
In Nigeria, conditions of work are hazardous and precarious, with little regulation of
the working environment, and very little social protection. Across the globe, workers are
denied what used to be entitlements through work; poor conditions of work are associated
with poor health and lowered incomes; and there is cross-generational transmission of
poverty from the present generation of working people to the next.
4

In addition, a very huge and increasing number of informal workers engage in
informal activities and in unfavorable environments with very little or no protection.
However, these risks and hazards are only peculiar to them rather than the formal sector.
The regulation of conditions of work, in order to secure decent and safe conditions, is
restricted to formal places of work such as offices and factories. While, the majority of
Nigerian workers now work elsewhere – whether on street corners, informal markets, or
public parks (street and market vendors) hawkers of groundnut, plantain chips, pure water
(sachet water), handkerchiefs. Food vendors “Mama Put”, carpenters, market women,
mechanics, conductors ”agbero”, money collectors (Adashe or Alajo or Esusu), meat vendors
(Mai suya), electricians, barbers, photographers, real estate agents private lesson teachers;,
on waste dumps (waste pickers, mai-shara), in their own homes(garages, kiosks, gate
rooms), or the private homes of others (domestic workers i.e. house helps, cooks, drivers,
gardeners etc.). But the conventional institutions covering occupational health and safety do
not cover informal places of work, nor do they include some of the occupational hazards
associated with informal work.
Systemic global risks or country-level – such as the global financial crisis/economic
recession, the recent flood crisis and “BOKO-HARAM” insurgence – have specific, often
severe, impacts on those engaged in the informal sector. Yet there is a widespread
assumption that the informal economy fares relatively well during crises and provides a
“cushion” to those who loose formal jobs or need to supplement formal incomes during
crises.
1.6. Research Methodology
In gathering the data for this research, geopolitical zoning was part of the criteria for
selection of the eight states surveyed, in which Oyo state was selected from the South-west
and Anambra from the South-east. Rivers and Delta states from the South-south while
Abuja/FCT from North-central. Kano state from North-west while Adamawa and Bauchi
states from North-east. Very highly trained and experienced field enumerators administered
questionnaires and conducted structured face-to-face interviews. The structured interview
utilized the following method;
5

Identify likely members of the informal sector either through accidental or
reputational sampling
Introduce self and inform participant of the aim of the study
Get participant’s consent to proceed with the interview
Conduct the interview if given consent
Debrief and thank participants for their cooperation
The procedure of conducting the structured interview observed the following principles;
Ensured ethical standards in the research process; such as getting informed consent
of respondents, clear the air on their rights to or not disclose any information
perceived to be private by them.
Location based and activity oriented research process; that is, the research data
gathering and analysis reflected the locational and socio-economic characteristics of
the respondents.
Culturally and gender sensitive research process; the various methods employed and
the process of data gathering took cognisance of the diversity of the groups involved
especially their values, practices, relations, needs, beliefs, preferences etc.
Systematic and thorough organization of the research process; The development of
the research framework, data gathering tools, and procedures were guided by the
review of literature, established methods of data generation, consultation and pre-
testing of instruments to ensure the reliability and validity of the research findings.
1.7. Aim and objectives
This study aims to build and maintain a preventive safety and health culture amongst
informal sector workers in Nigeria. The specific objectives include:
1. To identify work risks and hazards of the informal sector workers;
2. To examine how they cope with the risks and hazards when they occur;
3. To devise measures of reducing work-related injuries and occupational risks and
hazards; and
4. To develop a proper legislation for protecting informal sector workers from work-
related hazards and risks.
6

1.8. Significance
According to an ILO declaration, “Labour is not a commodity, but an essential
economic factor which has to be well protected”. Nigeria’s informal sector accounts for as
much as 57.9% of the nation’s rebased Gross Domestic Product (GDP), disclosed by Daouda
Toure, United Nations resident coordinator/representative of the United Nations
Development Program (UNDP) in Nigeria (June, 2014)6. About 90% of employment in Nigeria
is in the informal sector7. It is with these realizations, that the Federal Government of
Nigeria created, staffed and funded various departments in relevant ministries, parastatals
and agencies to formulate and administer policies, laws and regulations that protect its
workers against illness, diseases and injuries arising from their employment. However, this
study seeks to extend this privilege to the informal sector in view of its immense
contribution to economic growth and employment of millions of unemployed youths. A
more enriched economy in terms of human and capital resources as well as improved
welfare of the economically active age groups is in the offing.
1.9. Organization of the Study
This study is presented in four sections. Section one provides a very brief
introduction, problem statement, research methodology, aim and objectives and
significance of the study. Consequently, section two dwells on risks and vulnerability to
poverty. This entails the risks and vulnerability to poverty in Nigeria, the concept of poverty,
risks and vulnerability, why there is a need to worry about it, what makes households
vulnerable to poverty, coping strategies of destitute and vulnerable households, as well as
the rationale behind poverty being considered a multidimensional phenomenon.
Furthermore, section three presents an analysis of the survey results subject to risks and
6 National Planning Commission (NPC), working with the Nigerian Institute of Social and Economic Research (NISER), National Bureau of Statistics (NBS), in collaboration with United Nations Development Program (UNDP), (2014). “Informal Sector and Economic Development in Nigeria”. Monday 4, August 2014, Business Day magazine.7 Attah Amana Phillip et al. (2013). “Strategy for Reducing Unemployment in Nigeria: The Role of Informal Sector”. International Journal of Capacity Building in Education and Management (IJCBEM), Vol.2, No 1, Dec. 2013.
7

hazards as well as coping strategies. Finally, section four provides recommendations based
on the survey findings.
8

Section 2
Risks and Vulnerability to Poverty
Despite high and growing levels of risks and vulnerability to poverty, social
protection is only now becoming a priority in Nigeria. Plans are underway to extend basic
well-being support measures and other social protections to informal sector workers. There
is an emerging consensus among multilateral institutions around the need for developing
countries to strengthen and develop social protection policies and programs as an urgent
response to economic crisis and rising vulnerability to poverty (IADB 2000; Asian
Development Bank 2001; World Bank 2001). The consensus has centered on ‘social
protection’ as the organizing concept, covering a wider range of programs, stakeholders,
and instruments than alternatives such as ‘social policy’, ‘social security’, ‘social insurance’,
or ‘safety nets’.
2.1. Risk and Vulnerability to Poverty in Nigeria
In Nigeria, poverty is a growing problem which had been ironically described as
suffering in the midst of plenty (World Bank, 1996). Precisely, 65.6 percent of the population
- (about 67.5 million) - was poor in 1996. The proportion reduced to 54.4 percent in 2004
(about 72 million) (FGN, 2005). Suppose that in 2006 poverty remains at its 2004 level, more
than 76.16 million people would be poor. These scenarios clearly reveal that in absolute or
numerical term, the number of poor people is annually increasing. The Nigerian government
has focused on providing some social protection programs such as the National Poverty
Eradication Program (NAPEP), National Directorate of Employment (NDE), Subsidy Re-
investment Program (SURE-P), Youth Enterprise with Innovation (YOUWIN) etc. as
instruments of poverty alleviation and unemployment reduction while empowering youths
as well as promoting national economic development. Also, given the multidisciplinary
approach that is required for poverty alleviation, some government parastatals have been
saddled with the responsibilities of implementing some development programs that are
meant for reaching the poor. Thus, achieving the MDG of halving poverty level by 2015,
which is a prerequisite for achieving the other seven profoundly attractive goals, is a
9

daunting challenge that Nigerian policy makers must tactically address in just less than a
year.
2.2. What is Poverty, Risk and Vulnerability?
Poverty is an ex-post measure of a household’s well-being (or lack thereof). It
reflects a current state of deprivation and lack of the resources or capabilities to satisfy
current needs. Vulnerability on the other hand, is perceived to be an ex-ante measure of
well-being, not really portraying how well off a household currently is, but what its future
prospects are. What distinguishes poverty and vulnerability is the presence of risk, which is
the fact that the level of future well-being is uncertain. The uncertainty that households face
about the future stems from multiple sources of risks, which include and not limited to
harvests failure, rise in food prices, ill health or loss of income earner of the household,
unemployment, accidents, crime etc. If such risks were absent (and the future were certain)
there would be no distinction between ex-ante (vulnerability) and ex-post (poverty)
measures of well-being.
2.3. Why Should We Worry About Poverty, Risks and Vulnerability?
The reasons for considering the role of poverty, risk and vulnerability in the design
and implementation of social policy has been elaborately discussed in other studies by
Holzmann (2001), Holzmann and Jørgensen (2000), as well as Heitzmann, Canagarajah and
Siegel (2002) just to mention a few. The claim that the nature and magnitude of the poverty,
risks and vulnerabilities that households face, and the extent of the coping mechanisms they
have access to; given the environments in which they operate, potentially play a central role
in the dynamics and scale of poverty. This is also supported by both theoretical analyses and
empirical evidence. Drawing on these arguments, we list four reasons why analysis of risks
and vulnerability to poverty is both desirable and necessary.
Firstly and most importantly, a forward-looking anti-poverty intervention, is clearly
necessary to go beyond a cataloging of who is currently poor, how poor they are, and why
they are poor to an assessment of households’ risks and vulnerability to poverty i.e. who is
likely to be poor, how likely are they to be poor, how poor are they likely to be, and why are
they likely to be poor. Generally, in terms of risks and vulnerability to poverty, which, by
10

definition has to be forward-looking, forces us to consider the potential role and effects of
risk.
Secondly, a focus on risks and vulnerability to poverty tends to highlight the
distinction between ex-ante poverty prevention interventions and ex-post poverty
alleviation interventions. A simple public health analogy will make this distinction clearer.
Just as efforts to combat a disease outbreak include both treatment of those already
infected as well as preventive measures directed at those at risk, poverty reduction
strategies need to incorporate both alleviation, prevention and transformation efforts.
Thirdly, addressing risks and vulnerability also has instrumental value. Because of the
many risks households face, they often experience shocks leading to a wide variability in
their income. In the absence of sufficient assets or insurance to smooth consumption, such
shocks may lead to irreversible losses, such as distress sale of productive assets, reduced
nutrient intake, or interruption of education that permanently reduces human capital
(Jacoby and Skoufias, 1997), locking their victims in perpetual poverty. Aware of the
potential of such irreversible outcomes, vulnerable people often engage in risk mitigating
(coping) strategies to reduce the probability of such events occurring. Yet, these strategies
yield typically low average returns. Thus, when people lack the means to smooth
consumption in the face of variable incomes, they are often trapped in poverty through
their attempts to steer clear of irreversible shocks (Morduch, 1994; Barrett, 1999). In a
similar vein, it is being observed at the macro-level that economic growth slows down in the
face of downward risks resulting from structural phenomena such as climatic vagaries,
fluctuations in the terms of trade and political insecurity (Guillaumont, Guillaumont, Brun,
1999). Policies directed at reducing risks and vulnerability both at the micro and macro
level, will be instrumental in reducing poverty.
Last but not least, risks and vulnerability are intrinsic aspects of well-being. That
exposure to risk and uncertainty about the future adversely affect current wellbeing is one
of the central ideas of the basic economic theory of human behavior, embodied in the
assumption that individuals and households are risk averse. And as the World Development
Report 2000/2001 on Attacking Poverty documents, this presumption is echoed by findings
from worldwide consultations that indicate that risk and uncertainty are a central
preoccupation of the poor.
11

2.4. What makes a household vulnerable to poverty?
A household’s vulnerability to poverty at any point in time depends on how its
livelihood prospects and well-being is likely to evolve over time. And that in turn depends on
its future income prospects, the degree of income volatility it faces, its ability to smooth
consumption in the face of income or other livelihood shocks. These in turn depend on the
complex dynamic inter-linkages between the environment, institutional arrangements,
religious inclination and political terrain in which the household operates; the resources,
human, physical and financial power it commands, and its behavioral responses. Such a
dynamic perspective on household well-being suggests that the direct causes of poverty and
vulnerability to poverty include:
1. Exposure to adverse aggregate shocks (e.g. macroeconomic shocks or
commodity price shocks) and/or adverse idiosyncratic shocks (e.g., localized
crop damage or illness of the breadwinner of the household).
2. Low long-term income generating capacity. Households who are vulnerable
to transitory poverty suffer primarily from exposure to adverse shocks. On
the other hand, the structurally or chronically poor are those who are both
exposed to adverse shocks and have limited long-term income generating
capacity. Poverty reduction efforts must protect the former and assist the
latter.
2.5. Coping Strategies of Destitute and Vulnerable Households
Victims of adverse shocks who are both chronically and transient poor households,
usually adopt a variety of coping strategies to meet basic essential needs. Some of these
coping strategies, while they might enable the household to meet critical short-term needs,
can be costly in terms of the future well-being of the household, and in particular may
condemn the children of the household to a lifetime of poverty as well. Measures to prevent
the intergenerational transmission of poverty amongst poor households must be an
essential component of any sustainable poverty reduction strategy. Examples of such coping
strategies include; receive assistance from family members, friends and member unions,
sale of own assets etc.
12
2.6. Why is Risk and Vulnerability to Poverty Considered Multi-dimensional?
Poverty prevention efforts that aim to reduce risks and vulnerability to poverty and
prevent the intergenerational transmission of poverty must go beyond the direct causes of
poverty and vulnerability, to address the multiple underlying causes of poverty. Any
grouping of the underlying causes of poverty is ultimately somewhat misguiding given the
numerous complicated ways in which the various factors that lead to poverty are
intertwined. A household is more likely to be exposed to adverse shocks and have limited
earning prospects and income-generating capacity if it:
I. has low levels of human capital, know-how and access to information
II. suffers from physical and psychological disabilities
III. has few productive and financial assets
IV. suffers from social exclusion or inadequate networks of social support
V. has limited access to credit and risk-management instruments
VI. lives in a setting with adverse agro-climatic conditions and limited natural resources
VII. lives in a community where there is insufficient entrepreneurial activity and job
creation
VIII. Works in a sector that is particularly sensitive to macroeconomic volatility and
sectoral shocks.
These and other underlying risks and vulnerability factors makes poverty to be considered a
multidimensional threat.
13

Section 3
This section presents the survey results of the select states in Nigeria starting with the socio-
demographic characteristics of survey respondents, the various risks and hazards they
encounter, as well as their coping strategies.
3.1. Socio-demographic Characteristics
Gender
Table 1. Gender Distribution of Respondents
Adamawa Anambra Bauchi Delta Kano Oyo Rivers FCT
Abuja
National
Aggregate
MALE 80.1 62.7 73.6 59.8 85.4 58.1 58.2 66.5 68.0
FEMALE 19.9 37.3 26.4 40.2 14.7 41.9 41.8 33.5 32.0
Source: Arbitrage Consult Limited Field Work
MALE FEMALE 0.0
10.0
20.0
30.0
40.0
50.0
60.0
70.0
Fig.2; Percentage Gender Distribution of Informal Sector Workers in Nige-ria
Source: Arbitrage Consult Limited Field Work
14

Generally, gender distribution of informal sector workers in Nigeria, shows that 68% are
males while 32% are females. Across the States the survey found the trend to be the same
with more males engaged in the informal sector than females. However, Oyo State had the
highest percentage of females (41.9%) while Kano State had the least percentage of females
(14.7%).
Age
Table 2. Age Distribution of Respondents
Age
bracket
Adamawa Anambra Bauchi Delta Kano Oyo Rivers FCT
Abuja
National
Aggregate
0-14 years 0.0 0.7 11.4 4.0 3.3 1.7 0.0 1.5 2.8
15-29
years
26.0 19.8 29.9 30.6 37.5 23.8 15.9 40.9 28.1
30-44
years
43.2 45.2 29.0 45.9 44.6 40.8 45.9 40.0 41.8
45-59
years
25.0 26.7 20.3 14.2 12.5 24.5 33.5 15.5 21.5
60-74
years
5.4 7.7 9.3 5.3 2.3 9.3 4.7 2.1 5.8
Source: Arbitrage Consult Limited Field Work
With the exception of Anambra and Rivers, respondents in age bracket 15-29 years make up
at least 25% or a quarter of the total sample. Also, with the exception of Bauchi, at least 40
percent of respondents from all the states in the sample belong to the age bracket of 30-44
years.
15

0-14 years 15-29 years 30-44 years 45-59 years 60-74 years 0.0
5.0
10.0
15.0
20.0
25.0
30.0
35.0
40.0
45.0
Fig.3; Percentage Age Distribution of Informal Sector workers in Nigeria
Source: Arbitrage Consult Limited Field Work
The most recurring age bracket of informal workers in Nigeria is between 30-44 years,
followed by 15-29 years and the least is below 14 years. The age brackets 30-44 years
followed by 15-29 years and the below 14 years is the trend in Adamawa, Delta and Kano
States. While in Bauchi State (29.9%) and Abuja/FCT (40%), the most predominant age
bracket is 15-29 years, although slightly more than 30-44 years respectively. In contrast, the
age bracket 45-59 years is the next predominating in Oyo (24.5%) and Rivers (33.5%) States.
Marital Status
Table 3. Marital Status of Respondents
Adamaw
a
Anambra Bauchi Delta Kano Oyo Rivers FCT
Abuja
National
Aggregat
e
SINGLE 19.9 26.8 34.8 34.4 23.7 13.3 19 43.7 27.0
MARRIED 71.3 63.5 57.5 56.8 72.5 72.3 74.2 50.9 64.9
DIVORCED 2.6 1.9 3.1 3.4 2 7.7 3.7 2.2 3.3
WIDOW(ER) 6.3 7.8 4.7 5.3 1.8 6.7 3.1 3.1 4.9
Source: Arbitrage Consult Limited Field Work
16

SINGLE MARRIED DIVORCED WIDOW(ER)0.0
10.0
20.0
30.0
40.0
50.0
60.0
70.0
Fig.4; Marital Status of Informal Sector workers in Nigeria
Source: Arbitrage Consult Limited Field Work
Overall, about 65% informal sector workers in Nigeria are married, 27% are not yet married,
and 4.9% are either widows or widowers while 3.3% are divorced. This is a repeated trend
across the States except for Kano, Oyo and Rivers States where the survey found that there
were more divorcees than widows and widowers after the general trend of married and
singles.
Highest Educational Qualification
Table 4. Highest Educational Qualification of Respondents
Adamawa Anambra Bauchi Delta Kano Oyo Rivers FCT National
Total
None 6.3 5.2 22.2 12.8 6.9 10.5 6.3 11.3 7.9
Quranic 21.7 1.0 29.1 2.1 24.8 10.1 1.0 7.0 6.7
First School Leaving
Certificate
23.1 24.2 11.9 17.8 13.0 11.7 28.0 13.5 18.1
Voc/Tech/Com 2.7 2.9 1.4 4.3 3.6 5.5 17.6 5.1 6.2
JSSCE 4.3 10.5 3.9 8.2 4.9 3.2 5.6 4.2 6.2
SSCE 28.9 33.6 10.3 24.9 11.7 21.8 47.1 34.1 28.2
A Level 5.4 1.8 5.4 4.5 2.8 1.9 2.3 3.4 2.8
Nce/Ond/ Nursing 5.6 9.6 7.7 7.5 14.7 14.5 14.5 10.5 10.6
Hnd/Ba/Bsc 2.0 8.3 5.4 14.8 8.1 13.6 13.8 9.8 10.3
Ma/Msc 0.0 1.2 0.4 1.9 1.7 5.3 1.4 0.2 1.2
Others 0.0 0.8 2.2 0.3 7.3 0.5 0.4 0.7 1.8
17

Source: Arbitrage Consult Limited Field Work
SSCE
FSLC
NCE/OND/ N
URSING
HND/BA/B
SCNONE
QUARANIC JSS
CE
VOC/TECH/C
OM
A LEVEL
OTHER
S
MA/MSC
0.0
5.0
10.0
15.0
20.0
25.0
30.0
Fig.5; Highest Educational Qualification
Source: Arbitrage Consult Limited Field Work
Generally, the highest educational qualification of respondents across the States is SSCE
followed by first school leaving certificate. Rivers State (47.1%) had the highest proportion
of SSCE holders while Bauchi State (10.3%) had the least in that educational level. However,
the most recurring educational qualification in Bauchi (29.1%) and Kano (24.8%) States is
Quranic education. Rivers State still maintained the lead in FSLC with (28.0%) while Oyo
State hit the bottom with (11.7%) in that category.
Primary Source of Livelihood
Table 5. Primary Sources of Livelihood of Respondents
Primary
Source of
Livelihood
Adamawa Anambra Bauchi Delta Kano Oyo Rivers FCT
Abuja
National
Aggregat
e
Trade 16.9 28.5 16.4 18.5 20.0 27.0 33.4 24.9 23.2
Manufacturin
g
8.8 5.1 12.0 9.8 14.5 6.6 6.0 4.4 8.4
Agriculture 21.4 13.2 14.9 20.8 29.0 11.9 8.5 12.4 16.5
Forestry 0.0 0.4 4.0 2.3 1.9 4.0 1.8 3.1 2.2
Construction 1.9 0.7 0.4 0.9 1.1 1.7 0.6 1.3 1.1
18

Transport 8.8 10.6 11.1 7.8 7.3 4.5 9.2 8.0 8.4
Finance 0.0 0.6 1.1 2.3 1.3 1.9 0.8 1.0 1.1
Private
Services
42.2 40.9 38.5 36.6 24.6 31.6 38.3 43.7 37.0
Mining 0.0 0.1 1.7 0.9 0.2 0.0 1.5 1.3 0.7
Source: Arbitrage Consult Limited Field Work
Private
Servi
cesTra
de
Agricu
lture
Transp
ort
Manufac
turing
Fores
try
Finan
ce
Constructi
on
Mining 0.05.0
10.015.020.025.030.035.040.0
Fig.6; Ranked PSoL of Nigerian Informal Sector Workers
Source: Arbitrage Consult Limited Field Work
Overall, the three major sources of livelihood of informal sector workers are private
services, trade and agriculture. However, there exists State peculiarities for example
Abuja/FCT (43.7%) is the beehive of private services while Kano State (24.6%) is the least in
that category; Anambra State (28.5%) is the highest in terms of trade while Bauchi State
(16.4%) accounts for the least in that informal economic sector; Kano State (14.5%)
dominates in terms of manufacturing while Abuja/FCT 4.4%) is least in that group; Kano
State (29.0%) is topmost in agriculture while Rivers State (8.5%) is at the bottom of that list.
3.2. Understanding Risks and Hazards
Natural risks and hazards are severe and extreme weather and climate events that
occur naturally and pose threats to humans and the environment i.e. those elements
19

of the physical environment, harmful to man and caused by forces extraneous to
him. Examples include; drought, landslide, erosion, flood, strong winds, heavy
rainfall etc.
Health risks and hazards refer to substances, which are corrosive, irritant, toxic, or
can damage body parts or produces acute health effect. Examples are illness, injury,
accidents, disability, epidemics etc.
Lifecycle risks and hazards refer exposure to certain phenomena or certain life styles
at one stage or another in human lifecycle, which may affect the proper
development of other human lifecycle stages. Examples are birth, death, maternity,
family breakup, old age etc.
Economic risks and hazards refer to natural occurrences, environmental factors, and
social activities etc., which influence economic activity. Examples include
business/financial failure, unemployment, resettlement, harvest/output collapse etc.
Social risks and hazards refer to Common definitions of terrorism refer only to those
violent acts that are intended to create fear (terror); are perpetrated for a religious,
political, or ideological goal; and deliberately target or disregard the safety of the
people concerned.
Environmental Risks and hazards are potential threats that may have adverse effects on
living organisms and environment by emissions, wastes, resource depletion, etc.,
arising out of human activities.
20

Table 6. Risks and hazards of the informal sector workers in Nigeria
Adamawa
State (700)
Anambra State
(1500)
Bauchi State
(1200)
Delta State
(1500)
Kano State
(2000)
Oyo State
(1500)
Rivers State
(1400)
FCT/Abuja
(1100)
Country Total
(10,900)
Risk/Hazard F%
acrossF
%
acrossF
%
acrossF
%
acrossF
%
acrossF
%
acrossF
%
acrossF
%
acrossF
%
across
Natural Risks
Heavy rainfall 235 13.8 98 5.8 367 22.8 432 22.5 27 1.6 164 9.6 289 17.0 91 5.3 1703 10.1
Landslide 31 23.3 1 0.8 3 0.2 52 39.1 4 3.0 31 23.3 11 8.3 133 0.8
Erosion 70 11.7 16 2.7 27 1.7 191 10 58 9.7 111 18.5 100 16.7 27 4.5 600 3.6
Flood 283 24.1 149 12.7 23 1.4 363 18.9 37 3.2 123 10.5 141 12.0 53 4.5 1172 6.9
Drought 116 34.2 39 11.5 15 0.9 14 0.7 8 2.4 10 2.9 88 26.0 49 14.5 339 2.0
Strong winds 78 18.5 28 6.6 116 7.2 29 1.5 32 7.6 29 6.9 65 15.4 45 10.7 422 2.5
Insect infection 120 22.2 20 3.7 48 3.0 35 1.8 9 1.7 124 22.9 135 25.0 50 9.2 541 3.2
Health Risks
Illness 436 18.3 214 9.0 158 9.8 159 8.3 408 17.1 181 7.6 298 12.5 535 22.4 2389 14.2
Injury 334 20.6 116 7.2 41 2.5 67 3.5 341 21.0 177 10.9 213 13.1 332 20.5 1621 9.6
Accidents 72 7.0 101 9.8 82 5.1 79 4.1 198 19.3 168 16.4 161 15.7 165 16.1 1026 6.1
Disability 2 0.7 103 36.7 10 0.6 7 0.4 104 37.0 7 2.5 36 12.8 12 4.3 281 1.7
Epidemic 148 18.2 169 20.8 24 1.5 66 3.4 4 0.5 12 1.5 162 19.9 229 28.1 814 4.8
Life cycle
Risks
Birth 3 0.8 84 22.8 28 1.7 6 0.3 3 0.8 15 4.1 42 11.4 188 50.9 369 2.2
Maternity 3 1.1 17 6.3 5 0.3 5 0.3 3 1.1 8 3.0 62 23.1 165 61.6 268 1.6
Old age 111 34.6 3 0.9 94 5.8 10 0.5 11 3.4 7 2.2 56 17.4 29 9.0 321 1.9
Family Beak up 8 2.8 18 6.4 117 7.3 33 1.7 13 4.6 33 11.7 32 11.4 27 9.6 281 1.7
Death 23 3.4 64 9.5 163 10.1 32 1.7 6 0.9 70 10.4 125 18.5 191 28.3 674 4.0
21

Economic
Risks
Unemployment 29 4.3 29 4.3 123 7.6 128 6.7 3 0.4 80 11.9 177 26.3 104 15.5 673 4.0
Harvest
collapse122 31.0 77 19.6 39 2.4 26 1.4 6 1.5 29 7.4 17 4.3 77 19.6 393 2.3
Business/
financial failure224 29.9 90 12.0 81 5.0 57 3 13 1.7 42 5.6 88 11.7 154 20.6 749 4.4
Resettlement 7 3.3 22 10.5 10 0.6 8 0.4 7 3.3 11 5.3 9 4.3 135 64.6 209 1.2
Currency risk 0 0.0 6 14.0 0 0.0 3 0.2 18 41.9 0 0.0 2 4.7 14 32.6 43 0.3
Technology/
trade risk0 0.0 8 22.9 1 0.1 3 0.2 1 2.9 0 0.0 16 45.7 6 17.1 35 0.2
Social Risks
Crime 26 10.0 44 16.9 6 0.4 22 1.1 8 3.1 17 6.5 77 29.6 60 23.1 260 1.5
Domestic
Violence39 19.9 11 5.6 12 0.7 45 2.3 4 2.0 18 9.2 31 15.8 36 18.4 196 1.2
Conflict 36 7.3 155 31.6 9 0.6 51 2.7 35 7.1 65 13.3 88 18.0 51 10.4 490 2.9
Environmental
Risks
Land
deforestation18 20.2 24 27.0 0 0.0 6 6.7 5 5.6 30 33.7 6 6.7 89 0.5
Oil spillage 0 0.0 1 0.3 1 0.1 29 1.5 5 1.7 5 1.7 246 85.7 0 0.0 287 1.7
Land
degradation79 50.0 6 3.8 4 0.2 8 0.4 2 1.3 6 3.8 33 20.9 20 12.7 158 0.9
Pollution 17 5.1 3 0.9 3 0.2 11 0.6 0 0.0 0 0.0 283 84.5 18 5.4 335 2.0
Total 2670 1716 1610 1919 100 1422 1521 3133 2880 16871 100.0
Source: Arbitrage Consult Limited Field Work
22
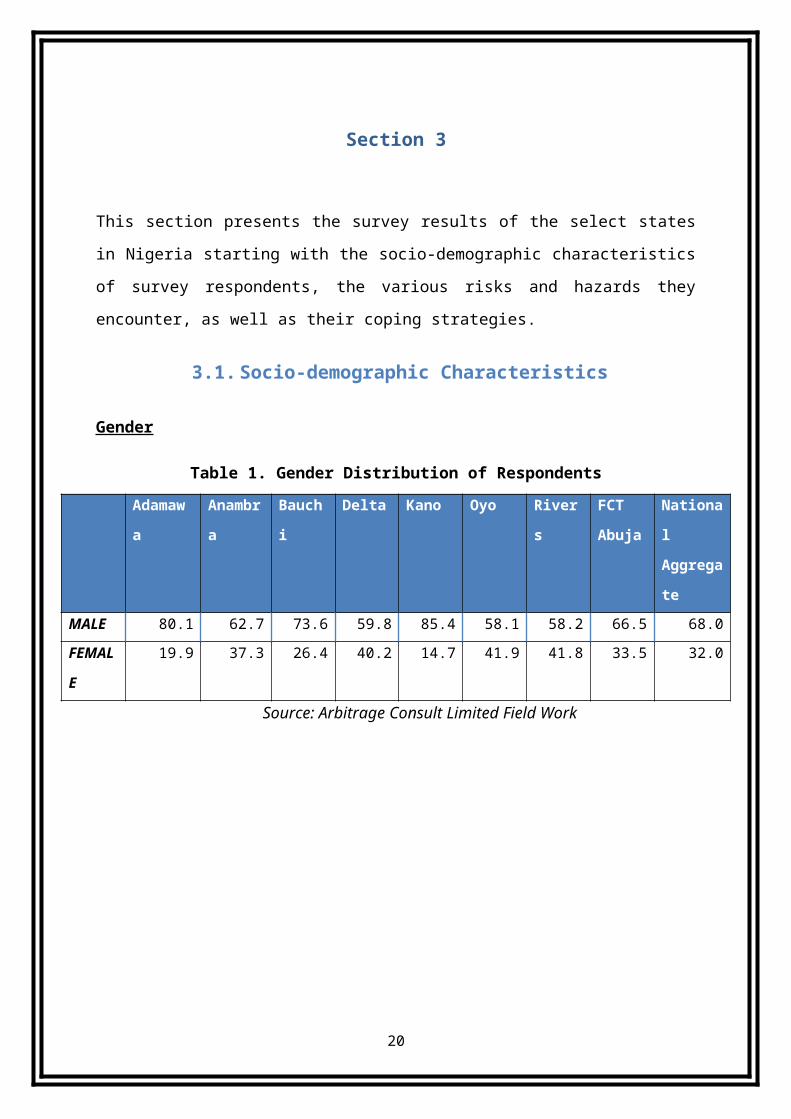
Table 7. Risks and hazards of informal sector workers in Nigeria
Risk and Hazard Percentage Exposure
Health Risks 49.8
Natural Risks 37.8
Lifecycle Risks 5.5
Social Risks 4.0
Environmental Risks 2.7
Economic Risks 0.3
Source: Arbitrage Consult Limited Field Work
Health
Risks
Natural
Risks
Lifecy
cle Risk
s
Socia
l Risk
s
Envir
onmental
Risks
Economic R
isks
0.05.0
10.015.020.025.030.035.040.045.050.0
Fig.7; Risks and hazards of informal sector workers in Nigeria
Source: Arbitrage Consult Limited Field Work
Apparently, health risks and hazards pose the major risks and vulnerability issue in Nigeria with
about 50% of respondents making this particular assertion. The next most threatening risks and
vulnerability issue is natural risks and hazards, with about 37.8% making this claim. Entirely,
almost 90% of risks and vulnerability issues according to results from the survey show that they
are related to health and natural risks and hazards as only about 12.5% comprise the other risks
and hazards in varying percentages.
23

3.2.1. Natural Risks and Hazards
Entirely across the nation, heavy rainfall (36.6%) accounts for the highest natural risks and hazards
of informal sector workers according to the findings of this survey, followed by flood (24.9%) and
erosion (10.6%). More details are presented below:
Heavy rainfall (36.6%)
Flood (24.9%)
Erosion (10.6%)
Drought (9.7%)
Insect infestation (9.6%)
Strong winds (8.7%)
Table 8. Showing the Spread of Natural Risks and Hazards across the States
Risk/Hazard Adamawa Anambra Bauchi Delta Kano Oyo Rivers FCT/Abuja
Heavy rainfall 13.8 5.8 21.6 25.4 1.6 9.6 17.0 5.3
Erosion 14.2 3.2 5.5 38.7 11.8 0.8 20.3 5.5
Flood 24.4 12.8 2.0 31.3 3.2 9.6 12.2 4.6
Drought 25.7 8.6 3.3 3.1 1.8 27.2 19.5 10.8
Strong winds 19.4 6.9 28.8 7.2 7.9 2.5 16.1 11.2
Insect infestation 26.9 4.5 10.8 7.8 2.0 6.5 30.3 11.2
Source: Arbitrage Consult Limited Field Work
For a more detailed breakdown and total percentages across the country refer to table 6.
Adamawa Anambra Bauchi Delta Kano Oyo Rivers FCT/Abuja0.05.0
10.015.020.025.030.035.040.0
Fig.8; Natural Risks and Hazards Across States
Heavy rainfall Erosion FloodDrought Strong winds Insect infection
Source: Arbitrage Consult Limited Field Work
24

Delta State (25.4%) informal sector workers are the worst hit in terms of heavy rainfall while Kano
State (1.6%) informal sector workers are the least affected by heavy rainfall. Delta State (38.7%)
informal sector workers are still the worst affected by erosion while Oyo State (0.8%) are the least
disturbed by erosion. Informal sector workers in Delta State (31.3%) are the worst hit by flood as
compared to those in Bauchi State (2.0%). Informal sector workers in Oyo state face the highest
drought risks and hazards as compared to Kano State (1.8%) informal sector workers who face the
least drought risks. Strong winds pose the greatest risks and hazards for the informal sector
workers in Bauchi State while Oyo State informal sector workers are sparingly affected by strong
winds. Insect infestation takes its greatest toll on informal sector workers in Rivers State while
Kano State informal sector workers are the least affected by insect infestation.
3.2.2. Health Risks and Hazards
Overall in Nigeria, illness (39.0%) poses the most vicious health risk and hazard for informal sector
workers in Nigeria. This is immediately followed by work injuries (26.4%) and accidents (16.7%).
Illness (39.0%)
Injury (26.4%)
Accidents (16.7%)
Epidemic (13.3%)
Disability (4.6%)
Table 9. Displays the health related risks and hazards of informal sector workers in Nigeria
Health
RisksAdamawa Anambra Bauchi Delta Kano Oyo Rivers FCT/Abuja
Illness 18.3 9.0 6.6 6.7 17.1 7.6 12.5 22.4
Injury 20.6 7.2 2.5 4.1 21.0 10.9 13.1 20.5
Accidents 7.0 9.8 8.0 7.7 19.3 16.4 15.7 16.1
Disability 0.7 36.7 3.6 2.5 37.0 2.5 12.8 4.3
Epidemic 18.2 20.8 2.9 8.1 0.5 1.5 19.9 28.1
Source: Arbitrage Consult Limited Field Work
For a more detailed breakdown and total percentages across the country refer to table 6.
25

Adamawa Anambra Bauchi Delta Kano Oyo Rivers FCT/Abuja0.05.0
10.015.020.025.030.035.040.0
Fig.9; Health Risks
Illness Injury Accidents Disability Epidemic
Source: Arbitrage Consult Limited Field Work
The survey results show that informal sector workers in Abuja/FCT (22.4%) face the worst illness
situation in contrast to Delta State (6.7%) informal sector workers who are unperturbed with the
risks of illness. As regards injuries, the survey found that Kano State (21.0%) informal sector
workers are the most injury prone in contrast to Bauchi State (2.5%) informal sector workers. Still
Kano State (19.3%) informal sector workers are the most accident prone as compared to informal
sector workers in Adamawa State (7.0%) who had the least burden with accidents. Still, Kano State
has the highest percentage of disability amongst informal sector workers whilst Adamawa State
has the least in terms of disability. Informal sector workers in Abuja/FCT suffer more epidemic
risks than all the other States’ informal sector workers.
3.2.3. Lifecycle Risks and Hazards
In Nigeria as a whole, the most sinister lifecycle risk is death (35.2%), followed by birth (19.3%)
and old age (16.8%).
Death (35.2%)
Birth (19.3%)
Old age (16.8%)
Family breakup (14.7%)
Maternity (14.0%)
26

Table 10. Displays the lifecycle Risks and Hazards faced by the Informal Sector Workers in Nigeria
Life cycle Adamawa Anambra Bauchi Delta Kano Oyo Rivers FCT/Abuja
Birth 0.8 22.8 7.6 1.6 0.8 4.1 11.4 50.9
Maternity 1.1 6.3 1.9 1.9 1.1 3.0 23.1 61.6
Old age 34.6 0.9 29.3 3.1 3.4 2.2 17.4 9.0
Family Beak up 2.8 6.4 41.6 11.7 4.6 11.7 11.4 9.6
Death 3.4 9.5 24.2 4.7 0.9 10.4 18.5 28.3
Source: Arbitrage Consult Limited Field Work
For a more detailed breakdown and total percentages across the country refer to table 6.
Adamawa Anambra Bauchi Delta Kano Oyo Rivers FCT/Abuja0.0
10.0
20.0
30.0
40.0
50.0
60.0
70.0
Fig.10; Life cycle risks
Birth Maternity Old age Family Beak up Death
Source: Arbitrage Consult Limited Field Work
Abuja/FCT (50.9%) informal sector workers face the highest birth risks as compared to Adamawa
State informal sector workers who face the least birth threat risks among the sampled states.
Similarly, the trend remains the same for maternity risks with Abuja/FCT (61.6%) the highest and
Adamawa State informal sector workers share a joint lowest (1.1%) with Kano State informal
sector workers. Adamawa State informal sector workers have the highest old age risk (34.6%)
while Anambra State has the least (0.9%). Family breakups are most predominant amongst Bauchi
State (41.6%) informal sector workers while it is least amongst informal sector workers in
Adamawa State (2.8%). Death risk amongst informal sector workers is highest in Abuja/FCT
(28.3%) as compared to Kano State (0.9%) which is the lowest.
27

3.2.4. Economic Risks and Hazards
Across the country, business/financial failure (35.6%) accounts for the highest economic risk, and
then closely followed by unemployment (32.0%) as well as harvest collapse (18.7%).
Business/financial failure (35.6%)
Unemployment (32.0%)
Harvest collapse (18.7%)
Resettlement (9.9%)
Currency risk (2.0%)
Technology/trade risk (1.7%)
Table 11. Shows the economic risks and hazards threatening Nigerian informal sector workers
Economic Risks Adamawa Anambra Bauchi Delta Kano Oyo Rivers FCT/Abuja
Unemployment 4.3 4.3 18.3 19.0 0.4 11.9 26.3 15.5
Harvest collapse 31.0 19.6 9.9 6.6 1.5 7.4 4.3 19.6
Business/financial
failure 29.9 12.0 10.87.6
1.7 5.6 11.7 20.6
Resettlement 3.3 10.5 4.8 3.8 3.3 5.3 4.3 64.6
Currency risk 0.0 14.0 0.0 7.0 41.9 0.0 4.7 32.6
Technology risk 0.0 22.9 2.9 8.6 2.9 0.0 45.7 17.1
Source: Arbitrage Consult Limited Field Work
For a more detailed breakdown and total percentages across the country refer to table 6.
Adamawa Anambra Bauchi Delta Kano Oyo Rivers FCT/Abuja0.0
10.020.030.040.050.060.070.0
Fig.11; Economic risks
Unemployment Harvest collapse Business/financial failureResettlement Currency risk Technology/trade risk
Source: Arbitrage Consult Limited Field Work
28

Survey results show that Rivers State (26.3%) informal sector workers appear to face the most
unemployment risk while Kano State (0.4%) is the least in that category. Informal sector workers
in Adamawa State (31.0%) are the most embattled with harvest collapse while Kano State (1.5%)
informal sector workers are the least affected. Adamawa State (29.9%) informal sector workers
face the greatest business/financial while Kano State (1.7%) informal sector workers are the least
affected with business/financial failure. Abuja/FCT (64.6%) informal sector workers are the most
beleaguered with resettlement risks while Adamawa and Kano States’ (3.3%) informal sector
workers have a joint least worry of the risk. Kano State (41.9%) informal sector workers face the
greatest currency risk while the least is Rivers State (4.7%) informal sector workers but Adamawa,
Bauchi and Oyo states’ informal sector workers are never confronted with currency risk. Rivers
State (45.7%) informal sector workers are the most exposed to technology risk while Bauchi and
Kano States’ (2.9%) informal sector workers share a joint lowest; although, Adamawa and Oyo
States’ informal sector workers are unaffected by technology risk.
3.2.5. Social Risks and Hazards
The most predominant social risk across the country is conflict (51.8%), followed by crime (27.5%)
and domestic violence (20.7%).
Table 12. Displays social risks and hazards
Social risks Adamawa Anambra Bauchi Delta Kano Oyo Rivers FCT/Abuja
Crime 10.0 10.0 2.3 8.5 3.1 6.5 29.6 23.1
Domestic Violence 19.9 19.9 6.1 23.0 2.0 9.2 15.8 18.4
Conflict 7.3 7.3 1.8 10.4 7.1 13.3 18.0 10.4
Source: Arbitrage Consult Limited Field Work
29

Adamawa Anambra Bauchi Delta Kano Oyo Rivers FCT/Abuja0.0
5.0
10.0
15.0
20.0
25.0
30.0
Fig.12; Social Risks
Crime Domestic Violence Conflict
Source: Arbitrage Consult Limited Field Work
Across the nation, Rivers State (29.6%) informal sector workers are the most undermined with
crime risks while Bauchi State (2.3%) informal sector workers are the least affected by crime risks.
Delta State (23.0%) informal sector workers are the most plagued with domestic violence while
Kano State informal sector workers are the least disturbed with domestic violence. Similar to
crime risks, the highest conflict risk is found amongst Rivers State (18.0%) informal sector workers
while the least is found among Bauchi State (1.8%) informal sector workers.
3.2.6. Environmental Risks and Hazards
In Nigeria, the major environmental risk is air pollution (38.6%), followed by oil spillage (33.0%),
land degradation (18.2%) and Land deforestation (10.2%).
Table 13. Environmental risks
Environmental risks Adamawa Anambra Bauchi Delta Kano Oyo Rivers FCT/Abuja
Land deforestation 20.2 27.0 0.0 0.0 6.7 5.6 33.7 6.7
Oil spillage 0.0 0.3 0.3 10.1 1.7 1.7 85.7 0.0
Land degradation 50.0 3.8 2.5 5.1 1.3 3.8 20.9 12.7
Air Pollution 5.1 0.9 0.9 3.3 0.0 0.0 84.5 5.4
Source: Arbitrage Consult Limited Field Work
For a more detailed breakdown and total percentages across the country refer to table 6.
30

Adamawa Anambra Bauchi Delta Kano Oyo Rivers FCT/Abuja0.0
10.0
20.0
30.0
40.0
50.0
60.0
70.0
80.0
90.0
Fig.13; Environmental risks
Land deforestation Oil spillage Land degradation Pollution
Source: Arbitrage Consult Limited Field Work
Rivers State informal sector workers face the highest environmental risks in terms of land
deforestation (33.7%), oil spillage (85.7%), and air pollution (84.5%). Bauchi and Delta States’
informal sector worker are not challenged by land deforestation. Abuja/FCT and Adamawa State
informal sector workers are unaffected by oil spillage. Adamawa State (50%) informal sector
workers face the most incessant land degradation in the country while Kano State (1.3%) informal
sector workers are the least affected. Informal sector workers in Kano and Oyo States are
unaffected by air pollution.
3.3. Coping Strategies
The coping strategies illustrate ways the informal sector workers/employers resort to meeting
their needs. Examples include; using own savings, receive assistance from government, NGO,
family, workers/town/religious unions etc.
Table 14. Displays the coping strategies of the informal sector workers
How do you cope with the risks when they occur?
A B C D E F G H I J total
(1) (2) (3)
Adamawa Freq. 547 199 15 32 4 0 48 2 0 66 2 7 922
31

% w/in 59.3 21.6 1.6 3.5 0.4 0.0 5.2 0.2 0.0 7.2 0.2 0.8 100.0
% across 11.3 6.5 4.7 8.4 1.4 0.0 27.0 1.4 0.0 29.5 3.8 5.2
Anambra Freq. 533 231 75 129 66 12 8 5 3 13 3 9 1087
% w/in 49.0 21.3 6.9 11.9 6.1 1.1 0.7 0.5 0.3 1.2 0.3 0.8 100.0
% across 11.0 7.5 23.4 33.9 22.8 6.8 4.5 3.6 4.7 5.8 5.8 6.7
Bauchi Freq. 444 579 13 37 11 9 1 6 1 5 3 1 1110
% w/in 40.0 52.2 1.2 3.3 1.0 0.8 0.1 0.5 0.1 0.5 0.3 0.1 100.0
% across 9.2 18.8 4.1 9.7 3.8 5.1 0.6 4.3 1.6 2.2 5.8 0.7
Delta Freq. 638 407 57 20 31 58 10 53 2 21 5 7 1309
% w/in 48.7 31.1 4.4 1.5 2.4 4.4 0.8 4.0 0.2 1.6 0.4 0.5 100.0
% across 13.2 13.2 17.8 5.3 10.7 33.0 5.6 37.9 3.1 9.4 9.6 5.2
Kano Freq. 1100 669 57 73 79 8 31 15 7 18 3 17 2077
% w/in 53.0 32.2 2.7 3.5 3.8 0.4 1.5 0.7 0.3 0.9 0.1 0.8 100.0
% across 22.8 21.7 17.8 19.2 27.2 4.5 17.4 10.7 10.9 8.0 5.8 12.6
Oyo Freq. 400 352 29 20 17 6 8 46 13 77 27 53 1048
% w/in 38.2 33.6 2.8 1.9 1.6 0.6 0.8 4.4 1.2 7.3 2.6 5.1 100.0
% across 8.3 11.4 9.1 5.3 5.9 3.4 4.5 32.9 20.3 34.4 51.9 39.3
Rivers Freq. 543 340 48 53 61 53 40 1 10 2 4 12 1167
% w/in 46.5 29.1 4.1 4.5 5.2 4.5 3.4 0.1 0.9 0.2 0.3 1.0 100.0
% across 11.2 11.0 15.0 13.9 21.0 30.1 22.5 0.7 15.6 0.9 7.7 8.9
Abuja/
FCT
Freq. 625 307 26 16 21 30 32 12 28 22 5 29 1153
% w/in 54.2 26.6 2.3 1.4 1.8 2.6 2.8 1.0 2.4 1.9 0.4 2.5 100.0
% across 12.9 10.0 8.1 4.2 7.2 17.0 18.0 8.6 43.8 9.8 9.6 21.5
Total Freq. 4830 3084 320 380 290 176 178 140 64 224 52 135 9873
% w/in 100.
0
100.0 100.0 100.0 100.
0
100.0 100.0 100.0 100.
0
100.0 100.0 100.0
% across 48.9 31.2 3.2 3.8 2.9 1.8 1.8 1.4 0.6 2.3 0.5 1.4 100.0
Source: Arbitrage Consult Limited Field Work
A. I take care of it myself; B. Receive assistance from family; C. Receive assistance from workers or market union; D(1).
Receive assistance from local government; D(2). Receive assistance from state government;
D(3). receive assistance from federal government; G. receive assistance from NGO'S; H. received help from
communities/town association; I. receive assistance from employer; J. receive assistance from religious organization;
K. receive assistance from worker association; L. others
32

Overall, about 48.9% of Nigerian informal sector workers individually deal with shocks whenever
they occur, while about 31.2% receive assistance from family members. The other forms of
assistance make up the remaining 20% in varying percentages.
0.010.020.030.040.050.0
Fig.14; Coping Strategies
Source: Arbitrage Consult Limited Field Work
Table 15. How do you cope with the risks when they occur?
How do you cope with the risks when they occur?
A B C D E F G H I J K L
Adamawa 59.3 21.6 1.6 3.5 0.4 0.0 5.2 0.2 0.0 7.2 0.2 0.8
Anambra 49.0 21.3 6.9 11.9 6.1 1.1 0.7 0.5 0.3 1.2 0.3 0.8
Bauchi 40.0 52.2 1.2 3.3 1.0 0.8 0.1 0.5 0.1 0.5 0.3 0.1
Delta 48.7 31.1 4.4 1.5 2.4 4.4 0.8 4.0 0.2 1.6 0.4 0.5
Kano 53.0 32.2 2.7 3.5 3.8 0.4 1.5 0.7 0.3 0.9 0.1 0.8
Oyo 38.2 33.6 2.8 1.9 1.6 0.6 0.8 4.4 1.2 7.3 2.6 5.1
Rivers 46.5 29.1 4.1 4.5 5.2 4.5 3.4 0.1 0.9 0.2 0.3 1.0
Abuja/FCT 54.2 26.6 2.3 1.4 1.8 2.6 2.8 1.0 2.4 1.9 0.4 2.5
Total 48.9 31.2 3.2 3.8 2.9 1.8 1.8 1.4 0.6 2.3 0.5 1.4
Source: Arbitrage Consult Limited Field Work
33

A. I take care of it myself; B. Receive assistance from family; C. Receive assistance from workers or market union; D.
receive assistance from local government; E. receive assistance from state government; F. receive assistance from
federal government; G. receive assistance from NGO'S; H. received help from communities/town association; I. receive
assistance from employer; J. receive assistance from religious organization; K. receive assistance from worker
association; L. others
Overall, about 48.9% of Nigerian informal sector workers individually deal with shocks whenever
they occur. The trend across the states is very similar with a larger majority of informal sector
workers having to deal with risks and hazards when they occur. At least 38% of the informal sector
workers in Oyo state deal with risks and hazards themselves while 59.3% of the informal sector
workers in Adamawa State muddle through on their own. The largest percentage of informal
sector workers who receive help from family members are the informal sector workers from
Bauchi State (52.2%) while the least percentage are informal sector workers from Anambra State
(21.3%).
3.4. Cross Tabulation of Some Key Variables
The cross tab report will show or establish the relationship existing between variables. This
provides us with a side-by-side comparison of the differences (and similarities) of the study
variables.
3.4.1. Gender and age of informal sector workers in Nigeria
What is the gender distribution with respect to age brackets of the informal sector workers
in Nigeria?
Table 16. Cross tab of gender and age brackets of informal sector workers
Gender Age Brackets Total
0-14 15-29 30-44 45-59 60-74
male Count 298 1842 2961 1604 502 7207
% within gender 4.1% 25.5% 41.2% 22.2% 6.9% 100.0%
% within age 38.7% 69.4% 68.0% 70.4% 78.2% 67.4%
female Count 472 812 1394 675 140 3493
% within gender 13.5% 23.2% 40.1% 19.2% 4.0% 100.0%
% within age 61.3% 30.6% 32.0% 29.6% 21.8% 32.6%
Total Count 770 2654 4355 2279 642 10700
% within gender 7.2% 24.8% 40.7% 21.3% 6.0% 100.0%
34
% within age 100.0% 100.0% 100.0% 100.0% 100.0% 100.0%
Source: Arbitrage Consult Limited Field Work
About 40.7% of the survey respondents were found to be within ages 30-44 years, out of which
68% are males while 32% females. 24.8% of the survey respondents were found to be between
15-29 years old, out of which 69.4% are males while 30.6% are females. Another 21.3% of the
informal sector workers surveyed belonged to the age bracket 45-59 years old, of which 70.4% are
males while 29.6% are females. Within the age group 0-14 years, 38.7% are males while 61.3% are
females. Finally, within the age group 60-74 years, 78.2% are males while 21.8% are females.
About 86.9% are actually considered to be within the economically active age groups between 15-
59 years old. However, those outside these economically active age groups are of another
particular type of interest. Those informal sector workers below 15 years of age could be
attributed to child labour or a form of cheap and free labour (unpaid family worker). More female
children about 61.3% are actually found within the age bracket (0-14), in contrast to more aged
male folks about 78.2% within the age bracket (60-74). This calls for immediate protection of
school age children engaged in the informal activities and/or employment, while old age security
pensions be considered for the elderly as practiced in Canada and other advanced countries of the
world. The informal sector workers within the economically active age groups should be
considered under their social protection needs as we will discuss hereafter.
3.4.2. Risks and hazards with respect to the age brackets
Which age brackets are the most susceptible to the different types of risks and hazards?
Table 17. Cross tab of risks and hazards with age brackets
Risks and Hazards Age brackets
(0-14) (15-29) (30-44) (45-59) (60-74)
Natural Risks Frequency 168 642 1,141 724 182
No 96.7 86.2 75.5 84.4 96.1
Yes 3.6 13.8 24.5 15.6 3.9
Health Risks Frequency 251 809 1435 773 227
35

No 95.9 86.8 76.6 87.4 96.3
Yes 4.1 13.2 23.4 12.6 3.7
Life Cycle Risks Frequency 36 128 222 121 31
No 98.1 93.3 88.4 93.7 98.4
Yes 1.9 6.7 11.6 6.3 1.6
Economic Risks Frequency 84 124 282 139 36
No 96.0 94.1 86.6 93.4 98.3
Yes 4.0 5.9 13.4 6.6 1.7
Social Risks Frequency 12 28 76 37 11
No 98.7 97.0 92.0 96.1 98.8
Yes 1.3 3.0 8.0 3.9 1.2
Environmental
Risks
Frequency 13 66 118 119 30
No 98.5 92.4 86.4 86.3 96.5
Yes 1.5 7.6 13.6 13.7 3.5
Source: Arbitrage Consult Limited Field Work
Natural Risks: Across the entire sampled states, about 3 in 10 of the total survey respondents are
susceptible to natural risks. The age bracket 30-44 years is the most susceptible to natural risks
(24.5%), followed by the age bracket 45-59 years (15.6%), while the least susceptible age bracket
is 0-14 years (3.9%).
Health Risks: About 4 in 10 of the entire survey respondents in all the sampled states are
susceptible to health risks. Ages 30-44 were the most susceptible to health risks (23.4%), followed
by ages 15-29 (13.2%) while the least susceptible age bracket is 0-14 (4.1%).
Lifecycle Risks: Generally, only about 1 in 20 of the survey respondents are susceptible to lifecycle
risks. However, the age bracket 30-44 years accounted for about 11.6% of the survey respondents
who were susceptible to lifecycle risks, followed by the age bracket 15-29 years (6.7%), while the
age bracket least susceptible to lifecycle risks is 60-74 years (1.6%).
Economic Risks: The survey found that about 1 in 10 of the respondents are susceptible to
economic risks across the sampled states. 11% of the entire respondents are within the age
bracket 30-44 years, followed by the age bracket 45-59 years who are about 6.6%, while the least
age bracket affected by economic risks is 60-74 years (1.7%).
36

Social Risks: Overall, only about 1 in 100 of the survey respondents are susceptible to social risks.
The age bracket 30-44 years are the most susceptible to social risks (8%), followed by the age
bracket 45-59 years (3.9%), while the least is the age bracket 60-74 years (1.2%).
Environmental Risks: About 1 in 20 of the survey respondents were found to be susceptible to
environmental risks. About 13.7% of those susceptible were within the age bracket 45-59 years,
followed by the age bracket 30-44 years (13.6%), while the least susceptible age bracket is 0-14
years (1.5%).
3.4.3. Risks and hazards with respect to primary sources of livelihood
Considering the three principal occupation/primary sources of livelihood of Nigerian in formal
sector workers, what risks and hazards do they usually encounter?
Table 18. Cross tab of risks and hazards with primary sources of livelihood
Risks and Hazards Primary source of livelihood
Private services Trade Agriculture
Natural Risks Frequency 4,676 2,664 1,327
No 57.2% 72.5% 13.3%
Yes 42.8% 27.5% 86.7%
Health risks Frequency 6,560 1,505 753
No 38.7% 43.5% 43.3%
Yes 61.3% 56.5% 56.7%
Life-cycle risks Frequency 3,405 538 329
No 48.1% 64.3% 56.3%
Yes 51.9% 35.7% 43.7%
Economic risks Frequency 1,583 209 118
No 53.5% 61.2% 64.2%
Yes 46.5% 38.8% 35.8%
Social risks Frequency 726 102 74
No 69.6% 80.2% 76.0%
Yes 30.4% 19.8% 24.0%
Environmental Risks Frequency 501 86 63
No 51.9% 68.9% 63.0%
37

Yes 48.1% 31.1% 37.0%
Source: Arbitrage Consult Limited Field Work
Generally, Nigerian informal sector traders expressed the most anxiety over health risks and
hazards (56.5%), which include illness, injury, accidents, epidemics etc. Subsequently, economic
risks and hazards (38.8%), lifecycle risks and hazards (35.7%), environmental risks and hazards
(33.1%) etc. as presented below.
Trade (Retail/wholesale)
o Health risks (56.5%)
o Economic risk (38.8%)
o Life cycle risk (35.7%)
o Environmental risk (31.1%)
o Natural risks (27.5%)
o Social risk (19.8%)
Overall, informal workers in the agricultural sector are foremost affected by natural risks and
hazards (86.7%), followed by health (56.7%) and lifecycle risks and hazards (43.7%) among the
three major types of risks and hazards.
Agriculture (crop, livestock and fish farmers)
o Natural risks (86.7%)
o Health risks (56.7%)
o Life cycle risk (43.7%)
o Economic risk (35.8%)
o Social risk (24.0%)
o Environmental risk (37.0%)
On the whole, health (61.3%) risks and hazards soar above all other risks and hazards militating
against the activities of private service providers. Following is lifecycle (51.9%) and environmental
(48.1%) risks and hazards.
38

Private services (shoe shiners, hair stylists, water vendors, etc.)
o Health risks (61.3%)
o Life cycle risk (51.9%)
o Environmental risk (48.1%)
o Economic risk (46.5%)
o Natural risks (42.8%)
o Social risk (30.4%)
39

Section 4
Recommendations
This study has shown that enormous risks and hazards abound in the Nigerian informal sector,
which is unattended to by government, employer organizations or compensated for. Health
promotes wealth and productivity; nonetheless, over 60% of the economic active groups are
established in the informal sector. It will not be wrong to say that a more holistic approach be
applied to ameliorating the health occupational safety challenges of this very significant sector
since it constitutes a larger proportion of the economically active age groups, rather than focus on
government employees who are just a fraction of the economically active populace.
Many protective laws, policies, programs and projects, involving multiple state and non-state
actors are scattered, ill coordinated and the general impact of these have been limited. It is
therefore not just about building new systems and new programs. It is also about assessing the
effectiveness or rather weaknesses of existing systems and programs.
The three major risks and hazards informal sector workers face are health, economic and lifecycle
related. Policies should be geared towards:
Health insurance schemes for informal sector workers: A special health insurance scheme
to cover informal sector workers should be designed or better still the NHIS coverage be
extended to informal sector workers;
Economic policies to encapsulate the informal sector workers: Streamlining existing micro-
credit schemes to suit the financial capacity of informal sector workers and repayments
should be made more flexible with competitive interest rates, as the current economic
policies do not truly consider the low income earners;
Lifecycle insurance for informal sector workers: Contributory old age pension and
retirement schemes should be designed for informal sector workers;
Natural disaster management and contributory schemes: Especially for agriculturists who
face the highest natural risks and hazards, special intervention programs such as
40

agricultural insurance schemes should be designed for informal sector farmers to be able
to withstand the long lasting effects of natural shocks; and enlightenment campaigns on
natural disaster management for informal sector workers be conducted more regularly;
Reducing social risks: Improve response to domestic violence, create strategic community
safety measures such as vigilante groups to keep watch of immediate communities against
intruders while promoting capacity building programs to enlighten the vigilante groups.
Encourage partnership between security forces and socio-economic activities of citizens;
reduce commercial robbery by improving situational prevention measures (improve
surveillance, etc.)
Employment and sustainable livelihood constitute the first entry point for income security
and social protection.
Social insurance and social assistance benefits are intended to cover contingencies arising
from reduced or non-existent earning capacity resulting from life cycle vulnerabilities,
macro-economic and other shocks.
As Government seeks to strengthen the social protection system, it is necessary to pursue
policies which foster economic and development including job creation.
World Bank's mission statement: Our dream is a world free of poverty.
41

References
Alwang, J., Siegel, P. and Jorgensen, S. (2001): Assessing Vulnerability: a View from Different Disciplines, Social Protection Discussion Paper No. 0115, Washington, D.C. (The World Bank).
Asian Development Bank (2001): Framework for Operations on Social Protection—Social Protection Strategy in Asia and the Pacific, approved by the Asian Development Bank (ADB) Board in autumn 2001, Manila (ADB).
Baulch, B. and Hoddinott, J. (2000, eds.): Economic Mobility and Poverty Dynamics in Developing Countries, The Journal of Development Studies, Vol. 36, Issue 6.
Conway, T. and Norton, A. (2002): Poverty, Risk and Rights: New Directions in Social Protection, Theme issue of Development Policy Review, Vol. 20, No. 5.
Ginnekin von W. (2005), Managing risk and minimizing vulnerability: The role of social protection in pro-poor growth, second draft of paper produced for Development Assistance Directorate (DAC), Poverty Reduction Network (POVNET) Task Team on Risk, Vulnerability and Pro-Poor Growth, ILO, Geneva.
Guillaumont P., S. Guillaumont Jeanneney & J.-F. Brun, 1999, "How Instability Lowers African Growth", Journal of African Economies, vol. 8 (1), p. 87-107
Heitzmann, K., Canagarajah, R.S. and Siegel, P.B. (2002): Guidelines for Assessing Risk and Vulnerability, Social Protection Discussion Paper No. 0218, Washington, D.C. (The World Bank).
Holzmann, R. (2003) in E. Dowler and P. Mosely (eds.): Poverty and Social Exclusion in North and South, London and New York (Routledge), in print.
Holzmann, R. and Jorgensen, S. (1999): Social Protection as Social Risk Management: Conceptual Underpinnings for the Social Protection Sector Strategy Paper, Journal of International Development, Vol. 11, Issue 7, 1999, 1005-1027.
Holzmann, R. and Jorgensen, S. (2001): Social Risk Management: A New Conceptual Framework for Social Protection, and Beyond, International Tax and Public Finance, Vol. 8, No. 4, 2001, 529-556.
Holzmann, R., Gill, I., Hinz, R., Impavido, G., Musalem, A., Rutkowski, M. and Schwarz, A. (2003): Old Age Income Support for the 21stCentury—The World Bank’s Perspective on Pension Systems and Reforms, Washington, D.C. (The World Bank), in preparation
Inter-American Development Bank (IADB) 2000, Annual Report.
World Development Report (2000/2001), Attacking Poverty: Opportunity, Empowerment, and Security.
42