risk management impact assessment on the success of ... · success of strategic investment...
TRANSCRIPT
Acta Polytechnica Hungarica Vol. 13, No. 5, 2016
– 221 –
Risk Management Impact Assessment on the
Success of Strategic Investment Projects:
Benchmarking Among Different Sector
Companies
Filip Jovanović1, Nenad Milijić
2, Makedonka Dimitrova
3, Ivan
Mihajlović2
1 Faculty of Project and Innovation Management, Boze Jankovica 14, 11000
Belgrade, Serbia
2 University of Belgrade, Technical Faculty in Bor, Management Department,
Vojske Jugoslavije 12, 19210 Bor, Serbia
3 University American College Skopje, Faculty of Business Economics and
Management, Blvd. Treta makedonska brigada no.60, Skopje 1000, Macedonia
[email protected], [email protected], [email protected],
Abstract: The paper explores the impact of the main elements of the strategic investment
projects management process in South East Europe (SEE), on achieving project objectives.
The impact of different projects elements on the project’s risk management process was
also addressed. The initial hypotheses are based on literature review in the field. The
proposed hypotheses were tested by the SEM (Structural Equation Modeling) methodology
on a sample of 311 strategic investment projects in Serbia, Bosnia and Herzegovina as well
as Macedonia. The strategic projects were analyzed in companies across various business
sectors thus the obtained results represent a benchmark of risk factors’ significance
according to the project team members and managers. The benchmarking of risk factors
significance was conducted by using the PROMETHEE – GAIA methodology. The results
verify the adequacy of the hypothetical framework.
Keywords: risk management; strategic investment projects; project objectives
1 Introduction
Strategic projects (SP) are of great significance for organizations, as they enable
environment for realization of strategic objectives. The SP may vary from major
investment projects, such as, construction of a new factory or plant, introduction
F. Jovanović et al. Risk Management Impact Assessment on the Success of Strategic Investment Projects: Benchmarking Among Different Sector Companies
– 222 –
of modern technology, improvement of energy efficiency etc., to somewhat
smaller projects such as information system introduction, development and
implementation of a new organizational structure, quality system introduction or
similar.
Asrilhant et al. suggested that the strategic projects are necessary when an
organization strives to achieve its long-term objectives and development [1]. In
this respect, Schoemaker defines the strategic projects as a manner of
implementation and realization of a sound organizational vision [2]. Moreover,
SPs are connected to the main investments of the companies and often bear
considerable risk and uncertainty, intangible benefits and enable attractive long-
term financial benefit [3, 4].
The strategic project management process helps achieve the projects’ successful
implementation, including the financial and the non-financial outcomes, as well
as, the benefits. Strategic project management includes two primary phases: the
evaluation phase and the monitoring phase [5]. The evaluation phase includes
development, planning and the evaluation of the strategic projects as well as the
project approval. The strategic projects’ monitoring phase envisages the project
management, the control and possible adaptation processes in case of necessity
[1]. Efficient strategic project management may be achieved if the responsible
project manager and the project team perform in accordance with the evaluation
and monitoring phase requirements; all based on the predefined influence
elements [6]. The process involves application of contemporary methods and
techniques necessary to achieve efficient management of the strategic projects [7].
In practice, strategic investment projects most frequently apply the following
techniques for their evaluation and monitoring: the return on investment, the net
present value, the internal rate of return, the repayment period, the cost benefit
analysis, the sensitivity analysis, the decision tree, the risk analysis, the
forecasting methods, the game theory, the simulation etc. [1]. Selection process of
the methods and techniques to be used in the strategic project management
process involves prior analysis and assessment to which extend certain methods
and techniques would be applied, if applicable at all [8].
The evaluation and the forecasting of future undertakings, processes and activities
are accompanied by uncertainty and risk. Some future project settings might bear
risk that could lead to negative and in rare cases positive impact on the project
implementation [9]. This is the reason that the project management process entails
appropriate project risk management. According to Kerzner, the risk management
is an action or an exercise for dealing with risk [10]. The project risk management
includes several related actions, such as the risk planning, the identification and
analysis of risk events, the development of strategies for risk handling and
monitoring, all oriented towards the project success [11]. Successful risk control
and management in the strategic investment projects may lead towards the
successful projects’ implementation. The level of success may be estimated by
application of an appropriate criterion [12].

Acta Polytechnica Hungarica Vol. 13, No. 5, 2016
– 223 –
This research paper focuses on the strategic investment projects’ (SIP)
management processes in the companies from the industrial and the non-industrial
sectors in South-Eastern Europe (SEE), in particular from Serbia, Macedonia and
Bosnia and Herzegovina. Research results from all three countries were analyzed
simultaneously. We can explain this decision based on the similarity of all three
countries. Namely, not long ago they were Member States of one country,
Yugoslavia. Even today, political, economic, social and technological factors do
not differ much in all three environments and therefore, we assumed that there
should not be much differences in the responses. This research endeavor targets
the risk management process, primarily in terms of understanding the effective
management process at SIP. Therefore, the objective of this paper is to analyze the
impact of the main elements of the risk management processes at SIP in SEE on
the achievement of the project goals as well as the impact of the project elements
on the risk management process. The importance of the risk factors, were
determined, by benchmarking, in accordance with the opinion of the project
managers and team members operating across different sectors.
2 Theoretical Framework and Research Hypotheses
The research framework of this work was preceded by extensive analysis of the
available literature in the field of SIP risk management. Numerous recently
published research papers pointed out to the relationship between the appropriate
methods for the risks analysis and assessment based on the factors of significance
for the decision makers, for evaluation of the overall success of SIP [13, 14, and
15]. Therefore, we have defined the first research hypothesis of this paper as
follows:
H1: The application of the methods for risk analysis and assessment is directly
related to the risk factors significant for the success of the company’s projects
Given the significant relationship between the methods used for the analysis and
assessment of risks and the risk factors that are primarily manageable [16, 17, 18],
we have defined the second research hypothesis as follows:
H2: The application of methods for risk analysis and assessment is directly
related to risk factors of significance for project risk management
The contemporary literature dealing with project risk management identifies that
the analysis of risk factors is significant for the project’s success and their
relationship with the risk management success [19, 20, 21]. The following
hypothesis is based on the previous findings:
H3: The risk factors of significance for the success of a company’s projects
influence the risk management results

F. Jovanović et al. Risk Management Impact Assessment on the Success of Strategic Investment Projects: Benchmarking Among Different Sector Companies
– 224 –
Analysis of the factors significant for risk management and their relationship with
the success of risk management is featured in a many research publications as well
[22, 23, 24]. Based on results of the authors of the aforementioned papers, the
following hypothesis is proposed as:
H4: The factors of significance for project risk management affect the risk
management results
On the other hand, some of the latest papers dealing with the correlation of
elements of significance to SIP control, and the applied methods for project
management [25, 26, 27], have led to the proposal of the following hypothesis:
H5: The elements of significance for the control of the strategic investment project
are directly correlated to the methods for strategic investment project
management
Apart from that, numerous authors emphasize that the applied methods for SIP
management are directly related to a significant criteria for measuring the project
success [28, 29, 30]. Therefore, the following hypothesis is further defined as:
H6: The methods for strategic investment project management are directly
correlated to the main criteria for measuring project success
In addition to the six research hypotheses, the following statements would be
considered axioms, since they are widely accepted in theory and practice [9, 31,
32, 33].
A1: The results of the project risk management affect the results of the strategic
investment project management
A2: The main criteria for measuring the project success affect the results of the
strategic investment project management
3 Sample and the Data Collection
The research objective of this paper is to understand the extent to which the risk
management process of SIP may be characterized by a set of elements, set forth by
the project managers as the most significant ones and which are in accordance
with the wide range of data available in the literature related to the topic. The
identified elements of significance were then grouped in several groups of
research questions. The data collection in this particular research used the
questionnaire based methodology [1, 31].
The questionnaire consisted of two parts. The first part consisted of 10 (ten)
control questions of a demographic character relevant to the surveyed sample
(project-oriented companies, respondents and projects). The second part of the

Acta Polytechnica Hungarica Vol. 13, No. 5, 2016
– 225 –
questionnaire featured 42 questions in the field of risk management and significant
factors for SIP management, all divided into appropriate groups defined in
accordance to proposed hypothesis, as presented in the Appendix 1. Based on the
questionnaire, the opinions of the project managers on the importance of the
methods for analysis and assessment of project risk were reviewed (1st group of
questions – G1), along with risk factors having the greatest impact on the projects’
success (2nd
group of questions – G2), then the most significant factors for the
project risk management (3rd
group of questions – G3), the elements significant in
the process of SIP control (4th
group of questions – G4), the methods for the
evaluation and control of SIPs (5th
group of questions – G5), as well as the main
criteria for measuring the success of SIPs (6th
group of questions – G6). The
impact of each of these groups of factors on the achieved results of project risk
management (Key Question 1 - Q1), as well as the success of management of SIPs
of the investigated companies (Key Question 2 – Q2) were then analyzed.
The Likert scale was used to measure the different levels of significance, where 1
represents the lowest significance (I absolutely disagree) and 5 represent the
highest significance (I absolutely agree). Also, certain questions were of a
dichotomous character (yes/no). In order to collect relevant data, project managers
and project team members were sampled, in particular those in charge for SIP
management or those involved with SIP on frequent basis. A total of 400
questionnaires were sent to potential respondents, 311 of which, were fully
completed within the stipulated deadline from Serbia, Bosnia and Herzegovina
and Macedonia. A relatively high response rate was achieved, owing to the
persistence and the direct contact between the researchers of this paper and the
surveyed managers and employees. Employees–non-managers were also included
in the research, with the condition that they were engaged in the project teams of
the company. Detailed demographic indicators of the companies are presented in
Table 1.
Table 1
Profiles of companies, respondents and projects
Characteristics N %
Company
(N=311)
Field of the company IT 50 16.08
Finance 13 4.18
Energy sector 29 9.32
Public administration 31 9.97
Traffic 13 4.18
Education 49 15.76
Scientific-research 71 22.83
Other 55 17.68
Number of
employees
<10 57 18.33
11-50 102 32.80
51-250 121 38.91

F. Jovanović et al. Risk Management Impact Assessment on the Success of Strategic Investment Projects: Benchmarking Among Different Sector Companies
– 226 –
251-1000 31 9.96
>1000 0 0
Respondent
(N=311)
Age <29 58 18.65
30-44 81 26.04
45-54 65 20.90
>55 107 34.41
Years spent in the
company
<5 172 55.31
6-15 89 28.62
16-25 16 5.14
>26 34 10.93
Years of service <5 75 24.12
6-15 82 26.37
16-25 29 9.32
>26 125 40.19
Level of education Secondary vocation.
educ.
31 9.97
High education 41 13.18
Higher education 17 5.47
HE - Master 82 26.37
MA 21 6.75
PhD 119 38.26
Field of education Technical-technological 151 48.55
Legal-economics 49 15.76
Social-humanistic 81 26.04
Natural- mathematics 12 3.86
Other 18 5.79
Position in the
company
Top manager / director 123 39.55
Middle management 42 13.50
Operational level of
management
77 24.76
Employees 69 22.19
Project
(N=311)
Type of projects ICT 41 13.18
R&D 34 10.93
Construction 17 5.47
Public administration 29 9.32
Scientific-research 83 26.69
Other 107 34.41
Duration of project
implementation
<6 months 69 22.19
6 month – 2 years 213 68.49
2-5 years 29 9.32
>5 years 0 0

Acta Polytechnica Hungarica Vol. 13, No. 5, 2016
– 227 –
4 Results and Discussion
In the following text, the results of the data analysis are presented, in order to
identify the relationship among elements of SIPs, as outlined in the initial
hypothetical framework. Subsequent to the data entry into a database, we have
proceeded to data analysis using the corresponding statistical analysis tools. The
statistical analysis included the measurement of adequacy of the whole sample and
the validation of the data structure. Then the analysis of the reliability of the risk
management indicators of SIPs, placed within the appropriate factor groups, was
performed along with testing the initial hypothetical frameworks through the
application of structural equations modeling. The statistical analysis of the
collected data was performed using the software packages SPSS 18.0 and LISREL
8.80.
4.1 Measures of the Sampling Adequacy and Structure
Validation
The measure of sampling adequacy analysis was performed by using the Kaiser–
Meyer–Olkin (KMO) and Bartlett tests. Based on the recommendations of other
authors, the minimum acceptable value of the Kaiser–Meyer–Olkin indicator is
0.6 [34]. The analysis showed that the coefficient of the Kaiser–Meyer–Olkin
(KMO) sampling adequacy test, for the results of the questionnaire conducted in
this research, is 0.738, indicating that the collected data is suitable for the
application of factor analysis. Aside from that, the Bartlett test of sphericity shows
the importance (χ2 = 592.16, p < 0.000), indicating that there are acceptable
correlations among items within the measuring instrument, and that the correlation
matrix is not a unit matrix [35].
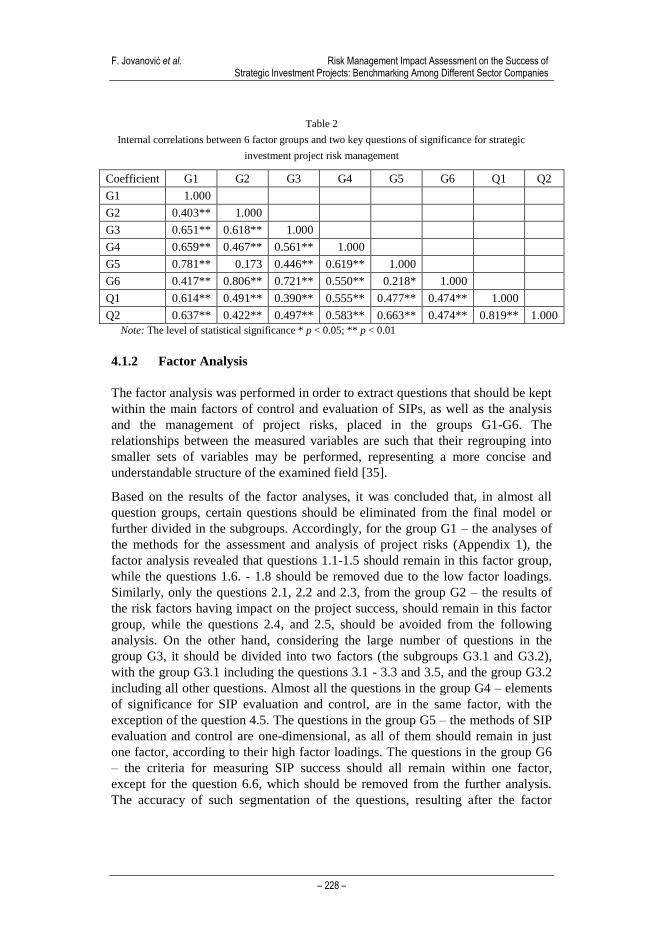
4.1.1 Correlation Matrix
The correlations between the six factor groups and the two key questions on risk
management of SIPs within the proposed model are presented in Table 2. Based
on the results in Table 2, it can be concluded that the majority of coefficients are
near or above the value of 0.5 pointing to a significant internal correlation
between the listed SIP management factors, and thus the use of factor analysis in
further research is justified [36]. Moreover, most of the correlation coefficients
have statistical significance at the level of 0.01.
F. Jovanović et al. Risk Management Impact Assessment on the Success of Strategic Investment Projects: Benchmarking Among Different Sector Companies
– 228 –
Table 2
Internal correlations between 6 factor groups and two key questions of significance for strategic
investment project risk management
Coefficient G1 G2 G3 G4 G5 G6 Q1 Q2
G1 1.000
G2 0.403** 1.000
G3 0.651** 0.618** 1.000
G4 0.659** 0.467** 0.561** 1.000
G5 0.781** 0.173 0.446** 0.619** 1.000
G6 0.417** 0.806** 0.721** 0.550** 0.218* 1.000
Q1 0.614** 0.491** 0.390** 0.555** 0.477** 0.474** 1.000
Q2 0.637** 0.422** 0.497** 0.583** 0.663** 0.474** 0.819** 1.000
Note: The level of statistical significance * p < 0.05; ** p < 0.01
4.1.2 Factor Analysis
The factor analysis was performed in order to extract questions that should be kept
within the main factors of control and evaluation of SIPs, as well as the analysis
and the management of project risks, placed in the groups G1-G6. The
relationships between the measured variables are such that their regrouping into
smaller sets of variables may be performed, representing a more concise and
understandable structure of the examined field [35].
Based on the results of the factor analyses, it was concluded that, in almost all
question groups, certain questions should be eliminated from the final model or
further divided in the subgroups. Accordingly, for the group G1 – the analyses of
the methods for the assessment and analysis of project risks (Appendix 1), the
factor analysis revealed that questions 1.1-1.5 should remain in this factor group,
while the questions 1.6. - 1.8 should be removed due to the low factor loadings.
Similarly, only the questions 2.1, 2.2 and 2.3, from the group G2 – the results of
the risk factors having impact on the project success, should remain in this factor
group, while the questions 2.4, and 2.5, should be avoided from the following
analysis. On the other hand, considering the large number of questions in the
group G3, it should be divided into two factors (the subgroups G3.1 and G3.2),
with the group G3.1 including the questions 3.1 - 3.3 and 3.5, and the group G3.2
including all other questions. Almost all the questions in the group G4 – elements
of significance for SIP evaluation and control, are in the same factor, with the
exception of the question 4.5. The questions in the group G5 – the methods of SIP
evaluation and control are one-dimensional, as all of them should remain in just
one factor, according to their high factor loadings. The questions in the group G6
– the criteria for measuring SIP success should all remain within one factor,
except for the question 6.6, which should be removed from the further analysis.
The accuracy of such segmentation of the questions, resulting after the factor
Acta Polytechnica Hungarica Vol. 13, No. 5, 2016
– 229 –
analysis, was verified using the analysis of reliability of the listed grouped
indicators of SIP risk management, presented in the following text.
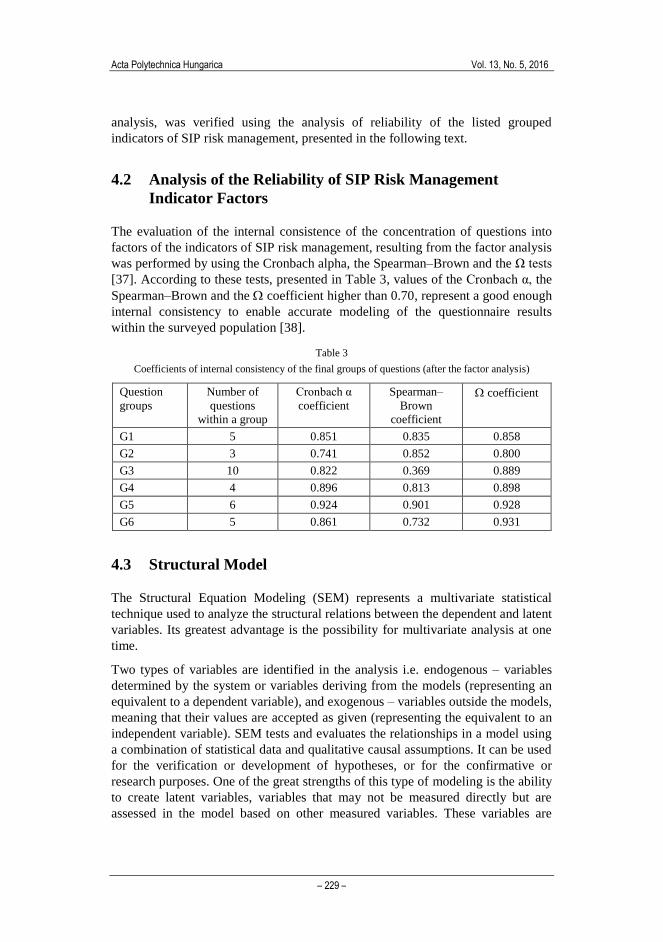
4.2 Analysis of the Reliability of SIP Risk Management
Indicator Factors
The evaluation of the internal consistence of the concentration of questions into
factors of the indicators of SIP risk management, resulting from the factor analysis
was performed by using the Cronbach alpha, the Spearman–Brown and the Ω tests
[37]. According to these tests, presented in Table 3, values of the Cronbach α, the
Spearman–Brown and the coefficient higher than 0.70, represent a good enough
internal consistency to enable accurate modeling of the questionnaire results
within the surveyed population [38].
Table 3
Coefficients of internal consistency of the final groups of questions (after the factor analysis)
Question
groups
Number of
questions
within a group
Cronbach α
coefficient
Spearman–
Brown
coefficient
coefficient
G1 5 0.851 0.835 0.858
G2 3 0.741 0.852 0.800
G3 10 0.822 0.369 0.889
G4 4 0.896 0.813 0.898
G5 6 0.924 0.901 0.928
G6 5 0.861 0.732 0.931
4.3 Structural Model
The Structural Equation Modeling (SEM) represents a multivariate statistical
technique used to analyze the structural relations between the dependent and latent
variables. Its greatest advantage is the possibility for multivariate analysis at one
time.
Two types of variables are identified in the analysis i.e. endogenous – variables
determined by the system or variables deriving from the models (representing an
equivalent to a dependent variable), and exogenous – variables outside the models,
meaning that their values are accepted as given (representing the equivalent to an
independent variable). SEM tests and evaluates the relationships in a model using
a combination of statistical data and qualitative causal assumptions. It can be used
for the verification or development of hypotheses, or for the confirmative or
research purposes. One of the great strengths of this type of modeling is the ability
to create latent variables, variables that may not be measured directly but are
assessed in the model based on other measured variables. These variables are

F. Jovanović et al. Risk Management Impact Assessment on the Success of Strategic Investment Projects: Benchmarking Among Different Sector Companies
– 230 –
actually grouping factors of certain measured variables. In order to develop a
model of structural equations, the grouping of the initial measured variables by
application of, for example, factor analysis, is performed beforehand.
Based on the conclusions drawn from the results of the statistical analysis,
especially the factor analysis described in the previous text, and in order to verify
the initial research hypotheses, the structural models for the analysis of risk in the
examined SIPs were set. The models are presented in Figure 1.
The following correlations have been verified through the structural equation
model (Figure 1a):
- The applied methods of the project risk assessment and analysis (G1) are
positively related to the risk factors that affect SIP success (G2). The correlation
level is 0.41. It may therefore be concluded that the research hypothesis H1 has
been verified.
- The applied methods of the project risk assessment and analysis (G1) are also
positively related to the risk factors that affect SIP success (G3). The correlation
level is 0.60. Verification of the hypothesis H2.
- The risk factors affecting the overall project success (G2) are positively related
to the achieved results of the project risk management (Q1). The correlation
level is 0.32. Verification of the hypothesis H3.
- The factors affecting the project risk management (G3) are also positively
related to the achieved results of the project risk management (Q1). The
correlation level is 0.37. Verification of the hypothesis H4.
- The achieved results of the project risk management (Q1) are positively related
to the success of SIP risk management (Q2). The correlation level is 0.74.
Axiom A1.
The following correlations have also been verified (Figure 1b):
- The elements of the significance in the process of SIP control (G4) are positively
related to the methods for evaluation and control of SIPs (G5), with the
correlation level of 0.41. Verification of the hypothesis H5.
- The methods for evaluation and control of SIPs (G5) are positively related to the
criteria for the measuring of SIP success (G6), with 0.40 correlation.
Verification of the hypothesis H6.
- Finally, the criterion for measuring the success of SIPs (G6) is directly related to
the success of SIP management (Q2), with correlation level of 0.59. Axiom A2.

Acta Polytechnica Hungarica Vol. 13, No. 5, 2016
– 231 –
Figure 1
Structural models for the verification of the initial research hypotheses
Considering the existence of a strong positive direct correlation between the listed
question groups, also proven in the form of combination of the direct and indirect
correlations using SEM, it may be concluded that all of the hypotheses proposed
in this research have been verified. The relationship between the two hypothetical
models (Figure 1a and Figure 1b), may be established through a common key
question, as present in both cases – the key question Q2.
F. Jovanović et al. Risk Management Impact Assessment on the Success of Strategic Investment Projects: Benchmarking Among Different Sector Companies
– 232 –
4.4 Ranking the Importance of the Project Risks
To assess the influence of the project types, based on the field of the company,
and the position of employees in organizations related to the success on risk
management of the SIPs, in addition to the success of the projects achieving
predefined goals, the Multi-Criteria Decision Analysis (MCDA) was used [39].
The MCDA methodology was based on the PROMETHEE II technique sustained
with the GAIA plane representation. Obtained MCDA results represent a
comparison of the identified project risks in analyzed companies across different
sectors. This way, it could be identified which of the risk factors are of largest
influence on success of quality, time and cost management at SIPs [40, 41].
During the process of application of the PROMETHEE II methodology, the
alternatives were ranked based on the values of their net flows, which represents a
complex ranking procedure. Moreover, this method could use the DECISION
LAB software, enabling graphical visualization of the obtained results in the form
of the GAIA plane (Geometrical Analysis for Interactive Aid) [42].
The influence of the two demographic parameters (the project type and the
position of the respondent in the organization) on the SIP risk management was
applied to the methodology as well. The initial data used in the PROMETHEE
procedure is presented in the Table 4. The values in the Table 4 are presenting the
average ranking of the individual groups of questions assessed by the employees
which are involved in different SIPs in the SEE region, at different work place
locations. For each work place, which is actually representing the position of the
employee in the project team (top manager P1, middle management level P2,
operational management level P3 and employee P4), given the researched project
types (ICT (T1), I&R (T2), civil construction works (T3), public sector (T4),
scientific research work (T5) and else (T6)), the average ranking of the employees
was calculated and presented in the Table 4.
Given that the PROMETHEE methodology includes the weight coefficient for
each selected criterion, and as such is associated with certain decision functions,
the results are presented in the Table 5. The weight coefficients can be described
as raw indicators of relative importance of each selected criterion in the analysis.
The entropic approach was used for the weights determination [43]. The Min/Max
values were based on the type of the questions and their potential impact on the
investigated factors.
The data presented in the Table 4 has been analyzed by using the software
Decision Lab 2000. The results of the full ranking based on the PROMETHEE II
method are presented in the Table 6 and the Figure 2. The visual presentation of
obtained ranking is presented in the Figure 3.

Acta Polytechnica Hungarica Vol. 13, No. 5, 2016
– 233 –
Table 4
Initial data used in the PROMETHEE multi criteria decision making analyses for the strategic
investment projects (SIP)
Criteria
Alternatives
Applied
method
s of
project
risk
assessm
ent and
analysis (G1)
Risk
factors
that
affect
SIP
success (G2)
Risk
factors
that
affect
SIP
success
(G3)
Elemen
ts of
signific
ance in
the
process
of SIP
control
(G4)
Method
s for
evaluati
on and
control
of SIP
(G5)
Main
criteria
for the
measur
ement
of SIP
success
(G6)
Did
applied
manage
ment
method
give
good
results?
(Q1)
Was the
SIP
manage
ment
success
ful?
(Q2)
ICT, Top manager / director
(T1P1) 3.40 3.90 4.00 4.10 2.60 4.30 2.00 2.00
ICT, Operational level of
management (T1P3) 1.50 2.80 2.60 2.70 2.10 2.30 1.00 1.00
R&D, Top manager / director
(T2P1) 3.10 3.70 3.60 4.40 3.60 3.80 2.00 2.00
R&D, Employees (T2P4) 2.60 4.10 3.80 4.10 2.90 4.80 2.00 2.00
Construction, Middle
management (T3P2) 2.70 4.20 4.20 4.00 3.80 4.50 2.00 2.00
Public administration, Middle
management (T4P2) 2.10 3.00 3.20 2.50 2.70 3.70 1.00 1.00
Public administration,
Employees (T4P4) 2.90 2.60 4.00 4.10 3.60 3.00 1.00 1.00
Scientific-research, Middle
management (T5P2) 2.20 4.00 4.20 3.90 1.60 4.20 1.00 1.00
Scientific-research, Operational
level of management (T5P3) 2.50 3.70 4.10 2.80 2.40 3.70 1.10 1.10
Scientific-research, Employees
(T5P4) 3.10 3.80 3.70 3.70 2.80 3.90 2.00 1.40
Other, Top manager / director
(T6P1) 2.40 3.50 3.80 3.30 2.30 3.90 1.30 1.30
Other, Operational level of
management (T6P3) 2.20 3.50 3.80 3.70 2.60 4.30 1.10 2.00
Table 5
Preference functions and weight coefficient of criterions
Criterion G1 G2 G3 G4 G5 G6 Q1 Q2
Weight
coefficient
0.1246 0.1235 0.1232 0.1240 0.1253 0.1241 0.1279 0.1275
Preference
function
Level Level Level Level Level Level Level Level
Min/Max MAX MAX MAX MAX MAX MAX MAX MAX
Based on the results of the MCDA, presented in the Table 6 and the Figures 2 and
3, it can be concluded that employees at both levels of research & development
projects (T2P1 and T2P4) are completely satisfied with the success of the project
risks management as well as the success of the projects. This was also the opinion
for the middle level managers of the civil works construction projects (T3P2).

F. Jovanović et al. Risk Management Impact Assessment on the Success of Strategic Investment Projects: Benchmarking Among Different Sector Companies
– 234 –
Conversely, the employees which strongly emphasized the negative outcomes
from the project risk management they were involved in as well as the low success
of the projects, belong to the operational level of managers at scientific/research
projects (T5P3) and middle level managers in public institutions (T4P2). The
lowest ranking of the investigated factors was obtained among the ICT projects
upon opinion obtained from the operational level managers (T1P3).
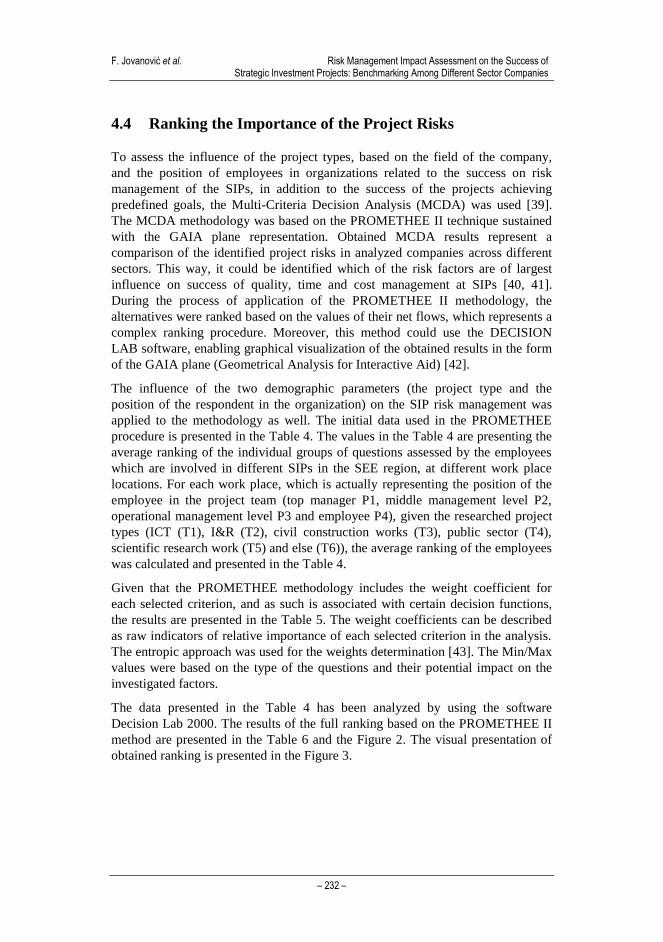
The position of the considered alternatives (triangles) identifies the strengths and
the weaknesses of the actions determining the criterions (rectangles), as presented
in the Figure 3. The closest the alternative lies to the direction of the criterion
vector, the alternative is ranked better from the point of this criterion [42]. This
way, as presented in the GAIA plane (Figure 3) the criterions Q1, Q2 and G4 have
largest influence on the ranking of the alternatives, based on their position towards
the pi vector – the decision stick (the red vector in the plane). In contrast, the
criterions G2 and G6 have the lowest influence on their decisions, based on the
position relative to the pi vector.
Table 6
Results of complete ranking of the success in the risk management of the strategic investment projects
based on the opinions of employees at different project team positions
Rank Alternatives + -
1 T3P2 0.2789 0.0057 0.2733
2 T2P1 0.2679 0.0225 0.2454
3 T1P1 0.2223 0.0171 0.2053
4 T2P4 0.2278 0.0227 0.2051
5 T5P4 0.1480 0.0630 0.0850
6 T6P3 0.1195 0.0857 0.0338
7 T4P4 0.1246 0.1762 -0.0516
8 T5P2 0.0844 0.1660 -0.0816
9 T6P1 0.0620 0.1541 -0.0922
10 T5P3 0.0507 0.1654 -0.1147
11 T4P2 0.0339 0.2834 -0.2494
12 T1P3 0.0000 0.4584 -0.4584
Figure 2
Results of the complete ranking of the success of the strategic investment project risk management,
based on the PROMETHEE II methodology
Acta Polytechnica Hungarica Vol. 13, No. 5, 2016
– 235 –
Figure 3
Graphic presentation at GAIA plane for ranking of the success of the risk management of the strategic
investment projects
Conclusion
Strategic investment projects represent the very foundation of economic
development and the development of Society, in general. Detailed analysis and
approaches to the management of every single element of these types of projects is
required given their level of significance. The potential risks and their adverse
effects, represent a particularly weighty part of that process, especially the
possibility to eliminate or minimize them or respond in a suitable way. The
statistical analysis of the data collected through a survey of employees in 311
companies and organizations within the area of SEE, dealing with SIP
management within their operations, leads to the following conclusions. The
initial questions in the questionnaire, as well as the initial hypothetical framework
of the research, have been defined based on the analysis of the available literature
in the field. Accordingly, six research hypotheses were proposed based on the
relation between application of the methods for risk analysis and identified risk
factors influencing the SIPs success in SEE.
Conducted factor analysis, according to the question groups in the initial
questionnaire, indicated that subgroups should be formed within certain groups,
whereas certain questions should be eliminated from the further analysis. The final
groups of questions, classified by factors, were used to develop a structural model,
used for verification of the previously set hypothetical framework.

F. Jovanović et al. Risk Management Impact Assessment on the Success of Strategic Investment Projects: Benchmarking Among Different Sector Companies
– 236 –
Based on the formed structural model for risk analysis of SIPs, it can be concluded
that the hypotheses have been verified. The obtained results could be of use for the
risk analysis and the strategic project management, connecting the identified
project risks with applicable methods for risk analysis, in the real life project
management practice. Finally, the obtained results, presented in this paper,
represent a solid foundation for the continuation of the research and the
development of a final measurement instrument and model of SIP risk
management.
We suggest that future research should apply the GLM multivariate procedure and
focus on the influence of the most significant demographic characteristics of the
projects (project type, project duration, project budget and type of project
management), as well as, the different methodologies for risk management of the
projects, on the overall SIP success. Also, additional research endeavors should
target new and larger samples of respondents.
References
[1] Asrilhant, B., Meadows, M., Dyson, R., Techniques to Support Successful
Strategic Project Management in the UK Upstream Oil and Gas Sector,
European Management Journal, 24(2-3) (2006) pp. 214-225
[2] Schoemaker, P. J. H., How to Link Strategic Vision to Core Capabilities,
Sloan Management Review, 34(1) (1992) pp. 67-72
[3] Buckley, A., International Investment: Value Creation and Appraisal,
Copenhagen Business School, Denmark, 1998
[4] Foss, N. J., Resources and Strategy: Problems, Open Issues, and Ways
Ahead, In Resources, Firms and Strategies: A Reader in the Resource-based
Perspective, ed. N. J. Foss, pp. 345-365. Oxford University Press, Oxford,
1997
[5] Turner, R., Projects and Project Management, In Gower Handbook of
Project Management, (eds) J. R. Turner and S. J. Simister (3rd
ed.) pp. 65-
76, Spring, UK, 2000
[6] Brook, J. W., Pagnanelli, F., Integrating Sustainability into Innovation
Project Portfolio Management – A Strategic Perspective, Journal of
Engineering and Technology Management, 34 (2014) pp. 46-62
[7] Huang, Y. C., Ma, R., Lee, K. W., Exploitative Learning in Project Teams:
Do Cognitive Capability and Strategic Orientations Act as Moderator
Variables? International Journal of Project Management, 33 (2015) pp.
760-771
[8] Mooraj, S., Oyon, D., Hostettler, D., The Balanced Scorecard: a Necessary
Good or an Unnecessary Evil? European Management Journal, 17(5)
(2009) pp. 481-491

Acta Polytechnica Hungarica Vol. 13, No. 5, 2016
– 237 –
[9] Project Management Institute (PMI), A Guide to the Project Management
Body of Knowledge (PMBOK® Guide) – Fifth edition, Newtown Square,
PA: Author, 2013
[10] Kerzner, H., Project Management: A Systems Approach to Planning,
Scheduling and Control, John Wiley & Sons, Inc., Hoboken, New Jersey,
2009
[11] Kumar, M., Gregory, M., An Exploration of Risk Management in Global
Industrial Investment, Risk Management, 15(4) (2013) pp. 272-300
[12] Marmier, F., Deniaud, I. F., Gourc, D., Strategic Decision-Making in NPD
Projects according to Risk: Application to Satellites Design Projects,
Computers in Industry, 65 (2014) pp. 1107-1114
[13] Hussein, B. A., Klakegg, O. J., Measuring the Impact of Risk Factors
Associated with Project Success Criteria in Early Phase, Procedia - Social
and Behavioral Sciences, 119 (2014) pp. 711-718
[14] Peixoto, J., Tereso, A., Fernandes, G., Almeida, R., Project Risk
Management Methodology: A Case Study of an Electric Energy
Organization, Procedia Technology, 16 (2014) pp. 1096-1105
[15] Carvalho, M. M., Patah, L. A., Bido, D. S., Project Management and its
Effects on Project Success: Cross-Country and Cross-Industry
Comparisons, International Journal of Project Management, 33 (2015) pp.
1509-1522
[16] Enescu, M., Enescu, M., Tudorescu, N., Points of View Regarding the
Evaluation of Decisional Factors in Risk Management Associated to Large
Combustion Plants, Procedia Economics and Finance, 16 (2014) pp. 110-
114
[17] Marcelino-Sádaba, S., Pérez-Ezcurdia, A., Lazcano, A. M. E., Villanueva,
P., Project Risk Management Methodology for Small Firms, International
Journal of Project Management, 32 (2014) pp. 327-340
[18] Ameyaw, E. E., Chan, A. P. C., Evaluation and Ranking of Risk Factors in
Public–Private Partnership Water Supply Projects in Developing Countries
using Fuzzy Synthetic Evaluation Approach, Expert Systems with
Applications, 42 (2015) pp. 5102-5116
[19] Kutsch, E., Hall, M., The Rational Choice of not Applying Project Risk
Management in Information Technology Projects, Project Management
Journal, 40(3) (2009) pp. 72-81
[20] Espinoza, R. D., Separating Project Risk from the Time Value of Money: A
Step toward Integration of Risk Management and Valuation of
Infrastructure Investments, International Journal of Project Management,
32 (2014) pp. 1056-1072
F. Jovanović et al. Risk Management Impact Assessment on the Success of Strategic Investment Projects: Benchmarking Among Different Sector Companies
– 238 –
[21] Rodrigues-da-Silva, L. H., Crispim, J. A., The Project Risk Management
Process, a Preliminary Study, Procedia Technology, 16 (2014) pp. 943-949
[22] Hwang, B.-G., Zhao, X., Gay, M. J. S., Public Private Partnership Projects
in Singapore: Factors, Critical Risks and Preferred Risk Allocation from the
Perspective of Contractors, International Journal of Project Management,
31 (2013) pp. 424-433
[23] Ihuah, P. W., Kakulu, I. I., Eaton, D., A Review of Critical Project
Management Success Factors (CPMSF) for Sustainable Social Housing in
Nigeria, International Journal of Sustainable Built Environment, 3 (2014)
pp. 62-71
[24] Shrivastava, S. V., Rathod, U., Categorization of Risk Factors for
Distributed Agile Projects, Information and Software Technology, 58
(2015) pp. 373-387
[25] Lončar, D., Applicative Model for Appraisal of Investment Projects Based
on Real Options Methodology, Serbian Journal of Management, 6(2)
(2011) pp. 269-282
[26] Pandremmenou, H., Sirakoulis, K., Blanas, N., Success Factors in the
Management of Investment Projects: A Case Study in the Region of
Thessaly, Procedia - Social and Behavioral Sciences, 74 (2013) pp. 438-
447
[27] Kiliç, M., Kaya, I., Investment Project Evaluation by a Decision Making
Methodology Based on Type-2 Fuzzy Sets., Applied Soft Computing, 27
(2015) pp. 399-410
[28] Drury-Grogan, M. L., Performance on Agile Teams: Relating Iteration
Objectives and Critical Decisions to Project Management Success Factors,
Information and Software Technology, 56 (2014) pp. 506-515
[29] Lappe, M., Spang, K., Investments in Project Management are Profitable: A
Case Study-based Analysis of the Relationship between the Costs and
Benefits of Project Management, International Journal of Project
Management, 32 (2014) pp. 603-612
[30] Todorović, M. Lj., Petrović, D. Č., Mihić, M. M., Obradović, V. Lj.,
Bushuyev, S. D., Project Success Analysis Framework: A Knowledge-
based Approach in Project Management, International Journal of Project
Management, 33 (2015) pp. 772-783
[31] Liu, S., Wang, L., Understanding the Impact of Risks on Performance in
Internal and Outsourced Information Technology Projects: The Role of
Strategic Importance, International Journal of Project Management, 32
(2014) pp. 1494-1510
Acta Polytechnica Hungarica Vol. 13, No. 5, 2016
– 239 –
[32] Junkes, M. B., Tereso, A. P., Afonso, P. S. L. P., The Importance of Risk
Assessment in the Context of Investment Project Management: a Case
Study, Procedia Computer Science, 64 (2015) pp. 902-910
[33] Davis, K., A Method to Measure Success Dimensions Relating to
Individual Stakeholder Groups, International Journal of Project
Management, 34 (2016) pp. 480-493
[34] Kaiser, H. F., An Index of Factorial Simplicity, Psychometrika, 39 (1974)
pp. 31-36
[35] Hair, J. F., Black, W. C., Babin, B. J., Anderson, R. E., Tatham, R. L.,
Multivariate Data Analysis, 6th
Edition, Pearson Prentice Hall, Upper
Saddle River, NJ, 2006
[36] Gorsuch, R. L., Factor Analysis, Hillsdale, NJ: Lawrence Erlbaum, 1983
[37] Cronbach, L. J., Coefficient Alpha and the Internal Structure of Tests,
Psychometrika, 16 (1951) pp. 297-334
[38] Nunnally, JM., Psychometric Theory, third ed. McGraw-Hill, New York,
1994
[39] Roy, B., Vincke, P., Multicriteria Analyses: Survey and New Directions,
European journal of operational research, 8 (3) (1981) pp. 207-218
[40] Csala, V., Szalay, T., Farkas, B., Markos, S., Application Benchmark of
Three Micro Hole Machining Processes for Manufacturing the Nozzle of a
Medical Water Jet Machine, Acta Polytechnica Hungarica, 12(2) (2015) pp.
53-69
[41] Živković, Ž., Nikolić, Dj., Djordjević, P., Mihajlović, I., Savić, M.,
Analytical Network Process in the Framework of SWOT Analysis for
Strategic Decision Making (Case Study: Technical Faculty in Bor,
University of Belgrade, Serbia), Acta Polytechnica Hungarica, 12(7) (2015)
pp. 199-216
[42] Brans, J. P., Mareschal, B., The PROMCALC & GAIA Decision Support
System for Multicriteria Decision Aid, Decision Support Systems, 12
(1994) pp. 297-310
[43] Zhi-hong, Z., Yi, Y., Jing-nan, S., Entropy Method for Determination of
Weight of Evaluating Indicators in Fuzzy Synthetic Evaluation for Water
Quality Assessment, Journal of Environmental Sciences, 18 (2006) pp.
1020-1023

F. Jovanović et al. Risk Management Impact Assessment on the Success of Strategic Investment Projects: Benchmarking Among Different Sector Companies
– 240 –
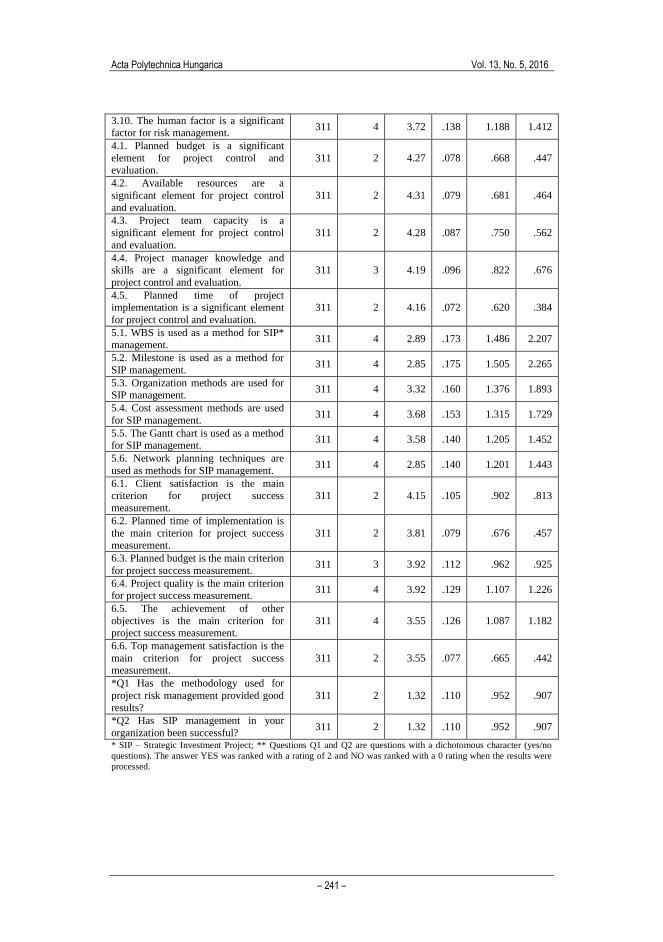
Appendix 1
Results of the descriptive statistics of answers to the questionnaire questions
N Range Mean Std.
Deviation Var.
Statistic Statistic Statistic
Std.
Error Statistic Statistic
1.1. Questionnaire is used as a method for risk analysis and assessment.
311 4 2.97 .143 1.227 1.506
1.2. Sensitivity analysis is used as a
method for risk analysis and assessment.
311 3 2.66 .152 1.306 1.706
1.3. Probability analysis is used as a
method for risk analysis and
assessment.
311 3 2.55 .128 1.100 1.209
1.4. Decision tree is used as a method
for risk analysis and assessment. 311 3 2.43 .107 .923 .852
1.5. The simulation method is used as a method for risk analysis and
assessment.
311 4 2.28 .118 1.014 1.028
1.6. Brainstorming is used as a method
for risk analysis and assessment. 311 4 2.49 .152 1.306 1.705
1.7. The Delphi method is used as a
method for risk analysis and
assessment.
311 4 2.84 .143 1.228 1.508
1.8. WBS is used as a method for risk analysis and assessment.
311 3 2.08 .129 1.107 1.226
2.1. Potential loss as a risk factor affects
the project success. 311 2 3.54 .067 .578 .334
2.2. Market risk as a risk factor affects the project success.
311 4 3.27 .140 1.208 1.460
2.3. Foreign exchange risk as a risk
factor affects the project success. 311 2 3.32 .080 .685 .469
2.4. Cost assessment risk as a risk factor affects the project success.
311 3 3.51 .082 .707 .500
2.5. Human resource as a risk factor
affects the project success. 311 2 3.89 .083 .713 .509
3.1. The probability of the occurrence of a risk event is a significant factor for
risk management.
311 4 3.76 .098 .841 .707
3.2. The frequency of risk events is a significant factor for risk management.
311 4 3.68 .096 .829 .688
3.3. The connection between different
risk events is a significant factor for risk management.
311 4 3.55 .104 .894 .798
3.4. Potential loss is a significant factor
for risk management. 311 3 3.97 .110 .950 .903
3.5. Timeline risk is a significant factor for risk management.
311 2 3.70 .074 .635 .404
3.6. Cost assessment risk is a significant
factor for risk management. 311 3 3.84 .082 .703 .494
3.7. Financing risk is a significant factor for risk management.
311 4 3.73 .101 .865 .748
3.8. Market risk is a significant factor
for risk management. 311 4 3.53 .104 .895 .801
3.9. Foreign exchange risk is a significant factor for risk management.
311 4 3.20 .107 .921 .849
Acta Polytechnica Hungarica Vol. 13, No. 5, 2016
– 241 –
3.10. The human factor is a significant factor for risk management.
311 4 3.72 .138 1.188 1.412
4.1. Planned budget is a significant
element for project control and evaluation.
311 2 4.27 .078 .668 .447
4.2. Available resources are a
significant element for project control
and evaluation.
311 2 4.31 .079 .681 .464
4.3. Project team capacity is a
significant element for project control
and evaluation.
311 2 4.28 .087 .750 .562
4.4. Project manager knowledge and skills are a significant element for
project control and evaluation.
311 3 4.19 .096 .822 .676
4.5. Planned time of project implementation is a significant element
for project control and evaluation.
311 2 4.16 .072 .620 .384
5.1. WBS is used as a method for SIP* management.
311 4 2.89 .173 1.486 2.207
5.2. Milestone is used as a method for
SIP management. 311 4 2.85 .175 1.505 2.265
5.3. Organization methods are used for SIP management.
311 4 3.32 .160 1.376 1.893
5.4. Cost assessment methods are used
for SIP management. 311 4 3.68 .153 1.315 1.729
5.5. The Gantt chart is used as a method for SIP management.
311 4 3.58 .140 1.205 1.452
5.6. Network planning techniques are
used as methods for SIP management. 311 4 2.85 .140 1.201 1.443
6.1. Client satisfaction is the main
criterion for project success
measurement.
311 2 4.15 .105 .902 .813
6.2. Planned time of implementation is
the main criterion for project success measurement.
311 2 3.81 .079 .676 .457
6.3. Planned budget is the main criterion
for project success measurement. 311 3 3.92 .112 .962 .925
6.4. Project quality is the main criterion for project success measurement.
311 4 3.92 .129 1.107 1.226
6.5. The achievement of other
objectives is the main criterion for project success measurement.
311 4 3.55 .126 1.087 1.182
6.6. Top management satisfaction is the
main criterion for project success measurement.
311 2 3.55 .077 .665 .442
*Q1 Has the methodology used for
project risk management provided good
results?
311 2 1.32 .110 .952 .907
*Q2 Has SIP management in your
organization been successful? 311 2 1.32 .110 .952 .907
* SIP – Strategic Investment Project; ** Questions Q1 and Q2 are questions with a dichotomous character (yes/no
questions). The answer YES was ranked with a rating of 2 and NO was ranked with a 0 rating when the results were
processed.