risk factors in the south african banking industry: the
TRANSCRIPT

Risk Factors in the South African Banking Industry: The Role
of Capital, Bank Size, Leverage and Franchise Value
Nkwenti Chalie Khan
Supervisor: Dr. Blessing Mudavanhu
Master of Management in Finance and Investment
Wits Business School
University of the Witswatersrand
2016

ii
Submitted in partial fulfillment of the requirements for the degree
Master of Management in Finance and Investment
in the
FACULTY OF COMMERCE, LAW AND MANAGEMENT
at the
UNIVERSITY OF WITSWATERSRAND
SURPERVISOR: Dr. Blessing Mudavanhu Signature
DECLARATION
I, Chalie Nkwenti Khan declare that all work submitted in this research dissertation is my
own except where otherwise properly acknowledged and referenced. This paper,
submitted for the degree of Master of Management in Finance and Investment at the
University of Witswatersrand in Johannesburg has never been submitted whether in full
or in part for any purpose whatsoever at any other university.
Candidate signature: Date: 24th March 2017

iii
Abstract
The recent failure rate of financial institutions and banks has put risk management at the center of regulatory
authority’s attention, not leaving out the banking sector. This study empirically investigates the relationship
between several risk factors including the capital-to-assets ratio (CAR), franchise value, bank size and operating
leverage; and bank risk in the South African banking sector before, during and after the financial crises covering
the period 2004 - 2015. A cross-sectional approach is employed on daily price data from publicly listed South
African bank holding companies to model risk in the sector and present potential red flags to regulators and policy
makers. Findings provide evidence of a negative relationship between the CAR and bank risk in non-crises years
and a positive relationship during the crises while a non-linear relationship between franchise value and bank risk
is confirmed. No such study has been conducted yet in the South African context, while very few have been done
within an African country context. Even at that, the only study to have combined several risk factors to study
effects of bank risk is that by Gregory and Hambusch, (2015) on the US banking sector.

iv
Acknowledgements
My deepest gratitude and appreciation goes first and foremost to my supervisor; Dr. Blessing Mudavanhu for his
consistent and invaluable guidance and assistance during the study despite his much busy schedule. I will continue
to thank my immediate family in SA and friends including Walters Tumasang, Maureen Tumasang, Ma’a Ngefor
Awa, Ella Tumasang and Sirri Imani Tumasang for their immense encouraging words, love and moral support.
Not least forgetting, my dad of blessed memory, late pa Tambah Muluh Nkwenti and my beloved mother Mrs.
Tambah Regina Ngefor including all my seven siblings. Very close to my heart is my daughter; Onezwa Bambeni
who shared pages of my books with me as I studied most nights. To my father, mentor, uncle and wife; respectively
Adjudant Chef Awa Tumasang and Mom Franka Wonjeg Awa; your words of motivation and continues push for
studies to the level of a PhD are what kept me striving forward against all odds. Above all; you, who are the source
of all wisdom, finance and otherwise are forever praised for seeing me midway through such a tough and daunting
journey.

v
Table of Contents
CHAPTER 1. INTRODUCTION ............................................................................................ 1
1.1 Background and context of the study ........................................................................................................ 1
1.2 Research objectives and motivations ........................................................................................................ 4
1.3 Problem Statement ................................................................................................................................... 5
1.4 Research methodology ............................................................................................................................. 6
1.5 Outline of the study.................................................................................................................................. 7
CHAPTER 2. LITERATURE REVIEW ................................................................................ 8
2.1 An overview of the South African banking industry ................................................................................. 8
2.1.1 Bank assets in relation to gross domestic product............................................................................. 10
2.2 Total banking-sector assets in relation to gross domestic product. ..................................................... 11
2. 2 Key risk factors defined and hypotheses stating ..................................................................................... 11
2.2.1 Bank Capital-to-Asset Ratio (CAR) ................................................................................................. 11
2.2.2 Franchise value ............................................................................................................................... 14
2.2.3 Lobbying ........................................................................................................................................ 15
2.3 Other risk factors ................................................................................................................................... 17
2.3.1 Bank size ........................................................................................................................................ 17
2.3.2 Operating leverage .......................................................................................................................... 18
2.4 Proxies for bank risk measures ............................................................................................................... 18
2.4.1 Total risk......................................................................................................................................... 18
2.4.2 Firm specific risk ............................................................................................................................ 19
2.4.3 Systematic risk ................................................................................................................................ 19
2.4.4 Market risk...................................................................................................................................... 19
2.4.5 Interest rate risk .............................................................................................................................. 20
2.5 Summary ............................................................................................................................................... 20
CHAPTER 3. METHODOLOGY ......................................................................................... 21
3.1 Research design and paradigm ............................................................................................................... 21
3.2 Research methodology ........................................................................................................................... 22
3.3 Research sample and size ....................................................................................................................... 22
3.4 Data collection, methodology and sources .............................................................................................. 23
vi
3.5 Model specification and description of its variables ................................................................................ 24
3.6 Reliability and validity of data ............................................................................................................... 26
3.7 Summary ............................................................................................................................................... 27
CHAPTER 4. EMPIRICAL FINDINGS AND DISCUSSIONS .......................................... 28
4.1 Correlation analysis of risk measures ..................................................................................................... 28
4.1.1 Firm-specific risk (FSR) .................................................................................................................. 28
4.1.2 Market risk (MktR) ......................................................................................................................... 30
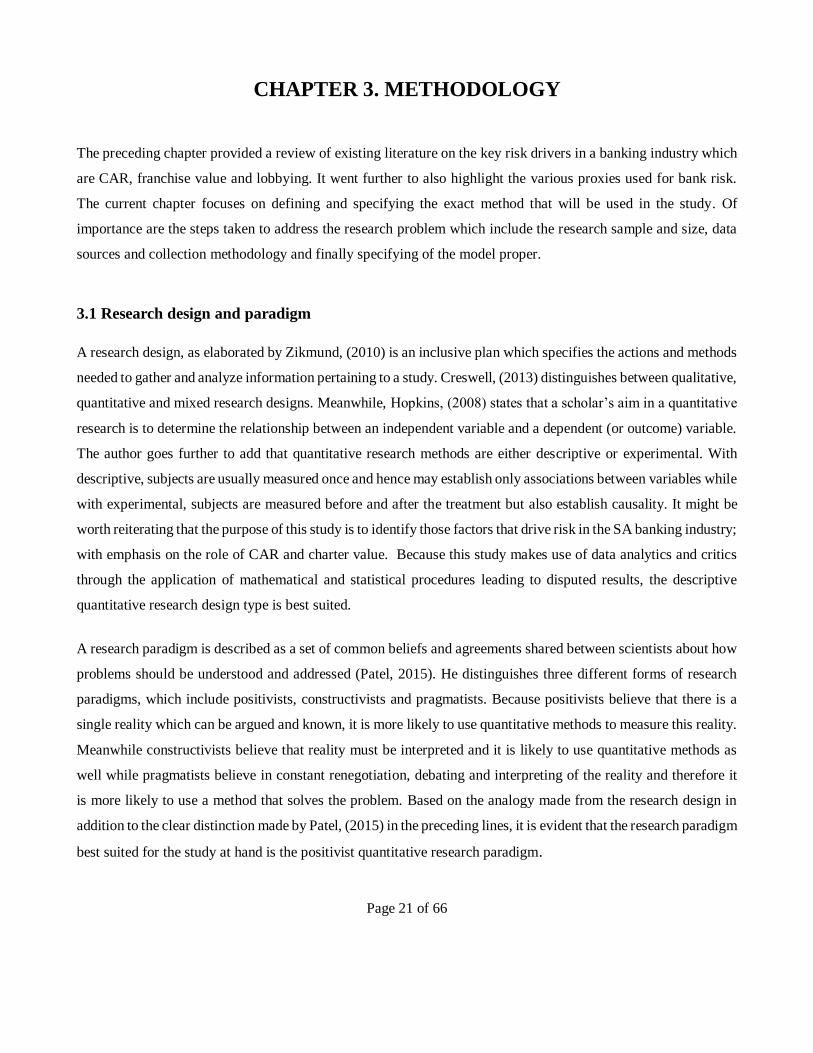
4.1.3 Systematic risk (SysR) .................................................................................................................... 32
4.1.4 Interest rate risk (IRR) ..................................................................................................................... 33
4.1.5 Total Risk (TR) ............................................................................................................................... 36
4.1.6 Comparison of the five risk measures .............................................................................................. 37
4.2 Descriptive and summary statistics ......................................................................................................... 38
4.2.1 Bank risk measures ......................................................................................................................... 39
4.3.1 Capital-to-Assets Ratio (CAR) ........................................................................................................ 42
4.3.2 Franchise value ............................................................................................................................... 42
4.3.3 Bank size ........................................................................................................................................ 44
4.3.4 Operating leverage .......................................................................................................................... 46
4.4 Explanatory variables............................................................................................................................. 47
4.5 Model fit ................................................................................................................................................ 48
CHAPTER 5. CONCLUSION AND RECOMMENDATIONS ........................................... 51
References ................................................................................................................................................... 53

vii
List of Tables
Table 3.1 Summary defining the research variables for the study………………………………............25
Table 4.1 Summary statistics for risk measures………………………………………………………....41
Table 4.2 Risk measure comparisons for different periods. …………………………………………...43
Table 4.3 Regression results. …………………………………………………………………………..45
Table 4.4 Descriptive statistics for regressors. ………………………………………………………...47
Table 4.5 F-statistics and adjusted R2 for equation 2. …………………………………………............50

List of Figures
Figure 1.1 Market share of the SA Banking sector (in R millions) …………………………………….7
Figure 2.1 Number of banks in South Africa over ten years……………………………………...........10
Figure 2.2 Total banking-sector assets in relation to gross domestic product.................................11
Figure 4.1a Firm-specific risk and capital-to-assets ratio ...……………………………………...........29
Figure 4.1b Firm-specific risk and franchise value.................................................................................29
Figure 4.1c Firm-specific risk and operating leverage…........................................................................30
Figure 4.1d Firm-specific risk and bank size…......................................................................................30
Figure 4.2a Market risk and capital-to-assets ratio…………………………………………………….31
Figure 4.2b Market risk and franchise value….……………………………………………..................31
Figure 4.2c Market risk and operating leverage………………………………………………………..32
Figure 4.2d Market risk and bank size...……………………………………………………………….32
Figure 4.3a Systematic risk and capital-to-assets ratio………………………………………………...33
Figure 4.3b Systematic risk and franchise value……………………………………………………….33
Figure 4.3c Systematic risk and operating leverage……………………………………………………34
Figure 4.3d Systematic risk and bank size…...………………………………………………………...34
Figure 4.4a Interest rate risk and capital-to-assets ratio…….………………………………………......34
Figure 4.4b Interest rate risk and franchise value……………………………………………………….35
Figure 4.4c Interest rate risk and operating leverage...............................................................................35
Figure 4.4d Interest rate risk and bank size…………….……………………………………………….35
Figure 4.5a Total risk and capital-to-assets ratio………………………………………………….……36
Figure 4.5b Total risk and franchise value…...………………………………………………………...36
Figure 4.5c Total risk and operating leverage………………………………………………………….37
Figure 4.5d Total risk and bank size.......................................................................................................37
Figure 4.6 Risk measure comparisons …………………………………………………………………38
Page 1 of 66
CHAPTER 1. INTRODUCTION
This chapter provides background to the study, motivation of the study, a statement of the research problem and
specific research objectives. The chapter ends with a brief outline of what is covered in the rest of the paper.
1.1 Background and context of the study
Diverse literature on banking among Gregory and Hambusch, (2015), Haq and Heaney, (2012), Mamatzakis and
Bermpei, (2014) and Ariss, (2010) argue that banks often bear excessive risk while doing business especially
during crises. The main business of banks is trading risk. This is necessary to enhance profitability and improve
on performance through maximizing its shareholder value. One way of achieving this is through extension of
credits in various forms such as lines of credit, revolving loans, term loans, off balance sheet financing, overdrafts
and bridge loans (Gup & Kolari 2005).
Banks are prone to many risks including systemic, total, interest rate, market, liquidity, operational and default
(Mamatzakis & Bermpei, 2014), although Hull, (2015) identifies credit (default) risk as the most important seeing
that it is the greatest risk facing a bank and it is also one for which the most regulatory capital is required. This is
the risk which arises when counterparty to a loan or derivatives transaction fails to repay part of, or the entire
amount owed to a lending institution (Horcher, 2005). This begs the question; what are the factors that drive these
risks? This brings to light the purpose of this research on the South African banking sector: to investigate how
several key risk factors including capital-to-asset ratio (CAR), franchise value, operating leverage and bank size
affect various measures of risk in the South African banking industry before, during and after the financial crises.
To the best of the author’s knowledge, which extends to scheming through the literature on banking, no such study
has been carried on the South African banking sector. Even where this has been the case in other sovereign
economies, interest has been largely to explore the relationship between single factors influencing bank risk; with
little work done on how a combination of several risk factors affect bank risk (Gregory & Hambusch, 2015). For
example, academics such as Furlong and Keeley (1989) have shown that higher bank capital ratio does not lead
banks to increase asset risk while Berger and Bouwman, (2013) found that an introduction of minimum capital
requirements reduces risk. Meanwhile, Frame and White, (2007) examined the effect of competition on Federal
Home Loan Bank mortgage purchase program and the adoption of Basel II in the U.S Secondary Mortgage Market
and established that complying with capital requirements would lead to a reduction in a bank’s market share,
thereby also reducing its franchise value.

Page 2 of 66
Regulators and supervisors have continuously and increasingly prioritized the management of bank risk and
particularly total risk and idiosyncratic risk (Haq & Heaney, 2012) over the past decades especially after the
collapse of the so thought “too big to fail” Lehman Brothers following one of the deadliest financial crises; the
2007 – 2008 global financial turmoil. Gregory and Hambusch, (2015) also report the failure of 322 financial
institutions in the US alone between 2008 and 2010 while a good number also failed in Europe. Hull, (2015)
distinguishes two types of risk management strategies at the disposal of a financial institution such as a bank.
These are: 1.) Risk decomposition which entails identifying risks one by one as they occur, but mitigating each
risk separately and 2.) Risk aggregation which entails reducing risks through diversification. The above analyses
clearly substantiate the need for prudent bank risk management, supervision and regulation largely to curb bank
failure, but partly to enhance bank profitability and the stability of the financial system and the global economy.
Several reasons explain the need for prioritizing risk management and enforcing stringent regulation in general.
Firstly, Schaeck, Cihak and Wolfe (2009) suggest that too much competition among banks could threaten the
solvency of individual institutions and ultimately threaten stability of the banking system. Second; Maredza and
Ikhide (2013) argue that a well-functioning banking sector contributes to economic growth via more efficient
allocation of resources and risk diversification in that, it shelters the economy against instability and boosts
consumer confidence. Furthermore, the authors add that the banking sector is considered the backbone of most
economies due to its ability to cripple the stability of the financial system if not well regulated and managed.
Dissecting the link between bank regulation and bank risk, Klomp and de Haan, (2012) contend that several studies
found little or no effect by bank regulation and supervision on banking risk. Interestingly, Demirguc-Kunt and
Detragiache (2011) employed data for 3000 banks from 86 different countries on a similar study and failed to find
evidence for an effect of bank regulation and supervision on banking risk. The next paragraphs and lines
contextually provide an introductory briefing on key risk drivers employed in the study, starting with capital-to-
asset ratio.
Bank capital is a key risk factor largely studied. To ensure a stable and resilient financial system, most central
banks across the world, for instance the Group of Twenty (G20) have adopted the Basel accords established by
the Basel Committee on Banking Supervision’s (BCBS) minimum capital requirements. These accords include
the Basel I, II and III, which are internationally recognized frameworks for supervising and regulating banks.
Basel I was established in 1988 to address credit risk and stipulate a minimum capital requirement for banks which
requires banks to hold sufficient capital to cover unexpected future losses while Basel II was put forward in 2004
as a follow up on Basel I. Per Galai, Crouhy and Mark, (2006), Basel II served to allow banks to calculate
minimum capital requirements in line with their respective risk exposures. More recent in 2010 was the release of

Page 3 of 66
Basel III, with core mandate to improve the banking sector’s ability to absorb shocks arising from financial and
economic stress irrespective of the source, thereby reducing the risk of spillover from the financial sector to the
real economy (Lobo. R, 2013). Surprisingly, mainly major crises such as the 2007 – 2009 subprime crises in the
U.S highlight the importance of bank regulation and supervision as reiterated by Arnold, et Al (2012) and Haq
and Heaney, (2012). Thus, another reason for banks to stay abreast of the major risk factors affecting the banking
sector to device means of responding to the risk at any time and not only during crises.
The CAR is a risk measure related to bank capital. In fact, it is simply a measure of leverage by the bank. As such,
the two are used interchangeably to refer to the same concept. Daesik and Santomero, (1988), Blum, (1999), Haq
and Heaney, (2012) and Distinguin, Roulet and Tarazi (2013) have contributively acknowledged the use of the
CAR as a regulatory tool. As a regulatory requirement, banks are required by regulators and supervisors to
maintain a minimum level of capital to serve as a loss-absorbing buffer for depositors. In addition, Frame and
white, (2007) also see the need of a minimum capital requirement to serve as a deterrent to owners’ taking risky
actions. From the point of view of a bank, adequate capital levels: 1.) Provide a buffer against insolvency 2.)
Minimizes credit risk, but also increases profitability (Naceur, 2003; Goddard, Molyneux & Wilson, 2004 and
Delis, Staikouras & Varlagas, 2008). 3.) Help small banks increase their probability of survival at all times [that
is; during market crises, banking crises, financial crises or normal time (Berger & Bouwman, 2013)] and, 4.)
Capital enhances the performance of medium and large banks primarily during banking crises (Berger &
Bouwman, 2013). Contrary to these views is Distinguin, Roulet and Tarazi, (2013)’s assertion that higher capital
is detrimental to the wellbeing of the bank as they argue that it is associated with less monitoring which reduces
liquidity creation while higher capital ratios on their part could crowd out deposits and lead to the creation of
liquidity reduction.
Frame and White, (2007) define franchise value as an intangible asset that the owners would lose if the down side
of risk taking caused owners to be removed from their ownership position. Franchise value is a synonym for
charter value which is generally referred to as the going concern value of a bank. Konishi and Yasuda (2004)’s
work on the Japanese economy when they used recent bank stock market data to investigate bank risk taking
confirmed the views of many academics and scholars alike, including (Keeley, 1990; Gorton & Rosen, 1995) that
a negative relationship exists between a bank’s franchise value and bank risk. Put differently, a decrease in
franchise value leads to an increase in bank risk. This theoretically is very insightful seeing that a decrease in the
going concern value of any institution implicitly translates to a higher probability of insolvency or failure; which
is itself a severe risk. Interestingly, Gregory and Hambusch, (2015) obtained mixed results on franchise value in
their studies of risk in the U.S banking industry. Meanwhile they obtained results controversial to the existing

Page 4 of 66
literature on franchise value (with examples cited in the preceding lines), only during crises periods did they find
results in line with what the previous studies obtained. The reason for this discrepancy could be linked to the
economic setting. The size of the US economy in addition to its remarkable level of financial and economic
development may contribute to other factors absorbing the effects of decreasing charter value.
Lobbying is perhaps the least studied risk measure in the literature on banking risk (Blau, Brough & Thomas,
2013). Scholars have contributively argued that even though lobbying makes financial and economic sense to the
wellbeing of an institution (it adds value), it is equally a good source of risk for the institution. For example,
meanwhile Acemoglu and Johnson, (2012); Johnson, (2009) and Johnson and Kwak, (2010) note that bank
lobbying enhances regulatory failure, Blau et Al, (2013) maintain that lobbying might serve as a form of insurance
in times of crises. Additionally, and contrary to Gregory & Hambusch, (2015)’s assertion that lobbying may
impede the swift passage of new policy and distort the policy’s original intended impact, Cooper, Gulen and
Ovtchinnikov, (2010) found a positive relationship between political connections and stock returns in their studies
of the link between political connections and stock returns. As per their findings, firms that donated to political
campaigns showed positive abnormal stock returns which is an indication of high stock performance and this has
also been confirmed by Faccio, Masulis and McConnell, (2006). Unfortunately, lobbying is still a relatively new
word in the jargon of SA banking sector as reports directly from some of the banks indicate they tend not to be
involved in lobbying. This not only makes lobbying data availability a challenge, but also may exert some degree
of sample bias or error on the study’s results. More on this in chapter 3.
South Africa, although not largely affected by the most recent subprime crises was nevertheless not completely
left out. Mboweni, (2004) contends that this is a result primarily of a sound regulatory and legal framework put in
place, but also due most importantly to good management and supervision of the banks by means of sophisticated
risk management systems and corporate governance structures. Again, South Africa is no exception to the rule as
many other sovereign economies were largely affected by the crises through their interconnectedness with the U.S
economy (Gregory & Hambusch, 2015).
1.2 Research objectives and motivations
This study follows an approach similar to that of Gregory and Hambusch, (2015). The study covers a 12year
period and spans from 2004 to 2015 comprising both periods before, during and after crises. Comparisons will be
done in each of these areas to provide the banks and other financial intermediaries at large a grasp of what potential
risks to cater for when in crises and otherwise. The main motivation of this study is to aid policy makers, regulators
Page 5 of 66
and supervisors improve risk management in the South African banking sector. This would in turn enhance the
performance of the banking sector but also promote a robust and resilient financial system in the country since
banks are seeing as the backbone of the financial sector of any country (Maredza & Ikhide 2013), thereby by
leading to improved GDP growth of the economy. A good and very common example of why adequate and
continuous risk management is key to a well-functioning financial system is the most recent global financial crises
which stemmed directly from banks.
1.3 Problem Statement
The South African Reserve Bank in a way to maintain a resilient financial system, of which the banking sector
forms a key component has since 2010 been publishing bi-annual financial stability reviews of key risks facing
its financial sector (SARB, 2014). This, in attempt to timely identify and manage potential financial stability risk
impinging the stability of its financial system. Global bank failure rate largely due to systemic risk, especially
during the most recent global financial crises has prompted both international and domestic regulators and
supervisors (such as the IMF and the BCBS), bank comptrollers and policy makers to increase risk management.
In the US alone, a total of 322 failed banks were registered during the crises years between 2008 and 2010
(Gregory & Hambusch, 2015), not undermining the significance of the good numbers reported from other
sovereigns like Europe. Hull (2015) argues that the main cause of the crises was poor and inadequate risk
management by banks and other related financial institution’s loan departments. The stability of the banking
system in any economy is indispensable for a resilient financial system. Existing literature on banking system
stability (for example; Schaeck, Cihak & Wolfe, 2009; Arnold et Al, 2012 and Haq & Heaney, 2012) supports
this argument. Meanwhile Schaeck, Cihak & Wolfe, (2009) found competition to increase banking system
stability, Arnold et Al, (2012) and Haq & Heaney, (2012) argue that identifying factors driving idiosyncratic risk
is essential for macroeconomic stability. To adequately achieve this, proper risk management; which includes
identification and monitoring through design and implementation of regular quantitative techniques is of the
essence.
In the case of South Africa, reports by SARB, (2016) state that the Bank conducted a common scenario stress test
of its banking sector at the start of 2016 and found out that the Bank could withstand significant credit losses
under stress scenarios even without the intervention of bank management in risk mitigation. This however, does
not eliminate the possibility of risk in the sector (SARB, 2015). The latter posits that interconnectedness of South
African banks with other financial markets increases risk. Furthermore, a very recent study by Dube and Kaya,
(2017); two students of the African Institute of Financial Markets and Risk Management reveals the top four banks

Page 6 of 66
in the country to be the main contributors of systemic risk in the sector. Of great interest is the fact that these
banks form about 60% of the sample size. The authors designed a systemic risk ranking model which found the
banks to be contributing a total of 64.11% of the sector’s systemic risk and therefore are those hugely putting the
sector at risk. Because these four banks own about 89% of the sector’s market share (SARB, 2015), identifying
those factors which drive risk in the sector will be imperative for stability of the country’s financial system.
The purpose of this study then, is to assist in this process by empirically identifying among the theoretically
predicted factors those which drive risk in the South African banking sector. Such factors as capital-to-asset ratio
(or capital adequacy ratio), charter value, off-balance sheet activities, dividend payout ratio, size and lobbying are
generally predicted theoretically in the literature. Aside from existing studies on bank risk drivers in some
geographic settings such as Gregory & Hambusch, (2015) on the US, Konishi and Yasuda, (2004) on the Japanese
banking sector and Haq and Heaney, (2012) on the European banking sector, no such study has been conducted
on the SA economy to the best of the author’s knowledge. The very minimal and mostly recent literature on SA
bank risk (for instance Barnhill, Papapanagiotou & Schumacher, 2002; Chin’anga, 2015; Maredza & Ikhide, 2013;
Coetzee, Van Zyl & Tait, 2012; Smit, Stwart & Van Niekerk, 2015 and Andrianova et Al, 2015) has largely
focused on credit risk. As such, the current study is the first ever to address the issue of factors driving risk in the
SA banking sector where a combination in a single study of several key risk drivers is empirically analyzed. To
this end, investors and lenders alike are well informed in their investment decisions of the risks facing the sector,
policy makers and regulators at large are aware of the risk which aids policy reshaping and compliance with
international standards and finally, the banks themselves can monitor and mitigate risk less costly and more
timeously. This has a ripple effect of increased financial system stability, increased profitability of the sector and
a general macroeconomic stability of the sovereign economy at large.
1.4 Research methodology
The study adopts a quantitative approach and following Gregory and Hambusch, (2015), the analyses apply a two-
step approach to model risks in the SA banking sector. Step one entails running a regression model to obtain five
different risk measures for each bank. In step two, the risk measures are employed as dependent variables and
used to study the relationship between each risk measure and several factors affecting risk including CAR and
franchise value. Control variables used in the study include interest rate, bank size and operating leverage. With
this, risk measures are studied during three different periods including before, during and after crises to maximize
the likelihood of managing risk by relevant stakeholders.

Page 7 of 66
To ensure reliable and accurate data availability, strictly publicly listed bank holding companies (whether
commercial or noncommercial) are constituted in the sample of banks that represent the South African banking
industry for the period 2004 to 2015. Thus, only seven banks are included in the study. However, the sample
sufficiently and unbiasedly represents the SA banking sector as it includes the big five with a collective market
share of 89% as at 31st December 2015 (SARB, 2015). This is an increase approximately of 6% on its 2004
comparative figure. In South Africa, top five banks as listed below in subsection 2.2 and explained by figure 1.1
traditionally dominate the sector.
Figure 1.1 Market share of the SA Banking sector (in R millions)1
1.5 Outline of the study
The first chapter basically introduced the research and provided a detailed background to the study. The second
chapter starts with an overview of the South African banking industry, defines key risk factors being studied while
stating hypothesis on which regression models are formulated and finally presents a detail of what is it that has
already been covered in the literature on risks facing the banking sector. Chapter 3 on the methodology details the
research design, research methodology as well as the research model. Chapter 4 draws insights from the model
estimated in the preceding chapter to explain the results of the findings whilst chapter 5 summarizes the results
while concluding with recommendations for further studies. With a main recommendation in brief that a more
combined study of this same nature which also includes lobbying banks be conducted in due time as and when
adequate data becomes available through growth in number of banks to minimize the nuances of data observation
encountered during some years in the present study.
1 Source: SA Reserve Bank and author’s deductions.

Page 8 of 66
CHAPTER 2. LITERATURE REVIEW
This chapter provides theoretical underpinnings of the study and comprises four main sections including: a brief
industry analysis detailing trends over the years in the SA banking industry, defining key risk factors and
hypothesis stating, identifying proxies for bank risk measures and finally summarizing what is it that has already
been documented on bank risk literature. In the first section, a brief overview of the South African banking
industry reveals that the sector has been very resilient to shocks over the period under study. Section two forms a
bulk of the literature where both theoretical and empirical analyses building on previous studies guide an
interpretation of the relationship binding a risk factor and a risk measure, leading to hypothesis enumeration.
Section three clearly defines with reasons the various proxies for bank risk measures while section 4 provides a
vivid summary of the chapter.
2.1 An overview of the South African banking industry
Despite the normal spillovers suffered by financial institutions at large, its Reserve Bank is content to state that
South Africa's financial system has hardly suffered any major crises pre-and post the apartheid era. This, except
for minor issues such as; the liquidity pressures and a significant depreciation of the rand faced in the early 2000s,
the political isolation of South Africa in the mid 80's which saw many international banks terminate operations
and exit South Africa and the global banking crises of the early 90's. Over the past two decades from the mid 90's,
South Africa has established a well-developed banking system which compares favorably with those in many
developed countries and which sets her apart from many other emerging market economies. Mboweni, (2004)
contends that this is a result primarily of a sound regulatory and legal framework put in place, but also due to good
management of the banks by means of sophisticated risk management systems and corporate governance
structures. This is also in line with Andrianova et Al, (2015)'s assertion that the Republic of South Africa has a
well-developed banking sector with an active stock market relative to other emerging markets at large and other
sub-Saharan African countries in particular.
Another strand of the literature; the BASA, (2014) reiterates that SA has a well-developed and proactively
regulated banking system which compares favorably with those of industrialized countries. To add more flair to
these arguments, the recent World Economic Forum Global Competitiveness Survey ranked SA 8th out of 140
countries in Financial Sector Development. As stated in the introductory part of this study, South Africa's banks
are regulated in accordance with principles set by the Basel Committee on banking Supervision (BCBS) and

Page 9 of 66
equally observe and implement international reporting and compliance standards such as the IFRS. A great deal
of literature on banking (for example; Maredza & Ikhide, 2013) also support these arguments in saying that South
Africa was far less affected by the US Subprime Crises, although SARB (2014) argues that interconnectedness of
economies or financial institutions increases risk. The authors advance reasons such as a sound regulatory
framework for the banks and solid macroeconomic policies.
According to Mboweni, (2004), the amendments to the Banks Act in 1994 saw the establishment of
representative offices and subsidiaries of international banks in SA, but also branches of international banks.
This amendment let to the opening of South Africa's financial system and spanned growth in the number of banks
operating in SA from a mere 3% in 1994 to 9.5% of total banking sector assets by the end of 2004. As of 2004;
which is the start of the sample period on which this research is based, SA had a total of 81 banks consisting of
15 South African controlled banks, 6 subsidiary banks, 15 local branches of international banks and 2 mutual
banks SARB, (2004). In addition, 43 international banks were authorized to own representative offices in South
Africa (see figure 1.2 below). Five major groups including the ABSA, Standard Bank, First Rand, Investec and
Nedcor dominated the SA banking sector during these early years and accounted for 83,8% of the total assets of
the banking sector in SA (SARB, 2004). However, due to the SA Reserve Bank's quest to follow the "four pillar"
regime (traditionally practiced by Australia) after the 2008 global crises to further stabilize its financial system
and encourage competition during crises, the Bank resorted to the theory of the “big four”. Hence Investec was
pulled out. The placing of African Bank under curatorship was largely to mitigate the effects of risk spillover.
SARB, (2016) reports that as at end of 2015, the SA banking sector comprised 17 registered banks, 2 mutual
banks, 14 local representatives of foreign banks, 2 co-operative banks and 43 foreign banks with approval of local
representative offices making a total of 78 banks in operation. This shows an approximate 4% decrease in the total
number of banks operating in SA over the period. Key reasons explaining this decrease include liquidity issues in
the early 2000's which saw the exit of Saambou Bank in 2002, the acquisition of BOE by Nedbank and the
placement of African bank under curatorship in August 2014.

Page 10 of 66
Figure 2.1 Number of banks in South Africa over ten years.2
2.1.1 Bank assets in relation to gross domestic product
Figure 2.2 presents the sector’s assets in relation to gross domestic product (GDP). The sector’s assets
in billions and starting at about R800billion in 2001 directly tracked GDP up to the pre-crises year 2006
before surprisingly increasing higher than GDP during the crises years. This may mean that despite the
effects of the crises, banks could grow their assets base certainly from within the country thanks to the
buoyant GDP growth. Moreover, the effects of the crises were less felt in SA and rather largely affected
employment leading to numerous job cuts. However, the ratio of GDP to total bank assets fared
constantly to the increase, starting at about 88% in 2001 to approximately 116% at the peak of the crises
in 2009 before decreasing post crises. This, as expected is a result of the aftermath of the crises which
led to massive job cuts across the entire economy.
2 Source: SA Reserve Bank and author’s deductions.

Page 11 of 66
Figure 2.2 Total banking-sector assets in relation to gross domestic product3.
2. 2 Key risk factors defined and hypotheses stating
This area of the study first defines each risk factor and then theoretically specifies the relationship between the
factor and risk, which in turn guides model specification.
2.2.1 Bank Capital-to-Asset Ratio (CAR)
Besides regulatory requirements such as the Basel Accord frameworks, banks traditionally are required to hold
sufficient capital as a buffer against stressed market conditions or simply against potential risks they are exposed
to in their lines of business. Hitchins, Hogg and Mallet, (2001) define Capital-to-asset ratio as the ability of a bank
having enough capital to cover the risks its faces in its line of business. Alternatively, Bangkok Bank, (2008) puts
forward a more detail definition for capital adequacy in which it distinguishes the main risks facing a bank.
According to the Bank, capital adequacy risk is the risk that a bank may not have sufficient capital reserves to
operate its business or to absorb unexpected losses arising from credit, market and operational risks. Interestingly,
CAR shows not only how well a bank is capitalized, but also measures the quality of the bank’s assets. As a result,
3 Source: South African Reserve Bank and own deductions.
2001 2002 2003 2004 2005 2006 2007 2008 2009 2010
140
120
100
80
60
40
20
0
3500
3000
2500
2000
1500
1000
500
0
Total banking-sector assets to gross domestic product (right-hand scale)
Percent R billions
Gross Domestic Product Total banking sector assets
Page 12 of 66
many central banks encourage their banks to hold a certain percentage beyond and above that normally required
by the main regulator they adopt such as Basel Accord. This percentage in most cases is directly dependent on the
economic environment. For example, at 14,35% of its risk weighted assets as of June 2015, SARB, (2015)
satisfactorily posits that its banking sector’s capital-to-asset ratio remained well above the regulatory requirement.
Basel II framework currently recommends that a bank should hold capital equal to at least 10 percent of its risk
weighted assets compared to Basel I’s recommendation of 8 percent some years back, until 2013. CAR comprises
of tier 1 or core capital (which includes common equity and non -cumulative perpetual preferred shares) and tier
two or supplementary capital (which includes cumulative preferred stock, types of 99-year debentures and
subordinated debt) as a proportion of total risk weighted assets (Hull, 2015). Moreover, Basel I also recommend
that at least 50% of capital must be tier 1. In addition, SARB, (2015) reports that Basel III framework recommends
that banks have adequate stock of unencumbered high-quality liquid assets easily convertible to cash to regularly
and timely meet their liquidity risks. Basel III very recently came up as a modification of Basel II in the wake of
stressed and unstable markets. The Bank reports that this was implemented in SA in January 2015.
The effects of capital on risk have been documented in finance literature, although very sparingly as Gregory and
Hambusch, (2015) postulate that risk drivers in general is one of those areas in finance with a lot of research gaps.
For example, Keeley, (1990) and Lindquist, (2004) argue that the reason bank regulators have bank capital at the
center of their attention is thanks to its role serving as a financial buffer to absorb losses, which further mitigates
issues of information asymmetry (particularly moral hazard) at bank level. However, Aduda and Gitonga, (2011)
are amongst those with views that the more capitalized a bank is, the higher its ability to absorb any unexpected
losses thereby reducing the financial risk of the banking institution. Oladele, Sulaimon and Akeke, (2012) share
similar views when they, in their work on ten Nigerian banks found that a higher capital ratio reduces risk while
a lower capital ratio exposes banks to higher risks. Interestingly, the authors reaffirmed the theoretical adage that
higher equity levels reduce the extent to which debt financing is needed. The size of the bank though is of extreme
importance here as high capital requirements have been proven to be detrimental to the existence of small size
banks. For instance, Boot and Marine, (2006) found that high minimum capital requirements force small banks
out of the banking system due to their inability to compete with large banks.
Meanwhile, Frederick, Furlong and Keeley, (1989) follow a contrarian route to argue against the views of most
commercial banks and scholars alike (such as Gregory & Hambusch, 2015) that more stringent capital regulation
will exacerbate the problem of risk-taking. The authors theoretically document in their findings that more stringent
capital regulation is a prerequisite for reduction in bank risk exposure. Paradoxically, very recent studies by Klomp
Page 13 of 66
and de Haan, (2012) on more than 200 banks from 21 OECD countries and Gregory and Hambusch, (2015) on
factors driving risks in the US banking sector seem to correctly argue that existing theoretical and empirical
literature has explored the question whether minimum capital ratio levels do in fact reduce risk and published
results are ambiguous. The former authors substantiate that one of the reasons for the mix results relates to the
issue of no generally accepted definition of banking risk. Varied literature on these arguments which comprises
studies around many other areas of the world include: Firstly; Van Hoose, (2007)’s work on both the Basel I of
1988 and Basel II of the 1990s. The scholar reviewed the literature surrounding the introduction and design of
these internationally recognized frameworks and documented no consensus opinion on the relationship between
relative levels of bank capital and risk. Secondly, and despite Furlong and Keely, (1989)’s findings that these
frameworks effectively reduce bank risk, Daesik and Santomero, (1988) found this not to be true. Rather, the
authors found that capital requirements increase bank risk. Meanwhile the former author’s findings are consistent
with those of Fiordelisi and Mare, (2013); Frederick, Furlong and Keeley, (1989); Frame and White, (2007) and
Haq and Heaney, (2012), the latter authors’ findings are consistent with those of Saunders et Al, (1990).
A review of studies similar to Gregory & Hambusch, (2015) is imperative to ascertain best practice in other
economic settings, but also to appreciate best characteristics of emerging economies such as South Africa, Nigeria
and Kenya. For example; Konishi & Yasuda, (2004) similarly employ data from Japanese commercial banks to
empirically study the effects of capital adequacy requirements, amakudari, shareholders and franchise value on
bank risk. The authors, in their methodology also followed a two-step approach like Gregory & Hambusch, (2015)
which includes running regressions in step one to generate risk measures used as dependent variables in step two.
In contrary to Gregory & Hambusch, (2015) however, they make use of panel regression technique to estimate
the regression model while also incorporating Boyd, Graham & Hewitt, (1993)’s Z-score to control for insolvency
risk. The authors found an inverse relationship between capital adequacy requirements and risk taking, an
insignificant relationship between acceptance of retired government officials (amakudari) on bank’s boards and
bank risk, as well as an inverse relationship between franchise value and risk taking by commercial banks in Japan.
Secondly, Klomp & De Haan, (2012), in their methodology applied principal component analysis as well as a
multilevel quantile regression model to data on more than 200 banks from 21 OECD countries over the period
2002-2008 to study the effects of bank supervision and regulation on banking risk. Their findings conclude bank
supervision and regulation to influence the risk of high-risk banks. Third, Haq and Heaney, (2012), just like
Gregory & Hambusch, (2015) made use of a two-step approach in their studies on 117 commercial banks across
15 European countries over the period 1996-2010. Comparatively; the authors, in step 1 made use of a two-factor
model previously used by Kane & Unal, (1988) and Flannery & James, (1984) to estimate risk factors used in step
two as explained variables just like Gregory & Hambusch, (2015). They however, in the quest to minimize biases
Page 14 of 66
adopted as methodology, the Arellano & Bover, (1995) and Blundell & Bond, (1998)’s two-step system GMM in
step two to empirically investigate bank capital, charter value, off balance sheet activities, dividend pay-out ratio
and size as determinants of bank risk. Findings indicated mixed results between charter value and bank risk, a
positive relationship between bank risk and off-balance sheet activities and a negative relationship between
dividend payout ratio and bank risk. Finally: Frederick, (2015), employed Multiple Linear Regression Analysis
on commercial banks in Uganda over the period 2000-2011 to study factors affecting the performance of the banks
including asset quality, management efficiency, interest income, capital adequacy and inflation. The author, in his
methodology regressed the return on assets against performance indicators and found management efficiency;
asset quality; interest income; capital adequacy and inflation to be factors affecting performance of domestic
commercial banks.
Despite the unavailability of literature on risk in the SA banking industry to permit gauging effects of capital
requirements on risks in the sector, myriad studies on non-South African banks have found results in favor of the
effectiveness of capital requirements. On the one hand, Haq and Heaney, (2012) found a non-linear negative
relationship between capital ratio levels and risks from their studies on 56 selected European banks, Konishi and
Yasuda, (2004) concluded the introduction of minimum capital ratios to reduce bank risk in Japan. Yet, Lindquist,
(2004) and Lee and Hsieh, (2013) found quite comparable results. According to the former, increased levels of
bank capital-to-asset ratio reduced bank risk in Norway while the latter published a negative relationship between
banks’ relative capital levels and risk in their study on 42 countries in the Asian region. Guided by the above
theoretical and empirical findings, a negative relationship between bank risk and bank’s capital ratio levels is
predicted and therefore leads to stating of the following first hypothesis; (H1):
H1. The CAR has a negative relationship with bank risk.
2.2.2 Franchise value
Keeley, (1990) defines franchise value as the value of an organization that would be forgone in the event of
foreclosure. Franchise value which is also known as charter value is simply defined differently as stated above in
the introductory section as the going concern value of a firm or institution. Several studies around the US have
found mixed results on the relationship between franchise value and bank risk. Contrary to Jones, Miller and
Yeager, (2011)’s findings of a negative relationship explained by the bank’s ability to mitigate moral hazard issues
is Saunders and Wilson, (2001)’s empirical groundworks of a positive relationship during periods of economic
expansion but with a negative relationship during economic contraction. Additionally, Boyd and De Nicole,

Page 15 of 66
(2005) equally found evidence of a positive relationship between a bank’s charter value and its risk while Frame
and White, (2007) theoretically argue in support of a negative relationship but go on to empirically find their
proposition to be true.
Notwithstanding, several interesting findings in studies elsewhere in the world on this relationship have not been
indifferent from those published by US academics. For instance, recent studies by Jimenez et Al, (2013) of risks
facing the Spanish banking sector confirmed a nonlinear relationship between bank risk and franchise value. In
contrary, Konishi and Yasuda, (2004) concluded a positive relationship between charter value and systematic risk
on the one hand against a negative relationship between the former and both idiosyncratic risk and total risk in
Japan on the other hand.
In the final analysis, a negative relationship is theoretically suggested between franchise value and bank risk
during economic crises in the study. This follows Gregory and Hambusch, (2015)’s suggestions of a positive
relationship between bank risk and franchise value during non-crises years that coincide with periods of economic
expansion and a negative relationship between franchise value and bank risk during crises backed by increased
regulation and bank efforts to protect franchise value.
H2. Franchise value has a positive relationship with bank risk in non-crises years and a negative relationship with
bank risk during crises years.
2.2.3 Lobbying
We generally talk of lobbying by corporations to refer to instances when they seek assistance, be it financial or
political contributions. In this way, these corporations either gain favorable regulatory conditions or other
economic benefits. To reiterate, lobbying appears to be the least studied risk measure, not only in SA context but
globally in finance literature. One usual reason advanced to explain this could be the fact that only a small
proportion of institutions lobby as generally argued in existing literature, (for example Blau et Al, 2013). This
could be explained by many banks’ seeming believe that lobbying is vastly a politically delineated aspect contrary
to their code of ethics. In addition, at the time of conducting this research, challenges in obtaining data on lobbying
by SA banks prompted me to contact the banks directly. Per my findings, out of the seven banks that constitute
the data sample on which the study is based, only about five of them seem to lobby, representing approximately
70% of the sample size. This however could be seen as an impediment to the stability of the banks that choose not
to lobby as Gregory and Hambusch, (2015) after studying lobbying expenditures of US banks over a period of
Page 16 of 66
13years assert that lobbying looks to be of significant importance to the US banking sector. If it be the case for
the world’s most developed economy, then think of how important lobbying should be for a small emerging
economy of South Africa’s size. On the contrary, Chelmers, (2017) argues that lobbying leads to regulatory failure
and impedes global financial regulation in the banking sector. Lobbying would undoubtedly enhance bank
earnings, but also reduce risk during crises.
Notwithstanding, previous studies have however concluded mixed results on the link between lobbying and risk
just as is the case with both franchise value and CAR. In the first instance, Cooper et Al, (2010) confirmed a
positive relationship between corporate lobbying and risk in their studies of the link between political connections
and stock returns. This is also in line with Faccio et Al, (2006)’s findings when they employed data from 450
politically connected firms in 35 countries over a five-year period to investigate the relationship between corporate
bailouts and political connections. They established that politically connected firms have higher chances of being
bailed out than similar nonconnected corporations. Similarly, Khwaja and Mian, (2005) found that politically
connected firms portray higher leverage ratios than their nonconnected counterparts after constructing a data set
from over 90 000 firms from Pakistan. Again, Blau et Al, (2013) failed to find any direct link between bank risk
and lobbying when they studied the lobbying expenditures of banks in the US that received government support
under the 2008 Troubled Asset Relief Program. The authors identify such benefits of lobbying as beneficial
regulatory regimes, preferential tax regimes and preferential treatment by government owned enterprises. As an
example, Hutchroft, (1998) enumerates benefits to troubled banks that lent to the Philippines president and his
Cronies.
Despite these achievements of lobbying, earlier literature has also documented reports of detrimental effects of
lobbing on corporations such as banks. Firstly, Gul, (2006) in his study of the role of the political economy in
financial reporting and auditing in Malaysia found a negative link between political connections and bank risk in
that firms with political connections recorded increases in audit fees compared to those with no political
connections after the Asian crises. Johnson and Mitton, (2003) documented similar conclusions when they studied
government subsidy structures in Malaysia during the Asian crises.
Building on the above analyses which in totality could summarize a decrease in total risk and overall market risk
during non-crises years and since banks have been proven empirically to engage in riskier activities post bailout
(Duchin and Sosyura, 2012); which may potentially increase risk during crises, permit me state the third
hypothesis:

Page 17 of 66
H3. Lobbying has a negative relationship with bank risk in non-crises years and a positive relationship with bank
risk during crises.
2.3 Other risk factors
Besides the key risk drivers of CAR, franchise value and lobbying discussed above, other risk drives, including
bank size, operating leverage, dividend payout ratio and off-balance sheet activities have been largely argued and
documented in the literature as possible bank risk drivers. Due to challenges largely related to data availability,
only two of these drivers are included in the current study. They are succinctly discussed in the next lines that
follow.
2.3.1 Bank size
Bank size, used as a control variable in the study is calculated as the natural logarithm of the book value of total
assets. Scholars have generally argued that bank size is inversely related to bank risk in that larger banks tend to
hold large levels of assets which serve as added buffer against firm-specific risk. For example, Demsetz and
Strahan, (1997) found bank size to move directly in sync with diversification, which in turn reduces risk in their
study of selected bank holding companies. The authors argued that banks in the quest for diversification tend to
engage in riskier asset portfolios and thus deduce that diversification does not necessarily translate into reduction
in risk. Their findings however showed that larger banks tend to hold highly diversified assets which then reduces
bank risk. In a similar trend, Weelock and Wilson, (2000) in their search to dissect the reason for bank failure in
the US also found large banks less likely to fail mainly thanks to diversification advantages.
Additionally, the concept of systematically important financial institutions (SIFIs); largely prevalent in the US
banking sector jargon has come alight when banks seem to fail due to ignorantly considering their big size to
shield them from risk. Labonte, (2017), defines SIFIs to include those financial institutions whose failure caused
by key factors including size, complexity and systemic interconnectedness would cause significant disruption to
the wider financial system and economic activity. This has the consequence of increased systemic and moral
hazard risks of banks. It is therefore important that bank size is controlled in the study to reduce variabilities and
biases in explanatories variables. To this effect, it is assumed negatively related to bank risk.

Page 18 of 66
2.3.2 Operating leverage
Operating leverage is defined in the study as the ratio of total fixed assets to book value of total assets. A
substantial portion of literature on banking has argued for, and documented a positive relationship between
leverage and bank risk. Firstly, De Young and Roland, (2001) in their studies on earnings volatility of a sample
of 472 banks in the US confirmed the theoretical expectation of a positive link between operating leverage and
bank risk. They found that as median banks tend to deviate from their traditional originate-and hold lending
activities to generate more income from noninterest generating businesses, chances of increased volatility in
earnings become apparent which leads to more risk taking. Secondly, Saunders et Al, (1990) arrived at a similar
conclusion when they found ownership structure to be a deterrent against risky call and put options strategies in
their study on ownership structure and bank risk taking. However; Chen, Steiner and Whyte, (1998) found
opposing results to what a great deal of the literature has documented. The authors found an unexpected negative
relationship between managerial ownership and market risk measures but went on to attribute this to reasons such
as sample size and functional relationships. The assumption however in this study is that of a direct link between
operating leverage and bank risk.
2.4 Proxies for bank risk measures
This subsection succinctly describes the various measures used as proxies for bank risk, but also clearly stating
reasons for the use thereof.
2.4.1 Total risk
Hull, (2015) defines total risk to include the sum of systematic risk and unsystematic (or diversifiable risk).
Systematic risk, traditionally measured by beta is the market risk that affects all investments or classes of
investments and cannot be diversified away by investing in different classes of assets. On the contrary,
unsystematic risk is the asset specific risk that can be diversified away by simply investing in different classes of
assets. Total risk is measured in the study as the standard deviation of daily changes in a bank’s stock price.
The use of total risk as a proxy for bank risk in the study falls in line with Agusman et Al, (2008)’s conclusion
that total risk includes the risks that affect each individual bank as well as market risk, or the risk that affects the
entire banking industry. Therefore, total risk serves as an embodiment of all possible risks facing either a bank or
the entire banking industry to better capture all risk effects inherent in banking activities.
Page 19 of 66
2.4.2 Firm specific risk
According to Salkel, (2011), firm-specific risk refers to that portion of total risk that is unique to each individual
bank, with business and financial risk as its two main sources. Firm-specific risk refers to the risk that arises from
the operations, performance or managerial decisions of a bank. This is the idiosyncratic (or systemic risk). It is
measured in the study as the standard deviation of the residual. Being specific to the banking sector, idiosyncratic
risk exerts direct links with key risk determinants such capital level, level of leverage by the bank and size of the
bank, thereby making it a reliable measure for banking risk.
2.4.3 Systematic risk
As mentioned above, systematic risk represents that portion of total risk that cannot be easily diversified away by
investing in different classes of assets. It is captured in the study as the difference between total risk and firm-
specific risk.
2.4.4 Market risk
Per Mehta et Al, (2012), market risk is the risk that affects the entire banking industry and represents the risk of
losses in the bank’s trading book due to changes in key market variables including: equity prices, interest rates,
credit spreads, foreign-exchange rates, commodity prices, and other indicators whose values are set in a public
market. This is captured in the study by beta. Beta is defined as the correlation between returns of the specific
bank and returns on the market. Traditionally, a portfolio with a beta of 1 simply means to say the portfolio has
the same quantity of risk as the market.
In the wake of the most recent global financial distress, regulators and risk management leaders at major banks
have continually encouraged and recommended more frequent risk modeling in the form of scenario analysis and
stress testing to identify potential risks facing the sector. Mehta et Al, (2012) alongside previous documented
literature have recognized value-at-risk (VaR) calculations as one of such reliable modeling technics for market
risk, which traditionally requires highly sophisticated technics to model. In addition to this modeling technic, an
inclusion of market risk as a dependent variable for bank risk measure may serve to already show or predict signs
of distress prior to the application of VaR technics.

Page 20 of 66
2.4.5 Interest rate risk
Interest rate risk, a component of market risk is defined by Hull, (2015) as the risk that results from maturity
mismatches of a corporation’s assets and its liabilities. It is captured in the model as the correlation between SA’s
10year treasury bill rate and returns of a bank and is expected to have a direct relationship with bank risk.
2.5 Summary
This chapter provided a brief overview of the South African banking sector pre-and post the advent of apartheid
and noted a remarkable growth trend in terms of financial sector development over the past two decades. Of
immense importance is the acknowledgement of its resilience to shocks thanks largely to very stringent regulation
both internationally and domestically on the one hand but also of excellent corporate governance structures and
risk management technics implemented. The main factors of CAR, franchise value and lobbying expected to drive
risk in the sector have been defined and previous literature reviewed, leading to the stating of hypotheses that will
in turn guide the regression model specification. Very fascinating is the fact that previous work on bank risk found
mix results on all three key risk majors. Which is worth reiterating the key question this study seeks to answer in
a different economic setting: What factors drive risk in the South African banking sector over a period before,
including and after financial crises. Additionally, and to bring the chapter to an end, the five different proxies for
bank risk measure which will serve as dependent variables in the model have been discussed in attempt to stimulate
reasons why they could be reliable proxies to capture potential risks facing the sector. Noteworthy is total risk
which is established as an umbrella cover for all various risk types facing the sector and as theory predicts is
expected to have a direct relationship with bank risk.
Page 21 of 66
CHAPTER 3. METHODOLOGY
The preceding chapter provided a review of existing literature on the key risk drivers in a banking industry which
are CAR, franchise value and lobbying. It went further to also highlight the various proxies used for bank risk.
The current chapter focuses on defining and specifying the exact method that will be used in the study. Of
importance are the steps taken to address the research problem which include the research sample and size, data
sources and collection methodology and finally specifying of the model proper.
3.1 Research design and paradigm
A research design, as elaborated by Zikmund, (2010) is an inclusive plan which specifies the actions and methods
needed to gather and analyze information pertaining to a study. Creswell, (2013) distinguishes between qualitative,
quantitative and mixed research designs. Meanwhile, Hopkins, (2008) states that a scholar’s aim in a quantitative
research is to determine the relationship between an independent variable and a dependent (or outcome) variable.
The author goes further to add that quantitative research methods are either descriptive or experimental. With
descriptive, subjects are usually measured once and hence may establish only associations between variables while
with experimental, subjects are measured before and after the treatment but also establish causality. It might be
worth reiterating that the purpose of this study is to identify those factors that drive risk in the SA banking industry;
with emphasis on the role of CAR and charter value. Because this study makes use of data analytics and critics
through the application of mathematical and statistical procedures leading to disputed results, the descriptive
quantitative research design type is best suited.
A research paradigm is described as a set of common beliefs and agreements shared between scientists about how
problems should be understood and addressed (Patel, 2015). He distinguishes three different forms of research
paradigms, which include positivists, constructivists and pragmatists. Because positivists believe that there is a
single reality which can be argued and known, it is more likely to use quantitative methods to measure this reality.
Meanwhile constructivists believe that reality must be interpreted and it is likely to use quantitative methods as
well while pragmatists believe in constant renegotiation, debating and interpreting of the reality and therefore it
is more likely to use a method that solves the problem. Based on the analogy made from the research design in
addition to the clear distinction made by Patel, (2015) in the preceding lines, it is evident that the research paradigm
best suited for the study at hand is the positivist quantitative research paradigm.

Page 22 of 66
3.2 Research methodology
Before delving into stating the specific research methodology this study has adopted, it is worth noting that a
research method is clearly distinct from a research methodology. A research method is merely a small part of a
research methodology. Kallet, (2004) describes a research method as the most important section of a study which
describes the rationale for the application of specific procedures or techniques used to identify, select, and analyze
information applied to understanding the research problem. This, then allows the reader to critically evaluate a
study’s overall validity and reliability. Differently, a recent publication by Schneider, (2014) succinctly defines a
research method as the technical steps taken to do research. On the other hand, Clark, (2005) distinguishes between
primary research and secondary data analysis as the two main methods for conducting a research. To him, primary
research is conducted by a researcher who performs the research in its entirety from collecting own data to
analyzing and deducting results whereas secondary research (or data analysis) entails the use of already available
data collected by another researcher to answer the research question by an individual. The current study uses the
secondary data analysis method given its reliance on historical data collected over a period of 12years from 2004
to 2015. Moreover, the use of the secondary data analysis method enjoys costs saving benefits (in terms of the
time required to collect and organize the data) and ease of access to some of the data.
The use of the company’s daily share price to model risk in the sector is thanks to its ability to explain firm-
specific risk (Dube & Kaya, 2017). The next two sections respectively discuss the research sample and size and
data collection, sources and methodology, while substantiating reasons for any challenges faced in the process.
The core of the study is explicitly documented in section 3.6 of the chapter and entails the use of cross section
regression analysis to analyze the data before the reliability and validity of the data is questioned in the final part
of the chapter.
3.3 Research sample and size
Sampling is a technique used to select a representative part of a population (which is a sample) from which to
make inferences and draw conclusions generalized to the population (Mugo, 2002). Hence, the sampling strategy
entails building on the parameters obtained from a particular population to address the research question and
objectives aligned to that population. One interesting point to note though is the issue of biases and sampling
errors. Kothari, (2004) warns that this form of sampling is usually very prone to sampling bias, but cautions that
the investigator in this case must be impartial and experienced to take the necessary judgments. As such, a good
sample must be representative of its population overall, particularly with regards to its characteristics.

Page 23 of 66
Between judgmental (or non-probability) and random (or probability) sampling techniques generally
recommended and used in the literature, judgmental sampling is the technique preferred for the current study.
Several reasons justify the appropriateness of this selected technique among: discretion and supremacy of the
researcher - allowing for selection of a sample that simultaneously controls for exogenous factors as well as
mitigates the issue of information adequacy, cost effectiveness and less time consuming. Mugo, (2002) defines
judgmental sampling as that perfected based on the discretion of the researcher familiar with the relevant
characteristics of the population under study.
Scholars among Brooks, (2008); Kothari, (2004) and Hastie, (2003) generally concur that the lager a sample size,
the more representative of the population the sample is and thus the less are its chances of suffering from biases
and sampling errors. This study on the South African banking industry makes use of a sample size of 7. That is,
out of the total of approximately seventeen registered banks in SA, seven banks constitute my data set. Banks
could be defined to include bank holding companies as well as commercial banks. The single most important
criteria used in the selection process was that the bank be publicly listed. This allows ease of access to, and
reliability of the data. In addition to the sample being very representative of the population of SA banks in terms
of size, the sample also constitutes the “big four” which together enjoy a substantial proportion of the market share
of approximately 89% as stated above in the first section of chapter 2.
3.4 Data collection, methodology and sources
Capital-to-asset ratio (CAR), franchise value, bank size and operating leverage are the research variables
employed by the study as elaborately explained in the section that follows. Data set for the study consisted of
publicly listed SA bank holding companies from 2004 to 2015. Daily share price data was obtained from Mcgregor
BFA database while interest rate data was obtained from Bloomberg. Information on the SA banking industry was
accessed through the Bureau of Economic Research, the SA Reserve Bank and Statistics SA. Other key data such
as bank specific asset pricing components was obtained from listed company websites and company's annual
audited financial statements. A review of the literature revealed that lobbying is relatively still a new term in most
emerging market economies including South Africa. As such, lobbying does not form part of the study due to the
unavailability of data.
Brooks, (2008) enumerates cross sectional data, time series data and panel data as the broad kind of data possibly
utilized to quantitatively model and study financial problems. Cross sectional data are those collected at a single
point in time on at least one variable whereas time series data, though also collected on one or more variables is

Page 24 of 66
collected over a period of time and panel data is that with both features of cross sectional and time series data.
For this study, a cross sectional approach is deemed most appropriate as it properly fits the data set. Daily price
data for each of the seven banks over the 12year period under which the study was conducted constituted the data
set. As a method of analyzing the data, both descriptive and summary statistics were used to summarize key
parameters of the data set.
3.5 Model specification and description of its variables
Among the Pooled Regression, the Fixed Effects and the Random Effects models distinguished by Gujarati, (2008)
as the three main techniques possibly used to perform data analysis in empirical research, random effects model
was adopted and used in the current study. The later model employs the ordinary least squares (OLS) method and
follows the classical linear regression model (CLRM) assumptions to obtain reliable parameter estimates of the
model. Brooks, (2008) postulates that these assumptions are based on the error variance which should have a zero
mean, constant variance, no autocorrelation, be normally distributed and finally should not be correlated with the
explanatory variable(s). The consequences of these assumptions are that violation of any one of them would lead
to wrong results realized. Moreover, issues of model specification and stationarity of the model are of paramount
importance as these may lead to spurious regressions, leading to yet unexpectedly wrong results. These points are
taken care of in chapter four prior to the estimation of the regression model. Simplicity (to understand and
interpret) is the single most important feature of the cross-section analysis model which makes it stand out and
consequently utilized in this study as emphasized by Gujarati, (2008). Nonetheless, the model is also prone to
some criticisms such as possibilities of autocorrelation present in the model.
Specification of the study’s model, as highlighted in the introductory part follows the two-step model implemented
by Gregory and Hambusch, (2015) on the US banking sector. In step one, a regression model is estimated to
calculate five different risk measures for each bank, while step two entails employing each of the risk measures
obtained in step 1 as dependent variables to estimate regression models which explain the link between each risk
measure and several factors affecting risk.
The five risk measures are total risk; captured in the model as the standard deviation of daily change in bank i’s
stock price, firm-specific risk; captured by the standard deviation of the residual term, systematic risk; calculated
by subtracting firm specific risk from total risk, market risk; captured by βM,i,t and interest rate risk; captured by
βI,t.. CAR, operating leverage (OL) and franchise value (FV) in the study are calculated as:

Page 25 of 66
CAR = risk adjusted assets/total bank capital.
OL = Total fixed assets/book value of total assets
...
Equation (1) details the first step of the model specification where regressions are used to calculate measures
required in step two4.
Ri,t = αi,t + βM,i,tRM,t + βI,t RI,t+ µi,t (1)
where: Ri,t represents the daily stock return for bank i at time t, RM,t represents the daily market return of the JSE
Alsi index, RI,t represents the daily change in the yield of the ten year SA government bond, αi,t represents the
slope intercept for bank i at time t, βi represents the various slope parameters and µ is the residual term.
θi,t = αi,t + β1CARi,t + β2FVi,t + β3Si,t + β4OPLVi,t + µi,t (2)
where: θ represents one of the risk measures calculated in equation (1) for bank i in year t; CARit represents bank
i’s capital-to-asset ratio in year t; FVi,t represents bank i’s franchise value in year t and theoretically expected to
be negatively related to bank risk; Si,t represents the size of the company captured as the natural log of its book
value of total assets and OPLVi,t represents operating leverage for bank i in year t and theoretically expected to be
positively related to bank risk. Meanwhile the parameters αi,t, β1…4 and µi,t are defined as in step one above.
The model represented in equation one is none other than the celebrated Capital Asset Pricing Model (CAPM)
equation where the intercept represents the risk-free rate while the interest rate represents a premium for bearing
additional systematic risk as rightly captured by beta. Furthermore, equation (1) is a generalization of two markets;
the stock market in which β according to the CAPM theory is a measure of the riskiness of the market and usually
equals to 1 and the money market in which β also represents a measure of the riskiness of the market and just like
the stock market is generally consider equals 1. It is usually termed systematic risk to refer to that portion of
market risk which is undiversifiable.
As detailed above, daily returns for each bank and the various risk measures including total risk, firm-specific
risk, systematic risk, market risk and interest rate risk are the dependent variables while returns on the JSE Alsi
4 For variable definitions, refer to table 3.1 on page 26.
FV = Book value of total assets
Market value of equity + book value of liabilities

Page 26 of 66
index, interest rate and the various expected risk drivers including CAR, franchise value, operating leverage and
bank size were used as independent (or explanatory variables). Table 3.1 below summarizes these variables.
Variable Type of
variable Measure Abbreviation
Bank returns Dependent Daily returns for bank R
Total risk Dependent Stdev of daily change in stock price TOTRISK
Firm-specific risk Dependent Standard deviation of residuals FSRISK
Systematic risk Dependent TOTRisk – FSRisk SYSRISK
Market risk Dependent Market’s beta MKTRISK
Interest rate risk Dependent Beta coefficient INTRISK
Mkt index returns independent Daily returns for market JSEMKT
Interest rates Independent Government bond r
Bank Capital Independent (tier I + tier II)/risk weighted assets CAR
Franchise value Independent (Mkt value of equity + book value of liabilities)/book value of total assets
FV
Operating leverage Independent Total fixed assets/book value of TA OPLV
Bank size Independent Natural logarithm of total assets S
Table 3.1 Summary defining the research variables for the study5
3.6 Reliability and validity of data
Twycross and Shields, (2004) ascertain that to be valid, a study’s technique, research tool or procedure should
measure what it sets out to measure. To ensure that this is adequately achieved, measures such as sources of data
collection and method of collection be highly trusted. That is, data should be collected from reliable sources.
Furthermore, it is advised that researchers refrain from using tools out of their own knowledge or know how, but
to rather use tools that have been in existence and well accepted. Data sources for the study are judged reliable
and valid as the data is collected from trusted and credible data vendors and publishers. Firstly, data and
information is collected from published journal articles. Secondly, empirical data is collected from Mcgregor BFA
and Bloomberg, which are trusted and well-known data vendors respectively in SA and internationally. Moreover,
information from the Reserve bank and company specific information is obtained from their audited financial
5 Source: Authors’ own work.

Page 27 of 66
statements, which are also publicly available. The fact that the information is publicly available adds impetus to
verifiability should the need arise.
3.7 Summary
This chapter elaborated on the research methodology, a very important component of any research study. A
descriptive quantitative research design technique was adopted in the study while the positivist quantitative
research paradigm was deemed more suited. Secondary data analyses methodology by use of judgmental sampling
was implemented on a data set comprising seven SA banks to understand potential risks facing the sector. Data
collection and sources was correctly argued to be valid and reliable as the main data sources for the study are large
reputable domestic and international data vendors in addition to the fact that its public availability of the data
makes verifiability an easy exercise. The model was equally specified with its variables clearly defined with
attention on those variables meant to account for effects outside the prime business of the study. These are the
control variables. The model was implemented using cross section regression analysis as the core of the study
with results and discussions forming the core of the next chapter. These will provide answers to the research
question before the concluding chapter comes in to summarize the whole study and suggest gaps for further
studies.

Page 28 of 66
CHAPTER 4. EMPIRICAL FINDINGS AND DISCUSSIONS
This chapter presents the empirical results of the study and comprises three main subsections including:
Correlation analysis in the first part to predict patterns or movements in the risk measures in relation to the various
risk drivers including the CAR, franchise value, operating leverage and bank size. Next, descriptive statistics and
regression results are analyzed separately and then in comparison by periods before, during and after the crises to
understand what factors drive risk in the SA banking industry. Finally, the adjusted R-squared is employed to
gauge how much the data fits the model estimates in subsection 4.3.
4.1 Correlation analysis of risk measures
This section seeks to demonstrate the relationship graphically between the five risk measures in the form of a
trend analysis and the various control variables over the period under study. To construct the graph, the author
averaged each of the variables for the banks constituted in the sample each year.
4.1.1 Firm-specific risk (FSR)
Firm-specific risk, one of the five risk measures used in the study as a dependent variable in equation (2) is
separately plotted against each of the four regressors; the capital-to-assets ratio, franchise value, operating leverage
and bank size in the graphs labelled 4.1a – 4.1d. The graphs plot percentages for the variables on the vertical axes
against time in years from 2004 to 2015 on the horizontal axis. A quick glance at figures 4.1a and 4.1b reveals the
CAR almost being a mirror image of franchise value although it displays a continuous decreasing trend from the
beginning of the period till the end compared to the franchise value which starts by increasing during the pre-
crises years. Generally, both H1 and H2 are clearly confirmed respectively in 4.1a and 4.1b. The negative
relationship theoretically postulated between the CAR and bank risk is visible in the graph while the charter value
consistently displays a negative relationship with idiosyncratic risk during crises and a positive relationship in the
none crises years. CAR on average showed a large decrease over the period starting from approximately 30% in
2004 to 20% in 2015. This could partially be because of banks increasing investments in liquid short to mid-term
money market assets in the quest to comply with the recent implementation of Basel III in SA, but could also be
a risk management technic as many scholars (for instance Berger & Bouwman, 2013) have theoretically argued
that large capital-to-assets ratios increase bank risk taking.

Page 29 of 66
Figure 4.1a Firm-specific risk and the capital-to-assets ratio
Firm-specific risk decreased sharply during the pre-crises years from about 15% in 2004 to below 5% in 2006
before rising sharply between 2007 and 2008, signaling the advent of the crises. It was clearly at its peak between
2008 and 2009 while sharply dropping in 2010 before increasing slowly from 2010 to 2015. The CAR explanation
applies to all five risk measures as the same CAR is used as a risk driver throughout this trend analysis. The
expected positive relationship between operating leverage and bank risk also seems to be evident throughout the
period although not very clear during the crises. Only bank size seemed to hold true with what theory predicts; a
negative relationship with firm specific risk. Interestingly, bank size has a sharp upward trend even during the
crises. This indicates that the crises were far from being an impediment to growth.
Figure 4.1b Firm-specific risk and franchise value
0
0.5
1
1.5
2
2.5
3
0
10
20
30
40
2004 2005 2006 2007 2008 2009 2010 2011 2012 2013 2014 2015
Per
cen
tages
(%
)
per
cen
tages
(%
)
Year
FSR vs CARCAR FSR
0
0.5
1
1.5
2
0
0.5
1
1.5
2
2.5
3
2004 2005 2006 2007 2008 2009 2010 2011 2012 2013 2014 2015
Per
cen
tag
es (
%)
Per
cen
tag
e (%
)
Year
FSR vs FVFSR FV

Page 30 of 66
Figure 4.1c Firm-specific risk and operating leverage
Figure 4.1d Firm-specific risk and bank size
4.1.2 Market risk (MktR)
Just as is the case with idiosyncratic risk, figures 4.2a and 4.2b show that the correlation between the CAR and
market risk is very similar to that between franchise value and market risk. The slight difference though is at the
start of the period during the pre-crises years where contrary to the CAR decreasing, franchise value is increasing.
Again, the expected negative relationship between the CAR and bank risk is confirmed, even though not very
significantly against a consistent positive relationship between franchise value and bank risk. Market risk fared
evenly to the increase over the period with a surprised and unexpected slight decrease during the crises years while
sharply decreasing in 2012 before rising again sharply from 2013 till the end of the period in 2015. Meanwhile a
consistent negative relationship is observed between market risk and operating leverage against theoretical
0
1
2
3
4
5
6
0
0.5
1
1.5
2
2.5
3
2004 2005 2006 2007 2008 2009 2010 2011 2012 2013 2014 2015
Per
cen
tages
(%
)
per
cen
tages
(%
)
Year
FSR vs OPLEVFSR OPLEV
16
17
18
19
20
0
0.5
1
1.5
2
2.5
3
200420052006200720082009201020112012201320142015
Per
cen
tag
es(%
)
Per
cen
tag
es (
%)
Year
FSR vs SIZEFSR SIZE

Page 31 of 66
expectation as shown by figure 4.2c, an overall positive correlation is observed as expected between bank size
and market risk as elaborated by figure 4.2d.
Figure 4.2a Market risk and the capital-to-assets ratio
Figure 4.2b Market risk and franchise value
0
0.2
0.4
0.6
0.8
1
0
5
10
15
20
25
30
35
20042005 200620072008 20092010 20112012201320142015
Per
cen
tages
(%
)
Per
cen
tages
(%
)
Year
MktR vs CARCAR MktR
0
0.5
1
1.5
2
0
20
40
60
80
100
2004 2005 2006 2007 2008 2009 2010 2011 2012 2013 2014 2015
Per
cen
tag
es (
%)
Per
cen
tag
es (
%)
Year
MktR vs FV MktR FV

Page 32 of 66
Figure 4.2c Market risk and operating leverage
4.1.3 Systematic risk (SysR)
Systematic risk which is computed in the study as the difference between total risk and firm-specific risk displays
a very similar correlation with the CAR and franchise value during and post the crises years as shown in figures
4.3a and 4.3b. Furthermore, an exact positive correlation is confirmed between the Car and systematic risk pre-
crises and continues fairly divergent post crises while the opposite looks to be true for franchise value. Pre-crises,
franchise value is negatively correlated with systematic risk before returning to be consistent from 2007 to the end
of the period.
Figure 4.2d Market risk and bank size
Operating leverage all throughout the period has an unexpected negative relationship theoretically with systematic
risk while size is negative pre-crises but becomes positive during and after the crises and ends up converging with
the risk measure as seen in figures 4.3c and 4.3d respectively.
0
2
4
6
0
20
40
60
80
100
2004 2005 2006 2007 2008 2009 2010 2011 2012 2013 2014 2015
Per
cen
tages
(%
)
Per
cen
tages
(%
)
Year
MktR vs OPLEVMktR OPLEV
16
17
18
19
20
0
20
40
60
80
100
200420052006200720082009201020112012201320142015
Per
cen
tag
es (
%)
Per
cen
tag
es (
%)
Year
MktR vs SizeMktR S
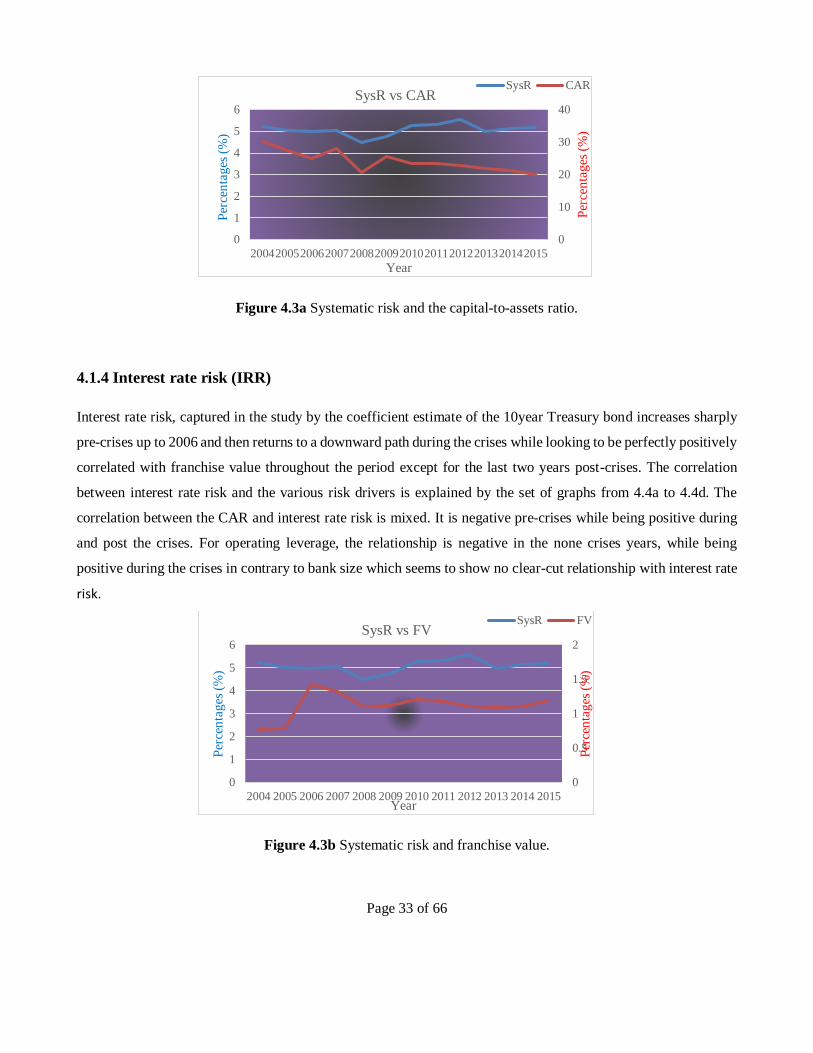
Page 33 of 66
Figure 4.3a Systematic risk and the capital-to-assets ratio.
4.1.4 Interest rate risk (IRR)
Interest rate risk, captured in the study by the coefficient estimate of the 10year Treasury bond increases sharply
pre-crises up to 2006 and then returns to a downward path during the crises while looking to be perfectly positively
correlated with franchise value throughout the period except for the last two years post-crises. The correlation
between interest rate risk and the various risk drivers is explained by the set of graphs from 4.4a to 4.4d. The
correlation between the CAR and interest rate risk is mixed. It is negative pre-crises while being positive during
and post the crises. For operating leverage, the relationship is negative in the none crises years, while being
positive during the crises in contrary to bank size which seems to show no clear-cut relationship with interest rate
risk.
Figure 4.3b Systematic risk and franchise value.
0
10
20
30
40
0
1
2
3
4
5
6
200420052006200720082009201020112012201320142015
Per
cen
tages
(%
)
Per
cen
tages
(%
)
Year
SysR vs CARSysR CAR
0
0.5
1
1.5
2
0
1
2
3
4
5
6
2004 2005 2006 2007 2008 2009 2010 2011 2012 2013 2014 2015
Per
cen
tag
es (
%)
Per
cen
tag
es (
%)
Year
SysR vs FVSysR FV

Page 34 of 66
Figure 4.3c Systematic risk and operating leverage.
Figure 4.3d Systematic risk and bank size.
Figure 4.4a Interest rate risk and the capital-to-assets ratio.
0
2
4
6
0
2
4
6
2004 2005 2006 2007 2008 2009 2010 2011 2012 2013 2014 2015
Per
cen
tages
(%
)
Per
cen
tages
(%
)
Year
SysR vs OplevSysR OPLEV
16
17
18
19
20
0
2
4
6
2004 2005 2006 2007 2008 2009 2010 2011 2012 2013 2014 2015
Per
cen
tag
es (
%)
Per
cen
tag
es (
%)
Year
SysR vs SizeSysR S
0
10
20
30
40
-50
0
50
100
150
2004 2005 2006 2007 2008 2009 2010 2011 2012 2013 2014 2015
Per
cen
tages
(%
)
Per
can
tag
es (
%)
Year
IRR vs CAR IRR CAR
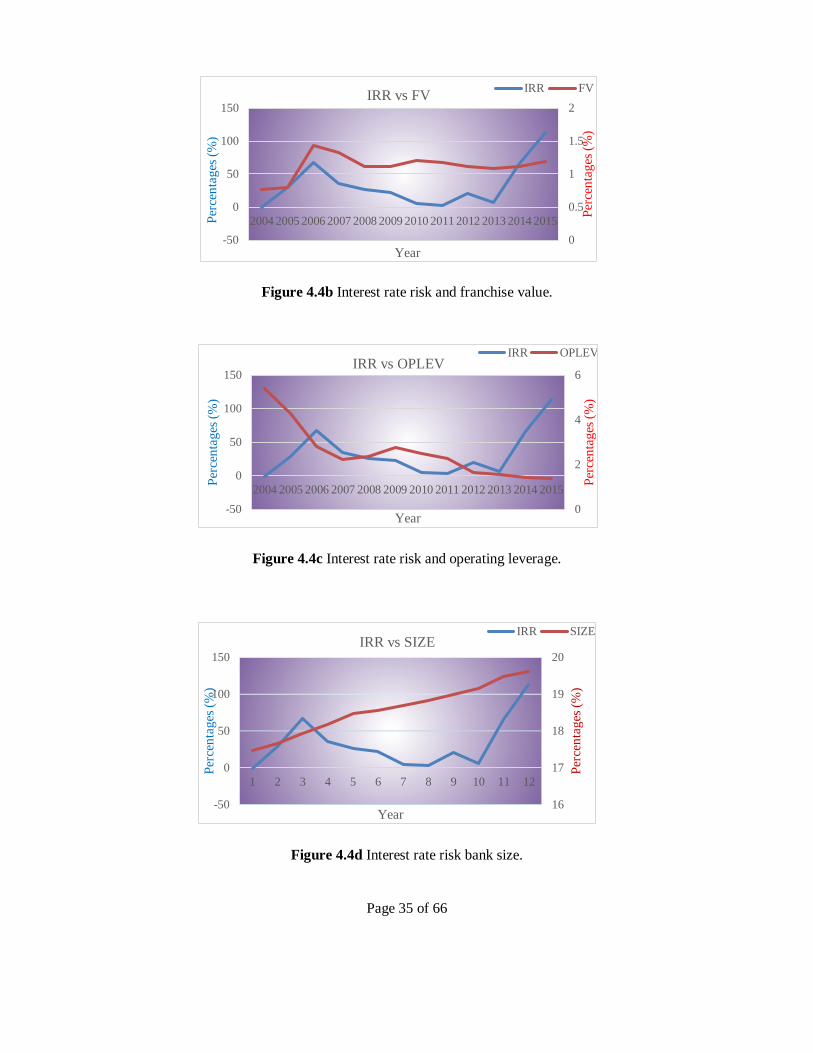
Page 35 of 66
Figure 4.4b Interest rate risk and franchise value.
Figure 4.4c Interest rate risk and operating leverage.
Figure 4.4d Interest rate risk bank size.
0
0.5
1
1.5
2
-50
0
50
100
150
2004 2005 2006 2007 2008 2009 2010 2011 2012 2013 2014 2015
Per
cen
tag
es (
%)
Per
cen
tages
(%
)
Year
IRR vs FVIRR FV
0
2
4
6
-50
0
50
100
150
2004 2005 2006 2007 2008 2009 2010 2011 2012 2013 2014 2015
Per
cen
tag
es (
%)
Per
cen
tag
es (
%)
Year
IRR vs OPLEVIRR OPLEV
16
17
18
19
20
-50
0
50
100
150
1 2 3 4 5 6 7 8 9 10 11 12
Per
cen
tages
(%
)
Per
cen
tages
(%
)
Year
IRR vs SIZEIRR SIZE

Page 36 of 66
4.1.5 Total Risk (TR)
Generally, and as expected theoretically, a negative relationship can be confirmed between total risk and
the CAR throughout the period. Total risk is graphed against the various risk factors in graphs 4.5a to
5.4d. The risk measure follows a trend very similar to that of idiosyncratic risk, although less volatile.
As expected theoretically, it is at its peak close to 7% during the crises years. One can argue that the
CAR does not seem a good driver of bank risk during the crises compared to none crises years as shown
by figure 4.5a.
Figure 4.5a Total risk and the capital-to-assets- ratio.
Franchise value on its part seems to track total risk throughout the period against theoretical
expectations except during the crises when it is slightly lower. Meanwhile no clear-cut relationship is
explained between operating leverage and bank risk in figure 4.5c, bank size shows an almost perfect
positive correlation with bank risk, which is very far from theoretical predictions.
0
10
20
30
40
6.2
6.4
6.6
6.8
7
7.2
200420052006200720082009201020112012201320142015
Per
cen
tag
es (
%)
Per
cen
tag
es (
%)
Year
TR vs CARTR CAR
0
0.5
1
1.5
2
6.2
6.4
6.6
6.8
7
7.2
2004 2005 2006 2007 2008 2009 2010 2011 2012 2013 2014 2015
Per
cen
tag
es (
%)
Per
cen
tages
(%
)
Year
TR vs FVTR FV

Page 37 of 66
Figure 4.5b Total risk and franchise value.
Figure 4.5c Total risk and operating leverage.
Figure 4.5d Total risk and bank size.
4.1.6 Comparison of the five risk measures
Graph 4.6 displays a plot of all five risk measures to provide a better view of the relationship between them, but
also their trend over the period. This is important to see at first sight what risk could possibly be of major concern
in the sector. The graph clearly shows total risk to be the highest in the sector as theory predicts. Although interest
rate risk and market risk as components of systematic risk are relatively lower, systematic risk is very high
throughout the period in comparison to firm-specific risk. Firm-specific risk surprisingly decreased sharply in
2007 before rising as expected theoretically during 2008 and 2009. This is an indication that effects of the crises
only started being felt in South Africa in 2008. Two theories explaining this are the facts that firstly, South Africa
0
200
400
600
6.2
6.4
6.6
6.8
7
7.2
200420052006200720082009201020112012201320142015
Per
cen
tages
(%
)
Per
can
tages
(%
)
Year
TR vs OplevTR OPLEV
16
17
18
19
20
6.2
6.4
6.6
6.8
7
7.2
200420052006200720082009201020112012201320142015
Per
cen
tag
es (
%)
Per
cen
tag
e (%
)
Year
TR vs SizeTR S

Page 38 of 66
only suffered the effects of the crises due to its interconnectedness with the Western economies. Secondly and as
reiterated by the South African Reserve Bank, its financial sector is protected by both solid macroeconomic
policies and micro-prudential regulation in addition to prudent regulation in the domestic banking sector.
Figure 4.6 Risk measure comparisons.
Haven established somewhat mixed and fairly expected preliminary results theoretically on some factors
expected to drive risk in the sector, it is too early to draw conclusions. An empirical discussion of the results in
the final section of this chapter will build on the above analysis to form a bigger picture of the factors effectively
driving risk in the sector.
4.2 Descriptive and summary statistics
This subsection aims to form a bigger picture of what factors drive risk in the South African banking sector in
addition to the few pointers mentioned in the trend analysis section above. Descriptive and summary statistics are
important as they help summarize the important characteristics of the data used in the study. Summary statistics
including the mean, standard deviation, maximum and minimum are those discussed both for all five risk measures
as well as for all four regressors. Meanwhile minimum and maximum values give the smallest and largest
values of the data set respectively, the standard deviation measures the extent to which values of
observations are distributed around the mean. Hence, the larger the standard deviation, the closer to the
mean are the observations in the data set and of course, the reverse is true for small standard deviations.
0
1
2
3
4
5
6
7
8
4 5 6 7 8 9 10 11 12
Per
cen
tage
(%)
Year
Risk measures comparison Firm-specificrisk
market risk
Interest raterisk
Systematicrisk
Total Risk

Page 39 of 66
4.2.1 Bank risk measures
Table 4.1 below reports summary statistics for all five risk measures for the seven banks constituting the sample
of the study. The summary statistics are obtained from the regression model in equation 2. During the pre-crises
years from 2004 to 2006, total risk increased slightly from 6.52% in 2004 to 6.69% while systematic risk, a main
contributor to total risk decreased from 5.23% to 4.99%, with firm-specific risk increasing from 1.29% to 1.7%
over the same period. This is an indication that the increase in total risk could only be fueled by the rising
idiosyncratic risk and partially by systematic risk in the form of interest rate and market risk as these are
theoretically expected to offset the decrease in systematic risk. Both interest rate risk and market risk increased
respectively from -0.01% and 0.42% to 0.67% and 0.78% over the same period, with the standard deviation of
total risk declining slightly as predicted by theory. An interesting explanation for the increase in idiosyncratic risk
could be the relative effect of the liquidity crises of the early 2000s.
A slight drop in total risk to 6.60% is observed in 2007 before increasing sharply to 6.97% during the crises in
2008. Interestingly, firm-specific risk follows a similar trend and drops to 1.56% in 2007 before increasing highly
by 59% to 2.48% in 2008 but later dropping again to 2.01% merely a year later. Systematic risk meanwhile
increased slightly to 5.04% in 2007 before decreasing again to 4.49% in 2008. In general, a similar trend of
decrease and then increase is observed in all risk measures except for interest rate risk and market risk during the
crises years. A constant decreasing trend is observed in interest rate risk during and after the crises.
Comparing 2004 and 2008, one can observe a marked increase in both total risk and firm specific risk (just as is
the case with the US banking sector), of 92% from 1.29% to 2.48% for the latter and 7% from 6.52% to 6.97%
for the former. It should however be noted that these increases are far more prominent and correctly so for the US
banking sector than for the SA banking sector since the crises originated from the US. The much higher increase
in idiosyncratic risk relative to total risk is largely attributed to the relative contribution of systematic risk and
more so, market risk during the crises years. However, the relative contribution of market risk to idiosyncratic risk
is largely offset by the decreasing interest rate risk during the crises. This was possible through the many interest
rate cuts by the SA reserve bank during 2007 and 2008 as a quantitative easing measure to curb the effects of the
crises. In addition to the many rate cuts between 2008 and 2010, the fact that SA was less affected by the crises
are some of the reasons for the decrease and relatively constant figures for total, firm-specific and systematic risk
from 2010 to 2015. Although total risk remains constant post the crises from 2010 and very close to the figure at
the peak of the crises of 6.97%, firm-specific risk non-the less has consistently being in the decrease. The
continuous high figures for total risk could be attributed largely to the ratings downgrade of South Africa’s debt

Page 40 of 66
in 2014 to near junk status (eNCA, 2014). It is also interesting to note that the test of difference for all risk
measures is highly statistically significant.
Table 4.2 reports risk measures summary statistics and comparisons for periods before, during and after the crises;
with panel A comparing between two periods: the crises period from 2008 to 2009 and the non-crises period from
2004 to 2007 and from 2010 to 2015. Meanwhile, panel B compares three different periods: the pre-crises period
2004 to 2007, the crises period 2008 to 2009 and the post crises period 2010 to 2015. Comparing the two sub
periods in panel A reveals that only total risk, firm-specific risk and systematic risk are significantly higher during
the crises years while systematic risk is only significant at 10% during the non-crises periods. The mean of total
risk, at 6.86% for the crises period is the largest compared to 6.55% for the combined non-crises periods. Only
for systematic risk does the mean for the non-crises years exceed that of the crises years by 1.02%. This is certainly
due to the relative contributions of market and interest rate risk. Additionally, the very high-level difference for
the mean is an indication of a significantly higher total risk for the sector during the crises years in comparison to
the non-crises years as also explained by the excessively high effect size of 12.97 for the crises years against a
mere 0.73 for the combined non-crises years.
Panel B, as theoretically predicted, reports a higher mean level difference of 6.86% for total risk during the crises
years 2008 to 2009 than both the pre-and post-crises years. Secondly, both total risk and firm-specific risk are
highly statistically significant at the 1% level during the crises years in comparison to interest rate risk statistically
insignificant during the crises years, but also highly significant during both the pre-and post-crises years. This is
very fulfilling economically as a decline in interest rate risk is usually a sign of relief post crises to curb the
lingering effects of the crises continuing. Effect sizes are equally substantially higher for both total and firm
specific risk during crises. It should also be noted of the substantial difference between the pre-and post-crises
mean levels and size effects of risk. It can further be observed from table 4.2 that mean levels of total and firm-
specific risk are higher pre-crises than post crises, with the reverse holding true for market and systematic risks.
Effect size not surprisingly is largest for interest rate risk pre-crises, but overall, is far more dominant for the rest
of the risk measures post crises. This is an indication that the effects of the crises were felt well earlier in South
Africa than expected.
4.3 Discussion of the model’s results.
This subsection discusses the main findings of the study and groups them per regressor into four main parts as
summarized by table 4.3. The table reports yearly results for all five risk measures (θ) per regressor starting with
the CAR.

Page 41 of 66
Year Test of difference
θ 2004 2005 2006 2007 2008 2009 2010 2011 2012 2013 2014 2015 F-statistic
Total risk (%)
Mean 6.52 6.52 6.69 6.6 6.97 6.74 6.48 6.53 6.46 6.63 6.49 6.61 91.10***
SD 0.07 0.08 0.05 0.05 0.09 0.08 0.04 0.03 0.03 0.35 0.03 0.06 (0.008)
Min. 6.43 6.44 6.64 6.55 6.9 6.59 6.43 6.49 6.42 6.45 6.45 6.52
Max. 6.61 6.65 6.76 6.67 7.15 6.82 6.56 6.57 6.5 7.43 6.53 6.67
Firm Specific risk (%)
Mean 1.29 1.5 1.7 1.56 2.48 2.01 1.2 1.21 0.91 1.64 1.34 1.43 96.73**
SD 0.65 0.31 0.26 0.26 0.18 0.14 0.13 0.26 0.63 0.88 0.3 0.23 (0.011)
Min. 0.02 1.18 1.42 1.29 2.22 1.9 0.98 0.93 0.01 1.02 1.03 1.18
Max. 2.04 2.02 2.03 2.03 2.74 2.23 1.34 1.74 1.46 3.51 1.62 1.8
Market risk
Mean 0.42 0.74 0.78 0.71 0.58 0.77 0.8 0.79 0.42 0.73 0.75 0.82 242.41***
SD 0.33 0.21 0.27 0.38 0.22 0.36 0.41 0.39 0.4 0.3 0.39 0.28 (0.005)
Min. 0.00 0.41 0.4 0.16 0.2 0.19 0.12 0.03 0.01 0.31 0.18 0.26
Max. 0.83 0.98 1.09 1.12 0.8 1.06 1.12 1.07 0.87 1.12 1.07 1.03
Systematic risk (%)
Mean 5.23 5.02 4.99 5.04 4.49 4.74 5.28 5.32 5.56 4.99 5.15 5.18 131.2***
SD 0.66 0.23 0.24 0.23 0.15 0.16 0.13 0.24 0.64 0.55 0.28 0.22 (0.005)
Min. 4.55 4.62 4.69 4.65 4.31 4.44 5.13 4.82 5.03 3.9 4.86 4.87
Max. 6.59 5.28 5.26 5.26 4.69 4.88 5.5 5.56 6.49 5.43 5.43 5.38
Interest rate risk
Mean -0.01 0.30 0.67 0.35 0.26 0.22 0.05 0.03 0.2 0.06 0.66 1.13 92.51**
SD 0.02 0.14 0.11 0.28 0.25 0.18 0.08 0.14 0.14 0.16 0.25 0.37 (0.010)
Min. -0.03 0.11 0.44 -0.06 -0.04 -0.11 -0.05 -0.19 0.01 -0.08 0.19 0.57
Max. 0.012 0.445 0.77 0.87 0.55 0.44 0.14 0.2 0.36 0.41 0.89 1.61
Notes: The above table reports summary statistics for all five risk measures including total risk, firm-specific risk, systematic risk, market risk and interest rate risk for various banks constituted in the sample and
are obtained from the regression model: Ri,t = αi,t + βM,i,tRM,t + βI,t RI,t+ µi,t.6
. One way ANOVA test was used to calculate the tests of difference with p-values in parentheses. θ represents risk measure. ***, **
statistical significance at 1% and 5% respectively.
Table 4.1 Summary statistics for risk measures.
6 For variable definitions, refer to subsection 3.5.

Page 42 of 66
4.3.1 Capital-to-Assets Ratio (CAR)
As a regressor for total risk, the CAR coefficient has the theoretically predicted negative sign throughout the
period except for the crises years extending into 2010 and only statistically significant economically just before
the crises in 2007 while again being significant at the 5% level in 2011. There seems to be only partial evidence
in support of hypothesis 1; the existence of a negative relationship between the CAR and bank risk. Although the
results found sufficient evidence in support of H1, they are economically insignificant as only in 2007 was the
relationship negative and statistically significant. Perhaps a different estimation approach (for example panel
regression) would provide more supporting evidence in favor of H1. A similar study has been carried out only in
the US by Gregory and Hambusch, (2015) with results fully in support of H1 and in line with others’ findings
such as Konishi &Yasuda, (2004) in Japan and Haq & Heanney, (2012) in Europe.
A very similar trend is also observed between CAR and firm-specific risk, with the former explaining more interest
rate risk. Just like total risk, firm-specific risk is also negatively significant at the 5% level in 2007 while being
positively significant in 2014. Surprisingly, CAR per the results does not drive either of systematic or market risk.
A case could possibly be made for market risk given that capital adequacy is a regulatory tool primarily designed
to regulate idiosyncratic risk and not the entire market. This is an indication that the relative contribution of
systematic risk to total risk is from interest rate risk. Question then is, why the mix and somewhat controversial
results when CAR as a powerful regulatory tool is expected theoretically to be the main risk driver in the sector?
Perhaps, it has to do with the size of South African banks in relation to their high levels of capital-to-assets ratios.
Some banks relative to their sizes had excessively large CARs in the pre-crises years.
4.3.2 Franchise value
Franchise value looks to have an even weaker power than the CAR in explaining bank risk. Despite being mostly
negative pre-and post-crises years, the risk driver is only significant both statistically and economically in 2011
for total risk. This is an indication that franchise value while reducing bank risk taking pre-and post the crises,
contributed to incite risk taking during crises. As such, the results again are mixed and just very partially in support
of H2. A possible explanation for the high risk-taking attitude during crises could be related to regulatory concerns,
in particular the implementation of Basel II and the quest for expansion through gain in market share and possible
M & As by South African banks.

Page 43 of 66
Notes: The above table reports risk measure summary statistics and comparisons for periods before, during and after the crises. t-statistics and effect size are used to evaluate risk measure level differences. Effect size explains the strength of
risk measure level differences and are calculated using Hedge’s g7 while t-statistics are calculated using the Welch t-test
for unequal variances. The use of t-statistics and effect size follows Gregory and Hambusch. ***, **, * indicate statistical
significance at 1%, 5% and 10% respectively.
Table 4.2 Risk measure comparisons for different periods.
7 Hedge’s g is preferred to Cohen’s d to carter for small sample size.
Periods 2008-2009 2004-207 &
2010-2015
2004-2007 2008-2009 2010-2015
Number of banks 7 7 7 7 6
Total risk (%)
Mean 6.86 6.55 6.58 6.86 6.53
SD 0.14 0.07 0.09 0.14 0.15
t -statistic 21.94***
(0.00)
1.05
(0.539)
2.98
(0.14)
21.94***
(0.00)
3.88**
(0.03)
Effect size 12.97 0.73 1.25 12.97 1.37
Firm-specific risk (%)
Mean 2.24 1.38 1.51 2.24 1.28
SD 0.29 0.24 0.41 0.29 0.52
t -statistic 27.58***
(0.00)
6.86
(0.131)
0.47
(0.72)
27.58***
(0.00)
1.06
(0.41)
Effect size 16.3 4.77 0.2 16.3 0.37
Market risk (%)
Mean 0.68 0.7 0.66 0.68 0.71
SD 0.31 0.15 0.32 0.31 0.37
t -statistic 0.55
(0.48)
0.76
(0.634)
0.78
(0.55)
0.55
(0.48)
1.24
(0.34)
Effect size 0.33 0.53 0.33 0.33 0.44
Interest rate risk (%)
Mean 0.24 0.34 0.33 0.24 0.33
SD 0.21 0.37 0.29 0.21 0.44
t -statistic 0.34
(0.57)
3.0
(0.261)
28.76***
(0.00)
0.34
(0.57)
12.98***
(0.00)
Effect size 0.2 2.09 12.09 0.2 0.57
Systematic risk (%)
Mean 4.61 5.18 5.07 4.61 5.25
SD 0.19 0.18 0.38 0.19 0.41
t -statistic 7.61**
(0.02)
12.60*
(0.055)
0.13
(0.94)
7.61**
(0.02)
0.51
(0.73)
Effect size 4.5 8.77 0.05 4.5 0.18
Panel A Panel B

Page 44 of 66
For firm-specific risk, franchise value although mostly negative throughout the period is nevertheless insignificant
for the whole period of the study. This again supports the mix results for F2. The consistent negative relationship
between firm-specific risk and franchise value post crises could be because of most banks following the phase of
economic expansion as also observed in the consistent and lower figures for the CAR post crises in comparison
to the crises period.
Franchise value, though also completely insignificant for systematic risk as for idiosyncratic risk is worst in terms
of H2. Only reporting the theoretically expected negative sign in three years pre-and post-crises and entirely
positive during the crises, it could be concluded that it is the main contributor to the total risk reduction pre-and
post-crises and total risk taking during crises attitude of the banks. Positive and statistically significant at the 1%
level, franchise value for interest rate risk is the main risk factor contributing relatively to explain the partial
evidence in support for H2.
Franchise values for market risk are mostly positive and statistically significant just prior to the crises in 2007, of
mix signs during the crises and mostly negative post crises. This is an indication, and in contrary to findings by
Saunders and Wilson, (2001) that franchise values are better risk drivers even during market contractions. Overall,
franchise value though a weaker risk driver than the CAR for the sector seems a better value driver in terms of
risk management during crises.
4.3.3 Bank size
Size is negative throughout the pre-crises years while continuing to be negative post crises from 2012 to 2015 and
entirely positive during the crises. The risk factor is largely insignificant over the 12year period while only being
positively significant at the 10% level in 2011 for total risk. Although a negative relationship is observed between
size and bank risk in the sector, size does not seem to be driving total risk. This is surprising seeing that size is
confirmed to be driving a component of total risk; firm-specific risk during the pre-crises years. It might mean
therefore that the negative relationship between size and firm-specific risk pre-crises seemed to cancel out the
positive relationship between size and total risk during and post the crises. Furthermore, a good question is; does
it mean the South African banking industry has not grown over the years under study? Or, does size not influence
risk in the SA banking industry? For it has been largely argued and empirically confirmed (for instance by
Wheelock and Wilson, 2000) that bank size may directly be proportional to bank risk, implying large banks can
absorb more risk.
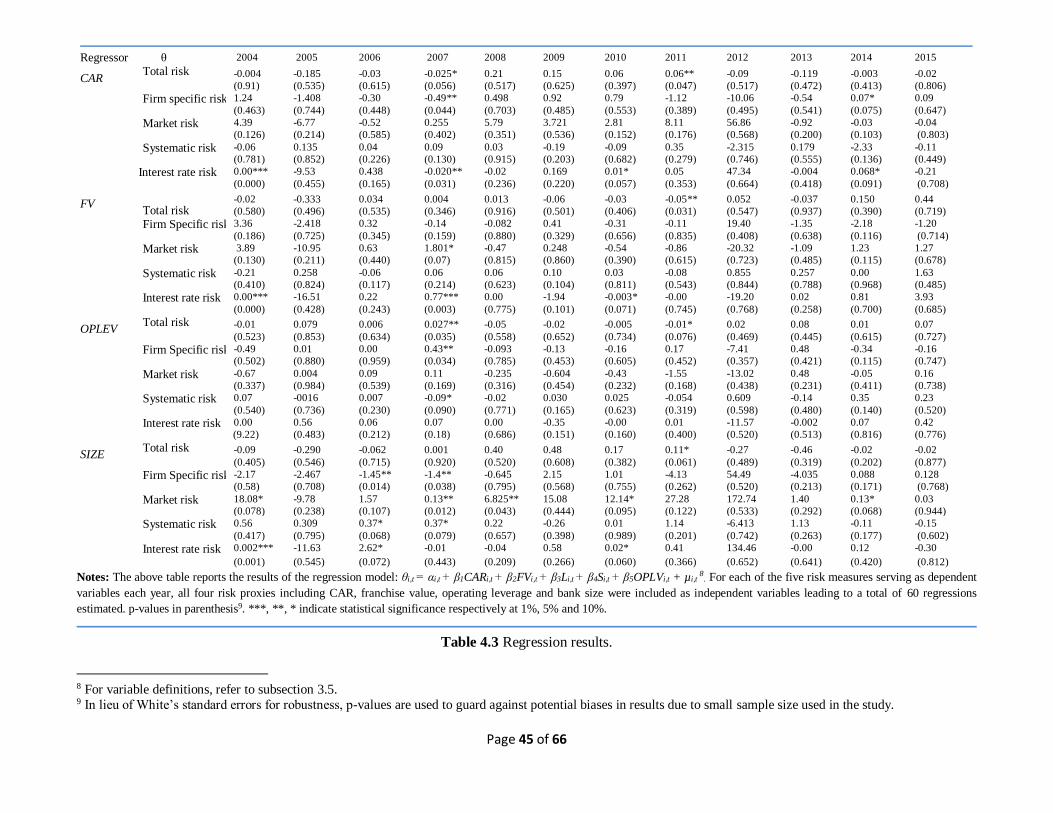
Page 45 of 66
Notes: The above table reports the results of the regression model: θi,t = αi,t + β1CARi,t + β2FVi,t + β3Li,t + β4Si,t + β5OPLVi,t + µi,t 8
. For each of the five risk measures serving as dependent
variables each year, all four risk proxies including CAR, franchise value, operating leverage and bank size were included as independent variables leading to a total of 60 regressions
estimated. p-values in parenthesis9. ***, **, * indicate statistical significance respectively at 1%, 5% and 10%.
Table 4.3 Regression results.
8 For variable definitions, refer to subsection 3.5. 9 In lieu of White’s standard errors for robustness, p-values are used to guard against potential biases in results due to small sample size used in the study.
Regressor θ 2004 2005 2006 2007 2008 2009 2010 2011 2012 2013 2014 2015
CAR Total risk
-0.004
(0.91)
-0.185
(0.535)
-0.03
(0.615)
-0.025*
(0.056)
0.21
(0.517)
0.15
(0.625)
0.06
(0.397)
0.06**
(0.047)
-0.09
(0.517)
-0.119
(0.472)
-0.003
(0.413)
-0.02
(0.806)
Firm specific risk 1.24
(0.463)
-1.408
(0.744)
-0.30
(0.448)
-0.49**
(0.044)
0.498
(0.703)
0.92
(0.485)
0.79
(0.553)
-1.12
(0.389)
-10.06
(0.495)
-0.54
(0.541)
0.07*
(0.075)
0.09
(0.647)
Market risk 4.39
(0.126)
-6.77
(0.214)
-0.52
(0.585)
0.255
(0.402)
5.79
(0.351)
3.721
(0.536)
2.81
(0.152)
8.11
(0.176)
56.86
(0.568)
-0.92
(0.200)
-0.03
(0.103)
-0.04
(0.803)
Systematic risk -0.06
(0.781)
0.135
(0.852)
0.04
(0.226)
0.09
(0.130)
0.03
(0.915)
-0.19
(0.203)
-0.09
(0.682)
0.35
(0.279)
-2.315
(0.746)
0.179
(0.555)
-2.33
(0.136)
-0.11
(0.449)
Interest rate risk 0.00***
(0.000)
-9.53
(0.455)
0.438
(0.165)
-0.020**
(0.031)
-0.02
(0.236)
0.169
(0.220)
0.01*
(0.057)
0.05
(0.353)
47.34
(0.664)
-0.004
(0.418)
0.068*
(0.091)
-0.21
(0.708)
FV Total risk
-0.02
(0.580)
-0.333
(0.496)
0.034
(0.535)
0.004
(0.346)
0.013
(0.916)
-0.06
(0.501)
-0.03
(0.406)
-0.05**
(0.031)
0.052
(0.547)
-0.037
(0.937)
0.150
(0.390)
0.44
(0.719)
Firm Specific risk 3.36
(0.186)
-2.418
(0.725)
0.32
(0.345)
-0.14
(0.159)
-0.082
(0.880)
0.41
(0.329)
-0.31
(0.656)
-0.11
(0.835)
19.40
(0.408)
-1.35
(0.638)
-2.18
(0.116)
-1.20
(0.714)
Market risk 3.89
(0.130)
-10.95
(0.211)
0.63
(0.440)
1.801*
(0.07)
-0.47
(0.815)
0.248
(0.860)
-0.54
(0.390)
-0.86
(0.615)
-20.32
(0.723)
-1.09
(0.485)
1.23
(0.115)
1.27
(0.678)
Systematic risk -0.21
(0.410)
0.258
(0.824)
-0.06
(0.117)
0.06
(0.214)
0.06
(0.623)
0.10
(0.104)
0.03
(0.811)
-0.08
(0.543)
0.855
(0.844)
0.257
(0.788)
0.00
(0.968)
1.63
(0.485)
Interest rate risk 0.00***
(0.000)
-16.51
(0.428)
0.22
(0.243)
0.77***
(0.003)
0.00
(0.775)
-1.94
(0.101)
-0.003*
(0.071)
-0.00
(0.745)
-19.20
(0.768)
0.02
(0.258)
0.81
(0.700)
3.93
(0.685)
OPLEV Total risk
-0.01
(0.523)
0.079
(0.853)
0.006
(0.634)
0.027**
(0.035)
-0.05
(0.558)
-0.02
(0.652)
-0.005
(0.734)
-0.01*
(0.076)
0.02
(0.469)
0.08
(0.445)
0.01
(0.615)
0.07
(0.727)
Firm Specific risk -0.49
(0.502)
0.01
(0.880)
0.00
(0.959)
0.43**
(0.034)
-0.093
(0.785)
-0.13
(0.453)
-0.16
(0.605)
0.17
(0.452)
-7.41
(0.357)
0.48
(0.421)
-0.34
(0.115)
-0.16
(0.747)
Market risk -0.67
(0.337)
0.004
(0.984)
0.09
(0.539)
0.11
(0.169)
-0.235
(0.316)
-0.604
(0.454)
-0.43
(0.232)
-1.55
(0.168)
-13.02
(0.438)
0.48
(0.231)
-0.05
(0.411)
0.16
(0.738)
Systematic risk 0.07
(0.540)
-0016
(0.736)
0.007
(0.230)
-0.09*
(0.090)
-0.02
(0.771)
0.030
(0.165)
0.025
(0.623)
-0.054
(0.319)
0.609
(0.598)
-0.14
(0.480)
0.35
(0.140)
0.23
(0.520)
Interest rate risk 0.00
(9.22)
0.56
(0.483)
0.06
(0.212)
0.07
(0.18)
0.00
(0.686)
-0.35
(0.151)
-0.00
(0.160)
0.01
(0.400)
-11.57
(0.520)
-0.002
(0.513)
0.07
(0.816)
0.42
(0.776)
SIZE Total risk
-0.09
(0.405)
-0.290
(0.546)
-0.062
(0.715)
0.001
(0.920)
0.40
(0.520)
0.48
(0.608)
0.17
(0.382)
0.11*
(0.061)
-0.27
(0.489)
-0.46
(0.319)
-0.02
(0.202)
-0.02
(0.877)
Firm Specific risk -2.17
(0.58)
-2.467
(0.708)
-1.45**
(0.014)
-1.4**
(0.038)
-0.645
(0.795)
2.15
(0.568)
1.01
(0.755)
-4.13
(0.262)
54.49
(0.520)
-4.035
(0.213)
0.088
(0.171)
0.128
(0.768)
Market risk 18.08*
(0.078)
-9.78
(0.238)
1.57
(0.107)
0.13**
(0.012)
6.825**
(0.043)
15.08
(0.444)
12.14*
(0.095)
27.28
(0.122)
172.74
(0.533)
1.40
(0.292)
0.13*
(0.068)
0.03
(0.944)
Systematic risk 0.56
(0.417)
0.309
(0.795)
0.37*
(0.068)
0.37*
(0.079)
0.22
(0.657)
-0.26
(0.398)
0.01
(0.989)
1.14
(0.201)
-6.413
(0.742)
1.13
(0.263)
-0.11
(0.177)
-0.15
(0.602)
Interest rate risk 0.002***
(0.001)
-11.63
(0.545)
2.62*
(0.072)
-0.01
(0.443)
-0.04
(0.209)
0.58
(0.266)
0.02*
(0.060)
0.41
(0.366)
134.46
(0.652)
-0.00
(0.641)
0.12
(0.420)
-0.30
(0.812)

Page 46 of 66
For firm-specific risk, size is negative during the entire pre-crises-period, while being significant at the 5% level in
2006 and 2007 and only negative in 2011 and 2013 during the post crises years, while being positive during the
crises. This shows that size might only be effective in explaining bank risk in the sector pre-crises. Meaning an
increase in bank size would increase its chances of absorbing losses by means perhaps of better diversification
possibilities in their portfolio holdings before and during crises. Size might on the other hand not influence
idiosyncratic risk post crises because of the much-debated regulatory concept of “too big to fail” banks. Interestingly,
size seems a much better risk driver for interest rate risk than firm-specific risk and total risk since all significant
coefficients are positive. Interest rate is mostly negative pre-and during the crises, while also being negative in 2013
and 2015. It is statistically significant in 2004 at the 1% level and in 2006 and 2010, both at the 10% level. Size is
by far the best driver for market risk than any other risk measure, being positive and significant at the 10% level in
2004, 2010 and 2014 and significant at the 5% level in 2007 and 2008. The relatively strong results for market risk
could be linked to the interconnectedness of banks, affording large size banks more diversification opportunities and
better competition for market share. Overall, the results show size to be the best variable explaining risk for the sector
than even the much-celebrated CAR.
4.3.4 Operating leverage
Operating leverage is positive for total risk during all the pre-crises years except in 2004, while being significant
only twice; at the 5% level in 2007 and at the 10% level in 2011. It is negative during both crises years but mostly
negative post crises. A mirror trend is observed for firm-specific risk except for the post crises years where operating
leverage is more negative. The results confirm the positive relationship between operating leverage and bank risk
postulated in the literature. An interesting observation is that operating leverage seems to drive risk mostly pre-crises,
which may mean that some banks tend to be more involved in leverage financing leading to elevated risk taking prior
to the crises. For market risk, just as was the case with total risk, operating leverage is positive in all the pre-crises
years except for 2004 but mostly positive post crises while for systematic risk, it is positive throughout the pre-crises
years while being mostly positive post crises. During the crises, the risk driver is negative all years for market, while
being mix for both interest rate and systematic risk. It is insignificant throughout for both market and interest rate
risk, while only being significant at the 10% level for systematic risk in 2007. The results show that operating
leverage provides very little explanatory power for market risk and interest rate risk. A general observation from the
results is that risk drivers are most significant both statistically and economically in 2007. This might be consistent
with some analysts and scholars’ arguments alike that the effects of the crises started being felt as early as 200710.
10 The study however considers the crises to start fully in 2008, although popular opinion points that it started towards the end
of 2007.

Page 47 of 66
Year Test of difference Regressor 2004 2005 2006 2007 2008 2009 2010 2011 2012 2013 2014 2015 F-statistic
CAR 276.09***
Mean 30.09 27.55 24.87 27.97 20.69 25.56 23.6 23.41 22.91 21.9 21.27 20.19 (0.0065)
SD 31.09 26.19 16.87 26.1 9.9 13.68 10.21 9.87 9.78 9.41 9.52 8.38
Min. 12 11 11.4 11.1 12 15 15 14 15 13 12 14
Max. 98 84 56 83.6 37 44.84 37 38 39 41 39 36
FV 416.97**
Mean 0.77 0.79 1.43 1.33 1.11 1.12 1.2 1.17 1.11 1.09 1.11 1.19 (0.0307)
SD 0.29 0.21 0.61 0.42 0.18 0.2 0.31 0.29 0.24 0.11 0.13 0.32
Min. 0.16 0.41 1.04 1.04 1 0.98 1.02 0.99 0.91 1 1.03 1.03
Max. 0.94 0.95 2.38 2.082 1.47 1.5 1.84 1.8 1.61 1.32 1.36 1.84
SIZE 130.17**
Mean 17.48 17.67 17.92 18.17 18.47 18.55 18.69 18.82 18.99 19.16 19.47 19.62 (0.0291)
SD 3.02 2.96 2.9 2.83 2.74 2.58 2.43 2.3 2.17 2.11 2.17 2.1
Min. 13.14 13.6 14.04 14.6 14.89 14.97 15.083 15.29 15.52 15.65 15.92 16.2
Max. 20.23 20.44 20.69 20.89 21.13 21.02 21.01 21.12 21.16 21.25 21.37 21.41
OPLEV 85.88**
Mean 5.39 4.29 2.79 2.21 2.36 2.76 2.49 2.29 1.64 1.53 1.43 1.39 (0.017)
SD 10.33 7.81 3.53 2.23 2.06 2.2 1.98 1.4 0.63 0.6 0.6 0.65
Min. 0.54 0.6 0.76 0.72 0.8 0.91 0.95 1.07 0.97 0.86 0.68 0.53
Max. 28.75 21.96 10.71 7.1 6.68 6.78 6.63 5.18 2.58 2.61 2.3 2.43
Notes: The above table reports summary statistics for the regressors CAR, FV, SIZE and OPLEV used to estimate equation 2. The one-way
ANOVA test with p-values in parentheses was used to calculate the tests of difference. ***, ** respectively indicate statistical significance
at 1% and 5%.
Table 4.4 Descriptive statistics for regressors11.
4.4 Explanatory variables
This subsection discusses the results pertaining to various risk drivers slotted in the model as independent variables
including the CAR, franchise value, operating leverage and bank size. These results are presented in table 4.4 in the
form of descriptive statistics. CAR fairly decreased to about 27% during the pre-crises period of 2004 to 2007 starting
from 30.09% in 2004. It further decreased to about 20% in 2008 during the crises years before peaking again to
25.56% at the peak of the crises in 2009. This might mean South Africa only started experiencing effects of the crises
when they were at the peak in addition to the numerous rate cuts by the SARB during the crises period. This high
11 Author’s work obtained from the regression model in equation 2.

Page 48 of 66
and low values of the CAR was similarly observed in the US. It might mean that the crises incited increased volatility
in the global economy requiring higher levels of capital as a buffer against idiosyncratic risk. This came about in
South Africa especially on the back of stricter regulatory concerns domestically in the form of Basel II during the
crises years. It will be interesting to observe that between 2004 and 2008, CAR dropped by 31% from 30.09% to
20.69% in the sector. Perhaps the liquidity crises of the early 2000s pulled through into the crises, thereby by
affecting banks capital ratio. CAR however remained steadily constant post crises from 2010 up to 2015 after
dropping by 23.6% in 2010, although it is projected to drop further with the implementation of Basel III regulation
in SA recently.
Franchise value averaged just below 1 in the first two pre-crises years before increasing to above 1 in the other two
years just before the start of the crises in 2008. The trend continued evenly around about 1.15 through the crises
years to the end of the period. Surprisingly, its highest values of 1.43 and 1.33 were respectively recorded during the
pre-crises years of 2006 and 2007. This might mean that the effects of the crises on South Africa, though negligible
as has been argued in the introductory phase of the study nevertheless might have cost the banks in the form of
reduction in market share and overall capitalization.
Operating leverage started on a high of 5.39% in 2004 but dropped consistently throughout the period to 1.39% at
the end. This is a 74% drop over the entire 12year period, indicating increased caution in terms of debt financing on
the part of banks in the wake of increased volatility in the markets and repeated shocks to the global economy. Some
of the shocks specific to South Africa include the ratings downgrade to near junk status in 2014 (eNCA, 2014) and
numerous mass action including the Marikana strike of 2012.
Size as a measure of industry concentration and hence growth in terms of total assets, starting at 17.48 at the start of
the period increased continuously till the end of the period. This simply in absolute terms reflects overall growth in
the industry over the years, which would extend to include growth in market share, investments and most especially
concentration in the industry. Tests of difference based on the one-way analysis of variance are also statistically
significant for all four regressors.
4.5 Model fit
Table 4.5 below reports F-statistics and adjusted R2 values for the equation 2 model estimated for each year using
each of the five risk measures as the dependent variable. Meanwhile the F-statistic is a test statistic used to infer the
explanatory power of more than one variable in a model, the R2 is a measure of fit which explains to what degree the
data fits the model estimate. The F-statistic is mostly significant for market risk at the 10% level and only significant
for interest rate risk in the two years just prior to the start of the crises in 2008. For systematic risk, a trend similar

Page 49 of 66
to that of interest rate risk is observed although the measure is also significant in 2009 while only being significant
respectively for total risk and firm-specific risk in 2007 and 2011. The R2 on its part indicates a reasonable measure
of fit for all risk measures but for total risk and firm-specific risk with negative R2 values respectively in 2008 and
in 2010. R2 values per year are on average 45.40% for total risk, 68% for firm-specific risk, 92.68% for market risk,
82.56% for systematic risk and 56.64% for interest rate risk.
R2 values for total risk generally demonstrate a good model fit despite being low during crises and negative in 2006.
Market risk displays best model fit as can also been seen from its average of 92.68% followed by systematic risk
while it may be difficult to tell at face look that total risk has the worst model fit but the average tells the story. The
performance of market risk and systematic risk is consistent with findings by Gregory and Hambusch in the US, who
conclude the capability of the model as a complement to standard methods in explaining market risk as a major
concern to bank regulators both during crises and in non-crises years. Interest rate risk, although displaying very
good model fit pre-and during the crises however shows the data to poorly fit the model post crises.
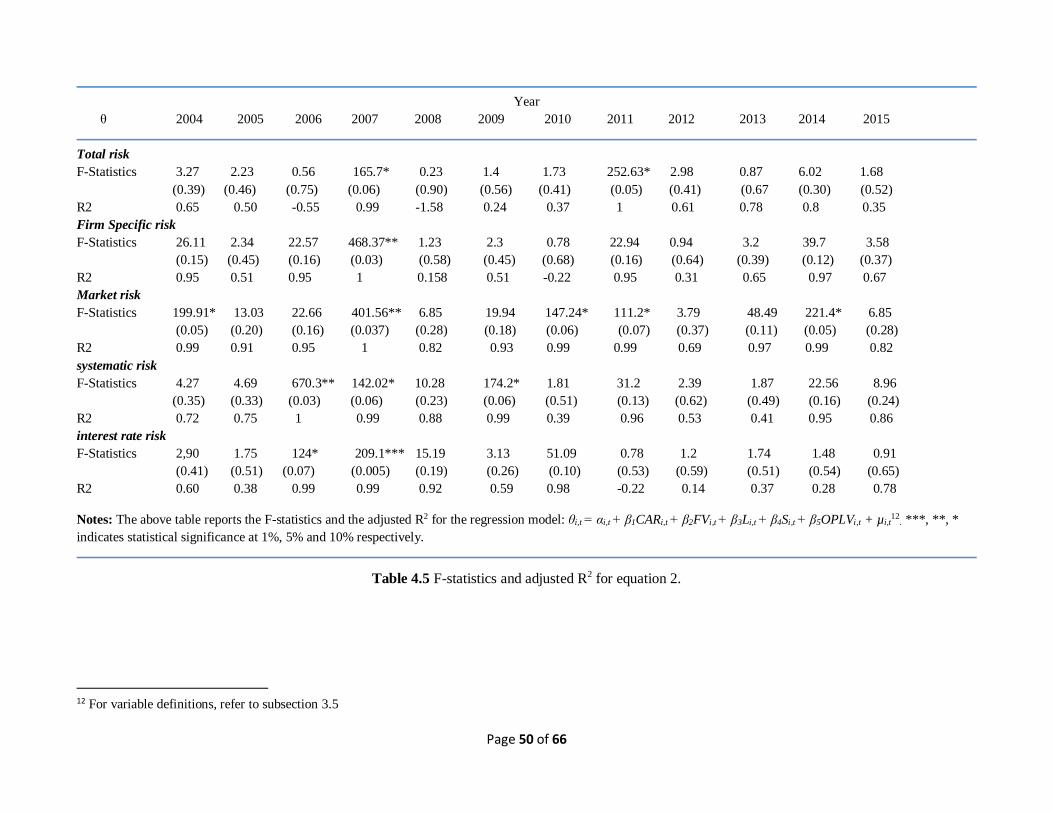
Page 50 of 66
Year
θ 2004 2005 2006 2007 2008 2009 2010 2011 2012 2013 2014 2015
Total risk
F-Statistics 3.27 2.23 0.56 165.7* 0.23 1.4 1.73 252.63* 2.98 0.87 6.02 1.68
(0.39) (0.46) (0.75) (0.06) (0.90) (0.56) (0.41) (0.05) (0.41) (0.67 (0.30) (0.52)
R2 0.65 0.50 -0.55 0.99 -1.58 0.24 0.37 1 0.61 0.78 0.8 0.35
Firm Specific risk
F-Statistics 26.11 2.34 22.57 468.37** 1.23 2.3 0.78 22.94 0.94 3.2 39.7 3.58
(0.15) (0.45) (0.16) (0.03) (0.58) (0.45) (0.68) (0.16) (0.64) (0.39) (0.12) (0.37)
R2 0.95 0.51 0.95 1 0.158 0.51 -0.22 0.95 0.31 0.65 0.97 0.67
Market risk
F-Statistics 199.91* 13.03 22.66 401.56** 6.85 19.94 147.24* 111.2* 3.79 48.49 221.4* 6.85
(0.05) (0.20) (0.16) (0.037) (0.28) (0.18) (0.06) (0.07) (0.37) (0.11) (0.05) (0.28)
R2 0.99 0.91 0.95 1 0.82 0.93 0.99 0.99 0.69 0.97 0.99 0.82
systematic risk
F-Statistics 4.27 4.69 670.3** 142.02* 10.28 174.2* 1.81 31.2 2.39 1.87 22.56 8.96
(0.35) (0.33) (0.03) (0.06) (0.23) (0.06) (0.51) (0.13) (0.62) (0.49) (0.16) (0.24)
R2 0.72 0.75 1 0.99 0.88 0.99 0.39 0.96 0.53 0.41 0.95 0.86
interest rate risk
F-Statistics 2,90 1.75 124* 209.1*** 15.19 3.13 51.09 0.78 1.2 1.74 1.48 0.91
(0.41) (0.51) (0.07) (0.005) (0.19) (0.26) (0.10) (0.53) (0.59) (0.51) (0.54) (0.65)
R2 0.60 0.38 0.99 0.99 0.92 0.59 0.98 -0.22 0.14 0.37 0.28 0.78
Notes: The above table reports the F-statistics and the adjusted R2 for the regression model: θi,t = αi,t + β1CARi,t + β2FVi,t + β3Li,t + β4Si,t + β5OPLVi,t + µi,t12
. ***, **, *
indicates statistical significance at 1%, 5% and 10% respectively.
Table 4.5 F-statistics and adjusted R2 for equation 2.
12 For variable definitions, refer to subsection 3.5

Page 51 of 66
CHAPTER 5. CONCLUSION AND RECOMMENDATIONS
The research set out to empirically investigate among many, factors that drive risk in the South African banking
industry using five different risk measures over the twelve-year period 2004 - 2015. A cross sectional model
employed daily data from publicly listed bank holding companies to study the relationship between the capital-
to-assets ratio, franchise value, operating leverage and bank size as explanatory variables and total risk, firm-
specific risk, systematic risk, market risk and interest rate risk as explained variables. The study would go a long
way to guide both the banks, investors, regulators and policy makers in their risk management and mitigation
technics through various channels including early detection and warning signals.
The study reports interesting findings. Bank risk is at its peak in the sector just prior to the crises in 2007 and
normalizes during the crises, while increasing again immediately after the crises in 2011. This risk is largely driven
on the one hand by idiosyncratic risk (which is as theoretically expected, negative and significant for both the
CAR and size while also being significant and positive for franchise value but positive and insignificant for
operating leverage) and systematic risk on the other hand. The effects of banks’ key risk measures including
market and interest rate should however not be underestimated as the findings report them to have relatively
contributed hugely to the systematic risk. For interest rate risk, just as is the case with firm-specific risk, most of
the risk factors are significant in the pre-crises years. It is highly significant for all risk factors in 2004 and 2007
except operating leverage. It is worth observing that for total risk, all risk factors are significant in 2011 with no
correct expected signs. In conclusion, all risk factors seem to be adequately driving risk in the sector mostly prior
to crises and just after the crises in the sector. The CAR is found to have a negative relationship with total risk as
well as firm-specific risk in the non-crises years and a positive relationship with the latter during the crises years.
This might mean banks with relatively higher capital adequacy ratios were better placed to consistently wither the
negative impacts of the crises. For franchise value, a nonlinear relationship is confirmed with both total risk and
idiosyncratic risk while size shows a more consistent negative relationship with total risk.
A possible limitation of the study lies in the fact that there may be expected to exist some degree of bias in the
results since a large proportion of the sample size is dominated by the big four banks with minor operations outside
of South Africa. Expectations would thus be that part of their returns from outside SA would cause the bias. This
is however not the case as reports from their audited financial statements (FirstRand, 2011) indicate that
approximately 96% of their returns are generated from South Africa; with similar conclusions by Nedcore Group,
the ABSA Group and Standard Bank. As a recommendation for further studies, another model estimation technic;
(for instance panel data analysis) while including studies on effects of bank lobbying (as and when data becomes
readily available) might provide more explanatory power to the various risk measures, leading to more plausible
results. In addition, lots of research gaps are yet to be exploited in this area of the study most especially in emerging

Page 52 of 66
market economies as a review of the literature reveals very minimal studies conducted. Furthermore, it would be
interesting to explore the concept of systematically important financial institutions [(SIFIs)-predominantly used
in the US as an insurance cover for too big to fail banks] to better understand the effects of bank size in the South
African context and further guide policy reshaping.
Page 53 of 66
References
1. Acemoglu. D, Johnson.S and Robinson. J.A, (2012). The colonial origins of comparative development:
An empirical investigation. Journal of American Economic Review.
2. Aduda. J and Gitonga. J, (2011). The relationship between credit risk management and profitability among
commercial banks in Kenya. Journal of Modern Accounting and Auditing. Vol. 7(9), 934-946.
3. Agusman. A, Monroe. G.S and Zumwalt. J.K. (2008). Accounting and capital market measures of risk:
Evidence from Asian banks during 1998-2003. Journal of Banking and Finance. Vol. 32(4), 480-488.
4. Andrianova, S., Baltagi, B., Demetriades, P., and Fielding, D. (2015). Why do African banks lend so
little? Oxford Buletin of Economics and Statistics, 77(3), 339-359.
5. Arnold B., Borio., C Ellis E. and Moshirian L, (2012). Systemic risk, macroprudential policy frameworks,
monitoring financial systems and the evolution of capital adequacy. Journal of Banking and Finance.,
36(12), 3125–3132.
6. Ariss. (2010). On the implications of market power in banking: Evidence from developing countries.
Journal of banking and Finance, 765-775.
7. Bangkok Bank. (2008). Annual Report. Retrieved September 16, 2016, from www.bangkokbank.com.
8. Barnhill. T.M, Papapanagiotou. P and Schumacher. L, (2002). Measuring Integrated Market and Credit
Risk in Bank Portfolios: An Application to a Set of Hypothetical Banks Operating in South Africa.
Financial Markets Institutions & Instruments, 11(5).
9. BASA. (2014). South African Banking Sector overview. Johannesburg: Banking Association South
Africa.
10. Berger, H.S and Bouwman, A. N. (2013). How does capital affect bank performance during financial
crises? Journal of Financial Economics, 109(1), 146–176.
11. Blau. B.M, Brough. J.J and Thomas. D.W, (2013). Corporate lobbying, political connections and the
bailout of banks. Journal of Banking and Finance. Vol. 37, 3007-3017.
12. Blum, J. (1999). Do capital adequacy requirements reduce risks in banking? Journal of Banking and
Finance, 23(5), 755–771.
13. Boot. A and Marine. M, (2006). Competition and entry in banking: Implications for stability and capital
regulatgion. Tinbergen Institute Discussion Paper. TI 2006-015/2.
14. Boyd. J.H. and De Nicole. G. (2005). The theory of bank risk taking and competition revisited. Journal
of Finance. Vol. 60(3), 1329-1343.
15. Brooks. C, (2008). Introductory Econometrics for Finance. Cambridge: Cambridge University Press.
16. Chalmers. A.W. (2017). When banks lobby: The effecst of organizational charateristics and banking
regulation on international bank lobbying. adamwilliamchalmers.com.

Page 54 of 66
17. Chen. C.R, Steiner. T.L and Whyte. A.M. (1998). Risk-taking behaviour and management ownership in
depository institutions. Journal of Financial Research. Vol. 21(1), 1-16.
18. Chin'anga, F. (2015). The effect of Credit Risk Management on the profitability of the four major South
African banks. Johannesburg: University of Johannesburg.
19. Clark. C, (2005). The structure of educational research. British Educational Research Journal. Vol. 31(3),
289-308.
20. Coetzee. J, Van Zyl. H and Tait. M, (2012). Selection criteria in the South African retail banking sector.
African Journal of Business Management, 6(41), 10558-10567.
21. Cooper. M.J, Gulen. H and Ovtchinnikov. A.V, (2010). Corporate political contributions and stock
returns. The Journal of Finance. Vol. 65 (2), 687-724.
22. Creswell. J.W. (2013). Research design, qualitative, quantitative and mixed methods approaches.4th
edition
23. Daesik. K, and Santomero, A. M. (1988). Risk in Banking and Capital Regulation. The journal of the
American Finance Association, 43(5), 1219–1233.
24. Delis. M.D, Staikouras. K.C and Varlagas. P.T, (2008). On the measurement of market power in the
banking industry. Journal of Business Finance and Accounting. Vol. 35 (7-8), 1023-1047.
25. Demirguc-Kunt, A. and Detragiache, E. (2011). Basel core principles and bank soundness: Does
compliance matter? Journal of Financial Stability. Vol. 7 (4), 179-190.
26. Demsetz. R.S. and Strahan. P.E. (1997). Diversification, size and risk at bank holding companies. Journal
of Money, Credit and Banking. Vol. 29(3), 300-313.
27. De Young. R and Roland, K.P, (2001). Product Mix and Earnings Volatility at Commercial Banks:
Evidence from a Degree of Total Leverage Model. Journal of Financial Intermediation. Vol. 10(1), 54-
84.
28. Distinguin. I, Roulet. C, and Tarazi. A, (2013). Bank regulatory capital and liquidity: Evidence from US
and European publicly traded banks. Journal of Banking and Finance, 37(9), 3295–3317.
29. Dube. Q and Kaya. T, (2017). New ranking shows which SA banks contribute most to systemic risk.
African Institute of Financial Markets and Risk Management.
30. Duchan. R. and Sosyura. D, (2012). The politics of government investment. Journal of Financial
Economics. Vol. 106(6), 2597-2635.
31. eNCA, (2014). Moody's downgrade - the knock-on effect on the economy. http://www.enca.com/south-
africa/moodys-downgrade-knock-effect-economy. Accessed: 24th November 2016.
32. Faccio. M, Msuli. R.W and McConnell, (2006). Political Connections and Corporate Bailouts. Journal of
Finance, LXI(6), 2600-2634.
33. Fiodelisi. F and Mare. D.S, (2013). Probability of default and efficiency in cooperative banking. Journal
of International Financial Markets, Institutions and Money. Vol. 26. 30-45.
Page 55 of 66
34. FirstRand Limited, (2011). Annual Financial Statement. Accessed: 25th November 2016.
35. Frame, W.S. and White, L.J. (2007). Charter Value, Risk-Taking Incentives, and Emerging Competition
for Fannie Mae and Freddie Mac. Journal of Credit, Money and Banking., 39(1), 83–103.
36. Frederick. N. K, (2015). Factors Affecting Performance of Commercial Banks in Uganda -A Case for
Domestic Commercial Banks. International Review of Business Research Papers. Vol. 11(1)1, 95 – 113
37. Furlong, F T and Keeley, M.C. (1989). Capital Regulation and bank risk-taking: A note. Journal of
Banking and Finance, 883-891.
38. Galai. D, Crouhy. M and Mark. W. (2006). The essentials of Risk Management, 2nd edition. Ohio:
Mcgraw Hill Higher Educattion.
39. Goddard. J, Molyneux. P, and Wilson. O.S, (2004). The profitability of european banks: a cross-sectional
and dynamic panel analysis. The Manchester School, 723, 363–381.
40. Gorton. G and Rosen. R, (1995). Corporate Control, Portfolio Choice, and the Decline of Banking. The
Journal of Finance., 50(5), 1377–1420.
41. Gregory, K and. Hambusch, G. (2015). Factors driving risk in the US banking industry: The role of capital,
franchise value and lobbying. International Journal of Managerial Finance, 388 - 409.
42. Gujarati. D.N. (2008). Basic Econometrics. 5th edition. Boston: McGraw Hill.
43. Gul. F.A. (2006). Auditor's response to political connections and cronyism in Malaysia. Journal of
Accounting Research. Vol. 44(5), 931-963.
44. Gup, B. E and Kholari, J.W. (2005). Commercial banking: The management of risk,3rd edition. John
Wiley and Sons Inc.
45. Haq M. and Heaney, R. (2012). Factors determining European bank risk. Intetrnational Financial
Markets, Institutions and Money, 696-718.
46. Hitchins. J, Hogg. M. and Mallet. D, (2001). Banking: A regulatory accounting and auditing guide, 4th
edition. Croner CCH Group Ltd.
47. Hopkins. W.G, (2008). Quantitative research design. Citeulike.
48. Horcher, K. A. (2005). Essentials of Risk Management. Wiley and Sons.
49. Hutchroft. P.D, (1998). Booty capitalism: The politics of banking in the Philippines. Cornell University
Press.
50. Hull, J. C. (2015). Risk Management and Financial Institutions, 4th edition. Canada: Wiley Finance
Series.
51. Jimenez. G, Lopez. J.A and Saurina. J. (2013). How does competition affect bank risk-taking? Journal of
Financial Stability. Vol. 9(2), 185-195.
52. Johnson. S and Mitton. T. (2003).Cronyism and capital controls: Evidence from Malaysia. Journal of
Financial Economics. Vol. 67(2), 351-382.

Page 56 of 66
53. Johnson. S and Kwak. J, (2010). Restraining regulatory capture? Anglo-America, crises politics and
trajectories of change in global financial governance. Journal of International Affairs. Vol. 86 (3), 647-
663.
54. Jones. J.S, Miller. S.A and Yeager. T.J. (2011). Charter value, Tobin's Q and bank risk during the
subprime financial crises. Journal of Economics and Business, Vol. 63(5), 372-391.
55. Keeley, M. C. (1990). Deposit Insurance, Risk, and Market Power in Banking. The American economic
Review, 80(5), 1183-1200.
56. Kallet. R.H. (2004). How to write the methods section of a research paper. Symposium Papers. Vol.
49(10).
57. Khotharie. C.R, (2004). Research Methodology, Methods & Techniques. New Delhi. New Age
International (P) Ltd.
58. Khwaja. A.L and Mian. A. (2005). Do lenders favour politically connected firms? Rent provision in an
emerging financial market. The Quarterly Journal of Economics. Vol. 120(4), 1371-1411.
59. Klomp, J. and De-haan, J . (2012). Banking risk and regulation: Does one size fit all? Journal of Banking
and Finance., 36(12).
60. Konishi. M and Yasuda. K. (2004). Factors affecting bank risk tasking: Evidence from Japan. Journal of
Banking and Finance., 215-232.
61. Labonte. M, (2017). Systemically Important or “Too Big to Fail” Financial Institutions. Congressional
Research Services.
62. Lee. C. and Hsieh. M, (2013). The impact of bank capital on profitability and risk in Asian banking.
Journal of International Money and Finance. Vol. 32: 251-281.
63. Lindquist K.G, (2004). Bank's buffer capital: How important is risk? Journal of International Money and
Finance. Vol 23 (3). 493-513
64. Lobo, R. (2013). What’s left of Basel III? World Finance.
65. Mamatzakis & Bermpei. (2014). What drives investment bank performance? The role of risk, liquidity
and fees prior to and during the crises. International Review of Financial Analysis, vol.35: 102-117.
66. Maredza, A. and Ikhide, S. (2013). Measuring the impact of the global financial crises on efficiency and
productivity of the Banking System in South Africa. Mediterranean journal of Social Sciences. Vol. 4
(6). 2039-2117.
67. Mboweni, T. (2004). The South African banking sector - an overview of the past 10 years. Johannesburg:
The SA Reserve Bank.
68. Mugo. F.W (2002). Sampling in research. www.trochim.human.cornell.edu/tutorial/mugo/tutorial.htm.
69. Naceur, S. B. (2003). The determinants of the Tunisian banking industry profitability: Panel Evidence.
Department of Finance.
Page 57 of 66
70. Oladele. P.O, Sulaimon. A.A. and Akeke. N.I, (2012). Determinants of bank performance in Nigeria.
International Journal of Business and Management Tomorrow. Vol. 2(2), 1-4.
71. Saunders. A, and Wilson. B, (2001). An analysis of bank charter value and its risk-constraining incentives.
Journal of Financial Services Research. Vol. 19 (2-3), 185-195.
72. Saunders. A, Strock. E, and Travlos. N.G, (1990). Ownership structure, deregulation and bank risk taking.
The Journal of Finance. Vol. 45(2), 643-654.
73. SARB. (2014). Financial Stability Review. Johannesburg: South African Reserve Bank.
74. SARB. (2015). Financial Stability Review. Johannesburg: The South African Reserve Bank.
75. SARB. (2016). Financial Stability Review. Johannesburg: The South African Reserve Bank.
76. Schaeck. K, Cihak. M and Wolfe. S, (2009). Are competitive banking systems more stable? Journal of
Money, Credit and Banking. Vol. 41 (4)
77. Smit. L, Stwart. B & Van Niekerk. F, (2015). Credit risk models in the South African context. Investment
Analyst Journal, 1029-3523.
78. Twycross. A and Shields.L, (2004). Validity and Reliability - What's it all about? Part 2 Reliability in
quantitative studies. RCNi Publication, Vol.16(10).
79. Vanhoose. D, (2007). Theories of bank behaviour under capital regulation. Jourrnal of Banking and
Finance. Vol. 31(12), 3680-3697.
80. WEF. (2015). The Global Competitiveness Report 2015-2016. World Economic Forum.
81. Wheelock. D.C. and Wilson. P.W. (2000). Why do banks disappear? The determinants of US bank failures
and acquisitions. Review of Economics and Statistics. Vol. 82(1), 127-138.
82. Zikmund, W.G, (2010). Business Research Methods. 8th edition. Mason: South-Western Cengage
Learning.

Page 58 of 66