risk assessment framework for emerging vector-borne
TRANSCRIPT

Risk Assessment Framework for Emerging Vector-Borne Livestock Diseases


Risk Assessment Framework for Emerging Vector-Borne Livestock Diseases
Project: BO-10-009-002 Report: 11-CVI0168 Clazien de Vos, Maarten Hoek, Egil Fischer, Aline de Koeijer Central Veterinary Institute, part of Wageningen UR Johan Bremmer LEI, part of Wageningen UR
© Central Veterinary Institute, part of Wageningen UR (CVI) All rights reserved. No part of this publication may be reproduced, stored in a retrieval system or transmitted, in any form or by any means, electronic, mechanical, photocopying, recording, or otherwise, without the prior permission of CVI. Liability CVI does not accept any liability for damages, if any, arising from the use of the results of this study or the application of the recommendations.
Central Veterinary Institute, part of Wageningen UR P.O. Box 65 8200 AB Lelystad, the Netherlands Tel: +31 320 238 800 Fax: +31 320 238 668 E-mail: [email protected] Internet: http://www.cvi.wur.nl


1
Table of contents
Table of contents ................................................................................................................ 1 Management summary ........................................................................................................ 3 1. Introduction ................................................................................................................... 5
1.1. Background .............................................................................................................. 5 1.2. Objective ................................................................................................................. 5 1.3. Outline of the report ................................................................................................. 6
2. Materials and methods ..................................................................................................... 7 2.1. Approach ................................................................................................................. 7 2.2. Guidelines for risk assessment ................................................................................... 8 2.3. European networks on vector-borne diseases ............................................................... 9 2.4. Framework for risk assessment of vector-borne livestock diseases ................................ 10
3. Results ........................................................................................................................ 11 3.1. Description of the framework ................................................................................... 11 3.2. Probability of entry ................................................................................................. 13 3.3. Transmission dynamics ............................................................................................ 20 3.3.1. Probability of transmission ................................................................................... 22 3.3.2. Probability of establishment ................................................................................. 23 3.3.3. Extent of spread ................................................................................................. 24 3.3.4. Likelihood of persistence ..................................................................................... 26
3.4. Impact of disease ................................................................................................... 29 4. Discussion .................................................................................................................... 33 5. Conclusion and recommendations ................................................................................... 35 Acknowledgements ........................................................................................................... 36 References ....................................................................................................................... 37 Annex I: List of abbreviations ............................................................................................. 41 Annex II: Glossary ............................................................................................................ 42 Annex III: Checklist .......................................................................................................... 44 Annex IV Structured questionnaire ...................................................................................... 49 Annex V: Dummy tables .................................................................................................... 69

2

3
Management summary
Increases in international trade and globalisation contribute to rapid and wide geographical spread of diseases. Furthermore, changes in climate, ecology, land use, and social welfare have contributed to the expansion of diseases beyond their endemic foci. The recent incursions of exotic vector-borne diseases into areas hitherto free from disease have urged the need for control of these diseases, both in the newly affected areas and in endemic regions. In the Netherlands the Ministry of Economic Affairs, Agriculture and Innovation is responsible for prevention and control of vector-borne livestock diseases. Efficient and cost-effective risk management requires better knowledge of these diseases and more insight into the possible pathways for introduction and subsequent spread. Import risk analysis for livestock diseases is usually based on the guidelines given by the World Organization for Animal Health (OIE). Assessment of the risk of introduction, establishment and spread of exotic vector-borne diseases requires, however, a multidisciplinary approach, with knowledge from epidemiology, virology, entomology, ecology, climatology and economy. The objective of this project was to develop a framework for risk assessment of introduction, establishment, spread and persistence of vector-borne livestock diseases based on international guidelines for risk assessment provided by different disciplines (animal health, plant health, human health). This framework will help risk analysts to assess the risk of vector-borne diseases, considering both likelihood of occurrence and potential impact to inform stakeholders on behalf of their decision making. The primary stakeholders are governments and governmental bodies that need to decide on risk management to prevent and control vector-borne diseases. Risk assessments based on the framework will provide insight into the main elements contributing to the risk which is a prerequisite when preparing for emerging vector-borne diseases. Furthermore, the framework will help to identify existing knowledge and data gaps that need to be solved to adequately address the risk.
In building the framework expertise on animal health risk analysis and pest risk analysis was joined and international guidelines from these disciplines (OIE, European and Mediterranean Plant Protection Organization, EPPO) were taken as the main starting point. A first draft of the framework was bilaterally discussed with national and international experts working on exotic vector-borne diseases. Then, a second draft was constructed and presented at an international workshop to > 20 invited experts on risk assessment and vector-borne diseases. The input and comments gathered at this workshop were used to complete the framework.
The framework for risk assessment of emerging vector-borne livestock diseases evaluates both the likelihood of introduction of a disease pathogen into the area at risk and its subsequent spread and consequences. The framework identifies the main steps in risk assessment of exotic vector-borne livestock diseases and provides a toolbox for (quick) assessments. The basic steps distinguished in the risk assessment framework are: (1) the probability of entry, i.e., the probability that the pathogen causing the disease enters the area at risk by any pathway, and (2) the probability of transmission, i.e., the probability that the pathogen is able to spread to other susceptible hosts in the area at risk implying that at least a competent vector should be present somewhere and that at a specific time environmental conditions are suitable for virus replication and spread. If both probabilities are non-negligible, the framework proceeds to evaluate (3) the probability of establishment, i.e., the probability that the pathogen can spread from vector to host and vice versa given the conditions of introduction (pathway, time and place) (4) the extent of spread, i.e., the extent to which the pathogen is able to spread in time and space, considering both local dispersal and long-distance spread, accounting for the number of animals/herds infected and the geographic area affected, (5) the likelihood of persistence, i.e., the likelihood that the pathogen will assert itself in the area at risk for a prolonged period resulting in endemicity, and (6) the impact of the disease being present in the area on the livestock sector and – if zoonotic – on human health, including economic, socio-ethical and environmental consequences. For each step, the framework gives (a) a flowchart identifying the key variables contributing to this step, (b) an extensive checklist with all parameters that contribute to the risk of this step, (c) a structured questionnaire to assess the risk of this step, and (d) an overview of databases and methods available to qualify or quantify the risk of this step. Use of the questionnaire allows for consistency

4
in risk assessment of vector-borne livestock diseases as the questionnaire systematically addresses all steps of the framework.
The framework was extensively tested using Rift Valley fever (RVF) as a case. The choice for RVF allows for an extensive test of the framework, since this disease affects many different host species; it is a zoonotic disease; and the virus is transmitted by many different (mosquito) vectors. During a second workshop with 11 invited experts, the framework (including the questionnaire, flowcharts, and checklists) were used for a risk assessment of Rift Valley Fever in North-western Europe. The workshop did not lead to changes in the framework itself, but a separate assessment by the project team using the full length of the framework supporting questionnaire resulted in small amendments of the questionnaires as such.
The framework offers the opportunity to do a first ‘quick’ assessment of the risk considering only the main elements of the framework and the key questions of the structured questionnaire. For a more extensive assessment, all questions of the questionnaire should be answered. Depending on the outcome of this qualitative assessment, one or several steps of the framework might require a more in-depth assessment by doing quantitative calculations. If possible, the impact of uncertainty and variability needs to be taken into account in such calculations.
The framework has been developed for emerging livestock diseases that are transmitted by mosquitoes, midges and ticks. An extensive testing of the applicability to a mosquito-borne disease has been performed. However, transmission dynamics of tick-borne diseases differ from those of mosquito-borne and midge-borne diseases, e.g., due to the longer life span of ticks, a lower biting frequency and stricter requirements for their ecological niche. To prove the general applicability of the framework to these different vector-borne livestock diseases, it needs to be tested for. Ideally, the framework should also be tested using a tick-borne disease, because of the different transmission dynamics involved, especially with respect to the timescale at which the disease spreads. However, we believe that extended testing of the framework using RVF as a case has proven the value of the framework with respect to the general approach used, the individual steps distinguished in the framework, the parameters indicated in the checklist and the questionnaire.
This project was funded by the Dutch Ministry of Economic Affairs, Agriculture and Innovation (BO-10-009-002) in the Hague.

5
1. Introduction
1.1. Background
The project “Risk analysis for exotic vector-borne diseases” (BO-10-009-002) was issued in 2010 by the Dutch Ministry of Economic Affairs, Agriculture and Innovation (BOCI program), the Hague, with the aim to diminish the risk of emerging livestock diseases in endemic areas and to increase the Dutch capacity to cope with these diseases if an incursion would occur. Introduction of a new livestock disease does not only have an impact on animal health, but also affects international trade, food supply and – if zoonotic – human health.
Increases in international trade and globalisation contribute to rapid and wide geographical spread of diseases. Furthermore, changes in climate, ecology, land use, and social welfare have contributed to the expansion of diseases beyond their endemic foci. The recent incursions of exotic vector-borne diseases into areas hitherto free from disease have urged the need for control of these diseases, both in the newly affected areas and in endemic regions. In the Netherlands the Ministry of Economic Affairs, Agriculture and Innovation is responsible for prevention and control of vector-borne livestock diseases. Efficient and cost-effective risk management requires better knowledge of these diseases and more insight into the possible pathways for introduction and subsequent spread. Import risk analysis for livestock diseases is usually based on the guidelines given by the World Organization for Animal Health (OIE). Assessment of the risk of introduction, establishment and spread of exotic vector-borne diseases requires, however, a multidisciplinary approach, with knowledge from epidemiology, virology, entomology, ecology, climatology and economy. Introduction and spread of vector-borne livestock diseases can indeed not only be induced by the importation of infected animals, but also by an increase of the vector’s habitat or by importation of the vector alongside with non-susceptible animals, plant species, inanimate objects or transport means. Furthermore, many of these vector-borne diseases have a zoonotic character, urging the need for prevention and rapid control.
1.2. Objective
Guidelines for risk analysis are available from different disciplines, e.g. animal health (OIE), plant health (International Plant Protection Convention, IPPC; European and Mediterranean Plant Protection Organization, EPPO) and food safety (Codex Alimentarius, Food and Agriculture Organization/World Health Organization, FAO/WHO), each with their own focus. The objective of this project was to develop a framework for risk assessment of introduction, establishment, spread and persistence of vector-borne livestock diseases by integrating the essential elements of these different approaches. This framework will help risk analysts to assess the risk of vector-borne diseases, considering both likelihood of occurrence and potential impact to inform stakeholders on behalf of their decision making. The primary stakeholders are governments and governmental bodies that need to decide on the risk management required to achieve the appropriate level of protection (ALOP) (WTO, 1994) for the disease concerned. Risk assessments based on the framework will also provide insight into the main elements contributing to the risk which is a prerequisite when preparing for emerging vector-borne diseases. Furthermore, the framework will help to identify existing knowledge and data gaps that need to be solved to adequately address the risk. Primary focus of the framework is on vector-borne livestock diseases. However, the framework might also be applicable for vector-borne plant pests and diseases and vector-borne human diseases.

6
1.3. Outline of the report
Chapter 2 gives an overview of the approach and input used to establish the framework. In Chapter 3 a description of the resulting framework is given. In Chapter 4 the framework is discussed. In Chapter 5 conclusions and recommendations are given. The Annexes provide (I) a list of abbreviations, (II) a glossary, (III) a checklist, (IV) a structured questionnaire to guide risk assessments for vector-borne diseases, and (V) exemplary tables to facilitate the reporting of the questions on the entry pathways and current area of distribution.
Next the framework will be presented. In the course of the development two workshops and an internal risk assessment by the project group are conducted. The results of these workshops and the internal risk assessments are available as separate reports:
- De Vos C.J., De Koeijer A.A., Bremmer, J. Workshop on a Risk Assessment Framework for Emerging Vector-Borne Diseases (2010)
- De Vos C.J., Hoek, M.R., Fischer E.A.J., De Koeijer A.A., Bremmer, J., Workshop on a Risk Assessment of Rift Valley fever in Europe (2011)
- Hoek M.R., Fischer E.A.J., De Koeijer, A.A., Bremmer, J., De Vos, C.J. Risk assessment framework for exotic vector-borne disease; a Rift Valley fever case study (2011)

7
2. Materials and methods
2.1. Approach
To build the framework, six major activities were undertaken in the following order:
1. Review of existing guidelines for risk assessment 2. Internal discussions within the project group 3. Bilateral discussions with national and international organizations working on risk
assessment of vector-borne diseases 4. International workshop with > 20 invited experts on risk assessment and vector-borne
diseases 5. International workshop with 12 invited experts on Rift Valley Fever and vector-borne
diseases 6. Internal assessment of the framework by the project group, by applying the framework to
Rift Valley Fever In the first phase of the project, existing guidelines and published risk assessments on vector-borne livestock diseases were studied. An overview of existing guidelines is given below. This, and the internal discussions, resulted in a first draft of the framework that basically comprised an outline of the steps that can be distinguished in risk assessment of vector-borne livestock diseases (i.e. entry, spread, persistence and impact) and flowcharts indicating the key variables and their interrelationships for each step. Furthermore, checklists were designed to give a comprehensive overview of all parameters that might contribute to the probability and/or magnitude of each step. This first draft of the framework was discussed with representatives of national and international organizations and European networks working on risk assessment of emerging vector-borne (livestock) diseases, viz.:
• Jan-Willem Zijlker, Ministry of Economic Affairs, Agriculture and Innovation, The Hague May 31, 2010
• Stephanie Wiessenhaan and Cindy Schenk, Ministry of Health, Welfare and Sport, The Hague May 31, 2010
• Wim Ooms, Food and Consumer Product Safety Authority (nVWA), The Hague May 31, 2010
• Jan Slingenbergh, Stephane de La Rocque, James Zingeser, Sherrilyn Wainwright, Ian Douglas and Akiko Kamata, Food and Agriculture Organization (FAO), Rome, Italy, June 3, 2010
• Joke van der Giessen, Chantal Reusken, Hein Sprong and Katsuhisa Takumi, National Institute for Public Health and the Environment (RIVM), Bilthoven, August 23, 2010
• Hans Heesterbeek, Faculty of Veterinary Medicine, Utrecht University, Utrecht, August 25, 2010
• Franck Berthe, Jordi Tarres-Call and Mo Salman, European Food Safety Authority (EFSA), Animal Health and Welfare (AHAW) Panel, teleconference, September 8, 2010
• Noel Murray, World Organization for Animal Health (OIE) (we contacted Wim Pelgrim, but discussed the framework with Noel Murray who has frequently been hired by OIE as an expert on import risk analysis), teleconference, September 8, 2010
• Paul Gale, Veterinary Laboratories Agency (VLA), Weybridge, UK, September 21, 2010 • Helmut Saatkamp, Business Economics, Wageningen University, Wageningen, November
9, 2010 Since the focus of the framework is on risk assessment for vector-borne livestock diseases, the framework was not bilaterally discussed with the IPPC and the EPPO.
A second draft of the framework was established based on the outcome of these bilateral discussions. Furthermore, a description of available methods and databases was included for each step. This second draft was presented at an international workshop on October 6, 2010 at Schiphol, the Netherlands. The aim of this workshop was to present the framework to national and

8
international researchers and policy makers working on emerging vector-borne livestock diseases and to discuss (a) the need for such a framework, (b) the completeness of the framework and (c) the application of the framework. A separate report on the workshop is available (De Vos et al., 2010). The input and comments gathered at the workshop were used to complete the framework. Furthermore, a structured questionnaire was developed to guide risk assessors through all essential elements of the framework and provide the basis for a consistency in risk assessment of vector-borne livestock diseases. This questionnaire systematically addresses all steps of the framework. Questions have been formulated at different levels of detail enabling the risk assessor to perform risk assessments that vary from a quick assessment using the first level of questions only till in-depth assessments that consider all relevant sub-questions. A qualitative scoring system has been added to the questionnaire, but the questions can also be answered quantitatively.
The improved framework was applied in a second workshop on 11-12 May 2011 at the Botanical Gardens in Amsterdam. The main objectives of the workshop were (1) a first assessment of the risk of RVF for Western Europe based on the framework, (2) a test of the framework for completeness and practicality and (3) an exchange of opinions on the risk of RVF. Eleven, both national and international, experts on RVF were invited to the workshop representing different disciplines, such as field experience, virology, epidemiology, entomology, economics and policy. A separate report on this workshop is available (De Vos et al., 2011). The workshop provided a first qualitative assessment of the risk of RVF in Western Europe and comments on the practicality of the framework.
The project group conducted a risk assessment of RVF internally after the workshop, strictly using the structured questionnaire. The aim was to obtain (1) a test of the use of the structured questionnaire, and (2) to add a risk assessment by a small group of risk assessors to the risk assessment by an expert group workshop. A separate report is available on this assessment (Hoek et al., 2011). Results of this assessment were used to improve the structured questionnaire. The structured questionnaire is available in Annex IV.
2.2. Guidelines for risk assessment
Several guidelines are available for risk assessment of plant, animal and human diseases. Most of these are provided by international organisations, although some have been drafted by national governmental bodies. In establishing the risk assessment framework for emerging vector-borne livestock diseases, we have elaborated on the guidelines given by the OIE for animal diseases (OIE, 2004; OIE, 2010a) and the guidelines by the EPPO for plant pests and diseases (EPPO, 2009). Guidelines given by the EPPO are a more detailed elaboration of guidelines given by the IPPC (FAO, 2006). Guidelines given by the FAO/WHO for microbiological risk assessment (food safety) in the Codex Alimentarius were considered less relevant for the risk assessment of vector-borne diseases, although dose-response relationships might be considered (Codex Alimentarius, 1999). However, usually data availability is not sufficient to estimate such relationships. Guidelines of the European Food Safety Authority (EFSA) for animal health risk assessment (EFSA, 2007a) and plant health risk assessment (EFSA, 2010a) rely to a great extent on OIE and EPPO and are therefore not explicitly addressed below. Furthermore, guidelines on import risk analysis given by national governmental bodies in among others New Zealand, Australia and the USA were taken into consideration, but these also relied heavily on OIE and IPPC guidelines (Anonymous, 2001; USDA, 2008; Anonymous, 2009). Procedures for animal import risk assessment in New Zealand have been laid down in a book that was written by the same author as the Handbooks on Import Risk Analysis that were issued by the OIE (Murray, 2002; OIE, 2004). In summary, international standards for animal import risk analysis worldwide heavily rely on OIE guidelines and international standards for pest risk analysis worldwide heavily rely on IPPC and EPPO guidelines.
The OIE framework (OIE, 2010a) has been developed to assess the disease risk associated with the importation of animals, animal products, animal genetic material, feedstuffs, biological products and pathological material. Since the Agreement on the Application of Sanitary and

9
Phytosanitary Measures (SPS Agreement) of the World Trade Organization (WTO) was implemented in 1995 (WTO, 1994), import restrictions should be based on international standards to protect human, animal or plant life or health. However, where such standards do not exist or where a higher level of protection is sought than provided by the relevant international standard, the measures must be supported by an assessment of the risks to human, animal or plant life or health. The principal aim of the OIE framework is to provide a method to conduct transparent, objective and defensible risk analysis for international trade. Main components of the OIE framework are hazard identification, risk assessment, risk management and risk communication. The risk assessment is further divided into four steps: (1) release assessment, (2) exposure assessment, (3) consequence assessment, and (4) risk estimation in which the results of the previous three steps are integrated to produce an overall measure of the risk. The Animal Health and Animal Welfare (AHAW) Panel of EFSA relies to a great extent on OIE guidelines for conducting animal health risk assessments. For issues involving antibiotic resistance, the Codex Alimentarius guidelines are used (Codex Alimentarius, 1999). Furthermore, the AHAW Panel has issued an opinion on the Framework for EFSA AHAW Risk Assessments (EFSA, 2007a), in which the procedural context of performing risk assessments is described in detail.
The EPPO framework (EPPO, 2009) has been developed to assess the risk of exotic plant pests and diseases. The pest risk analyses executed by using the EPPO pest risk analysis (PRA) scheme serve as a basis for the European Union (EU) and Mediterranean governments to decide whether a pest should be regulated or not. Regulation means that the pest gets the quarantine status. As a consequence, all stakeholders are obliged to prevent the pest from entering the country, to eradicate the pest when it enters, or to manage the pest such that plants and plant products traded will be free from the pest. The EPPO framework assesses (1) the probability of introduction by evaluating the probability of entry, establishment, and spread and (2) the potential economic consequences in the PRA area, i.e., the area at risk, and based on the outcome of these two assessments it is decided whether the pest presents a risk or not. Furthermore, the framework helps to assess which phytosanitary measures should be applied. EFSA has developed a comparable pest risk assessment scheme (EFSA, 2010a). It differs mainly from the EPPO scheme in the impact assessment part, i.e., the EFSA scheme does not require economic evaluation of the damage.
2.3. European networks on vector-borne diseases
In developing the framework, several European networks on vector-borne diseases were contacted to make sure that we took into account the newest developments in research on vector-borne diseases. EDEN (Emerging Diseases in a changing European eNvironment) is an EU-funded research project aiming at ecology and epidemiology of vector-borne and rodent-borne diseases that affect humans. The International Conference (10-12 May 2010, Montpellier, France) was attended and presentations gave new insights in the complex epidemiology of vector-borne disease, especially in relation to environmental and social changes. The EDEN project has ended now, but will be continued in the EDENext project. Hans Heesterbeek of the Faculty of Veterinary Medicine, Utrecht University is involved in this European network and shared his opinion on the framework in a bilateral meeting. ARBO-ZOONET is an EU-funded international network for capacity building for the control of emerging viral vector-borne zoonotic diseases and focuses on West Nile fever, Rift Valley fever and Crimean Congo haemorrhagic fever. A workshop on the risk of these diseases for Europe (26-27 November 2009, Montpellier, France) and the Annual Meeting 2010 (22-24 November 2010, Rabat, Morocco) were attended. VBORNET is a network of medical entomologists and public health experts focusing on human vector-borne diseases that was initiated by the European Centre for Disease Prevention and Control (ECDC). The aim of this network is to support arthropod vector surveillance in the EU and improve preparedness towards vector-borne diseases. RIVM is also involved in VBORNET with Joke van der Giessen being a work package leader. Joke informed us about the main activities in the network in a bilateral meeting. Guy Hendrickx (AVIA-GIS, Belgium) is also a work package leader in VBORNET. He attended the international workshop on the framework for risk assessment. Hence, the knowledge and

10
experience available within VBORNET was used in establishing the framework on risk assessment for vector-borne livestock diseases.
2.4. Framework for risk assessment of vector-borne livestock diseases
The guidelines issued by the OIE for import risk assessment of livestock diseases are widely used. However, the specific characteristics of vector-borne infections ask for a different approach in assessing their risk. Especially the impact of seasonality on vector biology and vector-pathogen interactions results in rather unique patterns that are only found in vector-borne infections. Ignoring those aspects may lead to an incomplete or even wrong assessment of the risk. The guidelines issued by the IPPC and the EPPO that are used for pest risk analysis do include some of these aspects, since arthropod vectors are often involved in disseminating plant pests and diseases. For instance, the phase of establishment of the disease following incursion is explicitly addressed in pest risk analysis. Elements of OIE and IPPC/EPPO guidelines were both considered in establishing the framework for risk assessment of vector-borne livestock diseases. This framework intends to provide a systematic, comprehensive and transparent approach to risk assessment of vector-borne infections. Following the checklists (Annex III) and/or the structured questionnaire (Annex IV) ensures not to neglect possibly important elements contributing to the risk.
The framework offers the opportunity to do a first ‘quick’ assessment of the risk considering only the main elements of the framework before proceeding into a more in-depth assessment. Key questions have been formulated in the structured questionnaire and are indicated in black normal font (Annex IV). For a more extensive qualitative assessment, also the questions in grey italic font of the structured questionnaire should be answered. Depending on the outcome of the qualitative assessment, one or several steps of the framework might require a more in-depth assessment by doing quantitative calculations (possible tools are indicated in the ‘Available methods and databases’ sections). If possible, the impact of uncertainty and variability needs to be taken into account in such calculations.

11
3. Results
3.1. Description of the framework
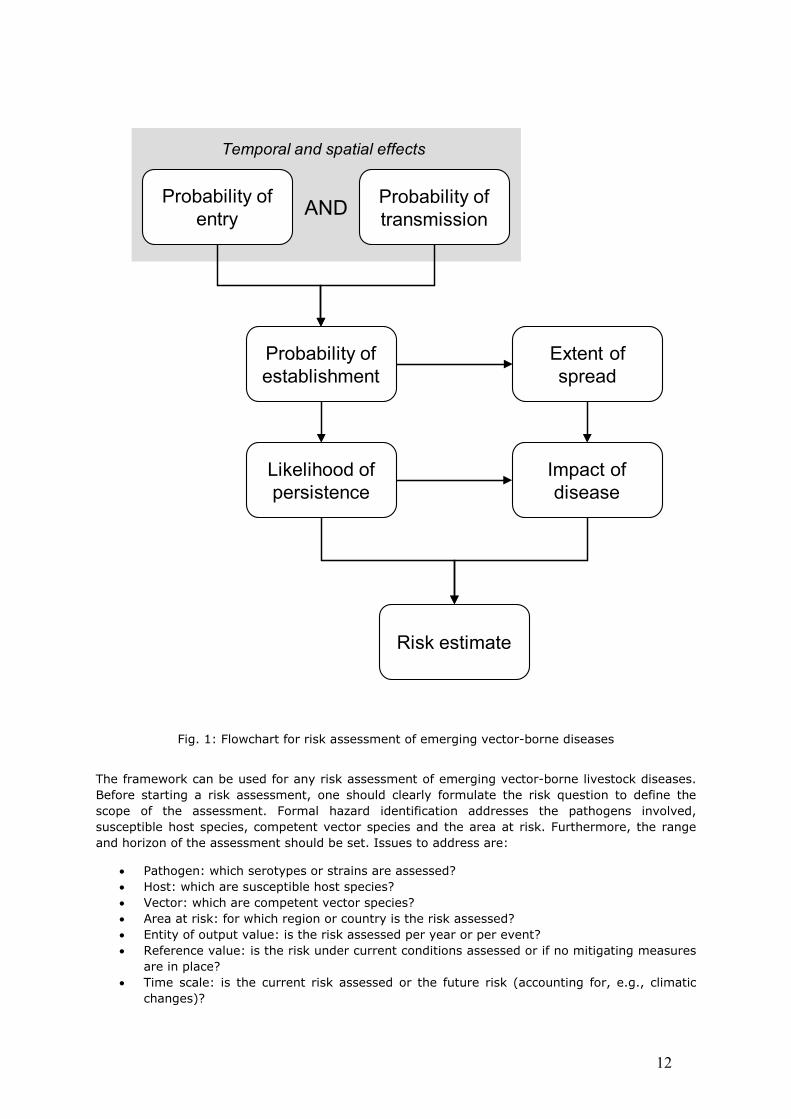
The framework for risk assessment of emerging vector-borne livestock diseases evaluates both the likelihood of introduction of a disease pathogen into the area at risk and its subsequent spread and consequences. An outline of the framework is given in Fig. 1, with the probabilities contributing to the risk at the left and the magnitudes at the right. In the framework six steps are distinguished that contribute to the final risk estimate: (1) probability of entry, i.e., the probability that the pathogen causing the disease enters the area at risk by any pathway, (2) probability of transmission, i.e., the probability that the pathogen is able to spread to susceptible hosts in the area at risk implying that at least a competent vector should be present somewhere and that at any time local environmental conditions are suitable for virus replication and spread, (3) probability of establishment, i.e., the probability that the pathogen can spread from vector to host and vice versa given the conditions of introduction (pathway, time and place) (4) extent of spread, i.e., the extent to which the pathogen is able to spread in time and space, considering both local dispersal and long-distance spread, accounting for the number of animals/herds infected and the geographic area affected, (5) the likelihood of persistence, i.e., the likelihood that the pathogen will assert itself in the area at risk for a prolonged period resulting in endemicity, and (6) impact of the disease being present in the area on the livestock sector and – if zoonotic – on human health, including economic, socio-ethical and environmental consequences. Steps 2 – 5 (probability of transmission, probability of establishment, extent of spread and likelihood of persistence) of the framework are closely related. The outcome of these steps is mainly determined by (a) the transmission dynamics of the infection and (b) the geographical and seasonal conditions in the area at risk. The results of all six steps of the framework can be integrated in an overall estimate of the risk taking into account both probabilities and consequences of vector-borne disease introduction.
A risk assessment of the introduction of exotic vector-borne diseases can either start with estimating the probability of entry of a disease pathogen or with estimating the probability of transmission once the pathogen is introduced. If it can be ruled out that the pathogen would enter the area at risk, no further risk assessment is required. On the other hand, if the pathogen cannot spread in the area at risk, for example because no competent vector is available, the pathogen does not constitute a serious risk either, even if entry is possible. The risk is then limited to the probability that the pathogen is brought into the area at risk by live animals and the impact of an isolated case of infection (limited control measures) (see e.g. the Dutch contingency plans for African Horse Sickness, LNV, 2007). Ideally, both probabilities should be assessed simultaneously in increasing level of detail. This process can be aborted if the outcome of one of the two steps is negligible, since details on the other step then become irrelevant. If the probabilities of both entry and transmission are non-negligible, the probability of establishment of the infection has to be considered taking into account the local conditions of the incursion. If the probability of establishment is non-negligible, the risk assessment proceeds in the next two steps, i.e. extent of spread and likelihood of persistence. To evaluate the likelihood of persistence (a) fade out due to depletion of susceptible hosts and (b) possible overwintering strategies of the pathogen should be taken into account. Depending on the outcome of the persistence step, the impact of the disease should be evaluated only for a single epidemic/outbreak or should include the impact of endemicity of the disease.
The framework presented in this document is based on flowcharts indicating the key variables contributing to the risk of vector-borne diseases. An overview of all parameters possibly contributing to the risk is given in an extensive checklist (Annex III). In addition, background information on each step has been documented. The framework also gives an overview of methods available for the different steps in the framework and databases available to quantify the parameters in the checklist. Finally, the framework provides a questionnaire that offers a structured approach to (qualitatively) assess the probability or magnitude of each step and arrive at an estimate of the overall risk (Annex IV).
12
Risk estimate
Impact of disease
Likelihood of persistence
Probability of establishment
AND Probability of transmission
Probability of entry
Temporal and spatial effects
Extent of spread
Fig. 1: Flowchart for risk assessment of emerging vector-borne diseases
The framework can be used for any risk assessment of emerging vector-borne livestock diseases. Before starting a risk assessment, one should clearly formulate the risk question to define the scope of the assessment. Formal hazard identification addresses the pathogens involved, susceptible host species, competent vector species and the area at risk. Furthermore, the range and horizon of the assessment should be set. Issues to address are:
• Pathogen: which serotypes or strains are assessed? • Host: which are susceptible host species? • Vector: which are competent vector species? • Area at risk: for which region or country is the risk assessed? • Entity of output value: is the risk assessed per year or per event? • Reference value: is the risk under current conditions assessed or if no mitigating measures
are in place? • Time scale: is the current risk assessed or the future risk (accounting for, e.g., climatic
changes)?

13
• Scale of impact: are the consequences assessed for the livestock sector only or also for supplying and processing industries?
A risk assessment can either be qualitative or quantitative. Qualitative assessments describe the risk in words such as low, moderate, and high, whereas quantitative assessments express the risk in numeric terms, such as the calculated probability per year. Although quantitative assessments can provide more (detailed) information, qualitative assessments are preferred when quantitative data are scarce. Often the values of some variables needed to assess the risk of vector-borne livestock diseases are highly uncertain, e.g. vector competence, vector-host ratios, and host preference of vectors. Therefore, the framework was initially developed to give a qualitative estimate of the risk of emerging vector-borne livestock diseases, although some methods presented in the framework allow for quantification of the individual steps of the framework.
The value and practicality of the framework was tested and confirmed in the workshop on Rift Valley fever, where in a 1.5 day with 11 experts a qualitative risk assessment proved to be possible. The workshop proved the ability to uncover key parameters for uncertainty and points of attention for risk managers. The testing with the project group showed that for this group of risk assessors 84 man-hour was needed to provide a qualitative risk assessment.
The impact of uncertainty on input parameters on the outcome of the risk assessment can be evaluated using sensitivity analysis. The results of the sensitivity analysis can indicate manageable parameters that have a large influence on the risk therewith providing options for risk management. Furthermore, it helps in identifying which uncertain input parameters have most impact on the estimated risk indicating areas for further research. Sensitivity analysis should not only be performed on uncertainty regarding the values of input parameters, but also on assumptions and/or supposed relations between parameters in estimating the risk.
It should be stressed that even the most advanced risk assessments cannot predict the unpredictable. This is definitely true for vector-borne diseases. The sudden rise of some exotic vector-borne diseases was not to foreseen. Examples are the tremendous spread of West Nile virus and the severe disease in horses and humans it caused in the USA after its introduction in 1999 (CDC, 2010) and the rapid spread of bluetongue virus serotype 8 (BTV-8) in North-western Europe after its introduction in 2006 (Saegerman et al., 2008). Spread of vector-borne diseases is determined by the host-pathogen-vector complex. Most vector species consist of numerous subspecies that differ in geographical distribution (dependent on climate and habitat), but also in competence for virus replication and spread, and host preference. Furthermore, most pathogens have different serotypes or strains. Small differences in the viral genome might dictate for either efficient or no replication in the vector species. Besides, viruses can easily mutate or reassort resulting in changes in virulence and opportunities for spread by vectors. Although the host-pathogen-vector interactions should be taken into account when performing risk assessment for vector-borne diseases, much is still unknown on vector competence and host preference, especially for vectors in non-endemic areas. Genomics might help in understanding the key genes that contribute to vector competence for viruses, enabling assessment of the risk for various vectors and virus serotypes (Gale et al., 2010).
3.2. Probability of entry
The probability of entry of a disease is primarily defined by (a) the current area of distribution, i.e. the possible source countries of the pathogen and (b) the pathways for introduction, i.e. the possible carriers of the pathogen. Furthermore, export regulations in place for the current area of distribution may reduce the probability of entry, although these regulations do not apply to all pathways. A flowchart for the probability of entry is given in Fig. 2.
The main variable to consider for the current area of distribution is the prevalence or incidence of disease in both hosts and vectors, taking into account disease outbreak patterns (epidemic or endemic), sensitivity and quality of surveillance systems and control measures in place. If disease is not endemic in certain regions of the current area of distribution, the probability of entry of

14
disease into these regions should be considered and the expected time till first detection of disease (high risk period). If disease is present, the reported incidence depends on the sensitivity and quality of surveillance systems and might be an underestimate of the true incidence in the region. Sensitivity of active surveillance depends on the sampling strategy used, the logistics (time delay, sample deterioration) and the test characteristics (sensitivity and specificity). Sensitivity of passive surveillance depends on the clinical disease pattern of infected animals and whether or not the disease is notifiable. Furthermore, the quality of veterinary services as indicated by OIE (OIE, 2010b) should be considered because low quality services may lead to misjudgement of the disease situation. Control measures like (emergency) vaccination and zoning and compartmentalization might influence reported incidence. For zoonotic infections, reports on human incidence might be available whilst reports on animal incidence are lacking.
Fig. 2: Flowchart for the probability of entry of emerging vector-borne diseases
Parameters to consider for the pathways for introduction are the numbers transported from the current area of distribution to the area at risk and the infection pressure along the pathways. Issues to consider with respect to the numbers transported are the frequency of transports, whether animals are transported individually or in batches, and the timing of transports. The latter might both influence the infection pressure along the pathway when incidence patterns in the current area of distribution are seasonal and the probability of establishment in the area at risk when vectors are not available year round. Infection pressure along the pathway depends on disease parameters like the length of the incubation and viraemic period, the probability of contamination and pathogen survival, transportation time and effects of processing, storage and transport.
Export regulations that might reduce the probability of entry are, for example, quarantine, testing, and clinical inspection of animals and heating of animal products. Insecticide spraying of aircraft cabins and elimination of breeding sites on vessels might also mitigate the probability of entry of exotic vector-borne diseases by mitigating the probability of entry of (exotic) vectors. Export regulations only affect the probability of pathogen entry by legal pathways, not illegal trade and
Pathways for introduction
Current area of distribution
Probability of entry
Import and export control
Prevalence Numbers Infection pressure

15
smuggling. Severe export regulations might be counterproductive resulting in bigger volumes of illegal trade.
The probability of entry of the pathogen might be seasonally distributed if prevalence in the current area of distribution is not constant throughout the year or if the numbers transported along the pathway are not evenly distributed over the year. Seasonality in the probability of entry might interact with seasonality in the probability of establishment of disease. The latter probability depends, among others, on the moment at which pathways enter the area at risk. Subsequent spread of disease is most likely to occur in the vector season. Furthermore, spread of disease depends on the availability of both vectors and hosts, which varies over regions. Host density is, for example higher in rural areas than in urban areas, while vector abundance depends, among others, on the availability of a suitable ecological niche and breeding sites. The probability of entry and subsequent establishment will be highest if numbers of transports or transported animals along the pathways are highest during periods of high prevalence in the current area of distribution and if these periods of high prevalence coincide with the vector season in the area at risk.
An overview of all parameters is given in the checklist in Annex III. To support the reporting of all possible pathways exemplary (dummy) tables is provided for in Annex V.
To estimate the probability of entry of disease, all possible pathways for introduction should be considered:
• Entry of infected live animals o Import of livestock o Import of zoo animals o Import of pets o Import / migration of wildlife o Migratory birds
• Entry of an infected vector (or its eggs or larvae) by o Increase of the infected area by an increase of the vector’s habitat o Wind / air currents o Tires o Plant materials o Transport vehicles: aircrafts, vessels, cars, trucks o (Non-susceptible) livestock, wildlife, pets or humans o Migratory birds o Manure o Soil
• Import of contaminated biological material o Genetic material: semen, ova, embryos o Serum, plasma o Modified live vaccines
• Import of contaminated animal products o Products for consumption: meat, milk, eggs, bush meat o Other products / animal by-products: hides, feathers, animal proteins, animal fats
• Entry of infected humans Importations of live animals and high-risk animal products are usually not allowed from areas where exotic diseases are endemic. Illegal importations can however substantially contribute to the probability of entry, although being very difficult to quantify (Hartnett et al., 2007).
Entry of infected humans does usually not result in subsequent spread of livestock viruses in the area at risk, because humans are considered dead end hosts for most livestock diseases, i.e., it is either biologically impossible that vectors get infected when feeding on infected humans or the probability of pathogen transmission from human to vector is that low that humans do not play an important role in the epidemiology of the disease.

16
All pathways have been outlined in a pathway diagram (Fig. 3), showing the subsequent events resulting in entry of the pathogen in the area at risk. Entry of the pathogen via the pathway ‘entry of infected live animals’ can result in establishment of disease directly, if competent vectors are present in the area at risk. For all other pathways, a more complex cascade of events is required to result in one or more infectious animals in the area at risk. These events are evaluated in the step ‘probability of establishment’.

17
Fig.
3:
Path
way
dia
gram
for
ent
ry o
f ex
otic
vec
tor-
born
e di
seas
es

18
Available methods and databases
A commonly used approach to estimate the probability of entry of a pathogen is the scenario tree or scenario pathway approach, in which the consecutive steps that result in disease introduction are outlined (Vose, 1997; Murray, 2002; OIE, 2004). A separate scenario tree can be made for each pathway or a pathway diagram can be made showing all pathways and their interrelations (De Vos et al., 2003; an example is given in Fig. 3). Each step in the pathway diagram has a conditional probability of occurrence. Entry of a pathogen via a specific pathway is only to occur if all steps in its scenario tree are true. The probability of entry via one entity transported along the pathway is calculated by multiplying the probabilities of all steps along this pathway. The probabilities per event depend on the pathway concerned, the region from where the pathway is coming, the host-pathogen-vector interactions, and seasonal and regional effects. The probability of entry of a pathogen along a specific pathway during a specific time frame (e.g. year, vector season) is calculated by combining the numbers transported from the current area of distribution to the area at risk during this period with the probability of entry per entity transported along this specific pathway.
Probabilities for each step can either be estimated qualitatively using narrative terms varying from negligible to very high, or quantitatively using numbers. The choice for a qualitative or quantitative approach depends, among others, on availability and reliability of (quantitative) data and the time available to do the assessment. Qualitative probabilities can be combined by using risk matrices. A recent example is found in an EFSA opinion on the risk of African swine fever (EFSA, 2010b). When combining qualitative estimates of probabilities, it should be kept in mind that the product of two probabilities is always equal to or smaller than the lowest probability in the ‘calculation’. Quantitative probabilities can be combined using model calculations, especially when uncertainty is involved. A commonly used modelling environment is Excel™ (Microsoft) with @Risk™ (Palisade Corporation) as an add-in. Absolute values of the probability of entry of a pathogen are, however, very hard to predict due to the usually high uncertainty of the true value of input parameters for each step in the scenario tree. Furthermore, available historical data are not always representative for the future due to changes in, for example, trade patterns, preventive measures and control strategies applied. The main objective of quantitative modelling is thus not to predict the entry of a pathogen, but rather to provide insight into (1) the relative contribution of (a) current areas of distribution and (b) pathways for introduction to this probability and (2) the effectiveness of risk management, e.g. preventive actions.
Databases available to estimate presence of disease in the current area of distribution and estimate prevalence or incidence levels are the World Animal Health Information Database (WAHID) from the OIE, the EMPRES (Emergency Prevention System) database of FAO, the Animal Disease Notification System (ADNS) from the EU, and ProMED mail (Program for Monitoring Emerging Diseases). These databases are all available from the internet. The reliability of WAHID and EMPRES depends largely on the compliance of member countries to notify disease outbreaks. In contrast, notification of disease outbreaks to ADNS is more reliable, since non-compliance has financial consequences for EU member states. On the contrary, WAHID and EMPRES contain data of most countries in the world (the OIE had 177 member countries and territories in 2010; EMPRES contains information on 179 countries worldwide), while ADNS only contains data from all 27 EU member states. Furthermore, the number of diseases on which information can be retrieved is less in ADNS. A major drawback of both systems is that they only provide information on positive cases. They do not provide insight into the numbers of animals tested which makes it difficult to derive proper prevalence estimates. FAO provides data on livestock populations worldwide in the Global Livestock Production and Health Atlas (GLiPHA) that might help in estimating prevalence levels. ProMED mail is a different database with descriptions of disease occurrence worldwide posted by individual persons and can also be filled by, for example, scientists. A further databases on disease occurrence worldwide is GLEWS (Global Early Warning and Response System for Major Animal Diseases, including Zoonoses), which is a joint initiative by FAO, OIE and the WHO. Disease reports in GLEWS are a compilation of disease reports provided by FAO, OIE and WHO. Both EMPRES and GLEWS not only contain official reports of disease, but also information from unofficial media reports and informal networks. This information is not publicly available on the internet. For zoonotic diseases, reports on human disease incidence can be used as an indicator for incidence in livestock if disease has not been reported in livestock. Other

19
information on disease occurrence, patterns, prevalence, etc. is to be obtained from published reports on disease outbreaks and scientific literature. Sensitivity and quality of surveillance systems in the current area of distribution can be evaluated using OIE guidelines (OIE, 2010b).
Databases available to estimate the number of pathway-units transported from the current areas of distribution to the area at risk are national statistics, Eurostat, FAOSTAT, and TRACES (Trade Control and Expert System) of the EU. National statistics on trade in animals and products are collected by most countries. These are usually based on custom reports. Eurostat is a statistical database of the EU containing detailed figures on intra-EU trade and exports to and imports from third countries. International trade data in Eurostat are available from the Traditional external trade database access (ComExt). The data in Eurostat are provided by the individual member states. No data on trade between third countries is available from Eurostat. FAOSTAT is a statistical database of FAO and does have information on these trade flows in the TradeSTAT database. However, FAOSTAT contains less detailed information than Eurostat. TRACES is not a statistical database, but contains data on all transports of live animal and animal products for which animal health certificates were issued or that were checked at border inspection posts of the EU. Data from TRACES are not publicly available at the internet, but should be retrieved from either the national veterinary authorities or a central server managed by the EU. Movements of zoo animals are registered in the International Species Information System (ISIS). Data on the number of animals present in each zoo are currently available on the internet. Data on movements, however, have to be requested. Data on migratory birds are available from ornithological organizations, such as the Dutch Centre for Field Ornithology (SOVON) and are nowadays widely collected for disease risk purposes, for example, to estimate the risk of entry of avian influenza and West Nile fever. Prevailing winds and air currents can be obtained from meteorological offices. Data on aircraft and passengers coming in can be obtained from national statistics and the Transport database of Eurostat. For other pathways, information on numbers is to be obtained from published reports on disease outbreaks and scientific literature.
Data on infection pressure can be obtained from fact sheets containing disease information and scientific literature. Export regulations are to be obtained from national, European Union or international (OIE) legislation (OIE, 2010c). European legislation is available on the internet from the EUR-Lex database. The Dutch Food and Consumer Product Safety Authority (nVWA) has established an interactive tool ‘Import Veterinair Online’ to easily find the requirements for importations of live animals, genetic material and animal products into the Netherlands.
Internet links ADNS http://ec.europa.eu/food/animal/diseases/adns/previous_table_11_en.htm ComExt (Eurostat) http://epp.eurostat.ec.europa.eu/newxtweb/ EMPRES http://empres-i.fao.org/empres-i/home?l=en_US EUR-Lex http://eur-lex.europa.eu/nl/index.htm Eurostat http://epp.eurostat.ec.europa.eu/portal/page/portal/eurostat/home FAOSTAT http://faostat.fao.org/site/535/default.aspx#ancor GLEWS http://www.glews.net/ GLiPHA http://kids.fao.org/glipha/ Import Veterinair Online http://wisdom.vwa.nl/ivo/Start.do ISIS https://app.isis.org/abstracts/abs.asp ProMED http://www.promedmail.org/pls/apex/f?p=2400:1000 SOVON http://www.sovon.nl/ and http://www.trektellen.nl/ WAHID http://www.oie.int/wahis/public.php?page=home

20
3.3. Transmission dynamics
The next four steps of the framework are discussed under one main heading, i.e., Transmission dynamics. The outcome of all these steps depends on the transmission dynamics between vector and host over time. Nevertheless, these steps are assessed separately, because they cover different parts of the overall risk evaluation and require different levels of detail and different approaches. The input used is, however, basically the same for all steps. The first two steps, i.e., probability of transmission and probability of establishment, require far less detail and technical tools and skills than the next two steps, i.e., extent of spread and likelihood of persistence.
First, the probability of transmission is assessed, since if there is no way that the infection will spread at a sufficient level for developing an epidemic in the area at risk, the risk assessment can be stopped at this stage. Next, the likelihood of establishment is assessed, taking into account the place and time of entry of the pathogen as well as the pathway along which the pathogen is brought into the area at risk. In this step, it is evaluated how likely it is that the infection, given these conditions, actually leads to local spread resulting in a small scale epidemic, often addressed to as establishment of the infection. Then, the extent of spread is assessed to evaluate the impact of the epidemic taking into account number of hosts, farms and/or regions affected and the spatial scale of the epidemic. The duration of the epidemic is assessed in the next step, the likelihood of persistence, considering fade out of the disease during the vector season and overwintering of the pathogen during the adverse season. While most vector species are strongly influenced by seasonal effects and require a reproductive cycle to persist into the new vector season (e.g. mosquitoes, midges), some species do easily survive the adverse season (e.g. ticks). Although this difference affects the risk assessment strongly, the systematic approach of first observing spread of disease in the vector season and subsequently studying possible overwintering mechanisms is effective for all vector-borne infections.
Figure 4 gives the flowchart of the complex system of pathogen transmission of vector-borne diseases, which is mainly from host to vector to host, but can also be from vector to vector by vertical transmission or co-feeding (ticks) and from host to host by either vertical or horizontal transmission. The transmission dynamics of vector-borne diseases not only depend on the vector-host interactions, but also on the presence or absence of a wildlife reservoir, the animal husbandry practices in the area at risk influencing contact rates between vectors and hosts, e.g. stabling of livestock, and socio-economic factors. An example of the complex dynamics between vector, host, climate and socio-economic factors like demography, wealth, and land use is given for tick-borne encephalitis by Randolph (2008). The flowchart in Fig. 4 is helpful in evaluating the steps of (local) transmission (if no transmission, no risk), establishment and extent of spread. These steps will be explained one by one in the text below.
Available methods and databases
Depending on the step in the framework that is assessed, a choice of models is available to evaluate transmission dynamics of vector-borne diseases. Important parameters that are required for each step are:
• Host density • Vector abundance • Biting rate (i.e. the interaction between host and vector) • The probability of transmission per bite
The last three parameters are often strongly influenced by climatic aspects, especially temperature. For evaluation of long term behaviour of the infection (persistence) more knowledge on the vector biology can be important.

21
Fig. 4: Flowchart for the probability of transmission of emerging vector-borne diseases (including probability of establishment and extent of spread)
Various publications are available explaining how to analyse transmission dynamics of vector-borne infections (see e.g. Keeling and Rohani, 2007; Hartemink et al., 2009). An initial and usually simple step would be an evaluation of the basic reproduction number R0. This number is defined as the expected number of new infections, induced by a (typical) initial infection, in an environment with many susceptible individuals. In the case of vector-borne infections this could be redefined as the expected number of newly infected hosts, induced by an initial host, via a vector. The basic reproduction number is a threshold value that is often applied in epidemiology because it clearly marks the difference between growth and decline of an epidemic. If the basic reproduction number is above one, an epidemic can grow. A basic reproduction number below one cannot lead to an epidemic and in that case imported infections will always (gradually) fade out. Generally, the basic reproduction number can easily be defined from a few basic parameters of the infection. In the case of vector-borne infections, this definition is slightly more complicated, but still feasible. The formula for R0 depends on the searching behaviour of the vector looking for hosts, so we cannot present a general formula here. In the references above a few variations on common patterns are given. One of the simplest models is described by De Koeijer and Elbers (2006) in an application to BTV-8. For further analysis of the extent of spread and the likelihood of persistence, specific knowledge on the infection is required, preferably supported by modelling fit to the situation.
Data on host densities can be found in national or international statistics, such as EUROSTAT and FAOSTAT. National databases with information on farm locations and animals present at each farm provide the most detailed host density maps, although some smoothing to larger areas is needed to combine these host density data with vector abundance data. The availability of data on vector abundance is increasing with several surveys recently or currently being conducted in Europe (Van Bortel et al., 2007; CMV, 2010). VBORNET, a network on vector-borne infections initiated and coordinated by ECDC, provides maps on vector distributions in Europe at its website (http://ecdc.europa.eu/en/activities/diseaseprogrammes/emerging_and_vector_borne_diseases/Pages/VBORNET_maps.aspx). In Belgium and the Netherlands, the results of such surveys have been combined with the CORINE database on land cover (EEA, 2011) to create vector abundance maps (Van Bortel et al., 2007; Fischer et al., 2011). Data on biting rates and transmission probabilities per bite are usually obtained from field or laboratory experiments described in scientific literature. For a few vector species and infections, good data is available (for example malaria). However, for vector species that are difficult to breed (e.g. Culicoides) and for infections that are difficult to culture or are less known, the available data in literature are very limited. Data
Vector Host
R0
R0
R0
Surveillance & Control
Climate
Ecology
Animal husbandry practices
Socio-economic factors
Pathogen Pathogen

22
on the climate and temperatures can be obtained from meteorological offices. The influence of climate, especially temperature, on vector biology is diverse and for some vectors well described in scientific literature. A systematic review of vector biology would, however, facilitate modelling of vector-borne diseases and make the time consuming search for parameters on vector biology, such as life span and biting rate easier.
3.3.1. Probability of transmission
The probability of transmission of a vector-borne disease is primarily defined by the presence of (competent) vectors and hosts and climatic and regional factors. Only if competent vectors are present in sufficient numbers (abundance) and susceptible hosts are present in sufficient numbers (density), epidemic spread of disease is possible. Furthermore, vector biology is greatly influenced by climatic factors, such as temperature and humidity. The biting rate and the life span of vectors (reciprocal of mortality rate) are temperature dependent, as is the length of the extrinsic incubation period of a pathogen in the vector. The extrinsic incubation period is the time from uptake of the pathogen via a blood meal until replication in the vector has reached the level at which the vector can transmit the pathogen to a susceptible host. Furthermore, vector abundance is driven by climatic factors (temperature, humidity, wind) and regional factors (availability of breeding sites based on habitat and micro-climate). Host densities (both susceptible and non-susceptible vertebrates) also differ over regions.
The probability of transmission can best be evaluated by analysing the basic reproduction number of an infection, the R0 value. The R0 should be evaluated for all geographic regions in the area at risk and for all seasons, since epidemic spread is greatly influenced by geography and seasonality. Differences in agricultural and urban areas should be taken into account. Only if R0 < 1 under all available conditions, no epidemic spread of the pathogen can be expected and introduction will only result in minor localized outbreaks (i.e. affect a few host animals). Calculation of the R0 is complicated for vector-borne diseases, since its value varies over the seasons. Epidemic spread is most likely in summer, i.e., the season in which temperatures favour vector abundance and virus replication in the vector.
By evaluating the basic reproduction number for the variable geographical and climatic conditions that appear in the area, the probability of an infection entering in a situation where spread can occur, can be evaluated, leading to the next step of the analysis: establishment of the infection.
An overview of parameters contributing to the probability of transmission is given in the checklist in Annex III.
Available methods and databases
A deterministic parameter-sparse model will generally be the most suitable tool to answer the questions in this step of the framework. A very general model, focussed only at the calculation of R0 would be the most efficient choice. Only if extended and detailed information is already available regarding the infection dynamics and the local situation in the area at risk, it can be worthwhile to address this question in a more extended model. The basic model in this step should address the impact of the specific differences between directly transmitted and vector-borne infections on the probability of transmission of disease, which are the interaction between the vector and the host (e.g. biting frequency) and the strong influence of temperature and other climatic aspects on vector behaviour (e.g. vector abundance and vector activity). General models which are suitable to evaluate these aspects are described by, for example, Keeling and Rohani (2007) and more specific models by, for example, De Koeijer and Elbers (2006) and Hartemink (2009).
Data to quantify such models can usually be found. However, expert judgement will often be required when evaluating an exotic infection, to estimate the transmission under the specific local conditions. Specific databases for such information are not available, and general literature searches are necessary.

23
3.3.2. Probability of establishment
Between the probability of introduction of the infection in the Netherlands and the actual spread of the infection in the country (if spread is possible) there is a highly stochastic transition phase, which is often referred to as establishment. Establishment of the infection is defined as a situation where the infection has passed from a host via a vector to an indigenous host, while the basic reproduction number R0 is higher than 1, i.e., under the given conditions the infection can spread epidemically. The outcome of this phase is highly dependent on three determinants:
1. The pathway along which the infection enters the area at risk 2. The specific area in which the infection first enters the area at risk 3. The specific time period in which the infection first enters the area at risk
Based on the above, the probability of establishment can be determined, i.e., the probability that the infection will be transmitted (1) to an indigenous host or vector and (2) from that first indigenous infection again onwards to the next host or vector.
The probability of establishment depends to a large extent on the form in which the infection enters the country, but is also strongly affected by the specific location where the infection enters the area at risk. This probability will be highest if live animals (at risk) are imported into areas with a high vector-host ratio, implying favourable conditions for spread of the infection. When the infection is imported in, for example, food, the probability of establishment will be much lower, because the infection first needs to reach and infect a susceptible host. In areas with low vector abundance, the probability of establishment will also be low, because transmission occurs at a lower rate.
If the infection can spread from host to vector to host in the initial area of entry, the next step in the framework, extent of spread, evaluates how fast and how far the infection will spread in the area at risk. The analysis of both steps, probability of establishment and extent of spread, do to some extent overlap, since the outcome of both steps relies on the probability of transmission of the infection in the area at risk. However, the specific pathway and the location and time of entry of the infection, as well as the highly stochastic process involved in the first transmission steps bring about the need for a separate step in the framework, being the probability of establishment.
An overview of parameters contributing to the probability of establishment is given in the checklist in Annex III.
Available methods and databases
Analysing this step in the framework requires a combination of the pathway analysis from the import risk assessment and the (simple) modelling study from the probability of transmission. A crude evaluation by expert judgement (with expertise regarding the import risk assessment and regarding the probability of transmission) can be used as a first approach. Basic risk assessment methods (e.g. Vose, 1997) are suitable for evaluation of this question. Such an evaluation can point out the essential or very uncertain aspects, which can subsequently be studied in more detail. A more detailed analysis will require a specific model of the system including the location and time of entry and the transmission of infection, using probabilistic methods or simulation. Whether such an analysis is realistic, depends on modelling expertise and the available data / information to feed the model. If very little data is available, deterministic models are the most suitable method. Thus, the impact of uncertainty and variability can be evaluated separately. The influence of variable parameters can subsequently be evaluated in a separate stochastic analysis. Generally, this combination of deterministic modelling, supplemented by a stochastic analysis, leads to a fast and thorough evaluation of the overall uncertainty and variability.
Again, good databases are not available to quantify the above. Scientific literature and expert judgement will be required.

24
3.3.3. Extent of spread
The extent to which a pathogen can spread in a new area is determined by the spatial and temporal scale where the basic reproduction number R0 is above the threshold of 1. This creates a “susceptible” area, which is usually only susceptible for a given time period, for example: pastures (location) with cattle (host) during spring and summer (time) for bluetongue (specific disease). The most important aspect that needs to be addressed in this step is the total number of hosts that get infected during an epidemic. Furthermore the affected area, i.e. the regional area where infected vectors are to be expected, needs to be assessed because disease control measures and export bans usually apply to the entire affected area.
The epidemic will remain small if the geographical area where spread is possible is small or when the period during which spread is possible is limited. In such cases, a crude estimate of the extent of spread can be given, based upon an estimate of the basic reproduction number and the number of infection generations that fit within the period during which spread is possible. An infection generation is defined as the average time span needed to transmit the infection from the host via the vector back to a next generation host. An indication of the number of infected hosts during the epidemic period is then given by the basic reproduction number to the power of the number of generations within the vector season. This crude estimate is only allowed when the calculated number is much smaller than the total number of hosts in the “susceptible” area. Furthermore, the total number of host animals infected during the epidemic not only depends on the basic reproduction number, the infection generation time and the length of the season in which spread is possible, but also on the number of susceptible hosts available (see e.g. De Koeijer and Elbers, 2006). Evaluation of the extent of spread for a large area and a long time span requires a more detailed evaluation by dynamic modelling, incorporating variation in vector and host densities over space, while also observing the effect of short and long distance transmission. For vector-borne infections, we are not aware of studies that have evaluated this in detail. However, these evaluations have been done for directly transmitted exotic infections like foot-and-mouth disease (FMD) and classical swine fever (CSF) (Tomassen et al., 2001; Backer et al., 2009). The typical seasonal decline in vector-borne infections is to some extent comparable to the effect of control measures on the spread of FMD and CSF when evaluating the epidemic, so methodologically they need similar approaches. However, for vector-borne infections, more difficulty is to be expected in quantifying the model input parameters, leading to higher uncertainty in the end results.
The extent of spread can be expressed by the timing and height of the epidemic peak (i.e. the maximum number of newly infected hosts per time unit) and by the epidemic size (i.e. the number or fraction of hosts that become infected during the whole epidemic). In Fig. 5, a basic description of an epidemic of a contagious (i.e. directly transmitted) disease is given which shows an initial major epidemic in a susceptible population, subsequently followed by a decline. Such a decline is generally due to depletion of susceptible hosts. If the fraction of susceptible animals is lower than 1/R0, the epidemic will fade out (Diekmann and Heesterbeek, 2000). If, however, replacement of new susceptible hosts is sufficiently fast compared to the time scale of the epidemic so that no fade out of infected hosts will occur, on-going spread of the disease after the epidemic peak results in an endemic situation in which a few smaller epidemic outbursts can be expected.
In the case of vector-borne infections, the development of the epidemic is often driven by the vector ecology. In the season of high vector abundance, the infection may spread, while it will decline or fade out in the adverse season. Thus, again a wave pattern may appear in the incidence of the disease, but in this case driven by climatic or ecological conditions and not the size of the susceptible host population. The outcome of both infection dynamics is similar: a dynamic fraction of infected hosts in time.

25
Fig. 5: Number of host animals affected over time since entry of disease: epidemic peak, epidemic size, and endemic prevalence
If the vector has more host species to feed upon, some of which are not susceptible to the infection (i.e. will not get infected and do not contribute to spread of disease), the presence of these host species can cause a so-called dilution effect, leading to fewer “effective” bites at which the infection can spread resulting in a lower transmission rate and hence a lower risk. However, if vector dynamics are driven by the presence of these hosts species; their presence resulting in higher vector abundance, this dilution effect may not be valid or even be reversed. This is assumed to be the case for BTV-8 in Europe, where the spread of infection appears to be driven by a Culicoides species that breeds in cow dung (EFSA, 2007b). The possible role of wildlife should be taken when considering the dilution effect.
A distinction should be made between local spread and long-distance dispersal of disease. Local spread is possible if competent vectors and susceptible vertebrate hosts are present in the same area. No further mechanisms are required. Long-distance dispersal of disease is initiated by either vector movements, e.g. dispersal of vectors by wind, or movements of the hosts (including wild life), e.g. animal trade.
Surveillance and control measures can reduce the extent of spread to a level at which R0 < 1, resulting in fade out of disease. Surveillance or early warning can limit the extent of spread by early detection of the pathogen in either vertebrate hosts or vectors if control measures can be implemented to limit the transmission of the pathogen from vectors to hosts and/or vice versa. Control measures can be directed at reducing the contacts between vectors and hosts by, e.g., isolation or the use of repellents, or at reducing the susceptibility or infectiousness of hosts or vectors to the pathogen by, e.g., vaccination. Control measures can also be directed at reducing the numbers of vectors (use of insecticides) or hosts (culling). Because the vector-host ratio is the main driver of the transmission rate for most vector-borne infections, vector reduction is in general an effective control measure. Host culling, however, will often not be effective, because it leads to an increased vector-host ratio and therewith increases the epidemic growth rate. Culling of infectious hosts can nevertheless have a positive effect by reducing the infectious period of the hosts, or when done selectively, e.g., only culling viraemic hosts (Fischer, 2011).
Infe
cted
hos
ts (l
og)
Time
Epidemic peak
Endemic prevalenceEpidemic size
Entry of disease
26
Most of the above arguments regarding spatial spread, seasonality and control are not directly valid for tick-borne infections, but the aspects that should be addressed are still the same (see e.g. Hartemink et al., 2008). Ticks have, however, higher demands with respect to their biotope / ecological niche than mosquitoes and midges. Furthermore, ticks are more dependent on specific hosts to feed upon and most tick species only feed once per life stage. Moreover, ‘horizontal’ transmission of vector-borne diseases is possible between ticks by co-feeding on the same host at the same time (Randolph 2008; Randolph, 2010).
Finally, if the infection is zoonotic, the epidemiology of human disease needs to be analysed separately. Often, people are dead end hosts for these vector-borne livestock infections, i.e., they can get infected, but do not spread the infection under normal conditions. In that case, the human epidemic will be scaled copy (linear relation) to the livestock epidemic, possibly with some time delay. If human density is high, the human epidemic will be larger, due to higher exposure. If, on the other hand, the human population does contribute to the spread of the infection, they should be addressed as an additional susceptible vertebrate host to estimate the extent of spread in both livestock and humans. In the impact analysis human disease will be addressed very differently though. Furthermore, surveillance in humans can be much more sensitive than surveillance in livestock, especially if livestock shows limited clinical disease.
An overview of parameters contributing to extent of spread is given in the checklist in Annex III.
Available methods and databases
The spatial scale at which the infection spreads within one vector season, i.e. within one epidemic episode, strongly determines the impact of disease, since all farms in that area will suffer from the control measures in place such as movement restrictions and export bans. Spatio-temporal maps of vector abundance and host density combined with R0 calculations based on host and vector biology are necessary to determine in which locations of the area at risk and in which periods of the year the infection will or will not spread. These risk maps can be used to provide an estimate of the affected area in one vector season. Examples of such risk maps can be found in Hartemink et al. (2009) and Gale et al. (2011).
Furthermore, an estimate of the total number of farms and/or animals infected needs to be made, based on estimates of the basic reproduction number R0 and the duration of the vector season. So far, little has been published regarding methods to estimate these numbers. However, based on an R0 map, (which is based on host density and vector abundance maps) a good evaluation can be made regarding the order of magnitude to be expected in an epidemic.
Typically, such questions can be addressed by deterministic modelling and more crude estimation models as for example used in Tomassen et al. (2001). They evaluate a possible FMD epidemic in the Netherlands by estimating the extent of spread, followed by an evaluation of the impact of such an epidemic. Although their model does not address a vector-borne infection, similar models can be applied, where the impact of control measures on FMD relates to the impact of decreasing temperatures at the end of the vector season on vector-borne infections. More detailed stochastic simulation models can also be applied (see e.g. Backer et al., 2009). The choice between the modelling types will mainly depend on the information available to quantify model input parameters, the resources available (time, money, expertise) and the personal preference of the assessors.
General databases to quantify these models are not available. Scientific literature and expert judgement will be required.
3.3.4. Likelihood of persistence
If a pathogen can spread (i.e. a competent vector is present, temperatures are sufficient for virus replication, etc.), its risk to animal health is further increased if it would be able to persist in the area at risk, i.e., it would become endemic and be present for a long period in the area. The likelihood of endemicity is determined by the rate at which depletion of susceptible hosts occurs. If

27
disease spreads rapidly, resulting in death or immunity of hosts, the number of susceptible hosts will in the end be too low to allow further spread of disease resulting in fade out of disease. The level of immunity in the host population depends on how fast the disease is spreading (R0 value), the size of the population, the turnover rate (birth and death rates), and the duration of immunity. Local clusters with different infection dynamics (e.g. slower spread) can contribute to patterns like long term persistence. For vector-borne diseases, however, fade out can also occur during the adverse season, when lower temperatures inhibit spread of disease. If the pathogen is not able to spread year round, it can only persist if it is able to survive during the adverse season (winter) in either the host or the vector or both. Survival in the environment does not seem to play an important role in vector-borne diseases although unusual vectors such as ticks in the case of a midge-borne disease, might contribute to overwintering of the infection. Persistence of disease is thus determined by (a) size of the susceptible host population and (b) seasonal parameters. A Floquet analysis in which the annual growth rate (k) is evaluated helps in analysing the combined effect of these two aspects (Floquet, 1883; Heesterbeek and Roberts, 1995). A flowchart for the likelihood of persistence is given in Fig. 6.
Fig. 6: Flowchart for the likelihood of persistence of vector-borne diseases
Fade out analysis(vector season)
Overwintering strategies
Depletion of susceptible hosts
Survival in vector Survival in host
Non-zerovector activity
Annual growth rate (k)

28
The most important overwintering mechanisms of vector-borne infections are:
• Survival in the host o Infectious period of host longer than the adverse season o Vertical transmission o Wildlife as a reservoir host
• Survival in the vector o Life span of vector longer than the adverse season or possibilities for the vector to
survive winter in warmer places o Vertical transmission or trans-stadial persistence in ticks
• Non-zero vector activity (assumed to be the case for BTV-8 in NW-Europe, Napp et al., 2011)
The likelihood of persistence of a disease can be evaluated using fade out analysis. These analyses estimate the expected time before the disease will disappear from the area at risk. We defined persistence or endemicity as the presence of the pathogen for a period of at least three years, equalling an annual rate of extinction of 1/3 = 0.33.
Risk management can be directed at minimizing the likelihood of persistence using control measures like vaccination.
An overview of parameters contributing to the likelihood of persistence is given in the checklist in Annex III.
Available methods and databases
If the infection has potential to persist in the adverse season after an epidemic in the vector season, the likelihood of the disease becoming endemic needs to be assessed. Main parameters to assess the impact of endemicity are the endemic prevalence of disease in the area at risk and the extent to which export bans are maintained into the period of endemicity.
If the infection has only few possibilities to persist throughout the adverse season, it is very important to quantify the likelihood of persistence more precisely, since the results of this assessment will have a major effect on the next step in the framework, i.e., the impact of disease. If many possible routes for overwintering exist, all of these need to be evaluated only up to the level that overwintering becomes almost certain; in that case detail is not required.
The first part of the analysis for the likelihood of persistence is an evaluation of the situation before the adverse season. That can consist of a deterministic evaluation of the timescale of the epidemic, from which the remaining fraction of susceptible hosts at the start of the adverse season can be evaluated (remember that an indication of the number of infected hosts during the epidemic period is given by the basic reproduction number to the power of the number of generations within the vector season). If the fraction of susceptible hosts is very low, fade out of the infection will follow as with directly transmitted diseases. This is a result of an effective reproduction number (i.e. the reproduction number multiplied with the fraction of susceptible hosts) lower than one (Wallinga and Teunis, 2004). If more detail is required in this step, the last stages of the fade out can be evaluated for duration and prevalence of infectious and susceptible hosts and vectors, using a probabilistic model in, e.g., Excel™ (Microsoft) and @Risk™ (Palisade Corporation). If fade out does not occur during the vector season, fade out due to the oncoming winter with reduced vector activity should be evaluated, i.e., does the winter lead to a full fade out and thus the end of the epidemic, or can the infection persist throughout the winter and reoccur in the next vector season? Generally, tick-borne infections easily persist in the ticks, which have a lifespan of several years. Mosquitoes and midges, on the other hand, rarely live longer than a few months and have trouble surviving harsh winters. In that case, an evaluation of the likelihood of persistence under winter conditions is required.
A stepwise approach of all possible overwintering strategies is advised to subsequently determine the probability of reappearance of the infection in the next vector season. In the checklist, an overview is given of possible overwintering strategies. For most of these, the likelihood of

29
persistence can directly be estimated from the probability of survival or the probability of a sufficiently long incubation or viraemic period. Only overwintering via non-zero vector activity, i.e. the situation in which some vectors might survive with transmission of the infection to hosts at a very low level during the adverse season, may require some more specific modelling to evaluate the probability of persistence via that route. In this case, a probabilistic model can be applied, using probability density functions for each time period in a host or vector, until it adds up to the total duration of the adverse season. Such an evaluation can be done by calculating the convolution integrals of the probability distributions of the relevant time periods and can also be approached with numerical methods for example using Excel™ (Microsoft) and @Risk™ (Palisade Corporation).
Finally, the long term persistence of the infection needs to be addressed, when it is clear that the infection will not fade out in the vector season and that it can survive the winter. To do so, a Floquet analysis is a suitable but very technical solution (Floquet, 1883; Heesterbeek and Roberts, 1995). An example of such an analysis is given by Fischer et al. (2011) who evaluated the geographical risk of RVF in the Netherlands.
3.4. Impact of disease
If the probabilities of entry, transmission, establishment, spread and persistence of a pathogen are non-negligible, the impact of the resulting epidemic has to be assessed to estimate the magnitude of the introduction risk. Furthermore, the impact of endemicity of the disease should be considered if the disease is able to persist in the area at risk. The impact of an epidemic is restricted in time and assessed per epidemic, whereas the impact of endemicity captures a longer period and is usually assessed on an annual basis. Although impact assessment of an epidemic and an endemic situation comprise similar elements, their magnitudes might differ. For example, morbidity and mortality are usually lower if a disease has been present in the area for a longer time period and the impact of trade restrictions will diminish when a disease becomes endemic due to changes in production goals and sales markets.
Impact assessment comprises the evaluation of the damage caused by the pathogen, not only considering economic consequences, but also socio-ethical and environmental consequences as internationally agreed upon by the European Commission (2009). Figure 7 shows a flowchart in which the elements contributing to the impact of disease are structured. From left to right, the flowchart contains the following elements:
• Causal aspects determining the impact, including the possible zoonotic character of the pathogen, the number of animals and/or farms infected, the affected area, and the measures applied to control the pathogen.
• Main effects of disease that result in economic, socio-ethical and/or environmental losses.
• Types of impacts that may follow from the effects. Economic consequences comprise losses in the livestock sector due to the presence of infected animals and/or farms and control measures, losses in the tourism sector, and losses induced by human disease, e.g., medical treatment and loss of productivity, if the disease is zoonotic. Losses in the tourism sector arise when natural areas are not accessible due to governmental measures to eradicate or contain the disease. In that case, hotels, holiday parks, camp sites and restaurants in the enclosed areas will lose sales. An illustrative example is given by the FMD epidemic in 2001 in the United Kingdom and the Netherlands (Huirne et al., 2002). Socio-ethical consequences comprise all aspects which affect human and animal well-being, other than economic effects, such as human disease burden, animal welfare, morbidity and mortality of pets if affected, the public concern when (healthy) animals and animal products are destroyed, and the adverse effects on citizens it they cannot go into recreational areas (tourism). Environmental consequences comprise all adverse effects of the pathogen on the environment including ecological effects that do not directly have an impact on human well-being. The main ecological impacts are effects on biodiversity and

30
nature values. Another environmental impact to address is pollution of the environment due to insecticides use to control the vector.
When considering economic consequences, a distinction is made between direct and indirect losses. Direct losses occur expectedly and are directly related to the infected entities, e.g. animals or farms. They include production losses at farm level and costs of control measures, both at farm level and at regional/national level. Indirect losses are not directly linked to the host and often follow from direct losses. Examples of indirect economic losses are changes in consumer demand and prices, changes in producer costs or input demands, losses incurred in supplying and processing industries, reduced access to export markets, welfare changes, and impacts on other related markets, sectors and economic entities. In the distinction between direct and indirect losses, the guidelines for plant pest risk analysis were followed, as recorded in international standards for phytosanitary measures (FAO, 2004).
Fig. 7: Flowchart for impact of emerging vector-borne diseases
The damage caused by the pathogen affects different groups:
1. Animals. The morbidity and sometimes mortality that is caused by infection affects animal welfare. Furthermore, measures to control the disease can affect animal welfare, for example, when animal transport bans result in overcrowded barns.
2. Livestock farmers. Sick animals are less productive than healthy animals resulting in production losses. In the case of mortality or culling, animals have to be replaced, requiring additional investments. Furthermore, management of the disease leads to additional costs, e.g., for medication and treatment. Furthermore, control costs made by the government can partly be claimed from the livestock sector, see point 5.
3. The agricultural production chain. Changes in production at farm level cause indirect economic effects for the supplying and processing industries in the production chain. In the
Epidemic size(animals/farms
infected)
Zoonotic disease
Geographical area affected
Control measures
Impact of diseaseSocio-ethical
consequences
Economic losses
Environmental consequences
Human disease
Infected animals/farms
Destruction of animals
Human disease burden
Side-effects (tourism)
Destruction of animals
Vector control
Ecological effects
Animal welfare
Morbidity and mortality of pets
Side-effects (tourism)
31
short run, the demand for animal feed drops, causing lower prices for animal feed. Reduced production, on the other hand, results in higher prices of animal products.
4. Humans. General: people might suffer from reduced tourism possibilities if access to natural areas is prohibited. Furthermore, illness or death of pets induced by the disease might affect human well-being. Finally, destruction of healthy animals or animal products to control the disease may result in ethical turmoil. If disease is zoonotic: humans become ill and might even die, severely affecting their well-being. Furthermore, controlling the pathogen involves costs for medical treatment. Finally, economic productivity is reduced if humans are temporarily or permanently unable to work.
5. The government. The control of epidemic diseases is organised and implemented by the government, resulting in costs for the crisis organisation, clinical inspections, enforcement of movement bans, and compensation costs for culled animals. It should be noted that these costs can be partly claimed from the livestock sector, for example by farmers’ contributions to an animal health fund (in Dutch: diergezondheidsfonds). Furthermore, in most cases the EU will also reimburse part of the governmental costs induced by livestock disease epidemics.
6. The environment. The environment can suffer from the introduction of a new pathogen if this, for example, results in reduced biodiversity. This is the case when rare or vulnerable species will die out due to the disease. Furthermore, nature values might be reduced if species are affected that play a key role in ecological processes disturbing coherence between species. Also, the environment can be harmed by emissions of insecticides applied to control vectors.
An overview of parameters contributing to the impact of disease is given in the checklist in Annex III.
Available methods and databases
A number of methods are available for economic impact assessment. Direct economic impacts are often determined by partial budgeting, a method which quantifies the changes in costs and benefits due to introduction of the disease, as compared to the prior situation (Roth and Hyde, 2002). Indirect economic impacts can also be determined by partial budgeting, when for each affected group the changes in costs and benefits can be determined. However, often indirect impacts are expressed in terms of welfare gains and losses for both producers and consumers, in which case equilibrium modelling is a common approach. Partial equilibrium models can be used when the economic effects are limited to the agricultural sector (Mas-Colell et al., 1995), while generalized equilibrium models are used when the pathogen causes wider economic effects (Dixon and Parmenter, 1996).
Commonly used concepts to assess the economic losses due to human disease are the DALY and the QALY, where DALY stands for Disability Adjusted Life Years (Prüss-Üstün et al., 2003) and QALY for Quality Adjusted Life Years. Four parameters are considered to determine these measures:
• The number of infected people • The seriousness of the symptoms • The case fatality rate • The age at which affected people die
DALY can be calculated as:
DALY = YLL + YLD
where YLL are the years of life lost (mortality) and YLD are the years of life lived with disability, weighted for severity of illness (morbidity).

32
The focus of the QALY concept is more on the quality of life. It can be calculated by attributing a value for each year of life, where unhealthy years get a number < 1 (Sassi, 2006).
The corresponding formula is:
QALY in one year = Q × 1 with Q < 1
where Q is the health-related quality of life weight attached to the relevant year of life.
According to this method, a score of 0.33 implies that the quality of life is perceived as 33% of the optimal quality. A year with optimal quality is equal to 3 years with a score of 0.33. Several methods can be used to elicit Q such as standard gambles and time trade-off (Weinstein et al., 2009). An example of a standard gamble is to provide a person the choice between living with a disease and a treatment against the disease with two possible outcomes: total recovery or passing away. The person has to estimate at which probability of surviving the treatment he is indifferent between living with the disease and the treatment. This probability is the value of the QALY lived in one year.
To evaluate the productivity loss due to human illness, a number of methods can be applied. The human capital approach takes the patient’s perspective. It considers any hour not worked by a patient as an hour lost. The friction costs method takes the employer’s perspective by calculating the hours not worked by the patient until a colleague replaces the patient (see e.g. Van Den Hout, 2010). However, more advanced methods like the generalized equilibrium models can be applied to calculate the effect of productivity loss on the national welfare.
Generic methods to assess socio-ethical and environmental impacts are not available at the moment. The main reason is that both types of impact cover a wide range of different effects which have their own quantities and units of measurement.
The economic, socio-ethical and environmental impacts cannot be directly added because of their different natures. Two approaches can be followed to add different impacts (Bremmer et al., 2009):
1. Monetising methods calculate the economic value of non-economic effects such as animal welfare and ecological effects. Examples are Hedonic pricing (Taylor, 2003) and the contingent valuation method (Bateman et al., 2002). The applicability of those methods is in most cases rather limited. Furthermore, the reliability of those methods is highly debated.
2. Multi-criteria analysis (Hardaker et al., 1997). This method provides objective and transparent protocols to add different impacts by transferring the individual effects into utility values and applying weight factors to the different impacts. Those weight factors express how the different impacts are evaluated compared to each other (ranking of importance).
In order to conduct an impact assessment, data are necessary. The epidemiological data considering the extent of spread (number of animals/farms infected, size of the affected area) and the likelihood of persistence (does the disease become endemic?) follow from the previous steps in the framework. Statistical information regarding the number of hosts and inhabitants in the affected region can be derived from national (CBS) and European databases (Eurostat) (see box with internet links). Economic data can be obtained from national (LEI-BIN) and European Farm Accountancy Data Networks (RICA). Information regarding the effect on hosts and humans can be collected from research reports, scientific literature and expert judgement.
Internet links LEI-BIN http://www3.lei.wur.nl/bin_asp/?database=LTC&language=1 CBS http://statline.cbs.nl/StatWeb/?LA=en Eurostat http://epp.eurostat.ec.europa.eu/portal/page/portal/eurostat/home RICA http://ec.europa.eu/agriculture/rica/database/database_en.cfm

33
4. Discussion
The introduction risk of exotic vector-borne livestock diseases requires a multidisciplinary approach because of the significant role vectors have in the transmission of these diseases. Not only import of animals and their products might result in introduction of these diseases, but also the entry of (invasive) vector species. Climate and ecology play an essential role in vector biology; only if conditions are suitable for the vector and for the pathogen to replicate in the vector, introduction of vector-borne diseases will result in establishment and spread. The established framework accounts for this multidisciplinary approach, especially when considering the transmission dynamics of vector-borne infections. The framework aims at (a) giving an overview of all relevant elements that contribute to the risk of emerging vector-borne livestock diseases and (b) providing a tool to enable a relatively quick assessment of the risk of vector-borne livestock diseases. The outline of the framework and the flowcharts for the individual steps provide an overview of the key variables that contribute to the risk of vector-borne diseases. The checklist and structured questionnaire guide the risk assessor through the risk assessment, allowing for different levels of detail. The emphasis of the framework is on the probability of entry of the disease and its transmission dynamics possibly resulting in establishment, spread and persistence. Although the impact of disease once established is very important in assessing the overall risk of disease introduction, less emphasis was given to this step of the framework. Often, risk assessments of exotic vector-borne livestock diseases are requested because of their potentially large impact. Incursions of these diseases into areas hitherto free from disease usually lead to drastic control measures including export bans. The assessment of the extent of spread and likelihood of persistence provides a good proxy for the impact of the disease on the agricultural sector and also provides an indication of socio-ethical consequences. If a vector-borne livestock disease is known to be zoonotic, its introduction will always have a huge impact, even if human morbidity and mortality are mostly mild. When such diseases occur, impact on human health is usually weighted higher than impact on economics in the public opinion, while animal welfare is definitely considered less important.
The framework was developed for risk assessment of vector-borne livestock diseases. Vector species considered were mosquitoes, midges and ticks. Although the processes described are valid for all three vector species, risk assessment of tick-borne infections is different from risk assessment of mosquito-borne and midge-borne infections. An important difference is the time scale at which processes occur, with ticks surviving for much longer periods. At the other hand, tick species only feed once or at most a few times per life stage, necessitating other strategies to pass on the virus to fellow ticks, e.g. co-feeding (Randolph, 2008). Furthermore, ticks have more strict requirements with respect to their ecological niche. Moreover, mobility of ticks is different. Although their radius of active movement is smaller than for mosquitoes and midges, they might more easily hitchhike on mammals or birds, resulting in a larger geographical dispersal.
To prove the general applicability of the framework to these different vector-borne livestock diseases, it needs to be tested. Ideally, three cases should be worked through to test the framework for its practical applicability: (1) a mosquito-borne disease, (2) a midge-borne disease and (3) a tick-borne disease. A first test was performed during the international workshop (6 October 2010) where the framework was discussed using Rift Valley fever, bluetongue and Crimean Congo haemorrhagic fever as cases.
The framework was extensively tested for a mosquito-borne zoonotic disease (Rift Valley fever). This resulted in a reordering of the structured questionnaire and the addition of a few questions. However, the framework itself sustained this testing and did not need further adjustments. Ideally, the framework should also be tested using a tick-borne disease, because of the different transmission dynamics involved, especially with respect to the timescale at which the disease spreads. However, we believe that extended testing of the framework using RVF as a case has already proven the value of the framework with respect to the general approach used, the individual steps distinguished in the framework, and the parameters indicated in the checklist.
The framework does not provide a tool to add the results of the individual steps into an overall risk estimate. Usually risk is defined as the probability of an adverse event times the consequences if

34
the adverse event would happen. However, a straightforward calculation of the risk is impossible given the complexity of the framework with interactions and dependencies between the different steps and the many uncertainties involved in estimating the probabilities or magnitudes of the individual steps. Furthermore, the framework was designed for a qualitative assessment of the risk rather than a quantitative assessment, although the methods put forward in Section 3.2 allow for a quantitative assessment if sufficient data are available.
Different approaches have been used to combine the individual steps of a risk assessment into an overall risk estimate. Examples include the work of the EU-project PRATIQUE (Enhancements of Pest Risk Analysis Techniques), where a knowledge based approach, Bayesian belief networks and risk matrices were proposed to integrate the steps of the EPPO scheme for pest risk assessment, and the work of the Dutch EmZoo project (Emerging Zoonoses), where a tool was developed to weight the results for individual criteria into a single output value in order to rank emerging zoonoses for the threat they pose to human health (Havelaar et al., 2010). Other examples of risk categorization or classification based on multiple criteria can be found in work performed in the project DisConTools (Development of the most effective tools to control infectious animal diseases, Work Package 2 Disease Prioritisation, http://www.discontools.eu/home/workgroups_home) and in the work of ANSES (French Agency for Food, Environmental and Occupational Health and Safety), France (Chiron et al., 2010). Our intention is to develop a tool to combine the outcomes of the individual steps of the framework into an overall risk estimate, explicitly addressing the uncertainty involved in each step. This can, however, not be accomplished with the time and resources available in the current project BO-10-009-002.

35
5. Conclusion and recommendations
The framework for risk assessment of emerging vector-borne livestock diseases is a useful tool to assess the risk of introduction, establishment, spread and persistence of exotic vector-borne livestock diseases, taking into account both probabilities and consequences. It provides the risk assessor with an overview of key variables and an extensive checklist of all parameters contributing to the risk. The structured questionnaire allows for both quick and in-depth assessments of the risk. The risk might be expressed qualitatively using the terminology used in the questionnaire, but can also be evaluated quantitatively using the modelling approaches and data provided in the framework. However, some parameters cannot be quantified or only with large uncertainty urging the need for sensitivity analysis. Results of the risk assessments can be used by national and international governments and governmental bodies that need to decide on efficient and cost-effective risk management to prevent and control these vector-borne diseases. Risk assessments based on the framework will provide insight into the main elements contributing to the risk which is a prerequisite when preparing for emerging vector-borne diseases. Furthermore, the framework will help to identify existing knowledge and data gaps that need to be solved to adequately address the risk.
Recommendations to further improve risk assessment and risk management of emerging vector-borne livestock diseases based on the framework are:
1. To test the framework separately for midge-borne and tick-borne diseases, given the differences observed in transmission dynamics of these disease groups with the already tested mosquito-borne infection. Especially ticks are different from mosquitoes and midges with respect to, among others, their life span, biting frequency and their demands on the ecological niche. Most tick-borne diseases are either endemic or absent. Epidemic occurrence like in mosquito-borne and midge-borne diseases is rare.
2. To develop a transparent tool to summarize the results of the individual steps of the framework into one overall risk estimate. Only such a tool will make the framework suitable for a risk-based prioritization of diseases. However, in its current state, the framework does provide information on those parameters contributing most to the risk of each step, allowing for prioritization in (a) prevention and control and (b) further research.
3. To rate the answering categories of the structured questionnaire in order to make results comparable. In the case of probabilities and transmission dynamics, use of log-scales is preferred over linear scales.
4. To further incorporate parameters to assess transmission dynamics of vector-borne zoonotic diseases that lead to infection in humans. In the case of zoonotic vector-borne infections, the framework might help to indicate whether priorities in control of the disease and in prevention of human infections should be given to the livestock sector or to public health. On the level of risk managers, responsibilities for prevention and control of zoonotic vector-borne livestock diseases should be clearly defined (Anonymous, 2010).
5. To create awareness among both risk assessors and risk managers that the probability of entry of pathogens is often underestimated, while epidemiological and economic consequences of diseases are usually overestimated. In estimating the probability of entry, not all pathways are (fully) taken into account due to lack of data, e.g. in the case of illegal importations, or because pathways are overlooked as they had never contributed to disease introduction so far, e.g., the origin of BTV-8 in North-western Europe is still not known. Overestimation of consequences might result from the dramatic course of recent epidemics in the Netherlands (CSF in 1997/98, FMD in 2001 and avian influenza in 2003), but also follows from a tendency to aim for worst case risk evaluation when data are scarce or lacking.

36
Acknowledgements
This project was funded by the Dutch Ministry of Economic Affairs, Agriculture and Innovation (BO-10-009-002). Daniel Bontje and Alies Hoek (Central Veterinary Institute of Wageningen UR) are gratefully acknowledged for their contribution to the internal discussions on the framework. We would like to thank all the consulted experts for commenting on the framework in the bilateral meetings and/or the international workshops.

37
References
Anonymous, 2001. Guidelines for Import Risk Analysis. Draft September 2001. Biosecurity Australia. Available at: http://www.daff.gov.au/__data/assets/pdf_ file/0016/22561/ iraguidelines.pdf. Accessed February 10, 2011.
Anonymous, 2009. Import Risk Analysis Handbook 2007 (update 2009). Australian Government, Department of Agriculture, Fisheries and Forestry, Biosecurity Australia. Available at: http://www.daff.gov.au/__data/assets/pdf_file/0003/1177833/IRA_handbook_2009_FINAL_FOR_WEB.pdf. Accessed February 10, 2011.
Anonymous, 2010. Van verwerping tot verheffing. Q-koortsbeleid in Nederland 2005-2010. Available at: http://www.rijksoverheid.nl/documenten-en-publicaties/rapporten/2010/11/22/van-verwerping-tot-verheffing.html. Accessed November 22, 2010.
Backer, J.A., Hagenaars, T.J., Van Roermund, H.J.W., De Jong, M.C.M., 2009. Modelling the effectiveness and risks of vaccination strategies to control classical swine fever epidemics. Journal of the Royal Society Interface 6, 849–861.
Bateman, I.J., Carson, R.T., Day, B., Hanemann, M., Hanley, N., Hett, T., Jones-Lee, M., Loome, G., Mourato, S., Ozdemiroglu, E., Pearce, D.W., Sugden, R., Swanson, J., 2002. Economic valuation with stated preference techniques: a manual. Cheltenhem, Edward Elgar.
Bremmer, J., Soliman, T., Kenis, M., Schaffner, U, Mourits, M., Van de Werf, W., Oude Lansink, A., 2009. Review of impact assessment methods for pest risk analysis. EU Framework 7 Research Project Enhancements of Pest Risk Analysis Techniques.
CDC, 2010. West Nile Virus: Statistics, Surveillance and Control Archive. Available at: http://www.cdc.gov/ncidod/dvbid/westnile/surv&control.htm. Accessed November 18, 2010.
Chiron, J., Hattenberger, A.M., Authie, E., 2010. Méthodologie de hiérarchisation des maladies animales; application à l’exemple des agents pathogènes exotiques. ANSES, France.
CMV, 2010. Centrum Monitoring Vectoren. Informatiesheet – Nationale Vector Survey 2010. Available at: http://www.vwa.nl/onderwerpen/dierziekten/dossier/centrum-monitoring-vectoren/ monitoring-steekmuggen-en-teken. Accessed February 16, 2011. (in Dutch)
Codex Alimentarius, 1999. Principles and Guidelines for the Conduct of Microbiological Risk Assessment. CAC/GL-30. Available at: http://www.codexalimentarius.net/download/ standards/ 357/CXG_030e.pdf. Accessed February 8, 2011.
De Koeijer, A.A., Elbers, A.R.W., 2006. Modelling of vector-borne diseases and transmission of bluetongue virus in North-West Europe. In: Takken, W. and Knols, B.G.J. (Eds.) Emerging pests and vector-borne diseases in Europe, Series: Ecology and control of vector-borne diseases Vol. 1, Wageningen Academic Publishers.
De Vos, C.J., Saatkamp, H.W., Huirne, R.B.M., Dijkhuizen, A.A., 2003. The risk of the introduction of classical swine fever virus at regional level in the European Union: a conceptual framework. Revue Scientifique et Technique de Office International des Epizooties 22, 795-810.
De Vos, C., De Koeijer, A., Bremmer, J., 2010. Workshop on a Risk Assessment Framework for Emerging Vector-Borne Diseases. Schiphol, The Netherlands, 6 October 2010.
Diekmann, O., Heesterbeek, J.A.P., 2000. Mathematical Epidemiology of Infectious Diseases: Model Building, Analysis and Interpretation. Wiley Series in Mathematical and Computational Biology, John Wiley & Sons.
Dixon, P.B., Parmenter, B.R., 1996. Computable general equilibrium modeling for policy analysis and forecasting”. In: Amman, H.M., Kendrick, D.A. and Rust J. (Eds.) Handbook of computational economics, Vol-I, Elsevier science B.V.

38
EEA, 2011. CORINE Land Cover. European Environment Agency. Available at: http://www.eea.europa.eu/publications/COR0-landcover. Accessed February 16, 2011.
EFSA, 2007a. Opinion of the Scientific Panel on Animal Health and Welfare on a selfmandate on the Framework for EFSA AHAW Risk Assessments. The EFSA Journal 550, 1-46.
EFSA, 2007b. Epidemiological analysis of the 2006 bluetongue virus serotype 8 epidemic in north-western Europe. Technical Report.
EFSA, 2010a. Guidance on a harmonised framework for pest risk assessment and the identification and evaluation of pest risk management options by EFSA. The EFSA Journal 8(2),1495.
EFSA, 2010b. Scientific Opinion on African Swine Fever. The EFSA Journal 8(3), 1556.
EPPO, 2009. Guidelines on Pest Risk Analysis (09-15190). Available at: http://archives.eppo.org/ EPPOStandards/PM5_PRA/PRA_scheme_2009.doc. Accessed March 5, 2010.
European Commission, 2009. Impact assessment guidelines. SEC (2009) 92. Available at: http://ec.europa.eu/governance/impact/commission_guidelines/docs/iag_2009_en.pdf. Accessed March 17, 2011.
FAO, 2004. Pest risk analysis for quarantine pests including analysis of environmental risks and living modified organisms, ISPM 11. International Plant Protection Convention. Available at: https://www.ippc.int/index.php?id=ispms&no_cache=1&L=0. Accessed February 10, 2011.
FAO, 2006. International Standards for Phytosanitary Measures. ISPM No. 11. Pest Risk Analysis for Quarantine Pests Including Analysis of Environmental Risks and Living Modified Organisms (2004). Produced by the Secretariat of the International Plant Protection Convention. Available at: https://www.ippc.int/file_uploaded/1146658377367_ISPM11.pdf. Accessed February 10, 2011.
Fischer, E.A.J., 2011. When culling of livestock makes vector-borne diseases less controllable. In prep.
Fischer, E.A.J., Boender, G.J., De Koeijer, A.A., Nodelijk, H.A., Van Roermund, H.J.W., 2011. Spread and control of Rift Valley fever virus after accidental introduction in the Netherlands. A modelling study. In prep.
Floquet, M.G., 1883. Sur les équations différentielles linéaires à coefficients périodiques. Annales Scientifiques de l’École Normale Supérieure 12, 47-88.
Gale, P., Wilson, A., Ulrich, R.G., 2010. Review of the potential application of genomic and related approaches to assist in risk assessments for the impact of climate change on the host-pathogen-vector interaction. EPIZONE Workpackage 7.4 report.
Gale, P., 2011. Impact of climate change on the risk of occurrence of vector-borne disease in Europe – a GIS model for CCHFV. In prep.
Hardaker, J.B., Huirne, R.B.M., Anderson, J.R., 1997. Coping with risk in agriculture. New York, CAB International.
Hartemink, N.A., Randolph, S.E., Davis, S.A., Heesterbeek, J.A.P., 2008. The basic reproduction number for complex disease systems: Defining R0 for tick-borne infections. American Naturalist 171, 743-754.
Hartemink, N.A., 2009. Vector-borne diseases: the basic reproduction number R0 and risk maps. PhD thesis, Utrecht University.
Hartemink, N.A., Purse, B.V., Meiswinkel, R., Brown, H.E., De Koeijer, A.A., Elbers, A.R.W., Boender, G.J., Rogers, D.J., Heesterbeek, J.A.P., 2009. Mapping the basic reproduction number (R0) for vector-borne diseases: A case study on bluetongue virus. Epidemics 1, 153-161.
39
Hartnett, E., Adkin, A., Seaman, M., Cooper, J., Watson, E., Coburn, H., England, T., Marooney, C., Cox, A., Wooldridge, M., 2007. A Quantitative Assessment of the Risks from Illegally Imported Meat Contaminated with Foot and Mouth Disease Virus to Great Britain. Risk Analysis 27, 187-202.
Havelaar, A.H., van Rosse, F., Bucura, C., Toetenel, M.A., Haagsma, J.A., Kurowicka, D., Heesterbeek, J.A.P., Speybroeck, N., Langelaar, M.F.M., van der Giessen, J.W.B., Cooke, R.M., Braks, M.A.H., 2010. Prioritizing Emerging Zoonoses in The Netherlands. PLoS One 5(11), e13965.
Heesterbeek, J.A.P., Roberts, M.G., 1995. Threshold quantities for infectious diseases in periodic environments. Journal of Biological Systems 3, 779-787.
Huirne, R.B.M., Mourits, M., Tomassen, F., de Vlieger, J.J., Vogelzang, T.A., 2002. MKZ: Verleden, Heden en Toekomst. Over de preventie en bestrijding van MKZ. Rapport 6.02.14, LEI, Den Haag.
Keeling, M.J., Rohani, P., 2007. Modeling Infectious Diseases in Humans and Animals. Princeton University Press.
LNV, 2007. Concept beleidsdraaiboek Afrikaanse Paardenpest. Versie 1.0, december 2007. (in Dutch)
Mas-Colell, A., Whinston, M.D., Green, J.R., 1995. Microeconomic Theory. New York: Oxford University Press.
Murray, N., 2002. Import Risk Analysis. Animals and Animal Products. MAF Biosecurity, Wellington, New Zealand.
Napp, S., Gubbins, S., Calistri, P., Allepuz, A., Alba, A., García-Bocanegra, I., Giovannini, A., Casal, J., 2011. Quantitative assessment of the probability of bluetongue virus overwintering by horizontal transmission: application to Germany. Veterinary Research 42, 4.
OIE, 2004. Handbook on Import Risk Analysis for Animals and Animal Products. OIE, Paris, France.
OIE, 2010a. Terrestrial Animal Health Code. Section 2. Risk Analysis. Available at: http://www.oie.int/eng/normes/mcode/en_titre_1.2.htm. Accessed November 24, 2010.
OIE, 2010b. Terrestrial Animal Health Code. Section 3. Quality of Veterinary Services. Available at: http://www.oie.int/eng/normes/mcode/en_titre_1.3.htm. Accessed November 24, 2010.
OIE, 2010c. Terrestrial Animal Health Code. Volume 2. Recommendations applicable to OIE listed diseases and other diseases of importance to international trade. http://www.oie.int/ eng/normes/mcode/en_sommaire.htm. Accessed November 24, 2010.
Prüss-Üstün, A., Mathers, C., Corvalán, C., Woodward, A., 2003. Introduction and methods; assessing the environmental burden of disease at national and local level. Environmental Burden of Disease series 1, World Health Organization, Geneva.
Randolph, S.E., 2008. Dynamics of tick-borne disease systems: minor role of recent climate change. Scientific and Technical Review 27, 367-381.
Randolph, S.E., 2010. To what extent has climate change contributed to the recent epidemiology of tick-borne diseases? Veterinary Parasitology 167, 92-94.
Roth, S., Hyde, J., 2002. Partial budgeting for agricultural businesses. Pennsylvania state university, unpublished manual.
Sassi, R., 2006. Calculating QALYs; comparing QALY and DALY calculations. Health policy plan, 402-408.
Saegerman, C., Berkvens, D., Mellor, P.S., 2008. Bluetongue Epidemiology in the European Union. Emerging Infectious Diseases 14, 539-544.

40
Taylor, L., 2003. The hedonic method. In: Champ, P.A., Boyle, K.J. and Brown, T.C. (Eds.) A Primer on Nonmarket Valuation. Dordrecht, Kluwer Academic Publishers.
Tomassen, F.H.M., De Koeijer, A., Mourits, M.C.M., Dekker, A., Bouma, A., Huirne, R.B.M., 2002. A decision-tree to optimise control measures during the early stage of a foot-and-mouth disease epidemic. Preventive Veterinary Medicine 54, 301-324.
USDA, 2008. Guidelines for import risk analysis. Available at: http://www.aphis.usda.gov/import_ export/animals/oie/downloads/tahc_oct08/tahc-guide-imp-risk-analysis77-oct08.pdf. Accessed February 10, 2011.
Van Bortel, W., Grootaert, P., Hance, T., Hendrickx, G., Takken, W., 2007. MODIRISK. Mosquito vectors of disease: spatial biodiversity, drivers of change, and risk. Available at: http://www.belspo.be/belspo/ssd/science/projects/MODIRISK_en.pdf. Accessed February 16, 2011.
Van Den Hout, W.B., 2010. The value of productivity, human-capital versus friction-cost method. Annals of the Rheumatic Diseases 69 (Suppl.1), i89-i91.
Vose, D.J., 1997. Risk analysis in relation to the importation and exportation of animal products. Revue Scientifique et Technique de Office International des Epizooties 16, 17-29.
Wallinga, J., Teunis, P., 2004. Different epidemic curves for severe acute respiratory syndrome reveal similar impacts of control measures. American Journal of Epidemiology 160, 509-516.
Weinstein, M.C., Torrance, G., McGuire, A., 2009. QALYs: The Basics. Value in Health 12, Supplement 1.
WTO (1994) Agreement on the Application of Sanitary and Phytosanitary Measures. http://www.worldtradelaw.net/uragreements/spsagreement.pdf. Accessed June 24, 2009.

41
Annex I: List of abbreviations
ADNS – Animal Disease Notification System
AHAW – Animal Health and Welfare Panel
ALOP – appropriate level of protection
BTV-8 – bluetongue virus serotype 8
CVI – Central Veterinary Institute of Wageningen UR
DALY – disability adjusted life years
ECDC – European Centre for Disease Prevention and Control
EDEN – European research project on emerging diseases in a changing European environment
EFSA – European Food and Safety Authority
EMPRES – Emergency Prevention System
EPPO – European and Mediterranean Plant Protection Organization
EU – European Union
FAO – Food and Agriculture Organization of the United Nations
GLEWS – Global Early Warning and Response System for Major Animal Diseases, including Zoonoses
GLiPHA – Global Livestock Production and Health Atlas
IPPC – International Plant Protection Convention
LEI – Agricultural Economics Research Institute of Wageningen UR
OIE – World Organization for Animal Health
PRA – pest risk analysis
QALY – quality adjusted life years
RIVM – Dutch National Institute for Public Health and the Environment
RVF – Rift Valley fever
SPS Agreement – Agreement on the Application of Sanitary and Phytosanitary Measures
TRACES – Trade Control and Expert System
VBORNET – network on vector-borne infections initiated and coordinated by ECDC
nVWA – Dutch Food and Consumer Product Safety Authority
WAHID – World Animal Health Information Database
WHO – World Health Organization
WTO – World Trade Organization

42
Annex II: Glossary
Adverse season Period of the year during which climatic conditions are not suitable for spread of vector-borne diseases, usually because temperatures are too low. Area at risk The geographical area for which the entry, establishment, spread, persistence and impact of disease are assessed. Basic reproduction number (R0) The expected number of new infected hosts that follows via one vector step from an initial infected host in a susceptible population. Current area of distribution Geographical regions where disease is currently present. Direct losses Losses directly related to the infected entities, e.g. animals or farms. They include production losses at farm level and costs of control measures, both at farm level and at regional/national level. Economic consequences Effects of disease that have monetary consequences for affected private and public bodies. Endemicity Long term persistence of an infection, with a constant but often low prevalence of infectious individuals in the population. This is generally induced by the constant inflow of new susceptibles in the population (for example by birth), leading to a constant low force of infection. Environmental consequences All adverse effects of the pathogen on the environment including ecological effects that do not directly have an impact on human well-being. The main ecological impacts are effects on biodiversity and nature values and pollution of the environment due to insecticides use to control the vector. Epidemic spread Exponential growth of the number of infectious individuals in the population, followed by a decrease in growth of the epidemic due to a declining fraction of susceptibles in the population. Typically an epidemic will result in fade out of disease if the replacement rate (inflow of new susceptibles) is low as compared to the speed at which the epidemic grows. Establishment of disease The situation in which the infection has passed from a host via a vector to an indigenous host, while the basic reproduction number R0 is higher than 1, i.e. under the given conditions the infection can spread epidemically. Extent of spread Extent to which the pathogen is able to spread in time and space, considering both local dispersal and long-distance spread. Extent of spread is measured by the number of farms or animals infected with the disease and the geographical area affected by the disease and/or imposed control measures. Fade out analysis Analysis to evaluate fade out of disease due to depletion of susceptible hosts.

43
Indirect losses Indirect losses are non-host specific and often follow from direct losses. Examples are changes in consumer demand and prices, changes in producer costs or input demands, losses incurred in supplying and processing industries, reduced access to export markets, welfare changes, and impacts on other related markets, sectors and economic entities. Impact Evaluated consequence of the disease being present in the area at risk Infection generation Average time span needed to transmit the infection from a host via he vector back to a next generation host Livestock hosts Cattle, sheep, goats, horses, pigs, poultry. Overwintering Survival of the pathogen during the adverse season in which transmission is limited due to climatic factors. Pathway for introduction Route along which a pathogen can be introduced into the area at risk. Persistence of disease Prolonged presence of a pathogen in the area at risk if no fade out of disease occurs and overwintering is possible. This results in endemicity of disease. Probability of transmission The probability that there is a combination of time and location possible within the area at risk, where the reproduction number R0 of the infection is above threshold, i.e. above one, taking into account all uncertainties and unknowns. Socio-ethical consequences All consequences which affect human and animal well-being, other than economic effects, such as human disease burden, animal welfare, mortality and morbidity of pets if affected, the ethical turmoil when (healthy) animals and animal products are destroyed, and the adverse effects on citizens it they cannot go into recreational areas (tourism). Spread of disease Transmission of disease from infectious individuals to susceptible individuals, directly, indirectly or by vectors. Spread of vector-borne diseases implies that at least a competent vector is present and that local environmental conditions are suitable for virus replication and spread. Vector-borne diseases Disease for which vectors are the primary transmission route. Vectors Arthropod vectors, i.e., mosquitoes, midges, ticks, (sand)flies. Vector season Period of the year during which climatic conditions are suitable for spread of vector-borne diseases

44
Annex III: Checklist
Probability of entry • Identification of all pathways
• Risk per pathway
o Numbers entering the area at risk (import statistics) Frequency Seasonality (which time of the year)
• Prevalence in current area of distribution • Vector season in area at risk
Batch size o Infection pressure
Disease parameters • Incubation period • Viraemic period • Time to seroconversion
Pathogen survival Probability of contamination Transportation time Effects of processing, storage, and transport
• Disease status in current area of distribution
o Only if epidemic Probability of introduction Expected length of the high risk period (HRP)
o Endemic / HRP if epidemic Incidence / prevalence
• Hosts o Within-herd o Between herd
• Vectors o Surveillance
Sensitivity and quality of active surveillance • Sampling strategy • Test characteristics • Logistics
Sensitivity and quality of passive surveillance • Clinical symptoms • Notifiable disease (yes/no)
Quality of veterinary services Human incidence
o Control measures (Emergency) vaccination Zoning and compartmentalization
• Regulations (do not affect all pathways)
o Quarantine o Clinical inspection o Testing
Virus, antigen, serology Sensitivity and specificity
o Commodity treatment Heating

45
o Vector control Disinsection of aircraft Elimination of breeding sites on vessels
Probability of transmission
• Host density • Vector abundance • Biting rate • Transmission probability per bite
o Vector to host o Host to vector
• Vector biology In this step, all these parameters need to be assessed for the optimal conditions for transmission in the area at risk. Probability of establishment
• Probability of transmission, given the specific conditions under which the pathogen enters the area at risk
o Pathway for introduction Route of exposure of indigenous vectors or indigenous hosts
o Time / season of entry of disease Temperature Humidity
o Geographic location of entry of disease Host density Vector abundance
o Vector-host interaction Biting rate Transmission probability per bite
• Vector to host • Host to vector
Extent of spread
• Local spread
o Vector Abundance
• Patchy vs. homogenous distribution Competence
• Life span • Biting rate • Transmission probability per bite
o Vector to host o Host to vector
• Extrinsic incubation period o Host
Density • Susceptible hosts • Non-susceptible hosts • Urban vs. rural areas • Housing conditions

46
Susceptibility and infectiousness • Host susceptibility • Latent period • Viraemic period • Duration of immunity • Morbidity • Case fatality rate
o Vector-host interaction Overlap between vector abundance and host density Dilution effect
• Host preference of vector o Spatio-temporal effects
Spatial effects • Suitability of niche/habitat for vector • Availability of breeding sites • Replacement due to presence of non-competent vectors
Temporal effects • Temperature • Humidity • Wind • Day length • Sunshine
• Long-distance spread
o Movements of vectors Wind Water Carried by wildlife / (migratory) birds Natural dispersal range of vector
o Movements of hosts animal transports in search of grazing areas (nomadism/pastoralism) migration of wildlife
o Reservoir host in wildlife • Surveillance
o Active / passive o Sensitivity of diagnostics used
clinical inspection laboratory test
o Time to detection of index case o Human disease surveillance if disease is zoonotic
• Control measures
o Reduce contact between vector and host isolation / quarantine repellents movement controls
o Reduce susceptibility of hosts vaccination
o Reduce number of susceptible hosts culling lower host density
• mixing with unsusceptible vertebrates o Reduce number of vectors
insecticides reduce favourable conditions for breeding

47
Likelihood of persistence
• Size of susceptible host population o Spread of disease (R0) o Total number of vertebrate hosts o Duration of immunity o Birth rate o Life span / mortality rate (natural deaths, culling for other reasons than disease)
• Vector abundance • Vector competence • Survival of the pathogen in the adverse season
o Length of the adverse season o Prevalence of infection at start of adverse season
Prevalence in host Prevalence in vector
o Survival in the vector seasonality (temperature, humidity)
• life span • extrinsic incubation period • biting rate
vertical or trans-stadial transmission co-feeding
o Survival in the host infectious period recrudescence (reactivation of virus in the host) vertical transmission
o Non-zero vector activity o Survival in the environment
abiotic materials unusual vectors (e.g. ticks for a midge-borne infection)
o Survival in a reservoir host (wildlife, rodents) Impact of disease
• Economic consequences o Human health effects
Direct losses • Medication and treatment • Surveillance and control
Indirect losses • Reduced economic productivity • Reduced quality of life (disabilities, life expectancy)
o Agricultural effects Direct losses
• Loss of livestock • Production losses • Consequential losses (empty barns) • Medication and treatment • Surveillance and control costs
Indirect losses • Supplying and processing industries (feed companies, slaughter-
houses) • Trade effects (export bans, price effects)

48
o Side-effects Tourism
• Socio-ethical consequences
o Human disease burden Mortality Morbidity
• Seriousness of symptoms • Duration of symptoms
o Temporary o Permanent
o Animal welfare Morbidity and mortality Movement controls (overcrowded barns)
o Morbidity and mortality of pets o Destruction
Healthy animals Animal products
• Environmental consequences
o Ecological impact Biodiversity (individual species) Nature values (coherence between species)
o Vector control Pollution by insecticides

49
Annex IV Structured questionnaire
Structured questionnaire for risk assessment of emerging vector-borne livestock diseases
Stage Theme Sub-theme Topic No. Question Order of questions Explanation Scoring Uncertainty
Haz
ard
iden
tifi
cati
on
Reason for performing a risk assessment
1 Describe the reason why the risk assessment is performed
Potential reasons are: a new commodity is imported; a new vector borne disease is identified; a new pathway is identified; a new vector is identified; the policy has been revised
description
Specification of disease 2 Determine the vector-borne disease(s) description
Specification of pathogen 3 Determine scientific name and
taxonomic position of the pathogen Consider different serotypes/strains description
Specification of vector 4 Determine the vector species that can
transmit the disease description
Specification of host 5 Determine the host species that are
susceptible to the disease description

50
Stage Theme Sub-theme Topic No. Question Order of questions Explanation Scoring Uncertainty
Haz
ard
iden
tifi
cati
on
Define the current area of distribution
6 Specify the geographical borders of the region(s) where the pathogen is or has been observed description
Epidemic potential 7
How likely is incursion of the pathogen in the current area of distribution to result in a major epidemic?
very low, low, moderate, high, very high
low, moderate, high
Endemic potential 8
How likely is incursion of the pathogen in the current area of distribution to result in endemicity?
very low, low, moderate, high, very high
low, moderate, high
Potential for consequences
Potential for economic consequences
9 Could the pathogen cause substantial economic consequences? yes or no
Potential for threatening human health
10 Could the pathogen cause substantial consequences for human health? yes or no
Define the area at risk 11 Specify the geographical borders of the
region(s) subject to the RA description

51
Stage Theme Sub-theme Topic No. Question Order of questions Explanation Scoring Uncertainty
Haz
ard
iden
tifi
cati
on
Presence of potential vectors in area at risk
12 Are potential vector species present in the area at risk?
If yes, go to Q14 yes or no
13 How likely is introduction and establishment of potential vectors in the area at risk?
If very low, stop the RA
very low, low, moderate, high, very high
low, moderate, high
Presence of host animals in risk area
14 Are potential host species present in the area at risk?
If yes, go to Q16 yes or no
15 How likely is introduction and establishment of potential host species in the area at risk?
If very low, stop the RA
very low, low, moderate, high, very high
low, moderate, high
Comparability of climatic conditions for survival in current area of distribution and area at risk
16 Are the climatic conditions in the area at risk comparable with those in the current area of distribution?
Consider both protected (in stables) and unprotected (outside) conditions
minimal, little, moderately, largely, totally
low, moderate, high
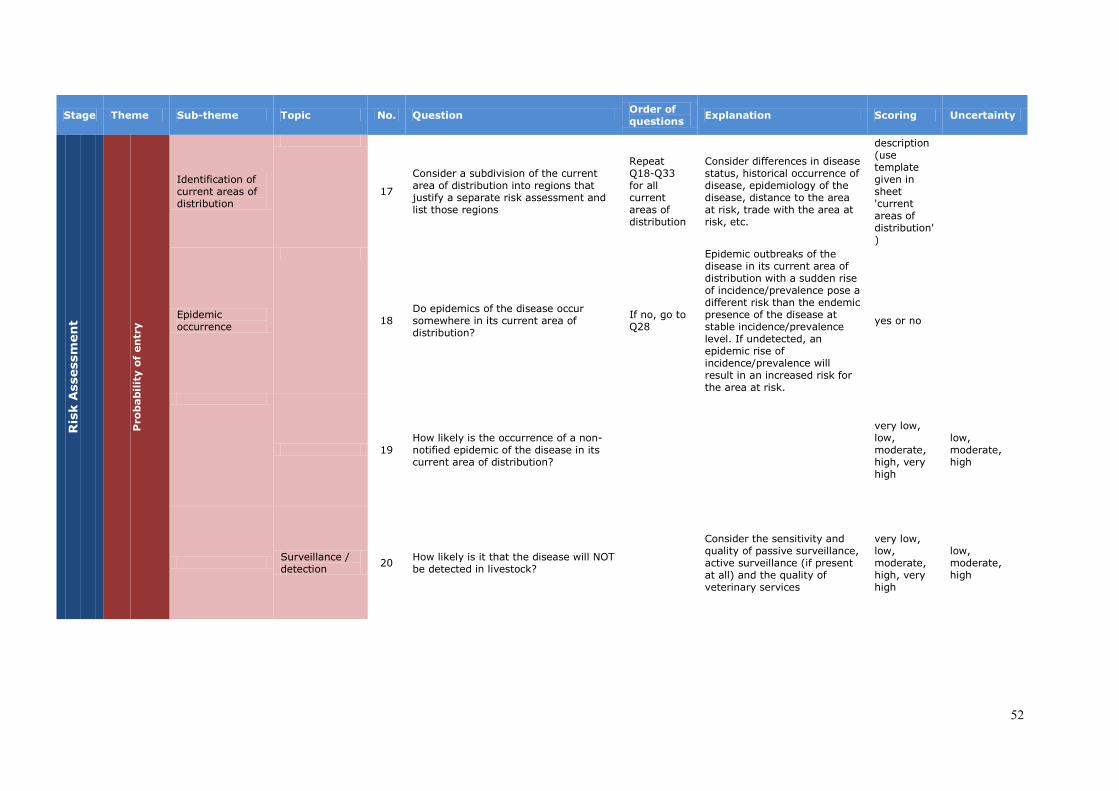
52
Stage Theme Sub-theme Topic No. Question Order of questions Explanation Scoring Uncertainty
Ris
k A
sses
smen
t
Pro
bab
ility
of
entr
y
Identification of current areas of distribution
17
Consider a subdivision of the current area of distribution into regions that justify a separate risk assessment and list those regions
Repeat Q18-Q33 for all current areas of distribution
Consider differences in disease status, historical occurrence of disease, epidemiology of the disease, distance to the area at risk, trade with the area at risk, etc.
description (use template given in sheet 'current areas of distribution')
Epidemic occurrence
18 Do epidemics of the disease occur somewhere in its current area of distribution?
If no, go to Q28
Epidemic outbreaks of the disease in its current area of distribution with a sudden rise of incidence/prevalence pose a different risk than the endemic presence of the disease at stable incidence/prevalence level. If undetected, an epidemic rise of incidence/prevalence will result in an increased risk for the area at risk.
yes or no
19 How likely is the occurrence of a non-notified epidemic of the disease in its current area of distribution?
very low, low, moderate, high, very high
low, moderate, high
Surveillance / detection 20 How likely is it that the disease will NOT
be detected in livestock?
Consider the sensitivity and quality of passive surveillance, active surveillance (if present at all) and the quality of veterinary services
very low, low, moderate, high, very high
low, moderate, high

53
Stage Theme Sub-theme Topic No. Question Order of questions Explanation Scoring Uncertainty
Ris
k A
sses
smen
t
Pro
bab
ility
of
entr
y
21 How likely is it that human disease will NOT result in detection of the disease in animals?
Only answer this question if the disease is zoonotic
Consider also the expected number of human cases and the probability of detection in humans taking into account clinical symptoms and medical care facilities
very low, low, moderate, high, very high
low, moderate, high
22 What is the expected length of the high risk period (HRP)?
The high risk period is defined as the period from first infection till first detection of the disease. Consider Q20 and Q21.
very short, short, moderately long, long, very long
low, moderate, high
23
What number of individual cases of disease will NOT be detected despite surveillance, if in place at all, resulting in underreporting?
Consider Q20 and Q21
minimal, minor, moderate, major, massive
low, moderate, high
Control measures 24
How likely is it that the disease will NOT be controlled despite the applied control measures?
Consider the effectiveness of vaccination, zoning and compartmentalization. Take into account that vaccination might also mask infections
very low, low, moderate, high, very high
low, moderate, high
Incidence/ prevalence 25 How high is the incidence or prevalence
of disease in host animals?
Consider both within-herd and between-herd incidence or prevalence and take into account underreporting (Q23)
very low, low, moderate, high, very high
low, moderate, high

54
Stage Theme Sub-theme Topic No. Question Order of questions Explanation Scoring Uncertainty
Ris
k A
sses
smen
t
Pro
bab
ility
of
entr
y
26 How high is the incidence or prevalence of disease in vectors?
Consider that disease prevalence in vectors is usually < 0.01.
very low, low, moderate, high, very high
low, moderate, high
27 How high is the incidence or prevalence of disease in humans?
Only answer this question if the disease is zoonotic
Consider underreporting due to mild or aspecific clinical symptoms, lack of medical care
very low, low, moderate, high, very high
low, moderate, high
Endemic presence 28 Is disease endemic somewhere in its
current area of distribution? If no, go to Q34 yes or no
Surveillance / detection 29
What number of individual cases of disease will NOT be detected despite surveillance, if in place at all, resulting in underreporting?
Consider the sensitivity and quality of passive surveillance, active surveillance (if present at all) and the quality of veterinary services
minimal, minor, moderate, major, massive
low, moderate, high
Control measures 30
How likely is it that the disease will NOT be controlled despite the applied control measures?
Consider the effectiveness of vaccination, zoning and compartmentalization. Take into account that vaccination might also mask infections
very low, low, moderate, high, very high
low, moderate, high

55
Stage Theme Sub-theme Topic No. Question Order of questions Explanation Scoring Uncertainty
Ris
k A
sses
smen
t
Pro
bab
ility
of
entr
y
Incidence/prevalence 31 How high is the incidence or prevalence
of disease in host animals?
Consider both within-herd and between-herd incidence or prevalence and take into account underreporting (Q29)
very low, low, moderate, high, very high
low, moderate, high
32 How high is the incidence or prevalence of disease in vectors?
very low, low, moderate, high, very high
low, moderate, high
33 How high is the incidence or prevalence of disease in humans?
Only answer this question if the disease is zoonotic
Consider underreporting due to mild or aspecific clinical symptoms, lack of medical care
very low, low, moderate, high, very high
low, moderate, high
Identification of pathways for introduction
34 Consider all relevant pathways for introduction and list them
Repeat Q35-Q43 for all pathways
Consider: (a) Entry of infected live animals (livestock, wildlife, migratory birds, zoo animals, pets); (b) Entry of an infected vector (or its eggs or larvae) by increase of the vector's habitat, by wind, tires, plant materials, transport vehicles, non-susceptible animals and/ or humans, migratory birds, manure, or soil; (c) Import of contaminated biological material (genetic material, serum, plasma, modified live vaccines); (d) Import of contaminated animal products (for consumption, other products, animal by-products); (e) Entry of infected humans
description (use template given in sheet 'pathways for introduction')

56
Stage Theme Sub-theme Topic No. Question Order of questions Explanation Scoring Uncertainty
Ris
k A
sses
smen
t
Pro
bab
ility
of
entr
y
Numbers entering the area at risk
35 What is the total volume of the animals / vectors / commodities / humans moved along the pathway?
Consider frequency, seasonality and batch size
minimal, minor, moderate, major, massive
low, moderate, high
36 How likely is it that vectors (eggs, larvae, adults) are transported along the pathway?
Consider the number of vectors likely to be present on transport vehicles, plant materials, inanimate goods, etc.
very low, low, moderate, high, very high
low, moderate, high
37 Does a seasonal pattern exist in numbers moved along the pathway that results in an increase of the risk?
Consider seasonality in host and vector prevalence in the current area of distribution, and the vector season and adverse season in the area at risk
yes or no
Infection pressure 38 How likely is infection of the host or
vector or contamination of the product?
Consider incidence/prevalence in hosts and vectors, and presence of the pathogen in animal products and biological materials
very low, low, moderate, high, very high
low, moderate, high
39 How likely is it that viable pathogen is still present in the host, vector or product upon arrival in the area at risk?
In other words: how likely is it that the host is still viraemic upon arrival in the area at risk, or that an infected vector survives until arrival in the area at risk, or that the pathogen survives in the animal product or biological material until arrival in the area at risk? Consider the length of the incubation and viraemic period, transportation time, pathogen survival, effects of processing, storage and transport
very low, low, moderate, high, very high
low, moderate, high

57
Stage Theme Sub-theme Topic No. Question Order of questions Explanation Scoring Uncertainty
Ris
k A
sses
smen
t
Pro
bab
ility
of
entr
y
40 How high is the infection pressure along the pathway? Consider Q38 and Q39
very low, low, moderate, high, very high
low, moderate, high
Regulations 41 To what extent are the relevant pathways subject to regulations?
Consider import regulations such as quarantine, clinical inspection, testing, commodity treatment and vector control
minimal, little, moderately, largely, totally
low, moderate, high
42 How likely is it that the regulations of Q40 will NOT detect or eliminate the infection along the pathway?
Consider import regulations such as quarantine, clinical inspection, testing, commodity treatment and vector control
very low, low, moderate, high, very high
low, moderate, high
Risk per pathway 43 How likely is entry of the pathogen into
the area at risk along the pathway?
Consider numbers moved along the pathway (Q35 and Q36), infection pressure (Q40) and mitigating effects of regulations (Q42)
very low, low, moderate, high, very high
low, moderate, high
Summary 44 Summarize the probability of entry If negligible, stop the RA
Consider Q43 for all pathways description

58
Stage Theme Sub-theme Topic No. Question Order of questions Explanation Scoring Uncertainty
Ris
k A
sses
smen
t
Tran
smis
sion
dyn
amic
s:
Pro
bab
ility
of
tran
smis
sion
Vector 45 What is the distribution of the vector in the area at risk?
Patchy or homogenous
46 What is the vectorial capacity in the area at risk?
Consider vector abundance, life span, biting rate, probability of transmission of infection from vector to host and from host to vector when biting, and extrinsic incubation period in the most favourable period of the year
very low, low, moderate, high, very high
low, moderate, high
Host 47 What is the host density in the area at risk?
Consider both rural and urban areas, housing conditions. Take into account patchy distribution if applicable
very low, low, moderate, high, very high
low, moderate, high
48 How susceptible is the host to infection and how infectious is the host when infected?
Consider host susceptibility, latent period, viraemic period, duration of immunity, morbidity, case fatality rate
very low, low, moderate, high, very high
low, moderate, high
Summary 49 Summarize the probability of transmission (R0)
If negligible, stop the RA. If Q44 and Q49 are both very low, stop the RA
Consider Q45 to Q48. Take into account overlap of vector abundance and host density to determine vector-host ratio in specific areas
description

59
Stage Theme Sub-theme Topic No. Question Order of questions Explanation Scoring Uncertainty
Ris
k A
sses
smen
t
Tran
smis
sion
dyn
amic
s:
Pro
bab
ility
of
esta
blis
hm
ent
50
What is the probability of infection of a first local host given the pathway of entry, the region of entry and the time of entry?
Repeat for all pathways (Q34)
Estimate this probability without taking into account the probability of entry of each pathway. Consider the impact of different regions (high host densities vs. low host densities) and different periods (winter, summer)
very low, low, moderate, high, very high
low, moderate, high
51
What is the probability of onward spread of the pathogen by local vectors to local hosts given the region of entry and the time of entry?
Repeat for all pathways (Q34)
Estimate this probability without taking into account the probability of entry of each pathway. Consider the probability of transmission (Q49), and the impact of different regions (host density, vector abundance and vector-host ratio) and different periods (winter, summer) on the R0 value
very low, low, moderate, high, very high
low, moderate, high
52
What is the probability of establishment of disease given the pathway of entry, the region of entry and the time of entry?
Repeat for all pathways (Q34)
Consider Q43, Q50 and Q51. Remember that these are conditional probabilities.
very low, low, moderate, high, very high
low, moderate, high
Summary 53 Summarize the probability of establishment
If negligible, stop the RA
Consider Q52 for all pathways description
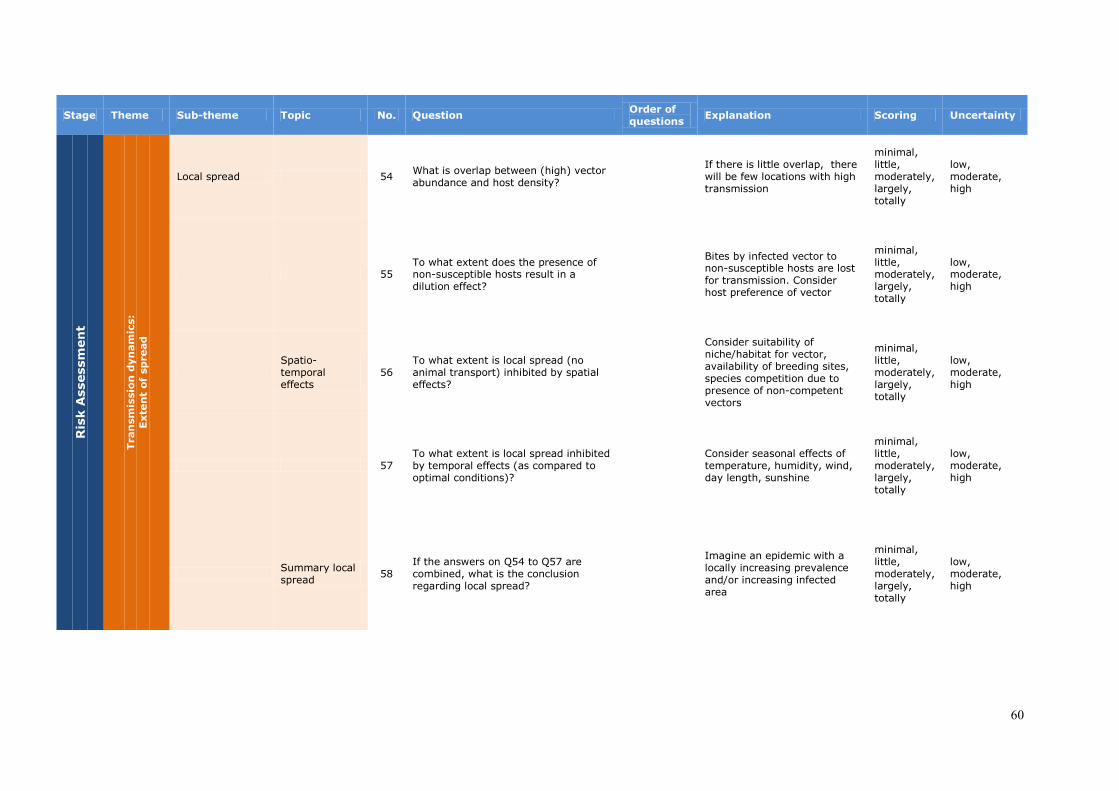
60
Stage Theme Sub-theme Topic No. Question Order of questions Explanation Scoring Uncertainty
Ris
k A
sses
smen
t
Tran
smis
sion
dyn
amic
s:
Exte
nt
of s
pre
ad
Local spread 54 What is overlap between (high) vector abundance and host density?
If there is little overlap, there will be few locations with high transmission
minimal, little, moderately, largely, totally
low, moderate, high
55 To what extent does the presence of non-susceptible hosts result in a dilution effect?
Bites by infected vector to non-susceptible hosts are lost for transmission. Consider host preference of vector
minimal, little, moderately, largely, totally
low, moderate, high
Spatio-temporal effects
56 To what extent is local spread (no animal transport) inhibited by spatial effects?
Consider suitability of niche/habitat for vector, availability of breeding sites, species competition due to presence of non-competent vectors
minimal, little, moderately, largely, totally
low, moderate, high
57 To what extent is local spread inhibited by temporal effects (as compared to optimal conditions)?
Consider seasonal effects of temperature, humidity, wind, day length, sunshine
minimal, little, moderately, largely, totally
low, moderate, high
Summary local spread 58
If the answers on Q54 to Q57 are combined, what is the conclusion regarding local spread?
Imagine an epidemic with a locally increasing prevalence and/or increasing infected area
minimal, little, moderately, largely, totally
low, moderate, high

61
Stage Theme Sub-theme Topic No. Question Order of questions Explanation Scoring Uncertainty
Ris
k A
sses
smen
t
Tran
smis
sion
dyn
amic
s:
Exte
nt
of s
pre
ad
Long-distance spread 59
To what extent does movement of vectors contribute to long-distance spread?
Pay attention to wind, water, movement via wildlife, natural dispersal range of the vector
minimal, little, moderately, largely, totally
low, moderate, high
60 To what extent does movement of hosts contribute to long-distance spread?
Pay attention to relocation (transport, pasturing) of livestock, migration of wildlife
minimal, little, moderately, largely, totally
low, moderate, high
Summary long-distance spread 61
If the answers on Q59 to Q60 are combined, what is the conclusion regarding long-distance spread?
Consider the geographical scale on which the infection can spread by movements of hosts and/or vectors
minimal, little, moderately, largely, totally
low, moderate, high
Surveillance 62 Is surveillance applied to detect the pathogen?
Consider active and passive surveillance, both on vectors and hosts
yes or no
63
How likely is it that the applied surveillance will NOT result in early detection of the presence of the pathogen?
Pay attention to sensitivity of the surveillance system and diagnostics used (clinical inspections, laboratory tests), time to detection of index case
very low, low, moderate, high, very high
low, moderate, high

62
Stage Theme Sub-theme Topic No. Question Order of questions Explanation Scoring Uncertainty
Ris
k A
sses
smen
t
Tran
smis
sion
dyn
amic
s:
Exte
nt
of s
pre
ad
Control measures 64
Name the relevant control measures aiming at vector control and larval control. Evaluate the impact of each on local and on long-distance spread
Pay attention to vector control (insecticides, elimination of breeding sites, larval control)
minimal, little, moderately, largely, totally
low, moderate, high
65
Name the other relevant control measures and evaluate the impact of each on local and on long-distance spread
Pay attention to isolation/quarantine, repellents, movement controls, vaccination, culling, etc.
minimal, little, moderately, largely, totally
low, moderate, high
66 Summarizing, to what extent will spread of the pathogen occur despite the applied control measures?
Consider the effectiveness of measures named at Q64 and Q65
minimal, little, moderately, largely, totally
low, moderate, high
Summary 67 Summarize the expected extent of spread given surveillance and control measures in place
Consider epidemic spread in time (length of epidemic) and space (geographical area of epidemic), and the answers to Q54 to Q66
description
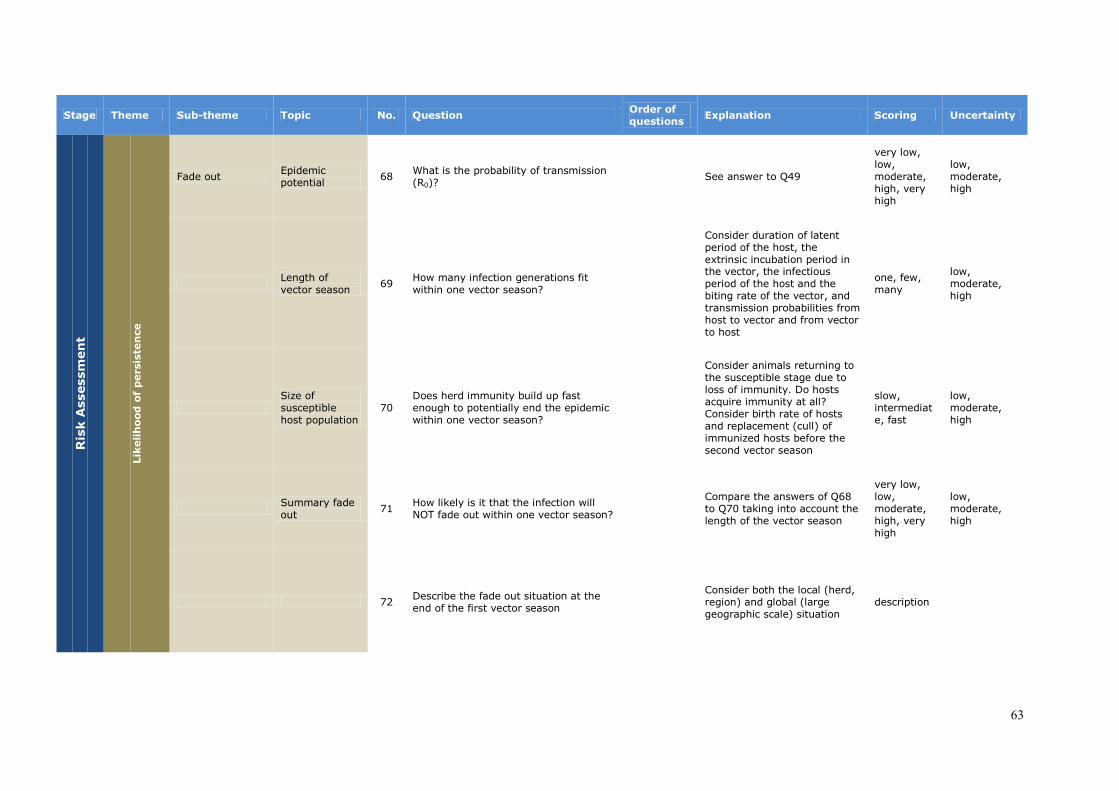
63
Stage Theme Sub-theme Topic No. Question Order of questions Explanation Scoring Uncertainty
Ris
k A
sses
smen
t
Like
lihoo
d o
f p
ersi
sten
ce
Fade out Epidemic potential 68 What is the probability of transmission
(R0)? See answer to Q49
very low, low, moderate, high, very high
low, moderate, high
Length of vector season 69 How many infection generations fit
within one vector season?
Consider duration of latent period of the host, the extrinsic incubation period in the vector, the infectious period of the host and the biting rate of the vector, and transmission probabilities from host to vector and from vector to host
one, few, many
low, moderate, high
Size of susceptible host population
70 Does herd immunity build up fast enough to potentially end the epidemic within one vector season?
Consider animals returning to the susceptible stage due to loss of immunity. Do hosts acquire immunity at all? Consider birth rate of hosts and replacement (cull) of immunized hosts before the second vector season
slow, intermediate, fast
low, moderate, high
Summary fade out 71 How likely is it that the infection will
NOT fade out within one vector season?
Compare the answers of Q68 to Q70 taking into account the length of the vector season
very low, low, moderate, high, very high
low, moderate, high
72 Describe the fade out situation at the end of the first vector season
Consider both the local (herd, region) and global (large geographic scale) situation
description

64
Stage Theme Sub-theme Topic No. Question Order of questions Explanation Scoring Uncertainty
Ris
k A
sses
smen
t
Like
lihoo
d o
f p
ersi
sten
ce
Overwintering strategies
Overwintering in host 73
How likely is persistence of the pathogen in the host during the winter season?
Pay attention to infectious period (distribution) and recrudescence (reactivation of virus in the host)
very low, low, moderate, high, very high
low, moderate, high
74 How likely is vertical transmission of the pathogen in the host?
very low, low, moderate, high, very high
low, moderate, high
75 How likely is it that direct host-to-host transmission of the pathogen leads to overwintering?
Also take into account needles as a direct transmission route
very low, low, moderate, high, very high
low, moderate, high
76 Summarize the probability of the pathogen overwintering in the host
Consider answers to Q73 to Q75
very low, low, moderate, high, very high
low, moderate, high
Overwintering in vector 77
How likely is survival of an infected (adult) vector during the winter season?
Consider abundance of the vector at the start of the winter season, length of the winter season, variability of temperature during the winter season, diapause
very low, low, moderate, high, very high
low, moderate, high
78 Is vertical transmission of the pathogen in the vector possible?
Also consider co-feeding for tick-borne diseases yes or no

65
Stage Theme Sub-theme Topic No. Question Order of questions Explanation Scoring Uncertainty
Ris
k A
sses
smen
t
Like
lihoo
d o
f p
ersi
sten
ce
79 Summarize the probability of the pathogen overwintering in the vector
Consider answers to Q77 and Q78
very low, low, moderate, high, very high
low, moderate, high
Other overwintering strategies
80 How likely is overwintering of the pathogen via other mechanisms?
Consider low (non-zero) vector activity, survival in the environment, survival in a reservoir host (wildlife, rodents), survival of mosquito-borne or midge-borne diseases in ticks
very low, low, moderate, high, very high
low, moderate, high
Summary overwintering 81 How likely is overwintering of the
pathogen?
Consider both overwintering in host (Q76) and vector (Q79) and other overwintering strategies (Q80)
very low, low, moderate, high, very high
low, moderate, high
Summary 82
How likely is persistence of the pathogen in the host and/or vector population over multiple years, resulting in endemicity?
Summarize fade out and overwintering over multiple years
description

66
Stage Theme Sub-theme Topic No. Question Order of questions Explanation Scoring Uncertainty
Ris
k A
sses
smen
t
Imp
act
of d
isea
se
General 83 Describe the effects caused by the pathogen
Distinguish humans, livestock, pets, other vertebrates and the environment. Pay attention to morbidity, mortality and the effect of control measures (Q64 and Q65)
description
Economic consequences
Agricultural effects 84 How severe are direct agricultural
economic losses?
Consider loss of livestock, production losses, increased costs (medication and treatment, surveillance and control costs)
minimal, minor, moderate, major, massive
low, moderate, high
85 How severe are indirect agricultural economic losses?
Consider consequential losses (empty barns), supplying and processing industry (feed companies, slaughterhouses) and trade effects (export ban, price effects)
minimal, minor, moderate, major, massive
low, moderate, high
Human health effects 86 How severe are direct economic losses
due to human disease?
Consider medication and treatment, surveillance and control
minimal, minor, moderate, major, massive
low, moderate, high
87 How severe are indirect economic losses due to human disease?
Consider reduced economic productivity
minimal, minor, moderate, major, massive
low, moderate, high
Side-effects 88 How severe are economic losses due to side-effects?
Consider economic losses in e.g. the tourism sector due to control measures
minimal, minor, moderate, major, massive
low, moderate, high

67
Stage Theme Sub-theme Topic No. Question Order of questions Explanation Scoring Uncertainty
Ris
k A
sses
smen
t
Imp
act
of d
isea
se
Summary 89 Summarize the economic consequences Consider answers to Q84 to Q88
minimal, minor, moderate, major, massive
low, moderate, high
Socio-ethical consequences
Human disease burden 90 How severe is the human disease
burden?
Consider mortality and morbidity (seriousness of symptoms, duration of symptoms (temporary, permanent), long term quality of life)
minimal, minor, moderate, major, massive
low, moderate, high
Animal welfare 91 How severe are consequences for animal welfare?
Consider morbidity and mortality (both livestock and pets), and to movement controls (overcrowded barns)
minimal, minor, moderate, major, massive
low, moderate, high
Morbidity and mortality of pets
92 To what extent do humans suffer due to disease in pets?
Consider loss of well-being due to infected pets (mortality and morbidity)
minimal, minor, moderate, major, massive
low, moderate, high
Culling / Destruction 93
To what extent is culling and/or destruction necessary to control the outbreak?
Consider culling of healthy animals and destruction of animal products
minimal, minor, moderate, major, massive
low, moderate, high
Tourism 94 To what extent do humans suffer from loss of touristic areas?
Consider restricted access to natural areas
minimal, minor, moderate, major, massive
low, moderate, high

68
Stage Theme Sub-theme Topic No. Question Order of questions Explanation Scoring Uncertainty
Ris
k A
sses
smen
t
Imp
act
of d
isea
se
Summary 95 Summarize the socio-ethical consequences
Consider answers to Q90 to Q94
minimal, minor, moderate, major, massive
low, moderate, high
Environmental consequences
Ecological consequences 96 How severe are consequences for
biodiversity?
Consider losses of (vulnerable) wild species, cross-breeding
minimal, minor, moderate, major, massive
low, moderate, high
97 How severe are consequences for nature values?
Consider ecosystem values, habitats
minimal, minor, moderate, major, massive
low, moderate, high
Environmental pollution 98 How severe are consequences of
insecticides used to control vectors? Consider pollution of the environment by insecticides
minimal, minor, moderate, major, massive
low, moderate, high
Summary 99 Summarize the environmental consequences
Consider answers to Q96 to Q98
minimal, minor, moderate, major, massive
low, moderate, high
Summary 100 Summarize impact of disease
Consider economic consequences (Q89), socio-ethical consequences (Q95) and environmental consequences (Q99)
description

69
Annex V: Exemplary tables
These tables can be obtained from the authors in an excel-format.
Question
Current area of distribution
Are
a 1
Are
a 2
Are
a 3
No. Question Order of questions Explanation Scoring
18 Do epidemics of the disease occur somewhere in its current area of distribution?
If no, go to Q28
Epidemic outbreaks of the disease in its current area of distribution with a sudden rise of incidence/prevalence pose a different risk than the endemic presence of the disease at stable incidence/prevalence level. If undetected, an epidemic rise of incidence/prevalence will result in an increased risk for the area at risk.
yes or no
19
How likely is the occurrence of a non-notified epidemic of the disease in its current area of distribution?
very low, low, moderate, high, very high
20 How likely is it that the disease will NOT be detected in livestock?
Consider the sensitivity and quality of passive surveillance, active surveillance (if present at all) and the quality of veterinary services
very low, low, moderate, high, very high
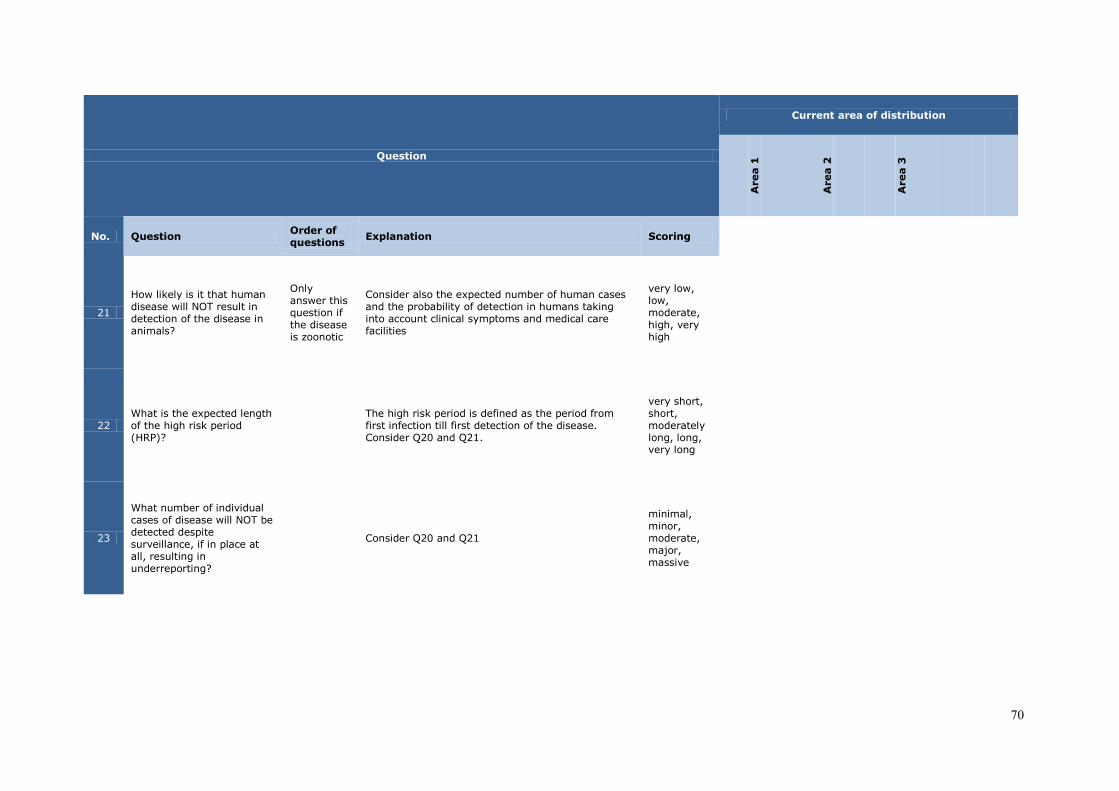
70
Question
Current area of distribution
Are
a 1
Are
a 2
Are
a 3
No. Question Order of questions Explanation Scoring
21
How likely is it that human disease will NOT result in detection of the disease in animals?
Only answer this question if the disease is zoonotic
Consider also the expected number of human cases and the probability of detection in humans taking into account clinical symptoms and medical care facilities
very low, low, moderate, high, very high
22 What is the expected length of the high risk period (HRP)?
The high risk period is defined as the period from first infection till first detection of the disease. Consider Q20 and Q21.
very short, short, moderately long, long, very long
23
What number of individual cases of disease will NOT be detected despite surveillance, if in place at all, resulting in underreporting?
Consider Q20 and Q21
minimal, minor, moderate, major, massive

71
Question
Current area of distribution
Are
a 1
Are
a 2
Are
a 3
No. Question Order of questions Explanation Scoring
24
How likely is it that the disease will NOT be controlled despite the applied control measures?
Consider the effectiveness of vaccination, zoning and compartmentalization. Take into account that vaccination might also mask infections
very low, low, moderate, high, very high
25 How high is the incidence or prevalence of disease in host animals?
Consider both within-herd and between-herd incidence or prevalence and take into account underreporting (Q23)
very low, low, moderate, high, very high
26 How high is the incidence or prevalence of disease in vectors?
Consider that disease prevalence in vectors is usually < 0.01.
very low, low, moderate, high, very high

72
Question
Current area of distribution
Are
a 1
Are
a 2
Are
a 3
No. Question Order of questions Explanation Scoring
27 How high is the incidence or prevalence of disease in humans?
Only answer this question if the disease is zoonotic
Consider underreporting due to mild or aspecific clinical symptoms, lack of medical care
very low, low, moderate, high, very high
28 Is disease endemic somewhere in its current area of distribution?
If no, go to Q34 yes or no
29
What number of individual cases of disease will NOT be detected despite surveillance, if in place at all, resulting in underreporting?
Consider the sensitivity and quality of passive surveillance, active surveillance (if present at all) and the quality of veterinary services
minimal, minor, moderate, major, massive
30
How likely is it that the disease will NOT be controlled despite the applied control measures?
Consider the effectiveness of vaccination, zoning and compartmentalization. Take into account that vaccination might also mask infections
very low, low, moderate, high, very high

73
Question
Current area of distribution
Are
a 1
Are
a 2
Are
a 3
No. Question Order of questions Explanation Scoring
31 How high is the incidence or prevalence of disease in host animals?
Consider both within-herd and between-herd incidence or prevalence and take into account underreporting (Q29)
very low, low, moderate, high, very high
32 How high is the incidence or prevalence of disease in vectors?
very low, low, moderate, high, very high
33 How high is the incidence or prevalence of disease in humans?
Only answer this question if the disease is zoonotic
Consider underreporting due to mild or aspecific clinical symptoms, lack of medical care
very low, low, moderate, high, very high

74
Please consider the pathways for introduction relevant for the pathogen assessed.
The pathways included in this table only provide an example on how to fill out this table.
Question
Pathways for introduction
Vector Host Other
Eggs
Larvae Adults Humans Animals
Mig
rato
ry b
ird
s
Goo
ds
Pla
nts
Goo
ds
Pla
nts
Pla
nts
Act
ive
flig
ht
Pas
sive
flig
ht
Air
craf
t
Sh
ip
Con
tain
ers
Tru
cks
Roa
d t
ran
spor
t
An
imal
tra
de
Mig
ran
ts
Tou
rist
s
Live
stoc
k tr
ade
- le
gal
Live
stoc
k tr
ade
- ill
egal
Mig
rati
on o
f w
ildlif
e
Rod
ents
Exot
ic /
zoo
an
imal
s
An
imal
pro
du
cts
-
lega
l tra
de
An
imal
pro
du
cts
- ill
egal
tra
de
Gen
etic
mat
eria
l (s
emen
, em
bry
os,
ova)
Bio
logi
cal m
ater
ial
(ser
um
)
Vac
cin
es
No. Question Scoring
35
What is the total volume of the animals / vectors / commodities / humans moved along the pathway?
minimal, minor, moderate, major, massive
36
How likely is it that vectors (eggs, larvae, adults) are transported along the pathway?
very low, low, moderate, high, very high
37
Does a seasonal pattern exist in numbers moved along the pathway that results in an increase of the risk?
yes or no
38
How likely is infection of the host or vector or contamination of the product?
very low, low, moderate, high, very high

75
Question
Pathways for introduction
Vector Host Other
Eggs
Larvae Adults Humans Animals
Mig
rato
ry b
ird
s
Goo
ds
Pla
nts
Goo
ds
Pla
nts
Pla
nts
Act
ive
flig
ht
Pas
sive
flig
ht
Air
craf
t
Sh
ip
Con
tain
ers
Tru
cks
Roa
d t
ran
spor
t
An
imal
tra
de
Mig
ran
ts
Tou
rist
s
Live
stoc
k tr
ade
- le
gal
Live
stoc
k tr
ade
- ill
egal
Mig
rati
on o
f w
ildlif
e
Rod
ents
Exot
ic /
zoo
an
imal
s
An
imal
pro
du
cts
-
lega
l tra
de
An
imal
pro
du
cts
- ill
egal
tra
de
Gen
etic
mat
eria
l (s
emen
, em
bry
os,
ova)
Bio
logi
cal m
ater
ial
(ser
um
)
Vac
cin
es
No. Question Scoring
39
How likely is it that viable pathogen is still present in the host, vector or product upon arrival in the area at risk?
very low, low, moderate, high, very high
40 How high is the infection pressure along the pathway?
very low, low, moderate, high, very high
41
To what extent are the relevant pathways subject to regulations?
minimal, little, moderately, largely, totally
42
How likely is it that the regulations of Q40 will NOT detect or eliminate the infection along the pathway?
very low, low, moderate, high, very high

76
Question
Pathways for introduction
Vector Host Other
Eggs
Larvae Adults Humans Animals
Mig
rato
ry b
ird
s
Goo
ds
Pla
nts
Goo
ds
Pla
nts
Pla
nts
Act
ive
flig
ht
Pas
sive
flig
ht
Air
craf
t
Sh
ip
Con
tain
ers
Tru
cks
Roa
d t
ran
spor
t
An
imal
tra
de
Mig
ran
ts
Tou
rist
s
Live
stoc
k tr
ade
- le
gal
Live
stoc
k tr
ade
- ill
egal
Mig
rati
on o
f w
ildlif
e
Rod
ents
Exot
ic /
zoo
an
imal
s
An
imal
pro
du
cts
-
lega
l tra
de
An
imal
pro
du
cts
- ill
egal
tra
de
Gen
etic
mat
eria
l (s
emen
, em
bry
os,
ova)
Bio
logi
cal m
ater
ial
(ser
um
)
Vac
cin
es
No. Question Scoring
43
How likely is entry of the pathogen into the area at risk along the pathway?
very low, low, moderate, high, very high
44 Summarize the probability of entry description
50
What is the probability of infection of a first local host given the pathway of entry, the region of entry and the time of entry?
very low, low, moderate, high, very high
51
What is the probability of onward spread of the pathogen by local vectors to local hosts given the region of entry and the time of entry?
very low, low, moderate, high, very high
52
What is the probability of establishment of disease given the pathway of entry, the region of entry and the time of entry?
very low, low, moderate, high, very high

