pdf, 1 mib - infoscience
TRANSCRIPT

B. Beaude. « City Space, Map Space. From Analogy to Coexistence». in Actes de Futur en Seine 2009. Le futur de la ville numérique, E. Chardronnet (dir.), Cap Digital, 2010.
City Space, Map SpaceFrom Analogy to Coexistence
Boris BeaudeChôros Lab, École Polytechnique Fédérale de Lausanne - Switzerland
Over the past five years, cartographic practices have been profoundly renewed and have mainly been concentrated within large metropolises, where maps are usually found in the subway, in the street (street furniture) or in paperback city guides. ese maps are now available on the Internet and by extension on mobile phones, accompanying individuals as they move from place to place. Augmented by means of egocentering1, telecommunicating and co-production, maps have become much more complex objects, which have changed in terms of role and responsibility. Indeed, the role of the map, as well as its recent evolution, allows a re-evaluation of the opportunities and challenges related to the contemporary urban environment. e map is more than ever a remarkable technical object which can be harnessed for greater mobility and for planning more complex spaces. However, thus augmented, rarely have maps retained their former illusion of being analogous of the space they represent, which increases the risk that we end up shaping cities according to map images, as misleading as they may be.
Evolution of the Map
Maps enhance our potential for action by creating analogies between our spatial representations and the space of our representations, between our spatial intentions and the space of our intentions. e renewal of the map, its digitization, automation, self-localization, personalization and telecommunication thus pose numerous challenges which urge us to control how these analogies are produced. Ignoring such a precaution could lead to a perversion of the map but also of the city as a whole, not to mention its citizens.
It is not only the distance to other realities that is simplified by information technologies, but also our positioning. Position and situation thus pair, intensifying the spatial relationship of individuals to their environments, which is a premise of the renewal of the production of spatial information. e convergence of the digital properties of the map and those of geolocation thus make this a remarkable opportunity to adapt the map to the specific spatial context of its user.
However, the distinction between technical innovation and social innovation is still very present when debating about these issues. A risk which oen arises is the overestimation of
1
1 e center of the map, its orientation and its contents can be tailored to the individual.

the self-capacity of these devices to create meaning. is observation probably explains why the notion of neography, which qualifies this renewal of cartography, remains to academia mainly associated with the geography of information technology and—to an even greater extent—with geomatics. e idea that geography is limited to the localization and the qualification of spatial realities is still commonplace, but it has lile to do with contemporary geography. It refers back to an idiosyncratic geography, the function of which was to describe the Earth's surface, to distinguish territories and to exemplify the unequal distribution of resources. Contemporary geography has a more delicate project to consider: to study the spatial dimension of society, which implies taking space seriously2, and, precisely, to give it meaning. What is at stake is not only the description of our environment, but a beer understanding of it.
erein lies the essential difference between data and what we do with it, between facts and their effects. Facebook's Gross National Happiness index3 or Google's Flu Trends4 only just pave the way. One must not forget that the development of global indexes based simply on user profiles in Facebook or on responses to queries gathered by Google requires the implementation of indicators and models, without which the indexes would not make sense. Beyond Web Squared and neogeography, the idea according to which meaning emerges spontaneously from the massive accumulation of data has garnered considerable interest, as seen in the provocative text of Chris Anderson, e End of eory: e Data Deluge Makes the Scientific Method Obsolete5. Nevertheless, his conclusion deserves to be taken seriously: “ere's no reason to cling to our old ways. It's time to ask: What can science learn from Google?” (Anderson 2008).
From Analogies to Coexistence
What maps really mean has become an even more important issue due to the fact that the renewal of cartographic representation also triggers a re-apprehension of our relationship to space. By seeking maps which are ever more digital, it seems that a process of transduction6 (Dodge et al. 2005), linked to urban activities and practices, is gradually shiing the city from background coded space to Code/Space7; that is to say, from a space where technology is only an accessory to a space where it is an indispensable component. is is what Adam Greenfield also warns us of, without specifically considering the map, when he insists on the tendency of technologies to become ubiquitous and gradually merge into our environment (Greenfield 2006). In 2008, he applied this argument to a synthetic urban perspective when he suggested that information technologies brought a considerable historical depth to the city (e long here)
HyperUrbain.2 : Deuxième colloque sur les Technologies de l’Information et de la Communication en milieu urbain
2
2 It is a maer of considering space as a specific component of the social. In this, it would not be a product of the other social dimensions (economic, historical, psychological, etc.), but one of the dimensions plain and whole, without which the world would be less readable.
3 hp://blog.facebook.com/blog.php?post=150162112130, hp://apps.facebook.com/gnh_index/
4 hp://www.google.org/flutrends/
5 hp://www.wired.com/science/discoveries/magazine/16-07/pb_theory
6 Ontogenetic approach to space proposed by Martin Dodge and Rob Kitchin.
7 ese two concepts, with that of Coded Space, are part of the three categories of space according to the terms of their relationship to the immaterial technological information (Code) proposed by Martin Dodge and Rob Kitchin.

and a remarkable quantity of instantaneous local information (e big now)8.
It is in the ambit of its intense articulation through information networks that the city transforms itself lile by lile, if not morphologically for now, at least in its representations and gradually in the practices that shape it. It is not only the city’s potential for interaction that is thereby increased, but also its readability. In this respect it is essential that together we consider the deployment of these technologies as well as what coproduced and automatic maps have to offer. Surely, authorship by multiple authors does not always imply that these maps are reliable (Monmonier 1991) or objective. ey may even tend to be intrusive and expose particular points of view that are unfounded or unwanted.
Increasing the Potential of the City
e most important issue to us probably remains the ability of dynamic maps to increase the potential of the city. Density and diversity maximize social interaction (Lévy 1994), but paradoxically cause the city to be characterized by an internal distance and a significant opacity. Most of the city’s potentiality is not grasped because it is unrecognized and too restrictive. Furthermore, the main aribute of a city, anonymity, oen implies an ignorance of one’s surroundings. Relationships are oen bound according to other logics (work colleagues, friends, family, etc.), which disregard topographical proximity. e city indeed allows a rich social life without necessarily geing to meet the neighbors. It is this quality which, since the Middle Ages, makes us believe that an air of freedom blows through the streets of cities: the freedom to choose whom to become acquainted with and what to do, without having to justify one’s choices.
e fact remains that internal distances are important and that our environment can be full of potential experiences we do not know about. e map, and by extension the variety of services that are enhanced by spatial information, are specifically intended to make the city more accessible. Google Maps, especially, is one of a type which offers background maps, as well as lavishly dense information (subway stations, restaurants, stores, photos, videos, etc.). Such tools foster the coproduction of spatial information by citizens and present a remarkable opportunity to increase the quality and the relevance of the maps thus produced.
By promoting crowdsourcing9, it is no longer a question of a few individuals suggesting what is of interest to the masses, but for the masses—via the expression of their views—to produce more accurate, diverse and unique representations. Never has it been as easy to gauge the potential of urbanity and, provided that we feel like it, to grasp the courage—perhaps—to update it. Information technologies, by virtualizing the map, make the city less virtual. ey allow a reconciliation of personal affinities and proximity, remarkably renewing the very notion of neighborhood10 .
Nevertheless, the ability of the city to produce unexpected and fruitful encounters or discoveries seems to be significantly affected by such devices. is reading of serendipity and
Espace de la ville, espace de la carte de l’analogie à la coexistence
3
8 hp://www.liconference.com/long-here-big-now
9 Crowdsourcing is the expression which best summarizes the production process delegated not to a defined group, but to the whole of the population. It was proposed in 2006 by Jeff Howe (Wired) to describe Web 2.0 during its production.
10 Initiatives such as Peuplade (in large French cities) or La Ruche (in Rennes) were specifically designed to boost community life and make affinities and proximities converge.

more advanced spatial technologies dedicated to city visibility is still partly erroneous. Even though it is more difficult to get lost, rarely do individuals who are uncomfortable with space leave themselves the freedom to wander, leading to practices and discoveries that would not have taken place without such a safety net. is liberating effect from what may seem at first glance alienating is not unrelated to the holiday resorts which, while they limit contact with locals, also serve as powerful inputs, initiating individuals that, without these safe havens, would never be confronted with unfamiliar spaces (Équipe Mit 2002).
us, it is important to reconsider serendipity without limiting it simply to the moment of the discovery, but in light of what initiated it. e map, enriched by a multitude of individual experiences, adds signs to the city which are more or less meaningful and aractive. Just like a signpost, a noise, a light, a store window or footprints, this information adds to what encourages us to venture into the unpredictable. Serendipity is all the more present for those who are not guided by automatisms and who embrace the freedom to choose among whatever is available “out there”.
Reading Invisible Cities
e map, through all the analogies it offers, makes it possible to situate realities of which large parts are invisible or cannot be apprehended at a glance. Maps are indeed powerful formalizations of the spatial dimension of the social. By situating realities in relation to one another, maps offer a layout that enables us to read a particular spatiality. In this respect, information technologies offer an unprecedented opportunity to make the city more legible. Beyond the potential of visualization and interaction techniques, the profusion of coproduced information by the very same people who live in and invest in a space is also a precious resource, which allows us to perceive spatial practices and representations that until now have been difficult to access. e result is not an accurate representation of what is, but a representation that is based on an exposure of oneself which is not addressed to a researcher in particular11.
Apart from a few exceptions, this potential is, however rarely, exploited beyond experimental purposes. Problematics are oen weak or nonexistent and the greater part of these initiatives is oen glad to rely on the visual effect—sometimes intense—of the spatial representation of this data. In response to Chris Anderson's provocations12 , this urges planners, sociologists, geographers and any other people concerned by representations of the city, to actively invest in this potential, in order to participate in the important renewal of the means available to apprehend invisible cities13. Contemporary urban sociology, in particular, is perfectly aware of the opacity of the most essential component of the city: its representations. Urban morphology, social practices and representations do influence one another reciprocally, but their visibility respectively dwindles as their influence rises (Bassand et al. 2001).
HyperUrbain.2 : Deuxième colloque sur les Technologies de l’Information et de la Communication en milieu urbain
4
11 is condition of observation ensures enquiry conditions of a remarkable quality, as long as we do not forget that the individuals carry out their actions in other fields of constraints. What is important is the exclusion of the researcher in these fields.
12 See above.
13 May this reference to Italo Calvino highlight the existing gap between the richness of the city and the poverty of its cartographic representations, as sophisticated as they may be.

Fig. 1. Metropolitan Police Crime Mapping - December 2009
What Does a Map Show?
Making the invisible visible relies on a process of representation that suggests a construction of the represented space. Cartography, from this point of view, is no exception, as it requires compromises that should be more explicit. What is represented? What relationship exists between what is represented and what represents? What is omied? Why use some colors rather than others? Why use statistical discretization? Why use a given scale? Why this projection rather than another? Numerous are the questions which remind us of the reductionism necessary to put space onto a map. However, we trust maps to faithfully represent reality (according to the “reality effect”; Barthes), which tricks us into believing that the map really is what it represents. e power of such analogies implies that the map merges with what it depicts, to the point of being a remarkable vehicle of spatial representation. is figurative power is such that it ends up being a milestone for other phenomena, like the image one has of one's own country, even though it’s physically impossible to see an entire country at a glance. Indeed, it is essentially to the map that we owe our coherent representation of countries or even of the world.
From this point of view, René Magrie warned us not to confuse an image with what it represents (“e Treachery of Images” 1929). “is is not a pipe,” a line added to the canvas to remind us of the illusion that we indulge in, perfectly sums up the treachery of images. e map is just as insidious. Not only is it not the space it represents, but it is also the subject of abstract representations, which provides a double illusion: a first analogy between the represented space and the map that represents it, and a second between what is represented and its representation. For example, a crime map of London shows London, but also criminality. Whereas this map is not London, the representation of criminality corresponds much less to actual criminality, the statistical indicator of which is subject of to a reduction of
Espace de la ville, espace de la carte de l’analogie à la coexistence
5

such an extent that it sometimes has lile to do with what it claims to report. e Metropolitan Police Crime Mapping14 , for example, suggests high criminality concentrated in the center of London (Fig. 1). However, this representation is essentially based on a series of statistical biases, criminality actually being comparatively low there (Beaude 2009).
Mapumental15, an innovative pilot project undertaken by the English non-profit association mySociety16, is another significant example of the tension between the “reality effect” of spatial representations and the limits of what they report. It is an interactive map that dynamically refreshes according to the criteria considered to be determinant for the localization of housing (Fig. 2). e criteria used in the experimental version are the travel time to arrive at 9 o'clock in the reference zone, the cost of land and the “scenicness” of the place. Many sources were used to make this map: OpenStreetMap for the background, Traveline17 data from the National Public Transport Data Repository for commuting times (October 2008 version), the Land Registry for England and Wales18 for land prices (between January 2008 and March 2009) and ScenicOrNot19 for the appeal factor.
is last source, the most subjective, is a site that was developed specifically for Mapumental by the mySociety association. It is based on the collective evaluation of the “scenicness” of the places from georeferenced photographs20 . By the end of 2009, ScenicOrNot was using a lile over 217,000 photographs from this database, of which nearly 180,000 had received at least three votes (threshold used by mySociety to avoid exceptional evaluations). e data covers exactly 95% of the territory, according to a grid made up of 1 km2 cells.
Bending over the construction of this map makes one observe that it was not simple to make. Since there is no standard definition to the “scenicness” of an image, appreciations vary from one individual to another and it is not surprising to observe that the average score of photographs, 4.56 out of 10, does not mean much. e average coefficient of variation for the evaluations of each image is 0.371, whereas it is 0.372 between images. is means that the variations between ratings given to a sole picture and between the average marks of each image are extremely similar.
HyperUrbain.2 : Deuxième colloque sur les Technologies de l’Information et de la Communication en milieu urbain
6
14 hp://maps.met.police.uk/
15 hp://mapumental.channel4.com/
16 hp://www.mysociety.org/
17 hp://www.pti.org.uk/repository.htm
18 hp://www.landreg.gov.uk/houseprices/
19 hp://scenic.mysociety.org/
20 e photographs are from the database Geograph British Isles, which brings together more than 1.5 million photographs made available and georeferenced voluntarily by users of this site: hp://www.geograph.org.uk/

Fig. 2. Mapumental - MySociety.org - December 2009
is is a remarkable example of the risks of the consensual taste approach: results sometimes leading to an image that has no meaning because it aributes local values that have very close internal and external heterogeneities. If one adds to this approximation the arbitrary choice of a photograph to represent 1 km2, the unequal evaluation of each image (from 3 to 162 votes for an average of 5.39) and the limits of the other indicators (such as travel time that does not take into account the automobile) it clearly appears that the reading of these images requires great caution, even though we are tempted to indulge in the synthetic strength of their representation.
ere are many examples that require caution, given that the automation of representation, as with the Metropolitan Police Crime Mapping of London or Mapumental, brings absolutely no guarantee of conformity between what is represented and its representation. Such images are nonetheless very representative of the spatial representations of the city, these kinds of images being one of the main initiators of theses representations.
Mapumental is an initiative which is all the more interesting and exemplary because it explicitly exposes a majority of its weaknesses21. It distinguishes itself thanks to the richness, the transparency and the creativity of its approach, which combines a plurality of sources and methods that contribute substantially to the readability of the city.
Espace de la ville, espace de la carte de l’analogie à la coexistence
7
21 mySociety essentially develops open platforms, for which the data is freely accessible. Without access to this data, we would not have been able to perform the calculations presented above. ey were made based on all votes (scripted PHP on 960,000 votes).e data relative to the ScenicOrNot project is available at the following address: hp://scenic.mysociety.org/votes.tsv
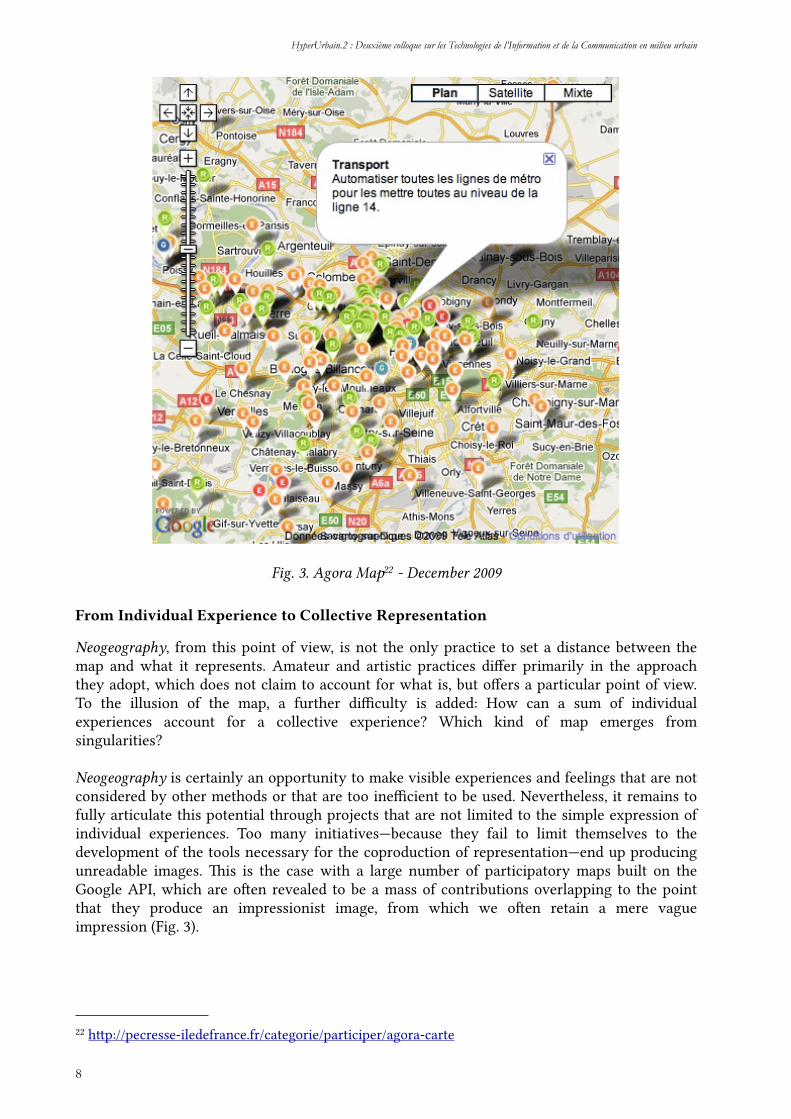
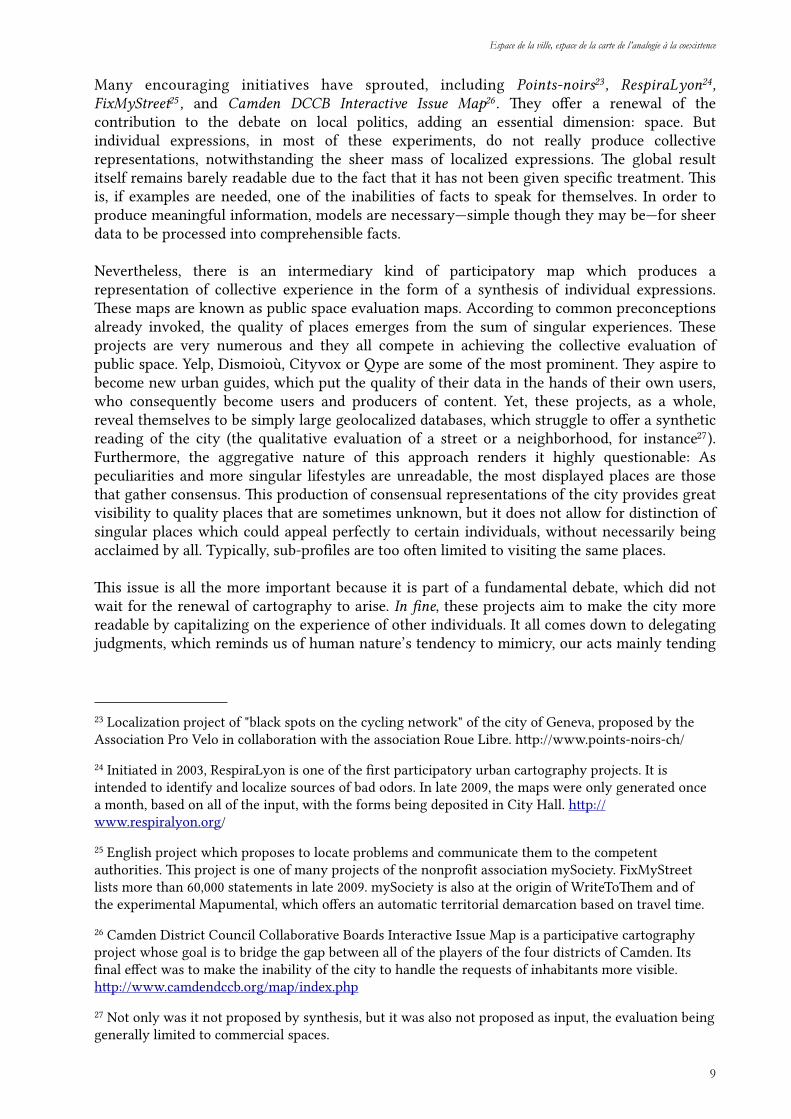
Fig. 3. Agora Map22 - December 2009
From Individual Experience to Collective Representation
Neogeography, from this point of view, is not the only practice to set a distance between the map and what it represents. Amateur and artistic practices differ primarily in the approach they adopt, which does not claim to account for what is, but offers a particular point of view. To the illusion of the map, a further difficulty is added: How can a sum of individual experiences account for a collective experience? Which kind of map emerges from singularities?
Neogeography is certainly an opportunity to make visible experiences and feelings that are not considered by other methods or that are too inefficient to be used. Nevertheless, it remains to fully articulate this potential through projects that are not limited to the simple expression of individual experiences. Too many initiatives—because they fail to limit themselves to the development of the tools necessary for the coproduction of representation—end up producing unreadable images. is is the case with a large number of participatory maps built on the Google API, which are oen revealed to be a mass of contributions overlapping to the point that they produce an impressionist image, from which we oen retain a mere vague impression (Fig. 3).
HyperUrbain.2 : Deuxième colloque sur les Technologies de l’Information et de la Communication en milieu urbain
8
22 hp://pecresse-iledefrance.fr/categorie/participer/agora-carte
Many encouraging initiatives have sprouted, including Points-noirs23 , RespiraLyon24, FixMyStreet25 , and Camden DCCB Interactive Issue Map26. ey offer a renewal of the contribution to the debate on local politics, adding an essential dimension: space. But individual expressions, in most of these experiments, do not really produce collective representations, notwithstanding the sheer mass of localized expressions. e global result itself remains barely readable due to the fact that it has not been given specific treatment. is is, if examples are needed, one of the inabilities of facts to speak for themselves. In order to produce meaningful information, models are necessary—simple though they may be—for sheer data to be processed into comprehensible facts.
Nevertheless, there is an intermediary kind of participatory map which produces a representation of collective experience in the form of a synthesis of individual expressions. ese maps are known as public space evaluation maps. According to common preconceptions already invoked, the quality of places emerges from the sum of singular experiences. ese projects are very numerous and they all compete in achieving the collective evaluation of public space. Yelp, Dismoioù, Cityvox or Qype are some of the most prominent. ey aspire to become new urban guides, which put the quality of their data in the hands of their own users, who consequently become users and producers of content. Yet, these projects, as a whole, reveal themselves to be simply large geolocalized databases, which struggle to offer a synthetic reading of the city (the qualitative evaluation of a street or a neighborhood, for instance27). Furthermore, the aggregative nature of this approach renders it highly questionable: As peculiarities and more singular lifestyles are unreadable, the most displayed places are those that gather consensus. is production of consensual representations of the city provides great visibility to quality places that are sometimes unknown, but it does not allow for distinction of singular places which could appeal perfectly to certain individuals, without necessarily being acclaimed by all. Typically, sub-profiles are too oen limited to visiting the same places.
is issue is all the more important because it is part of a fundamental debate, which did not wait for the renewal of cartography to arise. In fine, these projects aim to make the city more readable by capitalizing on the experience of other individuals. It all comes down to delegating judgments, which reminds us of human nature’s tendency to mimicry, our acts mainly tending
Espace de la ville, espace de la carte de l’analogie à la coexistence
9
23 Localization project of "black spots on the cycling network" of the city of Geneva, proposed by the Association Pro Velo in collaboration with the association Roue Libre. hp://www.points-noirs-ch/
24 Initiated in 2003, RespiraLyon is one of the first participatory urban cartography projects. It is intended to identify and localize sources of bad odors. In late 2009, the maps were only generated once a month, based on all of the input, with the forms being deposited in City Hall. hp://www.respiralyon.org/
25 English project which proposes to locate problems and communicate them to the competent authorities. is project is one of many projects of the nonprofit association mySociety. FixMyStreet lists more than 60,000 statements in late 2009. mySociety is also at the origin of WriteToem and of the experimental Mapumental, which offers an automatic territorial demarcation based on travel time.
26 Camden District Council Collaborative Boards Interactive Issue Map is a participative cartography project whose goal is to bridge the gap between all of the players of the four districts of Camden. Its final effect was to make the inability of the city to handle the requests of inhabitants more visible. hp://www.camdendccb.org/map/index.php
27 Not only was it not proposed by synthesis, but it was also not proposed as input, the evaluation being generally limited to commercial spaces.

to reproduce pre-existing practices28. e Enlightenment, the era when humanity rose to the ability of individuals to "use their understanding without the authority of another" (Kant 1784, §1), is at present confronted with the delegation of understanding not to a supreme or transcendental authority, but to the "immanence" of the consensus of individual experiences. Should we see this as the dramatic outcome of a lapse of perceptiveness or, on the contrary, as the prolongation of a humanist movement which has found the very expression of its emancipation? is is what Gabriel Tarde would have had us assume, at the end of the nineteenth century, when he showed that imitation, far from undermining individuality, is on the contrary the premise of social innovation. Because imitation never really equates to duplication, it could be a powerful engine for evolution, each individual aspiring to emulate existing practices according to his or her personal requirements. Tarde therefore summarizes: “us, repetitions engender variations” (Tarde 1890, p.7).
Sousveillance29
e convergence of information technology and mapping, from the moment it involves more and more individuals, also questions the flow of information and the respect of privacy. It questions the traces le by individuals and what is made of these traces. In this respect, the usage of these new representations implies an ability to avoid not only the insignificant smoothing of consensual indicators, but also, paradoxically, the unequal exposure of disaggregated and sometimes individualized data.
is paradox between the freedoms of the Enlightenment and the indoctrinations of modernity recalls Michel Foucault’s warning: He describes the human sciences as instruments of disciplinary power, and heterotopia as the corresponding spatiality (prisons, schools, barracks, hospitals, etc.) (Foucault 1975). e framework for action—from the sentencing of punishment to the isolation of individuals—has more recently led to increased preventive control which is not designed to keep an eye on the prisoner, but on all individuals likely to become one. Fieen years aer Discipline and Punish, Gilles Deleuze also explained that heterotopia was no longer marginal. It is now everywhere, as control is spatially distributed (Deleuze 1990). e transition from the prison to the electronic bracelet is only a symptom of this more general shi from a disciplinary society to a society of control. e Internet, which spread to the masses well aer Deleuze formulated his theories, only reinforces this logic with unprecedented intensity. is particular perspective puts to question, under a different light, William Mitchell's conception of what a rhizome is. In 1999, Mitchell said, “Deleuzian terminology is useful here; we might say that the global urban system is becoming less hierarchical and more rhyzomic in character” (Mitchell, 1995).
is hypothesis of decentralized surveillance delegated to all individuals is at the heart of the renewal of cartography which—via the online posting of individual claims or evaluations—comes to placing each individual at the heart of a vast system of spatial control. An abandoned car, a suspicious neighbor or one who has been convicted of sexual offence, a hair in your food… You name it. Anything can be virtually indexed, georeferenced and showcased for the whole world to see.
HyperUrbain.2 : Deuxième colloque sur les Technologies de l’Information et de la Communication en milieu urbain
10
28 "Laziness and cowardice are the reasons why such a large part of mankind gladly remain minors all their lives, long aer nature has freed them from external guidance. ey are the reasons why it is so easy for others to set themselves up as guardians. It is so comfortable to be a minor" (Kant 1784, §2).
29 Sousveillance refers to the opposite French prepositions “sur” and “sous,” which indicate respectively a top and a bottom perspective.

is logic of inverted panoptic forecasts a society which is currently difficult to grasp. e increased transparency of practices and the difficulty of assigning meaning to this transparency require that platforms which ensure circulation and centralization be taken seriously. Surveillance—no longer overarching, but potentially residing within each individual—becomes something similar to what Steve Mann and then Jean-Gabriel Ganascia call “sousveillance” (Ganascia 2009). e panopticon has become a catopticon30, a device by which every person is able to see every other person. is is a broad challenge posed to the society of individuals (Elias 1987). e importance of developing a universal ethic has rarely seemed so obvious, although improbable, since the platforms themselves tend to globalize and to involve individuals in the same world: e World.
Context
Globally, it is the context in which the map is used that must be put to trial. e concentration of basic analogies (background maps) in the hands of a few players poses as many problems as the dispersion of data produced by individuals for a considerable quantity of services, which seldom ensures an explicit and sustainable policy of respect for coproduced data. us dispersed, the services struggle to have a network effect sufficient enough for an offering to emerge within the context of specific or local projects31, their visibility being erased by the few transnational and generalist companies which—with a few close exceptions32 —ensure the convergence of ever-growing data, giving to crowdsourcing a bier taste of revisited outsourcing, leing the world voluntarily produce the wealth of some, the sole compensation to this work being the leisure to benefit from it, without the assurance that it will last33.
To whom does the data belong? How can we ensure that it may be used by other services? What respect is there for privacy? How can we be sure that the traces we leave can be erased? How do we avoid limiting geolocalization to points rather than surfaces? In addition to concerns regarding the quality of images produced, we must also consider the environment in which they are produced and not underestimate the weight that some companies are gathering in the production of spatial analogies. Google, in particular, tends to be omnipresent. Beyond its well-known search service, the extension of Google’s services to background maps (Google Maps, Google Earth), geolocalized data (all of the services that are based on Google Maps), as well as soware and operating systems (Google Chrome, Android), thoroughly emphasizes Google's importance and strategic positioning in this area. e recent announcement of Google's interest in the company Yelp34 has only confirmed the tendency to concentration of
Espace de la ville, espace de la carte de l’analogie à la coexistence
11
30 Term proposed by Jean-Gabriel Ganascia to transpose the panopticon into the concept of sousveillance. is term refers to catoptics, the study of the reflection of light.
31 is phenomenon that holds that the aractiveness of a network increases in a non-linear fashion with the number of its users is called Metcalfe's Law. is rests in fact on a simple premise, according to which the number of possible relations R in a network of n individuals is equal to ½n(n-1), that is ½n2 when n tends to infinity.
32 OSM is one of the exceptions.
33 Wikimapia is a perfect example of a platform whose status is ambiguous. It is based on a principle similar to Wikipedia, but it is a private company that has ownership of the data, while allowing its non-commercial use. is project uses Google Maps as the background map base and Google AdSense as a source of revenue.
34 “Google Said to Be Near a Yelp Deal,” New York Times, 18 December 2009. hp://www.nytimes.com/2009/12/19/technology/companies/19yelp.html

spatial information in the hands of a few biggies, at a rate never witnessed before.
“If we understand what is happening, and if we can conceive and explore alternative futures, we can find opportunities to intervene, sometimes to resist, to organize, to legislate, to plan, and to design,” William Mitchell warned in 1996, when he referred to the city of bits (Mitchell 1996, 24). It is not surprising that this statement, word by word, also applies to the maps of bits.
Since maps depict our existence via spatial analogies, they must be respectful of the realities that they depict. Since they make our existence readable, maps are before all an issue related to the representation of coexistence, which they oen merge with in practice. In this respect, the future of the map is also the one of the city. is is why mapping is a major societal issue and why we should not simply believe in the pertinence of the practices that refer to the automated production of spatial information, without paying aention to the meaning of such analogies.
Bibliography
Anderson, C. «e End of eory: e Data Deluge Makes the Scientific Method Obsolete». WIRED Magazine, June 2008.
Ascher, François. 1995. Métapolis ou l’avenir des villes, Odile Jacob.
Barthes, Roland. 1989 [1969-fr]. « e Reality Effect » in e Rustle of Language, University of California Press, pp. 141-148.
Bassand, Michel, Vincent Kaufmann and Dominique Joye (dir.). 2001. Enjeux de la sociologie urbaine, Presses polytechniques et universitaires romandes.
Beaude, Boris. 2009. “ Crime Mapping, ou le réductionnisme bien intentionné. ”, EspacesTemps.net, 04.05.2009. hp://espacestemps.net/document7733.html
Calvino, Italo. 1972. Invisible Cities. Giulio Einaudi Editore.
Castells, Manuel. 2001. e Internet Galaxy. Oxford University Press.
Claval, Paul. 1981. La logique des villes : Essai d’urbanologie, Litec.
Crampton, Jeremy. 2009. “ Maps 2.0. ”, Progress in Human Geography, vol 33, no1, pp. 91-100.
Deleuze, Gilles. 1990. “ Post-scriptum sur les sociétés de contrôle ”, in G. Deleuze, Pourparlers 1872-1990, Les éditions de Minuit, pp. 240-247.
Dodge Martin and Rob Kitchin. 2005. “Code and the transduction of space”, Annals of the Association of American Geographers, Vol. 95, No. 1, pp. 162-180.
Elias, Norbert. 1991. e Society of Individuals, Basil Blackwell.
Équipe Mit. 2002. Tourisme 1. Lieux communs. Belin.
Fisher, Danyel. 2007. “Papers of the IEEE Information Visualization Conference 2007-Session 4-Geographic Visualization-Hotmap: Looking at Geographic Aention”, IEEE Transaction on Visualisation and Computer Graphics, vol. 13, no6, pp. 1184-1191.
Girardin, Fabien, Francesco Calabrese et al. 2008. “ Digital footprinting: Uncovering tourists with user-generated content”, IEEE Pervasive Computing, vol. 7, n°4, pp. 36–43.
Girardin, Fabien. 2009. Aspects of implicit and explicit human interactions with ubiquitous geographic information. PhD thesis, Universitat Pompeu Fabra. hp://www.girardin.org/fabien/publications/thesis/
Greenfield, Adam. 2006. Everyware: e dawning age of ubiquitous computing. New Riders Publishing.
HyperUrbain.2 : Deuxième colloque sur les Technologies de l’Information et de la Communication en milieu urbain
12

Haklay, Muki, Alex Singleton and Chris Parker. 2008. “Web Mapping 2.0: e Neogeography of the GeoWeb”. Geography Compass, vol. 2, no6, pp. 2011-2039
Joliveau, ierry. 2008. “ Web 2.0 futur du Webmapping avenir de la géomatique ? ”. Géoévenement, Paris
Kant, Emmanuel. 2006 [1784]. ’est que les lumières ?, Mille et une nuits.
Lévy, Pierre. 1999. Collective Intelligence, Mankinds Emerging World in Cyberspace. Perseus.
Lévy, Jacques. 1994. L'espace légitime. Sur la dimension géographique de la fonction politique. Paris, Presses de la Fondation nationale des sciences politiques.
Magrie. 1929. e Treachery of Images. (Painting).
Maguire, David J. 2007. GeoWeb 2.0 and Volunteered GI, Workshop on Volunteered Geographic Information, 13-14 December 2009, Santa Barbara.
Monmonier, Mark. 1991. How to Lie with Maps, University Of Chicago Press.
Nova, Nicolas. 2009. Les médias géolocalisés. FYP éditions.
Sassen, Saskia. 2000. Cities in a World Economy. Pine Forge Press.
Tarde, Gabriel. 2001 (1903). e Laws of Imitation. (transl). H. Holt & Company.
Turner, Andrew and Brady Forrest (dir.). 2008. Where 2.0: e State of the Geospatial Web, O'Reilly Radar Report. hp://radar.oreilly.com/research/where2-report.html
William J. Mitchell. 1996. e city of bits: space, time and the infobahn. e MIT Press.
William J. Mitchell. 1999. “e city of bits Hypothesis”, in Donald A Schön, Bishwapriya Sanyal, William J Mitchell (dir.), High technology and low-income communities : prospects for the positive use of advanced information technology, MIT Press.
Zook, Mahew A. and Mark Graham. 2007. e creative reconstruction of the Internet: Google and the privatization of cyberspace and DigiPlace, Geoforum Vol. 38, no6, pp. 1322–1343.
Espace de la ville, espace de la carte de l’analogie à la coexistence
13