ripened cheeses: the effects of fat modifications on sensory - evira
TRANSCRIPT

RIPENED CHEESES;
THE EFFECTS OF FAT MODIFICATIONS ON SENSORY CHARACTERISTICS AND FATTY ACID COMPOSITION
Tiina-Kaisa Ritvanen
ACADEMIC DISSERTATION
To be presented, with the permission of the Faculty of Agriculture and Foresty, University of Helsinki, for public examination in lecture hall B5,
Viikki, on 15 November 2013, at 12 noon.
Finnish Food Safety Authority Evira Chemistry and Toxicology Unit
and
University of Helsinki
Department of Food and Environmental Sciences
Helsinki 2013

Custos: Professor Tapani Alatossava Department of Food and Environmental Sciences University of Helsinki Helsinki, Finland
Supervisors: Doctor Tiina Putkonen
Chemistry and Toxicology Research Unit Finnish Food Safety Authority Evira Helsinki, Finland
Professor Tapani Alatossava Department of Food and Environmental Sciences University of Helsinki Helsinki, Finland
Reviewers: Professor Luisa Pellegrino
Department of Food, Environmental and Nutritional Sciences University of Milan Milan, Italy
Adjunct professor Mari Sandell Department of Biochemistry University of Turku
Functional Foods Forum Turku, Finland
Opponent: Professor Ylva Ardö
Department of Food Science University of Copenhagen Frederiksberg C, Denmark
ISBN 978-952-225-133-6 (pbk.) ISBN 978-952-225-134-3 (PDF; http://ethesis.helsinki.fi) ISSN 1796-4660 Unigrafia Helsinki 2013

3
ABSTRACT
Fat is a remarkable source of energy in diet. The majority of dietary fat consists of fatty acids, which have a great influence on health. Much attention in nutritional discussion has focused on the saturation of fatty acids in food. Another group of fatty acids with significance to health is trans fatty acids (TFAs). Trans fatty acids resemble saturated fat in a physiological sense but are shown to increase the risk of cardiovascular disease even more than saturated fat. Nevertheless, there are differences in the biological activity of different TFA isomers. The analysis of fatty acids has met an increasing demand for more and more precise identification.
The correlation between saturated fat and cardiovascular diseases found in earlier decades has changed the nutritional recommendations to reduced-fat dairy products. Reduced-fat dairy products are a way of reducing total energy in diet, too. Dairy products may have a modified fatty acid profile if fat sources other than milk are used. Modern methods, with a greater weight on mass spectrometric methods, for fatty acid analysis and the effects of fat on the chemical and sensory characteristics of dairy products are reviewed.
Fat reduction changes the properties of cheese. The aim of the first part of the study was to characterise cheeses on the Finnish market and find out specifically the appealing characteristics of reduced-fat cheeses. The cheeses in the study were Emmental, Edam and Havarti-type cheeses. Chemical composition, sensory profile and consumer liking were studied. Cheese properties and liking were linked to identify the appealing characteristics of different cheeses.
The second part of the study included fatty acid analysis. Dairy products on the market have variable fat sources of vegetable origin. It is known from the literature that hardened vegetable fats may have TFAs, but the current situation on the Finnish market was not known. The aim of the second part of the study was to survey the fatty acid profiles of milk-based dairy products (cheeses, vegetable fat ice creams, and vegetable fat cream substitutes) and spreads and shortenings on the market. Products with reduced-fat or modified fat were included.
Free fatty acids are produced by lipolysis from fat. They have effect on the flavour of cheeses. Lipolysis can be enhanced by homogenisation. The aim of the third part of the study was to validate chromatographic method for free fatty acid analysis from cheese and to study the effect of homogenisation on free fatty acids in Emmental. The content of free fatty acids was joined to the sensory profile to find out if they have impact on flavour in the pilot Emmental cheeses.
This study shows that it is possible to create reduced-fat cheeses with appealing characteristics. The properties influencing liking were slightly different in reduced-fat cheeses than in regular fat cheeses. Generally
4
reduced-fat cheeses were lacking flavour. The liking of reduced-fat cheeses might increase if flavour intensities could be increased. However, it is desirable that flavour intensity is not increased with salt, as this has negative health effects.
The second part of the study shows that several milk-based products and spreads on the Finnish market do not contain remarkable amounts of trans fat. In addition, the fatty acid profiles of the cheeses are shown not to be affected by cheese variety or fat reduction. More interestingly, products have variable amounts of essential fatty acids and n-3 fatty acids. Accurate identification requires good separation between fatty acid isomers. In this study polar and highly polar columns with 60 m or 100 m length were sufficient for cis/trans separation for nutritional purposes. The analysis of fatty acid methyl esters by GC-MSD gave detailed information on fatty acids in dairy food.
Free fatty acids of Emmental cheese were quantitatively analysed by GC-MSD without derivatisation. Internal standards were used to correct for the effect of sample treatment. The method was suitable for cheese and for short- and medium-chain fatty acids. These volatile fatty acids contribute to the flavour of cheese. The homogenisation of cheese milk increased the content of free fatty acids and the intensity of taste in trial cheeses.
The defects, and on the other hand, the appealing characteristics of reduced-fat cheeses were studied. These results contribute to the development of appealing cheeses with reduced-fat content. The survey on fatty acids in dairy-based products gave up-to-date information on products on the market. These results have significance to nutritionists, dieticians, legislators and consumers, as this knowledge was not available before.

5
ACKNOWLEDGEMENTS
This study started at the National Veterinary and Food Research Institute EELA and continued at the Finnish Food Safety Authority Evira. The study includes two joint research projects “Kotimaisten juustojen laatututkimus” and “Kotimaiset kevytjuustot ja kuluttajan valinnat” with Agrifood Research Finland MTT, National Consumer Research Centre KTK, Finnish Food and Drink Industries’ Federation ETL and dairies, that were executed in EELA between 2000 and 2004, one research project with Helsinki University between 2011 and 2012 and one Evira project “Trans-rasvahapot elintarvikkeissa” from 2008 to 2012. Joint research projects were partly financed by the Ministry of Agriculture and Forestry, Finland and partly by dairies. The work executed in Evira did not have external financing. All the partners are gratefully acknowledged for financial support. In addition, Finnish Association for Milk Hygiene and Finnish Society of Dairy Science are acknowledged for financial support.
I wish to express my gratitude to my supervisors Professor Tapani Alatossava and Dr. Tiina Putkonen. Tapani – thank you for always supporting me on my postgraduate studies and bringing me new ideas how to proceed in my research. Tiina – there is not enough words how to describe your support and encouraging enthusiasm in every step of the study.
I appreciate the Head of the Chemistry and Toxicology Unit, Professor Kimmo Peltonen for his great contribution to this work and teaching me the basics of being a researcher.
I want to thank the previous Head of the Research and Laboratory Department, Professor Tuula Honkanen-Buzalski for giving me this valued possibility with great facilities and always believing in me.
For appreciated criticism and constructive comments, the reviewers of this thesis, Professor Luisa Pellegrino and Adjunct Professor Mari Sandell, are thanked.
Dr. Susanna Eerola and Dr. Anna-Maija Lampi, my steering group, are thanked for their ideas and conversations. Without your support especially the last step would have been a lot harder to take. Susanna – you have always been there to help and to encourage me in my career, I can't overestimate your contribution.
I express my warm thanks to my co-authors: Kimmo, Tiina, Tapani, Susanna, MSc Leena Lilleberg, MSc Tuomo Tupasela, Merja Isoniemi, Dr. Tapani Lyytikäinen, Dr. Ulla Suhonen, MSc Soili Vesanen, MSc Kevin Deegan, MSc Noora Heikintalo, Mr. Jyri Rekonen, Professor Esko Uusi-Rauva, Professor Hely Tuorila and Professor Paul McSweeney. It has been a pleasure to co-operate with all of you. Especially I want to thank Soili V. for her valuable work with this study, for teaching me how to work in sensory laboratory and staying as a friend through all these full years. And Leena –

6
you have teached me a lot about sensory science. Thank you for always being ready for conversation when I needed it. I also appreciate the fruitful co-operation with all project partners.
I sincerely thank the personnel at the Chemistry and Toxicology Unit for their help during my work. It has been a delight to work with all of you. Particularly I thank Tiina S., Kuku, Ulla-Maija, Soili N., Soile and Kirsi T. for their help in the laboratory. I would have not survived without you! I appreciate also my other colleagues in the KOLA section for their great company and understanding my absent-mindedness. I hope it has been only temporary. And I want to thank the assessors in the sensory panels, you make the sensory evaluation to reality with your personal contribution.
Finally, dearest thanks go to my family and relatives, especially my husband Jari and our sons Joonas and Saku for your love and support throughout my studies. I also thank my parents and parents-in-law for being there for me. Without your kind help these years would have been a lot harder time for me and my family.
Helsinki, September 2013

7
CONTENTS
Abstract .................................................................................................................. 3
Acknowledgements ................................................................................................ 5
Contents .................................................................................................................. 7
List of original publications ................................................................................. 10
Research input and authorship of articles I-IV .................................................... 11
Abbreviations ....................................................................................................... 12
1 Introduction ................................................................................................. 14
2 Review of the literature ............................................................................... 16
2.1 Fatty acids in food ............................................................................... 16
2.1.1 Chemical aspects .............................................................................. 16
2.1.2 Health aspects .................................................................................. 18
2.1.3 Fatty acids in milk ............................................................................ 22
2.1.4 Fatty acids in plant oils .................................................................... 23
2.1.5 Fatty acids in fish ............................................................................. 24
2.1.6 Other dietary fat sources .................................................................. 25
2.1.7 Factors affecting the choice of fat source ........................................ 26
2.2 Sensory aspects of fat and fatty acids in food ..................................... 26
2.3 Fat modification in dairy products ..................................................... 29
2.3.1 Fat reduction .................................................................................... 29
2.3.2 Fatty acid modification .................................................................... 32
2.4 Analysis of fatty acids ......................................................................... 34
2.4.1 Fat extraction ................................................................................... 34
2.4.2 Fatty acid methyl esters ................................................................... 36
2.4.3 Other derivatives .............................................................................. 36

8
2.4.4 Fractionation of fatty acids ............................................................. 38
2.4.5 Gas chromatographic separation .....................................................39
2.4.6 Fatty acid identification .................................................................. 40
2.4.7 Other analytical methods ................................................................. 41
3 Aims of the study ........................................................................................ 44
4 Materials and methods ................................................................................ 45
4.1 Samples ............................................................................................... 45
4.2 Methods .............................................................................................. 46
4.2.1 Quality scoring ................................................................................ 46
4.2.2 Sensory profile test ........................................................................... 47
4.2.3 Consumer test ................................................................................. 48
4.2.4 Compositional analyses ................................................................... 48
4.2.5 Fatty acid profile ............................................................................. 49
4.2.6 Free fatty acids ................................................................................ 50
4.2.7 Statistical analyses .......................................................................... 50
5 Results .......................................................................................................... 52
5.1 Quality scoring of the commercial cheeses ........................................ 52
5.2 Sensory profile of the cheeses ............................................................. 52
5.3 Consumer tests for the commercial cheeses....................................... 55
5.4 Chemical composition of the commercial cheeses ............................. 56
5.5 Appealing characteristics of the cheeses ............................................ 57
5.6 Fatty acid profiles of the commercial cheeses ................................... 58
5.7 Fatty acid profiles of the spreads, shortenings and vegetable fat dairy products ............................................................................................ 58
5.8 Free fatty acids of the trial Emmental ............................................... 60
6 Discussion ....................................................................................................63
6.1 Methodological and material aspects .................................................63

9
6.1.1 Sensory analysis ............................................................................... 63
6.1.2 Fatty acid analysis ............................................................................ 65
6.2 The impact of fat reduction in dairy foods ......................................... 68
6.3 The impact of fat replacement in dairy foods .................................... 69
6.4 The impact of free fatty acids on cheese flavour ................................ 70
7 Conclusions .................................................................................................. 72
References ............................................................................................................ 74

10
LIST OF ORIGINAL PUBLICATIONS
I T. Ritvanen, S. Lampolahti, L. Lilleberg, T. Tupasela, M. Isoniemi, U. Appelbye, T. Lyytikäinen, S. Eerola and E. Uusi-Rauva, 2005: Sensory evaluation, chemical composition and consumer acceptance of full fat and reduced fat cheeses in the Finnish market. Food Quality and Preference, 16:479-492.
II T. Ritvanen, L. Lilleberg, T. Tupasela, U. Suhonen, S. Eerola, T.
Putkonen, and K. Peltonen, 2010: The characterization of the most-liked reduced-fat Havarti-type cheeses. Journal of Dairy Science, 93:5039-5047.
III T. Ritvanen, T. Putkonen, and K. Peltonen, 2012: A comparative
study of the fatty acid composition of dairy products and margarines with reduced or substituted fat content. Food and Nutrition Sciences, 3:1189-1196.
IV K. Deegan, N. Heikintalo, T. Ritvanen, T. Putkonen, J. Rekonen,
P.L.H. McSweeney, T. Alatossava and H. Tuorila, 2013: Effects of low-pressure homogenization on the sensory and chemical properties of Emmental cheese. Innovative Food Science and Emerging Technologies, 19:104-114.
The publications are referred to in the text by their roman numerals.
11
RESEARCH INPUT AND AUTHORSHIP OF ARTICLES I-IV
I The author took part to the sensory evaluation of the cheeses as a test organiser, participated in statistical handling and wrote the article independently.
II The author took part to the planning and organisation of the
project, organised the chemical analyses, carried out the consumer tests and statistical handling and wrote the article independently.
III The author took part to the planning and organisation of the
project, organised chemical analyses, carried out the fatty acid analyses of vegetable fat ice creams, vegetable fat half creams and creams, carried out statistical handling and wrote the article independently.
IV The author validated the method for free fatty acid analysis at
Evira independently, carried out the free fatty acid analysis of samples, took part in the statistical handling of the results, wrote the methodological part for free fatty acids in the article and took part in the writing of the results and discussion chapters.

12
ABBREVIATIONS
ADHD attention deficit/hyperactivity disorder AHE automated hydrolysis and extraction ALA α-linolenic acid C18:3n-3 amu atomic mass unit ANOVA analysis of variance AOAC Association of Analytical Communities APPI atmospheric pressure photoionization ASE accelerated solvent extraction CHD coronary heart disease CLA conjugated linoleic acid CVD cardiovascular disease DHA docosahexaenoic acid C22:6n-3 DMOX dimethyloxazoline DPS Dairy Products Section EELA Veterinary and Food Research Institute EI electron impact EPA eicosapentaenoic acid C20:5n-3 ESI electrospray ionization FAME fatty acid methyl ester FFA free fatty acid FID flame ionization detector GC gas chromatography GSP generic sensory profiling HPLC high performance liquid chromatography ISO the International Organization for Standardization LA linoleic acid C18:2n-6 LCPUFA long-chain poly-unsaturated fatty acid LOD level of detection LOQ level of quantification MPLS Modified Partial Least Squares MSD mass selective detector MTT MTT Agrifood Research Finland MUFA mono-unsaturated fatty acid ND not detected NIT near infra-red transmittance PCA Principal Component Analysis PLE pressurized liquid extraction PUFA poly-unsaturated fatty acid SFA saturated fatty acid SSE signal suppression or enhancement TBARS thiobarbituric acid reactive substances

13
TFA trans fatty acid UHT ultra-high temperature UV ultraviolet
Introduction
14
1 INTRODUCTION
Food is one of the essential requirements for life. Food should be sufficient, available, safe and nutritious. It is a strong part of our cultural identity, too. Therefore, food security, food safety and food culture are sensitive topics which have engendered hot discussion in all eras. Today, at least in Western countries, food security is at satisfactory level. Besides not being dangerous as a result of toxic compounds, food should be nutritious and enhance our health. We are privileged of being more worried about topics such as individual diets and sensory characteristics.
Science produces more and more information on the effects of diet on health. It is indisputable that dietary fat is essential. Besides providing energy, the fatty acid composition of food has a great influence on health. Much attention has focused on the saturation of fatty acids in food (Astrup et al. 2011). The discussion about saturated fat has been active since the 1970s. At that time the correlation between saturated fat and cardiovascular disease (CVD) was found, thus the aim of nutrition education was to decrease saturated fat in the Finnish diet. However, not all studies show this correlation (Hoenselaar 2012). Even today, researchers are arguing about the significance of saturated fat to human health.
Another group of fatty acids with controversial significance to health are trans fatty acids (TFAs), which have been found to be harmful to health (Remig et al. 2010). They act like saturated fat in the metabolism though they are unsaturated. Trans fatty acids resemble saturated fat in a physiological sense but are shown to increase the risk of CVD even more than saturated fat. Various other diseases have been linked to the intake of TFA, but scientific evidence is strongest for the link between TFA and CVD. Nevertheless, there are differences in the biological activity of different TFA isomers. Industrially produced TFAs have more clearly been shown to be harmful than rumenic TFAs, which are produced in the rumen of ruminants (Walther et al. 2008). Since the evidence is not undisputed, the issue remains active in scientific discussion.
The traditional Northern diet includes a lot of dairy products. The share of milk product calories in diets in 2006 was 16 % in Sweden and 17 % in Finland, which were remarkably higher than the shares of 8 % in Spain and 12 % in USA, for instance (IDF 2011). The correlation between saturated fat and cardiovascular diseases (CVD) found in earlier decades changed the nutritional recommendations to reduced-fat dairy products (VRN 2005). Reduced-fat dairy products are a way of reducing total energy in diet, too. Fat contains approximately twice the amount of energy in grams than carbohydrates. The energy content of food is important, because obesity is a growing problem globally. However, weight management even today is based on the control of energy. Since work in modern society is not as energy-

15
consuming as it was in agricultural society, the energy supply in one’s diet should be adapted accordingly (VRN 2005).
The analysis of fatty acids has met an increasing demand for more and more precise identification of fatty acids. The chemical difference between cis and trans isomers is so minuscule that the separation techniques face great challenges. Although the basics of fatty acid analysis remain the same as in the past decades, up-to-date equipment improve the separation and identification of fatty acids to the level needed for current product specification.
The food industry develops products for modern people. We are busy, we travel a lot and we need more variation in life. We are very health-conscious; yet on the other hand we do not want to compromise on taste and flavour. The food industry releases new food items onto the market to fulfil consumers' expectations. In this situation, it is important to continuously study the nutritional quality of food in everyday food items. In addition, the sensory aspects of food cannot be dismissed.
The aim of this work was to study the nutritional and sensory characteristics of some dairy products, with special attention to cheese and fat. The literature review covers up-to-date nutritional information and sensory aspects of fat as well as the analysis of fatty acids in foods. The study part includes two studies on appealing characteristics of cheese, a study on free fatty acids and their effect on sensory aspects of Emmental and a study on fatty acid profile of dairy products. The data gathered in this study will help in an attempt to improve the sensory quality of reduced-fat cheeses and to evaluate the nutritional quality of some modern dairy products.
Review of the literature
16
2 REVIEW OF THE LITERATURE
2.1 FATTY ACIDS IN FOOD
2.1.1 CHEMICAL ASPECTS
Lipids consist of a broad group of compounds, which are soluble in organic solvents but barely soluble in water. Lipids contain such compounds as tri-, di- and monoacylglycerols, steroids, hormones, fat-soluble vitamins and waxes. Polar lipids interact with water forming aqueous phases while nonpolar lipids do not form lipid-water phases. However, they can form monolayers on a water surface (Larsson 1994). Lipids in food are commonly called fats and oils. The natural fats are characterised by solubility in most of the organic solvents, their oily character and their gravity which is less than that of water (Mehlenbacher 1960). Fats which are in liquid form at room temperature are called oils, while solid ones are fats, but this definition is not precise. Usually, oils are of vegetable origin and fats are of animal origin. In this work term “fat” means lipids in general.
Triacylglycerols (triglycerides) are the main components of neutral fat in food. Triacylglycerols comprise a glycerol molecule esterified with three fatty acid moieties. Fatty acids are nonpolar, aliphatic monocarboxylic acids that can be liberated by hydrolysis from naturally occurring fats (Nawar 1996). Fatty acids are divided into saturated, monounsaturated and polyunsaturated fatty acids according to the amount of double bonds in their hydrocarbon chain. The position of the double bonds is described by omega-X or n-X classification, where the number X after n to the position of the first double bond is calculated from the methyl end of the chain. Positions n-9, n-6, and n-3 are the most common ones in natural fatty acids. Monounsaturated fatty acids have one double bond and polyunsaturated fatty acids have several double bonds, usually 2 to 3, but fatty acids having 6 double bonds are found, too. Branched and odd-numbered fatty acids are found in minor quantities in many foodstuffs. Double bonds in polyunsaturated fatty acids are usually methylene-interrupted (=CH-CH2-CH=), but conjugated fatty acids (=CH-CH=) are also found in meat and milk.
The characteristics of fat in particular food items are primarily dependent on the saturation of fatty acids and their positional (sn-1,2,3) distribution in triacylglycerol. The more saturated the fat, the higher the melting point. In addition, the polymorphic form of the triacylglycerol has an effect. Fats with triacylglycerols in stable β-form have a higher melting point and are denser than fats in α-form (Nawar 1996).
threrahlih2saraco
F
Hastthmcoinp
ca
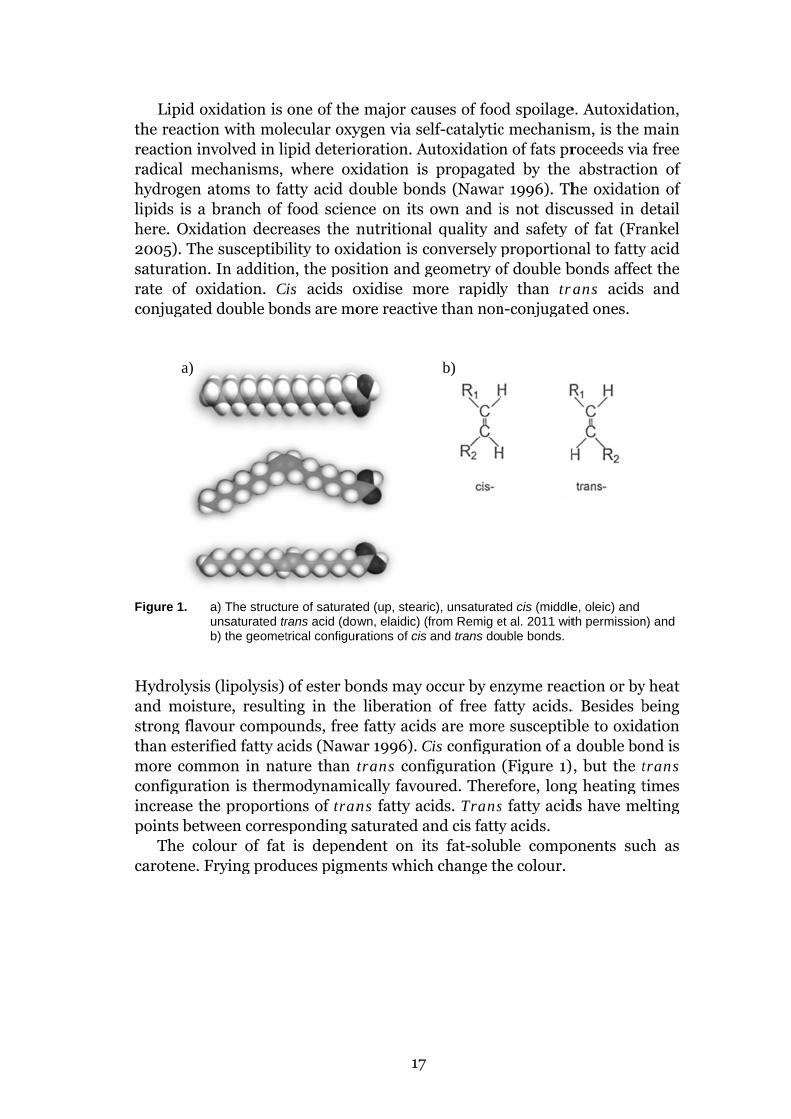
Lipid oxhe reactioneaction invadical mec
hydrogen aipids is a b
here. Oxida005). The aturation. ate of oxionjugated
igure 1. aub
Hydrolysis nd moistutrong flavohan esterif
more commonfigurationcrease the
points betwThe colo
arotene. Fr
a)
xidation is n with molvolved in lichanisms,
atoms to fabranch of ation decresusceptibiIn additio
idation. Cdouble bo
a) The structuunsaturated trb) the geomet
(lipolysis) ure, resultiour compofied fatty acmon in naton is therme proportio
ween corresour of fat rying prod
one of thelecular oxyipid deteriowhere ox
atty acid dfood scieneases the nility to oxidn, the posi
Cis acids onds are mo
ure of saturaterans acid (dowtrical configur
of ester boing in the
ounds, freecids (Nawature than tmodynamions of transponding s
is dependduces pigm
17
e major cauygen via seoration. Au
xidation is double bonnce on its nutritionaldation is cition and goxidise moore reactiv
ed (up, steariwn, elaidic) (frations of cis
onds may oliberation
e fatty acidar 1996). Ctrans confcally favouns fatty ac
saturated adent on it
ments which
uses of fooelf-catalyticutoxidation
propagatends (Nawar
own and il quality a
conversely geometry oore rapidly
ve than non
c), unsaturatefrom Remig eand trans do
occur by enn of free fads are moreCis configurfiguration ured. Thercids. Transand cis fattyts fat-solubh change th
b)
od spoilagec mechanisn of fats pred by the r 1996). This not disc
and safety proportion
of double by than tr
n-conjugate
ed cis (middleet al. 2011 wituble bonds.
nzyme reacatty acids.e susceptibration of a (Figure 1)efore, long
s fatty acidy acids. ble compohe colour.
e. Autoxidasm, is the roceeds via
abstractiohe oxidatiocussed in dof fat (Fra
nal to fattybonds affecrans acidsed ones.
e, oleic) and th permission
ction or by. Besides bble to oxida double bo), but the tg heating tds have me
onents suc
ation, main a free on of on of detail ankel y acid ct the and
n) and
y heat being ation
ond is trans times elting
ch as
Review of the literature
18
2.1.2 HEALTH ASPECTS
The healthiness of a certain fat is mainly dependent on its fatty acid moieties. Fat-soluble components such as cholesterol and fat-soluble vitamins play their role in nutrition, too. There may also be chemical modification during storage and processing. For instance, exposure to oxygen causes oxidation. Oxidation decreases the nutritive value of fat and produces toxic compounds. Heating produces trans fatty acids.
Saturation of fat has been a topic of intense discussion for several decades. Cumulating evidence shows that saturated fat increases the risk of coronary heart diseases (Astrup et al. 2011, Baum et al. 2012). Experts recommend that saturated fat should be replaced by unsaturated fat (Erkkilä et al. 2008), either by all kinds of polyunsaturated fatty acids (PUFAs) (Astrup et al. 2011) or n-3 PUFAs (Kris-Etherton and Innis 2007), although the dietary advice to avoid saturated fatty acids (SFAs) has also been claimed not to reflect the available scientific data (Hoenselaar 2012).
Earlier nutritional studies focused only on the sums of SFAs, monounsaturated fatty acids (MUFAs) and PUFAs in food or diet, and individual fatty acids were not addressed. Nowadays, individual saturated fatty acids are known to have diverse biological effects (Walther et al. 2008). Fatty acids C12:0, C14:0 and C16:0 have been considered the atherosclerotic ones (Kris-Etherton and Innis 2007, Gurr 2009). SFAs may have positive effects on health, too. Short-chain fatty acids acetate C2:0, propionate C3:0 and butyrate C4:0, have been studied for their possible preventive effect on colon cancer (Nkondjock et al. 2003, Hijova and Chmelarova 2007) and cancers at other sites (Parodi 1997).
Food items contain a combination of several saturated fatty acids, therefore practical dietary recommendations cannot be given for individual fatty acids. Furthermore, in dairy products other components may compensate for the negative effect of saturated fat (Walther et al. 2008, Astrup et al. 2011). There might also be interactions between saturated fatty acids and unsaturated fatty acids with nutritive effect, but the issue needs further studies. It can be concluded that the healthiness of a food is inadequately determined solely on the total SFA content.
MUFAs have been considered neither positive nor negative to human health and are thus considered neutral. Baum et al. (2012) concluded that further studies are needed to clarify the effect of a MUFA-rich diet on CVD risk. Likewise Nkondjock et al. (2003) concluded that the evidence on the effect of a major MUFA, oleic acid, on colorectal cancer is unconvincing. MUFAs may still play their role in many disorders, since oleic acid has been shown to increase the absorption of toxic substances (Aspenström-Fagerlund 2012).
Both n-6 and n-3 PUFAs have been indisputably shown to be important for health (Kris-Etherton and Innis 2007). However, there is still a discussion on the relative importance of n-3 and n-6 isomers. It is not clear
19
whether the absolute amounts of these fatty acids are important on their own or does the ratio of n-6/n-3 play a role, too (Griffin 2008, Brenna et al. 2009). Nordic Nutrition Recommendations (EFSA 2010) recommend a ratio of n-6/n-3 of between 3 and 9 for total diet. It has been claimed that it is more important to increase the intake of n-3 long-chain PUFA (LCPUFA) and to decrease the intake of n-6 PUFA, in other words the amounts are more important than the ratio (Erkkilä et al. 2008, Woods and Fearon 2009).
Linoleic acid (LA, C18:2n-6) and α-linolenic acid (ALA, C18:3n-3) are the essential fatty acids, as those fatty acids cannot be synthesised in the human metabolism. They are the parent compounds for n-6 and n-3 families, correspondingly. LA is substantial in numerous oils and fats. The richest sources (more than 50 000 mg/100 g, www.fineli.fi) are sunflower, maize and soybean oil. ALA is less common and is found in highest concentrations (more than 9 000 mg/100 g, www.fineli.fi) in flaxseed, rapeseed and walnut oil. ALA has been shown to reduce the risk of heart attack, to reduce the growth of some tumours, and to lower blood pressure and blood triglyceride levels (Ruiz-Rodriguez et al. 2010). Many studies show that low LA intake is connected to high SFA intake, high cholesterol levels and high incidence of coronary heart disease (CHD) (Seppänen-Laakso et al. 2002). LA (n-6) and ALA (n-3) are competitive in metabolism: a high intake of LA in addition to a low intake of ALA and other n-3 PUFA leads to the reduction of n-3 LCPUFA in tissues and thus may affect health negatively (Brenna et al. 2009).
Sometimes eicosapentaenoic acid (EPA, C20:5n-3) and docosahexaenoic acid (DHA, C22:6n-3) are considered essential fatty acids, too. ALA is a precursor for EPA and DHA, but the ability to synthesise these fatty acids varies and many individuals have been shown to benefit from diet fortification with these fatty acids. The richest natural sources for EPA and DHA are fish oils. EPA and DHA have been studied largely for their positive effects on many disorders such as hypertension, arthritis, inflammatory and autoimmune disorders (Ruiz-Rodriguez et al. 2010), dementia, attention deficit/hyperactivity disorder (ADHD), type I diabetes and infant development (Riediger et al. 2009) and colorectal cancer (Nkondjock et al. 2003). n-3 fatty acids also have some adverse effects. They may cause bleeding and nausea. The consumption of fish may be restricted for a variety of reasons: allergies, dislike of taste, dietary habits and environmental pollutants. The proposed mechanisms for the health benefits of n-3 fatty acids are related to membrane phospholipids. n-3 fatty acids change the fluidity of membrane, enzyme activity, eicosanoid production and gene expressions (Riediger et al. 2009).
Trans fatty acids (TFAs) are unsaturated fatty acids where at least one double bond is on trans configuration instead of the more common cis configuration (Figure 1). They have shown negative health effects similar to saturated fat. They are widely studied for their impact on coronary heart disease risk (Pfeuffer and Schrezenmeir 2006, Remig et al. 2010). Trans fatty
Review of the literature
20
acids influence on cardiovascular health via several potential mechanisms. They affect total serum cholesterol and inflammatory markers such as C-reactive protein and interleukin-6. They have been shown to adversely affect lipoprotein metabolism (Remig et al. 2010). The intake of TFAs is recommended to be as low as possible (EFSA 2010). Individual TFA isomers have differing physiological effects (Pfeuffer and Schrezenmeir 2006). Research has shown that ruminant trans fat may lack the harmful effects of industrially produced trans fat (Walther et al. 2008). Ruminant trans fat may even have a protective effect against CVD (Wang et al. 2012). However, the evidence has been evaluated to be insufficient in several reviews (Pfeuffer and Schrezenmeir 2006, Booker and Mann 2008, Gebauer et al. 2011). The moderate intake of TFAs from a diet high in dairy products is considered safe (Remig et al. 2010).
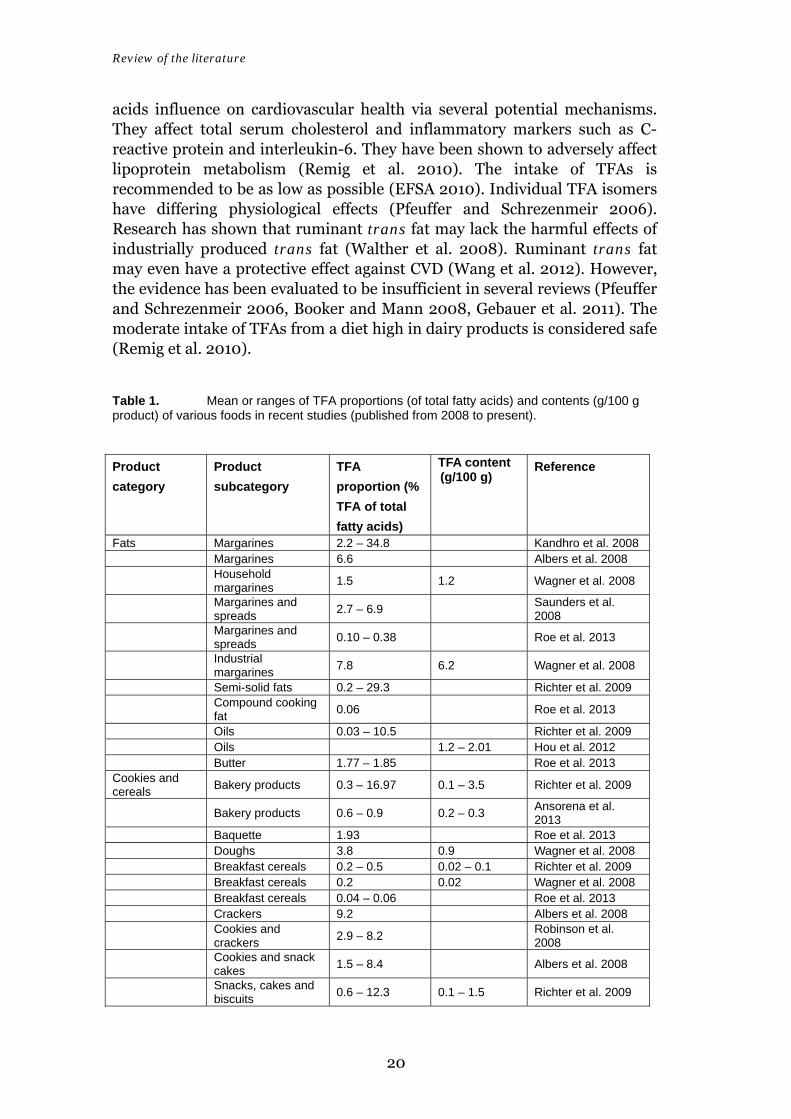
Table 1. Mean or ranges of TFA proportions (of total fatty acids) and contents (g/100 g product) of various foods in recent studies (published from 2008 to present).
Product
category
Product
subcategory
TFA
proportion (%
TFA of total
fatty acids)
TFA content (g/100 g)
Reference
Fats Margarines 2.2 – 34.8 Kandhro et al. 2008 Margarines 6.6 Albers et al. 2008
Household margarines
1.5 1.2 Wagner et al. 2008
Margarines and spreads
2.7 – 6.9 Saunders et al. 2008
Margarines and spreads
0.10 – 0.38 Roe et al. 2013
Industrial margarines
7.8 6.2 Wagner et al. 2008
Semi-solid fats 0.2 – 29.3 Richter et al. 2009
Compound cooking fat
0.06 Roe et al. 2013
Oils 0.03 – 10.5 Richter et al. 2009 Oils 1.2 – 2.01 Hou et al. 2012 Butter 1.77 – 1.85 Roe et al. 2013 Cookies and cereals
Bakery products 0.3 – 16.97 0.1 – 3.5 Richter et al. 2009
Bakery products 0.6 – 0.9 0.2 – 0.3 Ansorena et al. 2013
Baquette 1.93 Roe et al. 2013 Doughs 3.8 0.9 Wagner et al. 2008 Breakfast cereals 0.2 – 0.5 0.02 – 0.1 Richter et al. 2009 Breakfast cereals 0.2 0.02 Wagner et al. 2008 Breakfast cereals 0.04 – 0.06 Roe et al. 2013 Crackers 9.2 Albers et al. 2008
Cookies and crackers
2.9 – 8.2 Robinson et al. 2008
Cookies and snack cakes
1.5 – 8.4 Albers et al. 2008
Snacks, cakes and biscuits
0.6 – 12.3 0.1 – 1.5 Richter et al. 2009

21
Biscuits and cakes ND – 3.5 Saunders et al. 2008
Baby rusks 0.09 Roe et al. 2013
Pies and pastry Pies and pastry 2.1 – 7.1 Saunders et al. 2008
Pies, pasties and coated meat
0.14 – 0.89 Roe et al. 2013
Toaster pastries 3.1 Robinson et al. 2008
Quiche Lorraine 1.07 Roe et al. 2013 Convenience foods
Instant soups 13.8 2.4 Wagner et al. 2008
Canned and instant soups
0.05 – 0.32 Roe et al. 2013
Pizzas 3.7 – 5.7 Tyburczy et al. 2012 Pizzas 1.22 Roe et al. 2013
Pizzas and quick meals
1.1 – 1.8 0.1 - 0.2 Wagner et al. 2008
Cooled ready-to-eat products
4.9 0.3 Wagner et al. 2008
Pasta dishes 4.4 0.1 Wagner et al. 2008 Fast food Chicken nuggets 0.7 – 11.7 Tyburczy et al. 2012 French fries 0.5 – 12.5 Tyburczy et al. 2012 French fries 1.7 0.3 Wagner et al. 2008 Fried and fast food 0.2 – 21.8 0.03 – 2.1 Richter et al. 2009 Pre-fried products 0.6 0.1 Wagner et al. 2008 Hamburgers 2.8 – 5.7 Tyburczy et al. 2012 Hamburgers 2.04 0.3 Wagner et al. 2008 Snacks Popcorn 23.2 Albers et al. 2008 Potato chips 2.4 0.2 Wagner et al. 2008 Potato chips 0.10 – 2.05 Roe et al. 2013
Partially cooked chips
0 – 5.2 Saunders et al. 2008
Chips 5.1 – 12.6 Robinson et al. 2008
Chips 0 Albers et al. 2008
Snack bars ND – 0.8 Saunders et al. 2008
Desserts Desserts 3.4 0.1 Wagner et al. 2008 Apple pies 0.4 – 4.7 Tyburczy et al. 2012 Confectionery 0.10 – 0.53 Roe et al. 2013
Chocolate bars, wafers
0.1 – 2.7 0.04 – 0.6 Richter et al. 2009
Chocolate ND – 3.4 Saunders et al. 2008
Chocolate spreads 0.09 Roe et al. 2013
Chocolate nut spreads
0.64 0.22 Ansorena et al. 2013
Ice creams 0 – 22.9 0 – 1.7 Richter et al. 2009 Ice creams 1.70 – 2.27 Roe et al. 2013
Ice creams, non-dairy
0.25 – 0.55 Roe et al. 2013
Others Baking mixes 4.4 – 15.5 Robinson et al. 2008
Coleslaw 0.07 – 0.12 Roe et al. 2013 Mayonnaise 0.05 Roe et al. 2013
ND=not detected

Review of the literature
22
TFA content in food has been studied extensively with various methods. A summary of recent studies is shown in Table 1. Generally in Europe TFA content in food has been declining in recent decades (Aro 2006, Roe et al. 2013, Ansorena et al. 2013). For instance, Roe et al. (2013) reported that the TFA content of fat spreads (41-62 % fat) had decreased from 6 g/100 g product to less than 0.3 g/100 g product and Ansorena et al. (2013) reported that the same value for bakery products had decreased from 1.20 g/100g product to 0.2 g/100 g product.
Conjugated linoleic acids (CLAs) are a group of C18:2 compounds with conjugated double bonds instead of more common methylene-interrupted double bonds. The isomers C18:2n-7 cis9,trans11 and C18:2n-6 trans10,cis12 are considered biologically active (Collomb et al. 2006). CLAs have been reported for their anti-cancer, anti-diabetic and anti-inflammatory effects, among others (Ruiz-Rodriguez et al. 2010, Gebauer et al. 2011). Nonetheless, in several reviews (Collomb et al. 2006, Kris-Etherton and Innis 2007, EFSA 2010) their beneficial effects were considered not indisputable. Furthermore, negative impacts on health have also been reported. In his review, Park (2009) summed up that several human studies have reported decreased high-density lipoprotein HDL by CLA. He also noted that CLA supplementation has been linked to increased markers of oxidative stress and the net effect on glucose metabolism seems controversial (Park 2009). Therefore, the benefits of CLA supplementation are not clear and need further study, although the natural composition of food is safe.
2.1.3 FATTY ACIDS IN MILK
The most consumed and thus most studied milk is bovine milk. In 2010, global bovine milk production stood at 601 290 000 tonnes, while the production of buffalo milk was second largest with 92 885 000 tonnes and the productions of goat (caprine), sheep (ovine) and other milks were much smaller (IDF 2011). Other milks for human consumption are for example milks from horses (equine), camels and donkeys. Milk is consumed as raw milk without any processing, or after temperature processes such as pasteurisation, after homogenisation or in the production of other dairy products, most commonly butter, cheese, yoghurt and other fermented products. This chapter focuses on bovine milk, because it is by far the most commonly consumed milk in Finland.
The fatty acid composition of milk is affected by several factors, including feed (Palmquist et al. 1993), pasture (Moate et al. 2007), season (Heck et al. 2009), stage of lactation (Palmquist et al. 1993) and genetics, species, breed and individual (Soyeurt and Gengler 2008). While species have a remarkable influence on fatty acid composition, the differences between bovine breeds are less than the differences between individual cows (Palmquist and Jensen
23
2008). The processing of milk in the dairy industry does not have a remarkable influence on the fatty acid composition (Bisig et al. 2007).
Milk fat has more than 400 different fatty acids (Jensen 2002), though the main composition is covered by 14 to 27 fatty acids. Milk fat has an average of 60 % saturated fat, 24 % MUFA and 0.5 % PUFA (Walther et al. 2008). Milk fat is the richest natural source of CLAs, the main isomer being C18:2n-7 cis9,trans11 (Collomb et al. 2006, Park 2009). Milk fat has a lot of short-chain fatty acids, and in addition, various rare branched, odd-numbered and oxo fatty acids in small amounts. Milk fat has ruminant trans fatty acids because of the microbial activity in rumen.
2.1.4 FATTY ACIDS IN PLANT OILS
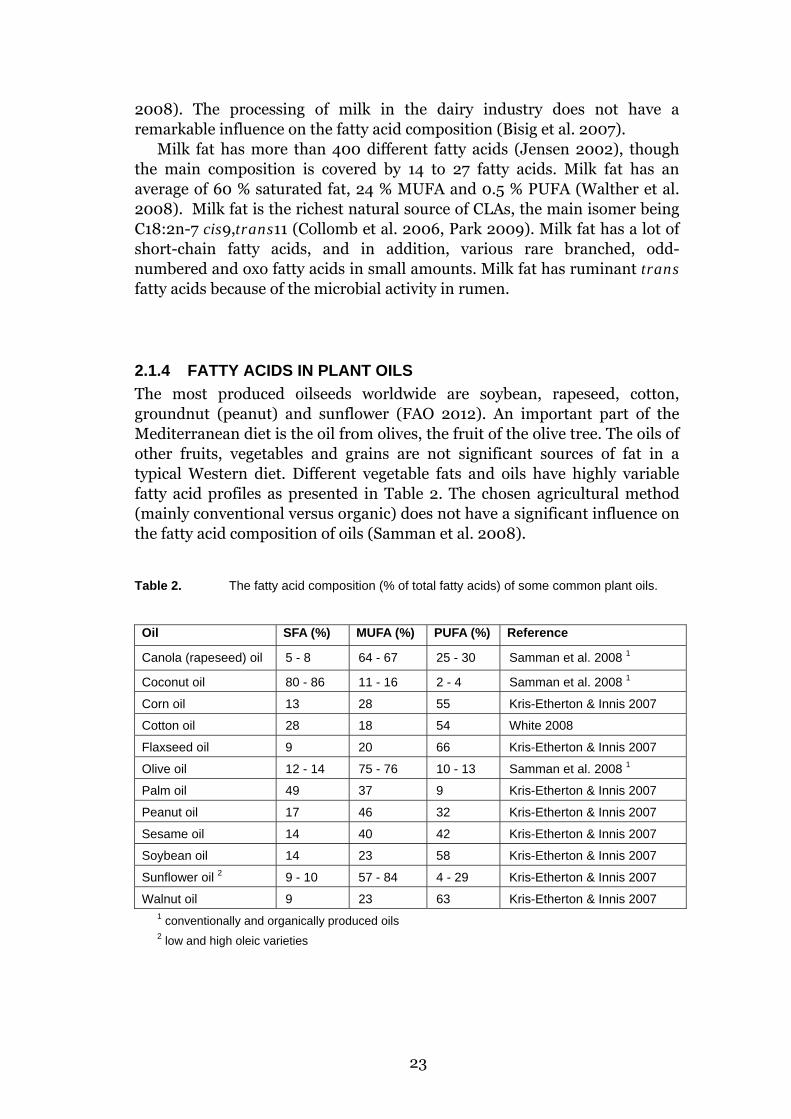
The most produced oilseeds worldwide are soybean, rapeseed, cotton, groundnut (peanut) and sunflower (FAO 2012). An important part of the Mediterranean diet is the oil from olives, the fruit of the olive tree. The oils of other fruits, vegetables and grains are not significant sources of fat in a typical Western diet. Different vegetable fats and oils have highly variable fatty acid profiles as presented in Table 2. The chosen agricultural method (mainly conventional versus organic) does not have a significant influence on the fatty acid composition of oils (Samman et al. 2008).
Table 2. The fatty acid composition (% of total fatty acids) of some common plant oils.
Oil SFA (%) MUFA (%) PUFA (%) Reference
Canola (rapeseed) oil 5 - 8 64 - 67 25 - 30 Samman et al. 2008 1
Coconut oil 80 - 86 11 - 16 2 - 4 Samman et al. 2008 1
Corn oil 13 28 55 Kris-Etherton & Innis 2007
Cotton oil 28 18 54 White 2008
Flaxseed oil 9 20 66 Kris-Etherton & Innis 2007
Olive oil 12 - 14 75 - 76 10 - 13 Samman et al. 2008 1
Palm oil 49 37 9 Kris-Etherton & Innis 2007
Peanut oil 17 46 32 Kris-Etherton & Innis 2007
Sesame oil 14 40 42 Kris-Etherton & Innis 2007
Soybean oil 14 23 58 Kris-Etherton & Innis 2007
Sunflower oil 2 9 - 10 57 - 84 4 - 29 Kris-Etherton & Innis 2007
Walnut oil 9 23 63 Kris-Etherton & Innis 2007 1 conventionally and organically produced oils 2 low and high oleic varieties

Review of the literature
24
Oils have to be compressed or extracted from the plant matrix. This can be done by several methods containing varying amount of processing. For instance, the classification of olive oils according to the oil production method is well-known and has a remarkable economic effect for olive oil producers. Vegetable oils can be used as raw oil, or after refining, deodorisation, hydrogenation and other processing in variable fat products targeted at the food industry.
The use of fluid oils is not practical in spreadable fats without hardening. The hydrogenation needed to harden the oil for margarines and shortenings may influence additional, undesirable changes for the fatty acid profile. The refining of oil may also cause TFA formation (Schwarz 2000). Ceriani and Meirelles (2007) studied the kinetics of TFA formation during deodorisation of canola oil. They found that in addition to time and temperature, the initial concentrations of LA and ALA have an effect on the final TFA concentration.
It is noteworthy, that plant oils do not have trans fatty acids naturally. Trans fatty acids are a well-known negative result of oil processing. TFA content in food and oil during frying was studied by Tsuzuki et al. (2010). They found little impact of frying on TFA intake. The use of hydrogenated fat in fast food restaurants increased TFA content of food (Wagner et al. 2000). However, several studies show that levels of TFAs in food has decreased generally (Leth et al. 2006, Wagner et al. 2008, Saunders et al. 2008, Roe et al. 2013). However, it is noteworthy, that contents exceeding 2 % of total fatty acids are still found around the world (Table 2). Developing countries have remarkable problems with food with a high TFA content (Micha and Mozaffarian 2008).
Denmark was the first and currently the only country to limit the TFA content of vegetable fats by legislation. No more than 2 % of fatty acids is allowed to be TFA in oils and fats of plant origin (Order No. 160 of 11 March 2003 on the content of trans fatty acids in oils and fats). For instance, TFA contents ranging from 1.15 g/100g to 2.01 g/100g were found for commercial soybean, rapeseed, sunflower and corn oil in China (Hou et al. 2012) in the order of increasing content. Hence, only the level of TFA in corn oil slightly exceeded the Danish limit. Richter et al. (2009) found TFA contents ranging from 0.03 % to 10.5 % of total fatty acids for olive, sunflower, peanut, rapeseed and vegetable oils.
2.1.5 FATTY ACIDS IN FISH
The fat content and fatty acid composition of fish is naturally dependent on the species. For instance, 11 Australian fish species have 29-34 % SFAs, 14-22 % MUFAs and 38-47 % PUFAs (Ackman 2008) and nine fish species on the Polish market have 21-42 % SFAs, 9-51 % MUFAs and 18-71 % PUFAs (Usydus et al. 2011) of total fatty acids. Thus fish oil is a significant source of PUFA. Fish oil is specially known for its high long-chain polyunsaturated

25
fatty acids (LCPUFA) content. The most studied LCPUFAs are EPA and DHA for their health effects. For instance, the mean content for EPA+DHA+DPA (C22:5, docosapentaenoic acid) in herring oil is 11 % and in salmon oil 34 % (Kris-Etherton and Innis 2007). The consumption of farmed fish has increased more than the consumption of wild fish. This change in consumption may also cause a change in the intake of certain fatty acids, because farming may change the proportions of fatty acids, depending on the feed (Karapanagiotidis et al. 2006). Farmed fish usually have a higher fat content, therefore it is a better source of n-3 fatty acids as long as the proportions remain the same (Ackman 2008).
2.1.6 OTHER DIETARY FAT SOURCES
Meat fat in general is saturated. Beef tallow has 50 % SFAs, 42 % MUFAs and 4 % PUFAs according to Kris-Etherton and Innis (2007). Tallow consists of the adipose tissue, while muscle has different fatty acid composition. Mean values for some common meats in Finland are presented in Table 3.
The fatty acid composition of meat can be influenced by feeding, more easily in non-ruminant animals (Woods and Fearon 2009, Kouba and Mourot 2011). Díaz et al. (2005) found remarkable differences in the fatty acid composition of lamb meat between countries. They assumed that differences were caused by variable grazing conditions and feeding with concentrate.
Table 3. Fat content (%) and fatty acid composition (% of total fatty acids) of some meats and egg. (www.fineli.fi).
Fat (%) SFA MUFA PUFA TFA
Beef 8 61 29 6 5
Pork 16 41 45 13 1
Lamb 13 52 42 6 0
Chicken 12 25 54 21 1
Moose 3 44 38 19 0
Egg (hen’s) 10 32 50 18 0
The fatty acid content of egg white (albumen) and yolk differ. The yolk has greater importance, since the majority of the fat is in the yolk. The fatty acid content of egg is affected by the hen's diet. Studies have shown the change in the fatty acid profile when diets containing linseed (Petrović et al. 2012) and microencapsulated fish oil (Lawlor et al. 2010) are utilised. Samman et al. (2009) studied the effect of the production method. Organic eggs had slightly more SFAs than conventional eggs, although the difference was unlikely to

Review of the literature
26
have a nutritional effect. In contrast, omega-3 eggs had significantly more PUFA and n-3 fatty acids than conventional and organic eggs in the same study. Reviews by Woods and Fearon (2009) and Kouba and Mourot (2011) are available for further information.
Cereals and vegetables other than oilseeds and nuts are not nutritionally remarkable sources of fat. Vegetables usually contain less than 1 % fat. Cereals comprise 4-5 %, potatoes 0-1 % and vegetables 0-1 % of fat intake for men and women in the national Findiet 2007 survey (KTL 2008). Oats are the fattiest of the cereals. For instance, rolled oats have 7.3 % fat content (www.fineli.fi). The principal fatty acids in cereals are C16:0, C16:1, C18:0, C18:1 C18:2 and C18:3 (Becker 2008). For instance, wheat (whole grain) has 2-3 % fat and the fat contains 56 % C18:2, 25 % C16:0, 12 % C18:1 and 4 % C18:3 of total fatty acids (Becker 2008). The fatty acid composition of endosperm, bran and germ has small differences.
2.1.7 FACTORS AFFECTING THE CHOICE OF FAT SOURCE
The most important factor for a healthy fatty acid profile in diet is the choice of the fat source. The sums of saturated, monounsaturated and polyunsaturated fatty acids have been the main parameters when estimating the healthiness of particular oil. However, flavour characteristics and allergies may restrict consumption. The food industry has to consider the susceptibility to oxidation, a product's shelf life and the price of the raw material.
2.2 SENSORY ASPECTS OF FAT AND FATTY ACIDS IN FOOD
Fat is an important factor in the flavour and texture of food. The term flavour is here understood as the combined sensory experience of smell and taste. Aroma is related to sensory impression of the olfactory bulb due to the volatile odorants of food and texture is related to the tactile sense, sensed either in the mouth or with fingers. The factors contributing to preference for fat are not clear. There is some evidence for an innate component, but the post-ingestive effects of fats have been shown to rapidly and consistently modify the preferences for fat-associated sensory attributes (Mela 1990). Cognitional factors have been shown to modify the preference (Bowen et al. 2003, Day et al. 2012). Endogenous opiates, or endorphins, are implicated in food cravings and their effect on the preference for fat has been studied (Drewnowski 1997). Drewnowski (1997) also concluded that the preference

27
for fat is individual and possibly genetically determined. In other words, the liking of fat is partly a cognitive (learned) consequence.
Stewart et al. (2011) discovered that taste hyposensitivity to oleic acid is associated with greater consumption of fatty foods. They propose that the taste perception system in certain individuals has adapted to the high intake of fat, to become less sensitive. Thus, dietary habits may influence the preference for fat. Mattes (2009) concluded that esterified fatty acids (e.g., triacylglycerol fatty acid moieties) are not an effective taste stimuli even though they carry flavour compounds and impact on texture, whereas free fatty acids may be. He proposes that oral exposure to free fatty acids may serve as a warning signal. Pepino et al. (2012) found out that people differed in their sensitivity to taste both oleic acid and triolein, and furthermore, that this sensitivity was associated with the genetic variant in the fatty acid translocase gene CD36 and lipase inhibition. In other words, the sensitivity to triolein (triacylglycerol) was associated with lingual lipase activity. Their data confirmed that free fatty acid, not triacylglyserol, is the sensed stimulus. Keller et al. (2012) genotyped five common CD36 polymorphisms and studied their correlation to oral fat perception, acceptance of high-fat foods and obesity. They found out that three of the studied polymorphisms were associated with fat detection and preference. Degrace-Passilly and Besnard (2012) summarized in their review, that CD36 and G-protein-coupled receptor gene GPR120 seem to play significant and complementary roles in the perception system for fat. They point out also that it is not clear whether obesity is the cause or the consequence of changes in fat taste sensitivity. In light of current data, some researchers propose that “fatty” is one of the properties perceived by sense of taste.
Fat increases the lubrication properties of milk. Chojnicka-Paszun et al. (2012) concluded that the effect is linear with fat concentrations over 1 %. Above this threshold, the friction coefficient was found to correlate negatively with the sensory evaluated creaminess. Pereira et al. (2006) concluded that added fat (frozen fat for milk recombination) caused the set acid milk gels (model yoghurt) to become firmer, more resistant to penetration, more cohesive, stickier, creamier and less compressive before fracture. They showed that added fat changes the structure of the gel. Phillips et al. (1995) found out that added fat increased the relative viscosity of liquid milk.
Creaminess is generally accepted as a key driver of sensory appeal, the effect repeatedly demonstrated for dairy products (Frøst and Janhøj 2007, Tournier et al. 2007). However, creaminess is a complex attribute involving several senses. Frøst and Janhøj (2007) concluded that texture properties are most decisive for the creaminess in liquid and semi-solid dairy products, but flavour properties contribute more to weak gels like stirred yoghurt. Tournier et al. (2007) concluded that properties underlying creaminess varied among consumers, however consumers mainly associated creaminess with texture and pleasantness. In contrast, Phillips et al. (1995) concluded that the appearance (colour: whiteness, blueness and greenness) contributed to the
Review of the literature
28
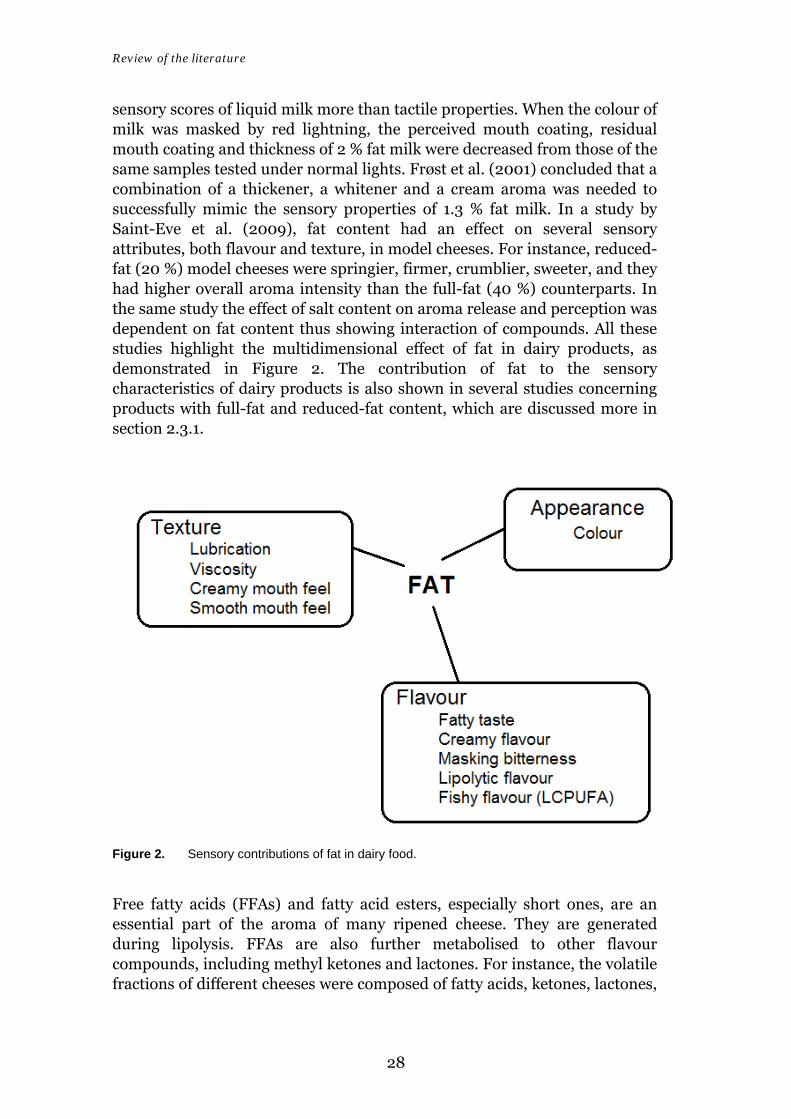
sensory scores of liquid milk more than tactile properties. When the colour of milk was masked by red lightning, the perceived mouth coating, residual mouth coating and thickness of 2 % fat milk were decreased from those of the same samples tested under normal lights. Frøst et al. (2001) concluded that a combination of a thickener, a whitener and a cream aroma was needed to successfully mimic the sensory properties of 1.3 % fat milk. In a study by Saint-Eve et al. (2009), fat content had an effect on several sensory attributes, both flavour and texture, in model cheeses. For instance, reduced-fat (20 %) model cheeses were springier, firmer, crumblier, sweeter, and they had higher overall aroma intensity than the full-fat (40 %) counterparts. In the same study the effect of salt content on aroma release and perception was dependent on fat content thus showing interaction of compounds. All these studies highlight the multidimensional effect of fat in dairy products, as demonstrated in Figure 2. The contribution of fat to the sensory characteristics of dairy products is also shown in several studies concerning products with full-fat and reduced-fat content, which are discussed more in section 2.3.1.
Figure 2. Sensory contributions of fat in dairy food.
Free fatty acids (FFAs) and fatty acid esters, especially short ones, are an essential part of the aroma of many ripened cheese. They are generated during lipolysis. FFAs are also further metabolised to other flavour compounds, including methyl ketones and lactones. For instance, the volatile fractions of different cheeses were composed of fatty acids, ketones, lactones,

29
aldehydes and alkenes in a study by Dirinck and De Winne (1999). In addition, Lawlor et al. (2002) found alcohols, esters and sulphide compounds in eight different ripened cheeses. Some of these compounds are fat-soluble. If the fat content is decreased, their amounts decrease as well, leading to the decrease in flavour intensity and flat flavour. Emmental cheeses have higher concentrations of FFAs than Gouda (Dirinck and De Winne 1999). Mould-ripened cheeses like Camembert have 5 to 10 % of total triglycerides hydrolyfed and up to 20 % are hydrolysed in other blue-vein cheeses (Collins et al. 2003). Lawlor et al. (2002) found that concentrations of two FFA positively correlated with flavour strength in one cheese type. In addition, the piquant flavour of certain Italian cheeses, such as Provolone and Romano, comes from the release of short-chain FFAs (Collins et al. 2003). The excess lipolysis can be considered undesirable and cheeses containing moderate amounts of FFAs may be considered rancid by some consumers (Collins et al. 2003). On the other hand, the typical “Cheddar” aroma of model Cheddar was not affected by FFA removal (House and Acree 2002). It can be concluded that the impact of FFAs on flavour is highly dependent on cheese type. FFAs are also found in milk and other dairy products, but their effect on flavour is highlighted in the products undergoing significant lipolysis. FFAs may contribute indirectly to flavour, too. Homma et al. (2012) found that oleic acid has a bitterness-masking ability in cheese, which is based on binding with the bitter compounds such as hydrophobic peptides. This is a novel aspect of FFA on flavour, which demonstrates the complexity of the flavour forming in food. Free fatty acids are naturally in interaction also with other compounds in food, but these interactions need further studies.
Long-chain PUFAs are typical in fish and indeed, their aroma is often characterised as fishy. This is a problem in certain fortified dairy foods with added EPA or DHA. Fortification is further discussed in section 2.3.2.
2.3 FAT MODIFICATION IN DAIRY PRODUCTS
2.3.1 FAT REDUCTION
Obesity is a growing problem all around the world, not only in Western countries. The fat reduction in total diet has been considered one of the main issues in weight control. It can be achieved by choosing food items with lower fat content and by reducing the fat content of particular food. Dairy products are the most popular reduced-fat choices in the Northern Ireland (Stewart-Knox et al. 2005) and probably in Finland, too but information on consumption of reduced-fat products in Finland is not available. In the Northern Ireland, 72 % of the respondents (n=1004, of which 77.5 % were

Review of the literature
30
female) had purchased more than twice semi-skimmed milk, 60 % had purchased lean minced meat, 55 % reduced-fat spreads and about 50 % low-fat yoghurt (Stewart-Knox et al. 2005).
The use of dairy products is still beneficial. In fact, in an attempt to lose weight, dairy products can be helpful. Astrup et al. (2010) concluded that possible mechanisms are the satiating power of dairy proteins, the increased faecal excretion and the calcium appetite concept. The consumption of dairy products, especially low-fat products, is often connected with a good metabolic health status, sustenance of normal blood pressure (Ralston et al. 2012) and reduced risk for type 2 diabetes (Salas-Salvadó et al. 2011). Astrup et al. (2011) also concluded that low-fat dairy products are part of a healthy diet. The Nordic Nutrition Recommendations are under reconsideration right now, however the draft of the 5th edition (4th batch launched at 29th April for public consultation, http://www.slv.se/en-gb/Startpage-NNR/Public-consultation/) includes a recommendation to consume low-fat dairy products.
Milk and other dairy products are a remarkable source of energy in the Western diet. In Finland, men gain 15-16 % and women 18 % of their energy from dairy products (KTL 2008). Skimmed milk and reduced-fat dairy products are recommended generally for daily consumption (VRN 2005, Kris-Etherton and Innis 2007). In fact, the consumption of products such as reduced-fat cheese has increased in recent decades. However, the consumption of skimmed milk has decreased in 2011 after a long period of growth while the consumption of whole milk has increased (Tike notice, 29.6.2012, www.maataloustilastot.fi/tilasto/14). There are no available statistics on the consumption of reduced-fat cheese and yoghurt, but they are also considered to have decreased over the last few years.
Finnish men and women consume a lot of yoghurt. Working age and elderly men consume 53 and 27 g/day and women 73 and 33 g/day, respectively (KTL 2008). In other words, the consumption was 24 kg per capita in 2011 (Tike notice, 29.6.2012, www.maataloustilastot.fi/tilasto/14). There are non-fat (0.1 % fat), low-fat (usually 2 % fat) and whole milk (3.5-4 % fat) yoghurt varieties on the market. Creamy yoghurt varieties may have 8-15 % fat. Thus the fat content of yoghurt may have an effect on the energy content of the total diet. The acceptability of commercial Labneh (strained yoghurt, popular in the Middle East) decreased when fat content decreased (Kaaki et al. 2012). In the sensory analysis, reduced-fat Labneh products tasted sweeter (use of sweeteners is not mentioned in the article) and had less yellowness and a weaker acidic taste than full-fat counterparts. In contrast, Johansen et al. (2010) studied vanilla yoghurts and found that sweetness increased the acceptance of the reduced-fat yoghurt. Interestingly, high richness only increased the acceptance in the sweetest samples. Tomaschunas et al. (2012) studied the effects of casein-to-whey protein ratio, protein and fat on sensory properties of stirred yoghurt. They found that typical yoghurt attributes (aromatic, sour and astringent flavour), and low
31
intensities of graininess in a non-fat yoghurt could be achieved with an increased casein-to-whey ratio and protein content.
Cheese is a remarkable source of dietary fat, too. The consumption of cheese was 21 kg per capita in 2011 (Tike notice, 29.6.2012, www.maataloustilastot.fi/tilasto/14) in Finland. For instance, full-fat commercial Cheddar cheeses had 30-36 % fat while reduced-fat Cheddar had 19-24 % fat and half-fat Cheddar had 13-18 % fat in a study by Fenelon et al. (2000). Cheeses with as low a fat content as 5 % are on the market in Finland. Modifications to the cheese production parameters are needed to compensate for the loss of fat, otherwise cheese can be rubbery and have a low intensity of typical flavour (Mistry 2001). The changes in sensory properties of cheese have been widely studied in an attempt to produce appealing reduced-fat and low-fat cheese (Banks 2004). The fat content of Cheddar had an effect on buttery, creamy and caramel fat-related sensory attributes in a study by Fenelon et al. (2000). Drake et al. (2010) found reduced-fat and low-fat Cheddar flavour to be rosy/burnt unlike the flavour of its full-fat counterpart; it was bitterer and had lower intensity of milk fat flavour than full-fat cheeses. In addition, low-fat Cheddar had lower intensity of sulphur and higher intensity of whey flavour than other cheeses. In a study by Saint-Eve et al. (2009), fat content had an effect on several sensory attributes, concerning both flavour and texture, in model cheeses. However, reduced-fat cheeses can be as appealing as full-fat cheeses (Ritvanen et al. 2005). Fat reduction in cheese does not cause changes in other nutritional properties of cheese (Ritvanen 2013).
The consumption of butter has increased from 2.5 kg per capita in 2005 to 4.0 kg per capita in 2011 (Tike notice, 29.6.2012, www.maataloustilastot.fi/tilasto/14). The consumption of fat mixtures consisting of butter and vegetable fat had grown from 2.8 kg to 3.0 kg, respectively. Unfortunately there are no statistics on margarine consumption during those years. In 2008 the consumption of margarine was 7.5 kg. Margarines and fat mixtures are considered here as “modified fat butter”. It is assumed that the increase in butter consumption has decreased the consumption of spreads, since they are used in a similar way in households. Fat spreads are a way of reducing energy in diet, because their fat content is usually lower than in butter. Margarines may contain 80-90 %, 60 % or 40 % fat and reduced-fat spreads have less than 41 % fat, while butter has 81 % fat. Spreads with less than 60 % fat are consumed more than spreads with 60 % fat or more (KTL 2008). Finnish men and women gain 14 % and 13 % of energy from fats (fat products), respectively (KTL 2008). Working age men gain 35 % and elderly men 42 % of total SFA from fats (fat products). For women the values are 33 % and 37 %, respectively (KTL, 2008). It can be concluded that the increasing consumption of butter may increase both the intake of energy and SFA.
Ice creams are manufactured with reduced-fat content, too. Aime et al. (2001) studied the texture of ice cream with variable fat content. Low-fat (2.5
Review of the literature
32
%) and fat-free (0.4 %) vanilla ice creams were rated as having lower viscosity, smoothness and mouth coating compared to regular fat (10 %) ice cream. Light (5 %) ice cream was no different from the regular product. In a study by Cadena et al. (2012), the reduction of fat and sugar in vanilla ice creams did not necessarily cause a decrease in acceptance, although sensory attributes were changed. The sensory attributes hydrogenated fat aroma and flavour were responsible for decreased acceptance. Similarly, in a study by Prindiville et al. (1999), low-fat, reduced-fat and non-fat chocolate ice creams were as accepted as regular fat chocolate ice creams despite the differences in the sensory attributes.
2.3.2 FATTY ACID MODIFICATION
Modification of oils and fats is possible in several ways. Rapeseed oil was modified by breeding in the 1970s to decrease the amount of erucic acid (C22:1), which is harmful to human health. It has been shown to cause morphological defects leading to harmful myocardial effects (Deshpande 2002). Canola oil was a trade name for oils from Canadian rapeseed varieties with low erucic acid and glucosinolate content, but is nowadays a generic name for similar varieties in North America and Australia. Since the 1980s, low erucic acid varieties for food production have become universal. The trade validity limit in Finland for erucic acid content in rapeseed varieties is 1 % (MTK 2012). All certified seeds fulfil the requirement.
The hardening processes of oils amount to fatty acid modification. In transesterification, the fatty acids remain the same, only their locations in triglyceride moiety (sn-1,2,3) change. In catalytic hydrogenation, unsaturated fatty acids are transformed to saturated fatty acids. The negative side effect of this process, the formation of TFAs, is largely known. However, the process can be controlled to decrease the formation of TFAs (Schmidt 2000). Nowadays, transesterification is more common than hydrogenation as a hardening method.
Milk and meat fatty acid profiles can be modified as early as in the formation stage, by feed selection and feed fortification. It is relatively easy with monogastric animals, but it is also possible with ruminants (Kouba and Mourot 2011). Fatty acid sources in feed might include fish oil, marine algae, linseed, rapeseed, soya and sunflower seed oil. Novel sources are hemp, chia seed (Salvia hispanica L.), lupin, oats, daisy plant and camelina (Woods and Fearon 2009). The aim is usually to decrease SFA content and increase the content of PUFAs or n-3 fatty acids. Large amounts of unsaturated fat in feed may cause adverse effects such as reduced milk yield, fat and protein concentration, shortened shelf life of the end product and off-flavours (Woods and Fearon 2009).
Jones et al. (2005) studied the properties of dairy products manufactured from CLA-enriched milk. The cows were fed with feed containing fish oil and sunflower oil. The CLA-enriched milk was then used for the manufacture of

33
UHT milk, butter and cheese. All experimental end products contained less SFAs, more CLAs, MUFAs, PUFAs, and n-3 PUFAs than control dairy products. The sensory properties of CLA-enriched products were slightly different to those of control products, but the differences in aroma intensity were not significant. In a study by Nelson and Martini (2009) fish oil in cows’ diet increased the levels of EPA, DHA, and n-3 fatty acids, but did not cause off-flavours in milk. However, the authors suggested that with a higher level of fortification the grassy and rancid off-flavours would become significant. Hurtaud et al. (2010) studied the effect of extruded linseed in cow diet on fatty acid composition of milk and butter properties. The linseed decreased the fat content of milk, increased ALA, MUFA, PUFA and TFA content, and improved texture in the mouth and the spreadability of butter. Flavour attributes were not affected.
The fatty acid profile can be altered by fortification of the dairy product. Oils with more favourable fatty acid composition can be added to the milk before processing into dairy product. For instance, fish oil fortification has a potential to increase the intake of n-3 PUFAs. Kolanowski and Weißbrodt (2007) studied the effects of fish oil fortification on several dairy products. In their study the sensory quality of the dairy products (yoghurt, cream, butter and variable cheeses) decreased as the amount of fish oil increased. The storage stability was affected in cheese but not in butter. On the other hand, the effect of fish oil fortification on sensory quality was lowest in processed cheese. The fishy off-flavour is a usual problem associated with fish oil or LCPUFA fortification. Martini et al. (2009) studied Cheddar with three levels of DHA and EPA fortification. The fishy off-flavour was detected with the highest fortification level, but decreased when cheese was aged 3 months.
The fatty acid composition of the dairy products is drastically altered if the fat source of the product is changed. The product is then referred to an imitation product. Vegetable fat ice creams, vegetable fat cheese imitations, margarines and vegetable fat mixtures are examples of this kind of products on the market. Furthermore, mixed blends containing butter and vegetable fat are popular in Finland (KTL 2008). Bachmann (2001) reviewed the knowledge about cheese analogues. Cheese substitutes, filled cheeses, with partly or totally substituted vegetable fat, have been on the market for several decades in the United States. The nutritional advantage of having less SFA and cholesterol than traditional cheese has increased the market demand. Bachmann (2001) stated that the main barriers for greater market share are the problems with flavour and labelling. The main usage for cheese analogues at that time was as pizza cheese. Cunha et al. (2010) studied the properties of spreadable processed cheese analogue made with vegetable fat. They found that despite the differences in texture, the cheese analogues with 50 % and 25 % vegetable fat were as accepted as traditional cheese. Interestingly, many of the sensory attributes were evaluated to be better in 50 % vegetable fat cheese analogue than in traditional cheese.

Review of the literature
34
2.4 ANALYSIS OF FATTY ACIDS
2.4.1 FAT EXTRACTION
The majority of the procedures for fatty acid analysis start with the extraction of fat from the food matrix. This can be done by traditional fat extraction methods such as the Soxhlet, Mojonnier flasks, Folch or Bligh and Dye methods, of which the Soxhlet method is probably the most commonly used technique (Ruiz-Rodriguez et al. 2010). The Soxhlet method utilises Soxhlet apparatus and solvents, usually petroleum ether or hexane (Ruiz-Rodriguez et al. 2010). Another common method, AOAC 996.06 includes acid hydrolysis and extraction with diethyl ether and petroleum ether in Mojonnier flasks. Acid hydrolysis before extraction enhances lipid hydrolysis and accordingly fatty acid recovery. However, it is not recommended for dairy products, because it may lead to the decomposition of some functional groups and to the isomerisation of CLA (Mossoba et al. 2009). The Folch and Bligh-Dyer methods utilise chloroform and methanol and long reaction times. In the extraction procedure care must be taken not to cause oxidation of fatty acids or cis/trans isomerisation. Isomerisation is an energy craving reaction, therefore it occurs more easily at high temperatures. Procedures allowing low temperatures are preferred and prolonged heating times must be avoided.
The most popular solvent is probably petroleum ether, and it is also recommended by Association of Analytical Communities (AOAC). It is noteworthy that the solvent has an effect on the amount and selection of extracted fatty acids. Different extraction methods also have differences in reagents, extraction times and procedures. Taha et al. (2012) studied the effect of the extraction method used on fatty acids of flaxseed. They found statistical differences in concentrations of individual fatty acids between modified Folch, International Organization for Standardization (ISO) method and low solvent volume AOAC, though quantitatively the differences were very small. Total fatty acid yields were similar. In the same study the oxidation was measured using the thiobarbituric acid test (TBARS). They found that oxidation was lowest in the ISO method in spite of the heating step (Taha et al. 2012). Similarly, Shin et al. (2013) compared the AOAC 996.06, automated Soxhlet and Folch methods for fat recovery and the fatty acid profile of bakery products. They gained the lowest fat content with the AOAC method and in addition, the contents of SFA, MUFA and PUFA were lowest using the same method. The automated Soxhlet method produced higher amounts of SFAs, MUFAs and TFAs than the Folch method for some of the bakery products. These methods utilise different solvents, reagents and procedures, and the AOAC method was the only method with the acid hydrolysis step. Xiao et al. (2012) studied the extraction efficiencies of Soxhlet extraction with petroleum ether, Soxhlet extraction after acid hydrolysis and the Bligh and Dyer method. They analysed the fatty acids

35
from the extraction residues of dried marine powders, and indeed they found fatty acids from the residues of every extraction method. The recovery of Soxhlet extraction was poorest, with recoveries below 50 % in some samples. When adding the acid hydrolysis step, the recoveries were higher. With the Bligh and Dyer method, up to 10% of the fatty acids were left in the residue. They found that unsaturated fatty acids EPA and DHA were particularly low in Soxhlet extracts. Using a reconstructed fatty acid profile (adding the fatty acids analysed from the residue to the fatty acid profile) they could show that the low amount was due to the low extraction efficacy and not a net loss caused by oxidation. It can be concluded that the fat extraction step has an influence on the recovery and on the fatty acid profile. Oxidation is not such a remarkable problem as poor recovery. It is noteworthy that none of the above-mentioned methods succeeded in every comparison. Method performance is undoubtedly dependent on the sample matrix. Therefore the best extraction method cannot be determined generally. The best procedure depends on the sample matrix and the aim of the analysis. And finally, proper method validation is needed to assure the applicability of the method.
The traditional extraction methods need a lot of solvents and are time consuming. Novel extraction methods have been developed to reduce the consumption of solvent and time, and solvent evaporation. Luque de Castro and Priego-Capote (2010) concluded in their review that automated Soxhlet extraction devices are much better than traditional apparatus in many aspects. Their disadvantages are high acquisition costs and lack of versatility. There are several articles on the pressurised liquid extraction (PLE) of fat from different matrices, cereal composite, egg yolk (Schäfer 1998), poultry meat (Gallina Toschi et al. 2003), meat homogenate and nutritional formula after acid and base hydrolysis (Rahmat Ullah et al. 2011). In a review by Ruiz-Rodriguez et al. (2010) it was concluded that results obtained with PLE are comparable to the standard methods. Luthria et al. (2004) concluded that PLE (also known as Accelerated Solvent Extraction, ASE) decreases extraction time and solvent usage, and the recovery is equal or even better than in the traditional method. In addition, the nitrogen atmosphere used in PLE protects oxygen-sensitive compounds such as PUFA. Robinson et al. (2008) utilised the automated hydrolysis and extraction (AHE) method for the fatty acid analysis of cereal products. They concluded that the AHE method was comparable to the standard method AOAC 996.01 and it had increased safety for the operator and decreased solvent requirement. Taha et al. (2012) compared the traditional AOAC (996.06) method with a low volume modification. The methods generated relatively similar yields, only few minor SFA were higher in the traditional method.

Review of the literature
36
2.4.2 FATTY ACID METHYL ESTERS
The extracted fat needs derivatisation in order to analyse fatty acids. The fatty acid moieties must be hydrolysed from the glycerol body by saponification and further esterified. Fatty acid methyl esters (FAME) are by far the most common derivatives for GC analysis. Usually this is done by transesterification. Methods without the fat extraction (one-step extraction and methylation) exist for some matrices, such as marine tissues (Meier et al. 2006), fish muscle, cod liver oil and milk powder (Araujo et al. 2008). The method by Meier et al. (2006) involves direct methylation by methanolic HCl followed by extraction with hexane. The method by Araujo et al. (2008) involves direct methylation by boron trihalide followed by extraction with hexane. Both authors compared the method to the conventional method and found no significant differences in fatty acid profiles of the samples. It can be assumed that similar direct esterification methods will gain popularity in the future.
Base-catalysed reaction is a widely used esterification method. It is a transesterifying reaction suitable for many kind of foods. NaOMe, NaOH and KOH are the most commonly used basic catalysts. Other possibilities are acid-catalysed esterification using methanolic HCl or H2SO4, or boron trihalide (BF3 or BCl3) in methanol (Christie 1989). Some methods are capable of esterifying both bound and free fatty acids, while others are more selective. For instance, sodium methoxide NaOMe is selective to lipid-bound fatty acids and BF3 esterifies both lipid-bound and free fatty acids (Christie 1989). Esterification by diazomethane is rapid at room temperature (Seppänen-Laakso et al. 2002) but methanolic HCl is slow. The disadvantages of diazomethane are its high toxicity and the fact that it is artefact forming (Shantha and Napolitano 1992). Some methods can alter the original fatty acids by forming positional or geometric isomers if the method procedure is not followed strictly. Thus, the disadvantages of different esterification methods should be considered when selecting the method for a certain matrix. Esterification of fatty acids have been utilised for decades and reviewed several times. The traditional esterification methods are presented for example in a review by Shantha and Napolitano (1992). In addition, Ruiz-Rodriguez et al. (2010) reviewed novel improvements in the esterification procedure in terms of catalyst, derivatisation time and temperature.
2.4.3 OTHER DERIVATIVES
Other possibilities instead of FAME are needed for special cases such as to diminish the volatility of short-chain fatty acids, to introduce aromatic groupings for UV-detection in HPLC, or to establish the configuration of FA for a mass selective detector. Ethyl esters are prepared easily just by changing methanol to ethanol in the transesterification methods described above (Christie 1989). Alkyl esters are prepared by using the appropriate

37
alcohols, for instance sodium butoxide or sulphuric acid in butanol (Christie 1989). Propyl and butyl esters have decreased volatility compared to FAME and are therefore particularly suitable for the analysis of short-chain fatty acids.
Double bond migration of FAME during EI-MS makes it difficult to establish the structure of unsaturated fatty acids. 3-hydroxymethylpyridinyl (picolinyl) esters and dimethyloxazoline (DMOX) derivatives (Figure 3b,d) are perhaps the most common choices for structure determination in MSD. Various methods for the preparation of DMOX have been described, for instance Yu et al. (1988) heated FFA in 180 °C with 2-amino-2-methyl-1-propanol (AMP) for 2 hours in a nitrogen atmosphere. Luthria and Sprecher (1993) and Fay and Richli (1991) continued the heating to 18 hours or overnight, respectively, to prepare DMOX derivatives from FAME. The advantage of DMOX is the stability of double bond positions in ionisation reactions of MSD. Yu et al. (1988) also considered DMOX derivatives useful in the analysis of branched fatty acids in Shanghai duck uropygial wax. Spitzer (1997) gives detailed information on the structure analysis of fatty acids by DMOX in the review. The advantage of DMOX over picolinyl ester is the fact that the GS analysis of DMOX derivatives resembles the analysis of FAME, as DMOX derivatives are very volatile. The chromatographic method does not need much modification, only a slightly higher temperature programme.
Picolinyl esters are prepared from free fatty acids. Christie (1998a) first prepares an acid chloride from a hydrolysed sample and then reacts it with 3-hydroxymethylpuridine in dichloromethane. Destaillats and Angers (2002) developed a one-step procedure including transesterification under base-catalysed conditions using 3-potassiooxamethylpyridine in methylene chloride. Reaction conditions allowed complete derivatisation of triacylglycerols and phospholipids in two minutes at room temperature. The method was applicable to FAMEs, too. In chromatography, picolinyl esters need column temperatures about 50 °C higher than FAMEs. Hamilton and Christie (2000) compared picolinyl esters and DMOX derivatives in the structural characterisation of fatty acids in MSD. With picolinyl esters, unusual rearrangements were rare and mass spectra were simpler and easier to interpret than those obtained by DMOX derivatives. Christie (1998a) compared these derivatives in the structural analysis of methylene-interrupted fatty acids and concluded the derivatives to be more complementary than competitive. Contrary to Hamilton and Christie (2000), Ratnayake (2004) concluded that mass spectra of DMOX derivatives are clearer and more informative than those of picolinyl esters.

Review of the literature
38
Figure 3. Some derivatives of fatty acids. a) pyrrolidide, b) picolinyl ester, c) dimethyldisulfide adduct and d) dimethyloxazoline (DMOX).
Other stable derivatives for MSD are pyrrolidides and dimethyl disulphide adducts (Figure 3a,c). Dimethyl disulphide adducts are useful in the location of double bond, because they stabilise the double bond. They are simple to prepare just by dissolving FAME in dimethyl disulphide with a trace of iodine (Christie 1998a). Pyrrolidides were the first useful nitrogen-containing derivatives, but nowadays they are usually substituted by picolinyl ester or DMOX derivatives (Christie 1998b).
2.4.4 FRACTIONATION OF FATTY ACIDS
The retention of similar isomers is accordingly similar, leading to overlapping peaks in chromatogram. Longer columns help in the separation of highly similar isomers, but another approach is a fractionation step before GC. Ag-ion thin layer chromatography (TLC) is the most common procedure for fractionation of cis and trans isomers since its introduction in the 1960s. It is based on the ability of the double bond to form polar complexes reversibly with silver compounds. Ratnayake (2004) reviewed the applications of Ag-TLC on hydrogenated fats and marine oils. Modern applications are based on solid-phase extraction (SPE). The same fractionation principle (argentation) as in Ag-TLC can be applied to SPE. For instance, Dreiucker and Vetter (2011) used Ag-SPE to fractionate cis and trans isomers of milk. The method enabled the determination of 87 fatty acids in milk samples. The same principle is utilised in HPLC with Ag-ion column (Ruiz-Rodriguez et al. 2010). Ag-HPLC has some advantages over Ag-TLC, including rapid analysis and complete separation of cis and trans C18:1 isomers (Ratnayake 2004). Jung and Jung (2002) used Ag-HPLC to isolate CLAs on hydrogenated soybean oil and GC-MS to identify them as

39
DMOX derivatives. Delmonte et al. (2008) used Ag-HPLC to separate cis and trans isomers of MUFA.
Reversed-phase HPLC is a less popular approach to fatty acid separation before GC analysis (Delmonte et al. 2009). Destaillats et al. (2007) compared HPLC and Ag-TLC for cis/trans fractionation in milk fat. They concluded that the fractioning methods were comparable. Delmonte et al. (2008) used reversed-phase HPLC to separate positional cis-17:1 isomers. They suggested the combination of Ag-HPLC and reversed-phase HPLC for combined geometrical and positional separation of isomers. Other possibilities are urea fractionation and counter-current chromatography (Delmonte et al. 2009). Urea fractionation has been widely used since the 1950s. It is not a totally forgotten method, since there are also modern applications. For example, the method for seed oil is a rapid, simple and inexpensive procedure capable of separating polyunsaturated FFAs from saturated FFAs (Hayes et al. 2000). Modern SPE columns containing NH2 groups have been developed for the separation of FFAs (Ruiz-Rodriguez et al. 2010).
Different lipid classes with varying polarity can be fractionated to analyse certain lipids such as phospholipid. The fractionation can be done on HPLC, TLC or ion-exchance chromatography (Christie 1989) or by SPE (Seppänen-Laakso et al. 2002).
2.4.5 GAS CHROMATOGRAPHIC SEPARATION
In chromatography, FAMEs are separated by polar columns according to chain length and the amount, position and isomeration of double bonds. The separation of cis and trans geometrical isomers is often needed, but conventional short columns are not very effective in this. Column lengths of 15 m, 30 m and 60 m are common, but columns with 100 m length and even longer ones are used for enhanced isomer separation. However, increasing the column length to more than 100 m has only a minimal influence on the cis/trans separation (Ratnayake 2004). The common stationary phases in FAME columns are highly polar cyanopropyl polysiloxanes (for instance HP-88, CP-Sil 88, SP-2380, DP-2560), biscyanopropyl and phenyl (SP-2330), medium polar cyanopropyl (DB-23) and polyethylene glykol (DB-Wax, Supelcowax-10, Omegawax). Weakly polar columns are also capable of separating fatty acids (Ruiz-Rodriguez et al. 2010). A novel extremely polar proprietary (patented) ionic liquid stationary phase in column SLB-IL111 has been successful in FAME analysis (Delmonte et al. 2011, Tyburczy et al. 2012). It is particularly capable of separating cis and trans isomers.
Modern two-dimensional (2-D) GC methods make it possible to separate FA isomers from each other more efficiently without pre-analysis fractionation. The basics of the resolution (gases, columns, detectors) in 2-D GC are the same as in traditional GC. De Geus et al. (2001) studied fatty acids in oil samples. They recommended 2-D GC for the identification whenever
Review of the literature
40
certified standards are not available. They concluded that the technique is also suitable for quantification. The same authors presented the basic set-up for 2-D GC. Columns 1 and 2 must have different lengths and polarities. Hyötyläinen et al. (2004) tested different column set-ups for fatty acid analysis. They gained improved separation and were able to analyse fatty acids with variable percentages in a single run. The nonpolar-polar (dimethyl polysiloxane-polyethylene glycol) set-up gave the best results and furthermore, the results were quantitative for all fatty acids excluding the most volatile ones. Gu et al. (2011) also used a nonpolar polydimethyl siloxane column together with a highly polar ionic liquid column to achieve good separation of fatty acids from algae samples. Villegas et al. (2010) compared the separation efficacy of 2-D GC and Ag-HPLC coupled to APPI-MSD. They concluded that both the methods were a better choice for traditional (1-D) GC. Contrary to the previously mentioned authors, they found the highly polar-semipolar set-up more effective than the nonpolar-polar set-up in the separation of C18:1 isomers.
2.4.6 FATTY ACID IDENTIFICATION
After GC separation, fatty acids are detected usually by flame ionisation detector (FID) or mass selective detector (MSD). Electron impact (EI) is the most common ionisation method for MSD. In FID, the identification of the fatty acid is based solely on retention time. In MSD, after ionisation and fragmentation of the ions, the mass spectrum of the molecule is detected, in addition to the retention time. Therefore, the identification of the molecule is based on greater information and is accordingly more reliable. The efficacy of the MSD identification is dependent on the chosen derivatisation method. The main disadvantage of FAME mass spectra is that cis and trans isomers cannot be distinguished. Another main defect with several derivatives is that the location of double bonds is not clear due to their migration during ionization.
Härtig (2008) has studied the mass spectra of fatty acids. He presents the characteristic ions for different kind of FAME. Saturated, monounsaturated and polyunsaturated fatty acids are clearly distinguishable by their mass spectra. In addition, iso and anteiso isomers were presented with slightly different mass spectra. The double bond migration can be helpful in the analysis of fatty acids, too. The branching position of methyl-branched MUFA was determined with EI-MS of methyl and trimethylsilyl esters of fatty acids with the help of double-bond migration (Rontani et al. 2009). They found that the migration yielded fragment ions, which were helpful in determining the branching position.
DMOX derivatives produce more stable ionisation products than do FAMEs. When the molecule is ionised, the nitrogen atom, not the alkyl chain, carries the charge, and double bond ionisation and migration are minimised.

41
The basics of DMOX ion characterisation are well presented in studies by Luthria and Sprecher (1993) and Spitzer (1997). The disadvantage of these derivatives is that cis and trans isomers are not distinguishable in their mass spectra, which leads to identification based solely on the differences in chromatographic retention. In addition, some of the characterising ions have several possible formation mechanisms, for instance the identification of the terminal moiety in the alkyl chain might be difficult (Hamilton and Christie 2000). Destaillats et al. (2005) compared mass spectra of methyl esters and DMOX derivatives of conjugated C18:3 fatty acid metabolites. They concluded that the mass spectra of these derivatives had similarity and the mass spectra of FAME were capable for the structural identification of these LCPUFAs.
Dimethyl disulphide adduct formation is stereospecific. As with the derivatives mentioned above, these threo- and erythro-derivatives which are formatted from cis and trans isomers, respectively, have indistinguishable spectra. In consequence, their identification is also based on retention differences (Christie 1998b).
Picolinyl esters produce simple and easy to read mass spectra (Dobson and Christie 1996). The principles of picolinyl and pyrrolidide mass spectra were presented 20 years ago by Harvey (1992). Their spectra are very similar, although the relative abundances of diagnostic ions are higher with picolinyl esters. Harvey (1992) presents the characteristic ions of several fatty acid type (for instance branched, unsaturated, cyclo) picolinyl esters. Yeboah et al. (2012) used picolinyl esters to study the structure of fatty acids from tiger nut and asiato oils. They were able to identify cyclopropene and cyclopropane rings at C9 and C10 in fatty acid alkyl chains, hence indicating the presence of sterculic acid (cp9,10-C18:1) and dihydrosterculic acid (cp9,10-C18:0) in the asiato, Pachira insignis, oil. Thus their result confirmed that asiato oil is unsuitable for human consumption.
In conclusion, MSD offers advantages over traditional FID in the identification. The identification of fatty acids is based on mass spectra, although information on retention time is still needed. Unknown peaks in the chromatogram can be roughly classified without certified standards. With MSD it is possible to create a spectral database for identification (Härtig 2008). Sometimes several different derivatives are needed for comprehensive structural analysis and quantification.
2.4.7 OTHER ANALYTICAL METHODS
High performance liquid chromatography (HPLC) has been used for fatty acid analysis. Fatty acids have no strong UV or visible light absorbing chromophores and fluorophores, which are usually needed for detection in HPLC. In consequence, derivatisation is needed. There are several methods for fatty acid derivatisation and analysis by HPLC. Lima and Abdalla (2002) reviewed the HPLC methods of fatty acids. The major advantage of HPLC is

Review of the literature
42
the lower temperature used during analysis, which reduces the risk of isomerisation. Unfortunately, the speed of resolution in HPLC is gained at the expense of resolution. Toyo'oka (2002) reviewed different fluorescent tagging methods for the detection of fatty acids in HPLC, among other carboxylic acids. He concluded that many of the methods were applicable to relatively high concentrations of molecules. He also emphasised the importance of effective sampling, sample clean-up and concentration of analytes.
New techniques coupling LC to MS have been successful in fatty acid analysis. The advantage of LC-MS over GC is the continuous manner of separation and identification without the need for purification and derivatisation steps (Lima and Abdalla 2002). This helps in the analysis of thermally labile substances. Electrospray ionisation (ESI) has been the most commonly used mode (Lima and Abdalla 2002). Cai and Syage (2006) used LC coupled with atmospheric pressure photoionisation MS (APPI-MS) for FAME and lipid analysis. The method was sensitive and gave stable, reproducible peak responses. APPI sensitivity was found to be highly dependent on mobile phase compositions. Villegas et al. (2010) used Ag-column for the positional and geometrical isomer separation of fatty acids and APPI-MS for identification. They achieved the separation of nine C18:1 isomers in less than 30 min. They concluded that APPI was a stable and reliable method for the ionisation of FAMEs. In addition, the method was rapid, specific and reproducible.
Statistical methods can be applied to help the identification in GC-MS. Vosough (2007) used mean field approach independent component analysis for fatty acid characterisation of fish oil. The method enabled the identification and quantification of fatty acids with overlapping signals and despite the disturbing background. It was also possible to identify positional isomers by the method. Tres et al. (2013) analysed fatty acids and volatile compounds and used chemometrics to identify the geographic origin of palm oil. The model was based on partial least squares discriminant analysis and hierarchical classification.
The saturation of fat can also be measured quantitatively by infra-red methods. Near-Infrared Transmittance (NIT) Spectroscopy has been used to predict the fatty acid composition in soya bean (Patil et al. 2010). In this study a chemometric model for the five most important fatty acids was developed by Modified Partial Least Squares (MPLS). In a study by Sierra et al. (2008), NIT, together with MPLS, was utilised to predict the fatty acid composition of beef. They could determine the amount of SFA, MUFA, branched fatty acids and the most prominent individual fatty acids. The prediction of PUFA content was not satisfactory for analytical purposes. It is possible to determine quantitatively fatty acids by 1H-NMR. Siciliano et al. (2013) used 1H-NMR to measure fatty acid chain composition in salami. They could measure oleyl, linoleyl and linolelyls and total SFA. NMR and IR are quick, non-destructive methods for the estimation of a fatty acid profile.

43
The analysis is cheap and solvents are not needed. In addition, the sample preparation does not influence fatty acids, which is often a problem in wet chemistry. On the other hand, these methods cannot yet give as precise information on fatty acids as traditional chromatographic methods.
The analysis of fatty acids from food has a lot of variable attributes. None of the methods is superior for all food items for all purposes. The required considerations are presented in Table 4.
Table 4. Required considerations when choosing the method for fatty acid analysis.
Step Attributes Alternatives To consider
further
Fat extraction Speed
Accuracy
Sensitivity to trans-
formations
Traditional methods
Accelerated methods
Direct methods without
extraction step
Solvent
Time
Temperature
Pre-hydrolysis
Recovery
Pre-treatment Lipid class separation
Isomer separation
TLC
SPE
HPLC
Recovery
Derivatisation Detection method
Degree of fatty acid
unsaturation and length
Qualitative (structure) or
quantitative analysis
Without derivatisation
FAME
DMOX
Picolinyl esters
Time
Temperature
Reagents
Analysis method Speed
Precision
Quantitative bias
GC
2D GC
HPLC
NMR
IR
Cost
Benefit
Separation Isomer separation
Speed
Precision
Column phases and
lengths
Time
Temperature
program
Detection Identification precision FID
MS
Quantification Qualitative (structure) or
quantitative analysis
Internal standards
Aims of the study
44
3 AIMS OF THE STUDY
Reduced-fat cheeses are part of a healthy diet. The principal aim was to study reduced-fat products from a consumers' perspective in terms of their healthiness and appealing characteristics. The fatty acid composition of variable dairy products was studied, in addition to sensory and chemical attributes of reduced-fat or substituted fat cheeses. As free fatty acids are an important factor in the sensory profile of cheese, the impact of milk homogenisation on free fatty acids and sensory characteristics of Emmental cheeses was studied.
The specific aims were to
study the sensory characteristics and the chemical composition
of full-fat (I) and reduced-fat cheeses (I, II), and their relation to consumer acceptance (I, II),
survey the fatty acid profiles of a variety of products on the
market, with a special emphasis on trans fatty acids and essential fatty acids (III),
validate an analytical method for free fatty acids in cheese (IV)
and to study free fatty acids in trial Emmental and their relation to
sensory characteristics (IV).

45
4 MATERIALS AND METHODS
4.1 SAMPLES
Edam, Emmental and Havarti-type cheeses are the most popular cheese varieties in Finland. Havarti-type cheeses (in Finnish “murukolojuustot”) are ripened cheeses with a mild, creamy flavour and a fresh, acidic taste. The body is light yellow with numerous small, irregularly shaped holes and is softer than other semi-hard varieties. Samples for Study I were commercially available full-fat and reduced-fat Emmental, Edam and Havarti-type cheeses (n=44) obtained from dairies involved in the study (Valio Ltd, Ingman Foods Ltd, co-operative dairy Milka). Samples for Study II were commercially available reduced-fat Havarti-type cheeses (n=10) obtained from the dairies mentioned above.
Samples for Study III were commercial cheeses (n=20), cheese substitutes (n=2), margarines and spreads (n=18), solid and liquid shortenings (n=20), vegetable fat half creams (n=11), vegetable fat ice creams (n=12) and creams (n=4) acquired from local markets. Two different batches of margarines and spreads were chosen to represent a brand. Vegetable fat half creams are non-whippable milk-based products which are designed to substitute cream in cooking.
The validation of the FFA method was done with a bread cheese, which represented the cheese matrix without FFAs. Bread cheese (squeaky cheese) is a baked fresh cheese, which has a very mild flavour. Samples for Study IV were trial Emmental cheeses (n=12) manufactured at Helsinki University’s Viikki pilot dairy. The cheeses were produced from milk homogenised at various pressures (0, 5 and 10 MPa and a control). The trial was repeated three times. A summary of the samples is presented in Table 5.

Materials and methods
46
Table 5. A summary of the samples in this study.
Sample category Fat content n Reference
Havarti-type cheese full-fat 8 I
Havarti-type cheese reduced-fat 8 I
Havarti-type cheese reduced-fat 10 II
Havarti-type cheese full-fat 2 III
Havarti-type cheese reduced-fat 5 III
Emmental cheese full-fat 8 I
Emmental cheese reduced-fat 6 I
Emmental cheese full-fat 2 III
Emmental cheese reduced-fat 5 III
Emmental cheese (trial) full-fat 12 IV
Edam cheese full-fat 8 I
Edam cheese reduced-fat 6 I
Edam cheese full-fat 2 III
Edam cheese reduced-fat 4 III
Cheese substitute reduced-fat 2 III
Margarine and spread 60 – 80 % 9 III
Margarine and spread
(light)
29 – 41 % 9 III
Solid shortening 59 – 83 % 9 III
Liquid shortening 56 – 83 % 11 III
Vegetable fat ice cream 5 – 14 % 12 III
Vegetable fat half cream 4 – 15 % 11 III
Cream 10 – 35 % 4 III
4.2 METHODS
4.2.1 QUALITY SCORING
The quality scoring in Study I was performed using the FIL-IDF 99C method (IDF 1997). It is a grading method using a 5-point quality scale for the attributes of appearance, consistency and flavour. The descriptions of the scores are as follows: 5 = conformity with the pre-established sensory specification, 4 = minimal deviation from the pre-established sensory specification, 3 = noticeable deviation from the pre-established sensory specification, 2 = considerable deviation from the pre-established sensory specification, 1 = very considerable deviation from the pre-established sensory specification, (0 = unfit for human consumption). The assessment of reduced-fat cheeses took place at MTT and the assessment of full-fat cheeses
47
at EELA by expert panels (n=5 at both laboratories). The sensory laboratory in EELA was accordant to standard ISO 8589 (ISO 2007). Before evaluation, a general sensory specification for Havarti-type cheeses was created on the basis of Codex cheese standard C-6 (FAO/WHO 1966b). For Edam and Emmental-type cheeses the Codex cheese standards C-4 and C-9 (FAO/WHO 1966a, FAO/WHO 1969, respectively) were used. The lower fat content of reduced-fat cheeses was taken into account. Assessors used whole points. If a panellist gave a score of three or below, the deviation (defect/defects) must be described with the help of nomenclature specified in the method. The temperature of the samples was +14 ºC ± 2 ºC. The quality scoring test was repeated once.
4.2.2 SENSORY PROFILE TEST
The sensory profile tests in studies I and II were carried out using the generic sensory profiling (GSP). In Study I, the assessment of reduced-fat cheeses took place in MTT and the assessment of full-fat cheeses in EELA. The sensory laboratory in EELA was accordant to standard ISO 8589 (ISO 2007). There were eight assessors for the GSP of all full-fat and reduced-fat Havarti-type cheeses and six assessors for the GSP of reduced-fat Edam and Emmental cheeses. Before the study, sensory vocabularies containing 17 attributes for Edam, 19 attributes for Havarti-type and 20 attributes for Emmental were created separately for each type of cheese. Reference samples were used to calibrate the panels. The sensory attributes concerned appearance (number of attributes 6, 5 and 6 for Edam, Havarti-type and Emmental, respectively), texture (number of attributes 3, 5 and 3 for Edam, Havarti-type and Emmental, respectively) and flavour (number of attributes 8, 9 and 11 for Edam, Havarti-type and Emmental, respectively). A linear scale (10 cm, 0-10, verbally anchored at both ends, e.g. weak – strong) was used. One attribute (size of the holes) was anchored additionally in the middle. The samples were presented to the judges coded by three-digit numbers and in a randomised order. The temperature of the samples was +14 ºC ± 2 ºC. The sensory profile test was carried out in duplicate.
The created profiles, excluding attributes vegetable oily and lipolytic flavour, were further used in Study II by a trained panel at MTT (n=9). Three separate training sessions (lasting four hours each) with the same reference samples as in Study I and various cheeses were organised before the study. In addition, the reference materials were available for the assessors for independent training between training sessions. The sufficiency of training was evaluated by examining deviations of the jury from the mean values. The sensory evaluation of the samples was carried out as in Study I.
The sensory profile test for Study IV was carried out in Helsinki University.

Materials and methods
48
4.2.3 CONSUMER TEST
The applied consumer test in studies I and II was a product test for liking using a 9-point hedonic scale (Peryam and Pilgrim 1957). The assessed attributes were pleasantness of appearance, mouth feel, flavour and overall liking. Points 6 – 9 meant that the subject liked the sample; points 1 – 4 represented a dislike of the sample, while point 5 was taken as neither liking nor disliking the sample. All points were verbally anchored. The samples were presented coded using three-digit numbers in Study I and with letters randomly extracted from the middle parts of the alphabet in Study II and in a randomised order. The assessments were written down using paper forms. The samples were evaluated at room temperature.
The consumers in Study I (n=108 in the test for Havarti-type cheeses; n=127 in the test for Edam cheeses; n=128 in test for Emmental-type cheeses) were recruited from a register maintained by the National Consumer Research Centre and the assessment was carried out in its rooms. The criterion for recruiting was general cheese consumption. In Study II, only regular consumers of reduced-fat cheeses were surveyed. The consumers (n=153) were customers at three different supermarkets in the metropolitan area of Finland and the assessment was carried out in the supermarkets. Consumers were asked their age, sex, level of education and their levels of reduced-fat cheese consumption.
4.2.4 COMPOSITIONAL ANALYSES The samples for chemical analyses were homogenised and analysed in duplicate.
The fat content of cheeses in studies I and II were analysed using
International Dairy Federation standard method 5B (IDF 1986). The fat content of cheeses in Study III was analysed by updated standard ISO-IDF 5 (ISO-IDF 2004). The fat content of margarines, spreads and shortenings with less than 75 % fat in Study III were analysed using the Röse-Gottlieb method as described in standard IDF 16C (IDF 1987). The fat content of the shortenings with at least 75 % fat in Study III were analysed by direct extraction as described in standard ISO 17189 | IDF 194 (ISO-IDF 2003). The methods were chosen according to the matrix and scope of the standard.
Dry matter and salt in studies I and II were analysed using International
Dairy Federation standard methods (IDF 1982, IDF 1988, respectively). These methods for fat, dry matter and salt are accredited in our laboratory according to EN ISO/IEC 17025.
Sorbic acid and natamycin were analysed by a liquid chromatographic
method (Luf and Brandl 1986). Sorbic acid and natamycin were extracted

49
from homogenized cheese with methanol, filtrated after freezing overnight, separated by reverse-phase C18-column (Symmetry C18, 5 μm, 3.0 mm, 150 mm, Waters, USA), and detected by UV-detector at wavelengths 263 nm and 303 nm, respectively. Nitrate was analysed by an ion chromatographic method (NMKL 2000).
Free amino acids in studies I and II were analysed by a titration method
(Moisio and Heikonen 1996) at Valio Ltd. Cheese was grated and homogenised with water. The extract after filtration was titrated with NaOH. The consumption of the NaOH titrant is determined within pH intervals of 0.2–0.6 units around the pK values of the components. The buffer capacity measured is expressed as the consumption of NaOH over the pH interval. The amounts of compounds are found from these results using simple models of chemometrics.
4.2.5 FATTY ACID PROFILE
Fatty acid analysis in Study III consisted of three steps. First, the fat was extracted from the matrix and after that the fat was transesterified to fatty acid methyl esters. The third step was the gas-chromatographic resolution of fatty acid methyl esters and detection by mass spectrometry. The quantification was based on peak areas.
Fat from shortenings and spreads with at least 40% fat was separated by the ISO 14156 │ IDF 172 method (ISO-IDF 2001). The sample was warmed in a 50 °C water bath and filtered. Fat from the other products (cheeses, vegetable fat half creams, vegetable fat ice creams, creams and spreads with less than 40% fat) was separated by the DPS detergent method (Atherton and Newlander 1977) with some modifications. The detergent was a mixture of sodium metaphosphate (NaPO3)6 and Triton-X-100 diluted in water. The homogenised sample was mixed with sesqui-fold volume of DPS detergent and boiled for 15 minutes. The extracted fat was separated and centrifuged before further processing.
Methyl esterification was achieved by base-catalysed transesterification with methanolic sodium hydroxide (Prevot et al. 1975). Prepared fatty acid methyl esters (FAME) were dried with calcium chloride and diluted with hexane. Samples were analysed in duplicate.
The gas-chromatographic method for FAME analysis was previously validated for the Agilent GC model 6890 equipped with mass selective detector 5973 Network and Enhanced ChemStation software (Agilent, USA). The analytical column was DB-23 (60 m × 0.25 mm × 0.15 μm) (Agilent Technologies, USA) in the analysis of cheeses, creams, margarines, spreads and shortenings and HP-88 (100 m × 0.25 mm × 0.20 μm) (Agilent Technologies, USA) in the analysis of vegetable fat ice creams and cream substitutes. The experimental conditions were: split ratio 55:1 for DB-23 and

Materials and methods
50
20:1 for HP-88, helium as a carrier gas and constant pressure mode 180 kPa for DB-23 and 250 kPa for HP-88. The oven temperature programme for DB-23 was: initial oven temperature 45 °C, then 25 °C min-1 to 175 °C and 1.5 °C to 230 °C, and the oven temperature programme for HP-88 was: initial oven temperature 50 °C, then 15 °C min-1 to 175 °C and 1.0 °C to 240 °C. The MSD parameters were: scan 40 – 400 amu, threshold 100 amu. The retention time for methyl oleate was locked at 15.8 min for DB-23. Peak identification was based on retention time correlation with reference standards and mass spectra.
4.2.6 FREE FATTY ACIDS
The method for the analysis of free fatty acids in Study IV was based on the method by de Jong and Badings (1990). Grated cheese was ground with anhydrous sodium sulphate. Sulphuric acid and internal standard solution were added. The mixture was extracted with ether:heptane (1:1) twice and purified with solid phase aminopropyl column HyperSep NH2 (500 mg, 6 ml, Thermo Scientific, USA). After removing neutral lipids by hexane:2-propanol, the bound fatty acids were released from the column by ether containing 2.5 % (v/v) formic acid.
The isolated fatty acids were separated by gas chromatography GC6890 with a GC Sampler 120 and a mass selective detector MSD 5973N (Agilent Technologies Inc. USA), interfaced with Enhanced ChemStation software E.02.00.493 (Agilent Technologies Inc., 1989-2008, USA). The analytical column was ZB-FFAP (30 m, 320 µm, 0.25 µm, Phenomenex, USA). Helium was used as the carrier gas at an initial flow rate of 3.2 ml/ml (constant pressure 70 kPa). The injector temperature was 250 °C, split ratio 5:1, and the initial oven temperature was 60 °C. The oven was heated at a rate of 10 °C/min to 240 °C and held there for 15 min. The MS Interface temperature was 280 °C, MS Quadrupole 150 °C, and MS Source 230 °C. The total analysis from grating to gas chromatography was performed within seven hours.
The quantification was based on internal standards. Short-chain fatty acids (chain lengths 4 to 8 carbons) were quantified with valeric acid C5:0, medium-chain fatty acids (chain lengths 10 to 16 carbons) with nonanoic acid C9:0 and long-chain fatty acids (chain lengths 18 to 22 carbons) with heptadecanoic acid C17:0.
4.2.7 STATISTICAL ANALYSES
The results of quality scoring in Study I (factors: origin/quality score, fat content/quality score) and chemical analysis (factors: origin/chemical attribute, fat content/chemical attribute) were analysed by 2-way analysis of

51
variance (ANOVA). The results of the generic sensory profiling (GSP) in Study I were analysed by 2-way ANOVA (factors: origin/sensory attribute, fat content/sensory attribute) and Principal Component Analysis (PCA). The repeated sensory profile tests were compared by coupled t-test. The experimental design in the consumer tests was a complete block design (block = consumer), although all consumers assessed the reduced-fat cheeses first. The results of the consumer tests were assessed by analysis of variance (factors: liking/origin, liking/fat content). Statistically significant differences (p < 0.05) in the consumer tests were tested by Tukey’s test. Correlations (p < 0.05) of chemical analysis, sensory profile and consumer test results in different cheese types and in subgroups with different fat content were gained by the Pearson correlation test.
The results of the GSP in Study II were analysed by 2-way ANOVA (factor: cheese, assessor) and Principal Component Analysis (PCA). The results of the consumer hedonic tests were assessed by 1-way ANOVA (factor: cheese) and statistically significant differences (p < 0.05) were tested by Tukey’s test. The experimental design in the consumer hedonic tests was a randomised block (block = consumer). Correlations (p < 0.05) of the consumer hedonic tests, the chemical analysis and the QDA results were obtained by the Spearman’s rank correlation test.
Preference mapping in Study II was done by Principal Component Regression. The results of the GSP were x-variables and the hedonic ratings (overall liking) were y-variables. Hierarchical Cluster Analysis (complete linkage) was carried out to divide the consumers into subgroups according to their similarities in terms of preferences.
The results of fatty acid analysis in Study III were tested by 1-way ANOVA (factor: cheese variety or solidity of shortening or fat content of spread) and statistically significant differences (p < 0.05) were tested by Tukey’s Honestly Significant Difference. The correlation between fat content and fatty acid proportions in cheeses and the correlation between butyric acid and TFA in spreads were tested by Pearson correlation.
The results of free fatty acid analysis in Study IV were analysed by 2-way ANOVA (factors: sample and trial). Statistically significant differences (p < 0.05) were tested by Tukey’s Honestly Significant Difference test.
Statistical tests were performed by various versions of Statistix for Windows (Analytical Software, Tallahassee, USA), The Unscrambler (CAMO PROCESS AS, Norway), and IBM SPSS Statistics (SPSS Inc., USA).
Results
52
5 RESULTS
The main findings are presented here. The results in detail are found in original publications I – IV.
5.1 QUALITY SCORING OF THE COMMERCIAL CHEESES
In Study I, the cheeses were graded according to quality scoring. The results are shown in Table 5 in I. None of the samples received a score of 5 for more than one attribute. One full-fat Emmental-type cheese was graded as second class (score < 3 for flavour). All reduced-fat Edam cheeses obtained a score of 3 for appearance and a score of 4 for consistency and were not statistically different from each other, while flavour score ranged from 3 to 4. Full-fat Edam cheeses were more variable in all quality attributes. Likewise, all reduced-fat Havarti-type cheeses obtained a score of 4 in flavour and in addition, the differences between samples for this attribute were not statistically significant, while full-fat Havarti-type cheeses had greater variation in flavour. In Emmental cheeses, the scores for flavour ranged from 2 to 4 and the scores for appearance and consistency ranged from 3 to 4. Differences in quality or variability of quality between reduced-fat and full-fat cheeses were not seen. Thus it can be concluded that all cheeses except one in Study I were of moderate or good quality.
5.2 SENSORY PROFILE OF THE CHEESES
Sensory vocabulary for Havarti-type, Emmental-type and Edam sensory profiles were created in Study I. The sensory profiles were then created for 44 sample cheeses in Study I. The summary of the profiles according to fat reduction and cheese variety can be seen in Figures 4 and 5. In Havarti-type cheeses, only the crystals and lipolytic flavour attributes were affected by fat reduction (Figure 5). Emmental cheeses had three attributes affected: hole bottom shininess, lipolytic and nutty flavour (Figure 4a). Full-fat Havarti-type and Emmental cheeses were more lipolytic than their reduced-fat counterparts. However, flavour intensity differed statistically significantly between full-fat and reduced-fat cheeses only in Edam cheeses (Figure 4b). Edam cheeses had seven attributes affected by fat reduction, for instance full-fat Edam cheeses were creamier, saltier, less yellow and richer in flavour

53
than reduced-fat ones. Reduced-fat cheeses were not bitterer than full-fat cheeses.
Figure 4. Means and standard deviations (N=number of assessors x number of samples x repetition) of the generic sensory profiling of a) Emmental-type and b) Edam cheeses in Study I. ColEven= evenness of colour; Hole_dev= deviation of holes; Hole_BShine= Glossiness of hole bottoms; Hole_BEven= even shape of hole bottoms; Flav_int= intensity of flavour; Flav_rich= richness of flavour; Flav_bal= balance of flavour; Flav_nut= nutty flavour; AfterT= after-taste; Flav_foreign= foreign flavour. * = statistical difference between full-fat and reduced-fat cheeses.
* *
*
0
1
2
3
4
5
6
7
8Emmental‐type
Full‐fat (N=8 x 8 x 2) Reduced‐fat (N=6 x 6 x 2)
a)
* **
**
**
0
1
2
3
4
5
6
7
8Edam
Full‐fat (N=8 x 8 x 2) Reduced‐fat (N=6 x 6 x 2)
b)
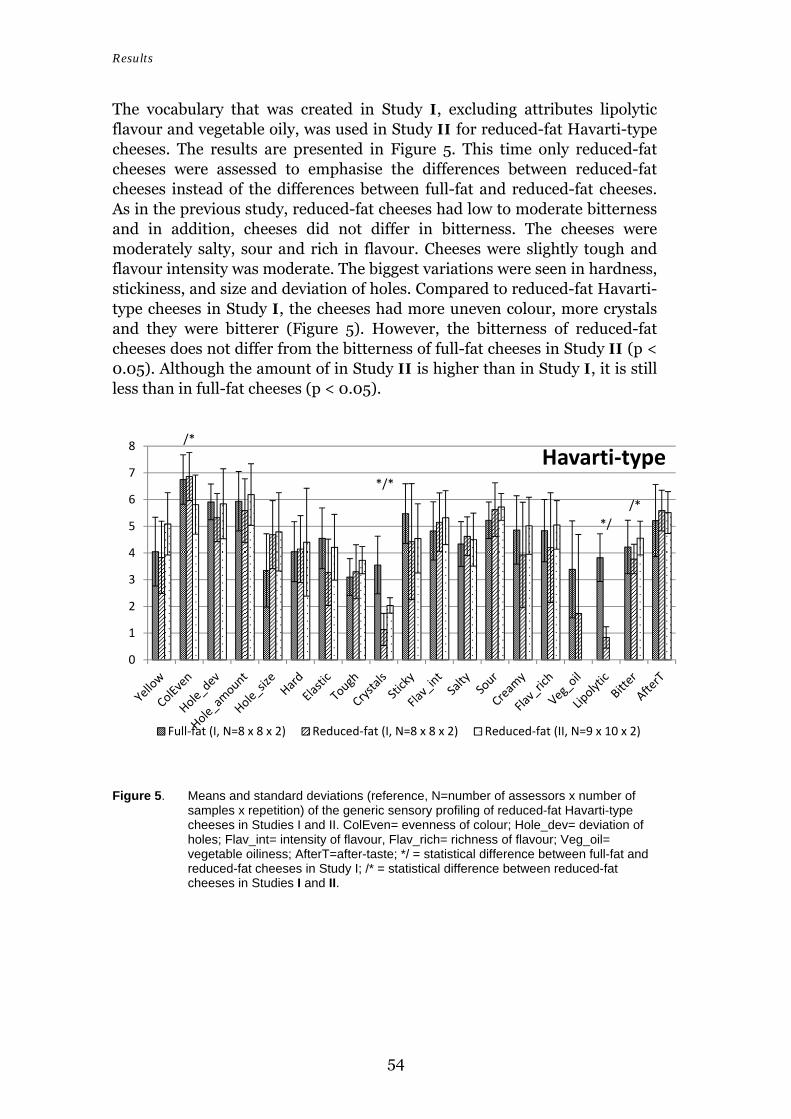
Results
54
The vocabulary that was created in Study I, excluding attributes lipolytic flavour and vegetable oily, was used in Study II for reduced-fat Havarti-type cheeses. The results are presented in Figure 5. This time only reduced-fat cheeses were assessed to emphasise the differences between reduced-fat cheeses instead of the differences between full-fat and reduced-fat cheeses. As in the previous study, reduced-fat cheeses had low to moderate bitterness and in addition, cheeses did not differ in bitterness. The cheeses were moderately salty, sour and rich in flavour. Cheeses were slightly tough and flavour intensity was moderate. The biggest variations were seen in hardness, stickiness, and size and deviation of holes. Compared to reduced-fat Havarti-type cheeses in Study I, the cheeses had more uneven colour, more crystals and they were bitterer (Figure 5). However, the bitterness of reduced-fat cheeses does not differ from the bitterness of full-fat cheeses in Study II (p < 0.05). Although the amount of in Study II is higher than in Study I, it is still less than in full-fat cheeses (p < 0.05).
Figure 5. Means and standard deviations (reference, N=number of assessors x number of samples x repetition) of the generic sensory profiling of reduced-fat Havarti-type cheeses in Studies I and II. ColEven= evenness of colour; Hole_dev= deviation of holes; Flav_int= intensity of flavour, Flav_rich= richness of flavour; Veg_oil= vegetable oiliness; AfterT=after-taste; */ = statistical difference between full-fat and reduced-fat cheeses in Study I; /* = statistical difference between reduced-fat cheeses in Studies I and II.
*/
/*
*/*
/*
0
1
2
3
4
5
6
7
8Havarti‐type
Full‐fat (I, N=8 x 8 x 2) Reduced‐fat (I, N=8 x 8 x 2) Reduced‐fat (II, N=9 x 10 x 2)
55
5.3 CONSUMER TESTS FOR THE COMMERCIAL CHEESES
The consumers in Study I were recruited from the National Consumer Research Centre register. They were regular cheese consumers. In Study II the consumers were supermarket customers in the Helsinki metropolitan area. These individuals were regular consumers of reduced-fat cheeses. In both studies most of the consumers were women (in Study I 70 – 80 % and in study II 68 %) and middle-aged (in Study I 79 – 80 % of consumers were 30-59 years of age and in Study II the mean age was 49 years) and well-educated (in Study I 75 – 76 % had at least a college level degree and in Study II 74 %).
The results of Study I are shown in Table 4 in I. Mean scores for Emmental cheeses were in the range between 4.95 and 7.26, for Edam cheeses between 4.13 and 7.31 and for Havarti-type cheese between 3.58 and 7.15. Altogether 7 of 14 Emmental cheeses were liked (mean score ≥ 6) for every attribute, and none of the cheeses was disliked (mean score < 5) for more than one attribute. One cheese was disliked for mouth feel. The least liked 5 cheeses had a mean score between 5 and 6 in overall liking and they were liked for only one (appearance) or two (appearance and flavour) attributes. In Edam cheeses, 9 of 14 samples were liked for every attribute. One sample was disliked for mouth feel, flavour and overall liking. Three cheeses were liked for one or three attributes and one cheese was neither liked nor disliked (mean score between 5 and 6) for every attribute. Three of the five least liked cheeses were reduced-fat cheeses. The situation was similar with Havarti-type cheeses, where 11 of 16 cheeses were liked for every attribute. Two cheeses were not liked for any attribute and even disliked for 2 or 3 attributes. These two disliked Havarti-type cheeses were reduced-fat (19 % fat) and full-fat (30 % fat) cheese analogues made with rapeseed oil. Excluding the cheese analogues, there were three cheeses that were liked for one, two or three attributes and all of them were reduced-fat cheeses.
In Study II, mean values for liking in all attributes were between 5.53 and 6.95, showing slight to moderate pleasantness and low variation in average liking between reduced-fat Havarti-type cheeses (Table 4 in II). None of the samples was disliked (mean value less than 5). Altogether 7 of 10 samples were liked for every attribute and even the least liked sample was liked for one attribute, appearance. This is a similar result compared to Study I if vegetable fat cheese analogues are excluded.
A noteworthy aspect is that reduced-fat and full-fat cheeses in Study I were assessed in separate sessions during a day. This way, the factors affecting liking for the particular cheese type with a similar fat content were studied. If consecutive samples have remarkable differences in fat content, it affects the evaluation. As it was not a good idea in terms of assessor performance to assess all samples in one session, this arrangement was considered sufficient. However, the results were merged. The assessors were

Results
56
thought to use the scale in the same way, despite the fat content of the samples.
Pleasantness of flavour and mouth feel correlated strongly (p < 0.0001) for every cheese type. It seems that consumers cannot differentiate between these attributes. In addition, liking of mouth feel and flavour were clearly correlated (p < 0.01) to overall liking in all cheese types.
5.4 CHEMICAL COMPOSITION OF THE COMMERCIAL CHEESES
The chemical composition of cheeses in studies I and II are presented in Table 6. Salt content plays a role in the health image of cheese. Some of the cheeses were heavy-salted in both studies. In addition, the additives sorbic acid, natamycin and nitrate were analysed during the Study II, although the results were not included in Article II. These additives do not contribute directly to the sensory characteristics of cheese, but they are important in the quality and health aspects. The concentrations of natamycin and nitrate did not exceed the legislative limits. One sample with a marking of nitrate in label did not include a quantifiable amount of it. None of the cheeses included natamycin. Sorbic acid can be used in line with the quantum satis principle. Three samples included sorbic acid in detectable amounts. Surprisingly, only one (the one containing 230 mg/kg) of them was labelled correctly. One of the incorrectly labelled samples had a remarkable amount of sorbic acid (120 mg/kg) and the other sample had a trace of it (1.1 mg/kg). The two cheeses with high content of sorbic acid do not differ remarkably from other cheeses in sensory profiling but the content of sorbic acid correlates negatively to the amount of holes and colour (p < 0.05). However, the number of cheeses having sorbic acid in detectable amounts is too small (n=3) to do conclusions.
Free amino acids are important for cheese flavour. The ripening increases their concentration in cheeses. Unfortunately, the ripening time was not controlled in the studies, but all the cheeses were analysed during a sale period typical of the variety.

57
Table 6. The chemical composition of the cheeses in studies I and II.
Cheese
type
Fat Dry
matter
(%)
Fat
(%)
Salt
(%)
Free amino
acids
(mmol/kg)
Sorbic
acid 1
(mg/kg)
Nata-
mycin 1
(mg/kg)
Nitrate 1
(mg/kg)
Ref
Havarti F 59-62 27-34 1.0-1.6 67-150 I
Havarti R 52-55 16-20 1.0-1.6 83-250 I
Havarti R 50-56 15-20 0.7-2.3 80-225 ND-230 ND <0.5-44 II
Edam F 54-58 23-25 0.8-1.5 66-140 I
Edam R 48-52 10-17 0.8-1.4 72-280 I
Emmental F 58-63 28-31 0.3-1.3 100-250 I
Emmental R 52-57 14-18 0.5-1.4 110-350 I
F= full-fat; R= reduced-fat; ND= not detected; 1= unpublished
5.5 APPEALING CHARACTERISTICS OF THE CHEESES
The appealing characteristics can be evaluated when the sensory profile and chemical results are combined with consumer test results. In Study I this was done by PCA and Pearson correlation analysis. In Study II a technique called preference mapping was used together with Spearman’s rank correlation analysis.
Study I included three different cheese types, which were studied separately. Stickiness was positively correlated to liking of mouth feel in all cheese types.
In Emmental cheese, hardness was negatively correlated, in other words soft Emmental cheeses were preferred. In addition, saltiness and sourness were positively correlated to overall appeal in Emmental. In the PCA picture, PC1 is characterised by hardness. The most liked Emmental cheeses are very dispersed in the PCA picture (Figure 1c in I) showing divergence, thus the general appealing characteristics of Emmental cannot be concluded with PCA.
In Havarti-type cheese, creaminess and rich flavour were positively correlated and vegetable oiliness was negatively correlated to overall appeal. The dislike of vegetable oil flavour was so dominant that the attribute had to be excluded from the PCA. In the PCA figure, the attributes of stickiness, richness and creamy flavour are grouped together and are characteristic for PC1 (Figure 1a in I). However, the most liked cheeses are dispersed along PC1. PC2 is characterised by strong flavour; flavour intensity and after-taste. The most liked reduced-fat cheeses are on the positive side of PC2, thus showing the importance of strong flavour to the pleasantness of reduced-fat cheeses.

Results
58
Study II with reduced-fat cheeses Havarti-type cheeses showed similar results. Stickiness, large holes, salt content and lack of toughness and yellowness correlated to overall liking. Interestingly, fat content correlated negatively to overall appeal. Preference mapping (Figure 1b in II) showed four groups of consumers with partly separated preferences. There were subgroups for 1) hard, yellow cheese, 2) cheese with strong flavour intensity and many holes, 3) sour and sticky cheese, and 4) sticky cheese with large holes. Subgroups 1 and 4 are the furthest apart from each other. Although the preferences differed between groups, consumers were more consistent in dislike: low intensities of flavour reduced liking (Figure 1a in II). Thus, the importance of flavour intensity can be seen, although the attribute of flavour intensity did not correlate to overall appeal.
Similar to Havarti-type cheese, creaminess and rich flavour were correlated to overall appeal in Edam cheeses and in addition, attributes saltiness, flavour intensity, amount of holes and salt content were also positively correlated. The results of PCA (Figure 1b in I) are similar to Havarti-type cheeses, as PC1 is characterised by sticky, creamy and rich flavour, attributes which are important in terms of liking. PC2 is characterised by the amount of holes, an attribute related to appearance and significant to overall appeal. All the most liked cheeses are grouped closely to each other in a quarter between positive PCs, thus showing similarity.
5.6 FATTY ACID PROFILES OF THE COMMERCIAL CHEESES
Fatty acid profiles (%) of reduced-fat and full-fat cheeses together with cream are presented in Figure 2 in III. The fatty acid profiles of cheeses were not significantly different from the profiles of creams. Fat reduction influenced the proportion of some fatty acids. Reduced-fat cheeses had greater proportions of LA and MUFAs and a smaller proportion of SFAs when all the varieties were studied together. The differences do not have significance to health as the amounts of individual fatty acids are low. Interestingly, some fatty acids correlated with fat content. In reduced-fat cheeses the variety did not have significance for fatty acid profile.
5.7 FATTY ACID PROFILES OF THE SPREADS, SHORTENINGS AND VEGETABLE FAT DAIRY PRODUCTS
The fatty acid profiles (%) of spreads, shortenings and vegetable fat dairy products are presented in Table 1 in III. Light spreads (fat content ranging

59
from 29.1 % to 41.1 %) had lower proportions of TFAs than fattier spreads (fat content ranging from 59.9 % to 79.9 %) and CLAs were not detected in light spreads, while fattier spreads had small proportions. However, the content of TFAs was low (less than 1.5 %) in all products and furthermore, TFAs were clearly associated with the presence of butter in mixed spreads, as can be seen in Figure 6. The content of TFA correlated strongly with the butyric acid content (p < 0.01). The contents of essential fatty acids LA and ALA in spreads are presented in Figure 7. The regression line is slightly ascending, although not statistically significantly (R2=0.19). It is clear that the amount of essential fatty acids is more dependent on the brand and ingredients (fat source) than on fat content. For instance, the sample containing essential fatty acids at 29 g/100g product included linseed oil, unlike the others. Regardless of the fat source, the lightest spreads cannot have large amounts of any fatty acid, as the total fat content is low. In the aim of increasing the intake of essential fatty acid, a lot of attention should be given to spreads.
Figure 6. The proportions (%) of butyric acid and TFA in margarines and spreads in the order of increasing fat content. The values are means of duplicate analysis of two samples (n=4).
Against the general presumption, none of the shortenings had TFAs in detectable amounts. This is a delightful sign of the fact that modern technological processes utilized in fat industry are not causing remarkable trans-isomeration anymore. As can be expected from the physical form, solid shortenings had more SFAs and less LA, ALA, PUFAs and MUFAs than liquid
0,0 %
0,2 %
0,4 %
0,6 %
0,8 %
1,0 %
1,2 %
1,4 %
Pro
po
rtio
n o
f fa
tty
acid
(%
)
Total fat content (%)
butyric acidC4:0TFA

Results
60
shortenings. Thus, liquid shortenings can be considered healthier than solid shortenings in the view of fatty acid profile.
Variations in the fatty acid profile of vegetable fat half creams were large, due to the variation of the fat source. Vegetable fat ice creams in general contained as much saturated fat as cream. The fatty acid profile of the cheese substitute self-evidently resembled the profile of its fat source, rapeseed oil, thus being very different from milk fat.
Figure 7. The content (g/100 g) of essential fatty acids (LA and ALA) in margarines and spreads in the order of increasing fat content. The values are means of duplicate analysis of two samples (n=4).
5.8 FREE FATTY ACIDS OF THE TRIAL EMMENTAL
The validation of the method included the estimation of the parameters of selectivity, recovery, repeatability, within-laboratory reproducibility (standard deviation) and linearity. Repeatability was calculated as the square root of the square sum of differences between duplicates divided by number of analysis. The summary of the results is shown in Table 7. As ripened cheese without remarkable amounts of FFAs is impossible to achieve, the blank sample was bread cheese. It is a fresh cheese, hence lipolysis has not yet occurred remarkably and the level of FFAs is low. In addition, the texture
-
5
10
15
20
25
30
35
Am
ount
of e
ssen
tial f
atty
aci
ds (
g/10
0g)
Total fat content (%)

61
of bread cheese is harder than other fresh cheeses, thus it resembles ripened cheeses more. The blank sample was spiked with fatty acid mixture for validation purposes.
Table 7. The parameters and results of the FFA method validation (n=4). Unpublished.
Fatty acid Content
(mg/kg)
Repeatability
(mg/kg)
Within-laboratory
reproducibility
(mg/kg)
Recovery
(%)
SSE (%)
C4:0 37 3.67 3.11 41 77
C6:0 37 3.85 3.20 42 76
C8:0 37 3.77 3.25 43 82
C10:0 39 3.27 2.69 37 58
C12:0 38 3.31 2.71 38 60
C14:0 44 3.92 3.21 40 60
C16:0 109 6.63 9.28 55 60
C18:0 64 6.13 7.65 55 63
C18:1 137 6.40 8.49 49 61
C18:2 54 4.51 5.45 52 61
C18:3 39 1.30 1.85 40 66
C20:0 35 1.86 3.20 34 69
C22:0 36 7.26 6.40 32 66
The term “selectivity” is used here to describe the effect of the background, i.e. other substances present in sample matrix, to the method. It was calculated by the signal suppression or enhancement ratio SSE as described in Sulyok et al. (2006), dividing the slope of calibration curve based on cheese extract (matrix) by the slope of calibration curve based on solvent and expressing the ratio by percentage. The results show a suppressing effect. Based on the fact that it is impossible to gain cheese matrix as blank, completely without FFAs or even low amount of every FFA, the calibration curve cannot be based on cheese extract in practice. The limit of detection (LOD) was the mean value of 11 replicates plus three times standard deviation. The limit of quantification (LOQ) was set at the same level, because the blank sample had a minor concentration of FFA (confirmed by mass spectra) and the LOD was in the linear region. The level of quantification was 19 mg/kg. True LOD seemed to be lower, but it is very difficult to prove it with cheese matrix, which always includes low amounts of FFAs. The linearity was evaluated by calculating the residuals for points in the calibration curve. The linear range starts at 19 mg/kg for all fatty acids except for C20:0 and C22:0; their linear range starts at 48 mg/kg. The upper limit for linearity is at 241 mg/kg. The recoveries are low. It is possible that
Results
62
bread cheese disturbs the separation of free fatty acids from the matrix more than ripened cheese, because also matrix effect was seen, contrary to Berard et al. (2007). In fact, recoveries based on matrix calibration curve were higher, but more variable (55 – 144 %). Low recovery is corrected with the use of internal standards. Repeatability and within-laboratory reproducibility were calculated from the repeated analyses of the spiked blank matrix. The repeatability of the method is between 1.30 mg/kg and 7.26 mg/kg depending on fatty acid.
In general, the parameters of the method were less satisfactory for long-chain free fatty acids, but this was considered acceptable as the main focus was on more volatile (shorter) fatty acids which have a greater influence on flavour. Another important deficiency was the low recovery. Since there was no certified reference material available, the need for a recovery correction was not confirmed.
The concentrations of FFAs on the trial cheeses were studied on days 1 and 90 of ripening. The results are presented in Table 5 in IV. As expected, the amount of FFAs increased remarkably during ripening. The increase was most significant in short-chain FFAs and this increase was not significantly affected by homogenisation. However, the homogenisation had an influence on the concentrations of other FFAs. The homogenised H5 and H10 cheeses had significantly higher concentrations of medium- and long-chain FFAs, and the total amount of FFAs was higher than in control and H0 cheeses. This significance was already clear on Day 1 and it remained almost the same up to Day 90. There were differences in FFA concentrations between trials; however, the trend was similar in all three trials.

63
6 DISCUSSION
6.1 METHODOLOGICAL AND MATERIAL ASPECTS
6.1.1 SENSORY ANALYSIS
The quality scoring method compares the sample to the pre-established specification. It is a suitable tool to estimate the quality, in other words the compliance with the requirements. At the time of Study I, all cheeses on the market had to be graded. The aim of the Study I was to survey the characteristics of popular cheeses in Finland, therefore the quality score was considered as an interesting attribute worth inspecting. Although the results are poorly comparable to consumer test, they give an insight into the quality level of commercial cheeses as well as a range of typical defects in cheeses. This information is appropriated by cheese producers.
The assessors in Study I were experts in the sensory evaluation of cheese. However, the sensory profiling of cheese was a new technique to everyone and the vocabulary had to be created from the beginning. The training also included the use of scales. Panels at MTT and EELA organised training sessions together so that panel performances could be assured to be similar. In these sessions, the mean values for scores were calculated and different opinions were discussed until a consensus was achieved. Panel training can be considered sufficient. However, connecting the results despite of separated panels adds uncertainty to the conclusions. In Study II, the panels were comprised of the same experts, thus intense training was not needed. Interestingly, bitterness of reduced-fat Havarti-type cheeses was higher in Study II than in Study I. However, these samples were assessed at the same institute by the same panel consisting mostly of same experts, thus this change unlikely arises from the panel performance. The market is in constant change, hence the sample selection was not the same, and there might have been product development in addition to natural variation between batches. One batch of cheese was considered sufficient, since the principal aim was not to characterize the brand but compare the sensory profile to the consumer test.
The sex distributions in Studies I and II were similar than in the Northern Irish study of reduced-fat food consumption (Stewart-Knox et al. 2005), where 77.5 % of the respondents were female. The author’s personal experience is that women are more eager to take part in consumer tests than men are. In addition, the age distribution is considered reasonable in terms of reduced-fat cheese consumption, although no statistics about the issue was found. Respondents had relatively high degree of education in both studies I and II. It is probable that this differs from average cheese consumers. However, as taking part to these consumer tests was voluntary and no fee

Discussion
64
was paid, a selection of consumers is unavoidable. Thus the sosiodemographic range of consumers was as expected and can be considered adequate. It would have been interesting to study the sosiodemographic differences between consumer segments in Study II. If preference mapping was applied in Study I, sosiodemographic factors could have been studied also then. However, this information was considered not to give essential information to the preference mapping of cheeses. Since the aim of the study was on cheeses, not on consumers, other analyses were prioritized. The different supermarkets in the metropolitan area were thought to be representative of the whole country for the aims of the study.
The term mouth feel is translated as “suutuntuma” in Finnish and flavour is translated here as “haju ja maku”. However, for ordinary consumers the terms are not clear. Although “suutuntuma” means accurately “the touch in your mouth”, it is easily mixed with flavour, which is, in fact, demonstrated in Studies I and II as a strong correlation (p < 0.01). This is a general feature of persons not familiar with sensory assessment. It is questionable whether the preferences for mouth feel and flavour are worth separating in consumer test.
The consumer test in Study I was separated into several sessions because the number of cheeses was too high for one session. Cheeses of every variety were evaluated in two sessions, full-fat cheeses and reduced-fat cheeses separately. The aim was to reduce the effect of fat content. However, the results were gathered in one table. By separating cheeses with variable fat, characteristics other than fattiness were enhanced. Thus, the basis for correlation analysis and PCA was still powerful except for the effect of fat content on preference. The number of cheeses in the consumer test could have been reduced if preliminary tests were implemented.
The Havarti-type cheeses in Study II were chosen according to market share. Not surprisingly, they were all liked in the consumer test. Havarti-type cheeses have a mild flavour, thus their sensory characteristics are generally quite similar. Although sensory characteristics had statistically significant differences between cheeses, the cheeses did not have remarkable differences. However, for preference mapping the samples should be variable to get a clear result. A preliminary elimination of samples might have clarified the conclusions. Another decision was to choose only reduced-fat cheeses. In this study full-fat and reduced-fat cheeses were categorized separately as different cheese varieties. The idea was that this way the differences between cheeses with similar fat content are more easily detected, as the fat is not overwhelming the sensation. The total amount of 10 cheeses in the consumer test was high, despite the fact it is only slightly higher than the number in a session in Study I (where n=6-8). Evaluating 10 cheeses with moderate similarity is a hard job for a consumer. It would have been easier for consumers if the number of cheeses was lower. We could have chosen four to six cheeses presenting as different characteristics as possible, based on quality description analysis (sensory profile) created by experts. As in

65
Study I, reducing the number of samples in the consumer test might have enhanced the differences in appeal between the cheeses.
The correlation analysis between sensory, chemical characteristics and liking was done by Pearson correlation in Study I and by Spearman’s rank correlation in Study II. Pearson correlation is a parametric test with presumptions about data. The presumptions are that data should be continuous and normally distributed and variances should be equal. The risk of wrong conclusions increases if parametric tests with unfulfilled presumptions are applied. With a low number of samples, the normal distribution is difficult to fulfil. In addition, the variances were not equal for every parameter and the scale in the consumer test was non-continuous. All these deviations from the presumptions increase the risk of false conclusions. However, there were a high number of consumers to diminish the risk. In addition, the results in Study I were also analysed by Spearman’s rank test and the results were highly comparable to Pearson correlation test. The low number of samples and the non-normal distribution of some parameters were taken into account in Study II by choosing Spearman’s rank correlation, which is a non-parametric test suitable for situations where presumptions are not fulfilled. ANOVA is also a parametric test. Instead of ANOVA, a non-parametric analysis of variances test would have been more reliable in studies I and II. For instance, Kruskal-Wallis is a non-parametric ANOVA test where the distributions do not have to be normal and the variances do not have to be equal.
6.1.2 FATTY ACID ANALYSIS
The base-catalysed esterification used in Study III is commonly utilised. A disadvantage is that is does not convert FFAs into FAMEs (Shantha and Napolitano 1992). In addition, the procedure in Study III included a heating step. Although being short and relatively mild (50 °C), it could have caused isomerisation of highly reactive fatty acids. Unfortunately, a part of the volatile, short-chain fatty acids are vanished in this heating period. In addition, cheeses may have moderate amounts of FFAs that are not included in the analysis. Nonetheless, the aim of the study was in the fatty acid profile and FFAs are not a remarkable part of total fatty acids in any other product than ripened cheese.
Careless handling of samples may cause significant loss of highly volatile short-chain fatty acids. In Study IV, free fatty acids were not esterified to avoid the loss. Short-chain fatty acids are volatile and thus easily separated by GC, but long-chain fatty acids are not as volatile. The validated method was linear for fatty acid C4:0 to C18:3 in a range from 0.015 mg/ml (19 mg/kg) to 0.193 mg/ml (241 mg/kg). The linearity range is slightly larger than in the study by Berard et al. (2007), who validated a similar method. Their linearity range started from 25 – 100 mg/kg for corresponding fatty
Discussion
66
acids and ended at 75 - 200 mg/kg. The lower limit for linearity was higher for long-chain fatty acids C20:0 and C22:0, being 0.039 mg/ml (48 mg/kg). In addition, the repeatability of C22:0 (7.26 mg/kg) was worse than the one of other fatty acids (1.30 – 6.40 mg/kg). Berard et al. (2007) did not include long-chain fatty acids (>18 carbons) into their study at all. The recoveries were in a range from 32 % to 55 %, irrespective of chain length or concentration (Table 7), even though the longest fatty acids C20:0 and C22:0 had the lowest recoveries. Bread cheese has considerably higher water content than Emmental has (52 % and 35 %, respectively, Rastas et al. 1997), which may have affected on the extraction of FFAs. de Jong and Badings (1990) added ethanol to milk to enhance the extraction of FFAs from aqueous phase. Even though bread cheese is a cheese, the water content might have been too high and the recovery might not be comparable to the recovery of ripened cheeses. Neither certified reference material nor a proficiency test was available at the time of validation, so the trueness of the method could not be confirmed. It was concluded that the internal standards correct the questionable recovery sufficiently until the bias of the method can be evaluated reliably. It can be concluded that the method was applicable to the aim of the study. If long-chain FFAs were more abundant, the suitability of the method should be reconsidered.
The concentrations of short-chain FFAs for trial Emmental (138 – 221 mg/kg) are well comparable to mini Emmental (73 – 156 mg/kg, Thierry et al. 2004) and Finnish Emmental (estimation from the figure: 200 mg/kg, Pillonel et al. 2005). In their review, Collins et al. (2003) also have similar values for short-chain FFAs in Emmental (228 mg/kg), but greater values for total FFAs in Emmental (2206 mg/kg) and in Swiss cheese (2926 – 9843 mg/kg) compared to concentrations (521-973 mg/kg) in trial Emmental in Study III.
Both columns, one (DB-23, Agilent Technologies, USA) with a polar phase, (50%-Cyanopropyl)-methylpolysiloxane, and the other (HP-88, Agilent Technologies, USA) with a highly polar stationary phase, nitroterephthalic acid modified polyethylene glycol, are well suited for FAME analysis. The longer the column, the better the resolution of isomers, thus the 100m column is an excellent choice for trans fatty acids. The higher polarity of the HP-88 is also a benefit in cis/trans separation. The column ZB-FFAP (Phenomenex, USA) is aimed at free fatty acid analysis. Its phase, modified polyethylene glycol, is highly polar.
To correct for the chromatographic step, a correction factor based on a known standard is often used. A standard mixture with known proportions of fatty acids is analysed in a similar way at the same time as the samples. By correlating the bias between the measured area per cents and the known proportion of certain fatty acids, a correction factor for the fatty acid is calculated. By this correction factor, the error from chromatography is taken into account. However, in this study this correction was not made. This leads to the underestimation of the amount of short-chain fatty acids and may lead
67
to the overestimation of the amount of very long fatty acids, but the distortion is not remarkable with sums of fatty acids (SFAs, MUFAs, PUFAs and TFAs) because of the abrogation effect. The aim of the study was to compare products on the market, thus normalisation was considered adequate.
The quantification of fatty acids in Study III was based on normalisation. This procedure gives the proportions of different fatty acids rather than actual concentrations in the sample. However, it is a simple way of achieving approximate amounts of fatty acids and an adequate method with well-known products. If the fat content and a typical proportion of triglycerides of total fat in the product are known, the precision of the result is adequate for nutritional purposes. Internal standards can be used to correct the result for total pre-treatment starting from fat extraction, including esterification, separation and detection, depending on the step where the internal standard is added.
The quantification of free fatty acids in Study IV was based on internal standards. Therefore, the results here reflect the actual concentrations in cheeses better than in study III. Three internal standards (C5:0, C9:0 and C17:0) were used for fatty acids with variable chain lengths. In this study, concentrations were more important than proportions, because processing has a great influence on lipolysis and thus to total amounts of free fatty acids.
The products for Study III were chosen according to fat content, milk basis and novelty. Margarines, spreads and shortenings generally had a remarkable amount of TFAs in previous decades (Aro et al. 1998). They are consumed as a healthy alternative to butter, which has a lot of SFAs. The amounts consumed are remarkable in diet, too. Fats covered 13 - 15 % of energy (KTL 2008) for Finnish men and women. We collected two samples (two different batches) of each spread (and margarine) and one product of each shortening on the market at the time. Thus the sampling covered the Finnish market well.
As in the case with margarines, vegetable fat ice creams and half creams as well as imitation cheeses are considered healthy alternatives to traditional dairy products. Thus, the aim was to study these partly novel products in view of their healthy fatty acid profile. Richter et al. (2009) reported TFA values of up to 22.9 % of total fatty acids for ice creams and information on other products was not found. Other possibly remarkable sources of TFAs are for instance cookies, pastries, French fries and instant soups (Table 1), but the scope of the study was restricted to dairy products. It would be interesting to study the fatty acid profile and TFA content of these products in the future. However, the TFA content of food has been shown to be reducing generally (Aro 2006, Roe et al. 2013).
The cheeses in the fatty acid profile Study III were commercial cheeses from the market. Thus, the information on raw milk and production parameters were not available. The lack of information made the comparison between products unreliable. We may assume that raw milk did not exhibit

Discussion
68
remarkable differences in fatty acid profile between varieties, since cheese varieties have a typical ripening time and the cheeses in the study were produced at about the same time. However, this study was not large enough to cover seasonal effects. Cheese production has been shown to cause only minor chances in CLA content (Bisig et al. 2007), and furthermore, Prandini et al. (2011) found statistically significant differences in fatty acid profiles but not in the CLA level of cheeses produced by dissimilar technologies. However, statistically significant differences were not found between reduced-fat cheese varieties but between full-fat and reduced-fat cheeses in Study III. When taking all the cheese varieties together, the total number of samples was higher and was sufficient to show preliminary results. To conclude anything for sure, controlled pilot cheese studies should be performed.
6.2 THE IMPACT OF FAT REDUCTION IN DAIRY FOODS
Obesity is a problem that is worsening globally. If total energy content in diet is greater than the consumed energy, people gain weight. Therefore, all aspects of reducing energy in diet as well as increasing the consumption of energy must be considered carefully. Dry matter content is lower in reduced-fat cheeses than in full-fat cheeses (Ritvanen 2013), but this has no nutritional impact. Sometimes fat replacers are used in cheeses, but it is not common in the EU. According to the labels, reduced-fat cheeses in studies I, II and III did not include fat replacers. Thus, the fat reduction reduced the total energy respectively. In Study III, reduced-fat cheeses had a lower proportion of SFAs and a higher proportion of LA than full-fat cheeses. Although these findings can be considered positive for reduced-fat cheeses, their significance in total diet is not remarkable. Thus, total fat content and total energy reductions are the most significant factors for human health when choosing cheese. According to this study, reduced-fat cheeses are a good way of reducing energy in diet. Their fatty acid profile is not worse than in full-fat cheeses in nutritional aspect, but the lower fat content helps in an attempt to decrease energy and saturated fat in diet.
Light spreads in Study III had 29 % to 41 % fat compared to 60 % to 80 % fat in spreads and margarines. Total energy contents were not calculated, but they can be assumed to correlate strongly with fat contents, thus energy contents are significantly lower in light spreads. Light spreads had smaller proportions of CLAs and TFAs than fattier spreads. The first property is considered negative for heath and the other positive, as CLAs may have health promoting effects while TFAs impair health. However, TFA contents were low in the study and associated with fat mixtures containing butter, thus TFAs were for the most part of ruminant origin. It can be concluded that spreads on the market do not contain TFA in harmful amounts. Light and

69
regular spreads had 6.5 ± 4.1 % and 5.2 ± 2.3 % ALA of total fatty acids, respectively. Because the variation between brands was large, the difference in proportions of ALA was not statistically significant between fat classes. In the opinion of the n-3 fatty acid source, fattier spreads have more fat and thus their n-3 fatty acid content is generally higher, too. Interestingly, in this study the variability between products (standard deviation) was slightly greater in light spreads than in regular fat spreads. In the light of this study, spreads in general have acceptable fatty acid profiles, but in order to increase the intake of essential fatty acids, spreads with higher fat content are usually better than light spreads. However, there are large differences between products and awareness of the healthiness of certain fatty acids is needed for consumer.
There was no statistical difference in liking between full-fat and reduced-fat cheeses in Study I. Reduced-fat cheeses are claimed to be bitter and tough (Mistry 2001), but these attributes were not significantly different between reduced-fat cheeses and full-fat cheeses of any variety in Study I. It is noteworthy that these cheeses were assessed by separated panels, but similar background of assessors together with calibrating sessions diminishes the uncertainty arising from panel differences. In addition, Havarti-type cheeses in Study II were neither bitter nor tough. It can be concluded that reduced-fat cheeses in this study did not have significant defects and they were generally as appealing as full-fat cheeses. Full-fat Havarti-type and Edam cheeses were creamier and had more richness of flavour than reduced-fat cheeses. Full-fat Emmental cheeses had a more nutty flavour than reduced-fat cheeses. Nutty flavour is characteristic of Emmental. It can be concluded that the reduced-fat cheeses on the market in those years were generally accepted, but there were still some important deviations in the sensory profile. Results from studies I and II show that consumers need stronger flavours in reduced-fat cheeses. Nonetheless, production parameters are undergoing constant development. Indeed, cheeses with a fat content as low as 5 %, are on the market today. Thus, reduced-fat cheeses have strong possibilities to become as appealing and accepted as full-fat cheeses.
6.3 THE IMPACT OF FAT REPLACEMENT IN DAIRY FOODS
In vegetable fat dairy products, the total energy is not changed, but fat type (fatty acid profile) is. However, the choice of fat source has a critical impact on the fatty acid profile. Rapeseed (canola) oil is considered healthy, thus many products have rapeseed oil totally or partly replacing milk fat. In this study vegetable fat cheese analogues had rapeseed oil replacing milk fat and thus their fatty acid profile was similar to rapeseed oil. Coconut oil is very
Discussion
70
saturated, but researchers are not unanimous about the health effects of saturated fat in general (Gurr 2009, Baum et al. 2012). In many products in Study III, the source of vegetable fat was not identified. Thus it is difficult to compare the products. Surprisingly, vegetable fat ice creams in general had as high a proportion of SFAs as cream. Thus, with the aim of reducing saturated fat in diet, products’ nutritional information sheets must be read carefully. In this study the mean value for the proportion of PUFAs was higher in vegetable fat half creams and ice creams than in creams, but the variation was large in both product groups. However, it was a positive finding of this study that none of the studied products had TFAs in remarkable proportions. It can be concluded that replacing dairy fat with vegetable fat does not automatically improve the healthiness of the fatty acid profile. As with spreads, awareness of the health effects of certain fatty acids is needed for consumer. Nevertheless, with vegetable fat dairy products, it is possible to increase the healthiness of fat in the diet.
The sensory aspects of fat replacement are critical to the consumer. Vegetable fat cheese analogues were not liked in Study I. The flavour changes dramatically if milk fat is totally changed to rapeseed oil. In addition, the mouth feel of cheese analogues was not liked. However, it is possible that consumers were not able to discriminate between mouth feel and flavour since the attributes correlated strongly. Today there are cheeses with partly replaced milk fat on the market. It would be interesting to compare these products to cheeses.
6.4 THE IMPACT OF FREE FATTY ACIDS ON CHEESE FLAVOUR
Free fatty acids are an important factor in the flavour of Emmental. Homogenised H5 and H10 cheeses in Study IV had increased amounts of free fatty acids due to enhanced lipolysis. This was expected to increase the lipolytic (rancid) flavour. However, the effect was not seen in the study. Interestingly, the attributes of sourness and fatty taste were significantly higher in H5 and H10 cheeses than in control and H0 cheeses (Figure 2b in IV). This might reflect the inability of the panellists to discriminate between flavours. Another explanation for the absence of rancid flavour might be linked to sample handling. In Study IV flavour was assessed by smelling a cheese cube cut 24 hours before evaluation. Free fatty acids are very volatile, thus the rancid flavour might have been evaporated from the surface. By chewing the sample, the flavour would have been released from the matrix at the moment of evaluation. In fact, taste intensity but not odour intensity was significantly higher in H5 and H10 cheeses than in control and H0 cheeses (Figure 2b in IV). Food-related flavour had equal intensity when sensed via the orthonasal (by nose) versus the retronasal (by mouth) route in a study by

71
Small et al. (2005). In addition, thresholds to flavours are usually lower when they are sensed orthonasally (Bojanowski and Hummel 2012), so the rancid flavour should have been detectable. The samples in Study IV were probably flat at the time of odour assessment. However, the results show that homogenisation increases the taste intensity of Emmental, although the effect of free fatty acids cannot be clearly demonstrated.

Conclusions
72
7 CONCLUSIONS
Fat in food has been a topic of discussions related to health, obesity, diseases and well-being. This study shows that it is possible to create reduced-fat dairy products with appealing characteristics. In this study reduced-fat cheeses were as liked as regular fat cheeses. The differences in liking resulted more from differences in production parameters than fat content. The properties influencing liking were slightly different in reduced-fat cheeses than in regular fat cheeses. In Havarti-type cheeses, creamy and rich flavour and sticky texture were preferred in both reduced-fat and full-fat subgroups. In addition, salt content correlated with the preference for reduced-fat Havarti-type cheeses. Stickiness also correlated with preference in reduced-fat Edam and Emmental cheeses, but not in full-fat analogues. Other attributes that correlated with preference in reduced-fat cheeses but not in full-fat analogues were sourness, creaminess, richness and salty flavour and salt content for Edam and lipolytic flavour for Emmental. Intensity of flavour correlated with preference for both reduced-fat and full-fat Edam. It can be concluded that in general, reduced-fat cheeses were lacking flavour. Thus, the liking of reduced-fat cheeses might increase if flavour intensities could be increased. This is a challenge to cheese producers to develop delicious cheeses with more intense and balanced flavour but reduced fat content. However, it is desirable that the flavour intensity is not increased with salt, as it has negative health effects.
In this study the fatty acid profiles of the cheeses were not significantly affected by cheese variety. Some minor differences between full-fat and reduced-fat cheeses were seen, but the issue needs more studying. Trans fatty acids, especially those that are industrially produced, have negative impacts on health. This study shows that spreads, shortenings and several milk-based products on the Finnish market do not contain harmful amounts of trans fat. More interestingly, products have variable amounts of essential fatty acids and n-3 fatty acids. Therefore, the aim of the fatty acid analysis should be not only to confirm the absence of undesirable fatty acids, but also to pay attention to nutritionally important fatty acid. However, it is not absolutely clear, even to nutritionists, which are the desirable fatty acids and which are not.
At the same time, we are gathering more information on the special effects of individual fatty acids. This adds pressure on the fatty acid analysis. More specific information on fatty acids is needed, the identification of the isomers have to be more accurate than before. A mass selective detector has an advantage over a flame ionisation detector just in terms of identification. Every compound is decomposed into characteristic fragments. The masses of these fragments are detected and the parent ion, fatty acid, can be judged by these fragments. Depending on the derivation method, several features of the

73
fatty acid, namely length, saturation, amount, localisation and sometimes geometric isomerisation of double bonds, can be revealed. Accurate identification and quantification also requires good separation between fatty acid isomers. In this study, polar and highly polar columns with 60 m or 100 m length were sufficient for cis/trans separation for nutritional purposes. The analysis of fatty acid methyl esters by GC-MSD provided good information on fatty acids in dairy food. In addition, the pre-treatment of samples, fat extraction, is crucial to achieve unaffected fatty acids for further analysis. The method utilized in this study would be appropriable for other food matrices, as long as the pre-treatment of the sample is modified according to matrix.
In this study, free fatty acids of Emmental cheese were quantitatively analysed by GC-MSD without derivatisation. Internal standards were used to correct for the effect of the sample treatment. The method was suitable for cheese and for short- and medium-chain fatty acids. These volatile fatty acids contribute to the flavour of cheese. The novel low pressure homogenisation of cheese milk increased the content of free fatty acids and the intensity of taste in trial cheeses.
The next step in the development of appealing and healthy cheeses would be to test the homogenisation procedure in the production of reduced-fat Emmental. As the homogenisation enhances the flavour and the fatty mouth feel, it might be the tool that is necessary to increase the flavour intensity of reduced-fat cheeses. In addition, a consumer test is needed to verify the acceptability of the cheeses. This study shows that with different technological procedures the possibilities to enhance the flavour of cheese are wide, but a lot of work is needed.
The analysis of fatty acids is constantly progressing. For fatty acid analysis, the implementation of derivatives other than fatty acid methyl esters will probably become common together with mass spectrometric methods. In the future, quick methods like Near-Infrared Transmittance might advance further for the requirements of comprehensive screening studies.
Conclusions
74
REFERENCES
Ackman, R.G. (2008) Fatty acids in fish and shellfish. In: Fatty acids in Foods and their Health Implications, Ed. By Chow, C.K., 3rd Ed., Taylor & Francis Group, CRC Press, Boca Raton, USA.
Aime, D.B., Arntfield, S.D., Malcolmson, L.J. and Ryland, D. (2001) Textural
analysis of fat reduced vanilla ice cream products. Food Research International 34:237-246.
Albers, M.J., Harnack, L.J., Steffen, L.M. and Jacobs, D.R. (2008) 2006
Marketplace survey of trans-fatty acid content of margarines and butters, cookies and snack cakes, and savory snacks. Journal of the American Dietetic Association 108:367-370
Ansorena, D., Echarte, A., Ollé, R. and Astiasarán, I. (2013) 2012: No trans
fatty acids in Spanish bakery products. Food Chemistry 138:422-429. Araujo, P., Nguyen, T.-T., Frøyland, L., Wang, J. and Kang, J.X. (2008)
Evaluation of a rapid method for the quantitative analysis of fatty acids in various matrices. Journal of Chromatography A 1212:106-113.
Aro, A. (2006) The scientific basis for trans fatty acid regulations – Is it
sufficient? A European perspective. Atherosclerosis Supplements 7(2):67-68.
Aro, A., Van Amelsvoort, J., Becker, W,. van Erp-Baart, M.-A., Kafatos, A.,
Leth, T. and van Poppel G. (1998) Trans fatty acids in dietary fats and oils from 14 European countries: The TRANSFAIR study. Journal of Food Composition and Analysis 11(2):137–149.
Aspenström-Fagerlund, B. (2012) Dietary fatty acids increase the absorption
of toxic substances and drugs by modifying different absorption pathways in the intestinal epithelium. Doctoral thesis no. 88, Faculty of Veterinary Medicine and Animal Sciences, Swedish University of Agricultural Sciences, SLU Service/Repro, Uppsala, Sweden.
Astrup, A., Chaput, J.-P., Gilbert, J.-A., and Lorenzen, J.K. (2010) Dairy
beverages and energy balance. Physiology & Behavior 100:67-75. Astrup, A., Dyerberg, J., Elwood, P., Hermansen, K., Hu, F.B., Jakobsen,
M.U., Kok, F.J., Krauss, R.M., Lecerf, J.M., LeGrand, P., Nestel, P., Risérus, U., Sanders, T., Sinclair, A., Stender, S., Tholstrup, T. and Willett, W.C. (2011) The role of reducing intakes of saturated fat in the prevention of cardiovascular disease: where does the evidence stand in 2010? American Journal of Clinical Nutrition 93:684-688.

75
Atherton, H.V. and Newlander, J.A., (1977) Chemistry and testing of dairy products, 4th ed., The Avi Publishing Company Inc, Westport, p. 396.
Bachmann, H.-P. (2001) Cheese analogues: A review. International Dairy
Journal 11:505-515. Banks, J.M. (2004) The technology of low-fat cheese manufacture.
International Journal of Dairy Technology 57:199-207. Baum, S.J., Kris-Etherton, P.M., Willett, W.C., Lichtenstein, A.H., Rudel,
L.L., Maki, K.C., Whelan, J., Ramsden, C.E., and Block, R.C. (2012) Fatty acids in cardiovascular health and disease: A comprehensive update. Journal of Clinical Lipidology 6:216-234.
Becker, R. (2008) Fatty acids in food cereal grains and grain products. In:
Fatty acids in Foods and their Health Implications, Ed. By Chow, C.K., 3rd Ed., Taylor & Francis Group, CRC Press, Boca Raton, USA.
Berard, J., Bianchi, F., Careri, M., Chatel, A., Mangia, A. and Musci, M.
(2007) Characterization of the volatile fraction and of free fatty acids of “Fontina Valle d’Aosta”, a protected designation of origin Italian cheese. Food Chemistry 105:293-300.
Bisig, W., Eberhard, P., Collomb, M. and Rehberger, B. (2007) Review -
Influence of processing on the fatty acid composition and the content of conjugated linoleic acid in organic and conventional dairy products – a review. Lait, 87:1-19.
Bojanowski, V. and Hummel, T. (2012) Retronasal perception of odors.
Physiology & Behavior 107:484-487. Booker, C.S. and Mann, J.I. (2008). Review – Trans fatty acids and
cardiovascular health: Translation of the evidence base. Nutrition, Metabolism and Cardiovascular Diseases 18:448-456.
Bowen, D., Green, P., Vizenor, N., Vu, C., Kreuter, P. and Rolls, B. (2003)
Effects of fat content on fat hedonics: cognition or taste? Physiology & Behavior 78:247-253.
Brenna, J.T., Salem Jr., N., Sinclair, A.J. and Cunnane, S.C. (2009) α-
Linolenic acid supplementation and conversion to n-3 long-chain polyunsaturated fatty acids in humans. Prostaglandins, Leukotrienes and Essential Fatty Acids 80:85-91.
Cadena, R.S., Cruz, A.G., Faria, J.A.F. and Bolini, H.M.A. (2012) Reduced fat
and sugar vanilla ice creams: Sensory profiling and external preference mapping. Journal of Dairy Science 95:4842-4850.
Conclusions
76
Cai, S-S. and Syage, J.A. (2006) Atmospheric pressure photoionization mass spectrometry for analysis of fatty acid and acylglycerol lipids. Journal of Chromatography A 1110:15-26.
Ceriani, R. and Meirelles, A.J.A. (2007) Formation of trans PUFA during
deodorization of canola oil: A study through computational simulation. Chemical Engineering and Processing 46:375-385.
Chojnicka-Paszun, A., de Jongh, H.H.J. and de Kruif, C.G. (2012) Sensory
perception and lubrication properties of milk: Influence of fat content. International Dairy Journal 26:15-22.
Christie W.W. (1989) Gas chromatography and lipids - a practical guide. 1st
edition, The Oily Press, Bell and Bain, Glasgow, GB. Christie, W.W. (1998a) Mass spectrometry of fatty acids with methylene-
interrupted ene-yne systems. Chemistry and Physics of Lipids 94:35-41. Christie, W.W. (1998b) Review- Gas chromatography-Mass spectrometry
methods for structural analysis of fatty acids. Lipids 33:343-353. Collins, Y.F., McSweeney, P.L.H. and Wilkinson, M.G. (2003) Review –
Lipolysis and free fatty acid catabolism in cheese: a review of current knowledge. International Dairy Journal 13:841-866.
Collomb, M., Schmid, A., Sieber, R., Wechsler, D. and Ryhänen, E.-L. (2006)
Review – Conjugated linoleic acids in milk fat: variation and physiological effects. International Dairy Journal 16:1347-1361.
Cunha, C.R., Dias, A.I., and Viotto, W.H. (2010) Microstructure, texture,
colour and sensory evaluation of a spreadable processed cheese analogue made with vegetable fat. Food Research International 43:723-729.
Day, C.J., McHale, S. and Francis, J. (2012) Individual differences and
preference for dietary fat using the Fat Preference Questionnaire© in a UK sample. Appetite 58:679-686.
de Geus, H.-J., Aidos, I., de Boer, J., Luten, J.B. and Brinkman, U.A.Th.
(2001) Characterization of fatty acids in biological oil samples using comprehensive multidimensional gas chromatography. Journal of Chromatography A 910:95-103.
Degrace-Passilly, P. and Besnard, P. (2012) Review - CD36 and taste of fat.
Current Opinion in Clinical Nutrition and Metabolic Care 15(2):107-11. de Jong, C. and Badings, H. T. (1990). Determination of free fatty acids in
milk and cheese procedures for extraction, clean up, and capillary gas chromatographic analysis. Journal of High Resolution Chromatography 13(2):94-98.
77
Delmonte, P., Hu, Q., Fardin Kia, A.-R. and Rader, J.I. (2008) Preparation, chromatographic separation and relative retention times of cis/trans heptadecaenoic (17:1) fatty acids. Journal of Chromatography A 1214:30-36.
Delmonte, P., Fardin Kia, A.-R., Hu, Q., and Rader, J.I. (2009) Review of
methods for preparation and gas chromatographic separation of trans and cis reference fatty acids. Journal of AOAC International 92(5):1310-1326.
Delmonte, P., Fardin Kia, A.-R., Kramer, J.K.G., Mossoba, M.M., Sidisky, L.
and Rader, J.I. (2011) Separation characteristics of fatty acid methyl esters using SLB-IL111, a new ionic liquid coated capillary gas chromatographic column. Journal of Chromatography A 1218:545-554.
Deshpande, S.S. (2002) Handbook of food toxicology. Marcel Dekker, Inc,
New York, USA, p. 172, 348. Destaillats, F. and Angers, P. (2002) One-step methodology for the synthesis
of FA picolinyl esters from intact lipids. Journal of AOCS 79(3):253-256. Destaillats, F., Sébédio, J.-L., Berdeaux, O., Juanéda, P. and Angers, P.
(2005) Gas chromatography-mass spectrometry determination of metabolites of conjugated cis-9,trans-11,cis-15 18:3 fatty acid. Journal of Chromatography B 820:15-22.
Destaillats, F., Golay, P.-A., Joffre, F., de Wispelaere, M., Hug, B., Giuffrida,
F., Fauconnot, L. and Dionisi, F. (2007) Comparison of available analytical methods to measure trans-octadecenoic acid isomeric profile and content by gas-liquid chromatography in milk fat. Journal of Chromatography A 1145:222-228.
Díaz, M.T., Álvarez, I., De la Fuente, J., Sañudo, C., Campo, M.M., Oliver,
M.A., Font i Furnols, M., Montossi, F., San Julián, R., Nute, G.R. and Cañeque, V. (2005) Fatty acid composition of meat from typical lamb production systems of Spain, United Kingdom, Germany and Uruguay. Meat Science 71:256-263.
Dirinck, P. and De Winne, A. (1999) Flavour characterization and
classification of cheeses by gas chromatographic-mass spectrometric profiling. Journal of Chromatography A 847:203-208.
Dobson, G. and Christie, W.W. (1996) Structural analysis of fatty acids by
mass spectrometry of picolinyl esters and dimethyloxazoline derivatives. Trends in Analytical Chemistry 15(3):130-136.
Drake, M.A., Miracle, R.E. and McMahon, D.J. (2010) Impact of fat
reduction on flavor and flavor chemistry of Cheddar cheeses. Journal of Dairy Science 93:5069-5081.

Conclusions
78
Dreiucker, J. and Vetter, W. (2011) Fatty acids patterns in camel, moose, cow and human milk as determined with GC/MS after silver ion solid phase extraction. Food Chemistry 126:762-771.
Drewnowski, A. (1997) Taste preferences and food intake. Annual Review of
Nutrition 17:237–53. EFSA (2010) Scientific Opinion on Dietary Reference Values for fats,
including saturated fatty acids, polyunsaturated fatty acids, monounsaturated fatty acids, trans fatty acids, and cholesterol. EFSA Journal 8:1-107.
Erkkilä, A., de Mello, V.D.F., Risérus, U. and Laaksonen, D.E. (2008) Review
- Dietary fatty acids and cardiovascular disease: An epidemiological approach. Progress in Lipid Research 47:172-187.
FAO (2012) Oilseeds market summary. Food Outlook, November 2012. FAO,
Trade and market division, Food and Agricultural Organization of the United Nations, Rome, Italy. http://www.fao.org/fileadmin/templates/est/COMM_MARKETS_MONITORING/Oilcrops/Documents/Food_outlook_oilseeds/Food_outlook_Nov_12.pdf
FAO/WHO (1966a) Code of principles concerning milk and milk products,
international standards for milk products and international individual standards for cheeses. Part III: International individual standards for cheeses. C-4: Edam. Codex Alimentarius Volume XVI (1st ed.).
FAO/WHO (1966b) Code of principles concerning milk and milk products,
international standards for milk products and international individual standards for cheeses. Part III: International individual standards for cheeses. C-6: Havarti. Codex Alimentarius Volume XVI (1st ed.).
FAO/WHO (1969) Code of principles concerning milk and milk products,
international standards for milk products and international individual standards for cheeses. Part III: International individual standards for cheeses. C-9: Emmentaler. Codex Alimentarius Volume XVI (1st ed.).
Fay, L. and Richli, U. (1991) Location of double bonds in polyunsaturated
fatty acids by gas chromatography-mass spectrometry after 4,4-dimethyloxazoline derivatization. Journal of Chromatography, 541:89-98.
Fenelon, M.A., Guinee, T.P., Delahunty, C., Murray, J. and Crowe, F. (2000)
Composition and sensory attributes of retail cheddar cheese with different fat contents. Journal of Food Composition and Analysis 13:13-26.
Frankel, E.N. (2005) Frying fats. In: Frankel E.N., Lipid oxidation, 2nd
edition, The Oily Press Lipid Library, Vol. 8, PJ Barnes & Associates, The Oily Press, Athenaeum Press Ltd, Gateshead, Tyne & Wear, Bridgwater, UK, pp. 355-389.

79
Frøst, M.B., Dijksterhuis, G. and Martens, M. (2001) Sensory perception of fat in milk. Food Quality and Preference 12:327-336.
Frøst, M.B. and Janhøj, T. (2007) Review – Understanding creaminess.
International Dairy Journal 17:1298-1311. Gallina Toschi, T., Bendini, A., Ricci, A. and Lercker, G. (2003) Pressurized
solvent extraction of total lipids in poultry meat. Food Chemistry 83:551-555.
Gebauer, S.K., Chardigny, J.-M., Uhre Jakobsen, M., Lamarche, B., Lock,
A.L., Proctor, S.D. and Baer, D.J. (2011) Review – Effects of ruminant trans fatty acids on cardiovascular disease and cancer: A comprehensive review of epidemiological, clinical, and mechanistic studies. Advances in Nutrition 2:332-354.
Griffin, B. A. (2008) How relevant is the ratio of dietary n-6 to n-3
polyunsaturated fatty acids to cardiovascular disease risk? Evidence from the OPTILIP study. Current Opinion in Lipidology 19:57-62.
Gu, Q., David, F., Lynen, F., Vanormelingen, P., Vyverman, W., Rumpel, K.,
Xu, G. and Sandra, P. (2011) Evaluation of ionic liquid stationary phases for one dimensional gas chromatography-mass spectrometry and comprehensive two dimensional gas chromatographic analyses of fatty acids in marine biota. Journal of chromatography A 1218:3056-3063.
Gurr, M.I. (2009) Lipids in nutrition and health: A reappraisal. The Oily
Press Lipid Library, Vol. 11. The Oily Press, PJ Barnes & Associates, Bridgwater, UK, p. 11.
Hamilton, J.T.G. and Christie, W.W. (2000) Mechanisms for ion formation
during the electron impact-mass spectrometry of picolinyl ester and 4,4-dimethyloxazoline derivatives of fatty acids. Chemistry and Physics of Lipids 105:93-104.
Harvey, D.J. (1992) Mass spectrometry of picolinyl and other nitrogen-
containing derivatives of lipids. In: Christie, W.W. (ed), Advances in lipid methodology - one. The Oily Press Ltd., Bell and Bain Ltd., Glasgow, Great Britain.
Hayes, D.G., Van Alstine, J.M., and Setterwall, F. (2000) Urea-based
fractionation of seed oil samples containing fatty acids and acylglycerols of polyunsaturated and hydroxy fatty acids. Journal of AOCS 77(2):207-213.
Heck, J.M.L., van Valenberg, H.J.F., Dijkstra, J. and Hooijdonk, A.C.M.
(2009) Seasonal variation in the Dutch bovine raw milk composition. Journal of Dairy Science 92:4745-4755.

Conclusions
80
Hijova, E. and Chmelarova, A. (2007) Topical review - Short chain fatty acids and colonic health. Bratislava Medical Journal - Bratislavske Lekarske Listy 108(8):354-358.
Hoenselaar, R. (2012) Review – Saturated fat and cardiovascular disease: the
discrepancy between the scientific literature and dietary advice. Nutrition 28:118-123.
Homma, R., Yamashita, H., Funaki, J., Ueda, R., Sakurai, T., Ishimaru, Y.,
Abe, K. and Asakura, T. (2012) Identification of bitterness-masking compounds from cheese. Journal of Agricultural and Food Chemistry 60:4492-4499.
Hou, J.-C., Wang, F., Wang, Y-T., Xu, J. and Zhang, C.-W. (2012) Assessment
of trans fatty acids in edible oils in China. Food Control 25:211-215. House, K.A. and Acree, T.E. (2002) Sensory impact of free fatty acids on the
aroma of model Cheddar cheese. Food Quality and Preference 13:481-488.
Hurtaud, C., Faucon, F., Couvreur, S. and Peyraud, J.-L. (2010) Linear
relationship between increasing amount of extruded linseed in dairy cow diet and milk fatty acid composition and butter properties. Journal of Dairy Science 93:1429-1443.
Hyötyläinen, T., Kallio, M., Lehtonen, M., Lintonen, S., Peräjoki, P., Jussila,
M. and Riekkola, M.-L. (2004) Comprehensive two-dimensional gas chromatography in the analysis of dietary fatty acids. Journal of Separation Science 27:459-467.
Härtig, C. (2008) Rapid identification of fatty acid methyl esters using a
multidimensional gas chromatography-mass spectrometry database. Journal of Chromatography A 1177:159-169.
IDF (1982) Cheese and processed cheese - Determination of total solids
content (reference method). Standard IDF 4a. International Dairy Federation, Brussels, Belgium.
IDF (1986) Cheese and processed cheese - Determination of fat content -
gravimetric method (reference method). Standard IDF 5b. International Dairy Federation, Brussels, Belgium.
IDF (1987) Cream – Determination of fat content (Röse-Gottlieb reference
method). Standard IDF16C. International Dairy Federation, Brussels, Belgium.
IDF (1988) Cheese and cheese products - Determination of chloride content -
potentiometric titration method. Standard IDF 88a. International Dairy Federation, Brussels, Belgium.

81
IDF (1997) Sensory evaluation of dairy products by scoring - reference method. IDF Standard 99C International Dairy Federation, Brussels, Belgium.
IDF (2011) The World Dairy Situation 2011. Bulletin of the International
Dairy Federation 451. ISO (2007) Sensory analysis — General guidance for the design of test rooms.
ISO Standard 8589 International Organization for Standardization, Geneva, Switzerland.
ISO-IDF (2001) Milk and milk products – Extraction methods for lipids and
liposoluble compounds. Standard ISO 14156 | IDF 172, International Dairy Federation and International Organization for Standardization, Brussels, Belgium.
ISO-IDF (2003) Butter, edible oil emulsions and spreadable fats –
Determination of fat content – (reference method). Standard ISO 14189 | IDF 194, International Dairy Federation and International Organization for Standardization, Brussels, Belgium.
ISO-IDF (2004) Cheese and processed cheese products – Determination of
fat content – Gravimetric method (reference method). Standard ISO 1735 | IDF 5, International Dairy Federation and International Organization for Standardization, Brussels, Belgium.
Jensen, R.G. (2002) Invited review: The composition of bovine milk lipids:
January 1995 to December 2000. Journal of Dairy Science 85:295-350. Johansen, S.B., Næs, T., Øyaas, J. and Hersleth, M. (2010) Acceptance of
calorie-reduced yoghurt: Effects of sensory characteristics and product information. Food Quality and Preference 21:13-21.
Jones, E.L., Shingfield, K.J., Kohen, C., Jones, A.K., Lupoli, B., Grandison,
A.S., Beever, D.E., Williams, C.M., Calder, P.C. and Yaqoob, P. (2005) Chemical, physical, and sensory properties of dairy products enriched with conjugated linoleic acid. Journal of Dairy Science 88:2923-2937.
Jung, M.Y. and Jung, M.O. (2002) Identification of conjugated linoleic acids
in hydrogenated soybean oil by silver ion-impregnated HPLC and gas chromatography-ion impacted mass spectrometry of their 4,4-dimethyloxazoline derivates. Journal of Agricultural and Food Chemistry 50:6188-6193.
Kaaki, D., Keppe Baghdadi, O., Najm, N.E. and Olabi, A. (2012) Preference
mapping of commercial Labneh (strained yoghurt) products in the Lebanese market. Journal of Dairy Science 95:521-532.
Kandhro, A., Sherazi, S.T.H., Mahesar, S.A., Bhanger, M.I., Younis Talpur,
M. and Rauf, A. (2008) GC-MS quantification of fatty acid profile

Conclusions
82
including trans FA in the locally manufactured margarines of Pakistan. Food Chemistry 109:207-211.
Karapanagiotidis, I.T., Bell, M.V., Little, D.C., Yakupitiyage, A. and Rakshit,
S.K. (2006) Polyunsaturated fatty acid content of wild and farmed Tilapias in Thailand: Effect of aquaculture practices and implications for human nutrition. Journal of Agricultural and Food Chemistry 54:4304-4310.
Keller, K.L., Liang, L.C.H., Sakimura, J., May, D., van Belle, C., Breen, C.,
Driggin, E., Tepper, B.J., Lanzano, P.C., Deng, L. and Chung, W.K. (2012) Common variants in the CD36 gene are associated with oral fat perception, fat preferences, and obesity in African Americans.Obesity 20(5):1066-73.
Kolanowski, W. and Weißbrodt, J. (2007) Sensory quality of dairy products
fortified with fish oil. International Dairy Journal 17:1248-1253. Kouba, M. and Mourot, J. (2011) Mini-review – A review of nutritional
effects on fat composition of animal products with special emphasis on n-3 polyunsaturated fatty acids. Biochimie 93:13-17.
Kris-Etherton, P.M. and Innis, S. (2007) Position of the American Dietetic
Association and Dietitians of Canada: Dietary fatty acids. Journal of the American Dietetic Association 107: 1599-1611.
KTL (2008) The National Findiet 2007 Survey. Kansanterveyslaitoksen
julkaisuja B23, Ed. Paturi M Tapanainen H Reinivuo H and Pietinen P, National Public Health Institute (KTL), Yliopistopaino, Helsinki, Finland, pp. 227.
Larsson, K. (1994) Basic concepts. In: Larsson, K., Lipids – molecular
organization, physical functions and technical applications, The Oily Press Lipid Library, Vol. 5, The Oily Press, Bell and Bain Ltd, Glasgow, UK, pp. 355-389.
Lawlor, J.B., Delahunty, C.M., Wilkinson, M.G. and Sheehan, J. (2002)
Relationships between the gross, non-volatile and volatile compositions and the sensory attributes of eight hard-type cheeses. International Dairy Journal 12:493-509.
Lawlor, J.B., Gaudette, N., Dickson, T. and House, J.D. (2010) Fatty acid
profile and sensory characteristics of table eggs from laying hens fed diets containing microencapsulated fish oil. Aninal Feed Science and Technology 156:97-103.
Leth, T., Jensen, H.G., Ærendahl Mikkelsen, A., and Bysted, A. (2006) The
effect of the regulation on trans fatty acid content in Danish food. Atherosclerosis Supplements 7:53–56.

83
Lima, E.S. and Abdalla, D.S.P. (2002) Review - High-performance liquid chromatography of fatty acids in biological samples. Analytica Chimica Acta 465:81-91.
Luf, M. and Brandl, E. (1986) Simultaneous determination of sorbic acid and
natamycin in and on cheese surfaces by means of high performance liquid chromatography (HPLC). Meijeritieteellinen Aikakauskirja XLIV:56–60.
Luque de Castro, M.D. and Priego-Capote, F. (2010) Review – Soxhlet
extraction: Past and present panacea. Journal of Chromatography A 1217:2383-2389.
Luthria, D.L. and Sprecher, H. (1993) 2-Alkenyl-4,4-dimethyloxazolines as
derivatives for the structural elucidation of isomeric unsaturated fatty acids. Lipids 28:561-564.
Luthria, D.L., Vinjamoori, D., Noel, K., and Ezzell, J. (2004) Accelerated
Solvent Extraction. In: Luthria, D.L. (Ed.), Oil Extraction and Analysis – Critical Issues and Comparative studies. AOCS Press Champaign, Illinois, USA .
Martini, S., Thurgood, J.E., Brothersen, C., Ward, R. and McMahon, D.J.
(2009) Fortification of reduced-fat Cheddar cheese with n-3 fatty acids: Effect on off-flavor generation. Journal of Dairy Science 92:1876-1884.
Mattes, R.D. (2009) Is there a fatty acid taste? Annual Review of Nutrition
29:305–327. Mehlenbacher, V.C. (1960) The analysis of fats and oils. The Garrard Press,
Publishers, Champaign, Illinois, USA, p. 1. Meier, S., Mjøs, S.A., Joensen, H. and Grahl-Nielsen, O. (2006) Validation of
a one-step extraction/methylation method for determination of fatty acids and cholesterol in marine tissues. Journal of Chromatography A 1104:261-298.
Mela, D.J. (1990) Sensory preferences for fats: What, who, why? Food
Quality and Preference 2:95-101. Micha, R. and Mozaffarian, D. (2008) Trans fatty acids: Effects on
cardiometabolic health and implications for policy. Prostaglandins, Leukotrienes and Essential Fatty Acids 79:147-152.
Mistry, V.V. (2001) Low fat cheese technology. International Dairy Journal
11:413-422. Moate, P.J., Chalupa, W., Boston, R.C. and I.J. Lean (2007). Milk fatty acids.
I. Variation in the concentration of individual fatty acids in bovine milk. Journal of Dairy Science 90:4730-4739.
Conclusions
84
Moisio, T. and Heikonen, M. (1996) A simple method for the titration of multicomponent acid-base mixtures. Fresenius Journal of Analytical Chemistry 354:271-277.
Mossoba, M.M., Moss, J. and Kramer, J.K.G. (2009) Trans fat labeling and
levels in U.S. Foods: Assessment of gas chromatographic and infrared spectroscopic techniques for regulatory compliance. Journal of AOAC International 92(5):1284-1300.
MTK (2012) Öljykasvinviljelijän opas. Päivitetty 23.4.2012. Maa- ja
metsätaloustuottajien liitto MTK ja Elintarviketeollisuuden Öljynpuristamoyhdistys, Fransco Oy, Helsinki, Finland, p. 34. Www.agronet.fi/rypsi2000/index-yleistietoa.html
Nawar, W. W. (1996). Lipids. In: Fennema, O.R. (ed), Food chemistry, 3rd
edition, Marcel Dekker Inc., New York, USA, pp. 225-319. Nelson, K.A.S. and Martini, S. (2009) Increasing omega fatty acid content in
cow’s milk through diet manipulation: Effect on milk flavour. Journal of Dairy Science 92:1378-1386.
Nkondjock, A., Shatenstein, B., Maisonneuve, P. and Ghadirian, P. (2003)
Specific fatty acids and human colorectal cancer: An overview. Cancer Detection and Prevention 27:55-66.
NMKL (2000) Nitrite and nitrate. Nitrite and/or nitrate in foodstuffs by ion
chromatography. Standard NMKL 165, Nordic Committee on Food Analysis, Oslo, Norway.
Palmquist, D.L., Beaulieu, A.D. and Barbano, D.M. (1993) Feed and animal
factors influencing milk fat composition. Journal of Dairy Science 76:1753-1771.
Palmquist, D.L. and Jensen, R.G. (2008) Fatty acids in milk fat. In: Fatty
acids in foods and their health implications, 3rd edition, ed. C. K. Chow, CRC Press, Taylor & Francis Group, Boca Raton, USA.
Park, Y. (2009) Study review – Conjugated linoleic acid (CLA): Good or bad
trans fat? Journal of Food Composition and Analysis 22S:S4-S12. Parodi, P.W. (1997) Cows’ milk fat components as potential anticarcinogenic
agents. Journal of Nutrition 127: 1055-1060. Patil, A.G., Oak, M.D., Taware, S.P., Tamhankar, S.A. and Rao, V.S. (2010)
Nondestructive estimation of fatty acid composition in soybean [Glycine max (L.) Merrill] seeds using Near-Infrared Transmittance Spectroscopy. Food Chemistry 120:1210-1217.
85
Pepino, M.Y., Love-Gregory, L., Klein, S. and Abumrad, N.A. (2012) The fatty acid translocase gene, CD36, and lingual lipase influence oral sensitivity to fat in obese subjects. Journal of Lipid Research 53:561-566.
Pereira, R., Matia-Merino, L., Jones, V. and Singh, H. (2006) Influence of fat
on the perceived texture of set acid milk gels: a sensory perspective. Food Hydrocolloids 20:305-313.
Peryam, D. R. and Pilgrim, F. J. (1957) Hedonic scale method of measuring
food preferences. Food Technology 11(9):9–14. Petrović, M., Gačić, M., Karačić, V., Gottstein, Ž., Mazija, H. and Medić, H.
(2012) Enrichment of eggs in n-3 polyunsaturated fatty acids by feeding hens with different amount of linseed oil in diet. Food Chemistry 135:1563-1568.
Pfeuffer, M. and Schrezenmeir, J. (2006) Review – Impact of trans fatty
acids of ruminant origin compared with those from partially hydrogenated vegetable oils on CHD risk. International Dairy Journal 16:1383-1388.
Phillips, L.G., McGiff, M.L., Barbano, D.M. and Lawless, H.T. (1995) The
influence of fat on the sensory properties, viscosity, and color of lowfat milk. Journal of Dairy Science 78:1258-1266.
Pillonel, L., Badertscher, R., Casey, M., Meyer, J., Rossmann, A.,
Schlichtherle-Cerny, H., Tabacchi, R. and Bosset J.O. (2005) Geographic origin of European Emmental cheese: Characterisation and descriptive statistics. International Dairy Journal 15:547-556.
Prandini, A., Sigolo, S. and Piva, G. (2011) A comparative study of fatty acid
composition and CLA concentration in commercial cheeses. Journal of Food Composition and Analysis 24:55–61
Prevot, M.A., Gantoi, E., Holand M., and Rosset, M. (1975) Methode rapide
de dosage de l’acide erucique dans les graines de colza. Revue Française des Corps Gras, 22:211-215.
Prindiville, E.A., Marshall, R.T. and Heymann, H. (1999) Effect of milk fat on
the sensory properties of chocolate ice cream. Journal of Dairy Science 82:1425-1432.
Rahmat Ullah, S.M., Murphy, B., Dorich, B., Richter, B. and Srinivasan, K.
(2011) Fat extraction from acid- and base-hydrolyzed food samples using accelerated solvent extraction. Journal of Agricultural and Food Chemistry 59:2169–2174.
Ralston, R.A., Lee, J.H., Truby, H., Palermo, C.E. and Walker, K.Z. (2012)
Review – A systematic review and meta-analysis of elevated blood pressure and consumption of dairy foods. Journal of Human Hypertension 26:3-13.

Conclusions
86
Rastas, M., Seppänen, R., Knuts, L.-R., Hakala, P. and Karttila, V. (1997)
Nutrient composition of foods. Kansaneläkelaitos, Gummerus Kirjapaino Ltd., Jyväskylä, Finland.
Ratnayake, W.M.N. (2004) Overview of the methods for the determination of
trans fatty acids by gas chromatography, silver-ion thin-layer chromatography, silver-ion liquid chromatography, and gas chromatography/mass spectrometry. Journal of AOAC International 87(2):523-539.
Remig V., Franklin, B., Margolis, S., Kostas, G., Nece, T. and Street, J.C.
(2010) Trans fats in America: A review of their use, consumption, health implications, and regulation. Journal of the American Dietetic Association 110:585-592.
Richter, E.K., Shawish, K.A., Scheeder, M.R.L. and Colombani, P.C. (2009)
Trans fatty acid content of selected Swiss foods: The TransSwissPilot study. Journal of Food Composition and Analysis 22:479-484.
Riediger, N.D., Othman, R.A., Suh, M. and Moghadasian, M.H. (2009) A
systematic review of the roles of n-3 fatty acids in health and disease. Journal of the American Dietetic Association 109:668-679.
Ritvanen, T. (2013) Reduced-fat cheeses: composition and health potential.
In: Preedy, V.R., Watson, R.R. and Patel, V.B. (ed), Handbook of cheese in health: production, nutrition and medical sciences, Human health handbooks, vol. 6, Wageningen Academic Publishers, in press.
Ritvanen, T., Lampolahti, S., Lilleberg, L., Tupasela, T., Isoniemi, M.,
Appelbye, U., Lyytikäinen, T., Eerola, S. and Uusi-Rauva, E. (2005) Sensory evaluation, chemical composition and consumer acceptance of full fat and reduced fat cheeses in the Finnish market. Food Quality and Preference 16:479-492.
Robinson, J.E., Singh, R. and Kays, S.E. (2008) Evaluation of an automated
hydrolysis and extraction method for quantification of total fat, lipid classes and trans fat in cereal products. Food Chemistry 107:1144-1150.
Roe, M., Pinchen, H., Church, S., Elahi, S., Walker, M., Farron-Wilson, M.,
Buttriss, J. and Finglas, P. (2013) Trans fatty acids in a range of UK processed foods. Food Chemistry 140:427-431.
Rontani, J.F., Zabeti, N. and Aubert, C. (2009) Double bond migration to
methylidene positions during electron ionization mass spectrometry of branched monounsaturated fatty acid derivatives. Journal of American Society for Mass Spectrometry 20:1997-2005.
Ruiz-Rodriguez, A., Reglero, G. and Ibañez, E. (2010) Review – Recent
trends in the advanced analysis of bioactive fatty acids. Journal of Pharmaceutical and Biomedical Analysis 51:305-326.
87
Saint-Eve, A., Lauverjat, C., Magnan, C., Déléris, I. and Souchon, I. (2009)
Reducing salt and fat content: Impact of composition, texture and cognitive interactions on the perception of flavoured model cheeses. Food Chemistry 116:167-175.
Salas-Salvadó, J., Martinez-González, M.Á, Bulló, M., and Ros, E. (2011) The
role of diet in the prevention of type 2 diabetes. Nutrition, Metabolism & Cardiovascular Diseases 21:B32-B48.
Samman, S., Chow, J.W.Y., Foster, M.J., Ahmad, Z.I., Phuyal, J.L. and
Petocz, P. (2008). Fatty acid composition of edible oils derived from certified organic and conventional agricultural methods. Food Chemistry 109:670-674.
Samman, S., Kung, F.P., Carter, L.M., Foster, M.J., Ahmad, Z.I., Phuyal, J.L.
and Petocz, P. (2009). Fatty acid composition of certified organic, conventional and omega-3 eggs. Food Chemistry 116:911-914.
Saunders, D., Jones, S., Devane, G.J., Scholes, P., Lake, R.J. and Paulin, S.M.
(2008) Trans fatty acids in the New Zealand food supply. Journal of Food Composition and Analysis 21:320-325.
Schmidt, Š. (2000) Formation of trans unsaturation during partial catalytic
hydrogenation. Eur. Journal of Lipid Science and Technology 102:646-648.
Schwarz, W. (2000) Formation of trans polyalkenoic fatty acids during
vegetable oil refining. Eur. Journal of Lipid Science and Technology 102:648-649.
Schäfer, K. (1998) Accelerated solvent extraction of lipids for determining the
fatty acid composition of biological material. Analytica Chimica Acta 358:69-77.
Seppänen-Laakso, T., Laakso, I. and Hiltunen, R. (2002) Review – Analysis
of fatty acids by gas chromatography, and its relevance to research on health and nutrition. Analytica Chimica Acta 465:39-62.
Shantha, N.C. and Napolitano, G.E. (1992) Review - Gas chromatography of
fatty acids. Journal of Chromatography 624:37-51, Shin, J.-M., Hwang, Y.-O., Tu, O.-J., Jo, H.-B., Kim, J.-H., Chae, Y.-Z., Rhu,
K.-H. and Park, S.-K. (2013) Comparison of different methods to quantify fat classes in bakery products. Food Chemistry 136:703-709.
Siciliano, C., Belsito, E., De Marco, R., Di Gioia, M.L., Leggio, A. and Liguori,
A. (2013) Quantitative analysis of fatty acid chain composition in pork meat products by high resolution 1H NMR spectroscopy. Food Chemistry 136:546-554.
Conclusions
88
Sierra, V., Aldai, N., Castro, P., Osoro, K., Coto-Montes, A. and Oliván, M.
(2008) Prediction of the fatty acid composition of beef by near infrared transmittance spectroscopy. Meat Science 78:248-255.
Small, D.M., Gerber, J.C., Mak, Y. E. and Hummel, T. (2005) Differential
neural Responses evoked by orthonasal versus retronasal odorant perception in humans. Neuron 47(18): 593–605.
Soyeurt, H. and Gengler, N. (2008) Genetic variability of fatty acids in bovine
milk. Biotechnology, Argonomy Society and Environment 12(2):203-210. Spitzer, V. (1997) Structure analysis of fatty acids by gas chromatography –
Low resolution electron impact mass spectrometry of their 4,4-dimethyloxazoline derivatives – A review. Progress in Lipid Research 35(4):387-408.
Stewart, J.E., Newman, L.P. and Keast, R.S.J. (2011) Oral sensitivity to oleic
acid is associated with fat intake and body mass index. Clinical Nutrition 30:838-844.
Stewart-Knox, B., Hamilton, J., Parr, H. and Bunting, B. (2005) Dietary
strategies and uptake of reduced fat foods. Journal of Human Nutrition and Dietetics 18:121-128.
Sulyok, M., Berthiller, F., Krska, R. and Schuhmacher, Rainer (2006)
Development and validation of a liquid chromatography/tandem mass spectrometric method for the determination of 39 mycotoxins in wheat and maize. Rapid Communications in Mass Spectrometry 20:2649-2659.
Taha, A.Y., Metherel, A.H. and Stark, K.D. (2012) Comparative analysis of
standardized and common modifications of methods for lipid extraction for the determination of fatty acids. Food Chemistry 134:427-433.
Thierry, A., Maillard, M.-B., Hervé, C., Richoux, R. and Lortal, S. (2004)
Varied volatile compounds are produced by Propionibacterium freudenreichii in Emmental cheese. Food Chemistry 87:439-446.
Tomaschunas, M., Hinrichs, J., Köhn, E. and Busch-Stockfisch, M. (2012)
Effects of casein-to-whey protein ratio, fat and protein content on sensory properties of stirred yoghurt. International Dairy Journal 26:31-35.
Tournier, C., Martin, C., Guichard, E., Issanchou, S. and Sulmont-Rossé, C.
(2007) Contribution to the understanding of consumers' creaminess concept: A sensory and a verbal approach. International Dairy Journal 17:555-564.
Toyo’oka, T. (2002) Review - Fluorescent tagging of physiologically
important carboxylic acids, including fatty acids, for their detection in liquid chromatography. Analytica Chimica Acta 465:111–130.
89
Tres, A., Ruiz-Samblas, C., van der Veer, G. and van Ruth, S.M. (2013)
Geographic provenance of palm oil by fatty acid and volatile compound fingerprinting techniques. Food Chemistry 137:142-150.
Tsuzuki, W., Matsuoka, A. and Ushida, K. (2010) Formation of trans fatty
acids in edible oils during the frying and heating process. Food Chemistry 123:976-982.
Tyburczy, C., Delmonte, P., Fardin-Kia, A.R., Mossoba, M.M., Kramer, J.K.G.
and Rader, J.I. (2012) Profile of trans fatty acids (FAs) including trans polyunsaturated FAs in representative fast food samples. Journal of Agricultural and Food Chemistry 60:4567-4577.
Usydus, Z., Szlinder-Richert, J., Adamczyk, M. and Szatkowska, U. (2011)
Marine and farmed fish in the Polish market: Comparison of the nutritional value. Food Chemistry 126:78-84.
Villegas, C., Zhao, Y. and Curtis, J.M. (2010) Two methods for the separation
of monounsaturated octadecenoic acid isomers. Journal of Chromatography A 1217:775-784.
Vosough, M. (2007) Using mean field approach independent component
analysis to fatty acid characterization with overlapped GC–MS signals. Analytica Chimica Acta 598:219–226.
VRN (2005) Suomalaiset ravitsemussuositukset - ravinto ja liikunta
tasapainoon. National Nutrition Council, Helsinki, Finland. Wagner, K.-H., Auer, E. and Elmadfa, I. (2000) Content of trans fatty acids
in margarines, plant oils, fried products and chocolate spreads in Austria. European Food Research and Technology 210:237-241.
Wagner, K.-H., Plasser, E., Proell, C. and Kanzler, S. (2008) Comprehensive
studies on the trans fatty acid content of Austrian foods: Convenience products, fast food and fats. Food Chemistry 108:1054-1060.
Walther, B., Schmid, A., Sieber, R. and Wehrmüller, K. (2008) Review -
Cheese in nutrition and health. Dairy Science and Technology 88:389-405.
Wang, Y., Jacome-Sosa, M. and Proctor, S.D. (2012) The role of ruminant
trans fat as a potential nutraceutical in the prevention of cardiovascular disease. Food Research International 26:460-468.
White, P.J. (2008) Fatty acids in oilseed (vegetable oils). In: Fatty acids in
Foods and their Health Implications, Ed. By Chow, C.K., 3rd Ed., Taylor & Francis Group, CRC Press, Boca Raton, USA.
Conclusions
90
Woods, V.B. and Fearon, A.M. (2009) Dietary sources of unsaturated fatty acids for animals and their transfer into meat, milk and eggs: A review. Livestock Science 126:1-20.
Xiao, L., Mjøs, S.A. and Haugsgjerd, B.O. (2012) Efficiencies of three
common lipid extraction methods evaluated by calculating mass balances of the fatty acids. Journal of Food Composition and Analysis 25:198-207.
Yeboah, S.O., Mitei, Y.C., Ngila J.C., Wessjohann, L. and Schmidt, J. (2012)
Compositional and structural studies of the oils from two edible seeds: Tiger nut, Cyperus esculentum, and asiato, Pachira insignis, from Ghana. Food Research International 47:259-266.
Yu, Q.T., Liu, B.N., Zhang, J.Y. and Huang, Z.H. (1988) Location of methyl
branchings in fatty acids: Fatty acids in uropygial secretion of Shanghai duck by GC-MS of 4,4-dimethyloxazoline derivatives. Lipids 23(8):804-810.
www.fineli.fi (22.1.2013) www.maataloustilastot.fi (21.3.2013) www.slv.se/en-gb/Startpage-NNR/Public-consultation/ (10.8.2013)