rio tinto: annual report 2018 · 2018 $11.8 billion in cash from operations $8.6 billion in cash...
TRANSCRIPT

Rio Tinto A
nnual report 2018
2018 Annual report

Contents
Our business2018 at a glance 4Chairman’s statement 6Chief executive’s statement 8Market context:
Our business in a transforming world 10Strategic realities 12
Business model and strategy:The way we work 14Our strategy in action 18
Our yearKey performance indicators 20Chief financial officer’s statement 24Financial review 26Portfolio management 32
Strategic report
Business reviewsIron Ore 34Aluminium 38Copper & Diamonds 42Energy & Minerals 46Growth & Innovation 50Commercial 51
Sustainable development 52
Risk reportRisk management 64Principal risks and uncertainties 67
Five-year review 73
GovernanceBoard of directors 76Executive Committee 78Chairman’s governance review 80The board in action 82Matters discussed in 2018 832018 highlights 84Evaluating our performance 86Nominations Committee report 88Audit Committee report 90Sustainability Committee report 95Compliance with governance
codes and standards 97
Remuneration ReportAnnual statement by the
Remuneration Committee chairman 101Remuneration at a glance 104 Remuneration policy extracts 106Implementation report 113
Additional statutory disclosure 137
Group income statement 144Group statement of comprehensive income 145Group cash flow statement 146Group balance sheet 147Group statement of changes in equity 148Notes to the 2018 financial statements 150Rio Tinto plc company balance sheet 244Rio Tinto plc company statement
of changes in equity 245Rio Tinto financial information
by business unit 249
Australian Corporations Act – summary of ASIC relief 252
Directors’ declaration 253Auditor’s independence declaration 254Independent auditors’ report 255Financial summary 2009-18 264Summary financial data 265
Directors’ report
Financial statements
Metals and minerals production 268Ore reserves 271Mineral resources 275Competent Persons 280Mines and production facilities 282
Independent limited assurance report – Sustainable Development 290
Shareholder information: 292UK Listing Rules cross reference table 298Financial calendar 298
Contact details 299Cautionary statement about
forward-looking statements 300
Production, reserves and operations
Additional information
Reporting currency: We report in US dollars unless otherwise stated. Where specified, A$ refers to Australian dollars and C$ refers to Canadian dollars.
Annual report 2018 | riotinto.com 1
Strategic report

As pioneers in mining and metals, we produce materials essential to human progress
2018
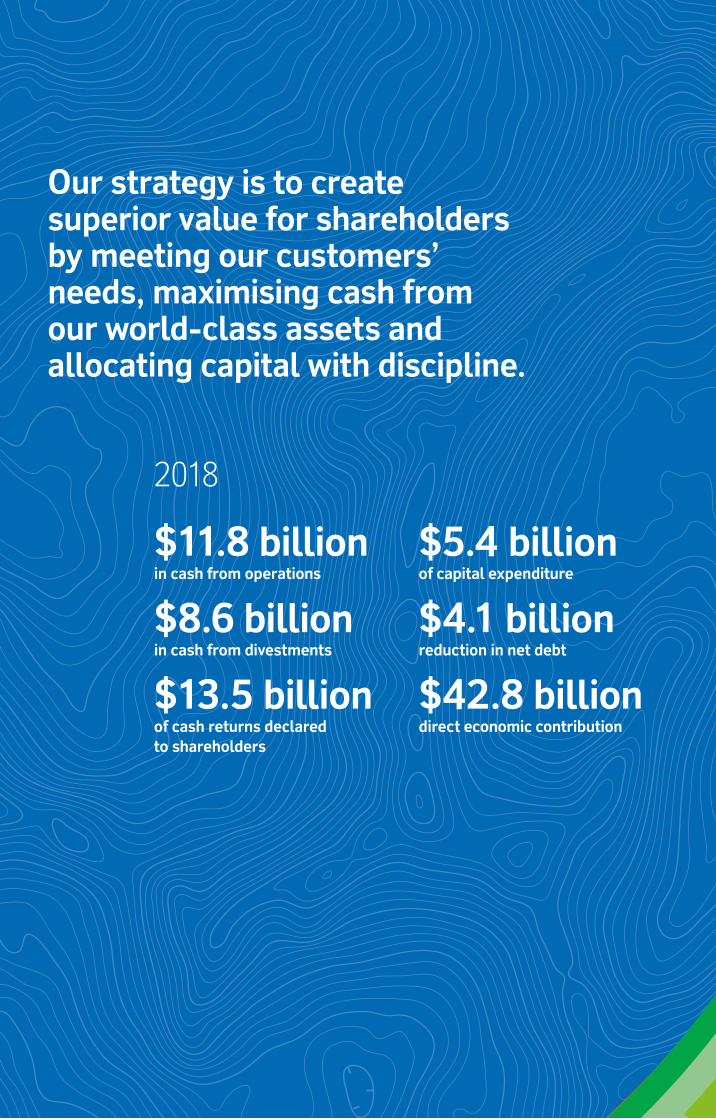
$11.8 billionin cash from operations
$8.6 billionin cash from divestments
$13.5 billion of cash returns declared to shareholders
$5.4 billionof capital expenditure
$4.1 billionreduction in net debt
$42.8 billiondirect economic contribution
Our strategy is to create superior value for shareholders by meeting our customers’ needs, maximising cash from our world-class assets and allocating capital with discipline.
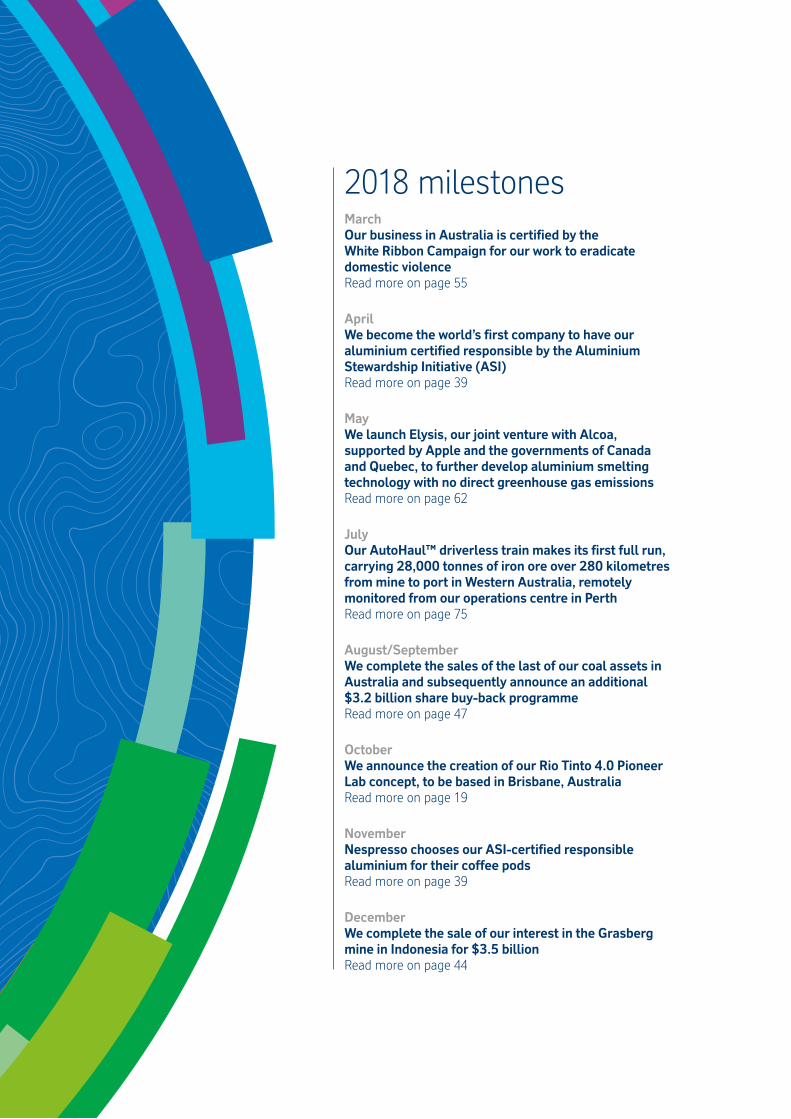
2018 milestonesMarchOur business in Australia is certified by the White Ribbon Campaign for our work to eradicate domestic violenceRead more on page 55
AprilWe become the world’s first company to have our aluminium certified responsible by the Aluminium Stewardship Initiative (ASI) Read more on page 39
MayWe launch Elysis, our joint venture with Alcoa, supported by Apple and the governments of Canada and Quebec, to further develop aluminium smelting technology with no direct greenhouse gas emissionsRead more on page 62
JulyOur AutoHaul™ driverless train makes its first full run, carrying 28,000 tonnes of iron ore over 280 kilometres from mine to port in Western Australia, remotely monitored from our operations centre in PerthRead more on page 75
August/SeptemberWe complete the sales of the last of our coal assets in Australia and subsequently announce an additional $3.2 billion share buy-back programmeRead more on page 47
OctoberWe announce the creation of our Rio Tinto 4.0 Pioneer Lab concept, to be based in Brisbane, AustraliaRead more on page 19
NovemberNespresso chooses our ASI-certified responsible aluminium for their coffee podsRead more on page 39
DecemberWe complete the sale of our interest in the Grasberg mine in Indonesia for $3.5 billionRead more on page 44

Our business2018 at a glance 4Chairman’s statement 6Chief executive’s statement 8Market context:
Our business in a transforming world 10Strategic realities 12
Business model and strategy:The way we work 14Our strategy in action 18
Our yearKey performance indicators 20Chief financial officer’s statement 24Financial review 26Portfolio management 32
Business reviewsIron Ore 34Aluminium 38Copper & Diamonds 42Energy & Minerals 46Growth & Innovation 50Commercial 51
Sustainable development 52
Risk reportRisk management 64Principal risks and uncertainties 67
Five-year review 73
Strategic report
Annual report 2018 | riotinto.com2
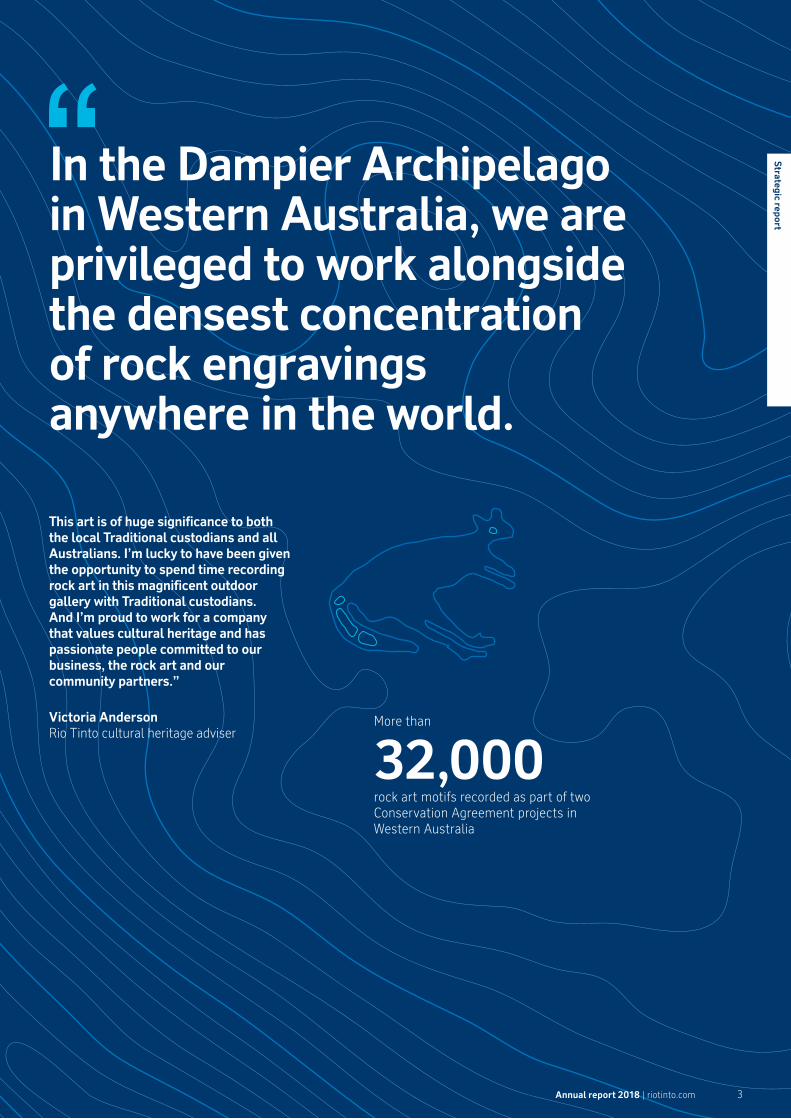
This art is of huge significance to both the local Traditional custodians and all Australians. I’m lucky to have been given the opportunity to spend time recording rock art in this magnificent outdoor gallery with Traditional custodians. And I’m proud to work for a company that values cultural heritage and has passionate people committed to our business, the rock art and our community partners.”
Victoria AndersonRio Tinto cultural heritage adviser
In the Dampier Archipelago in Western Australia, we are privileged to work alongside the densest concentration of rock engravings anywhere in the world.
More than
32,000rock art motifs recorded as part of two Conservation Agreement projects in Western Australia
Annual report 2018 | riotinto.com 3
Strategic report

Strategic report
2018 at a glance
Our business comprises a portfolio of world-class assets that generate strong cash flows through the cycle.”
$11.8bnnet cash generated from operating activities (2017: $13.9bn)
$18.1bnunderlying EBITDA•with a 42% margin (2017: $18.6bn)
33.4%total shareholder return (% over five years) (2017: 5.8%)
$18.5bngross revenue• (2017: $18.3bn)
$11.3bnunderlying EBITDA• (2017: $11.5bn)
337.8mtproduced (2017: 329.8mt)
16mines
1,700kmintegrated rail network
4ports
4power plants
Main customer marketsChina, Japan, South Korea, Taiwan and other Asian countries
Major projectsKoodaideri, Robe Valley and West Angelas sustaining projects
Managed operations
Iron Ore production numbers are on a 100% basis.
Iron OreIron ore is the primary component of steel. In the Pilbara region of Western Australia, we own a world-class, integrated portfolio of iron ore assets; we are one of the leading contributors to the seaborne market. Our quality product suite, including our flagship Pilbara Blend™, is well positioned to benefit from continued demand across China, Japan and other markets.
Fe
2.4mtreduction in greenhouse gas emissions (2017: 1.4mt)
0.44all injury frequency rate (AIFR) (2017: 0.42)
Consolidated sales revenue by destinationOur key assets are located in close proximity to countries experiencing economic growth and urbanisation.
China (45%)
Asia (12%)Excluding China and Japan
UK (1%)
Europe (9%)
Canada (3%)
Other (3%)
Japan (10%)
US (15%)
Australia (2%)
Annual report 2018 | riotinto.com4

Non-GAAP measuresIn addition to IFRS measures, management uses non-GAAP measures internally to assess performance. Full reconciliations are provided in the notes to the financial statements. These measures are highlighted with the symbol: •
2018 At a glance
5mines
3power plants
11mines and processing operations
5mines
14smelters
1smelter
4power plants
4refineries
12power plants
$12.2bngross revenue• (2017: $11.0bn)
$3.1bnunderlying EBITDA• (2017: $3.4bn)
50.4mtbauxite produced (2017: 50.8mt)
3,458ktaluminium produced (2017: 3,551kt)
$6.5bngross revenue• (2017: $4.8bn)
$2.8bnunderlying EBITDA• (2017: $1.9bn)
634ktmined copper produced (2017: 478kt)
$5.7bngross revenue• (2017: $7.8bn)
$2.2bnunderlying EBITDA• (2017: $2.8bn)
1,116kttitanium dioxide slag produced (2017: 1,315kt)
8,952ktiron ore pellets and concentrates produced (2017: 11,166kt)
Main customer marketGlobal
Main customer marketGlobal
Main customer marketGlobal
Major projectAmrun
Major projectsOyu Tolgoi underground, Resolution, and Diavik Diamond Mine A21 pipe
Major projectsZulti South and Jadar
Managed and non-managed operations Managed and non-managed operations Managed and non-managed operations
Aluminium, Copper & Diamonds and Energy & Minerals show Rio Tinto’s percentage share of production.
AluminiumAluminium is one of the world’s fastest growing major metals. Lightweight and recyclable, it is found in everything from jet engines to electric vehicles to smart phones. Our vertically integrated aluminium portfolio spans from high-quality bauxite mines to alumina refineries to smelters which, in Canada, are powered entirely by clean, renewable energy and located in the first decile of the cost curve.
Copper & DiamondsCopper plays a key role in electrification and power generation, including in renewable energy and electric vehicles. Our operations span the globe, from Mongolia to the US, and occupy various stages of the mining lifecycle. Our two diamond mines in Australia and Canada make us one of the largest producers, and our white and coloured diamonds are some of the world’s most sought-after gems.
Energy & MineralsThe global Energy & Minerals portfolio produces materials essential to thousands of everyday products across manufacturing and agriculture. It includes titanium dioxide, borates, high-grade iron ore pellets and concentrate, as well as uranium and salt.
Al Cu Ti, B, Fe
Annual report 2018 | riotinto.com 5
Strategic report

Strategic report
We have published our first report under the Task Force on Climate-related Financial Disclosures (TCFD) recommendations. Following the sale of our coal assets, Rio Tinto is unique among the major diversified miners in having no fossil fuel production. At the end of the year, more than 70% of the electricity used across our business came from renewable sources, and climate change considerations are fully integrated into our operational and strategic decision-making.
We have developed greenhouse gas (GHG) abatement curves and assessed the climate change resilience of all our major operating assets and core infrastructure. We are committed to substantially decarbonising our business by 2050, in accordance with our endorsement of the Paris Agreement. However, while many GHG-abatement projects lie within our control, others depend upon governments around the world developing a regulatory framework for the taxation and pricing of carbon that will create the certainty businesses need to invest in new technology and reduce their carbon footprint. We will develop new medium-term targets for GHG reduction before our current targets expire in 2020. But, longer term, the challenge of climate change will only be addressed through active engagement and collective action by business, civil society, consumers and especially governments.
The board and stakeholder engagement2018 was a year of change for the board. Jan du Plessis retired in March, after successfully leading the company as chairman for nearly nine years. Paul Tellier also retired in May and Chris Lynch retired as chief financial officer in September. Our thanks go to all three for their outstanding service to the Group. Jakob Stausholm replaced Chris as chief financial officer, and we were pleased to welcome Moya Greene and Simon McKeon as non-executive directors. Jakob brings extensive experience of finance, natural resources and capital-intensive, cyclical industries. Moya and Simon bring valuable business expertise and a deep knowledge of Canada and Australia, respectively – the two countries that host our largest operations.
During the year, board members participated in two environmental, social and governance (ESG) investor seminars, in London and Sydney, as well as two civil society roundtables in Melbourne and Washington. We have already responded to a number of suggestions made at these meetings. The Sustainability Committee and other board members also visited Energy Resources of Australia, in the Northern Territory, to review closure planning and environmental rehabilitation with the management team and to meet Traditional Owners.
Shareholder returnsThe combination of strong cash flow from operations and the proceeds from asset disposals enabled us to further strengthen our balance sheet, with net debt $4.1 billion lower than 2017. We also announced record cash returns to shareholders of $13.5 billion. This comprises a full-year dividend of $5.3 billion (307 cents per share), the $1.0 billion share buy-back we announced last August from operational cash flow and $7.2 billion of supplementary cash returns from post-tax divestment proceeds, including a $4.0 billion special dividend and $3.2 billion of share buy-backs.
Social and economic contributionRio Tinto continues to make a significant economic and social contribution in the countries where it operates. During 2018, we paid $3.6 billion in corporate taxes, and made a total economic contribution, including payments to employees and suppliers, of $42.8 billion. As part of our commitment to building robust, long-term partnerships, we have enhanced transparency and disclosure in a number of areas of importance to our stakeholders, including human rights, membership of industry associations and beneficial ownership.
SustainabilityDuring 2018, the board revised and updated the Group’s sustainability strategy. Climate change represents perhaps the greatest long-term threat to our business and we are determined to be part of the solution, not part of the problem. Our aluminium and copper product groups, in particular, have a vital role to play in supplying essential materials for the transition to a low-carbon economy.
Chairman’s statement
Rio Tinto has a clear purpose: as pioneers in metals and mining, we produce materials essential for human progress. And by doing so efficiently and effectively, we aim to deliver superior returns to our shareholders while safeguarding the environment and meeting our obligations to wider society.
PerformanceDuring 2018, we delivered underlying earnings of $8.8 billion (2017: $8.6 billion). Despite some volatility, commodity prices remained broadly supportive during the year, but growth in our end-markets was relatively subdued and inflationary pressures increased in some of our product groups. A continuing focus on mine-to-market productivity and value over volume was therefore essential to defend the Group’s EBITDA margin of 42%, compared with 44% in 2017.
PortfolioWe continue to invest in value-creative growth. The Amrun bauxite project in Queensland, Australia was completed ahead of schedule and below budget. In November, we approved the development of the $2.6 billion Koodaideri iron ore project in the Pilbara. The world-class Oyu Tolgoi copper project in Mongolia has progressed, albeit with challenges which further impact the forecasted ramp-up to sustainable production at this complex underground project.
We also continued to reshape our portfolio. We sold the Hail Creek and Kestrel mines and the Valeria and Winchester South coal development projects for combined sale proceeds of $4.15 billion, pre tax. We also completed the sale of our investment in Grasberg for total proceeds of $3.5 billion and disposed of our aluminium smelter at Dunkerque for headline proceeds of $500 million.
Our business in 2018
Annual report 2018 | riotinto.com6
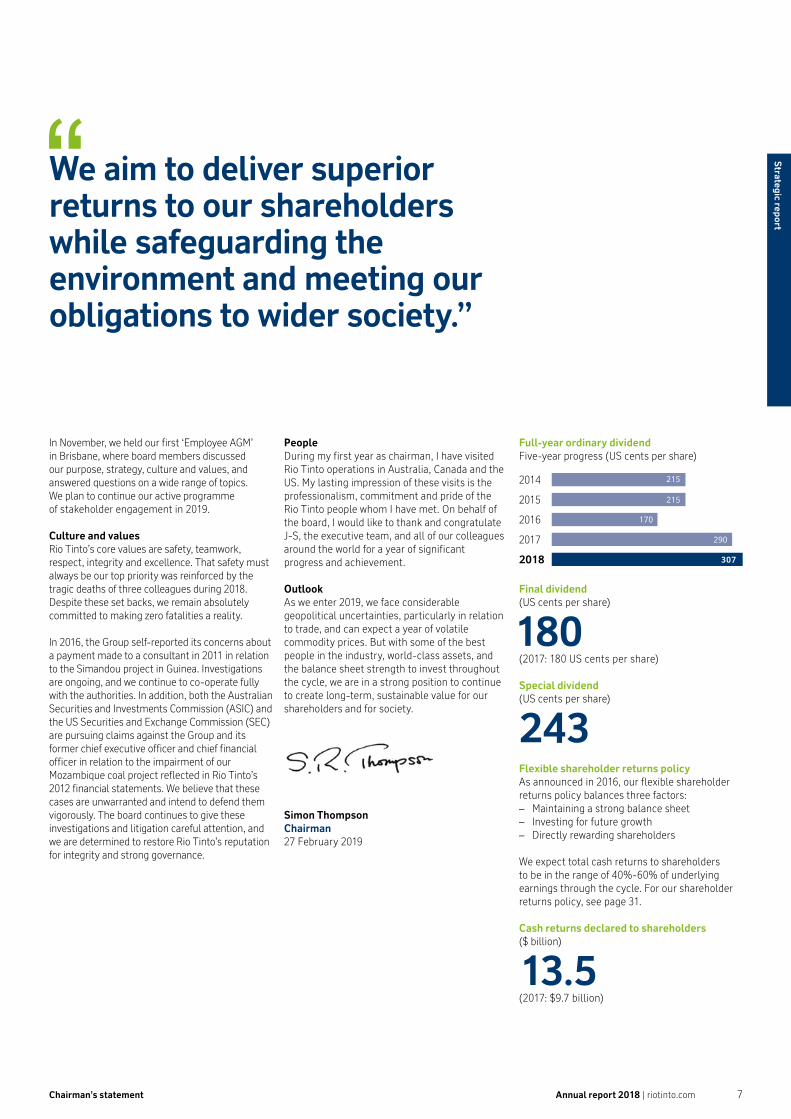
Full-year ordinary dividendFive-year progress (US cents per share)
215
215
170
290
307
2014
2015
2016
2017
2018
Final dividend(US cents per share)
180(2017: 180 US cents per share)
Special dividend(US cents per share)
243Flexible shareholder returns policyAs announced in 2016, our flexible shareholder returns policy balances three factors: – Maintaining a strong balance sheet – Investing for future growth – Directly rewarding shareholders
We expect total cash returns to shareholders to be in the range of 40%-60% of underlying earnings through the cycle. For our shareholder returns policy, see page 31.
Cash returns declared to shareholders($ billion)
13.5(2017: $9.7 billion)
Chairman’s statement
We aim to deliver superior returns to our shareholders while safeguarding the environment and meeting our obligations to wider society.”
PeopleDuring my first year as chairman, I have visited Rio Tinto operations in Australia, Canada and the US. My lasting impression of these visits is the professionalism, commitment and pride of the Rio Tinto people whom I have met. On behalf of the board, I would like to thank and congratulate J-S, the executive team, and all of our colleagues around the world for a year of significant progress and achievement.
OutlookAs we enter 2019, we face considerable geopolitical uncertainties, particularly in relation to trade, and can expect a year of volatile commodity prices. But with some of the best people in the industry, world-class assets, and the balance sheet strength to invest throughout the cycle, we are in a strong position to continue to create long-term, sustainable value for our shareholders and for society.
Simon ThompsonChairman27 February 2019
In November, we held our first ‘Employee AGM’ in Brisbane, where board members discussed our purpose, strategy, culture and values, and answered questions on a wide range of topics. We plan to continue our active programme of stakeholder engagement in 2019.
Culture and valuesRio Tinto’s core values are safety, teamwork, respect, integrity and excellence. That safety must always be our top priority was reinforced by the tragic deaths of three colleagues during 2018. Despite these set backs, we remain absolutely committed to making zero fatalities a reality.
In 2016, the Group self-reported its concerns about a payment made to a consultant in 2011 in relation to the Simandou project in Guinea. Investigations are ongoing, and we continue to co-operate fully with the authorities. In addition, both the Australian Securities and Investments Commission (ASIC) and the US Securities and Exchange Commission (SEC) are pursuing claims against the Group and its former chief executive officer and chief financial officer in relation to the impairment of our Mozambique coal project reflected in Rio Tinto’s 2012 financial statements. We believe that these cases are unwarranted and intend to defend them vigorously. The board continues to give these investigations and litigation careful attention, and we are determined to restore Rio Tinto’s reputation for integrity and strong governance.
Annual report 2018 | riotinto.com 7
Strategic report
Strategic report
Chief executive’s statement
Our business in 2018
Around the world, geopolitical uncertainty and its economic and social implications are challenging long-held traditions. Our industry is also evolving, as changes in technology add to both the opportunity and challenge before us. At Rio Tinto, our absolute focus on safety, performance, portfolio, partners and people is why I am confident we will continue to meet challenges, leverage opportunities – and pioneer human progress.
This year, we start by remembering Francis Lalancette, Muzi Patrick Nhlenyama and Daniel Patterson – our colleagues who went to work but did not return home. Like all of us at Rio Tinto, I am deeply saddened by their tragic deaths and the irreplaceable loss to their families, friends and colleagues. We must do better on safety. Nothing is more important and I can assure you we are fully focused on this across our entire business.
We also remember the tragedy in Brumadinho, in Brazil, in early 2019. Our thoughts remain with the many who lost their lives or are still missing, and their families and communities. Our industry must do better.
At Rio Tinto, we have had a global tailings standard since 2015, and three levels of governance: asset-level, which includes reviewing facility design and operational controls; assurance of compliance with the standard through business conformance audits and technical reviews; and a programme of independent external audits. We continually assess ways to further strengthen these processes – work that will receive additional focus in 2019.
Performance2018 marked another solid year for our company: we declared $13.5 billion of cash returns to shareholders – the highest in Rio Tinto history. We also delivered on a number of our strategic priorities – strengthening our portfolio, advancing our growth options and divesting assets for value, while maintaining balance sheet strength and building critical capabilities.
In a relatively stable pricing environment, we delivered $40.5 billion in consolidated sales revenue, $18.1 billion of underlying EBITDA, and an EBITDA margin of 42%. This year, we made a significant investment in capabilities and technology to unlock future productivity, which we expect to ramp-up and deliver an incremental $0.6 billion in free cash flow in 2019. We remain on track to deliver $1.5 billion a year in additional free cash flow from productivity improvements from 2021.
Operating cash flow for the year was $11.8 billion, and we ended the year once again with a strong balance sheet, reducing net debt by $4.1 billion and ending the year with net cash of $0.3 billion. With expected outflows in 2019, including a $4.0 billion special dividend to our shareholders, our net debt is expected to rise in the first half of the year.
These results are in part due to our company’s solid operational performance, in particular at our copper assets, which delivered a 33% year-on-year increase in mined production. Iron ore shipments and production also rose, while bauxite and aluminium were slightly lower. We are also making our business safer and more efficient. In 2018, for the first time, our driverless trains – up to 2.4 kilometres in length – delivered iron ore from our mines in the Pilbara, to our port in Cape Lambert, in Western Australia. With the programme fully implemented by the end of 2018, we have now completed more than 1.6 million kilometres in driverless mode.
PortfolioWe continued to significantly reshape our portfolio in 2018, with the sale of our interests in the Hail Creek and Kestrel coal mines and the Valeria and Winchester South coal development projects in Australia, marking the end of our coking coal activities. We divested other assets, including our stake in the Grasberg copper mine in Indonesia and the Dunkerque aluminium smelter in France. We also took steps to divest our interests in the Rössing Uranium business in Namibia. We are returning $7.2 billion to shareholders from the proceeds of sales completed in 2018.
Indeed, over the past three years, we have significantly reshaped our portfolio, realising $12 billion in sales proceeds, pre-tax. However, this has not come at the expense of growth: with a smaller but higher-quality asset base, we grew production by just under 3% year-on-year on a copper-equivalent basis. Many of these disposals have also changed our exposure to environmental, social and governance risks, differentiating our portfolio from those of our industry peers.
We also invested in high-quality growth. In December 2018, we shipped our first tonnes of bauxite from our Amrun mine in Queensland, Australia – six weeks ahead of schedule.
2018 highlights
$13.5bnof cash returns declared to shareholders
$18.1bnunderlying EBITDA
42%EBITDA margin
$11.8bnoperating cash flow
19%return on capital employed (ROCE)
$8.8bnunderlying earnings
$4.1bnreduction in net debt
8 Annual report 2018 | riotinto.com

Chief executive’s statement
We declared the highest cash returns to shareholders in Rio Tinto history, delivered a reshaped and improved portfolio, further strengthened our balance sheet and invested in high-quality growth.”In November, we announced the development of the $2.6 billion Koodaideri iron ore project – our most technologically advanced mine – in the Pilbara, Western Australia. The world-class underground copper project at Oyu Tolgoi, in Mongolia, also progressed, including the signing of the Power Source Framework Agreement. The detailed engineering design work and overall construction is mostly on track, but more detailed geotechnical information and difficult ground conditions have required a review of the mine design. This, combined with fit-out and commissioning challenges with the main production shaft, is ultimately expected to result in a further revised ramp-up schedule to sustainable first production (beyond the nine-month delay indicated in October 2018). Detailed design work is underway to estimate the impact these issues will have on cost and schedule.
PartnersOur focus on partnership continued and intensified in 2018, with the launch of a collaboration to further develop greenhouse-gas-emissions-free aluminium smelting technology: our Elysis joint venture with Alcoa is supported by Apple and the governments of Canada and Quebec. We also announced that we would provide Aluminium Stewardship Initiative (ASI)-certified responsible aluminium to Nespresso – Rio Tinto is the first company to have its metal certified by the ASI.
We continued to strengthen our partnership with China, and our Chinese customers. In June, we ran the first of five learning programmes in Perth, Australia, with China’s State-Owned Assets Supervisions and Administration Commission (SASAC), which supervises and manages state-owned assets.
In Western Australia, where automation may have a disruptive impact on our communities, we launched a partnership with the government of Western Australia and South Metropolitan TAFE (Technical and Further Education) to develop the first nationally recognised courses in automation. This partnership aims to train and certify people in new skills, making them easily transferable – so that people can follow opportunity wherever they find it.
And in Canada, the home of our aluminium business, we strengthened our partnership with the provincial government and renewed the Quebec Agreement, a framework for further investment in our aluminium business in the province.
We know we can be part of the solution on sustainability issues, which today are becoming more complex and intensifying the challenge before us. In 2018, we developed an integrated approach to sustainability, linked to the United Nations’ Sustainable Development Goals, which we introduced to investors and civil society groups in the latter half of the year.
Rio Tinto has been recognised as a leader in transparent tax reporting. We were the first in the industry to disclose our payments to governments, and we have been reporting on our taxes and royalties paid, and our economic contribution, in increasing detail since 2010. Our 2018 Taxes paid report, which details this contribution, will be published in April 2019. Also in 2019, we released our first report in line with the recommendations of the Task Force on Climate-related Financial Disclosures. This articulates our climate-related risks and opportunities, including those related to a 2°C climate change scenario.
PeopleAs I travelled around the world this year, visiting our assets and offices, what energised me most was our people – their ideas, their enthusiasm for our business and the commitment they have to making Rio Tinto a safer, more productive and more responsible company. Our success this year is due to their hard work and dedication, and I thank them for all they do, every day – at every asset, and in every office.
In 2018, we focused on building our technical and leadership capabilities to equip our people and our company for continued success. A new programme – RioExcel – lets technical specialists build a career as experts in their respective fields, from geology to process engineering to asset management. We also established three centres of excellence – underground mining, surface mining and processing – that bring together the company’s foremost technical experts to partner with our assets, mitigate risk and deliver value.
Our aspiration is to continue to pioneer our industry, with a culture that welcomes and nurtures new ideas and higher performance. Cultures that do this are also, by definition, inclusive and diverse. We are working to bring more women into our business. In 2018, 36% of our graduate intake were women; we aim to make this 50%. We also have a target to improve the proportion of women in senior management by 2% every year.
A look aheadAs we look to the future, we see markets remaining volatile, with some risk of a trade war and a deceleration in economic activity. At Rio Tinto, we will continue our strong focus on value over volume, growth and mine-to-market productivity. Partnership and sustainability must remain important priorities. We will continue to make every effort to keep our people safe, healthy, and equipped to meet the challenges of the coming years.
With a world-class portfolio, a strong balance sheet and people who I am convinced are some of the best in the business, we are well positioned to withstand these challenges – and to create new opportunities. We will continue to drive productivity and aim to deliver superior value as we produce the materials essential to human progress.
J-S JacquesChief executive27 February 2019
Annual report 2018 | riotinto.com 9
Strategic report
Strategic report | Market context
Our business in a transforming world
Data is set to be our most valuable asset. Cars and trains will drive themselves, equipment will be printed, not made, and machines will accelerate human cognition.”
Global megatrends
Global interconnectionsOver the past three decades, the freer movement of capital, goods, services and people has unlocked significant global wealth, lifting millions out of poverty and improving the lives of millions more. Rio Tinto has played an important role in this transformation.
Globalisation has reduced inequalities between countries, but it has also contributed to increased disparities within some societies. A protectionist and populist backlash has been steadily building since the global financial crisis, in particular across developed and liberal economies. Combined with the rise of China, this is creating a new set of challenges for the institutions that have supported the global order since World War II. This is resulting in a less stable geopolitical landscape and a stronger reliance on bilateral relationships in an increasingly polarised world.
These dynamics do not necessarily imply a reversal of global interconnections, but rather a shift in their nature. While traditional flows of goods, services and capital have stagnated over the past decade, cross-border data flows have grown exponentially, supporting the sharing of information and ideas. This has led to the emergence of new global digital communities, as well as stronger networks between the world’s megacities, which by some estimates are the source of 66% of global economic activity and 85% of innovation.
With our global footprint and customer base, and the fact that most of our products are sold cross-border, the continued evolution of global interconnections presents both risks and opportunities for Rio Tinto.
Disruptive technologiesThe ever-increasing pace of technological advancement is reshaping most sectors of the global economy and competitive landscapes within it, including mining. For example, as the volume of data collected continues its exponential growth, and the cost to store it falls to nearly zero, ever more intelligent algorithms can access richer data pools to add insight to complex problems – including at Rio Tinto. Our first intelligent mine – Koodaideri, in Western Australia – will use extensive digital modelling to make operations safer and more efficient.
The world of energy is also in transition: the cost of solar power and lithium-ion batteries has fallen by 80% over the past decade, with further savings expected. The global fuel mix has remained stable over the past 50 years, with oil, gas and coal contributing about 80% of total energy needs. Today, competitive storage technology, together with further electrification in the global economy, including transportation, is set to lead the transition to a low-carbon energy system.
Disruptive technologies will also shape the future of work. Automation and artificial intelligence will displace workers at a faster pace in some activities. New roles will undoubtedly be created and future human-machine collaborations should create new opportunities. Nevertheless, the scope for social disruption is significant and the transition needs to be managed carefully.
These dynamics will likely affect Rio Tinto in two ways. First, automation and new technologies will directly impact our workforce and local communities with a mix of challenges and opportunities. And second, we should see a stronger global emphasis on the materials that will underpin the transition to a low-carbon economy.
1.6mautonomous kilometres travelled by Rio Tinto’s AutoHaulTM
Megacities are the source of
66%of global
economic activity
Annual report 2018 | riotinto.com10

Market context | Our business in a transforming world
If we are to thrive in this new world, we
need a fundamentally different vision.”
Global demographic shiftsOne in ten people is expected to be over age 65 by 2025 (from one in 12 today); in high-income countries, this number is expected to be one in five. Over the next decade, we expect this ageing population to increasingly outnumber working populations in the developed world and China; countries in sub-Saharan Africa and the Middle East will continue to see strong population growth. This will have implications for the location of global manufacturing centres and the pace of economic development in these regions.
These diverging demographic trends will also continue to support cross-border migration. The number of international migrants has grown by about 50% since 2000, although at just over 3% this remains a small portion of the global population. Estimates indicate migrants have made significantly stronger contributions to global GDP than if they had remained in their home countries. However, migrants are often seen by host communities as competing for jobs and financial resources; a negative perception of migration has contributed to the backlash against globalisation.
As living standards in emerging markets improve around the world, people will have rising expectations of fairness and sustainable economic development. Water and air quality issues have become particularly important, especially in urban areas, influencing government policymaking. Companies like ours are also expected to play a greater role in addressing global social and environmental issues, and to do so transparently.
Industrialisation and urbanisationThe industrialisation and urbanisation of China has been a key force shaping the mining sector and Rio Tinto over the past two decades. While this will remain important in coming years, it is diversifying towards India, South East Asia and Africa.
These regions have a large infrastructure gap, which will require a significant increase in investment to support growth. Infrastructure projects tend to be funded by the private sector but also offer opportunities for governments to exert influence at home and abroad. Initiatives such as China’s Belt and Road Initiative are adding a strategic geopolitical dimension to the infrastructure gap.
Mobility is another aspect of urbanisation undergoing significant change. Ride-sharing apps have already disrupted transportation in and around cities. In the longer term, the combination of shared mobility with autonomous driving may revolutionise urban transport, affecting the size of the global vehicle fleet, as well as roads, parking, power systems and urban air quality.
Other kinds of new technology and an increasing focus on the circular economy, with its emphasis on minimising waste, will also drive resource efficiencies in the industrial sector. For example, 3D printing, as well as new carbon or composite materials, may decrease demand for traditional minerals and metals, as could rising recycling rates.
Each of these trends could have a profound influence on the future demand for our products. China’s Belt and Road Initiative will also affect supply, as mining projects come online, particularly in Africa and Latin America.
As living standards in emerging markets improve
around the world, people will have rising expectations of
fairness and sustainable economic development.
Annual report 2018 | riotinto.com 11
Strategic report
Strategic realities
Resilience premiumWhile the global economy has been steadily expanding since mid 2016, certain tension points may create geopolitical pressures, protectionism, battles over technology leadership and, in places, elevated debt levels.
Mining is a cyclical industry, typically experiencing larger swings in demand compared with underlying changes in GDP. The ability to succeed throughout the commodity cycle – resilience – is therefore critical to the way we run our business. Two key drivers ensure our own resilience: balance sheet strength and a portfolio of world-class assets.
The mining sector as a whole has now significantly reduced debt levels. Deployment of capital towards smart growth is again being considered. Disciplined capital allocation remains a strategic priority for Rio Tinto, and the sanctioning of expenditure for new growth projects is always weighed against the return of capital to shareholders.
With regard to the strength of our balance sheet, we reduced our debt ahead of the sector in the last cycle, resulting in a less volatile share price performance compared with our peers between mid 2014 and late 2017. This year, we reduced net debt by $4.1 billion.
Our world-class assets are positioned in the lower part of the industry cost curve. They are therefore better able to provide attractive and less volatile margins throughout the cycle, as costs increase and/or prices decrease. We continually evaluate each of our assets against the attractiveness of each commodity’s industry structure as well their competitive positions, including expandability and partner-to-operate risks. Over the past three years, we have significantly reshaped our portfolio, realising $12 billion in sales proceeds, pre-tax.
China “New Era”China represents more than 55% of industry demand. Chinese companies are among our key customers and important joint-venture partners, suppliers and competitors.
China will be a driving force of the industry for years to come, but with the New Era – President Xi Jinping’s mid- to long-term strategy for the country – the nature of its growth and ambition is changing. We see a stronger focus on industrial and technological leadership, more stringent environmental policies and greater global aspirations, including those defined through the Belt and Road Initiative.
Certain elements will have an immediate impact on our industry: the restructuring of state-owned enterprises, Chinese customers’ shift towards higher-quality products (such as our premium iron ore product, Pilbara Blend™), the emergence of Chinese companies as key suppliers and as stronger overseas competition.
We have adapted and strengthened our relationship with China. In 2018, we signed a joint-venture agreement with Minmetals and are deepening our relationship with the State-Owned Assets Supervision and Administration Commission (SASAC), which supervises and manages Chinese state-owned assets. We also strengthened our partnership with Tsinghua University: a Joint Research Centre that brings together experts from China and other countries to study, generate and share ideas and best practices on sustainable development.
Productivity breakthroughProductivity declined during the Chinese economic boom (2003-13), when both demand and prices for mined materials were high. However, today’s relatively low commodity price environment, combined with disruptive technologies, has created market fundamentals in which productivity is back in focus. Digital enablers – automation, intelligent mining, artificial intelligence – will be a key feature of this next step-change in productivity.
As competition for world-class assets increases, the effective use of technology will be a differentiating factor among competitors for those assets. This will push the industry to treat data as a valuable asset and will shift traditional supplier relationships towards more dynamic and richer partner ecosystems.
Our mine-to-market agenda, which includes all aspects of productivity, is driving this step change, as is our investment in advanced technologies like AutoHaul™ and our intelligent mine, Koodaideri.
Six themes, arising from global megatrends, that shape the strategic landscape of our industry.”
We are on track to deliver
$1.5bnin additional free cash flow from productivity improvements each year from 2021
Strategic report | Market context
Annual report 2018 | riotinto.com12
Business to people Mining companies work with a complex and interconnected range of stakeholders, from national governments to global NGOs to local community groups, all of which can have shifting, and at times conflicting, expectations. Our own expectations can also at times conflict with those of our stakeholders. For example, there is a natural tension between mining companies’ need for stable, predictable legal, fiscal and regulatory frameworks and host governments’ desire to maximise revenue from their non-renewable resources. In some jurisdictions, this can result in significant risks to the business.
Our approach is defined through our partner-to-operate strategy, which focuses on collaborating to enable wider benefits where we operate, and is designed for what is called the Business to people era.
This new era demands clear, transparent and honest communication. With the rise of social media in particular, everyone has a global platform, and is empowered to use it. At companies like ours, employees’ need for a sense of purpose, generational shifts, and the impact of digitalisation and automation all create challenges and opportunities. Producing materials essential to human progress – and doing this responsibly – helps us to meet these evolving expectations.
Climate change Climate change presents a significant challenge for the world, and for Rio Tinto. Initiatives such as the Task Force on Climate-related Financial Disclosures (TCFD) encourage more transparency on climate-related risks and opportunities aligned with objectives of the Paris Agreement, such as our resilience to a 2°C warming scenario.
We believe that climate change has the potential to shape our sector and business profoundly over the medium and in particular, long term. Our TCFD report is available on our website at riotinto.com/TCFD2018.
Our response begins with understanding our carbon footprint and options for managing it. Our products have a role to play in the move to a low-carbon economy, and today, we are the only major mining company that does not produce coal. Our higher-quality iron ore is more carbon-efficient, and has to travel a relatively short distance to market. Aluminium is increasingly in demand for its lightweight properties and recyclability, and our assets in Canada are powered by clean, renewable hydropower. And copper is a key part of electrification, including, for example, in electric vehicles.
Supply gaps While commodity demand has outpaced GDP growth on average since 2000, we expect future global GDP growth to be less commodity-intensive. We expect South and South East Asian economic development to contribute to continued growth in commodity demand, and for this to be partly offset by China’s maturing economy and increased use of scrap.
For individual commodities, including those we produce, this translates to more limited supply gaps. – The global iron ore industry is shifting from
volume growth to a focus on quality. This has positive implications for our higher-grade products.
– Capital-intensive aluminium production sees Chinese producers currently at an advantage to supply the market with lower-cost options. However, environmental policy pressures may create opportunities for our more sustainable metal, as our Canadian aluminium assets are all powered by clean, renewable hydropower.
– Gaps in the supply of copper and other commodities (nickel, lithium and cobalt needed for energy storage) may be harder to fill, since growth projects may be more difficult to bring into production and more competitive to secure.
Market context | Strategic realities
We have published our
first TCFD reportriotinto.com/TCFD2018
Annual report 2018 | riotinto.com 13
Strategic report

The way we work
Implicit in our purpose is the expectation that our activities should also support human progress.”
Our business model
Repurpose and
renew
Explore and
evaluate
Develop and
innovate
Market and
deliver
Mine and
process
Disciplined capital
allocation
Strategic report | Business model and strategy
Annual report 2018 | riotinto.com14

We aim to design and run our assets to create a positive legacy once our mining activity concludes. Applying this approach could entail rehabilitating the land for a nature reserve, for example, or repurposing it for light industrial use. Each of our sites has rehabilitation plans that we review each year. We see this long-term approach – planning and operating with the future in mind – as integral to running a safe, responsible and profitable business.
We use some of the most advanced exploration technologies in the world to find potential new sources of minerals and metals. And we consider new products and operations with an understanding of customers’ and communities’ needs. We are also mindful of the future: our environmental impact, as well as the diversity and balance of our portfolio.
Disciplined capital allocationOur business is underpinned by a disciplined approach to capital allocation; we strive to use every dollar prudently. Today, our balance sheet is a key strength, providing a platform for strong shareholder returns, as well as enabling us to invest throughout the commodity cycle.
We assess each potential operation with a focus on risk, potential returns, and long-term sustainability and value. Once we have approved an investment, we design and build each operation. We aim to develop every potential site to achieve optimal, long-term productivity while minimising risks. Our growing network of partners – governments, communities, customers and suppliers – is helping expand our thinking, capabilities and ability to deliver mutual benefit.
A safe site is a productive site, and advanced technologies are playing a more important role in how we achieve both. We also share best practices across our assets to create safe, environmentally responsible working practices and a high-performing culture that targets production at lower costs.
At the same time, our operations aim to benefit local economies by contributing jobs, taxes and royalties, contracts with local businesses and social and community investment. By understanding and respecting our business partners, employees, communities, and the environment, we can create sustainable value for all our stakeholders.
Our minerals and metals are used in a vast array of everyday products – from cars to coffee pods to smart phones. Our Commercial team ensure that we manage our products in line with market and customer needs. And our network of rail, ports and ships means that we can control end-to-end logistics to deliver our products safely, efficiently and reliably.
Business model and strategy | The way we work
We aim to run our business in ways that are safer, smarter and more sustainable.
Explore and evaluate
Develop and innovate
Mine and process
Market and deliver
Repurpose and renew
Annual report 2018 | riotinto.com 15
Strategic report

The way we work continued
A focus on the ‘four Ps’
Our strategyOur strategy is to create superior value for shareholders by meeting our customers’ needs, maximising cash from our world-class assets and allocating capital with discipline.
Attracting, developing and retaining the best people is crucial to our success. We continue to strengthen our technical and commercial capabilities through our centres of excellence, and are committed to building a diverse and inclusive workforce across our global business.
Our portfolio of low-cost, long-life assets delivers attractive returns throughout the cycle.
After a significant portfolio reshaping, we are invested in commodities with strong long-term
fundamentals and material growth opportunities.
Partnerships and collaboration are essential to the long-term success of our business. We work closely with technology partners, local suppliers, governments, community groups, industry leaders and NGOs at all stages of the mining lifecycle, from exploration to rehabilitation and closure. We believe this gives us a competitive edge and also allows us to work more thoughtfully and responsibly, and to deliver real benefits to all our stakeholders.
Safety is our number one priority. We look to generate value from mine to market and also to
prioritise value over volume in our investment decisions. We work to maximise value in other
ways – for example, by developing new markets for our materials and by focusing on operating
excellence to improve efficiency.
Partners Performance
PortfolioPeople
Strategic report | Business model and strategy
Annual report 2018 | riotinto.com16

Business model and strategy | The way we work – continued
The way we workWe deliver both our purpose and our strategy through The way we work.
Our values
SafetyCaring for human life and wellbeing above everything else
This means: we make the safety and wellbeing of our employees, contractors and communities our number one priority. Always. Safely looking after the environment is an essential part of our care for future generations.
TeamworkCollaborating for success
This means: we work together with colleagues, partners and communities globally to deliver the products our customers need. We learn from each other to improve our performance and achieve success.
RespectFostering inclusion and embracing diversity
This means: we recognise and respect diverse cultures, communities and points of view. We treat each other with fairness and dignity to make the most of everyone’s contributions.
IntegrityHaving the courage and commitment to do the right thing
This means: we do the right thing, even when this is challenging. We take ownership of what we do and say. And we are honest and clear with each other, and with everyone we work with. This helps us to build trust.
ExcellenceBeing the best we can be for superior performance
This means: we challenge ourselves and others to create lasting value and achieve high performance. We adopt a pioneering mindset and aim to do better every day.
Annual report 2018 | riotinto.com 17
Strategic report

Our strategy in action
This year, we brought our strategy to life in many ways, across all our businesses.
PortfolioReshaping our portfolioThis year, we divested several assets. The sales of our interests in the Hail Creek and Kestrel coal mines and the Valeria and Winchester South coal development projects in Australia realised $4.15 billion in pre-tax proceeds and helped to position us for the transition to a low-carbon economy. In November, we announced the sale of our interest in Rössing Uranium in Namibia. And in December, we completed the sale of our investment in the Grasberg copper mine in Indonesia for total proceeds of $3.5 billion. We also completed the sale of our aluminium smelter in Dunkerque, France for headline proceeds of $500 million.
$4.15bnin pre-tax proceeds from the sale of our coal assets
Investing in our businessIn March, we delivered the first ore from the new fourth pipe at our Diavik diamond mine in Canada, following an investment of $350 million.
In November, we approved the development of the $2.6 billion Koodaideri iron ore project in the Pilbara. Koodaideri will be our first intelligent mine, with fully integrated autonomous drills, trucks and rail networks, underlining our industry-leading position.
And in December, we made our first shipment from the Amrun bauxite mine in Queensland Australia, six weeks ahead of schedule.
PartnersSourcing locally in AustraliaReal partnership means creating mutual and sustainable benefit, and we are doing this in a variety of ways. One example is Kulbardi, a Perth-based Indigenous business that provides workplace supplies for our Western Australia offices. Another is Pindari, an Indigenous-owned labour-hire company supplying workers for our Pilbara mines – approximately 30% of the Pindari workforce is Indigenous. And this year, the first Indigenous-owned and operated mine in Australia, Gulkula, began producing bauxite in Australia’s Northern Territory. We buy from Gulkula and sell its bauxite both in Australia and internationally. To help people in the area build careers in mining, we have also invested A$2.4 million in the Gulkula Mine Training Centre, which provides industry-related training.
$82minvested in vocational training centres in Mongolia
Made in MongoliaOyu Tolgoi is making a significant contribution to the national and local economies in Mongolia. Alongside a workforce that is approximately 93% Mongolian, we are partnering with local businesses: more than half of our procurement spend goes to Mongolian suppliers.
We also invest in local education: to date, $82 million has helped build vocational training centres in five Mongolian towns and cities, supporting the training of vocational teachers and university scholarships for young Mongolians. We have also found innovative ways to support local communities. Through our partnership in the Sustainable Cashmere Project, we are helping to re-engineer the supply chain of high-quality cashmere to protect and enhance the livelihoods of Mongolian herders.
PerformanceFocusing on safetyWe track safety performance to identify patterns to help prevent incidents – for example, by being extra vigilant at particular times of the day when we know incidents are more likely. This year, our data analysis team began looking beyond traditional safety metrics – bringing factors like weather and workers’ accommodation into the picture – to identify leading indicators of injuries, incidents and fatalities. We are factoring our learnings into revised safety practices in key parts of our business.
Data as an assetEvery day our automated drills, trucks, shovels, conveyors, trains and ships produce huge amounts of valuable data. We track more than 4,000 vehicles across our 60 global operations, 24 hours a day. Each of our haul trucks has more than 45 electronic tags sending data every few seconds, giving us more than 30 million geopositions every single day. Our Mine Automation System, in place at 98% of our operations, uses artificial intelligence and machine learning to turn this data into real-time operational insights.
Data from our autonomous drills makes our orebody modelling more accurate. Data from trucks allows us to optimise their speed and reduce queuing – small improvements in efficiency that produce a significant gain in productivity.
4,000vehicles tracked 24 hours a day
Strategic report | Business model and strategy
Annual report 2018 | riotinto.com18

PeopleSupporting employees in needThe safety and wellbeing of our people is our top priority. In 2017, we took steps to eradicate domestic violence with a package of initiatives to protect and support employees. In 2018, in Australia, this led to Rio Tinto being the first mining company to receive White Ribbon accreditation and recognition at the annual Australian Women in Resources National Awards. We have extended the programme to Canada and the US, where employees in need can take up to ten days of paid extra leave, work flexible hours, and receive financial aid and emergency accommodation. In 2019, we will be equipping leaders and HR teams to address family and domestic violence issues, while rolling out similar programmes in other parts of the world.
White Ribbonaccreditation achieved in Australia
Not business as usualEmbracing technology and thinking differently, with new perspectives, is crucial to our continued success. The Rio Tinto 4.0 Pioneer Lab, in Brisbane, will help us to tackle some of our biggest challenges and opportunities. This year, we announced that six of our best and brightest people will come from all over the world to work together on breaking new frontiers – from the circular economy to synthetic materials.
ShareholdersWe are committed to delivering superior returns – and aim to pay 40%-60% of our underlying earnings in total cash returns.
CommunitiesWe create jobs for local communities and pay billions in taxes and royalties. We also contribute to local economic and social development, the impact of which is often felt even after our operations have ended.
CustomersWe aim to better address customer needs and adjust our operations to meet market demands. As customer expectations evolve, we are also seeking to position more of our products as responsibly sourced and sustainably produced.
SuppliersWe look for the right balance of global, national and local capability, working with partners to drive innovation and create local supply chains wherever we can.
EmployeesWe are committed to the safety, rights and wellbeing of our 47,500 employees. Our aspiration is to create a culture that nurtures new ideas and higher performance.
The environmentWe are finding new ways to work more sustainably as a business to meet the challenges of a low-carbon future.
$13.5bncash returns declared to shareholders
$192minvested in communities
>2,000customers served
>$12.3bnpaid to suppliers
22.6% of senior management are women
43%GHG emissions since 2008
Our strategy in action
We want to manage and grow Rio Tinto in ways that are safe, smart and benefit the world around us. So we set clear standards – both for ourselves and for the value we aim to deliver to our shareholders and stakeholders.
The value we create
You can see more examples of our strategy in action at the start of each section of the report and in the business reviews.
Divider pages See page 3, 75, 143, 267 and 289.
Business review pages See pages 34-51.
Annual report 2018 | riotinto.com 19
Strategic report

We have made significant progress reshaping our portfolio, creating a more focused business. But this focus did not come at the expense of growth: we grew output by just under 3% year on year on a copper-equivalent basis and continued to invest in high-quality growth. Our world-class portfolio and strong balance sheet position us well to succeed throughout the cycle, and create superior value for our shareholders.
We delivered strong results, declaring $13.5 billion in cash returns to shareholders on the back of $18 billion of underlying EBITDA. However, we must do better on safety.
Key performance indicators
All injury frequency rate (AIFR) R per 200,000 hours worked
DefinitionThe number of injuries per 200,000 hours worked by employees and contractors at operations that we manage. AIFR includes medical treatment cases, restricted work- day and lost-day injuries.
PerformanceOver the past five years, our AIFR has improved by 32% but it has deteriorated by 5% since last year. More importantly, though, we did not meet our goal of zero fatalities. In 2018, three colleagues lost their lives: one at our Paraburdoo Mine in the Pilbara, Australia; a contractor at our Sorel-Tracy plant in Quebec, Canada; and a security contractor at Richards Bay Minerals in South Africa.
Relevance to strategyPeople: safety is our number one priority, one of our core values and an essential component to everything we do. Our goal is zero fatalities. We are committed to reinforcing our safety culture, and key to this is improving leadership and simplifying our tools and systems.
Partners: we are seeking to learn from others and are strengthening our partnering for safety through the CEO Safety Award and other contractor safety initiatives. This is described further in the sustainable development section (page 52).
Associated risks – Health, safety, environment and
communities (HSE&C) risks, as our operations are inherently hazardous.
– Operations, projects and people risks, including management of major hazard and safety control frameworks.
Link to executive remunerationIncluded in the short term incentive plan (see page 108).
Forward planWe will: – Continue to implement our critical-risk
management programme. – Strengthen our safety leadership and
coaching programmes. – Work more closely with contractors and
joint-venture partners to improve our safety record.
– Continue to implement our major hazard standards, including process safety, water and tailings, with strong assurance processes.
– Simplify critical safety tools.
0.59
0.44
0.44
0.42
0.44
2014
2015
2016
2017
2018
SAFETY
Strategic report
R Linked to remuneration – see the Remuneration report on pages 101-136
Annual report 2018 | riotinto.com20
Key performance indicators
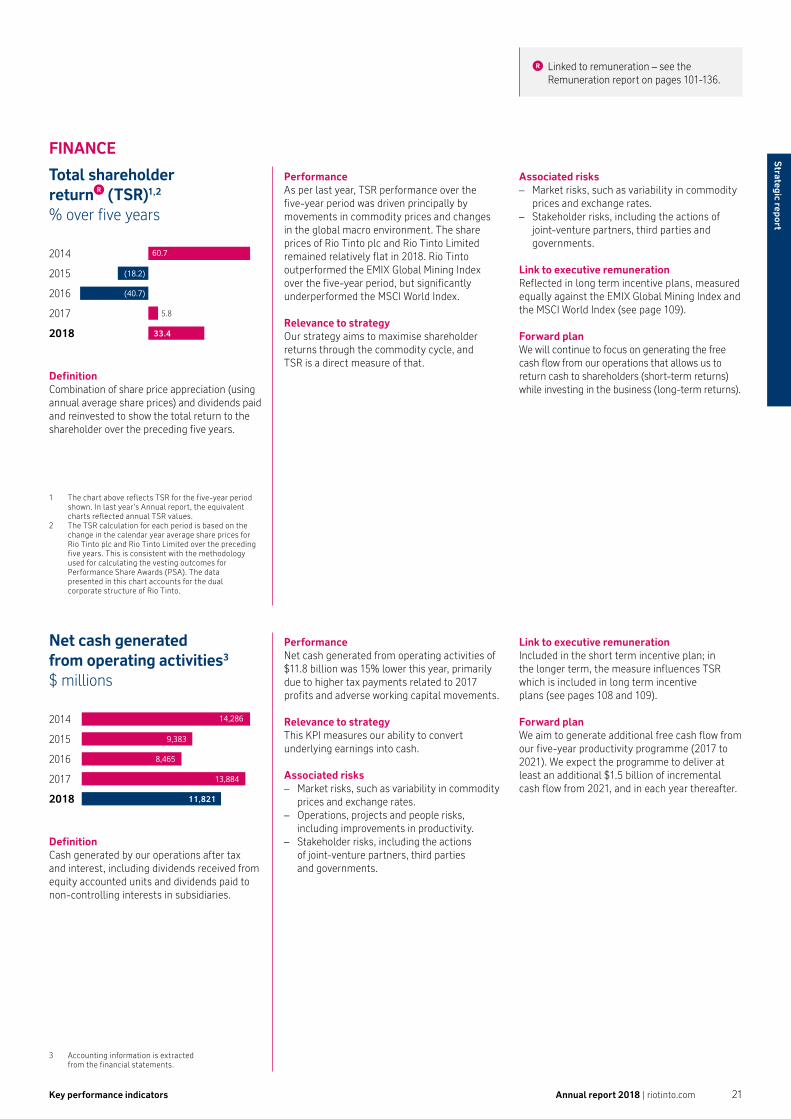
Net cash generated from operating activities3 $ millions
Total shareholder return R (TSR)1,2 % over five years
DefinitionCash generated by our operations after tax and interest, including dividends received from equity accounted units and dividends paid to non-controlling interests in subsidiaries.
DefinitionCombination of share price appreciation (using annual average share prices) and dividends paid and reinvested to show the total return to the shareholder over the preceding five years.
PerformanceNet cash generated from operating activities of $11.8 billion was 15% lower this year, primarily due to higher tax payments related to 2017 profits and adverse working capital movements.
Relevance to strategyThis KPI measures our ability to convert underlying earnings into cash.
Associated risks – Market risks, such as variability in commodity
prices and exchange rates. – Operations, projects and people risks,
including improvements in productivity. – Stakeholder risks, including the actions
of joint-venture partners, third parties and governments.
Performance As per last year, TSR performance over the five-year period was driven principally by movements in commodity prices and changes in the global macro environment. The share prices of Rio Tinto plc and Rio Tinto Limited remained relatively flat in 2018. Rio Tinto outperformed the EMIX Global Mining Index over the five-year period, but significantly underperformed the MSCI World Index.
Relevance to strategyOur strategy aims to maximise shareholder returns through the commodity cycle, and TSR is a direct measure of that.
Link to executive remunerationIncluded in the short term incentive plan; in the longer term, the measure influences TSR which is included in long term incentive plans (see pages 108 and 109).
Forward planWe aim to generate additional free cash flow from our five-year productivity programme (2017 to 2021). We expect the programme to deliver at least an additional $1.5 billion of incremental cash flow from 2021, and in each year thereafter.
Associated risks – Market risks, such as variability in commodity
prices and exchange rates. – Stakeholder risks, including the actions of
joint-venture partners, third parties and governments.
Link to executive remunerationReflected in long term incentive plans, measured equally against the EMIX Global Mining Index and the MSCI World Index (see page 109).
Forward planWe will continue to focus on generating the free cash flow from our operations that allows us to return cash to shareholders (short-term returns) while investing in the business (long-term returns).
3 Accounting information is extracted from the financial statements.
60.7
(18.2)
(40.7)
5.8
33.4
2014
2015
2016
2017
2018
14,286
9,383
8,465
13,884
11,821
2014
2015
2016
2017
2018
FINANCE
R Linked to remuneration – see the Remuneration report on pages 101-136.
1 The chart above reflects TSR for the five-year period shown. In last year’s Annual report, the equivalent charts reflected annual TSR values.
2 The TSR calculation for each period is based on the change in the calendar year average share prices for Rio Tinto plc and Rio Tinto Limited over the preceding five years. This is consistent with the methodology used for calculating the vesting outcomes for Performance Share Awards (PSA). The data presented in this chart accounts for the dual corporate structure of Rio Tinto.
Annual report 2018 | riotinto.com 21
Strategic report

Strategic report
Key performance indicators continued
Net cash /(net debt)1 $ millions
Underlying earnings R and underlying EBITDA1 $ millions
DefinitionNet borrowings after adjusting for cash and cash equivalents, other liquid investments and derivatives related to net debt (see note 24 of the financial statements).
DefinitionUnderlying earnings represent net earnings attributable to the owners of Rio Tinto, adjusted to exclude items which do not reflect the underlying performance of the Group’s operations. These items are explained in note 2 of the financial statements.
Underlying EBITDA represents profit before tax, net finance items, depreciation and amortisation. It excludes the EBITDA impact of the items mentioned above.
Performance Net debt decreased by $4.1 billion from $3.8 billion to net cash of $0.3 billion, as net cash generated from operating activities and disposal proceeds exceeded capital expenditure and cash returns to shareholders.
Relevance to strategyThis measures how we are managing our balance sheet and capital structure. A strong balance sheet is essential for giving us flexibility to take advantage of opportunities as they arise, and for returning cash to shareholders.
Associated risks – Market risks, such as variability in
commodity prices and exchange rates. – Operations, projects and people risks,
including delivery of productivity improvements.
– Stakeholder risks, including the actions of joint-venture partners, third parties and governments.
– Financial risks, including the impact of external events and internal discipline on Group liquidity.
– Strategic risks, such as the Group’s ability to successfully execute divestments and acquisitions and its ability to develop new projects successfully.
PerformanceUnderlying earnings of $8.8 billion were $0.2 billion higher than in 2017. Underlying EBITDA of $18.1 billion was $0.4 billion lower than 2017. The 2% decrease in underlying EBITDA resulted from higher volumes of iron ore and copper and higher prices for aluminium and copper being offset by lower iron ore prices, the coal divestments, and a rise in energy and raw material costs.
Relevance to strategyThese financial KPIs measure how well we are managing costs, increasing productivity and generating the most revenue from each of our assets.
Link to executive remunerationNet debt is, in part, an outcome of free cash flow, which itself is reflected in the short term incentive plan. In the longer term, net debt influences TSR which is reflected in long term incentive plans (see page 109).
Forward planWe believe that a strong balance sheet is a major competitive advantage and essential in a cyclical business. We will therefore continue to manage net debt carefully.
Associated risks – Market risks, such as variability in
commodity prices and exchange rates. – Operations, projects and people risks,
including improvements in productivity. – Stakeholder risks, including the actions
of joint-venture partners, third parties and governments.
Link to executive remunerationReflected in the short term incentive plan; in the longer term, both measures influence TSR, which is the primary measure for long term incentive plans (see page 109).
Forward planOur strategy aims to maximise shareholder returns through the commodity cycle. These will come principally from our productivity programme and investments for growth.
1 Accounting information is extracted from the financial statements.
19,665
9,305
4,540
5,100
8,627
12,621
13,510
18,580
18,136
8,808
2014
2015
2016
2017
EBITDA Underlying earnings
2018
(12,495)
(13,783)
(9,587)
(3,845)
255
2014
2015
2016
2017
2018
R Linked to remuneration – see the Remuneration report on pages 101-136
Annual report 2018 | riotinto.com22
Key performance indicators continued
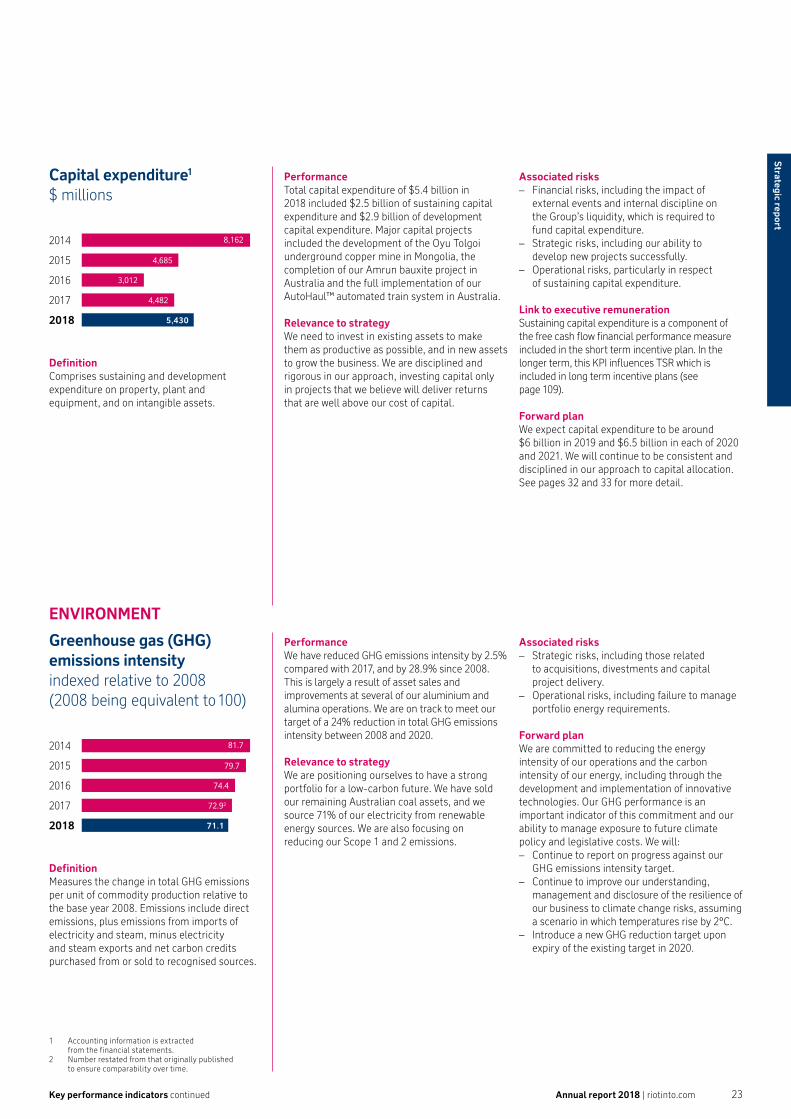
Greenhouse gas (GHG) emissions intensity indexed relative to 2008 (2008 being equivalent to 100)
Capital expenditure1 $ millions
DefinitionMeasures the change in total GHG emissions per unit of commodity production relative to the base year 2008. Emissions include direct emissions, plus emissions from imports of electricity and steam, minus electricity and steam exports and net carbon credits purchased from or sold to recognised sources.
DefinitionComprises sustaining and development expenditure on property, plant and equipment, and on intangible assets.
PerformanceWe have reduced GHG emissions intensity by 2.5% compared with 2017, and by 28.9% since 2008. This is largely a result of asset sales and improvements at several of our aluminium and alumina operations. We are on track to meet our target of a 24% reduction in total GHG emissions intensity between 2008 and 2020.
Relevance to strategyWe are positioning ourselves to have a strong portfolio for a low-carbon future. We have sold our remaining Australian coal assets, and we source 71% of our electricity from renewable energy sources. We are also focusing on reducing our Scope 1 and 2 emissions.
PerformanceTotal capital expenditure of $5.4 billion in 2018 included $2.5 billion of sustaining capital expenditure and $2.9 billion of development capital expenditure. Major capital projects included the development of the Oyu Tolgoi underground copper mine in Mongolia, the completion of our Amrun bauxite project in Australia and the full implementation of our AutoHaul™ automated train system in Australia.
Relevance to strategyWe need to invest in existing assets to make them as productive as possible, and in new assets to grow the business. We are disciplined and rigorous in our approach, investing capital only in projects that we believe will deliver returns that are well above our cost of capital.
Associated risks – Strategic risks, including those related
to acquisitions, divestments and capital project delivery.
– Operational risks, including failure to manage portfolio energy requirements.
Forward planWe are committed to reducing the energy intensity of our operations and the carbon intensity of our energy, including through the development and implementation of innovative technologies. Our GHG performance is an important indicator of this commitment and our ability to manage exposure to future climate policy and legislative costs. We will: – Continue to report on progress against our
GHG emissions intensity target. – Continue to improve our understanding,
management and disclosure of the resilience of our business to climate change risks, assuming a scenario in which temperatures rise by 2ºC.
– Introduce a new GHG reduction target upon expiry of the existing target in 2020.
Associated risks – Financial risks, including the impact of
external events and internal discipline on the Group’s liquidity, which is required to fund capital expenditure.
– Strategic risks, including our ability to develop new projects successfully.
– Operational risks, particularly in respect of sustaining capital expenditure.
Link to executive remunerationSustaining capital expenditure is a component of the free cash flow financial performance measure included in the short term incentive plan. In the longer term, this KPI influences TSR which is included in long term incentive plans (see page 109).
Forward planWe expect capital expenditure to be around $6 billion in 2019 and $6.5 billion in each of 2020 and 2021. We will continue to be consistent and disciplined in our approach to capital allocation. See pages 32 and 33 for more detail.
1 Accounting information is extracted from the financial statements.
2 Number restated from that originally published to ensure comparability over time.
8,162
4,685
3,012
4,482
5,430
2014
2015
2016
2017
2018
ENVIRONMENT
81.7
79.7
74.4
72.92
71.1
2014
2015
2016
2017
2018
Annual report 2018 | riotinto.com 23
Strategic report
Strategic report
Strong and consistent EBITDAIn a fairly volatile geopolitical environment, we increased our revenues to $40.5 billion while our underlying EBITDA remained relatively steady at $18.1 billion, with a margin of 42%. Average pricing, volumes and exchange rates were all positives, adding around $1.4 billion in aggregate to EBITDA. Higher sales volumes were mainly from iron ore, copper and gold. Shipments from the Pilbara rose 2% following improved rail capacity from AutoHaul™. And we delivered a strong year in copper on all fronts. However, these increases were offset by rising input costs, in particular energy and raw materials. These cost increases were mainly felt by our aluminium business, which was impacted to the tune of $0.5 billion. However, we did see some softening in raw material inflation in the second half. Other costs included $0.3 billion of restructuring, $0.1 billion higher than 2017, and a $0.1 billion increase in corporate costs, including pensions and insurance.
Productivity accelerating in 2019We remain committed to generating $1.5 billion of additional free cash flow each year from 2021 from our mine-to-market productivity programme. 2018 was a challenging year due to the rising input costs. In 2019, we expect to deliver $0.6 billion from the programme, which will bring our run-rate by the end of 2019 to $1.0 billion of additional free cash flow each year.
Increasing our investment in the business and returning cash to shareholdersHaving a strong balance sheet is key and we ended 2018 with net cash of $0.3 billion, following the completion of the Grasberg disposal in December. Our balance sheet provides us with the platform to continue to invest in attractive growth opportunities and sustain our track record of delivering strong cash returns to shareholders.
Over the past three years we have steadily increased our capital expenditure to $5.4 billion in 2018, as we continue to invest through the cycle. In 2018, we completed the Amrun bauxite project in Queensland and fully implemented the AutoHaul™ autonomous trains system in the Pilbara. Our most significant growth project is the Oyu Tolgoi copper/gold underground mine in Mongolia where we are investing around $1.0 billion a year. And from 2019, we will ramp-up investment in replacing our iron ore production in the Pilbara, following board approval for the Koodaideri and Robe River sustaining mines.
At the same time, we are continuing to deliver sector-leading cash returns to our shareholders. In total, we have announced $13.5 billion of returns in respect of 2018. This includes the final dividend of 180 US cents per share bringing the total ordinary dividend to 307 US cents, or $5.3 billion, which, together with the $1.0 billion share buy-back we announced in August, represents 72% of underlying earnings. We also announced supplementary returns of $7.2 billion from the divestments we made in 2018, including a $3.2 billion share buy-back and a special dividend of $4.0 billion from our most recently completed Grasberg and Aluminium Dunkerque disposals.
Underlying EBITDA
$18.1bn2% decrease
Operating cash flow
$11.8bn15% decrease
Net cash
$0.3bn$4.1bn reduction in net debt
Chief financial officer’s statement
We continue to allocate capital with discipline. Our strong balance sheet and operating cash flow allow us to invest in the business and deliver sector-leading cash returns to shareholders.”
Annual report 2018 | riotinto.com24
Financial review
Our view on the 2018 global economy Global economic growth in 2018 was around 3%. Strong economic growth in the US, estimated at 2.9%, was driven by domestic tax cuts implemented in January 2018. The US unemployment rate fell to a 49-year low of 3.7% in September, but strong growth and rising core inflation resulted in four benchmark rate increases over the year. The imposition of section 232 tariffs on steel and aluminium in March, and section 301 tariffs on China in April, weighed on global commodity prices, though macro effects were limited. Worries over slowing growth and trade tensions caused a sharp downward correction in US equity markets in the fourth quarter, erasing earlier gains.
In China, growth was 6.8% in the first two quarters, as a second quarter pick-up in industrial production and strong trade data helped to offset weakening housing sales and falling infrastructure investment. The effects of a deleveraging campaign squeezed the economy more visibly in the third quarter, resulting in government measures to encourage infrastructure investment and support the private sector. Growth continued to decelerate in the fourth quarter as property sales remained soft and industrial value-added production and trade growth weakened.
The European and Japanese economies slowed more than expected due to weak global demand and negative shocks to business investment. Investment was hurt by softer manufacturing growth, tapering of quantitative easing across Europe and natural disasters in Japan.
A weakening global manufacturing cycle and softer Chinese commodity demand hurt growth in many emerging markets. Increased capital outflows, driven by monetary tightening in the US and rising risk aversion, also reduced domestic investment.
OutlookOver the next couple of years, global growth is likely to weaken as monetary policy normalises and US fiscal stimulus fades, increasing risks to the business environment. The outlook for China depends to some extent on the resolution of the tariff negotiations with the US, but is likely to be weaker on softer property sales and deferred
investment. Signs that downside risks could be minimised would include a successful resolution to US-China trade negotiations, early stabilisation of the global manufacturing cycle and a slower pace of interest rate increases by the Federal Reserve.
Stimulus in China and a modest relaxation of deleveraging could provide some support for domestic demand in the second half of the year. Measures to increase infrastructure construction will also be important and could provide some support for commodity demand.
We believe the biggest risks in 2019 include any escalation of the US trade conflict with China, a sharp downward correction in global equities as monetary policy tightens, and a more severe than expected deceleration of Chinese growth.
Volatility around these risks, combined with weakening fundamentals, would make for a challenging business environment. However, our strong balance sheet and world-class portfolio place us in a sound position. We will be able to continue to improve our business, invest through the cycle and deliver returns to shareholders.
Jakob StausholmChief financial officer27 February 2019
Annual report 2018 | riotinto.com 25
Strategic report
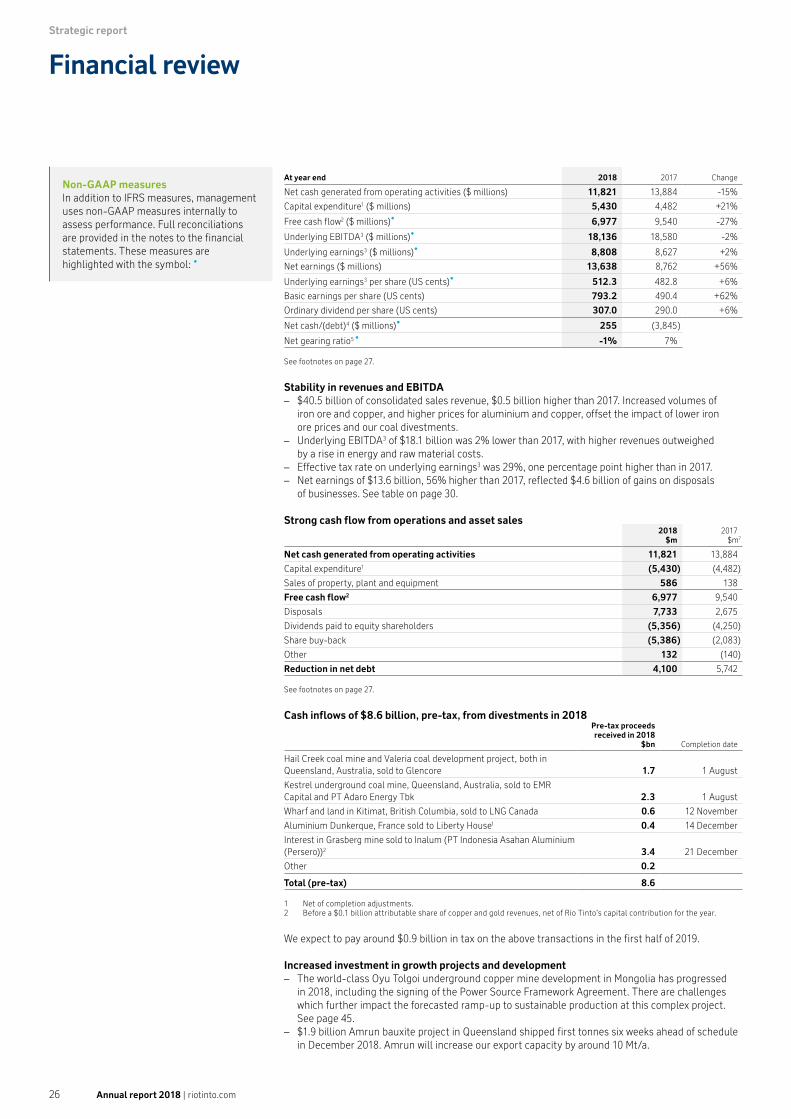
Strategic report
Financial review
At year end 2018 2017 Change
Net cash generated from operating activities ($ millions) 11,821 13,884 -15%
Capital expenditure1 ($ millions) 5,430 4,482 +21%
Free cash flow2 ($ millions)• 6,977 9,540 -27%
Underlying EBITDA3 ($ millions)• 18,136 18,580 -2%
Underlying earnings3 ($ millions)• 8,808 8,627 +2%
Net earnings ($ millions) 13,638 8,762 +56%
Underlying earnings3 per share (US cents)• 512.3 482.8 +6%
Basic earnings per share (US cents) 793.2 490.4 +62%
Ordinary dividend per share (US cents) 307.0 290.0 +6%
Net cash/(debt)4 ($ millions)• 255 (3,845)
Net gearing ratio5 • -1% 7%
See footnotes on page 27.
Stability in revenues and EBITDA – $40.5 billion of consolidated sales revenue, $0.5 billion higher than 2017. Increased volumes of
iron ore and copper, and higher prices for aluminium and copper, offset the impact of lower iron ore prices and our coal divestments.
– Underlying EBITDA3 of $18.1 billion was 2% lower than 2017, with higher revenues outweighed by a rise in energy and raw material costs.
– Effective tax rate on underlying earnings3 was 29%, one percentage point higher than in 2017. – Net earnings of $13.6 billion, 56% higher than 2017, reflected $4.6 billion of gains on disposals
of businesses. See table on page 30.
Strong cash flow from operations and asset sales2018
$m2017
$m7
Net cash generated from operating activities 11,821 13,884
Capital expenditure1 (5,430) (4,482)
Sales of property, plant and equipment 586 138
Free cash flow2 6,977 9,540
Disposals 7,733 2,675
Dividends paid to equity shareholders (5,356) (4,250)
Share buy-back (5,386) (2,083)
Other 132 (140)
Reduction in net debt 4,100 5,742
See footnotes on page 27.
Cash inflows of $8.6 billion, pre-tax, from divestments in 2018Pre-tax proceeds received in 2018
$bn Completion date
Hail Creek coal mine and Valeria coal development project, both in Queensland, Australia, sold to Glencore 1.7 1 August
Kestrel underground coal mine, Queensland, Australia, sold to EMR Capital and PT Adaro Energy Tbk 2.3 1 August
Wharf and land in Kitimat, British Columbia, sold to LNG Canada 0.6 12 November
Aluminium Dunkerque, France sold to Liberty House1 0.4 14 December
Interest in Grasberg mine sold to Inalum (PT Indonesia Asahan Aluminium (Persero))2 3.4 21 December
Other 0.2
Total (pre-tax) 8.6
1 Net of completion adjustments.2 Before a $0.1 billion attributable share of copper and gold revenues, net of Rio Tinto’s capital contribution for the year.
We expect to pay around $0.9 billion in tax on the above transactions in the first half of 2019.
Increased investment in growth projects and development – The world-class Oyu Tolgoi underground copper mine development in Mongolia has progressed
in 2018, including the signing of the Power Source Framework Agreement. There are challenges which further impact the forecasted ramp-up to sustainable production at this complex project. See page 45.
– $1.9 billion Amrun bauxite project in Queensland shipped first tonnes six weeks ahead of schedule in December 2018. Amrun will increase our export capacity by around 10 Mt/a.
Non-GAAP measuresIn addition to IFRS measures, management uses non-GAAP measures internally to assess performance. Full reconciliations are provided in the notes to the financial statements. These measures are highlighted with the symbol: •
Annual report 2018 | riotinto.com26
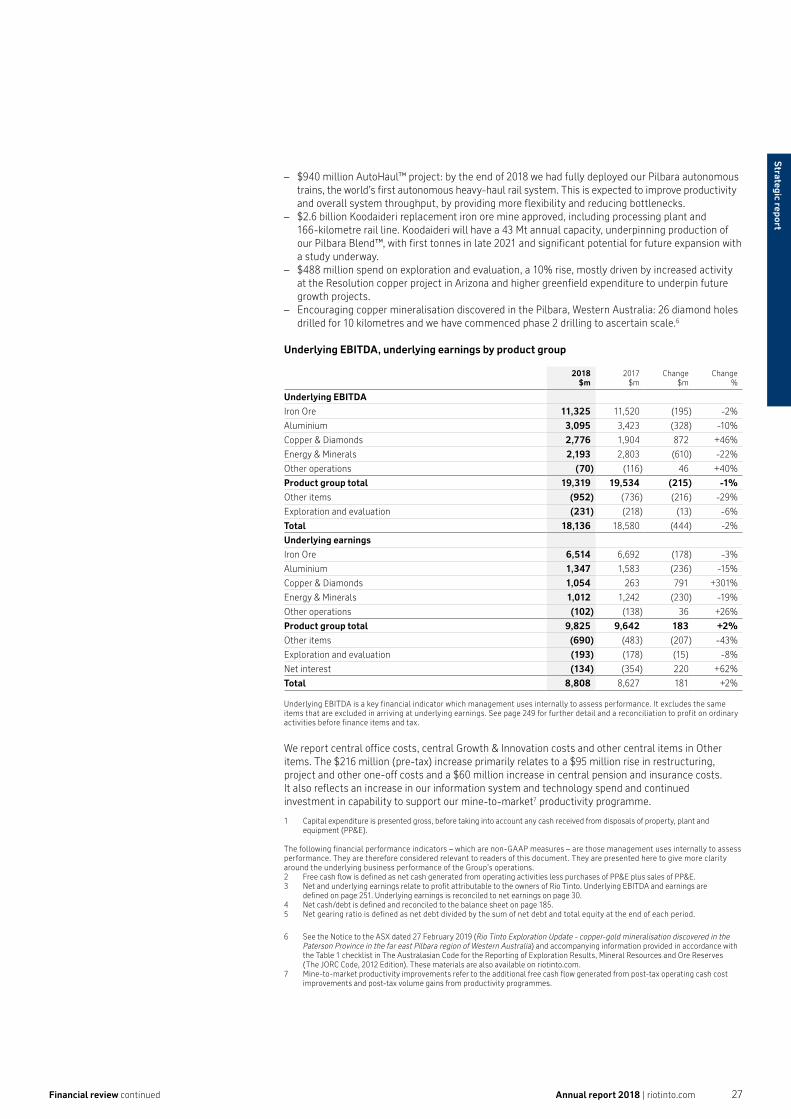
Financial review continued
– $940 million AutoHaul™ project: by the end of 2018 we had fully deployed our Pilbara autonomous trains, the world’s first autonomous heavy-haul rail system. This is expected to improve productivity and overall system throughput, by providing more flexibility and reducing bottlenecks.
– $2.6 billion Koodaideri replacement iron ore mine approved, including processing plant and 166-kilometre rail line. Koodaideri will have a 43 Mt annual capacity, underpinning production of our Pilbara Blend™, with first tonnes in late 2021 and significant potential for future expansion with a study underway.
– $488 million spend on exploration and evaluation, a 10% rise, mostly driven by increased activity at the Resolution copper project in Arizona and higher greenfield expenditure to underpin future growth projects.
– Encouraging copper mineralisation discovered in the Pilbara, Western Australia: 26 diamond holes drilled for 10 kilometres and we have commenced phase 2 drilling to ascertain scale.6
Underlying EBITDA, underlying earnings by product group
2018$m
2017$m
Change$m
Change %
Underlying EBITDA
Iron Ore 11,325 11,520 (195) -2%
Aluminium 3,095 3,423 (328) -10%
Copper & Diamonds 2,776 1,904 872 +46%
Energy & Minerals 2,193 2,803 (610) -22%
Other operations (70) (116) 46 +40%
Product group total 19,319 19,534 (215) -1%
Other items (952) (736) (216) -29%
Exploration and evaluation (231) (218) (13) -6%
Total 18,136 18,580 (444) -2%
Underlying earnings
Iron Ore 6,514 6,692 (178) -3%
Aluminium 1,347 1,583 (236) -15%
Copper & Diamonds 1,054 263 791 +301%
Energy & Minerals 1,012 1,242 (230) -19%
Other operations (102) (138) 36 +26%
Product group total 9,825 9,642 183 +2%
Other items (690) (483) (207) -43%
Exploration and evaluation (193) (178) (15) -8%
Net interest (134) (354) 220 +62%
Total 8,808 8,627 181 +2%
Underlying EBITDA is a key financial indicator which management uses internally to assess performance. It excludes the same items that are excluded in arriving at underlying earnings. See page 249 for further detail and a reconciliation to profit on ordinary activities before finance items and tax.
We report central office costs, central Growth & Innovation costs and other central items in Other items. The $216 million (pre-tax) increase primarily relates to a $95 million rise in restructuring, project and other one-off costs and a $60 million increase in central pension and insurance costs. It also reflects an increase in our information system and technology spend and continued investment in capability to support our mine-to-market7 productivity programme.
1 Capital expenditure is presented gross, before taking into account any cash received from disposals of property, plant and equipment (PP&E).
The following financial performance indicators – which are non-GAAP measures – are those management uses internally to assess performance. They are therefore considered relevant to readers of this document. They are presented here to give more clarity around the underlying business performance of the Group’s operations.2 Free cash flow is defined as net cash generated from operating activities less purchases of PP&E plus sales of PP&E. 3 Net and underlying earnings relate to profit attributable to the owners of Rio Tinto. Underlying EBITDA and earnings are
defined on page 251. Underlying earnings is reconciled to net earnings on page 30.4 Net cash/debt is defined and reconciled to the balance sheet on page 185.5 Net gearing ratio is defined as net debt divided by the sum of net debt and total equity at the end of each period.
6 See the Notice to the ASX dated 27 February 2019 (Rio Tinto Exploration Update - copper-gold mineralisation discovered in the Paterson Province in the far east Pilbara region of Western Australia) and accompanying information provided in accordance with the Table 1 checklist in The Australasian Code for the Reporting of Exploration Results, Mineral Resources and Ore Reserves (The JORC Code, 2012 Edition). These materials are also available on riotinto.com.
7 Mine-to-market productivity improvements refer to the additional free cash flow generated from post-tax operating cash cost improvements and post-tax volume gains from productivity programmes.
Annual report 2018 | riotinto.com 27
Strategic report

Strategic report
Financial review continued
Commentary on financial resultsTo provide additional insight into the performance of our business, we report underlying EBITDA and underlying earnings. The principal factors explaining the movements in underlying EBITDA are set out in this table.
$m
2017 underlying EBITDA 18,580
Prices 277
Exchange rates 286
Volumes and mix 863
General inflation (301)
Energy (436)
Operating cash cost movements (750)
Higher exploration and evaluation spend (43)
One-off items (23)
Non-cash costs/other (317)
2018 underlying EBITDA 18,136
Prices generally stableCommodity price movements in 2018 increased underlying EBITDA by $277 million compared with 2017. We have included a table of prices and exchange rates on page 298.
The FOB (free on board) Platts index for 62% iron Pilbara fines was 4% lower on average compared with 2017.
Average prices for copper and aluminium were up 6% and 7% respectively, compared with 2017. We also benefitted from higher market premiums for aluminium, in particular the mid-west premium in the US which averaged $419 per tonne in 2018 – a 111% rise on 2017’s $199 per tonne.
On 1 March, the US government announced a 10% tariff on US imports of aluminium from Canada, which it implemented on 1 June. We do not expect this to have a significant financial impact on our business in the near term.
Weaker Australian dollarCompared with 2017, on average the US dollar strengthened by 3% against the Australian dollar, stayed flat against the Canadian dollar and weakened by 1% against the South African rand. Currency movements increased underlying EBITDA by $286 million relative to 2017.
Rise in our iron ore, copper and gold volumesHigher sales volumes increased underlying EBITDA by $863 million compared with 2017, mainly in iron ore and copper/gold. Our Pilbara iron ore shipments rose as we debottlenecked our rail network following full implementation of AutoHaul™ autonomous trains and ramped up production from our new Silvergrass mine. In copper, we benefitted from better operating performance at Escondida including the absence of the labour disruption in 2017, as well as higher copper grades at Rio Tinto Kennecott and higher gold grades at Oyu Tolgoi.
Increase in energy pricesHigher energy prices compared to 2017 reduced our underlying EBITDA by $436 million. This was mainly due to the average price of oil rising by roughly 31% in 2018 to $71 per barrel. Our Pacific Aluminium smelters were also affected by higher coal prices and a new power contract.
Continued cost pressuresOur cash operating costs rose by $750 million compared with 2017. The considerable efficiencies we continue to see from our mine-to-market productivity programme were offset by the increasing costs of raw materials – in particular caustic soda, petroleum coke and tar pitch for Aluminium.
Higher expenditure on exploration and evaluationWe spent $43 million more on exploration and evaluation compared with last year. This went to our highest-value projects, particularly the Resolution copper project in Arizona.
One-off itemsOne-off items were $23 million more than in 2017. At Iron Ore Company of Canada, we suspended operations for two months in 2018 ($236 million impact) before reaching a new labour agreement. At Iron & Titanium, production was suspended after a fatality at our Sorel-Tracy plant and labour disruptions at Richards Bay Minerals ($132 million impact). In 2017, our most significant one-off item was the strike action at Escondida, which led to lower volumes and higher unit costs with a $316 million impact.
Non-cash costs/otherThe movements in our non-cash costs and other items lowered EBITDA by $317 million compared to 2017. We had $717 million less in underlying EBITDA following the sale of our coal businesses in 2017 and 2018. This was partly offset by the $278 million gain on sale of the Winchester South and Valeria coal development projects and a $167 million revaluation of a royalty receivable arising from the disposal of the Mount Pleasant coal project in 2016. Our restructuring costs were $95 million higher as we continued our reorganisation around four operating and commercial hubs.
“ Strong and consistent EBITDA with modestly higher prices, and improved volumes offset by higher energy prices and raw materials costs.”
Annual report 2018 | riotinto.com28
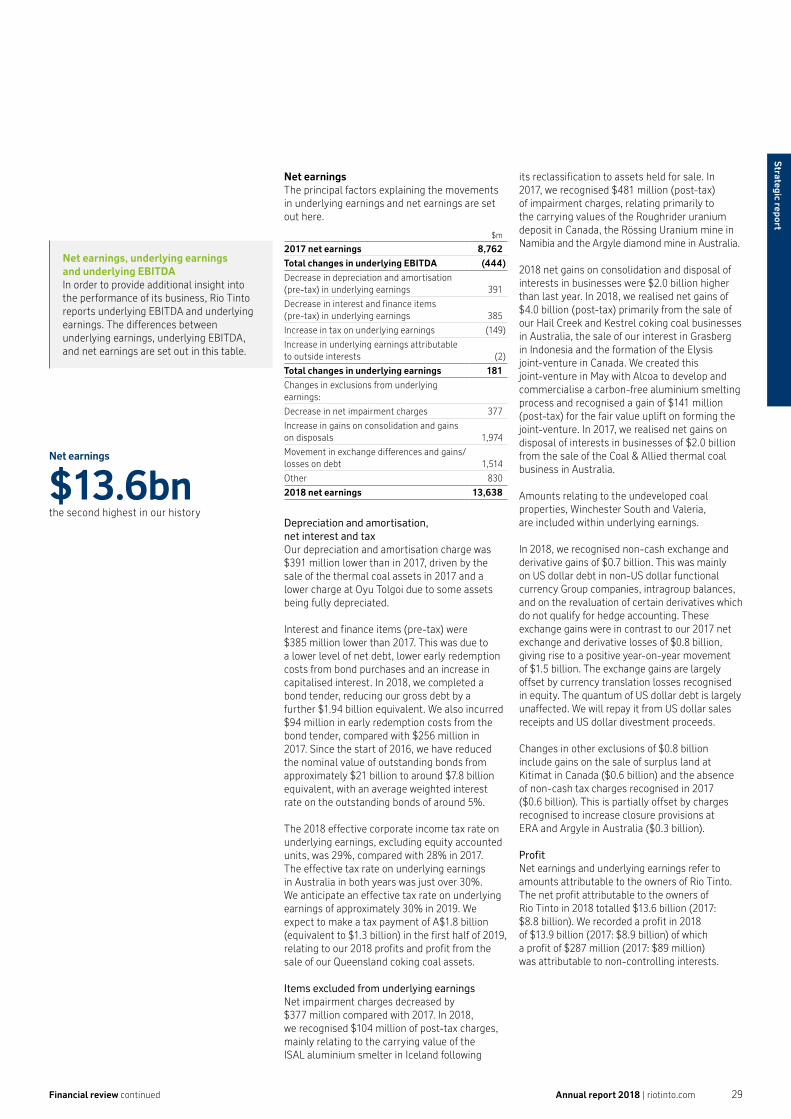
Financial review continued
Net earningsThe principal factors explaining the movements in underlying earnings and net earnings are set out here.
$m
2017 net earnings 8,762
Total changes in underlying EBITDA (444)
Decrease in depreciation and amortisation (pre-tax) in underlying earnings 391
Decrease in interest and finance items (pre-tax) in underlying earnings 385
Increase in tax on underlying earnings (149)
Increase in underlying earnings attributable to outside interests (2)
Total changes in underlying earnings 181
Changes in exclusions from underlying earnings:
Decrease in net impairment charges 377
Increase in gains on consolidation and gains on disposals 1,974
Movement in exchange differences and gains/losses on debt 1,514
Other 830
2018 net earnings 13,638
Depreciation and amortisation, net interest and taxOur depreciation and amortisation charge was $391 million lower than in 2017, driven by the sale of the thermal coal assets in 2017 and a lower charge at Oyu Tolgoi due to some assets being fully depreciated.
Interest and finance items (pre-tax) were $385 million lower than 2017. This was due to a lower level of net debt, lower early redemption costs from bond purchases and an increase in capitalised interest. In 2018, we completed a bond tender, reducing our gross debt by a further $1.94 billion equivalent. We also incurred $94 million in early redemption costs from the bond tender, compared with $256 million in 2017. Since the start of 2016, we have reduced the nominal value of outstanding bonds from approximately $21 billion to around $7.8 billion equivalent, with an average weighted interest rate on the outstanding bonds of around 5%.
The 2018 effective corporate income tax rate on underlying earnings, excluding equity accounted units, was 29%, compared with 28% in 2017. The effective tax rate on underlying earnings in Australia in both years was just over 30%. We anticipate an effective tax rate on underlying earnings of approximately 30% in 2019. We expect to make a tax payment of A$1.8 billion (equivalent to $1.3 billion) in the first half of 2019, relating to our 2018 profits and profit from the sale of our Queensland coking coal assets.
Items excluded from underlying earningsNet impairment charges decreased by $377 million compared with 2017. In 2018, we recognised $104 million of post-tax charges, mainly relating to the carrying value of the ISAL aluminium smelter in Iceland following
Net earnings
$13.6bnthe second highest in our history
its reclassification to assets held for sale. In 2017, we recognised $481 million (post-tax) of impairment charges, relating primarily to the carrying values of the Roughrider uranium deposit in Canada, the Rössing Uranium mine in Namibia and the Argyle diamond mine in Australia.
2018 net gains on consolidation and disposal of interests in businesses were $2.0 billion higher than last year. In 2018, we realised net gains of $4.0 billion (post-tax) primarily from the sale of our Hail Creek and Kestrel coking coal businesses in Australia, the sale of our interest in Grasberg in Indonesia and the formation of the Elysis joint-venture in Canada. We created this joint-venture in May with Alcoa to develop and commercialise a carbon-free aluminium smelting process and recognised a gain of $141 million (post-tax) for the fair value uplift on forming the joint-venture. In 2017, we realised net gains on disposal of interests in businesses of $2.0 billion from the sale of the Coal & Allied thermal coal business in Australia.
Amounts relating to the undeveloped coal properties, Winchester South and Valeria, are included within underlying earnings.
In 2018, we recognised non-cash exchange and derivative gains of $0.7 billion. This was mainly on US dollar debt in non-US dollar functional currency Group companies, intragroup balances, and on the revaluation of certain derivatives which do not qualify for hedge accounting. These exchange gains were in contrast to our 2017 net exchange and derivative losses of $0.8 billion, giving rise to a positive year-on-year movement of $1.5 billion. The exchange gains are largely offset by currency translation losses recognised in equity. The quantum of US dollar debt is largely unaffected. We will repay it from US dollar sales receipts and US dollar divestment proceeds.
Changes in other exclusions of $0.8 billion include gains on the sale of surplus land at Kitimat in Canada ($0.6 billion) and the absence of non-cash tax charges recognised in 2017 ($0.6 billion). This is partially offset by charges recognised to increase closure provisions at ERA and Argyle in Australia ($0.3 billion).
ProfitNet earnings and underlying earnings refer to amounts attributable to the owners of Rio Tinto. The net profit attributable to the owners of Rio Tinto in 2018 totalled $13.6 billion (2017: $8.8 billion). We recorded a profit in 2018 of $13.9 billion (2017: $8.9 billion) of which a profit of $287 million (2017: $89 million) was attributable to non-controlling interests.
Net earnings, underlying earnings and underlying EBITDAIn order to provide additional insight into the performance of its business, Rio Tinto reports underlying EBITDA and underlying earnings. The differences between underlying earnings, underlying EBITDA, and net earnings are set out in this table.
Annual report 2018 | riotinto.com 29
Strategic report

Strategic report
Financial review continued
Net earnings, underlying earnings and underlying EBITDAThe differences between underlying earnings and net earnings are set out in this table (all numbers are after tax and exclude non-controlling interests).
2018$m
2017$m
Underlying earnings 8,808 8,627
Items excluded from underlying earnings
Impairment charges (104) (481)
Net gains on consolidation and disposal of interests in businesses 3,996 2,022
Foreign exchange and derivative gains/(losses) on US dollar net debt and intragroup balances and derivatives not qualifying for hedge accounting 704 (810)
Gain on sale of wharf and land in Kitimat, Canada 569 –
Changes in closure estimates (non-operating and fully impaired sites) (335) –
Changes in corporate tax rates – (439)
Tax charge relating to expected divestments – (202)
Other excluded items – 45
Net earnings 13,638 8,762
The explanation of excluded items is on page 29. On pages 167 to 168 there is a detailed reconciliation from underlying earnings to net earnings, including pre-tax amounts and additional explanatory notes. The differences between underlying EBITDA, EBITDA and net earnings are set out in this table.
2018$m
2017$m
Underlying EBITDA 18,136 18,580
Net gains on consolidation and disposal of interests in businesses 4,622 2,344
Gains/(losses) on embedded commodity derivatives not qualifying for hedge accounting (including exchange) 279 (505)
Gain on sale of wharf and land in Kitimat, Canada 602 –
Changes in closure estimates (376) –
Other excluded items – 73
EBITDA 23,263 20,492
Depreciation and amortisation in subsidiaries excluding capitalised depreciation (3,909) (4,302)
Impairment charges, net of reversals (132) (796)
Depreciation and amortisation in equity accounted units (650) (648)
Finance items in subsidiaries (33) (1,658)
Taxation in subsidiaries (4,242) (3,965)
Taxation and finance items in equity accounted units (372) (272)
Less profit attributable to non-controlling interests (287) (89)
Net earnings 13,638 8,762
Cash flowWe generated $11.8 billion in net cash from our operating activities, 15% lower than in 2017. This reduction was primarily driven by higher tax payments related to our 2017 profits and adverse working capital movements.
We invested $5.4 billion in capital expenditure, 21% more than in 2017 as our major projects ramped up. These included our Oyu Tolgoi underground copper mine in Mongolia, the completion of our Amrun bauxite project in Queensland and the full implementation of AutoHaul™, the automation of our Pilbara train system.
We generated $7.0 billion of free cash flow, 27% lower than 2017, in line with our lower operating cash flow and higher capital expenditure. This was partly offset by proceeds from the sale of property, plant and equipment including $ 0.5 billion received from the sale of surplus land at Kitimat. In 2018, our mine-to-market productivity programme exit rate was $0.4 billion which was impacted by $0.3 billion of raw material cost headwinds. We are on track to be generating $1.5 billion per year in free cash flow from this programme from 2021.
We paid $5.4 billion in dividends to our shareholders. We also repurchased $5.4 billion of our shares: $2.1 billion of these were bought off-market in Australia and $3.3 billion on-market in the UK in 2018 as part of our ongoing programme.
Balance sheetOur net debt (see page 185) declined by $4.1 billion, giving rise to net cash of $0.3 billion. This reflects our 2018 operating cash flows and divestment proceeds, offset by the increase in capital expenditure, payment of the final dividend and the ongoing share buy-back.
Our net gearing ratio (net debt to total capital) decreased to -1% at 31 December 2018 (31 December 2017: 7%).
Total financing liabilities at 31 December 2018 were $13.0 billion (see page 185) and the weighted average maturity was around 11 years. At 31 December 2018, approximately 79% of Rio Tinto’s total borrowings were at floating interest rates. The maximum amount, within non-current borrowings, maturing in any one calendar year was $1.7 billion, which matures in 2025. These amounts are subject to revision following the implementation of IFRS 16 on 1 January 2019.
In 2018, we repaid $2.3 billion of borrowings, mainly through the early redemption of bonds. Cash and cash equivalents plus other short-term cash investments at 31 December 2018 were $13.3 billion (31 December 2017: $11.5 billion).
(3.8)
11.8
7.7
(5.4)
0.2
0.6
(10.8)
0.3
Net debt atDecember 2017
Operating cash�ow
Disposals
Capital expenditure
Sales of property, plant and equipment
Dividends and share buy-backs
Other
Net cash at December 2018
Net debt movements($ billion)
(10.8)
Annual report 2018 | riotinto.com30

Financial review continued
Our shareholder returns policyAt the end of each financial period, the board determines an appropriate total level of ordinary dividend per share, taking into account the results for the financial year, the outlook for our major commodities, the board’s view of the long-term growth prospects of the business and the company’s objective of maintaining a strong balance sheet. The intention is that the balance between the interim and final dividend be weighted to the final dividend.
The board expects total cash returns to shareholders over the longer term to be in a range of 40%-60% of underlying earnings in aggregate through the cycle.
The board is committed to maintaining an appropriate balance between cash returns to shareholders and investment in the business, with the intention of maximising shareholder value.
Acknowledging the cyclical nature of the industry, in periods of strong earnings and cash generation, it is the board’s intention to supplement the ordinary dividends with additional returns to shareholders.
$bn US cents per share
Ordinary dividend
Interim paid in September 2018 2.2 127.00
Final to be paid in April 2019 3.1 180.00
2018 full-year dividend 5.3 307.00
Additional returns
Share buy-back announced in August 2018, completed by 27 February 2019 1.0
Combined total is 72% of 2018 underlying earnings 6.3
Supplementary share buy-back, returns of post-tax divestment proceeds
Off-market buy-back in Rio Tinto Limited, completed in November 2018 2.1
On-market buy-back in Rio Tinto plc from 28 February 2019 to be completed no later than 28 February 2020 1.1
Special dividend of 243 US cents per share 4.0
Total supplementary returns 7.2
Total cash returns to shareholders declared for 2018 13.5
We determine dividends in US dollars. We declare and pay Rio Tinto plc dividends in pounds sterling and Rio Tinto Limited dividends in Australian dollars. The 2018 final dividend and the special dividend were converted at exchange rates applicable on 26 February 2019 (the latest practicable date prior to the declaration of the dividend). ADR holders receive dividends in US dollars.
Ordinary dividend per share 2018 2017
Rio Tinto Group
Interim (US cents) 127.00 110.00
Final (US cents) 180.00 180.00
Full-year dividend (US cents) 307.00 290.00
Rio Tinto plc
Interim (UK pence) 96.82 83.13
Final (UK pence) 135.96 129.43
Full-year dividend (UK pence) 232.78 212.56
Rio Tinto Limited
Interim (Australian cents) 170.84 137.72
Final (Australian cents) 250.89 228.53
Full-year dividend (Australian cents) 421.73 366.25
Special dividend per share 2018
Rio Tinto Group
US cents per share 243.00
Rio Tinto plc
UK pence per share 183.55
Rio Tinto Limited
Australian cents per share 338.70
Both the 2018 final dividend and the special dividend to be paid to our Rio Tinto Limited shareholders will be fully franked. The board expects Rio Tinto Limited to be in a position to pay fully franked dividends for the foreseeable future.
We will pay the 2018 final dividend and the special dividend on 18 April 2019 to holders of ordinary shares and ADRs on the register at the close of business on 8 March 2019. The ex-dividend date for both the 2018 final dividend and the special dividend for Rio Tinto Limited, Rio Tinto plc and Rio Tinto plc ADR shareholders is 7 March 2019.
Rio Tinto plc shareholders may choose to receive their dividend in Australian dollars, and Rio Tinto Limited shareholders may choose to receive theirs in pounds sterling. Currency conversions will be based on the pound sterling and Australian dollar exchange rates five business days before the dividend payment date. Rio Tinto plc and Rio Tinto Limited shareholders must register their currency elections by 28 March 2019.
We will operate our Dividend Reinvestment Plans for both the 2018 final dividend and the special dividend – see our website (riotinto.com) for details. Rio Tinto plc and Rio Tinto Limited shareholders’ election notice for the Dividend Reinvestment Plans must be received by 28 March 2019. Purchases under the Dividend Reinvestment Plan are made on, or as soon as practicable after, the dividend payment date and at prevailing market prices. There is no discount available.
“ In 2018, we have declared record cash returns to shareholders of $13.5bn, comprising $6.3bn from operations and $7.2bn from divestments.”
Annual report 2018 | riotinto.com 31
Strategic report
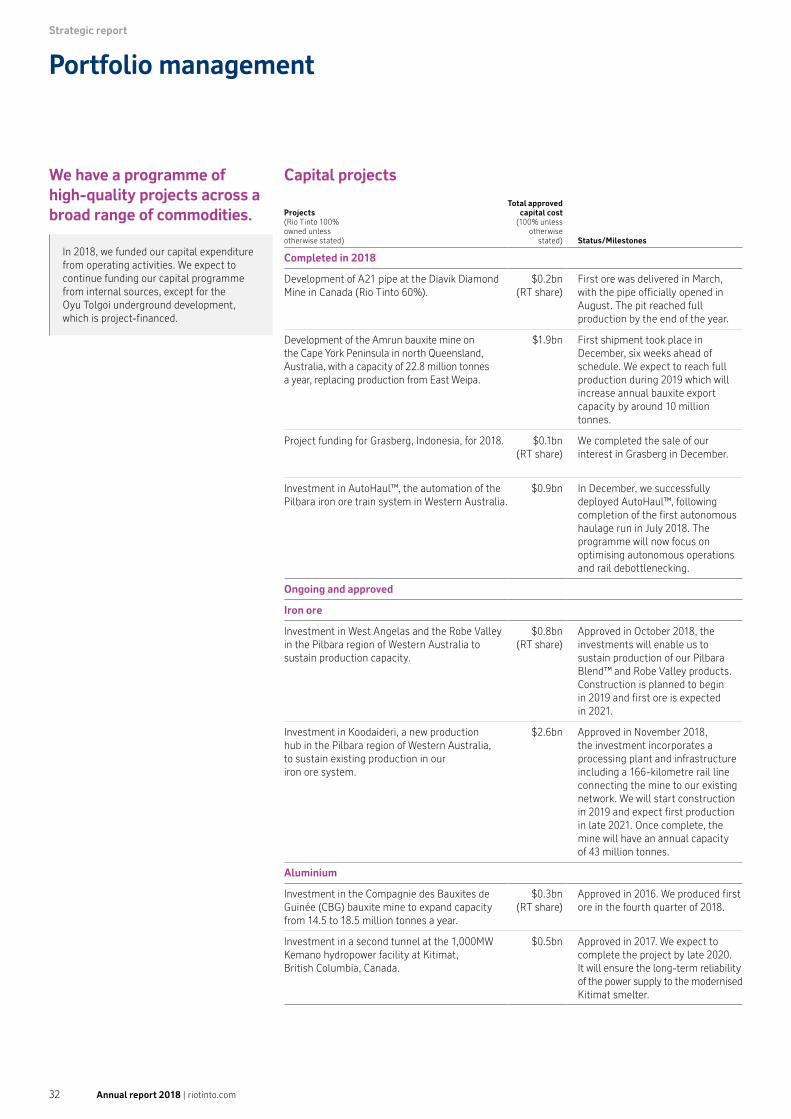
Strategic report
Portfolio management
Capital projects
Projects (Rio Tinto 100% owned unless otherwise stated)
Total approved capital cost
(100% unless otherwise
stated) Status/Milestones
Completed in 2018
Development of A21 pipe at the Diavik Diamond Mine in Canada (Rio Tinto 60%).
$0.2bn(RT share)
First ore was delivered in March, with the pipe officially opened in August. The pit reached full production by the end of the year.
Development of the Amrun bauxite mine on the Cape York Peninsula in north Queensland, Australia, with a capacity of 22.8 million tonnes a year, replacing production from East Weipa.
$1.9bn First shipment took place in December, six weeks ahead of schedule. We expect to reach full production during 2019 which will increase annual bauxite export capacity by around 10 million tonnes.
Project funding for Grasberg, Indonesia, for 2018. $0.1bn(RT share)
We completed the sale of our interest in Grasberg in December.
Investment in AutoHaul™, the automation of the Pilbara iron ore train system in Western Australia.
$0.9bn In December, we successfully deployed AutoHaul™, following completion of the first autonomous haulage run in July 2018. The programme will now focus on optimising autonomous operations and rail debottlenecking.
Ongoing and approved
Iron ore
Investment in West Angelas and the Robe Valley in the Pilbara region of Western Australia to sustain production capacity.
$0.8bn(RT share)
Approved in October 2018, the investments will enable us to sustain production of our Pilbara Blend™ and Robe Valley products. Construction is planned to begin in 2019 and first ore is expected in 2021.
Investment in Koodaideri, a new production hub in the Pilbara region of Western Australia, to sustain existing production in our iron ore system.
$2.6bn Approved in November 2018, the investment incorporates a processing plant and infrastructure including a 166-kilometre rail line connecting the mine to our existing network. We will start construction in 2019 and expect first production in late 2021. Once complete, the mine will have an annual capacity of 43 million tonnes.
Aluminium
Investment in the Compagnie des Bauxites de Guinée (CBG) bauxite mine to expand capacity from 14.5 to 18.5 million tonnes a year.
$0.3bn(RT share)
Approved in 2016. We produced first ore in the fourth quarter of 2018.
Investment in a second tunnel at the 1,000MW Kemano hydropower facility at Kitimat, British Columbia, Canada.
$0.5bn Approved in 2017. We expect to complete the project by late 2020. It will ensure the long-term reliability of the power supply to the modernised Kitimat smelter.
We have a programme of high-quality projects across a broad range of commodities.
In 2018, we funded our capital expenditure from operating activities. We expect to continue funding our capital programme from internal sources, except for the Oyu Tolgoi underground development, which is project-financed.
Annual report 2018 | riotinto.com32
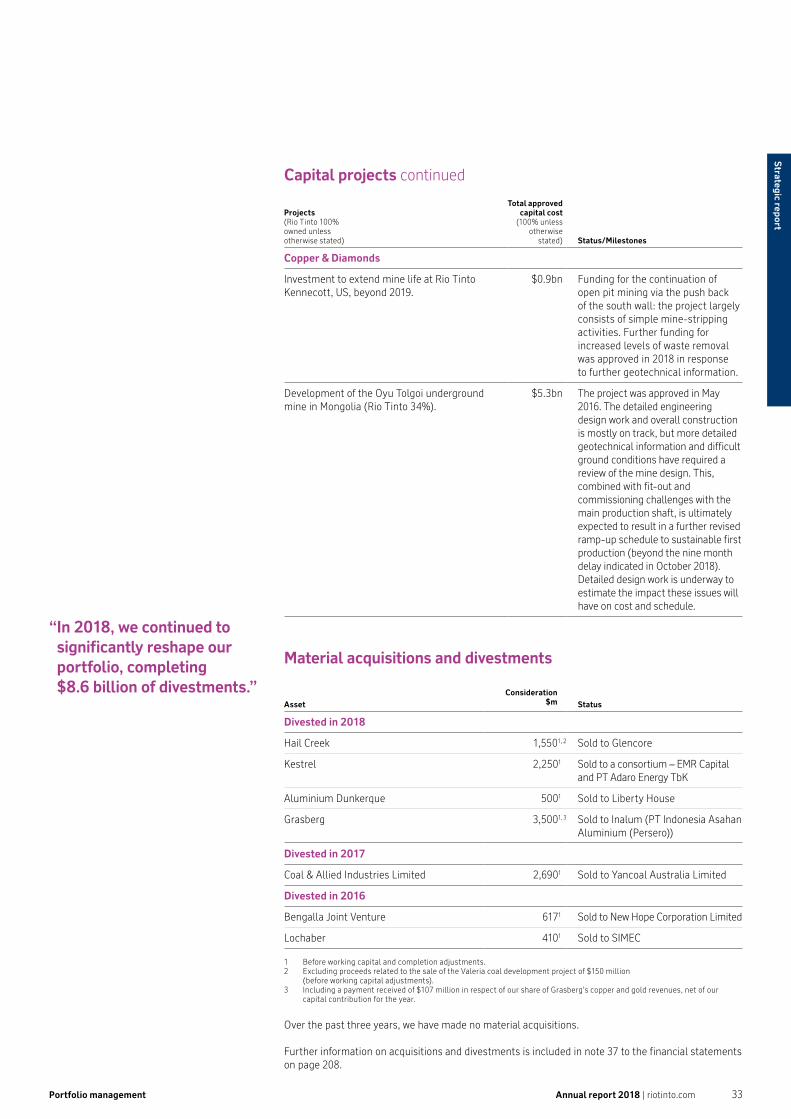
Portfolio management
Projects (Rio Tinto 100% owned unless otherwise stated)
Total approved capital cost
(100% unless otherwise
stated) Status/Milestones
Copper & Diamonds
Investment to extend mine life at Rio Tinto Kennecott, US, beyond 2019.
$0.9bn Funding for the continuation of open pit mining via the push back of the south wall: the project largely consists of simple mine-stripping activities. Further funding for increased levels of waste removal was approved in 2018 in response to further geotechnical information.
Development of the Oyu Tolgoi underground mine in Mongolia (Rio Tinto 34%).
$5.3bn The project was approved in May 2016. The detailed engineering design work and overall construction is mostly on track, but more detailed geotechnical information and difficult ground conditions have required a review of the mine design. This, combined with fit-out and commissioning challenges with the main production shaft, is ultimately expected to result in a further revised ramp-up schedule to sustainable first production (beyond the nine month delay indicated in October 2018). Detailed design work is underway to estimate the impact these issues will have on cost and schedule.
Material acquisitions and divestments
AssetConsideration
$m Status
Divested in 2018
Hail Creek 1,5501, 2 Sold to Glencore
Kestrel 2,2501 Sold to a consortium – EMR Capital and PT Adaro Energy TbK
Aluminium Dunkerque 5001 Sold to Liberty House
Grasberg 3,5001, 3 Sold to Inalum (PT Indonesia Asahan Aluminium (Persero))
Divested in 2017
Coal & Allied Industries Limited 2,6901 Sold to Yancoal Australia Limited
Divested in 2016
Bengalla Joint Venture 6171 Sold to New Hope Corporation Limited
Lochaber 4101 Sold to SIMEC
1 Before working capital and completion adjustments.2 Excluding proceeds related to the sale of the Valeria coal development project of $150 million
(before working capital adjustments). 3 Including a payment received of $107 million in respect of our share of Grasberg’s copper and gold revenues, net of our
capital contribution for the year.
Over the past three years, we have made no material acquisitions.
Further information on acquisitions and divestments is included in note 37 to the financial statements on page 208.
Capital projects continued
“ In 2018, we continued to significantly reshape our portfolio, completing $8.6 billion of divestments.”
Annual report 2018 | riotinto.com 33
Strategic report

Strategic report | Business reviews
In Iron Ore, our success is underpinned by an integrated system of mines and infrastructure, a quality product offering, and a focus on creating and growing value for all our stakeholders.”Chris SalisburyChief executive, Iron Ore
Iron Ore
16integrated mines in Western Australia
5iron ore products
4port terminals
1,700km automated rail network, including AutoHaul™, the world’s largest robot
13.5%of residential workforce from Indigenous groups in the Pilbara
10,500 employees
Our integrated iron ore operations in the Pilbara, Western Australia, use cutting-edge technology to mine and transport iron ore to our customers safely, efficiently and in response to market conditions.
Our iron ore operations comprise a world-class, integrated network of 16 iron ore mines, four independent port terminals, a 1,700 kilometre rail network and related infrastructure.
Insights from data help us to explore and extract our iron ore efficiently. Our Operations Centre in Perth uses next-generation technologies, including artificial intelligence, automation and robotics, to run operations in real-time and respond quickly to changes. Our AutoHaul™ train system is the first fully autonomous, long-distance, heavy-haul rail network – the world’s largest robot.
Each of these elements works together to deliver high-quality iron ore, including our flagship Pilbara Blend™, to our customers reliably and safely.
Annual report 2018 | riotinto.com34

Snapshots from the year…
2018 in numbers
1fatality (2017: 0 fatalities)
$18.5bn gross sales revenue (2017: $18.3bn)
68% underlying free on board (FOB) EBITDA margin (2017: 68%)
$8.3bn cash generated from operating activities (2017: $8.5bn)
KoodaideriOur most advanced mine
In November, our board approved $2.6 billion in funding for Koodaideri, our first intelligent mine, located in the Pilbara, Western Australia. Koodaideri is a high-quality, long-life, low-cost and expandable iron ore asset. Designed to run automated trucks and drills, Koodaideri is set to be our safest and most efficient operation.
One initiative unique to Koodaideri will be the use of a digital twin of the mine that collects all the data from design, build, commissioning and operation. This will give our people in the field and at our remote operations centre, the ability to access the same information and make decisions, based on real-time data, in seconds instead of hours or days.
Our contribution to Western AustraliaHelping Western Australia to thrive alongside our company is a commitment we take seriously. One way we are fulfilling this commitment is by making it easier for local businesses to become part of our supply chain through procurement opportunities.
In July, we launched a new partnership with the Regional Chambers of Commerce & Industry Western Australia (RCCIWA) to build capability in businesses in the Pilbara.
Local businesses have access to a portal to find and bid for contracts. In 2018, we awarded over 100 scopes of work through this portal. We also use 30-day payment terms to help small business partners (those with less than $1 million of expenditure) to manage their cash flow.
When fully operational, Koodaideri will produce up to 43 million tonnes of iron ore a year, in its first phase, contributing to our flagship product, Pilbara Blend™. It will also become a new production hub for our iron ore business, incorporating a processing plant and infrastructure including a 166-kilometre rail line connecting the mine to our existing network.
Koodaideri will also bring jobs and business opportunities to Western Australia, including for Traditional Owners and Indigenous people. The construction phase will create over 2,000 jobs and, when operational, we expect the mine to employ about 600 people.
The construction phase will create more than
2,000 jobsWe are working with more than 140 Aboriginal businesses in the Pilbara to help build capacity and become Rio Tinto suppliers. In 2018, we spent $120 million with more than 45 Pilbara Aboriginal businesses.
We have also launched a partnership with the government of Western Australia and post-secondary education institution, South Metropolitan TAFE, to develop the first nationally recognised certificate in automation. This partnership aims to train people in the new skills required to work with automation, and ensure these skills are easily transferable across the industry – allowing people to pursue opportunity wherever they find it.
Australia’s
1stqualification in automation
Business reviews | Iron ore Annual report 2018 | riotinto.com 35
Strategic report

Strategic report | Business reviews
SafetyTragically, there was a fatality this year at our Paraburdoo mine in Western Australia. We are deeply affected by this loss, and our thoughts remain with the families and many friends, colleagues and communities affected. Following a detailed investigation, we have shared our learnings and implemented a number of measures at Paraburdoo and across our Pilbara operations.
In 2018, while our all-injury frequency rate rose to 0.63, 31% more than 2017, the severity of injuries decreased. We are actively working to reduce injuries and eliminate fatalities, and have introduced a number of safety initiatives with our employees and contractor partners to improve engagement and reduce risk. We continue to focus on critical-risk management. In 2018, we completed over 300,000 verifications on fatality-risk critical controls and introduced a transferable learnings process.
This year, we also focused heavily on reducing exposure to material risks, and we continued to invest in a range of mental health and wellbeing programmes to support our workforce and their families.
Financial performanceWe continued to deliver strong results from our world-class iron ore assets. We benefitted from robust demand for our high-quality products, we increased shipments and maintained unit costs. It was a solid year operationally although third-quarter production was affected by a safety pause across all operations following the fatality at the Paraburdoo mine.
Underlying EBITDA of $11.3 billion in 2018 was 2% lower than 2017, primarily driven by lower prices and higher energy costs. The average FOB Platts index for 62% Pilbara fines dropped by 4%, which lowered our EBITDA by $0.5 billion relative to 2017. We partly offset this by increasing shipments by 2% to 338 million tonnes.
In 2018, Pilbara unit cash costs were marginally lower at $13.3 per tonne (2017: $13.4 per tonne). Higher volumes and the weakening of the Australian dollar offset headwinds including higher diesel prices, rises in labour and maintenance costs, and steeper hauls.
Our Pilbara operations delivered an underlying FOB EBITDA margin of 68% in 2018, consistent with 2017.
In 2018, we priced approximately 68% of our sales with reference to the current month average index; 17% with reference to the prior quarter’s average index lagged by one month; 5% with reference to the current quarter average; and 10% on the spot market. Approximately 32% of our sales were made on an FOB basis with the remainder sold including freight.
In 2018, we achieved an average iron ore price of $57.8 per wet metric tonne on an FOB basis (2017: $59.6 per wet metric tonne). This equates to $62.8 per dry metric tonne (2017: $64.8 per dry metric tonne), which compares with the average FOB Platts index of $61.2 per dry metric tonne for the 62% iron Pilbara fines product (2017: $64.1 per dry metric tonne).
Gross sales revenue for our Pilbara operations in 2018 included freight revenue of $1.69 billion (2017: $1.46 billion).
Net cash generated from operating activities of $8.3 billion was 2% lower than 2017, driven by the same trends as underlying EBITDA.
Free cash flow of $7.0 billion, 3% lower than 2017, reflected higher capital spend. This was largely sustaining capital, including rail improvements, structural integrity works and automation.
Iron Ore continued
2018 results1 2018 2017 Change
Pilbara production (million tonnes – Rio Tinto share) 281.8 271.3 +4%
Pilbara production (million tonnes – 100%) 337.8 329.8 +2%
Pilbara shipments (million tonnes – Rio Tinto share) 280.8 272.0 +3%
Pilbara shipments (million tonnes – 100%) 338.2 330.1 +2%
Gross sales revenue ($ millions) 18,485 18,251 +1%
Underlying EBITDA ($ millions) 11,325 11,520 -2%
Pilbara underlying FOB EBITDA margin2 68% 68%
Underlying earnings ($ millions) 6,514 6,692 -3%
Net cash generated from operating activities ($ millions) 8,332 8,466 -2%
Capital expenditure ($ millions) (1,288) (1,201) +7%
Free cash flow ($ millions) 7,043 7,265 -3%
1 Iron Ore Company of Canada and the Simandou iron ore project in Guinea are reported within Energy & Minerals, reflecting management responsibility.
2 The Pilbara underlying FOB EBITDA margin is defined as Pilbara underlying EBITDA divided by Pilbara revenues, excluding freight revenue.
11,520
(479)
142
(105)
11,008
321
(31)
27
11,325
(70)
2017 underlying EBITDA
Price
Exchange rates
Energy
In�ation
Flexed 2017 underlying EBITDA
Volumes and mix
Cash costs
Other
2018 underlying EBITDA
Underlying EBITDA 2017 vs 2018 ($ million)
Annual report 2018 | riotinto.com36

Business reviews | Iron ore
Review of operationsOur Pilbara mines in Western Australia produced 338 million tonnes in 2018 (with 282 million tonnes as Rio Tinto’s share) – 2% higher than 2017. This increase came from expanded mines and productivity improvements across the integrated system.
In December 2018, we successfully deployed AutoHaul™, the world’s first automated heavy-haul, long-distance rail network. Since completing the first autonomous haulage run in July 2018, we have steadily increased the number of driverless journeys, with more than 1.6 million kilometres travelled autonomously in 2018. The programme will now focus on optimising autonomous operations.
New projects and growth optionsIn 2018, the board approved three new investments to sustain our existing production capacity. We are set to invest $2.6 billion in the Koodaideri mine. This will be the most technologically advanced iron ore mine and, as a new production hub in the Pilbara, will create significant future flexibility in the system. It will incorporate a processing plant and infrastructure, including a 166-kilometre rail line connecting the mine to our existing infrastructure network. We expect construction to start in 2019, with first production in late 2021. Once complete, the initial mine development will have an annual capacity of 43 million tonnes.
We also received board approval for a $44 million pre-feasibility study into Koodaideri Phase 2. This will explore options for expanding annual capacity from our new production hub to 70 million tonnes and beyond, underpinning production of our Pilbara Blend™.
With our joint-venture partners, Mitsui and Nippon Steel, we will invest $1.55 billion (Rio Tinto’s 53% share $820 million) to sustain production capacity at the Robe Valley and West Angelas mines. We expect construction on these projects to start in 2019, and production of first ore from 2021.
Markets and outlookDemand for the high-quality, higher grade iron ores we produce remained strong in 2018. This was driven by Chinese environmental policy and the supply-side reform of the steel sector. With Chinese steel mills continuing to chase productivity, prices for 62% iron ore remained relatively stable, while prices for 58% iron ore traded at a 42% discount (on average) to 62% iron ore in 2018. Around 90% of our Pilbara products are priced with reference to the 62% index.
Global steel markets were resilient in 2018, supported by record Chinese crude steel production of 928 million tonnes. Chinese steel inventories declined, highlighting healthy end-use demand. Steel demand outside China was also robust. India overtook Japan as the world’s second-largest steel producer, and Europe’s steel demand and production sustained its growth momentum. We have also seen US capacity utilisation recovering on the back of tariffs on steel imports imposed by section 232. With US annual steel imports representing just two-and-a-half weeks of Chinese steel production, we continue to expect the impact of section 232 on China to be minimal.
2018 seaborne iron ore supply was essentially flat compared to 2017. Expansions from the major producers were mostly offset by high-cost, low-quality supply exiting the market, coupled with significant operational disruptions and industrial disputes. China’s domestic supply dropped to 240 million tonnes in 2018.
Scrap use increased, with up to 50 million tonnes of new electric arc furnace (EAF) capacity expected in the next five years. Scrap use will remain limited by availability, quality, location and economics, and we expect EAF utilisation rates to stay below 70%.
Greenhouse gas emissionsThis year we continued to reduce our greenhouse gas emissions intensity compared with the baseline target set in 2008. Since 2008, greenhouse gas emissions intensity in our Iron Ore operations has reduced by 7.3%.
Continued delivery from a world-class asset.”
Underlying FOB EBITDA margin
68% (2017: 68%)
Pilbara shipments(million tonnes – 100% basis)
288.3
318.5
327.6
330.1
338.2
2014
2015
2016
2017
2018
Annual report 2018 | riotinto.com 37
Strategic report
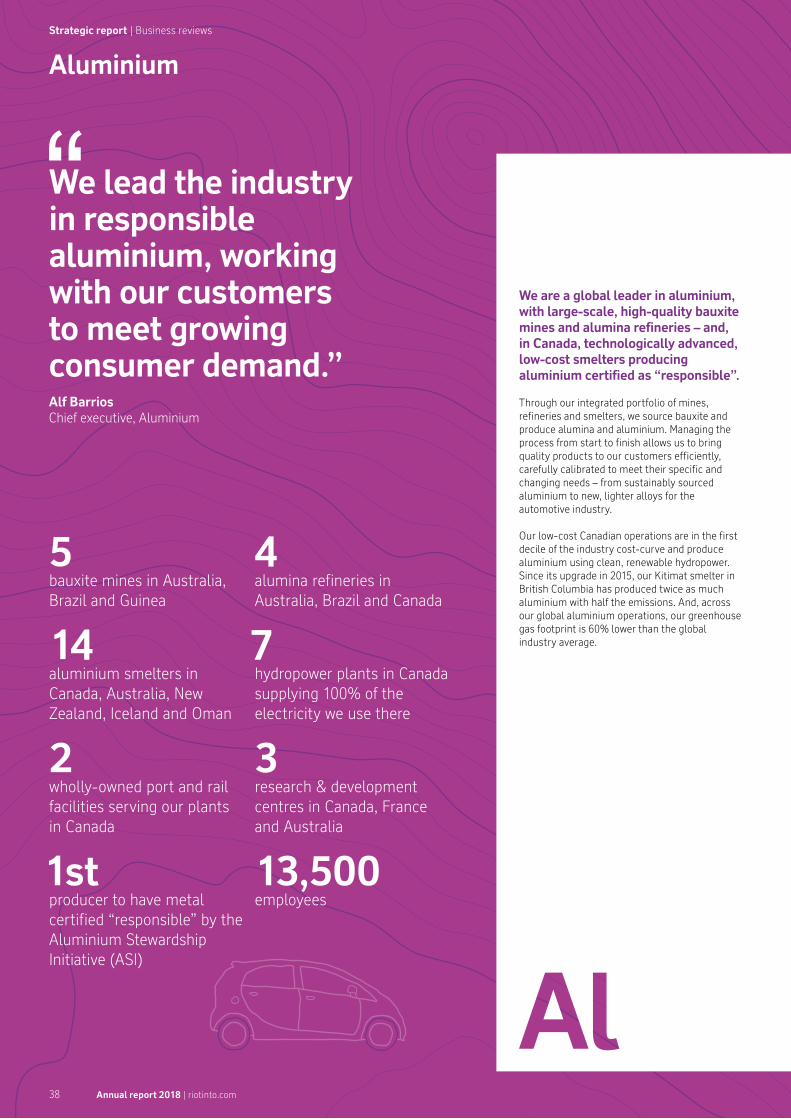
Strategic report | Business reviews
We lead the industry in responsible aluminium, working with our customers to meet growing consumer demand.”Alf BarriosChief executive, Aluminium
Aluminium
5 bauxite mines in Australia, Brazil and Guinea
4 alumina refineries in Australia, Brazil and Canada
14aluminium smelters in Canada, Australia, New Zealand, Iceland and Oman
7 hydropower plants in Canada supplying 100% of the electricity we use there
2 wholly-owned port and rail facilities serving our plants in Canada
3research & development centres in Canada, France and Australia
1st producer to have metal certified “responsible” by the Aluminium Stewardship Initiative (ASI)
13,500employees
We are a global leader in aluminium, with large-scale, high-quality bauxite mines and alumina refineries – and, in Canada, technologically advanced, low-cost smelters producing aluminium certified as “responsible”.
Through our integrated portfolio of mines, refineries and smelters, we source bauxite and produce alumina and aluminium. Managing the process from start to finish allows us to bring quality products to our customers efficiently, carefully calibrated to meet their specific and changing needs – from sustainably sourced aluminium to new, lighter alloys for the automotive industry.
Our low-cost Canadian operations are in the first decile of the industry cost-curve and produce aluminium using clean, renewable hydropower. Since its upgrade in 2015, our Kitimat smelter in British Columbia has produced twice as much aluminium with half the emissions. And, across our global aluminium operations, our greenhouse gas footprint is 60% lower than the global industry average.
Annual report 2018 | riotinto.com38
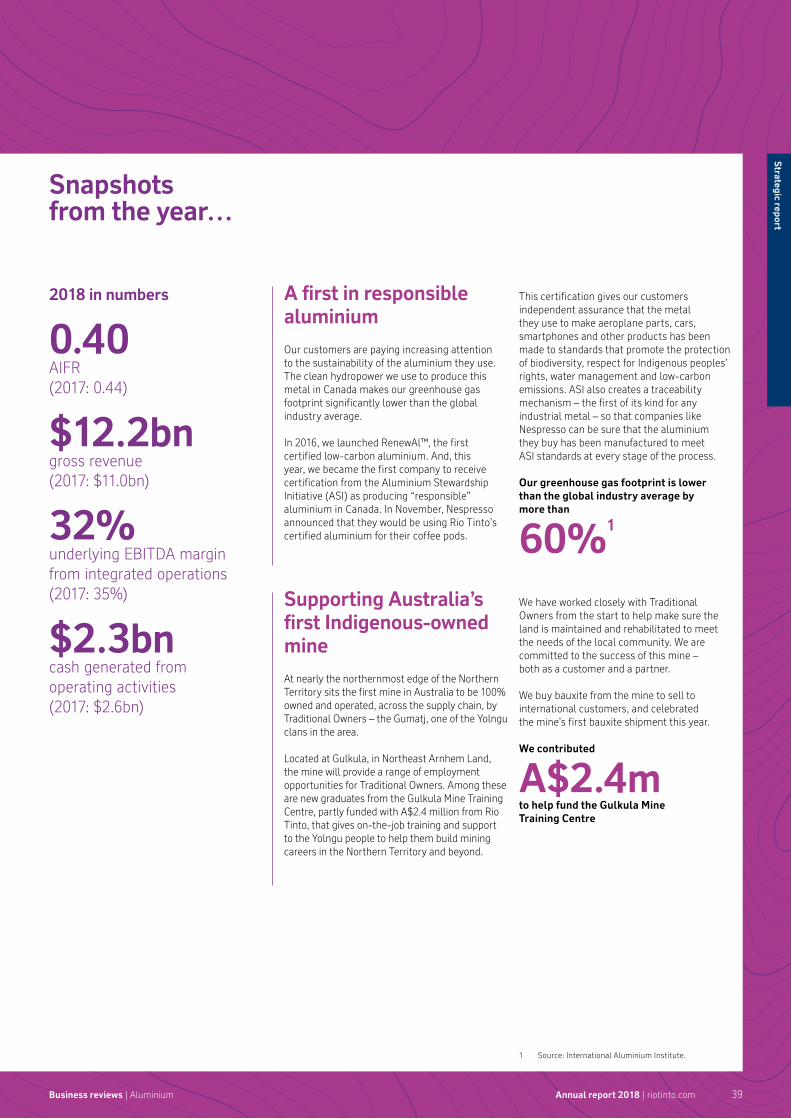
Snapshots from the year…
2018 in numbers
0.40AIFR (2017: 0.44)
$12.2bn gross revenue (2017: $11.0bn)
32% underlying EBITDA margin from integrated operations(2017: 35%)
$2.3bn cash generated from operating activities (2017: $2.6bn)
A first in responsible aluminiumOur customers are paying increasing attention to the sustainability of the aluminium they use. The clean hydropower we use to produce this metal in Canada makes our greenhouse gas footprint significantly lower than the global industry average.
In 2016, we launched RenewAl™, the first certified low-carbon aluminium. And, this year, we became the first company to receive certification from the Aluminium Stewardship Initiative (ASI) as producing “responsible” aluminium in Canada. In November, Nespresso announced that they would be using Rio Tinto’s certified aluminium for their coffee pods.
Supporting Australia’s first Indigenous-owned mineAt nearly the northernmost edge of the Northern Territory sits the first mine in Australia to be 100% owned and operated, across the supply chain, by Traditional Owners – the Gumatj, one of the Yolngu clans in the area.
Located at Gulkula, in Northeast Arnhem Land, the mine will provide a range of employment opportunities for Traditional Owners. Among these are new graduates from the Gulkula Mine Training Centre, partly funded with A$2.4 million from Rio Tinto, that gives on-the-job training and support to the Yolngu people to help them build mining careers in the Northern Territory and beyond.
This certification gives our customers independent assurance that the metal they use to make aeroplane parts, cars, smartphones and other products has been made to standards that promote the protection of biodiversity, respect for Indigenous peoples’ rights, water management and low-carbon emissions. ASI also creates a traceability mechanism – the first of its kind for any industrial metal – so that companies like Nespresso can be sure that the aluminium they buy has been manufactured to meet ASI standards at every stage of the process.
Our greenhouse gas footprint is lower than the global industry average by more than
60%1
We have worked closely with Traditional Owners from the start to help make sure the land is maintained and rehabilitated to meet the needs of the local community. We are committed to the success of this mine – both as a customer and a partner.
We buy bauxite from the mine to sell to international customers, and celebrated the mine’s first bauxite shipment this year.
We contributed
A$2.4mto help fund the Gulkula Mine Training Centre
1 Source: International Aluminium Institute.
Business reviews | Aluminium Annual report 2018 | riotinto.com 39
Strategic report

Strategic report | Business reviews
Aluminium continued
3,423
283
136
(132)
3,616
185
(491)
(215)
3,095
(94)
2017 underlying EBITDA
Price
Exchange rates
Energy
In�ation
Flexed 2017 underlying EBITDA
Volumes and mix
Cash costs
Other
2018 underlying EBITDA
Underlying EBITDA 2017 vs 2018 ($ million)
Safety2018 marked a fourth consecutive fatality-free year for Aluminium. Our all-injury frequency rate continued to decline (from 0.44 to 0.40), marking another record. The severity of our injuries also decreased year on year, however we had more lost-time injuries in 2018 than 2017. In 2018, we continued our strong focus on critical risk management, completing over 293,000 verifications on fatality-risk critical controls and improving the level of critical risk management maturity across our sites. We also continued to make process safety improvements, reducing the number of incidents and enhancing the management of critical risks. We are proud that our Power Operations division, based in Quebec, was awarded the Rio Tinto 2018 CEO Safety Award.
Our strong commitment to safety extends to mental health and wellbeing. We provided training and implemented various programmes to support employees and their families.
Financial performanceOur aluminium business was stable from an operational perspective, with higher premiums for our sales in North America offset by the US 10% tariff. The year was characterised by market volatility from tariffs, sanctions and alumina supply disruptions and rises in input prices for key raw materials.
Underlying EBITDA of $3.1 billion declined by 10% compared with 2017. The stronger pricing environment, in particular for primary metal in the first half of the year, helped to increase revenues. However, this was more than outweighed by the impact of legacy alumina sales contracts, raw material cost inflation and lower aluminium volumes. The lower volumes were primarily due to labour disruptions at the non-managed Becancour smelter in Canada and a power interruption at the Dunkerque smelter in France.
In 2018, we achieved an average realised aluminium price of $2,470 per tonne (2017:
$2,231 per tonne). This comprised the LME price, a market premium and a value-added product (VAP) premium. The cash LME price averaged $2,110 per tonne, 7% higher than 2017. Market premiums increased in all regions. In our key US market, the mid-West premium rose 111% to $419 per tonne (2017: $199 per tonne), driven by the 10% US tariff implemented on 1 June which is included in our operating costs. VAP represented 57% of the primary metal we sold (2017: 57%) and generated attractive product premiums averaging $224 per tonne of VAP sold (2017: $221 per tonne). Overall, the improvement in prices increased our underlying EBITDA by $0.3 billion compared with 2017.
Although we are broadly balanced in alumina, we are exposed to approximately 2.2 million tonnes of legacy alumina sales contracts which have a fixed linkage to the LME price. These contracts date back to 2005 or earlier, and the majority expire between 2023 and 2030. The negative impact on EBITDA of these legacy contracts, following significant escalation in the alumina index due to industry supply disruptions, was $0.46 billion in 2018. This was $0.3 billion higher than in 2017.
In 2018, there was a significant impact from raw material cost headwinds – most notably caustic soda, petroleum coke and tar pitch. In addition, higher priced energy relating to stronger thermal coal pricing negatively impacted our Pacific Aluminium smelters in Australia. These headwinds resulted in around $0.5 billion (pre-tax) of cost inflation relative to the 2017 pricing of these inputs.
Despite these pressures, we maintained our position as the leading business in the sector, with an EBITDA margin from integrated operations of 32%.
Net cash from operating activities decreased by 12%, driven by the underlying EBITDA performance. Our overall free cash flow declined by 54%. This was partly due to the reduction in EBITDA and partly to 33% higher capital
2018 results 2018 2017 Change
Bauxite production (000 tonnes - Rio Tinto share) 50,421 50,796 -1%
Alumina production (000 tonnes - Rio Tinto share) 7,980 8,131 -2%
Aluminium production (000 tonnes - Rio Tinto share) 3,458 3,551 -3%
Gross sales revenue ($ millions) 12,191 11,005 +11%
Underlying EBITDA ($ millions) 3,095 3,423 -10%
Underlying EBITDA margin (integrated operations) 32% 35%
Underlying earnings ($ millions) 1,347 1,583 -15%
Net cash generated from operating activities ($ millions) 2,331 2,648 -12%
Capital expenditure – excluding EAUs1 ($ millions)2 (1,683) (1,269) +33%
Free cash flow ($ millions) 638 1,380 -54%
1 Equity accounted units 2 2018 capital expenditure excludes proceeds of $508 million from the sale of surplus land at Kitimat in Canada. These proceeds
are not included in Aluminium’s free cash flow and the associated gain on disposal is excluded from underlying EBITDA and underlying earnings.
Annual report 2018 | riotinto.com40
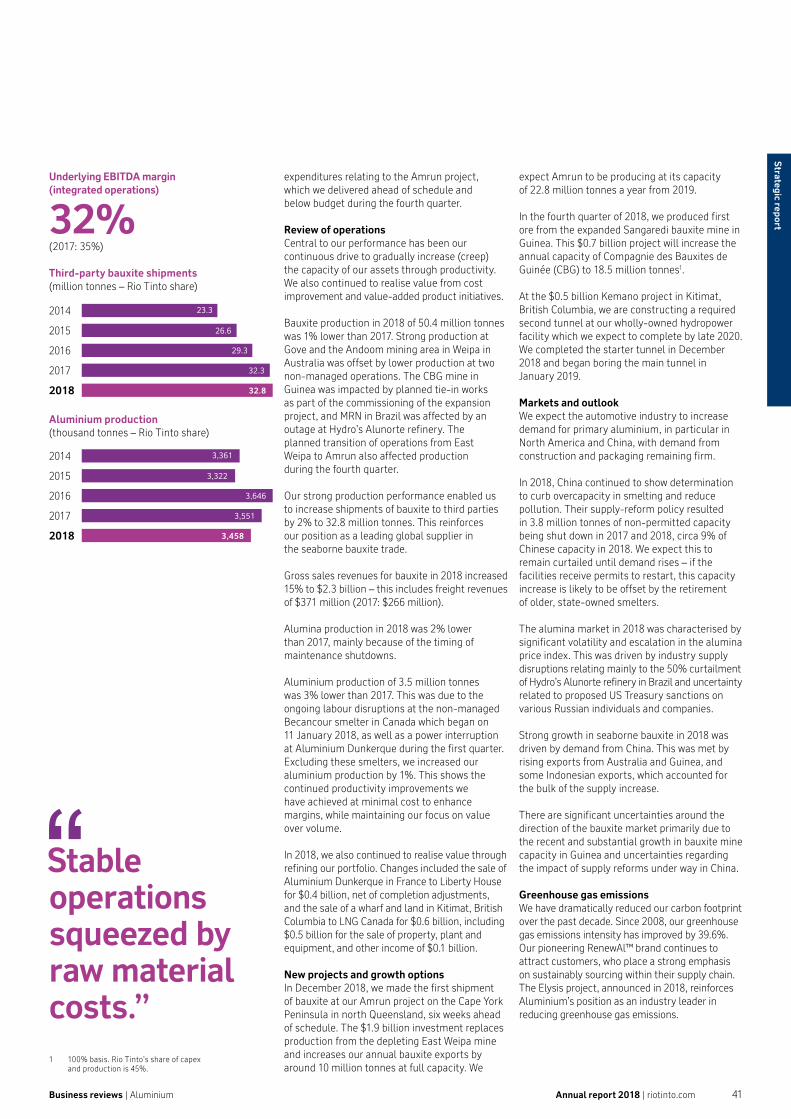
Business reviews | Aluminium
expenditures relating to the Amrun project, which we delivered ahead of schedule and below budget during the fourth quarter.
Review of operationsCentral to our performance has been our continuous drive to gradually increase (creep) the capacity of our assets through productivity. We also continued to realise value from cost improvement and value-added product initiatives.
Bauxite production in 2018 of 50.4 million tonnes was 1% lower than 2017. Strong production at Gove and the Andoom mining area in Weipa in Australia was offset by lower production at two non-managed operations. The CBG mine in Guinea was impacted by planned tie-in works as part of the commissioning of the expansion project, and MRN in Brazil was affected by an outage at Hydro’s Alunorte refinery. The planned transition of operations from East Weipa to Amrun also affected production during the fourth quarter.
Our strong production performance enabled us to increase shipments of bauxite to third parties by 2% to 32.8 million tonnes. This reinforces our position as a leading global supplier in the seaborne bauxite trade.
Gross sales revenues for bauxite in 2018 increased 15% to $2.3 billion – this includes freight revenues of $371 million (2017: $266 million).
Alumina production in 2018 was 2% lower than 2017, mainly because of the timing of maintenance shutdowns.
Aluminium production of 3.5 million tonnes was 3% lower than 2017. This was due to the ongoing labour disruptions at the non-managed Becancour smelter in Canada which began on 11 January 2018, as well as a power interruption at Aluminium Dunkerque during the first quarter. Excluding these smelters, we increased our aluminium production by 1%. This shows the continued productivity improvements we have achieved at minimal cost to enhance margins, while maintaining our focus on value over volume.
In 2018, we also continued to realise value through refining our portfolio. Changes included the sale of Aluminium Dunkerque in France to Liberty House for $0.4 billion, net of completion adjustments, and the sale of a wharf and land in Kitimat, British Columbia to LNG Canada for $0.6 billion, including $0.5 billion for the sale of property, plant and equipment, and other income of $0.1 billion.
New projects and growth optionsIn December 2018, we made the first shipment of bauxite at our Amrun project on the Cape York Peninsula in north Queensland, six weeks ahead of schedule. The $1.9 billion investment replaces production from the depleting East Weipa mine and increases our annual bauxite exports by around 10 million tonnes at full capacity. We
expect Amrun to be producing at its capacity of 22.8 million tonnes a year from 2019.
In the fourth quarter of 2018, we produced first ore from the expanded Sangaredi bauxite mine in Guinea. This $0.7 billion project will increase the annual capacity of Compagnie des Bauxites de Guinée (CBG) to 18.5 million tonnes1.
At the $0.5 billion Kemano project in Kitimat, British Columbia, we are constructing a required second tunnel at our wholly-owned hydropower facility which we expect to complete by late 2020. We completed the starter tunnel in December 2018 and began boring the main tunnel in January 2019.
Markets and outlookWe expect the automotive industry to increase demand for primary aluminium, in particular in North America and China, with demand from construction and packaging remaining firm.
In 2018, China continued to show determination to curb overcapacity in smelting and reduce pollution. Their supply-reform policy resulted in 3.8 million tonnes of non-permitted capacity being shut down in 2017 and 2018, circa 9% of Chinese capacity in 2018. We expect this to remain curtailed until demand rises – if the facilities receive permits to restart, this capacity increase is likely to be offset by the retirement of older, state-owned smelters.
The alumina market in 2018 was characterised by significant volatility and escalation in the alumina price index. This was driven by industry supply disruptions relating mainly to the 50% curtailment of Hydro’s Alunorte refinery in Brazil and uncertainty related to proposed US Treasury sanctions on various Russian individuals and companies.
Strong growth in seaborne bauxite in 2018 was driven by demand from China. This was met by rising exports from Australia and Guinea, and some Indonesian exports, which accounted for the bulk of the supply increase.
There are significant uncertainties around the direction of the bauxite market primarily due to the recent and substantial growth in bauxite mine capacity in Guinea and uncertainties regarding the impact of supply reforms under way in China.
Greenhouse gas emissionsWe have dramatically reduced our carbon footprint over the past decade. Since 2008, our greenhouse gas emissions intensity has improved by 39.6%. Our pioneering RenewAl™ brand continues to attract customers, who place a strong emphasis on sustainably sourcing within their supply chain. The Elysis project, announced in 2018, reinforces Aluminium’s position as an industry leader in reducing greenhouse gas emissions.
Stable operations squeezed by raw material costs.”
Underlying EBITDA margin(integrated operations)
32% (2017: 35%)
Third-party bauxite shipments(million tonnes – Rio Tinto share)
Aluminium production(thousand tonnes – Rio Tinto share)
23.3
26.6
29.3
32.3
32.8
2014
2015
2016
2017
2018
3,361
3,322
3,646
3,551
3,458
2014
2015
2016
2017
2018
1 100% basis. Rio Tinto’s share of capex and production is 45%.
Annual report 2018 | riotinto.com 41
Strategic report

Strategic report | Business reviews
Global demand for copper is increasing, and our business is well-positioned to grow, and help meet it.”Arnaud SoiratChief executive, Copper & Diamonds
Copper & Diamonds
3 copper operations in the US, Mongolia and Chile
2 copper growth projects in the US and Mongolia
2diamond operations in Canada and Australia
1st mining company to be certified by the Responsible Jewellery Council
16countries with copper exploration programmes
8,500employees
250,000 pounds of copper scrap recycled each month at Kennecott Copper Mine in the US, now in its 115th year
Our portfolio of copper and diamond mines share an expertise in underground mining as well as a focus on safety, productivity and sustainability.
CopperGlobal demand for copper is set to grow, driven by urbanisation, industrialisation and increasing requirements for renewable energy: copper plays a key role in electrification and power production. For example, a wind turbine capable of generating a megawatt of power – enough to supply several hundred homes – needs more than three tonnes of copper.
Our copper operations around the world are at various stages in the mining lifecycle, from exploration to rehabilitation. We supply customers in China, Japan and the US.
Oyu Tolgoi, our mine in Mongolia, has reserves and resources that make it one of the world’s largest known copper and gold deposits. When working to full capacity, it will be the world’s third-biggest copper mine.
DiamondsIn diamonds, we are a fully integrated global exploration, mining and sales and marketing business. We are one of the world’s largest producers of rough diamonds from our two mines – Argyle in Australia and Diavik in Canada.
We provide a reliable supply of white and coloured diamonds mined to the highest possible ethical and environmental standards. As a founding member of The Responsible Jewellery Council, we support responsible and ethical social and environmental practices throughout the jewellery supply chain. We are also members of the World Diamond Council and the Diamond Producers Association which uphold the reputation of diamond miners as careful custodians of these natural treasures.
Annual report 2018 | riotinto.com42

Snapshots from the year…
2018 in numbers
0.46AIFR (2017: 0.461)
$6.5bn gross revenue (2017: $4.8bn)
43% underlying EBITDA margin (2017: 39%)
$2.1bn cash generated from operating activities (2017: $1.7bn)
Ingenuity at work Deep inside our Bingham Canyon copper mine in Utah, western United States, we use a remote operated vehicle team – including drones and other equipment – to help keep people safe and save the business money. The newest team member is a robot named Mark II, designed and built by our chief drone pilot, Matt Key, using an over-the-counter rock crawler and a 3D printer. Matt’s ingenuity meant Mark II cost a mere $10,000 to build, a fraction of the $100,000 it could have cost to buy a similar robot.
Mark II squeezes into small spaces and manoeuvres over tough terrain to test oxygen levels and collect soil and water samples.
New diamond pipe at Diavik 200 kilometres from the Arctic Circle, under a giant lake, sit some of the world’s most beautiful and sought-after diamonds. This is the Diavik Diamond Mine, in Canada’s Northwest Territories. Since 2003, Diavik has been producing predominantly gem-quality diamonds destined for high-end jewellery in markets around the world. This includes the 187.7 carat Foxfire diamond, one of the largest gem-quality rough diamonds discovered in North America.
Sending in a robot to check hazards in advance has obvious safety benefits – and can also save the business time and money. The team is already designing Mark II’s little brother, Mark III.
Our robot built for just
10% of the market price
In August, we celebrated the opening of a fourth diamond pipe at Diavik. Known as A21, the new pipe will help to sustain production at Diavik through to 2025. This follows four years of construction and an investment of $350 million, shared by Rio Tinto (60%) and our joint-venture partner Dominion Diamond Corporation (40%).
Diavik is expected to produce high-quality gems until
2025
1 Restated to reflect the move of Oyu Tolgoi into Copper & Diamonds
Business reviews | Copper & Diamonds Annual report 2018 | riotinto.com 43
Strategic report

Financial performance2018 was a year of strong operational performance, with Escondida in Chile returning to capacity, productivity improvements at Rio Tinto Kennecott in the US and progress on the Oyu Tolgoi underground project in Mongolia. We rounded the year off by successfully completing the sale of our interest in the Grasberg mine in Indonesia for $3.5 billion.
Underlying EBITDA of $2.8 billion was 46% higher than 2017. Our strong performance was primarily driven by increased volumes of copper and gold, lower costs linked to productivity improvements at our managed operations, and Escondida running at full capacity after the 2017 strike. These drivers more than offset the impact of higher input costs and the increase in our evaluation expenditure as we advanced the Resolution copper project in Arizona.
Gross sales revenue of $6.5 billion was 34% higher than 2017. This reflected increased copper and gold volumes which were driven by higher grades. The rise is also connected to productivity improvements and increased plant throughput at Rio Tinto Kennecott, a return to capacity at Escondida, higher gold grades at Oyu Tolgoi, and a greater metal share at Grasberg.
Average copper prices increased 6% to 297 US cents per pound, and the average gold price rose 1% to $1,269 per ounce compared with 2017. These price rises were more than offset by provisional pricing movements, resulting in a $25 million decrease in underlying EBITDA compared with 2017.
In 2018, we generated $2.1 billion in cash from our operating activities, a 25% increase on the previous year. This included $786 million of dividends from Escondida, in line with the $780 million received in 2017. Working capital, productivity and cost management initiatives also contributed to favourable cash flows, partially offsetting the impact of raw materials and consumables inflation at certain sites.
We also delivered free cash flow of $266 million, net of a $474 million increase in capital expenditure, as we ramped up activities at the Oyu Tolgoi underground project.
Review of operationsMined copper production was 33% higher than 2017, attributable to: – The commissioning of the Los Colorados
concentrator at Escondida in the second half of 2017 and full recovery from the 2017 strike.
– Increases at Rio Tinto Kennecott as mining activity moved into a higher grade area of the pit and fleet productivity improved.
– Higher recoveries at Oyu Tolgoi. – An attributable metal share of 26 thousand
tonnes from Grasberg.
Refined copper production was 39% higher, reflecting a return to normal operating activities both at Rio Tinto Kennecott, after the 2017 smelter shutdown, and at Escondida.
Rio Tinto KennecottMined copper production in 2018 was 37% up on 2017 as activity continued in a higher-grade area of the pit, productivity improved and plant throughput increased.
Refined copper was 55% higher than 2017 as better mine grades improved concentrate quality and smelting throughput.
Escondida2018 mined copper production from our 30% stake in the Escondida mine was 29% higher than 2017. This reflected commissioning of the Los Colorados concentrator and full recovery from the 2017 strike.
GrasbergIn 2018, we completed the sale of our entire interest in the Grasberg copper/gold mine in Indonesia for $3.5 billion. This was part of a series of transactions involving Inalum (PT Indonesia Asahan Aluminium (Persero)), Indonesia’s state mining company, and Freeport-McMoRan Inc.
2018 results 2018 2017 Change
Mined copper production (000 tonnes – Rio Tinto share) 633.5 478.1 +33%
Refined copper production (000 tonnes – Rio Tinto share) 274.8 197.2 +39%
Diamonds production (000 carats – Rio Tinto share) 18,427 21,627 -15%
Gross sales revenue ($ millions) 6,468 4,842 +34%
Underlying EBITDA ($ millions) 2,776 1,904 +46%
Underlying EBITDA margin 43% 39%
Underlying earnings ($ millions) 1,054 263 +301%
Net cash generated from operating activities ($ millions)1 2,114 1,695 +25%
Capital expenditure – excluding EAUs2 ($ millions) (1,848) (1,374) +34%
Free cash flow ($ millions) 266 319 -17%
1 Net cash generated from operating activities excludes the operating cash flows of equity accounted units (Escondida) but includes dividends from the equity accounted units.
2 Equity accounted units.
1,904
(25)
1
(52)
1,780
356
26
(27)
316
260
65
2,776
(48)
2017 underlying EBITDA
Price
Exchange rates
Energy
In�ation
Flexed 2017 underlying EBITDA
Volumes and mix
Cash costs
Exploration and evaluation
Full recovery from Escondida strike
Grasberg production
Other
2018 underlying EBITDA
Underlying EBITDA 2017 vs 2018 ($ million)
SafetyWhile we still have much to do, this year has seen an overall improvement in safety in our operations, with four of our five assets improving their safety record. We had a year free of fatalities and permanent disabling injuries at our managed operations, and we met our critical-risk management and process-safety targets. Although the number of injuries increased from 60 in 2017 to 65 in 2018, we have seen a decline in process-safety incidents. Our all-injury frequency rate has remained more or less the same, and we are working hard to improve this by simplifying our safety tools, using problem-solving techniques and engaging with frontline staff. We are also continuing to focus on process safety and managing critical risk, performing almost 250,000 verifications of critical controls over the year. A renewed focus on manual-handling incidents launched last year at all of our operations, has led to improved performance in this area.
Strategic report | Business reviews
Copper & Diamonds continued
Strong operational performance.”
Annual report 2018 | riotinto.com44
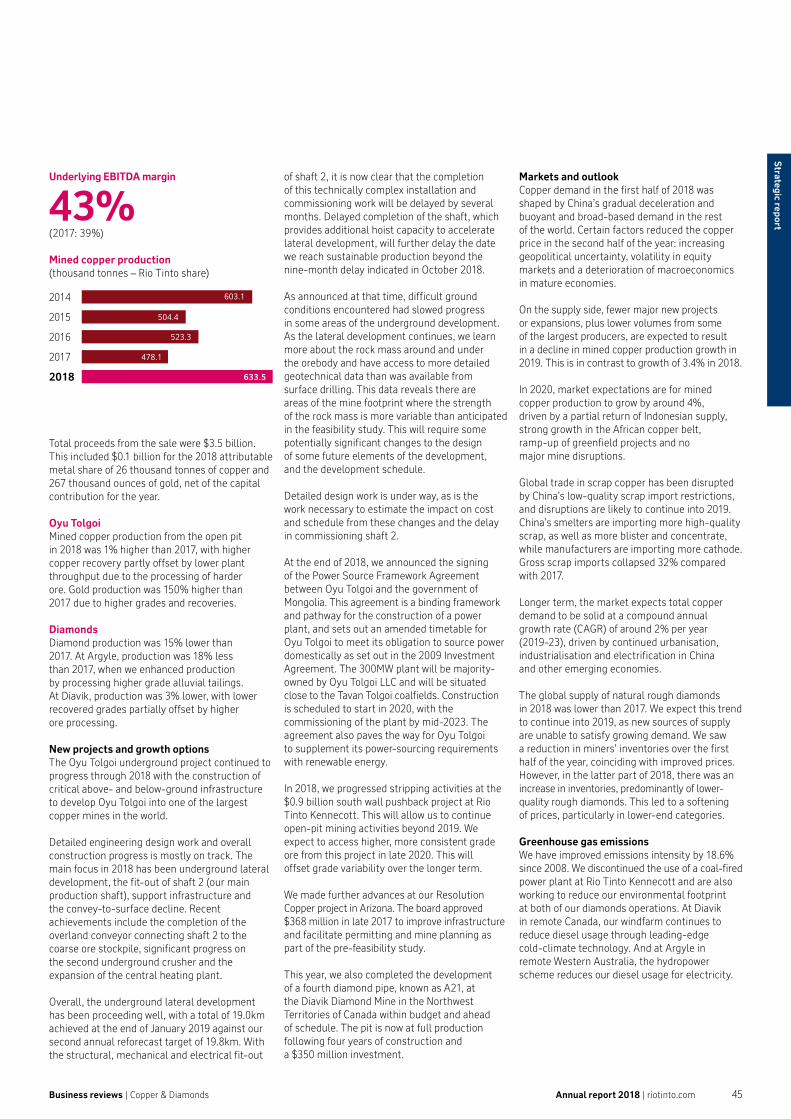
of shaft 2, it is now clear that the completion of this technically complex installation and commissioning work will be delayed by several months. Delayed completion of the shaft, which provides additional hoist capacity to accelerate lateral development, will further delay the date we reach sustainable production beyond the nine-month delay indicated in October 2018.
As announced at that time, difficult ground conditions encountered had slowed progress in some areas of the underground development. As the lateral development continues, we learn more about the rock mass around and under the orebody and have access to more detailed geotechnical data than was available from surface drilling. This data reveals there are areas of the mine footprint where the strength of the rock mass is more variable than anticipated in the feasibility study. This will require some potentially significant changes to the design of some future elements of the development, and the development schedule.
Detailed design work is under way, as is the work necessary to estimate the impact on cost and schedule from these changes and the delay in commissioning shaft 2.
At the end of 2018, we announced the signing of the Power Source Framework Agreement between Oyu Tolgoi and the government of Mongolia. This agreement is a binding framework and pathway for the construction of a power plant, and sets out an amended timetable for Oyu Tolgoi to meet its obligation to source power domestically as set out in the 2009 Investment Agreement. The 300MW plant will be majority-owned by Oyu Tolgoi LLC and will be situated close to the Tavan Tolgoi coalfields. Construction is scheduled to start in 2020, with the commissioning of the plant by mid-2023. The agreement also paves the way for Oyu Tolgoi to supplement its power-sourcing requirements with renewable energy.
In 2018, we progressed stripping activities at the $0.9 billion south wall pushback project at Rio Tinto Kennecott. This will allow us to continue open-pit mining activities beyond 2019. We expect to access higher, more consistent grade ore from this project in late 2020. This will offset grade variability over the longer term.
We made further advances at our Resolution Copper project in Arizona. The board approved $368 million in late 2017 to improve infrastructure and facilitate permitting and mine planning as part of the pre-feasibility study.
This year, we also completed the development of a fourth diamond pipe, known as A21, at the Diavik Diamond Mine in the Northwest Territories of Canada within budget and ahead of schedule. The pit is now at full production following four years of construction and a $350 million investment.
Markets and outlook Copper demand in the first half of 2018 was shaped by China’s gradual deceleration and buoyant and broad-based demand in the rest of the world. Certain factors reduced the copper price in the second half of the year: increasing geopolitical uncertainty, volatility in equity markets and a deterioration of macroeconomics in mature economies.
On the supply side, fewer major new projects or expansions, plus lower volumes from some of the largest producers, are expected to result in a decline in mined copper production growth in 2019. This is in contrast to growth of 3.4% in 2018.
In 2020, market expectations are for mined copper production to grow by around 4%, driven by a partial return of Indonesian supply, strong growth in the African copper belt, ramp-up of greenfield projects and no major mine disruptions.
Global trade in scrap copper has been disrupted by China’s low-quality scrap import restrictions, and disruptions are likely to continue into 2019. China’s smelters are importing more high-quality scrap, as well as more blister and concentrate, while manufacturers are importing more cathode. Gross scrap imports collapsed 32% compared with 2017.
Longer term, the market expects total copper demand to be solid at a compound annual growth rate (CAGR) of around 2% per year (2019-23), driven by continued urbanisation, industrialisation and electrification in China and other emerging economies.
The global supply of natural rough diamonds in 2018 was lower than 2017. We expect this trend to continue into 2019, as new sources of supply are unable to satisfy growing demand. We saw a reduction in miners’ inventories over the first half of the year, coinciding with improved prices. However, in the latter part of 2018, there was an increase in inventories, predominantly of lower-quality rough diamonds. This led to a softening of prices, particularly in lower-end categories.
Greenhouse gas emissionsWe have improved emissions intensity by 18.6% since 2008. We discontinued the use of a coal-fired power plant at Rio Tinto Kennecott and are also working to reduce our environmental footprint at both of our diamonds operations. At Diavik in remote Canada, our windfarm continues to reduce diesel usage through leading-edge cold-climate technology. And at Argyle in remote Western Australia, the hydropower scheme reduces our diesel usage for electricity.
Underlying EBITDA margin
43% (2017: 39%)
Mined copper production(thousand tonnes – Rio Tinto share)
603.1
504.4
523.3
478.1
633.5
2014
2015
2016
2017
2018
Total proceeds from the sale were $3.5 billion. This included $0.1 billion for the 2018 attributable metal share of 26 thousand tonnes of copper and 267 thousand ounces of gold, net of the capital contribution for the year.
Oyu TolgoiMined copper production from the open pit in 2018 was 1% higher than 2017, with higher copper recovery partly offset by lower plant throughput due to the processing of harder ore. Gold production was 150% higher than 2017 due to higher grades and recoveries.
Diamonds Diamond production was 15% lower than 2017. At Argyle, production was 18% less than 2017, when we enhanced production by processing higher grade alluvial tailings. At Diavik, production was 3% lower, with lower recovered grades partially offset by higher ore processing.
New projects and growth optionsThe Oyu Tolgoi underground project continued to progress through 2018 with the construction of critical above- and below-ground infrastructure to develop Oyu Tolgoi into one of the largest copper mines in the world.
Detailed engineering design work and overall construction progress is mostly on track. The main focus in 2018 has been underground lateral development, the fit-out of shaft 2 (our main production shaft), support infrastructure and the convey-to-surface decline. Recent achievements include the completion of the overland conveyor connecting shaft 2 to the coarse ore stockpile, significant progress on the second underground crusher and the expansion of the central heating plant.
Overall, the underground lateral development has been proceeding well, with a total of 19.0km achieved at the end of January 2019 against our second annual reforecast target of 19.8km. With the structural, mechanical and electrical fit-out
Business reviews | Copper & Diamonds Annual report 2018 | riotinto.com 45
Strategic report

Strategic report | Business reviews
The minerals we produce are essential to a wide variety of industries – agriculture to construction – and ultimately, to people’s everyday lives.”Bold BaatarChief executive, Energy & Minerals
Energy & Minerals
Operations in
6countries
5 sectors: borates, iron ore concentrate and pellets, salt, titanium dioxide and uranium
10,000employees
The products from our diverse portfolio of high-quality mining, refining and marketing operations and projects make important contributions to people’s everyday lives, as well as to a wide variety of industries.
The Energy & Minerals (E&M) portfolio includes titanium dioxide, rutile and zircon; borates; iron ore concentrate and pellets; salt; and uranium. E&M products are used in everything from television screens to paints and plastics, and in industries from healthcare to aerospace.
As a key global supplier of borates, we account for approximately 25% of global demand – with mining, processing, commercial and research facilities. Our Iron & Titanium business is a major global producer of high-grade titanium dioxide feedstock. The Iron Ore Company of Canada produces premium iron ore pellets and high-grade concentrate with low levels of impurities. We also have three operations at Dampier Salt, in Western Australia. We continue to study the Jadar lithium-borate project in Serbia. And in 2018, we also owned interests in two uranium businesses – Energy Resources of Australia and Rössing Uranium in Namibia – and a uranium project in Canada.
In 2018, we completed the sale of our remaining coal interests in Australia, formerly part of E&M.
The Rio Tinto Ventures team, also part of E&M, is exploring partnerships and other opportunities that will allow us to expand into metals critical to a low-carbon economy with a strong focus on battery materials.
10 mining sites
Annual report 2018 | riotinto.com46
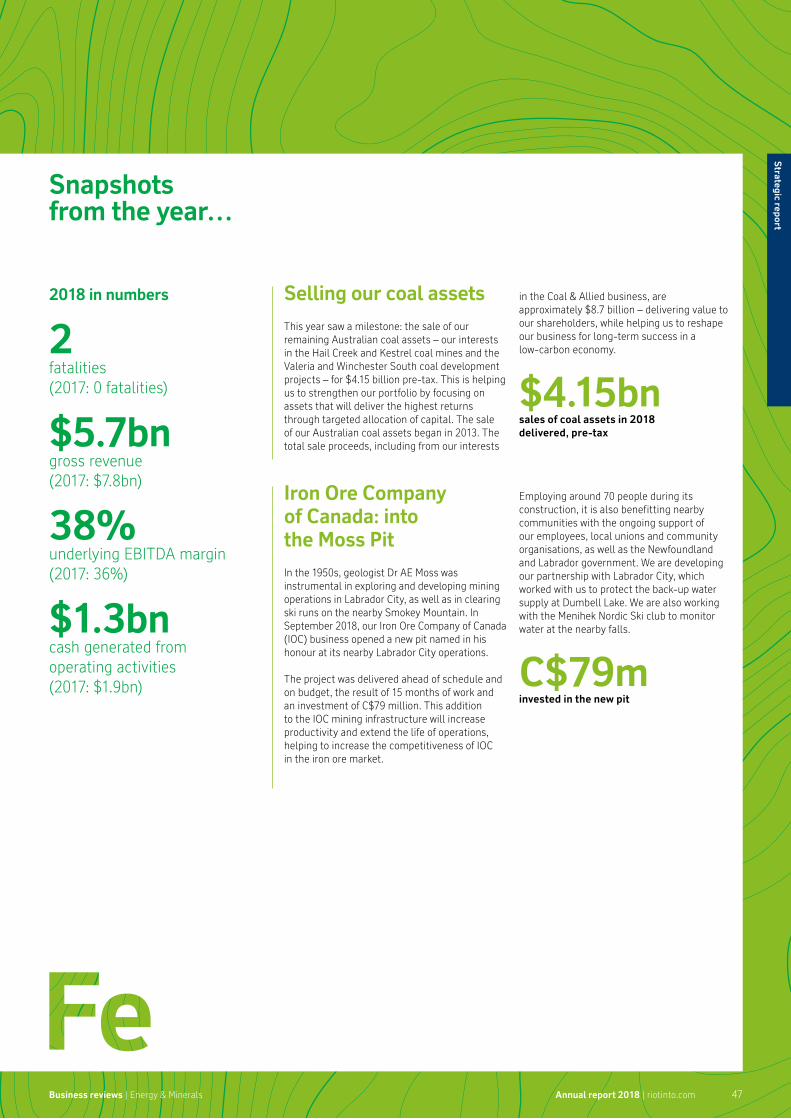
Snapshots from the year…
2018 in numbers
2fatalities (2017: 0 fatalities)
$5.7bn gross revenue (2017: $7.8bn)
38% underlying EBITDA margin (2017: 36%)
$1.3bn cash generated from operating activities (2017: $1.9bn)
Selling our coal assetsThis year saw a milestone: the sale of our remaining Australian coal assets – our interests in the Hail Creek and Kestrel coal mines and the Valeria and Winchester South coal development projects – for $4.15 billion pre-tax. This is helping us to strengthen our portfolio by focusing on assets that will deliver the highest returns through targeted allocation of capital. The sale of our Australian coal assets began in 2013. The total sale proceeds, including from our interests
Iron Ore Company of Canada: into the Moss PitIn the 1950s, geologist Dr AE Moss was instrumental in exploring and developing mining operations in Labrador City, as well as in clearing ski runs on the nearby Smokey Mountain. In September 2018, our Iron Ore Company of Canada (IOC) business opened a new pit named in his honour at its nearby Labrador City operations.
The project was delivered ahead of schedule and on budget, the result of 15 months of work and an investment of C$79 million. This addition to the IOC mining infrastructure will increase productivity and extend the life of operations, helping to increase the competitiveness of IOC in the iron ore market.
in the Coal & Allied business, are approximately $8.7 billion – delivering value to our shareholders, while helping us to reshape our business for long-term success in a low-carbon economy.
$4.15bnsales of coal assets in 2018 delivered, pre-tax
Employing around 70 people during its construction, it is also benefitting nearby communities with the ongoing support of our employees, local unions and community organisations, as well as the Newfoundland and Labrador government. We are developing our partnership with Labrador City, which worked with us to protect the back-up water supply at Dumbell Lake. We are also working with the Menihek Nordic Ski club to monitor water at the nearby falls.
C$79minvested in the new pit
Business reviews | Energy & Minerals Annual report 2018 | riotinto.com 47
Strategic report
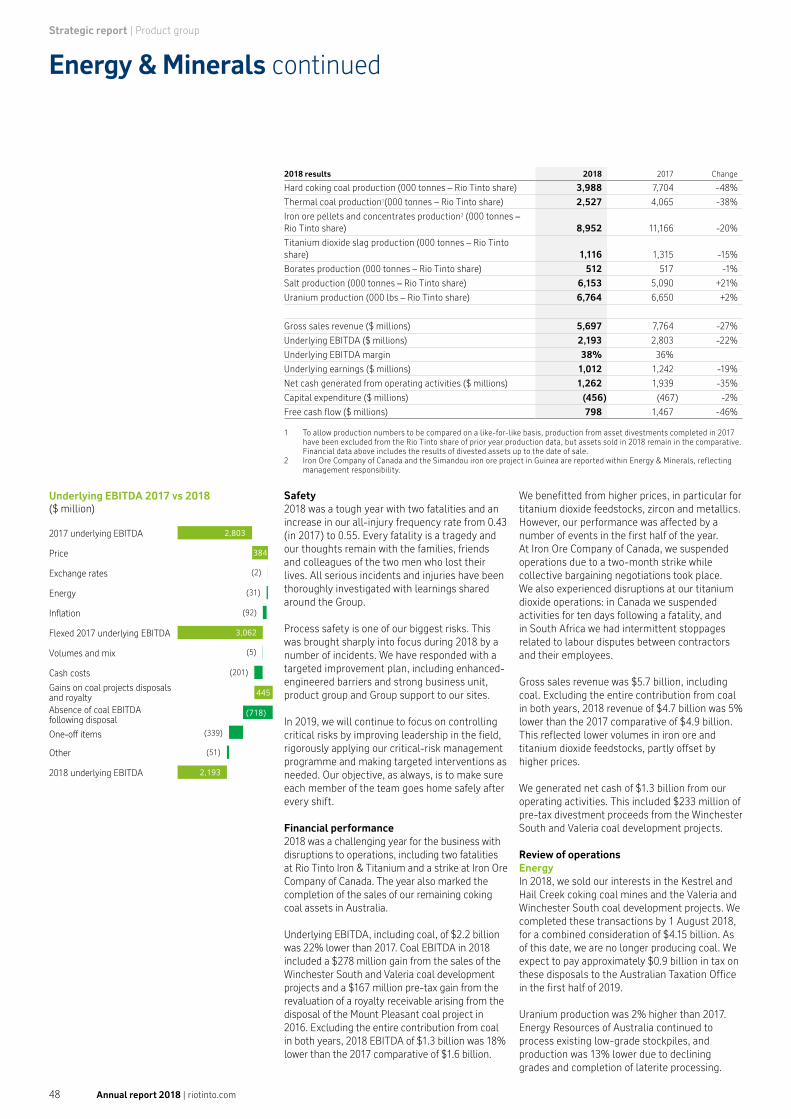
Safety2018 was a tough year with two fatalities and an increase in our all-injury frequency rate from 0.43 (in 2017) to 0.55. Every fatality is a tragedy and our thoughts remain with the families, friends and colleagues of the two men who lost their lives. All serious incidents and injuries have been thoroughly investigated with learnings shared around the Group.
Process safety is one of our biggest risks. This was brought sharply into focus during 2018 by a number of incidents. We have responded with a targeted improvement plan, including enhanced-engineered barriers and strong business unit, product group and Group support to our sites.
In 2019, we will continue to focus on controlling critical risks by improving leadership in the field, rigorously applying our critical-risk management programme and making targeted interventions as needed. Our objective, as always, is to make sure each member of the team goes home safely after every shift.
Financial performance2018 was a challenging year for the business with disruptions to operations, including two fatalities at Rio Tinto Iron & Titanium and a strike at Iron Ore Company of Canada. The year also marked the completion of the sales of our remaining coking coal assets in Australia.
Underlying EBITDA, including coal, of $2.2 billion was 22% lower than 2017. Coal EBITDA in 2018 included a $278 million gain from the sales of the Winchester South and Valeria coal development projects and a $167 million pre-tax gain from the revaluation of a royalty receivable arising from the disposal of the Mount Pleasant coal project in 2016. Excluding the entire contribution from coal in both years, 2018 EBITDA of $1.3 billion was 18% lower than the 2017 comparative of $1.6 billion.
We benefitted from higher prices, in particular for titanium dioxide feedstocks, zircon and metallics. However, our performance was affected by a number of events in the first half of the year. At Iron Ore Company of Canada, we suspended operations due to a two-month strike while collective bargaining negotiations took place. We also experienced disruptions at our titanium dioxide operations: in Canada we suspended activities for ten days following a fatality, and in South Africa we had intermittent stoppages related to labour disputes between contractors and their employees.
Gross sales revenue was $5.7 billion, including coal. Excluding the entire contribution from coal in both years, 2018 revenue of $4.7 billion was 5% lower than the 2017 comparative of $4.9 billion. This reflected lower volumes in iron ore and titanium dioxide feedstocks, partly offset by higher prices.
We generated net cash of $1.3 billion from our operating activities. This included $233 million of pre-tax divestment proceeds from the Winchester South and Valeria coal development projects.
Review of operations EnergyIn 2018, we sold our interests in the Kestrel and Hail Creek coking coal mines and the Valeria and Winchester South coal development projects. We completed these transactions by 1 August 2018, for a combined consideration of $4.15 billion. As of this date, we are no longer producing coal. We expect to pay approximately $0.9 billion in tax on these disposals to the Australian Taxation Office in the first half of 2019.
Uranium production was 2% higher than 2017. Energy Resources of Australia continued to process existing low-grade stockpiles, and production was 13% lower due to declining grades and completion of laterite processing.
2018 results 2018 2017 Change
Hard coking coal production (000 tonnes – Rio Tinto share) 3,988 7,704 -48%
Thermal coal production1(000 tonnes – Rio Tinto share) 2,527 4,065 -38%
Iron ore pellets and concentrates production2 (000 tonnes – Rio Tinto share) 8,952 11,166 -20%
Titanium dioxide slag production (000 tonnes – Rio Tinto share) 1,116 1,315 -15%
Borates production (000 tonnes – Rio Tinto share) 512 517 -1%
Salt production (000 tonnes – Rio Tinto share) 6,153 5,090 +21%
Uranium production (000 lbs – Rio Tinto share) 6,764 6,650 +2%
Gross sales revenue ($ millions) 5,697 7,764 -27%
Underlying EBITDA ($ millions) 2,193 2,803 -22%
Underlying EBITDA margin 38% 36%
Underlying earnings ($ millions) 1,012 1,242 -19%
Net cash generated from operating activities ($ millions) 1,262 1,939 -35%
Capital expenditure ($ millions) (456) (467) -2%
Free cash flow ($ millions) 798 1,467 -46%
1 To allow production numbers to be compared on a like-for-like basis, production from asset divestments completed in 2017 have been excluded from the Rio Tinto share of prior year production data, but assets sold in 2018 remain in the comparative. Financial data above includes the results of divested assets up to the date of sale.
2 Iron Ore Company of Canada and the Simandou iron ore project in Guinea are reported within Energy & Minerals, reflecting management responsibility.
2,803
384
(2)
(31)
3,062
(5)
(201)
445
(718)
(339)
(51)
2,193
(92)
2017 underlying EBITDA
Price
Exchange rates
Energy
In�ation
Flexed 2017 underlying EBITDA
Volumes and mix
Cash costs
Gains on coal projects disposalsand royaltyAbsence of coal EBITDAfollowing disposal
One-off items
Other
2018 underlying EBITDA
Underlying EBITDA 2017 vs 2018 ($ million)
Strategic report | Product group
Energy & Minerals continued
Annual report 2018 | riotinto.com48
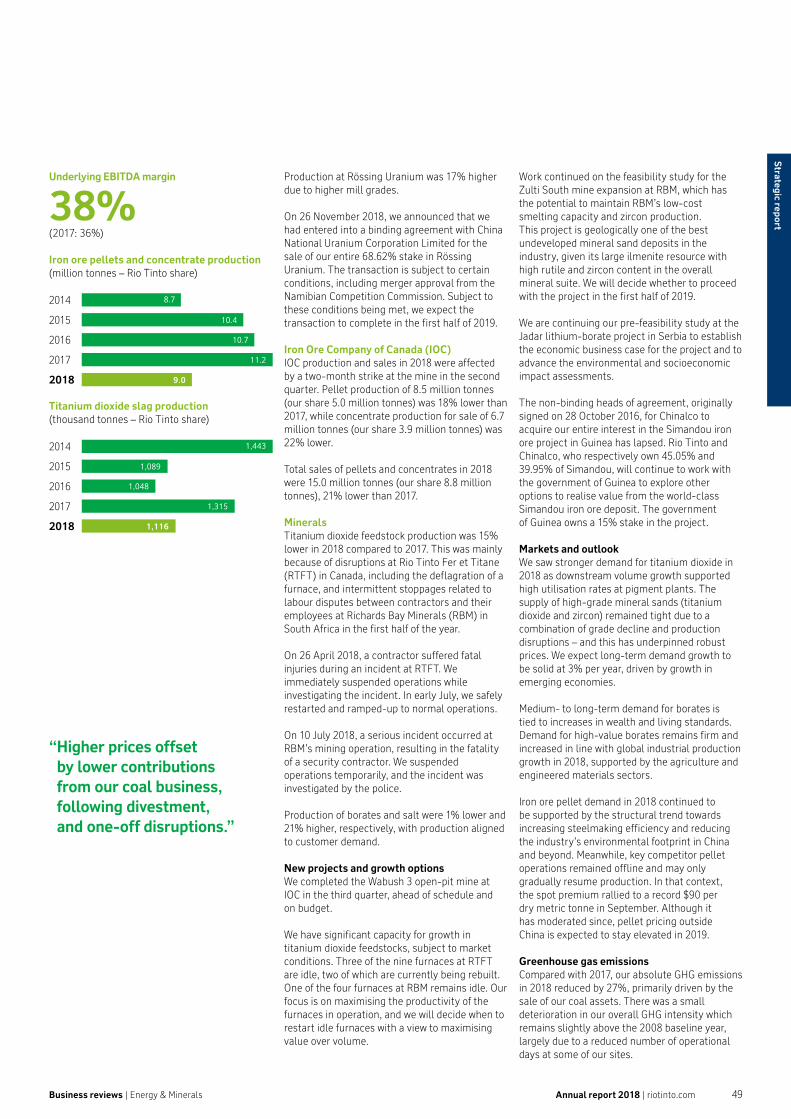
Production at Rössing Uranium was 17% higher due to higher mill grades.
On 26 November 2018, we announced that we had entered into a binding agreement with China National Uranium Corporation Limited for the sale of our entire 68.62% stake in Rössing Uranium. The transaction is subject to certain conditions, including merger approval from the Namibian Competition Commission. Subject to these conditions being met, we expect the transaction to complete in the first half of 2019.
Iron Ore Company of Canada (IOC)IOC production and sales in 2018 were affected by a two-month strike at the mine in the second quarter. Pellet production of 8.5 million tonnes (our share 5.0 million tonnes) was 18% lower than 2017, while concentrate production for sale of 6.7 million tonnes (our share 3.9 million tonnes) was 22% lower.
Total sales of pellets and concentrates in 2018 were 15.0 million tonnes (our share 8.8 million tonnes), 21% lower than 2017.
MineralsTitanium dioxide feedstock production was 15% lower in 2018 compared to 2017. This was mainly because of disruptions at Rio Tinto Fer et Titane (RTFT) in Canada, including the deflagration of a furnace, and intermittent stoppages related to labour disputes between contractors and their employees at Richards Bay Minerals (RBM) in South Africa in the first half of the year.
On 26 April 2018, a contractor suffered fatal injuries during an incident at RTFT. We immediately suspended operations while investigating the incident. In early July, we safely restarted and ramped-up to normal operations.
On 10 July 2018, a serious incident occurred at RBM’s mining operation, resulting in the fatality of a security contractor. We suspended operations temporarily, and the incident was investigated by the police.
Production of borates and salt were 1% lower and 21% higher, respectively, with production aligned to customer demand.
New projects and growth optionsWe completed the Wabush 3 open-pit mine at IOC in the third quarter, ahead of schedule and on budget.
We have significant capacity for growth in titanium dioxide feedstocks, subject to market conditions. Three of the nine furnaces at RTFT are idle, two of which are currently being rebuilt. One of the four furnaces at RBM remains idle. Our focus is on maximising the productivity of the furnaces in operation, and we will decide when to restart idle furnaces with a view to maximising value over volume.
Work continued on the feasibility study for the Zulti South mine expansion at RBM, which has the potential to maintain RBM’s low-cost smelting capacity and zircon production. This project is geologically one of the best undeveloped mineral sand deposits in the industry, given its large ilmenite resource with high rutile and zircon content in the overall mineral suite. We will decide whether to proceed with the project in the first half of 2019.
We are continuing our pre-feasibility study at the Jadar lithium-borate project in Serbia to establish the economic business case for the project and to advance the environmental and socioeconomic impact assessments.
The non-binding heads of agreement, originally signed on 28 October 2016, for Chinalco to acquire our entire interest in the Simandou iron ore project in Guinea has lapsed. Rio Tinto and Chinalco, who respectively own 45.05% and 39.95% of Simandou, will continue to work with the government of Guinea to explore other options to realise value from the world-class Simandou iron ore deposit. The government of Guinea owns a 15% stake in the project.
Markets and outlookWe saw stronger demand for titanium dioxide in 2018 as downstream volume growth supported high utilisation rates at pigment plants. The supply of high-grade mineral sands (titanium dioxide and zircon) remained tight due to a combination of grade decline and production disruptions – and this has underpinned robust prices. We expect long-term demand growth to be solid at 3% per year, driven by growth in emerging economies.
Medium- to long-term demand for borates is tied to increases in wealth and living standards. Demand for high-value borates remains firm and increased in line with global industrial production growth in 2018, supported by the agriculture and engineered materials sectors.
Iron ore pellet demand in 2018 continued to be supported by the structural trend towards increasing steelmaking efficiency and reducing the industry’s environmental footprint in China and beyond. Meanwhile, key competitor pellet operations remained offline and may only gradually resume production. In that context, the spot premium rallied to a record $90 per dry metric tonne in September. Although it has moderated since, pellet pricing outside China is expected to stay elevated in 2019.
Greenhouse gas emissionsCompared with 2017, our absolute GHG emissions in 2018 reduced by 27%, primarily driven by the sale of our coal assets. There was a small deterioration in our overall GHG intensity which remains slightly above the 2008 baseline year, largely due to a reduced number of operational days at some of our sites.
Underlying EBITDA margin
38% (2017: 36%)
Iron ore pellets and concentrate production(million tonnes – Rio Tinto share)
Titanium dioxide slag production(thousand tonnes – Rio Tinto share)
8.7
10.4
10.7
11.2
9.0
2014
2015
2016
2017
2018
1,443
1,089
1,048
1,315
1,116
2014
2015
2016
2017
2018
Business reviews | Energy & Minerals
“ Higher prices offset by lower contributions from our coal business, following divestment, and one-off disruptions.”
Annual report 2018 | riotinto.com 49
Strategic report

Strategic report | Business reviews
Growth & Innovation
Stephen McIntoshGroup executive, Growth & Innovation
2,200employees
12,000contractors working in exploration and construction
3 new Centres of Excellence – Processing in Montreal, Surface Mining in Perth and Underground Mining in Brisbane – with around 25 people in each
8different commodities being explored for in 16 countries
$2.3bnspent on capital projects in 2018
Whether exploring or building assets, we find ground-breaking ways to add value across the entire lifecycle of our operations.
We work across Rio Tinto, supporting each product group’s daily operations from start to finish. We are responsible for exploration – the search for new sources of commodities – and the design and construction of new assets. This year, our projects team completed, with Aluminium, the Amrun bauxite project in Queensland, Australia and, with Iron Ore, started work on Koodaideri, our intelligent mine in the Pilbara, Western Australia.
We also provide technical expertise and project management to close our sites when they reach the end of their lives. We work to create a more efficient, safe and agile Rio Tinto by managing major technical risks, researching and developing new ways of operating, automating for safety and productivity, providing information technology systems and services, and partnering with our sites to replicate industry-leading best practice.
SafetyWe had a fatality-free year and our all-injury frequency rate of 0.19 improved by 42%1 compared with 2017. This improvement reflects the time we have spent reinforcing our existing safety culture.
ProjectsWorking with Iron Ore, this year in Australia we completed AutoHaul™. We also began a three-year project to enhance the hydroelectric power supply for the Kitimat aluminium smelter in British Columbia. The world-class underground copper project at Oyu Tolgoi, in Mongolia, also progressed, including with the signing of the Power Source Framework Agreement. The detailed engineering design work and overall construction is mostly on track, but more detailed geotechnical information and difficult ground conditions have required a review of the mine design. This, combined with fit-out and commissioning challenges with the main production shaft, is ultimately expected to result in a further revised ramp-up schedule to sustainable first production (beyond the nine-month delay indicated in October 2018). Detailed design work is underway to estimate the impact these issues will have on cost and schedule.
ExplorationWe have an extensive global exploration programme. This year, we explored in 16 countries looking for eight commodities and generated more opportunities than ever before. Expenditure on exploration and evaluation in 2018 was $488 million. Of this, $231 million relates to the exploration and evaluation of our greenfield programmes and $257 million to our product groups, mostly copper. We have had some early success in copper exploration in the Pilbara, Western Australia, at the Winu project where phase 2 drilling is now underway. The majority of our projects this year are in the early stages of drilling. Projects at a more advanced stage are listed in the table below.
Productivity and technical supportWe are continuing to focus on productivity initiatives and we remain on track to deliver $1.5 billion a year in additional cash flow from productivity improvements from 2021. We formed three Centres of Excellence – Processing, Surface Mining and Underground Mining – to bring together our most critical technical capabilities. To better support our technical people in building their careers, we entered into a landmark partnership with AusIMM and created a technical career pathway programme called RioExcel.
Information Systems & Technology (IS&T)Technology has the power to change Rio Tinto. This year, our IS&T function continued to make us more resilient to cyber threats and began a digital transformation journey to make us safer, better-connected and more productive. We upgraded critical infrastructure, built an integrated data platform and made more of our applications mobile.
Top of the classThis year, we asked Deloitte to benchmark our capital projects team. Working with Oxford Global Projects and the Project Management Institute, they did a series of assessments, interviews, workshops and data analysis, to benchmark 21 of our projects against more than 500 capital projects from a range of industries, including those of five of our mining peers. The results: – We were ranked fourth for safety performance,
underscoring the focus we place on improving safety.
– Our projects have a stronger cost performance with a median underrun of 10%, while our peers’ average was 0%.
– Our project schedule performance is 20% better than the industry average, with a median overrun of just 1%.
Advanced stage exploration projects
Project Commodity Country Type Stage
Cape York Bauxite Australia Greenfield Project of MeritBorborema Mineral Sands Brazil Greenfield Project of MeritSudi Mineral Sands Tanzania Greenfield Project of MeritFalCon2 Diamond Canada Greenfield Order of MagnitudePilbara Iron ore Australia Brownfield Project of MeritGrader West Industrial Mineral Canada Brownfield Project of MeritOyu Tolgoi Copper Mongolia Brownfield Project of MeritBingham Canyon Copper US Brownfield Project of MeritWinu Copper Australia Greenfield Order of MagnitudeKalindi Copper Zambia Greenfield Project of MeritKorgantas Copper Kazakhstan Greenfield Project of Merit
1 Excludes Oyu Tolgoi operations and support functions that were transferred to Copper & Diamonds in 2018.
2 This project was referred to as Stella in 2017. Project of Merit – Preliminary evaluation of orebody size,
quality and potential. Order of Magnitude – judging whether an opportunity will be economical to develop.
“We grow and improve the Group’s business by discovering the minerals and metals we need today and tomorrow, applying new technologies, delivering our projects and optimising our operations.”
Annual report 2018 | riotinto.com50

Business reviews Commercial
Commercial
Simon TrottChief commercial officer
1,300employees
Singapore Commercial Hubwith satellite offices in Chicago and Frankfurt and offices in China, Japan and South Korea
Approximately
2,000customers across 96 countries
More than
200contracted ships managed at any one time
Managing around
37,000 suppliers in more than 120 locations
Our Commercial group creates value using customer, supplier and market insights generated through the visibility we enjoy across the entire value chain. Deeper understanding of the needs of our customers and suppliers is crucial to successfully navigating commodity and economic cycles while achieving our growth aspirations.
This year, the Commercial group brought together our global sales and marketing, procurement, marine, logistics and marketing analysis activities to strengthen our ability to share commercial insights and build cross-product group capabilities. We are the voice of customers and suppliers within Rio Tinto, connecting market perspectives back to our assets and operations.
The year has been a formative one. We consolidated our American and European commercial activities into Chicago and Frankfurt to be closer to customers. These offices are closely integrated with our Singapore hub and our offices in China, Japan and South Korea, enhancing opportunities to identify and respond to market developments.
SafetyWe are committed to ensuring the safety, health and wellbeing of our workforce. We face a diverse range of risks across multiple geographies in our global sales and marketing, procurement marine and logistics activities. Our primary focus has been implementing Group standards and critical-risk management fatality prevention programmes across our areas of greatest exposure, primarily Marine & Logistics, and Procurement. In 2018, we had zero fatalities and a 0.18 all-injury frequency rate. In 2019, we intend to build on this and share our focus on safety, health and wellbeing in a tangible and visible way through our daily interactions with our customers and suppliers.
PerformanceOur customer and supplier interactions provide us with unique insights and data that we can use to create and unlock value today, as well as shaping our future resource investment decisions.
We also work hand-in-hand with our product groups to enable us to better address customer needs and adjust our operations to meet market demands. As an example, in 2018, we introduced a secondary iron ore product, to protect the quality of our flagship Pilbara Blend™ products. This was in direct response to market feedback, which underscored the importance of maintaining the premium brand position occupied by the Pilbara Blend™ due to its consistent quality and market liquidity.
With the formation of the Commercial group, the product groups now have a single point of interface from managing procurement needs through to turning contracts into cash. Our goal is to simplify our systems, automate interfaces and provide a common approach and set of processes to our product groups across commodities.
Our procurement function has significantly simplified its contractual terms and conditions. This has reduced the number of different template contracts from 400 to four, simplified the language, reduced the length by two-thirds to made them ready for automation. Contracts are now easier to prepare, negotiate and understand.
We also work in partnership with our product groups to safely and sustainably source the optimal raw materials and supplies for the Group at competitive prices. In 2018, we delivered more than 400 cash-generating initiatives, with the mindset of bringing our customers and suppliers into the heart of our business. We continue to try to address issues and challenges together, and deliver outcomes that benefit every business, including our own.
Digitalisation of tradeOur goal is to improve customer experience, and we are investing time and resources into simplifying systems and automating activities. As an example, in 2018, we successfully trialled a blockchain transaction as part of the first fully digitised end-to-end trade transaction completed in Singapore. The sale included electronic shipping documents as well as a digital letter of credit. While the technology is not ready for widescale use, this is a significant step forward in the digitalisation of international trade. Our ambition is to continuously improve the experience of doing business with Rio Tinto, reduce documentation turnaround times and optimise working capital.
Markets and outlookFor our analysis of the markets and outlook for 2019 see the Iron Ore, Aluminium, Copper & Diamonds and Energy & Minerals sections.
“Commercial partners with our product groups, customers and suppliers to generate insights and unlock value for all our stakeholders.”
Annual report 2018 | riotinto.com 51
Strategic report
Strategic reportStrategic report
Sustainable development
At Rio Tinto, we produce materials essential to human progress. Achieving this purpose requires us to work, as often as not, in remote locations and sensitive, beautiful environments, often on land owned by Indigenous people. Our values, experience and history tell us that we must work in a way that delivers real, lasting benefits for the owners of our company as well as the wider communities in which we operate. We must care for our employees, respect and care for the environment while we operate, and rehabilitate the land when we cease. We must contribute our fair share to local and national economies, including via taxes, and do so transparently. These beliefs are the foundation of our views on sustainability.
This year, we again took stock of the issues facing our business, as well as the societal and economic trends changing the global landscape, and developed an approach to sustainability that ensures material issues are integrated into our business strategy and corporate governance. The expected outcome is commercial success coupled with a meaningful contribution to the world around us.
This approach comprises every facet of the work we do, but begins with running a safe, responsible and profitable business. Safety is important to Rio Tinto not only because we care for the people we work with, but because a safe business is also operationally sound. Responsibility also starts at home, with a commitment to the safety, rights and wellbeing of our employees, the integrity of our business and supply chain, and respect for the environment. Profitability enables us to meet our commitments to our shareholders and assume leadership in other areas, including sustainability.
We work hard to leave a lasting, positive legacy, everywhere we work. Our long-term economic contribution is one way we do this. In 2018, Rio Tinto paid billions in taxes and royalties to governments around the world1. Our direct economic contribution was $42.8 billion. Over the past five years, our business has contributed more than $200 billion to countries and communities, everywhere we operate. We do not always build and maintain roads and bridges, schools and hospitals, ourselves – but the billions we contribute support each of these.
Our business is often the major source of jobs and livelihoods – and sometimes, one of few avenues to opportunity. We take this responsibility seriously.
We employ 47,500 people in around 35 countries. In Mongolia, we are the single largest private sector employer; approximately 93% of our employees there are Mongolian. In Western Australia in our Iron Ore product group, we employ 10,500 people: 13.5% of the residential workforce are members of Indigenous groups from the Pilbara region. We are a major employer in the Saguenay, in Quebec. We also work with about 37,000 suppliers in more than 120 locations, supporting the employment of many thousands more. In 2018, we paid $4.7 billion in wages and other employment costs, and $12.3 billion on goods and services, often supplied locally, by local businesses. This year, we invested $192 million to strengthen the health, education, cultural heritage and environment of the places that so many of us call home.
This is how economic development and prosperity is created, and sustained.
To be clear, protecting the environment is also critically important. Rio Tinto has long acknowledged the reality of climate change and its potential to have a negative impact on our business, our communities and the world around us. In 2015, we supported the outcomes of the Paris Agreement and the long-term goal to limit global average temperature rise to well below 2°C, recognising that doing so will require governments and companies alike to approach climate change with more ambition and action.
We believe we are doing our part – from helping to develop technology that can make aluminium smelters entirely GHG-emissions-free to providing the world with the materials it needs to build the new, low-carbon economy, from electric vehicles to smart phones. This year, we also exited fossil fuel production, becoming the only major mining company to do so.
As much as we have done, there is more to do. We are not where we want to be on safety, or diversity. We appreciate that the changing nature of work presents opportunities for our business, but also significant challenges for many of our communities and employees. Managing the coming closure of certain sites, and doing so well, will reflect our commitment.
However, as our performance in 2018 illustrates, commercial success can indeed be coupled with a meaningful contribution to the world around us.
The pages that follow aim to illustrate this contribution.
Our business by its very nature must have sustainability at the centre of its strategy.”
In this section, we focus on topics central to sustainability at Rio Tinto, and summarise our 2018 performance. For a fuller report on the year, please see our 2018 Sustainable development report, available on our website.
Further important information relating to our approach to sustainability is set out on page 63
“ Our values, experience and history tell us that we must work in a way that delivers real, lasting benefits for the owners of our company as well as the wider communities in which we operate.”
1 Our 2018 Taxes paid report will be published in April 2019.
Annual report 2018 | riotinto.com52

Sustainable development | Running a safe, responsible and profitable business
UN Sustainable Development Goals (SDGs)
Our sustainability frameworkOur three pillars each contribute to the United Nations’ 17 Sustainable Development Goals.
Running a safe, responsible and profitable businessThe foundation of our approach is to run a safe, responsible and profitable business.
Collaborating to enable long-term economic benefitsWe collaborate with others to enable long-term benefits where we operate – working with governments at all levels and community partners to help make a difference in people’s lives.
Pioneering materials for human progressWe are helping to pioneer a more sustainable future – through examining our own global carbon footprint, forming smart partnerships and producing materials that contribute to a low-carbon economy.
Proud to be recognised for sustainability by
Dow Jones &FTSE4Good
again in 2018
Annual report 2018 | riotinto.com 53
Strategic report

Strategic report
Sustainable development continued
Staying safe, keeping others safe, and being responsible are core to who we are as a company. Profitability allows us to meet our commitment to our shareholders while contributing to the world around us.
Running our business in this way means not only meeting production, financial and productivity targets, but also paying close attention to safety and wellbeing, inclusion and diversity, and ethics and integrity. It means thoughtfully managing our operational environment, including resources like water and air, and the rights, traditions and heritage of the communities where we operate.
Running a safe, responsible and profitable business: priorities for 2019Safety and wellbeing – Achieve our first fatality-free year, in part
by building stronger leadership in the field around health and safety critical risks.
– Continue to work with joint-venture partners and other industry safety leaders to learn new ways to improve our health and safety performance.
– Continue to strengthen employee mental health and wellbeing, including by expanding initiatives like Iron Ore’s long-standing peer support programme into other product groups and countries.
– Focus on major hazard risk management, particularly around water and tailings facilities and process safety.
Environment – Set new water targets for 2019-23. – Establish easier internal systems that
improve our live reporting. – Introduce a programme to further
enhance our management of tailings risk.
Communities – Continue to build technical excellence
in communities and social performance. – Update and strengthen our approach
to regional economic development. – Continue to strengthen our ability to prevent
the causes of community complaints.
2018 performance against targets
Goals Performance
To reach zero fatalities, and to eliminate workplace injuries and catastrophic events
– 3 fatalities at managed operations – All injury frequency rate (AIFR) at 0.44
(target: 0.38), up 5% on 2017 – 1.45 million CRM verifications
(target: 1.2 million)
To minimise exposure to critical fatality health-risks by verifying that effective controls are in place at all managed operations by the end of 2018
– 77% of managed operations achieved this target
To reduce the rate of new occupational illnesses each year
– 15% increase in the rate of new occupational illnesses since 2017
To achieve approved local water targets in all managed operations with material water risk
– 79% of operations met their 2014-18 water targets (target 100%)
To improve diversity in our business by:- Increasing women in senior management
by 2% each year- Aiming for 50% women in our graduate intake,
with 30% from places where we are developing new businesses
– 22.6% of senior management were women, up from 22.4% in 2017
– 25% of our Executive Committee were women – 36% of our graduate intake were women,
down 5% from 2017 – 31% of our graduate intake were from the
places we are developing new businesses – 17.7%1 of our total workforce were women
Improving our employee engagement and satisfaction
– An eight-point increase in our Employee Net Promoter Score (eNPS)
– Two-point increase in employee satisfaction score (eSAT)
– Six-point increase in average monthly engagement on Yammer
1 Gender distribution for our total workforce is based on managed operations (excludes non-managed operations and joint-ventures) as of 31 December 2018. Less than 1% of the workforce gender is undeclared.
Running a safe, responsible and profitable business
Annual report 2018 | riotinto.com54

Safety and wellbeing
Safety and health performance1 2014-18
2018 2017 2016 2015 2014
Fatalities at managed operations from safety and security incidents 3 1 1 4 2
Fatalities at managed operations from health incidents – –4 – – –
All injury frequency rate (per 200,000 hours worked) 0.44 0.42 0.44 0.44 0.59
Number of lost-time injuries 228 199 206 220 381
Lost-time injury frequency rate (per 200,000 hours worked) 0.27 0.25 0.26 0.25 0.37
New cases of occupational illness (per 10,000 employees) 29 253 47 32 17
Number of employees2 47,500 47,000 51,000 55,000 60,000
1 Data relating to fatalities, all injury frequency rate and lost-time injury frequency rate includes all employee and contractor exposure hours and incidents. New cases of occupational illness are reported for employees only.
2 Includes our share of joint ventures and associates.3 Numbers adjusted from previous years to ensure comparability over time.4 Health fatality in 2017 was reclassified as non-work related.
SafetyOur number one priority is to keep our people, contractors, communities and suppliers safe. We believe that all accidents and health risks are preventable, so we concentrate on identifying and managing these – and where possible, eliminating them.
This year, tragically, three people lost their lives. In April, a maintainer lost his life while working on a furnace rebuild at our Sorel-Tracy plant in Quebec, Canada. In July, a security guard at Richards Bay Minerals in South Africa was fatally assaulted. And in August, a heavy haul truck driver was in a fatal accident at our Paraburdoo mine in Western Australia.
We have been deeply affected by these losses, and our thoughts remain with the families and many friends, colleagues and communities affected. We have offered support after each tragedy and completed full investigations.
We continue to focus on eliminating fatalities in other ways, including through our critical risk management programme, embedded at more than 60 sites this year. This programme systematically identifies major hazard risks (low-probability, high-consequence events) and helps us to manage them through standards, analysis, external reviews and rigorous verification of controls.
In 2018, we improved how we categorise occupational illness. The rate of new cases of occupational illness rose by 15% from 2017 – the main types recorded being musculoskeletal disorders (33%), noise-induced hearing loss (32%) and stress (23%).
Our goal is zero fatalities; our performance in 2018 shows that we have a lot more to do. From 2013-18, our AIFR improved by 32% but deteriorated by 5% since last year.
WellbeingRio Tinto promotes a healthy and balanced lifestyle, work-life balance, good nutrition, regular exercise, and access to health care – all elements of wellbeing. We also have an increasing focus on mental health.
Mental illness is one of the most rapidly growing causes of long-term sick leave and labour market exclusion across developed countries despite improved rates of detection and methods of intervention. We provide mental health training for managers because studies have suggested that these improve occupational outcomes for employees with mental health problems.
One way we support mental health is through our Employee Assistance Programme, which gives employees access to professional coaching, advice and support for themselves and their families. It can help with many types of concern, including financial and legal questions, children’s needs, family relationships, advice for supporting an ill parent, balancing work and home life, and dealing with change and stress. More than 95% of our employees are covered by this programme, with the remainder supported by on-site counsellors.
This year, in Australia, we were also pleased that we achieved White Ribbon Workplace Accreditation, which recognises our work to raise awareness of, and to eradicate, domestic violence, particularly that which affects our employees and communities. We have extended the programme to Canada and the US, where employees in need can take up to ten days of paid extra leave, work flexible hours and receive financial aid and emergency accommodation.
“Our number one priority is to keep our people, contractors and suppliers safe.”
Our values at work
Some of the best people in the industry work at Rio Tinto, and we want to make sure this tradition continues. We do this by fostering a culture where every voice is heard, every idea is encouraged and everyone is supported.
Inclusion and diversityRespect is core to how we work. We employ people based on job requirements alone. We do not discriminate on any grounds, and we do not tolerate discrimination.
This year, we revised our policy on inclusion and diversity, jointly owned by the board and Executive Committee, in order to articulate explicit expectations around behaviours and personal accountability. We also implemented our gender-neutral paid parental leave in every country where we operate, making 18 weeks of paid leave available to primary carers, including single parents and employees in same-sex relationships.
We employ people with disabilities and make considerable efforts to offer suitable alternative employment and retraining to employees who become disabled and can no longer perform their regular duties.
On gender diversity, we are still not where we want to be: our overall percentage of female employees decreased by 0.3% to a Group-wide 17.7% (6,963 women; 32,419 men). Although the number of women in operations roles increased from 5% to 15%, only 22.6% of our senior management roles are held by women (112 women; 383 men) up from 22.4% in 2017 (117 women; 406 men). We define senior management as general managers, Group advisers and chief advisers as well as employees in leadership roles who report directly to Executive Committee members. Women represented 15% of the directors of our principal controlled subsidiary undertakings during 2018 (20 women; 112 men).
Sustainable development | Running a safe, responsible and profitable business Annual report 2018 | riotinto.com 55
Strategic report

Strategic reportStrategic report
Sustainable development continued
Our gender pay gap this year was 1% in favour of men overall and 2% in favour of men like-for-like. We are addressing these issues – for example, we are working with recruitment agencies and universities to bring more diverse graduates into our business. We are working to substantially increase the number of women employed at all levels to help boost the percentage of women in senior management. In 2018, there were 62 women in our graduate intake (36%), and our aim is to make this 50%. We also target improving the proportion of women in senior management by 2% each year.
Engaging our employeesWe know that having engaged people will make our business more productive, and we have regular dialogue with all our employees, at all levels. Our chief executive held well over 30 town hall and small group discussions in 20 locations; he also conducted webcasts to present annual and half-year financial results to our global employees. This year, he also launched open-door sessions, where employees at manager level and below can stop by and talk to him about whatever they like. We also use Yammer, an internal social networking app, to support engagement: in 2018 nearly half of our employees were on Yammer, and average monthly engagement across nearly 2,000 groups was up six points year on year. This year, our board held its first-ever employee AGM in Brisbane, where directors discussed our purpose, strategy, culture and values, and answered questions on a wide range of topics. We also run global engagement surveys twice each year to understand employees’ views and perceptions.
Human rightsWe respect and support human rights everywhere we work, in line with the Universal Declaration of Human Rights. The human rights issues that have the most potential to affect us centre around operational security, land access and resettlement, Indigenous people’s rights, labour rights, environmental issues such as access to water, and issues related to migration such as access to local health services.
We continue to support employees’ right to belong to a union and to bargain collectively – for a fuller discussion, please see our 2018 Sustainable development report. We do not employ forced, bonded or child labour.
We have due diligence processes and systems in place, such as social impact assessments, community engagement plans, grievance mechanisms and digital tools that identify community sentiment. This in turn allows us to prevent and minimise the adverse effects of our
operations on human rights. Ensuring that we do no harm is a core consideration in our social risk analysis and impact assessment processes. We also integrate human rights considerations into our health, safety, environment, communities and security and procurement practices, and into our business performance audits. Where our standards and procedures are stricter than existing laws or regulations, we apply our own standards.
This year, we were named the top extractives company in the Corporate Human Rights Benchmark for continuing to improve how we approach the management of human rights risks.
More detail on the steps we have taken to prevent human rights issues in our business and across our supply chain can be found in our Modern Slavery Act statement online. Our policies and statements relating to human rights, together with a list of the international standards we follow, are also available on our website.
Operational environment
We aim to minimise the potentially adverse impact of our operations on the environment and on the communities where we operate. This involves establishing very clear internal standards and practices that are in line with – and sometimes go beyond – international and local regulations.
It also means having open dialogue with local communities and other stakeholders. We operate joint community monitoring programmes and share air-quality monitoring information, including on our website.
WaterWater is a valuable resource and is vital to our operations. We use it to process ore, manage dust, produce hydroelectric power and as drinking water. Each of our sites has its own unique water context – from environments where water is scarce to places with high rainfall.
For the 28 Rio Tinto sites where water management is a material risk, we set site-specific targets for the period 2014-18. These include the security of the water supply, managing the quality of water returned to the environment, and balancing our operational needs with regulatory requirements and those of local communities and Traditional Owners. 79% of sites met their five-year targets. We remain committed to continuing the water target programme and will set new targets for 2019-23.
In 2019, we will start reporting our practices against the commitments outlined in the International Council on Mining and Metals (ICMM) position statement on water stewardship.
36%women in our graduate intake in 2018 – still short of our 50% target
Running a safe, responsible and profitable business continued
Annual report 2018 | riotinto.com56

Environmental performance 2014-18
2018 2017 2016 2015 2014
Freshwater used (billion litres) 401 465 467 460 465
Land footprint – disturbed (square kilometres) 3,595 3,616 3,696 3,629 3,592
Land footprint – rehabilitated (square kilometres) 485 497 541 533 502
Our approach to tailings management is in line with the ICMM position statement, and we continually review and audit our practices, including externally. We are working with our industry peers to better manage risks associated with tailings and water storage facilities, and also participating in two research projects led by the University of Western Australia, specifically on reducing tailings risks. And we are working to help develop and update tailings management guidelines in Australia and Canada.
To raise awareness on tailings risks and good practices, we hold regular webinars where internal and external experts share their knowledge with our employees. We also continue to develop our executive reporting protocol, and we are piloting an integrated control effectiveness tool to monitor progress and drive improvements on the ground.
In 2018, following our 2017 site reviews, we created and have started delivering seven training modules to increase understanding and capabilities around effective tailings management, particularly for nominated role personnel under our tailings standard. We also completed technical risk reviews at five sites to strengthen our technical assurance process. These were in addition to business conformance audits at 14 sites that assessed compliance with our tailings performance standard. Group Internal Audit also completed an independent assurance process to assess our approach to tailings risk management: we have good fundamentals in place, but we will continue to learn, evolve and improve our approach.
WasteOur main types of waste are mineral waste such as waste rock, slag and tailings and non-mineral waste such as used oil and office waste. When it is not possible to reuse or recycle waste, we build facilities to manage it in ways that minimise adverse environmental and community impact, disposal costs and future liabilities. Roughly 31% of our mineral waste has the potential to react with air and water or break down to create potentially harmful contaminants like acid and metalliferous drainage (AMD). So we have in place rigorous and regularly monitored controls to prevent and mitigate the potential harmful impact of AMD.
In 2018, we safely stored or disposed of 886 million tonnes of mineral waste (predominantly waste rock and tailings) and 274,245 tonnes of non-mineral waste.
Managing tailingsMining processes create residues called tailings. Where it is not possible to reclaim and reuse these, they are discharged – normally as slurry – to storage facilities. We manage the operation of tailings and/or large water storage facilities at 32 sites worldwide, including closed and legacy sites not yet fully rehabilitated. We also have a further four non-managed operational sites and 14 non-managed legacy sites with joint-venture partners.
There were no tailings or water dam related failures at our managed operations in 2018. At our non-managed operations, we work with our partners to minimise the environmental and social impacts and risks associated with tailings management.
88%of water used at Oyu Tolgoi is recycled
Sustainable development | Running a safe, responsible and profitable business
Working with non-managed assets We hold interests in companies and joint ventures that we do not manage and control. In 2018, the two largest were the Grasberg copper-gold mine in Indonesia, managed by PT Freeport Indonesia (PTFI), a subsidiary of Freeport-McMoRan, and the Escondida copper mine in Chile, managed by BHP.
We work closely with our partners in these joint ventures through formal governance structures and technical exchanges to learn and improve performance. We encourage all our partners to embed a strong safety, security and human rights culture in their workforces, and have a two-way process for sharing health and safety practices including fatality prevention initiatives, such as critical risk management (CRM) and learning critical lessons.
At Grasberg, we have traditionally engaged with PTFI through five forums: the Operating, Technical, Exploration and Sustainable Development Committees and the Tailings Management board. In December 2018, we completed the sale of our entire interest in the Grasberg mine for $3.5 billion.
We also own a 30% interest in Escondida and give regular input on strategic and policy matters through its Owners’ Council. Escondida has recently commissioned one of the largest desalinisation plants in the world, announcing in 2018 their intention to extract significantly less groundwater from the arid region around the mine from 2020 onwards.
Annual report 2018 | riotinto.com 57
Strategic report

Strategic reportStrategic report
Sustainable development continued
Environmental regulations While we reported no significant environmental incidents with a major or catastrophic impact in 2018, we were fined $284,683 by the governments in Canada, Mongolia and the US. The concerns outlined by each have since been addressed; more details can be found in the Directors’ report on page 140 and in our Sustainable development report on our website.
Ethics and integrityWe have clear standards around antitrust, bribery and corruption, conflicts of interest, benefits, sponsorships and donations, data privacy, fraud and third-party due diligence. Our code of conduct, The way we work, provides a clear framework for how we should conduct our business, no matter where we work or where we are from.
We recognise that our reputation has been damaged by the ongoing investigations into the impairment of our coal investment in Mozambique and payments made to a consultant in relation to the Simandou project in Guinea, activities that took place more than six years ago.
On the former, we reached a settlement in 2017 with the UK Financial Conduct Authority (FCA), who believe we should have impaired the asset six months earlier than we did. Importantly, the FCA found no evidence of fraud or systemic failure. Both the Australian and US authorities are pursuing claims against the Group in relation to the impairment of our Mozambique coal project. We believe these cases are unwarranted and intend to strenuously deny the allegations in court.
On Simandou, after commissioning an independent investigation, the board took the decision to self-report to the authorities in the UK, the US and Australia. We continue to co-operate fully with the relevant authorities, but the conduct and timing of these investigations are outside our control.
Today, we remain focused on acting with integrity, being transparent and continuing to foster a culture in which our employees never need a reason to do the right thing.
In October, we publicly committed to disclosing on our website our contracts with, and taxes and payments to, governments, as well as the identities of the owners of companies with which we work (beneficial ownership). We are on the board of the Extractive Industries Transparency Initiative (EITI), which works to improve transparency and accountability in the extractive sector. And we are working closely with governments and the Organisation for Economic Co-operation and Development (OECD) on new tax reporting codes and policies to ensure consistency in our reporting procedures.
This year, we joined other leading multinational companies in endorsing The B Team Responsible Tax Principles, which aim to drive fairer, more sustainable tax systems and global standards of responsible tax practice. In addition, every April, we publish a Taxes paid report, detailing how much tax we pay and where.
We are also working to improve the transparency of our supply chain. Our supplier code of conduct clearly lays out our expectations on human and labour rights, safety and the environment. Our Know Your Supplier (KYS) procedure enables us to understand legal, ethical and reputational risks of working with certain suppliers. We use this with all new suppliers meeting the risk criteria and, from the end of 2019, will also include it in contract renewals. We have centralised monitoring for relevant third parties we work with (5,922 in 2018).
We have a dedicated third-party due diligence team within our Ethics & Integrity function to facilitate risk-based KYS and Know Your Customer (KYC) due diligence assessments on our commercial relationships.
The assessments cover bribery, corruption, human rights, money laundering, trade sanctions and other areas which may result in potential legal, ethical or reputational risks. We apply automated monitoring of relevant third parties to highlight significant changes in our risk profile.
Talk to Peggy
In 2018, a key activity was making ongoing improvements to Talk to Peggy, our confidential and independently operated whistleblowing programme available to all employees, contractors and community members. Key statistics for the year: – 679 incidents reported either through
Talk to Peggy, compliance managers or team leaders, down approximately 5% on last year.
– We substantiated or took corrective action for 34% of reported incidents.
“Today, we remain focused on acting with integrity, being transparent and continuing to foster a culture in which our employees never need a reason to do the right thing.”
Running a safe, responsible and profitable business continued
Annual report 2018 | riotinto.com58
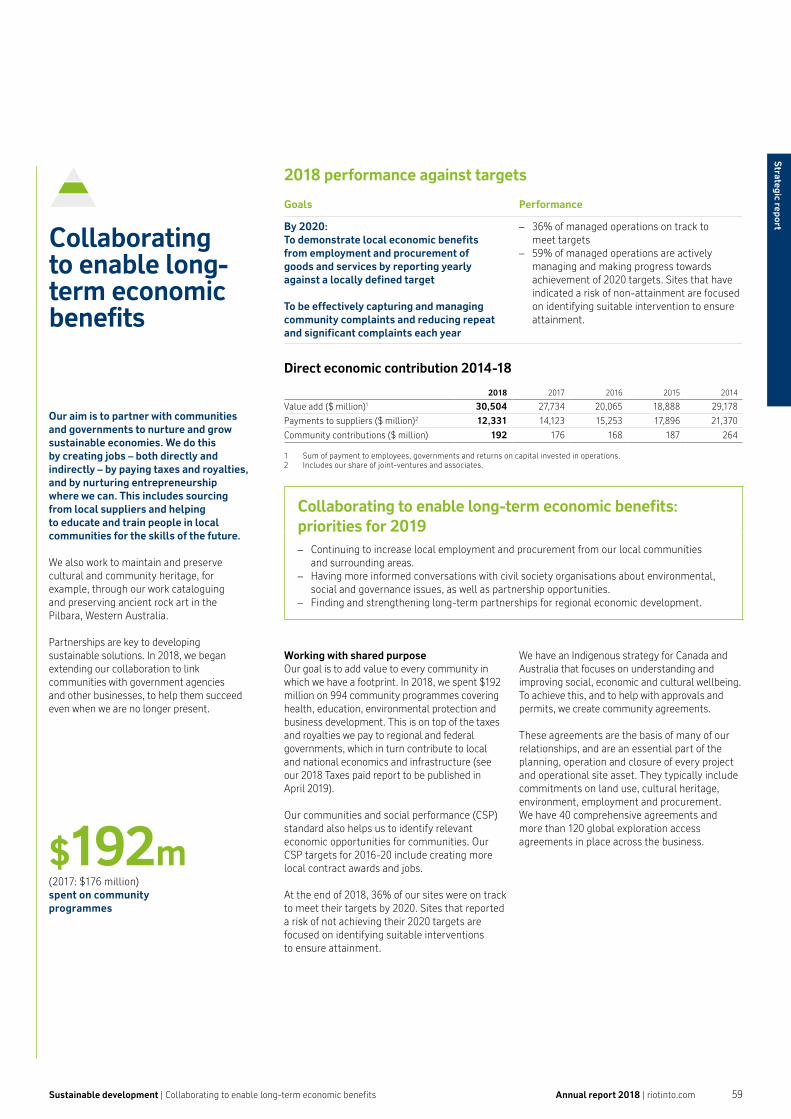
Our aim is to partner with communities and governments to nurture and grow sustainable economies. We do this by creating jobs – both directly and indirectly – by paying taxes and royalties, and by nurturing entrepreneurship where we can. This includes sourcing from local suppliers and helping to educate and train people in local communities for the skills of the future.
We also work to maintain and preserve cultural and community heritage, for example, through our work cataloguing and preserving ancient rock art in the Pilbara, Western Australia.
Partnerships are key to developing sustainable solutions. In 2018, we began extending our collaboration to link communities with government agencies and other businesses, to help them succeed even when we are no longer present.
2018 performance against targets
Goals Performance
By 2020:To demonstrate local economic benefits from employment and procurement of goods and services by reporting yearly against a locally defined target
To be effectively capturing and managing community complaints and reducing repeat and significant complaints each year
– 36% of managed operations on track to meet targets
– 59% of managed operations are actively managing and making progress towards achievement of 2020 targets. Sites that have indicated a risk of non-attainment are focused on identifying suitable intervention to ensure attainment.
Direct economic contribution 2014-18
2018 2017 2016 2015 2014
Value add ($ million)1 30,504 27,734 20,065 18,888 29,178
Payments to suppliers ($ million)2 12,331 14,123 15,253 17,896 21,370
Community contributions ($ million) 192 176 168 187 264
1 Sum of payment to employees, governments and returns on capital invested in operations.2 Includes our share of joint-ventures and associates.
Collaborating to enable long-term economic benefits: priorities for 2019 – Continuing to increase local employment and procurement from our local communities
and surrounding areas. – Having more informed conversations with civil society organisations about environmental,
social and governance issues, as well as partnership opportunities. – Finding and strengthening long-term partnerships for regional economic development.
Working with shared purposeOur goal is to add value to every community in which we have a footprint. In 2018, we spent $192 million on 994 community programmes covering health, education, environmental protection and business development. This is on top of the taxes and royalties we pay to regional and federal governments, which in turn contribute to local and national economics and infrastructure (see our 2018 Taxes paid report to be published in April 2019).
Our communities and social performance (CSP) standard also helps us to identify relevant economic opportunities for communities. Our CSP targets for 2016-20 include creating more local contract awards and jobs.
At the end of 2018, 36% of our sites were on track to meet their targets by 2020. Sites that reported a risk of not achieving their 2020 targets are focused on identifying suitable interventions to ensure attainment.
$192m(2017: $176 million)spent on community programmes
Collaborating to enable long-term economic benefits
Sustainable development | Collaborating to enable long-term economic benefits
We have an Indigenous strategy for Canada and Australia that focuses on understanding and improving social, economic and cultural wellbeing. To achieve this, and to help with approvals and permits, we create community agreements.
These agreements are the basis of many of our relationships, and are an essential part of the planning, operation and closure of every project and operational site asset. They typically include commitments on land use, cultural heritage, environment, employment and procurement. We have 40 comprehensive agreements and more than 120 global exploration access agreements in place across the business.
Annual report 2018 | riotinto.com 59
Strategic report

Strategic report
to markets, and support for improved quality and grazing – all in return for adopting better practices. Other incentives will eventually include assistance to diversify herders’ income as well as other financial support, including access to loans and insurance against loss of herds.
We contribute in other ways as well, often through our network of local suppliers. Our payments to suppliers comprise a big part of our global economic contribution – this year such payments totalled $12.3 billion, out of a total direct economic contribution of $42.8 billion.
We also support regional economies through our procurement processes. For example, local businesses in Australia can use a special portal to find and bid for contracts, and we offer 30-day payment terms to help smaller businesses with cash flow. In 2018, we spent A$1.9 billion on goods and services from Western Australian businesses alone.
Global engagement We take an active role in a variety of dialogues with the global community on social issues as well as the environment. This allows us to both harness opportunities and address collective challenges that we cannot effectively tackle on our own.
Rio Tinto is a member of many trade and industry associations, which we join where membership provides value to our business, investors and other stakeholders. We believe engagement is important even where there is a wide range of views with which we do not always agree. We do not favour any political party, group or individual. We do not involve ourselves in party political matters, nor make any type of payments to political parties or candidates.
For example, we support, or are members of, a range of initiatives and organisations ranging from the ICMM to the UN Global Compact to EITI and this year, the World Economic Forum.
Strategic report
Sustainable development continued
Rio Tinto in the Queensland Community
In 2015, we announced an A$2.6 billion investment in far north Queensland, Australia, for the construction of a bauxite mine, processing and port facilities. At the request of Traditional Owners, it was named Amrun, the Wik Waya name for the area. Starting in 2019, Amrun is expected to produce up to 22.8 million tonnes of bauxite per year. The first shipment left port in December 2018, six weeks ahead of schedule.
Amrun’s economic impact has been felt across Australia; we have made more than A$2.1 billion in purchases from more than 1,200 Australian suppliers – over 800 from the state of Queensland. Western Cape York businesses alone have supplied more than A$240 million worth of goods and services.
We are working to address local community needs: because working parents in the area face child-care pressures, we are funding a programme that encourages local educators to open new daycare facilities. We are also funding education, employment and training opportunities for the local Indigenous community.
We are also helping to safeguard the environment: the nursery we planted is today 86,000 seedlings strong. These seedlings will be used to support rehabilitation across our Weipa operations, including Amrun. And last year, as part of their work to counter baby turtle predation, our team potentially saved approximately 7,600 turtle eggs.
“Socioeconomic development is about more than employment and social investment. It is about efforts to make local communities successful and resilient over the long term.”
Collaborating to enable long-term economic benefits continued
Regional economic development Socioeconomic development is about more than employment and social investment. It is about efforts to make local communities successful and resilient over the long term. This, in turn, requires meaningful partnerships at the local level, with both governments and community organisations.
In 2018, for example, we launched a partnership with the government of Western Australia and South Metropolitan TAFE (Technical and Further Education) to develop the first nationally recognised certificates in Automation and Remote Operations. This partnership aims to train people in the new skills required for the automation age and certify those skills, so they are easily transferable across industries.
In Mongolia, we are part of the Sustainable Cashmere Project, an initiative to strengthen the supply chain of high-quality cashmere. This project works to give Mongolian herders better-than-market prices, more direct access
Annual report 2018 | riotinto.com60
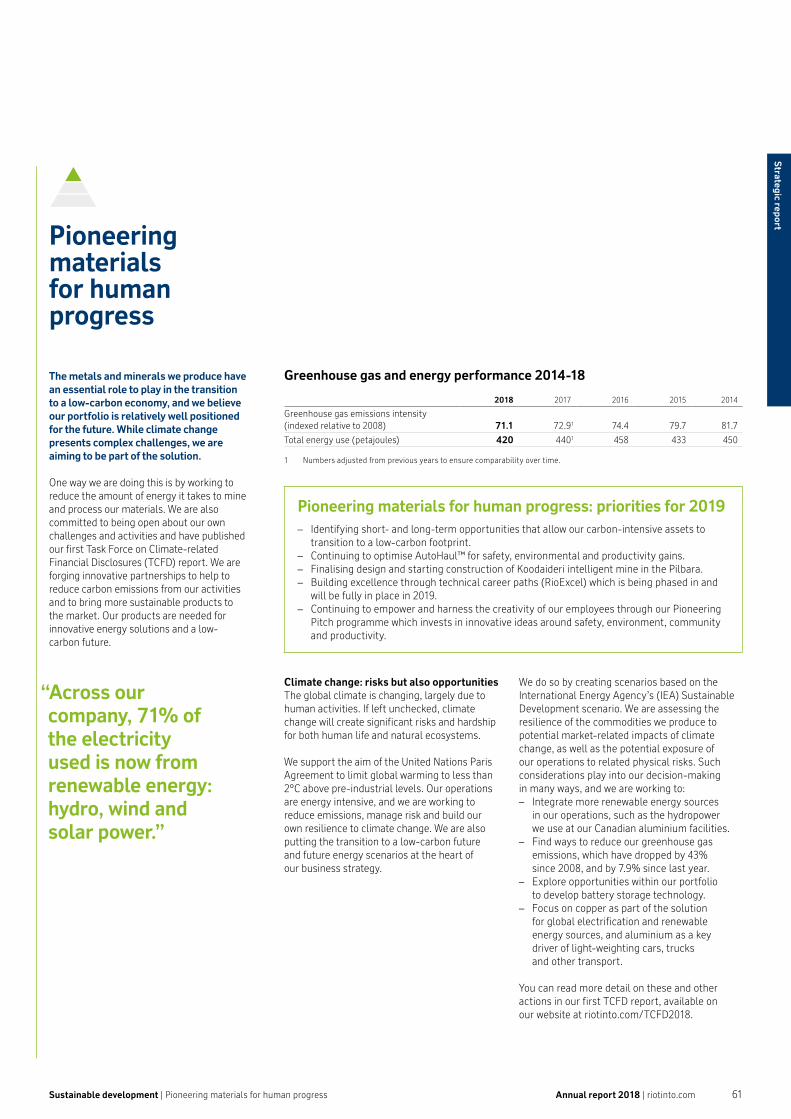
Climate change: risks but also opportunities The global climate is changing, largely due to human activities. If left unchecked, climate change will create significant risks and hardship for both human life and natural ecosystems.
We support the aim of the United Nations Paris Agreement to limit global warming to less than 2ºC above pre-industrial levels. Our operations are energy intensive, and we are working to reduce emissions, manage risk and build our own resilience to climate change. We are also putting the transition to a low-carbon future and future energy scenarios at the heart of our business strategy.
We do so by creating scenarios based on the International Energy Agency’s (IEA) Sustainable Development scenario. We are assessing the resilience of the commodities we produce to potential market-related impacts of climate change, as well as the potential exposure of our operations to related physical risks. Such considerations play into our decision-making in many ways, and we are working to: – Integrate more renewable energy sources
in our operations, such as the hydropower we use at our Canadian aluminium facilities.
– Find ways to reduce our greenhouse gas emissions, which have dropped by 43% since 2008, and by 7.9% since last year.
– Explore opportunities within our portfolio to develop battery storage technology.
– Focus on copper as part of the solution for global electrification and renewable energy sources, and aluminium as a key driver of light-weighting cars, trucks and other transport.
You can read more detail on these and other actions in our first TCFD report, available on our website at riotinto.com/TCFD2018.
Pioneering materials for human progress: priorities for 2019 – Identifying short- and long-term opportunities that allow our carbon-intensive assets to
transition to a low-carbon footprint. – Continuing to optimise AutoHaul™ for safety, environmental and productivity gains. – Finalising design and starting construction of Koodaideri intelligent mine in the Pilbara. – Building excellence through technical career paths (RioExcel) which is being phased in and
will be fully in place in 2019. – Continuing to empower and harness the creativity of our employees through our Pioneering
Pitch programme which invests in innovative ideas around safety, environment, community and productivity.
Greenhouse gas and energy performance 2014-18
2018 2017 2016 2015 2014
Greenhouse gas emissions intensity (indexed relative to 2008) 71.1 72.91 74.4 79.7 81.7
Total energy use (petajoules) 420 4401 458 433 450
1 Numbers adjusted from previous years to ensure comparability over time.
Pioneering materials for human progress
Sustainable development | Pioneering materials for human progress
“Across our company, 71% of the electricity used is now from renewable energy: hydro, wind and solar power.”
The metals and minerals we produce have an essential role to play in the transition to a low-carbon economy, and we believe our portfolio is relatively well positioned for the future. While climate change presents complex challenges, we are aiming to be part of the solution.
One way we are doing this is by working to reduce the amount of energy it takes to mine and process our materials. We are also committed to being open about our own challenges and activities and have published our first Task Force on Climate-related Financial Disclosures (TCFD) report. We are forging innovative partnerships to help to reduce carbon emissions from our activities and to bring more sustainable products to the market. Our products are needed for innovative energy solutions and a low-carbon future.
Annual report 2018 | riotinto.com 61
Strategic report

Strategic reportStrategic report
Sustainable development continued
Materials of the low-carbon futureMany of our products are well suited to developing energy solutions, such as renewable energy storage and electricity transmission. Copper is the primary conductor in the world’s electrical infrastructure and plays a significant role in the electrification of transportation and smart technologies. By 2027, we expect our Oyu Tolgoi mine in Mongolia to become one of the world’s top producers of copper, demand for which is linked to the use of renewable energies and electric vehicles.
Aluminium has always been the leading choice for sustainable product development due to its lightweight, strength and infinite recyclability. Its properties make it ideally suited to lighter and more fuel-efficient vehicles. And as battery storage technology develops, lithium is expected to play an increasing role in the low-carbon economy, particularly in markets such as the US, EU and China. The pre-feasibility studies of our Jadar lithium project in Serbia have continued to progress this year.
Groundbreaking partnershipsIn 2018, we announced Elysis, a pioneering partnership with Alcoa, supported by Apple and the governments of Canada and Quebec. This joint venture will further develop a revolutionary process that eliminates direct GHG emissions from the aluminium smelting process, replacing them with pure oxygen. The technology will be developed and licensed for use in both existing and new smelters.
We are also the first company in the world to become certified under the Aluminium Stewardship Initiative (ASI), the highest internationally recognised standard for robust environmental, social and governance practices across the aluminium lifecycle of production, use and recycling. This has led to immediate benefits such as our partnership with Nespresso to supply responsible, sustainable aluminium for their coffee capsules by 2020.
Our Ventures team is exploring partnerships and other opportunities that will allow us to expand even more into the metals and minerals of the future, as technology continues to change the way we live and work.
Closure: ending production Planning for the future of our sites is a core business function, which is governed by our Closure Steering Committee.
A centralised closure group supports all our businesses and oversees work to minimise the impacts and risks and to maximise benefits for stakeholders. A number of our assets are coming to the end of their operating lives. At the end of 2018, we had almost $10 billion set aside on our balance sheet for the cost of closing these sites.
Last year, we developed a strategy to help drive greater consistency and effectiveness in the planning and implementation of our closure
activity at every site. This includes progressively rehabilitating land throughout the life of an operation; in 2018, we rehabilitated 24% of the land we disturbed for mining. We also look to incorporate closure into the design of our assets, as well as how to optimise decommissioning, remediation and any long-term management obligations, such as water treatment. And we continually assess the potential to repurpose and reuse sites for future economic or social benefit. In some instances, we manage historic sites for the long term.
This work is highly collaborative, involving sustained input from our employees, landowners, communities, governments and NGOs. In some regions, regulations for large mine closures are undeveloped or untested. We are working with our stakeholders and peers to better understand the opportunities around closure, to find solutions to the challenges and to engage governments to create effective and proportionate policies.
We manage a number of historic (post-production) sites, often inherited through acquisitions or mergers. We rehabilitate these sites and, where and when we can, we transfer them to local authorities or third parties.
Intelligent miningThrough our Mine of the Future™ programme, we harness new and emerging technologies to make our operations safer, more efficient, and more environmentally friendly. In 2018, for the first time, our driverless trains – 2.4 kilometres in length – delivered iron ore from our mines to our ports in the Pilbara in Western Australia. With the programme fully implemented, we have now completed more than 1.6 million kilometres in driverless mode, reducing risk at level crossings and cutting light vehicle travel across the Pilbara by 1.5 million kilometres a year.
We also approved funding for the Koodaideri iron ore mine in Western Australia, the world’s first intelligent mine. In addition to technology already in use across Rio Tinto, such as autonomous trucks, trains and drills, the site has more than 70 design innovations in scope. Fully integrated mine operation and simulation systems, including digital twin technology, will improve safety, maintenance and productivity – and will be accessible in real-time in the field. Koodaideri will set a benchmark for our industry in terms of automation and the use of data.
Using technology to construct assets intelligently, and with respect for the environment and local communities, is also a priority. At our Amrun bauxite mine in Queensland, Australia, we used innovative modular engineering techniques to build the wharf more safely, faster and with a smaller environmental footprint. We also used virtual reality to help the local community and Traditional Owners understand how the mine and surrounding areas would eventually look. Today, we oversee activities at Amrun in real-time, using the latest technology and predictive mathematical tools to run operations safely and efficiently.
Pioneering materials for human progress continued
“We are the first company in the world to become certified under the Aluminium Stewardship Initiative (ASI), the highest internationally recognised standard for robust environmental, social and governance practices across the aluminium lifecycle of production, use and recycling.”
Annual report 2018 | riotinto.com62

Our approach to sustainability
Governance and materiality
The Sustainability Committee reviews our approach to ensure consistency with our purpose and values, the effective management of material sustainability risks and our contribution to sustainable development (more information on page 95).
Every year we review the sustainability topics that matter most to our business and stakeholders. Following the Global Reporting Initiative (GRI) Standards, this year we prioritised our material topics, combining an analysis of the external environment with feedback from Rio Tinto leaders and subject-matter experts while also considering stakeholder expectations.
We also have a robust infrastructure in place for capitalising on opportunities and mitigating risk: a clear strategy, comprehensive policies and standards, and rigorous audits to verify progress.
Task Force on Climate-related Financial Disclosures (TCFD)
In June 2017, the Financial Stability Board released its final report on the recommendations of the TCFD. This voluntary framework seeks to encourage businesses to disclose climate-related risks and opportunities. For our operations, climate-related risks and opportunities span several areas ranging from managing our carbon emissions, water usage where water is scarce, through to understanding how the products we produce fit into the low-carbon future.
We have provided information relating to these areas under the relevant pillar of our sustainability framework. In addition, we have provided disclosure, as envisaged by the TCFD, in our TCFD report, which can be found on our website at riotinto.com/TCFD2018.
Assurance
We engaged an independent external assurance organisation, PricewaterhouseCoopers LLP, to provide the directors of Rio Tinto with assurance on selected sustainable development subject matters, as explained on pages 290 and 291.
PricewaterhouseCoopers LLP’s assurance statement satisfies the requirements of subject matters 1 to 4 of the ICMM assurance procedure. See pages 92 to 94 of the governance report for more information on our external auditors and internal assurance.
Notes on dataThe data summarised in this section relates to calendar years, and unless stated otherwise, parameters are reported for all managed operations without adjustment for equity interests. Where possible, we include data for operations acquired before 1 October of the reporting period. Divested operations are included in data collection processes up until the transfer of management control.
We report against GRI standards and the requirements of other select reporting frameworks, and reflect the ten principles of the ICMM and the mandatory requirements in the ICMM position statements within our policies, standards and procedures. For more about our data definitions, our reporting of GRI disclosure requirements and our alignment with the ICMM, see our Sustainable development report, that will be published in March.
Non-financial information statement
This section (pages 52 to 63) provides information as required by regulation in relation to:
– Environmental matters – Our employees – Social matters – Human rights – Corruption and bribery
In addition, other related information can be found as follows:
– Business model – pages 14 and 15 – Principal risks and how they are
managed – pages 64 to 72 – Non-financial key performance
indicators – pages 20 to 23
Sustainable development | Our approach to sustainability Annual report 2018 | riotinto.com 63
Strategic report

Strategic report
We also continue to focus on managing risks relating to our relationships with governments, communities and key customers and suppliers. Our partner-to-operate strategy supports the creation and maintenance of mutually beneficial partnerships with key stakeholders, particularly host governments.
Our managed and non-managed joint-ventures, particularly operations in places with higher sovereign risk, continue to need close monitoring and active management. Our non-managed joint-venture portfolio is now better aligned with our strategic priorities and appetite for risk, after the sale of our interest in the Grasberg mine in Indonesia. And we are continuing to refine our portfolio for a future carbon-constrained world, with the sale of our Australian coal assets.
You can see changes to our risk profile during 2018 on the following page. For more detail on movements and the monitoring of these exposures, see pages 34 to 51 (Business reviews) 76 to 141 (the Directors’ report) and the Notes to the 2018 financial statements on page 150.
Emerging risksIn the near term, we expect to face continued macroeconomic and geopolitical uncertainty. The global economic cycle is expected to weaken due to monetary policy normalisation, the fading impacts of the US stimulus and weakening demand in China. We see the most significant short-term risks to be the impact on market sentiment of continuing global trade tensions, the potential for a sharp and prolonged downward correction in global equities, and a worse-than-expected slowdown in the Chinese economy.
We are also mindful of the ongoing rise of populism in many of the markets in which we operate. This is likely to lead to increasing
resource nationalism and pressure from governments, communities and customers for a greater share of the wealth that our business creates. Related to this, we also see a tightening of scrutiny around foreign investments.
In the medium term, we see both threats and opportunities in technological disruption – from mining and processing automation to machine learning and artificial intelligence. We aim to use these technologies to improve productivity in increasingly sophisticated markets, while managing the social implications of automation in partnership with our host governments.
In the longer term, we predict increasing demand for sustainable working practices and a growing need to manage environmental and other risks to our licence to operate, such as land reform. Climate change represents perhaps the greatest long-term threat to our business, but also brings opportunities. We will need to show resilience to the risks it poses – physical, regulatory and market. A low-carbon economy may lead to structural shifts such as a step-change in recycling, but it will also fuel higher demand for commodities like copper and raw materials for batteries.
Already, societal expectations around water and closure management are changing. We have considerably enhanced our framework for managing water risk, developing a comprehensive Water Risk Profile, Group-wide water metric and Group water target. We have also created a centrally coordinated closure strategy and a dedicated Closure team to provide strong lifecycle planning and to oversee our growing activities related to closing and repurposing our sites.
Risk management
The geopolitical context remained unsettled during 2018, with rising trade tensions creating increased market volatility.”We are exposed to a variety of risks (both threats and opportunities) that can affect our business performance, reputation and licence to operate – financially, operationally and in terms of compliance. Creating shareholder value is the reward for taking and accepting risk. Effective management of risk is therefore critical to whether we can achieve our strategic objectives.
The risk landscape in 2018The geopolitical context remained unsettled during 2018, with rising trade tensions creating increased market volatility. We have, however, generally experienced a favourable market and pricing environment. While there have been inflationary cost pressures affecting the industry, we have focused on delivering continued operational efficiencies through our mine-to-market productivity programme to defend our margins. Our solid cash flows, underpinned by strong prices and cash from divestments, have further strengthened our balance sheet and decreased our liquidity risk. We have also maintained a strong discipline around capital allocation: returning cash to shareholders and investing in high-quality long-term greenfield and brownfield projects.
In 2018, we continued to enhance our controls for managing operational risks. In particular, we are strengthening how we manage the risks of major hazards through a Group-wide improvement programme, and are applying more rigorous cyber-security controls to deal with the evolving and growing threat of cyber attacks and security exposures.
Our trading and sales and marketing teams have continued to develop a more sophisticated market interface with the ongoing expansion of our Commercial division in Singapore. We are building a robust governance, risk and controls framework to support the Commercial team and to manage the strategic, financial and operational risks to which they are exposed.
Annual report 2018 | riotinto.com64

Assessing our risksWith the help of management, the board has carried out a robust assessment of the principal risks of the business, as listed above. They have also tested the Group’s financial plans for each of these principal risks, and for a number of severe but plausible scenarios related to certain principal and material risks appearing at or around the same time.
We will continue to monitor the potential impacts of the UK’s departure from the European Union as a result of the June 2016 referendum. At the moment, we foresee no material impacts from this on our operations or business, although it could well create volatility in equity markets and contribute to political instability in the UK and Europe.
Longer-term viability statementOur business planning processes include preparing detailed financial plans for the next two years, as well as more strategic and higher level financial plans for the next five years. We develop our strategy and make capital investment decisions based on an assessment of cash flows over a multi-decade horizon. We also regularly test our investment capacity to make sure any capital commitments are in line with our capital allocation model. This multi-year approach to planning reflects our business model of investing in and running long-life assets, and selling into commodity markets over which we have limited influence.
Our planning includes modelling a series of macroeconomic scenarios and using a range of assumptions, including: – Projections of economic growth and commodity
demand in major markets, primarily China. – Commodity prices and exchange rates,
which are often correlated. – Potential new technology and productivity
enhancements. – Cost and supply parameters for our major inputs. – The schedule and cost of organic and inorganic
growth programmes.
Considering the potential speed and degree of change possible in factors like Chinese demand, commodity prices and exchange rates, we have set a three-year range for our long-term viability statement. We feel this strikes the right balance between long- and short-term influences on performance, and allows credible detailed forecasts.
We have undertaken robust stress-testing as part of the business planning process to confirm the long-term viability of the business. The variables tested include commodity price and exchange rate movements, and assumptions relating to production, political and stakeholder risks, acting both individually and in combination. We analyse severe but plausible risk levels well beyond those expected in the normal course of business.
The viability of the business under these scenarios remained sound, with a suite of management actions available to preserve resilience, including accessing lines of credit, reducing capital expenditure and changing levels of shareholder returns.
In summary, taking into account the Group’s current position and principal risks, the directors have assessed the prospects of the business over the next three years (until 31 December 2021) and have a reasonable expectation that we will be able to continue to operate and meet our liabilities as they fall due over that period.
It is impossible to predict all risks and the combinations in which they might appear. There may be risks that do not seem material at the moment, but which could turn out to be material, particularly if they appear at or around the same time.
How we manage riskUnderpinned by our risk policy and standards, our approach to risk management and internal control is aimed at embedding risk awareness in all decision-making, and a commitment to managing risk proactively and effectively. This includes: – Identifying and evaluating threats and
opportunities early. – Managing and preventing threats before
they materialise, and responding effectively if they do.
– Actively pursuing opportunities to capture value within agreed risk tolerances.
We make accountability for risk management very clear in our business – this is a key performance area for line managers.
Our Risk team supports the understanding and management of risk at all levels of the business. They provide a framework for managing and reporting material risks, escalating key issues to the Executive Committee and ultimately to the board, if appropriate. They also support the Risk Management Committee.
Risk management
Principal risks and uncertainties exposure at a glance – 2018 trend
External Internal Internal and external
Increasing risk or uncertainty
– Sovereign risk – China development
pathway – Commodity prices
– Attracting and retaining talent
No change in risk or uncertainty
– Strategic partnerships
– Execution of acquisitions and divestments
– Capital project development
– Health, safety, environment and communities
– Exploration and resources
– Operational excellence – Regulation and
regulatory intervention
Decreasing risk or uncertainty
– Liquidity
Annual report 2018 | riotinto.com 65
Strategic report
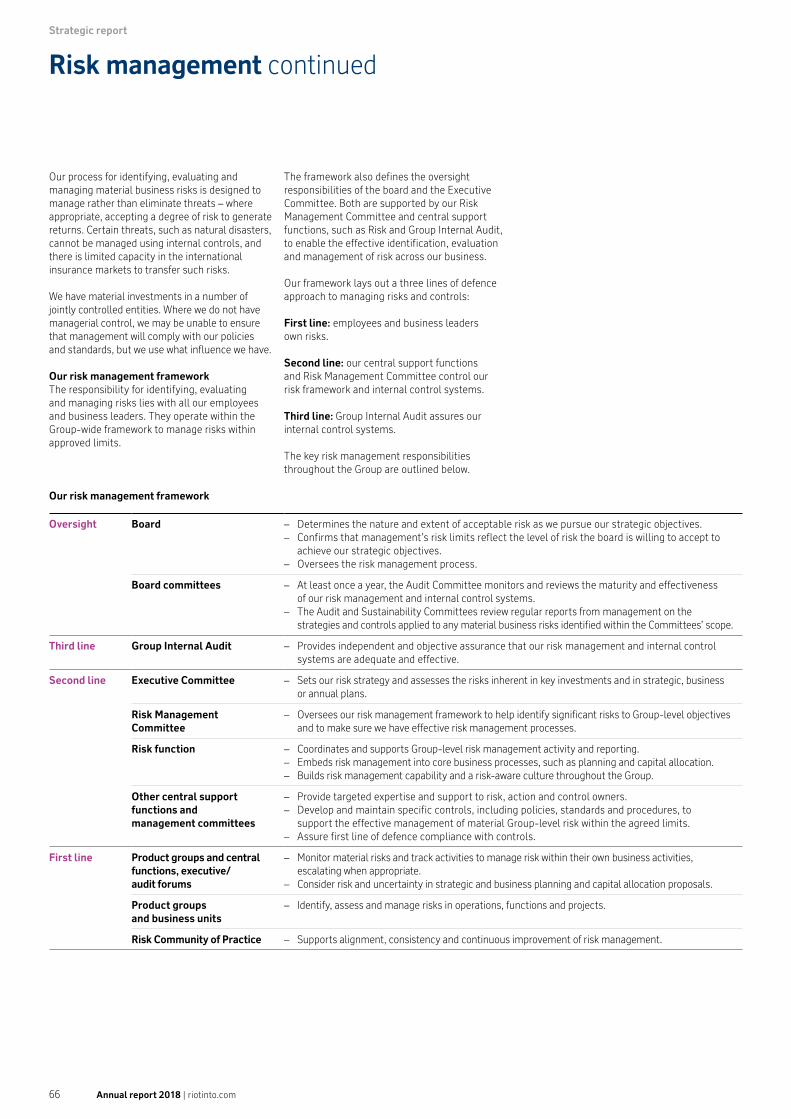
Strategic report
Our process for identifying, evaluating and managing material business risks is designed to manage rather than eliminate threats – where appropriate, accepting a degree of risk to generate returns. Certain threats, such as natural disasters, cannot be managed using internal controls, and there is limited capacity in the international insurance markets to transfer such risks.
We have material investments in a number of jointly controlled entities. Where we do not have managerial control, we may be unable to ensure that management will comply with our policies and standards, but we use what influence we have.
Our risk management frameworkThe responsibility for identifying, evaluating and managing risks lies with all our employees and business leaders. They operate within the Group-wide framework to manage risks within approved limits.
Our risk management framework
Oversight Board – Determines the nature and extent of acceptable risk as we pursue our strategic objectives. – Confirms that management’s risk limits reflect the level of risk the board is willing to accept to
achieve our strategic objectives. – Oversees the risk management process.
Board committees – At least once a year, the Audit Committee monitors and reviews the maturity and effectiveness of our risk management and internal control systems.
– The Audit and Sustainability Committees review regular reports from management on the strategies and controls applied to any material business risks identified within the Committees’ scope.
Third line Group Internal Audit – Provides independent and objective assurance that our risk management and internal control systems are adequate and effective.
Second line Executive Committee – Sets our risk strategy and assesses the risks inherent in key investments and in strategic, business or annual plans.
Risk Management Committee
– Oversees our risk management framework to help identify significant risks to Group-level objectives and to make sure we have effective risk management processes.
Risk function – Coordinates and supports Group-level risk management activity and reporting. – Embeds risk management into core business processes, such as planning and capital allocation. – Builds risk management capability and a risk-aware culture throughout the Group.
Other central support functions and management committees
– Provide targeted expertise and support to risk, action and control owners. – Develop and maintain specific controls, including policies, standards and procedures, to
support the effective management of material Group-level risk within the agreed limits. – Assure first line of defence compliance with controls.
First line Product groups and central functions, executive/ audit forums
– Monitor material risks and track activities to manage risk within their own business activities, escalating when appropriate.
– Consider risk and uncertainty in strategic and business planning and capital allocation proposals.
Product groups and business units
– Identify, assess and manage risks in operations, functions and projects.
Risk Community of Practice – Supports alignment, consistency and continuous improvement of risk management.
The framework also defines the oversight responsibilities of the board and the Executive Committee. Both are supported by our Risk Management Committee and central support functions, such as Risk and Group Internal Audit, to enable the effective identification, evaluation and management of risk across our business.
Our framework lays out a three lines of defence approach to managing risks and controls:
First line: employees and business leaders own risks.
Second line: our central support functions and Risk Management Committee control our risk framework and internal control systems.
Third line: Group Internal Audit assures our internal control systems.
The key risk management responsibilities throughout the Group are outlined below.
Risk management continued
Annual report 2018 | riotinto.com66

Principal risks and uncertainties
The principal risks and uncertainties outlined in this section reflect the inherent risks that could materially affect Rio Tinto or its ability to meet its strategic objectives, either directly or by triggering a succession of events that in aggregate become material to the Group.
Rio Tinto’s business units and functions assess the potential economic and non-economic consequences of their respective risks using the framework defined by the Group’s Risk standard. Once identified, each principal risk or uncertainty is reviewed and monitored by the relevant internal experts and by the Risk Management Committee and, as appropriate, by the relevant board committees and the board.
There may be additional risks unknown to Rio Tinto and other risks currently not believed to be material which could turn out to be material. A number of them, particularly those with longer-term potential impacts, are referred to in the sustainable development section of this Annual report on pages 52 to 63.
The principal risks and uncertainties should be considered in connection with any forward-looking statements in this Annual report and the cautionary statement on page 300.
Market risks
Rio Tinto operates in global markets and accepts the impact of exchange rate movements and market-driven prices for our commodities, seeking premiums where possible.
Commodity prices: inherent risk and uncertaintyCommodity prices, driven by demand and supply for the Group’s products, vary outside of expectations over time.
Exchange rate variations and geopolitical issues may offset or exacerbate this risk.
Anticipating and responding to market movements is inherently uncertain and outcomes may vary.
Risk exposure 2018 trend
Potential impact – Business model – Future financial performance – Solvency – Liquidity – Financial market reputation
OpportunitiesA rise in commodity prices, or favourable exchange rate movements, generates more cash flow from operations, enabling the Group to pursue growth options or capital expansions, pay down debt and/or increase returns to shareholders.
Capturing above-planned returns from commercial insights relating to market movements would deliver additional cash flow to the Group.
ThreatsFalling commodity prices, or adverse exchange rate movements, reduce cash flow, limiting profitability and shareholder returns. These may trigger impairments and/or impact rating agency metrics. Extended subdued prices may reflect a longer-term fall in demand for the Group’s products, and the reduced earnings and cash flow streams resulting from this may limit investment and/or growth opportunities.
Failure to deliver planned returns from commercial insights would negatively impact cash flows for the Group.
China development pathway: inherent risk and uncertaintyChina’s growth pathway could impact demand for the Group’s products outside of expectations.
Risk exposure 2018 trend
Potential impact – Business model – Future financial performance – Solvency – Liquidity
OpportunitiesStrong growth, positive policy decisions and reforms drive demand for commodities, resulting in rising prices which may justify capital expansion and increased shareholder returns in the short to medium term.
ThreatsChina is the largest market for our products, and Chinese demand is a strong driver, at times the dominant one, of the market price of the commodities we produce. An economic slowdown in China, and/or a material change in policy, could result in a slowdown in demand for our products and reduced earnings and cash flow for the Group.
Mitigating actions include: – Pursue low-cost production, allowing profitable supply throughout the commodity price cycle. – Maintain a diverse portfolio of commodities across a number of geographies. – Maintain global portfolio of customers and contracts. – Maintain a strong balance sheet. – Monitor multiple leading indicators and undertake detailed industry analysis to develop more accurate assumptions in our commodity price and
exchange rate forecasting that is used for capital allocation and planning processes, and for commercial insights. – Comply with the Group’s Treasury policy and standard, which outlines the fundamental principles that govern the Group’s financial risk management practices. – Closely coordinate market-facing sales and marketing and trading resources in the Group. – Apply strong governance reflecting relevant regulatory frameworks and jurisdictions.
Principal risks and uncertainties Annual report 2018 | riotinto.com 67
Strategic report

Strategic report
Strategic risks
Rio Tinto enforces disciplined capital allocation to the best returning opportunities (organic and inorganic growth projects) or returns to shareholders.
Execution of acquisitions and divestments: inherent risk and uncertaintyRio Tinto’s ability to secure planned value by successfully executing divestments and acquisitions may vary.
Risk exposure 2018 trend
Potential impact – Business model – Future performance – Solvency – Liquidity – Group reputation
OpportunitiesProceeds realised from divested assets are greater than planned, allowing more capital to be returned to shareholders or redeployed into higher returning or more productive uses. The Group is successful in acquiring businesses on acceptable terms that provide sustainable future cash flow and/or future growth optionality.
ThreatsDivestment and acquisition activity incurs transaction costs that cannot be recouped, or may result in value destruction by realising less than fair value for divestments or paying more than fair value for acquisitions. This could result in unforeseen pressure on the Group’s cash position or reduce the Group’s ability to expand operations. The Group may also be liable for the past acts or omissions of assets it has acquired that were unforeseen or greater than anticipated at the time of acquisition. The Group may also face liabilities for divested entities if the buyer fails to honour commitments or the Group agrees to retain certain liabilities.
Capital project development: inherent risk and uncertaintyThe Group’s ability to deliver projects successfully may vary.
Risk exposure 2018 trend
Potential impact – Future performance – HSE&C – Group reputation – Solvency – Liquidity
OpportunitiesAn ability to develop projects safely, on time and within budget enhances the Group’s licence to operate and investor confidence.
ThreatsA delay or overrun in a project schedule could negatively impact the Group’s profitability, cash flows, ability to repay project-specific indebtedness, asset carrying values, growth aspirations and relationships with key stakeholders.
Strategic partnerships: inherent risk and uncertaintyStrategic partnerships play a material role in delivering the Group’s production, cash and market positioning, and these may not always develop as planned.
Risk exposure 2018 trend
Potential impact – Business model – Future performance – HSE&C – Group reputation
OpportunitiesJoint-ventures and partnerships offer opportunities to access resources, increase shareholder returns, and reduce political and operational risks.
ThreatsJoint-venture partners may hinder growth by not agreeing to support investment decisions. For non-managed operations, the decisions of the controlling partners may cause adverse impacts to the value of the Group’s interest in the operation or to its reputation and may expose it to unexpected financial liability.
Mitigating actions include: – Complete detailed, objective due diligence on all material divestments
and acquisitions. – Resource Business Development team appropriately supported by
external specialists as required. – Involve business unit leaders early in process to recognise integration
planning and synergies, or separation threats and opportunities. – Undertake post-investment reviews on divestments and acquisitions
to identify key learnings to embed into future initiatives. – Consistently approach development of large-scale capital projects
through a specialised projects division.
– Follow rigorous project approval and stage-gating our process, including monitoring and status evaluation, as articulated in Project Evaluation Standard and guidance.
– Ensure effective stakeholder management in project development. – Approach investments and partnerships with a view to long-term
development of relationships rather than short-term transactional advantage. – Maintain strong focus on contractor management. – Actively participate within the governance structures of joint ventures
to promote, where possible, alignment with the Group’s policies and strategic priorities.
– Undertake rigorous third-party due diligence and assurance.
Principal risks and uncertainties continued
Annual report 2018 | riotinto.com68

Principal risks and uncertainties continued
Financial risk
Rio Tinto maintains a strong balance sheet and liquidity position to preserve financial flexibility through the cycle.
Liquidity: inherent risk and uncertaintyExternal events and internal capital discipline may impact Group liquidity.
Risk exposure 2018 trend
Potential impact – Future performance – Solvency – Liquidity – Group reputation
OpportunitiesFavourable market conditions and strong internal capital discipline could increase Group liquidity and/or balance sheet strength and allow the Group to pursue investment or growth opportunities, pay down debt and/or enhance returns to shareholders.
ThreatsThe Group’s ability to raise sufficient funds for planned expenditure, such as capital growth and/or mergers and acquisitions, as well as the ability to weather a major economic downturn, could be compromised by a weak balance sheet and/or inadequate access to liquidity.
Mitigating actions include: – Comply with the Group’s Treasury policy and standard, which outlines the fundamental principles that govern the Group’s financial risk
management practices. – Maintain a prudent gearing ratio and other financial metrics commensurate with a strong investment-grade credit rating. – Manage the liquidity and financing structure of the Group using forecasts and sensitivity analysis tools to actively monitor, determine and
enable access to the appropriate level, sources and types of financing required. – Subject funds invested by the Group to credit limits and maturity profiles based on board-approved frameworks to promote diversification
and maintain appropriate liquidity. – Maintain accurate financial reporting and tracking of our business performance. – Report financial performance monthly to senior management and the board. – Seek board approval of the financial strategy, long-term planning and cash flow forecasting. – Apply a shareholder returns policy which allows shareholder returns to adjust with the cycle.
Resources risks
Rio Tinto invests materially to accurately identify new deposits and develop orebody knowledge, underpinning our operations and projects.
Exploration and resources: inherent risk and uncertaintyThe success of the Group’s exploration activity may vary. In addition, estimates of ore reserves are based on uncertain assumptions that, if changed, could result in the need to restate ore reserves and mine plans.
Risk exposure 2018 trend
Potential impact – Business model – Future performance – Group reputation
OpportunitiesThe discovery of a new viable orebody can significantly improve future growth options.
The volume of ore in reported reserves/resources is based on the geological, commercial and technical information available at the date of the report that is, by its nature, incomplete. As new information comes to light, the economic viability of some ore reserves and mine plans can be restated upwards. As a result, projects may be more successful and of longer duration than initially anticipated.
ThreatsA failure to discover new viable orebodies could undermine future growth prospects.
The risk that new information comes to light or that operating conditions change means that the economic viability of some ore reserves and mine plans can be restated downwards. As a result, projects may be less successful and of shorter duration than initially anticipated, and/or the asset value may be impaired.
Mitigating actions include: – Comply with the Group’s resources and reserves standard. – Recruit and retain skilled and experienced exploration and evaluation personnel. – Provide stable funding for exploration activities. – Continually review the prospectivity of opportunities in the exploration portfolio and prioritise spend accordingly. – Utilise new technologies where appropriate. – Develop, leverage and manage third-party partnerships. – Coordinate orebody knowledge through active Group-wide leadership forum.
Annual report 2018 | riotinto.com 69
Strategic report

Strategic report
Health, safety, environment and community (HSE&C) risks
Rio Tinto’s operations are inherently hazardous. We manage responsibly to preserve our licence to operate and ensure our employees and contractors go home safe and healthy.
HSE&C: inherent risk and uncertaintyOur operations and projects are inherently hazardous with the potential to cause illness or injury, damage to the environment, disruption to a community or a threat to personal security.
Risk exposure 2018 trend
Potential impact – Future performance – HSE&C – Group reputation
OpportunitiesDelivering leading health, safety, environment and communities performance is essential to our business success. Meeting or exceeding our commitments in these areas contributes to sustainable development and underpins our continued access to resources, capital and a diverse workforce to sustain the organisation.
Good performance in closure and legacy management of closed sites can enhance our reputation and enable us to maintain access to land, resources, people and capital, so we can continue to establish new projects with the support of local communities.
ThreatsFailure to manage our health, safety, environment or community risks could result in a catastrophic event or other long-term damage which could in turn harm the Group’s financial performance and licence to operate.
Recognised hazards and threats include, among others, underground operations, pit slope instability, tailings facilities, process safety, infrastructure, vector-borne and pandemic disease, chemicals, gases, vehicles and machinery, aviation, extreme natural environments, endangered flora or fauna, areas of cultural heritage significance, water supply stress and climate change.
Mitigating actions include: – Continue focus on HSE&C as a core priority at all operations and projects, overseen by the Sustainability Committee. – Clearly define and ensure compliance with Group HSE&C strategy, policy and performance standards. – Regularly review and audit HSE&C processes, training and controls to promote and improve effectiveness at managed and (where practicable)
non-managed operations. – Monitor monthly HSE&C performance at the Group level. – Report, investigate and share learnings from HSE&C incidents. – Build safety targets into personal performance metrics to incentivise safe behaviour and effective risk management (see Remuneration report). – Develop mutually beneficial partnerships with local communities and establish appropriate social performance targets. – Report annually on performance on greenhouse gas emissions, water, land use and rehabilitation, among others. – Focus on fatality elimination through implementation of a programme to verify safety risk controls.
Principal risks and uncertainties continued
Annual report 2018 | riotinto.com70
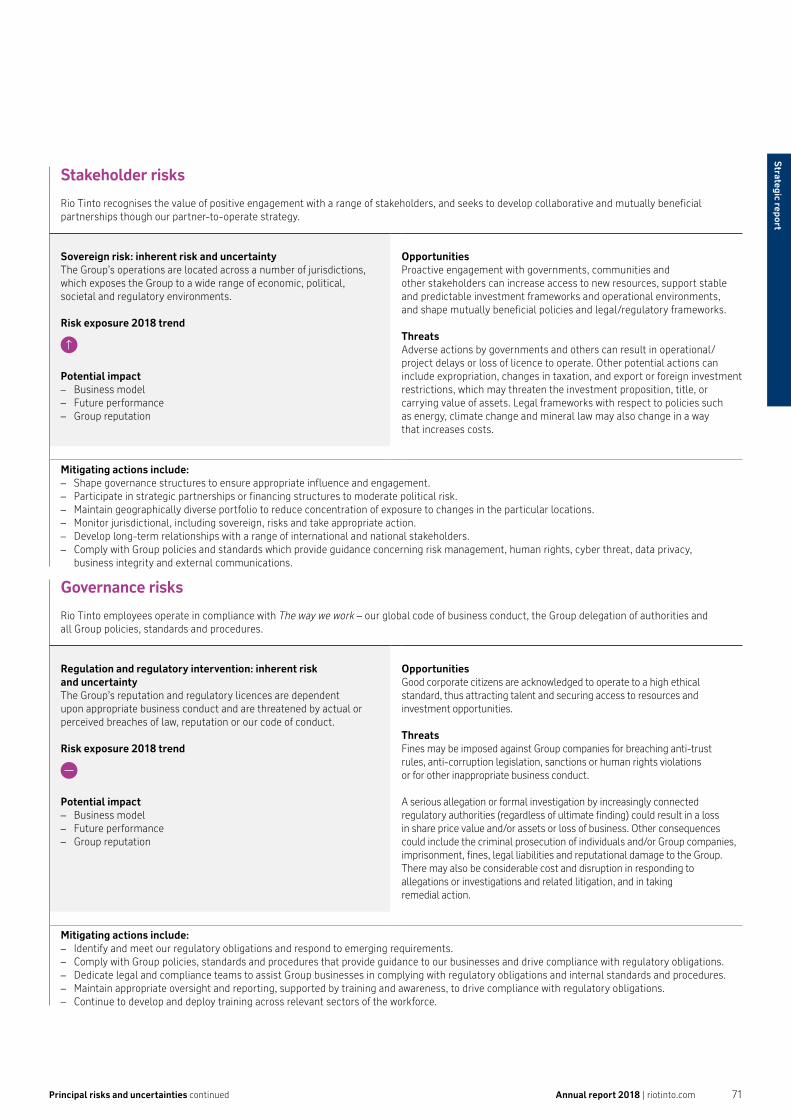
Stakeholder risks
Rio Tinto recognises the value of positive engagement with a range of stakeholders, and seeks to develop collaborative and mutually beneficial partnerships though our partner-to-operate strategy.
Sovereign risk: inherent risk and uncertaintyThe Group’s operations are located across a number of jurisdictions, which exposes the Group to a wide range of economic, political, societal and regulatory environments.
Risk exposure 2018 trend
Potential impact – Business model – Future performance – Group reputation
OpportunitiesProactive engagement with governments, communities and other stakeholders can increase access to new resources, support stable and predictable investment frameworks and operational environments, and shape mutually beneficial policies and legal/regulatory frameworks.
ThreatsAdverse actions by governments and others can result in operational/project delays or loss of licence to operate. Other potential actions can include expropriation, changes in taxation, and export or foreign investment restrictions, which may threaten the investment proposition, title, or carrying value of assets. Legal frameworks with respect to policies such as energy, climate change and mineral law may also change in a way that increases costs.
Mitigating actions include: – Shape governance structures to ensure appropriate influence and engagement. – Participate in strategic partnerships or financing structures to moderate political risk. – Maintain geographically diverse portfolio to reduce concentration of exposure to changes in the particular locations. – Monitor jurisdictional, including sovereign, risks and take appropriate action. – Develop long-term relationships with a range of international and national stakeholders. – Comply with Group policies and standards which provide guidance concerning risk management, human rights, cyber threat, data privacy,
business integrity and external communications.
Governance risks
Rio Tinto employees operate in compliance with The way we work – our global code of business conduct, the Group delegation of authorities and all Group policies, standards and procedures.
Regulation and regulatory intervention: inherent risk and uncertaintyThe Group’s reputation and regulatory licences are dependent upon appropriate business conduct and are threatened by actual or perceived breaches of law, reputation or our code of conduct.
Risk exposure 2018 trend
Potential impact – Business model – Future performance – Group reputation
OpportunitiesGood corporate citizens are acknowledged to operate to a high ethical standard, thus attracting talent and securing access to resources and investment opportunities.
ThreatsFines may be imposed against Group companies for breaching anti-trust rules, anti-corruption legislation, sanctions or human rights violations or for other inappropriate business conduct.
A serious allegation or formal investigation by increasingly connected regulatory authorities (regardless of ultimate finding) could result in a loss in share price value and/or assets or loss of business. Other consequences could include the criminal prosecution of individuals and/or Group companies, imprisonment, fines, legal liabilities and reputational damage to the Group. There may also be considerable cost and disruption in responding to allegations or investigations and related litigation, and in taking remedial action.
Mitigating actions include: – Identify and meet our regulatory obligations and respond to emerging requirements. – Comply with Group policies, standards and procedures that provide guidance to our businesses and drive compliance with regulatory obligations. – Dedicate legal and compliance teams to assist Group businesses in complying with regulatory obligations and internal standards and procedures. – Maintain appropriate oversight and reporting, supported by training and awareness, to drive compliance with regulatory obligations. – Continue to develop and deploy training across relevant sectors of the workforce.
Principal risks and uncertainties continued Annual report 2018 | riotinto.com 71
Strategic report

Strategic report
Operations, projects and people risks
Rio Tinto seeks to achieve operational and commercial excellence, and to attract and retain the best people in the industry.
Operational excellence: inherent risk and uncertaintyExcellence at our operations and projects is derived from high operational and human productivity and innovation, which requires quality people, processes and systems.
Risk exposure 2018 trend
Potential impact – Future performance – Liquidity – HSE&C – Group reputation
OpportunitiesImproved productivity and innovation from new systems can decrease costs and increase output, delivering additional cash flow.
Development and retention of talent enhances productivity, financial and HSE&C outcomes.
ThreatsBusiness interruption may arise from a number of circumstances, including: – Operational difficulties throughout the value chain, such as extended
industrial dispute, delayed development, bottlenecks or interruptions to infrastructure for power, water and transportation.
– Operational failure such as a process safety incident, major pit slope, dump or tailings/water impoundment failure or underground incident.
– Cyber breach/incident affecting commercial and operational systems. – Natural disasters such as earthquakes, subsidence, drought, flood, fire
and storm can impact mines, smelters, refineries and infrastructure installations. Some of these risks are likely to increase through the impact of climate change.
Any of these events could result in a significant HSE&C incident, an interruption to operations, the inability to deliver products or a commercial loss.
Mitigating actions include: – Preserve geographically diverse portfolio, limiting physical events/disruptions to a specific business, single infrastructure or logistical event. – Comply with slope geotechnical, tailings management, underground mining and process safety technical and safety standards, supported by
subject-matter experts and audit protocols, reducing the risk (likelihood and consequence) of operational failure. – Comply with the Acceptable use of information and electronic resources standard, supported by periodic reviews of IT infrastructure and security
controls by dedicated in-house cyber-security team. – Operate under strong human resources and employee relations framework. – Undertake business resilience planning and preparedness exercises for execution of plans across all operations.
Attracting and retaining talent: inherent risk and uncertaintyAttracting and retaining talent as the company and industry evolves presents a constant challenge.
Risk exposure 2018 trend
Potential impact – Business model – Future performance – Group reputation
OpportunitiesLeveraging the evolving company and market to attract a diverse and engaged workforce will deliver a competitive advantage to the Group.
ThreatsThe inability to attract or retain key talent will constrain the Group’s ability to reach its goals within planned timeframes.
Mitigating actions include: Continue to provide leadership and technical development opportunities. – Continue employee engagement programme and metrics. – Enhance focus on inclusion, diversity and wellbeing at all levels of the Group. – Maintain purpose, values and vision statements.
Principal risks and uncertainties continued
Annual report 2018 | riotinto.com72

Five year review
Five-year review
Selected financial data
The selected consolidated financial information below has been derived from the historical audited consolidated financial statements of the Rio Tinto Group. The selected consolidated financial data should be read in conjunction with, and qualified in their entirety by reference to, the 2018 financial statements and notes thereto. The financial statements as included on pages 144 to 243 have been prepared in accordance with IFRS as defined in note 1.
Rio Tinto Group
Income statement data
For the years ending 31 December Amounts in accordance with IFRS
2018US$m
2017US$m
2016US$m
2015US$m
2014US$m
Consolidated sales revenue 40,522 40,030 33,781 34,829 47,664
Group operating profit(a) 17,687 14,135 6,795 3,615 11,346
Profit/(loss) for the year 13,925 8,851 4,776 (1,719) 6,499
Basic earnings/(losses) for the year per share (US cents) 793.2 490.4 256.9 (47.5) 353.1
Diluted earnings/(losses) for the year per share (US cents)(b) 787.6 486.9 255.3 (47.5) 351.2
Dividends per share
Dividends declared during the year
US cents
– interim 127.0 110.0 45.0 107.5 96.0
– final 180.0 180.0 125.0 107.5 119.0
– special 243.0
UK pence
– interim 96.82 83.13 33.80 68.92 56.9
– final 135.96 129.43 100.56 74.21 78.0
– special 183.55
Australian cents
– interim 170.84 137.7 59.13 144.91 103.1
– final 250.89 228.5 163.62 151.89 153.0
– special 338.70
Dividends paid during the year (US cents)
– ordinary 307.0 235 152.5 226.5 204.5
Weighted average number of shares – basic (millions) 1,719.3 1,786.7 1,797.3 1,824.7 1,848.4
Weighted average number of shares – diluted (millions)(b) 1,731.7 1,799.5 1,808.6 1,824.7 1,858.7
Balance sheet data
Total assets 90,949 95,726 89,263 91,564 107,827
Share capital/premium 8,000 8,666 8,443 8,474 9,053
Total equity/Net assets 49,823 51,115 45,730 44,128 54,594
Equity attributable to owners of Rio Tinto 43,686 44,711 39,290 37,349 46,285
(a) Group operating profit includes the effects of charges and reversals resulting from impairments (other than impairments of equity accounted units) and profit and loss on disposals of interests in businesses. Group operating profit amounts shown above excludes equity accounted operations, finance items, tax and discontinued operations.
(b) The effects of dilutive securities has not been taken into account when calculating diluted loss per share for the year ended 31 December 2015, in accordance with IAS 33 ‘Earnings Per Share’.
Directors’ approval statementThis Strategic report is delivered in accordance with a resolution of the board, and has been signed on behalf of the board by:
Simon ThompsonChairman27 February 2019
Annual report 2018 | riotinto.com 73
Strategic report
GovernanceBoard of directors 76Executive Committee 78Chairman’s governance review 80The board in action 82Matters discussed in 2018 832018 highlights 84Evaluating our performance 86Nominations Committee report 88Audit Committee report 90Sustainability Committee report 95Compliance with governance codes and standards 97
Remuneration reportA nnual statement by the
Remuneration Committee chairman 101Remuneration at a glance 104Remuneration policy extracts 106Implementation report 113
Additional statutory disclosure 137
Directors’ report
Annual report 2018 | riotinto.com74

The world’s largest robot delivers iron ore
AutoHaul™, our first driverless heavy-haul, long-distance trains, successfully delivered iron ore from our inland mines in the Pilbara, Western Australia, to our port at Cape Lambert.
Since its first loaded run in July, we have safely and steadily increased the number of autonomous trips across our iron ore operations in Western Australia. AutoHaul™ have travelled more than 1.6 million kilometres in 2018.
AutoHaul™ improves safety by reducing risk at level crossings and through its automated responses to speed restrictions and alarms. It also eliminates the need to transport drivers to and from trains mid-journey saving almost 1.5 million kilometres of road travel each year. It also improves cycle times by using information about the train and rail network topography to calculate and deliver a safe, consistent driving strategy.
This is by far the most exciting project I’ve ever worked on from the perspective of innovation and world-first technology. It is the highlight of my career.”Lido CostaPrincipal engineer, AutoHaul™
Our autonomous trains
travelled more than
1.6 millionkilometres in 2018
Annual report 2018 | riotinto.com 75
Governance

Governance
Rio Tinto plc and Rio Tinto Limited have a common board of directors. The directors are collectively responsible for the stewardship and long-term success of the Group.
Board of directors
Simon Thompson Chairman, MA (Oxon), PhD. Age 59. Appointed April 2014; chairman from March 2018
Skills and experience: Simon has significant global experience in mining and metals, finance and corporate governance. Among a wide range of board appointments, Simon was an executive director of Anglo American plc, where he held the roles of chairman and chief executive officer of the Base Metals Division, chairman of Tarmac, and chairman of the Exploration Division. Earlier in his career he held various investment banking positions at S. G. Warburg and N M Rothschild.
Current external appointments: Chairman of 3i Group plc since 2015.
Jean-Sébastien Jacques Chief executive, MSc. Age 47. Appointed March 2016; chief executive from July 2016
Skills and experience: J-S’s strong executive leadership has driven significant growth and transformation projects at Rio Tinto. As chief executive of our Copper group from 2013, and our Copper & Coal group from 2015, he led the transformation of the product groups’ safety and cash performance. He also led two successful growth projects, Oyu Tolgoi in Mongolia and Resolution in the US.
J-S brings more than 15 years of experience in the aluminium, bauxite and steel industries to Rio Tinto.
Current external appointments: Member of the International Council on Mining and Metals and the European Roundtable of Industrialists since 2016 and 2018, respectively.
Jakob Stausholm Chief financial officer, Ms Economics. Age 50. Appointed September 2018
Skills and experience: Jakob has over 20 years’ experience in senior finance roles in Europe, Latin America and Asia. He also has deep experience of capital-intensive, long-cycle businesses, and of innovative technology and supply chain optimisation. Jakob spent six years with the Maersk Group, where his roles included group chief financial officer and executive director of the group’s integrated transport and logistics business, and group chief financial officer for the facility services company ISS A/S. He had previously spent more than 19 years with Royal Dutch Shell plc, holding a range of finance positions, including chief internal auditor.
Current external appointments: None.
David Constable Independent non-executive director, BSc. Engineering. Age 57. Appointed February 2017
Skills and experience: David has strong corporate governance, board and leadership credentials. His international experience in the engineering, construction, energy, mining and chemical sectors includes the execution of major capital projects. David was chief executive officer of Sasol Limited from 2011 to 2016, and worked with Fluor Corporation from 1982 to 2011, most recently as Group president, Operations.
Current external appointments: Non-executive director of Anadarko Petroleum Corporation since 2016 and ABB Ltd since 2015. Chairman of the Compensation Committee at ABB Ltd. Senior advisor, Cerberus Capital Management. Member of the US Business Council.
Megan Clark AC Independent non-executive director, BSc, PhD. Age 60. Appointed November 2014
Skills and experience: Megan combines expertise in the mining and metals industry with strong leadership experience in science, research and technology. Megan was chief executive of the Commonwealth Scientific and Industrial Research Organisation (CSIRO) from 2009 until 2014. She had previously held various roles with Western Mining Corporation, and was a director at N M Rothschild and Sons (Australia), and a vice president at BHP Billiton. Her commitment to sustainable development and understanding of innovation bring valuable insights to the board.
Current external appointments: Non-executive director of CSL Limited since 2016 and CARE Australia since 2015. Head of Australian Space Agency.
Dame Moya Greene Independent non-executive director, BA, LL.B. Age 64. Appointed September 2018
Skills and experience: Moya is an experienced leader in both private and public sectors who has expertise in logistics, strategic planning and complex negotiations. She was CEO of Royal Mail plc from 2010 to 2018, having formerly been president and CEO of Canada Post Corporation. Moya moved into business in 1996 having previously served in the Canadian civil service, including serving as assistant deputy minister for Transport Canada.
Current external appointments: Non-executive director of EasyJet plc since July 2017. Member of the board of trustees for the Tate Gallery and the National Gallery.
Chairman, executive and non-executive directors
Former directors who served for part of the year
Jan du PlessisJan retired as chairman and as a director with effect from 5 March 2018.
Hon Paul TellierPaul stepped down from the board on 2 May 2018.
Chris LynchChris stepped down from his role as chief financial officer on 3 September 2018, and retired from Rio Tinto on 30 September 2018.
Past external appointments over the last three yearsFor details of each director’s past appointments, see the Directors’ report on page 138.
Board committee membership key Committee chairman
Audit Committee
Remuneration Committee
Nominations Committee
Chairman’s Committee
Sustainability Committee
Annual report 2018 | riotinto.com76
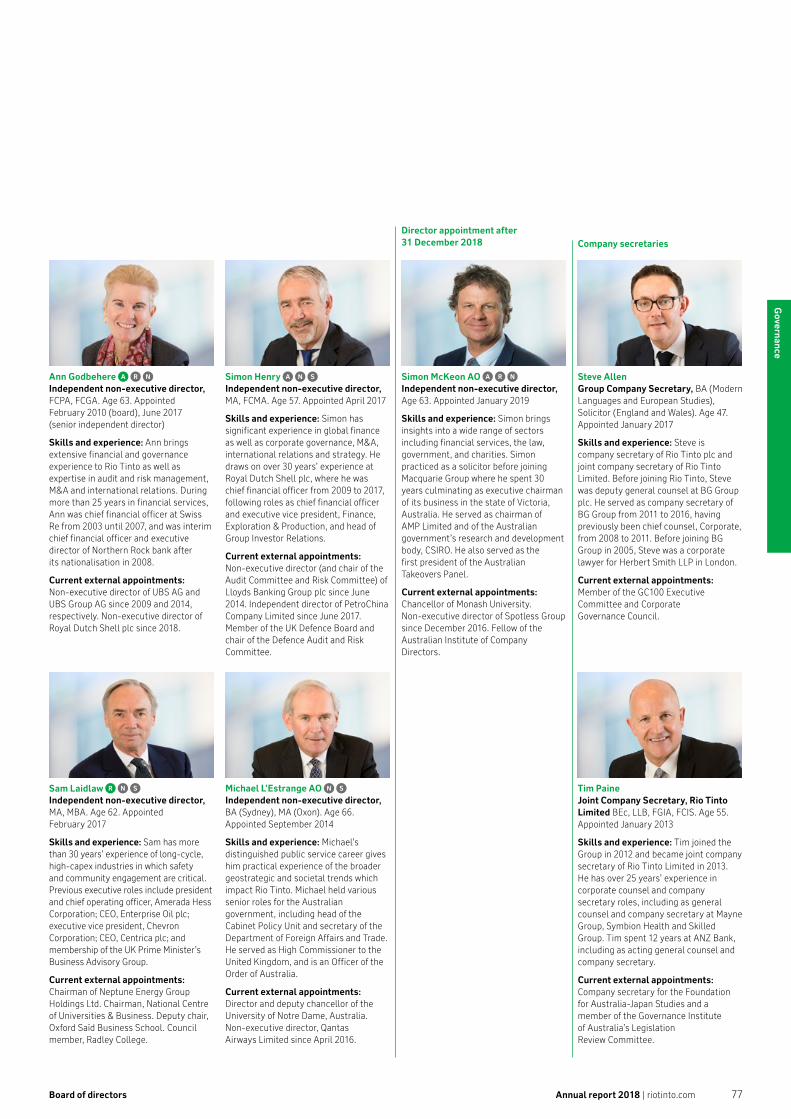
Board of directors
Ann Godbehere Independent non-executive director, FCPA, FCGA. Age 63. Appointed February 2010 (board), June 2017 (senior independent director)
Skills and experience: Ann brings extensive financial and governance experience to Rio Tinto as well as expertise in audit and risk management, M&A and international relations. During more than 25 years in financial services, Ann was chief financial officer at Swiss Re from 2003 until 2007, and was interim chief financial officer and executive director of Northern Rock bank after its nationalisation in 2008.
Current external appointments: Non-executive director of UBS AG and UBS Group AG since 2009 and 2014, respectively. Non-executive director of Royal Dutch Shell plc since 2018.
Simon Henry Independent non-executive director, MA, FCMA. Age 57. Appointed April 2017
Skills and experience: Simon has significant experience in global finance as well as corporate governance, M&A, international relations and strategy. He draws on over 30 years’ experience at Royal Dutch Shell plc, where he was chief financial officer from 2009 to 2017, following roles as chief financial officer and executive vice president, Finance, Exploration & Production, and head of Group Investor Relations.
Current external appointments: Non-executive director (and chair of the Audit Committee and Risk Committee) of Lloyds Banking Group plc since June 2014. Independent director of PetroChina Company Limited since June 2017. Member of the UK Defence Board and chair of the Defence Audit and Risk Committee.
Simon McKeon AO Independent non-executive director, Age 63. Appointed January 2019
Skills and experience: Simon brings insights into a wide range of sectors including financial services, the law, government, and charities. Simon practiced as a solicitor before joining Macquarie Group where he spent 30 years culminating as executive chairman of its business in the state of Victoria, Australia. He served as chairman of AMP Limited and of the Australian government’s research and development body, CSIRO. He also served as the first president of the Australian Takeovers Panel.
Current external appointments: Chancellor of Monash University. Non-executive director of Spotless Group since December 2016. Fellow of the Australian Institute of Company Directors.
Steve AllenGroup Company Secretary, BA (Modern Languages and European Studies), Solicitor (England and Wales). Age 47. Appointed January 2017
Skills and experience: Steve is company secretary of Rio Tinto plc and joint company secretary of Rio Tinto Limited. Before joining Rio Tinto, Steve was deputy general counsel at BG Group plc. He served as company secretary of BG Group from 2011 to 2016, having previously been chief counsel, Corporate, from 2008 to 2011. Before joining BG Group in 2005, Steve was a corporate lawyer for Herbert Smith LLP in London.
Current external appointments: Member of the GC100 Executive Committee and Corporate Governance Council.
Tim PaineJoint Company Secretary, Rio Tinto Limited BEc, LLB, FGIA, FCIS. Age 55. Appointed January 2013
Skills and experience: Tim joined the Group in 2012 and became joint company secretary of Rio Tinto Limited in 2013. He has over 25 years’ experience in corporate counsel and company secretary roles, including as general counsel and company secretary at Mayne Group, Symbion Health and Skilled Group. Tim spent 12 years at ANZ Bank, including as acting general counsel and company secretary.
Current external appointments: Company secretary for the Foundation for Australia-Japan Studies and a member of the Governance Institute of Australia’s Legislation Review Committee.
Sam Laidlaw Independent non-executive director, MA, MBA. Age 62. Appointed February 2017
Skills and experience: Sam has more than 30 years’ experience of long-cycle, high-capex industries in which safety and community engagement are critical. Previous executive roles include president and chief operating officer, Amerada Hess Corporation; CEO, Enterprise Oil plc; executive vice president, Chevron Corporation; CEO, Centrica plc; and membership of the UK Prime Minister’s Business Advisory Group.
Current external appointments: Chairman of Neptune Energy Group Holdings Ltd. Chairman, National Centre of Universities & Business. Deputy chair, Oxford Saïd Business School. Council member, Radley College.
Michael L’Estrange AO Independent non-executive director, BA (Sydney), MA (Oxon). Age 66. Appointed September 2014
Skills and experience: Michael’s distinguished public service career gives him practical experience of the broader geostrategic and societal trends which impact Rio Tinto. Michael held various senior roles for the Australian government, including head of the Cabinet Policy Unit and secretary of the Department of Foreign Affairs and Trade. He served as High Commissioner to the United Kingdom, and is an Officer of the Order of Australia.
Current external appointments: Director and deputy chancellor of the University of Notre Dame, Australia. Non-executive director, Qantas Airways Limited since April 2016.
Director appointment after 31 December 2018 Company secretaries
Annual report 2018 | riotinto.com 77
Governance

Governance
Day-to-day management of the business is delegated to the chief executive and through him to other members of the Executive Committee.
Executive Committee
Bold BaatarChief executive, Energy & Minerals
Bold has been the chief executive of our Energy & Minerals (E&M) product group since 2016. Through the development of new products and markets, a value-over-volume approach for E&M, and the successful divestment of the coal business, he has helped to drive the optimisation of Rio Tinto’s portfolio and to generate significant shareholder value. He has also refreshed the Group’s focus on Africa and driven the development of Rio Tinto Ventures, which focuses on assessing growth opportunities in the minerals and metals of the future.
Alf BarriosChief executive, Aluminium
Alf became chief executive of Rio Tinto Aluminium (RTA) in 2014. Since then, RTA has seen significant improvement on safety and strong financial performance with industry-leading EBITDA margins, and growth projects including the modernisation of the Kitimat smelter and construction of the Amrun bauxite mine. RTA continues to lead the industry on sustainability, launching the first certified low CO2 aluminium, becoming the first company certified by the Aluminium Stewardship Initiative for responsible production, and establishing Elysis, a partnership with Alcoa supported by Apple and the governments of Canada and Quebec, to further develop the world’s first carbon-free smelting technology.
Executive Committee membersThe two executive directors, Jean-Sébastien Jacques (chief executive) and Jakob Stausholm (chief financial officer), are members of the Executive Committee. Their biographies can be found on page 76.
Executive CommitteeResponsible for the delivery of strategy, annual plans and commercial objectives. Manages the financial and operational performance of the Group.
The following management committees support the chief executive in the performance of his duties:
Investment CommitteeReviews proposals on investments, acquisitions and disposals. Approves capital decisions within delegated authority limits, and otherwise recommends matters for approval to the board, where appropriate.
Risk Management CommitteeOversees the management and mitigation of the principal risks that could materially impact the Group’s business objectives and exceed its risk tolerances.
Ore Reserves Steering CommitteeResponsible for standards and control procedures in the ore reserves estimation and disclosure process. Ensures that these are effective in meeting internal objectives and regulatory requirements.
Disclosure CommitteeOversees the identification of inside information and its public disclosure, including processes to ensure such disclosure is accurate and timely.
Closure CommitteeOversees the process and controls designed to manage the material risks related to rehabilitation, closure and legacy operations.
Jean-Sébastien JacquesChief executive
Jakob StausholmChief financial officer
Annual report 2018 | riotinto.com78

Executive Committee
Vera KirikovaHuman Resources Group executive
Vera was appointed Group executive, Human Resources, in 2017. She has led the development of a robust people-strategy, aligned to our business strategy, and the delivery of an award-winning leadership programme. Since 2018, she has been responsible for our strategy for shaping a strong workforce for Rio Tinto’s future: this includes the development of a technical career framework, a strong talent pipeline, and a new Group-wide approach to performance. She has also been overseeing the implementation of the Group’s new operating model, which is designed to increase collaboration and efficiency.
Steve McIntoshGrowth & Innovation Group executive
Steve became chief executive of Growth & Innovation in 2016, following more than three decades of service with Rio Tinto. As chief executive, Steve has successfully applied innovative, leading-edge technical expertise to discover new ore deposits and develop them into assets – including our Amrun bauxite mine in Queensland. He is also leading our efforts to digitise operations, including through artificial intelligence and data analysis. In 2018, he led Rio Tinto’s groundbreaking White Ribbon accreditation initiative, which supports employees who are victims of family or domestic violence.
Arnaud SoiratChief executive, Copper & Diamonds
Arnaud was appointed chief executive of our Copper & Diamonds (C&D) product group in 2016. Under Arnaud’s leadership, C&D has progressed its growth projects and focused on operational excellence, productivity improvement and cost reduction, deploying lean manufacturing to help achieve them. The resulting strong value creation has enabled the business to self-finance its growth and stay free-cash-flow positive. The payment of strong dividends from Escondida and the sale of our participation in Grasberg – both non-managed assets – have also created substantial value for our shareholders.
Philip RichardsGroup General Counsel
Philip was appointed Group General Counsel in April 2017 after taking on the role from December 2016 on secondment from Freshfields. Alongside leading our legal teams around the world, Philip oversees a range of governance functions including the Company Secretariat, Ethics & Integrity, and Technical Evaluation Group. His work to reinforce governance includes overseeing the formation of a specialist legal team to support our expanding Commercial group, the transformation of the Group’s risk function, and the creation of an integrated assurance office to coordinate all our second line assurance activity.
Simone NivenCorporate Relations Group executive
Simone was appointed Group executive, Corporate Relations, in 2016. Simone has played an important role in developing our vision of partnership – which mitigates risk while delivering sustained value to our assets and society. She also led the development of integrated market and regional country strategies which align both with business and Group priorities. In 2018, Simone led the development of our new approach to environmental, social and governance performance, which was launched in October 2018 with the board’s ESG Investor Seminar.
Simon TrottChief commercial officer
Simon was appointed chief commercial officer in 2017 in order to establish and lead our Commercial group. Commercial works with our product groups to grow value across customer and supplier chains. To establish Commercial, Simon managed the integration of sales and marketing, marine and logistics, and procurement activities into one organisation. This included linking Commercial activities in the Singapore hub with new consolidated satellite offices in Chicago and Frankfurt, and other Commercial offices globally, and building a team focused on growing value through capability building, digitalising key processes, and step-out commercial activities.
Chris SalisburyChief executive, Iron Ore
Chris has been chief executive of our Iron Ore product group since 2016. Over this time, Iron Ore has consistently delivered strong operational and cost performance. It has also led in innovation: including the development of the world’s largest robot – a driverless train up to 2.4 km long – and developing plans for the construction of Koodaideri, the world’s first intelligent mine. At the same time, Chris has focused on reskilling, retraining and reshaping the Iron Ore workforce to be ready for the future, and made improving safety and wellbeing across Iron Ore a personal and business priority.
Joanne FarrellHealth, Safety & Environment Group executive
Joanne was appointed Group executive, Health, Safety & Environment in July 2016. She has driven projects aimed at improving the Group’s hazard control frameworks while simplifying the paperwork burden on frontline employees. Joanne has also championed fitness-for-work initiatives and support for mental wellbeing. As managing director, Australia, she has helped drive our diversity and inclusion agenda and secure our White Ribbon accreditation, which recognises workplaces taking active steps to stop violence against women. Joanne draws on more than 35 years’ experience of the mining industry.
Annual report 2018 | riotinto.com 79
Governance
Governance
At the core of our approach to corporate governance is the need to ensure the long-term, sustainable success of your company. Our success enables us to invest in the future, to meet our obligations to our employees, our customers, our suppliers, our local communities and our host governments, as well as generating superior returns for our shareholders.
As a mining company, we are acutely aware of the broader impact that our business has on our many stakeholders and the wider responsibilities that this brings.
All businesses exist at the will of society, but mining companies are particularly dependent upon maintaining the goodwill of their host communities and governments, because mining projects typically involve large upfront capital costs with long pay-back periods. You cannot relocate a mine, so when we invest, we do so for the long term. But we also recognise the need to balance the inherently long-term nature of our business with the shorter-term imperatives of many of our stakeholders.
Through effective corporate governance, your board seeks to embed and sustain a culture that will enable Rio Tinto to fulfil its purpose and achieve its long-term strategic objectives, by building durable partnerships and upholding its core values of safety, teamwork, excellence, respect and integrity. But we also acknowledge our limitations. We know that the culture and reputation of Rio Tinto depends upon the day-to-day behaviour of every single one of our 47,500 employees and 100,000 contractors around the world. We seek to influence that behaviour through training and communication of our purpose, strategy and values, by recruiting and promoting executives who lead by example, and above all, by trying to create an environment where everyone feels empowered to speak up when things go wrong.
In the pages that follow, we set out how our corporate governance arrangements work, and how we have developed them over the course of the past year to link with wider developments within the Group and across our industry.
Chairman’s governance review
We have changed how we are reporting this yearWe have changed the structure of our reporting around Governance this year to make the information more accessible. The main body of the report sets out the key activities of the board of directors in promoting effective governance during 2018.
We have created a separate compliance section, set out on pages 97 to 100, which describes how we have complied with the: – UK Corporate Governance Code (2016 version) (the
Code), focusing on the application of the principles – ASX Corporate Governance Council’s Corporate
Governance Principles (3rd edition) (the ASX Principles)
Both the UK and Australian frameworks contain a set of principles. While it is not mandatory to comply with all the provisions, any non-compliance must be disclosed and explained.
In addition, Rio Tinto plc is a foreign private issuer (FPI) with American Depositary Receipts (ADRs) listed on the New York Stock Exchange (NYSE). There are differences between the approach that is recommended by the principles we follow, as set out by the Code and the ASX Principles, as compared with the NYSE listing standards. Therefore, as required under the NYSE listing standards, we also report any significant corporate governance differences from these standards – please see page 97.
Through effective corporate governance, your board seeks to embed and sustain a culture that will enable Rio Tinto to fulfil its purpose and achieve its long-term strategic objectives.”
Annual report 2018 | riotinto.com80

Chairman’s governance review
Changes to the boardIn our succession planning, we aim to bring a diverse and complementary range of skills, knowledge and experience to the board, so that we are equipped to navigate the operational, social, regulatory and geopolitical complexity in which our business operates. Achieving the right blend of skills and diversity to support effective decision-making is a continuing process. Further details of our succession planning are set out in the Nominations Committee report on pages 88 and 89.
During the year, there were a number of changes on the board. We welcomed Moya Greene and Simon McKeon as new non-executive directors. They bring valuable business expertise and a deep knowledge of Canada and Australia, respectively. We said farewell to Jan du Plessis, who retired as chairman in March, Paul Tellier who stepped down as non-executive director in May, and Chris Lynch, who retired as executive director and chief financial officer in September. Chris was succeeded by Jakob Stausholm, previously at Maersk and Shell, who has spent the past few months visiting many of our operations and major shareholders.
At the Rio Tinto Limited Annual General Meeting (AGM) in May 2019, Ann Godbehere will step down as senior independent director and chair of the Audit Committee. Sam Laidlaw will succeed her as senior independent director, and Simon Henry will succeed her as chair of the Audit Committee. I would like to thank Jan, Paul, Chris and all the current directors for their support, commitment, insights and wise counsel during my first year as chairman.
Over the past year, I have met shareholders, employees, customers, suppliers, government officials and civil society representatives across four continents. I look forward to meeting many more of our shareholders at our AGMs in April and May 2019, in London and Perth respectively.
Simon ThompsonChairman27 February 2019
External contextWe face significant geopolitical uncertainties, particularly on trade. The markets for many of our products are growing relatively slowly, and there are rising inflationary cost pressures. In this context, our short-term priority continues to be the safe, continuous improvement of our operating and capital efficiency, driving increased productivity from mine to market.
But the board is also focused on the longer-term challenges and opportunities that face our company. New technology is transforming our industry, helping us to extract valuable resources more efficiently and effectively. We need to ensure that our workforce has the skills and capabilities to respond to this rapid technological change.
People’s expectations about the role of business in society continue to rise, and we must respond. Mining has a profound impact on wider society, both positive and negative. We produce materials essential to human progress, create jobs, pay taxes, and contribute to the social and economic development of our host nations. But our activities also have environmental and social impacts – at the local, regional and global scale – that must be managed responsibly.
Over the past year, we have revised and updated our approach to environmental, social and governance (ESG) risks to meet these challenges and to ensure that ESG considerations are fully integrated into our strategic and operational decision making. At the heart of our ESG strategy is a recognition of the importance of partnerships, with customers, suppliers, local communities, civil society and governments. Our aim is to forge enduring partnerships that create mutual benefits and secure our “license to operate” over the long-term.
Annual report 2018 | riotinto.com 81
Governance
Governance
The board in action
In 2018, we took a close look at The way we work as a board and identified a series of improvements, as part of an internally facilitated board and committee evaluation.
We hope that these improvements will strengthen our strategic focus and improve both the challenge and the support that the board provides to the executive team.
Considering the right things…“ Environmental, social and
governance issues (ESG) has to be a vital focus of the board.”
We want to make sure the board is working in ways that add the most value to the business. The principal responsibilities of the board are to: – Set the Group’s purpose, values and strategy, and ensure that the
Group’s culture is aligned with these. – Appoint the executive team (including the executive directors), who
are responsible for fulfilling our purpose, upholding our values, and developing and delivering the strategy.
– Monitor the Group’s performance in delivering its strategy, including ensuring that the necessary resources are in place for the Group to meet its objectives.
– Analyse external trends, and assess the opportunities and risks that they may present.
– Establish a framework of prudent and effective controls that enables these risks to be assessed and managed.
– Engage with shareholders and other stakeholders to ensure that their views and concerns are taken into account.
Much of our work over the year has been focused on continuing to reshape the portfolio and invest in value-accretive growth, while optimising the performance of our core assets.
… at the right time…“ We have reduced the number of board
meetings, but increased their length and effectiveness.”
To ensure that we are maintaining the right balance between monitoring past performance and thinking about the future, we have developed a detailed rolling agenda for the board and its committees. We consider matters under four key pillars: the performance of the business; priority items relating to the Group’s strategy or risk profile; items requiring a board decision, such as prospective investments; and governance.
We have reduced the number of board meetings, but increased their length and effectiveness. Committee meetings now run consecutively, rather than concurrently, so that board members can attend all meetings if they wish. We have also added two dedicated strategy meetings to the annual cycle – the first to review the external environment and to identify priorities for the executive team to evaluate, and the second to make decisions.
… with the right people and insights“ We want to make sure that we are making
the decisions and judgments that matter, with the skills and information we need.”
Recognising that no board can possess all the necessary skills and experience, we aim to become more effective “conveners of expertise”, arranging site visits, presentations by internal and external experts, and other education programmes ahead of critical strategic or investment decisions. These initiatives are underpinned by an improved understanding of the capabilities of the current board. We have developed a skills and competencies matrix for the board (summarised on page 89) which has helped us to identify potential gaps and informed decisions on new appointments.
Within the wider organisation, we recognise the need to augment our existing technical strengths by developing or recruiting new skills and talent, in some cases from non-traditional sources. This in turn means that we have to adapt our culture, building on the great strengths that have served Rio Tinto so well over the past 146 years, while embracing new ideas and fresh approaches. We describe this work on page 84.
We have also stepped up our engagement with a wide range of stakeholders to ensure that their ideas and concerns are better reflected in our operational and strategic decision-making. Some of these activities are described on the following page.
Annual report 2018 | riotinto.com82

Matters discussed in 2018
Matters discussed in 2018
We set out below some of the matters which the board has considered during 2018, grouped under the new headings that we use to structure our agendas.
We have also provided case studies of the board’s work in relation to strategy, culture and values, stakeholder engagement and induction and training.
Performance Reviewed: – Causes of, and learnings from, major safety events, including the
circumstances around the three fatalities in 2018 at Sorel-Tracy in Quebec, Richards Bay Minerals in South Africa, and our Paraburdoo mine in Western Australia.
– Updates of the Group’s major capital projects, including Oyu Tolgoi (with a particular focus on the Power Agreement), Resolution, Grasberg and Richards Bay Minerals.
– Financial, operational and safety performance against KPIs. – Investor feedback.
Approved: – The Annual Plan for 2018 and endorsed the Group’s five-year
business plan 2019-2023. – The 2017 full year results and the 2018 half year results
announcements, including the 2017 final dividend, and declared the 2018 interim dividend.
Appraised the impact of investment in AutoHaul™ to date and approved additional funding to complete the project.
Conducted post-investment reviews of a number of completed projects with potential for broad future learnings across the Group.
Priority issues – Strategic/Risk Reviewed: – And confirmed the Group’s strategy at two separate strategy days in
June and September. – The Group’s new sustainability framework and draft report under
the Task Force on Climate-related Financial Disclosures guidelines. – Updates with regard to global regulatory compliance with a focus
on data privacy, anti-trust, anti-bribery and corruption and regulatory policy.
– A new country risk framework. – Material cyber security risks for the Group, and the external factors
and threats driving the Group’s cyber security strategy (the chairman, chief executive and chief financial officer also participated in a business resilience exercise based on a cyber attack).
– Endorsed the Group’s principal risks and mitigation measures.
Teach-ins Received a technical teach-in on orebody knowledge.
Hosted external speakers in May and June to discuss China.
Carried out strategic deep dives on Copper and Iron Ore.
Received: – A brief on the historical context of the Oyu Tolgoi project, and a
detailed update on its current status. – A teach in on the Ranger mine closure and rehabilitation ahead of the
visit by certain non-executive directors to the mine in November 2018. – A live demonstration of the Group’s risk management
platform, Archer.
Decisions Approved: – Disposal of the Group’s remaining coal assets in Queensland,
Australia, for a combined consideration of $4.15 billion pre tax. – $3.2 billion share buy-back programme returning the post-tax
coal disposal proceeds to shareholders, comprising approximately $2.1 billion off-market purchases in Rio Tinto Limited shares and $1.1 billion on-market purchases in Rio Tinto plc shares.
– An additional $1 billion on-market share buy-back programme of Rio Tinto plc shares.
– Sale of the Group’s entire interest in the Grasberg mine in Indonesia for $3.5 billion.
– Sale of the Group’s interest in Rössing Uranium Limited in Namibia, expected to complete in 2019.
– Bond purchase and redemption plan for up to $2.25 billion to reduce gross debt.
– $2.6 billion investment in the Koodaideri iron ore mine in Western Australia, our most technologically advanced mine.
– Sale of the Group’s aluminium smelter at Dunkerque, France for headline proceeds of $500 million.
– Lease and sale of a wharf and land in Kitimat, British Columbia, to LNG Canada for a consideration of $0.6 billion.
Governance Approved the appointment of: – Jakob Stausholm as the new chief financial officer. – Two new non-executive directors: Moya Greene and Simon McKeon. – KPMG as external auditor for the year ending 31 December 2020,
subject to shareholder approval.Approved:
– Updated terms of reference for the board and board committees. – As part of its annual review, the Group’s tax strategy.
Reviewed: – A multi-year initiative to embed the culture-change programme
across the Group. – Results of the March and October 2018 employee engagement
surveys and the actions contemplated by management in response.
Received updates from the Investigations Committee on the ongoing investigation and proceedings in relation to our historical issues in Guinea and Mozambique.
Discussed the board performance evaluation results and agreed practices and priorities for the coming year.
Considered corporate governance and regulatory developments for the UK, Australia and the US, including the new Code.
Annual report 2018 | riotinto.com 83
Governance

Governance
Defining our culture, values and behavioursWe need to prepare Rio Tinto for sustainable success in an era that we anticipate will be characterised by significant societal shifts. To ensure that Rio Tinto continues to pioneer progress in mining and metals in the 21st century we need to develop a culture that is more open, agile and collaborative.
To this end, we have embarked on a multi-year culture change programme, with the commitment and support of employees and leadership – including strong endorsement by both the board and Executive Committee.
2017 We started with work to sharpen our purpose and values as a company, while at the same time strengthening our code of conduct, The way we work.
2018 This year, the board has monitored management initiatives to engage employees on these issues and on our future prospects and vision as a company in a rapidly changing world. We have launched brand campaigns in Australia, Canada and Mongolia, and established a Pioneer Lab concept (Rio Tinto 4.0), which we hope will serve as an incubator for new ideas to help us tackle some of our biggest challenges and opportunities. Initiatives such as those taken to eradicate domestic violence, and the development of our sustainability framework, have helped to define our values and culture.
2019 Two important initiatives for 2019 will be the roll-out of the “Rio Tinto behaviours”, which will give expression to how we wish to see our culture and values applied.
Working with the senior management team, the board seeks to monitor culture, values and behaviours through a series of formal and informal interactions, such as site visits, town halls and the employee AGM. We also use a range of metrics including safety performance, absenteeism, staff retention and turnover rates, employee surveys, exit interviews, major breaches of The way we work, and calls to our whistleblowing programme, Talk to Peggy. This year, for example, 679 incidents were reported either through Talk to Peggy, compliance managers or team leaders. Of these, 53% related to human resource issues; 23% to business integrity matters; and 7% to health, safety or environmental matters.
As part of our review of culture, during 2019, the Remuneration Committee will consider whether the safety, business and financial targets we use may inadvertently create unintended incentives or behaviours.
Two-stage strategy processFor the first time this year, we dedicated two complete meetings in the annual cycle of board activity to our strategy.
Step 1 At our first session in June, we reviewed progress over the preceding six months, analysed the external context and identified strategic priorities requiring further investigation.
Step 2 At our second session, in September, we took decisions on the priorities identified in the June session.
The board agreed the following strategic priorities: – Continuing the drive towards greater productivity, with an increased focus
on digital enablers. – Continuing to strengthen our partnership with China, with a stronger
focus on industrial and environmental collaboration, including through the Belt and Road Initiative.
– Continuing to increase the resilience of our portfolio with a focus on Tier 1 assets and balance sheet strength.
– Identifying emerging supply and demand gaps in the various commodity markets, and pursuing opportunities for growth and differentiated product offerings.
– Responding to changing societal expectations, including an increasing ESG focus (both internally and externally), and a renewed commitment to stakeholder engagement.
– Positioning Rio Tinto as part of the solution to climate change through our differentiated product portfolio, increasing the climate change resilience of our assets and the development of a feasible pathway towards decarbonisation of the business by 2050.
At the meetings, the board used a framework to assess external growth options and considered the organic growth pipeline including exploration.
Deepening board members’ skills and knowledge This year, we have enhanced training and development for board members by introducing a programme of teach-ins and deep dives to complement our schedule of site visits and to build experience and understanding of the business and local operating conditions. We have also begun to tailor individual site visits so they are more relevant for directors’ committee responsibilities and sought to integrate the timing of visits to complement upcoming board decisions.
Enhancing transparency
The board recognises the need for greater transparency on issues of concern to stakeholders. During the year we have approved: – The publication of the company’s annual assessment of compliance
with the Voluntary Principles on Security and Human Rights. – A new contract and tax transparency policy. – A global statement recognising the importance of maintaining an
open and vibrant space for civil society. – A report on our membership of industry associations, setting out
where their policy positions on climate change differ from ours. – Our first report under the TCFD recommendations. – A new policy on inclusion and diversity, jointly owned by the
board and the Executive Committee.
2018 highlights
“Meeting with the Strategy team in preparation for the September strategy session with the board helped me to gain a deep and immediate understanding of the strategic drivers of the mining industry and the opportunities that lie ahead for Rio Tinto.
But to really understand our business, you need to see our assets and people first hand. In the four months to the end of 2018, I visited 22 assets, offices and projects, in nine countries across four continents. These visits allowed me time to begin to understand the operational complexity of our assets, how they do business locally, and how this contributes to their financial performance.”
Jakob StausholmChief financial officer
Annual report 2018 | riotinto.com84

Engaging with a wide range of stakeholdersRio Tinto has long recognised that effective management of stakeholder relations is a strategic imperative. In the 1980s, for example, Rio Tinto pioneered land agreements with Traditional Owners in Australia, and in the late 1990s, we championed the Mining, Metals and Sustainable Initiative that gave rise to the International Council on Mining and Metals and helped to reset relations between the industry, local communities and civil society. We therefore welcome the focus on stakeholder engagement in the Financial Reporting Council’s revised UK Corporate Governance Code.
During the year, we developed our response to the Code’s new emphasis on purpose, values and culture (see page 84), and discussed the most effective means of further enhancing engagement with our host communities and governments, employees, customers and suppliers.
Major institutional and retail investorsIn addition to our ongoing engagement with major institutional and retail investors, including at our two AGMs in 2018, we held investor seminars in October in London and in November in Sydney that focused specifically on ESG issues.
ESG analysts At the seminars, around 50 ESG analysts from some of our largest investors heard updates from the chairman, chief executive and our committee chairs on our ESG strategy and priorities. A panel session gave analysts the opportunity to ask questions and raise the emerging issues and trends they considered relevant to Rio Tinto.
Civil society and investor groupsThe chairman also hosted two roundtable discussions in Melbourne and Washington with civil society and investor groups. These helped to inform a number of decisions that were taken during the year relating to our environmental and social performance and disclosure, as well as our ongoing engagement plan with relevant stakeholders. They also provided valuable input to the process of refreshing and updating our sustainability strategy.
Our employeesIn November, we held our first employee AGM, at which more than 500 colleagues joined the board and Executive Committee in Brisbane for an interactive panel discussion. Employees posed questions on subjects including risk, growth, productivity, climate change, sustainability, safety, graduate recruitment, culture, and our reputation. Afterwards, employees had the chance to meet the board informally while exploring a number of “pop-up” stalls showcasing some of the innovative work under way around the business. The event was webcast to other Rio Tinto locations, and subsequently posted on our internal portal, where it was viewed by approximately 1,000 employees. In 2019, we plan to hold our employee AGM in Montreal.
>500Employees attended our first employee AGM in Brisbane
2018 highlights
Seeing the full picture: mine closures
Mine closures have a significant impact on the workforce, local communities, and the environment. Managing the closure and remediation of assets responsibly is therefore a key focus for the Group, and it is essential that the board has an in-depth understanding of the issues involved.
This year, our work to understand the closure of the Ranger uranium mine in the Northern Territory, Australia, owned by Energy Resources of Australia (ERA), which is 68% owned by Rio Tinto, demonstrates our focus on responsible closure as well as the board’s approach to developing its knowledge and understanding of key issues.
At our October 2018 board meeting, members took part in a teach-in on ERA covering the history of its operations, stakeholders, governance and regulatory environment and progress of the Ranger Closure Feasibility Study. We also discussed Rio Tinto’s role in assisting ERA to deliver the rehabilitation of the Ranger mine so it can be incorporated into the Kakadu National Park.
In November, members of the Sustainability Committee visited ERA to obtain a first-hand understanding of closure planning and execution. The lessons learnt have application to a number of upcoming mine closures.
Supporting new appointments
Induction processes for new board members and new appointments help to ensure the board has the right balance of skills. This year, we appointed two new non-executive directors, Moya Greene and Simon McKeon, a new chief financial officer, Jakob Stausholm, and a new chairman (but existing board member), Simon Thompson.
Simon Thompson’s induction process included shareholder meetings in the UK, Australia and China, site visits to several of our key operations, participation in the senior leader conference in Beijing, and meetings with other stakeholders in the UK, Australia and the US. Tailored induction programmes have also been prepared for Moya Greene and Simon McKeon.
Jakob’s induction was supported by a comprehensive library of key recent internal reports, memos and presentations cutting across all commercial, operational and functional areas of the Group, site visits, and meetings with senior leaders across the business and with investors and other stakeholders including in the UK and in Australia.
Annual report 2018 | riotinto.com 85
Governance

Governance
Evaluating our performance
Evaluating our performanceAn effective board depends on the personal development of individual directors and continuous improvement in the operation of the board as a whole. We measure our performance each year by carrying out a formal annual review of the board, its committees, the chairman and individual directors.
In 2018, we engaged the specialist corporate advisory firm Lintstock to conduct an evaluation. The evaluation covered board composition; oversight of strategy and risk; oversight of culture, values and key stakeholders; understanding of the external environment; board dynamics; management of meetings, including time allocation and board support; quality of management information on performance and investment decisions; risk management; personal development and training; and future priorities. Lintstock is a specialist corporate advisory firm with no other connection to Rio Tinto.
The board and committees have reviewed and discussed the evaluation and agreed an action plan, summarised below. Overall, respondents agreed that the performance of the board has improved since the last board review, and observed a steady improvement in board dynamics.
In 2019, we will hold an externally facilitated evaluation with Lintstock to provide fresh insights into the continuous improvement of board performance. As part of that process, in addition to the usual interviews of board members, Lintstock will interview the executive management team, the auditors and the Group company secretary.
Individual assessmentsThe chairman is responsible for evaluating the performance of non-executive directors. In 2018, he met each non-executive director to review their views on and contribution to the board, as well as their training requirements.
The non-executive directors, led by the senior independent director, are responsible for the performance evaluation of the chairman. The senior independent director met with the non-executive directors and, separately, the executive directors to gather feedback to provide to the chairman on his performance.
Topic 2018 progress Further action
Board composition The appointments of Moya Greene and Simon McKeon bring relevant business expertise and enhance the Canadian and Australian representation on the board.
Planning was undertaken to identify successors for the roles of senior independent director and chairman of the Audit Committee.
Update succession plans for the chief executive and chief financial officer.
Continue to refresh the board while increasing diversity, targeting skills and experience in government relations; finance; technology and data analytics; and relevant sector expertise.
Strategic oversight The involvement of the board in strategy, the clarity of the Group’s strategy and the communication of strategy externally were positively rated, as was the board’s oversight of strategic implementation.
The board will continue to focus on the following strategic priorities in 2019: – Productivity – Growth – China – Building organisational capacity and capability and driving cultural change.
The chief financial officer will also consider an enhanced framework of financial metrics against which the board can analyse and stress test strategic options, new investments and business plan scenarios.
Further work will be carried out to conduct multi-year analysis of product groups and assets as part of ongoing strategic reviews.
Board reporting Overall, the quality of board documentation received a positive rating, with papers generally viewed as well written and clear.
Work to be undertaken to create a template for board and committee papers to provide greater brevity, clarity and consistency for papers.
Stakeholders Greater use of external speakers.
Increased and more effective engagement with employees, investors and civil society groups on strategic issues including ESG.
The board’s understanding of customers and suppliers received a mixed response.
At the strategy meeting in September, the board received a report from one of its financial advisers on the investor community’s perception of the board and the Group’s strategy, culture, principal risks and opportunities, and business and financial performance.
The board’s forward agenda of business includes plans for customer/supplier representatives to present at board meetings and for the results of a customer and supplier survey to be considered. Additional customer/supplier research findings are also to be considered.
The board and its committees will continue to utilise external speakers and subject-matter experts to enhance understanding of issues such as China, climate change and the energy transition.
Further workforce engagement initiatives will seek to build understanding, across different jurisdictions, of employee attitudes to work practices and to the company in general.
Further “outside in” views of the company, including from investor-relations advisers.
Site visits to include more opportunities for board members to meet local government officials and community leaders.
Annual report 2018 | riotinto.com86

Evaluating our performance
Directors’ attendance at scheduled board and committee meetings during 20181
Committee appointments Board Audit Nominations Remuneration Sustainability Chairman’s
Annual general meetings
Chairman and Executive directors
Jan du Plessis – retired 5 March 2018 2/2 2/2 3/3 3/3
Simon Thompson – appointed chairman on 5 March 2018 9/9 2/2 8/8 5/5 8/8 2/2
Jean-Sébastien Jacques 9/9 9/11 2/2
Chris Lynch – retired 3 September 2018 6/6 9/9 2/2
Jakob Stausholm – appointed 3 September 2018 3/3 2/2
Non-executive directors
Megan Clark 9/9 8/8 5/5 5/5 2/2
David Constable 9/9 5/5 8/8 2/2 2/2
Moya Greene – appointed 17 September 2018 3/3 2/2 2/2 1/1
Ann Godbehere 9/9 7/7 8/8 5/5 2/2
Simon Henry 9/9 7/7 7/82 2/2 2/2
Sam Laidlaw 9/9 8/8 2/2 5/5 2/2
Michael L’Estrange 9/9 8/8 5/5 2/2
Paul Tellier – retired 2 May 2018 3/4 2/2 3/4 3/4 1/2
1 Outside of the scheduled meetings of the board and committees for 2018, certain ad hoc meetings took place to consider more urgent matters. 2 Simon Henry was unable to attend a Nominations Committee meeting due to a prior commitment.
Our plans and priorities for 2019
The board identified the following focus areas for 2019:
Focusing on strategy and growth options – – continue to consider the Group’s 3- to 5-year strategy against a
number of different external scenarios and a maturing financial framework.
– seek to identify appropriate growth options for the business, while maintaining our disciplined approach to capital allocation.
Operational efficiency and closure – – monitor the Group’s productivity performance. – ensure we capture the experience and understanding gained from
closure and rehabilitation work at ERA (as well as Argyle and Diavik) to inform future planning for the closure of our more mature assets.
Supporting management – – support the continued on-boarding of the newly appointed
chief financial officer. – continue to enhance relations between executive and non-executive
members of the board, creating an informal, challenging but supportive environment.
– provide support and advice on Group initiatives and emerging issues, including community engagement models, strategic scenario planning, digitalisation and the Group’s technology strategy.
Culture, capacity and capability – – continue to enhance the board’s oversight of culture and behaviours. – ensure that the Group has the organisational capacity and capabilities
to deliver its strategic objectives. – review the executive and senior management talent pipeline and
succession plans.
Stakeholder engagement – – improve the board’s understanding of key customers and suppliers. – continue to formalise mechanisms to hear the views of the Group’s
workforce, and to shape decision-making accordingly.
Training and development – – continue to enhance the board’s knowledge of Asia, and China
in particular. – conduct deep dives into the Group’s commercial (marketing, logistics
and procurement) activities and our aluminium product group.
Annual report 2018 | riotinto.com 87
Governance

Governance
The Nominations Committee seeks to ensure that the board has the right mixture of skills, experience and background to enable it to identify and respond appropriately to current and future opportunities and challenges. It reviews the composition of the board and makes recommendations to the board as part of the succession planning for both non-executive and executive directors. It also approves proposals for appointments to the Executive Committee and monitors the succession plans and talent pipeline for Executive Committee members and their direct reports.
Simon ThompsonNominations Committee chairman27 February 2019
Building an inclusive cultureRio Tinto is committed to promoting behaviours that support an inclusive and diverse workplace and that reflect our values of safety, teamwork, respect, integrity and excellence. This commitment is set out in our global code of conduct, The way we work.
The board aims to lead by example and recognises that it has an important role to play in creating an environment in which all contributions are valued, different perspectives are embraced, and biases are acknowledged and overcome. The board shares ownership with the Executive Committee of the Group’s inclusion and diversity policy, which can be found on the Group’s website at riotinto.com/publicationsandpolicies.
Membership of the CommitteeAll non-executive directors are members of the Nominations Committee. The chief executive and the Human Resources Group executive are invited to attend all or part of most meetings.
Appointments to the board – our approachWe base our appointments to the board on merit, and on objective selection criteria, with the aim of bringing a range of skills, knowledge, and experience to Rio Tinto. This involves a formal and rigorous process to source strong candidates from diverse backgrounds and conducting appropriate background and reference checks on the shortlisted candidates. We aim to appoint people who will help us to address the operational and strategic challenges and opportunities facing the company now and in the future, and to ensure that our board is diverse in terms of gender, nationality, social background and cognitive style.
We believe that an effective board provides a range of perspectives, combining the experience of directors who have developed a deep understanding of our business over several years with the fresh insights of newer appointees. Our board composition should also reflect the global nature of Rio Tinto’s business: currently four different nationalities are represented, including significant representation from our major countries of operation. The key skills and experience we consider most relevant to the board are set out on page 89.
Increasing female representation The Group has set measurable gender diversity objectives for the composition of senior management and graduate intake. In 2018, gender balance increased slightly from 22.4% to 22.6% within senior management (against a target of 24.4%) and the graduate intake was 36% (against a target of 50%). The number of women in operations roles increased from 5% to 15%. For the total employee population, gender balance decreased slightly from 18% to 17.7%. As a Committee, we have reviewed and endorsed the gender diversity objectives for 2019, and we will monitor progress on the programmes and initiatives designed to achieve them. Further information with regard to the performance against the targets set for 2018 and on our 2019 objectives can be found on page 54.
Currently, 27% of our board members are women. We only engage executive search firms who have signed up to the Voluntary Code of Conduct on diversity best practice, and we require that all long lists should include suitably-qualified female candidates. We will increase female representation on the board as vacancies arise, with a longer-term ambition for one-third of our board members to be women.
We apply a similar approach to our Executive Committee, which is currently one quarter female, and includes eight different nationalities. The board endorses the recommendations set out in the Hampton Alexander review, an independent review body focused on increasing the number of women on FTSE350 boards. The board supports management action to strengthen the pipeline of senior female executives within the business and to ensure that there are no obstacles to women succeeding at the highest levels within Rio Tinto.
Nominations Committee report
Annual report 2018 | riotinto.com88

Skills and experience of the chairman and non-executive directorsSubject -matter
expertKey
strengthSignificant experience Total
Business leadership Sustainable success in business at a senior executive level. – 3 4 7
Capital projects Experience working in an industry with projects involving large-scale long-cycle capital outlays. 1 2 3 6
Financial Proficiency in financial accounting and reporting, corporate finance and internal controls, corporate funding, and associated risks.
2 – 4 6
Mergers & acquisitions Experience in corporate transactions and actions and joint ventures. – 4 –─ 4
Global experience Experience in multiple global locations, exposed to a range of political, cultural, regulatory and business environments.
– 7 1 8
Corporate governance Experience with a major organisation that demonstrates rigorous governance standards. – 4 4 8
Government and International relations
Interaction with government and regulators and involvement in public policy decisions. 1 1 1 3
HSSE/ESG Familiarity with issues associated with workplace health and safety, asset integrity, environment and social responsibility, and communities.
– 4 1 5
Marketing Senior executive experience in marketing, and the development of product and/or customer management strategies.
– – 2 2
Mining Senior executive experience in a large, global mining organisation involved in the discovery, acquisition, development and marketing of natural resources.
– 2 1 3
HR/Remuneration Understanding the link between strategy, performance and remuneration outcomes. – 1 5 6
Technology/Digital A strong understanding of technology and innovation, and the development and implementation of initiatives to enhance production.
1 1 – 2
Year in reviewSuccession planningThe Committee, on behalf of the board, regularly assesses the balance of executive and non-executive directors, and the composition of the board in terms of skills, experience, diversity and capacity.
The Committee assisted in the appointment of our new executive director and chief financial officer, following Chris Lynch’s retirement in September 2018. We engaged MWM Consulting to carry out an external search and to benchmark internal candidates for the role. MWM Consulting has no other connection to Rio Tinto. From a shortlist of five candidates, members of the Committee interviewed two, and recommended the appointment of Jakob Stausholm, former chief financial, strategy & transformation officer at A.P. Moller Maersk. Jakob is an experienced and authoritative finance leader who combines nearly ten years’ experience gained as chief financial officer of two substantial global public companies in his native Denmark, with 19 years working in numerous finance positions around the world for Royal Dutch Shell.
In anticipation of Paul Tellier’s retirement as a non-executive director in May, the Committee sought to strengthen the Canadian representation on the board and was pleased to appoint Moya Greene, who brings senior public and private sector experience in both Canada and the UK. Her background and experience is set out on page 76. Moya has joined the Audit, Remuneration and Nominations Committees. Egon Zehnder International advised on this appointment. Other than work undertaken to asses the performance of senior leaders, Egon Zehnder has no other connection to Rio Tinto.
We were also keen to strengthen the Australian representation on the board, following Chris’s retirement, and were pleased to announce Simon McKeon’s appointment, with effect from 1 January 2019. Simon brings significant legal, financial and regulatory experience (see page 77) and joins Audit, Remuneration and Nominations Committees. Russell Reynolds advised on this appointment. The firm has no other connection to Rio Tinto.
Ann Godbehere will retire from the board in May 2019, after nine years of service. Sam Laidlaw will succeed Ann as senior independent director, while Simon Henry will bring his considerable recent and relevant financial experience to the chairmanship of the Audit Committee.
Nominations Committee report
Executive Committee succession planningDuring 2018, the Committee received regular presentations from the chief executive on the composition and performance of the Executive Committee. These updates included detailed consideration of the performance and development requirements of individual members of the Committee, and a review of their direct reports and other high-potential individuals who could become members of the Executive Committee in due course. The discussions included a review of the diversity of the senior management pipeline.
Changes to our committeesFollowing the appointment of Simon Thompson as chairman in March 2018, the Committee agreed a number of changes in the chairs and membership of the board’s committees: – Simon Thompson assumed the chairmanship of the Nominations
Committee and stood down as chairman of the Remuneration Committee and as a member of the Audit Committee.
– Sam Laidlaw became chairman of the Remuneration Committee. – David Constable stood down as a member of the Sustainability
Committee and became a member of the Audit Committee. – Simon Henry became a member of the Sustainability Committee.
Board re-election and board compositionDirectors are accountable to shareholders. Each director is subject to election by shareholders at the first AGMs after their appointment and then is required to seek re-election at each year’s AGMs.
In planning the composition of the non-executive part of the board, a balance must be struck between retaining a collective understanding of the company and its business with a progressive refresh of the board’s composition. The tenure of the current non-executive directors (including the chairman) is shown in the chart below:
Non-executive director tenure
50-3 years
Number of directors
33-6 years
16-9 years
Annual report 2018 | riotinto.com 89
Governance

Governance
Audit Committee report
I am pleased to report on the activities of our Audit Committee over the past year. The remit of the Committee is to assist the board in fulfilling its oversight responsibilities with regard to financial reporting and risk governance, compliance and assurance. We are also responsible for making the recommendation to the board with regard to the appointment or reappointment of the external auditors for the Group.
In June 2018, we completed the audit tender process for the Group’s external auditors, and recommended that the board should appoint KPMG as our external auditors with effect for the 2020 financial year. The board agreed, and the formal appointment will occur subject to shareholder approval, early in 2020.
In preparation, KPMG will shadow our incumbent auditors over the 2019 half-year and year-end results which will require KPMG to be independent in accordance with applicable regulations and the Group’s policy on the provision of non-audit services by the external auditor by 30 June 2019. We are currently transferring non-audit services away from KPMG, to ensure they become independent in accordance with this time frame.
We continue to have a strong relationship with PwC, who will serve as our auditors until we publish our 2019 accounts in early 2020. They have already started planning with KPMG for an orderly transition between the two firms.
Chris Lynch retired as chief financial officer in September and we would like to take this opportunity to thank Chris for his valued input and support to the Committee during his tenure as chief financial officer. We were pleased to welcome Jakob Stausholm as the Group’s new chief financial officer.
Jakob’s appointment has coincided with the implementation of the Group’s new operating model. This includes the consolidation of most of Rio Tinto’s previously diverse risk functions into a single new specialist function reporting to Jakob from January 2019. We welcome this consolidation. Risk is and will always be owned by operational management, who provide the first line of defence. A new Integrated Assurance Office, based in Brisbane, coordinates the delivery of the range of risk assurance activities carried out across the Group, collectively known as the second line of defence. The entire programme is audited by the Group’s internal audit function, who provide the third line of defence and whose head continues to report functionally to me as chairman of the Audit Committee.
We said goodbye to two valued members of the Committee during the year. In line with best practice, Simon Thompson stepped down when he became chairman of the board in March 2018. Paul Tellier retired from the board in May 2018. My thanks go to both of them for their valuable contributions. I was pleased to welcome David Constable and Moya Greene to the Committee during 2018, as well as Simon McKeon upon his appointment to the board in January 2019. They bring the combined benefits of wide business and financial experience to our deliberations. Finally, this will be my last report as the Committee chairman. I advised the board in February 2019 that, after nine years’ service, I will retire at the 2019 AGMs. The chairmanship of the Committee will pass to Simon Henry and I wish him and the other Committee members every success in the future.
Ann Godbehere Audit Committee chairman 27 February 2019
MembershipThe members of the Committee during the year and to the date of this report were:
Ann Godbehere (chairman)
David Constable (from 5 March 2018)
Moya Greene (from 17 September 2018)
Simon McKeon (from 1 January 2019)
Simon Henry
Paul Tellier (to 2 May 2018)
Simon Thompson (to 5 March 2018)
The members of the Committee are all non-executive directors. Each was, at all times, independent and free of any relationship that would affect their impartiality. You can find biographies of the current Committee members on pages 76 and 77.
As Rio Tinto’s securities are listed in Australia, the UK and the US, we follow the regulatory requirements and best practice governance recommendations for audit committees in each of these markets.
Australian listing requirementsIn Australia, the members, and the Committee as a whole, meet the independence requirements of the ASX Principles. Specifically, the Committee members between them have the accounting and financial expertise and a sufficient understanding of the industry in which the company operates to be able to discharge the Committee’s mandate effectively.
UK listing requirementsIn the UK, the members meet the requirements of the FCA’s Disclosure Guidance and Transparency Rules and the provisions of the Code relating to audit committee composition. Ann Godbehere, the current chairman, and Simon Henry, the future chairman, are both considered by the board to have recent and relevant financial experience. Ann has been a director of the company for nine years, while Simon and David Constable both have extensive prior experience of the natural resources sector. The other members have gained experience of the mining sector by serving on the board and on the Committee, and through regular site visits and ongoing deep dives into aspects of the business. The Committee as a whole has competence relevant to the sector in which the company operates.
US listing requirementsIn the US, the requirements for the Committee’s composition and role are set out in SEC and NYSE rules. The board has designated both Ann and Simon Henry as an “audit committee financial expert”. The board also believes that the other members of the Committee are financially literate by virtue of their wide business experience.
Induction for new membersTo meet our responsibilities, everyone on the Committee must understand their role. Our new members all receive a full, tailored induction. David and Moya met the Group financial controller, the heads of Group internal audit and Ethics & Integrity, and the acting head of Risk, as well as the lead audit engagement partners in the UK and Australia. They also took part in teach-ins on new accounting standards, and in a board deep dives on the process for identifying and assessing potential impairments and reversals. Simon McKeon is in the process of completing a similar programme.
Annual report 2018 | riotinto.com90
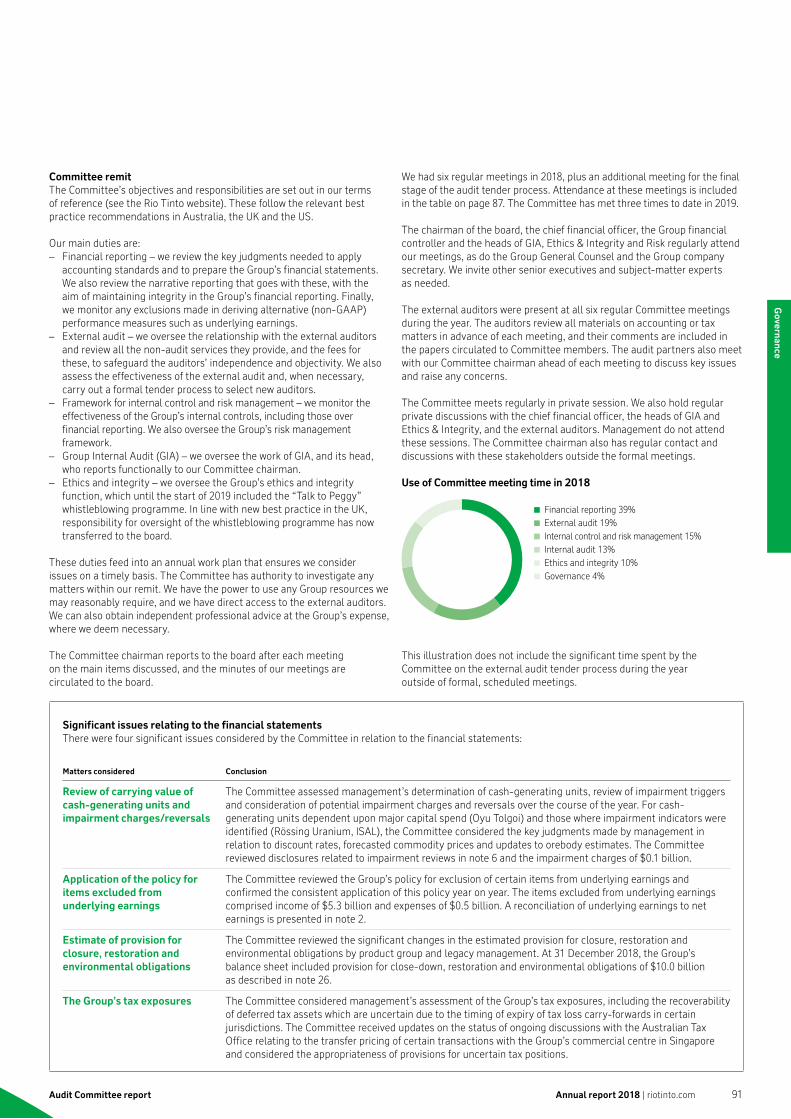
Audit Committee report
Committee remitThe Committee’s objectives and responsibilities are set out in our terms of reference (see the Rio Tinto website). These follow the relevant best practice recommendations in Australia, the UK and the US.
Our main duties are: – Financial reporting – we review the key judgments needed to apply
accounting standards and to prepare the Group’s financial statements. We also review the narrative reporting that goes with these, with the aim of maintaining integrity in the Group’s financial reporting. Finally, we monitor any exclusions made in deriving alternative (non-GAAP) performance measures such as underlying earnings.
– External audit – we oversee the relationship with the external auditors and review all the non-audit services they provide, and the fees for these, to safeguard the auditors’ independence and objectivity. We also assess the effectiveness of the external audit and, when necessary, carry out a formal tender process to select new auditors.
– Framework for internal control and risk management – we monitor the effectiveness of the Group’s internal controls, including those over financial reporting. We also oversee the Group’s risk management framework.
– Group Internal Audit (GIA) – we oversee the work of GIA, and its head, who reports functionally to our Committee chairman.
– Ethics and integrity – we oversee the Group’s ethics and integrity function, which until the start of 2019 included the “Talk to Peggy” whistleblowing programme. In line with new best practice in the UK, responsibility for oversight of the whistleblowing programme has now transferred to the board.
These duties feed into an annual work plan that ensures we consider issues on a timely basis. The Committee has authority to investigate any matters within our remit. We have the power to use any Group resources we may reasonably require, and we have direct access to the external auditors. We can also obtain independent professional advice at the Group’s expense, where we deem necessary.
The Committee chairman reports to the board after each meeting on the main items discussed, and the minutes of our meetings are circulated to the board.
We had six regular meetings in 2018, plus an additional meeting for the final stage of the audit tender process. Attendance at these meetings is included in the table on page 87. The Committee has met three times to date in 2019.
The chairman of the board, the chief financial officer, the Group financial controller and the heads of GIA, Ethics & Integrity and Risk regularly attend our meetings, as do the Group General Counsel and the Group company secretary. We invite other senior executives and subject-matter experts as needed.
The external auditors were present at all six regular Committee meetings during the year. The auditors review all materials on accounting or tax matters in advance of each meeting, and their comments are included in the papers circulated to Committee members. The audit partners also meet with our Committee chairman ahead of each meeting to discuss key issues and raise any concerns.
The Committee meets regularly in private session. We also hold regular private discussions with the chief financial officer, the heads of GIA and Ethics & Integrity, and the external auditors. Management do not attend these sessions. The Committee chairman also has regular contact and discussions with these stakeholders outside the formal meetings.
Use of Committee meeting time in 2018
Financial reporting 39%External audit 19%Internal control and risk management 15%Internal audit 13%Ethics and integrity 10%Governance 4%
This illustration does not include the significant time spent by the Committee on the external audit tender process during the year outside of formal, scheduled meetings.
Significant issues relating to the financial statementsThere were four significant issues considered by the Committee in relation to the financial statements:
Matters considered Conclusion
Review of carrying value of cash-generating units and impairment charges/reversals
The Committee assessed management’s determination of cash-generating units, review of impairment triggers and consideration of potential impairment charges and reversals over the course of the year. For cash-generating units dependent upon major capital spend (Oyu Tolgoi) and those where impairment indicators were identified (Rössing Uranium, ISAL), the Committee considered the key judgments made by management in relation to discount rates, forecasted commodity prices and updates to orebody estimates. The Committee reviewed disclosures related to impairment reviews in note 6 and the impairment charges of $0.1 billion.
Application of the policy for items excluded from underlying earnings
The Committee reviewed the Group’s policy for exclusion of certain items from underlying earnings and confirmed the consistent application of this policy year on year. The items excluded from underlying earnings comprised income of $5.3 billion and expenses of $0.5 billion. A reconciliation of underlying earnings to net earnings is presented in note 2.
Estimate of provision for closure, restoration and environmental obligations
The Committee reviewed the significant changes in the estimated provision for closure, restoration and environmental obligations by product group and legacy management. At 31 December 2018, the Group’s balance sheet included provision for close-down, restoration and environmental obligations of $10.0 billion as described in note 26.
The Group’s tax exposures The Committee considered management’s assessment of the Group’s tax exposures, including the recoverability of deferred tax assets which are uncertain due to the timing of expiry of tax loss carry-forwards in certain jurisdictions. The Committee received updates on the status of ongoing discussions with the Australian Tax Office relating to the transfer pricing of certain transactions with the Group’s commercial centre in Singapore and considered the appropriateness of provisions for uncertain tax positions.
Annual report 2018 | riotinto.com 91
Governance
Governance
Safeguarding independence and objectivity, and maintaining effectivenessIn our relationship with PwC, we need to ensure that they retain their independence and objectivity, and continue to be effective in performing the statutory audit.
Use of the external auditors for non-audit servicesThe external auditors have significant knowledge and experience of our business and of how we apply our accounting policies. That means it is sometimes cost-efficient for them to provide non-audit services. There may also be confidentiality reasons that make them the preferred choice for a particular task.
However, safeguarding their objectivity and independence as external auditors is an overriding priority. For this reason, and in line with the FRC’s Ethical Standard, the Committee ensures that the external auditors do not perform any functions of management, undertake any work which they may later need to audit or rely upon in the audit, or serve in an advocacy role for the Group.
We have a written policy governing the use of the auditors to provide non-audit services. There is an overall cap on the total fees that may be paid to the external auditors for non-audit services in any given year, being 70% of the average of the audit fees for the preceding three years. This is also in line with the FRC’s Ethical Standard. The non-audit assignments tend to fall into two broad areas: – Audit, audit-related and certain other “pre-approved” services –
this is work of a type where we know that there is no obvious threat to the auditors’ independence and objectivity, other than through the fees payable.
– Other services – these include all other non-audit services we allow our auditors to perform.
We apply different approval regimes to these areas of work. In relation to audit, audit-related and certain other “pre-approved” services, the approval is based on the fees payable: – Up to $50,000 – subject to prior notification to management, this work
can be awarded to the external auditors. – From $50,000 – $100,000 – requires the chief financial officer’s approval. – Over $100,000, and with a tender process – if PwC are successful in the
tender, their appointment requires the chief financial officer’s approval. – From $100,000 – $250,000, with no tender process – requires the chief
financial officer’s approval. – Over $250,000, with no tender process – requires the Committee’s or
Committee chairman’s approval.
In each case, the nature of the assignment and the fees payable are reported to the Committee.
For other permitted services, the chief financial officer can approve an appointment, provided the fees for the task are no more than $50,000 and the aggregate fees approved in this way do not exceed $100,000 between Committee meetings. Once this happens, or if the fee is over $50,000, the Committee or the Committee chairman must give prior approval.
At the half-year and year-ends, the chief financial officer and the external auditors report to the Committee on non-audit services performed, and the fees payable.
All of the non-audit services provided by PwC in 2018 were either within the pre-approval policies or specifically approved by the Committee. We are satisfied that the provision of non-audit services by PwC in accordance with this procedure is compatible with the general standard of independence for auditors and the other requirements of the relevant Australian, UK and US regulations.
Audit Committee report continued
Other focus areas in 2018In addition to our normal workload, the Committee focused on the following: – The tender for new external auditors, as outlined in the Committee
chairman’s introduction. Following the decision to appoint KPMG, we then oversaw the tender to appoint a new co-sourcing provider of internal audit services.
– Reviewing the new accounting standards in force for the 2018 financial statements (IFRS 9 and IFRS 15) as well as the new lease accounting standard (IFRS 16 effective 1 January 2019), and the Group’s plans for implementing them.
– Reviewing an external assessment of the effectiveness of GIA. – Reviewing the terms of reference of the Ore Reserves Steering
Committee and the control environment over the estimation of mineral resources and ore reserves.
– Monitoring the reorganisation of the existing risk functions into a new, fully integrated and coordinated assurance function, and the transfer of this to the chief financial officer.
– Monitoring the implementation of the Group operating model, as it affects the finance function.
– Reviewing the Group’s preparations for the implementation of the General Data Protection Regulation, the new data privacy framework put in place across the EU.
We also reviewed the quality and effectiveness of the Group’s internal control systems. For the first time, this was done jointly with members of the Sustainability Committee, who oversee a number of key corporate risks. This review included the effectiveness of the Group’s internal controls over financial reporting, and the Group’s disclosure controls and procedures in accordance with sections 404 and 302 of the Sarbanes-Oxley Act 2002. The Committee also received reports from GIA and PwC on their work in reviewing and auditing the control environment.
After a robust process, in early 2019, the Committee recommended to the board that the draft 2018 Annual report is, taken as a whole, fair, balanced and understandable.
Contact with regulatorsDuring the year, the Company received a letter from the FRC’s Corporate Reporting Review team in relation to the 2017 financial statements and the Oyu Tolgoi cash-generating unit. Management’s response was reviewed by the Committee chairman and discussed with the external auditors. Management has provided disclosure in Note 6 relating to the outcome of the review for impairment indicators for the Oyu Tolgoi cash-generating unit. As noted last year, the FRC’s report on their routine audit quality review of the audit of our 2016 financial statements was assessed by the Committee at a meeting in February 2018.
External auditorsEngagement of the external auditorsFor the current financial year, PwC remain our auditors. The UK entity of PwC audits Rio Tinto plc, and the Australian entity audits Rio Tinto Limited. The UK audit engagement partner, Paul Barkus, was appointed in 2016, and the Australian partner, Debbie Smith, was appointed in 2017.
This year, as usual, we agreed the scope of the auditors’ review of the half-year accounts, and of their audit of the full-year accounts taking into consideration the key risks and areas of material judgment for the Group. We also approved the fees for this work and the engagement letters for the auditors.
Annual report 2018 | riotinto.com92

Audit Committee report
Fees for audit and non-audit servicesThe amounts payable to the external auditors, PwC, in each of the past two years were:
2018$m
2017$m
Audit fees 16.7 14.3
Non-audit fees:
Assurance services 4.2 3.3
Taxation services 0.0 0.5
All other fees 0.2 0.7
Total non-audit fees 4.4 4.5
Non-audit: audit fees (in-year) 26% 31%
For further analysis of these fees, please see note 39.
None of the individual non-audit assignments were significant, either in terms of the work done or the fees payable. We have reviewed the non-audit work in aggregate. We are satisfied that neither the work done, nor the fees payable, could compromise the independence and objectivity of PwC as our external auditors.
Independence of the external auditorsPwC, as the Group’s external auditors, are required to provide a declaration to the directors in relation to their compliance with the independence requirements of the Australian Corporations Act 2001 and the professional code of conduct for external auditors. A copy of this is on page 254.
No person who served as an officer of Rio Tinto during 2018 was a director or partner of PwC at a time when they conducted an audit of the Group.
Effectiveness of the external auditorsIn February 2018, the Committee reviewed the results of the FRC’s Audit Quality Review of PwC’s audit of the 2016 financial statements. The review findings, which were not significant, have been accepted and addressed by PwC.
We further reviewed the effectiveness of PwC as auditors at our meeting in June 2018. We considered the results of a survey containing questions on PwC’s objectivity, quality and efficiency. It was completed by a range of operational and corporate executives across the business, and by Committee members. The overall rating of PwC’s effectiveness was positive and respondents perceived PwC as having an ongoing commitment to improve audit quality.
Re-appointment of the auditorsThe Committee has reviewed the independence, objectivity and effectiveness of PwC as external auditors in 2018 and in the year to date. We have recommended to the board that PwC should be retained in this role for 2019, which the board supports.
PwC have indicated that they are willing to continue as auditors of Rio Tinto. A resolution to reappoint them as auditors of Rio Tinto plc will therefore be proposed as a joint resolution at the 2019 AGMs, together with a separate resolution seeking authority for the Committee to determine the external auditors’ remuneration.
Subject to approval of the above resolution, PwC will continue in office as auditors of Rio Tinto Limited.
Risk management and internal controlsWe review Rio Tinto’s internal control systems and the risk management framework. We also monitor risks falling within our remit, especially those relating to the integrity of financial reporting. A summary of the business’s internal control and risk management systems, and of the principal risks and uncertainties we face, is in the Strategic report on pages 64 to 72.
Importantly, responsibility for operating and maintaining the internal control environment and risk management systems sits at asset level. Leaders of our businesses and functions are required to complete a representation letter each year, in which they confirm that adequate internal controls are in place, that these are operating effectively and are designed to identify any failings and weaknesses that may exist, and that any required actions are taken promptly.
Two management committees, the Executive Committee and the Disclosure Committee, regularly review reports on the Group’s control framework. The work they do satisfies the relevant requirements of the Code, the ASX Principles, the NYSE Standards and section 404 of the Sarbanes-Oxley Act 2002.
GIA runs an annual testing programme on the internal control environment, and presents its findings to the Audit Committee, Sustainability Committee and the Executive Committee.
The Audit Committee reviews the Group’s risk management framework, typically twice a year. The most recent review was in February 2019.
Audit tender processPwC have been our external auditors since before the formation of the DLC structure in 1995. While their reappointment in recent years has been subject to rigorous scrutiny by the Committee, there was no formal tender process until this year.
The Committee chairman’s introduction to this report explains the outcome of the tender which took place in the first half of 2018. It was a short, controlled and centralised process led by the Committee, and management did not provide any recommendations.
We considered tenders from Deloitte, EY and KPMG for a standalone appointment as external auditors, with an understanding that the chosen firm could be reappointed without a tender each year for up to ten years. The Committee recommended the appointment of KPMG, and this was endorsed by the board. Their appointment for the 2020 financial year is subject to the approval of shareholders at our AGMs in 2020. Planning is already underway, and there will also be a shadowing period to ensure a smooth handover from PwC.
Following KPMG’s appointment, we will continue to keep the external audit arrangements under regular review.
Annual report 2018 | riotinto.com 93
Governance
Governance
We also regularly monitor our risk management and internal control systems (including internal financial controls). We aim to have appropriate policies, standards and procedures in place, and ensure that they operate effectively.
As part of considering the risk management framework, the Committee receives regular reports from the Group financial controller, the General Counsel and the Head of Group Tax on material developments in the legal, regulatory and fiscal landscape in which the Group operates.
The board, supported by the Audit Committee, has completed its formal annual review of the effectiveness of our risk management and internal control systems. This review included consideration of our material financial, operational and compliance controls. We concluded that the Group has taken, or is taking, appropriate steps to address any failings or weaknesses identified by our internal control framework.
Internal control over financial reportingThe main features of our internal control and risk management systems in relation to financial reporting are explained on pages 140 and 141.
Internal auditProgramme structureGIA provides independent and objective assurance of the adequacy and effectiveness of risk management and internal control systems. It also may recommend improvements.
While the head of GIA reports administratively to the chief executive, appointment to, or removal from, this role requires the consent of the Audit Committee Chairman. The head of GIA is accountable to the chairmen of both the Audit and Sustainability Committees, and communicates regularly with both, attending all regular committee meetings. Our GIA team therefore operates independently of management. Their mandate is set out in a written charter, reviewed by the Audit Committee each year, with the most recent sign-off in June 2018. GIA uses a formal internal audit methodology, which is consistent with the Institute of Internal Auditors (IIAs) internationally-recognised standards.
When needed, the team brings in external partners to help achieve its goals. There is a clear policy to address any conflicts of interest, which complies with the IIA’s standards on independence. This policy identifies a list of services which need prior approval from the head of GIA.
Governance of the annual planEach year’s internal audit plan is approved by the Audit Committee and the Sustainability Committee. The plan is focused on higher-risk areas and any specific areas or processes chosen by the Committees. It is also aligned with any risks identified by the external auditors. Both committees are given regular updates on progress, including any material findings, and can refine the plans as needed.
Effectiveness of the internal audit programmeThe Audit Committee monitors the effectiveness of the GIA function throughout the year, with updates on performance at every meeting. In addition, this year the IIA-Australia conducted an independent quality assessment of GIA and the results were reported to the Committee. The findings of the current year assessment were that GIA is operating at a high level, with leading practices evident. Further, the maturity of GIA against the IIA standards was rated within the highest category of the IIA-Australia’s benchmarking scale. The assessment also provided some useful suggestions for further improvement which are being actioned. The last such assessment was completed in 2015.
The Committee conducted its own annual review in February 2019 and is satisfied that the quality, experience and expertise of GIA is appropriate for the business and that GIA was objective and performed its role effectively. We also monitored management’s response to internal audits during the year. We are satisfied that improvements are being implemented promptly in response to internal audit findings, and believe that management supports the effective working of the internal audit function.
Ethics, integrity and the whistleblowing programmeThe business has a long-established ethics programme, known as The way we work, supported by a whistleblowing programme branded as “Talk to Peggy”. Both have been relaunched in the past three years. The whistleblowing programme enables employees, in confidence, to raise concerns about possible improprieties.
The head of Ethics & Integrity attended three of our Committee meetings during 2018. His reports covered a broad range of areas, including ethics, regulatory and compliance issues. Importantly, each report included a full review of reports provided through the whistleblowing programme, and the actions that resulted.
Committee effectivenessA formal performance evaluation of the Committee took place during the year. Committee members used an online questionnaire tool to rate performance and provide commentary across a variety of areas. After considering the results of the evaluation, they decided that more time should be allocated to risk management issues including introducing the new joint session with the Sustainability Committee as highlighted earlier in this report.
Audit Committee report continued
Annual report 2018 | riotinto.com94

Sustainability Committee report
Rio Tinto’s long-term future is inextricably linked to the contribution we make: to the people we employ, the communities we work in, and the environment in which we operate.
One of our key responsibilities as a Committee is to ensure that the Group’s approach is consistent with this sense of purpose. That means embedding health, safety, asset security, environment, and community and social performance into our business strategy and tracking our progress against each. It also means reviewing how Rio Tinto assesses and manages its most material risks. Our Committee helps provide the governance, on behalf of the board, that supports the Group’s contribution to local and global sustainable development.
Our operating environment, and the expectations of our stakeholders, are always evolving. So alongside our established approach to operational and local issues, the Group considers emerging and global priorities, including the UN’s Sustainable Development Goals.
The Committee’s activities in 2018 reflect this broad outlook. We describe our work in detail in the report below – but as a snapshot, I would like to give you three examples:
The first is safety – a core priority for the Group, for me, and for everyone on the Committee. Despite the significant reduction in the Group’s all injury frequency rate at managed operations over the past ten years, the tragic loss of three colleagues in 2018 is sad evidence that we have not succeeded in eliminating fatalities from our operations. We are determined to do so. We have reviewed the circumstances of each of these events to ensure lessons were learnt, and applied across the Group. Vehicles, driving and process safety are key risks for the Group and remain areas of focus. Various initiatives are being undertaken to address these risks, including collaboration between Group Safety and Asset Management to develop possible actions.
The second is overseeing how Rio Tinto supports communities, and the local environment, when it closes an asset. This year, we visited the Ranger uranium mine operated by Energy Resources of Australia, which is 68% owned by Rio Tinto, to understand the details of the closure and rehabilitation programme there. It gave us important insights into the key issues the Group considers as it manages such closures.
The third example reflects Rio Tinto’s engagement with stakeholders on its role in a low-carbon future – a strategic priority for the board. The Committee has endorsed integrating the management of the Group’s climate change risks and opportunities into the Group’s corporate strategy. It has overseen the work being done to enable disclosures, in early 2019, in line with the recommendations of the Task Force on Climate-related Financial Disclosures (TCFD).
As these examples show, our work has a wide range, but it is driven by a common theme: promoting the long-term success of Rio Tinto, and helping ensure it is generating value for our shareholders and contributing to wider society.
Megan ClarkSustainability Committee chairman27 February 2019
MembershipThe members of the Committee during the year and to the date of this report were:
Megan Clark (chairman)
Michael L’Estrange
David Constable (to 5 March 2018)
Sam Laidlaw
Simon Henry (from 1 May 2018)
Our key responsibilitiesOur scope is to oversee, on behalf of the board, the management processes, standards and strategies designed to meet Rio Tinto’s commitments, and manage its risks, in the key areas of sustainable development. These include safety, health, environment (including water management and climate change), land access (including closure and legacy management), relationships with communities, and the human rights of employees, contractors, suppliers and others in our value chain.
The Committee has the authority and access to resources to investigate all matters falling within its terms of reference. These terms of reference are published on the Rio Tinto website, and feature a full list of our responsibilities, which include: – Reviewing the Group’s relevant policies, and overseeing the
management processes designed to ensure compliance with them. – Monitoring management’s commitment to the behaviours required
by those policies and standards. – Assessing the Group’s health, safety, security, environment and
communities framework. – Reviewing reports from management on fatalities and other serious
incidents, considering recommendations for improvement, and receiving follow-up reports on their implementation.
– Reviewing the measures for the safety component of the short term incentive plans for the executive team, and assessing performance against them, making recommendations to the Remuneration Committee as a result.
– Reviewing and approving the proposed annual plan for independent audit and assurance projects within our scope, and reviewing their outcomes and recommendations.
– Carrying out a formal review each year of the role and responsibilities of our Committee, its organisation and effectiveness, and its terms of reference.
Our year in review We met five times in 2018, covering a wide range of activities, which are summarised below.
SafetyWe were deeply saddened by the tragic deaths of three of our colleagues, at Sorel-Tracy, Quebec (April 2018), Richards Bay Minerals (July 2018) and Paraburdoo (August 2018). We reviewed the circumstances surrounding these incidents and made sure lessons were learnt from these terrible events, including risk and hazard identification and focus on leadership and engagement. Rio Tinto has completed a risk normalisation focus across the business and will be implementing common leadership coaching in 2019.
Sustainability Committee report Annual report 2018 | riotinto.com 95
Governance

Governance
As part of our other work related to safety this year, we: – Carried out deep dives into the risks and controls for the Group’s process
safety programmes, and its controls on toxic and asphyxiant gases. – Reviewed the outcomes of the Group’s 2017 short term incentive plan
in relation to safety, and the 2018 safety targets for fatalities, all injury frequency rates, and critical risk management; we also reviewed the design for the 2019 targets.
– Assessed Rio Tinto’s safety and health performance compared with peers from mining and other industries, as represented in the ICMM, and found that Rio Tinto’s safety strategy is aligned with industry best practice. Our performance on occupational illness rates matches ICMM peers.
Environment In 2017, the Committee oversaw the internal audit team’s review of the application and effectiveness of our controls in relation to our tailings and waste water facilities. In 2018, we received regular reports as part of our oversight of the subsequent targeted technical reviews of our key facilities, and of the development of improvement plans, including training on effective tailings management. In January 2019, the tragic tailings dam disaster at Vale S.A.’s Feijão Mine in Brumadinho, Brazil, served as a further reminder of the vital importance of this work, and the Committee has sought further updates on our certification and assurance processes for our tailings and waste water facilities at all current and legacy sites. Rio Tinto is contributing to the industry’s review of standards and responses to this disaster. More information on how we manage tailings from our operations is available at riotinto.com/tailings.
CommunitiesWe continued to provide oversight of the Group’s communities and social performance strategy, with a particular focus on relationships with communities and human rights, including in our supply chains.
Some of the initiatives we have overseen in relation to human rights, and the work being done to contribute to our local communities, is set out in the Sustainable development section on pages 52 to 63 of this report.
Closure and remediationAn important focus this year, was our review of the key issues involved in managing the closure and remediation of assets, including the Group’s existing legacy sites and its closure plans over the next decade. We reinforced the need to carefully manage the impact of closure with our communities, including in terms of employment, enterprise development and the environment. Our visit to the Ranger uranium mine, described in the chairman’s letter on page 6 was part of this work.
Governance and reportingEach year, we review the Group’s key risks associated with health, safety, security, environment, and community and social performance. In 2018, this included a discussion on the integration into Group strategy of the risks and opportunities presented by climate change, and a review of the Group’s reporting in this area, including our governance, scenario assessments, business resilience, risk management framework, and targets and metrics.
We also reviewed and approved the Group’s assessment of its most material sustainability topics, a process which combines feedback from internal leaders and subject-matter experts, and considers stakeholder expectations as well as an analysis of the external environment.
Our other work included: – Approving new targets for health management and water
management to take effect from 1 January 2019. – Reviewing the 2017 sustainable development report, and the sustainable
development sections of the 2017 Annual report. – Evaluating the Committee’s performance, resulting in, among other
outcomes, the Committee agreeing to assume an increased focus on the impact of climate change on our business.
We also held our first ESG investor seminars in London and Sydney.
This illustration does not include time spent by the Committee on formalities, administrative items, the Committee performance evaluation, or attending site visits and the ESG investor seminars.
Our processThe chairman of the board, the chief executive, the Health, Safety and Environment Group executive, the Corporate Relations Group executive and the Group General Counsel regularly attend our meetings.
The Committee chairman reports to the board after each meeting, and our minutes are tabled before the board. All directors have access to the Committee’s papers.
Our sustainable development strategy and performance are described in detail on pages 52 to 63 of this report as well as in our sustainable development report, which can be found on our website.
Safety and health 30%Sustainable development assurance and reporting 26%Environment, closure and climate change 17%Communities and social performance 15%Risk management – overview and deep dives 11%Whistleblowing oversight 1%
How the Committee spent its time
Sustainability Committee report continued
Annual report 2018 | riotinto.com96

Compliance with governance codes and standards
Compliance with governance codes and standards
This section sets out our compliance with the applicable governance codes and standards. As our shares are listed on both the Australian and London Securities/Stock Exchanges, we set out how we have complied with the codes and standards governing those bodies on the following pages:
– London Stock Exchange – UK Corporate Governance Code (2016 version) (the Code), see pages 97 and 98.
– Australian Securities Exchange – ASX Corporate Governance Council’s Corporate Governance Principles and Recommendations (3rd edition) (the ASX Principles), see pages 99 and 100.
In addition, as explained within the Chairman’s governance review, as a foreign private issuer (FPI) with American Depository Receipts (ADRs) listed on the New York Stock Exchange (NYSE), we need to report any significant corporate governance differences from the NYSE listing standards.
The UK Code Provision with which the Group did not comply during 2018 was Provision E.2.4. The Notice of AGM and related papers were sent to shareholders 17 working days before the meeting instead of 20 days. This was due to technical difficulties in producing the 2017 Annual report to comply with new reporting requirements.
Statement of compliance with the Code and ASX PrinciplesThroughout 2018 and as at the date of this report, the Group has applied the Principles of the Code and the ASX Principles. The Code is available at www.frc.org.uk, and the ASX Principles at www.asx.com/au. For the purposes of ASX Listing Rule 4.10.3 and the ASX Principles, pages 76 to 100 of this report form our “Corporate Governance Statement”. This statement is current as at 27 February 2019, unless otherwise indicated, and has been approved by the board. Corporate governance documents and policies referenced can be found at riotinto.com/corporategovernance.
Difference from NYSE listing standardsWe have reviewed the NYSE Standards and consider that our practices are broadly consistent with them, with the following exceptions where the literal requirements of the NYSE Standards are not met due to differences in corporate governance between the US, UK and Australia: – The NYSE Standards state that companies must have a nominating/
corporate governance committee composed entirely of independent directors which, in addition to identifying individuals qualified to become board members, develops and recommends to the board a set of corporate governance principles applicable to the company. Our Nominations Committee comprises the chairman and independent non-executive directors, information about which is set out on pages 88 to 89. This Committee does not develop corporate governance principles for the board’s approval. The board itself develops such principles.
– Under US securities law and the NYSE Standards, the company is required to have an audit committee that is directly responsible for the appointment, compensation, retention and oversight of the work of external auditors. While our Audit Committee makes recommendations to the board on these matters, and is subject to legal and regulatory requirements on oversight of audit tenders, the ultimate responsibility for the compensation of the external auditors and the appointment of the external auditors of Rio Tinto rests with the shareholders.
UK CodeA. LeadershipA.1 The role of the boardOur board provides effective leadership and is collectively responsible for the stewardship and long-term success of the Group. The board provides entrepreneurial leadership, within a framework of prudent and effective controls that enable risk to be assessed and managed. The formal schedule of matters reserved for the board’s decision, available on our website, covers areas including: setting the Group’s purpose and strategic vision; monitoring performance of the delivery of the approved strategy; approving major investments, acquisitions and divestments; the oversight of risk and the setting of the Group’s risk appetite; and reviewing the Group’s governance framework. Through our The way we work framework, the board sets the company’s values, and standards for the Group’s employees. For further information on the delegation of business to management please refer to pages 78 and 79.
A.2 Division of responsibilitiesThere is a clear division of responsibilities between the chairman and the chief executive, to ensure that no individual has unfettered powers of decision. Written roles and responsibilities, which are available on our website, explain this division.
A.3 The chairmanThe chairman is responsible for the leadership and overall effectiveness of the board. He was independent on the date of his appointment in March 2018. He recognises the importance of creating a boardroom culture which encourages openness and debate and ensures constructive relations between executive and non-executive directors. This is reflected in his role profile. He ensures that the directors receive accurate, timely and clear information, and that shareholder communications are effective.
A.4 Non-executive directorsThe non-executive directors (NEDs) constructively challenge and help develop proposals on strategy. They are also responsible for scrutinising management performance and ensuring that financial information, risks and controls, and systems of risk management are robust. The board ensures, through the Nominations Committee, that the board composition and succession plans are robust. The Remuneration Committee ensures that appropriate remuneration structures are in place. Ann Godbehere, the senior independent director, provides a sounding board for the chairman and serves as intermediary for other directors when necessary. The chairman and NEDs typically meet at the start or end of each board meeting without the executive directors, creating an opportunity for NEDs to raise any issues in the private session.
B. EffectivenessB.1 The composition of the boardIn total, the board comprises 11 board members; eight independent NEDs, the chairman, the chief executive and the chief financial officer. This is considered to be an appropriate size for the business, and to provide the right balance of executive and non-executive directors. The board remains satisfied that it has the appropriate balance of skills, experience, independence, and knowledge of the company to enable its members to discharge their respective duties and responsibilities effectively, and that no individual or group can dominate the board’s decision-making. Only the chairman and committee members have the right to attend the meetings of the Nominations, Audit and Remuneration Committees. Attendance by all other individuals is by invitation only.
The Nominations Committee assesses the independence of each NED, using an independence framework which takes into account the requirements of the Code, the ASX Principles and the NYSE Standards. The Committee reviews and approves that framework each year. In line with the framework, all non-executive directors were considered independent in judgment and character when appointed to the board, and continued to be independent in 2018. A particularly rigorous independence review was conducted for Ann Godbehere as she has served on the board for more than six years. The review concluded she continues to demonstrate independence. Ann will stand down from the board at the 2019 AGMs.
Annual report 2018 | riotinto.com 97
Governance

Governance
B.2 Appointments to the boardThe Nominations Committee ensures a formal, rigorous and transparent procedure for the appointment of new directors and is responsible for board succession planning, regularly assessing the balance of skills, experience, diversity and capacity required to oversee the delivery of Rio Tinto’s strategy. It also reviews proposals for appointments to the Executive Committee, and monitors executive succession planning. In 2018, we appointed Jakob Stausholm, Moya Greene and Simon McKeon to the board. For further details on their appointments please refer to pages 89.
B.3 CommitmentEach non-executive director’s letter of appointment (available for inspection at the AGM) outlines the commitments expected of them throughout the year. Each director has undertaken to allocate sufficient time to the Group in order to discharge their responsibilities effectively, and this is kept under review by the Nominations Committee. Executive directors are prohibited from taking more than one non-executive directorship in a FTSE100 company, or the chairmanship of such a company. Simon Thompson’s other appointments are listed on page 76. These have not changed since his appointment as chairman.
B.4 DevelopmentOn joining Rio Tinto, all non-executive directors take part in a full, formal induction programme which is tailored to their specific requirements. Board members can also participate in training and development opportunities throughout the year, including visits to Rio Tinto operations. These visits provide an opportunity to meet employees and other key stakeholders, and to develop a deeper understanding of the challenges and opportunities at operational sites and in the business areas more generally. The chairman holds annual appraisal meetings with all directors to review their performance, and training and development needs are discussed with the directors.
B.5 Information and supportBoard papers are circulated at least five days before each meeting to ensure directors have appropriate time to review them, and to seek clarification where necessary. The quality of papers is kept under review, and some areas for improvement in board presentations were identified in the most recent board effectiveness review. The chairman reviews the board agenda with the chief executive, chief financial officer and Group company secretary before each meeting to ensure the directors receive clear and accurate information. The Group company secretary is the trusted interlocutor within the board and its committees, and between senior management and the non-executive directors. He is responsible for advising the board, through the chairman, on all governance matters.
B.6 EvaluationAn internal board and board Committee effectiveness evaluation is carried out each year. The evaluation considers (but is not limited to): the balance of board members’ skills and experience; independence; diversity; the running of the board; and directors’ knowledge of the company. This results in effectiveness reviews which are discussed at the board and each of the committees. Every third year, the board evaluation is externally facilitated. The next external review is scheduled to take place in 2019. In 2018, the performance evaluation of the chairman was internally conducted, with the assistance of Lintstock. The chairman evaluates each director’s performance and contribution, ensuring that they have the training and knowledge required to effectively fulfil their role.
B.7 Re-electionThe board’s policy is that all directors stand for re-election by shareholders each year at the AGM. The Notice of annual general meeting includes a statement that the board considers that all directors continue to perform effectively and demonstrate appropriate levels of commitment. It also provides reasons why each director is recommended for re-election, highlighting the director’s relevant skills and experience.
C. AccountabilityC.1 Financial and business reportingThe board is responsible for the presentation of a fair, balanced and understandable assessment of the company’s position and prospects, not only in the Annual report, but in all publicly available financial and operating reviews and reports. We have a robust process in place including through the Disclosure Committee, to ensure that this is the case: please refer to pages 140 to 141 of this Annual report for further detail.
C.2 Risk management and internal controlThe board is ultimately responsible for our risk management and internal controls, and for ensuring that the systems in place are robust and take into account the principal risks faced by the company. The board delegates certain matters to the Audit Committee, and the Audit Committee provides updates to the board on matters discussed at each meeting. Please refer to pages 93 and 94 of this Annual report for further detail.
C.3 Audit Committee and auditorWe have formal and transparent arrangements in relation to corporate reporting, risk management and internal controls. The Audit Committee’s terms of reference set out its responsibility for overseeing risk management and internal controls (including internal control over financial reporting). These terms of reference will be reviewed in the light of the 2018 UK Corporate Governance Code. The Audit Committee conducted an audit tender in the second quarter of 2018 which resulted in the decision to appoint a new external auditor, KPMG, for the 2020 year end. Please refer to page 93 of this Annual report for further detail.
D. RemunerationD.1 The level and components of remunerationOur Remuneration Policy is designed to help drive a performance culture which incentivises executives to deliver the Group’s long-term strategy and create superior shareholder value over the short, medium and long term. The Remuneration Committee uses the FTSE30 as its initial comparator group for assessing appropriate levels of remuneration for executives. It also references comparable companies, such as international industrial organisations and other international mining companies, and is mindful of pay and employment conditions elsewhere in the Group. Base salaries are typically aimed at the median position of these comparator groups to avoid the risk of an upward ratchet in remuneration levels.
D.2 ProcedureWe have a formal and transparent procedure for developing the Remuneration Policy, and no director is involved in deciding their own remuneration. For further information, please refer to the Directors’ remuneration report on pages 101 to 136 of this Annual report.
E. Relations with shareholdersE.1 Dialogue with shareholdersThe board is kept aware of major shareholder issues and concerns through reports from a variety of sources, including the chairman, the chief financial officer, the chief executive, the investor relations team and external consultants. Other ways in which the board maintains dialogue with shareholders include general meetings, investor roadshows and interim and full-year results presentations. Please see page 85 for further details on investor seminars held this year.
E.2 Constructive use of general meetingThe board uses the AGMs to communicate with investors and to encourage their participation. At each AGM, a separate resolution is presented in relation to each matter, including a resolution seeking shareholder approval of the Annual report.
Compliance with governance codes and standards continued
Annual report 2018 | riotinto.com98

Compliance with governance codes and standards
Principle 2: Structure the board to add valueRecommendation 2.1 The Nominations Committee includes all non-executive directors and is chaired by the chairman of the board. The board is satisfied that all non-executive directors, including the chairman, continue to meet the test for independence under the UK Code, the ASX Principles and the NYSE Standards. The Nominations Committee’s terms of reference are available on our website. The Nominations Committee report on pages 88 and 89 provides further details on its role and responsibilities. Details on membership, the number of times the Committee met, and the attendance of members are set out on page 87.
Recommendation 2.2A board skills matrix showing key attributes in terms of skills, experience and diversity that are relevant to the board is set out on page 89 of the Annual report.
Recommendation 2.3, 2.4, 2.5The Nominations Committee is responsible for assessing the independence of each non-executive director against an independence framework which combines the requirements of the Code, the ASX Principles and NYSE Standards. The Nominations Committee reviews and approves this framework each year.
The board is satisfied that all of its non-executive directors are independent in character and judgment and are free from any relationships (material or otherwise) or circumstances that could create a conflict of interest.
The chairman was considered independent upon his appointment and, in the board’s view, he continues to satisfy the tests for independence under the Code, the ASX Principles and the NYSE Standards.
The name, skills and experience of each director, together with their terms in office, are shown in the biographical details on pages 76 and 77.
Recommendation 2.6On joining Rio Tinto, all directors receive a full, formal induction programme. It is delivered over a number of months, and tailored to their specific requirements, taking into account their prospective committee responsibilities. Further details are set out on page 94 of the Annual report.
All directors are expected to commit to continuing their development during their tenure. This is supported through a combination of: site visits; internal business; and operational briefings provided in or around scheduled board and committee meetings. In addition, the Group company secretary provides regular updates on corporate governance developments in the UK, Australia and the US. Further details are set out on page 84 of the Annual report.
Principle 3: Act ethically and responsiblyRecommendation 3.1Rio Tinto’s commitment to integrity and compliance is set out in The way we work, a global code of conduct for all employees. This is available on our website and is summarised on page 94 of the Annual report.
Principle 4: Safeguard integrity in corporate reportingRecommendation 4.1The Audit Committee report on pages 90 to 94 provides details on the role and responsibilities of the Committee. The Audit Committee’s terms of reference are available on our website. Further details on membership, the number of times the Committee met during 2018 and the attendance of members are set out on page 87.
Recommendation 4.2Details on compliance with the financial reporting requirements contemplated under this recommendation are set out on pages 140 and 141 of the Annual report.
ASX PrinciplesPrinciple 1: Lay solid foundations for management and oversightRecommendation 1.1Rio Tinto plc and Rio Tinto Limited have a common board of directors. The principal role of the board is to set the Group’s strategy and to review its strategic direction regularly. The board also has responsibility for corporate governance. A formal schedule of matters reserved for the board is available on our website.
The board delegates responsibility for day-to-day management of the business to the chief executive and other members of the Executive Committee. A number of management committees support the chief executive and the Executive Committee. The structure of these committees is set out on page 78.
Recommendation 1.2The Nominations Committee, on behalf of the board, ensures a formal, rigorous and transparent procedure for the appointment of new directors. Further information on the appointment approach is set out on page 88.
The Notice of annual general meeting includes a statement that the board considers that all directors continue to perform effectively and demonstrate appropriate levels of commitment. It also provides reasons why each director is recommended for re-election, highlighting the director’s relevant skills and experience. Further information on the skills and experience of each director is set out on pages 76 and 77 of the Annual report.
Recommendation 1.3The company has written agreements setting out the terms of appointment for each director and senior executive. Non-executive directors are appointed by letters of appointment. Executive directors and other senior executives are employed through employment service contracts. Further information is set out on pages 110 and 112 of the Annual report.
Recommendation 1.4The Group company secretary is accountable to the board and advises the chairman, and, through the chairman, the board on all governance matters. The appointment and removal of the Group company secretary is a matter reserved for the board.
Recommendation 1.5Rio Tinto has a Group-wide, board-endorsed Inclusion and diversity policy. A summary of the policy is available on our website. The board sets objectives for achieving diversity for the board and the Group and states that the board and Executive Committee will annually review the Group’s performance against them. Page 54 of the Annual report sets out the measurable objectives and our performance against them. The respective proportions of men and women on the board, in senior executive positions and across the whole organisation is reported on pages 55 and 56 of the Annual report.
Recommendation 1.6 The performance of the board, and of each of its committees and individual directors, was reviewed in 2018, as it is each year. Detailed information on the board and committee evaluation and the evaluation of the chairman and the non-executive directors is set out on page 86 of the Annual report.
Recommendation 1.7The performance of Executive Committee members, including executive directors, is continually evaluated as part of the Group’s performance evaluation cycle. Further details are set out in the Remuneration report on page 114.
Annual report 2018 | riotinto.com 99
Governance
Governance
Recommendation 4.3Rio Tinto’s external auditors, PwC, attend Rio Tinto’s AGMs and are available to answer questions about the conduct of the external audit and the preparation and content of the independent auditors’ report.
Principle 5: Make timely and balanced disclosureRecommendation 5.1Rio Tinto recognises the importance of effective and timely communication with shareholders and the wider investment community.
It is our policy to make sure that all information disclosed or released by the Group is accurate, complete and timely and complies with all continuous and other disclosure obligations under applicable Listing Rules and other relevant legislation.
To ensure that trading in our securities takes place in an informed and orderly market, we have established a Disclosure Committee to oversee compliance with our continuous disclosure obligations. The terms of reference of our Disclosure Committee, together with our adopted procedures in relation to disclosure and management of relevant information, support compliance with our disclosure obligations, and constitute our continuous disclosure policy.
The Group’s Disclosure Committee is responsible for determining whether information relating to Rio Tinto may require disclosure to the markets under the continuous disclosure requirements in the jurisdictions in which Rio Tinto is listed. In accordance with its terms of reference, the specific focus of the Disclosure Committee is to consider and determine on a timely basis whether information would, to the extent that the information is not public and relates directly or indirectly to Rio Tinto, be likely to have a material effect on the price of Rio Tinto securities if that information was generally available.
The members of the Committee are the chief executive; chief financial officer; Group company secretary; the Group general counsel; the head of investor relations and the Corporate relations Group executive.
Principle 6: Respect the rights of security holdersRecommendation 6.1Our website includes pages dedicated to corporate governance, providing information on compliance with governance codes and standards (the Code, ASX Principles and the NYSE Standards); the terms of reference of the committees; risk management and financial reporting; and board governance including selection, appointment and re-election of directors, director’s independence and board performance evaluation.
All information released to the markets is posted in the Media section of our website. Our website also provides general investor information. Annual and half-year results, as well as any major presentations, are webcast and the materials are available on our website, which also contains presentation material from investor seminars.
Recommendation 6.2Our main channels of communication with the investment community are through the chairman, chief executive and chief financial officer, who have regular meetings with the Group’s major shareholders. The senior independent director has a specific responsibility to be available to shareholders who have concerns which have not been resolved through contact with the chairman, chief executive or chief financial officer, or for whom such contact is inappropriate.
We have a number of processes and initiatives to ensure that members of the board understand the views of major shareholders. The chief financial officer reports to the board at each meeting, and provides regular investor updates. In addition, the head of investor relations reports regularly to the board, and an annual survey of major shareholders’ opinions is presented to the board by the Group’s investor relations advisers.
Further information on engagement with shareholders and investors during 2018 is set out on page 85 of the Annual report.
Recommendation 6.3The AGMs present an opportunity to provide a summary business presentation, to inform shareholders of recent developments, and to give them the opportunity to ask questions. Generally, the chairs of all board committees are available to answer questions raised by shareholders, and all directors are expected to attend where possible. In 2018, all the directors attended the AGMs save for Paul Tellier who stood down from the board on 2 May 2018 and therefore did not attend the Rio Tinto Limited AGM. The AGMs are webcast and transcripts of the chairman’s and chief executive’s speeches are made available on our website. A summary of the proceedings at the meetings, and the results of voting on resolutions, are made available as soon as practicable after the meetings.
Recommendation 6.4Shareholders can choose to communicate electronically with the companies and the share registrars. The contact details for the registrars are on page 299 and on our website.
Principle 7: Recognise and manage riskRecommendation 7.1, 7.2The board is ultimately responsible for risk management and internal controls and for ensuring that the systems in place are robust and take into account the principal risks faced by the Group. The board delegates certain risk management matters to the Audit Committee, and the Audit Committee provides updates to the board on matters discussed at each meeting. Further details on the Group’s governance framework for risk management and internal control are set out on pages 93 and 94 of the annual report.
Recommendation 7.3Further information on Rio Tinto’s Group Internal Audit function is set out on page 94 of the annual report.
Recommendation 7.4A description of the principal risks and uncertainties that could affect Rio Tinto (including economic, environmental and social sustainability risks), and of the Group’s governance framework for risk management and internal control, are on page 93 of the Annual report.
Principle 8: Remunerate fairly and responsiblyRecommendation 8.1The Remuneration report on pages 101 to 136 provides details on the role and responsibilities of the committee. The Remuneration Committee’s terms of reference are available on our website. Further details on membership, the number of times the Committee met during 2018 and the attendance of members are set out on page 87.
Recommendation 8.2Rio Tinto’s policies and practices regarding remuneration of non-executive directors, executive directors and senior executives are set out on pages 101 to 136 of the Remuneration report.
Recommendation 8.3Rio Tinto’s approach on participating in equity based remuneration schemes is set out on page 140 of the Annual report.
Compliance with governance codes and standards continued
Annual report 2018 | riotinto.com100

Governance | Remuneration report
Annual statement by the Remuneration Committee chairman
On behalf of the board, I am pleased to introduce my first Directors’ remuneration report (the Remuneration report) since being appointed the chair of the Remuneration Committee (Committee). I want to begin by acknowledging that the Committee is mindful of its responsibilities in determining executive pay. We are committed to ongoing engagement with our shareholders, and to hearing all perspectives.
This year, we have taken the opportunity to refresh the format of our Remuneration report. It is divided into three parts. We have provided a summary of key information and highlights through a new remuneration At a glance section. We have also provided relevant extracts from our Remuneration Policy (Policy). Our full Policy is available on the company website. The Implementation report shows how the Policy was applied in 2018. Throughout this Remuneration report, the members of the executive committee, including our executive directors, are collectively referred to as “executives”.
Remuneration PolicyThe Committee’s overarching aim is to ensure our remuneration structure and policies reward fairly and responsibly with a clear link to corporate and individual performance, and to the company’s long-term strategy and values. We make sure that such policies are both effective and competitive in the market place, and are appropriately stretching and rewarding the right behaviours. We also ensure that there is alignment between executive remuneration and wider company pay policies, and we closely scrutinise gender pay differential to ensure equality.
All resolutions relating to remuneration presented to the 2018 AGMs, including the triennial policy review, were passed with majorities of some 90% or above. There was a consistent view that our Policy, and the new umbrella Equity Incentive Plan (EIP) that governs our long-term share-based remuneration including our Performance Share Awards (PSA), are aligned with market practice.
During our consultation with shareholders, one of the proposals under our Policy was to substitute restricted stock for the PSA granted under the EIP, and significantly reduce the maximum quantum of the award. This proposal received a mixed response and was therefore ultimately excluded from our Policy. The board and management will continue to review the appropriateness and effectiveness of our Policy. We remain of the view that restricted stock has considerable merits in a long-term cyclical industry such as mining.
During 2018, we observed a number of ASX-listed companies review and replace their more traditional executive remuneration framework with
The Committee’s overarching aim is to ensure our remuneration structure and policies reward fairly and responsibly.”
Remuneration report | Annual statement by the Remuneration Committee chairman
more flexible frameworks that better suit their particular circumstances. While no clearly preferred remuneration model has emerged, we will continue to engage with shareholders on the merits of restricted stock.
2019 decisionsIn 2019, annual base salary increases for our executives will be based on Consumer Price Index forecasts for each executive’s country of employment. This increase will be the same as or lower than the overall country budget for our broader workforce. The chairman’s fee and the fees for our non-executive directors will be unchanged for 2019.
The maximum opportunity for executives under the Short Term Incentive Plan (STIP) remains unchanged, and outcomes are aligned to business performance. The 2019 safety measures, weightings and targets are fully disclosed on page 124. We expect to disclose the 2019 financial and individual targets retrospectively in the 2019 Implementation report.
The overall level of PSA to be granted to executives in March 2019, as a percentage of base salary, will be slightly lower than the PSA granted in 2018. Consistent with our practice since 1998, the awards will be made using the average share price over the previous calendar year. As such, PSA granted in 2019 will be calculated using the 2018 average share prices of £38.94 and A$78.17. Our decision to use average prices, rather than spot prices, is intended to mitigate the impact of share price volatility. The performance conditions for the 2019 PSA are set out in the Implementation report.
2018 performance and remunerationThe 2018 single total figure of remuneration for the chief executive, Jean-Sébastien Jacques, is higher than in 2017, mainly because the value of Long Term Incentive Plan (LTIP) awards vesting under the 2014 PSA were higher than those that vested under the 2013 PSA. This higher value was primarily due to the 2013 PSA vesting in two equal tranches in 2016 and 2017 under a transitional arrangement. The impact was partly offset by the estimated lower overall vesting level for the 2014 PSA, as well as higher share prices at the time of vesting for the 2013 PSA.
For the former chief financial officer, Chris Lynch, the single total figure of remuneration is lower than in 2017. This is due mainly to 2018 representing a part-year of remuneration up to 30 September 2018 when Chris retired. This was partly offset by the value of LTIP awards vesting as explained above for the chief executive. No comparison is made for Jakob Stausholm as he only joined the company in September 2018.
Annual report 2018 | riotinto.com 101
Governance

Overall, the estimated vesting for the award when the TSR and EBIT margin portions are combined is 41.3% of maximum. The Committee gave consideration to the Group’s overall performance during the five-year performance period and concluded that vesting of awards was justified. As a consequence, the portion of the award relating to TSR will vest on 28 February 2019. The Committee will make a final determination of the relative improvement in EBIT margin measure when the final EBIT margin performance of the comparator group companies becomes available in May 2019. If applicable, this portion of the award will vest on 31 May 2019.
Former directorsChris Lynch retired in September 2018 after providing the company notice of his intention to retire in September 2017. Until his retirement, Chris continued to receive his contractual entitlements.
As disclosed in the 2016 and 2017 Annual reports, a deed of deferral was entered into with the former chief executive, Sam Walsh. This was in connection to the investigations concerning the Simandou project. Given that the regulatory investigations are still not complete, the Committee has determined that a further deferral of the amounts that were payable on 31 December 2018 is appropriate.
This matter is still under discussion and the company will disclose the outcome when the process is complete.
UK Corporate GovernanceWe welcome the introduction of the new Corporate Governance Code which came into effect on 1 January 2019. We believe we are well placed to comply with this code, and will continue to consider matters such as post-employment shareholding and pension arrangements. In this year’s Remuneration report, we are voluntarily disclosing our chief executive pay ratio. The ratio of the total remuneration of the chief executive to the median total remuneration of all employees for 2018 was 45:1. The Committee continues to monitor the ratio between our executive pay and our broader workforce, which will be supported through regular and detailed reporting. I was also delighted to have the opportunity to discuss a range of executive remuneration topics with our workforce at our inaugural employee AGM with the board in Brisbane in November 2018. We will continue to engage with employees in a range of innovative ways.
Fair payThe Committee continues to monitor both equal pay and the gender pay gap across our workforce. As at 31 December 2018, the Group-wide equal pay gap was less than 2% and gender pay gap less than 1%. While we have made further progress in ensuring equal pay for equal work in 2018, we do need to continue our focus on the relatively low level of gender diversity in senior management roles in order to continue to close the gender pay gap in all locations. Further details of both equal pay and the gender pay gap, together with the steps we are taking to address this issue, are provided on page 56 of this report.
Yours sincerely
Sam LaidlawRemuneration Committee chairman27 February 2019
Short Term Incentive Plan In our At a glance section on page 104, and on pages 114 to 121, we retrospectively disclose the financial and individual STIP targets set by the board for 2018. While most of the 2018 targets were achieved, the overall 2018 STIP awards for Jean-Sébastien Jacques and Chris Lynch, expressed as a percentage of the maximum award, are lower than last year. Further details are given below.
Short Term Incentive Plan – SafetyUnfortunately, we did not achieve our goal of zero fatalities in 2018, with three colleagues not returning home from work. In April, a maintenance contractor was fatally struck by a falling object while performing work on one of the furnaces at Energy & Mineral’s Sorel-Tracy operations; in July, a security contractor was fatally assaulted while on duty at Energy & Mineral’s Richards Bay Minerals operations; and in August, a truck operator was fatally injured as a result of his truck colliding with a windrow at Iron Ore’s Paraburdoo operations. Performance against the fatality measure was therefore zero for all executives.
The combined performance against our safety measures meant that the Group’s STIP safety result was below target at 22% of maximum, and the STIP safety results for all executives were below target.
Short Term Incentive Plan – FinancialThe “flexed” earnings and “unflexed” cash flow results for the Group were close to target, the “unflexed” earnings was between target and outstanding and the “flexed” cash flow result, adjusted for commodity prices, was below target. These outcomes are reflected in the financial component of the STIP awards for all executives. Together, the outcomes resulted in a Group performance against the financial targets of 60% of maximum.
The Committee made adjustments to the targets in 2018 to take account of events outside management’s control and to ensure a like-for-like comparison with the targets.
The most significant adjustments in 2018 related to the gain on disposal of surplus land at Kitimat in Canada, the impact of the disposal of our remaining coal assets in Australia, and the impact of the strike at our iron ore operations in Canada. The net impact of all adjustments, both positive and negative, decreased the Group’s result against the financial targets from 63% to 60% of maximum (2017: increase from 56% to 67% of maximum). Further details are provided on page 115.
Long Term Incentive PlansOur LTIP is designed to reflect alignment with shareholder returns and our relative performance. PSA granted under the LTIP in 2014 had three equally weighted performance metrics: Total Shareholder Return (TSR) relative to the EMIX Global Mining Index (formerly known as the Euromoney Index); TSR relative to the MSCI World Index; and improvement in Earnings Before Interest and Tax (EBIT) margin relative to global mining comparators. Rio Tinto outperformed against the Mining Index, but under performed against the MSCI World Index, resulting in a 33.3% vesting of the award under these two components, out of a maximum of 66.7%. This outcome reflects the design intention that executives should not unduly benefit from windfall gains when commodity prices are high, nor be unduly penalised when prices are low.
The estimated performance against the EBIT margin measure is that Rio Tinto ranked no.5 against a comparator group of 11, which would result in a vesting of 24.0% for this measure (representing 8.0% of the total award). We can only provide an estimate at this time as we do not have the reported data for all comparator companies.
Governance | Remuneration report
Annual statement by the Remuneration Committee chairman continued
Annual report 2018 | riotinto.com102

Remuneration report | Annual statement by the Remuneration Committee chairman
As our shares are listed on both the Australian and London Stock Exchanges, the information provided within our Remuneration report must comply with the reporting requirements of both countries.
About our reportingOur regulatory responsibilities impact the volume of information we provide, as well as the complexity. In Australia, we need to report on a wider group of executives, as described in the following paragraph. In addition, as set out in our visual below, the two reporting regimes follow different methodologies for calculating remuneration.
In the UK, we need to report remuneration for the board, including the executive directors. The Australian legislation requires disclosures in respect of “key management personnel”, being those persons having authority and responsibility for planning, directing and controlling the activities of the Group. The key management personnel are, in addition to the directors, all members of the Executive Committee. Throughout this Remuneration report, the members of the Executive Committee are collectively referred to as “executives”. They are listed on page 124, with details of the positions held during the year and dates of appointment to those roles.
Structure of our Remuneration reportThis year, we have included an At a glance section that summarises key information in one place, resulting in our Remuneration report being organised into the following parts:
Annual statement by the Remuneration Committee chairman 101
Remuneration At a glance 104
Remuneration Policy extracts 106
Implementation report, which shows 113 – How the Policy has been applied as required under the legislation – Tables 1a-3 incorporating additional disclosures required
under the Australian regulations
Shareholder votingAs required under UK legislation, the full Remuneration Policy section of the 2017 report was subject to a binding vote at our 2018 AGMs on 11 April 2018 in London, and 2 May 2018 in Melbourne. It passed with votes for the Policy of 95.6%, and will apply for three years, when a new Policy will need to be presented at the 2021 AGMs. An extract of our Policy is provided this year, and the full Policy can be found at: riotinto.com/ar2018.
The Implementation report, together with the Annual statement by the Remuneration Committee chairman, is subject to an advisory vote each year as required by UK legislation. Under Australian legislation, the Remuneration report as a whole is subject to an advisory vote. All remuneration-related resolutions will be voted on at the AGMs as Joint Decision Matters by Rio Tinto plc and Rio Tinto Limited shareholders.
The differing approaches explainedAs well as the difference in methodology for measuring remuneration, there are also key differences in how remuneration is reported in the UK and Australia:
UK – For reporting purposes, remuneration is divided into fixed
and variable elements. – Remuneration is reported in the currency it is paid, eg, where a UK
executive is paid in UK sterling, remuneration is reported in UK sterling.
Australia – For reporting purposes, remuneration is divided into short and long
term elements. – All remuneration is reported in US dollars, so using the previous
example, the UK executives remuneration would be converted to US dollars using the average exchange rate for the financial year (except STIP, which is converted at the year end exchange rate).
The visual below summarises the elements of each component of remuneration, as well as the significant differences in the approaches to measurement.
FixedBase salary
Benefits
PensionThe value of the pension contribution and payment in lieu of pension paid during the year.
VariableSTIP – cash element
STIP – deferred share element
LTIPMeasured at point of vesting.
Short-termBase salary
STIP – cash element
Cash benefits
Non-monetary benefits
Long-termSTIP – deferred share element Based on the amortised IFRS fair value of deferred shares at the time of grant.
LTIP Based on the amortised IFRS fair value of the LTI at time of grant.
Pension and superannuation Accounting basis.
Total remuneration
UK Australia
Annual report 2018 | riotinto.com 103
Governance

Governance | Remuneration report
Remuneration at a glance
This At a glance section sets out key elements of our policy, performance and remuneration outcomes for 2018.
2018 performance
STIP 70% of the STIP award for executives is currently determined based on safety (20%) and financial performance (50%).
SafetySafety performance is assessed in three areas: – All injury frequency rate – Binary fatality measure – Implementation of critical risk management
For 2018, the total assessment for the Group’s safety performance was below target, at 22% of maximum. Three people lost their lives while working at Rio Tinto managed operations, which meant that we did not achieve our goal of zero fatalities. Accordingly, all executives received a zero result for the binary fatality measure in 2018.
FinancialTwo measures are used to assess financial performance, with both unflexed and flexed targets (adjusted for commodity prices) for each measure. We also adjust for exceptional and non-controllable items. Overall, the net impact of all adjustments was to decrease the Group’s financial performance to 60% of maximum. Actual performance against threshold, target, and outstanding performance for each measure is set out in the charts below:
LTIPRio Tinto outperformed against the EMIX Global Mining Index, but underperformed against the MSCI World Index, resulting in an estimated vesting of 33.3% under these two components, out of a maximum of 66.7%. This outcome reflects the design intention that executives should not unduly benefit from windfall gains when commodity prices are high, nor suffer when prices are low.
The estimated performance against the EBIT margin measure is that Rio Tinto is ranked no.5 against a comparator group of 11, which would result in a vesting of 24.0% for this measure. The estimated performance will be recalculated following the vesting of the EBIT margin measure in May 2019.
Total shareholder return
2013 2014 2015 2016 2017 2018
Rio Tinto Group EMIX Global Mining Index MSCI World Index
Policy for executives
Base salary – Reviewed annually – Maximum individual increase of 9%, per annum, or inflation if higher
Pension – Maximum contribution of 25% of base salary for those appointed
since 1 June 2018. Previously the maximum was 35%
Other benefits – Includes healthcare, allowance for professional tax services, company
car or car allowance, and international relocation allowance and benefits
Short Term Incentive Plan (STIP) – Maximum is capped at 200% of base salary with awards of:
– 25% of maximum for threshold – 50% of maximum for target – 100% of maximum for outstanding performance – In the cases of the chief executive and former chief financial officer,
the percentage award is multiplied by 1.2, subject to a 200% cap. – Any formulaic STIP calculation is subject to the exercise of discretion
by the Committee. – Performance is based on a scorecard of the Group’s five priorities
for each executive. – 70% of the measures relate to financial and safety targets, and 30%
relate to individual performance. – Delivered equally in cash and deferred shares. – Deferred shares vest after three years.
Long Term Incentive Plan (LTIP) – LTIP consists of Performance Share Awards (PSA). – Maximum is 438% of base salary with awards of 22.5% of maximum
for threshold performance. – Performance based on Rio Tinto’s relative TSR against
two benchmarks over a five-year period: – EMIX Global Mining Index (50%). – MSCI World Index (50%).
– The relative EBIT margin improvement measure has been removed from awards granted since 2018.
– Current level of outperformance required for full vesting is 6% per annum over five years.
Share ownership guidelines – Chief executive: four times base salary after five years – Other executives: three times base salary after five years
Termination policy – Notice period normally 12 months, during which executives
will receive their base salary, STIP and other benefits. – An eligible leaver may be awarded a discretionary STIP award
on a pro rata basis, payable on the normal STIP payment date in cash. – Any unvested bonus deferred shares from prior year awards
will normally vest on the scheduled vesting date. – LTIPs will normally be retained by eligible leavers and vest on the
scheduled vesting date, subject to performance conditions where applicable.
– PSA and Management Share Awards (MSA) will be reduced where the executive leaves within 36 months of grant.
– PSA granted prior to 2018 are subject to malus and clawback following termination, and all LTIP awards granted from 2018 are subject to malus, clawback and suspension following termination.
Underlying earnings target range (threshold to outstanding) – US$
STIP free cash �ow target range (threshold to outstanding) – US$
5.8bn
Target: 7.2bn Un�exed
Flexed
Un�exed
Flexed
6.9bn
8.9bn
10.5bn
14.3bn
Actual: 8.8bn
Actual: 10.3bn
9.0bn
7.7bn 12.6bn
Target: 8.5bn
Target: 9.7bn
Target: 11.1bn
Annual report 2018 | riotinto.com104
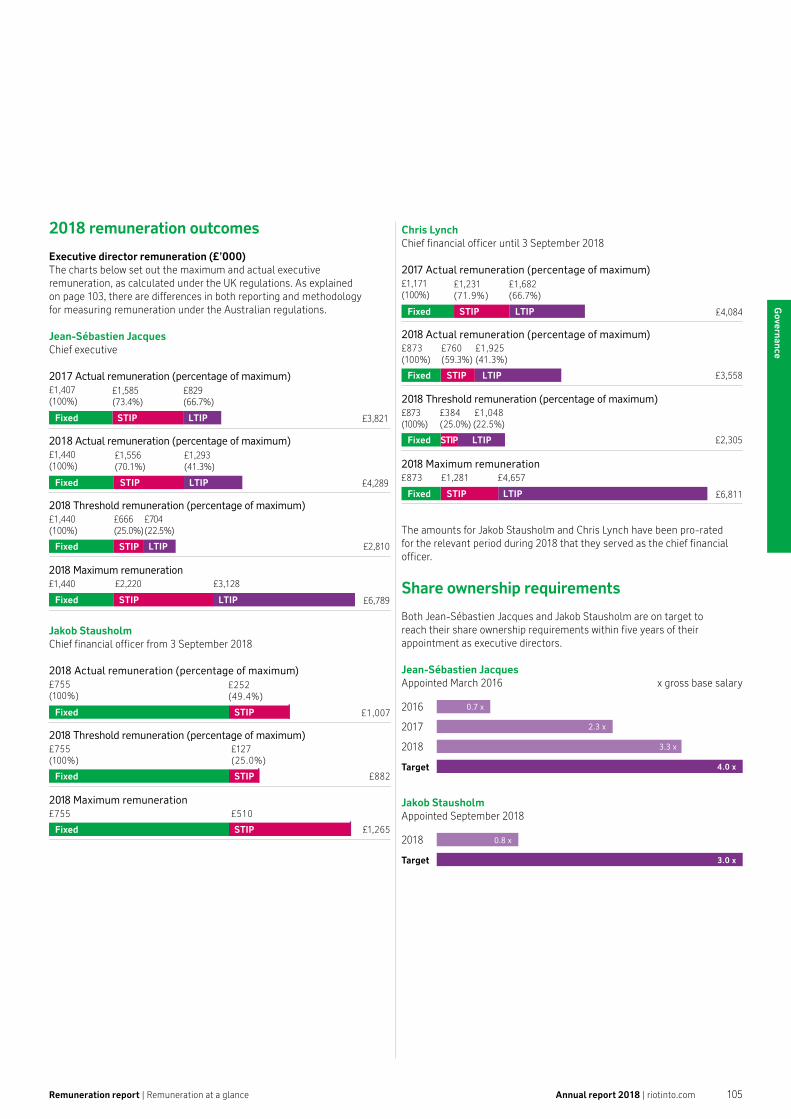
2018 remuneration outcomes
Executive director remuneration (£’000)The charts below set out the maximum and actual executive remuneration, as calculated under the UK regulations. As explained on page 103, there are differences in both reporting and methodology for measuring remuneration under the Australian regulations.
Jean-Sébastien JacquesChief executive
£1,440 £2,220 £3,128
£6,789
£1,585(73.4%)
£829(66.7%)
£3,821Fixed STIP LTIP
Fixed STIP LTIP
Fixed STIP LTIP
£666(25.0%)
£704(22.5%)
£2,810
2017 Actual remuneration (percentage of maximum)£1,407(100%)
£1,556(70.1%)
£1,293(41.3%)
£4,289Fixed STIP LTIP
2018 Actual remuneration (percentage of maximum)£1,440(100%)
2018 Threshold remuneration (percentage of maximum)£1,440(100%)
2018 Maximum remuneration
Jakob StausholmChief financial officer from 3 September 2018
£252(49.4%)
£1,007Fixed STIP
Fixed STIP
£127(25.0%)
£882
2018 Actual remuneration (percentage of maximum)£755(100%)
2018 Threshold remuneration (percentage of maximum)£755(100%)
Fixed STIP
£510
£1,265
2018 Maximum remuneration£755
Chris LynchChief financial officer until 3 September 2018
£873 £1,281 £4,657
£6,811
£1,231(71.9%)
£1,682(66.7%)
£4,084Fixed STIP LTIP
Fixed LTIPSTIP
Fixed STIP LTIP
£760(59.3%)
£1,925(41.3%)
£3,558
2017 Actual remuneration (percentage of maximum)£1,171(100%)
2018 Actual remuneration (percentage of maximum)£873(100%)
Fixed STIP LTIP
£384(25.0%)
£1,048(22.5%)
£2,305
2018 Threshold remuneration (percentage of maximum)£873(100%)
2018 Maximum remuneration
The amounts for Jakob Stausholm and Chris Lynch have been pro-rated for the relevant period during 2018 that they served as the chief financial officer.
Share ownership requirements
Both Jean-Sébastien Jacques and Jakob Stausholm are on target to reach their share ownership requirements within five years of their appointment as executive directors.
Jean-Sébastien JacquesAppointed March 2016 x gross base salary
0.7 x
2.3 x
3.3 x
4.0 x
2016
2017
2018
Target
Jakob StausholmAppointed September 2018
0.8 x
3.0 x
2018
Target
Remuneration report | Remuneration at a glance Annual report 2018 | riotinto.com 105
Governance

Remuneration policy extracts
Remuneration Policy introductionOur Remuneration Policy applies to our executive and non-executive directors and to the chairman. In accordance with Australian law, it also sets out the broad policy principles that apply to members of the Executive Committee who are not directors.
Shareholders should note that our Remuneration Policy is binding only in so far as it relates to directors.
Our remuneration policies, principles and practicesOur first priority is to spend remuneration resource wisely. We want our pay policies to be regarded as fair by shareholders and employees alike. Although we believe that our Remuneration Policy is fit for purpose, the Committee retains the discretion to override unforeseen and inappropriate mechanistic outcomes.
High-quality people, who are capable of managing and growing the business, are essential to generate superior returns for our shareholders. Rio Tinto operates in global and local markets where it competes for a limited pool of talented executives and our compensation strategy is therefore designed to attract and retain the people that we need. We recognise that remuneration represents just one of the factors that encourage the attraction and retention of talent. We also seek to engage our employees over the long term, to foster diversity, and to provide challenging work and development opportunities. Our people strategy is underpinned by our commitment to safety and our other core values of respect, integrity, excellence and teamwork.
Competitive remuneration linked to performance and shareholder value creationRemuneration is linked to performance targets over both the short and long term, to ensure that executive rewards are aligned to the delivery both of short-term priorities and long-term sustainable growth in shareholder value. In order to assess the competitiveness of the packages we offer, we benchmark ourselves against other companies in the FTSE30 (excluding financial services companies), which typically have similar global reach and complexity, and other international mining and natural resources companies. The outcomes of these benchmarking exercises form just part of our consideration of the appropriate level of remuneration packages, but we would not expect either base salaries or the expected outcome of our short- and long-term incentive plans to deviate markedly from the median of these comparator groups. The actual outcome will, of course, depend on business and individual performance.
We take salary increases in the broader employee population into account in determining any change to the base pay of executives and regularly consult with shareholders on the design of our short- and long-term incentive plans to ensure that they are aligned with shareholder interests and priorities. We do not formally consult with our employees on the Remuneration Policy, but approximately 40 per cent of the workforce are shareholders, through participation in our employee share plans and therefore have the right to vote on the Remuneration Report. Employees are also free to ask questions or express opinions through our normal employee communications channels.
Performance under the Short Term Incentive Plan (STIP) is measured over one year based on a balanced scorecard including safety, financial and individual targets. We recognise the importance of ensuring these targets are achieved in the right way, and aligned to the company’s values. Therefore in considering STIP outcomes, we also consider the extent to which outcomes are in accordance with our values. Fifty per cent of the STIP for executives is delivered in deferred shares that vest after three years.
Performance for performance share awards (PSA) under the Long Term Incentive Plan (LTIP) is measured over five years and awards are typically delivered in shares. From 2018, performance is measured by reference to the total shareholder return (TSR) of Rio Tinto relative to the EMIX Global Mining Index (formerly the Euromoney Global Mining Index) (50 per cent) and the MSCI World Index (50 per cent), reflecting the fact that the company competes for capital with both mining companies and other global companies. IHS Markit purchased from Euromoney Indices all of its benchmark index intellectual property assets and subsequently rebranded those indices as the EMIX Indices. The relative EBIT margin improvement measure has been removed following consultation with major shareholders and feedback from employees, in order to achieve greater simplicity, transparency and alignment.
A new Equity Incentive Plan (EIP) was approved by shareholders at the AGMs in 2018. This allows both PSA and the deferred element of the STIP as described herein to be granted under a single plan with sufficient flexibility to reflect any future changes in the Group’s Remuneration Policy. Participants below the Executive Committee level will also participate in LTIP awards under the EIP. Deferred dividends are accumulated under the EIP.
Options are no longer granted, but existing vested options may be exercised up to ten years after their grant. Our share ownership policy requires executives to build up and maintain a material shareholding in the company as described in the Implementation Report.
What this section contains This section sets out relevant extracts of our Remuneration Policy that provide context for our 2018 Implementation Report. For example, during the year our chief financial officer retired, and we hired a new chief financial officer, so our policies for termination and recruitment are included in full.
Further detail
Our full Remuneration Policy as approved at our 2018 AGMs can be found at: riotinto.com/ar2018
Governance | Remuneration report
Annual report 2018 | riotinto.com106

Executive remuneration structure – policy table The total remuneration package is designed to provide an appropriate balance between fixed and variable components, with an emphasis on long-term variable pay. The remuneration structure for executives, including the relationship between each element of remuneration and Group performance, is summarised below. Complementary remuneration structures are designed for other employees, drawing on these strategies and policies.
Further details on the key performance indicators (KPIs) used to assess Group performance are provided in the Strategic report.
Any commitment made before this Remuneration Policy takes effect or before an executive became or becomes a director will be honoured even if it is not consistent with this or any subsequent Remuneration Policy.
Remuneration arrangements – Fixed Link to Group performance and strategy
Base salary – Base salary provides the main fixed element of the remuneration package. – Base salaries are reviewed annually, with a maximum individual increase of nine per cent,
or inflation if higher, per annum. An individual increase may be higher than this for executives who are not directors in the circumstances described below.
– Any increase is generally aligned with the average base salary increases applying to the broader employee population unless there were significant changes to an individual’s role and/or responsibilities during the year. Any increases are determined with reference to underlying Group and individual performance, global economic conditions, role responsibilities, an assessment against relevant comparator groups and internal relativities.
– An increase above the maximum noted above for executives who are not directors may be made in the event of internal promotion or increase in responsibility or where the executive’s base salary is significantly below market positioning.
– Benchmarking is undertaken periodically but not annually, and our intention is to apply judgment in evaluating market data.
– We pay competitive salaries to hire, motivate and retain highly competent people.
Pension or superannuation
– Employment benefits typically include participation in a pension plan, superannuation fund, or a cash allowance to contribute to a personal pension or superannuation fund, which are aligned with the arrangements for the broader workforce of the country of residence.
– For appointments made from 1 June 2018, the maximum level of company contribution to an individual executive director’s scheme annually is 25 per cent of base salary. For appointments prior to 1 June 2018 the maximum was 35 per cent.
– We provide locally competitive post employment benefits in a cost-efficient manner in order to hire and retain.
Other benefits – Other benefits may include, but are not limited to, private healthcare cover for the executive
and their dependants, company car or allowance, car parking, life insurance, accident insurance, provision of company-provided transport/chauffeur, professional advice, participation in local flexible benefit programmes and certain other minor benefits (including modest retirement gifts in applicable circumstances, occasional spouse travel in support of the business and any Rio Tinto business expenses which are deemed to be taxable and where the company has paid the tax on their behalf).
– Secondment, relocation and localisation benefits (for example, housing, tax equalisation, cost of living allowance, the payment of school fees, periodic visits home for the executive and their family and where relevant, localisation payments) may also be made to and on behalf of executives living outside their home country. Examples of these types of payments are set out in the Implementation Report.
– Other benefits are paid at cost and, given the nature and variety of the items, there is no formal maximum level of company contribution.
– We provide competitive other benefits in a cost-efficient manner in order to hire and retain.
Remuneration report | Remuneration policy extracts Annual report 2018 | riotinto.com 107
Governance
Remuneration arrangements – Performance-related (At risk) Link to Group performance and strategy
Short-Term Incentive Plan (STIP) – 25 per cent of maximum is awarded for threshold performance; 50 per cent for target; and 100 per
cent for outstanding. Between threshold and target, and between target and outstanding, the award is pro-rated on a straight line basis. In the case of executive directors, the percentage award is multiplied by 1.2. The maximum award is capped at 200 per cent of base salary for all executives. Any outcome from the formulaic STIP calculation is subject to the exercise of discretion by the Committee.
– A scorecard based on the Group’s five priorities is established for each executive at the commencement of the financial year. The measures and the relative weightings are selected by the Committee in order to drive business performance for the current year, including the achievement of financial, safety and other individual business outcomes that are priorities for the financial year in question. At least 50 per cent of the measures will relate to financial performance and a significant component will relate to safety performance.
– The measures, weightings and targets are reviewed annually and are included either prospectively or retrospectively each year in the Implementation Report. The Committee retains flexibility to determine the measures, weightings and targets as appropriate, based on the outcomes of its annual review.
– We expect to disclose the measures, weightings and targets for safety goals at the beginning of each year. In the area of financial and individual goals, we will, at the beginning of each year, disclose the measures and weightings only, because we regard the targets as commercially sensitive. However, we intend to disclose these targets and outcomes retrospectively. In the rare instances where this may not be prudent on grounds of commercial sensitivity, we will seek to explain why, and give an indication of when they will be disclosed.
– Threshold, target and outstanding performance levels are established for all STIP measures to help drive high levels of business and individual performance.
– The central or “base” plan delivers what the board considers to be target performance. Target performance is intended to be stretching. Probability factors are then applied, based upon a range of potential operating and cost scenarios, to establish the threshold and outstanding performance levels. These threshold (below target), target, and outstanding (above target) levels are determined by the Committee at the beginning of each performance year.
– In making its year-end determination of STIP awards, the Committee seeks to ensure that actual performance is directly comparable to the targets set at the beginning of the year. This may result in adjustments to the targets or to the assessed results being made by the Committee (in particular to take account of events outside management’s control), to ensure a like-for-like comparison. Both upward and downward adjustments can be made, with reference to principles agreed by the Committee, to ensure the outcomes are fair.
– Safety KPIs comprise a significant portion of the STIP for executives, and any fatality will have a material impact on the STIP result for all executives.
– STIP focuses participants on achieving demanding annual performance goals, which are based on the Group’s five priorities, in pursuit of the creation of sustainable shareholder value.
– We demand that sustainable business practices are adhered to, particularly in the context of safety.
– When reviewing the outcome of the awards under the STIP the Committee will, when evaluating overall safety, financial, Group and individual performance, consider the overall fairness against original expectations and shareholder experience.
– Any discretionary adjustments for directors will be disclosed in the Implementation Report for the financial period.
– We consider the individual performance of our executives against our values. The way we work outlines how we deliver both our purpose and strategy. It makes clear how all employees should behave, in accordance with our values of safety, team work, respect, integrity and excellence.
Bonus Deferral – Fifty per cent of the STIP is delivered in bonus deferred shares under the EIP with the remainder
of the STIP delivered in cash with no deferral. Prior to 2018, bonus deferred share awards were made under the Bonus Deferral Plan (BDP).
– The bonus deferred shares vest in the December of the third year after the end of the STIP performance year to which it relates.
– The number of shares that vest is increased by reference to the dividends paid in the deferral period.
– Bonus deferred shares vest on a change of control. – Given the mandatory nature of the deferral and the absence of performance conditions, bonus
deferred shares are treated as “owned” from the award date for the purposes of calculating an executive’s shareholding level.
– Malus, claw-back and suspension provisions that apply are set out later in the Remuneration Policy.
– Bonus Deferral ensures ongoing alignment between executives and shareholders through deferral of 50 per cent of STIP awards into Rio Tinto shares.
Remuneration policy extracts continued
Governance | Remuneration report
Annual report 2018 | riotinto.com108
Remuneration report | Remuneration policy extracts
Remuneration arrangements – Performance-related (At risk) Link to Group performance and strategy
Performance Share Awards (PSA) under the Long Term Incentive Plan (LTIP) – PSA granted under the EIP will be conditional share awards that vest subject to the achievement
of stretching performance conditions, comparing Rio Tinto’s TSR relative to the EMIX Global Mining Index (50 per cent) and to the MSCI World Index (50 per cent).
– Full vesting is only achieved if Rio Tinto’s relative TSR significantly outperforms the TSR of both indices. The outperformance required for full vesting is considered by the Committee to be very stretching. The TSR measure excludes stock repurchases on the basis that these would be reflected via our share price.
– The current level of outperformance required for full vesting is 6 per cent per annum over five years. However, for each award the Committee will determine the level of outperformance required against the indices on a per annum basis or on a compounded basis over the five-year period, in order for the whole of the award to vest.
– Each component of the award will be assessed independently. Details of the TSR targets and vesting schedules for the year under review and for the following year will be set out in the Implementation Report each year.
– Awards have a maximum face value of 438 per cent of base salary (ignoring dividend equivalents as described below).
– The awards have been calculated independently by our consultants (Willis Towers Watson) to have an expected value of approximately 50 per cent of face value. Expected value is face value adjusted for the probability of the performance target being met.
– Threshold performance, as explained in the Implementation Report, would result in the vesting of 22.5 per cent of the face value of an award.
– The maximum expected value of PSA is 219 per cent of base salary (ie 438 per cent x 50 per cent). The maximum threshold value is 98.6 per cent of base salary (ie 438 per cent x 22.5 per cent).
– Actual award levels may vary for each executive and are included in the Implementation Report. – If vesting is achieved, participants are entitled to receive a number of additional shares whose
market value reflects the aggregate cash amount of dividends that would have been received had the shares which have vested at the end of the performance period been held throughout the performance period.
– Where permitted by the plan rules, and where the Remuneration Committee so decides, awards may be made or satisfied in cash in lieu of shares.
– Awards and performance conditions may be adjusted to take account of variations of capital and other transactions. Subject to this Policy, performance conditions may also be amended in other circumstances if the Committee considers that a changed performance condition would be a fairer measure of performance.
– If there is a change of control, awards will vest to the extent performance conditions are then satisfied. Unless the Committee determines otherwise, if the change of control happens during the first 36 months from the date of grant of the award, the number of shares that can vest will be reduced pro rata to that 36-months period. The Committee may, alternatively, with agreement of an acquiring company, replace awards with equivalent new awards over shares in the acquiring company.
– The Committee retains the discretion, where circumstances warrant, to amend performance conditions under the relevant plan rules. The Committee will seek to ensure that outcomes are fair and that they take account of the overall performance of the company during the performance period.
– Malus, claw-back and suspension provisions that apply are set out later in the Remuneration Policy.
– PSA are designed to provide a simple and transparent mechanism for aligning executive reward with the execution of an effective business strategy that delivers superior long-term shareholder returns.
– Award levels are set to incentivise long-term performance and to contribute towards the competitiveness of the overall remuneration package.
– Relative TSR has been chosen as the most appropriate measure as it allows for an objective external assessment over a sustained period on a basis that is familiar to shareholders.
– How performance is generated is as important as what level of performance is delivered. Before vesting, the Committee will satisfy itself that relative TSR is an appropriate measure of the underlying performance of the business, and may adjust vesting accordingly.
Notes to the policy table The major change to the Remuneration Policy in 2018 is the removal of the relative EBIT margin improvement measure from the PSA. For PSA granted from 2013 until 2017 (under the 2013 Performance Share Plan), conditional share awards vest subject to the achievement of stretching performance conditions, comparing Rio Tinto’s performance against: – One-third: TSR relative to the EMIX Global Mining Index; – One-third: TSR relative to the MSCI World Index; and – One-third: improvement in EBIT margin relative to the global mining
comparators which will be listed in the Implementation Report each year.
Each component of the award will be assessed independently. With respect to the EBIT margin measure, in order to ensure that outcomes are fair and that business performance has been appropriately taken into account, the
Committee will consider, on a discretionary basis, any specific, significant, unusual, “below the line” items (eg impairments) reported by Rio Tinto or its peers during the performance period to ensure genuine comparability when determining any level of vesting indicated by third-party data (currently S&P Capital IQ). The application of any such discretion will be disclosed.
Long-term incentive awards made prior to 2018, which may vest should the relevant performance conditions be satisfied, are permitted under this Policy. Details of awards granted prior to 2018, which have yet to vest, including their respective performance conditions, are provided in the Implementation Report.
Annual report 2018 | riotinto.com 109
Governance
Malus, claw-back and suspensionSubject to approval by shareholders at the 2018 AGMs, “malus”,“claw-back” and “suspension” provisions will apply to LTIP awards, including awards granted in connection with deferred bonuses under the EIP.
Under both the “malus” and “claw-back” provisions, where the Committee determines that an exceptional circumstance has occurred, the Committee may, at its discretion, reduce the number of shares to be received on vesting of an award, or, for a period of two years after the vesting of an award, the Committee can claw-back value from a participant.
The circumstances under which the Committee exercises such discretion may include, inter alia: – any fraud or misconduct by a participant or an exceptional event which
has had, or may have, a material effect on the value or reputation of any member of the Group (excluding an exceptional event or events which have a material adverse effect on global macroeconomic conditions);
– an error in the Group’s financial statements which requires a material downward restatement or is otherwise material or where information has emerged since the award date which would have affected the size of award granted or vested;
– where the Committee determines that the personal performance of a participant, of their product group or of the Group does not justify vesting or where the participant’s conduct or performance has been in breach of their employment contract, any laws, rules or codes of conduct applicable to them or the standards reasonably expected of a person in their position;
– the performance of the company, business or undertaking in which a participant worked or works or for which he or she was or is directly or indirectly responsible is found to have been misstated or based upon any material misrepresentation and which resulted in the award being granted and/or vesting over a greater number of shares than would otherwise have been the case;
– where any team, business area, member of the Group or profit centre in which the participant works or worked has been found guilty in connection with any regulatory investigation or has been in breach of any laws, rules or codes of conduct applicable to it or the standards reasonably expected of it; or
– a catastrophic safety or environmental event or events occurring in any part of the Rio Tinto Group.
Under the suspension provisions, the Committee may suspend the vesting of an award (for up to five years) until the outcome of any internal or external investigation is concluded and may then reduce or lapse the participant’s award based on the outcome of that investigation. Note that where suspension applies, the 24-month claw-back period will not extend beyond the period commencing from the original vesting date.
Recruitment remunerationFor both internal and external recruitment, we aim to position base salary at an appropriate level, taking into consideration a range of factors including the executive’s current remuneration and experience, internal relativities, an assessment against the relevant comparator groups and cost.
Other elements of remuneration will be established in line with this Remuneration Policy.
In the case of internal appointments, existing commitments will be honoured.
If the Committee concludes that it is necessary and appropriate to secure an appointment, relocation-related support and international mobility benefits may be provided depending on the circumstances. Any relocation arrangements will be set out in the Implementation Report.
Any compensation provided to an executive recruited from outside the Group for the forfeiture of awards under variable remuneration arrangements entered into with a previous employer is considered separately to the establishment of forward-looking annual remuneration arrangements. Our policy with respect to such “buyouts” is to determine a reasonable level of award, on a like-for-like basis, consisting primarily of equity-based awards, but also potentially cash or restricted stock, taking into consideration the quantum of forfeited awards, their performance conditions and vesting schedules. The Committee will obtain an independent external assessment of the value of awards proposed to be bought out and retains discretion, subject to the considerations noted above, to make such compensation as it deems necessary and appropriate to secure the relevant executive’s employment. The Committee’s intention is that buy-out compensation should include, where appropriate, performance conditions and an equivalent deferral period.
No form of “golden hello” will be provided upon recruitment.
Executives’ service contracts and terminationUnder normal circumstances, executive directors will be offered service contracts which can be terminated by either party with up to 12 months’ notice in writing, or immediately by paying the base salary only in lieu of any unexpired notice. In exceptional circumstances, an initial notice period of up to 24 months during the first two years of employment, reducing to up to 12 months thereafter, may be necessary to secure an external appointment. In some circumstances, it may also be appropriate to use fixed-term contracts for executive directors. For new appointments, if the company terminates by making a payment in lieu of notice, the Committee will for executive directors (to the extent permitted by relevant law) have regard to the executive director’s ability to mitigate his or her loss in assessing the payment to be made.
Remuneration policy extracts continued
Governance | Remuneration report
Annual report 2018 | riotinto.com110

Remuneration report | Remuneration policy extracts
The letters of appointment are available for inspection at Rio Tinto plc’s registered office, and at its AGM.
Other executives are offered service contracts which can be terminated by the company with up to 12-months’ notice in writing, and by the employee with six-months’ notice in writing, or immediately by the company by paying the base salary only in lieu of any unexpired notice. For the chief executive and for executives appointed from 1 January 2018, notice may be paid progressively in instalments over the notice period.
The current contract terms of both directors and the other executives are included in the Implementation Report.
Executives may be required to undertake “garden leave” during all or part of their notice period and may receive their base salary, STIP and other benefits during the notice period (or the cash equivalent). Where applicable, tax equalisation and other expatriate benefits will continue in accordance with the executive’s prevailing terms and conditions.
In the case of dismissal for cause, the company can terminate employment without notice and without payment of any salary or compensation in lieu of notice. Outstanding awards under any of the Group’s long-term incentive plans may be forfeited in these circumstances.
Accrued but untaken annual leave and any long service leave will be paid out on termination, in accordance with the relevant country legislation and applicable practice applying to all employees. For eligible leavers (as defined below) in Australia, the value of the leave is calculated on the basis of base salary, target STIP and car allowance. No STIP is included where the executive is not an eligible leaver.
If termination is a result of redundancy, the terms of the relevant local policy will apply in the same way as for other local employees.
On termination, the company will pay relocation or expatriation benefits as agreed at the time of the original expatriation and/or in accordance with applicable policies on travel and relocation.
On termination other than for cause, the company may make a payment in consideration for entry by the departing executive director into appropriate restrictive covenants to protect Rio Tinto and its shareholders. The amount of such payment will be determined by the Committee based on the content and duration of the covenant.
Following termination, executive directors may be eligible to receive long-term incentive awards under the conditions described in the sections following. They and their dependants may also be eligible for post-retirement benefits such as medical and life insurance. The company may also agree to continue certain other benefits for a period following termination where the arrangements are provided under term contracts or in accordance with the terms of the service contract, for example, payment for financial advice, tax advice and preparation of tax returns for a tax year. In some cases, they may receive a modest retirement gift.
Subject to the approval of the Committee the company may pay such amount as it determines is reasonable to settle any claims that an executive director may have in connection with the termination of his or her employment. The company may also pay reasonable legal and other professional fees (including outplacement support) to or in respect of a director in connection with the termination of his or her employment. These may include legal fees incurred in negotiating a settlement agreement with Rio Tinto. In assessing what is reasonable, the company will take account of prevailing rates for such advice and support and determine an appropriate level of contribution based on the complexity of the issues.
Treatment of STIP and LTIP on terminationThe STIP and LTIP rules govern the entitlements that executive participants may have under those plans upon termination of employment.
The concept of an “eligible leaver” is defined in the relevant plan rules. In general terms, an eligible leaver is an executive who leaves the Group by reason of ill-health, injury, disability (as determined by the executive’s employer); retirement; redundancy; transfer of the undertaking in which the executive works; change of control of the executive’s employing company; or death. Usually there is discretion for the Committee to treat an executive as an eligible leaver.
STIPIf an eligible leaver leaves the Group during a performance year, the Committee may determine in its absolute discretion to award a pro rata portion of the STIP based on the amount of the year served and based on actual assessment of performance against targets. Any cash payment will be made at the normal STIP payment date and no portion of the award will be deferred into shares.
If an executive provides the company notice of their resignation during the performance year, but does not leave the Group until after the end of the performance year, the Committee may determine in its absolute discretion to make an award under the STIP. In these circumstances, the executive will only be eligible to receive the cash portion of the award and will forfeit the deferred shares portion. Any cash payment will be made at the normal STIP payment date.
No STIP award will be made where an executive who is not an eligible leaver leaves the Group, resigns or is terminated for cause prior to the end of the performance year.
Bonus deferred shares under the EIP and grants under the BDP (2013-2017)For grants made to executives, awards will normally vest on the scheduled vesting date. There will be no pro rata reduction of awards and any dividend equivalent shares will be calculated on the vested shares.
If the executive resigns or is dismissed for misconduct, or for any other reason that the Committee decides, the awards will lapse.
Performance Share Awards under the EIP and Performance Share Plan (2013-2017)For grants made to executives from and including 2013, awards will normally be retained, and vest at the scheduled vesting date. Unvested awards remain subject to the satisfaction of the performance conditions. Any dividend equivalent shares will be calculated on the vested shares at vesting.
If the executive leaves the Group during the first 36 months from the date of grant of the award, the number of shares that can vest will be reduced pro rata over that 36-month period.
Awards will vest immediately on death, but if an executive dies during the first 36 months from the date of grant of the award, the number of shares that vest will be reduced pro rata over that 36-month period.
If the executive resigns or is dismissed for misconduct, or for any other reason that the Committee decides, the awards will lapse.
Where permitted by the plan rules, and where the Remuneration Committee so decides, awards may be made or satisfied in cash in lieu of shares.
Annual report 2018 | riotinto.com 111
Governance

Management Share Awards under the EIP and grants under the Management Share Plan (MSP) (prior to 2018)Awards are only made to executives prior to their appointment as an Executive Committee member, except under the circumstances described in the “Recruitment remuneration” section above. All retained awards will be reduced pro rata to reflect the proportion of the period between the date of grant of the award and the normal vesting date which has not elapsed at the time employment ceased. Any dividend equivalent shares will be calculated on the vested shares. Awards vest on death, subject to the pro rata reduction described above, unless the Committee decides otherwise.
For grants made to executives, awards will normally be retained, and vest, at the Committee’s discretion, at the scheduled vesting date (although awards for US taxpayers may vest on leaving).
If the executive resigns or is dismissed for misconduct, or for any other reason that the Committee decides, the awards will lapse.
All employee share plansFor grants made to executives, awards will normally vest on or shortly after leaving. There will be no pro rata reduction of awards and any dividend equivalent shares will be calculated on the vested shares.
If the executive resigns or is dismissed for misconduct, or for any other reason that the Committee decides, the awards will lapse.
Chairman and non-executive directors’ remunerationChairmanIt is Rio Tinto’s policy that the chairman should be remunerated on a competitive basis and at a level which reflects his or her contribution to the Group, as assessed by the board.
The Committee (excluding the chairman, if he or she is a member) determines the terms of service and remuneration of the chairman. The chairman’s fees are set by the Committee.
The chairman receives a fixed annual fee and does not receive any additional fee or allowance either for committee membership or chairmanship, or for travel. The chairman does not participate in the Group’s incentive plans.
The chairman may be provided with a car and driver. Any use for transport between home and the office and other personal travel is a taxable benefit to the chairman, and the company pays any tax arising on the chairman’s behalf. The chairman pays a fixed annual fee to the company for the personal travel element.
Relocation and localisation benefits in accordance with the policy for executive directors (for example, housing, tax equalisation, cost of living allowance, the payment of school fees, periodic visits home for the executive and their family and where relevant, localisation payments) may be made to and on behalf of a chairman working outside their home country. Any instances of these types of payments will be set out in the Implementation Report.
Other benefits include private healthcare cover, accident insurance (note this is neither contractual nor a taxable benefit), other minor benefits (including modest retirement gifts in applicable circumstances), occasional spouse travel in support of the business and any Rio Tinto business-related expenses which are deemed to be taxable where the company has paid the tax on his or her behalf. Rio Tinto does not pay retirement or post-employment benefits to the chairman.
Non-executive directorsFees paid to non-executive directors reflect their respective duties and responsibilities and the time required to be spent by them so as to make a meaningful and effective contribution to the affairs of Rio Tinto.
The non-executive directors’ fees and other terms are set by the board upon the recommendation of the Chairman’s Committee (which comprises the chairman, chief executive and chief financial officer).
Non-executive directors receive a fixed annual fee comprising a base fee, committee membership or committee chairmanship fee or senior independent director fee, as applicable, and allowances for attending meetings which involve medium or long-distance air travel. They do not participate in any of the Group’s incentive plans.
Where the payment of statutory minimum superannuation contributions for Australian non-executive directors is required by Australian superannuation law, these contributions are deducted from the director’s overall fee entitlements.
Non-executive directors may on occasion receive reimbursement for costs incurred in relation to the provision of professional advice. These payments, if made, are taxable benefits to the non-executive directors and the tax arising is paid by the company on the director’s behalf.
Other benefits provided include accident insurance (note this is neither contractual nor a taxable benefit), other minor benefits (including modest retirement gifts in applicable circumstances), occasional spouse travel in support of the business and any Rio Tinto business expenses which are deemed to be taxable where the company has paid the tax on their behalf. Rio Tinto does not pay retirement or post-employment benefits to non-executive directors.
Remuneration policy extracts continued
Governance | Remuneration report
Annual report 2018 | riotinto.com112
Remuneration report | Implementation report
Implementation report
IntroductionThis Implementation report is presented to shareholders for approval at our AGMs. It outlines how our Remuneration Policy was implemented in 2018, and how we intend to operate it in 2019.
The single total figure of remuneration tables on pages 116, 119 and 120 show remuneration for executives, gross of tax and in the relevant currency of award or payment.
In table 1a on page 130, we report information regarding executives in accordance with Australian statutory disclosure requirements. The information is shown gross of tax and in US dollars. The remuneration details in table 1a include accounting values relating to various parts of the remuneration package, most notably Performance Share Awards (PSA) granted under the Group’s Long Term Incentive Plan (LTIP) arrangements, and require a different methodology for calculating the pension value. The figures in the single total figure of remuneration tables are therefore not directly comparable with those in table 1a. Where applicable, amounts have been converted using the relevant average exchange rates included in the notes to table 1a(a).
In table 1b on page 132, we report the remuneration of the chairman and the non-executive directors.
Certain information contained within the Remuneration report is audited, as outlined on page 141.
Remuneration Committee responsibilitiesThe Committee’s responsibilities are set out in our terms of reference, which we review each year and are published in the corporate governance section of the Rio Tinto website. Our responsibilities include: – determining the Group’s remuneration structure and policies, and
assessing their cost, including pension and superannuation arrangements for executives
– determining the mix and use of short- and long-term incentive plans for executives
– overseeing the operation of the Group’s short- and long-term incentive plans for executives, including approving awards, setting performance criteria, and determining any vesting
– determining contractual notice periods and termination commitments, and setting retention and termination arrangements for executives
– determining awards under the Group’s all-employee share plan – monitoring gender pay – determining the terms of service upon appointment for the chairman
and executives, and any subsequent changes.
We take account of the level of pay and conditions throughout the Group when determining executive remuneration.
Committee membershipThe members of the Committee during the year and to the date of this report were:
Sam Laidlaw (chairman) (chairman from 5 March 2018)
Ann Godbehere
Megan Clark
Moya Greene (from 17 September 2018)
Simon McKeon (from 1 January 2019)
Paul Tellier (to 2 May 2018)
Simon Thompson (chairman to 5 March 2018)
Jan du Plessis (to 5 March 2018)
How we workWhen needed, we invite executives and members of senior management to attend meetings to provide information. In 2018, these included Jean-Sébastien Jacques (chief executive), Vera Kirikova (Group executive, Human Resources), John Beadle (head of Performance & Reward until 22 May 2018), Alex Wayne (head of Executive Reward from 23 May 2018), and Steve Allen (Group company secretary). They were not present when matters associated with their own remuneration were considered. The Committee will normally hold private sessions at Committee meetings where no executives or managers are present.
Independent advisersDuring 2018, the Committee engaged Willis Towers Watson as independent advisers; they reported to the Committee and not to management. Willis Towers Watson was the only remuneration consultant which provided remuneration recommendations to the Committee during 2018.
The Committee has a protocol for engaging and working with remuneration consultants to ensure that “remuneration recommendations” (being advice relating to the elements of remuneration for key management personnel, as defined under the Australian Corporations Act) are made free from undue influence by key management personnel to whom they may relate. We monitored compliance with these requirements throughout 2018. Willis Towers Watson gave declarations to the effect that its remuneration recommendations were made free from undue influence by key management personnel to whom they related, and the board has received assurance from the Committee and is satisfied that this was the case.
Willis Towers Watson is a member of the Remuneration Consultants’ Group, and voluntarily operates under its Code of Conduct (the Code) in relation to executive remuneration consulting in the UK. The Code is based upon principles of transparency, integrity, objectivity, competence, due care and confidentiality. Willis Towers Watson has confirmed that it adhered to the Code throughout 2018 for all remuneration services provided to Rio Tinto. The Code is available online at remunerationconsultantsgroup.com.
The Committee is content that Willis Towers Watson did not have any connections with Rio Tinto that impaired its independence. In addition to providing remuneration recommendations, in 2018 Willis Towers Watson’s services included attending Committee meetings and giving advice in relation to management proposals. Willis Towers Watson was paid US$259,919 (2017: US$374,434) for these services.
Willis Towers Watson also provided general and technical executive remuneration services. These services included advice about remuneration of employees other than key management personnel, and advice about the preparation of the 2018 Remuneration report. We received other services and publications relating to remuneration data from a range of sources.
(a) UK and Australian remuneration figures are generally not comparable due to the different methodologies required to calculate various parts of the remuneration packages, most notably LTIP arrangements and the value of pension or superannuation.
Annual report 2018 | riotinto.com 113
Governance
How the Committee spent its time in 2018During 2018, the Committee met six times. We fulfilled our responsibilities as set out in our terms of reference.
Our work in 2018 and in the early part of 2019 included: – reviewing and determining any base salary adjustments for executives – reviewing and determining “threshold”, “target” and “outstanding”
targets for the safety and financial components of the 2018 STIP – reviewing actual performance against the targets for the 2018 STIP and
assessing applicable adjustments – reviewing and determining the final EBIT margin outcome for PSA with
a performance period ending 31 December 2017 – reviewing and determining the total shareholder return (TSR) outcome
and the estimated EBIT margin outcome for PSA with a performance period ending 31 December 2018
– reviewing and determining LTIP grants for the executives in 2019 – determining the terms of appointment for the new chief financial officer,
Jakob Stausholm – acting in accordance with the terms of the deferral agreement for the
former chief executive officer, Sam Walsh – reviewing the strategy and annual reports on the Group’s global
benefit plans – considering the Group’s response to the updated UK Corporate
Governance Code and related UK legislation in respect of executive remuneration
– reviewing progress towards the Group’s share ownership requirements; – determining the 2019 STIP targets; and – preparing the Remuneration report (including this
Implementation report).
We describe the performance targets for PSA granted under the LTIP, and the company’s approach to performance targets under the STIP, in the executive remuneration structure table on pages 108 to 109.Our approach to the commercial sensitivity of certain targets is discussed below.
Performance review process for executivesRio Tinto conducts annual performance reviews for all its executives. Our key objectives for the performance review process are to: – improve organisational effectiveness by creating alignment between
the executive’s objectives and Rio Tinto’s strategy – provide a consistent, transparent and balanced approach to measure,
recognise and reward executive performance.
The chief executive conducts the review for members of the Executive Committee, and recommends the performance outcomes to the Committee. The chief executive’s performance is assessed by the chairman of the board. Performance reviews for all executives took place in 2018 or early 2019.
Share ownership policy for executivesThe Group understands the importance of aligning executives’ interests with those of shareholders and expects executives to build up and maintain a material shareholding. Executives should aim to reach a share ownership (defined below) in Rio Tinto shares equivalent in value to:
Share ownership requirement
Chief executive 4 x base salary
Other executives 3 x base salary
The Committee expects executives to build up their shareholding over a five-year period by holding shares that vest under the LTIPs. We may accept longer periods for new hires, given the five-year vesting periods for PSA.
Shares are treated as “owned” if they are not subject to restriction, which includes shares directly held by an executive and any shares where there is
a beneficial interest. A beneficial interest includes any shares for which an executive receives the benefit of ownership (such as a right to receive dividends) without directly owning the shares. Given its mandatory nature and the absence of performance conditions, a value for unvested bonus deferred shares is included with a 50% discount for the likely effects of taxation.
We also have shareholding requirements for senior management who are not members of the Executive Committee.
We set out details of executives’ beneficial interests in Rio Tinto shares in table 2 on page 133. Awards of shares and options under long-term incentive plans are shown in table 3 on pages 134 to 136.
Executives’ external and other appointmentsOur executives may be invited to become non-executive directors of other companies. Our policy is that such appointments can bring benefits to the Group by broadening the experience and knowledge of executives; so where there is no likelihood of a conflict of interest, the board will normally consent. Our policy limits each executive’s external appointment to one FTSE 100 company directorship or equivalent. The executive typically retains any fees earned.
Neither of the executive directors currently has an external directorship.
Performance and impact on 2018 STIPSafety as a key performance measureOur goal is zero harm, including, above all, the elimination of workplace fatalities, so we consider safety as a key performance measure. We include Group safety measures alongside Group financial measures in the STIP for executive directors and Group executives. The STIP measures for product group chief executive officers (PGCEOs) include product group financial and safety measures in addition to Group financial measures.
Safety measures for all executives in 2018 included a standalone binary fatality measure (40%), with the remainder split between all injury frequency rate (AIFR) (30%) and measures relating to critical risk management (CRM) (30%).
Financial measures that reflect our KPIsOur current financial measures are based on KPIs that are used in managing the business.
The first, underlying earnings, gives insight to cost management, production growth and performance efficiency on a like-for-like basis. This reflects the fact that Rio Tinto is focused on reducing operating costs, increasing productivity and generating maximum revenue from each of our assets. A reconciliation of net earnings/(losses) to underlying earnings is provided in note 2 (Operating segments) on page 167.
The second, STIP free cash flow, is also an important measure to the business. It demonstrates how we convert underlying earnings to cash, and provides further insight into how we are managing costs and increasing efficiency and productivity. STIP free cash flow comprises net cash generated from operating activities, less purchases of property, plant and equipment and intangible assets, plus sales of property, plant and equipment and intangible assets, adjusted to exclude dividends paid to holders of non-controlling interests in subsidiaries and development capital expenditure.
When we measure financial performance against the annual plan, half is measured against the original plan, and half is “flexed” to exclude factors that are outside management’s control, such as the impact of fluctuations in exchange rates, or quoted metal and other prices. “Flexed” financial targets are typically higher than the “unflexed” targets set by the board when commodity prices rise, as was the case in 2018, and lower when commodity prices fall. Actual underlying earnings and STIP free cash flow results are compared against equally weighted “flexed” and “unflexed” targets.
Implementation report continued
Governance | Remuneration report
Annual report 2018 | riotinto.com114
Remuneration report | Implementation report
Safety performanceThree people lost their lives while working at our managed operations in 2018. Performance against the binary fatality measure was therefore zero for all executives.
In line with our normal procedures, the Remuneration Committee sought guidance from the Sustainability Committee on safety performance for 2018. Injury rates as measured by AIFR remained similar to 2017, with the AIFR in 2018 at 0.44, compared to 0.42 in 2017. The 2018 result of 0.44 was below the threshold of 0.42.
2018 was the last year for specific inclusion of CRM in the safety STIP metrics and the majority of sites exceeded the target of achieving “sustainable” on the implementation assessment matrix. CRM verifications were well above target at 1.4 million verifications against a target of 1 million. Going forward, CRM will be incorporated into a new safety maturity metric.
The combined performance against our safety measures meant that the Group’s STIP safety result was below target. Inclusive of the binary fatality measure, the total STIP safety result for the Group was 22% of maximum, and the STIP safety results for all of the product groups were below target.
Group financial performanceHighlights of our 2018 performance can be found on pages 4 and 5. The “flexed” earnings and “unflexed” cash flow results for the Group were close to target, the “unflexed” earnings was between target and outstanding, and the “flexed” cash flow result was below target. These outcomes are reflected in the financial component of the STIP awards, for all executives. Together, the outcomes translate into a Group performance against the financial targets of 60% of maximum.
When we make our year-end determination of STIP awards, we aim to ensure that actual performance is directly comparable to the targets we set at the beginning of the year. This means making adjustments to the targets, to take account of events outside management’s control, and to ensure a like-for-like comparison. The changes made to financial STIP outcomes are based on a set of principles which are approved by the Committee. We made both upward and downward adjustments to the targets to ensure the outcomes were fair.
The most significant downward adjustments in 2018 related to divestments, primarily the disposal of our remaining coal assets in Australia and surplus land at Kitimat in Canada. In this respect, we have adjusted the operating plans of the coal assets to normalise the impact of the disposal by removing planned earnings and cash flow from target measures for the period following divestment. In addition, we have removed the impact of the gains on disposal related to Valeria and Winchester South. Similarly, we removed the impact of the cash receipts related to the disposal of these two undeveloped properties, as well as the cash proceeds from the Kitimat land transaction. We have adjusted out the related impacts, namely, lower net interest, as a result of lower net debt driven by proceeds received from the disposal of our coal assets in Australia.
The most significant upward adjustment related to the strike at our iron ore operations in Canada, which were suspended on 27 March 2018 whilst collective bargaining negotiations took place with the local union workforce. The workforce returned on 28 May 2018. A safe and successful restart of operations to normal production rates was achieved by the end of June 2018.
These events accounted for over 90% of all adjustments. The adjustment process decreased the Group’s result against the financial targets from 63% to 60% of maximum (2017: from 56% to 67% of maximum).
Aggregate resultsThe aggregate results for Group safety and financial measures are set out in the table below. The outcomes for the executive directors, with commentary on key highlights on performance against individual objectives, are on pages 117, 119 and 121. Details for other executives are on page 123.
Group measures Weight (%)Result (% of
maximum)Weighted
result
Group safety(a) 20.0 22.0 4.4
Underlying earnings 12.5 90.0 11.2
Underlying earnings – flexed 12.5 53.0 6.6
STIP free cash flow 12.5 58.0 7.3
STIP free cash flow – flexed 12.5 39.0 4.9
Group financial 50.0 60.0 30.0
Safety and financial measures(b) 70.0 49.1 34.4
Individual measures(c) 30.0 – –
Total(c) 100.0 – –
(a) This includes the impact of the binary fatality measure in 2018.(b) The weighted result represents the total Group safety and financial measures result (as
a percentage of maximum) weighted based on the total STIP opportunity of 70% allocated to the safety and financial measures.
(c) The outcomes against individual measures for executive directors and the total result for executives are included in the following pages.
STIP individual measures for 2018The individual measures that were set by the chairman for the chief executive, and by the chief executive for other executives, were based on our five priorities: safety, people, cash, partnership and growth.
Details of the outcomes against the individual measures are provided in the sections relating to each executive director. The total result is shown for other executives.
Performance and impact on LTIP vesting outcome for the period ended 31 December 2018The conditional share awards granted on 17 March 2014 vest subject to the achievement of performance conditions. These compare Rio Tinto’s performance against: – TSR relative to the EMIX Global Mining Index – one-third – TSR relative to the MSCI World Index – one-third – Improvement in EBIT margin relative to global mining
comparators – one-third.
Our remuneration consultants, Willis Towers Watson, calculate performance against the TSR measures.
The dual TSR measures recognise that the company competes in the global market for investors as well as within the mining sector, and aligns to the philosophy of rewarding executives for stable returns over the long term relative to the broader market and the mining sector.
Performance against TSRRio Tinto outperformed the EMIX Global Mining Index by 37.4% for the five-year performance period starting 1 January 2014 and ending on 31 December 2018. This equated to an outperformance of 6.6% per annum – which is above the required level of outperformance required for full vesting against this index. The vesting outcome against this index was therefore 100% (33.3% of the total award).
Rio Tinto underperformed against the MSCI World Index, resulting in a vesting level of nil against this index.
Annual report 2018 | riotinto.com 115
Governance
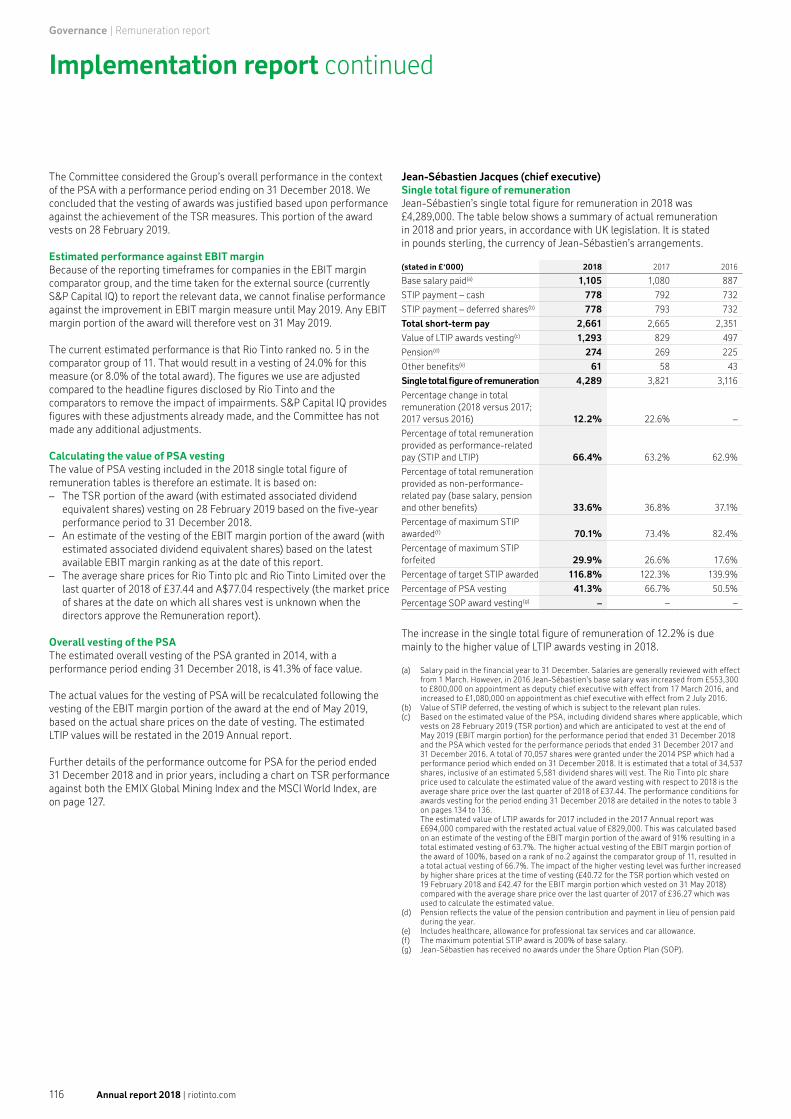
The Committee considered the Group’s overall performance in the context of the PSA with a performance period ending on 31 December 2018. We concluded that the vesting of awards was justified based upon performance against the achievement of the TSR measures. This portion of the award vests on 28 February 2019.
Estimated performance against EBIT margin Because of the reporting timeframes for companies in the EBIT margin comparator group, and the time taken for the external source (currently S&P Capital IQ) to report the relevant data, we cannot finalise performance against the improvement in EBIT margin measure until May 2019. Any EBIT margin portion of the award will therefore vest on 31 May 2019.
The current estimated performance is that Rio Tinto ranked no. 5 in the comparator group of 11. That would result in a vesting of 24.0% for this measure (or 8.0% of the total award). The figures we use are adjusted compared to the headline figures disclosed by Rio Tinto and the comparators to remove the impact of impairments. S&P Capital IQ provides figures with these adjustments already made, and the Committee has not made any additional adjustments.
Calculating the value of PSA vestingThe value of PSA vesting included in the 2018 single total figure of remuneration tables is therefore an estimate. It is based on: – The TSR portion of the award (with estimated associated dividend
equivalent shares) vesting on 28 February 2019 based on the five-year performance period to 31 December 2018.
– An estimate of the vesting of the EBIT margin portion of the award (with estimated associated dividend equivalent shares) based on the latest available EBIT margin ranking as at the date of this report.
– The average share prices for Rio Tinto plc and Rio Tinto Limited over the last quarter of 2018 of £37.44 and A$77.04 respectively (the market price of shares at the date on which all shares vest is unknown when the directors approve the Remuneration report).
Overall vesting of the PSAThe estimated overall vesting of the PSA granted in 2014, with a performance period ending 31 December 2018, is 41.3% of face value.
The actual values for the vesting of PSA will be recalculated following the vesting of the EBIT margin portion of the award at the end of May 2019, based on the actual share prices on the date of vesting. The estimated LTIP values will be restated in the 2019 Annual report.
Further details of the performance outcome for PSA for the period ended 31 December 2018 and in prior years, including a chart on TSR performance against both the EMIX Global Mining Index and the MSCI World Index, are on page 127.
Jean-Sébastien Jacques (chief executive)Single total figure of remunerationJean-Sébastien’s single total figure for remuneration in 2018 was £4,289,000. The table below shows a summary of actual remuneration in 2018 and prior years, in accordance with UK legislation. It is stated in pounds sterling, the currency of Jean-Sébastien’s arrangements.
(stated in £‘000) 2018 2017 2016
Base salary paid(a) 1,105 1,080 887
STIP payment – cash 778 792 732
STIP payment – deferred shares(b) 778 793 732
Total short-term pay 2,661 2,665 2,351
Value of LTIP awards vesting(c) 1,293 829 497
Pension(d) 274 269 225
Other benefits(e) 61 58 43
Single total figure of remuneration 4,289 3,821 3,116
Percentage change in total remuneration (2018 versus 2017; 2017 versus 2016) 12.2% 22.6% –
Percentage of total remuneration provided as performance-related pay (STIP and LTIP) 66.4% 63.2% 62.9%
Percentage of total remuneration provided as non-performance-related pay (base salary, pension and other benefits) 33.6% 36.8% 37.1%
Percentage of maximum STIP awarded(f) 70.1% 73.4% 82.4%
Percentage of maximum STIP forfeited 29.9% 26.6% 17.6%
Percentage of target STIP awarded 116.8% 122.3% 139.9%
Percentage of PSA vesting 41.3% 66.7% 50.5%
Percentage SOP award vesting(g) – – –
The increase in the single total figure of remuneration of 12.2% is due mainly to the higher value of LTIP awards vesting in 2018.
(a) Salary paid in the financial year to 31 December. Salaries are generally reviewed with effect from 1 March. However, in 2016 Jean-Sébastien’s base salary was increased from £553,300 to £800,000 on appointment as deputy chief executive with effect from 17 March 2016, and increased to £1,080,000 on appointment as chief executive with effect from 2 July 2016.
(b) Value of STIP deferred, the vesting of which is subject to the relevant plan rules. (c) Based on the estimated value of the PSA, including dividend shares where applicable, which
vests on 28 February 2019 (TSR portion) and which are anticipated to vest at the end of May 2019 (EBIT margin portion) for the performance period that ended 31 December 2018 and the PSA which vested for the performance periods that ended 31 December 2017 and 31 December 2016. A total of 70,057 shares were granted under the 2014 PSP which had a performance period which ended on 31 December 2018. It is estimated that a total of 34,537 shares, inclusive of an estimated 5,581 dividend shares will vest. The Rio Tinto plc share price used to calculate the estimated value of the award vesting with respect to 2018 is the average share price over the last quarter of 2018 of £37.44. The performance conditions for awards vesting for the period ending 31 December 2018 are detailed in the notes to table 3 on pages 134 to 136. The estimated value of LTIP awards for 2017 included in the 2017 Annual report was £694,000 compared with the restated actual value of £829,000. This was calculated based on an estimate of the vesting of the EBIT margin portion of the award of 91% resulting in a total estimated vesting of 63.7%. The higher actual vesting of the EBIT margin portion of the award of 100%, based on a rank of no.2 against the comparator group of 11, resulted in a total actual vesting of 66.7%. The impact of the higher vesting level was further increased by higher share prices at the time of vesting (£40.72 for the TSR portion which vested on 19 February 2018 and £42.47 for the EBIT margin portion which vested on 31 May 2018) compared with the average share price over the last quarter of 2017 of £36.27 which was used to calculate the estimated value.
(d) Pension reflects the value of the pension contribution and payment in lieu of pension paid during the year.
(e) Includes healthcare, allowance for professional tax services and car allowance. (f) The maximum potential STIP award is 200% of base salary.(g) Jean-Sébastien has received no awards under the Share Option Plan (SOP).
Implementation report continued
Governance | Remuneration report
Annual report 2018 | riotinto.com116

Remuneration report | Implementation report
Base salaryThe Committee increased Jean-Sébastien’s base salary by 2.5% with effect from 1 March 2019. This was consistent with the salary budget for other UK-contracted employees.
2019 2018 % change
Base salary (stated in £’000) 1,138 1,110 2.5
STIP individual objectives for 2018Jean-Sébastien’s performance against his individual objectives is summarised below:Category Performance
Safety – Provided strong, visible leadership through multiple site visits and engaging with our workforce to drive an outcome of zero fatalities.
– Oversaw good progress in the implementation of the Process Safety Standard and the maturation of the CRM programme.
– Delivered a reduction in Tier 1 process safety and environmental incidents.
– Drove the development of our revised sustainability strategy and our first TCFD report.
– Engaged on sustainability issues through ESG investor seminars in the UK and Australia.
People – Engaged actively with leaders and employees globally, including multiple site visits, town hall meetings and small group discussions.
– Employee engagement scores (eNPS and eSAT) showed continued improvement.
– Successfully implemented the Group purpose (“pioneering progress”) and values.
– Improved executive succession planning and leadership development.
– Improved gender diversity in senior management and operational roles, and continued to build an inclusive culture.
Cash – Strengthened the portfolio and created value through the divestment of our coking coal assets, Dunkirque, the Kitimat land holding and Grasberg.
– Progressed the ‘mine to market’ productivity agenda, providing a solid platform for further progress in 2019.
– Embedded the operating hubs and centres of technical expertise, laying the foundation for increased productivity and a reduction in cost.
– Led the generation of operating cashflow of US$11.8bn and announced shareholder returns of US$13.5bn during 2018.
Partnership – Drove the launch of our partnership with Alcoa, supported by Apple and the governments of Canada and Quebec, as well as other innovative partnerships with Nespresso and TAFE Western Australia.
– Defended and extended our licence to operate, despite challenging conditions in several key countries and markets.
– Oversaw the implementation of Rio Tinto brand campaigns in Australia and Canada.
– Further matured our strategic partnerships with China, including the launch of a joint Rio Tinto and SASAC Development Program, the signing of an exploration joint venture with Minmetals, and hosting our senior leader forum in Beijing.
Growth – Made significant progress on growth projects (AutoHaulTM, Amrun, Koodaideri), and secured agreement on power supply for Oyu Tolgoi.
– Continued to achieve 1.4% CAGR of Cu-equivalent production since 2015, despite significant divestment and portfolio simplification.
– Progressed the exploration pipeline. – Developed multiple growth opportunities through
Rio Tinto Ventures.
The Committee, with input from the chairman, assessed Jean-Sébastien’s performance against his individual objectives as 80% of maximum.
STIP outcomes for 2018
Measures Weight (%)Result (% of
maximum)Weighted
result
Group safety(a) 20.0 22.0 4.4
Group financial(a) 50.0 60.0 30.0
Safety and financial 70.0 49.1 34.4
Individual 30.0 80.0 24.0
Total 100.0 – 58.4
STIP award (% of maximum award)(b) 70.1
Total STIP award (% of base salary) 140.2
(a) Refer to pages 114 and 115 for further details of Group safety and financial performance. (b) Weighted result multiplied by 1.2x. Award levels are subject to an overriding maximum
of 200% of base salary.
The result of these STIP outcomes is that Jean-Sébastien received a STIP award of £1,556,056 (2017: £1,585,008), which is 70.1% of maximum (2017: 73.4%), and equivalent to 140.2% of his base salary (2017: 146.8%). Half will be paid in cash in March 2019, and the remainder will be delivered in deferred shares, vesting in December 2021. If Jean-Sébastien resigns or is dismissed for misconduct, or for any other reason that the Committee decides, the deferred shares will lapse. The 2019 STIP measures and weightings are described on page 124.
LTIP outcome for the period ended 31 December 2018Under the LTIP, Jean-Sébastien will receive an estimated 34,537 shares (2017: 19,931 shares) in Rio Tinto plc in 2019 from the vesting of the PSA granted in 2014. The number of shares vesting includes an estimated 5,581 shares, which correspond to the aggregate net dividends that would have been paid if he had owned them during that five-year period. No dividend shares will be granted in respect of the share awards that lapse. The total estimated value of the PSA vesting for the performance period ending 31 December 2018, inclusive of the estimated dividend shares on the PSA granted in 2014, was £1,293,000 (2017: £829,000).
Annual report 2018 | riotinto.com 117
Governance

LTIP award granted in 2018The details of Jean-Sébastien’s 2018 LTIP award, which were previewed in the 2017 Remuneration report, are summarised in the following table.
Type ofaward Grant date
Face valueof award
(% of basesalary)
Facevalue
of award(£’000)(a)
% vesting atthreshold
performance
End of the period over which the
performanceconditions have
to be fulfilled(b)(c)
PSA 15 May 2018
430% 4,774 22.5% 31 Dec 2022
(a) The face value represents the maximum value of the award of 430% of Jean-Sébastien’s base salary of £1,110,200 and resulted in a total award of 139,995 conditional shares based on the average share price over 2017 of £34.10. The expected value of the award was 50% of the face value or £2,387,000.
(b) The 2018 PSA may vest after five years in 2023.(c) The full performance conditions for the award are set out in detail in notes to table 3
on page 136.
LTIP award for 2019Jean-Sébastien’s LTIP award consists of conditional shares in 2019. This will be granted as PSA, and will have a face value of 430% of base salary and an expected value of 215% of base salary. Any award will depend on the Group’s relative TSR performance and will vest in 2024. Full performance conditions are set out on page 123.
The number of PSA shares is calculated using the average share price over the previous calendar year and, as such, 125,665 shares will be awarded in 2019 calculated using the 2018 average share price of £38.94.
Jean-Sébastien’s shareholdingIn line with our share ownership policy, Jean-Sébastien’s shareholding is calculated using the market price of Rio Tinto shares on the latest practicable date each year before this report is published.
31 December2018
31 December2017
Increase inshareholding
Holding of ordinary shares 64,740 38,541 68.0%
Multiple of base salary 3.3 2.3 1.0
The multiple of base salary as shown above includes the value of 50% unvested Bonus Deferral Awards (BDA). Jean-Sébastien holds no options over Rio Tinto shares. He has until 2021 to build up his ownership in shares to four times his salary as chief executive.
PensionJean-Sébastien is employed in the UK. He receives pension benefits on a defined contribution basis on the same terms as other UK employees: – A pension contribution to a funded UK company pension arrangement
of 25% of £135,000, being the current maximum salary on which pension contributions are based under that arrangement.
– A cash supplement equal to 25% of the amount by which his base salary exceeded £135,000, less any applicable withholdings.
In line with other UK employees, Jean-Sébastien elected to reduce the company’s pension contribution to £10,000 per UK tax year in 2018 and to take the balance as a taxable cash allowance. The gross cash allowance was reduced by the company’s national insurance contribution payable on that cash allowance.
Under Australian Superannuation Guarantee legislation the company pays superannuation contributions to an Australian superannuation fund in respect of Jean-Sébastien’s working days in Australia. The pounds sterling equivalent of these superannuation contributions is offset against the UK cash supplement paid to Jean-Sébastien.
Jean-Sébastien’s pension provision in 2018 was: – A UK pension contribution of £12,708 (2017: £24,063). – A gross cash allowance of £18,489 (2017: £8,514). – A superannuation contribution to an Australian superannuation fund
of A$25,302 (2017: A$9,916 in the period 1 July to 31 December 2017). The sterling equivalent of £14,288 (2017: £5,831) was offset against the cash supplement.
– A cash supplement of £242,542 (2017: £236,250), reduced to £228,254 after the offset of the Australian superannuation contributions.
Jean-Sébastien’s total pension provision for 2018 was £273,739 (2017: £268,827). This equates to a pension benefit of 24.8% of base salary.
Fees from external appointmentsJean-Sébastien received no fees from external appointments in 2018 or 2017.
Service contract
Positions held and date of appointment to position
Positions held during 2018 Date of appointment to position
Chief executive 2 July 2016
Either Rio Tinto or Jean-Sébastien can terminate his contract with 12 months’ notice in writing, or immediately by paying the base salary only in lieu of any unexpired notice.
Chief executive’s pay and employee payIn the table below we compare the changes from 2017 to 2018 in salary, benefits and annual incentives paid to the chief executive and to the Australian workforce (chosen because approximately 40% of our total workforce is employed in Australia, more than in any other country). The percentage change in each element of remuneration for the workforce is calculated on a per capita basis using average employee numbers.
Changes to the chief executive’s base salary, benefits and annual incentive are explained in the single total figure of remuneration table on page 116.
Percentagechange in
salary paid
Percentagechange in
otherbenefits paid
Percentagechange in
annualincentive paid(a)
Chief executive(b) 2.3% 5.2% 8.2%
Australian workforce 3.8% 5.3% 3.4%
(a) The percentage change in annual incentive compares amounts paid in 2018 with respect to the 2017 performance year, to amounts paid in 2017 with respect to the 2016 performance year. Annual incentives for the workforce comprise a number of different short-term incentive arrangements.
(b) The annual incentive paid to the chief executive in 2018 was higher than in 2017, primarily due to a higher base salary reflecting his full year as chief executive in 2017, partly offset by lower financial outcomes.
Chief executive pay ratioThe ratio of the total remuneration of the chief executive to the median total remuneration of all Rio Tinto employees for 2018 was 45:1. This has been calculated using the single total figure of remuneration for the chief executive and the median employee from our global gender pay gap analysis.
Given the size and global nature of our business, a Group-wide ratio is more appropriate as we have less than 250 UK employees.
Implementation report continued
Governance | Remuneration report
Annual report 2018 | riotinto.com118

Remuneration report | Implementation report
Jakob Stausholm (chief financial officer)Single total figure of remunerationThe table below provides a summary of actual remuneration in respect of 2018 in accordance with UK legislation, stated in pounds sterling, the currency of Jakob’s arrangements. The details for 2018 reflect remuneration for the period 3 September to 31 December 2018.
(stated in £‘000) 2018
Base salary paid(a) 258
STIP payment – cash 126
STIP payment – deferred shares(b) 126
Total short-term pay 510
Value of LTIP awards vesting 0
Pension(c) 57
Other benefits(d) 440
Single total figure of remuneration 1,007
Percentage of total remuneration provided as performance-related pay (STIP and LTIP) 25.0%
Percentage of total remuneration provided as non-performance-related pay (base salary, pension and other benefits) 75.0%
Percentage of maximum STIP awarded(e) 49.4%
Percentage of maximum STIP forfeited 50.6%
Percentage of target STIP awarded 98.8%
Percentage of PSA vesting(f) –
Percentage SOP award vesting(g) –
(a) Salary paid in the financial year to 31 December. (b) Value of STIP deferred, the vesting of which is subject to the relevant plan rules.(c) Pension reflects the value of the pension contribution and payment in lieu of pension paid
during the year.(d) Includes healthcare, allowance for professional tax services, car allowance, grossed-up tax benefit (£45,505) and a one-time lump sum gross payment for relocation (£330,778).(e) The maximum potential STIP award is 200% of base salary.(f) Jakob had no LTIP awards vest in respect of the performance period that ended
31 December 2018.(g) Jakob has received no awards under the SOP.
Base salaryJakob’s base salary of £775,000 will not be increased in 2019.
2019 2018 % change
Base salary (stated in £’000) 775 775 –
STIP individual objectives for 2018Jakob’s performance against his individual objectives is summarised below:
Category Performance
Safety – Rapidly developed an understanding of the operationalisation of our safety strategy.
People – Made multiple site visits to develop better understanding of our assets and people.
– Actively engaged in our senior leader forum in Beijing, building relationships with our high potential talent.
Cash – Delivered a strong balance sheet and improved net debt position.
– Assumed leadership of the annual planning process and 5 year business plan, as well as the support function review.
– Made a strong contribution to our IT strategy review.
Partnership – Quickly developed relationships with investors and engaged with ratings agencies and key stakeholders.
Growth – Played a key role in capital allocation processes across the Group through the Investment Committee.
The Committee, with input from the chief executive, assessed Jakob’s performance against his individual objectives as 50% of maximum.
STIP outcomes for 2018The following table summarises the STIP outcomes for 2018.
Measures Weight (%)Result (out of
maximum)Weighted
result
Safety(a) 20.0 22.0 4.4
Group financial(a) 50.0 60.0 30.0
Safety and financial 70.0 49.1 34.4
Individual 30.0 50.0 15.0
Total 100.0 – 49.4
STIP award (% of maximum award)(b) 49.4
Total STIP award (% of base salary) 98.8
(a) Refer to pages 114 and 115 for further details of Group safety and financial performance. (b) Weighted result multiplied by 1 rather than 1.2 for the chief executive and former chief
financial officer. Award levels are subject to an overriding maximum of 200% of base salary.
Jakob received a STIP award of £251,737, which is 49.4% of maximum, and equivalent to 98.8% of base salary, pro-rated for the period of employment from 3 September 2018. Half will be paid in cash in March 2019, and the remainder will be delivered in deferred shares, vesting in December 2021. If Jakob resigns or is dismissed for misconduct, or for any other reason that the Committee decides, the deferred shares will lapse. The 2019 STIP measures and weightings are described on page 124.
LTIP outcome for the period ended 31 December 2018Jakob had no LTIP awards vest in respect of the performance period that ended 31 December 2018.
LTIP award granted in 2018The details of Jakob’s 2018 LTIP award are summarised in the following table.
Type ofaward Grant date
Face valueof award
(% of basesalary)
Facevalue
of award(£’000)(a)
% vesting atthreshold
performance
End of the period over which the
performanceconditions have
to be fulfilled(b)(c)
PSA 10 Sep 2018
400% 1,019 22.5% 31 Dec 2022
(a) The face value represents the maximum value of the award of 400% of Jakob’s base salary of £775,000, pro-rated for the period from 3 September 2018 to 31 December 2018 and resulted in a total award of 29,886 conditional shares based on the average share price over 2017 of £34.10. The expected value of the award is 50% of the face value or £509,500.
(b) The 2018 PSA may vest in 2023.(c) The full performance conditions for the award are set out in detail in notes to table 3
on page 136.
LTIP award granted in 2019Jakob’s LTIP award consists of conditional shares in 2019. This will be granted as PSA, and will have a face value of 400% of base salary and an expected value of 200% of base salary. Any award will depend on the Group’s relative TSR performance and will vest in 2024. Full performance conditions are set out on page 123.
The number of PSA shares is calculated using the average share price over the previous calendar year and, as such, 79,609 shares will be awarded in 2019 calculated using the 2018 average share price of £38.94.
ShareholdingJakob’s shareholding as at 31 December 2018 of 0.8 times base salary (15,000 shares) is calculated using the market price of Rio Tinto shares on the latest practicable date before this report is published.
Annual report 2018 | riotinto.com 119
Governance

PensionJakob is employed in the UK. He receives pension benefits on a defined contribution basis on the same terms as other UK employees: – A pension contribution to a funded UK company pension arrangement of
25% of £135,000, being the current maximum salary on which pension contributions are based under that arrangement.
– A cash supplement equal to 25% of the amount by which his base salary exceeded £135,000, less any applicable withholdings.
In line with other UK employees, Jakob elected to reduce the company’s pension contribution to £10,000 per UK tax year in 2018 and to take the balance as a taxable cash allowance. The gross cash allowance is reduced by the company’s national insurance contribution payable on that cash allowance.
Jakob’s pension provision in 2018 was: – A UK pension contribution of £5,714. – A cash allowance of £4,864. – A cash supplement of £46,866.
Jakob’s total pension provision for 2018 was £57,444. This equates to a pension benefit of 22.2% of base salary.
Fees from external appointmentsJakob received no fees from external appointments in 2018.
Chris Lynch (former chief financial officer)Single total figure of remunerationThe table below provides a summary of actual remuneration in respect of 2018 and prior years in accordance with UK legislation, stated in pounds sterling, the currency of Chris’s arrangements. The details for 2018 reflect remuneration for the period 1 January to 30 September 2018, and the full value of the LTIP award that has vested in 2018.
(stated in £‘000) 2018 2017 2016
Base salary paid(a) 642 853 836
STIP payment – cash 760 615 717
STIP payment – deferred shares(b) 0 616 718
Total short-term pay 1,402 2,084 2,271
Value of LTIP awards vesting(c) 1,925 1,682 1,008
Pension(d) 159 221 209
Other benefits(e) 72 97 144
Single total figure of remuneration 3,558 4,084 3,632
Percentage change in total remuneration (2018 versus 2017; 2017 versus 2016) (12.9%) 12.4% –
Percentage of total remuneration provided as performance-related pay (STIP and LTIP) 75.5% 71.3% 67.3%
Percentage of total remuneration provided as non-performance-related pay (base salary, pension and other benefits) 24.5% 28.7% 32.7%
Percentage of maximum STIP awarded(f) 59.3% 71.9% 85.8%
Percentage of maximum STIP forfeited 40.7% 28.1% 14.2%
Percentage of target STIP awarded 98.8% 119.8% 143.0%
Percentage of PSA vesting 41.3% 66.7% 50.5%
Percentage SOP award vesting(g) – – –
Chris retired from Rio Tinto in September 2018. The decrease in Chris’s single total figure of remuneration therefore reflects a part-year from 1 January 2018 to 30 September 2018, compared to a full year in 2017. This was partly offset by the higher value of LTIP awards vesting in 2018.
(a) Salary paid in the financial year to 31 December. (b) Value of STIP deferred, the vesting of which is subject to the relevant plan rules.(c) Based on the estimated value of the PSA, including dividend shares where applicable, which
vests on 18 February 2019 (TSR portion) and which are anticipated to vest at the end of May 2019 (EBIT margin portion) for the performance period that ended 31 December 2018; and the PSA which vested for the performance periods that ended 31 December 2017 and 31 December 2016. A total of 104,312 shares were granted under the 2014 PSP which had a performance period which ended on 31 December 2018. It is estimated that a total of 51,426 shares, inclusive of an estimated 8,311 dividend shares will vest. The Rio Tinto plc share price used to calculate the estimated value of the award vesting with respect to 2018 is the average share price over the last quarter of 2018 of £37.44. The performance conditions for awards vesting for the period ended 31 December 2018 are detailed in the notes to table 3 on page 136.
The estimated value of the LTIP awards for 2017 included in the 2017 Annual report was £1,407,000 compared with the restated actual value of £1,682,000. This was calculated based on an estimate of the vesting of the EBIT margin portion of the award of 91% resulting in a total estimated vesting of 63.7%. The higher actual vesting of the EBIT margin portion of the award of 100%, based on a ranking of no.2 against the comparator group of 11, resulted in a total actual vesting of 66.7%. The impact of the higher vesting level was further increased by higher share prices at the time of vesting (£40.72 for the TSR portion which vested on 19 February 2018 and £42.47 for the EBIT margin portion which vested on 31 May 2018) compared with the average share price over the last quarter of 2017 of £36.27 which was used to calculate the estimated value.
(d) Pension reflects the value of the pension contribution and payment in lieu of pension paid during the year.
(e) Includes healthcare, allowance for professional tax services and car allowance. (f) The maximum potential STIP award is 200% of base salary.(g) Chris has received no awards under the SOP.
Base salaryAs we reported last year, Chris’s base salary of £856,500 was not increased in 2018 and his base salary remained at this level until he retired from the Group on 30 September 2018.
STIP individual objectives for 2018Chris’s performance against his individual objectives is summarised below:
Category Performance
Safety – Supported progress in our safety agenda through engagement with operations and site visits.
People – Contributed to improved employee engagement and talent development.
– Actively managed the implementation of the operating model.
– Engaged in the implementation of the Group purpose (“pioneering progress”) and values, and supported the Audit Committee.
Cash – Oversaw the release of cash from non-core assets. – Pursued the “mine to market” productivity agenda. – Drove net debt reduction and balance sheet strength.
Partnership – Continued to strengthen relationships with investors. – Actively engaged with ratings agencies
and other stakeholders.
Growth – Continued to build on the growth pipeline, with a clear focus on Tier 1 potential projects.
– Pursued an active and disciplined approach to capital allocation decisions.
Implementation report continued
Governance | Remuneration report
Annual report 2018 | riotinto.com120
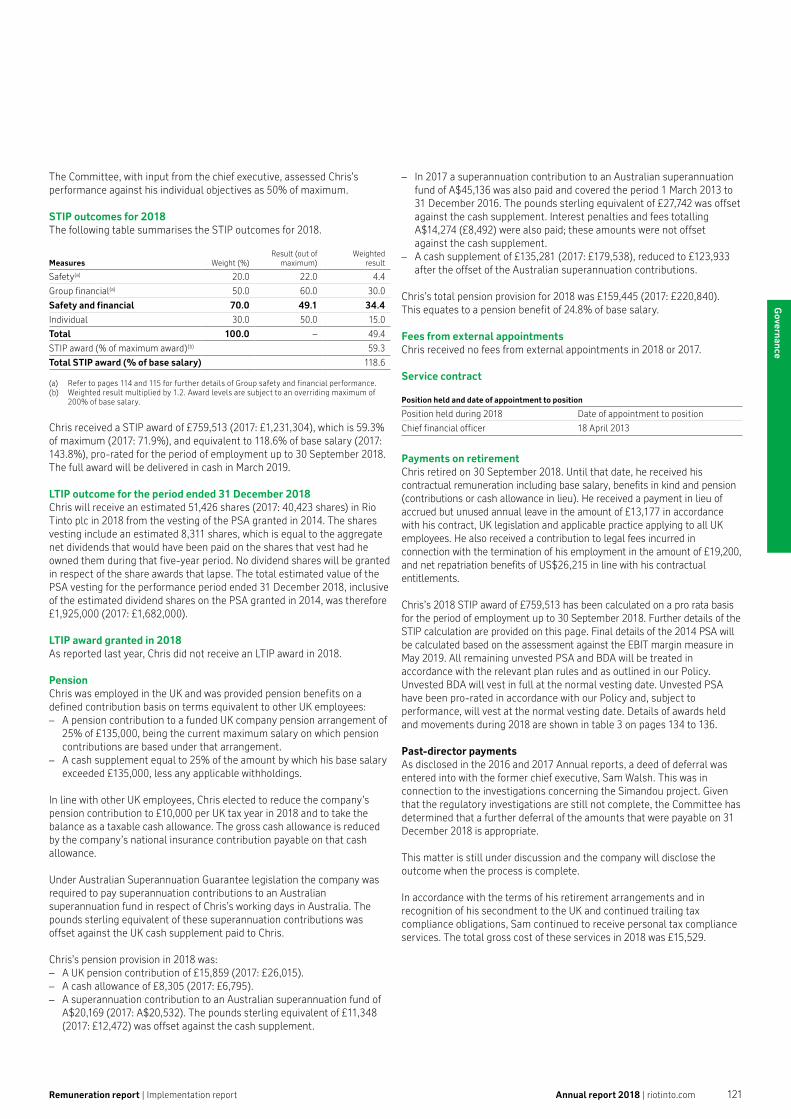
The Committee, with input from the chief executive, assessed Chris’s performance against his individual objectives as 50% of maximum.
STIP outcomes for 2018The following table summarises the STIP outcomes for 2018.
Measures Weight (%)Result (out of
maximum)Weighted
result
Safety(a) 20.0 22.0 4.4
Group financial(a) 50.0 60.0 30.0
Safety and financial 70.0 49.1 34.4
Individual 30.0 50.0 15.0
Total 100.0 – 49.4
STIP award (% of maximum award)(b) 59.3
Total STIP award (% of base salary) 118.6
(a) Refer to pages 114 and 115 for further details of Group safety and financial performance. (b) Weighted result multiplied by 1.2. Award levels are subject to an overriding maximum of
200% of base salary.
Chris received a STIP award of £759,513 (2017: £1,231,304), which is 59.3% of maximum (2017: 71.9%), and equivalent to 118.6% of base salary (2017: 143.8%), pro-rated for the period of employment up to 30 September 2018. The full award will be delivered in cash in March 2019.
LTIP outcome for the period ended 31 December 2018Chris will receive an estimated 51,426 shares (2017: 40,423 shares) in Rio Tinto plc in 2018 from the vesting of the PSA granted in 2014. The shares vesting include an estimated 8,311 shares, which is equal to the aggregate net dividends that would have been paid on the shares that vest had he owned them during that five-year period. No dividend shares will be granted in respect of the share awards that lapse. The total estimated value of the PSA vesting for the performance period ended 31 December 2018, inclusive of the estimated dividend shares on the PSA granted in 2014, was therefore £1,925,000 (2017: £1,682,000).
LTIP award granted in 2018As reported last year, Chris did not receive an LTIP award in 2018.
PensionChris was employed in the UK and was provided pension benefits on a defined contribution basis on terms equivalent to other UK employees: – A pension contribution to a funded UK company pension arrangement of
25% of £135,000, being the current maximum salary on which pension contributions are based under that arrangement.
– A cash supplement equal to 25% of the amount by which his base salary exceeded £135,000, less any applicable withholdings.
In line with other UK employees, Chris elected to reduce the company’s pension contribution to £10,000 per UK tax year in 2018 and to take the balance as a taxable cash allowance. The gross cash allowance is reduced by the company’s national insurance contribution payable on that cash allowance.
Under Australian Superannuation Guarantee legislation the company was required to pay superannuation contributions to an Australian superannuation fund in respect of Chris’s working days in Australia. The pounds sterling equivalent of these superannuation contributions was offset against the UK cash supplement paid to Chris.
Chris’s pension provision in 2018 was: – A UK pension contribution of £15,859 (2017: £26,015). – A cash allowance of £8,305 (2017: £6,795). – A superannuation contribution to an Australian superannuation fund of
A$20,169 (2017: A$20,532). The pounds sterling equivalent of £11,348 (2017: £12,472) was offset against the cash supplement.
– In 2017 a superannuation contribution to an Australian superannuation fund of A$45,136 was also paid and covered the period 1 March 2013 to 31 December 2016. The pounds sterling equivalent of £27,742 was offset against the cash supplement. Interest penalties and fees totalling A$14,274 (£8,492) were also paid; these amounts were not offset against the cash supplement.
– A cash supplement of £135,281 (2017: £179,538), reduced to £123,933 after the offset of the Australian superannuation contributions.
Chris’s total pension provision for 2018 was £159,445 (2017: £220,840). This equates to a pension benefit of 24.8% of base salary.
Fees from external appointmentsChris received no fees from external appointments in 2018 or 2017.
Service contract
Position held and date of appointment to position
Position held during 2018 Date of appointment to position
Chief financial officer 18 April 2013
Payments on retirementChris retired on 30 September 2018. Until that date, he received his contractual remuneration including base salary, benefits in kind and pension (contributions or cash allowance in lieu). He received a payment in lieu of accrued but unused annual leave in the amount of £13,177 in accordance with his contract, UK legislation and applicable practice applying to all UK employees. He also received a contribution to legal fees incurred in connection with the termination of his employment in the amount of £19,200, and net repatriation benefits of US$26,215 in line with his contractual entitlements.
Chris’s 2018 STIP award of £759,513 has been calculated on a pro rata basis for the period of employment up to 30 September 2018. Further details of the STIP calculation are provided on this page. Final details of the 2014 PSA will be calculated based on the assessment against the EBIT margin measure in May 2019. All remaining unvested PSA and BDA will be treated in accordance with the relevant plan rules and as outlined in our Policy. Unvested BDA will vest in full at the normal vesting date. Unvested PSA have been pro-rated in accordance with our Policy and, subject to performance, will vest at the normal vesting date. Details of awards held and movements during 2018 are shown in table 3 on pages 134 to 136.
Past-director paymentsAs disclosed in the 2016 and 2017 Annual reports, a deed of deferral was entered into with the former chief executive, Sam Walsh. This was in connection to the investigations concerning the Simandou project. Given that the regulatory investigations are still not complete, the Committee has determined that a further deferral of the amounts that were payable on 31 December 2018 is appropriate.
This matter is still under discussion and the company will disclose the outcome when the process is complete.
In accordance with the terms of his retirement arrangements and in recognition of his secondment to the UK and continued trailing tax compliance obligations, Sam continued to receive personal tax compliance services. The total gross cost of these services in 2018 was £15,529.
Remuneration report | Implementation report Annual report 2018 | riotinto.com 121
Governance
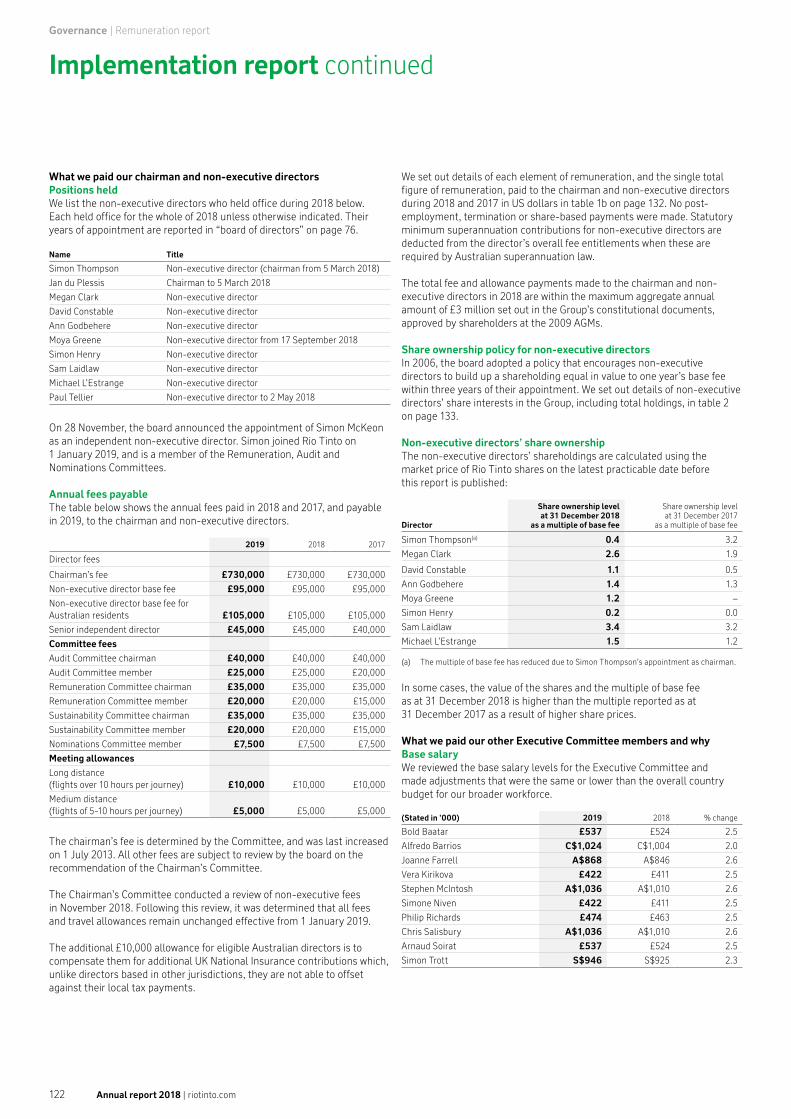
What we paid our chairman and non-executive directorsPositions heldWe list the non-executive directors who held office during 2018 below. Each held office for the whole of 2018 unless otherwise indicated. Their years of appointment are reported in “board of directors” on page 76.
Name Title
Simon Thompson Non-executive director (chairman from 5 March 2018)
Jan du Plessis Chairman to 5 March 2018
Megan Clark Non-executive director
David Constable Non-executive director
Ann Godbehere Non-executive director
Moya Greene Non-executive director from 17 September 2018
Simon Henry Non-executive director
Sam Laidlaw Non-executive director
Michael L’Estrange Non-executive director
Paul Tellier Non-executive director to 2 May 2018
On 28 November, the board announced the appointment of Simon McKeon as an independent non-executive director. Simon joined Rio Tinto on 1 January 2019, and is a member of the Remuneration, Audit and Nominations Committees.
Annual fees payableThe table below shows the annual fees paid in 2018 and 2017, and payable in 2019, to the chairman and non-executive directors.
2019 2018 2017
Director fees
Chairman’s fee £730,000 £730,000 £730,000
Non-executive director base fee £95,000 £95,000 £95,000
Non-executive director base fee for Australian residents £105,000 £105,000 £105,000
Senior independent director £45,000 £45,000 £40,000
Committee fees
Audit Committee chairman £40,000 £40,000 £40,000
Audit Committee member £25,000 £25,000 £20,000
Remuneration Committee chairman £35,000 £35,000 £35,000
Remuneration Committee member £20,000 £20,000 £15,000
Sustainability Committee chairman £35,000 £35,000 £35,000
Sustainability Committee member £20,000 £20,000 £15,000
Nominations Committee member £7,500 £7,500 £7,500
Meeting allowances
Long distance (flights over 10 hours per journey) £10,000 £10,000 £10,000
Medium distance (flights of 5-10 hours per journey) £5,000 £5,000 £5,000
The chairman’s fee is determined by the Committee, and was last increased on 1 July 2013. All other fees are subject to review by the board on the recommendation of the Chairman’s Committee.
The Chairman’s Committee conducted a review of non-executive fees in November 2018. Following this review, it was determined that all fees and travel allowances remain unchanged effective from 1 January 2019.
The additional £10,000 allowance for eligible Australian directors is to compensate them for additional UK National Insurance contributions which, unlike directors based in other jurisdictions, they are not able to offset against their local tax payments.
We set out details of each element of remuneration, and the single total figure of remuneration, paid to the chairman and non-executive directors during 2018 and 2017 in US dollars in table 1b on page 132. No post-employment, termination or share-based payments were made. Statutory minimum superannuation contributions for non-executive directors are deducted from the director’s overall fee entitlements when these are required by Australian superannuation law.
The total fee and allowance payments made to the chairman and non-executive directors in 2018 are within the maximum aggregate annual amount of £3 million set out in the Group’s constitutional documents, approved by shareholders at the 2009 AGMs.
Share ownership policy for non-executive directorsIn 2006, the board adopted a policy that encourages non-executive directors to build up a shareholding equal in value to one year’s base fee within three years of their appointment. We set out details of non-executive directors’ share interests in the Group, including total holdings, in table 2 on page 133.
Non-executive directors’ share ownershipThe non-executive directors’ shareholdings are calculated using the market price of Rio Tinto shares on the latest practicable date before this report is published:
Director
Share ownership levelat 31 December 2018
as a multiple of base fee
Share ownership levelat 31 December 2017
as a multiple of base fee
Simon Thompson(a) 0.4 3.2
Megan Clark 2.6 1.9
David Constable 1.1 0.5
Ann Godbehere 1.4 1.3
Moya Greene 1.2 –
Simon Henry 0.2 0.0
Sam Laidlaw 3.4 3.2
Michael L’Estrange 1.5 1.2
(a) The multiple of base fee has reduced due to Simon Thompson’s appointment as chairman.
In some cases, the value of the shares and the multiple of base fee as at 31 December 2018 is higher than the multiple reported as at 31 December 2017 as a result of higher share prices.
What we paid our other Executive Committee members and whyBase salaryWe reviewed the base salary levels for the Executive Committee and made adjustments that were the same or lower than the overall country budget for our broader workforce.
(Stated in ’000) 2019 2018 % change
Bold Baatar £537 £524 2.5
Alfredo Barrios C$1,024 C$1,004 2.0
Joanne Farrell A$868 A$846 2.6
Vera Kirikova £422 £411 2.5
Stephen McIntosh A$1,036 A$1,010 2.6
Simone Niven £422 £411 2.5
Philip Richards £474 £463 2.5
Chris Salisbury A$1,036 A$1,010 2.6
Arnaud Soirat £537 £524 2.5
Simon Trott S$946 S$925 2.3
Implementation report continued
Governance | Remuneration report
Annual report 2018 | riotinto.com122

STIP objectives and outcomes for 2018Overview of STIP weightings and measures for 2018The following table shows the measures and weightings used to determine STIP awards for executives in 2018:
Weightingfor executivedirectors and
Group executivesWeighting for
PGCEOs
Safety – split between standalone binary measure for fatality, AIFR and CRM 20% 20%
Financial measures split equally between underlying earnings and STIP free cash flow for the Group 50% 20%
Financial measures split equally between underlying earnings and STIP free cash flow for the relevant product group 0% 30%
Individual measures based on key strategic initiatives of each role and contribution to overall company performance 30% 30%
The Group safety result was 22% of maximum and the average performance against safety goals for executives was below “target”.
Detailed commentary on the performance of each product group is on pages 34 to 51. Average performance against the individual product group financial goals was above “target”.
The Committee reviewed the individual performance of executives who are not executive directors and, on average, considered them above “target”. This reflected performance against our safety, people, cash, partnership and growth objectives.
The 2018 STIP awards are detailed in the table below.
2018 STIP award(% of salary)(a)
2018 STIP award (000’s)
Bold Baatar 82.7% £434
Alfredo Barrios 98.1% C$985
Joanne Farrell 92.8% A$785
Vera Kirikova 92.8% £382
Stephen McIntosh 116.7% A$1,178
Simone Niven 116.8% £480
Philip Richards 98.8% £457
Chris Salisbury 94.1% A$950
Arnaud Soirat 141.6% £742
Simon Trott 98.8% S$914
(a) Results out of 100% have been rounded to one decimal place and STIP awards have been rounded to the nearest thousand units. As the actual STIP awards do not use rounding conventions, small rounding variances may occur.
LTIP outcomes for the period ended 31 December 2018Eligible executives will receive shares in Rio Tinto plc or Rio Tinto Limited in 2019 from the vesting of PSA granted in 2014. All executives who were granted these awards will also receive additional shares equal to the aggregate net dividends that would have been paid on the PSA shares that vest had they owned them during the five-year performance period. No dividends will be paid in respect of the share awards that lapse.
An estimate of the total value of PSA that will vest is included in the single total figure of remuneration. The actual PSA values will be recalculated following the vesting of the EBIT margin portion of the award, based on the actual share prices on the date of vesting (31 May 2019). The estimated PSA values will be restated, if applicable, in the 2019 Annual report.
Further details of the performance outcome for PSA with a performance period that ended on 31 December 2018 are provided on page 127 and pages 133 to 136.
LTIP awards granted in 2018The maximum potential value of PSA granted in 2018 was 438% of base salary. The Committee decided that the PSA granted in 2018 would have a face value of awards as shown in the table below. The eventual value of the award will depend on the Group’s relative TSR performance during the years 2018-2022. The 2018 PSA may vest after five years in 2023. The performance conditions for the awards granted in 2018 are consistent with the performance conditions for awards to be granted in 2019 as set out below.
LTIP awards for 2019The Committee sets award levels to incentivise executives to meet the long-term strategic goals of the Group, to support retention and to contribute towards the competitiveness of the overall remuneration package. With this in mind, we determined that LTIP awards consist of conditional shares in 2019. This will have the face values shown in the table below.
As we have done since 1998, we calculated the awards using the average share price over the previous calendar year to mitigate the impact of short-term volatility in the share price. The awards granted in 2019 will therefore be calculated using the 2018 average share prices for Rio Tinto plc and Rio Tinto Limited of £38.94 and A$78.17 respectively.
The average face value of awards to be made to Executive Committee members in 2019, excluding the executive directors, is 382% of base salary (2018: 386% of salary).
Maximum value(% of 1 March base salary) 2019 2018
Bold Baatar 375 410
Alfredo Barrios 375 375
Joanne Farrell 375 375
Vera Kirikova 375 375
Stephen McIntosh 375 375
Simone Niven 410 410
Philip Richards 375 375
Chris Salisbury 375 410
Arnaud Soirat 410 375
Simon Trott 375 375
Average 382 386
The expected value of the awards made from 2018 is equal to 50% of the face value. The percentage vesting at “threshold” performance is 22.5%. The 2019 award will vest after five years in 2024, subject to the Group’s performance against the relative TSR measures.
The performance conditions for the PSA granted under the EIP from 2018 are set out below. TSR performance is measured equally against the EMIX Global Mining Index and the MSCI World Index.
Outperformance of the index by 6% per annum 1.0 x award vests
Performance between equal to the index and 6% outperformance
Proportionate vesting between 0.225 x and 1.0 x vesting
Performance equal to the index 0.225 x award vests
Performance less than the index Nil vesting
Remuneration report | Implementation report Annual report 2018 | riotinto.com 123
Governance

Share ownershipThe following table shows the executive share ownership level for members of the Executive Committee in office at 31 December 2018 as a multiple of base salary.
Share ownership level at 31 December 2018 as a multiple of base salary
Bold Baatar 1.9
Alfredo Barrios 2.2
Joanne Farrell 5.5
Vera Kirikova 0.8
Stephen McIntosh 3.0
Simone Niven 1.1
Philip Richards 0.3
Chris Salisbury 3.3
Arnaud Soirat 2.6
Simon Trott 1.2
Share ownership level is calculated using the market price of Rio Tinto shares on the latest practicable date before this report was published, and we define “share ownership” on page 114. The vesting of the 2014 PSA, and 2016 MSA where applicable, will increase the multiples noted above for several executives.
All current executives who were employed as at 31 December 2017 have increased their holding of ordinary shares during 2018, and are making progress towards their share ownership requirements. The value of the shares has also increased due to higher share prices.
Post-employment benefitsExecutives may participate in the pension, superannuation, and post-employment medical and life insurance benefits which are typically offered to employees in similar locations.
Service contractsAll executives have service contracts which can be terminated by the company with 12 months’ notice in writing, or by the employee with six months’ notice in writing, or immediately by the company by paying the base salary only in lieu of any unexpired notice.
Positions held and date of appointment to position
Name Position(s) held during 2018Date of appointment
to position
Other executives
Bold Baatar Chief executive, Energy & Minerals 1 December 2016
Alfredo Barrios Chief executive, Aluminium 1 June 2014
Joanne FarrellGroup executive, Health, Safety & Environment 2 July 2016
Vera KirikovaGroup executive, Human Resources 1 January 2017
Stephen McIntoshGroup executive, Growth & Innovation 2 July 2016
Simone NivenGroup executive, Corporate Relations 1 January 2017
Philip Richards Group executive, Legal 2 April 2017
Chris Salisbury Chief executive, Iron Ore 2 July 2016
Arnaud SoiratChief executive, Copper & Diamonds 2 July 2016
Simon Trott Chief commercial officer 1 January 2018
STIP measures, weightings and targets for 2019As in 2018, the STIP measures and weightings for executives will be 50% for financial, 30% for individual and 20% for safety measures. The individual targets include objectives relating to safety, people, cash, partnership and growth.
The financial and individual targets that have been set for 2019 are considered by the board to be commercially sensitive. As such, the specific targets for these measures, and the performance against them, are expected to be described retrospectively in the 2019 Implementation report. The Group financial targets relate to underlying earnings and STIP free cash flow.
The safety measures, weightings and targets for 2019 are outlined below.
2019 safety measures, weightings and targetsThe safety measures for all executives for 2019 will continue to include the standalone binary fatality measure (40%), with the remainder split between AIFR (30%) and measures relating to our safety maturity model (30%).
The standalone measure for fatality will be assessed as follows: – If a fatality occurs, there is no payment made in relation to this measure. – An outcome of outstanding is paid if no fatality occurs. – The metric will apply equally across all executives, regardless of the
location of any fatality.
For the AIFR measure, “target” performance for the Group has been set at 0.38, which is a 10.5% improvement compared with the actual outcome for 2018 of 0.44. The “threshold” number for calculation purposes is 0.42, and “outstanding” performance has been set at 0.30.
In 2018, CRM was measured by the single metric of CRM implementation. In 2019, CRM expands to a safety maturity model. This model is designed to enable a comparable evaluation of a site’s safety maturity, drive the right behaviours and activity to deliver efficient and effective safety performance, and maintain the focus on CRM.
Safety maturity in this context can be defined as the ability of a site’s leadership, culture and processes to deliver and improve safety performance, and to be resilient in a dynamic and cyclical operational environment.
Implementation report continued
Governance | Remuneration report
Annual report 2018 | riotinto.com124
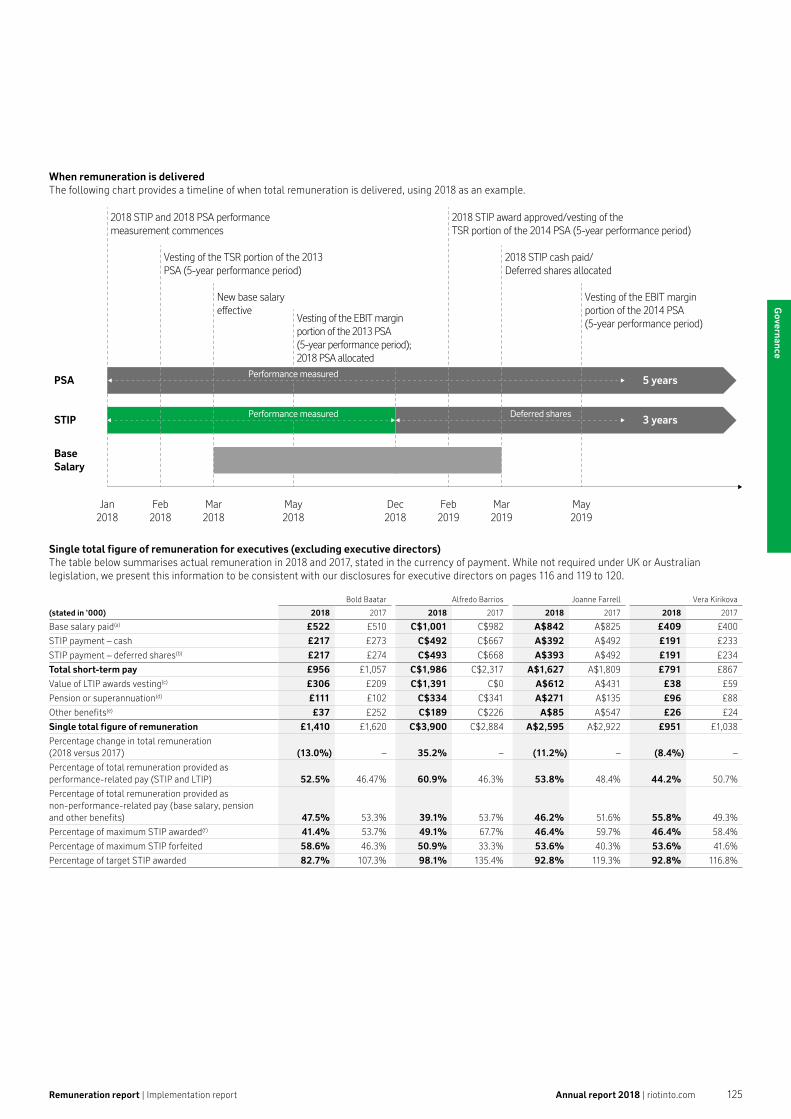
When remuneration is deliveredThe following chart provides a timeline of when total remuneration is delivered, using 2018 as an example.
PSA
STIP
BaseSalary
2018 STIP and 2018 PSA performance measurement commences
Vesting of the TSR portion of the 2013 PSA (5-year performance period)
2018 STIP cash paid/ Deferred shares allocated
New base salary effective
Vesting of the EBIT margin portion of the 2014 PSA (5-year performance period)
Feb2018
Jan2018
Mar2018
May2018
Dec2018
Feb2019
Mar2019
May2019
2018 STIP award approved/vesting of the TSR portion of the 2014 PSA (5-year performance period)
Vesting of the EBIT marginportion of the 2013 PSA (5-year performance period); 2018 PSA allocated
5 years
3 years
Performance measured
Performance measuredPerformance measured Deferred shares
Single total figure of remuneration for executives (excluding executive directors)The table below summarises actual remuneration in 2018 and 2017, stated in the currency of payment. While not required under UK or Australian legislation, we present this information to be consistent with our disclosures for executive directors on pages 116 and 119 to 120.
(stated in ’000)
Bold Baatar Alfredo Barrios Joanne Farrell Vera Kirikova
2018 2017 2018 2017 2018 2017 2018 2017
Base salary paid(a) £522 £510 C$1,001 C$982 A$842 A$825 £409 £400
STIP payment – cash £217 £273 C$492 C$667 A$392 A$492 £191 £233
STIP payment – deferred shares(b) £217 £274 C$493 C$668 A$393 A$492 £191 £234
Total short-term pay £956 £1,057 C$1,986 C$2,317 A$1,627 A$1,809 £791 £867
Value of LTIP awards vesting(c) £306 £209 C$1,391 C$0 A$612 A$431 £38 £59
Pension or superannuation(d) £111 £102 C$334 C$341 A$271 A$135 £96 £88
Other benefits(e) £37 £252 C$189 C$226 A$85 A$547 £26 £24
Single total figure of remuneration £1,410 £1,620 C$3,900 C$2,884 A$2,595 A$2,922 £951 £1,038
Percentage change in total remuneration (2018 versus 2017) (13.0%) – 35.2% – (11.2%) – (8.4%) –
Percentage of total remuneration provided as performance-related pay (STIP and LTIP) 52.5% 46.47% 60.9% 46.3% 53.8% 48.4% 44.2% 50.7%
Percentage of total remuneration provided as non-performance-related pay (base salary, pension and other benefits) 47.5% 53.3% 39.1% 53.7% 46.2% 51.6% 55.8% 49.3%
Percentage of maximum STIP awarded(f) 41.4% 53.7% 49.1% 67.7% 46.4% 59.7% 46.4% 58.4%
Percentage of maximum STIP forfeited 58.6% 46.3% 50.9% 33.3% 53.6% 40.3% 53.6% 41.6%
Percentage of target STIP awarded 82.7% 107.3% 98.1% 135.4% 92.8% 119.3% 92.8% 116.8%
Remuneration report | Implementation report Annual report 2018 | riotinto.com 125
Governance

(stated in ’000)
Stephen McIntosh Simone Niven Philip Richards(g)
2018 2017 2018 2017 2018 2017
Base salary paid(a) A$1,005 A$985 £409 £400 £461 £338
STIP payment – cash A$589 A$575 £240 £248 £228 £197
STIP payment – deferred shares(b) A$589 A$575 £240 £249 £229 £198
Total short-term pay A$2,183 A$2,135 £889 £897 £918 £733
Value of LTIP awards vesting(c) A$620 A$635 £123 £59 £0 £0
Pension or superannuation(d) A$241 A$240 £98 £89 £97 £59
Other benefits(e) A$140 A$141 £18 £18 £34 £25
Single total figure of remuneration A$3,184 A$3,151 £1,128 £1,063 £1,049 £817
Percentage change in total remuneration (2018 versus 2017) 1.0% – 6.1% – 28.4% –
Percentage of total remuneration provided as performance-related pay (STIP and LTIP) 56.5% 56.6% 53.5% 52.3% 43.6% 48.3%
Percentage of total remuneration provided as non-performance-related pay (base salary, pension and other benefits) 43.5% 43.4% 46.5% 47.7% 56.4% 51.7%
Percentage of maximum STIP awarded(f) 58.4% 58.4% 58.4% 62.2% 49.4% 58.4%
Percentage of maximum STIP forfeited 41.6% 41.6% 41.6% 37.8% 50.6% 41.6%
Percentage of target STIP awarded 116.7% 116.8% 116.8% 124.3% 98.8% 116.8%
(stated in ’000)
Chris Salisbury Arnaud Soirat Simon Trott
2018 2017 2018 2017 2018 2017
Base salary paid(a) A$1,005 A$985 £522 £510 S$925 –
STIP payment – cash A$475 A$647 £371 £234 S$457 –
STIP payment – deferred shares(b) A$475 A$648 £371 £235 S$457 –
Total short-term pay A$1,955 A$2,280 £1,264 £979 S$1,839 –
Value of LTIP awards vesting(c) A$657 A$542 £555 £313 S$370 –
Pension or superannuation(d) A$230 A$240 £111 £109 S$203 –
Other benefits(e) A$98 A$88 £95 £105 S$1,079 –
Single total figure of remuneration A$2,940 A$3,150 £2,025 £1,506 S$3,491 –
Percentage change in total remuneration (2018 versus 2017) (6.7%) – 34.5% – – –
Percentage of total remuneration provided as performance-related pay (STIP and LTIP) 54.7% 58.3% 64.1% 51.9% 36.8% –
Percentage of total remuneration provided as non-performance-related pay (base salary, pension and other benefits) 45.3% 41.7% 35.9% 48.1% 63.2% –
Percentage of maximum STIP awarded(f) 47.1% 65.8% 70.8% 46.0% 49.4% –
Percentage of maximum STIP forfeited 52.9% 34.2% 29.2% 54.0% 50.6% –
Percentage of target STIP awarded 94.1% 131.5% 141.6% 91.9% 98.8% –
(a) Salary paid in the financial year to 31 December. Salaries are generally reviewed with effect from 1 March. (b) Value of STIP deferred, the vesting of which is subject to the relevant plan rules.(c) Based on the estimated value of PSA which vest on 28 February 2019 (TSR portion) and which are anticipated to vest on 31 May 2019 (EBIT margin portion) for the performance period that
ended 31 December 2018, for the 2018 disclosure, and the PSA which vested for the performance period that ended 31 December 2017, for the 2017 disclosure. The Rio Tinto plc and Rio Tinto Limited share prices used to calculate the estimated value of the awards vesting are the average share prices over the last quarter of 2018 which were £37.44 and A$77.04 respectively. All executives who were granted the PSA in 2014 will also receive additional shares equal to the aggregate net dividends that would have been paid on the PSA shares that vest had they owned them during the five-year performance period. No dividend payments will be made in respect of the shares that lapse.
The estimated value of the LTIP awards for 2017 included in the 2017 Annual report was calculated based on an estimate of the vesting of the EBIT margin portion of the award of 91% resulting in a total estimated vesting of 63.7%. The higher actual vesting of the EBIT margin portion of the award of 100%, based on a rank of no 2 against the comparator group of 11, resulted in a total actual vesting of 66.7%. The impact of the higher vesting level was further increased by higher share prices at the time of vesting (£40.72 and A$82.00 for the TSR portion, which vested on 19 February 2018, and £42.47 and A$82.75 for the EBIT margin portion which vested on 31 May 2018) compared with the average share prices over the last quarter of 2017 of £36.27 and A$71.11, which were used to calculate the estimated value.
Where applicable, the value of LTIP awards vesting includes the value of MSA granted prior to appointment as an executive. (d) For defined benefit plans, pension or superannuation reflects the value of the pension or superannuation accrued during the year assuming that it was to come into payment immediately.
For defined contribution plans and cash paid in lieu of pension contributions, it is the amount contributed in the year by the company. This differs from the value reported in table 1a which is calculated using IAS 19 methodology and assumptions on rates of investment return, inflation and salary increases. Superannuation contributions for Joanne Farrell have been restated because a defined contribution company contribution on STIP of A$33,000 was omitted. The previous figure disclosed for 2017 was A$102,000.
(e) Includes healthcare, other post-employment benefits, allowance for professional tax compliance services and car and fuel allowances or car benefit value. Includes active or legacy expatriate-related benefits, as relevant. Joanne Farrell is an active member of a defined benefit superannuation plan. Simon Trott received a one-time lump sum gross payment for relocation (S$940,763).
(f) The maximum potential STIP award is 200% of base salary.(g) Remuneration details for 2017 reflect remuneration received for the period 2 April 2017 to 31 December 2017.
Implementation report continued
Governance | Remuneration report
Annual report 2018 | riotinto.com126
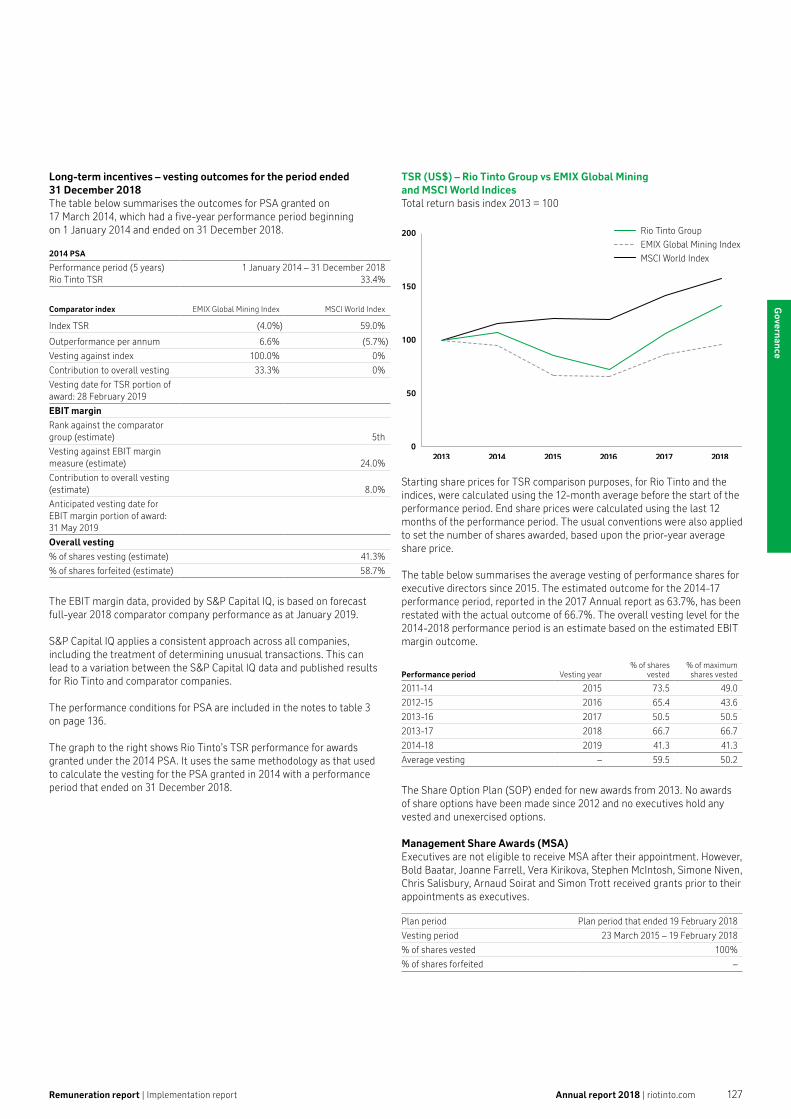
Long-term incentives – vesting outcomes for the period ended 31 December 2018The table below summarises the outcomes for PSA granted on 17 March 2014, which had a five-year performance period beginning on 1 January 2014 and ended on 31 December 2018.
2014 PSA
Performance period (5 years) Rio Tinto TSR
1 January 2014 – 31 December 2018 33.4%
Comparator index EMIX Global Mining Index MSCI World Index
Index TSR (4.0%) 59.0%
Outperformance per annum 6.6% (5.7%)
Vesting against index 100.0% 0%
Contribution to overall vesting 33.3% 0%
Vesting date for TSR portion of award: 28 February 2019
EBIT margin
Rank against the comparator group (estimate) 5th
Vesting against EBIT margin measure (estimate) 24.0%
Contribution to overall vesting (estimate) 8.0%
Anticipated vesting date for EBIT margin portion of award: 31 May 2019
Overall vesting
% of shares vesting (estimate) 41.3%
% of shares forfeited (estimate) 58.7%
The EBIT margin data, provided by S&P Capital IQ, is based on forecast full-year 2018 comparator company performance as at January 2019.
S&P Capital IQ applies a consistent approach across all companies, including the treatment of determining unusual transactions. This can lead to a variation between the S&P Capital IQ data and published results for Rio Tinto and comparator companies.
The performance conditions for PSA are included in the notes to table 3 on page 136.
The graph to the right shows Rio Tinto’s TSR performance for awards granted under the 2014 PSA. It uses the same methodology as that used to calculate the vesting for the PSA granted in 2014 with a performance period that ended on 31 December 2018.
TSR (US$) – Rio Tinto Group vs EMIX Global Mining and MSCI World IndicesTotal return basis index 2013 = 100
Rio Tinto GroupEMIX Global Mining IndexMSCI World Index
2013 2014 2015 2016 2017 20180
50
100
150
200
Starting share prices for TSR comparison purposes, for Rio Tinto and the indices, were calculated using the 12-month average before the start of the performance period. End share prices were calculated using the last 12 months of the performance period. The usual conventions were also applied to set the number of shares awarded, based upon the prior-year average share price.
The table below summarises the average vesting of performance shares for executive directors since 2015. The estimated outcome for the 2014-17 performance period, reported in the 2017 Annual report as 63.7%, has been restated with the actual outcome of 66.7%. The overall vesting level for the 2014-2018 performance period is an estimate based on the estimated EBIT margin outcome.
Performance period Vesting year% of shares
vested% of maximumshares vested
2011-14 2015 73.5 49.0
2012-15 2016 65.4 43.6
2013-16 2017 50.5 50.5
2013-17 2018 66.7 66.7
2014-18 2019 41.3 41.3
Average vesting – 59.5 50.2
The Share Option Plan (SOP) ended for new awards from 2013. No awards of share options have been made since 2012 and no executives hold any vested and unexercised options.
Management Share Awards (MSA)Executives are not eligible to receive MSA after their appointment. However, Bold Baatar, Joanne Farrell, Vera Kirikova, Stephen McIntosh, Simone Niven, Chris Salisbury, Arnaud Soirat and Simon Trott received grants prior to their appointments as executives.
Plan period Plan period that ended 19 February 2018
Vesting period 23 March 2015 – 19 February 2018
% of shares vested 100%
% of shares forfeited –
Remuneration report | Implementation report Annual report 2018 | riotinto.com 127
Governance
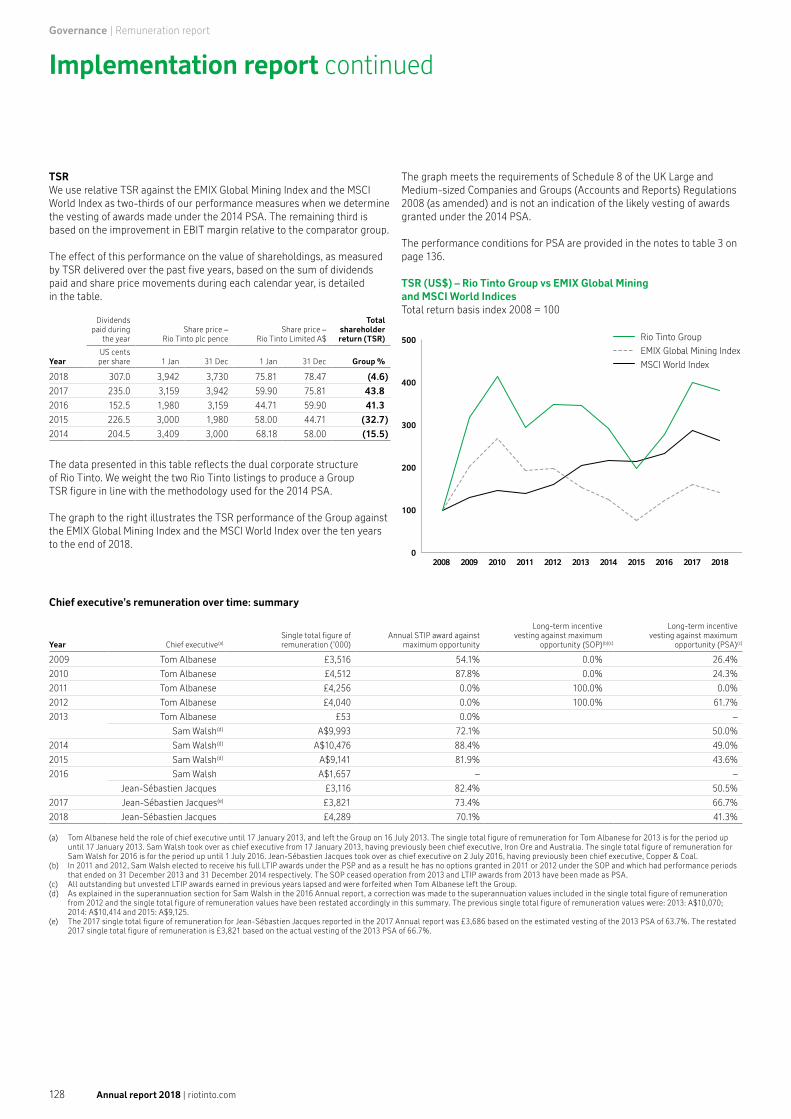
TSRWe use relative TSR against the EMIX Global Mining Index and the MSCI World Index as two-thirds of our performance measures when we determine the vesting of awards made under the 2014 PSA. The remaining third is based on the improvement in EBIT margin relative to the comparator group.
The effect of this performance on the value of shareholdings, as measured by TSR delivered over the past five years, based on the sum of dividends paid and share price movements during each calendar year, is detailed in the table.
Year
Dividendspaid during
the yearShare price –
Rio Tinto plc penceShare price –
Rio Tinto Limited A$
Totalshareholderreturn (TSR)
US centsper share 1 Jan 31 Dec 1 Jan 31 Dec Group %
2018 307.0 3,942 3,730 75.81 78.47 (4.6)
2017 235.0 3,159 3,942 59.90 75.81 43.8
2016 152.5 1,980 3,159 44.71 59.90 41.3
2015 226.5 3,000 1,980 58.00 44.71 (32.7)
2014 204.5 3,409 3,000 68.18 58.00 (15.5)
The data presented in this table reflects the dual corporate structure of Rio Tinto. We weight the two Rio Tinto listings to produce a Group TSR figure in line with the methodology used for the 2014 PSA.
The graph to the right illustrates the TSR performance of the Group against the EMIX Global Mining Index and the MSCI World Index over the ten years to the end of 2018.
The graph meets the requirements of Schedule 8 of the UK Large and Medium-sized Companies and Groups (Accounts and Reports) Regulations 2008 (as amended) and is not an indication of the likely vesting of awards granted under the 2014 PSA.
The performance conditions for PSA are provided in the notes to table 3 on page 136.
TSR (US$) – Rio Tinto Group vs EMIX Global Mining and MSCI World IndicesTotal return basis index 2008 = 100
Rio Tinto GroupEMIX Global Mining IndexMSCI World Index
0
100
200
300
400
500
2009 2010 2011 2012 2013 2014 2015 2016 20172008 2018
Chief executive’s remuneration over time: summary
Year Chief executive(a)Single total figure ofremuneration (’000)
Annual STIP award against maximum opportunity
Long-term incentive vesting against maximum
opportunity (SOP)(b)(c)
Long-term incentive vesting against maximum
opportunity (PSA)(c)
2009 Tom Albanese £3,516 54.1% 0.0% 26.4%
2010 Tom Albanese £4,512 87.8% 0.0% 24.3%
2011 Tom Albanese £4,256 0.0% 100.0% 0.0%
2012 Tom Albanese £4,040 0.0% 100.0% 61.7%
2013 Tom Albanese £53 0.0% –
Sam Walsh(d) A$9,993 72.1% 50.0%
2014 Sam Walsh(d) A$10,476 88.4% 49.0%
2015 Sam Walsh(d) A$9,141 81.9% 43.6%
2016 Sam Walsh A$1,657 – –
Jean-Sébastien Jacques £3,116 82.4% 50.5%
2017 Jean-Sébastien Jacques(e) £3,821 73.4% 66.7%
2018 Jean-Sébastien Jacques £4,289 70.1% 41.3%
(a) Tom Albanese held the role of chief executive until 17 January 2013, and left the Group on 16 July 2013. The single total figure of remuneration for Tom Albanese for 2013 is for the period up until 17 January 2013. Sam Walsh took over as chief executive from 17 January 2013, having previously been chief executive, Iron Ore and Australia. The single total figure of remuneration for Sam Walsh for 2016 is for the period up until 1 July 2016. Jean-Sébastien Jacques took over as chief executive on 2 July 2016, having previously been chief executive, Copper & Coal.
(b) In 2011 and 2012, Sam Walsh elected to receive his full LTIP awards under the PSP and as a result he has no options granted in 2011 or 2012 under the SOP and which had performance periods that ended on 31 December 2013 and 31 December 2014 respectively. The SOP ceased operation from 2013 and LTIP awards from 2013 have been made as PSA.
(c) All outstanding but unvested LTIP awards earned in previous years lapsed and were forfeited when Tom Albanese left the Group.(d) As explained in the superannuation section for Sam Walsh in the 2016 Annual report, a correction was made to the superannuation values included in the single total figure of remuneration
from 2012 and the single total figure of remuneration values have been restated accordingly in this summary. The previous single total figure of remuneration values were: 2013: A$10,070; 2014: A$10,414 and 2015: A$9,125.
(e) The 2017 single total figure of remuneration for Jean-Sébastien Jacques reported in the 2017 Annual report was £3,686 based on the estimated vesting of the 2013 PSA of 63.7%. The restated 2017 single total figure of remuneration is £3,821 based on the actual vesting of the 2013 PSA of 66.7%.
Implementation report continued
Governance | Remuneration report
Annual report 2018 | riotinto.com128

Employee share plansAll employee share plansThe Committee believes that all employees should be given the opportunity to become shareholders in our business, and that share plans help engage, retain and motivate employees over the long term. Rio Tinto’s share plans are therefore part of its standard remuneration practice, to encourage alignment with the performance of the Group. Executives may participate in broad-based share plans that are available to Group employees generally and to which performance conditions do not apply.
Global Employee Share PlanA global employee share purchase plan is normally offered to all eligible employees unless there are local jurisdictional restrictions. Under the plan, employees may acquire shares up to the value of US$5,000 (or equivalent in other currencies) per year, capped at 10% of their base salary. Each share purchased will be matched by the company, providing the participant holds the shares, and remains employed, at the end of the three-year vesting period.
Approximately 16,000 (40%) of our employees are shareholders as a result of participating in this plan.
Management Share Awards (MSA)The MSA are designed to help the Group attract the best staff in an increasingly competitive labour market, and to retain key individuals as we deliver our long-term strategy.
MSA are conditional awards that are not subject to a performance condition. They vest at the end of three years subject to continued employment, to act as an effective retention tool. Shares to satisfy the awards are bought in the market, and no new shares are issued. Executives are not eligible for the MSA.
DilutionAwards under the SOP, the 2013 Performance Share Plan, the 2018 EIP and all employee plans may be satisfied by, in the case of Rio Tinto plc, treasury shares or the issue of new shares or the purchase of shares in the market. In the case of Rio Tinto Limited, the plan is satisfied by the issue of new shares or the purchase of shares in the market.
In the UK, the Investment Association has issued corporate governance guidelines in relation to the amount of new shares that may be issued having regard to the total issued share capital. Under the guidelines, the rules of a scheme must provide that commitments to issue new shares or reissue treasury shares, when aggregated with awards under all of a company’s other schemes, must not exceed 10% of the issued ordinary share capital (adjusted for share issuance and cancellation) in any rolling ten-year period. Furthermore, commitments to issue new shares or reissue treasury shares under executive (discretionary) schemes should not exceed 5% of the issued ordinary share capital of a company (adjusted for share issuance and cancellation) in any rolling ten-year period. This may be exceeded where vesting is dependent on the achievement of significantly more stretching performance criteria. Rio Tinto plc is in compliance with these guidelines. As at 31 December 2018 these limits had not been exceeded.
In Australia, as a condition of relief from prospectus requirements, the Australian Securities and Investments Commission has imposed a cap on the issue of shares to employees of 5% of issued capital during a three-year period. As Rio Tinto Limited satisfies awards by market purchase, this cap does not currently apply. However, Rio Tinto would be in compliance with this guideline.
All other share awards are satisfied by the use of shares that are purchased in the market. Further information in respect of the share plan arrangements and outstanding balances under each plan can be found in note 43 to the financial statements.
Shareholder votingIn the table below, we set out the results of the remuneration-related resolutions approved at the Group’s 2018 AGMs. Our meetings with shareholders in 2018 were well attended and provided an opportunity for the Committee chairman to discuss remuneration-related topics with shareholders, particularly matters relating to the refreshed Policy. It also includes the results from the last vote on the Approval of the Remuneration Policy Report in 2018.
ResolutionTotal votes
castVotes
forVotes
againstVotes
withheld(a)
Approval of the Remuneration policy 1,209,963,085 1,157,103,709 52,859,376 37,598,712
95.6% 4.4%
Approval of the Directors’ remuneration report: Implementation report 1,207,823,991 1,091,233,129 116,590,862 39,733,694
90.3% 9.7%
Approval of the Directors’ remuneration report 1,219,897,208 1,093,943,297 125,953,911 27,660,314
89.7% 10.3%
Approval of the Rio Tinto 2018 Equity Incentive Plan 1,246,273,582 1,185,191,394 61,082,188 1,284,427
95.1% 4.9%
Approval of potential termination benefits payable under the Rio Tinto 2018 Equity Incentive Plan 1,245,749,221 1,221,760,831 23,988,390 1,809,446
98.1% 1.9%
(a) A vote “withheld” is not a vote in law, and is not counted in the calculation of the proportion of votes for and against the resolution.
Relative spend on remunerationTo show our relative spend on remuneration, the directors have shown other significant disbursements of the company’s funds for comparison.
Stated in US$m 2018 2017 Difference
in spend
Remuneration paid(a) 4,728 4,765 -37
Distributions to shareholders(b) 10,742 6,333 4,409
Purchase of property, plant and equipment and intangible assets(c) 5,430 4,482 948
Corporate income tax paid(c) 3,602 2,307 1,295
(a) Total employment costs for the financial year as per note 5 to the financial statements. (b) Distributions to shareholders include equity dividends paid to owners of Rio Tinto and
own shares purchased from owners of Rio Tinto as per the Group cash flow statement.(c) Purchase of property, plant and equipment and intangible assets, and corporate income tax
paid during the financial year are as per the Group cash flow statement and are calculated as per note 1 to the financial statements.
Gender payRio Tinto is committed to ensuring that employees with similar skills, knowledge, qualifications, experience and performance are paid equally for the same or comparable work.
The company’s statement on pay equity, and our approach to diversity and inclusion, are set out on pages 55 to 56, and on the company’s website. An additional voluntary disclosure on UK gender pay reporting is set out on the company’s website.
Remuneration report | Implementation report Annual report 2018 | riotinto.com 129
Governance
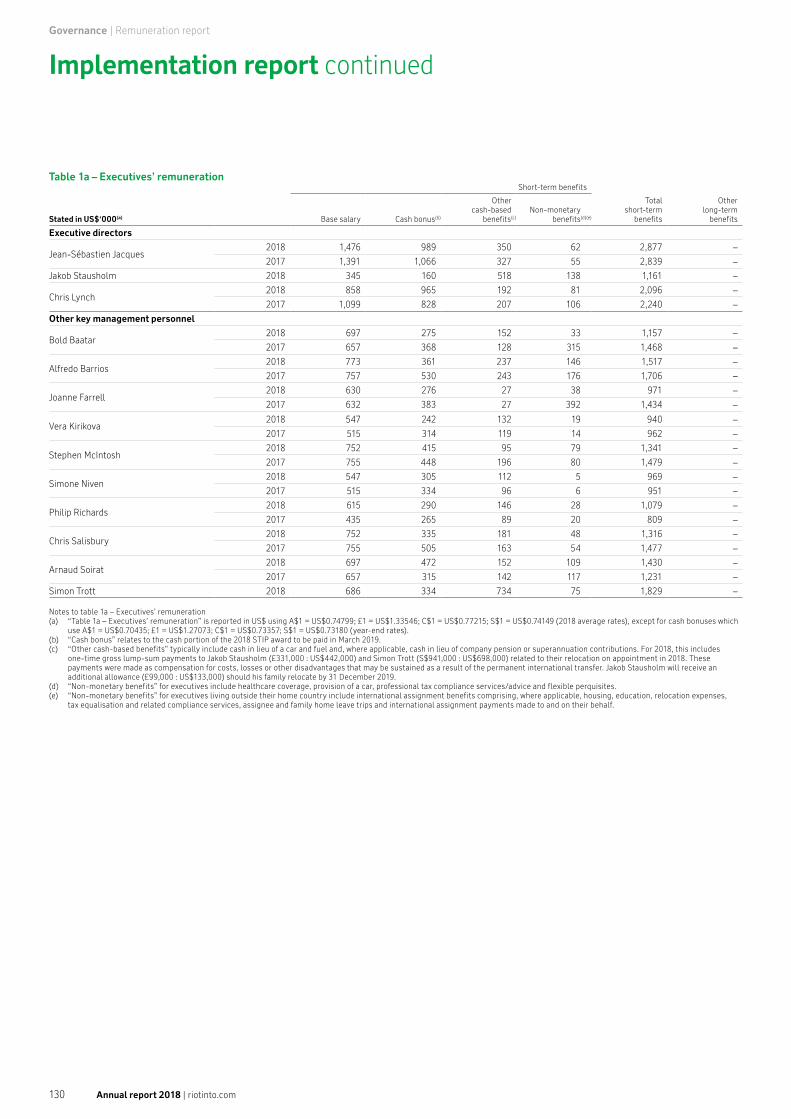
Table 1a – Executives’ remuneration
Stated in US$‘000(a)
Short-term benefits
Base salary Cash bonus(b)
Othercash-based
benefits(c)Non-monetary
benefits(d)(e)
Totalshort-term
benefits
Other long-term
benefits
Executive directors
Jean-Sébastien Jacques2018 1,476 989 350 62 2,877 –
2017 1,391 1,066 327 55 2,839 –
Jakob Stausholm 2018 345 160 518 138 1,161 –
Chris Lynch2018 858 965 192 81 2,096 –
2017 1,099 828 207 106 2,240 –
Other key management personnel
Bold Baatar2018 697 275 152 33 1,157 –
2017 657 368 128 315 1,468 –
Alfredo Barrios2018 773 361 237 146 1,517 –
2017 757 530 243 176 1,706 –
Joanne Farrell2018 630 276 27 38 971 –
2017 632 383 27 392 1,434 –
Vera Kirikova2018 547 242 132 19 940 –
2017 515 314 119 14 962 –
Stephen McIntosh2018 752 415 95 79 1,341 –
2017 755 448 196 80 1,479 –
Simone Niven2018 547 305 112 5 969 –
2017 515 334 96 6 951 –
Philip Richards2018 615 290 146 28 1,079 –
2017 435 265 89 20 809 –
Chris Salisbury2018 752 335 181 48 1,316 –
2017 755 505 163 54 1,477 –
Arnaud Soirat2018 697 472 152 109 1,430 –
2017 657 315 142 117 1,231 –
Simon Trott 2018 686 334 734 75 1,829 –
Notes to table 1a – Executives’ remuneration(a) “Table 1a – Executives’ remuneration” is reported in US$ using A$1 = US$0.74799; £1 = US$1.33546; C$1 = US$0.77215; S$1 = US$0.74149 (2018 average rates), except for cash bonuses which
use A$1 = US$0.70435; £1 = US$1.27073; C$1 = US$0.73357; S$1 = US$0.73180 (year-end rates).(b) “Cash bonus” relates to the cash portion of the 2018 STIP award to be paid in March 2019.(c) “Other cash-based benefits” typically include cash in lieu of a car and fuel and, where applicable, cash in lieu of company pension or superannuation contributions. For 2018, this includes
one-time gross lump-sum payments to Jakob Stausholm (£331,000 : US$442,000) and Simon Trott (S$941,000 : US$698,000) related to their relocation on appointment in 2018. These payments were made as compensation for costs, losses or other disadvantages that may be sustained as a result of the permanent international transfer. Jakob Stausholm will receive an additional allowance (£99,000 : US$133,000) should his family relocate by 31 December 2019.
(d) “Non-monetary benefits” for executives include healthcare coverage, provision of a car, professional tax compliance services/advice and flexible perquisites.(e) “Non-monetary benefits” for executives living outside their home country include international assignment benefits comprising, where applicable, housing, education, relocation expenses,
tax equalisation and related compliance services, assignee and family home leave trips and international assignment payments made to and on their behalf.
Implementation report continued
Governance | Remuneration report
Annual report 2018 | riotinto.com130
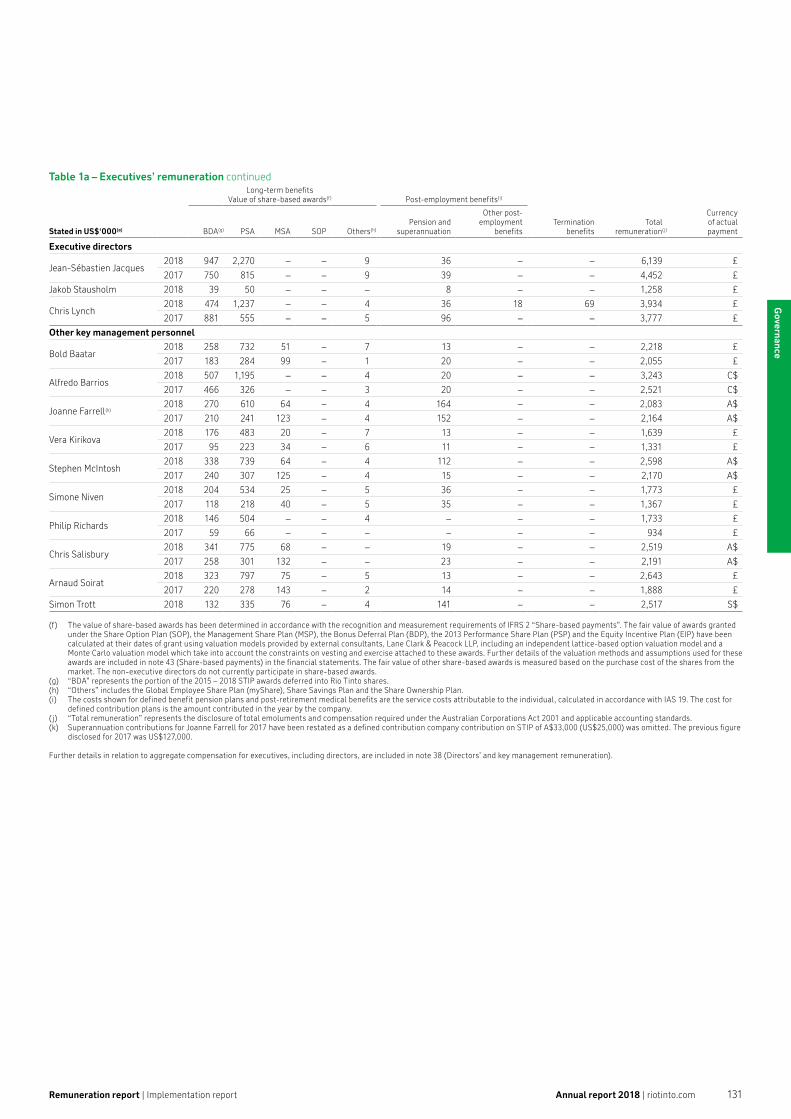
Remuneration report | Implementation report
Table 1a – Executives’ remuneration continued
Stated in US$‘000(a)
Long-term benefitsValue of share-based awards(f) Post-employment benefits(i)
Currencyof actualpaymentBDA(g) PSA MSA SOP Others(h)
Pension andsuperannuation
Other post-employment
benefitsTermination
benefitsTotal
remuneration(j)
Executive directors
Jean-Sébastien Jacques2018 947 2,270 – – 9 36 – – 6,139 £
2017 750 815 – – 9 39 – – 4,452 £
Jakob Stausholm 2018 39 50 – – – 8 – – 1,258 £
Chris Lynch2018 474 1,237 – – 4 36 18 69 3,934 £
2017 881 555 – – 5 96 – – 3,777 £
Other key management personnel
Bold Baatar2018 258 732 51 – 7 13 – – 2,218 £
2017 183 284 99 – 1 20 – – 2,055 £
Alfredo Barrios2018 507 1,195 – – 4 20 – – 3,243 C$
2017 466 326 – – 3 20 – – 2,521 C$
Joanne Farrell(k)2018 270 610 64 – 4 164 – – 2,083 A$
2017 210 241 123 – 4 152 – – 2,164 A$
Vera Kirikova2018 176 483 20 – 7 13 – – 1,639 £
2017 95 223 34 – 6 11 – – 1,331 £
Stephen McIntosh2018 338 739 64 – 4 112 – – 2,598 A$
2017 240 307 125 – 4 15 – – 2,170 A$
Simone Niven2018 204 534 25 – 5 36 – – 1,773 £
2017 118 218 40 – 5 35 – – 1,367 £
Philip Richards2018 146 504 – – 4 – – – 1,733 £
2017 59 66 – – – – – – 934 £
Chris Salisbury2018 341 775 68 – – 19 – – 2,519 A$
2017 258 301 132 – – 23 – – 2,191 A$
Arnaud Soirat2018 323 797 75 – 5 13 – – 2,643 £
2017 220 278 143 – 2 14 – – 1,888 £
Simon Trott 2018 132 335 76 – 4 141 – – 2,517 S$
(f) The value of share-based awards has been determined in accordance with the recognition and measurement requirements of IFRS 2 “Share-based payments”. The fair value of awards granted under the Share Option Plan (SOP), the Management Share Plan (MSP), the Bonus Deferral Plan (BDP), the 2013 Performance Share Plan (PSP) and the Equity Incentive Plan (EIP) have been calculated at their dates of grant using valuation models provided by external consultants, Lane Clark & Peacock LLP, including an independent lattice-based option valuation model and a Monte Carlo valuation model which take into account the constraints on vesting and exercise attached to these awards. Further details of the valuation methods and assumptions used for these awards are included in note 43 (Share-based payments) in the financial statements. The fair value of other share-based awards is measured based on the purchase cost of the shares from the market. The non-executive directors do not currently participate in share-based awards.
(g) “BDA” represents the portion of the 2015 – 2018 STIP awards deferred into Rio Tinto shares.(h) “Others” includes the Global Employee Share Plan (myShare), Share Savings Plan and the Share Ownership Plan.(i) The costs shown for defined benefit pension plans and post-retirement medical benefits are the service costs attributable to the individual, calculated in accordance with IAS 19. The cost for
defined contribution plans is the amount contributed in the year by the company.( j) “Total remuneration” represents the disclosure of total emoluments and compensation required under the Australian Corporations Act 2001 and applicable accounting standards.(k) Superannuation contributions for Joanne Farrell for 2017 have been restated as a defined contribution company contribution on STIP of A$33,000 (US$25,000) was omitted. The previous figure
disclosed for 2017 was US$127,000.
Further details in relation to aggregate compensation for executives, including directors, are included in note 38 (Directors’ and key management remuneration).
Annual report 2018 | riotinto.com 131
Governance
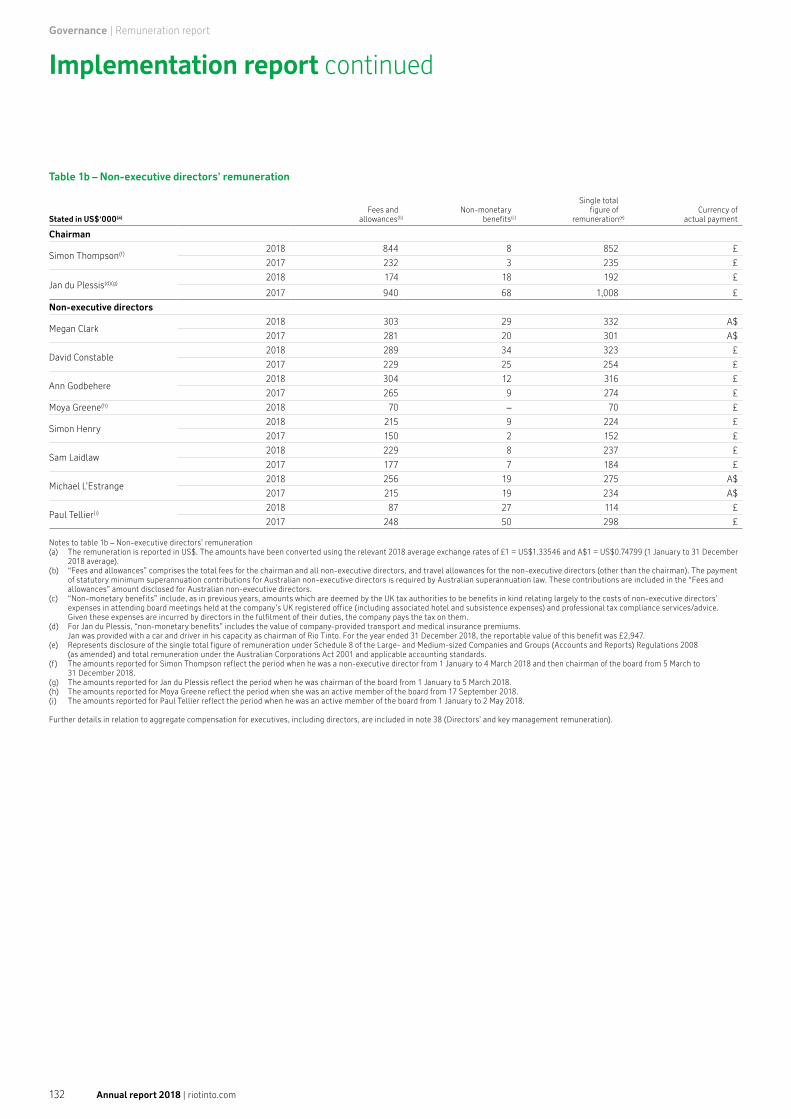
Table 1b – Non-executive directors’ remuneration
Stated in US$‘000(a)Fees and
allowances(b)Non-monetary
benefits(c)
Single totalfigure of
remuneration(e)Currency of
actual payment
Chairman
Simon Thompson(f)2018 844 8 852 £
2017 232 3 235 £
Jan du Plessis(d)(g)2018 174 18 192 £
2017 940 68 1,008 £
Non-executive directors
Megan Clark2018 303 29 332 A$
2017 281 20 301 A$
David Constable2018 289 34 323 £
2017 229 25 254 £
Ann Godbehere2018 304 12 316 £
2017 265 9 274 £
Moya Greene(h) 2018 70 – 70 £
Simon Henry2018 215 9 224 £
2017 150 2 152 £
Sam Laidlaw2018 229 8 237 £
2017 177 7 184 £
Michael L’Estrange2018 256 19 275 A$
2017 215 19 234 A$
Paul Tellier(i)2018 87 27 114 £
2017 248 50 298 £
Notes to table 1b – Non-executive directors’ remuneration(a) The remuneration is reported in US$. The amounts have been converted using the relevant 2018 average exchange rates of £1 = US$1.33546 and A$1 = US$0.74799 (1 January to 31 December
2018 average).(b) “Fees and allowances” comprises the total fees for the chairman and all non-executive directors, and travel allowances for the non-executive directors (other than the chairman). The payment
of statutory minimum superannuation contributions for Australian non-executive directors is required by Australian superannuation law. These contributions are included in the “Fees and allowances” amount disclosed for Australian non-executive directors.
(c) “Non-monetary benefits” include, as in previous years, amounts which are deemed by the UK tax authorities to be benefits in kind relating largely to the costs of non-executive directors’ expenses in attending board meetings held at the company’s UK registered office (including associated hotel and subsistence expenses) and professional tax compliance services/advice. Given these expenses are incurred by directors in the fulfilment of their duties, the company pays the tax on them.
(d) For Jan du Plessis, “non-monetary benefits” includes the value of company-provided transport and medical insurance premiums. Jan was provided with a car and driver in his capacity as chairman of Rio Tinto. For the year ended 31 December 2018, the reportable value of this benefit was £2,947.
(e) Represents disclosure of the single total figure of remuneration under Schedule 8 of the Large- and Medium-sized Companies and Groups (Accounts and Reports) Regulations 2008 (as amended) and total remuneration under the Australian Corporations Act 2001 and applicable accounting standards.
(f) The amounts reported for Simon Thompson reflect the period when he was a non-executive director from 1 January to 4 March 2018 and then chairman of the board from 5 March to 31 December 2018.
(g) The amounts reported for Jan du Plessis reflect the period when he was chairman of the board from 1 January to 5 March 2018.(h) The amounts reported for Moya Greene reflect the period when she was an active member of the board from 17 September 2018.(i) The amounts reported for Paul Tellier reflect the period when he was an active member of the board from 1 January to 2 May 2018.
Further details in relation to aggregate compensation for executives, including directors, are included in note 38 (Directors’ and key management remuneration).
Implementation report continued
Governance | Remuneration report
Annual report 2018 | riotinto.com132

Remuneration report | Implementation report
Table 2 – Directors’ and executives’ beneficial interests in Rio Tinto shares
Rio Tinto plc(a) Rio Tinto Limited Movements
1 Jan2018(b)
31 Dec 2018(c)
15 Feb2019(d)
1 Jan2018(b)
31 Dec2018(c)
15 Feb2019(d)
Exercise ofoptions(e) Compensation(f) Other(g)
Directors
Megan Clark – – – 4,085 5,245 5,245 – – 1,160
David Constable 1,167 2,547 2,547 – – – – – 1,380
Jan du Plessis(h) 30,000 30,000 – – – – – – –
Ann Godbehere 3,100 3,100 3,100 – – – – – –
Moya Greene(h) 2,618 2,618 2,618 – – – – – –
Simon Henry – 500 500 – – – – – 500
Jean-Sébastien Jacques 38,541 64,740 64,785 – – – – 45,418 (19,175)
Sam Laidlaw 7,500 7,500 7,500 – – – – – –
Michael L’Estrange – – – 2,603 3,103 3,103 – – 500
Chris Lynch(h) 42,753 65,962 – 6,890 6,890 – – 40,599 (17,390)
Simon McKeon(h) – – – – – 10,000 – – –
Jakob Stausholm(h) – 15,000 15,000 – – – – – 15,000
Paul Tellier(h) 25,371 25,371 – – – – – – –
Simon Thompson 7,458 7,458 7,458 – – – – – –
Executives
Bold Baatar 9,617 17,231 17,250 – – – – 9,156 (1523)
Alfredo Barrios 7,893 17,906 17,949 – – – – 19,304 (9248)
Joanne Farrell 2,995 3,175 3,175 34,536 41,001 41,040 – 9,073 (2389)
Vera Kirikova 2,178 3,768 3,812 – – – – 2,263 (629)
Stephen McIntosh 8,385 8,478 8,478 10,878 17,784 17,823 – 11,962 (4,924)
Simone Niven 3,347 5,895 5,895 – – – – 4,287 (1,739)
Philip Richards – 68 68 – – – – 67 1
Chris Salisbury – – – 20,779 27,837 27,837 938 11,282 (5,161)
Arnaud Soirat 59 155 155 12,759 20,626 20,626 – 10,995 (3,032)
Simon Trott(h) – 74 98 5,066 11,536 11,577 – 6,332 276
Notes to table 2 – Directors’ and executives’ beneficial interests in Rio Tinto shares(a) Rio Tinto plc ordinary shares or Rio Tinto plc ADRs. (b) Or date of appointment, if later.(c) Or date of retirement from the board/date stepped down from the Executive Committee, if earlier.(d) Latest practicable date prior to the publication of the 2018 Annual report. (e) Shares obtained through the exercise of options under the Rio Tinto Share Savings Plan or the Share Option Plan. The number of shares retained may differ from the number of options exercised.(f) Shares obtained through awards under the Rio Tinto Share Ownership Plan, the Global Employee Share Plan and/or vesting of the Performance Share Awards (PSA), Management Share Awards
(MSA) and Bonus Deferral Awards (BDA) granted under the Group’s Long Term Incentive Plan (LTIP) arrangements.(g) Share movements due to the sale or purchase of shares, or shares received under dividend reinvestment plans.(h) Jakob Stausholm, Moya Greene and Simon McKeon were appointed as directors with effect from 3 September 2018, 17 September 2018 and 1 January 2019 respectively. Jan du Plessis, Paul
Tellier and Chris Lynch retired as directors on 5 March 2018, 2 May 2018 and 3 September 2018 respectively. Simon Trott joined the Executive Committee on 1 January 2018.
Interests in outstanding awards under LTIPs and the SOP are set out in table 3.
Annual report 2018 | riotinto.com 133
Governance
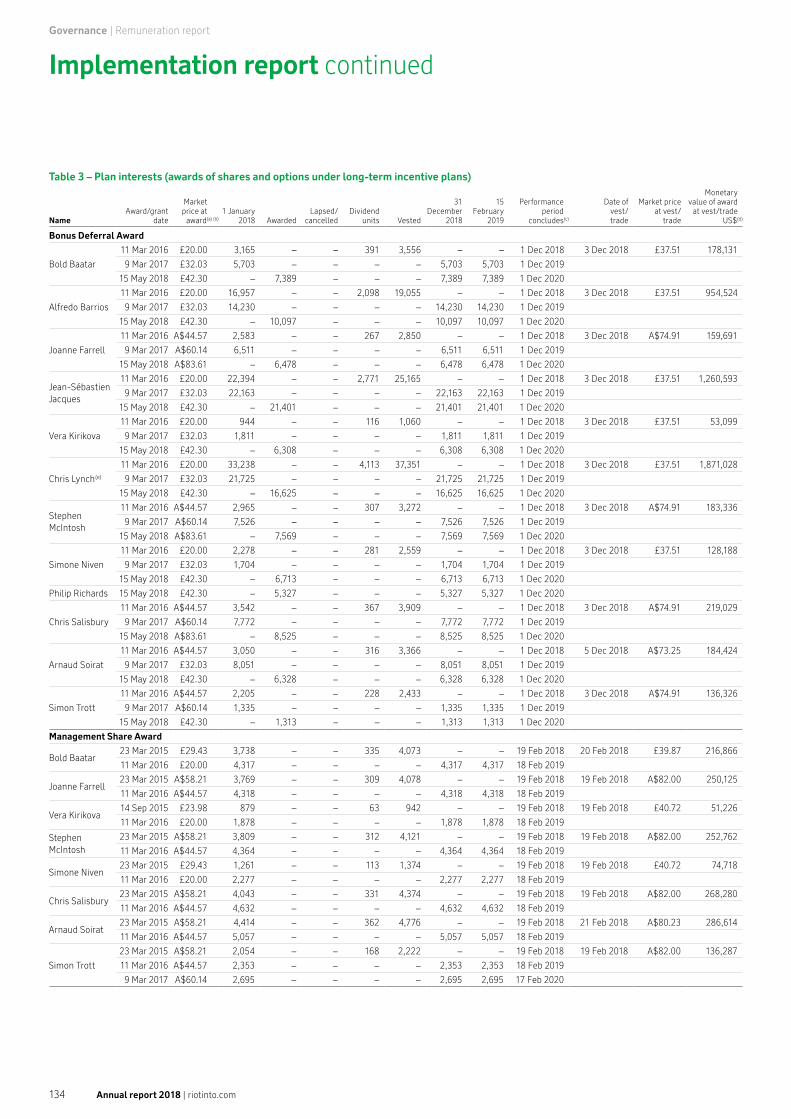
Governance | Remuneration report
Table 3 – Plan interests (awards of shares and options under long-term incentive plans)
NameAward/grant
date
Market price at
award(a) (b)1 January
2018 AwardedLapsed/
cancelledDividend
units Vested
31 December
2018
15 February
2019
Performance period
concludes(c)
Date of vest/
trade
Market price at vest/
trade
Monetary value of award
at vest/tradeUS$(d)
Bonus Deferral Award
Bold Baatar
11 Mar 2016 £20.00 3,165 – – 391 3,556 – – 1 Dec 2018 3 Dec 2018 £37.51 178,131
9 Mar 2017 £32.03 5,703 – – – – 5,703 5,703 1 Dec 2019
15 May 2018 £42.30 – 7,389 – – – 7,389 7,389 1 Dec 2020
Alfredo Barrios
11 Mar 2016 £20.00 16,957 – – 2,098 19,055 – – 1 Dec 2018 3 Dec 2018 £37.51 954,524
9 Mar 2017 £32.03 14,230 – – – – 14,230 14,230 1 Dec 2019
15 May 2018 £42.30 – 10,097 – – – 10,097 10,097 1 Dec 2020
Joanne Farrell
11 Mar 2016 A$44.57 2,583 – – 267 2,850 – – 1 Dec 2018 3 Dec 2018 A$74.91 159,691
9 Mar 2017 A$60.14 6,511 – – – – 6,511 6,511 1 Dec 2019
15 May 2018 A$83.61 – 6,478 – – – 6,478 6,478 1 Dec 2020
Jean-Sébastien Jacques
11 Mar 2016 £20.00 22,394 – – 2,771 25,165 – – 1 Dec 2018 3 Dec 2018 £37.51 1,260,593
9 Mar 2017 £32.03 22,163 – – – – 22,163 22,163 1 Dec 2019
15 May 2018 £42.30 – 21,401 – – – 21,401 21,401 1 Dec 2020
Vera Kirikova
11 Mar 2016 £20.00 944 – – 116 1,060 – – 1 Dec 2018 3 Dec 2018 £37.51 53,099
9 Mar 2017 £32.03 1,811 – – – – 1,811 1,811 1 Dec 2019
15 May 2018 £42.30 – 6,308 – – – 6,308 6,308 1 Dec 2020
Chris Lynch(e)
11 Mar 2016 £20.00 33,238 – – 4,113 37,351 – – 1 Dec 2018 3 Dec 2018 £37.51 1,871,028
9 Mar 2017 £32.03 21,725 – – – – 21,725 21,725 1 Dec 2019
15 May 2018 £42.30 – 16,625 – – – 16,625 16,625 1 Dec 2020
Stephen McIntosh
11 Mar 2016 A$44.57 2,965 – – 307 3,272 – – 1 Dec 2018 3 Dec 2018 A$74.91 183,336
9 Mar 2017 A$60.14 7,526 – – – – 7,526 7,526 1 Dec 2019
15 May 2018 A$83.61 – 7,569 – – – 7,569 7,569 1 Dec 2020
Simone Niven
11 Mar 2016 £20.00 2,278 – – 281 2,559 – – 1 Dec 2018 3 Dec 2018 £37.51 128,188
9 Mar 2017 £32.03 1,704 – – – – 1,704 1,704 1 Dec 2019
15 May 2018 £42.30 – 6,713 – – – 6,713 6,713 1 Dec 2020
Philip Richards 15 May 2018 £42.30 – 5,327 – – – 5,327 5,327 1 Dec 2020
Chris Salisbury
11 Mar 2016 A$44.57 3,542 – – 367 3,909 – – 1 Dec 2018 3 Dec 2018 A$74.91 219,029
9 Mar 2017 A$60.14 7,772 – – – – 7,772 7,772 1 Dec 2019
15 May 2018 A$83.61 – 8,525 – – – 8,525 8,525 1 Dec 2020
Arnaud Soirat
11 Mar 2016 A$44.57 3,050 – – 316 3,366 – – 1 Dec 2018 5 Dec 2018 A$73.25 184,424
9 Mar 2017 £32.03 8,051 – – – – 8,051 8,051 1 Dec 2019
15 May 2018 £42.30 – 6,328 – – – 6,328 6,328 1 Dec 2020
Simon Trott
11 Mar 2016 A$44.57 2,205 – – 228 2,433 – – 1 Dec 2018 3 Dec 2018 A$74.91 136,326
9 Mar 2017 A$60.14 1,335 – – – – 1,335 1,335 1 Dec 2019
15 May 2018 £42.30 – 1,313 – – – 1,313 1,313 1 Dec 2020
Management Share Award
Bold Baatar23 Mar 2015 £29.43 3,738 – – 335 4,073 – – 19 Feb 2018 20 Feb 2018 £39.87 216,866
11 Mar 2016 £20.00 4,317 – – – – 4,317 4,317 18 Feb 2019
Joanne Farrell23 Mar 2015 A$58.21 3,769 – – 309 4,078 – – 19 Feb 2018 19 Feb 2018 A$82.00 250,125
11 Mar 2016 A$44.57 4,318 – – – – 4,318 4,318 18 Feb 2019
Vera Kirikova14 Sep 2015 £23.98 879 – – 63 942 – – 19 Feb 2018 19 Feb 2018 £40.72 51,226
11 Mar 2016 £20.00 1,878 – – – – 1,878 1,878 18 Feb 2019
Stephen McIntosh
23 Mar 2015 A$58.21 3,809 – – 312 4,121 – – 19 Feb 2018 19 Feb 2018 A$82.00 252,762
11 Mar 2016 A$44.57 4,364 – – – – 4,364 4,364 18 Feb 2019
Simone Niven23 Mar 2015 £29.43 1,261 – – 113 1,374 – – 19 Feb 2018 19 Feb 2018 £40.72 74,718
11 Mar 2016 £20.00 2,277 – – – – 2,277 2,277 18 Feb 2019
Chris Salisbury23 Mar 2015 A$58.21 4,043 – – 331 4,374 – – 19 Feb 2018 19 Feb 2018 A$82.00 268,280
11 Mar 2016 A$44.57 4,632 – – – – 4,632 4,632 18 Feb 2019
Arnaud Soirat23 Mar 2015 A$58.21 4,414 – – 362 4,776 – – 19 Feb 2018 21 Feb 2018 A$80.23 286,614
11 Mar 2016 A$44.57 5,057 – – – – 5,057 5,057 18 Feb 2019
Simon Trott
23 Mar 2015 A$58.21 2,054 – – 168 2,222 – – 19 Feb 2018 19 Feb 2018 A$82.00 136,287
11 Mar 2016 A$44.57 2,353 – – – – 2,353 2,353 18 Feb 2019
9 Mar 2017 A$60.14 2,695 – – – – 2,695 2,695 17 Feb 2020
Implementation report continued
Annual report 2018 | riotinto.com134

Remuneration report | Implementation report
Table 3 – Plan interests (awards of shares and options under long–term incentive plans) continued
NameAward/grant
date
Market price
at award(a) (b)1 January
2018 AwardedLapsed/
cancelledDividend
units Vested
31 December
2018
15 February
2019
Performance period
concludes(c)
Date of vest/ trade
Market price at vest/
trade
Monetary value of award
at vest/tradeUS$(d)
Performance Share Award(f)
Bold Baatar
16 Sep 2013 £31.83 1,751 – (584) 175 1,342 – – 31 Dec 2017 20 Feb 2018/ 1 Jun 2018
£39.87/ £42.94
35,403/ 38,818
17 Mar 2014 £31.80 7,765 – – – – 7,765 7,765 31 Dec 2018
23 Mar 2015 £29.43 14,954 – – – – 14,954 14,954 31 Dec 2019
11 Mar 2016 £20.00 17,270 – – – – 17,270 17,270 31 Dec 2020
9 Mar 2017 £32.03 85,174 – – – – 85,174 85,174 31 Dec 2021
15 May 2018 £42.30 – 63,039 – – – 63,039 63,039 31 Dec 2022
Alfredo Barrios
15 Sep 2014 £32.35 43,568 – – – – 43,568 43,568 31 Dec 2018
23 Mar 2015 £29.43 66,390 – – – – 66,390 66,390 31 Dec 2019
11 Mar 2016 £20.00 73,140 – – – – 73,140 73,140 31 Dec 2020
9 Mar 2017 £32.03 91,721 – – – – 91,721 91,721 31 Dec 2021
15 May 2018 £42.30 – 66,050 – – – 66,050 66,050 31 Dec 2022
Joanne Farrell
27 May 2013 A$53.11 2,477 – (826) 250 1,901 – – 31 Dec 2017 19 Feb 2018/ 31 May 2018
A$82.00/A$82.75
57,778/ 59,358
17 Mar 2014 A$61.28 7,448 – – – – 7,448 7,448 31 Dec 2018
23 Mar 2015 A$58.21 7,539 – – – – 7,539 7,539 31 Dec 2019
11 Mar 2016 A$44.57 8,637 – – – – 8,637 8,637 31 Dec 2020
9 Mar 2017 A$60.14 66,295 – – – – 66,295 66,295 31 Dec 2021
15 May 2018 A$83.61 – 48,612 – – – 48,612 48,612 31 Dec 2022
Jean-Sébastien Jacques
27 May 2013 £28.67 25,683 – (8,562) 2,810 19,931 – – 31 Dec 2017 19 Feb 2018/ 31 May 2018
£40.72/ £42.47
536,836/ 570,568
17 Mar 2014 £31.80 70,057 – – – – 70,057 70,057 31 Dec 2018
23 Mar 2015 £29.43 72,768 – – – – 72,768 72,768 31 Dec 2019
11 Mar 2016 £20.00 84,005 – – – – 84,005 84,005 31 Dec 2020
12 Sep 2016 £22.95 79,966 – – – – 79,966 79,966 31 Dec 2020
9 Mar 2017 £32.03 184,994 – – – – 184,994 184,994 31 Dec 2021
15 May 2018 £42.30 – 139,995 – – – 139,995 139,995 31 Dec 2022
Vera Kirikova
14 Sep 2015 £23.98 1,758 – – – – 1,758 1,758 31 Dec 2019
11 Mar 2016 £20.00 5,636 – – – – 5,636 5,636 31 Dec 2020
9 Mar 2017 £32.03 66,803 – – – – 66,803 66,803 31 Dec 2021
15 May 2018 £42.30 – 45,219 – – – 45,219 45,219 31 Dec 2022
Chris Lynch(e)
27 May 2013 £28.67 52,085 – (17,362) 5,700 40,423 – – 31 Dec 2017 19 Feb 2018/ 31 May 2018
£40.72/ £42.47
1,088,792/ 1,157,187
17 Mar 2014 £31.80 104,312 – – – – 104,312 104,312 31 Dec 2018
23 Mar 2015 £29.43 112,620 – – – – 112,620 112,620 31 Dec 2019
11 Mar 2016 £20.00 126,987 – (18,671) – – 108,316 108,316 31 Dec 2020
9 Mar 2017 £32.03 146,711 – (70,276) – – 76,435 76,435 31 Dec 2021
Stephen McIntosh
27 May 2013 A$53.11 5,633 – (1,878) 570 4,325 – – 31 Dec 2017 19 Feb 2018/ 31 May 2018
A$82.00/ A$82.75
131,380/ 135,119
17 Mar 2014 A$61.28 7,578 – – – – 7,578 7,578 31 Dec 2018
23 Mar 2015 A$58.21 11,429 – – – – 11,429 11,429 31 Dec 2019
11 Mar 2016 A$44.57 13,093 – – – – 13,093 13,093 31 Dec 2020
9 Mar 2017 A$60.14 79,152 – – – – 79,152 79,152 31 Dec 2021
15 May 2018 A$83.61 – 58,040 – – – 58,040 58,040 31 Dec 2022
Simone Niven
27 May 2013 £28.67 343 – (115) 36 264 – – 31 Dec 2017 19 Feb 2018/ 31 May 2018
£40.72/ £42.47
7,124/ 7,543
17 Mar 2014 £31.80 3,660 – – – – 3,660 3,660 31 Dec 2018
23 Mar 2015 £29.43 5,041 – – – – 5,041 5,041 31 Dec 2019
11 Mar 2016 £20.00 9,109 – – – – 9,109 9,109 31 Dec 2020
9 Mar 2017 £32.03 66,803 – – – – 66,803 66,803 31 Dec 2021
15 May 2018 £42.30 – 49,440 – – – 49,440 49,440 31 Dec 2022
Philip Richards11 Sep 2017 £36.78 57,810 – – – – 57,810 57,810 31 Dec 2021
15 May 2018 £42.30 – 50,872 – – – 50,872 50,872 31 Dec 2022
Annual report 2018 | riotinto.com 135
Governance

Governance | Remuneration report
Table 3 – Plan interests (awards of shares and options under long–term incentive plans) continued
NameAward/grant
date
Market price
at award(a) (b)1 January
2018 AwardedLapsed/
cancelledDividend
units Vested
31 December
2018
15 February
2019
Performance period
concludes(c)
Date of vest/ trade
Market price at vest/
trade
Monetary value of award
at vest/tradeUS$(d)
Chris Salisbury
27 May 2013 A$53.11 3,907 – (1,303) 395 2,999 – – 31 Dec 2017 19 Feb 2018/ 31 May 2018
A$82.00/ A$82.75
91,083/ 93,711
17 Mar 2014 A$61.28 7,994 – – – – 7,994 7,994 31 Dec 201823 Mar 2015 A$58.21 16,175 – – – – 16,175 16,175 31 Dec 201911 Mar 2016 A$44.57 13,898 – – – – 13,898 13,898 31 Dec 20209 Mar 2017 A$60.14 79,152 – – – – 79,152 79,152 31 Dec 2021
15 May 2018 A$83.61 – 63,457 – – – 63,457 63,457 31 Dec 2022
Arnaud Soirat
27 May 2013 A$53.11 3,601 – (1,201) 363 2,763 – – 31 Dec 2017 21 Feb 2018/ 4 Jun 2018
A$80.23/ A$83.19
82,095/ 86,804
17 Mar 2014 A$61.28 16,326 – – – – 16,326 16,326 31 Dec 201823 Mar 2015 A$58.21 17,658 – – – – 17,658 17,658 31 Dec 201911 Mar 2016 A$44.57 20,230 – – – – 20,230 20,230 31 Dec 20209 Mar 2017 £32.03 85,174 – – – – 85,174 85,174 31 Dec 2021
15 May 2018 £42.30 – 57,657 – – – 57,657 57,657 31 Dec 2022Jakob Stausholm 10 Sep 2018 £35.16 – 29,886 – – – 29,886 29,886 31 Dec 2022
Simon Trott
27 May 2013 A$53.11 1,834 – (612) 184 1,406 – – 31 Dec 2017 19 Feb 2018/ 31 May 2018
A$82.00/ A$82.75
42,689/ 43,946
17 Mar 2014 A$61.28 5,135 – – – – 5,135 5,135 31 Dec 201823 Mar 2015 A$58.21 8,216 – – – – 8,216 8,216 31 Dec 201911 Mar 2016 A$44.57 9,412 – – – – 9,412 9,412 31 Dec 20209 Mar 2017 A$60.14 8,085 – – – – 8,085 8,085 31 Dec 2021
15 May 2018 £42.30 – 57,188 – – – 57,188 57,188 31 Dec 2022
Name Date of grant1 January
2018(a)
Vested during
2018 ExercisedLapsed/
cancelled
Vested and exercisable
on 31 Dec 2018
31 December
2018
Vested and exercisable
on 15 February
2019
15 February
2019Exercise
price
Value of options
exercised during 2018
Market price on date of
exercise
Date from which first
exercisableExpiry
date
Share Option Plan(g)
Chris Salisbury 17 Mar 2009 3,335 – 3,335 – – – – – A$33.45 A$254,027 A$76.17 17 Mar 2012
17 Mar 2019
(a) Awards and options denominated in pounds sterling were for Rio Tinto plc ordinary shares of 10 pence each and awards denominated in Australian dollars were for Rio Tinto Limited shares. All awards and options are granted over ordinary shares. Where an exercise price is stated, it represents the amount payable per share on the exercise of the option by the participant.
(b) The weighted fair value per share of Bonus Deferral Awards granted in 2018 was £42.41 for Rio Tinto plc and A$84.47 for Rio Tinto Limited and for PSA was £26.87 for Rio Tinto plc and A$53.99 for Rio Tinto Limited. Conditional awards are awarded at no cost to the participant and no amount remains unpaid on any shares awarded.
(c) Details of performance conditions for the PSA are provided below. For awards granted from 2013, for the TSR component (constituting two thirds of the award), where TSR performance is measured against both the EMIX Global Mining Index and the MSCI World Index, the award will vest as follows: – Outperformance of the index by 6% per annum 1.0x award vests – Performance between equal to the index and 6% outperformance Proportionate vesting between 0.225x and 1.0x vesting – Performance equal to the index 0.225x award vests – Performance less than index Nil vesting
For awards granted from 2013 to 2017, one-third of the award is subject to an EBIT margin condition measuring the change in the EBIT margin of Rio Tinto and each of the comparator companies (measured on a “point-to-point” basis using the last financial year in the performance period and the financial year prior to the start of the performance period). This will be calculated using independent third-party data. Vesting will be subject to Rio Tinto’s interpolated ranking position using the following schedule: – Equal to or greater than 2nd ranked company 1.0x award vests – Between the 5th and 2nd ranked companies Proportionate vesting between 0.225x and 1.0x vesting – Above the 6th ranked company 0.225x award vests – Equal to the 6th ranked company or below Nil vesting
The TSR performance condition (two thirds of the award) vests in February with the EBIT performance condition (one third of the award) vesting in May. Due to the phased vesting nature of the award, details of each vest are displayed separately side by side within the table.For awards granted from 2018 the EBIT performance condition will not apply. Instead the award will be subject to the TSR measures described above, with each applied to 50% of the award.If vesting is achieved, participants will be entitled to receive a number of additional shares whose market value reflects the aggregate cash amount of dividends that would have been received had the number of shares which have vested at the end of the performance period been held throughout the period.
(d) The amount in US$ has been converted at the rate of US$1.33546 = £1 and US$0.74799 = A$1, being the average exchange rates for 2018.(e) Balances shown for Chris Lynch are as at 31 December 2018 and 15 February 2019 rather than the date he left Rio Tinto (30 September 2018). (f) For the Performance Share Awards granted on 17 March 2014 with a performance period that concluded on 31 December 2018, 33.3% of the award vested in relation to the TSR portion. The remaining
performance condition of relative EBIT margin will be assessed later in 2019.(g) No options have been granted to executives since 19 March 2012.
The closing price at 31 December 2018 was £37.30 for Rio Tinto plc ordinary shares and was A$78.47 for Rio Tinto Limited ordinary shares. The high and low prices during 2018 of Rio Tinto plc and Rio Tinto Limited shares were £45.41 and £34.605 and A$87.09 and A$69.41 respectively. As of 15 February 2019, members of the Executive Committee held 2,522,618 shares awarded and not vested under long-term incentive plans. No Executive Committee member held any options.
Directors’ approval statementThis Directors’ remuneration report is delivered in accordance with a resolution of the board, and has been signed on behalf of the board by:
Sam LaidlawChairman of the Remuneration Committee 27 February 2019
Annual report 2018 | riotinto.com136

Additional statutory disclosure
Additional statutory disclosure
The directors present their report and audited consolidated financial statements for the year ended 31 December 2018.
Scope of this reportFor the purposes of UK company law and the Australian Corporations Act 2001: – the additional disclosures under the heading “Shareholder information”
on pages 292 to 298 are hereby incorporated by reference to, and form part of, this Directors’ report;
– the Strategic report on pages 4 to 73 provides a comprehensive review of Rio Tinto’s operations, its financial position and its business strategies and prospects, and is incorporated by reference into, and forms part of this Directors’ report; certain items that would ordinarily need to be included in this Directors’ report (including an indication of likely future developments in the business of the company and the Group) have, as permitted, instead been discussed in the Strategic report, while details of the Group’s policy on addressing financial risks and details about financial instruments are shown in note 30 to the Group financial statements; and
– taken together, the Strategic report and this Directors’ report are intended to provide a fair, balanced and understandable assessment of: the development and performance of the Group’s business during the year and its position at the end of the year; its strategy; likely developments; and any principal risks and uncertainties associated with the Group’s business.
For the purposes of compliance with DTR 4.1.5R(2) and DTR 4.1.8R, the required content of the “Management report” can be found in the Strategic report or this Directors’ report, including the material incorporated by reference.
A full report on director and executive remuneration and shareholdings can be found in the Remuneration report on pages 101 to 136 which for the purposes of the Australian Corporations Act 2001, forms part of this Directors’ report.
Dual listed structure and constitutional documentsThe dual listed companies (DLC) structure of Rio Tinto plc and Rio Tinto Limited, their constitutional provisions and voting arrangements – including restrictions that may apply to the shares of either company under specified circumstances – are described on pages 292 and 293.
Operating and financial reviewRio Tinto’s principal activities during 2018 were minerals and metals exploration, development, production and processing and marketing.
Subsidiary and associated undertakings principally affecting the profits or net assets of the Group in the year are listed in notes 33 to 36 to the financial statements.
The following significant changes and events affected the Group during 2018 and up to the date of this report:
Financial – During 2018, Rio Tinto purchased $5.4 billion of shares through a
combination of on-market purchases of Rio Tinto plc shares and an off-market tender of Rio Tinto Limited shares. The Group returned $2.1 billion through a Rio Tinto Limited off-market tender announced on 20 September 2018 and completed on 12 November 2018.
– In 2018, on-market purchases were completed of $3.3 billion of Rio Tinto plc shares. These comprised the return of $1.9 billion announced in the second half of 2017, the $1 billion programme announced on 7 February 2018 and $0.4 billion of a $1 billion programme announced on 1 August 2018. The remaining $0.6 billion of this last programme will be completed no later than 27 February 2019.
– A further $1.1 billion of the programme announced in September 2018 will be returned through an on-market Rio Tinto plc share buy-back commencing on 28 February 2019 and will be completed no later than 28 February 2020.
– On 20 March 2018, Rio Tinto announced a tender offer and bond redemption exercise to further reduce gross debt and use excess liquidity. Redemption notices for approximately $1.4 billion of US dollar-denominated notes were issued, and invitations commenced to holders outside the US to sell up to approximately $850 million equivalent of its 2020 and 2024 euro-denominated notes. The transactions completed on 20 April 2018; as a result the Group’s gross debt was reduced by $1.94 billion equivalent.
– Following the announcement by the United States Treasury Department on 6 April 2018 that it was implementing sanctions against various Russian individuals and companies, Rio Tinto announced on 13 April 2018 that it had reviewed arrangements with impacted entities and subsequently force majeure was declared on certain contracts. The sanctions’ wind-down period was then extended to 21 January 2019, and no further force majeure declarations were made.
– On 29 November 2018, we announced that we will develop our most technologically advanced mine following the full approval of a $2.6 billion (A$3.5 billion) investment in the Koodaideri iron ore mine in Western Australia.
– At the end of 2018, we announced the signing of the Power Source Framework Agreement between Oyu Tolgoi and the government of Mongolia. This agreement is a binding framework and pathway for the construction of a power plant, and sets out an amended timetable for Oyu Tolgoi to meet its obligation to source power domestically. The 300MW plant will be majority owned by Oyu Tolgoi LLC and will be situated close to the Tavan Tolgoi coalfields. Construction is scheduled to start in 2020, with the commissioning of the plant by mid-2023. The agreement also paves the way for Oyu Tolgoi to supplement its power sourcing requirements with renewable energy.
Transactions – On 10 January 2018, Rio Tinto announced it had received a binding offer
from Liberty House for the sale of the Aluminium Dunkerque smelter in France for $500 million. The sale completed on 14 December 2018.
– On 26 February 2018, Rio Tinto announced it had received a binding offer from Hydro for the ISAL aluminium smelter in Iceland, its 53.3% share in the Aluchemie anode plant in the Netherlands, and its 50% share in the aluminium fluoride plant in Sweden for $345 million. On 14 September 2018, it was announced that Hydro had withdrawn its offer.
– On 1 June 2018, Rio Tinto announced it had completed the sale of its 75% interest in the Winchester South coal development project in Queensland, Australia, to Whitehaven Coal Limited. The total consideration of $200 million comprised $150 million in cash received on the date of completion, and an unconditional cash payment of $50 million due 12 months from the date of completion.
– On 1 August 2018, Rio Tinto announced that the sales of its interests in the Hail Creek coal mine and Valeria coal development project to Glencore had completed, in addition to its interest in the Kestrel underground mine to EMR Capital and PT Adaro Energy Tbk. Gross proceeds totalled $3.95 billion.
– Following the announcement of a non-binding agreement with Inalum (PT Indonesia Asahan Aluminium (Persero)) in relation to its future ownership of the Grasberg mine, Indonesia, the offer was subsequently made binding on 28 September 2018, with Rio Tinto agreeing to sell its entire interest for $3.5 billion. The sale completed on 21 December 2018.
– On 29 October 2018, Rio Tinto announced that the non-binding heads of agreement, originally signed on 28 October 2016, for Chinalco to acquire Rio Tinto’s entire interest in the Simandou iron ore project in Guinea had lapsed.
– On 26 November 2018, Rio Tinto announced it had entered into a binding agreement with China National Uranium Corporation Limited for the sale of its entire 68.62% stake in Rössing Uranium Limited.
Annual report 2018 | riotinto.com 137
Governance
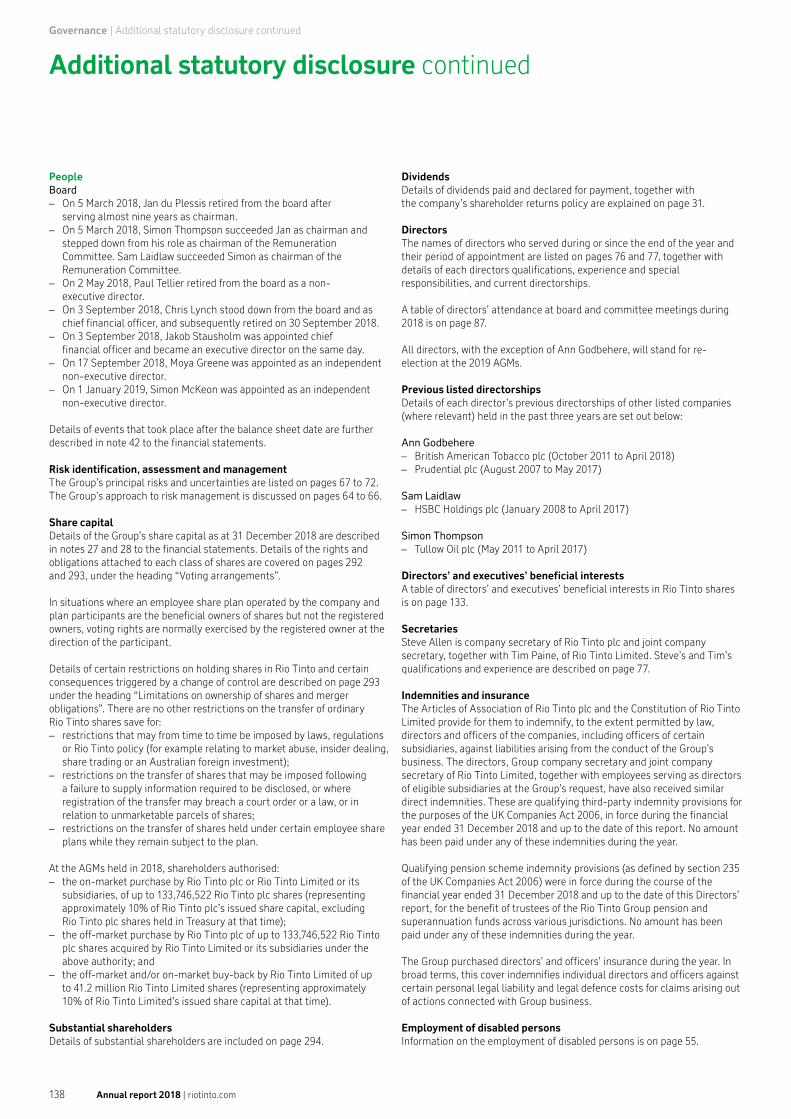
Governance | Additional statutory disclosure continued
PeopleBoard – On 5 March 2018, Jan du Plessis retired from the board after
serving almost nine years as chairman. – On 5 March 2018, Simon Thompson succeeded Jan as chairman and
stepped down from his role as chairman of the Remuneration Committee. Sam Laidlaw succeeded Simon as chairman of the Remuneration Committee.
– On 2 May 2018, Paul Tellier retired from the board as a non-executive director.
– On 3 September 2018, Chris Lynch stood down from the board and as chief financial officer, and subsequently retired on 30 September 2018.
– On 3 September 2018, Jakob Stausholm was appointed chief financial officer and became an executive director on the same day.
– On 17 September 2018, Moya Greene was appointed as an independent non-executive director.
– On 1 January 2019, Simon McKeon was appointed as an independent non-executive director.
Details of events that took place after the balance sheet date are further described in note 42 to the financial statements.
Risk identification, assessment and managementThe Group’s principal risks and uncertainties are listed on pages 67 to 72. The Group’s approach to risk management is discussed on pages 64 to 66.
Share capitalDetails of the Group’s share capital as at 31 December 2018 are described in notes 27 and 28 to the financial statements. Details of the rights and obligations attached to each class of shares are covered on pages 292 and 293, under the heading “Voting arrangements”.
In situations where an employee share plan operated by the company and plan participants are the beneficial owners of shares but not the registered owners, voting rights are normally exercised by the registered owner at the direction of the participant.
Details of certain restrictions on holding shares in Rio Tinto and certain consequences triggered by a change of control are described on page 293 under the heading “Limitations on ownership of shares and merger obligations”. There are no other restrictions on the transfer of ordinary Rio Tinto shares save for: – restrictions that may from time to time be imposed by laws, regulations
or Rio Tinto policy (for example relating to market abuse, insider dealing, share trading or an Australian foreign investment);
– restrictions on the transfer of shares that may be imposed following a failure to supply information required to be disclosed, or where registration of the transfer may breach a court order or a law, or in relation to unmarketable parcels of shares;
– restrictions on the transfer of shares held under certain employee share plans while they remain subject to the plan.
At the AGMs held in 2018, shareholders authorised: – the on-market purchase by Rio Tinto plc or Rio Tinto Limited or its
subsidiaries, of up to 133,746,522 Rio Tinto plc shares (representing approximately 10% of Rio Tinto plc’s issued share capital, excluding Rio Tinto plc shares held in Treasury at that time);
– the off-market purchase by Rio Tinto plc of up to 133,746,522 Rio Tinto plc shares acquired by Rio Tinto Limited or its subsidiaries under the above authority; and
– the off-market and/or on-market buy-back by Rio Tinto Limited of up to 41.2 million Rio Tinto Limited shares (representing approximately 10% of Rio Tinto Limited’s issued share capital at that time).
Substantial shareholdersDetails of substantial shareholders are included on page 294.
Additional statutory disclosure continued
DividendsDetails of dividends paid and declared for payment, together with the company’s shareholder returns policy are explained on page 31.
DirectorsThe names of directors who served during or since the end of the year and their period of appointment are listed on pages 76 and 77, together with details of each directors qualifications, experience and special responsibilities, and current directorships.
A table of directors’ attendance at board and committee meetings during 2018 is on page 87.
All directors, with the exception of Ann Godbehere, will stand for re-election at the 2019 AGMs.
Previous listed directorships Details of each director’s previous directorships of other listed companies (where relevant) held in the past three years are set out below:
Ann Godbehere – British American Tobacco plc (October 2011 to April 2018) – Prudential plc (August 2007 to May 2017)
Sam Laidlaw – HSBC Holdings plc (January 2008 to April 2017)
Simon Thompson – Tullow Oil plc (May 2011 to April 2017)
Directors’ and executives’ beneficial interestsA table of directors’ and executives’ beneficial interests in Rio Tinto shares is on page 133.
SecretariesSteve Allen is company secretary of Rio Tinto plc and joint company secretary, together with Tim Paine, of Rio Tinto Limited. Steve’s and Tim’s qualifications and experience are described on page 77.
Indemnities and insuranceThe Articles of Association of Rio Tinto plc and the Constitution of Rio Tinto Limited provide for them to indemnify, to the extent permitted by law, directors and officers of the companies, including officers of certain subsidiaries, against liabilities arising from the conduct of the Group’s business. The directors, Group company secretary and joint company secretary of Rio Tinto Limited, together with employees serving as directors of eligible subsidiaries at the Group’s request, have also received similar direct indemnities. These are qualifying third-party indemnity provisions for the purposes of the UK Companies Act 2006, in force during the financial year ended 31 December 2018 and up to the date of this report. No amount has been paid under any of these indemnities during the year.
Qualifying pension scheme indemnity provisions (as defined by section 235 of the UK Companies Act 2006) were in force during the course of the financial year ended 31 December 2018 and up to the date of this Directors’ report, for the benefit of trustees of the Rio Tinto Group pension and superannuation funds across various jurisdictions. No amount has been paid under any of these indemnities during the year.
The Group purchased directors’ and officers’ insurance during the year. In broad terms, this cover indemnifies individual directors and officers against certain personal legal liability and legal defence costs for claims arising out of actions connected with Group business.
Employment of disabled persons Information on the employment of disabled persons is on page 55.
Annual report 2018 | riotinto.com138

Additional statutory disclosure
Purchases
Rio Tinto plc shares(a) and Rio Tinto plc American Depositary Receipts (ADRs)
Total number of shares purchased(b)
Average price per share US$(c)
Total number of shares purchased to satisfy
company dividend reinvestment plans
Total number of shares purchased to satisfy
employee share plans
Total number of shares purchased as part of publicly
announced plans or programmes(d)(m)
Maximum number of shares that may be
purchased under plans or programmes
2018
1 to 31 Jan 3,392,898 54.80 – 611,007 2,681,891 102,840,71(f)
1 to 28 Feb 3,978,411 55.28 – – 3,978,411 98,862,300(f)
1 to 31 Mar 5,864,264 51.92 – – 5,864,264 92,998,036(f)
1 to 30 Apr 6,086,290 52.73 650,611 550,320 4,885,359 128,861,163(g)
1 to 31 May 4,935,177 56.20 – – 4,935,177 123,925,986(g)
1 to 30 Jun 4,994,418 56.88 – 227,418 4,767,000 119,158,986(g)
1 to 31 Jul 4,890,093 53.92 – – 4,890,093 114,268,893(g)
1 to 31 Aug 5,695,018 48.69 – – 5,695,018 108,573,875(g)
1 to 30 Sep 7,024,089 47.99 467,060 109,296 6,447,733 102,126,142(g)
1 to 31 Oct 7,681,327 48.77 – 348,832 7,332,495 94,793,647(g)
1 to 30 Nov 6,789,956 49.11 – – 6,789,956 88,003,691(g)
1 to 31 Dec 7,288,270 46.82 – 1,571,380 5,716,890 82,286,801(g)
Total 68,520,211(e) 51.29 1,117,671 3,418,253 63,984,287 –
2019
1 to 31 Jan 6,253,189 49.71 – – 6,253,189 76,033,612(g)
1 to 15 Feb 2,789,406 55.11 – – 2,789,406 73,244,206(g)
Rio Tinto Limited shares
Total number of shares purchased(b)
Average price per share US$(c)
Total number of shares purchased to satisfy
company dividend reinvestment plans
Total number of shares purchased to satisfy
employee share plans(h)
Total number of shares purchased as part of publicly
announced plans or programmes(d)(m)
Maximum number of shares that may be
purchased under plans or programmes
2018
1 to 31 Jan 542,237 59.30 – 542,237 – 30,621,936(i)
1 to 28 Feb – – – – – 30,621,936(i)
1 to 31 Mar – – – – – 30,621,936(i)
1 to 30 Apr 1,482,615 59.75 1,076,139 406,476 – 30,621,936(i)
1 to 31 May – – – – – 41,200,000(j)
1 to 30 Jun 94,969 63.13 – 94,969 – 41,200,000(j)
1 to 31 Jul – – – – – 41,200,000(j)
1 to 31 Aug – – – – – 41,200,000(j)
1 to 30 Sep 679,633 57.00 603,872 75,761 – 41,200,000(j)
1 to 31 Oct 210,590 55.94 – 210,590 – 41,200,000(j)
1 to 30 Nov 41,198,134 49.99(k) – – 41,198,134(l) 1,866(j)
1 to 31 Dec 1,324,321 53.85 – 1,324,321 – 1,866(j)
Total 45,532,499 50.69(k) 1,680,011 2,654,354 41,198,134 –
2019
1 to 31 Jan – – – – – 1,866(j)
1 to 15 Feb – – – – – 1,866(j)
(a) Rio Tinto plc shares have a nominal value of 10 pence each. (b) Monthly totals of purchases are based on the settlement date.(c) The shares were purchased in the currency of the stock exchange on which the purchases took place and the sale price has been converted into US dollars at the exchange rate on the date of settlement.(d) Shares purchased in connection with the dividend reinvestment plans and employee share plans are not deemed to form any part of any publicly announced plan or programme.(e) This figure represents 5.3% of Rio Tinto plc issued share capital at 31 December 2018.(f) At the Rio Tinto plc AGM held in 2017, shareholders authorised the on-market purchase by Rio Tinto plc, Rio Tinto Limited and its subsidiaries of up to 137,492,259 Rio Tinto plc shares.
This authorisation expired on 30 June 2018.(g) At the Rio Tinto plc AGM held in 2018, shareholders authorised the on-market purchase by Rio Tinto plc, Rio Tinto Limited and its subsidiaries of up to 133,746,522 Rio Tinto plc shares.
This authorisation will expire on the later of 11 July 2019 or the date of the 2019 AGM.(h) The average price of shares purchased on-market by the trustee of Rio Tinto Limited’s employee share trust during 2018 was $56.22.(i) At the Rio Tinto Limited AGM held in 2017 shareholders authorised the off-market and/or on-market buy-back of up to 42.4 million Rio Tinto Limited shares. ( j) At the Rio Tinto Limited AGM held in 2018 shareholders authorised the off-market and/or on-market buy-back of up to 41.2 million Rio Tinto Limited shares.(k) The “Average price per share” includes the off-market share buy-back programme by Rio Tinto Limited.(l) The shares were purchased at A$69.69 per share under the Rio Tinto Limited off-market share buy-back, representing a 14% discount to the relevant market price.(m) During 2018, Rio Tinto purchased $5.4 billion of shares through a combination of on-market purchases of Rio Tinto plc shares and an off-market tender of Rio Tinto Limited shares. The Group
returned $2.1 billion through a Rio Tinto Limited off-market tender announced on 20 September 2018 and completed on 12 November 2018. In 2018, on-market purchases were completed of $3.3 billion in Rio Tinto plc shares. These comprised the return of $1.9 billion announced in the second half of 2017, the $1 billion programme announced on 7 February 2018 and $0.4 billion of a $1 billion programme announced on 1 August 2018. The remaining $0.6 billion of this last programme will be completed no later than 27 February 2019. A further $1.1 billion of the programme announced in September 2018 will be returned through an on-market Rio Tinto plc share buy-back commencing on 28 February 2019 and will be completed no later than 28 February 2020.
Annual report 2018 | riotinto.com 139
Governance

Governance | Additional statutory disclosure continued
Political donationsThe Group made no political donations (as defined by the UK Companies Act 2006) in the EU, Australia or elsewhere during 2018.
Government regulationsOur operations around the world are subject to extensive laws and regulations imposed by local, state, provincial and federal governments. These regulations govern many aspects of our work – from how we explore, mine and process ore, to conditions of land tenure and health, safety and environmental requirements. They also govern how we operate as a company in relation to securities, taxation, intellectual property, competition and foreign investment, provisions to protect data privacy, conditions of trade and export and infrastructure access. In addition to these laws, several of our operations are governed by specific agreements made with governments, some of which are enshrined in legislation. The geographic and product diversity of our operations reduces the likelihood of any single law or government regulation having a material effect on the Group’s business as a whole.
Environmental regulationsRio Tinto is subject to various environmental laws and regulations in the countries where we have operations. We measure our performance against environmental regulations by tracking and rating incidents according to their actual environmental and compliance impacts using five severity categories (minor, medium, serious, major or catastrophic). If incidents have a consequence rating of major or catastrophic, they are immediately reported to the chief executive, and to the relevant product group chief executive. In 2018, there were no environmental incidents at managed operations with a major or catastrophic impact.
During 2018, four managed operations incurred fines amounting to $284,683 (2017: $89,502). We report details of these fines in the performance section of our sustainable development report at: riotinto.com/sd2018.
Australian corporations that exceed specific greenhouse gas emissions or energy-use thresholds have obligations under the Australian National Greenhouse and Energy Reporting Act 2007 (NGER). All Rio Tinto entities covered under this Act submitted their annual NGER reports by the 31 October 2018 deadline.
Further information on our environmental performance is included in the sustainable development section of this Annual report, on pages 52 to 63, and on our website.
Greenhouse gas emissionsGreenhouse gas emissions (in million tCO2-e)(a) (b)
2018 2017(g)
Scope 1(c) 17.8 20.0
Scope 2(d) 10.8 11.0
Total greenhouse gas emissions(e) 28.2 30.6
Ratios
Greenhouse gas emissions intensity index(f) 71.1 72.9
Greenhouse gas emissions intensity
(tCO2-e/t of product) 0.065 0.067
(a) Rio Tinto’s greenhouse gas emission for managed operations are reported in accordance with the requirements under Part 7 of the UK Companies Act 2006 (Strategic Report and Directors’ Report) Regulations 2013. Our approach and methodology used for the determination of these emissions are available at: riotinto.com/sd2018 and riotinto.com/sd2018/glossary.
(b) Rio Tinto’s greenhouse gas emissions inventory is based on definitions provided by The World Resource Institute/World Business Council for Sustainable Development Greenhouse Gas Protocol: A Carbon Reporting and Accounting Standard, March 2004.
(c) Scope 1 emissions include “emissions from combustion of fuel and operation of managed facilities”. These include emissions from land management and livestock management at those facilities.
(d) Scope 2 emissions include “emissions from the purchase of electricity, heat, steam or cooling”.
Additional statutory disclosure continued
(e) Total emissions is the sum of scope 1 and scope 2 emissions, minus emissions that are associated with the generation of electricity, heat, steam or cooling supplied to others. These emissions exclude indirect emissions associated with transportation and use of our products reported at riotinto.com/sd2018.
(f) Rio Tinto greenhouse gas intensity index is the weighted emissions intensity for each of Rio Tinto’s main commodities relative to the commodity intensities in the 2008 base year (set to 100). This index includes approximately 98 (98.4%)% of Rio Tinto’s emissions from managed operations.
(g) All numbers are restated to ensure comparability over time. Amendments are due to changes in measurement and calculation methodologies including the adoption of updated global warming potentials from the IPCC fourth assessment report or immaterial updates to data.
Exploration, research and developmentThe Group carries out exploration, research and development, described in the Growth & Innovation section on page 50. Exploration and evaluation costs, net of any gains and losses on disposal, generated a net loss before tax of $210 million (2017: $460 million). Research and development costs were $45 million (2017: $58 million).
Financial instrumentsDetails of the Group’s financial risk management objectives and policies, and exposure to risk, are described in note 30 to the financial statements.
Dealing in Rio Tinto securitiesRio Tinto operates rules which restrict the dealing in Rio Tinto securities by directors and employees with access to “inside information”. These individuals must seek clearance before any proposed dealing takes place.
Our rules also prohibit such persons from engaging in hedging or other arrangements which limit the economic risk in connection to Rio Tinto securities issued, or otherwise allocated, as remuneration that are either unvested, or that have vested, but remain subject to a holding period. We also impose restrictions on a broader group of employees, requiring them to seek clearance before engaging in similar arrangements over any Rio Tinto securities.
Financial reportingFinancial statementsThe directors are required to prepare financial statements for each financial period that give a true and fair view of the state of the Group at the end of the financial period, together with profit or loss and cash flows for that period. This includes preparing financial statements in accordance with UK company law that give a true and fair view of the state of the company’s affairs, and preparing a Remuneration report that includes the information required by Regulation 11, Schedule 8 of the Large- and Medium-sized Companies and Groups (Accounts and Reports) Regulations 2008 (as amended) and the Australian Corporations Act 2001.
In addition, the UK Corporate Governance Code requires that the board provides a fair, balanced and understandable assessment of the company’s position and prospects in its external reporting.
Rio Tinto’s management conducts extensive review and challenge in support of the board’s obligations, aiming to strike a balance between positive and negative statements and provide good linkages throughout the Annual report.
The directors were responsible for the preparation and approval of the Annual report for the year ended 31 December 2018. They consider the Annual report, taken as a whole, to be fair, balanced and understandable, and that it provides the information necessary for shareholders to assess the Group’s position, performance, business model and strategy.
The directors are responsible for maintaining proper accounting records, in accordance with UK and Australian legislation. They have a general responsibility to safeguard the assets of the Group, and to prevent and detect fraud and other irregularities. The directors are also responsible for ensuring that appropriate systems are in place to maintain and preserve the integrity of the Group’s website.
Annual report 2018 | riotinto.com140

Additional statutory disclosure
Legislation in the UK governing the preparation and dissemination of financial statements may differ from current and future legislation in other jurisdictions. The work carried out by the Group’s external auditors does not take into account such legislation and, accordingly, the external auditors accept no responsibility for any changes to the financial statements after they are made available on the Group’s website.
The directors, senior executives, senior financial managers and other members of staff who are required to exercise judgment while preparing the Group’s financial statements, are required to conduct themselves with integrity and honesty and in accordance with the highest ethical standards, as are all Group employees.
The directors consider that the 2018 Annual report presents a true and fair view and has been prepared in accordance with applicable accounting standards, using the most appropriate accounting policies for Rio Tinto’s business, and supported by reasonable judgments and estimates. The accounting policies have been consistently applied as described on pages 150 to 164, and directors have received a written statement from the chief executive and the chief financial officer to this effect. In accordance with the internal control requirements of the Code and the ASX Principles, this written statement confirms that the declarations in the statement are founded on a sound system of risk management and internal controls, and that the system is operating effectively in all material respects in relation to financial reporting risks. Further information on directors’ responsibilities in the light of UK Disclosure and Transparency Rules is included on page 253.
Disclosure controls and proceduresThe Group maintains disclosure controls and procedures, as defined in US Exchange Act Rule 13a-15(e). Management, with the participation of the chief executive and chief financial officer, has evaluated the effectiveness of the Group’s disclosure controls and procedures in relation to US Exchange Act Rule 13a-15(b), as of the end of the period covered by this report, and has concluded that the Group’s disclosure controls and procedures were effective at a reasonable assurance level.
Management’s report on internal control over financial reportingManagement is responsible for establishing and maintaining adequate internal controls over financial reporting. These controls, designed under the supervision of the chief executive and chief financial officer, provide reasonable assurance regarding the reliability of the Group’s financial reporting and the preparation and presentation of financial statements for external reporting purposes, in accordance with International Financial Reporting Standards (IFRS) as defined on page 150.
The Group’s internal controls over financial reporting include policies and procedures designed to ensure the maintenance of records that: – accurately and fairly reflect transactions and dispositions of assets; – provide reasonable assurances that transactions are recorded as
necessary, enabling the preparation of financial statements in accordance with IFRS, and that receipts and expenditures are made with the authorisation of management and directors of each of the companies; and
– provide reasonable assurance regarding the prevention or timely detection of unauthorised acquisition, use or disposition of the Group’s assets that could have a material effect on its financial statements.
Due to inherent limitations, internal controls over financial reporting cannot provide absolute assurance. Similarly, these controls may not prevent or detect all misstatements, whether caused by error or fraud within each of Rio Tinto plc and Rio Tinto Limited.
There were no changes to internal controls over financial reporting during the relevant period that have materially affected, or are reasonably likely to materially affect, the financial reporting of Rio Tinto plc and Rio Tinto Limited.
Management’s evaluation of the effectiveness of the company’s internal controls over financial reporting was based on criteria established in Internal Control-Integrated Framework (2013), issued by the Committee of Sponsoring Organisations of the Treadway Commission. Following this evaluation, management concluded that our internal controls over financial reporting were effective as at 31 December 2018.
Audited informationUnder Schedule 8 of the Large- and Medium-sized Companies and Groups (Accounts and Reports) Regulations 2008 (as amended), the following information is auditable: – the single total figure of remuneration for each director, as set out on
pages 116, 119 and 120 and table 1b on page 132; – details of the directors’ total pension entitlements, as set out on pages
118, 120 and 121; – details of scheme interests awarded to the directors during the financial
year, as set out on pages 118, 119 and 121 and table 3 on pages 134 to 136; – details of payments to past directors as set out on page 121; – statement of the directors’ shareholdings and share interests, as set out
in tables 2 and 3 on pages 133 to 136 of the Implementation report; – STIP objectives and outcomes for 2018 as set out on pages 114, 117, 119,
120 and 121 and LTIP outcome and award granted for 2018 as set out on pages 115, 117, 118, 119 and 121.
The Australian Securities and Investments Commission issued an order dated 14 December 2015, under which the Remuneration report must be prepared and audited in accordance with the requirements of the Australian Corporations Act 2001 applied on the basis of certain modifications set out in the order (as detailed on page 252). The information provided in the Remuneration report has been audited as required by section 308 (3C) of the Australian Corporations Act 2001.
Directors’ declarationThe directors’ statement of responsibilities in relation to the Group’s financial statements is set out on page 253.
Non-audit services and auditor independenceDetails of the non-audit services and a statement of independence regarding the provision of non-audit services undertaken by our external auditor, including the amounts paid for non-audit services, are set out on pages 92 and 93 of the Directors’ report.
Going concernThe directors, having made appropriate enquiries, have satisfied themselves that it is appropriate to adopt the going concern basis of accounting in preparing the financial statements. Additionally, the directors have considered longer-term viability, as described in their statement on page 65.
2019 AGMsThe 2019 AGMs will be held on 10 April in London and 9 May in Perth. Separate notices of the 2019 AGMs will be produced for the shareholders of each company.
Directors’ approval statementThe Directors’ report is delivered in accordance with a resolution of the board.
Simon ThompsonChairman27 February 2019
Annual report 2018 | riotinto.com 141
Governance
2018 Financial statementsPrimary financial statements Group income statement 144Group statement of comprehensive income 145Group cash flow statement 146Group balance sheet 147Group statement of changes in equity 148Reconciliation with Australian
Accounting Standards 149Outline of dual listed companies
structure and basis of financial statements 149
Notes to the 2018 financial statements Group income statement and cash flow statement
Note 1 Principal accounting policies 150Note 2 Operating segments 165Note 3 Operating segments –
additional information 169Note 4 Net operating costs
(excluding items shown separately) 170Note 5 Employment costs 171Note 6 Impairment charges 171Note 7 Share of profit after tax of
equity accounted units 173Note 8 Finance income and finance costs 173Note 9 Taxation 174Note 10 Earnings per ordinary share 175Note 11 Dividends 175
Group balance sheetNote 12 Goodwill 176Note 13 Intangible assets 177Note 14 Property, plant and equipment 178Note 15 Investments in equity
accounted units 180Note 16 Inventories 180Note 17 Deferred taxation 180Note 18 Trade and other receivables 182Note 19 Assets and liabilities held for sale 182Note 20 Other financial assets
(including non-quasi equity loans to equity accounted units) 183
Note 21 Cash and cash equivalents 183Note 22 Borrowings and other
financial liabilities 184Note 23 Capitalised finance leases 185Note 24 Consolidated net cash/(debt) 185Note 25 Trade and other payables 186Note 26 Provisions (including
post-retirement benefits) 186
Capital and reserves Note 27 Share capital – Rio Tinto plc 187Note 28 Share capital – Rio Tinto Limited 187Note 29 Other reserves and retained earnings 188
Additional disclosures Note 30 Financial instruments
and risk management 189Note 31 Contingencies and commitments 199Note 32 Average number of employees 202Note 33 Principal subsidiaries 203Note 34 Principal joint operations 205Note 35 Principal joint ventures 206Note 36 Principal associates 207Note 37 Purchases and sales of
subsidiaries, joint ventures, associates and other interests in businesses 208
Note 38 Directors’ and key management remuneration 209
Note 39 Auditors’ remuneration 210Note 40 Related-party transactions 210Note 41 Exchange rates in US$ 211Note 42 Events after the balance sheet date 211Note 43 Share-based payments 211Note 44 Post-retirement benefits 214Note 45 New standards and interpretations
adopted in the current year 219Note 46 Rio Tinto Limited parent
company disclosures 223Note 47 Related undertakings 224Rio Tinto plc company information 244Rio Tinto financial information
by business unit 249Australian Corporations Act –
summary of ASIC relief 252Directors’ declaration 253Auditor’s independence declaration 254Independent auditors’ report of
PricewaterhouseCoopers LLP to the members of Rio Tinto plc and of PricewaterhouseCoopers to the members of Rio Tinto Limited 255
Financial summary 2009-2018 264Summary financial data in Australian
dollars, sterling and US dollars 265
Annual report 2018 | riotinto.com142

Partnering with Mongolia: Oyu Tolgoi
Our underground project will see the Oyu Tolgoi mine become the world’s third largest source of copper, the metal used in critical infrastructure, from water pipes to wind turbines.
Alongside a workforce that is approximately 93% Mongolian, we also aim to contribute to the community, society and economy: more than half of our procurement spend goes to Mongolian suppliers, and to date, we have invested $82 million to help build vocational training centres in five towns and cities. And, through our partnership in the Sustainable Cashmere Project, we are helping to protect and enhance the livelihoods of Mongolian herders.
We do a lot for our community here at Oyu Tolgoi. So I like to think that our mine helps our country as much as the metal helps the world.”Erdenechimeg DamdinpurevSuperintendent Training, Oyu Tolgoi
We have invested
$82 millionto help build vocational training centres in Mongolia
Annual report 2018 | riotinto.com 143
Financial Statem
ents
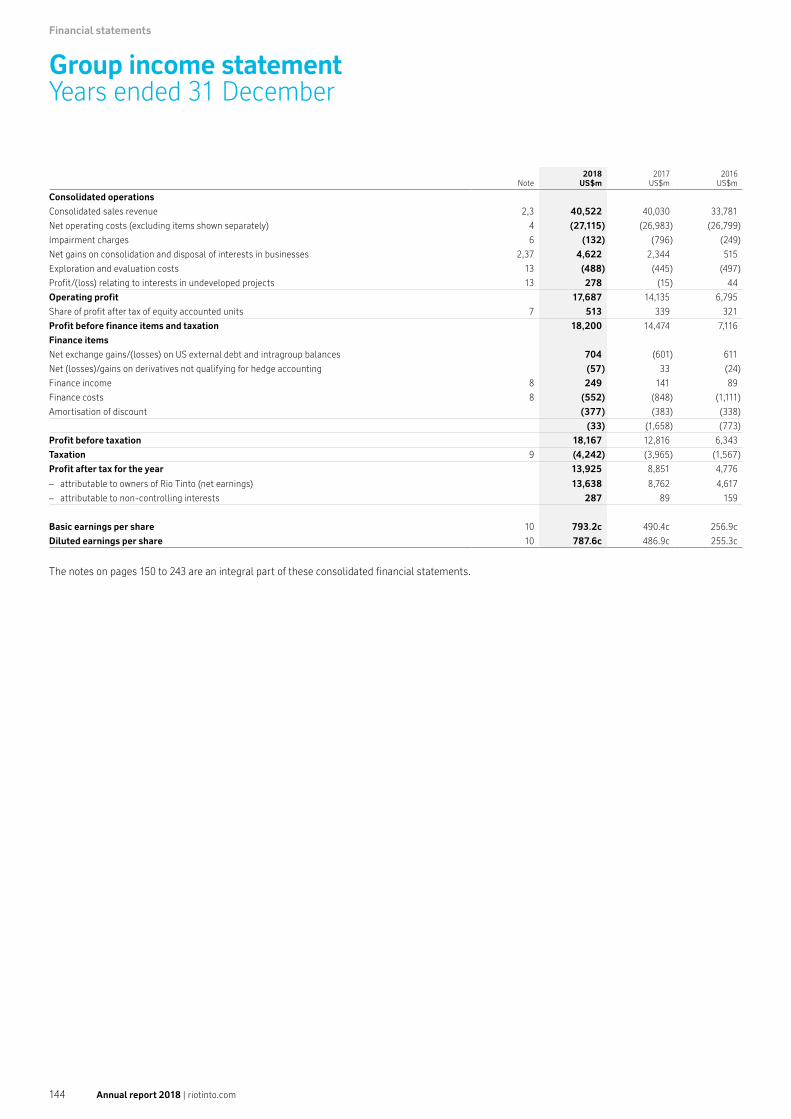
Financial statements
Group income statement Years ended 31 December
Note2018
US$m2017
US$m2016
US$m
Consolidated operations
Consolidated sales revenue 2,3 40,522 40,030 33,781
Net operating costs (excluding items shown separately) 4 (27,115) (26,983) (26,799)
Impairment charges 6 (132) (796) (249)
Net gains on consolidation and disposal of interests in businesses 2,37 4,622 2,344 515
Exploration and evaluation costs 13 (488) (445) (497)
Profit/(loss) relating to interests in undeveloped projects 13 278 (15) 44
Operating profit 17,687 14,135 6,795
Share of profit after tax of equity accounted units 7 513 339 321
Profit before finance items and taxation 18,200 14,474 7,116
Finance items
Net exchange gains/(losses) on US external debt and intragroup balances 704 (601) 611
Net (losses)/gains on derivatives not qualifying for hedge accounting (57) 33 (24)
Finance income 8 249 141 89
Finance costs 8 (552) (848) (1,111)
Amortisation of discount (377) (383) (338)
(33) (1,658) (773)
Profit before taxation 18,167 12,816 6,343
Taxation 9 (4,242) (3,965) (1,567)
Profit after tax for the year 13,925 8,851 4,776
– attributable to owners of Rio Tinto (net earnings) 13,638 8,762 4,617
– attributable to non-controlling interests 287 89 159
Basic earnings per share 10 793.2c 490.4c 256.9c
Diluted earnings per share 10 787.6c 486.9c 255.3c
The notes on pages 150 to 243 are an integral part of these consolidated financial statements.
Annual report 2018 | riotinto.com144

Group statement of comprehensive income
Group statement of comprehensive income Years ended 31 December
Note2018
US$m2017
US$m2016
US$m
Profit after tax for the year 13,925 8,851 4,776
Other comprehensive income/(loss)
Items that will not be reclassified to profit or loss:
Actuarial gains/(losses) on post-retirement benefit plans 44 907 6 (90)
Changes in the fair value of equity investments held at fair value through other comprehensive income (FVOCI) (13) – –
Tax relating to these components of other comprehensive income 9 (271) (12) 29
Share of other comprehensive losses of equity accounted units, net of tax (1) – –
Adjustments to deferred tax on post-retirement benefit plans due to changes in corporate tax rates in the US and France 9 – (140) –
622 (146) (61)
Items that have been/may be subsequently reclassified to profit or loss:
Currency translation adjustment(a) (3,830) 3,096 (157)
Currency translation on companies disposed of, transferred to the income statement 14 78 99
Fair value movements:
– Cash flow hedge gains/(losses) 156 62 (88)
– Cash flow hedge losses/(gains) transferred to the income statement 40 (62) 116
– Gains on revaluation of available for sale securities – 19 13
– Losses on revaluation of available for sale securities transferred to the income statement – 8 –
Net change in costs of hedging(b) (39) – –
Tax relating to these components of other comprehensive income 9 (54) (1) 4
Share of other comprehensive (loss)/income of equity accounted units, net of tax (48) 34 11
Other comprehensive (loss)/income for the year, net of tax (3,139) 3,088 (63)
Total comprehensive income for the year 10,786 11,939 4,713
– attributable to owners of Rio Tinto 10,663 11,691 4,504
– attributable to non-controlling interests 123 248 209
(a) Excludes a currency translation charge of US$382 million (2017: gain of US$310 million; 2016: charge of US$35 million) arising on Rio Tinto Limited’s share capital for the year ended 31 December 2018, which is recognised in the Group statement of changes in equity. Refer to Group statement of changes in equity on page 148.
(b) As part of the bond buy-back programme, cross-currency interest rate swaps hedging the bonds repurchased were closed out resulting in the reclassification of US$3 million cost of hedging to the income statement and recognised within finance costs.
The notes on pages 150 to 243 are an integral part of these consolidated financial statements.
Annual report 2018 | riotinto.com 145
Financial statements

Financial statements
Group cash flow statement Years ended 31 December
Note2018
US$m2017
US$m2016
US$m
Cash flows from consolidated operations(a) 15,655 16,670 11,368
Dividends from equity accounted units 800 817 253
Cash flows from operations 16,455 17,487 11,621
Net interest paid(b) (612) (897) (1,294)
Dividends paid to holders of non-controlling interests in subsidiaries (420) (399) (341)
Tax paid (3,602) (2,307) (1,521)
Net cash generated from operating activities 11,821 13,884 8,465
Cash flows from investing activities
Purchases of property, plant and equipment and intangible assets 2 (5,430) (4,482) (3,012)
Disposals of subsidiaries, joint ventures, unincorporated joint operations, and associates 37 7,733 2,675 761
Purchases of financial assets(c) (1,572) (723) (789)
Sales of financial assets(c) 19 40 582
Sales of property, plant and equipment and intangible assets 586 138 354
Net funding of equity accounted units (9) (3) (12)
Acquisitions of subsidiaries, joint ventures and associates 37 (5) – –
Other investing cash flows (1) (18) 12
Net cash generated/(used) in investing activities 1,321 (2,373) (2,104)
Cash flows before financing activities 13,142 11,511 6,361
Cash flows from financing activities
Equity dividends paid to owners of Rio Tinto 11 (5,356) (4,250) (2,725)
Proceeds from additional borrowings 54 18 4,413
Repayment of borrowings(b) (2,300) (2,795) (9,361)
Proceeds from issue of equity to non-controlling interests 85 170 101
Own shares purchased from owners of Rio Tinto (5,386) (2,083) –
Purchase of non-controlling interests 37 – (194) (23)
Other financing cash flows (48) (7) 104
Net cash flows used in financing activities (12,951) (9,141) (7,491)
Effects of exchange rates on cash and cash equivalents 151 (12) (35)
Net increase/(decrease) in cash and cash equivalents 342 2,358 (1,165)
Opening cash and cash equivalents less overdrafts 10,547 8,189 9,354
Closing cash and cash equivalents less overdrafts 21 10,889 10,547 8,189
(a) Cash flows from consolidated operations
Profit after tax for the year 13,925 8,851 4,776
Adjustments for: – Taxation 4,242 3,965 1,567
– Finance items 33 1,658 773
– Share of profit after tax of equity accounted units (513) (339) (321)
– Net gains on consolidation and disposal of interests in businesses 37 (4,622) (2,344) (515)
– Impairment charges 6 132 796 249
– Depreciation and amortisation 4,015 4,375 4,794
– Provisions (including exchange differences on provisions) 1,011 535 1,417
Utilisation of provisions (620) (714) (627)
Utilisation of provision for post-retirement benefits 26 (219) (339) (370)
Change in inventories (587) (482) 292
Change in trade and other receivables (421) (138) (794)
Change in trade and other payables 476 421 229
Other items(d) (1,197) 425 (102)
15,655 16,670 11,368
(b) We completed a US$1.9 billion (nominal value) bond buy-back programme in April 2018. The notes purchased and redeemed have been cancelled. Net interest paid includes US$80 million being the payment of the premiums and the accelerated interest associated with the bond redemption. In 2017, we completed a US$2.5 billion (nominal value) bond buy-back programme. Net interest paid includes US$259 million being the payment of the premiums and the accelerated interest associated with the bond redemption. In 2016, Rio Tinto completed three bond purchase programmes totalling US$7.5 billion (nominal values). These transactions resulted in net interest paid of US$493 million, which represents the payment of the premiums and the accelerated interest associated with these bond redemptions.
(c) During 2018, we invested US$1.6 billion (2017: US$0.7 billion) in a separately managed portfolio of fixed income instruments. As there was significant turnover in both years, we have elected to report the purchases and sales of these securities on a net cash flow basis within “Purchases of financial assets”. In 2016, the Group invested US$0.25 billion in these securities and reported the purchases and sales on a gross basis.
(d) Includes adjustments to add back mark-to-market gains of US$288 million (2017: losses of US$501 million; 2016: gains of US$29 million) mainly relating to derivative contracts transacted for operational purposes and not designated in a hedge relationship. This also includes adjustments to add back a gain of US$549 million on the sale of surplus land at Kitimat and a gain of US$167 million on the revaluation of a financial asset arising from the disposal of the Mount Pleasant coal project in 2016.
The notes on pages 150 to 243 are an integral part of these consolidated financial statements.
Annual report 2018 | riotinto.com146

Group balance sheet
Group balance sheet At 31 December
Note2018
US$m2017
US$m
Non-current assets
Goodwill 12 912 1,037
Intangible assets 13 2,779 3,119
Property, plant and equipment 14 56,361 62,093
Investments in equity accounted units 15 4,299 4,486
Inventories 16 152 160
Deferred tax assets 17 3,137 3,395
Trade and other receivables 18 1,585 1,724
Tax recoverable 8 30
Other financial assets (including loans to equity accounted units) 20 814 510
70,047 76,554
Current assets
Inventories 16 3,447 3,472
Trade and other receivables 18 3,179 3,443
Tax recoverable 77 129
Other financial assets (including loans to equity accounted units) 20 2,692 1,084
Cash and cash equivalents 21 10,773 10,550
20,168 18,678
Assets of disposal groups held for sale 19 734 494
Total assets 90,949 95,726
Current liabilities
Borrowings and other financial liabilities 22 (1,073) (904)
Trade and other payables 25 (6,600) (7,061)
Tax payable (1,842) (1,985)
Provisions including post-retirement benefits 26 (1,056) (1,275)
(10,571) (11,225)
Non-current liabilities
Borrowings and other financial liabilities 22 (12,847) (15,148)
Trade and other payables 25 (841) (856)
Tax payable (348) (263)
Deferred tax liabilities 17 (3,673) (3,628)
Provisions including post-retirement benefits 26 (12,552) (13,367)
(30,261) (33,262)
Liabilities of disposal groups held for sale 19 (294) (124)
Total liabilities (41,126) (44,611)
Net assets 49,823 51,115
Capital and reserves
Share capital
– Rio Tinto plc 27 211 220
– Rio Tinto Limited 28 3,477 4,140
Share premium account 4,312 4,306
Other reserves 29 8,661 12,284
Retained earnings 29 27,025 23,761
Equity attributable to owners of Rio Tinto 43,686 44,711
Attributable to non-controlling interests 6,137 6,404
Total equity 49,823 51,115
The notes on pages 150 to 243 are an integral part of these consolidated financial statements.
The financial statements on pages 142 to 243 were approved by the directors on 27 February 2019 and signed on their behalf by
Simon ThompsonChairman
Jean-Sébastien JacquesChief executive
Jakob StausholmChief financial officer
Annual report 2018 | riotinto.com 147
Financial statements
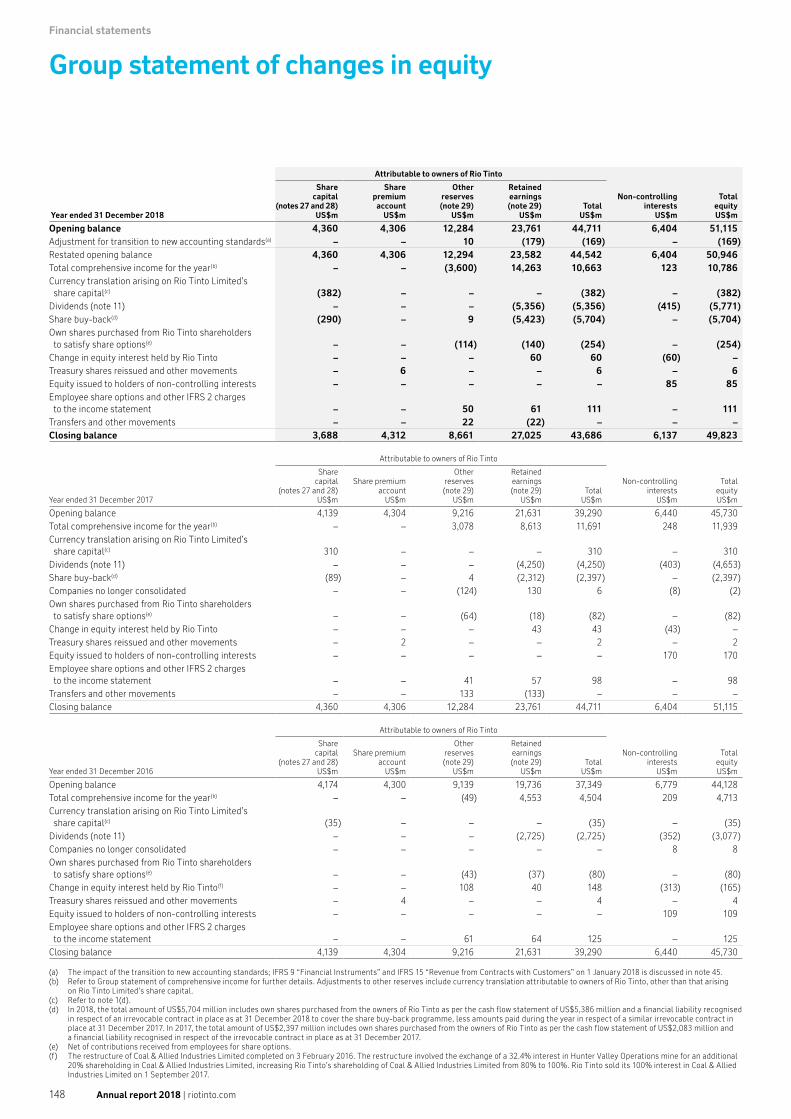
Financial statements
Group statement of changes in equity
Year ended 31 December 2018
Attributable to owners of Rio Tinto
Non-controllinginterests
US$m
TotalequityUS$m
Sharecapital
(notes 27 and 28)US$m
Sharepremium account
US$m
Otherreserves(note 29)
US$m
Retainedearnings(note 29)
US$mTotal
US$m
Opening balance 4,360 4,306 12,284 23,761 44,711 6,404 51,115Adjustment for transition to new accounting standards(a) – – 10 (179) (169) – (169)Restated opening balance 4,360 4,306 12,294 23,582 44,542 6,404 50,946Total comprehensive income for the year(b) – – (3,600) 14,263 10,663 123 10,786Currency translation arising on Rio Tinto Limited’s share capital(c) (382) – – – (382) – (382)Dividends (note 11) – – – (5,356) (5,356) (415) (5,771)Share buy-back(d) (290) – 9 (5,423) (5,704) – (5,704)Own shares purchased from Rio Tinto shareholders to satisfy share options(e) – – (114) (140) (254) – (254)Change in equity interest held by Rio Tinto – – – 60 60 (60) –Treasury shares reissued and other movements – 6 – – 6 – 6Equity issued to holders of non-controlling interests – – – – – 85 85Employee share options and other IFRS 2 charges to the income statement – – 50 61 111 – 111Transfers and other movements – – 22 (22) – – –Closing balance 3,688 4,312 8,661 27,025 43,686 6,137 49,823
Year ended 31 December 2017
Attributable to owners of Rio Tinto
Non-controllinginterests
US$m
TotalequityUS$m
Sharecapital
(notes 27 and 28)US$m
Share premium account
US$m
Otherreserves(note 29)
US$m
Retainedearnings(note 29)
US$mTotal
US$m
Opening balance 4,139 4,304 9,216 21,631 39,290 6,440 45,730Total comprehensive income for the year(b) – – 3,078 8,613 11,691 248 11,939Currency translation arising on Rio Tinto Limited’s share capital(c) 310 – – – 310 – 310Dividends (note 11) – – – (4,250) (4,250) (403) (4,653)Share buy-back(d) (89) – 4 (2,312) (2,397) – (2,397)Companies no longer consolidated – – (124) 130 6 (8) (2)Own shares purchased from Rio Tinto shareholders to satisfy share options(e) – – (64) (18) (82) – (82)Change in equity interest held by Rio Tinto – – – 43 43 (43) –Treasury shares reissued and other movements – 2 – – 2 – 2Equity issued to holders of non-controlling interests – – – – – 170 170Employee share options and other IFRS 2 charges to the income statement – – 41 57 98 – 98Transfers and other movements – – 133 (133) – – –Closing balance 4,360 4,306 12,284 23,761 44,711 6,404 51,115
Year ended 31 December 2016
Attributable to owners of Rio Tinto
Non-controllinginterests
US$m
TotalequityUS$m
Sharecapital
(notes 27 and 28)US$m
Share premium account
US$m
Otherreserves(note 29)
US$m
Retainedearnings(note 29)
US$mTotal
US$m
Opening balance 4,174 4,300 9,139 19,736 37,349 6,779 44,128Total comprehensive income for the year(b) – – (49) 4,553 4,504 209 4,713Currency translation arising on Rio Tinto Limited’s share capital(c) (35) – – – (35) – (35)Dividends (note 11) – – – (2,725) (2,725) (352) (3,077)Companies no longer consolidated – – – – – 8 8Own shares purchased from Rio Tinto shareholders to satisfy share options(e) – – (43) (37) (80) – (80)Change in equity interest held by Rio Tinto(f) – – 108 40 148 (313) (165)Treasury shares reissued and other movements – 4 – – 4 – 4Equity issued to holders of non-controlling interests – – – – – 109 109Employee share options and other IFRS 2 charges to the income statement – – 61 64 125 – 125Closing balance 4,139 4,304 9,216 21,631 39,290 6,440 45,730
(a) The impact of the transition to new accounting standards; IFRS 9 “Financial Instruments” and IFRS 15 “Revenue from Contracts with Customers” on 1 January 2018 is discussed in note 45.(b) Refer to Group statement of comprehensive income for further details. Adjustments to other reserves include currency translation attributable to owners of Rio Tinto, other than that arising
on Rio Tinto Limited’s share capital.(c) Refer to note 1(d).(d) In 2018, the total amount of US$5,704 million includes own shares purchased from the owners of Rio Tinto as per the cash flow statement of US$5,386 million and a financial liability recognised
in respect of an irrevocable contract in place as at 31 December 2018 to cover the share buy-back programme, less amounts paid during the year in respect of a similar irrevocable contract in place at 31 December 2017. In 2017, the total amount of US$2,397 million includes own shares purchased from the owners of Rio Tinto as per the cash flow statement of US$2,083 million and a financial liability recognised in respect of the irrevocable contract in place as at 31 December 2017.
(e) Net of contributions received from employees for share options.(f) The restructure of Coal & Allied Industries Limited completed on 3 February 2016. The restructure involved the exchange of a 32.4% interest in Hunter Valley Operations mine for an additional
20% shareholding in Coal & Allied Industries Limited, increasing Rio Tinto’s shareholding of Coal & Allied Industries Limited from 80% to 100%. Rio Tinto sold its 100% interest in Coal & Allied Industries Limited on 1 September 2017.
Annual report 2018 | riotinto.com148

Outline of dual listed companies structure and basis of financial statements
Reconciliation with Australian Accounting StandardsThe Group’s financial statements have been prepared in accordance with IFRS, as defined in note 1, which differs in certain respects from the version of International Financial Reporting Standards that is applicable in Australia, referred to as Australian Accounting Standards (AAS).
Prior to 1 January 2004, the Group’s financial statements were prepared in accordance with UK GAAP. Under IFRS, as defined in note 1, goodwill on acquisitions prior to 1998, which was eliminated directly against equity in the Group’s UK GAAP financial statements, has not been reinstated. This was permitted under the rules governing the transition to IFRS set out in IFRS 1. The equivalent Australian Standard, AASB 1, does not provide for the netting of goodwill against equity. As a consequence, shareholders’ funds under AAS include the residue of such goodwill, which amounted to US$379 million at 31 December 2018 (2017: US$557 million).
Save for the exception described above, the Group’s financial statements drawn up in accordance with IFRS are consistent with the requirements of AAS.
Outline of dual listed companies structure and basis of financial statementsThe Rio Tinto GroupThese are the financial statements of the Group formed through the merger of economic interests of Rio Tinto plc and Rio Tinto Limited (“Merger”), and presented by both Rio Tinto plc and Rio Tinto Limited as their consolidated financial statements in accordance with both UK and Australian legislation and regulations.
Merger termsOn 21 December 1995, Rio Tinto plc and Rio Tinto Limited, entered into a dual listed companies (DLC) merger. Rio Tinto plc is incorporated in the UK and listed on the London and New York Stock Exchanges and Rio Tinto Limited is incorporated in Australia and listed on the Australian Stock Exchange. The Merger was effected by contractual arrangements between the companies and amendments to Rio Tinto plc’s Memorandum and Articles of Association and Rio Tinto Limited’s Constitution.
As a result, Rio Tinto plc and Rio Tinto Limited and their respective groups operate together as a single economic enterprise, with neither assuming a dominant role. In particular, the arrangements: – confer upon the shareholders of Rio Tinto plc and Rio Tinto Limited
a common economic interest in both groups; – provide for common boards of directors and a unified management
structure; – provide for equalised dividends and capital distributions; and – provide for the shareholders of Rio Tinto plc and Rio Tinto Limited to
take key decisions, including the election of directors, through an electoral procedure in which the public shareholders of the two companies in effect vote on a joint basis.
The Merger involved no change in the legal ownership of any assets of Rio Tinto plc or Rio Tinto Limited, nor any change in the ownership of any existing shares or securities of Rio Tinto plc or Rio Tinto Limited, nor the issue of any shares, securities or payment by way of consideration, save for the issue by each company of one special voting share to a trustee company which facilitates the joint electoral procedure for public shareholders. During 2002, each of the parent companies issued a DLC Dividend Share to facilitate the efficient management of funds within the DLC structure.
Accounting standardsThe financial statements have been drawn up in accordance with IFRS as defined in note 1. The Merger was accounted for as a merger under UK GAAP. As permitted under the rules governing the transition to IFRS, which are set out in IFRS 1, the Group did not restate business combinations that occurred before the transition date of 1 January 2004. As a result, the DLC Merger of economic interests described above continues to be accounted for as a merger under IFRS as defined in note 1.
The main consequence of adopting merger rather than acquisition accounting is that the balance sheet of the merged Group includes the assets and liabilities of Rio Tinto plc and Rio Tinto Limited at their carrying values prior to the Merger, subject to adjustments to achieve uniformity of accounting policies, rather than at their fair values at the date of the Merger. For accounting purposes Rio Tinto plc and Rio Tinto Limited are viewed as a single public parent company (with their respective public shareholders being the shareholders in that single company). As a result, the amounts attributable to both Rio Tinto plc and Rio Tinto Limited public shareholders are included in the amounts attributed to owners of Rio Tinto on the balance sheet, income statement and statement of comprehensive income.
Australian Corporations ActThe financial statements are drawn up in accordance with an order, under section 340 of the Australian Corporations Act 2001, issued by the Australian Securities and Investments Commission (ASIC) on 14 December 2015. The main effect of the order is that the financial statements are prepared on the basis that Rio Tinto Limited, Rio Tinto plc and their respective controlled entities are treated as a single economic entity, and in accordance with the principles and requirements of International Financial Reporting Standards as adopted by the European Union (EU IFRS) and include a reconciliation from EU IFRS to the Australian equivalents of IFRS (see above).
For further details of the ASIC Class Order relief see page 252.
Annual report 2018 | riotinto.com 149
Financial statements

Financial statements
Notes to the 2018 financial statements
1 Principal accounting policiesCorporate informationRio Tinto’s business is finding, mining and processing mineral resources. Major products are aluminium, copper, diamonds, gold, industrial minerals (borates, titanium dioxide and salt), iron ore and uranium. Activities span the world and are strongly represented in Australia and North America, with significant businesses also in Asia, Europe, Africa and South America.
Rio Tinto plc is incorporated in the UK and listed on the London and New York Stock Exchanges and Rio Tinto Limited is incorporated in Australia and listed on the Australian Stock Exchange. Rio Tinto plc’s registered office is at 6 St James’s Square, London SW1Y 4AD, UK. Rio Tinto Limited’s registered office is at Level 7, 360 Collins Street, Melbourne, Victoria 3000, Australia.
As described in the “Outline of dual listed companies structure and basis of financial statements” on page 149, for the purposes of preparing the IFRS compliant consolidated financial statements of the Rio Tinto Group, both the DLC companies, Rio Tinto plc and Rio Tinto Limited, are viewed as a single economic entity, and the interests of shareholders of both companies are presented as the equity interests of shareholders in the Rio Tinto Group.
These financial statements consolidate the accounts of Rio Tinto plc and Rio Tinto Limited (together “the Companies”) and their respective subsidiaries (together “the Group”) and include the Group’s share of joint arrangements and associates as explained in note 1(b) below. The Group’s financial statements for the year ended 31 December 2018 were authorised for issue in accordance with a directors’ resolution on 27 February 2019.
Notes 33 to 36 provide more information on the Group’s subsidiaries, joint arrangements and associates and note 40 provides information on the Group’s transactions with other related parties.
The 2018 Annual report satisfies the obligations of Rio Tinto Limited to prepare consolidated accounts under Australian company law, as amended by an order issued by the Australian Securities and Investments Commission on 14 December 2015. The 2018 financial statements disclose on page 149 the effect of the adjustments to the Group’s consolidated profit/(loss), consolidated total comprehensive income/(loss) and consolidated shareholders’ funds as prepared under IFRS as defined below that would be required under the version of IFRS that is applicable in Australia, referred to as Australian Accounting Standards (AAS).
The US dollar is the presentation currency used in these financial statements, as it most reliably reflects the Group’s global business performance.
Basis of preparation of the financial statementsThe basis of preparation and the accounting policies used in preparing the Group’s 2018 financial statements are set out below.
The financial statements have been prepared on a going concern basis in accordance with the Companies Act 2006 applicable to companies reporting under IFRS and in accordance with applicable UK law, applicable Australian law as amended by the Australian Securities and Investments Commission Order dated 14 December 2015, Article 4 of the European Union IAS regulation and also with: – International Financial Reporting Standards as issued by the
International Accounting Standards Board (IASB) and interpretations issued from time to time by the IFRS Interpretations Committee (IFRS IC) both as adopted by the European Union (EU) and which are mandatory for EU reporting as at 31 December 2018; and
– International Financial Reporting Standards as issued by the IASB and interpretations issued from time to time by the IFRS IC which are mandatory as at 31 December 2018.
The above accounting standards and interpretations are collectively referred to as “IFRS” in this report. The Group has not early adopted any amendments, standards or interpretations that have been issued but are not yet mandatory.
Further detail on the going concern basis of accounting is included on page 141.
The Group’s financial statements have been prepared on the basis of accounting policies consistent with those applied in the financial statements for the year ended 31 December 2017, except for the change in accounting requirements set out below, all of which were effective as at 1 January 2018 without restatement of prior years.
The Group adopted IFRS 9 “Financial Instruments”, IFRS 15 “Revenue from Contracts with Customers” and IFRIC 22 “Foreign Currency Transactions and Advance Consideration” and a number of other minor amendments to IFRS on 1 January 2018. All of these pronouncements have been endorsed by the EU. Information on the transition impact of these new pronouncements is included in note 45.
Mandatory in 2019The impact on the Group of transition to the accounting pronouncements listed below that are mandatory in 2019 is currently expected to be immaterial other than for IFRS 16 “Leases”.
IFRS 16 “Leases” (Endorsed by the EU and mandatory in 2019)Under the new standard, a lessee is in essence required to:(a) Recognise all right of use assets and lease liabilities, with the exception
of short-term (12 months or fewer) and low value leases, on the balance sheet. The lease liability is initially measured at the present value of future lease payments for the lease term. Where a lease contains an extension option, the lease payments for the extension period will be included in the liability if the Group is reasonably certain that it will exercise the option. The liability includes variable lease payments that depend on an index or rate but excludes other variable lease payments. The right of use asset at initial recognition reflects the lease liability, initial direct costs and any lease payments made before the commencement date of the lease less any lease incentives and, where applicable, provision for dismantling and restoration.
(b) Recognise depreciation of right of use assets and interest on lease liabilities in the income statement over the lease term.
(c) Separate the total amount of cash paid into a principal portion (presented within financing activities) and interest portion (which the Group presents in operating activities) in the cash flow statement.
The Group will implement the standard as at 1 January 2019. For contracts in place at this date, the Group will continue to apply its existing definition of leases under current accounting standards (“grandfathering”), instead of reassessing whether existing contracts are or contain a lease at the date of application of the new standard.
For transition, as permitted by IFRS 16, the Group will apply the modified retrospective approach to existing operating leases which will be capitalised under the new standard (ie retrospectively, with the cumulative effect recognised at the date of initial application as an adjustment to the opening balance of retained earnings with no restatement of comparative information in the financial statements). For existing finance leases, the carrying amounts before transition will represent the 31 December 2018 values assigned to the right of use asset and lease liability.
Annual report 2018 | riotinto.com150

Notes to the 2018 financial statements continued
The Group has made the following additional choices, as permitted by IFRS 16, for existing operating leases: – Not to bring short-term leases (12 months or fewer to run as at 1 January
2019 including reasonably certain options to extend) or low value leases on balance sheet. Costs for these items will continue to be expensed directly to the income statement.
– For all leases, the lease liability will be measured at 1 January 2019 as the present value of any future lease payments discounted using the appropriate incremental borrowing rate. The carrying value of the right of use asset for property, vessels and certain other leases will generally be measured as if the lease had been in place since commencement date. For all other leases the right of use asset will be measured as equal to the lease liability and adjusted for any accruals or prepayments already on the balance sheet. The Group will also exclude any initial direct costs (eg legal fees) from the measurement of the right of use assets at transition.
– An impairment review must be performed on right of use assets at initial application of the standard. The Group has elected to rely on its onerous lease assessments under IAS 37 “Provisions, Contingent Liabilities and Contingent Assets”, as at 31 December 2018 as permitted by IFRS 16. Any existing onerous lease provision is set against the right of use asset carrying value upon transition.
– To apply the use of hindsight when reviewing the lease arrangements for determination of the measurement or term of the lease under the retrospective option.
– To separate non-lease components from lease components for vessels and properties for the first time as part of the transition adjustment.
– To continue not to apply lease accounting to intangible assets. – In some cases, to apply a single discount rate to a portfolio of leases
with reasonably similar characteristics.
The impact of transition to IFRS 16 on the Group’s 1 January 2019 balance sheet is expected to be an increase in lease liabilities (debt) of US$1.2 billion, an increase in right of use assets/net investments in leases of US$1.1 billion, net adjustments to other assets and liabilities of US$0.1 billion, and a charge of less than US$0.1 billion to retained earnings.
The weighted average incremental borrowing rate applied to the Group’s lease liabilities to be recognised in the balance sheet at 1 January 2019 is 4.7%.
The Group’s undiscounted non-cancellable operating lease commitments of US$1.7 billion at 31 December 2018 under IAS 17 “Leases” are shown on page 200 of this Report. The most significant differences between these lease commitments and a lease liability recorded on transition of US$1.3 billion as shown above are set out below:
US$bn
Operating lease commitments under IAS 17 per note 31 1.7
Exclude/deduct
Leases expiring in 12 months or fewer(a) (0.1)
Committed leases not commenced(a) (0.1)
Components excluded from the lease liability(a) (0.2)
Include/add
Cost of reasonably certain extensions(a) 0.3
Other(b) 0.1
Sub total 1.7
Effect of discounting on payments included in the calculation of the lease liability (excluding finance lease balances) (0.4)
Lease liability opening balance reported as at 1 January 2019 (IFRS 16) 1.3
(a) Undiscounted.(b) Includes finance lease liabilities already reported under IAS 17. Refer to note 23.
The lease liability of US$1.3 billion (inclusive of amounts already reported as finance leases under IAS 17) shown above will be included in net debt as at 1 January 2019.
The Group has implemented a lease accounting system which will be used for the majority of the Group’s leases. A separate contract linked system will be used for the Group’s shipping leases.
Contracts signed after 1 January 2019 will be assessed against the lease identification criteria under IFRS 16. This may increase or decrease the number of contracts which are deemed to be leases. Practical application of IFRS 16 continues to develop and the Group continues to monitor this.
In future periods EBITDA, as disclosed in the Financial Information by Business Unit on page 249 will increase as the operating lease cost is charged against EBITDA under IAS 17 whereas under IFRS 16 the charge will be included in depreciation and interest, which are excluded from EBITDA (although included in net earnings). Short-term leasing costs and non-lease components will continue to be charged against EBITDA. In 2018, an operating lease expense of US$787 million has been recorded in net operating costs; refer to note 4. This includes arrangements entered into and maturing during 2018 and therefore not disclosed as non-cancellable operating lease commitments at 31 December 2017. The Group has disclosed US$0.5 billion of non-cancellable operating lease commitments due within one year at 31 December 2018, approximately US$0.3 billion of which are not expected to be charged against EBITDA in 2019 as a result of implementing IFRS 16.
Operating cash flows will increase under IFRS 16 as the element of cash paid attributable to the repayment of principal will be included in financing cash flows. The net increase/decrease in cash and cash equivalents will remain the same.
The Group’s activities as a lessor are not material and hence the Group does not expect any significant impact on the financial statements. As the Group has some property sub lease arrangements, these must be reassessed for classification purposes as operating or finance leases at transition. Some additional disclosures will also be required from next year.
IFRIC 23 “Uncertainty over Income Tax Treatments” (Endorsed by the EU and mandatory in 2019)IFRIC 23 changes the method of calculating provisions for uncertain tax positions. The Group currently recognises provisions based on the most likely amount of the liability, if any, for each separate uncertain tax position. The interpretation requires a probability weighted average approach to be taken for issues for which there are a wide range of possible outcomes. For tax issues with a binary outcome, the most likely amount method still remains.
The interpretation must be implemented retrospectively, either with restatement of comparatives or with the cumulative impact of application recognised as at 1 January 2019 without restatement of comparatives.
Annual report 2018 | riotinto.com 151
Financial statements

Financial statements
Notes to the 2018 financial statements continued
1 Principal accounting policies continued“Amendments to IFRS 9: Prepayment Features with Negative Compensation”, “Amendments to IAS 28: Long-term Interests in Associates and Joint Ventures” (Endorsed by the EU and mandatory in 2019), “Annual Improvements to IFRS Standards 2015-2017 Cycle” and “Amendments to IAS 19 – Plan Amendment, Curtailment or Settlement” (Mandatory in 2019 and not yet endorsed by the EU)
The Group is currently evaluating the impact of these pronouncements.
Mandatory in 2020 and beyondConceptual Framework for Financial Reporting (Mandatory in 2020 and not yet endorsed by the EU)The 2018 Conceptual Framework for Financial Reporting is effective in 2020 for preparers that develop an accounting policy based on the Framework.
The IASB revised its Conceptual Framework in April 2018. Where specific accounting policies are not covered by IFRS they must be in accordance with the principles in the Framework by 2020.
The 2018 Conceptual Framework describes the objective of, and the concepts for, general purpose financial reporting. The purpose of the Conceptual Framework is to: (a) Assist the International Accounting Standards Board (Board) to develop
IFRS Standards (“Standards”) that are based on consistent concepts; (b) Assist preparers to develop consistent accounting policies when no
Standard applies to a particular transaction or other event, or when a Standard allows a choice of accounting policy; and
(c) Assist all parties to understand and interpret the Standards.
The Conceptual Framework is not a Standard. Nothing in the Conceptual Framework overrides any Standard or any requirement in a Standard. The Group is currently evaluating this pronouncement.
IFRS 17 “Insurance Contracts” (Mandatory in 2021 and not yet endorsed by the EU)The Standard provides consistent principles for all aspects of accounting for insurance contracts. The Group will evaluate the impact of this pronouncement in due course.
Judgments in applying accounting policies and key sources of estimation uncertaintyThe preparation of the financial statements requires management to use judgment in applying accounting policies and in making critical accounting estimates.
These judgments and estimates are based on management’s best knowledge of the relevant facts and circumstances, having regard to previous experience, but actual results may differ materially from the amounts included in the financial statements. Areas of judgment in the application of accounting policies that have the most significant effect on the amounts recognised in the financial statements and key sources of estimation uncertainty that have a significant risk of causing a material adjustment to the carrying amounts of assets and liabilities within the next financial year are noted below and further information is contained in the accounting policies and/or the notes to the financial statements.
These areas of judgment and estimation are discussed further in critical accounting policies and estimates on pages 162 to 164. The quantum of ore reserves and mineral resources impacts many of these areas and the basis of calculation is explained below. Information on less material judgments and sources of estimation uncertainty has been incorporated into the relevant accounting policy notes.
Areas of judgment in the application of accounting policies that have the most significant effect on the amounts recognised in the financial statements are:
– Impairment of non-current assets – determination of cash generating units (CGUs) and assessment of indicators of impairment – note 1(e) and (i), note 6, note 12 and note 13.
– Estimation of asset lives – whether certain assets are indefinite lived – note 1(e) and (i).
– Provision for onerous contracts – determination of assets dedicated to a contract – note 1(i).
– Close-down, restoration and environmental obligations – determining when an estimate is sufficiently reliable to update – note 1(k).
– Deferral of stripping costs – judgment on components/strip ratios and separate or integrated multiple pit mines – note 1(h).
– Uncertain tax positions – technical interpretation of tax law and the use of the most likely scenario for provision – note 1(m), note 9 and note 31.
– Recoverability of potential deferred tax assets – recognition of deferred tax assets for loss-making operations – note 17(c), (e) and (f).
– Identification of functional currencies – different companies may make different judgments based on similar facts – note 1(d).
– Basis of consolidation – judgment as to when the Group has control, joint control or significant influence – notes 33 to 36.
– Contingencies – assessing the probability of any loss and whether it is possible to quantify any loss – note 31.
– Exclusions from underlying earnings – judgment on items to be excluded on grounds of nature or size – note 2.
– Accounting for the Pilbara Arrangements – treatment of payments made over a contractually specified period for network infrastructure capacity – critical policies note (xiii).
Key sources of estimation uncertainty that have a significant risk of causing a material adjustment to the carrying amounts of assets and liabilities within the next financial year are: – Impairment of non-current assets – review of asset carrying values,
impairment charges and reversals and the recoverability of goodwill – determination of discounted cash flows – note1(e) and (i), note 6, note 12 and note 13.
– Provision for onerous contracts – cash flow estimates and the discount rate to be used – note 1(i).
– Close-down, restoration and environmental cost obligations – estimation of costs and the timing of expenditure – note 1(k) and note 26.
– Uncertain tax positions – estimating the potential exposures for each possible scenario – note 1(m), note 9 and note 31.
– Recoverability of potential deferred tax assets – determination of cash flows – note 1(m), note 17(c), (e) and (f).
– Estimation of obligations for post-employment costs – note 1(n) and note 44.
– Contingencies – estimate of possible liability – note 31.
Ore reserves and mineral resourcesEstimates of ore reserves and, in some cases, mineral resources can impact: depreciation and amortisation rates; the carrying values of intangible assets and property, plant and equipment; deferred stripping costs; provisions for close-down and restoration costs; and the recovery of deferred tax assets.
The Group estimates its ore reserves and mineral resources based on information compiled by Competent Persons as defined in accordance with the Joint Ore Reserves Committee (JORC) code (see note 1(j)).
The estimation of ore reserves and mineral resources requires judgment to interpret available geological data and subsequently to select an appropriate mining method and then to establish an extraction schedule. Estimation requires assumptions about future commodity prices and demand, exchange rates, production costs, transport costs, close-down and restoration costs, recovery rates and discount rates and, in some instances, the renewal of mining licences.
There are many uncertainties in the estimation process and assumptions that are valid at the time of estimation may change significantly when new information becomes available. New geological or economic data, or
Annual report 2018 | riotinto.com152

Notes to the 2018 financial statements continued
unforeseen operational issues, may change estimates of ore reserves and mineral resources.
The Group uses judgment as to when to include mineral resources in accounting estimates, for example, the use of mineral resources in the Group’s depreciation policy is described in note 1(i) below and in the determination of the date of closure as described in note 1(k). The unaudited statement of ore reserves is included on page 271 and of mineral resources on page 275.
(a) Accounting conventionThe financial information included in the financial statements for the year ended 31 December 2018, and for the related comparative periods, has been prepared under the historical cost convention, as modified by the revaluation of certain derivative contracts and financial assets, the impact of fair value hedge accounting on the hedged item and the accounting for post-employment assets and obligations. The Group’s policy in respect of these items is set out in the notes below.
All financial statement values are rounded to the nearest million (US$m) unless otherwise stated.
Where applicable, comparatives have been adjusted to measure or present them on the same basis as current period figures.
(b) Basis of consolidation (notes 33 to 36)All intragroup transactions and balances have been eliminated on consolidation.
Where necessary, adjustments are made to the locally reported assets, liabilities, and results of subsidiaries, joint arrangements and associates to bring their accounting policies in line with those used by the Group.
SubsidiariesSubsidiaries are entities controlled by either of the Companies. Control exists where either of the Companies has: power over the entities, that is, existing rights that give it the current ability to direct the relevant activities of the entities (those that significantly affect the Companies’ returns); exposure, or rights, to variable returns from its involvement with the entities; and the ability to use its power to affect those returns. Subsidiaries are fully consolidated from the date on which the Group obtains control. They are deconsolidated from the date that control ceases.
Joint arrangementsA joint arrangement is an arrangement in which two or more parties have joint control. Joint control is the contractually agreed sharing of control such that decisions about the relevant activities of the arrangement (those that significantly affect the Companies’ returns) require the unanimous consent of the parties sharing control. The Group has two types of joint arrangements:
Joint operations (JO)A JO is a joint arrangement in which the parties that share joint control have rights to the assets, and obligations for the liabilities, relating to the arrangement. This includes situations where the parties benefit from the joint activity through a share of the output, rather than by receiving a share of the results of trading. In relation to its interest in a JO, the Group recognises: its share of assets and liabilities; revenue from the sale of its share of the output and its share of any revenue generated from the sale of the output by the JO; and its share of expenses. All such amounts are measured in accordance with the terms of the arrangement, which is usually in proportion to the Group’s interest in the JO. These amounts are recorded in the Group’s financial statements on the appropriate lines.
Joint ventures (JV)A JV is a joint arrangement in which the parties that share joint control have rights to the net assets of the arrangement. JVs are accounted for using the equity accounting method.
Other unincorporated arrangementsIn some cases, the Group participates in unincorporated arrangements and has rights to its share of the assets and obligations for its share of the liabilities of the arrangement rather than a right to a net return, but does not share joint control. In such cases, the Group recognises: its share of assets and liabilities; revenue from the sale of its share of the output and its share of any revenue generated from the sale of the output by the unincorporated arrangement; and its share of expenses. All such amounts are measured in accordance with the terms of the arrangement, which is usually in proportion to the Group’s interest in the arrangement. These amounts are recorded in the Group’s financial statements on the appropriate lines.
AssociatesAn associate is an entity that is neither a subsidiary nor a joint arrangement, over which the Group has significant influence. Significant influence is presumed to exist where there is neither control nor joint control and the Group has more than 20% of the voting rights, unless it can be clearly demonstrated that this is not the case. Significant influence can arise where the Group holds less than 20% of the voting rights if it has the power to participate in the financial and operating policy decisions affecting the entity. Investments in associates are accounted for using the equity accounting method.
The Group uses the term “equity accounted units” (EAUs) to refer to associates and JVs collectively. Under the equity accounting method the investment is recorded initially at cost to the Group, including any goodwill on acquisition. In subsequent periods the carrying amount of the investment is adjusted to reflect the Group’s share of the EAUs’ retained post-acquisition profit or loss and other comprehensive income. Long-term loans to EAUs that in substance form part of the Group’s net investment (quasi equity loans) are financial assets but are included in the line “Investments in equity accounted units” on the face of the balance sheet. When the Group’s share of losses in an EAU equals or exceeds its interest in the EAU, including such long-term loans and any other unsecured receivables, the Group does not recognise further losses, unless it has incurred legal or constructive obligations to continue to make payments on behalf of the EAU.
Acquisitions (note 37)Under the “acquisition” method of accounting for business combinations, the purchase consideration is allocated to the identifiable assets acquired and liabilities and contingent liabilities assumed (the identifiable net assets) on the basis of their fair value at the date of acquisition, which is the date on which control is obtained.
The consideration transferred for the acquisition of a subsidiary comprises the fair values of the assets transferred, the liabilities incurred to the former owners of the acquiree, the fair value of any asset or liability resulting from a contingent consideration arrangement and any equity interests issued by the Group. Costs related to the acquisition of a subsidiary are expensed as incurred.
The excess of the consideration transferred, the amount of any non-controlling interest in the acquiree and the acquisition date fair value of any previous equity interest in the acquiree over the fair value of the identifiable net assets acquired is recorded as goodwill. Any shortfall is immediately recognised in the income statement.
Non-controlling interests in the acquiree, that are present ownership interests and entitle their holders to a proportionate share of the entity’s net assets in the event of liquidation, are recognised by the Group in one of two ways with the choice being available on an acquisition-by-acquisition basis. They can be measured at either the non-controlling interest’s proportionate share of the acquiree’s identifiable net assets or at fair value. In some cases, non-controlling interests may be treated as equity options and valued on that basis. Goodwill (see note (e)) and amounts attributable to non-controlling interests will differ depending on the basis used.
Annual report 2018 | riotinto.com 153
Financial statements
Financial statements
Notes to the 2018 financial statements continued
1 Principal accounting policies continuedWhere the Group previously held a non-controlling interest in the acquiree, this is remeasured to fair value at the date control is obtained with any gain or loss recognised in the income statement. The cash cost of the share purchase that gives rise to control is included within “Investing activities” in the cash flow statement.
Where the Group increases its ownership interest in a subsidiary, the difference between the purchase price and the carrying value of the share of net assets acquired is recorded in equity. The cash cost of such purchases is included within “Financing activities” in the cash flow statement.
Provisional fair values allocated at a reporting date are finalised within 12 months of the acquisition date.
The results of businesses acquired during the year are included in the consolidated financial statements from the date on which control, joint control or significant influence is obtained.
Disposals (note 37)Individual non-current assets or “disposal groups” (that is, groups of assets and liabilities) to be disposed of by sale or otherwise in a single transaction are classified as “held for sale” if the following criteria are met at the period end: – The carrying amount will be recovered principally through a sale
transaction rather than through continuing use; and – The disposal group is available for immediate sale in its present
condition subject only to terms that are usual and customary for such sales; and
– The sale is highly probable.
Disposal groups held for sale are carried at the lower of their carrying amount and fair value less costs to sell. The comparative balance sheet is not restated. Disposal groups acquired with a view to resale are held at the fair value determined at the acquisition date. For these assets acquired for resale no profits or losses are recognised between the acquisition date and the disposal date, unless there is a subsequent impairment.
On classification as held for sale, the assets are no longer depreciated and, if applicable, equity accounting ceases.
If control is lost, any interest in the entity retained by the Group is remeasured to its fair value and the change in carrying amount is recognised in the income statement. The retained interest may be subsequently accounted for as a joint venture, joint operation, associate or financial asset depending on the facts. Certain amounts previously recognised in other comprehensive income in respect of the entity disposed of, or for which control, joint control or significant influence has ceased, may be recycled to the income statement. The cash proceeds of disposals are included within “Investing activities” in the cash flow statement.
Changes in the Group’s interest in a subsidiary that do not result in a loss of control are accounted for in equity. The cash proceeds of such disposals are included within “Financing activities” in the cash flow statement.
(c) Sales revenueRecognition and measurementThe Group recognises sales revenue related to the transfer of promised goods or services when control of the goods or services passes to the customer. The amount of revenue recognised reflects the consideration to which the Group is or expects to be entitled in exchange for those goods or services.
Sales revenue is recognised on individual sales when control transfers to the customer. In most instances, control passes and sales revenue is recognised when the product is delivered to the vessel or vehicle on which it will be transported once loaded, the destination port or the customer’s premises. There may be circumstances when judgment is required based on the five indicators of control below. – The customer has the significant risks and rewards of ownership and
has the ability to direct the use of, and obtain substantially all of the remaining benefits from, the goods or service.
– The customer has a present obligation to pay in accordance with the terms of the sales contract. For shipments under the Incoterms Cost, Insurance and Freight (CIF)/Carriage Paid to (CPT)/Cost and Freight (CFR) this is generally when the ship is loaded, at which time the obligation for payment is for both product and freight.
– The customer has accepted the asset. Sales revenue may be subject to adjustment if the product specification does not conform to the terms specified in the sales contract but this does not impact the passing of control. Assay and specification adjustments have been immaterial historically.
– The customer has legal title to the asset. The Group usually retains legal title until payment is received for credit risk purposes only.
– The customer has physical possession of the asset. This indicator may be less important as the customer may obtain control of an asset prior to obtaining physical possession, which may be the case for goods in transit.
The Group sells a significant proportion of its products on CFR or CIF Incoterms. This means that the Group is responsible (acts as principal) for providing shipping services and, in some instances, insurance after the date at which control of goods passes to the customer at the loading port.
The Group therefore has separate performance obligations for freight and insurance services that are provided solely to facilitate sale of the commodities it produces. Other Incoterms commonly used by the Group are Free on Board (FOB), where the Group has no responsibility for freight or insurance once control of the goods has passed at the loading port, and Delivered at Place (DAP) where control of the goods passes when the product is delivered to the agreed destination. For these Incoterms there is only one performance obligation, being for provision of product at the point where control passes.
The Group’s products are sold to customers under contracts which vary in tenure and pricing mechanisms, including some volumes sold in the spot market. Pricing for iron ore is on a range of terms, the majority being either monthly or quarterly average pricing mechanisms, with a smaller proportion of iron ore volumes being sold on the spot market.
Within each sales contract, each unit of product shipped is a separate performance obligation. Revenue is generally recognised at the contracted price as this reflects the stand-alone selling price. Sales revenue excludes any applicable sales taxes. Mining royalties payable are presented as an operating cost or, where they are in substance a profit-based tax, within taxation.
Sales of copper concentrate are stated net of the treatment and refining charges which will be required to convert it to an end product.
Annual report 2018 | riotinto.com154
Notes to the 2018 financial statements continued
Certain of the Group’s products may be provisionally priced at the date revenue is recognised; however, substantially all iron ore and aluminium sales are reflected at final prices in the results for the period. The final selling price for all provisionally priced products is based on the price for the quotational period stipulated in the contract. Final prices for copper concentrate are normally determined between 30 to 180 days after delivery to the customer. The change in value of the provisionally priced receivable is based on relevant forward market prices and is included in sales revenue.
Rio Tinto has a number of long-term contracts to supply product to customers in future periods. Generally, revenues are recognised on an as invoiced basis, hence, the right to consideration from a customer corresponds directly with the entity’s performance completed to date.
A number of the Group’s businesses provide volume discounts in certain circumstances. The impact of constraining such variable consideration under IFRS 15 was immaterial at 31 December 2018.
The Group applies the practical expedient in paragraph 121 of IFRS 15 and does not disclose information on the transaction price allocated to performance obligations that are unsatisfied.
Presentation and disclosuresConsolidated sales revenue as reported in the income statement comprises sales to third parties. Certain of the Group’s products may be provisionally priced at the date revenue is recognised. Sales revenue includes revenue from contracts with customers, which is accounted for under IFRS 15 “Revenue from Contracts with Customers” and subsequent movements in provisionally priced receivables which are accounted for under IFRS 9 “Financial Instruments”. A breakdown of sales revenue between these two amounts is disclosed in the product analysis in note 3 and further detail on provisional pricing in note 3. Sales revenue includes revenue from movements in provisionally priced receivables, consistent with the treatment in prior periods.
The Group considers that the impact of economic factors on its sales revenue, particularly pricing and volumes, is best understood by reference to the disclosure of sales revenue by product group and sales destination in note 3. The analysis of provisional pricing adjustments by commodity in the product analysis in note 3 shows which products are subject to price volatility post the transfer of control. With the exception of Oyu Tolgoi, which sells copper concentrate to China, this price uncertainty is largely resolved at the period end.
Typically, the Group has a right to payment before or at the point that control of the goods passes including a right, where applicable, to payment for provisionally priced products and unperformed freight and insurance services. Cash received before control passes is recognised as a contract liability. The amount of consideration does not contain a significant financing component as payment terms are less than one year.
Revenues from the sale of significant by-products, such as gold, are included in sales revenue. Sundry revenue (eg sales of surplus power) incidental to the main revenue-generating activities of the operations, is treated as a credit to operating costs.
The Group does not disclose sales revenue from freight and insurance services separately as it does not consider that this is necessary in order to understand the impact of economic factors on the Group; the Group’s chief executive, the chief operating decision maker, as defined under IFRS 8, “Operating Segments”, does not review information specifically relating to these sources of revenue in order to evaluate the performance of business segments and Group information on these sources of revenue is not provided externally.
The Group does provide information on freight revenue for the iron ore and bauxite businesses on pages 36 and 41 to help stakeholders understand FOB operating margins for those products.
Third-party commodity swap arrangements principally for delivery and receipt of smelter-grade alumina are offset within operating costs.
Presentation of comparative consolidated sales revenue is in accordance with the previous standard IAS 18 “Revenue Recognition”. No material measurement or recognition differences on comparative information were identified between IAS 18 and the current standard IFRS 15. For further understanding of the impact of the transition to IFRS 15, refer to note 45.
(d) Currency translationThe functional currency for each entity in the Group, and for joint arrangements and associates, is the currency of the primary economic environment in which that entity operates. For many of these entities, this is the currency of the country in which they are located. Transactions denominated in other currencies are converted to the functional currency at the exchange rate ruling at the date of the transaction. Monetary assets and liabilities denominated in foreign currencies are retranslated at period-end exchange rates.
The Group’s financial statements are presented in US dollars, as that presentation currency most reliably reflects the global business performance of the Group as a whole. On consolidation, income statement items for each entity are translated from the functional currency into US dollars at average rates of exchange, except for material one-off transactions, which are translated at the rate prevailing on the transaction date. Balance sheet items are translated into US dollars at period-end exchange rates.
Exchange differences arising on the translation of the net assets of entities with functional currencies other than the US dollar are recognised directly in the currency translation reserve. These translation differences are shown in the statement of comprehensive income, with the exception of translation adjustments relating to Rio Tinto Limited’s share capital, which are shown in the statement of changes in equity.
Where an intragroup balance is, in substance, part of the Group’s net investment in an entity, exchange gains and losses on that balance are taken to the currency translation reserve.
Except as noted above, or in note 1(p) relating to derivative contracts, all other exchange differences are charged or credited to the income statement in the year in which they arise.
(e) Goodwill and intangible assets (excluding exploration and evaluation expenditure) (notes 12 and 13)Goodwill is not amortised; it is tested annually for impairment or more frequently if events or changes in circumstances indicate a potential impairment. Investments in EAUs, including any goodwill, are tested for impairment as a single asset when a trigger for impairment has been identified. The Group’s impairment policy is explained in note 1(i).
Purchased intangible assets are initially recorded at cost. Finite-life intangible assets are amortised over their useful economic lives on a straight line or units of production basis, as appropriate. Intangible assets that are deemed to have indefinite lives and intangible assets that are not yet ready for use are not amortised; they are reviewed annually for impairment or more frequently if events or changes in circumstances indicate a potential impairment in accordance with accounting policy note 1(i).
Annual report 2018 | riotinto.com 155
Financial statements

Financial statements
Notes to the 2018 financial statements continued
1 Principal accounting policies continuedThe Group considers that intangible assets have indefinite lives when, based on an analysis of all of the relevant factors, there is no foreseeable limit to the period over which the asset is expected to generate cash flows for the Group. The factors considered in making this judgment include the existence of contractual rights for unlimited terms or evidence that renewal of the contractual rights without significant incremental cost can be expected for indefinite future periods in view of the Group’s investment intentions. The life cycles of the products and processes that depend on the asset are also considered.
(f) Exploration and evaluation (note 13)Exploration and evaluation expenditure comprises costs that are directly attributable to: – Researching and analysing existing exploration data; – Conducting geological studies, exploratory drilling and sampling; – Examining and testing extraction and treatment methods; and/or – Compiling various studies (order of magnitude, pre-feasibility
and feasibility).
Exploration expenditure relates to the initial search for deposits with economic potential. Expenditure on exploration activity undertaken by the Group is not capitalised.
Evaluation expenditure relates to a detailed assessment of deposits or other projects (including smelter and refinery projects) that have been identified as having economic potential. Capitalisation of evaluation expenditure commences when there is a high degree of confidence that the Group will determine that a project is commercially viable, that is the project will provide a satisfactory return relative to its perceived risks, and therefore it is considered probable that future economic benefits will flow to the Group. The Group’s view is that a high degree of confidence is greater than “more likely than not” (that is, greater than 50% certainty) and less than “virtually certain” (that is, less than 90% certainty).
Assessing whether there is a high degree of confidence that the Group will ultimately determine that an evaluation project is commercially viable requires judgment and consideration of all relevant factors such as the nature and objective of the project; the project’s current stage; project timeline; current estimates of the project’s net present value, including sensitivity analyses for the key assumptions; and the main risks of the project. Development expenditure incurred prior to the decision to proceed is subject to the same criteria for capitalisation, being a high degree of confidence that the Group will ultimately determine that a project is commercially viable.
In some cases, undeveloped projects are regarded as successors to orebodies, smelters or refineries currently in production. Where this is the case, it is intended that these will be developed and go into production when the current source of ore is exhausted or when existing smelters or refineries are closed.
Ore reserves may be declared for an undeveloped mining project before its commercial viability has been fully determined. Evaluation costs may continue to be capitalised during the period between declaration of ore reserves and approval to mine as further work is undertaken in order to refine the development case to maximise the project’s returns.
In accordance with IFRS 6 “Exploration for and Evaluation of Mineral Resources”, the criteria for the capitalisation of evaluation costs are applied consistently from period to period.
In the case of undeveloped mining projects that have arisen through acquisition, the allocation of the purchase price consideration may result in undeveloped properties being recognised at an earlier stage of project evaluation compared with projects arising from the Group’s exploration and evaluation programme. Subsequent expenditure on acquired undeveloped projects is only capitalised if it meets the high degree of confidence threshold discussed above.
The carrying values of capitalised evaluation expenditure for undeveloped mining projects (projects for which the decision to mine has not yet been approved at the appropriate authorisation level within the Group) are reviewed at each reporting date for indicators of impairment in accordance with IFRS 6, and when indicators that are identified are tested in accordance with IAS 36. Evaluation expenditure for non-mining projects is reviewed and tested under IAS 36.
The impairment review is based on a status report summarising the Group’s intentions to recover value through development, sale or other partnering arrangements. If a project does not prove viable and is cancelled, all irrecoverable costs associated with the project net of any previously recorded impairment provisions are charged to the income statement.
(g) Property, plant and equipment (note 14)Once an undeveloped mining project has been determined as commercially viable and approval to mine has been given, expenditure other than that on land, buildings, plant, equipment and capital work in progress is capitalised under “Mining properties and leases” together with any amount transferred from “Exploration and evaluation”.
Costs which are necessarily incurred whilst commissioning new assets, in the period before they are capable of operating in the manner intended by management, are capitalised. Development costs incurred after the commencement of production are capitalised to the extent they are expected to give rise to a future economic benefit. Interest on borrowings related to construction or development projects is capitalised, at the rate payable on project-specific debt if applicable or at the Group or subsidiary’s cost of borrowing if not, until the point when substantially all the activities that are necessary to make the asset ready for its intended use are complete. It may be appropriate to use a subsidiary’s cost of borrowing when the debt was negotiated based on the financing requirements of that subsidiary.
Property, plant and equipment is stated at cost, as defined in IAS 16, less accumulated depreciation and accumulated impairment losses. The cost of property, plant and equipment includes, where applicable, the estimated close-down and restoration costs associated with the asset.
(h) Deferred stripping (note 14)In open pit mining operations, overburden and other waste materials must be removed to access ore from which minerals can be extracted economically. The process of removing overburden and waste materials is referred to as stripping. During the development of a mine (or, in some instances, pit; see below), before production commences, stripping costs related to a component of an orebody are capitalised as part of the cost of construction of the mine (or pit) and are subsequently amortised over the life of the mine (or pit) on a units of production basis.
Where a mine operates several open pits that are regarded as separate operations for the purpose of mine planning, initial stripping costs are accounted for separately by reference to the ore from each separate pit. If, however, the pits are highly integrated for the purpose of mine planning, the second and subsequent pits are regarded as extensions of the first pit in accounting for stripping costs. In such cases, the initial stripping (ie overburden and other waste removal) of the second and subsequent pits is considered to be production phase stripping (see below).
Annual report 2018 | riotinto.com156

Notes to the 2018 financial statements continued
The Group’s judgment as to whether multiple pit mines are considered separate or integrated operations depends on each mine’s specific circumstances.
The following factors would point towards the initial stripping costs for the individual pits being accounted for separately: – If mining of the second and subsequent pits is conducted
consecutively following that of the first pit, rather than concurrently. – If separate investment decisions are made to develop each pit, rather
than a single investment decision being made at the outset. – If the pits are operated as separate units in terms of mine planning
and the sequencing of overburden removal and ore mining, rather than as an integrated unit.
– If expenditures for additional infrastructure to support the second and subsequent pits are relatively large.
– If the pits extract ore from separate and distinct orebodies, rather than from a single orebody.
If the designs of the second and subsequent pits are significantly influenced by opportunities to optimise output from several pits combined, including the co-treatment or blending of the output from the pits, then this would point to treatment as an integrated operation for the purposes of accounting for initial stripping costs. The relative importance of each of the above factors is considered in each case.
In order for production phase stripping costs to qualify for capitalisation as a stripping activity asset, three criteria must be met: – It must be probable that there will be an economic benefit in a future
accounting period because the stripping activity has improved access to the orebody;
– It must be possible to identify the “component” of the orebody for which access has been improved; and
– It must be possible to reliably measure the costs that relate to the stripping activity.
A “component” is a specific section of the orebody that is made more accessible by the stripping activity. It will typically be a subset of the larger orebody that is distinguished by a separate useful economic life (for example, a pushback).
Production phase stripping can give rise to two benefits: the extraction of ore in the current period and improved access to ore which will be extracted in future periods. When the cost of stripping which has a future benefit is not distinguishable from the cost of producing current inventories, the stripping cost is allocated to each of these activities based on a relevant production measure using a life-of-component strip ratio. The ratio divides the tonnage of waste mined for the component for the period either by the quantity of ore mined for the component or by the quantity of minerals contained in the ore mined for the component. In some operations, the quantity of ore is a more appropriate basis for allocating costs, particularly where there are significant by-products. Stripping costs for the component are deferred to the extent that the current period ratio exceeds the life of component ratio. The stripping activity asset is depreciated on a “units of production” basis based on expected production of either ore or minerals contained in the ore over the life of the component unless another method is more appropriate.
The life-of-component ratios are based on the ore reserves of the mine (and for some mines, other mineral resources) and the annual mine plan; they are a function of the mine design and, therefore, changes to that design will generally result in changes to the ratios. Changes in other technical or economic parameters that impact the ore reserves (and for
some mines, other mineral resources) may also have an impact on the life-of-component ratios even if they do not affect the mine design. Changes to the ratios are accounted for prospectively.
It may be the case that subsequent phases of stripping will access additional ore and that these subsequent phases are only possible after the first phase has taken place. Where applicable, the Group considers this on a mine-by-mine basis. Generally, the only ore attributed to the stripping activity asset for the purposes of calculating a life-of-component ratio, and for the purposes of amortisation, is the ore to be extracted from the originally identified component.
Deferred stripping costs are included in “Mining properties and leases” within “Property, plant and equipment” or within “Investments in equity accounted units”, as appropriate. Amortisation of deferred stripping costs is included in “Depreciation of property, plant and equipment” within “Net operating costs” or in “Share of profit after tax of equity accounted units”, as appropriate.
(i) Depreciation and impairment (notes 13 and 14)Depreciation of non-current assetsProperty, plant and equipment is depreciated over its useful life, or over the remaining life of the mine or smelter or refinery if that is shorter and there is no reasonable alternative use for the asset by the Group.
The useful lives of the major assets of a CGU are often dependent on the life of the orebody to which they relate. Where this is the case, the lives of mining properties, and their associated refineries, concentrators and other long-lived processing equipment are generally limited to the expected life of the orebody. The life of the orebody, in turn, is estimated on the basis of the life-of-mine plan. Where the major assets of a CGU are not dependent on the life of a related orebody, management applies judgment in estimating the remaining service potential of long-lived assets. Factors affecting the remaining service potential of smelters include, for example, smelter technology and electricity purchase contracts when power is not sourced from the company’s, or in some cases a local government’s, renewably sourced electricity generating capacity.
The useful lives and residual values for material assets and categories of assets are reviewed annually and changes are reflected prospectively.
Depreciation commences when an asset is available for use. The major categories of property, plant and equipment are depreciated on a units of production and/or straight line basis as follows:
Units of production basisFor mining properties and leases and certain mining equipment, consumption of the economic benefits of the asset is linked to production. Except as noted below, these assets are depreciated on the units of production basis.
In applying the units of production method, depreciation is normally calculated based on production in the period as a percentage of total expected production in current and future periods based on ore reserves and, for some mines, other mineral resources. Other mineral resources may be included in the calculations of total expected production in limited circumstances where there are very large areas of contiguous mineralisation, for which the economic viability is not sensitive to likely variations in grade, as may be the case for certain iron ore, bauxite and industrial minerals deposits and where there is a high degree of confidence that the other mineral resources can be extracted economically. This would be the case when the other mineral resources do not yet have the status of ore reserves merely because the necessary detailed evaluation work has not yet been performed and the responsible technical personnel agree that inclusion of a proportion of measured and indicated resources in the calculation of total expected production is appropriate based on historical reserve conversion rates.
Annual report 2018 | riotinto.com 157
Financial statements

Financial statements
Notes to the 2018 financial statements continued
1 Principal accounting policies continuedThe required level of confidence is unlikely to exist for minerals that are typically found in low-grade ore (as compared with the above), such as copper or gold. In these cases, specific areas of mineralisation have to be evaluated in detail before their economic status can be predicted with confidence.
Where measured and indicated resources are used in the calculation of depreciation for infrastructure, primarily rail and port, which will benefit current and future mines, then the measured and indicated resources may relate to mines which are currently in production or to mines where there is a high degree of confidence that they will be brought into production in the future. The quantum of mineral resources is determined taking into account future capital costs as required by the JORC code. The depreciation calculation, however, applies to current mines only and does not take into account future development costs for mines that are not yet in production. Measured and indicated resources are currently incorporated into depreciation calculations in the Group’s Australian iron ore business.
Straight line basisAssets within operations for which production is not expected to fluctuate significantly from one year to another or which have a physical life shorter than the related mine are depreciated on a straight line basis.
Impairment charges/reversals of non-current assetsImpairment charges and reversals are assessed at the level of cash-generating units which, in accordance with IAS 36 “Impairment of Assets”, are identified as the smallest identifiable asset or group of assets that generate cash inflows, which are largely independent of the cash inflows from other assets. Separate CGUs are identified where an active market exists for intermediate products, even if the majority of those products are further processed internally. Impairment of financial assets is evaluated in accordance with IAS 39.
In some cases, individual business units consist of several operations with independent cash-generating streams which constitute separate CGUs.
Goodwill acquired through business combinations is allocated to the CGU or groups of CGUs that are expected to benefit from the related business combination, and tested for impairment at the lowest level within the Group at which goodwill is monitored for internal management purposes. All goodwill, intangible assets that have an indefinite life and intangible assets that are not ready for use are tested annually for impairment as at 30 September, regardless of whether there has been an impairment trigger or, more frequently, if events or changes in circumstances indicate a potential impairment.
Property, plant and equipment and intangible assets with finite lives are reviewed for impairment if there is an indication that the carrying amount may not be recoverable. The Group conducts an internal review of the asset values annually as at 30 September which is used as a source of information to assess for indications of impairment or reversal of previously recognised impairment losses. External factors, such as changes in forecasted commodity prices, costs and other market factors as well as internal factors such as cancellation of a project or reduced project scope, are also monitored to assess for indications of impairment or reversal of previously recognised impairment losses. If any such indication exists then an impairment review is undertaken; the recoverable amount is assessed by reference to the higher of value in use (being the net present value of expected future cash flows of the relevant CGU in its current condition) and fair value less cost of disposal (FVLCD).
When the recoverable amount of the CGU is measured by reference to FVLCD, this amount is further classified in accordance with the fair value hierarchy for observable market data that is consistent with the unit of account for the CGU being tested. The Group considers that the best evidence of FVLCD is the value obtained from an active market or binding sale agreement and, in this case, the recoverable amount is classified in the fair value hierarchy as level 1. When FVLCD is based on quoted prices for equity instruments but adjusted to reflect factors such as a lack of liquidity in the market, the recoverable amount is classified as level 2 in the fair value hierarchy. No CGUs are currently assessed for impairment by reference to a recoverable amount based on FVLCD classified as level 1 or level 2.
Where unobservable inputs are material to the measurement of the recoverable amount, FVLCD is based on the best information available to reflect the amount the Group could receive for the CGU in an orderly transaction between market participants at the measurement date. This is often estimated using discounted cash flow techniques and is classified as level 3 in the fair value hierarchy.
Where the recoverable amount is assessed using FVLCD based on discounted cash flow techniques, the resulting estimates are based on detailed life-of-mine and/or long-term production plans. These may include anticipated expansions which are at the evaluation stage of study.
The cash flow forecasts for FVLCD purposes are based on management’s best estimates of expected future revenues and costs, including the future cash costs of production, capital expenditure, and closure, restoration and environmental costs. For the purposes of determining FVLCD from a market participant’s perspective, the cash flows incorporate management’s price and cost assumptions in the short and medium term. In the longer term, operating margins are assumed to remain constant where appropriate, as it is considered unlikely that a market participant would prepare detailed forecasts over a longer term. The cash flow forecasts may include net cash flows expected to be realised from the extraction, processing and sale of material that does not currently qualify for inclusion in ore reserves. Such non-reserve material is only included when there is a high degree of confidence in its economic extraction. This expectation is usually based on preliminary drilling and sampling of areas of mineralisation that are contiguous with existing ore reserves. Typically, the additional evaluation required to achieve reserves status for such material has not yet been done because this would involve incurring evaluation costs earlier than is required for the efficient planning and operation of the mine.
As noted above, cost levels incorporated in the cash flow forecasts for FVLCD purposes are based on the current life-of-mine plan or long-term production plan for the CGU. This differs from value in use which requires future cash flows to be estimated for the asset in its current condition and therefore does not include future cash flows associated with improving or enhancing an asset’s performance. Anticipated enhancements to assets may be included in FVLCD calculations and, therefore, generally result in a higher value.
Where the recoverable amount of a CGU is dependent on the life of its associated orebody, expected future cash flows reflect the current life of mine and/or long-term production plans, which are based on detailed research, analysis and iterative modelling to optimise the level of return from investment, output and sequence of extraction. The mine plan takes account of all relevant characteristics of the orebody, including waste-to-ore ratios, ore grades, haul distances, chemical and metallurgical properties of the ore impacting process recoveries and capacities of processing equipment that can be used. The life-of-mine plan and/or long-term production plans are, therefore, the basis for forecasting production output and production costs in each future year.
Annual report 2018 | riotinto.com158

Notes to the 2018 financial statements continued
Forecast cash flows for ore reserve estimation for JORC purposes are generally based on Rio Tinto’s commodity price forecasts, which assume short-term market prices will revert to the Group’s assessment of the long-term price, generally over a period of three to five years. For most commodities, these forecast commodity prices are derived from a combination of analyses of the marginal costs of the producers and of the incentive price of these commodities. These assessments often differ from current price levels and are updated periodically. The Group does not believe that published medium- and long-term forward prices necessarily provide a good indication of future levels because they tend to be strongly influenced by spot prices. The price forecasts used for ore reserve estimation are generally consistent with those used for impairment testing unless management deems that in certain economic environments, a market participant would not assume Rio Tinto’s view on prices, in which case in preparing FVLCD impairment calculations management estimates the assumptions that a market participant would be expected to use.
Forecast future cash flows of a CGU take into account the sales prices under existing sales contracts.
The discount rates applied to the future cash flow forecasts represent an estimate of the rate the market would apply having regard to the time value of money and the risks specific to the asset for which the future cash flow estimates have not been adjusted. The Group’s weighted average cost of capital is generally used as a starting point for determining the discount rates, with appropriate adjustments for the risk profile of the countries in which the individual CGUs operate, weighted for gold content. For final feasibility studies and ore reserve estimation, internal hurdle rates, which are generally higher than the Group’s weighted average cost of capital, are used. For developments funded with project finance, the debt component of the weighted average cost of capital may be calculated by reference to the specific interest rate of the project finance and anticipated leverage of the project.
For operations with a functional currency other than the US dollar, the impairment review is undertaken in the relevant functional currency. In estimating FVLCD, internal forecasts of exchange rates take into account spot exchange rates, historical data and external forecasts, and are kept constant in real terms after five years. The great majority of the Group’s sales are based on prices denominated in US dollars. To the extent that the currencies of countries in which the Group produces commodities strengthen against the US dollar without an increase in commodity prices, cash flows and, therefore, net present values are reduced. Management considers that over the long term, there is a tendency for movements in commodity prices to compensate to some extent for movements in the value of the US dollar, particularly against the Australian dollar and Canadian dollar, and vice versa. However, such compensating changes are not synchronised and do not fully offset each other. In estimating value in use, the present value of future cash flows in foreign currencies is translated at the spot exchange rate on the testing date.
Non-current assets (excluding goodwill) that have suffered impairment are reviewed using the same basis for valuation as explained above whenever events or changes in circumstances indicate that the impairment loss may no longer exist, or may have decreased. If appropriate, an impairment reversal will be recognised. The carrying amount of the CGU after reversal must be the lower of (a) the recoverable amount, as calculated above, and (b) the carrying amount that would have been determined (net of amortisation or depreciation) had no impairment loss been recognised for the CGU in prior periods.
An onerous contract is defined under IAS 37 “Provisions, Contingent Liabilities and Contingent Assets” as a contract under which the unavoidable costs of meeting the obligations under the contract exceed the economic benefits expected to be received under it. Provision is made when the assets dedicated to the contract are fully impaired or the contract becomes stranded as a result of a business decision.
(j) Determination of ore reserve and mineral resource estimatesThe Group estimates its ore reserves and mineral resources based on information compiled by Competent Persons as defined in accordance with the JORC code.
Ore reserves and, for certain mines, other mineral resources determined in this way are used in the calculation of depreciation, amortisation and impairment charges and for forecasting the timing of the payment of close-down and restoration costs and the recovery of deferred tax assets. The depreciation and impairment policy above notes instances in which mineral resources are taken into account for accounting purposes. In addition, value may be attributed to mineral resources in purchase price allocations undertaken for the purposes of business combination accounting.
(k) Close-down, restoration and environmental obligations (note 26)The Group has provisions for close-down and restoration costs which include the dismantling and demolition of infrastructure, the removal of residual materials and the remediation of disturbed areas for mines and certain refineries and smelters. These provisions are based on all regulatory requirements and any other commitments made to stakeholders.
Closure provisions are not made for those operations that have no known restrictions on their lives as the closure dates cannot be reliably estimated. This applies primarily to certain Canadian smelters which have indefinite-lived water rights or power agreements for renewably sourced power with local governments.
Close-down and restoration costs are a normal consequence of mining or production, and the majority of close-down and restoration expenditure is incurred in the years following closure of the mine, refinery or smelter. Although the ultimate cost to be incurred is uncertain, the Group’s businesses estimate their costs using current restoration standards and techniques.
Close-down and restoration costs are provided for in the accounting period when the obligation arising from the related disturbance occurs, based on the net present value of the estimated future costs of restoration to be incurred during the life of the operation and post-closure. Where appropriate, the provision is estimated using probability weighting of the different remediation and closure scenarios. The obligation may occur during development or during the production phase of a facility.
Provisions for close-down and restoration costs do not include any additional obligations that are expected to arise from future disturbance.
The costs are estimated on the basis of a closure plan, and are reviewed at each reporting period during the life of the operation to reflect known developments. The estimates are also subject to formal review, with appropriate external support, at regular intervals.
The initial close-down and restoration provision is capitalised within “Property, plant and equipment”. Subsequent movements in the close-down and restoration provisions for ongoing operations, including those resulting from new disturbance related to expansions or other activities qualifying for capitalisation, updated cost estimates, changes to the estimated lives of operations, changes to the timing of closure activities and revisions to discount rates are also capitalised within “Property, plant and equipment”. These costs are then depreciated over the lives of the assets to which they relate. Changes in closure provisions relating to closed operations are charged/credited to “Net operating costs” in the income statement.
Where rehabilitation is conducted systematically over the life of the operation, rather than at the time of closure, provision is made for the estimated outstanding continuous rehabilitation work at each balance sheet date and the cost is charged to the income statement.
Annual report 2018 | riotinto.com 159
Financial statements

Financial statements
Notes to the 2018 financial statements continued
1 Principal accounting policies continuedThe amortisation or “unwinding” of the discount applied in establishing the provisions is charged to the income statement in each accounting period. The amortisation of the discount is shown within “Finance items” in the income statement.
Environmental costs result from environmental damage that was not a necessary consequence of operations, and may include remediation, compensation and penalties. Provision is made for the estimated present value of such costs at the balance sheet date. These costs are charged to “Net operating costs”, except for the unwinding of the discount, which is shown within “Finance items”.
Remediation procedures may commence soon after the time the disturbance, remediation process and estimated remediation costs become known, but can continue for many years depending on the nature of the disturbance and the remediation techniques used.
(l) Inventories (note 16)Inventories are valued at the lower of cost and net realisable value, primarily on a weighted average cost basis. Average costs are calculated by reference to the cost levels experienced in the relevant month together with those in opening inventory. The cost of raw materials and consumable stores is the purchase price. The cost of partly-processed and saleable products is generally the cost of production, including: – Labour costs, materials and contractor expenses which are directly
attributable to the extraction and processing of ore or the production of alumina and aluminium
– The depreciation of mining properties and leases and of property, plant and equipment used in the extraction and processing of ore or the production of alumina and aluminium
– Production overheads
Work in progress includes ore stockpiles and other partly processed material. Stockpiles represent ore that has been extracted and is available for further processing. If there is significant uncertainty as to if and/or when the stockpiled ore will be processed, the ore is expensed as mined. If the ore will not be processed within 12 months after the balance sheet date, it is included within non-current assets and net realisable value is calculated on a discounted cash flow basis. Quantities of stockpiled ore are assessed primarily through surveys and assays. Certain estimates, including expected metal recoveries, are calculated using available industry, engineering and scientific data, and are periodically reassessed taking into account technical analysis and historical performance.
(m) Taxation (note 9 and note 17)Current tax is the tax expected to be payable on the taxable income for the year calculated using rates that have been enacted or substantively enacted at the balance sheet date. It includes adjustments for tax expected to be payable or recoverable in respect of previous periods. Where the amount of tax payable or recoverable is uncertain, Rio Tinto establishes provisions based on the Group’s judgment of the most likely amount of the liability, or recovery.
Deferred tax is calculated in accordance with IAS 12. The Group provides for deferred tax in respect of fair value adjustments on acquisitions including mining rights that, in general, are not eligible for income tax allowances. Provision for deferred tax is based on the difference between the carrying value of the asset and its income tax base (which may be nil). Even when there is no income tax base, the existence of a tax base for capital gains tax purposes is not usually taken into account in determining the deferred tax provision for the assets, unless they are classified as held for sale or it is determined for other reasons that the carrying amount is expected to be recovered primarily through disposal and not through use of the assets.
(n) Post-employment benefits (note 44)The Group operates a number of defined benefit plans which provide lump sums, pensions, medical benefits and life insurance to retirees. In accordance with IAS 19, for post-employment defined benefit plans, the difference between the fair value of any plan assets and the present value of the plan obligations is recognised as an asset or liability in the balance sheet.
Where appropriate, the recognition of assets may be restricted to the present value of any amounts the Group expects to recover by way of refunds from the plan or reductions in future contributions. In determining the extent to which a refund will be available the Group considers whether any third party, such as a trustee or pension committee, has the power to enhance benefits or to wind up a pension plan without the Group’s consent.
The most significant assumptions used in accounting for pension plans are the discount rate, the inflation rate and mortality rates. The discount rate is used to determine the net present value of the obligations, the interest cost on the obligations and the interest income on plan assets. The discount rate used is the yield on high-quality corporate bonds with maturities and terms that match those of the post-employment obligations as closely as possible. Where there is no developed corporate bond market in a currency, the rate on government bonds is used. The inflation rate is used to project increases in future benefit payments for those plans that have benefits linked to inflation. The mortality rates are used to project the period over which benefits will be paid, which is then discounted to arrive at the net present value of the obligations.
The current service cost, any past service cost and the effect of any curtailment or settlements are recognised in the income statement. The interest cost less interest income on assets held in the plans is also charged to the income statement. All amounts charged to the income statement in respect of these plans are included within “Net operating costs” or in “Share of profit after tax of equity accounted units”, as appropriate.
The Group’s contributions to defined contribution plans are charged to the income statement in the period to which the contributions relate. These are included within “Net operating costs” or in “Share of profit after tax of equity accounted units”, as appropriate.
(o) Cash and cash equivalents (note 21)For the purpose of the balance sheet, cash and cash equivalents comprise: cash on hand, deposits held with banks, and short-term, highly liquid investments (mainly money market funds) that are readily convertible into known amounts of cash and which are subject to insignificant risk of changes in value. Bank overdrafts are shown as current liabilities in the balance sheet.
Further detail on cash and cash equivalents, including restricted cash, is shown in note 21.
For the purposes of the cash flow statement, cash and cash equivalents are net of bank overdrafts that are repayable on demand.
(p) Financial instruments (note 30)The Group has elected to apply the limited exemption in IFRS 9 relating to classification, measurement and impairment requirements for financial instruments, and accordingly comparative periods have not been restated and remain in line with the previous standard IAS 39 “Financial Instruments: Recognition and Measurement”. For further understanding of the impact of the transition to IFRS 9, refer to note 45.
Annual report 2018 | riotinto.com160

Notes to the 2018 financial statements continued
(i) Financial assetsClassification and measurementThe Group classifies its financial assets into the following categories: those to be measured subsequently at fair value (either through other comprehensive income (FVOCI) or through the income statement (FVPL)) and those to be held at amortised cost.
Classification depends on the business model for managing the financial assets and the contractual terms of the cash flows.
Management determines the classification of financial assets at initial recognition. The Group’s policy with regard to financial risk management is set out in note 30. Generally, the Group does not acquire financial assets for the purpose of selling in the short term.
The Group’s business model is primarily that of “hold to collect” (where assets are held in order to collect contractual cash flows). When the Group enters into derivative contracts, these transactions are designed to reduce exposures relating to assets and liabilities, firm commitments or anticipated transactions.
(a) Financial assets held at amortised costThis classification applies to debt instruments which are held under a hold to collect business model and which have cash flows that meet the “solely payments of principal and interest” (SPPI) criteria.
At initial recognition, trade receivables that do not have a significant financing component, are recognised at their transaction price. Other financial assets are initially recognised at fair value plus related transaction costs; they are subsequently measured at amortised cost using the effective interest method. Any gain or loss on derecognition or modification of a financial asset held at amortised cost is recognised in the income statement.
(b) Financial assets held at fair value through other comprehensive income (FVOCI)
This classification applies to the following financial assets: – Debt instruments that are held under a business model where they
are held for the collection of contractual cash flows and also for sale (“collect and sell”) and which have cash flows that meet the SPPI criteria. An example would be where trade receivable invoices for certain customers were factored from time to time. All movements in the fair value of these financial assets are taken through other comprehensive income, except for the recognition of impairment gains or losses, interest revenue (including transaction costs by applying the effective interest method), gains or losses arising on derecognition and foreign exchange gains and losses which are recognised in the income statement. When the financial asset is derecognised, the cumulative fair value gain or loss previously recognised in other comprehensive income is reclassified to the income statement.
– Equity investments where the Group has irrevocably elected to present fair value gains and losses on revaluation in other comprehensive income. The election can be made for each individual investment; however, it is not applicable to equity investments held for trading.Fair value gains or losses on revaluation of such equity investments, including any foreign exchange component, are recognised in other comprehensive income. When the equity investment is derecognised, there is no reclassification of fair value gains or losses previously recognised in other comprehensive income to the income statement. Dividends are recognised in the income statement when the right to receive payment is established.
(c) Financial assets held at fair value through profit or loss (FVPL)This classification applies to the following financial assets. In all cases, transaction costs are immediately expensed to the income statement. – Debt instruments that do not meet the criteria of amortised cost or fair
value through other comprehensive income. The Group has a significant proportion of trade receivables with embedded derivatives for provisional pricing. These receivables are generally held to collect but do not meet the SPPI criteria and as a result must be held at FVPL. Subsequent fair value gains or losses are taken to the income statement.
– Equity investments which are held for trading or where the FVOCI election has not been applied. All fair value gains or losses and related dividend income are recognised in the income statement.
– Derivatives which are not designated as a hedging instrument. All subsequent fair value gains or losses are recognised in the income statement.
(ii) Financial liabilitiesBorrowings and other financial liabilities (including trade payables but excluding derivative liabilities) are recognised initially at fair value, net of transaction costs incurred, and are subsequently measured at amortised cost.
The Group participates in supply chain finance arrangements whereby vendors may elect to receive early payment of their invoice from a bank by factoring their receivable from Rio Tinto. These arrangements do not modify the terms of the original liability, and therefore financial liabilities subject to supply chain finance continue to be classified as trade payables.
(iii) Impairment of financial assetsA forward-looking expected credit loss (ECL) review is required for: debt instruments measured at amortised cost or held at fair value through other comprehensive income; loan commitments and financial guarantees not measured at fair value through profit or loss; lease receivables and trade receivables that give rise to an unconditional right to consideration.
As permitted by IFRS 9, the Group applies the “simplified approach” to trade receivable balances and the “general approach” to all other financial assets. The general approach incorporates a review for any significant increase in counterparty credit risk since inception. The ECL reviews include assumptions about the risk of default and expected loss rates. For trade receivables, the assessment takes into account the use of credit enhancements, for example, letters of credit. Impairments for undrawn loan commitments are reflected as a provision.
(iv) Derivatives and hedge accountingThe Group applies the hedge accounting requirements under IFRS 9 and its hedging activities are discussed in note 30 with movements on hedging reserves disclosed in note 29. Where applicable, the Group may defer the costs of hedging including currency basis spreads, forward points and the time value of options.
(q) Share-based payments (note 43)The fair value of the Group’s share plans is recognised as an expense over the expected vesting period with an offset to retained earnings for Rio Tinto plc plans and to other reserves for Rio Tinto Limited plans.
The Group uses fair values provided by independent actuaries calculated using either a lattice-based option valuation model or a Monte Carlo simulation model.
Annual report 2018 | riotinto.com 161
Financial statements

Financial statements
Notes to the 2018 financial statements continued
1 Principal accounting policies continuedThe terms of each plan are considered at the balance sheet date to determine whether the plan should be accounted for as equity-settled or cash-settled. The Group does not operate any plans as cash-settled. However, the Performance Share Plan can, at the discretion of the directors, offer employees an equivalent amount in cash. This is not standard practice. In some jurisdictions, employees are granted cash-settled awards where equity-settled awards are prohibited by local laws and regulations. The value of these awards is immaterial.
The Group’s equity-settled share plans are settled either by: the issuance of shares by the relevant parent company; the purchase of shares on market; or the use of shares held in treasury which were previously acquired as part of a share buy-back. If the cost of shares acquired to satisfy the plans differs from the expense charged, the difference is taken to retained earnings or other reserves, as appropriate.
(r) Share capital (notes 27 and 28)Ordinary shares are classified as equity. Incremental costs directly attributable to the issuance of new shares are shown in equity as a deduction, net of tax, from the proceeds.
Where any Group company purchases the Group’s equity share capital (treasury shares), the consideration paid, including any directly attributable incremental costs (net of income taxes) is deducted from equity attributable to owners of Rio Tinto. Where such shares are subsequently reissued, any consideration received, net of any directly attributable incremental costs and the related income tax effects, is included in equity attributable to owners of Rio Tinto. If purchased Rio Tinto plc shares are cancelled, an amount equal to the nominal value of the cancelled share is credited to the capital redemption reserve.
(s) Segment reporting (notes 2 and 3)Operating segments are reported in a manner consistent with the internal reporting provided to the chief operating decision maker (CODM). The Group considers that Rio Tinto’s chief executive is the CODM, who is responsible for allocating resources and assessing performance of the operating segments.
Critical accounting policies and estimates(i) Determination of CGUs, assessment of indicators of impairment, review of asset carrying values, impairment charges and reversals and the recoverability of goodwill (notes 6, 12 and 13)Impairment is assessed at the CGU level. A CGU is the smallest identifiable asset or group of assets that generates independent cash inflows. Judgment is applied to identify the Group’s CGUs, particularly when assets belong to integrated operations, and changes in CGUs could impact impairment charges and reversals. The most significant examples of this judgment are the grouping of the Weipa bauxite mine and the Gladstone alumina refineries (Yarwun and QAL) in Queensland, Australia and of Rio Tinto Fer et Titane in Quebec, Canada and QIT Madagascar Minerals (QMM) into combined CGUs on the basis that they are vertically integrated operations with no active market for either bauxite or ilmenite. Management reviews these judgments on an annual basis as part of the annual internal review of asset values as described in note (i) above.
External and internal factors are monitored for indicators of impairment and include an annual internal review of asset values as described in note (i) above. Judgment is required to determine whether the impact of adverse spot commodity price movements is significant and structural in nature. There were no material instances of this judgment as at 31 December 2018.
Generally, discounted cash flow models are used to determine the recoverable amount of CGUs. In this case, significant judgment is required to determine the appropriate estimates and assumptions used and there is significant estimation uncertainty. In particular, for fair value less costs of disposal valuations, judgment is required to determine the estimates a market participant would use. The discounted cash flow model is most sensitive to the following estimates: the timing of project expansions; the cost to complete asset construction; long-term commodity prices; production timing and recovery rates; exchange rates; operating costs; reserve estimates; closure costs and discount rates and, in some instances, the renewal of mining licences. Some of these variables are unique to an individual CGU. Future changes in these variables may differ from management’s expectations and may materially alter the recoverable amounts of the CGUs.
Note (i) above also describes the Group’s methodology for estimating long-term commodity prices, exchange rates and discount rates for impairment testing purposes. Note 6 outlines the significant judgments, assumptions and sensitivities made for both measuring the impairments recorded and for determining whether reversal of part or all of a previous impairment was appropriate. Judgments, assumptions and sensitivities in relation to the testing of CGUs containing goodwill and indefinite-lived intangible assets are outlined in notes 12 and 13 respectively.
(ii) Estimation of asset livesIntangible assets are considered to have indefinite lives (and therefore no related depreciation or amortisation charge) if, in the Group’s judgment, there is no foreseeable limit to the period over which the asset is expected to generate cash flows. Factors that are considered in making this judgment include the existence of contractual rights for unlimited terms or evidence that renewal of the contractual rights without significant incremental costs can be expected for indefinite periods into the future in view of the Group’s investment intentions.
The useful lives of the major assets of a CGU are often dependent on the life of the orebody to which they relate. The life of the orebody will be determined on the basis of the life-of-mine plan, which is based on the estimates of ore reserves as described on page 271.
(iii) Provision for onerous contractsProvision for an onerous contract is made only when the assets dedicated to that contract are fully impaired or the contract becomes stranded as a result of a business decision. Judgment is required in determining which assets are considered dedicated to a contract when there is optionality as to how the contract obligations can be settled. Key estimates are the cash flows associated with the contract and the discount rate assumption. The Group completed the disposal of its remaining coking coal assets in 2018 and has retained the onerous provisions made in past periods for rail infrastructure “take or pay” contracts which were considered stranded. Refer to note 37. As at 31 December 2018, the balance of the provision was US$324 million.
(iv) Close-down, restoration and environmental obligations (note 26)Provision is made for close-down, restoration and environmental costs when the obligation occurs, based on the net present value of estimated future costs required to satisfy the obligation. Management uses its judgment and experience to determine the potential scope of closure rehabilitation work required to meet the Group’s legal, statutory and constructive obligations, and any other commitments made to stakeholders, and the options and techniques available to meet those obligations and estimate the associated costs and the likely timing of those costs. Significant judgment is also required to determine both the costs associated with that work and the other assumptions used to calculate the provision. External experts support the cost estimation process where appropriate but there remains significant estimation uncertainty.
Annual report 2018 | riotinto.com162

Notes to the 2018 financial statements continued
The key judgment in applying this accounting policy is determining when an estimate is sufficiently reliable to make or adjust a closure provision.
Closure provisions are not made for those operations that have no known restrictions on their lives as the closure dates cannot be reliably estimated. This applies primarily to certain Canadian smelters which have indefinite-lived water rights or power agreements for renewably sourced power with local governments.
Cost estimates are updated throughout the life of the operation; generally cost estimates must comply with the Group’s Capital Project Framework once the operation is ten years from expected closure. This means, for example, that where an Order of Magnitude (OoM) study is required for closure it must be of the same standard as an OoM study for a new mine, smelter or refinery. As at 31 December 2018, there are 13 operations with remaining lives of under ten years before taking into account unapproved extensions; the largest of these is Rio Tinto Kennecott for which a pre-feasibility study is expected to be concluded in the next 24 months. Adjustments are made to provisions when the range of possible outcomes becomes sufficiently narrow to permit reliable estimation. Depending on the materiality of the change, adjustments may require review and endorsement by the Group’s Closure Steering Committee before the provision is updated.
In some cases, the closure study may indicate that monitoring and, potentially, remediation will be required in perpetuity. In this case, the provision may be restricted to a period for which the costs can be reliably estimated; on average this is around 30 years for operations in closure.
The most significant assumptions and estimates used in calculating the provision are: – Timeframes. The weighted average remaining lives of operations is shown
in note 26(c). Some expenditure may be incurred before closure whilst the operation as a whole is in production. The length of any post-closure monitoring period will depend on the specific site requirements; some expenditure can continue into perpetuity.
– The probability weighting of possible closure scenarios. The most significant impact of probability weighting is at the Pilbara operations (Iron Ore) relating to infrastructure and incorporates the possibility that some infrastructure may be retained by the relevant State authorities post-closure. The assignment of probabilities to this scenario reduces the closure provision by US$0.8 billion.
– Appropriate sources on which to base the calculation of the risk-free discount rate. At 31 December 2018 the carrying value of the close-down, restoration and environmental provision was US$9,975 million. The change in carrying value of the provision which would result if the real discount rate was 0.5% lower than that assumed by management is shown in note 26.
There is significant estimation uncertainty in the calculation of the provision and cost estimates can vary in response to many factors including: – Changes to the relevant legal or local/national government requirements
and any other commitments made to stakeholders – Review of remediation and relinquishment options – Additional remediation requirements identified during the rehabilitation – The emergence of new restoration techniques – Change in the expected closure date – Change in the discount rate – The effects of inflation
Experience gained at other mine or production sites may also change expected methods or costs of closure, although elements of the restoration and rehabilitation of each site are relatively unique to a site. Generally, there is relatively limited restoration and rehabilitation activity and historical precedent elsewhere in the Group, or in the industry as a whole, against which to benchmark cost estimates.
The expected timing of expenditure can also change for other reasons, for example because of changes to expectations around ore reserves and mineral resources, production rates, renewal of operating licences or economic conditions.
As noted in note (k) above, changes in closure and restoration provisions for ongoing operations (other than the impact relating to current year production) are capitalised and therefore will impact assets and liabilities but have no impact on equity at the time the change is made. However, these changes will impact depreciation and the unwind of discount in future years. Changes in closure estimates at the Group’s ongoing operations could result in a material adjustment to assets and liabilities in the next 12 months.
Changes to closure cost estimates for closed operations, and changes to environmental cost estimates at any operation, would impact equity; however, the Group does not consider that there is significant risk of a change in estimates for these liabilities causing a material adjustment to equity in the next 12 months. Any new environmental incidents may require a material provision but cannot be predicted.
Cash flow estimates must be discounted at the risk-free interest rate if this has a material effect on the provision. The selection of appropriate sources on which to base the calculation of the risk-free discount rate requires judgment. The 2% real rate currently used by the Group is based on a number of inputs including observable historic yields on 30 year US Treasury Inflation Protected Securities (TIPS), and recommendations by independent valuation experts.
(v) Deferral of stripping costs (note 14)Stripping of waste materials takes place throughout the production phase of a surface mine or pit. The identification of components within a mine and of the life of component strip ratios requires judgment and is dependent on an individual mine’s design and the estimates inherent within that. Changes to that design may introduce new components and/or change the life of component strip ratios. Changes in other technical or economic parameters that impact ore reserves may also have an impact on the life of component strip ratios, even if they do not affect the mine’s design. Changes to the life of component strip ratios are accounted for prospectively.
The Group’s judgment as to whether multiple pit mines are considered separate or integrated operations determines whether initial stripping of a pit is deemed to be pre-production or production phase stripping and, therefore, the amortisation base for those costs. The analysis depends on each mine’s specific circumstances and requires judgment: another mining company could make a different judgment even when the fact pattern appears to be similar.
(vi) Uncertain tax positionsThe Group operates across a large number of jurisdictions and is subject to periodic challenges by local tax authorities on a range of tax matters during the normal course of business, including transfer pricing, indirect taxes and transaction-related issues. Where the amount of tax payable or recoverable is uncertain, the Group establishes provisions based on the Group’s interpretation of tax law and judgment of the most likely amount of the liability, or recovery. An alternative approach under current standards is to use a weighted average of various possible scenarios. The weighted average approach is required under IFRIC 23 “Uncertainty over Income Tax Treatments” which is mandatory in 2019 although for issues with a binary outcome, the most likely amount method can continue to be applied. The impact on the Group of implementing IFRIC 23 is currently expected to be immaterial as noted on page 150.
Annual report 2018 | riotinto.com 163
Financial statements

Financial statements
Notes to the 2018 financial statements continued
1 Principal accounting policies continued(vii) Recoverability of potential deferred tax assets (note 17)The Group has tax losses, and other deductible temporary differences, mainly in Australian, Canadian, French, US and Mongolian taxable entities, that have the potential to reduce tax payments in future years. Deferred tax assets have been recognised to the extent that their recovery is probable, having regard to the availability of sufficient taxable temporary differences relating to the same taxation authority and the same taxable entity, the estimates of projected future taxable income of these taxable entities and after taking account of specific risk factors that are expected to affect the recovery of these assets including the risk of expiry of losses. Further information on deferred tax assets is given in note 17.
In addition to the risk of expiry of losses the projections on which recovery of tax losses are based are subject to the same estimation uncertainty as noted in (i) above in relation to impairment. The key judgment in the application of this accounting policy is the recognition of deferred tax assets for losses where the operation is not currently profitable for tax purposes.
(viii) Identification of functional currenciesThe functional currency for each subsidiary, unincorporated arrangement, joint operation and equity accounted unit, is the currency of the primary economic environment in which it operates. Determination of functional currency involves significant judgment and other companies may make different judgments based on similar facts. For many of Rio Tinto’s businesses, their functional currency is the currency of the country in which they operate. The Group reconsiders the functional currency of its businesses if there is a change in the underlying transactions, events or conditions which determine their primary economic environment.
The determination of functional currency is a key judgment which affects the measurement of non-current assets included in the balance sheet and, as a consequence, the amortisation of those assets included in the income statement. It also impacts exchange gains and losses included in the income statement and in equity. The Group applies judgment to determine whether or not certain intragroup loans are likely to be repaid in the foreseeable future and therefore whether the associated exchange gains and losses can be taken to equity. During 2018, A$14 billion of intragroup loans continued to meet these criteria and associated exchange gains were taken to equity.
(ix) Estimation of obligations for post-employment costs (note 44)The value of the Group’s obligations for post-employment benefits is dependent on the amount of benefits that are expected to be paid out, discounted to the balance sheet date. The discount rate is a key assumption and is based upon the yields on high-quality corporate bonds in the relevant currency which have durations consistent with the term of the obligations. The discount rate will vary from one period to another in line with movements in corporate bond yields, but at any given measurement date there is relatively little estimation uncertainty. This rate is also used to calculate the interest cost on obligations and interest income on plan assets.
The following key assumptions are used to calculate the estimated benefit: future pay increases to be received by members of final pay plans, the level of inflation (for those benefits that are subject to some form of inflation protection), current mortality rates and future improvements in mortality rates. The assumption regarding future inflation is based on market yields on inflation-linked instruments, where possible, combined with consensus views. The Group reviews the actual mortality rates of retirees in its major pension plans on a regular basis and uses these rates to set its current mortality assumptions. It also uses its judgment with respect to allowances for future improvements in longevity having regard to standard improvement scales in each relevant country and after taking external actuarial advice.
Most of the Group’s defined benefit pension plans are closed to new entrants and the majority of the obligations relate to former employees. The carrying value of the Group’s post-employment obligations is therefore less sensitive to assumptions about future salary increases than it is to assumptions regarding future inflation.
Details of the key assumptions, how they have moved since the previous balance sheet date and the sensitivity of the carrying value to changes in the assumptions are set out in note 44.
(x) Contingencies (note 31)Disclosure is made of material contingent liabilities unless the possibility of any loss arising is considered remote based on the Group’s judgment and legal advice. Contingent liabilities are quantified unless, in the Group’s judgment, the amount cannot be reliably estimated.
(xi) Basis of consolidation (notes 33 to 36)Judgment is sometimes required to determine whether after considering all relevant factors, the Group has control, joint control or significant influence over an entity or arrangement. Other companies may make different judgments regarding the same entity or arrangement. Significant influence includes situations of collective control (see note 36(a)).
(xii) Exclusions from underlying earnings (note 2) As set out in note 2, certain items are excluded from net earnings/(loss) in arriving at underlying earnings in each period irrespective of materiality. In addition, there is a final judgmental category which includes, where applicable, other credits and charges that, individually or in aggregate if of a similar type, are of a nature or size to require exclusion in order to provide additional insight into underlying business performance.
The exclusion of the impact of changes in closure estimates at Argyle and ERA, the operating assets of each having previously been fully impaired, and a gain relating to the lease and sale of surplus land at Kitimat were the only judgments in this respect in 2018.
(xiii) Pilbara Iron arrangementsThe arrangements described in note 34(c) to the accounts permit each of the partners to the joint operation to request the other to construct assets on their tenure to widen the capacity of the network. The requesting partner’s (Asset User’s) share of the capacity of the network will increase by the capacity of the newly constructed asset but, generally, that capacity may be provided from any of the network assets. The Asset User will pay an annual charge (Committed Use Charge – “CUC”) over a contractually specified period irrespective of usage of the network. The constructing partner (Asset Owner) has an ongoing obligation to make available capacity from those assets and to maintain the assets in good working order as required under relevant State Agreements and associated tenure.
The Group considered whether the CUC arrangements give rise to a lease between the Asset Owner and the Asset User under the current lease accounting standards IAS 17 “Leases” and IFRIC 4 “Determining whether an arrangement contains a lease”. The conclusion that they do not is because there is no specified asset, rather the Asset User has a first priority right to the capacity in the CUC asset. This treatment has been grandfathered on adoption of IFRS 16. Management considers that these arrangements are unique and has used judgement to apply the principles of IFRS to the accounting for the arrangements as described above. The obligation of the Asset Owner to make capacity available is fulfilled over time and not at a point in time. The CUC arrangement is therefore an executory contract as defined under IAS 37 “Provisions, contingent liabilities and contingent assets” whereby neither party has performed any of its obligations, or both parties have partially performed their obligations to an equal extent, and so the CUC payments are expensed as incurred. An alternative treatment would have resulted in a gross presentation in the Group’s balance sheet with an asset and a corresponding liability to reflect the present value of the CUC payments. The Asset User is a wholly owned subsidiary of Rio Tinto, whereas the Asset Owner is a joint operation. This impact would be some US$2 billion (calculated on the basis of grossing up the written down value of the CUC assets). Other methods of calculating the gross up might give rise to different numbers.
Annual report 2018 | riotinto.com164

Notes to the 2018 financial statements continued
2 Operating segments Rio Tinto’s management structure is based on the principal product groups in the tables below together with the global functions that support the business, which include Growth & Innovation. The chief executive of each product group reports to the chief executive of Rio Tinto. The chief executive of Rio Tinto monitors the performance of each product group based on a number of measures, including underlying earnings, underlying EBITDA, capital expenditure, operating cash flow and free cash flow. Finance costs and net debt are managed on a Group basis.
Generally, business units are allocated to product groups based on their primary product. The Energy & Minerals product group includes businesses with products such as uranium, borates, salt and titanium dioxide feedstock together with coal operations (prior to the divestment of these assets), Iron Ore Company of Canada and the Simandou iron ore project, which is the responsibility of the Energy & Minerals product group chief executive. The Copper & Diamonds product group also produces gold, silver, molybdenum and other by-products.
The financial information by business unit provided on pages 249 to 251 of these financial statements provides additional voluntary disclosure which the Group considers useful to the users of the financial statements.
Gross sales revenue2018
US$m2017
US$m2016
US$m
Iron Ore 18,485 18,251 14,605
Aluminium 12,191 11,005 9,458
Copper & Diamonds 6,468 4,842 4,524
Energy & Minerals 5,697 7,764 6,734
Other Operations 9 10 8
Reportable segments total 42,850 41,872 35,329
Inter-segment transactions (15) (15) (11)
Product group total 42,835 41,857 35,318
Items excluded from underlying earnings – 10 18
Gross sales revenue 42,835 41,867 35,336
Share of equity accounted unit sales and adjustments for intra-subsidiary/equity accounted units sales (2,313) (1,837) (1,555)
Consolidated sales revenue per income statement 40,522 40,030 33,781
Gross sales revenue includes the Group’s proportionate share of sales revenue of equity accounted units (after adjusting for sales to subsidiaries) of US$2,354 million (2017: US$1,859 million; 2016: US$1,585 million) which are not included in consolidated sales revenue. Consolidated sales revenue includes subsidiary sales of US$41 million (2017: US$22 million; 2016: US$30 million) to equity accounted units which are not included in gross sales revenue.
Capital expenditure2018
US$m2017
US$m2016
US$m
Iron Ore 1,288 1,201 868
Aluminium 1,373 1,436 916
Copper & Diamonds 2,150 1,622 1,441
Energy & Minerals 456 467 141
Other Operations 12 (35) (11)
Reportable segments total 5,279 4,691 3,355
Other items 65 70 (46)
Less: capital expenditure of equity accounted units (500) (417) (651)
Capital expenditure per financial information by business unit 4,844 4,344 2,658
Add back: proceeds from disposal of property, plant and equipment 586 138 354
Capital expenditure per cash flow statement 5,430 4,482 3,012
Capital expenditure for reportable segments comprises the net cash outflow on purchases less disposals of property, plant and equipment, capitalised evaluation costs and purchases less disposals of other intangible assets. The details provided include 100% of subsidiaries’ capital expenditure and Rio Tinto’s share of the capital expenditure of joint operations and equity accounted units.
Depreciation and amortisation2018
US$m2017
US$m2016
US$m
Iron Ore 1,682 1,645 1,645
Aluminium 1,122 1,199 1,250
Copper & Diamonds 1,317 1,452 1,601
Energy & Minerals 475 652 739
Other Operations 26 32 34
Reportable segments total 4,622 4,980 5,269
Other items 43 42 51
Less: depreciation and amortisation of equity accounted units (650) (647) (526)
Depreciation and amortisation per note 4 4,015 4,375 4,794
Annual report 2018 | riotinto.com 165
Financial statements

Financial statements
Notes to the 2018 financial statements continued
2 Operating segments continuedProduct group depreciation and amortisation for reportable segments totals include 100% of subsidiaries’ depreciation and amortisation and Rio Tinto’s share of the depreciation and amortisation of equity accounted units. Rio Tinto’s share of the depreciation and amortisation charge of equity accounted units is deducted to arrive at depreciation and amortisation, excluding equity accounted units, as shown in note 4. These figures exclude impairment charges and reversals, which are excluded from underlying earnings.
Tax charge/(credit)2018
US$m2017
US$m2016
US$m
Iron Ore 2,819 2,871 2,005
Aluminium 532 543 171
Copper & Diamonds 118 48 (320)
Energy & Minerals 511 652 331
Other Operations (51) (84) (73)
Reportable segments total 3,929 4,030 2,114
Other items (276) (261) (191)
Exploration and evaluation not attributed to product groups (38) (36) (27)
Net finance costs (174) (364) (484)
3,441 3,369 1,412
Tax charge excluded from underlying earnings 801 596 155
Tax charge per income statement 4,242 3,965 1,567
Tax charge/(credit) excludes amounts relating to equity accounted units. Further information on the tax charge/(credit) excluded from underlying earnings is provided in the section “Underlying earnings”, below.
Underlying EBITDA2018
US$m2017
US$m2016
US$m
Iron Ore 11,325 11,520 8,526
Aluminium 3,095 3,423 2,472
Copper & Diamonds 2,776 1,904 1,387
Energy & Minerals 2,193 2,803 1,806
Other Operations (70) (116) (95)
Reportable segments total 19,319 19,534 14,096
Central pension costs, share-based payments and insurance (128) (68) (34)
Restructuring, project and one-off costs (272) (177) (13)
Central costs (552) (491) (364)
Exploration and evaluation not attributed to product groups (231) (218) (175)
Underlying EBITDA 18,136 18,580 13,510
Items excluded from underlying EBITDA 5,127 1,912 (687)
EBITDA 23,263 20,492 12,823
Depreciation, amortisation and impairment charges in subsidiaries and equity accounted units (4,691) (5,746) (5,466)
Taxation and finance items in equity accounted units (372) (272) (241)
Profit on ordinary activities before finance items and tax 18,200 14,474 7,116
Underlying earnings2018
US$m2017
US$m2016
US$m
Iron Ore 6,514 6,692 4,611
Aluminium 1,347 1,583 947
Copper & Diamonds 1,054 263 (18)
Energy & Minerals 1,012 1,242 612
Other Operations (102) (138) (88)
Reportable segments total 9,825 9,642 6,064
Central pension costs, share-based payments and insurance (90) (48) (24)
Restructuring, project and one-off costs (190) (124) (9)
Central costs (410) (311) (208)
Exploration and evaluation not attributed to product groups (193) (178) (147)
Net finance costs (134) (354) (576)
Underlying earnings 8,808 8,627 5,100
Items excluded from underlying earnings 4,830 135 (483)
Net earnings attributable to owners of Rio Tinto per income statement 13,638 8,762 4,617
Annual report 2018 | riotinto.com166

Notes to the 2018 financial statements continued
Underlying EBITDA and underlying earnings are reported by Rio Tinto to provide greater understanding of the underlying business performance of its operations and to enhance comparability of reporting periods.
The measures of underlying EBITDA and underlying earnings, in conjunction with net cash generated from operating activities and capital expenditure (net of proceeds on disposals), are used by the chief executive of Rio Tinto to assess the performance of the product groups. Underlying earnings and net earnings both represent amounts net of tax attributable to owners of Rio Tinto.
The following items are excluded from net earnings in arriving at underlying earnings in each period irrespective of materiality: – Net gains/(losses) on disposal of interests in businesses. – Impairment charges and reversals. – Profit/(loss) after tax from discontinued operations. – Exchange and derivative gains and losses. This exclusion includes exchange gains/(losses) on US dollar net debt and intragroup balances, unrealised
gains/(losses) on currency and interest rate derivatives not qualifying for hedge accounting, unrealised gains/(losses) on certain commodity derivatives not qualifying for hedge accounting, and unrealised gains/(losses) on embedded derivatives not qualifying for hedge accounting.
In addition, there is a final judgmental category which includes, where applicable, other credits and charges that, individually or in aggregate if of a similar type, are of a nature or size to require exclusion in order to provide additional insight into underlying business performance.
Underlying EBITDA excludes the EBITDA impact of the same items that are excluded from underlying earnings.
Product group earnings include earnings of subsidiaries and the Group’s share of the underlying earnings of equity accounted units stated before finance items but after the amortisation of discount on provisions.
Rio Tinto’s share of the underlying earnings of equity accounted units amounted to US$513 million in 2018 (2017: US$332 million; 2016: US$309 million). This amount is attributable as follows: US$476 million profit to the Copper & Diamonds product group and US$38 million profit to other product groups (2017: US$295 million profit to the Copper & Diamonds product group and US$37 million profit to other product groups; 2016: US$272 million profit to the Copper & Diamonds product group and US$37 million profit to other product groups). These amounts are included in underlying earnings and include the underlying earnings of the Group’s tolling entities which process alumina. Tolling entities recharge the majority of their costs and generally have minimal earnings.
Reconciliation of net earnings/(losses) to underlying earnings
Exclusions from underlying earnings
Pre-tax(m)
2018US$m
Taxation 2018
US$m
Non-controllinginterests
2018US$m
Netamount
2018US$m
Net amount
2017 US$m
Net amount
2016 US$m
Impairment charges (note 6) (132) 25 3 (104) (481) (183)
Net gains on consolidation and disposal of interests in businesses(a) 4,622 (626) – 3,996 2,022 382
Exchange and derivative gains/(losses):
– Exchange gains/(losses) on US dollar net debt, intragroup balances and derivatives(b) 694 (136) (8) 550 (488) 516
– (Losses)/gains on currency and interest rate derivatives not qualifying for hedge accounting(c) (59) 11 – (48) 30 (12)
– Gains/(losses) on embedded commodity derivatives not qualifying for hedge accounting(d) 288 (83) (3) 202 (352) 32
Losses from increases to closure estimates (non-operating and fully impaired sites)(e) (376) 41 – (335) – (282)
Gain relating to surplus land at Kitimat(f) 602 (33) – 569 – –
Changes in corporate tax rates in the US and France(g) – – – – (439) –
Onerous port and rail contracts(h) – – – – – (329)
Restructuring costs and global headcount reductions – – – – – (177)
Rio Tinto Kennecott insurance settlement(i) – – – – 45 –
Tax provision(j) – – – – – (380)
Tax charge relating to expected divestments(k) – – – – (202) –
Other exclusions(l) – – – – – (50)
Total excluded from underlying earnings 5,639 (801) (8) 4,830 135 (483)
Net earnings 18,167 (4,242) (287) 13,638 8,762 4,617
Underlying earnings 12,528 (3,441) (279) 8,808 8,627 5,100
Annual report 2018 | riotinto.com 167
Financial statements

Financial statements
Notes to the 2018 financial statements continued
2 Operating segments continued
(a) On 10 May 2018, Rio Tinto and Alcoa announced they had launched a new joint venture, Elysis, to develop and commercialise a carbon-free aluminium smelting process. Rio Tinto’s interest in the joint venture has been accounted for using the equity method. The patents contributed and intellectual property licensed to the arrangement by Rio Tinto had no carrying value, and therefore a gain has been recognised for the fair value uplift on formation of the arrangement. This gain has been reduced so that it only represents the proportion contributed by outside shareholders, resulting in a pre-tax gain of US$171 million (US$141 million after tax). On 1 August 2018, a pre-tax gain of US$1,141 million (US$836 million after tax) was recognised on the sale of the Hail Creek coal mine and a pre-tax gain of US$1,010 million (US$724 million after tax) was recognised on the sale of the Kestrel underground coal mine. On 14 December 2018, a pre-tax gain of US$128 million (US$122 million after tax) was recognised on the sale of the Dunkerque aluminium smelter. On 21 December 2018, a pre-tax gain of US$2,146 million was recognised on the sale of Grasberg. No tax is payable on this gain. Amounts relating to the sale of undeveloped properties, Winchester South and Valeria, are included within underlying earnings. In 2017, the net gain related mainly to the sale of Coal & Allied Industries Limited, which completed on 1 September 2017. In 2016, the net gain related mainly to the sale of Rio Tinto’s 40% interest in the Bengalla Joint Venture on 1 March 2016 and the sale of the Lochaber assets in Scotland on 23 November 2016. This was partially offset by a loss on disposal of the 100% interest in Carbone Savoie on 31 March 2016.
(b) Exchange gains/(losses) on external US dollar net debt and intragroup balances comprise of post-tax foreign exchange losses on US dollar denominated net debt in non-US dollar functional currency companies of US$386 million loss and post-tax gains of US$936 million on intragroup balances, primarily as a result of the Australian and Canadian dollars both weakening against the US dollar. Net exchange gains in 2017 comprise post-tax foreign exchange gains of US$420 million on US dollar denominated net debt, and US$908 million losses on intragroup balances. Net exchange gains in 2016 comprise post-tax foreign exchange gains of US$123 million on external US dollar denominated net debt, and US$393 million gains on intragroup balances, mainly as the Canadian dollar strengthened against the US dollar.
(c) Valuation changes on currency and interest rate derivatives, which are ineligible for hedge accounting, other than those embedded in commercial contracts, and the currency revaluation of embedded US dollar derivatives contained in contracts held by entities whose functional currency is not the US dollar.
(d) Valuation changes on derivatives, embedded in commercial contracts, that are ineligible for hedge accounting, but for which there will be an offsetting change in future Group earnings. From 1 January 2018, all mark-to-market movements on commodity derivatives entered into with the commercial objective of achieving spot pricing for the underlying transaction at the date of settlement are now included within underlying earnings. In 2017 and previous years, valuation changes on this type of commodity derivative were excluded from underlying earnings. The impact of this change on the reported comparatives is insignificant, and therefore the comparatives have not been restated.
(e) The pre-feasibility study for the Argyle mine closure was completed in late 2018, resulting in an increase to the closure provision. As the assets at Argyle have been fully impaired, this increase has not been capitalised and has instead been recognised in the income statement. The impairment charge in respect of Argyle recognised in 2017 (see note 6) was based on preliminary findings from the pre-feasibility study. On this basis, the charge arising from the finalisation of this study in 2018 of US$134 million (US$93 million after tax) has been excluded from underlying earnings. On 6 December 2018, Energy Resources of Australia (ERA) (68% owned by Rio Tinto and listed on the Australian Stock Exchange) announced a likely increase to its closure provision of A$296 million pending finalisation of the Ranger Project Area closure feasibility study. The final assessment has indicated an increase equivalent to US$242 million. As the assets of ERA have been fully impaired, this increase has not been capitalised and has instead been recognised in the income statement. There is no tax impact in respect of this item. In 2016, the closure provision for non-operating and legacy operations increased mainly due to the Gove alumina refinery in Northern Territory, Australia where operations have been curtailed since May 2014. The provision was updated based on the cost estimates from the studies. Future revisions to the closure cost estimate during the study periods (including the next stage of feasibility study) will continue to be excluded from underlying earnings as the site operating assets have been fully impaired.
(f) In November 2018, Rio Tinto completed the lease and sale of a wharf and land in Kitimat. This resulted in a pre-tax gain of US$549 million on disposal of Property, plant and equipment and Other income of US$53 million (total impact of US$569 million after tax). This has been excluded from underlying earnings on the grounds of materiality.
(g) In 2017, deferred tax assets were remeasured to reflect lower corporate income tax rates in the US and France as a result of tax legislation changes substantively enacted in December 2017.(h) In 2016, a review of the infrastructure capacity requirements in Queensland, Australia, confirmed that it was no longer likely that Rio Tinto would utilise the Abbot Point Coal Terminal and associated
rail infrastructure capacity contracted under take or pay arrangements, and agreement was reached with Adani, the owner of the port, to relinquish that capacity. Accordingly, an onerous contract provision was recognised based on the net present value of expected future cash flows for the port and rail capacity discounted at a post-tax real rate of 2%, resulting in a post-tax onerous contract charge of US$329 million.
(i) In 2017, Rio Tinto received the final settlement on the insurance claims related to the 2013 slide at Rio Tinto Kennecott’s Bingham Canyon mine. The amounts excluded from underlying earnings were consistent with the previous excluded losses to which they related, in line with the treatment of the 2013 and 2015 settlement payments.
( j) Tax provision includes amounts provided for specific tax matters for which the timing of resolution and potential economic outflow are uncertain. During 2016, provision was made in relation to matters under discussion with the Australian Taxation Office (ATO) in relation to the transfer pricing of certain transactions between Rio Tinto entities based in Australia and the Group’s commercial centre in Singapore for the period since 2009.
(k) In 2017, deferred tax assets were derecognised as a result of revised profit forecasts in France due to the expected divestments of Dunkerque and ISAL. The Dunkerque divestment completed in 2018.(l) Other credits and charges that, individually, or in aggregate if of similar type, are of a nature or size to require exclusion in order to provide additional insight into underlying business performance.
In 2016, other exclusions included costs related to multiple transformation projects and the recuperation of capital losses against capital gains on divestment. (m) Exclusions from underlying earnings relating to equity accounted units are stated after tax and are included in the column “Pre-tax”.
Annual report 2018 | riotinto.com168

Notes to the 2018 financial statements continued
3 Operating segments – additional informationConsolidated sales revenue by destination(a)
2018%
2017%
2016%
2018US$m
2017US$m
2016US$m
China 44.6 44.2 43.6 18,061 17,706 14,742
Asia (excluding China and Japan) 11.5 12.8 13.9 4,665 5,108 4,692
United States of America 15.5 14.3 13.9 6,278 5,716 4,709
Japan 9.6 11.7 11.3 3,873 4,701 3,809
Europe (excluding UK) 9.1 7.5 7.6 3,706 3,015 2,579
Canada 3.2 2.8 3.0 1,340 1,111 1,024
Australia 1.8 1.8 2.0 720 710 675
UK 1.0 1.1 1.2 386 449 391
Other countries 3.7 3.8 3.5 1,493 1,514 1,160
Consolidated sales revenue 100.0 100.0 100.0 40,522 40,030 33,781
(a) Consolidated sales revenue by geographical destination is based on the ultimate country of destination of the product, if known. If the eventual destination of the product sold through traders is not known then revenue is allocated to the location of the product at the time when control is transferred. Rio Tinto is domiciled in both the UK and Australia.
Consolidated sales revenue by productConsolidated sales revenues of the Group are derived from the following products sold to external customers:
Revenue from contracts with
customers2018
US$m
Otherrevenue(a)
2018 US$m
Consolidated sales revenue
2018US$m
Consolidated sales revenue
2017US$m
Consolidated sales revenue
2016US$m
Iron ore 19,888 (21) 19,867 20,010 15,855
Aluminium 12,041 (22) 12,019 10,864 9,342
Copper 2,420 (32) 2,388 1,760 1,609
Coal 986 3 989 2,822 2,567
Industrial minerals 2,093 – 2,093 2,060 1,954
Gold 869 – 869 378 608
Diamonds 695 – 695 706 613
Other 1,602 – 1,602 1,430 1,233
Consolidated sales revenue 40,594 (72) 40,522 40,030 33,781
Share of equity accounted unit sales and intra-subsidiary/equity accounted unit sales 2,313 1,837 1,555
Gross sales revenue 42,835 41,867 35,336
(a) Certain of the Group’s products may be provisionally priced at the date revenue is recognised. The change in value of the provisionally priced receivables is based on relevant forward market prices and is included in “Other revenue” above. In prior periods there was no equivalent requirement under IAS 18 to separate out such provisional price movements and therefore this was not separately disclosed.
Annual report 2018 | riotinto.com 169
Financial statements
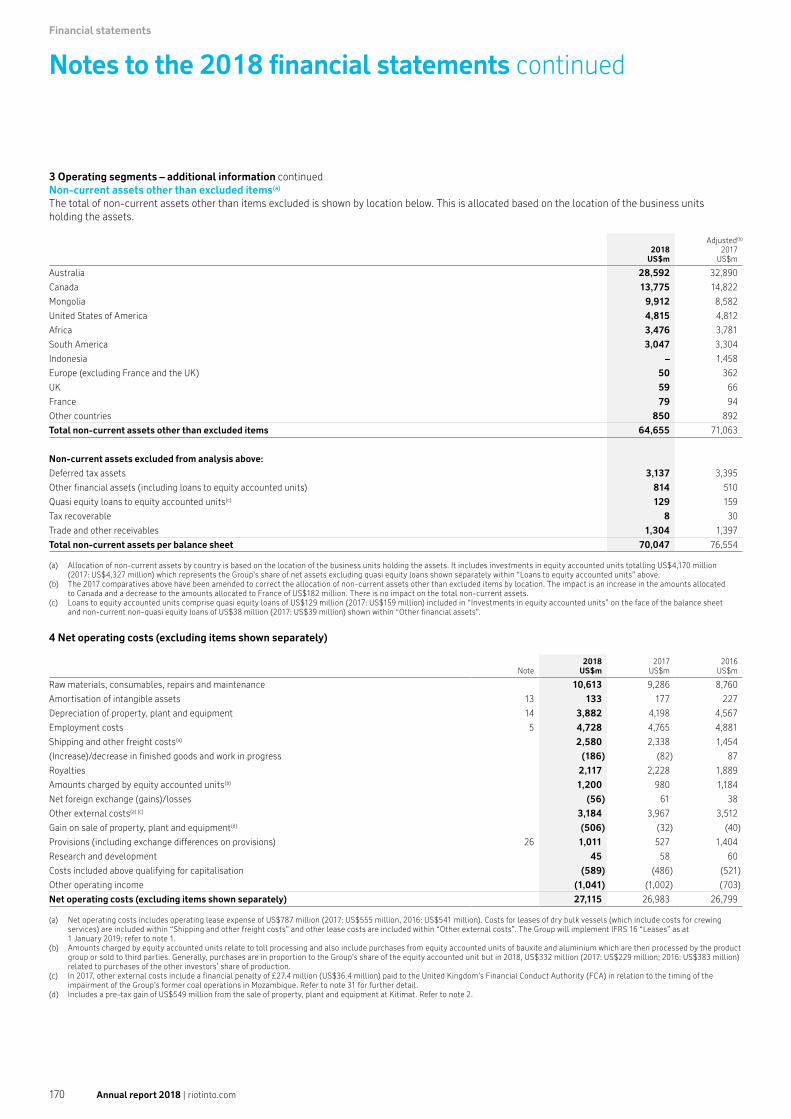
Financial statements
Notes to the 2018 financial statements continued
3 Operating segments – additional information continuedNon-current assets other than excluded items(a)
The total of non-current assets other than items excluded is shown by location below. This is allocated based on the location of the business units holding the assets.
2018 US$m
Adjusted(b)
2017US$m
Australia 28,592 32,890
Canada 13,775 14,822
Mongolia 9,912 8,582
United States of America 4,815 4,812
Africa 3,476 3,781
South America 3,047 3,304
Indonesia – 1,458
Europe (excluding France and the UK) 50 362
UK 59 66
France 79 94
Other countries 850 892
Total non-current assets other than excluded items 64,655 71,063
Non-current assets excluded from analysis above:
Deferred tax assets 3,137 3,395
Other financial assets (including loans to equity accounted units) 814 510
Quasi equity loans to equity accounted units(c) 129 159
Tax recoverable 8 30
Trade and other receivables 1,304 1,397
Total non-current assets per balance sheet 70,047 76,554
(a) Allocation of non-current assets by country is based on the location of the business units holding the assets. It includes investments in equity accounted units totalling US$4,170 million (2017: US$4,327 million) which represents the Group’s share of net assets excluding quasi equity loans shown separately within “Loans to equity accounted units” above.
(b) The 2017 comparatives above have been amended to correct the allocation of non-current assets other than excluded items by location. The impact is an increase in the amounts allocated to Canada and a decrease to the amounts allocated to France of US$182 million. There is no impact on the total non-current assets.
(c) Loans to equity accounted units comprise quasi equity loans of US$129 million (2017: US$159 million) included in “Investments in equity accounted units” on the face of the balance sheet and non-current non-quasi equity loans of US$38 million (2017: US$39 million) shown within “Other financial assets”.
4 Net operating costs (excluding items shown separately)
Note 2018US$m
2017US$m
2016US$m
Raw materials, consumables, repairs and maintenance 10,613 9,286 8,760
Amortisation of intangible assets 13 133 177 227
Depreciation of property, plant and equipment 14 3,882 4,198 4,567
Employment costs 5 4,728 4,765 4,881
Shipping and other freight costs(a) 2,580 2,338 1,454
(Increase)/decrease in finished goods and work in progress (186) (82) 87
Royalties 2,117 2,228 1,889
Amounts charged by equity accounted units(b) 1,200 980 1,184
Net foreign exchange (gains)/losses (56) 61 38
Other external costs(a) (c) 3,184 3,967 3,512
Gain on sale of property, plant and equipment(d) (506) (32) (40)
Provisions (including exchange differences on provisions) 26 1,011 527 1,404
Research and development 45 58 60
Costs included above qualifying for capitalisation (589) (486) (521)
Other operating income (1,041) (1,002) (703)
Net operating costs (excluding items shown separately) 27,115 26,983 26,799
(a) Net operating costs includes operating lease expense of US$787 million (2017: US$555 million, 2016: US$541 million). Costs for leases of dry bulk vessels (which include costs for crewing services) are included within “Shipping and other freight costs” and other lease costs are included within “Other external costs”. The Group will implement IFRS 16 “Leases” as at 1 January 2019; refer to note 1.
(b) Amounts charged by equity accounted units relate to toll processing and also include purchases from equity accounted units of bauxite and aluminium which are then processed by the product group or sold to third parties. Generally, purchases are in proportion to the Group’s share of the equity accounted unit but in 2018, US$332 million (2017: US$229 million; 2016: US$383 million) related to purchases of the other investors’ share of production.
(c) In 2017, other external costs include a financial penalty of £27.4 million (US$36.4 million) paid to the United Kingdom’s Financial Conduct Authority (FCA) in relation to the timing of the impairment of the Group’s former coal operations in Mozambique. Refer to note 31 for further detail.
(d) Includes a pre-tax gain of US$549 million from the sale of property, plant and equipment at Kitimat. Refer to note 2.
Annual report 2018 | riotinto.com170
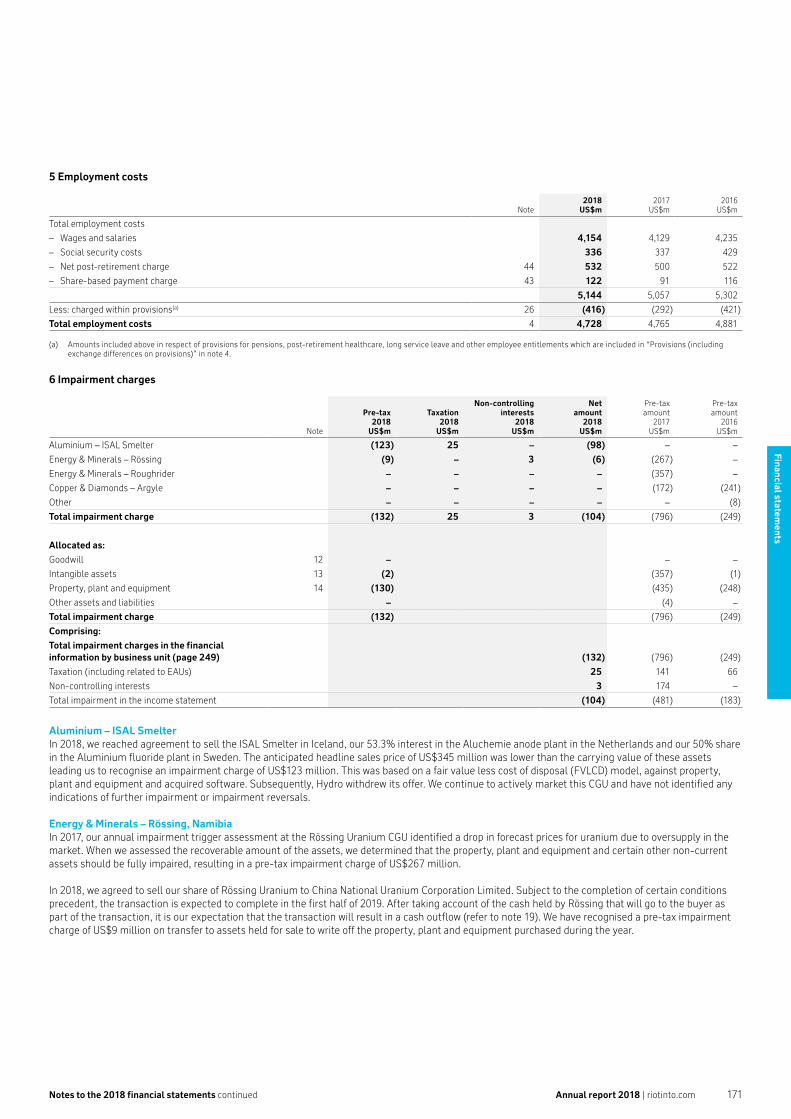
Notes to the 2018 financial statements continued
5 Employment costs
Note 2018US$m
2017US$m
2016US$m
Total employment costs
– Wages and salaries 4,154 4,129 4,235
– Social security costs 336 337 429
– Net post-retirement charge 44 532 500 522
– Share-based payment charge 43 122 91 116
5,144 5,057 5,302
Less: charged within provisions(a) 26 (416) (292) (421)
Total employment costs 4 4,728 4,765 4,881
(a) Amounts included above in respect of provisions for pensions, post-retirement healthcare, long service leave and other employee entitlements which are included in “Provisions (including exchange differences on provisions)” in note 4.
6 Impairment charges
Note
Pre-tax 2018
US$m
Taxation2018
US$m
Non-controllinginterests
2018US$m
Net amount
2018 US$m
Pre-taxamount
2017US$m
Pre-taxamount
2016US$m
Aluminium – ISAL Smelter (123) 25 – (98) – –
Energy & Minerals – Rössing (9) – 3 (6) (267) –
Energy & Minerals – Roughrider – – – – (357) –
Copper & Diamonds – Argyle – – – – (172) (241)
Other – – – – – (8)
Total impairment charge (132) 25 3 (104) (796) (249)
Allocated as:
Goodwill 12 – – –
Intangible assets 13 (2) (357) (1)
Property, plant and equipment 14 (130) (435) (248)
Other assets and liabilities – (4) –
Total impairment charge (132) (796) (249)
Comprising:
Total impairment charges in the financial information by business unit (page 249) (132) (796) (249)
Taxation (including related to EAUs) 25 141 66
Non-controlling interests 3 174 –
Total impairment in the income statement (104) (481) (183)
Aluminium – ISAL SmelterIn 2018, we reached agreement to sell the ISAL Smelter in Iceland, our 53.3% interest in the Aluchemie anode plant in the Netherlands and our 50% share in the Aluminium fluoride plant in Sweden. The anticipated headline sales price of US$345 million was lower than the carrying value of these assets leading us to recognise an impairment charge of US$123 million. This was based on a fair value less cost of disposal (FVLCD) model, against property, plant and equipment and acquired software. Subsequently, Hydro withdrew its offer. We continue to actively market this CGU and have not identified any indications of further impairment or impairment reversals.
Energy & Minerals – Rössing, NamibiaIn 2017, our annual impairment trigger assessment at the Rössing Uranium CGU identified a drop in forecast prices for uranium due to oversupply in the market. When we assessed the recoverable amount of the assets, we determined that the property, plant and equipment and certain other non-current assets should be fully impaired, resulting in a pre-tax impairment charge of US$267 million.
In 2018, we agreed to sell our share of Rössing Uranium to China National Uranium Corporation Limited. Subject to the completion of certain conditions precedent, the transaction is expected to complete in the first half of 2019. After taking account of the cash held by Rössing that will go to the buyer as part of the transaction, it is our expectation that the transaction will result in a cash outflow (refer to note 19). We have recognised a pre-tax impairment charge of US$9 million on transfer to assets held for sale to write off the property, plant and equipment purchased during the year.
Annual report 2018 | riotinto.com 171
Financial statements

Financial statements
Notes to the 2018 financial statements continued
6 Impairment charges continuedCopper & Diamonds – Argyle Diamond Mine, AustraliaIn 2016, our annual impairment trigger assessment at the Argyle CGU identified the impact of lower production volumes compared with forecast and lower prices achieved for bulk diamonds as impairment indicators. We calculated a recoverable amount for Argyle of US$191 million, resulting in a pre-tax impairment charge of US$241 million to property, plant and equipment and intangible assets.
In 2017, our annual impairment trigger assessment at the Argyle CGU identified impairment indicators because of lower production volumes compared with forecast, a smaller than expected contribution from productivity improvements and lower realised prices. In assessing the recoverable amount of the assets, we determined that the property, plant and equipment, including an updated closure asset, was fully impaired resulting in a pre-tax impairment charge of US$172 million. The impairment charge resulted in the recognition of deferred tax assets of US$34 million, which will be recovered by other business units in the same tax group.
Energy & Minerals – Roughrider, CanadaIn 2017, after reassessing our planned exploration spend, we decided not to plan or budget for evaluating the Roughrider deposit. We identified this as an impairment indicator under IFRS 6 and, due to uncertainty around whether there are viable quantities of uranium there, set a recoverable amount of US$nil for the evaluation and exploration assets. In light of this, we recorded an impairment charge of US$357 million to write off the mineral interests recognised when we acquired Roughrider.
Copper & Diamonds – Oyu Tolgoi, MongoliaAs noted in the Strategic report for Copper & Diamonds, the Group has observed a deterioration in some internal and external indicators of value for the Oyu Tolgoi CGU and has therefore prepared an assessment of recoverable amount.
The net present value of post-tax cash flows, based on the IAS 36 fair value less costs of disposal (FVLCD) methodology, for the Oyu Tolgoi CGU, discounted at 8% in real-terms, exceeds the carrying value by US$3.1 billion. As such, no impairment charge has been recognised. The recoverable amount incorporates a reduction in value of approximately US$1.1 billion, compared with the 2017 forecast, as a result of those changes to the project schedule, cost and scope, including the location of the power station, where the extent of those changes, and their value impacts, can be reasonably assessed at this time. This reduction was offset by value accretion of US$1.3 billion due to the annual unwind of the discount for the timing of expected cash inflows and inflation.
The individual assumptions subject to the most estimation uncertainty for the FVLCD calculation are the copper price and the discount rate. To illustrate these sensitivities, the valuation headroom would be eliminated by an increase to the discount rate of 1.9%, or a reduction of US$0.39 per pound to the forecast copper price throughout the life of mine, if all other inputs remained constant. In the long term, this price sensitivity is the equivalent to a 13% reduction in copper prices. These cash flows have been calculated in line with the accounting policy set out in note 1(i).
As set out in the Strategic report, in October 2018 we announced our annual reforecast of the development schedule which at that time suggested a nine-month delay in the schedule to sustainable production, primarily caused by delays in completing and equipping the primary production shaft and by some zones of variable rock strength that had been encountered. In December 2018, we announced the signing of the Power Source Framework Agreement, which sets out an amended timetable for Oyu Tolgoi to meet its obligation to source power domestically. These updates, together with an estimate of the financial impact of a potential further delay in the commissioning of the primary production shaft, have been reflected in the recoverable amount of the CGU as set out above.
Since then, our mine design teams have continued to work with the more comprehensive geotechnical data that has become available as the underground development continues, and it is clear that potentially significant changes to the design of some future elements of the development, and to the development schedule, will be needed, to allow for zones of particularly variable rock strength which have been encountered in the footprint of the mine. The detailed design work is under way, as is the work necessary to estimate the impact on cost and schedule that these changes may have. Given the very early status of this work, no adjustments have at this time been made to the recoverable amount. The Group will continue to review the CGU for further indicators of impairment as this work progresses.
Recognising the uncertainties noted above, as well as the time remaining through to ramp-up of commercial production, the Group highlights that it does not consider the current headroom to be indicative of an impairment reversal at this time.
Annual report 2018 | riotinto.com172

Notes to the 2018 financial statements continued
7 Share of profit after tax of equity accounted units
2018US$m
2017US$m
2016US$m
Sales revenue: Rio Tinto share(a) 2,497 1,960 1,727
Operating costs (1,656) (1,400) (1,237)
Profit before finance items and taxation 841 560 490
Finance items (69) (47) (33)
Share of profit after tax of equity accounted units 14 17 20
Profit before taxation 786 530 477
Taxation (273) (191) (156)
Profit for the year (Rio Tinto share) 513 339 321
(a) Sales revenue of equity accounted units includes sales by equity accounted units to Group subsidiaries.
Further information relating to the Group’s interests in joint ventures and associates is given in notes 35 and 36.
8 Finance income and finance costs
Note 2018US$m
2017US$m
2016US$m
Finance income from equity accounted units (Rio Tinto share) 7 4 6
Other finance income (including bank deposits and other financial assets) 242 137 83
Total finance income 249 141 89
Interest on:
– Financial liabilities at amortised cost and associated derivatives (775) (819) (895)
– Finance leases (2) (3) (3)
Fair value movements:
– Bonds designated as hedged items in fair value hedges 96 28 89
– Derivatives designated as hedging instruments in fair value hedges (73) (22) (89)
Loss on early redemption of bonds(a) (94) (256) (324)
Amounts capitalised 14 296 224 111
Total finance costs (552) (848) (1,111)
(a) In 2018, loss on early redemption of bonds includes a premium charge of US$72 million; unamortised debt issuance costs and fees of US$9 million, the write-off of the fair value hedge adjustment of US$16 million and the reclassification of a gain out of the cost of hedging reserve of US$3 million (see note 30). In 2017, loss on early redemption of bonds included a premium charge of US$238 million; unamortised debt issuance costs and fees of US$14 million and the write-off of the fair value hedge adjustment of US$4 million (see note 30). In 2016, loss of early redemption of bonds included a premium charge of US$441 million; unamortised debt issuance costs and fees of US$42 million partially offset by the write-off of fair value hedge adjustments of US$159 million (see note 30).
Annual report 2018 | riotinto.com 173
Financial statements

Financial statements
Notes to the 2018 financial statements continued
9 TaxationTaxation charge
Note 2018US$m
2017US$m
2016US$m
– Current 3,726 3,270 2,115
– Deferred 17 516 695 (548)
Total taxation charge 4,242 3,965 1,567
Prima facie tax reconciliation 2018US$m
2017US$m
2016US$m
Profit before taxation 18,167 12,816 6,343
Deduct: share of profit after tax of equity accounted units (513) (339) (321)
Parent companies’ and subsidiaries’ profit before tax 17,654 12,477 6,022
Prima facie tax payable at UK rate of 19% (2017: 19%; 2016: 20%) 3,354 2,371 1,204
Higher rate of taxation on Australian underlying earnings 1,106 1,069 604
Impact of items excluded in arriving at underlying earnings(a):
– Impairment charges – 10 (16)
– Net gains and losses on consolidation and disposal of interests in businesses (251) (123) 30
– Exchange and gains/(losses) on derivatives 32 (48) (33)
– Losses from increases to closure estimates (non-operating and fully impaired sites) 30 – (40)
– Gain relating to surplus land at Kitimat (81) – –
– Changes in corporate tax rates in the US and France(b) – 439 –
– Onerous port and rail contracts – – (46)
– Tax provision(c) – – 380
– Tax charge relating to expected divestments(d) – 202 –
– Other exclusions – 14 (48)
Impact of changes in tax rates and laws 47 21 (9)
Other tax rates applicable outside the UK and Australia on underlying earnings (47) (92) (283)
Resource depletion and other depreciation allowances (46) (33) (15)
Recognition of previously unrecognised deferred tax assets – (40) (154)
Write-down of previously recognised deferred tax assets(e) 13 160 –
Other items(f) 85 15 (7)
Total taxation charge(g) 4,242 3,965 1,567
(a) The impact for each item includes the effect of tax rates applicable outside the UK.(b) In 2017, deferred tax assets were remeasured to reflect lower corporate income tax rates in the US and France as a result of tax legislation changes substantively enacted in December 2017. (c) Tax provision includes amounts provided for specific tax matters for which the timing of resolution and potential economic outflow are uncertain. During 2016, provision was made in relation
to matters under discussion with the Australian Taxation Office (ATO) in relation to the transfer pricing of certain transactions between Rio Tinto entities based in Australia and the Group’s commercial centre in Singapore for the period since 2009.
(d) In 2017, deferred tax assets were derecognised as a result of revised profit forecasts in France due to expected divestments of Dunkerque and ISAL. The Dunkerque divestment completed in 2018.
(e) The write-down of previously recognised deferred tax assets in 2017 primarily relates to a reduction in recognised deferred tax assets on brought forward losses in Grasberg.(f) Other items include various adjustments to provisions for taxation of prior periods.(g) This tax reconciliation relates to the Group’s parent companies, subsidiaries and joint operations. The Group’s share of profit of equity accounted units is net of tax charges of US$273 million
(2017: US$191 million; 2016: US$156 million).
2018Total
US$m
2017Total
US$m
2016Total
US$m
Tax on fair value movements:
– Cash flow hedge fair value (gains)/losses (54) (1) 4
Tax (charge)/credit on actuarial gains and losses on post-retirement benefit plans (271) (12) 29
Adjustments to deferred tax on post-retirement benefit plans due to changes in corporate tax rates in the US and France – (140) –
Tax relating to components of other comprehensive income/(loss) for the year(a) (325) (153) 33
(a) This comprises a deferred tax charge of US$325 million (2017: charge of US$153 million; 2016: credit of US$33 million) and a current tax charge of US$nil (2017: US$nil; 2016: US$nil), plus a share of tax on other comprehensive income of equity accounted units shown separately (see note 17).
Annual report 2018 | riotinto.com174

Notes to the 2018 financial statements continued
10 Earnings per ordinary share
2018 Earnings
US$m
2018Weighted
averagenumber of
shares(millions)
2018 Per share
amount (cents)
2017Earnings
US$m
2017Weighted
averagenumber of
shares(millions)
2017Per share
amount(cents)
Basic earnings per share attributable to ordinary shareholders of Rio Tinto(a) 13,638 1,719.3 793.2 8,762 1,786.7 490.4
Diluted earnings per share attributable to ordinary shareholders of Rio Tinto(b) 13,638 1,731.7 787.6 8,762 1,799.5 486.9
2016 Earnings
US$m
2016Weighted
averagenumber of
shares(millions)
2016Per share
amount(cents)
Basic earnings per share attributable to ordinary shareholders of Rio Tinto(a) 4,617 1,797.3 256.9
Diluted earnings per share attributable to ordinary shareholders of Rio Tinto(b) 4,617 1,808.6 255.3
(a) The weighted average number of shares is calculated as the average number of Rio Tinto plc shares outstanding not held as treasury shares of 1,312.7 million (2017: 1,364.5 million; 2016: 1,373.7 million) plus the average number of Rio Tinto Limited shares outstanding of 406.6 million (2017: 422.3 million; 2016: 423.6 million) over the relevant period. No Rio Tinto Limited ordinary shares were held by Rio Tinto plc in any of the periods presented.
(b) For the purposes of calculating diluted earnings per share, the effect of dilutive securities of 12.4 million shares in 2018 (2017: 12.8 million; 2016: 11.3 million) is added to the weighted average number of shares described in (a) above. This effect is calculated under the treasury stock method. In accordance with IAS 33 “Earnings per share”. The Group’s only potential dilutive ordinary shares are share options for which terms and conditions are described in note 43.
11 Dividends
2018US$m
2017US$m
2016US$m
Rio Tinto plc previous year final dividend paid 2,446 1,725 1,443
Rio Tinto plc interim dividend paid 1,666 1,530 604
Rio Tinto Limited previous year final dividend paid 731 523 473
Rio Tinto Limited interim dividend paid 513 472 205
Dividends paid during the year 5,356 4,250 2,725
Dividends per share: paid during the year 307.0c 235.0c 152.5c
Final dividends per share: proposed in the announcement of the results for the year 180.0c 180.0c 125.0c
Special dividends per share: proposed in the announcement of the results for the year 243.0c – –
Dividendsper share
2018
Dividendsper share
2017
Dividendsper share
2016
Rio Tinto plc previous year final (pence) 129.43p 100.56p 74.21p
Rio Tinto plc interim (pence) 96.82p 83.13p 33.80p
Rio Tinto Limited previous year final – fully franked at 30% (Australian cents) 228.53c 163.62c 151.89c
Rio Tinto Limited interim – fully franked at 30% (Australian cents) 170.84c 137.72c 59.13c
Numberof shares
2018(millions)
Numberof shares
2017(millions)
Numberof shares
2016(millions)
Rio Tinto plc previous year final 1,334.8 1,374.6 1,373.9
Rio Tinto plc interim 1,308.4 1,366.1 1,374.4
Rio Tinto Limited previous year final 412.4 424.0 423.5
Rio Tinto Limited interim 412.4 424.0 424.0
The dividends paid in 2018 are based on the following US cents per share amounts: 2017 final – 180.0 cents, 2018 interim – 127.0 cents (2017 dividends paid: 2016 final – 125.0 cents, 2017 interim – 110.0 cents; 2016 dividends paid: 2015 final – 107.5 cents, 2016 interim – 45.0 cents).
The number of shares on which Rio Tinto plc dividends are based excludes those held as treasury shares and those held by employee share trusts which waived the right to dividends. Employee share trusts waived dividends on 132,294 Rio Tinto plc ordinary shares and 22,824 American Depository Receipts (ADRs) for the 2017 final dividend and on 314,529 Rio Tinto plc ordinary shares and 36,321 ADRs for the 2018 interim dividend (2017: 277,946 Rio Tinto plc ordinary shares and 22,021 ADRs for the 2016 final dividend and on 173,297 Rio Tinto plc ordinary shares and 24,377 ADRs for the 2017 interim dividend; 2016: 428,529 Rio Tinto plc ordinary shares and 13,881 ADRs for the 2015 final dividend and on 217,661 Rio Tinto plc ordinary shares and 31,604 ADRs for the 2016 interim dividend). In 2018, 2017 and 2016, no Rio Tinto Limited shares were held by Rio Tinto plc.
Annual report 2018 | riotinto.com 175
Financial statements

Financial statements
Notes to the 2018 financial statements continued
11 Dividends continuedThe number of shares on which Rio Tinto Limited dividends are based excludes those held by shareholders who have waived the rights to dividends. Employee share trusts waived dividends on 130,129 Rio Tinto Limited ordinary shares for the 2017 final dividend and on 251,394 shares for the 2018 interim dividend (2017: 214,278 shares for the 2016 final dividend and on 274,899 shares for the 2017 interim dividend; 2016: 681,818 shares for the 2015 final dividend and on 152,834 shares for the 2016 interim dividend).
In addition, the directors of Rio Tinto announced a final dividend of 180.0 cents per share and a special dividend of 243.0 cents per share on 27 February 2019. These are expected to result in payments of approximately US$7 billion. The dividends will be paid on 18 April 2019 to Rio Tinto plc and Rio Tinto Limited shareholders on the register at the close of business on 8 March 2019.
The proposed Rio Tinto Limited dividends will be franked out of existing franking credits or out of franking credits arising from the payment of income tax during 2019.
The approximate amount of the Rio Tinto Limited consolidated tax group’s retained profits and reserves that could be distributed as dividends and franked out of available credits that arose from net payments of income tax in respect of periods up to 31 December 2018 (after deducting franking credits expected to be utilised on the 2018 final dividend declared) is US$6,178 million (2017: US$8,542 million; 2016: US$11,577 million).
12 Goodwill
2018US$m
2017US$m
Net book value
At 1 January 1,037 951
Adjustment on currency translation (125) 86
At 31 December 912 1,037
– cost 15,861 17,942
– accumulated impairment (14,949) (16,905)
At 1 January
– cost 17,942 17,144
– accumulated impairment (16,905) (16,193)
At 31 December, goodwill has been allocated as follows:
2018US$m
2017US$m
Net book value
Richards Bay Minerals 474 552
Pilbara 351 389
Dampier Salt 87 96
912 1,037
Impairment tests for goodwillRichards Bay MineralsRichards Bay Minerals’ annual impairment review resulted in no impairment charge for 2018 (2017: no impairment charge). The recoverable amount has been assessed by reference to FVLCD, in line with the policy set out in note 1(i) and classified as level 3 under the fair value hierarchy. FVLCD was determined by estimating cash flows until the end of the life-of-mine plan including anticipated expansions. In arriving at FVLCD, a post-tax discount rate of 8.8% (2017: 8.7%) has been applied to the post-tax cash flows expressed in real terms.
The key assumptions to which the calculation of FVLCD for Richards Bay Minerals is most sensitive and the corresponding decrease in FVLCD are set out below:
US$m
5% decrease in the titanium slag price 174
1% increase in the discount rate applied to post-tax cash flows 195
10% strengthening of the South African rand 328
Other assumptions include the long-term pig iron and zircon prices and operating costs. Future selling prices and operating costs have been estimated in line with the policy set out in note 1(i). The recoverable amount of the CGU exceeds the carrying value when each of these sensitivities are applied whilst keeping all other assumptions constant.
PilbaraThe annual impairment review of the Pilbara CGU has been assessed by reference to FVLCD using discounted cash flows, which is in line with the policy set out in note 1(i) and is classified as level 3 under the fair value hierarchy. In arriving at FVLCD, a post-tax discount rate of 6.8% (2017: 6.7%) has been applied to the post-tax cash flows expressed in real terms. The recoverable amount was determined to be significantly in excess of carrying value, and there are no reasonably possible changes in key assumptions that would cause the remaining goodwill to be impaired.
Annual report 2018 | riotinto.com176

Notes to the 2018 financial statements continued
13 Intangible assets
Year ended 31 December 2018
Explorationand
evaluation(a)
US$m
Trademarks,patented and
non-patentedtechnology
US$m
Contract-basedintangible
assets(b)
US$m
Otherintangible
assetsUS$m
TotalUS$m
Net book value
At 1 January 2018 393 75 2,188 463 3,119
Adjustment on currency translation (25) (3) (171) (46) (245)
Expenditure during the year 90 1 – 83 174
Amortisation for the year(c) – (14) (23) (96) (133)
Impairment charges(d) – – – (2) (2)
Disposals, transfers and other movements(e) (225) – (12) 103 (134)
At 31 December 2018 233 59 1,982 505 2,779
– cost 2,346 217 3,114 1,538 7,215
– accumulated amortisation and impairment (2,113) (158) (1,132) (1,033) (4,436)
Year ended 31 December 2017
Explorationand
evaluation(a)
US$m
Trademarks,patented andnon-patented
technologyUS$m
Contract-basedintangible
assets(b)
US$m
Otherintangible
assetsUS$m
TotalUS$m
Net book value
At 1 January 2017 711 78 2,103 387 3,279
Adjustment on currency translation 27 10 150 29 216
Expenditure during the year 57 – – 65 122
Amortisation for the year(c) – (13) (67) (97) (177)
Impairment charges(d) (357) – – – (357)
Disposals, transfers and other movements(e) (45) – 2 79 36
At 31 December 2017 393 75 2,188 463 3,119
– cost 2,658 224 3,438 1,537 7,857
– accumulated amortisation and impairment (2,265) (149) (1,250) (1,074) (4,738)
(a) Exploration and evaluation assets’ useful lives are not determined until transferred to property, plant and equipment. (b) The Group benefits from certain intangible assets acquired with Alcan, including power supply contracts, customer contracts and water rights. The water rights are expected to contribute
to the efficiency and cost-effectiveness of operations for the foreseeable future: accordingly, these rights are considered to have indefinite lives and are not subject to amortisation but are tested annually for impairment. These water rights constitute the majority of the amounts in “Contract-based intangible assets”. The remaining carrying value of the water rights (US$1,684 million) as at 31 December 2018 relates wholly to the Quebec smelters CGU. The Quebec smelters CGU was tested for impairment by reference to FVLCD using discounted cash flows, which is in line with the policy set out in note 1(i). The recoverable amount of the Quebec smelters is classified as level 3 under the fair value hierarchy. In arriving at FVLCD, post-tax cash flows expressed in real terms have been estimated over the expected useful economic lives of the underlying smelting assets and discounted using a real post-tax discount rate of 6.8% (2017: 6.7%). The recoverable amounts were determined to be significantly in excess of carrying value, and there are no reasonably possible changes in key assumptions that would cause the remaining water rights to be impaired.
(c) Finite life intangible assets are amortised over their useful economic lives on a straight line or units of production basis, as appropriate. Where amortisation is calculated on a straight line basis, the following useful lives have been determined: Trademarks, patented and non-patented technology Trademarks: 14 to 20 years Patented and non-patented technology: ten to 20 years Contract-based intangible assets Power contracts/water rights: two to 45 years Other purchase and customer contracts: five to 15 years Other intangible assets Internally generated intangible assets and computer software: two to five years Other intangible assets: two to 20 years
(d) Impairment charges in 2018 relate to the ISAL Smelter (see note 6). Impairment charges in 2017 relate to the full write-off of the Roughrider deposit in Canada (see note 6).(e) Disposals, transfers and other movements includes transfers to assets held for sale relating to Rössing Uranium and ISAL assets, transfers to Mining properties and leases in relation to
the Koodaideri mine from Exploration and evaluation, offset by transfers into other intangibles as part of the Autohaul project. Disposals, transfers and other movements for Exploration and evaluation in 2017 included US$34 million transferred to Mining Property in relation to the Kemano tunnel following approval of the project.
Annual report 2018 | riotinto.com 177
Financial statements

Financial statements
Notes to the 2018 financial statements continued
13 Intangible assets continuedExploration and evaluation expenditureThe charge for the year and the net amount of intangible assets capitalised during the year are as follows:
2018US$m
2017US$m
2016US$m
Net expenditure in the year (net of cash proceeds of US$233 million (2017: US$3 million; 2016: US$208 million) on disposal of undeveloped projects) (345) (493) (284)
Non-cash movements and non-cash proceeds on disposal of undeveloped projects 45 (24) (177)
Amount capitalised during the year 90 57 8
Net charge for the year (210) (460) (453)
Reconciliation to income statement
Exploration and evaluation costs (488) (445) (497)
Profit/(loss) relating to interests in undeveloped projects(a) 278 (15) 44
Net charge for the year (210) (460) (453)
(a) During 2018, profit relating to interests in undeveloped properties relates to the gains on the sales of Valeria (US$83 million) and Winchester South (US$195 million) undeveloped properties which are included within underlying earnings.
At 31 December 2018, a total of US$233 million had been capitalised related to projects which had not yet been approved to proceed (31 December 2017: a total of US$420 million had been capitalised comprising: evaluation costs of US$393 million included above and US$27 million of early works expenditure within property, plant and equipment).
14 Property, plant and equipment
Year ended 31 December 2018 Note
Miningpropertiesand leases(a)
US$m
Landand
buildings(b)
US$m
Plantand
equipmentUS$m
Capitalworks in
progressUS$m
Total US$m
Net book value
At 1 January 2018 11,488 7,376 36,285 6,944 62,093
Adjustment on currency translation(c) (689) (548) (2,671) (249) (4,157)
Adjustments to capitalised closure costs 26 486 – – – 486
Interest capitalised(d) 8 – – – 296 296
Additions 403 80 459 4,359 5,301
Depreciation for the year(a) (e) (664) (382) (2,836) – (3,882)
Impairment charges(f) (3) (20) (101) (6) (130)
Disposals (1) (54) (71) (4) (130)
Subsidiaries no longer consolidated(g) (1,103) (377) (1,392) (514) (3,386)
Transfers and other movements(h) 1,146 188 2,346 (3,810) (130)
At 31 December 2018 11,063 6,263 32,019 7,016 56,361
– cost 23,318 10,601 63,051 7,324 104,294
– accumulated depreciation and impairment (12,255) (4,338) (31,032) (308) (47,933)
Non-current assets held under finance leases(i) – – 31 – 31
Non-current assets pledged as security(j) 3,054 385 5,194 4,588 13,221
Annual report 2018 | riotinto.com178

Notes to the 2018 financial statements continued
Year ended 31 December 2017 Note
Miningpropertiesand leases(a)
US$m
Landand
buildings(b)
US$m
Plantand
equipmentUS$m
Capitalworks inprogress
US$mTotal
US$m
Net book value
At 1 January 2017 10,848 7,316 35,706 4,985 58,855
Adjustment on currency translation(c) 495 461 2,242 183 3,381
Adjustments to capitalised closure costs 26 710 – – – 710
Interest capitalised(d) 8 – – – 224 224
Additions 230 41 646 3,834 4,751
Depreciation for the year(a) (e) (673) (403) (3,122) – (4,198)
Impairment charges(f) (304) (2) (128) (1) (435)
Disposals – (57) (40) (26) (123)
Subsidiaries no longer consolidated(g) (211) (95) (417) (26) (749)
Transfers and other movements(h) 393 115 1,398 (2,229) (323)
At 31 December 2017 11,488 7,376 36,285 6,944 62,093
– cost 24,691 12,029 71,903 7,266 115,889
– accumulated depreciation and impairment (13,203) (4,653) (35,618) (322) (53,796)
Non-current assets held under finance leases(i) – – 37 – 37
Non-current assets pledged as security(j) 3,307 410 5,308 3,278 12,303
(a) At 31 December 2018, the net book value of capitalised production phase stripping costs totalled US$2,050 million, with US$1,572 million within Property, plant and equipment and a further US$478 million within Investments in equity accounted units (2017: total of US$1,815 million with US$1,374 million in Property, plant and equipment and a further US$441 million within Investments in equity accounted units). During the year capitalisation of US$526 million was partly offset by depreciation of US$274 million (including amounts recorded within equity accounted units). Depreciation of deferred stripping costs in respect of subsidiaries of US$134 million (2017: US$194 million; 2016: US$203 million) is included within “Depreciation for the year”.
(b) At 31 December 2018, the net book value amount for land and buildings includes freehold US$6,240 million (2017: US$7,294 million) and long leasehold US$23 million (2017: US$82 million).(c) Adjustment on currency translation represents the impact of exchange differences arising on the translation of the assets of entities with functional currencies other than the US dollar,
recognised directly in the currency translation reserve. The adjustment in 2018 arose from the strengthening of the US dollar against other currencies. (d) Interest is capitalised at a rate based on the Group or relevant subsidiary’s cost of borrowing or at the rate on project specific debt, where applicable. The Group’s average borrowing rate used
for capitalisation of interest is 4.90% (2017: 4.45%).(e) Assets within operations for which production is not expected to fluctuate significantly from one year to another or which have a physical life shorter than the related mine are depreciated on
a straight line basis as follows: Land and buildings Land: not depreciated Buildings: five to 50 years Plant and equipment Other plant and equipment: three to 50 years Power assets: 25 to 50 years Capital work in progress: not depreciated
(f) During 2018, impairment charges primarily related to the ISAL Smelter (see note 6). During 2017, impairment charges primarily related to Argyle Diamonds and Rössing Uranium (see note 6).(g) During 2018, “Subsidiaries no longer consolidated” relates primarily to the disposal of Kestrel and Hail Creek, which completed on 1 August 2018 and the disposal of Grasberg on 21 December
2018. Refer to note 37. During 2017, “Subsidiaries no longer consolidated” relates primarily to the disposal of Coal & Allied Industries Limited, which completed on 1 September 2017.
(h) “Transfers and other movements” includes reclassifications between categories and transfers to assets held for sale relating to Rössing Uranium and ISAL assets in 2018, and Dunkerque in 2017.
(i) The finance leases under which these assets are held are disclosed in note 23. ( j) Excludes assets held under finance leases. Non-current assets pledged as security represent amounts pledged as collateral against US$4,562 million (2017: US$4,677 million) of loans,
which are included in note 22.
Annual report 2018 | riotinto.com 179
Financial statements

Financial statements
Notes to the 2018 financial statements continued
15 Investments in equity accounted unitsSummary balance sheet (Rio Tinto share)
2018US$m
2017US$m
Rio Tinto’s share of assets
– Non-current assets 6,000 5,913
– Current assets 887 990
6,887 6,903
Rio Tinto’s share of liabilities
– Current liabilities (607) (654)
– Non-current liabilities (1,981) (1,763)
(2,588) (2,417)
Rio Tinto’s share of net assets 4,299 4,486
Further details of investments in equity accounted units are set out in notes 35 and 36.
At 31 December 2018 and 2017, the Group had no investments in equity accounted units with shares listed on recognised stock exchanges.
At 31 December 2018, net debt of equity accounted units, excluding amounts due to Rio Tinto, was US$1,158 million (2017: US$1,244 million).
16 Inventories
2018
US$m2017
US$m
Raw materials and purchased components 734 648
Consumable stores 862 875
Work in progress 1,026 1,082
Finished goods and goods for resale 977 1,027
Total inventories 3,599 3,632
Comprising:
Expected to be used within one year 3,447 3,472
Expected to be used after more than one year 152 160
Total inventories 3,599 3,632
During 2018, the Group recognised inventory write-downs, net of reversals, amounting to US$48 million. During 2017, the Group recognised a net inventory write-back of US$7 million. This comprised a US$81 million write-back of amounts previously written down due to an increase in realisable values, partly offset by inventory write-offs of US$74 million.
At 31 December 2018, US$566 million (2017: US$611 million) of inventories were pledged as security for liabilities.
17 Deferred taxation
2018
US$m2017
US$m
At 1 January – deferred tax liability/(asset) 233 (607)
Adjustment to opening balance on transition to IFRS 15 (71) –
At 1 January – restated opening balance 162 (607)
Adjustment on currency translation (172) 53
Charged to the income statement 516 695
Charged to statement of comprehensive income(a) 325 153
Disposals (263) –
Other movements(b) (32) (61)
At 31 December – deferred tax liability 536 233
Comprising:
– deferred tax liabilities(c) (d) 3,673 3,628
– deferred tax assets(c) (e) (f) (3,137) (3,395)
Annual report 2018 | riotinto.com180

Notes to the 2018 financial statements continued
Deferred tax balances for which there is a right of offset within the same tax jurisdiction are presented net on the face of the balance sheet as permitted by IAS 12. The closing deferred tax liabilities and assets, prior to this offsetting of balances, are shown below.
Analysis of deferred taxTotal2018
US$m
Total2017
US$m
Deferred tax liabilities arising from:
Capital allowances 4,408 5,208
Unremitted earnings(d) 454 588
Capitalised interest 259 391
Unrealised exchange gains 5 31
Other temporary differences 309 222
Total 5,435 6,440
Deferred tax assets arising from:
Tax losses(e) (1,894) (2,282)
Provisions (1,585) (1,731)
Capital allowances (154) (579)
Post-retirement benefits (293) (616)
Unrealised exchange losses (187) (317)
Other temporary differences (786) (682)
Total (4,899) (6,207)
Charged/(credited) to the income statement
Unrealised exchange losses 57 36
Tax losses (30) 12
Provisions (19) 451
Capital allowances 461 278
Tax on unremitted earnings (33) 4
Post-retirement benefits 30 149
Other temporary differences 50 (235)
Total 516 695
(a) The amounts charged directly to the Statement of comprehensive income include provisions for tax on exchange differences on intragroup loans qualifying for reporting as part of the net investment in subsidiaries, on cash flow hedges and on actuarial gains and losses on pension schemes and on post-retirement healthcare plans.
(b) “Other movements” include deferred tax relating to tax payable recognised by subsidiary holding companies on the profits of the equity accounted units to which it relates.(c) The deferred tax liability of US$3,673 million (2017: US$3,628 million) includes US$3,658 million (2017: US$3,615 million) due in more than one year. The deferred tax asset of US$3,137 million
(2017: US$3,395 million) includes US$3,133 million (2017: US$3,386 million) receivable in more than one year. All amounts are shown as non-current on the face of the balance sheet as required by IAS 12.
(d) Deferred tax is not recognised on the unremitted earnings of subsidiaries and joint ventures totalling US$3,726 million (2017: US$3,242 million) where the Group is able to control the timing of the remittance and it is probable that there will be no remittance in the foreseeable future. If these earnings were remitted, tax of US$157 million (2017: US$131 million) would be payable.
(e) There is a limited time period, the shortest of which is six years, for the recovery of US$1,519 million (2017: US$1,679 million) of tax losses and other tax assets which have been recognised as deferred tax assets in the financial statements.
(f) Recognised and unrecognised deferred tax assets are shown in the table below and totalled US$5,647 million at 31 December 2018 (2017: US$7,071 million). Of this total, US$3,137 million has been recognised as deferred tax assets (2017: US$3,395 million), leaving US$2,510 million (2017: US$3,676 million) unrecognised, as recovery is not considered probable.
The recognised amounts do not include deferred tax assets that have been netted off against deferred tax liabilities.
At 31 December
Recognised Unrecognised
2018US$m
2017US$m
2018US$m
2017US$m
France – – 1,122 1,163
Canada 545 546 559 674
US 932 877 12 7
Australia 796 1,055 289 257
Mongolia(a) 703 631 87 61
Other(b) 161 286 441 1,514
Total 3,137 3,395 2,510 3,676
(a) Deferred tax assets in Mongolia include US$469 million (2017: US$432 million) from tax losses that expire if not recovered against taxable profits within eight years. Tax losses have been calculated in accordance with the provisions of the Oyu Tolgoi Investment Agreement and Mongolian laws. Recovery of the recognised deferred tax assets is expected to commence from 2024 based on projected cash flows in the latest life-of-mine plan, which has been calculated on a consistent basis with the impairment test described in note 6. Tax law in Mongolia and its interpretation by the tax authority has been, and is expected to continue to be, subject to change. Such future changes could have a material impact on the amount and period of recovery of these deferred tax assets.
(b) US$684 million (2017: US$777 million) of the unrecognised assets relate to realised or unrealised capital losses, the recovery of which depends on the existence of capital gains in future years. There is a time limit, the shortest of which is one year, for the recovery of US$96 million of the unrecognised assets (2017: US$250 million).
Annual report 2018 | riotinto.com 181
Financial statements

Financial statements
Notes to the 2018 financial statements continued
18 Trade and other receivables
Non-current 2018
US$m
Current 2018
US$m
Total2018
US$m
Non-current2017
US$m
Current2017
US$m
Total2017
US$m
Trade receivables(a) – 2,167 2,167 1 2,314 2,315
Other financial receivables(a) 240 550 790 178 462 640
Amounts due from equity accounted units – 50 50 – 30 30
Other receivables 129 226 355 348 358 706
Prepayment of tolling charges to jointly controlled entities(b) 228 – 228 269 – 269
Pension surpluses (note 44) 935 – 935 871 – 871
Other prepayments 53 186 239 57 279 336
Total 1,585 3,179 4,764 1,724 3,443 5,167
(a) At 31 December 2018, trade and other financial receivables are stated net of allowances for expected credit losses of US$8 million. The 2017 closing provision for doubtful debt under IAS 39 of US$55 million was adjusted by US$7 million (pre-tax) upon adoption of IFRS 9 (refer to note 45). During the year there has been an increase to the provision for expected credit losses of US$2 million and US$42 million has been utilised.
(b) These prepayments will be charged to Group operating costs as processing takes place.
There is no material element of trade and other receivables that is interest-bearing or financing in nature.
The fair value of current trade and other receivables and the majority of amounts classified as non-current trade and other receivables approximates to their carrying value.
There are no material trade receivables that are past due but not impaired.
19 Assets and liabilities held for saleAt 31 December 2018, assets and liabilities held for sale include Rio Tinto’s interest in the Rössing Uranium mine (US$106 million) and the ISAL Smelter, the Aluchemie anode plant and the Alufluor aluminium fluoride plant (US$334 million).
At 31 December 2017, assets and liabilities held for sale included Rio Tinto’s interest in the Dunkerque aluminium smelter (US$355 million) and certain other separate assets.
The major classes of assets and liabilities of those entities classified as held for sale at 31 December 2018 are:
2018US$m
2017US$m
Assets
Intangible assets 4 6
Property, plant and equipment 238 190
Investments in equity accounted units 5 –
Inventories 186 88
Deferred tax assets 66 49
Trade and other receivables 58 139
Other financial assets (including loans to equity accounted units) 60 22
Cash and cash equivalents 117 –
Assets of disposal groups held for sale 734 494
Liabilities
Trade and other payables (134) (60)
Provisions including post-retirement benefits (160) (64)
Liabilities of disposal groups held for sale (294) (124)
Net assets associated with disposal groups 440 370
On completion of the sale of Rössing Uranium, it is expected that a loss of approximately US$300 million will be recognised, including the loss that will be recycled from the currency translation reserve on sale of the business. The loss is subject to currency movements up until completion of the sale, which is expected to be in the first half of 2019.
Annual report 2018 | riotinto.com182
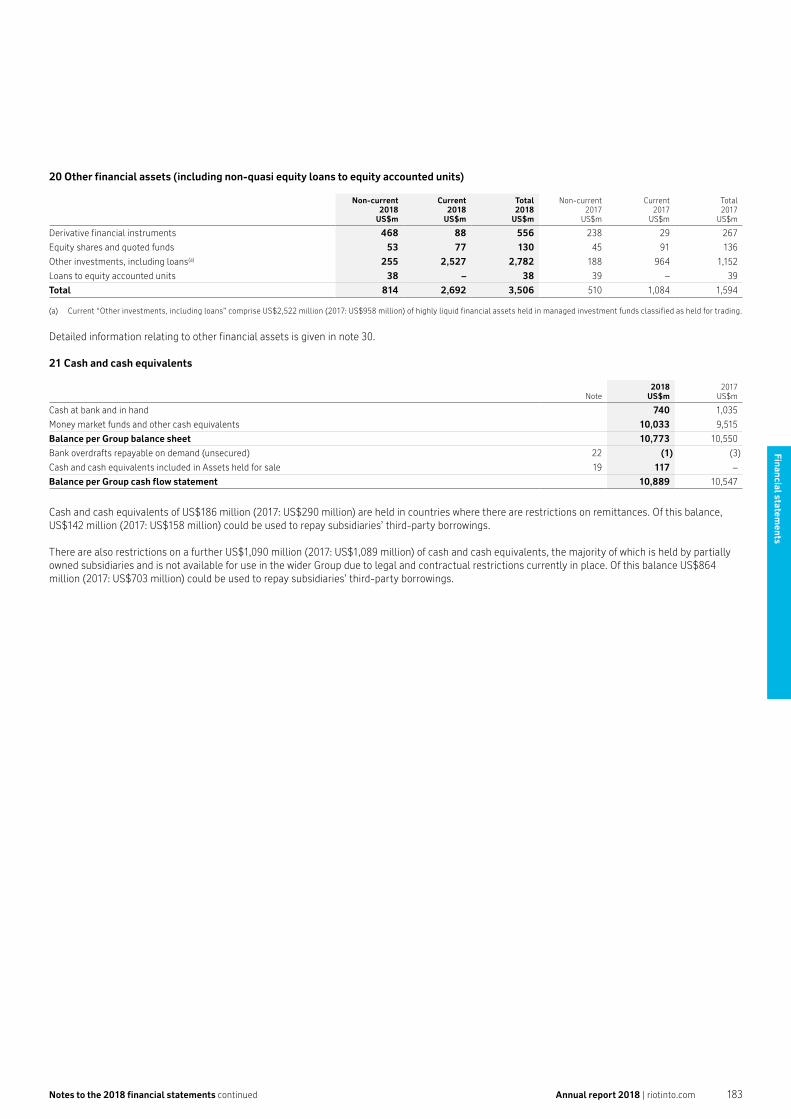
Notes to the 2018 financial statements continued
20 Other financial assets (including non-quasi equity loans to equity accounted units)
Non-current2018
US$m
Current 2018
US$m
Total 2018
US$m
Non-current 2017
US$m
Current2017
US$m
Total2017
US$m
Derivative financial instruments 468 88 556 238 29 267
Equity shares and quoted funds 53 77 130 45 91 136
Other investments, including loans(a) 255 2,527 2,782 188 964 1,152
Loans to equity accounted units 38 – 38 39 – 39
Total 814 2,692 3,506 510 1,084 1,594
(a) Current “Other investments, including loans” comprise US$2,522 million (2017: US$958 million) of highly liquid financial assets held in managed investment funds classified as held for trading.
Detailed information relating to other financial assets is given in note 30.
21 Cash and cash equivalents
Note2018
US$m2017
US$m
Cash at bank and in hand 740 1,035
Money market funds and other cash equivalents 10,033 9,515
Balance per Group balance sheet 10,773 10,550
Bank overdrafts repayable on demand (unsecured) 22 (1) (3)
Cash and cash equivalents included in Assets held for sale 19 117 –
Balance per Group cash flow statement 10,889 10,547
Cash and cash equivalents of US$186 million (2017: US$290 million) are held in countries where there are restrictions on remittances. Of this balance, US$142 million (2017: US$158 million) could be used to repay subsidiaries’ third-party borrowings.
There are also restrictions on a further US$1,090 million (2017: US$1,089 million) of cash and cash equivalents, the majority of which is held by partially owned subsidiaries and is not available for use in the wider Group due to legal and contractual restrictions currently in place. Of this balance US$864 million (2017: US$703 million) could be used to repay subsidiaries’ third-party borrowings.
Annual report 2018 | riotinto.com 183
Financial statements

Financial statements
Notes to the 2018 financial statements continued
22 Borrowings and other financial liabilitiesBorrowings at 31 December
Note
Non-current2018
US$m
Current2018
US$m
Total 2018
US$m
Non-current 2017
US$m
Current 2017
US$m
Total 2017
US$m
Rio Tinto Finance plc Euro Bonds 2.0% due 2020(a) (b) 468 – 468 921 – 921
Rio Tinto Finance (USA) Limited Bonds 4.125% 2021(a) – – – 428 – 428
Rio Tinto Finance (USA) Limited Bonds 3.750% 2021(a) – – – 347 – 347
Rio Tinto Finance (USA) plc Bonds 3.5% 2022(a) – – – 227 – 227
Rio Tinto Finance (USA) plc Bonds 2.875% 2022(a) – – – 377 – 377
Rio Tinto Finance plc Euro Bonds 2.875% due 2024(a) (b) 514 – 514 644 – 644
Rio Tinto Finance (USA) Limited Bonds 3.75% 2025(a) 1,170 – 1,170 1,192 – 1,192
Rio Tinto Finance (USA) Limited Bonds 7.125% 2028(a) 927 – 927 965 – 965
Alcan Inc. Debentures 7.25% due 2028 104 – 104 105 – 105
Rio Tinto Finance plc Sterling Bonds 4.0% due 2029(a) (b) 633 – 633 669 – 669
Alcan Inc. Debentures 7.25% due 2031 421 – 421 422 – 422
Alcan Inc. Global Notes 6.125% due 2033 741 – 741 740 – 740
Alcan Inc. Global Notes 5.75% due 2035 288 – 288 287 – 287
Rio Tinto Finance (USA) Limited Bonds 5.2% 2040(a) 1,095 – 1,095 1,102 – 1,102
Rio Tinto Finance (USA) plc Bonds 4.75% 2042(a) 462 – 462 467 – 467
Rio Tinto Finance (USA) plc Bonds 4.125% 2042(a) 685 – 685 691 – 691
Oyu Tolgoi LLC MIGA Insured Loan LIBOR plus 2.65% due 2027(c) 676 – 676 674 – 674
Oyu Tolgoi LLC Commercial Banks “B Loan” LIBOR plus 3.4% due 2027(c) 1,588 – 1,588 1,588 – 1,588
Oyu Tolgoi LLC Export Credit Agencies Loan 2.3% due 2028(c) 272 – 272 255 – 255
Oyu Tolgoi LLC Export Credit Agencies Loan LIBOR plus 3.65% due 2029(c) 871 – 871 869 – 869
Oyu Tolgoi LLC International Financial Institutions “A Loan” LIBOR plus 3.78% due 2030(c) 768 – 768 761 – 761
Loans from equity accounted units – – – – 31 31
Other secured loans 345 42 387 451 79 530
Other unsecured loans 373 264 637 393 435 828
Finance leases 23 39 5 44 49 4 53
Bank overdrafts 21 – 1 1 – 3 3
Total borrowings including overdrafts(d) 12,440 312 12,752 14,624 552 15,176
(a) These borrowings are subject to the hedging arrangements summarised below. Fair value hedge accounting has been applied except for the Rio Tinto Finance plc Sterling Bonds 4.0% due 2029 which has cash flow hedge accounting applied.
(b) Rio Tinto has a US$10 billion (2017: US$10 billion) European Debt Issuance Programme against which the cumulative amount utilised was US$1.6 billion equivalent at 31 December 2018 (2017: US$2.2 billion). The carrying value of these bonds after hedge accounting adjustments amounted to US$1.6 billion (2017: US$ 2.2 billion) in aggregate.
(c) These borrowings relate to the Oyu Tolgoi LLC project finance facility. The project finance facility provides for interest-only payments for the first five years followed by minimum repayments according to a stepped amortisation schedule for the remaining life of the facility. The due dates stated represent the final repayment date. The interest rates stated are pre-completion and will increase by 1% post-completion.
(d) The Group’s borrowings of US$12.8 billion (2017: US$15.2 billion) include US$2.4 billion (2017: US$2.7 billion) which relates to subsidiary entity borrowings that are without recourse to the Group, and US$4.6 billion (2017: US$4.7 billion) which is subject to various financial and general covenants with which the respective borrowers were in compliance as at 31 December 2018.
Other financial liabilities
Non-current2018
US$m
Current2018
US$m
Total 2018
US$m
Non-current 2017
US$m
Current 2017
US$m
Total 2017
US$m
Derivative financial instruments 407 95 502 481 50 531
Other financial liabilities – 666 666 43 302 345
Total other financial liabilities 407 761 1,168 524 352 876
Total borrowings including overdrafts (as above) 12,440 312 12,752 14,624 552 15,176
Total borrowings and other financial liabilities 12,847 1,073 13,920 15,148 904 16,052
Swap arrangementsAt 31 December 2018, US$4.3 billion (2017: US$5.7 billion) US dollar notional of the fixed rate US dollar borrowings were swapped to floating US dollar rates and US$0.9 billion (2017: US$1.5 billion) US dollar notional equivalent of euro borrowings were fully swapped to floating US dollar rates.
Hedge accounting has been applied to the full notional of items marked (a) in the above table except for: US$75 million (2017: US$75 million) of the Rio Tinto Finance (USA) Limited Bonds 7.125% due 2028. This portion is held at amortised cost.
The Rio Tinto Finance plc Sterling Bond 4.0% due 2029 at US$0.6 billion (2017: US$0.7 billion) US dollar notional equivalent of sterling was fully swapped to US dollar notional and fixed US dollar rates. Cash flow hedging was applied to the annual interest coupons and principal of this bond. The hedge was fully effective in 2018 and 2017 financial years as the notional amount, maturity, payment and reset dates match.
Annual report 2018 | riotinto.com184

Notes to the 2018 financial statements continued
The fair value of interest rate and cross-currency interest rate swaps at 31 December 2018 was US$70 million (2017: US$99 million) asset and US$358 million (2017: US$276 million) liability, respectively. These are included within “Other financial assets” and “Other financial liabilities” in the balance sheet. The change in fair value used for measuring ineffectiveness for the period is shown in note 8.
The main sources of ineffectiveness include changes in the timing of the cash flows of the hedging instrument compared to the underlying hedged item and changes in the credit risk of parties to the hedging relationship.
Details of the major interest rate and cross-currency interest rate swaps are shown in note 30.
23 Capitalised finance leases
Note2018
US$m2017
US$m
Present value of minimum lease payments
Total minimum lease payments 45 57
Effect of discounting (1) (4)
Total 22 44 53
Payments under capitalised finance leases
Due within 1 year 5 4
Between 1 and 3 years 10 14
Between 3 and 5 years 18 28
More than 5 years 12 11
Total 45 57
24 Consolidated net cash/(debt)
Year ended 31 December 2018
Financing liabilities(b) Other assets
Net (debt)/cash
US$m
Borrowings(including
finance leases)excluding
overdrafts(a)
US$m
Debt-relatedderivatives
(included inOther financial
assets/liabilities)
US$m
Cash/overdrafts(b)
US$m
Otherinvestments(c)
US$m
Analysis of changes in consolidated net cash/(debt)
Opening balance (15,173) (177) 10,547 958 (3,845)
Foreign exchange adjustment 126 (64) 151 – 213
Cash movements excluding exchange movements 2,246 51 191 1,557 4,045
Other non-cash movements 50 (98) (117) 7 (158)
Closing balance (12,751) (288) 10,772 2,522 255
Year ended 31 December 2017
Financing liabilities(b) Other assets
Net debt
US$m
Borrowings(including
finance leases)excluding
overdrafts(a)
US$m
Debt-relatedderivatives
(included inOther financial
assets/liabilities)
US$m
Cash/overdrafts(b)
US$m
Otherinvestments(c)
US$m
Analysis of changes in consolidated net debt
Opening balance (17,618) (408) 8,189 250 (9,587)
Foreign exchange adjustment (303) 245 (12) – (70)
Cash movements excluding exchange movements 2,777 7 2,370 705 5,859
Other non-cash movements (29) (21) – 3 (47)
Closing balance (15,173) (177) 10,547 958 (3,845)
(a) Borrowings (including finance leases) at 31 December 2018 differ from total borrowings on the balance sheet as they exclude overdrafts of US$1 million (31 December 2017: US$3 million), other current financial liabilities of US$761 million (31 December 2017: US$352 million) and other non-current financial liabilities US$407 million (31 December 2017: US$524 million).
(b) Closing cash/overdrafts at 31 December 2018 differ from cash and cash equivalents on the balance sheet as they include overdrafts of US$1 million which have been classified as a financial liability (31 December 2017: US$3 million). Other non-cash movements represents the reclassification of cash and cash equivalents in disposal groups to assets held for sale.
(c) Other investments comprise US$2,522 million (2017: US$958 million) of highly liquid financial assets held in managed investment funds classified as held for trading.
Further information relating to the currency and interest rate exposures arising from net debt and related derivatives is given in note 30.
Annual report 2018 | riotinto.com 185
Financial statements

Financial statements
Notes to the 2018 financial statements continued
25 Trade and other payables
Non-current2018
US$m
Current 2018US$m
Total2018
US$m
Non-current2017
US$m
Current2017
US$m
Total 2017
US$m
Trade payables – 3,180 3,180 – 3,255 3,255
Other financial payables 256 653 909 265 867 1,132
Other payables 165 114 279 87 97 184
Deferred income(a) 176 234 410 246 246 492
Accruals 11 1,229 1,240 13 1,347 1,360
Employee entitlements – 630 630 – 734 734
Royalties and mining taxes 1 487 488 4 492 496
Amounts owed to equity accounted units 156 67 223 156 19 175
Government grants deferred 76 6 82 85 4 89
Total 841 6,600 7,441 856 7,061 7,917
(a) Deferred income includes contract liabilities of US$198 million.
The fair value of trade payables and financial instruments within other payables approximates their carrying value.
26 Provisions (including post-retirement benefits)
Note
Pensionsand
post-retirementhealthcare(a)
US$m
Otheremployee
entitlements(b)
US$m
Close-downand
restoration/environmental(c)
US$mOtherUS$m
Total2018
US$m
Total2017
US$m
At 1 January 3,370 389 9,983 900 14,642 13,794
Adjustment on currency translation (145) (37) (656) (60) (898) 846
Adjustments to mining properties: 14
– changes in estimate – – 486 – 486 710
Charged/(credited) to profit:
– increases to existing and new provisions 267 185 456 229 1,137 797
– unused amounts reversed – (36) (38) (70) (144) (187)
– exchange losses/(gains) on provisions – – 13 3 16 (83)
– amortisation of discount – – 372 9 381 383
Utilised in year (219) (122) (319) (177) (837) (1,053)
Actuarial (gains)/losses recognised in equity (781) – – – (781) 121
Subsidiaries no longer consolidated(d) – (29) (257) (32) (318) (622)
Transfers and other movements(e) (6) 10 (65) (15) (76) (64)
At 31 December 2,486 360 9,975 787 13,608 14,642
Balance sheet analysis:
Current 79 274 476 227 1,056 1,275
Non-current 2,407 86 9,499 560 12,552 13,367
Total 2,486 360 9,975 787 13,608 14,642
(a) The main assumptions used to determine the provision for pensions and post-retirement healthcare, and other information, including the expected level of future funding payments in respect of those arrangements, are given in note 44.
(b) The provision for other employee entitlements includes a provision for long service leave of US$242 million (2017: US$292 million), based on the relevant entitlements in certain Group operations and includes US$46 million (2017: US$24 million) of provision for redundancy and severance payments.
(c) The Group’s policy on close-down and restoration costs is described in note 1(k) on page 159 and in paragraph (iv) under “Critical accounting policies and estimates” on pages 162 to 164. Close-down and restoration costs are a normal consequence of mining, and the majority of close-down and restoration expenditure is incurred in the years following closure of the mine, refinery or smelter. Remaining lives of operations and infrastructure range from one to over 60 years with an average for all sites, weighted by present closure obligation, of around 17 years (2017: 20 years). Although the ultimate cost to be incurred is uncertain, the Group’s businesses estimate their respective costs based on current restoration standards and techniques. Provisions of US$9,975 million (2017: US$9,983 million) for close-down and restoration costs and environmental clean-up obligations are based on risk-adjusted cash flows. These estimates have been discounted to their present value at a real risk-free rate of 2% per annum, based on an estimate of the long-term, risk-free, pre-tax cost of borrowing. If the risk-free rate was decreased by 0.5% then the provision would be US$1,139 million higher. Non-current provisions for close-down and restoration/environmental expenditure include amounts relating to environmental clean-up of US$535 million (2017: US$336 million) expected to take place between one and five years from the balance sheet date, and US$683 million (2017: US$839 million) expected to take place later than five years after the balance sheet date. Close-down and restoration/environmental liabilities at 31 December 2018 have not been adjusted for amounts of US$110 million (2017: US$75 million) arising from closure-related receivables from the co-owners of the Diavik Joint Venture and insurance recoveries and other financial assets held for the purposes of meeting these obligations.
(d) “Subsidiaries no longer consolidated” relates primarily to the disposal of Kestrel and Hail Creek, which completed on 1 August 2018 and the disposal of Grasberg on 21 December 2018. In 2017 it related to the disposal of Coal & Allied Industries Limited, which completed on 1 September 2017. Refer to note 37.
(e) Transfers and other movements include transfers to liabilities held for sale relating to Rössing Uranium and ISAL provisions. It also includes an adjustment to record Diavik Diamond Mines Inc. obligations for close-down and restoration on a 100% basis (previously 60% share). Refer to note 33 footnote (e).
Annual report 2018 | riotinto.com186

Notes to the 2018 financial statements continued
27 Share capital – Rio Tinto plc
2018 Number (million)
2017 Number (million)
2016 Number (million)
2018US$m
2017US$m
2016US$m
Issued and fully paid up share capital of 10p each At 1 January 1,351.609 1,384.520 1,384.487 220 224 224Ordinary shares issued(a) (c) 0.035 0.026 0.033 – – –Shares purchased and cancelled(b) (63.984) (32.937) – (9) (4) –At 31 December 1,287.660 1,351.609 1,384.520 211 220 224 Shares held by public At 1 January 1,342.058 1,374.822 1,374.046 Shares reissued from treasury(a) 0.106 0.147 0.743 Shares purchased and cancelled(b) (63.984) (32.937) – Ordinary shares issued(a) (c) 0.035 0.026 0.033 At 31 December 1,278.215 1,342.058 1,374.822 Shares held in treasury 9.445 9.551 9.698 Shares held by public 1,278.215 1,342.058 1,374.822 Total share capital 1,287.660 1,351.609 1,384.520 Other share classes Special Voting Share of 10p each(d) 1 only 1 only 1 only DLC Dividend Share of 10p each(d) 1 only 1 only 1 only Equalisation Share of 10p each(d) 1 only 1 only 1 only
(a) 35,380 ordinary shares were issued in 2018 under the Global Employee Share Plan (GESP). 106,045 ordinary shares were reissued from treasury during the year resulting from the vesting of awards and the exercise of options under Rio Tinto plc employee share-based payment plans, with exercise prices and market values between £16.53 and £43.79 per share (2017: 26,241 ordinary shares were issued under the GESP and 147,126 ordinary shares were reissued from treasury with exercise prices and market values between £28.63 and £37.78 per share; 2016: 33,210 ordinary shares were issued under the GESP and 743,380 ordinary shares reissued from treasury with exercise prices and market values between £16.53 and £32.23 per share).
(b) The authority for the company to buy-back its ordinary shares was renewed at the 2018 annual general meeting. 63,984,287 shares were bought back and cancelled in 2018 under the on-market buy-back programme. 32,937,109 shares were bought back and cancelled in 2017 under the on-market buy-back programme. No shares were bought back in 2016.
(c) The aggregate consideration for new shares issued under the GESP was US$1.0 million (2017: US$1.0 million; 2016: US$0.9 million). The difference between the nominal value and the issue price of the shares issued was credited to the share premium account. The aggregate consideration received for treasury shares reissued was US$6 million (2017: US$2 million; 2016: US$4 million). No new shares were issued as a result of the exercise of options under Rio Tinto plc employee share-based payment plans in 2018, 2017 and 2016.
(d) The “Special Voting Share” was issued to facilitate the joint voting by shareholders of Rio Tinto plc and Rio Tinto Limited on Joint Decisions, following the DLC Merger. The “DLC Dividend Share” was issued to facilitate the efficient management of funds within the DLC structure. Directors have the ability to issue an Equalisation Share if that is required under the terms of the DLC Merger Sharing Agreement.
During 2018, US$140 million of shares and ADRs (2017: US$38.9 million; 2016: US$40.1 million) were purchased by employee share ownership trusts on behalf of Rio Tinto plc to satisfy future share options and awards as they vest. At 31 December 2018, 1,770,651 shares and 72,809 ADRs were held in the employee share ownership trusts on behalf of Rio Tinto plc.
Information relating to share options and other share-based incentive schemes is given in note 43.
Subsequent to 31 December 2018, 10,956,767 shares were brought back and cancelled under the on-market buy-back programme.
28 Share capital – Rio Tinto Limited
2018 Number (million)
2017 Number (million)
2016 Number (million)
2018US$m
2017US$m
2016US$m
Issued and fully paid up share capital At 1 January 412.41 424.19 424.19 4,140 3,915 3,950Adjustment on currency translation (382) 310 (35)Ordinary shares purchased and cancelled(a) (b) (41.20) (11.78) – (281) (85) –At 31 December 371.21 412.41 424.19 3,477 4,140 3,915 – Special Voting Share(c) 1 only 1 only 1 only – DLC Dividend Share(c) 1 only 1 only 1 only
Total share capital 371.21 412.41 424.19
(a) In November 2018, 41,198,134 Rio Tinto Limited ordinary shares were purchased at A$69.69 per share and cancelled under an off-market share buy-back programme carried out pursuant to the shareholder approval granted at Rio Tinto Limited’s 2018 annual general meeting for off-market and on-market buy-backs of up to 41.2 million Rio Tinto Limited ordinary shares.
(b) In November 2017, 11,778,064 Rio Tinto Limited ordinary shares were purchased at A$63.67 per share and cancelled under an off-market share buy-back programme carried out pursuant to the shareholder approval granted at Rio Tinto Limited’s 2017 annual general meeting for off-market and on-market buy-backs of up to 42.4 million Rio Tinto Limited ordinary shares.
(c) The “Special Voting Share” was issued to facilitate the joint voting by shareholders of Rio Tinto Limited and Rio Tinto plc on Joint Decisions following the DLC Merger. The “DLC Dividend Share” was issued to facilitate the efficient management of funds within the DLC structure. Directors have the ability to issue an Equalisation Share if that is required under the terms of the DLC Merger Sharing Agreement.
During 2018, US$114 million of shares (2017: US$37.5 million; 2016: US$48.5 million) were purchased by employee share ownership trusts on behalf of Rio Tinto Limited to satisfy future share options and awards as they vest. At 31 December 2018, 1,416,728 shares were held in the employee share ownership trusts on behalf of Rio Tinto Limited.
Information relating to share options and other share-based incentive schemes is given in note 43.
Annual report 2018 | riotinto.com 187
Financial statements

Financial statements
Notes to the 2018 financial statements continued
29 Other reserves and retained earnings
2018US$m
2017US$m
2016US$m
Capital redemption reserve(a)
At 1 January 38 34 34
Own shares purchased and cancelled 9 4 –
At 31 December 47 38 34
Cash flow hedge reserve
At 1 January 32 32 –
Adjustment for transition to new accounting standards (note 45) (4) – –
Cash flow hedge gains/(losses) 156 62 (88)
Cash flow hedge losses/(gains) transferred to the income statement 40 (62) 116
Tax on the above (54) – 4
Transfers and other movements 25 – –
At 31 December 195 32 32
Available for sale revaluation reserves
At 1 January 20 (126) (139)
Adjustment for transition to new accounting standards (note 45) (20) – –
Gains on available for sale securities – 19 13
Losses on available for sale securities transferred to the income statement – 6 –
Tax on the above – (1) –
Transfers and other movements – 122 –
At 31 December – 20 (126)
Fair value through other comprehensive income reserve
At 1 January – – –
Adjustment for transition to new accounting standards (note 45) 8 – –
Losses on equity investments (11) – –
Transfers to retained earnings (3) – –
At 31 December (6) – –
Cost of hedging reserve
At 1 January – – –
Adjustment for transition to new accounting standards (note 45) 26 – –
Cost of hedging deferred to reserves during the year (36) – –
Transfer of cost of hedging to the income statement (3) – –
At 31 December (13) – –
Other reserves(b)
At 1 January 11,714 11,861 11,735
Change in equity interest held by Rio Tinto – – 108
Own shares purchased from Rio Tinto Limited shareholders to satisfy share options (114) (64) (43)
Employee share options: value of services 52 31 58
Deferred tax on share options (2) 10 3
Companies no longer consolidated – (124) –
At 31 December 11,650 11,714 11,861
Foreign currency translation reserve(c)
At 1 January 480 (2,585) (2,491)
Parent and subsidiaries currency translation and exchange adjustments (3,658) 2,942 (204)
Equity accounted units currency translation adjustments (48) 34 11
Currency translation reclassified on disposal 14 78 99
Transfers and other movements – 11 –
At 31 December (3,212) 480 (2,585)
Total other reserves per balance sheet 8,661 12,284 9,216
Annual report 2018 | riotinto.com188

Notes to the 2018 financial statements continued
2018US$m
2017US$m
2016US$m
Retained earnings(d)
At 1 January 23,761 21,631 19,736
Adjustment for transition to new accounting standards (note 45) (179) – –
Parent and subsidiaries’ profit for the year 13,125 8,423 4,298
Equity accounted units’ profit after tax for the year 513 339 319
Actuarial gains/(losses)(e) 894 1 (94)
Tax relating to components of other comprehensive income (269) (150) 30
Total comprehensive income for the year 14,263 8,613 4,553
Share buy-back programme (5,423) (2,312) –
Dividends paid (5,356) (4,250) (2,725)
Change in equity interest held by Rio Tinto 60 43 40
Companies no longer consolidated – 130 –
Own shares purchased/treasury shares reissued for share options and other movements (140) (18) (37)
Employee share options and other IFRS 2 charges taken to the income statement 61 57 64
Transfer from FVOCI reserve 3 – –
Transfers and other movements (25) (133) –
At 31 December 27,025 23,761 21,631
(a) The capital redemption reserve was set up to comply with section 733 of the UK Companies Act 2006 (previously section 170 of the UK Companies Act 1985) when shares of a company are redeemed or purchased wholly out of the company’s profits. Balances reflect the amount by which the company’s issued share capital is diminished in accordance with this section.
(b) Other reserves includes US$11,936 million which represents the difference between the nominal value and issue price of the shares issued arising from Rio Tinto plc’s rights issue completed in July 2009. No share premium was recorded in the Rio Tinto plc financial statements through the operation of the merger relief provisions of the UK Companies Act 1985. Other reserves also include the cumulative amount recognised under IFRS 2 in respect of options granted but not exercised to acquire shares in Rio Tinto Limited, less, where applicable, the cost of shares purchased to satisfy share options exercised. The cumulative amount recognised under IFRS 2 in respect of options granted but not exercised to acquire shares in Rio Tinto plc is recorded in retained earnings.
(c) Exchange differences arising on the translation of the Group’s net investment in foreign controlled companies are taken to the foreign currency translation reserve, as described in note 1(d). The cumulative differences relating to an investment are transferred to the income statement when the investment is disposed of.
(d) Retained earnings and movements in reserves of subsidiaries include those arising from the Group’s share of joint operations.(e) There were no actuarial losses relating to equity accounted units in 2018, 2017 or 2016.
30 Financial instruments and risk managementExcept where stated, the information given below relates to the financial instruments of the parent companies and their subsidiaries and joint operations, and excludes those of equity accounted units. The information is grouped in the following sections:
A – Financial assets and liabilities by categoriesB – Derivative financial instrumentsC – Fair values
A (a) Financial assets and liabilities by categories
At 31 December 2018 Note
IFRS 9
Total US$m
Amortisedcost
US$m
Fair valuethrough other
comprehensiveincome
US$m
Fair valuethrough
profit andloss
US$m
Financial assets
Cash and cash equivalents 21 10,773 2,779 – 7,994
Trade and other financial receivables(a) (b) 18 3,007 2,015 – 992
Equity shares and quoted funds 20 130 – 53 77
Other investments, including loans(c) 20 2,782 6 – 2,776
Derivatives related to net debt: designated as hedges(d) 20, 24 70 – – 70
Derivatives and embedded derivatives not related to net debt: not designated as hedges(d) 20 432 – – 432
Embedded derivatives not related to net debt: designated as hedges(d) 20 54 – – 54
Loans to equity accounted units including quasi equity loans 167 167 – –
Total financial assets 17,415 4,967 53 12,395
Financial liabilities
Trade and other financial payables(e) 25 (5,552) (5,513) (39)
Short-term borrowings and bank overdrafts 22 (312) (312) –
Medium-term and long-term borrowings 22 (12,440) (12,440) –
Derivatives related to net debt: designated as hedges(d) 22, 24 (358) – (358)
Derivatives and embedded derivatives not related to net debt: not designated as hedges(d) 22 (98) – (98)
Embedded derivatives not related to net debt: designated as hedges(d) 22 (46) – (46)
Other financial liabilities 22 (666) (666) –
Total financial liabilities (19,472) (18,931) (541)
Annual report 2018 | riotinto.com 189
Financial statements

Financial statements
Notes to the 2018 financial statements continued
30 Financial instruments and risk management continued
At 31 December 2017 Note
IAS 39
TotalUS$m
Loans andreceivables
US$m
Availablefor sale
securitiesUS$m
Held atfair value
US$m
Held to maturityassets/other
financialliabilities
US$m
Financial assets
Cash and cash equivalents 21 10,550 10,550 – – –
Trade and other financial receivables(a) (b) 18 2,985 2,895 – 90 –
Equity shares and quoted funds 20 136 – 136 – –
Other investments, including loans(c) 20 1,152 15 – 1,125 12
Derivatives related to net debt: designated as hedges(d) 20, 24 99 – – 99 –
Derivatives and embedded derivatives not related to net debt: not designated as hedges(d) 20 168 – – 168 –
Loans to equity accounted units including quasi equity loans 198 198 – – –
Total financial assets 15,288 13,658 136 1,482 12
Financial liabilities
Trade and other financial payables(e) 25 (5,922) (15) (5,907)
Short-term borrowings and bank overdrafts 22 (552) – (552)
Medium-term and long-term borrowings 22 (14,624) – (14,624)
Derivatives related to net debt: designated as hedges(d) 22, 24 (276) (276) –
Other derivatives and embedded derivatives: not designated as hedges(d) 22 (255) (255) –
Other financial liabilities 22 (345) – (345)
Total financial liabilities (21,974) (546) (21,428)
(a) Trade and other financial receivables comprise trade receivables, other financial receivables, and amounts due from equity accounted units within note 18.(b) Under IFRS 9, provisionally priced receivables are fair valued. In the prior year, under IAS 39, only the embedded pricing derivatives, which were separated from the host receivables, were
fair valued.(c) Other investments, including loans, comprise US$2,522 million (2017: US$958 million) of highly liquid financial assets in managed investment funds classified as held for trading.(d) These financial assets and liabilities in aggregate agree to total derivative financial instruments disclosed in notes 20 and 22.(e) Trade and other financial payables comprise trade payables, other financial payables, accruals and amounts due to equity accounted units within note 25. The trade and other payables held at
fair value are valued using level 2 inputs.
A (b) Financial risk management Objectives and policyRio Tinto’s policies on financial risk management are defined such that the Group has a capital structure in place to manage the organisation through the commodity cycle and that the Group’s exposures may float with the market. Any exceptions to this general principle are formally approved. The Group is exposed to capital, liquidity, commodity price, credit, foreign exchange and interest rate risk. Treasury oversees the management of these risks along with the cash management and investment activities of the Group. It performs its activities in a strong control environment, within board-approved limits. These are reviewed and approved by the board at least annually.
Rio Tinto does not acquire or issue derivative financial instruments for trading or speculative purposes; nor does it believe that it has material exposure to such trading or speculative holdings through its investments in joint arrangements and associates. However, derivatives are used as and when required in order to manage the Group’s exposure in accordance with its underlying financial risk management principles. A specialist team who have the appropriate skills and experience, with oversight from the treasurer, carries this out.
Summarised below are the risks and the agreed policies to manage the risks identified above.
(i) Capital and liquidity risk managementThe Group’s overriding objective when managing capital and liquidity is to safeguard the business as a going concern by maintaining a strong balance sheet whilst maximising returns for shareholders.
The board and senior management regularly review the capital structure and liquidity of the Group taking into account: the Group’s strategic priorities, the economic and business conditions, and investment opportunities that have been identified, along with the expected returns to shareholders. The board expects total cash returns to shareholders over the longer term to be in a range of 40% to 60% of underlying earnings in aggregate throughout the commodity cycle.
Their review considers various financial metrics. These include analysing net debt, gearing, the overall level of borrowings and their maturity profile, liquidity levels, total capital, future cash flows, EBITDA and interest cover ratios.
Net debt decreased from US$3.8 billion at 31 December 2017 to net cash of US$0.3 billion at 31 December 2018 as operating cash inflows and divestment proceeds were partly offset by capital expenditure and cash returns to shareholders. At 31 December 2018 net gearing was (1%) (2017: 7%) and interest cover was 22 times (2017: 14 times).
Annual report 2018 | riotinto.com190

Notes to the 2018 financial statements continued
Total capital for the Group is summarised below:
Total capital Note2018
US$m2017
US$m
Equity attributable to owners of Rio Tinto (see Group balance sheet) 43,686 44,711
Equity attributable to non-controlling interests (see Group balance sheet) 6,137 6,404
Net debt 24 (255) 3,845
Total capital 49,568 54,960
The Group has access to various forms of financing including its US Shelf Programme, European Debt Issuance Programme, Commercial Paper and credit facilities. The Group did not issue any listed debt in 2018 under these programmes.
It also has access to a US$1.9 billion facility which was extended in 2018 and now matures in November 2021 with a one-year extension option and a US$5.6 billion facility (including a US$ denominated same day access swing-line facility) which matures in November 2022. The funds available can be used for general corporate purposes of the Group. At 31 December 2018 the facilities were undrawn.
Advances under the revolving facilities bear an interest rate per annum based on LIBOR (or EURIBOR, CDOR or BBSW in relation to any euro, Canadian dollar or Australian dollar loans respectively) plus a margin (which is dependent on the Group’s long-term credit rating as determined by Moody’s and Standard & Poor’s and the level of drawdown). The facility agreements contain no financial covenants.
The table below summarises the credit ratings attributed to the Group by Standard & Poor’s and Moody’s investor services as at 31 December.
2018 2017
Long-term rating(a) A/A3 A-/A3
Short-term rating(a) A-1/P-2 A-1/P-2
Outlook Stable/Stable Positive/Stable
(a) On 6 February 2019 Moody’s upgraded the Group’s long-term credit rating to A2 and short-term credit rating to P-1 with a stable outlook.
The unified credit status of the Group is maintained through cross-guarantees whereby contractual obligations of Rio Tinto plc and Rio Tinto Limited are automatically guaranteed by the other.
During 2018, the Group redeemed bonds in aggregate with a notional principal value of US$1.9 billion (2017: US$2.5 billion) as part of the liability management programme. These bonds were issued by Rio Tinto Finance (USA) plc, Rio Tinto Finance plc and Rio Tinto Finance (USA) Limited. Due to early redemption costs this led to an aggregate cash outflow on those redemptions of US$2.0 billion (2017: US$2.7 billion) before fees.
The table below summarises the maturity profile of the Group’s financial liabilities based on contractual undiscounted payments. It will therefore not necessarily agree with the amounts disclosed in the balance sheet.
Financial liability analysis
At 31 December 2018 (Outflows)/inflows
Within 1 year or on
demandUS$m
Between1 and 2
yearsUS$m
Between2 and 3
yearsUS$m
Between3 and 4
yearsUS$m
Between4 and 5
yearsUS$m
After5 years
US$mTotal
US$m
Non-derivative financial liabilities
Trade and other financial payables (5,129) (423) – – – – (5,552)
Borrowings before swaps (312) (562) (166) (660) (741) (10,476) (12,917)
Expected future interest payments(a) (651) (653) (636) (630) (586) (4,082) (7,238)
Other financial liabilities (666) – – – – – (666)
Derivative financial liabilities(b)
Derivatives related to net debt – net settled (36) (36) (36) (36) 4 (8) (148)
Derivatives related to net debt – gross settled(a):
– gross inflows 48 508 39 39 39 1,278 1,951
– gross outflows (79) (595) (58) (58) (58) (1,581) (2,429)
Derivatives not related to net debt – net settled (27) (13) (5) (5) (5) (28) (83)
Derivatives not related to net debt – gross settled:
– gross inflows 1,664 – – – – – 1,664
– gross outflows (1,733) – – – – – (1,733)
Total (6,921) (1,774) (862) (1,350) (1,347) (14,897) (27,151)
Annual report 2018 | riotinto.com 191
Financial statements

Financial statements
Notes to the 2018 financial statements continued
30 Financial instruments and risk management continued
At 31 December 2017 (Outflows)/inflows
Within 1 year or on
demandUS$m
Between1 and 2
yearsUS$m
Between2 and 3
yearsUS$m
Between3 and 4
yearsUS$m
Between4 and 5
yearsUS$m
After5 yearsUS$m
TotalUS$m
Non-derivative financial liabilities
Trade and other financial payables (5,488) (434) – – – – (5,922)
Borrowings before swaps (552) (148) (1,011) (916) (1,283) (11,387) (15,297)
Expected future interest payments(a) (679) (673) (670) (638) (606) (4,553) (7,819)
Other financial liabilities (302) (43) – – – – (345)
Derivative financial liabilities(b)
Derivatives related to net debt – net settled 10 10 14 11 7 36 88
Derivatives related to net debt – gross settled(a):
– gross inflows 62 62 958 44 44 1,493 2,663
– gross outflows (82) (82) (1,051) (55) (55) (1,741) (3,066)
Derivatives not related to net debt – net settled (43) (36) (33) (24) (21) (138) (295)
Derivatives not related to net debt – gross settled:
– gross inflows 795 – – – – – 795
– gross outflows (802) – – – – – (802)
Total (7,081) (1,344) (1,793) (1,578) (1,914) (16,290) (30,000)
(a) Interest payments have been projected using interest rates applicable at the end of the applicable financial year. Where debt is subject to variable interest rates, future interest payments are subject to change in line with market rates.
(b) The maturity grouping is based on the earliest payment date.
Offsetting and enforceable master netting agreementsFinancial assets and liabilities are offset and the net amount reported in the consolidated balance sheet when there is a legally enforceable right to offset the recognised amounts and there is an intention to settle on a net basis or realise the asset and settle the liability simultaneously. There were no material amounts offset in the balance sheet and no material enforceable master netting agreements were identified.
(ii) Commodity price riskThe Group’s normal policy is to sell its products at prevailing market prices. Exceptions to this rule are subject to strict limits laid down by the board and to rigid internal controls.
The Group’s products are sold to customers under contracts which vary in tenure and pricing mechanisms, including some volumes sold in the spot market. Sales revenue may be subject to adjustment if the product specification does not conform to the terms specified in the sales contract.
Pricing for iron ore is on a range of terms, the majority being either monthly or quarterly average pricing mechanisms, with a smaller proportion of iron ore volumes being sold on the spot market.
Copper and aluminium are generally sold under contracts which vary in tenure and pricing mechanisms, with some volumes sold in the spot market. The prices are determined by reference to prevailing market prices on terminal markets, such as the London Metal Exchange (LME) and the Commodities Exchange (COMEX) in New York. Prices fluctuate widely in response to changing levels of supply and demand but, in the long run, prices are related to the marginal cost of supply. Gold is also priced in an active market in which prices respond to daily changes in quantities offered and sought. Newly mined gold is only one source of supply; investment and disinvestment can be important elements of supply and demand.
Certain of the Group’s products may be provisionally priced at the date revenue is recognised; however, substantially all iron ore and aluminium sales are reflected at final prices in the results for the period. The final selling price for all provisionally priced products is based on the price for the quotational period stipulated in the contract. Final prices for copper concentrate are normally determined between 30 and 180 days after delivery to the customer. The change in value of the provisionally priced receivable is based on relevant forward market prices and is included in sales revenue.
As at 31 December 2018, the Group had 240 million pounds of copper sales (31 December 2017: 250 million pounds) that were provisionally priced at US 277 cents per pound (2017: US 304 cents per pound). The final price of these sales will be determined during the first half of 2019. A 10% change in the price of copper realised on the provisionally priced sales, all other factors held constant, would increase or reduce net earnings by US$37 million (2017: US$41 million).
The Group is also exposed to changes in commodity prices on purchases of raw materials and consumables.
Annual report 2018 | riotinto.com192
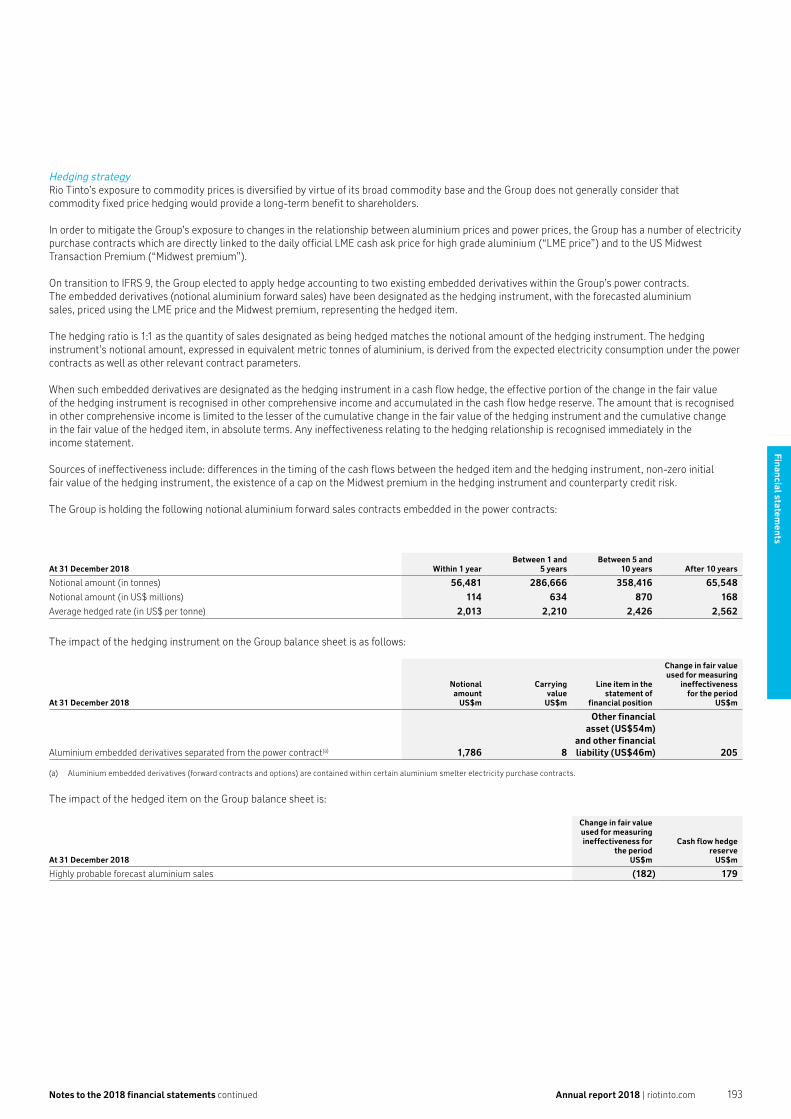
Notes to the 2018 financial statements continued
Hedging strategyRio Tinto’s exposure to commodity prices is diversified by virtue of its broad commodity base and the Group does not generally consider that commodity fixed price hedging would provide a long-term benefit to shareholders.
In order to mitigate the Group’s exposure to changes in the relationship between aluminium prices and power prices, the Group has a number of electricity purchase contracts which are directly linked to the daily official LME cash ask price for high grade aluminium (“LME price”) and to the US Midwest Transaction Premium (“Midwest premium”).
On transition to IFRS 9, the Group elected to apply hedge accounting to two existing embedded derivatives within the Group’s power contracts. The embedded derivatives (notional aluminium forward sales) have been designated as the hedging instrument, with the forecasted aluminium sales, priced using the LME price and the Midwest premium, representing the hedged item.
The hedging ratio is 1:1 as the quantity of sales designated as being hedged matches the notional amount of the hedging instrument. The hedging instrument’s notional amount, expressed in equivalent metric tonnes of aluminium, is derived from the expected electricity consumption under the power contracts as well as other relevant contract parameters.
When such embedded derivatives are designated as the hedging instrument in a cash flow hedge, the effective portion of the change in the fair value of the hedging instrument is recognised in other comprehensive income and accumulated in the cash flow hedge reserve. The amount that is recognised in other comprehensive income is limited to the lesser of the cumulative change in the fair value of the hedging instrument and the cumulative change in the fair value of the hedged item, in absolute terms. Any ineffectiveness relating to the hedging relationship is recognised immediately in the income statement.
Sources of ineffectiveness include: differences in the timing of the cash flows between the hedged item and the hedging instrument, non-zero initial fair value of the hedging instrument, the existence of a cap on the Midwest premium in the hedging instrument and counterparty credit risk.
The Group is holding the following notional aluminium forward sales contracts embedded in the power contracts:
At 31 December 2018 Within 1 yearBetween 1 and
5 yearsBetween 5 and
10 years After 10 years
Notional amount (in tonnes) 56,481 286,666 358,416 65,548
Notional amount (in US$ millions) 114 634 870 168
Average hedged rate (in US$ per tonne) 2,013 2,210 2,426 2,562
The impact of the hedging instrument on the Group balance sheet is as follows:
At 31 December 2018
Notionalamount
US$m
Carryingvalue
US$m
Line item in the statement of
financial position
Change in fair value used for measuring
ineffectivenessfor the period
US$m
Aluminium embedded derivatives separated from the power contract(a) 1,786 8
Other financial asset (US$54m)
and other financial liability (US$46m) 205
(a) Aluminium embedded derivatives (forward contracts and options) are contained within certain aluminium smelter electricity purchase contracts.
The impact of the hedged item on the Group balance sheet is:
At 31 December 2018
Change in fair value used for measuring ineffectiveness for
the period US$m
Cash flow hedge reserve
US$m
Highly probable forecast aluminium sales (182) 179
Annual report 2018 | riotinto.com 193
Financial statements

Financial statements
Notes to the 2018 financial statements continued
30 Financial instruments and risk management continuedThe effect of the cash flow hedge in the statement of profit or loss and other comprehensive income (OCI) is:
At 31 December 2018
Total hedging gain recognised
in OCIUS$m
Ineffectiveness recognised in profit or loss
US$m
Line item inthe statement of
profit or loss
Amount reclassified from OCI to
profit or lossUS$m
Line item in the statement of profit or loss
Highly probable forecast aluminium sales 181 24
Net operating costs (raw materials,
consumables, repairs and
maintenance) 2 Consolidated sales revenue
There was no cost of hedging recognised during 2018 relating to this hedge relationship.
Details of commodity derivatives, not designated as hedges held at 31 December 2018 are set out in section B.
SensitivitiesThe Group’s commodity derivatives are impacted by changes in market prices.
The table below summarises the impact that changes in aluminium market prices have on aluminium forward and option contracts embedded in power supply agreements outstanding at 31 December 2018. There will be an offsetting change in future Group earnings with any changes in price.
Change inmarket prices
2018US$m
2017US$m
Effect on net earnings +10% (102) (203)
-10% 35 212
Effect on equity +10% (101) –
-10% 103 –
The Group’s “own use contracts” are excluded from the sensitivity analysis as they are outside the scope of IFRS 9. Such contracts to buy or sell non-financial items continue to be held for the purpose of the receipt or delivery of the non-financial item in accordance with the business unit’s expected purchase, sale or usage requirements.
(iii) Credit riskCredit risk is the risk that a counterparty will not meet its obligations under a financial instrument or customer contract, leading to a financial loss. The Group is exposed to credit risk from its operating activities (primarily from customer receivables) and from its financing activities, including investments in treasury and liquidity funds, deposits with banks and financial institutions, other short-term investments, interest rate and currency derivative contracts and other financial instruments.
Credit risks related to receivablesCustomer credit risk is managed by the Commercial team subject to the Group’s established policy, procedures and controls relating to customer credit risk management. Credit limits are established for all customers based on internal or external rating criteria. Where customers are rated by an independent credit rating agency, these ratings are used to set credit limits. In circumstances where no independent credit rating exists, the credit quality of the customer is assessed based on a credit rating scorecard. Outstanding customer receivables are regularly monitored and any credit concerns highlighted to senior management. Shipments to major customers are often covered by letters of credit or other forms of credit insurance.
At 31 December 2018, the Group had approximately 113 customers (2017: 115 customers) that owed the Group more than US$5 million each and these balances accounted for approximately 84% (2017: 78%) of all trade receivables. There were 17 customers (2017: 23 customers) with balances greater than US$20 million accounting for just over 34% (2017: 35%) of all trade receivables. The expected credit loss on the Group’s trade receivable portfolio is insignificant (see note 18).
Credit risk related to financial instruments and cash deposits Credit risk from investments in government securities (primarily US Government), corporate and asset-backed securities or money market funds, and balances with banks and financial institutions is managed by Group Treasury in accordance with a board-approved policy. Investments of surplus funds are made only with approved investment grade (BBB- and above) counterparties who have been assigned specific credit limits. The board reviews these annually. The limits are set to minimise the concentration of credit risk and therefore mitigate the potential for financial loss through counterparty failure.
Annual report 2018 | riotinto.com194

Notes to the 2018 financial statements continued
The maximum credit risk exposure of the Group’s financial assets at the balance sheet date is as follows:
Note2018
US$m 2017
US$m
Cash and cash equivalents 21 10,773 10,550
Trade and other financial receivables 18 3,007 2,985
Investments 20 2,782 1,152
Derivative assets 20 556 267
Loans to equity accounted units 38 39
Total 17,156 14,993
(iv) Foreign exchange riskThe Group’s earnings, cash flows and shareholders’ equity are influenced by a wide variety of currencies due to the geographic diversity of the Group’s sales and the countries in which it operates. The US dollar is the currency in which the majority of the Group’s sales are denominated. Operating costs are influenced by the currencies of those countries where the Group’s mines and processing plants are located and also by those currencies in which the costs of imported equipment and services are determined. Apart from the US dollar, the Australian and Canadian dollars are the most important currencies influencing costs. In any particular year, currency fluctuations may have a significant impact on Rio Tinto’s financial results. A strengthening of the US dollar against the currencies in which the Group’s costs are partly denominated has a positive effect on Rio Tinto’s underlying earnings. However, a strengthening of the US dollar does reduce the value of non-US dollar-denominated net assets and therefore total equity.
Borrowings and cash are predominantly denominated in US dollars, either directly or through the use of derivatives, as it is the most appropriate currency for financing the Group’s operations.
The majority of debt and other financial assets and liabilities including intragroup balances, are held in the functional currency of the relevant subsidiary. In a small number of instances, US dollar debt and other financial assets and liabilities, including intragroup balances, are held in currencies other than the functional currency of the relevant subsidiary. This results in an accounting exposure to exchange gains and losses as the financial assets and liabilities are translated into the functional currency of the subsidiary that holds those assets and liabilities. These exchange gains and losses are recorded in the Group’s income statement except to the extent that they can be taken to equity under the Group’s accounting policy which is explained in note 1(d). The Group’s income statement includes realised and unrealised exchange gains/losses arising on US dollar external borrowings and intragroup balances in entities with a non-US dollar functional currency. On translation to the Group’s US dollar presentation currency, there is a corresponding and offsetting exchange difference on translation of these balances which is recognised directly in the currency translation reserve. There is no impact on total equity. Gains and losses on US dollar net debt and on non-trading intragroup balances are excluded from underlying earnings. Other exchange gains and losses are included in underlying earnings.
See section B for the details of cross-currency interest rate swaps relating to borrowings.
The table below summarises, by currency, the Group’s net debt, after taking into account relevant cross-currency interest rate swaps and foreign exchange contracts:
Net cash/(debt) by currency
Totalborrowings
excluding overdrafts
US$m
Derivativesrelated to net
debtUS$m
Cash andcash
equivalentsUS$m
Otherinvestments
US$m
Net cash/(debt) 2018US$m
Net cash/ (debt) 2017
US$m
US dollar (12,080) (288) 10,310 2,522 464 (3,628)
Australian dollar (472) – 217 – (255) (208)
Euro (39) – 17 – (22) (58)
South African rand – – 95 – 95 59
Canadian dollar (157) – 23 – (134) (148)
Other (3) – 110 – 107 138
Total (12,751) (288) 10,772 2,522 255 (3,845)
Hedging strategyUnder normal market conditions, the Group does not consider that active currency hedging of transactions would provide long-term benefits to shareholders. The Group reviews its exposure on a regular basis and will undertake hedging if deemed appropriate. Currency protection measures may be deemed appropriate in specific commercial circumstances. Capital expenditures and other significant financial items such as acquisitions, disposals, tax and dividend cash flows may be hedged subject to strict limits laid down by the board. Refer to section B for details of the cross-currency interest rate swaps, and the currency forward and option contracts used to manage the currency risk exposures of the Group at 31 December 2018.
Annual report 2018 | riotinto.com 195
Financial statements

Financial statements
Notes to the 2018 financial statements continued
30 Financial instruments and risk management continuedSensitivitiesThe table below gives the estimated retranslation effect on financial assets and financial liabilities, including intragroup balances, of a 10% strengthening in the closing exchange rate of the US dollar against significant currencies. 10% is the annual exchange rate movement that management deems to be reasonably probable (on an annual basis over the long run) for one of the Group’s significant currencies and as such provides an appropriate representation. Sensitivities are calculated in the functional currencies of individual Group entities. The impact of these on net earnings and underlying earnings is translated into US dollars at the year-end exchange rates presented in note 41. The sensitivity associated with a 10% weakening of a particular currency would be broadly equal and opposite within equity to the figures presented below. The impact is expressed in terms of the effect on net earnings, underlying earnings and equity, assuming that each exchange rate moves in isolation. The sensitivities are based on financial assets and financial liabilities held at 31 December 2018, where balances are not denominated in the functional currency of the subsidiary or joint operation, and exclude financial assets and liabilities held by equity accounted units. These balances will not remain constant throughout 2019, and therefore the following information should be used with care.
At 31 December 2018Gains/(losses) associated with 10% strengthening of the US dollar
Currency exposure
Closingexchange
rateUS cents
Effect onnet
earningsUS$m
Of whichamount
impactingunderlying
earningsUS$m
Impactdirectly
on equityUS$m
Australian dollar 70 346 1 (993)
Canadian dollar 73 (82) 7 –
Euro 114 202 5 –
At 31 December 2017Gains/(losses) associated with 10% strengthening of the US dollar
Currency exposure
Closingexchange
rateUS cents
Effect onnet
earningsUS$m
Of whichamount
impactingunderlying
earningsUS$m
Impactdirectly
on equityUS$m
Australian dollar 78 608 47 (1,657)
Canadian dollar 79 (134) 3 –
Euro 120 165 (2) –
(v) Interest rate riskInterest rate risk refers to the risk that the value of a financial instrument or cash flows associated with the instrument will fluctuate due to changes in market interest rates. The Group’s interest rate management policy is generally to borrow and invest at floating interest rates. This approach is based on the historically lower cost of borrowing at floating rates and historical correlation between interest rates and commodity prices. However, in certain circumstances the Group may elect to maintain a higher proportion of fixed-rate funding.
Hedging strategyAs noted above, the Group hedges its interest rate risk by entering into interest rate derivatives to achieve its policies. The Group reviews the positions on a regular basis. During 2018, in conjunction with its liability management programme, the Group closed out interest rate swaps with a notional principal amount of US$1.9 billion (2017: US$2.0 billion), giving rise to a net cash outflow of US$51 million (2017: US$5 million), including accrued interest of US$11 million (2017: US$2 million). The interest rate swaps were in fair value hedge relationships prior to being closed out. See section B for details of currency and interest rate swaps relating to borrowings.
At the end of 2018, US$10.2 billion (2017: US$12.5 billion) of the Group’s adjusted gross borrowings were at floating rates after taking into account interest and currency interest rate swaps, resulting in a floating to fixed debt ratio of 79% floating to 21% fixed (2017: 82% floating to 18% fixed). The weighted average maturity was approximately 11 years (2017: ten years) based on current interest rates and the carrying value of gross borrowings at the year end.
See note 22 for the details of outstanding debt and hedging arrangements with regard to debt at 31 December 2018.
SensitivitiesBased on the floating rate financial instruments outstanding at 31 December 2018, the effect on net earnings of a 100 basis point increase in US dollar LIBOR interest rates, with all other variables held constant, would be an income of US$8 million (2017: charge of US$8 million) due to the net cash position in 2018 versus the net debt position in 2017. The Group has an exposure to interest rate volatility within shareholders’ equity arising from fair value movements on derivatives in the cash flow hedge reserve. These derivatives have an underlying exposure to sterling and US dollars. With all factors remaining constant, and based on the composition of derivatives impacting the cash flow reserve at 31 December 2018, the sensitivity of a 100 basis point increase in interest rates in each of the currencies in isolation would impact equity, before tax, by a charge of US$69 million (2017: US$84 million charge) for sterling and a credit of US$78 million (2017: US$88 million credit) for US dollars. A 100 basis point decrease would have broadly the same impact in the opposite direction. These balances will not remain constant throughout 2019, and therefore this information should be used with care.
Annual report 2018 | riotinto.com196

Notes to the 2018 financial statements continued
B Derivative financial instrumentsThe Group’s derivatives, including embedded derivatives, as at 31 December, are summarised below.
Total fair value
2018 2017
AssetUS$m
LiabilityUS$m
AssetUS$m
LiabilityUS$m
Derivatives designated as hedges
Interest rate swaps(a) 70 (137) 99 (127)
Cross-currency interest rate swaps(b) – (221) – (149)
Aluminium embedded derivatives(c) 54 (46) – –
Total derivatives designated as hedges 124 (404) 99 (276)
Derivatives not designated as hedges
Currency forward contracts, options and swaps – (68) 7 (2)
Aluminium forward contracts(d) 26 (19) 21 (9)
Aluminium embedded derivatives(c) 346 – 140 (238)
Other embedded derivatives 6 – – (5)
Other commodity contracts 54 (11) – (1)
Total derivatives not designated as hedges 432 (98) 168 (255)
Total derivative instruments 556 (502) 267 (531)
Analysed by maturity:
Less than 1 year 88 (95) 29 (50)
Between 1 and 5 years 153 (205) 31 (233)
More than 5 years 315 (202) 207 (248)
Total 556 (502) 267 (531)
Total net derivative instruments 54 (264)
Reconciliation to balance sheet Note2018
US$m2017
US$m
Non-current assets 20 468 238
Current assets 20 88 29
Current liabilities 22 (95) (50)
Non-current liabilities 22 (407) (481)
Total net derivative instruments 54 (264)
(a) The interest rate swaps are used to convert certain fixed rate borrowings to a floating rate. For further details, see note 22.(b) The cross-currency interest rate swaps are used to convert non-US dollar denominated borrowings to either fixed or floating US dollar borrowings. For further details see note 22.(c) Aluminium embedded derivatives (forward contracts and options) are contained within certain aluminium smelter electricity purchase contracts. These contracts reduce the Group’s margin
exposure to movements in the aluminium price.(d) The aluminium forward contracts are entered into to convert aluminium sales made at a fixed price to the market price (LME cash). In 2017 and 2018 these contracts were not designated
as hedges.
C Fair valuesThe carrying amounts and fair values of all of the Group’s financial instruments which are not carried at an amount which approximates their fair value at 31 December 2018 and 31 December 2017 are shown in the following table. The fair values of the Group’s cash equivalents and loans to equity accounted units approximate their carrying values as a result of their short maturity or because they carry floating rates of interest.
Note
31 December 2018 31 December 2017
Carryingvalue
US$m
Fairvalue
US$m
Carryingvalue
US$m
Fair value
US$m
Short-term borrowings 22 (312) (312) (552) (552)
Medium-term and long-term borrowings 22 (12,440) (13,554) (14,624) (16,385)
Borrowings with a carrying value of US$7.5 billion (2017: US$9.6 billion) relate to listed bonds with a fair value of US$8.3 billion (2017: US$10.9 billion) and are categorised as level 1 in the fair value hierarchy. Borrowings with a carrying value of US$4.2 billion (2017: US$4.1 billion) relate to project finance drawn down with a fair value of US$4.6 billion (2017: US$4.7 billion) and are categorised as level 3 in the fair value hierarchy. This is because the fair value of Oyu Tolgoi’s borrowings has been estimated with reference to a market yield, the variability of which is considered a reasonable indicator, over the pre-completion period, of movements in the fair value of amounts drawn under the project finance facility. Post-completion, the fair value has been estimated with reference to the annual interest rate on each tranche of the facility, and consideration of factors that could indicate a change in the credit assessment of Oyu Tolgoi LLC as a counterparty to project finance. These considerations include in-country risk relating to the Oyu Tolgoi project, and the assumed date of transition from pre-completion to post-completion. Refer to note 31 for a description of Rio Tinto’s guarantee arrangements with respect to project finance borrowings. The remaining borrowings have a fair value measured by discounting estimated cash flows with an applicable market quoted yield and are categorised as level 2 in the fair value hierarchy.
Annual report 2018 | riotinto.com 197
Financial statements

Financial statements
Notes to the 2018 financial statements continued
30 Financial instruments and risk management continuedC (a) Valuation hierarchyThe table below shows the financial instruments carried at fair value by valuation method, under IFRS 9, at 31 December 2018.
NoteTotal
US$mLevel 1(a)
US$mLevel 2(b)
US$mLevel 3(c)
US$m
Not held at fair value
US$m
Assets
Cash and cash equivalents 10,773 7,994 – – 2,779
Investments in equity shares and funds 130 92 – 38 –
Other investments, including loans(d) 20 2,782 2,544 – 232 6
Trade and other financial receivables(e) 18 3,007 20 972 – 2,015
16,692 10,650 972 270 4,800
Derivatives (net)
Forward contracts and option contracts: designated as hedges(f) (Section B) 8 – – 8 –
Forward contracts and option contracts, not designated as hedges(f)
(Section B) 334 – (25) 359 –
Derivatives related to net debt (Section B)(g) (288) – (288) – –
Liabilities
Trade and other financial payables 25 (5,552) – (39) – (5,513)
Total 11,194 10,650 620 637 (713)
The table below shows the financial instruments carried at fair value by valuation method, under IAS 39, at 31 December 2017.
NoteTotal
US$mLevel 1(a)
US$mLevel 2(b)
US$mLevel 3(c)
US$m
Not held at fair value
US$m
Assets
Cash and cash equivalents 10,550 – – – 10,550
Equity shares and quoted funds 20 136 88 – 3 45
Other investments, including loans(d) 20 1,152 1,037 – 88 27
Trade and other receivables(e) 2,985 – 90 – 2,895
14,823 1,125 90 91 13,517
Derivatives (net)
Forward contracts and option contracts, not designated as hedges(f) (Section B) (87) – 11 (98) –
Derivatives related to net debt (Section B)(g) (177) – (177) – –
Liabilities
Trade and other financial payables (5,922) – (15) – (5,907)
Total 8,637 1,125 (91) (7) 7,610
(a) Valuation is based on unadjusted quoted prices in active markets for identical financial instruments. This category includes listed equity shares and other quoted funds.(b) Valuation is based either on inputs which include quoted prices for similar instruments or identical instruments in markets which are not considered to be active, or on inputs, which are directly
or indirectly based on observable market data.(c) Valuation is based on inputs that are not based on observable market data (unobservable inputs).(d) Other investments, including loans, comprise: cash deposits in rehabilitation funds, government bonds, managed investment funds and royalty receivables. The royalty receivables are valued
based on future expected output as well as future expected commodity prices.(e) Trade receivables include provisionally priced receivables relating to sales contracts where the selling price is determined after delivery to the customer, based on the market price at the
relevant quotation point stipulated in the contract. Revenue is recognised on provisionally priced sales based on the forward selling price for the period stipulated in the contract. Under IFRS 9, provisionally priced receivables at 31 December 2018 were US$889 million and were fair valued. In the prior year, under IAS 39, only the embedded pricing derivatives, which were separated from the host receivables, were fair valued (31 December 2017: US$90 million).
(f) Level 3 derivatives consist of derivatives embedded in electricity purchase contracts linked to the LME with terms expiring between 2025 and 2030 (2017: 2018 and 2030). The embedded derivatives are measured using discounted cash flows and option model valuation techniques. Long-term embedded derivatives with a fair value of US$338 million at 31 December 2018 (2017: US$(98) million) are valued using significant unobservable inputs as the term of the derivative extends beyond the forward curve for aluminium and includes unobservable market premium prices. In valuing these derivatives, aluminium prices are flatlined beyond the market forward curve and increased by projected inflation up to the date of expiry of each contract. Future market premiums are estimated based on historical trends. The range of market prices are US$2,426 per metric tonne in 2029 to US$2,507 in 2030 (2017: US$2,679 per metric tonne in 2028 to US$2,848 in 2030).
(g) Interest rate and currency interest rate swaps are valued using applicable market-quoted swap yield curves adjusted for relevant basis and credit default spreads. Currency interest rate swap valuations also use market-quoted foreign exchange rates. A discounted cash flow approach is applied to the cash flows derived from the inputs to determine fair value.
There were no transfers between level 1 and level 2, or between level 2 and level 3 in the year ended 31 December 2018 or in the year ended 31 December 2017.
Annual report 2018 | riotinto.com198

Notes to the 2018 financial statements continued
C (b) Level 3 financial assets and financial liabilitiesThe table below shows the summary of changes in the fair value of the Group’s level 3 financial assets and financial liabilities.
2018Level 3
financial assetsand financial
liabilitiesUS$m
2017Level 3
financial assetsand financial
liabilitiesUS$m
Opening balance (7) 479
Adjustment from transition to IFRS 9 19 –
Currency translation adjustments (23) 8
Total realised gains/(losses) included in:
– consolidated sales revenue – 1
– net operating costs 9 (5)
Total unrealised gains/(losses) included in:
– consolidated sales revenue – 17
– net operating costs 375 (508)
Total unrealised gains transferred into other comprehensive income through cash flow hedges 181 –
Additions 67 –
Disposals/maturity of financial instruments (6) (5)
Transfers 22 6
Closing balance 637 (7)
Total gains/(losses) for the year included in the income statement for assets and liabilities held at year end 346 (491)
Sensitivity analysis in respect of level 3 derivativesThe values of aluminium forward contracts and options that are determined using unobservable inputs are calculated using appropriate discounted cash flow and option model valuation techniques. The most significant of these assumptions relate to long-term pricing wherein aluminium prices are increased by a projected inflation after the ten-year LME curve. A 10% increase in long-term metal pricing assumptions would result in a US$22 million (31 December 2017: US$41 million) decrease in carrying value. A 10% decrease in long-term metal pricing assumptions would result in a US$14 million (31 December 2017: US$22 million) increase in carrying value.
The Group has a royalty asset arising from the sale of coal assets in prior periods. The value is determined using level 3 unobservable inputs. The main unobservable input is the long-term coal price used over the life of the royalty asset. A 15% increase in the coal spot price would result in a US$181 million increase in the carrying value. A 15% decrease in the coal spot price would result in a US$95 million decrease in the carrying value.
31 Contingencies and commitments
2018 US$m
2017US$m
Capital commitments excluding the Group’s share of joint venture capital commitments
Within 1 year 1,742 2,052
Between 1 and 3 years 439 531
Between 3 and 5 years 66 58
After 5 years 36 –
Total 2,283 2,641
Group’s share of joint venture capital commitments
Within 1 year 115 29
Between 1 and 3 years 1 –
Total 116 29
Our capital commitments include open purchase orders for managed operations and expenditure on major projects already authorised by our Investment Committee for non-managed operations. On a legally enforceable basis, capital commitments would be approximately US$0.4 billion (2017: US$0.5 billion) as many of the contracts relating to the Group’s projects have various cancellation clauses.
Annual report 2018 | riotinto.com 199
Financial statements

Financial statements
Notes to the 2018 financial statements continued
31 Contingencies and commitments continuedUnrecognised commitments to contribute funding or resources to joint venturesWe have a commitment to purchase and market a portion (in excess of the Group’s ownership interest) of the output of Sohar Aluminium Company L.L.C., an aluminium smelter in which the Group is a joint venture partner. The Group immediately sells the purchased products to third parties.
Along with the other joint venture partners, we have commitments to provide emergency funding (ie funding required to preserve the life or assets of the company or to comply with applicable laws) if required by Sohar Aluminium Company L.L.C., subject to approved thresholds.
At 31 December 2018, Minera Escondida Limitada held an undrawn shareholder line of credit for US$225 million (Rio Tinto share: 31 December 2017: US$225 million). The current facility will mature in September 2019.
Operating leasesThe aggregate amounts of minimum lease payments under non-cancellable operating leases are as follows:
2018 US$m
2017US$m
Within 1 year 475 397
Between 1 and 3 years 587 542
Between 3 and 5 years 270 313
After 5 years 385 593
Total 1,717 1,845
Operating leases include leases of dry bulk vessels and offices as well as other property, plant and equipment. The terms of lease payments vary, with a significant proportion being fixed rate and including renewal options. Leases for dry bulk vessels include costs for crewing services. The Group will implement IFRS 16 “Leases” as at 1 January 2019; refer to note 1.
Purchase obligationsThe aggregate amount of future payment commitments under purchase obligations outstanding at 31 December was:
2018 US$m
Adjusted(a)
2017US$m
Within 1 year 2,804 2,874
Between 1 and 2 years 1,565 1,712
Between 2 and 3 years 1,344 1,401
Between 3 and 4 years 1,097 1,282
Between 4 and 5 years 882 1,026
After 5 years 9,358 11,185
Total 17,050 19,480
(a) The 2017 comparative has been amended to correctly reflect certain purchase obligations at 31 December 2017. The impact is a reduction in future payment commitments of US$309 million.
Purchase obligations are enforceable and legally binding agreements to buy goods or services. They specify all significant terms, including: fixed or minimum quantities to be purchased or consumed; fixed, minimum or variable price provisions; and the approximate timing of the transactions.
Purchase obligations for goods mainly relate to purchases of raw materials and consumables and purchase obligations for services mainly relate to charges for the use of infrastructure, commitments to purchase power and freight contracts. These goods and services are expected to be used in the business. To the extent that this changes, a provision for onerous obligations may be made as described in note 1(i).
Purchases from joint arrangements or associates are included if the quantity purchased is in excess of our ownership interest in the entity. However, purchase obligations exclude contracted purchases of bauxite, alumina and aluminium from joint arrangements and associates and contracted purchases of alumina from third parties. This is because these purchases are made for commercial reasons and the Group is, overall, a net seller of these commodities.
Annual report 2018 | riotinto.com200

Notes to the 2018 financial statements continued
As described above, we also have a commitment to buy and market a portion (in excess of our ownership interest) of the output of Sohar Aluminium Company L.L.C.
Contingent liabilities (subsidiaries and joint operations)
2018 US$m
2017US$m
Indemnities and other performance guarantees(a) (b) 317 552
(a) Indemnities and other performance guarantees represent the potential outflow of funds from the Group for the satisfaction of obligations including those under contractual arrangements (for example undertakings related to supplier agreements) not provided for in the balance sheet, where the likelihood of the guarantees or indemnities being called is assessed as possible rather than probable or remote.
(b) There were no material contingent liabilities arising in relation to the Group’s joint ventures and associates.
Contingent liabilitiesIn October 2017, Rio Tinto announced that it had been notified by the US Securities and Exchange Commission (SEC) that the SEC had filed a complaint in relation to Rio Tinto’s disclosures and timing of the impairment of Rio Tinto Coal Mozambique (RTCM). The impairment was reflected in Rio Tinto’s 2012 year-end accounts. The SEC alleges that Rio Tinto, a former chief executive, Tom Albanese, and a former chief financial officer, Guy Elliott, committed violations of the anti-fraud, reporting, books and records and internal control provisions of the federal securities law by not accurately disclosing the value of RTCM and not impairing it when Rio Tinto published its 2011 year-end accounts in February 2012 or its 2012 interim results in August 2012. In October 2017, an associated US class action was commenced on behalf of securities holders.
In March 2018, the Australian Securities and Investments Commission (ASIC) filed civil proceedings in the NSW District Registry of the Federal Court of Australia against Rio Tinto Limited, Albanese, and Elliott. On 1 May 2018, ASIC expanded its proceedings. ASIC alleges that Rio Tinto committed violations of the disclosure, accounting, and misleading or deceptive conduct provisions of the Corporations Act by making misleading or deceptive statements related to RTCM in its 2011 Annual report and its 2012 interim financial statements, not complying with accounting standards in respect of its 2012 interim financial statements, and not disclosing an impairment of RTCM in its 2012 interim financial statements. ASIC further alleges Albanese and Elliott breached their duties as directors or officers, and failed to take all reasonable steps to comply with relevant accounting requirements.
Rio Tinto believes that the SEC case and the ASIC proceedings are unwarranted and that, when all the facts are considered by the courts, the claims will be rejected. Rio Tinto will defend the allegations vigorously.
In October 2017, Rio Tinto reached a settlement with the UK’s Financial Conduct Authority (FCA) related to the timing of the impairment of RTCM, with the FCA determining that Rio Tinto had breached the FCA’s Disclosure and Transparency Rules, imposing a financial penalty on Rio Tinto of £27.4 million (US$36.4 million). It is important to stress that the FCA made no findings of fraud, or of any systemic or widespread failure by Rio Tinto. This separate FCA case is now closed.
In addition, Rio Tinto continues to co-operate fully with relevant authorities in connection with their investigations in relation to contractual payments totalling US$10.5 million made to a consultant who had provided advisory services in 2011 on the Simandou project in Guinea. In August 2018, the court dismissed a related US class action commenced on behalf of securities holders.
The outcomes of these matters remain uncertain, but they could ultimately expose the Group to material financial cost. The board is giving these matters its full and proper attention and a dedicated board committee continues to monitor the progress of these matters.
The Group is monitoring developments in relation to EU State Aid investigations including the EU Commission’s State Aid investigation into the UK’s Controlled Foreign Company taxation regime. The Group does not currently consider that any provision is required in relation to EU State Aid.
Guarantees by parent companiesRio Tinto plc and Rio Tinto Limited have, jointly and severally, fully and unconditionally guaranteed the following securities issued by the following 100% owned finance subsidiaries: US$4.4 billion (31 December 2017: US$5.8 billion) Rio Tinto Finance (USA) Limited and Rio Tinto Finance (USA) plc bonds with maturity dates up to 2042; and US$1.6 billion (31 December 2017: US$2.1 billion) on the European Debt Issuance Programme. In addition, Rio Tinto Finance plc and Rio Tinto Finance Limited have entered into facility arrangements for an aggregate amount of US$7.5 billion (31 December 2017: US$7.5 billion). The facilities are guaranteed by Rio Tinto plc and Rio Tinto Limited.
Rio Tinto plc has provided a guarantee, known as the completion support undertaking (CSU), in favour of the Oyu Tolgoi LLC project finance lenders. At 31 December 2018, US$4.3 billion of project finance debt was outstanding under this facility (2017: US$4.3 billion). Oyu Tolgoi LLC is jointly owned by Erdenes Oyu Tolgoi LLC (34%), which is controlled by the Government of Mongolia, and Turquoise Hill Resources Ltd (66%, of which Rio Tinto owns 51%). The project finance has been raised for development of the underground mine and the CSU will terminate on the completion of the underground mine according to a set of completion tests set out in the project finance facility.
The Rio Tinto guarantee applies to the extent that Turquoise Hill Resources Ltd cannot satisfy Oyu Tolgoi LLC’s project finance debt servicing obligations under its own guarantee to the lenders, called the sponsor debt service undertaking (DSU). Both the CSU and DSU contain a carve-out for certain political risk events.
Contingent assetsThe Group has, from time to time, various insurance claims outstanding with reinsurers.
Annual report 2018 | riotinto.com 201
Financial statements
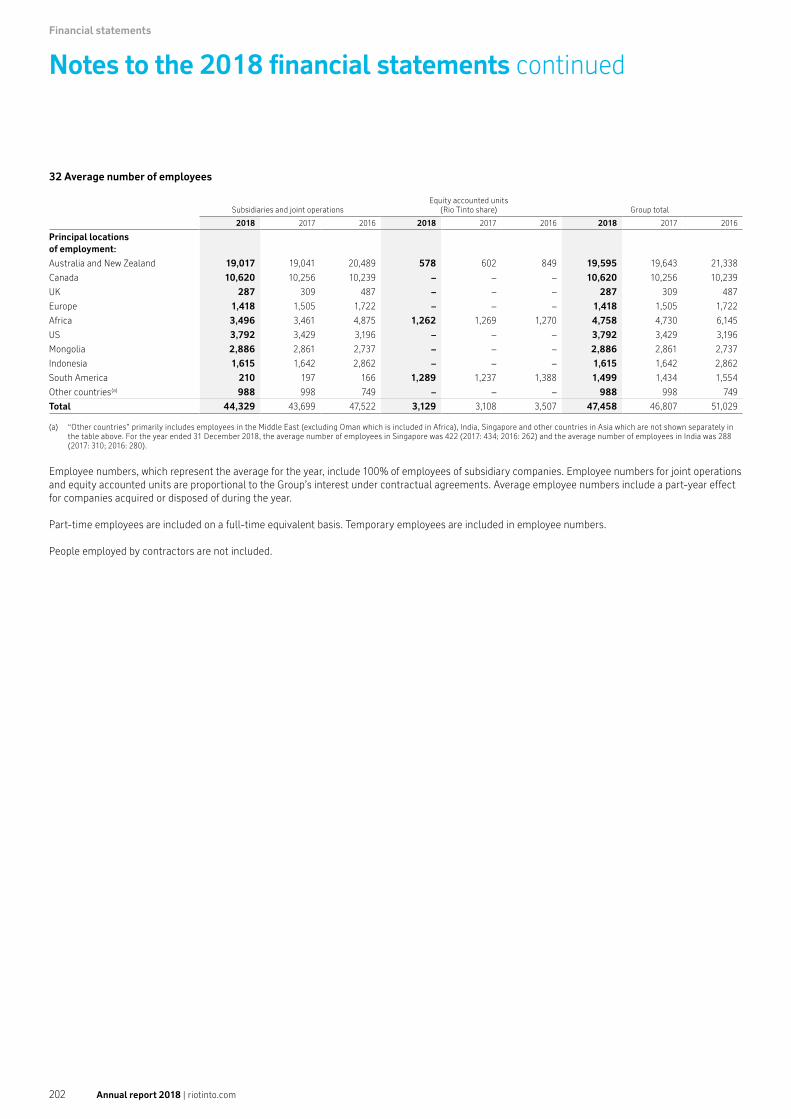
Financial statements
Notes to the 2018 financial statements continued
32 Average number of employees
Subsidiaries and joint operationsEquity accounted units
(Rio Tinto share) Group total
2018 2017 2016 2018 2017 2016 2018 2017 2016
Principal locations of employment:
Australia and New Zealand 19,017 19,041 20,489 578 602 849 19,595 19,643 21,338
Canada 10,620 10,256 10,239 – – – 10,620 10,256 10,239
UK 287 309 487 – – – 287 309 487
Europe 1,418 1,505 1,722 – – – 1,418 1,505 1,722
Africa 3,496 3,461 4,875 1,262 1,269 1,270 4,758 4,730 6,145
US 3,792 3,429 3,196 – – – 3,792 3,429 3,196
Mongolia 2,886 2,861 2,737 – – – 2,886 2,861 2,737
Indonesia 1,615 1,642 2,862 – – – 1,615 1,642 2,862
South America 210 197 166 1,289 1,237 1,388 1,499 1,434 1,554
Other countries(a) 988 998 749 – – – 988 998 749
Total 44,329 43,699 47,522 3,129 3,108 3,507 47,458 46,807 51,029
(a) “Other countries” primarily includes employees in the Middle East (excluding Oman which is included in Africa), India, Singapore and other countries in Asia which are not shown separately in the table above. For the year ended 31 December 2018, the average number of employees in Singapore was 422 (2017: 434; 2016: 262) and the average number of employees in India was 288 (2017: 310; 2016: 280).
Employee numbers, which represent the average for the year, include 100% of employees of subsidiary companies. Employee numbers for joint operations and equity accounted units are proportional to the Group’s interest under contractual agreements. Average employee numbers include a part-year effect for companies acquired or disposed of during the year.
Part-time employees are included on a full-time equivalent basis. Temporary employees are included in employee numbers.
People employed by contractors are not included.
Annual report 2018 | riotinto.com202

Notes to the 2018 financial statements continued
33 Principal subsidiariesAt 31 December 2018
Company and country of incorporation/operation Principal activitiesClass of shares
held
Proportionof class
held (%)
Groupinterest
(%)Non-controlling
interest (%)
Australia
Argyle Diamonds Limited Mining and processing of diamonds Ordinary 100 100 –
Dampier Salt Limited Salt and gypsum Ordinary 68.36 68.36 31.64
Energy Resources of Australia Limited Uranium mining Ordinary 68.39 68.39 31.61
Hamersley Iron Pty Limited Iron ore mining Ordinary 100 100 –
North Mining Limited(a) Iron ore mining Ordinary 100 100 –
Queensland Coal Pty Limited(b) Coal mining Ordinary 100 100 –
Rio Tinto Aluminium (Holdings) Limited Bauxite mining; alumina production; primary aluminium smelting
Ordinary 100 100 –
Robe River Mining Co Pty Ltd(a)
Iron ore mining Class A 40
60 40Class B 76.36
Brazil
Alcan Alumina Ltda.(c) Alumina production and bauxite mining Quota 100 100 –
Canada
Iron Ore Company of Canada(d) Iron ore mining; iron ore pellets Common 58.72 58.72 41.28
Rio Tinto Fer et Titane Inc.
Titanium dioxide feedstock; high purity iron and steel
Common 100 100 –
Class B preference 100 100 –
CAD 0.01 preferred 100 100 –
Rio Tinto Alcan Inc. Bauxite mining; alumina refining; aluminium smelting
Common 100 100 –
Diavik Diamond Mines (2012) Inc.(e) Diamond mining and processing Common 100 100 –
Guinea
Simfer Jersey Limited(f) Iron ore project Ordinary 53 53 47
Madagascar
QIT Madagascar Minerals SA(g)
Ilmenite mining Common 80 8015
Investment certificates 100 100
Voting certificates 80 80 20
Mongolia
Turquoise Hill Resources Ltd (including Oyu Tolgoi LLC)(h)
Copper and gold mining Common 50.79 50.79 49.21
Namibia
Rössing Uranium Limited(i)
Uranium mining B N$1 71.22
68.62 31.38C N10c 70.59
South Africa
Richards Bay Titanium (Proprietary) Limited(j)
Titanium dioxide; high purity iron production
B Ordinary 100
74 26B preference 100
Parent Preference 100
Richards Bay Mining (Proprietary) Limited(j)
Ilmenite, rutile and zircon mining B Ordinary 100
74 26B preference 100
Parent Preference 100
US
Kennecott Holdings Corporation (including Kennecott Utah Copper and Kennecott Exploration)
Copper and gold mining, smelting and refining and exploration activities
Common US$0.01 100 100 –
U.S. Borax Inc. Mining, refining and marketing of borates Common US$0.10 100 100 –
This list includes only those companies that have a more significant impact on the profit or assets of the Group. Refer to note 47 for a list of related undertakings.
Annual report 2018 | riotinto.com 203
Financial statements
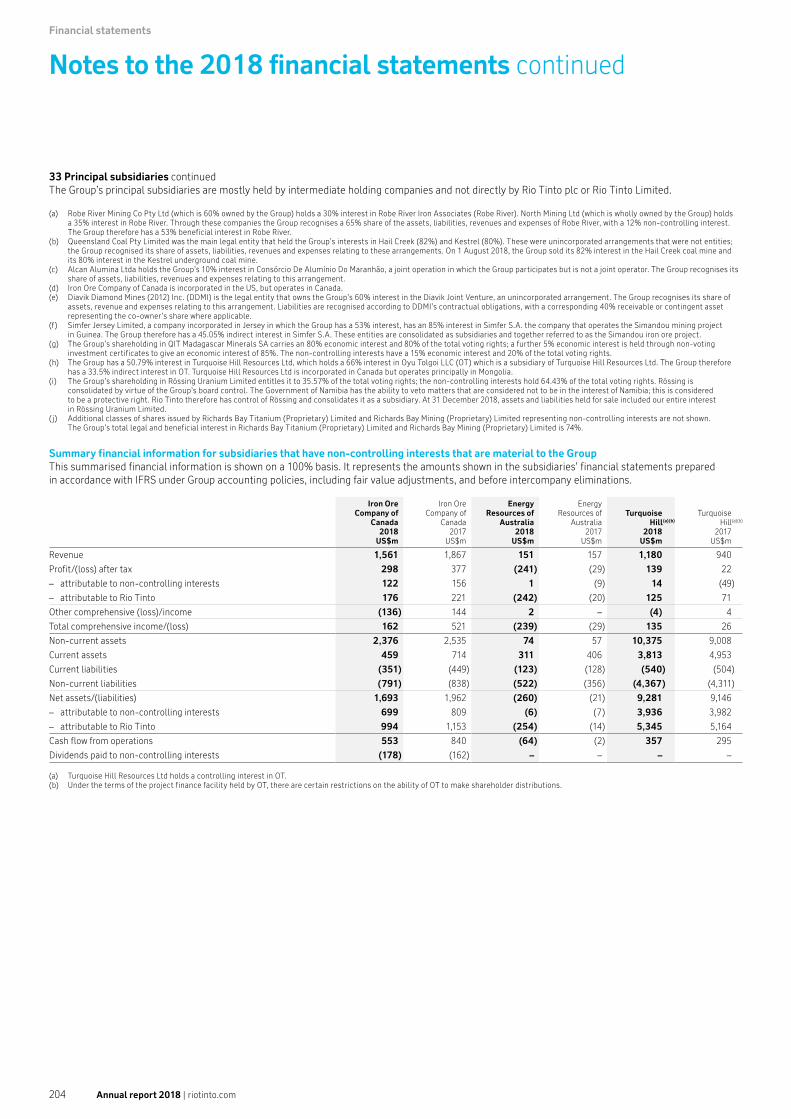
Financial statements
Notes to the 2018 financial statements continued
33 Principal subsidiaries continuedThe Group’s principal subsidiaries are mostly held by intermediate holding companies and not directly by Rio Tinto plc or Rio Tinto Limited.
(a) Robe River Mining Co Pty Ltd (which is 60% owned by the Group) holds a 30% interest in Robe River Iron Associates (Robe River). North Mining Ltd (which is wholly owned by the Group) holds a 35% interest in Robe River. Through these companies the Group recognises a 65% share of the assets, liabilities, revenues and expenses of Robe River, with a 12% non-controlling interest. The Group therefore has a 53% beneficial interest in Robe River.
(b) Queensland Coal Pty Limited was the main legal entity that held the Group’s interests in Hail Creek (82%) and Kestrel (80%). These were unincorporated arrangements that were not entities; the Group recognised its share of assets, liabilities, revenues and expenses relating to these arrangements. On 1 August 2018, the Group sold its 82% interest in the Hail Creek coal mine and its 80% interest in the Kestrel underground coal mine.
(c) Alcan Alumina Ltda holds the Group’s 10% interest in Consórcio De Alumínio Do Maranhão, a joint operation in which the Group participates but is not a joint operator. The Group recognises its share of assets, liabilities, revenues and expenses relating to this arrangement.
(d) Iron Ore Company of Canada is incorporated in the US, but operates in Canada.(e) Diavik Diamond Mines (2012) Inc. (DDMI) is the legal entity that owns the Group’s 60% interest in the Diavik Joint Venture, an unincorporated arrangement. The Group recognises its share of
assets, revenue and expenses relating to this arrangement. Liabilities are recognised according to DDMI’s contractual obligations, with a corresponding 40% receivable or contingent asset representing the co-owner’s share where applicable.
(f) Simfer Jersey Limited, a company incorporated in Jersey in which the Group has a 53% interest, has an 85% interest in Simfer S.A. the company that operates the Simandou mining project in Guinea. The Group therefore has a 45.05% indirect interest in Simfer S.A. These entities are consolidated as subsidiaries and together referred to as the Simandou iron ore project.
(g) The Group’s shareholding in QIT Madagascar Minerals SA carries an 80% economic interest and 80% of the total voting rights; a further 5% economic interest is held through non-voting investment certificates to give an economic interest of 85%. The non-controlling interests have a 15% economic interest and 20% of the total voting rights.
(h) The Group has a 50.79% interest in Turquoise Hill Resources Ltd, which holds a 66% interest in Oyu Tolgoi LLC (OT) which is a subsidiary of Turquoise Hill Resources Ltd. The Group therefore has a 33.5% indirect interest in OT. Turquoise Hill Resources Ltd is incorporated in Canada but operates principally in Mongolia.
(i) The Group’s shareholding in Rössing Uranium Limited entitles it to 35.57% of the total voting rights; the non-controlling interests hold 64.43% of the total voting rights. Rössing is consolidated by virtue of the Group’s board control. The Government of Namibia has the ability to veto matters that are considered not to be in the interest of Namibia; this is considered to be a protective right. Rio Tinto therefore has control of Rössing and consolidates it as a subsidiary. At 31 December 2018, assets and liabilities held for sale included our entire interest in Rössing Uranium Limited.
( j) Additional classes of shares issued by Richards Bay Titanium (Proprietary) Limited and Richards Bay Mining (Proprietary) Limited representing non-controlling interests are not shown. The Group’s total legal and beneficial interest in Richards Bay Titanium (Proprietary) Limited and Richards Bay Mining (Proprietary) Limited is 74%.
Summary financial information for subsidiaries that have non-controlling interests that are material to the GroupThis summarised financial information is shown on a 100% basis. It represents the amounts shown in the subsidiaries’ financial statements prepared in accordance with IFRS under Group accounting policies, including fair value adjustments, and before intercompany eliminations.
Iron OreCompany of
Canada 2018
US$m
Iron OreCompany of
Canada2017
US$m
EnergyResources of
Australia2018
US$m
EnergyResources of
Australia2017
US$m
TurquoiseHill(a)(b)
2018US$m
TurquoiseHill(a)(b)
2017US$m
Revenue 1,561 1,867 151 157 1,180 940
Profit/(loss) after tax 298 377 (241) (29) 139 22
– attributable to non-controlling interests 122 156 1 (9) 14 (49)
– attributable to Rio Tinto 176 221 (242) (20) 125 71
Other comprehensive (loss)/income (136) 144 2 – (4) 4
Total comprehensive income/(loss) 162 521 (239) (29) 135 26
Non-current assets 2,376 2,535 74 57 10,375 9,008
Current assets 459 714 311 406 3,813 4,953
Current liabilities (351) (449) (123) (128) (540) (504)
Non-current liabilities (791) (838) (522) (356) (4,367) (4,311)
Net assets/(liabilities) 1,693 1,962 (260) (21) 9,281 9,146
– attributable to non-controlling interests 699 809 (6) (7) 3,936 3,982
– attributable to Rio Tinto 994 1,153 (254) (14) 5,345 5,164
Cash flow from operations 553 840 (64) (2) 357 295
Dividends paid to non-controlling interests (178) (162) – – – –
(a) Turquoise Hill Resources Ltd holds a controlling interest in OT.(b) Under the terms of the project finance facility held by OT, there are certain restrictions on the ability of OT to make shareholder distributions.
Annual report 2018 | riotinto.com204

Notes to the 2018 financial statements continued
Robe RiverMining Co
Pty 2018
US$m
Robe RiverMining Co
Pty2017
US$m
Othercompanies
andeliminations(c)
2018US$m
Othercompanies
andeliminations(c)
2017US$m
Robe River2018
US$m
Robe River2017
US$m
Revenue 1,082 1,164 1,262 1,351 2,344 2,515
Profit after tax 561 617 543 637 1,104 1,254
– attributable to non-controlling interests 218 242 – – 218 242
– attributable to Rio Tinto 343 375 543 637 886 1,012
Other comprehensive (loss)/income (313) 238 (203) 158 (516) 396
Total comprehensive income 248 855 340 795 588 1,650
Non-current assets 2,610 2,927 3,739 4,187 6,349 7,114
Current assets(d) 710 875 2,368 1,149 3,078 2,024
Current liabilities (111) (186) (235) (1,357) (346) (1,543)
Non-current liabilities(d) (117) (174) (3,977) (2,244) (4,094) (2,418)
Net assets 3,092 3,442 1,895 1,735 4,987 5,177
– attributable to non-controlling interests 1,237 1,375 – – 1,237 1,375
– attributable to Rio Tinto 1,855 2,067 1,895 1,735 3,750 3,802
Cash flow from operations 933 1,048 1,151 1,207 2,084 2,255
Dividends paid to non-controlling interests (224) (230) – – (224) (230)
(c) “Other companies and eliminations” includes North Mining Limited (a wholly owned subsidiary of the Group which accounts for its interest in Robe River) and goodwill of US$351 million (2017: US$389 million) that arose on the Group’s acquisition of its interest in Robe River.
(d) The 2017 comparative has been adjusted to more appropriately classify certain balances.
34 Principal joint operationsAt 31 December 2018
Company and country of incorporation/operation Principal activities Group interest (%)
Australia
Tomago Aluminium Joint Venture Aluminium smelting 51.6
Gladstone Power Station Power generation 42.1
Hope Downs Joint Venture Iron ore mining 50
Queensland Alumina Limited(a) (b) Alumina production 80
Pilbara Iron arrangement Infrastructure, corporate and mining services (c)
New Zealand
New Zealand Aluminium Smelters Limited(a) (b) Aluminium smelting 79.36
Canada
Aluminerie Alouette Inc. Aluminium production 40
US
Pechiney Reynolds Quebec Inc(b) (d) Aluminium smelting 50.2
This list includes only those joint operations that have a more significant impact on the profit or operating assets of the Group. Refer to note 47 for a list of related undertakings.
The Group’s joint operations are held by intermediate holding companies and not directly by Rio Tinto plc or Rio Tinto Limited.
(a) Although the Group has a 79.4% interest in New Zealand Aluminium Smelters Limited and an 80% interest in Queensland Alumina Limited, decisions about activities that significantly affect the returns that are generated require agreement of both parties to the arrangements, giving rise to joint control.
(b) Queensland Alumina Limited, New Zealand Aluminium Smelters Limited and Pechiney Reynolds Quebec Inc. are joint arrangements that are primarily designed for the provision of output to the parties sharing joint control; this indicates that the parties have rights to substantially all the economic benefits of the assets. The liabilities of the arrangements are in substance satisfied by cash flows received from the parties; this dependence indicates that the parties in effect have obligations for the liabilities. It is these facts and circumstances that give rise to the classification of these entities as joint operations.
(c) A number of arrangements are in place between the Australian Iron Ore operations managed by Rio Tinto which allow their respective assets to be operated as a single integrated network across the Pilbara region. The arrangements are managed through two wholly owned subsidiaries: Pilbara Iron (Company) Services Pty Ltd and Pilbara Iron Pty Ltd. In assessing the Pilbara Iron arrangements, it has been concluded that they collectively constitute a joint operation on the basis that decisions about relevant activities require unanimous consent. The resulting efficiencies are shared between Rio Tinto and Robe River Iron Associates (Robe River), and the parties fund all of the cash flow requirements of Pilbara Iron (Company) Services Pty Ltd and Pilbara Iron Pty Ltd.
(d) Pechiney Reynolds Quebec Inc. has a 50.1% interest in the Aluminerie de Bécancour, Inc. aluminium smelter, which is located in Canada.
Annual report 2018 | riotinto.com 205
Financial statements

Financial statements
Notes to the 2018 financial statements continued
35 Principal joint venturesAt 31 December 2018
Company and country of incorporation/operation Principal activitiesNumber of
shares held
Class of shares
held
Proportion of class
held (%)
Group interest
(%)
Chile
Minera Escondida Limitada(a) Copper mining and refining – – – 30
Oman
Sohar Aluminium Co. L.L.C.(b) Aluminium smelting; power generation 37,500 Ordinary 20 20
This list includes only those joint ventures that have a more significant impact on the profit or operating assets of the Group. Refer to note 47 for a list of related undertakings.
The Group’s principal joint ventures are held by intermediate holding companies and not directly by Rio Tinto plc or Rio Tinto Limited.
(a) Although the Group has a 30% interest in Minera Escondida Limitada, participant and management agreements provide for an Owners’ Council whereby significant commercial and operational decisions about the relevant activities that significantly affect the returns that are generated in effect require the joint approval of both Rio Tinto and BHP Billiton (holders of a 57.5% interest). It is therefore determined that Rio Tinto has joint control. The year end of Minera Escondida Limitada is 30 June. The amounts included in the consolidated financial statements of Rio Tinto are, however, based on accounts of Minera Escondida Limitada that are coterminous with those of the Group.
(b) Although the Group holds a 20% interest in Sohar Aluminium Co. L.L.C., decisions about relevant activities that significantly affect the returns that are generated require agreement of all parties to the arrangement. It is therefore determined that Rio Tinto has joint control.
Summary information for joint ventures that are material to the GroupThis summarised financial information is shown on a 100% basis. It represents the amounts shown in the joint ventures’ financial statements prepared in accordance with IFRS under Group accounting policies, including fair value adjustments and amounts due to and from Rio Tinto.
MineraEscondida
Limitada(a)
2018US$m
Minera Escondida
Limitada(a) 2017
US$m
SoharAluminium
Co. L.L.C.(b)
2018US$m
SoharAluminium
Co. L.L.C.(b)
2017US$m
Revenue 7,580 6,037 810 460
Depreciation and amortisation (1,727) (1,690) (120) (145)
Other operating costs (3,230) (2,617) (440) (205)
Operating profit 2,623 1,730 250 110
Finance expense (163) (120) (35) (35)
Income tax (873) (627) (40) –
Profit after tax 1,587 983 175 75
Total comprehensive income 1,587 983 175 75
Non-current assets 13,027 13,814 3,085 3,230
Current assets 2,413 2,760 340 305
Current liabilities (1,637) (1,727) (230) (205)
Non-current liabilities (4,460) (4,617) (955) (1,270)
Net assets 9,343 10,230 2,240 2,060
Assets and liabilities above include:
– cash and cash equivalents 697 460 15 95
– current financial liabilities (230) (330) (100) (130)
– non-current financial liabilities (2,763) (2,840) (795) (1,120)
Dividends received from joint venture (Rio Tinto share) 786 780 – –
Reconciliation of the above amounts to the investment recognised in the Group balance sheet
Group interest 30% 30% 20% 20%
Net assets 9,343 10,230 2,240 2,060
Group’s ownership interest 2,803 3,069 448 412
Other adjustments – 4 (1) (3)
Carrying value of Group’s interest 2,803 3,073 447 409
(a) In addition to its “Investment in equity accounted units”, the Group recognises deferred tax liabilities of US$413 million (2017: US$500 million) relating to tax on unremitted earnings of equity accounted units.
(b) Under covenants stipulated in the agreement to Sohar Aluminium Co. L.L.C.’s secured loan facilities, Sohar Aluminium Co. L.L.C. is currently restricted from making any shareholder distributions until 2021 unless a specified amount of the loan facilities is funded.
Annual report 2018 | riotinto.com206

Notes to the 2018 financial statements continued
36 Principal associatesAt 31 December 2018
Company and country of incorporation/operation Principal activitiesNumber of
shares heldClass of
shares held
Proportion of class
held (%)
Group interest
(%)
Australia
Boyne Smelters Limited(a) Aluminium smelting 153,679,560 Ordinary 59.4 59.4
Brazil
Mineração Rio do Norte S.A.(b)
Bauxite mining25,000,000,000 Ordinary 12.5
1247,000,000,000 Preferred 11.75
US
Halco (Mining) Inc.(c) 4,500 Common 45 45
This list includes only those associates that have a more significant impact on the profit or operating assets of the Group. Refer to note 47 for a list of related undertakings.
The Group’s principal associates are held by intermediate holding companies and not directly by Rio Tinto plc or Rio Tinto Limited.
(a) The parties that collectively control Boyne Smelters Limited do so through decisions that are determined on an aggregate voting interest that can be achieved by several combinations of the parties. Although each combination requires Rio Tinto’s approval, this is not joint control as defined under IFRS 11. Rio Tinto is therefore determined to have significant influence over this company.
(b) Although the Group holds only 12% of Mineração Rio do Norte S.A., it has representation on its board of directors and a consequent ability to participate in the financial and operating policy decisions. It is therefore determined that Rio Tinto has significant influence.
(c) Halco (Mining) Inc. has a 51% indirect interest in Compagnie des Bauxites de Guinée, a bauxite mine, the core assets of which are located in Guinea.
Summary information for associates that are material to the GroupThis summarised financial information is shown on a 100% basis. It represents the amounts shown in the associate’s financial statements prepared in accordance with IFRS under Group accounting policies, including fair value adjustments and amounts due to and from Rio Tinto.
BoyneSmelters
Limited(a)
2018US$m
BoyneSmelters
Limited(a)
2017US$m
Revenue – –
(Loss)/profit after tax (12) 5
Other comprehensive (loss)/income(b) (68) 56
Total comprehensive (loss)/income (80) 61
Non-current assets 1,268 1,468
Current assets 93 88
Current liabilities (113) (99)
Non-current liabilities (842) (996)
Net assets 406 461
Reconciliation of the above amount to the investment recognised in the Group balance sheet
Group interest 59.4% 59.4%
Net assets 406 461
Group’s ownership interest 241 274
Loans to equity accounted units 129 159
Carrying value of Group’s interest 370 433
(a) Boyne Smelters Limited is a tolling operation; as such it is dependent on its participants for funding which is provided through cash calls. Rio Tinto has made certain prepayments to Boyne for toll processing of alumina. These are charged to Group operating costs as processing takes place.
(b) “Other comprehensive (loss)/income” is net of amounts recognised by subsidiaries in relation to quasi equity loans.
Annual report 2018 | riotinto.com 207
Financial statements
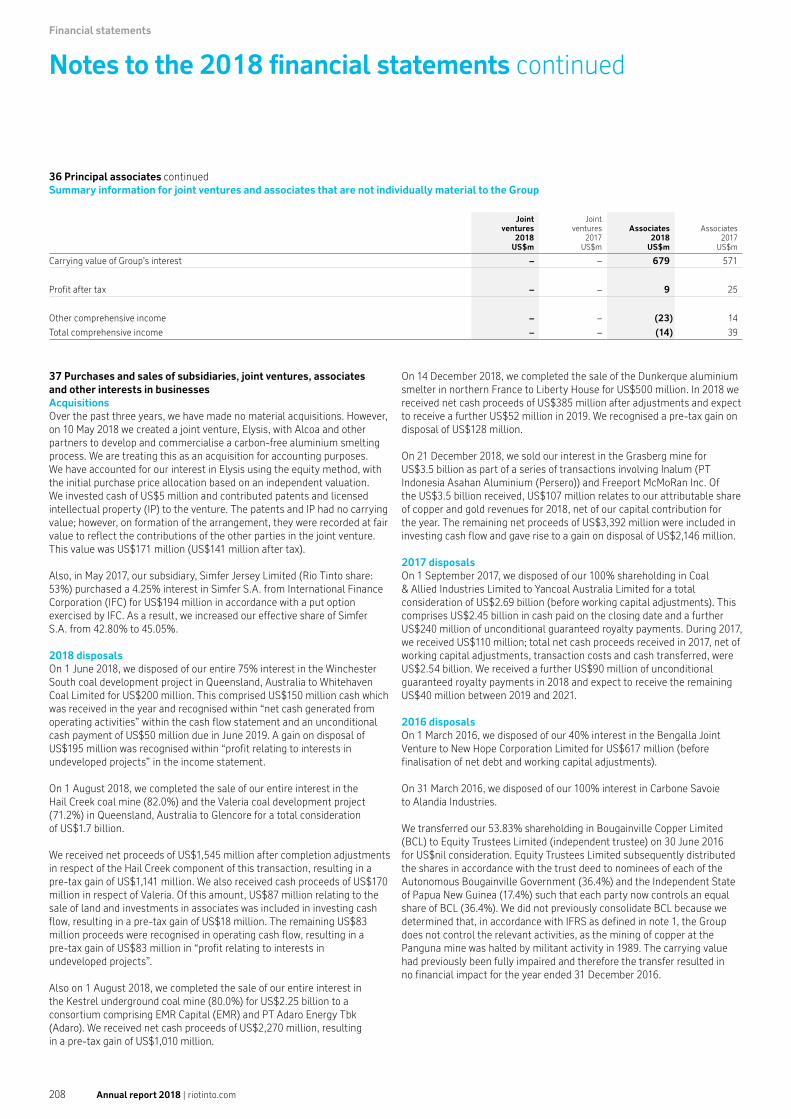
Financial statements
Notes to the 2018 financial statements continued
37 Purchases and sales of subsidiaries, joint ventures, associates and other interests in businessesAcquisitionsOver the past three years, we have made no material acquisitions. However, on 10 May 2018 we created a joint venture, Elysis, with Alcoa and other partners to develop and commercialise a carbon-free aluminium smelting process. We are treating this as an acquisition for accounting purposes. We have accounted for our interest in Elysis using the equity method, with the initial purchase price allocation based on an independent valuation. We invested cash of US$5 million and contributed patents and licensed intellectual property (IP) to the venture. The patents and IP had no carrying value; however, on formation of the arrangement, they were recorded at fair value to reflect the contributions of the other parties in the joint venture. This value was US$171 million (US$141 million after tax).
Also, in May 2017, our subsidiary, Simfer Jersey Limited (Rio Tinto share: 53%) purchased a 4.25% interest in Simfer S.A. from International Finance Corporation (IFC) for US$194 million in accordance with a put option exercised by IFC. As a result, we increased our effective share of Simfer S.A. from 42.80% to 45.05%.
2018 disposalsOn 1 June 2018, we disposed of our entire 75% interest in the Winchester South coal development project in Queensland, Australia to Whitehaven Coal Limited for US$200 million. This comprised US$150 million cash which was received in the year and recognised within “net cash generated from operating activities” within the cash flow statement and an unconditional cash payment of US$50 million due in June 2019. A gain on disposal of US$195 million was recognised within “profit relating to interests in undeveloped projects” in the income statement.
On 1 August 2018, we completed the sale of our entire interest in the Hail Creek coal mine (82.0%) and the Valeria coal development project (71.2%) in Queensland, Australia to Glencore for a total consideration of US$1.7 billion.
We received net proceeds of US$1,545 million after completion adjustments in respect of the Hail Creek component of this transaction, resulting in a pre-tax gain of US$1,141 million. We also received cash proceeds of US$170 million in respect of Valeria. Of this amount, US$87 million relating to the sale of land and investments in associates was included in investing cash flow, resulting in a pre-tax gain of US$18 million. The remaining US$83 million proceeds were recognised in operating cash flow, resulting in a pre-tax gain of US$83 million in “profit relating to interests in undeveloped projects”.
Also on 1 August 2018, we completed the sale of our entire interest in the Kestrel underground coal mine (80.0%) for US$2.25 billion to a consortium comprising EMR Capital (EMR) and PT Adaro Energy Tbk (Adaro). We received net cash proceeds of US$2,270 million, resulting in a pre-tax gain of US$1,010 million.
On 14 December 2018, we completed the sale of the Dunkerque aluminium smelter in northern France to Liberty House for US$500 million. In 2018 we received net cash proceeds of US$385 million after adjustments and expect to receive a further US$52 million in 2019. We recognised a pre-tax gain on disposal of US$128 million.
On 21 December 2018, we sold our interest in the Grasberg mine for US$3.5 billion as part of a series of transactions involving Inalum (PT Indonesia Asahan Aluminium (Persero)) and Freeport McMoRan Inc. Of the US$3.5 billion received, US$107 million relates to our attributable share of copper and gold revenues for 2018, net of our capital contribution for the year. The remaining net proceeds of US$3,392 million were included in investing cash flow and gave rise to a gain on disposal of US$2,146 million.
2017 disposalsOn 1 September 2017, we disposed of our 100% shareholding in Coal & Allied Industries Limited to Yancoal Australia Limited for a total consideration of US$2.69 billion (before working capital adjustments). This comprises US$2.45 billion in cash paid on the closing date and a further US$240 million of unconditional guaranteed royalty payments. During 2017, we received US$110 million; total net cash proceeds received in 2017, net of working capital adjustments, transaction costs and cash transferred, were US$2.54 billion. We received a further US$90 million of unconditional guaranteed royalty payments in 2018 and expect to receive the remaining US$40 million between 2019 and 2021.
2016 disposalsOn 1 March 2016, we disposed of our 40% interest in the Bengalla Joint Venture to New Hope Corporation Limited for US$617 million (before finalisation of net debt and working capital adjustments).
On 31 March 2016, we disposed of our 100% interest in Carbone Savoie to Alandia Industries.
We transferred our 53.83% shareholding in Bougainville Copper Limited (BCL) to Equity Trustees Limited (independent trustee) on 30 June 2016 for US$nil consideration. Equity Trustees Limited subsequently distributed the shares in accordance with the trust deed to nominees of each of the Autonomous Bougainville Government (36.4%) and the Independent State of Papua New Guinea (17.4%) such that each party now controls an equal share of BCL (36.4%). We did not previously consolidate BCL because we determined that, in accordance with IFRS as defined in note 1, the Group does not control the relevant activities, as the mining of copper at the Panguna mine was halted by militant activity in 1989. The carrying value had previously been fully impaired and therefore the transfer resulted in no financial impact for the year ended 31 December 2016.
36 Principal associates continuedSummary information for joint ventures and associates that are not individually material to the Group
Jointventures
2018US$m
Joint ventures
2017 US$m
Associates2018
US$m
Associates2017
US$m
Carrying value of Group’s interest – – 679 571
Profit after tax – – 9 25
Other comprehensive income – – (23) 14
Total comprehensive income – – (14) 39
Annual report 2018 | riotinto.com208

Notes to the 2018 financial statements continued
On 20 July 2016, a tranche of 7.5% non-contributory shares in Simfer S.A. was transferred free of charge to the Government of Guinea as per the terms of the Simandou project agreement signed in 2014, further diluting our ownership percentage and also our partners’ in the project. Under the agreement, a second tranche comprising 10% Ordinary Contributory Shares may be acquired at any time for a pro rata share of historical mining cost. The remaining two tranches of 5% ordinary contributing shares may be acquired by the Government of Guinea at market value at any time after 22 April 2026 and 22 April 2031 respectively.
On 2 September 2016, we disposed of our interest in Zululand Anthracite Colliery.
On 23 November 2016, we disposed of our 100% interest in Lochaber to SIMEC for US$410 million (before finalisation of closing adjustments and transaction costs). We received US$224 million of this in December 2016 and the second and final instalment in April 2017.
38 Directors’ and key management remunerationAggregate remuneration, calculated in accordance with the UK Companies Act 2006, of the directors of the parent companies was as follows:
2018US$’000
2017US$’000
2016US$’000
Emoluments 9,069 8,339 9,186
Long term incentive plans 2,923 4,685 3,071
11,992 13,024 12,257
Pension contributions: defined contribution plans 80 135 69
Gains made on exercise of share options 107 – –
The Group defines key management personnel as the directors and members of the Executive Committee. The Executive Committee comprises the executive directors, product group chief executive officers and Group executives.
The aggregate remuneration incurred by Rio Tinto plc in respect of its directors was US$11,465,000 (2017: US$12,624,000; 2016: US$10,630,000). The aggregate pension contribution to defined contribution plans was US$80,000 (2017: US$135,000; 2016: US$69,000). The aggregate remuneration, including pension contributions and other retirement benefits, incurred by Rio Tinto Limited in respect of its directors was US$607,000 (2017: US$535,000; 2016: US$1,696,000). The aggregate pension contribution to defined contribution plans was US$nil (2017: US$nil; 2016: US$nil).
During 2018, no directors (2017: nil; 2016: one) accrued retirement benefits under defined benefit arrangements, and three directors (2017: two; 2016: two) accrued retirement benefits under defined contribution arrangements.
Emoluments included in the table above have been translated from local currency at the average exchange rate for the year with the exception of bonus payments, which have been translated at the year-end rate.
Detailed information concerning directors’ remuneration, shareholdings and options is shown in the Remuneration report, including tables 1 to 3, on pages 101 to 136.
Aggregate compensation, representing the expense recognised under IFRS, as defined in note 1, of the Group’s key management, including directors, was as follows:
2018US$’000
2017US$’000
2016US$’000
Short-term employee benefits and costs 23,978 23,095 22,269
Post-employment benefits 629 415 3,461
Employment termination benefits 69 – 2,682
Share-based payments 14,916 8,033 15,806
Total 39,592 31,543 44,218
The figures shown above include employment costs which comprise social security and accident premiums in Canada, the UK and US and payroll taxes in Australia paid by the employer as a direct additional cost of hire. In total, they amount to US$2,360,000 (2017: US$2,122,000; 2016: US$2,295,000) and although disclosed here, are not included in table 1 of the Remuneration report.
More detailed information concerning the remuneration of key management is shown in the Remuneration report, including tables 1 to 3 on pages 101 to 136.
Annual report 2018 | riotinto.com 209
Financial statements

Financial statements
Notes to the 2018 financial statements continued
39 Auditors’ remunerationGroup Auditors’ remuneration(a)
2018US$m
2017US$m
2016US$m
Audit of the Group 9.2 6.2 4.5
Audit of subsidiaries 7.5 8.1 9.0
Total audit 16.7 14.3 13.5
Audit-related assurance service 0.9 1.0 0.9
Other assurance services(b) 3.3 2.3 0.6
Total assurance services 4.2 3.3 1.5
Tax compliance(c) – 0.3 0.5
Tax advisory services(c) – 0.2 0.1
Other non-audit services not covered above 0.2 0.7 1.8
Total non-audit services 4.4 4.5 3.9
Total Group Auditors’ remuneration 21.1 18.8 17.4
Audit fees payable to other accounting firms
Audit of the financial statements of the Group’s subsidiaries 1.4 2.0 2.1
Fees in respect of pension scheme audits 0.1 0.5 0.3
Total audit fees payable to other accounting firms 1.5 2.5 2.4
(a) The remuneration payable to PwC, the Group Auditors, is approved by the Audit Committee. The Committee sets the policy for the award of non-audit work to the auditors and approves the nature and extent of such work, and the amount of the related fees, to ensure that independence is maintained. The fees disclosed above consolidate all payments made to member firms of PwC by the companies and their subsidiaries, along with fees in respect of joint operations paid for by the Group. Non-audit services arise largely from assurance and/or regulation related work. Also included in amounts above are US$0.1 million for audits relating to associated pension schemes of the company and US$0.1 million of non-audit services relating to associated pension schemes.
(b) Other assurance services relates to the review of non-statutory financial information including sustainability reporting.(c) Tax compliance and tax advisory services incurred in the year amounted to US$0.04 million.
40 Related-party transactionsInformation about material related-party transactions of the Rio Tinto Group is set out below.
Subsidiary companies and joint operationsDetails of investments in principal subsidiary companies are disclosed in note 33. Information relating to joint operations can be found in note 34.
Equity accounted unitsTransactions and balances with equity accounted units are summarised below. Purchases, trade and other receivables, and trade and other payables relate largely to amounts charged by equity accounted units for toll processing of alumina and purchasing of bauxite and aluminium. Sales relate largely to sales of alumina to equity accounted units for smelting into aluminium.
Income statement items
Note2018
US$m2017
US$m2016
US$m
Purchases from equity accounted units (1,209) (993) (1,216)
Sales to equity accounted units 493 210 248
Cash flow statement itemsDividends from equity accounted units 800 817 253
Net funding of equity accounted units (9) (3) (12)
Balance sheet itemsInvestments in equity accounted units(a) 15 4,299 4,486 5,019
Loans to equity accounted units 20 38 39 39
Loans from equity accounted units 22 – (31) (49)
Trade and other receivables: amounts due from equity accounted units(b) 18 278 299 298
Trade and other payables: amounts due to equity accounted units 25 (223) (175) (243)
(a) Investments in equity accounted units include quasi equity loans. Further information about investments in equity accounted units is set out in notes 35 and 36.(b) This includes prepayments of tolling charges.
Annual report 2018 | riotinto.com210

Notes to the 2018 financial statements continued
Pension fundsInformation relating to pension fund arrangements is set out in note 44.
Directors and key managementDetails of directors’ and key management’s remuneration are set out in note 38 and in the Remuneration report on pages 101 to 136.
41 Exchange rates in US$The principal exchange rates used in the preparation of the 2018 financial statements were:
Full-year average Year-end
2018 2017 2016 2018 2017 2016
Sterling 1.34 1.29 1.36 1.27 1.34 1.22
Australian dollar 0.75 0.77 0.74 0.70 0.78 0.72
Canadian dollar 0.77 0.77 0.76 0.73 0.79 0.74
Euro 1.18 1.13 1.11 1.14 1.20 1.05
South African rand 0.076 0.075 0.068 0.069 0.081 0.073
42 Events after the balance sheet dateThere were no significant events identified after the balance sheet date that are required to be disclosed.
43 Share-based paymentsRio Tinto plc and Rio Tinto Limited have a number of share-based incentive plans, which are described in detail in the Remuneration report. These plans have been accounted for in accordance with the fair value recognition provisions of IFRS 2 “Share-based Payment”.
The charge that has been recognised in the income statement for Rio Tinto’s share-based incentive plans, and the related liability (for cash-settled plans), is set out in the table below.
Charge recognised for the year Liability at the end of the year
2018US$m
2017US$m
2016US$m
2018US$m
2017US$m
Equity-settled plans 118 88 116 – –
Cash-settled plans 4 3 – 16 15
Total 122 91 116 16 15
The main Rio Tinto plc and Rio Tinto Limited plans are as follows:
Share Option PlansAwards are no longer granted under the Share Option Plans and all charges have been incurred as the remaining awards all vested before 2018, although there remain outstanding vested options under these plans, all of which are due to expire in 2019.
UK Share Plan (formerly the Share Ownership Plan)The fair values of Matching and Free Shares made by Rio Tinto plc are taken to be the market value of the shares on the date of purchase. These awards are settled in equity.
Performance Share PlansParticipants are generally assigned shares in settlement of their Performance Share Awards (PSA) on vesting and therefore the awards are accounted for in accordance with the requirements applying to equity-settled share-based payment transactions, including the dividends accumulated from date of award to vesting.
For the parts of awards with Total Shareholder Return (TSR) performance conditions, the fair value of the awards was calculated using a Monte Carlo simulation model taking into account the TSR performance conditions. One-third of the awards granted from 2013 to 2017 (inclusive) are subject to an earnings margin performance target relative to ten global mining comparators. As this is a non-market related performance condition, under IFRS 2, the fair value recognised is reviewed at each accounting date based on the directors’ expectations for the proportion vesting. Forfeitures prior to vesting are assumed at 5% per annum of outstanding awards (2017: 5% per annum).
Management Share PlansThe Management Share Plans were introduced in 2007 (and readopted in 2017) to provide Management Share Awards (MSA) to management. The vesting of these awards is dependent on service conditions being met. In general, the awards will be settled in equity, including the dividends accumulated from date of award to vesting. The awards are accounted for in accordance with the requirements applying to equity-settled share-based payment transactions.
The fair value of each award on the day of grant is equal to the share price on the day of grant less a small adjustment for the timing of dividends. For awards granted since 2017 this adjustment is negligible and therefore the fair value of each award is equal to the share price on the day of grant. Forfeitures prior to vesting are assumed at 7% per annum of outstanding awards (2017: 7% per annum).
Annual report 2018 | riotinto.com 211
Financial statements

Financial statements
Notes to the 2018 financial statements continued
43 Share-based payments continuedBonus Deferral PlansThe Bonus Deferral Plans were introduced to award Bonus Deferral Awards (BDA) in connection with the mandatory deferral of 50% of the bonuses for executive directors and product group executives and 25% of the bonuses for other executives.
The vesting of these awards is dependent only on service conditions being met. In general, the awards will be settled in equity including the dividends accumulated from date of award to vesting. The awards are accounted for in accordance with the requirements applying to equity-settled share-based payment transactions. The fair value of each award on the day of grant is equal to the share price on the day of grant less a small adjustment for the timing of dividends. For awards granted since 2017 this adjustment is negligible and therefore the fair value of each award is equal to the share price on the day of grant. Forfeitures prior to vesting are assumed at 3% per annum of outstanding awards (2017: 3% per annum).
Equity Incentive PlanIn 2018, shareholders approved the introduction of the Rio Tinto 2018 Equity Incentive Plan (the “EIP”). From 2018, all long term incentive awards will be granted under this umbrella plan which allows for awards in the form of PSA, MSA and BDA to be granted.
For grants made from 2018, the earnings margin performance target applying to the PSA was removed and instead all of the awards are subject to the TSR performance conditions described above and in the Directors’ remuneration report.
Global Employee Share PlansThe Global Employee Share Plans were introduced in 2012. The companies provide a matching share award for each investment share purchased by a participant. The vesting of these matching awards is dependent on service conditions being met and the continued holding of investment shares by the participant until vesting. These awards are settled in equity including the dividends accumulated from date of award to vesting. The fair value of each matching share on the day of grant is equal to the share price on the date of purchase less a deduction of 15% for cancellations (caused by employees electing to withdraw their investment shares before vesting of their matching shares). Forfeitures prior to vesting are assumed at 5% per annum of outstanding awards (2017: 5% per annum).
Summary of options outstanding and exercisableA summary of the status of the companies’ equity-settled share option plans at 31 December 2018 is presented below.
At 31 December 2018 Number
Weightedaverageexerciseprice per
option £/A$
Weightedaverage
remainingcontractual
life Years
Aggregateintrinsic
value2018
US$m
Rio Tinto plc Share Option Plan (exercise price £16 – £25) 23,659 17 0.22 1
Rio Tinto Limited Share Option Plan (exercise price A$33) 16,455 33 0.21 –
Total 40,114 1
As at 31 December 2017 there were 188,766 options outstanding with an aggregate intrinsic value of US$3 million.
The Management Share Plans, Performance Share Plans, Bonus Deferral Plans, Equity Incentive Plans, Global Employee Share Plans and UK Share Plan together represent 100% (2017: 100%) of the total IFRS 2 charge for Rio Tinto plc and Rio Tinto Limited plans in 2018.
Performance Share Awards (granted under either the Performance Share Plans or the Equity Incentive Plans)
Rio Tinto plc awards Rio Tinto Limited awards
2018number
Weightedaverage fair
value atgrant date
2018 £
2017number
Weightedaverage fair
value atgrant date
2017 £
2018number
Weightedaverage fair
value atgrant date
2018A$
2017number
Weightedaverage fair
value atgrant date
2017 A$
Non-vested shares at 1 January 3,555,274 20.47 2,883,053 18.27 1,609,154 40.13 1,590,957 37.52
Awarded 801,047 26.87 1,198,677 24.64 387,298 53.85 529,776 45.84
Forfeited (188,761) 21.45 (199,435) 16.28 (36,530) 43.83 (36,716) 36.59
Failed performance conditions (107,625) 14.54 (161,966) 16.25 (54,322) 27.67 (113,857) 30.89
Vested (214,853) 21.57 (165,055) 21.51 (108,321) 40.85 (84,284) 40.79
Transfers from equity to cash-settled(a) – – – – – – (276,722) 40.11
Non-vested shares at 31 December 3,845,082 21.86 3,555,274 20.47 1,797,279 43.34 1,609,154 40.13
(a) In 2017, an agreement was reached between the Group and a former director to settle any of his future vested awards in cash rather than equity.
Annual report 2018 | riotinto.com212
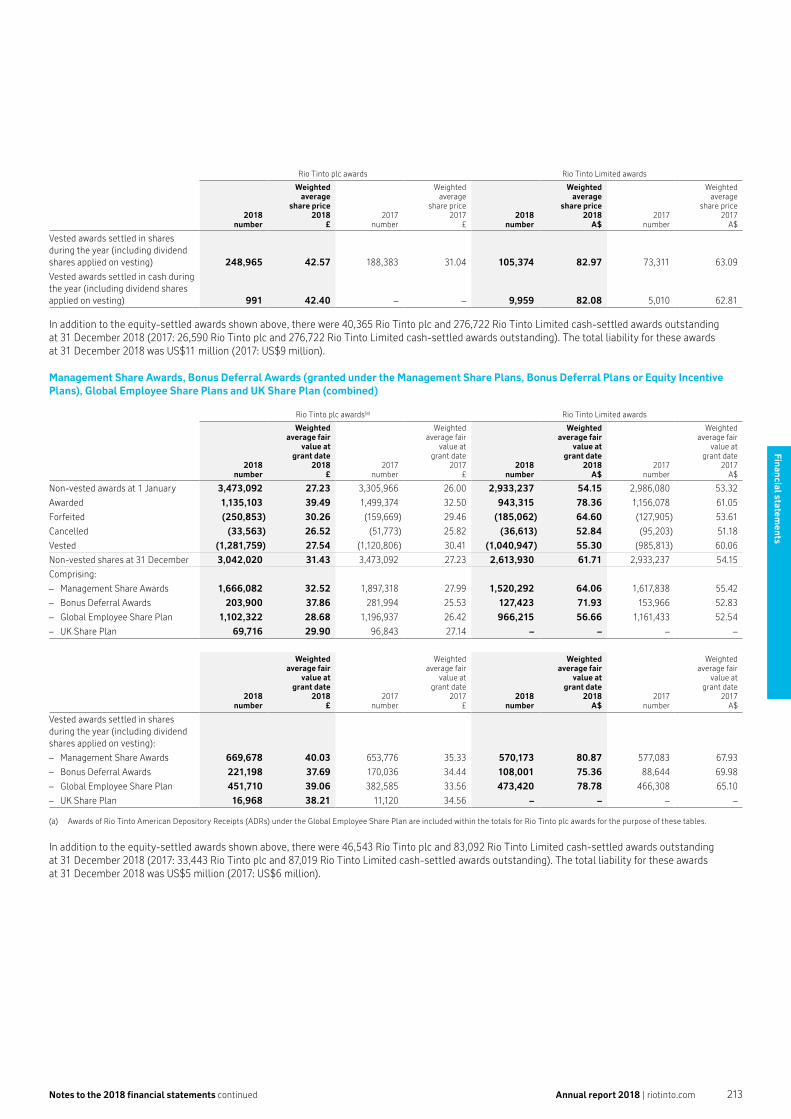
Notes to the 2018 financial statements continued
Rio Tinto plc awards Rio Tinto Limited awards
2018number
Weightedaverage
share price 2018
£2017
number
Weightedaverage
share price 2017
£2018
number
Weightedaverage
share price 2018
A$2017
number
Weightedaverage
share price2017
A$
Vested awards settled in shares during the year (including dividend shares applied on vesting) 248,965 42.57 188,383 31.04 105,374 82.97 73,311 63.09
Vested awards settled in cash during the year (including dividend shares applied on vesting) 991 42.40 – – 9,959 82.08 5,010 62.81
In addition to the equity-settled awards shown above, there were 40,365 Rio Tinto plc and 276,722 Rio Tinto Limited cash-settled awards outstanding at 31 December 2018 (2017: 26,590 Rio Tinto plc and 276,722 Rio Tinto Limited cash-settled awards outstanding). The total liability for these awards at 31 December 2018 was US$11 million (2017: US$9 million).
Management Share Awards, Bonus Deferral Awards (granted under the Management Share Plans, Bonus Deferral Plans or Equity Incentive Plans), Global Employee Share Plans and UK Share Plan (combined)
Rio Tinto plc awards(a) Rio Tinto Limited awards
2018number
Weightedaverage fair
value atgrant date
2018£
2017number
Weightedaverage fair
value atgrant date
2017£
2018number
Weightedaverage fair
value atgrant date
2018A$
2017number
Weightedaverage fair
value atgrant date
2017A$
Non-vested awards at 1 January 3,473,092 27.23 3,305,966 26.00 2,933,237 54.15 2,986,080 53.32
Awarded 1,135,103 39.49 1,499,374 32.50 943,315 78.36 1,156,078 61.05
Forfeited (250,853) 30.26 (159,669) 29.46 (185,062) 64.60 (127,905) 53.61
Cancelled (33,563) 26.52 (51,773) 25.82 (36,613) 52.84 (95,203) 51.18
Vested (1,281,759) 27.54 (1,120,806) 30.41 (1,040,947) 55.30 (985,813) 60.06
Non-vested shares at 31 December 3,042,020 31.43 3,473,092 27.23 2,613,930 61.71 2,933,237 54.15
Comprising:
– Management Share Awards 1,666,082 32.52 1,897,318 27.99 1,520,292 64.06 1,617,838 55.42
– Bonus Deferral Awards 203,900 37.86 281,994 25.53 127,423 71.93 153,966 52.83
– Global Employee Share Plan 1,102,322 28.68 1,196,937 26.42 966,215 56.66 1,161,433 52.54
– UK Share Plan 69,716 29.90 96,843 27.14 – – – –
2018number
Weightedaverage fair
value atgrant date
2018£
2017number
Weightedaverage fair
value atgrant date
2017£
2018number
Weightedaverage fair
value atgrant date
2018A$
2017number
Weightedaverage fair
value atgrant date
2017A$
Vested awards settled in shares during the year (including dividend shares applied on vesting):
– Management Share Awards 669,678 40.03 653,776 35.33 570,173 80.87 577,083 67.93
– Bonus Deferral Awards 221,198 37.69 170,036 34.44 108,001 75.36 88,644 69.98
– Global Employee Share Plan 451,710 39.06 382,585 33.56 473,420 78.78 466,308 65.10
– UK Share Plan 16,968 38.21 11,120 34.56 – – – –
(a) Awards of Rio Tinto American Depository Receipts (ADRs) under the Global Employee Share Plan are included within the totals for Rio Tinto plc awards for the purpose of these tables.
In addition to the equity-settled awards shown above, there were 46,543 Rio Tinto plc and 83,092 Rio Tinto Limited cash-settled awards outstanding at 31 December 2018 (2017: 33,443 Rio Tinto plc and 87,019 Rio Tinto Limited cash-settled awards outstanding). The total liability for these awards at 31 December 2018 was US$5 million (2017: US$6 million).
Annual report 2018 | riotinto.com 213
Financial statements
Financial statements
Notes to the 2018 financial statements continued
44 Post-retirement benefitsDescription of plansThe Group operates a number of pension and post-retirement healthcare plans around the world. Some of these plans are defined contribution and some are defined benefit, with assets held in separate trusts, foundations and similar entities.
Defined benefit pension and post-retirement healthcare plans expose the Group to a number of risks:
Uncertainty in benefit payments The value of the Group’s liabilities for post-retirement benefits will ultimately depend on the amount of benefits paid out. This in turn will depend on the level of future pay increases, the level of inflation (for those benefits that are subject to some form of inflation protection) and how long individuals live.
Volatility in asset values The Group is exposed to future movements in the values of assets held in pension plans to meet future benefit payments.
Uncertainty in cash funding Movements in the values of the obligations or assets may result in the Group being required to provide higher levels of cash funding, although changes in the level of cash required can often be spread over a number of years. In some countries control over the rate of cash funding or over the investment policy for pension assets might rest to some extent with a trustee body or other body that is not under the Group’s direct control. In addition the Group is also exposed to adverse changes in pension regulation.
For these reasons the Group has a policy of moving away from defined benefit pension provisions and towards defined contribution arrangements instead. The defined benefit pension plans for salaried employees are closed to new entrants in almost all countries. For unionised employees, some plans remain open.
The Group does not usually participate in multi-employer plans in which the risks are shared with other companies using those plans. The Group’s participation in such plans is immaterial and consequently no detailed disclosures are provided in this note.
Pension plansThe majority of the Group’s defined benefit pension obligations are in Canada, the UK, the US and Switzerland.
In Canada the benefits for salaried staff are generally linked to final average pay and the plans are generally closed to new entrants. Benefits for bargaining employees are reviewed in negotiation with unions and are typically either linked to final average pay or to a flat monetary amount per year of service. New employees join arrangements which are defined contribution from the Group’s perspective, with any required additional funding being provided by employees. The plans are subject to the regulatory requirements that apply to Canadian pension plans in the relevant provinces and territories (predominantly Quebec). Pension Committees are responsible for ensuring that the plans operate in a manner that is compliant with the relevant regulations. The Pension Committees generally have a number of members appointed by the sponsor and a number appointed by the plan participants. In some cases there is also an independent Committee member.
The defined benefit sections of the UK arrangements are linked to final pay. New employees are admitted to defined contribution sections. The plans are subject to the regulatory requirements that apply to UK pension plans. Trustees are responsible for ensuring that the plans operate in a manner that is compliant with UK regulations. The trustee board governing the main UK plans has a number of directors appointed by the sponsor, a number appointed by the plan participants and an independent trustee director.
A number of defined benefit pension plans are sponsored by the US entities. Benefits for salaried staff are generally linked to final average pay. Benefits for bargaining employees are reviewed in negotiation with unions and are typically a flat monetary amount per year of service. New employees are admitted to defined contribution plans. A Benefits Governance Committee is responsible for ensuring that the plans are compliant with US regulations. Members of that Committee are appointed by the sponsor.
In Europe, there are defined benefit plans in Switzerland, Germany and France. The largest single plan is in Switzerland and provides benefits linked to final average pay. The Swiss plan is overseen by a foundation board which is responsible for ensuring that the plan complies with Swiss regulations. Foundation board members are appointed by the plan sponsor, by employees and by retirees.
In Australia, the main arrangements are principally defined contribution in nature but there are sections providing defined benefits linked to final pay, typically paid in lump sum form.
The Group also operates a number of unfunded defined benefit plans, which are included in the figures below.
Post-retirement healthcare plansCertain subsidiaries of the Group, mainly in the US and Canada, provide health and life insurance benefits to retired employees and in some cases to their beneficiaries and covered dependants. Eligibility for cover is dependent upon certain age and service criteria. These arrangements are generally unfunded, and are included in the figures below.
Plan assetsThe assets of the pension plans are invested predominantly in a diversified range of equities, bonds and property. Consequently, the funding level of the pension plans is affected by movements in the level of equity markets and also by movements in interest rates. The Group monitors its exposure to changes in interest rates and equity markets and also measures its balance sheet pension risk using a value at risk approach. These measures are considered when deciding whether significant changes in investment strategy are required. Asset-liability studies are conducted on a periodic basis for the main pension plans to determine the optimal investment mix bearing in mind the Group’s tolerance for risk, the risk tolerance of the local sponsor companies and the views of the Pension Committees and trustee boards who are legally responsible for the investments of the plans. In Canada, the UK and Switzerland, the Group works with the governing bodies to ensure that the investment policy adopted is consistent with the Group’s tolerance for risk. In the US the Group has direct control over the investment policy, subject to local investment regulations.
Annual report 2018 | riotinto.com214

Notes to the 2018 financial statements continued
The proportions of the total fair value of assets in the pension plans for each asset class at the balance sheet date were:
2018 2017
Equities 20.7% 32.4%
– Quoted 16.7% 28.6%
– Private 4.0% 3.8%
Bonds 63.6% 53.2%
– Government fixed income 18.0% 14.3%
– Government inflation-linked 15.5% 13.1%
– Corporate and other publicly quoted 27.1% 23.5%
– Private 3.0% 2.3%
Property 11.0% 11.2%
– Quoted property funds 5.1% 5.8%
– Unquoted property funds 5.9% 5.4%
Qualifying insurance policies 0.1% 0.2%
Cash and other 4.6% 3.0%
Total 100.0% 100.0%
The assets of the plans are managed on a day-to-day basis by external specialist fund managers. These managers may invest in the Group’s securities subject to limits imposed by the relevant fiduciary committees and local legislation. The approximate total holding of Group securities within the plans is US$3 million (2017: US$13 million).
The holdings of quoted equities are invested either in pooled funds or segregated accounts held in the name of the relevant pension funds. These equity portfolios are well diversified in terms of the geographic distribution and market sectors.
The holdings of government bonds are generally invested in the debt of the country in which a pension plan is situated. Corporate and other quoted bonds are usually of investment grade. Private debt is mainly in North America.
The property funds are invested in a diversified range of properties.
The holdings of cash and other are predominantly cash and short-term money market instruments.
Investments in private equity, private debt and property are less liquid than the other investment classes listed above and therefore the Group’s investment in those asset classes is restricted to a level that does not endanger the liquidity of the pension plans.
The Group does not currently utilise derivatives to manage risk in its pension plans. However, fund managers may use derivatives to hedge currency movements within their portfolios and, in the case of bond managers, to take positions that could be taken using direct holdings of bonds but more efficiently.
Maturity of defined benefit obligationsAn approximate analysis of the maturity of the obligations is given in the table below:
Pensionbenefits
Otherbenefits
2018 Total
%
2017Total
%
2016Total
%
Proportion relating to current employees 20% 15% 19% 20% 21%
Proportion relating to former employees not yet retired 11% 2% 11% 11% 12%
Proportion relating to retirees 69% 83% 70% 69% 67%
Total 100% 100% 100% 100% 100%
Average duration of obligations (years) 13.4 12.7 13.4 13.9 14.3
Geographical distribution of defined benefit obligationsAn approximate analysis of the geographic distribution of the obligations is given in the table below:
Pensionbenefits
Otherbenefits
2018 Total
%
2017Total
%
2016Total
%
Canada 49% 39% 48% 49% 46%
UK 30% 2% 28% 27% 27%
US 11% 56% 14% 14% 16%
Switzerland 5% 0% 5% 5% 5%
Other 5% 3% 5% 5% 6%
Total 100% 100% 100% 100% 100%
Annual report 2018 | riotinto.com 215
Financial statements

Financial statements
Notes to the 2018 financial statements continued
44 Post-retirement benefits continuedTotal expense recognised in the income statement
Pensionbenefits
Otherbenefits
2018 Total
US$m
2017Total
US$m
2016Total
US$m
Current employer service cost for defined benefit plans (156) (9) (165) (155) (158)
Past service (cost)/income (34) (2) (36) 4 –
Curtailment gains 2 – 2 1 5
Settlement gains 5 – 5 1 –
Net interest on net defined benefit liability (44) (35) (79) (79) (90)
Non-investment expenses paid from the plans (15) – (15) (17) (22)
Total defined benefit expense (242) (46) (288) (245) (265)
Current employer service cost for defined contribution and industry-wide plans (242) (2) (244) (255) (257)
Total expense recognised in the income statement (484) (48) (532) (500) (522)
The above expense amounts are included as an employee cost within net operating costs. No amounts have been excluded from underlying earnings in 2018, 2017 or 2016.
The past service cost in 2018 relates primarily to benefit amendments in the US and also includes US$9 million to reflect the current estimate of the cost of equalising benefits in the Group’s UK schemes, in line with the requirements of the court judgment on 26 October 2018 in the case involving Lloyds Banking Group and relating to Guaranteed Minimum Pensions. The settlement gain in 2018 is the result of certain US obligations being transferred to an external insurance company. The curtailments relate primarily to headcount reductions at various operations.
Total amount recognised in other comprehensive income before tax
2018US$m
2017US$m
2016US$m
Actuarial gains/(losses) 1,382 (855) (1,120)
Return on assets (net of interest on assets) (527) 894 1,031
Gain/(loss) on application of asset ceiling 52 (33) (1)
Total gain/(loss) recognised in other comprehensive income 907 6 (90)
Amounts recognised in the balance sheetThe following amounts were measured in accordance with IAS 19 at 31 December:
Pensionbenefits
Otherbenefits
2018 Total
US$m
2017Total
US$m
Total fair value of plan assets 13,203 – 13,203 15,257
Present value of obligations – funded (13,482) – (13,482) (16,199)
Present value of obligations – unfunded (401) (871) (1,272) (1,446)
Present value of obligations – total (13,883) (871) (14,754) (17,645)
Effect of asset ceiling – – – (111)
Net deficit to be shown in the balance sheet (680) (871) (1,551) (2,499)
Comprising:
– Deficits (1,615) (871) (2,486) (3,370)
– Surpluses 935 – 935 871
Net deficits on pension plans (680) – (680) (1,501)
Unfunded post-retirement healthcare obligation – (871) (871) (998)
The surplus amounts shown above are included in the balance sheet as Trade and other receivables. See note 18.
Deficits are shown in the balance sheet within Provisions (including post-retirement benefits). See note 26.
Annual report 2018 | riotinto.com216
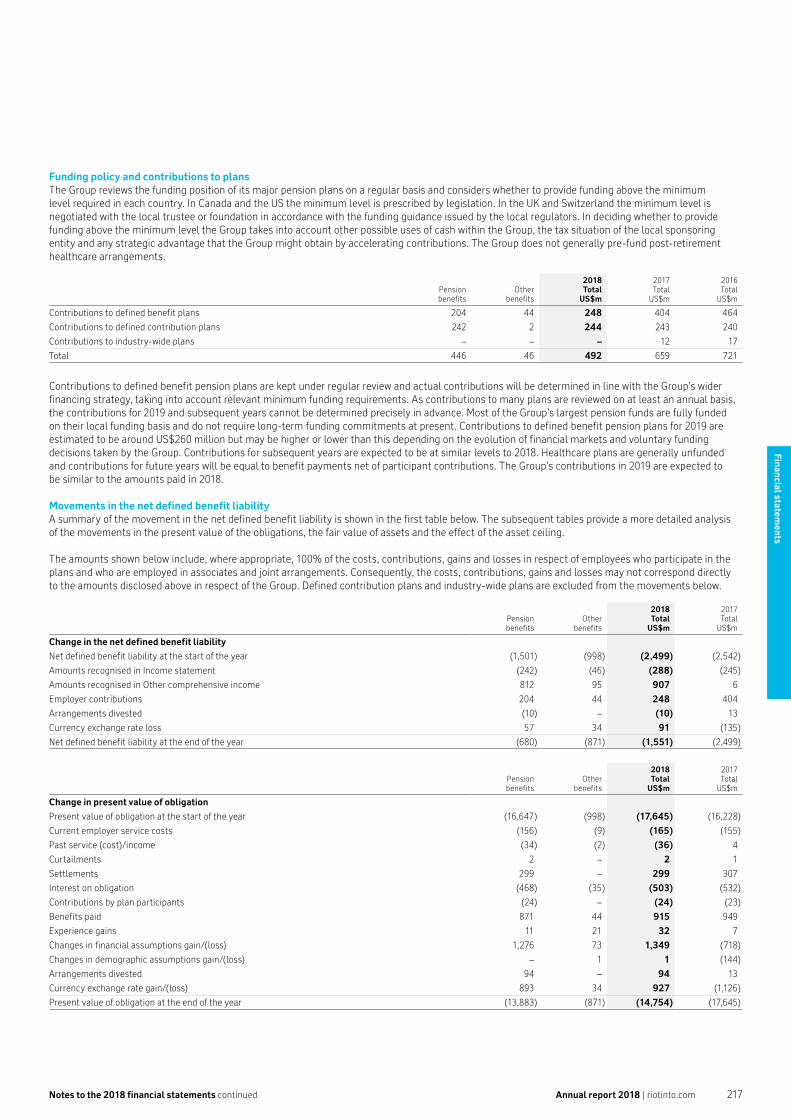
Notes to the 2018 financial statements continued
Funding policy and contributions to plansThe Group reviews the funding position of its major pension plans on a regular basis and considers whether to provide funding above the minimum level required in each country. In Canada and the US the minimum level is prescribed by legislation. In the UK and Switzerland the minimum level is negotiated with the local trustee or foundation in accordance with the funding guidance issued by the local regulators. In deciding whether to provide funding above the minimum level the Group takes into account other possible uses of cash within the Group, the tax situation of the local sponsoring entity and any strategic advantage that the Group might obtain by accelerating contributions. The Group does not generally pre-fund post-retirement healthcare arrangements.
Pensionbenefits
Otherbenefits
2018 Total
US$m
2017Total
US$m
2016Total
US$m
Contributions to defined benefit plans 204 44 248 404 464
Contributions to defined contribution plans 242 2 244 243 240
Contributions to industry-wide plans – – – 12 17
Total 446 46 492 659 721
Contributions to defined benefit pension plans are kept under regular review and actual contributions will be determined in line with the Group’s wider financing strategy, taking into account relevant minimum funding requirements. As contributions to many plans are reviewed on at least an annual basis, the contributions for 2019 and subsequent years cannot be determined precisely in advance. Most of the Group’s largest pension funds are fully funded on their local funding basis and do not require long-term funding commitments at present. Contributions to defined benefit pension plans for 2019 are estimated to be around US$260 million but may be higher or lower than this depending on the evolution of financial markets and voluntary funding decisions taken by the Group. Contributions for subsequent years are expected to be at similar levels to 2018. Healthcare plans are generally unfunded and contributions for future years will be equal to benefit payments net of participant contributions. The Group’s contributions in 2019 are expected to be similar to the amounts paid in 2018.
Movements in the net defined benefit liabilityA summary of the movement in the net defined benefit liability is shown in the first table below. The subsequent tables provide a more detailed analysis of the movements in the present value of the obligations, the fair value of assets and the effect of the asset ceiling.
The amounts shown below include, where appropriate, 100% of the costs, contributions, gains and losses in respect of employees who participate in the plans and who are employed in associates and joint arrangements. Consequently, the costs, contributions, gains and losses may not correspond directly to the amounts disclosed above in respect of the Group. Defined contribution plans and industry-wide plans are excluded from the movements below.
Pensionbenefits
Otherbenefits
2018 Total
US$m
2017Total
US$m
Change in the net defined benefit liability
Net defined benefit liability at the start of the year (1,501) (998) (2,499) (2,542)
Amounts recognised in Income statement (242) (46) (288) (245)
Amounts recognised in Other comprehensive income 812 95 907 6
Employer contributions 204 44 248 404
Arrangements divested (10) – (10) 13
Currency exchange rate loss 57 34 91 (135)
Net defined benefit liability at the end of the year (680) (871) (1,551) (2,499)
Pensionbenefits
Otherbenefits
2018 Total
US$m
2017Total
US$m
Change in present value of obligation
Present value of obligation at the start of the year (16,647) (998) (17,645) (16,228)
Current employer service costs (156) (9) (165) (155)
Past service (cost)/income (34) (2) (36) 4
Curtailments 2 – 2 1
Settlements 299 – 299 307
Interest on obligation (468) (35) (503) (532)
Contributions by plan participants (24) – (24) (23)
Benefits paid 871 44 915 949
Experience gains 11 21 32 7
Changes in financial assumptions gain/(loss) 1,276 73 1,349 (718)
Changes in demographic assumptions gain/(loss) – 1 1 (144)
Arrangements divested 94 – 94 13
Currency exchange rate gain/(loss) 893 34 927 (1,126)
Present value of obligation at the end of the year (13,883) (871) (14,754) (17,645)
Annual report 2018 | riotinto.com 217
Financial statements
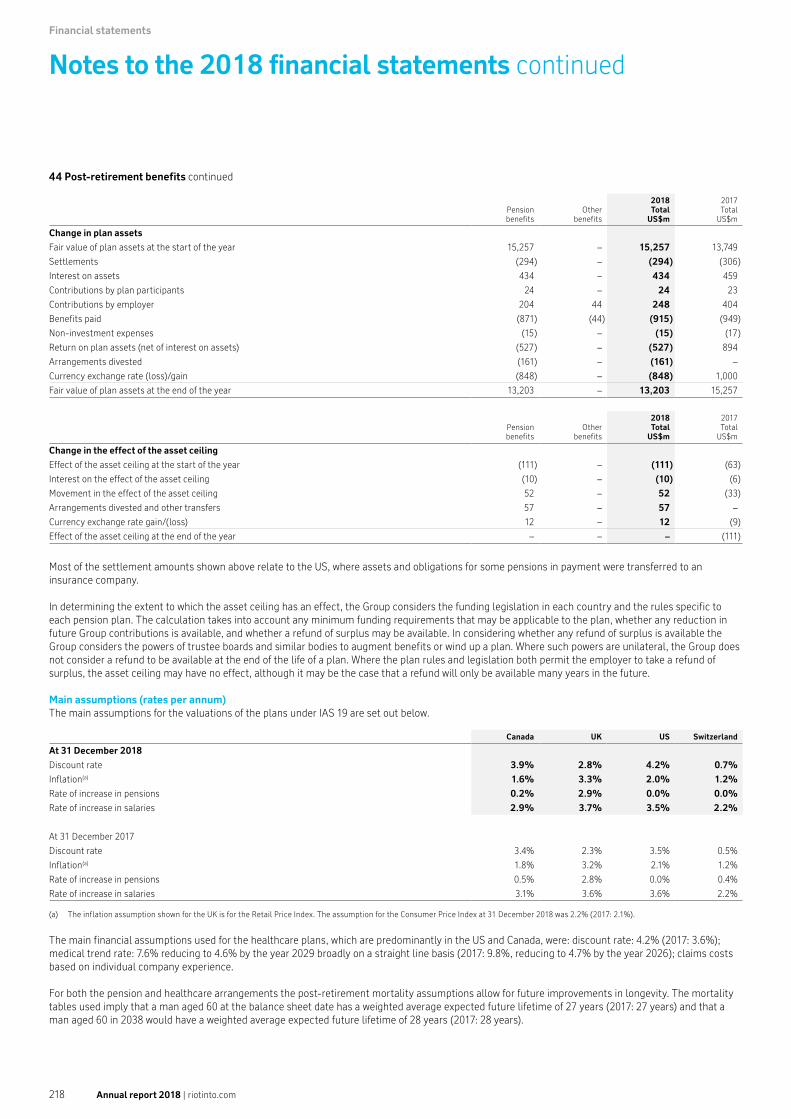
Financial statements
Notes to the 2018 financial statements continued
44 Post-retirement benefits continued
Pensionbenefits
Otherbenefits
2018 Total
US$m
2017Total
US$m
Change in plan assets
Fair value of plan assets at the start of the year 15,257 – 15,257 13,749
Settlements (294) – (294) (306)
Interest on assets 434 – 434 459
Contributions by plan participants 24 – 24 23
Contributions by employer 204 44 248 404
Benefits paid (871) (44) (915) (949)
Non-investment expenses (15) – (15) (17)
Return on plan assets (net of interest on assets) (527) – (527) 894
Arrangements divested (161) – (161) –
Currency exchange rate (loss)/gain (848) – (848) 1,000
Fair value of plan assets at the end of the year 13,203 – 13,203 15,257
Pensionbenefits
Otherbenefits
2018 Total
US$m
2017Total
US$m
Change in the effect of the asset ceiling
Effect of the asset ceiling at the start of the year (111) – (111) (63)
Interest on the effect of the asset ceiling (10) – (10) (6)
Movement in the effect of the asset ceiling 52 – 52 (33)
Arrangements divested and other transfers 57 – 57 –
Currency exchange rate gain/(loss) 12 – 12 (9)
Effect of the asset ceiling at the end of the year – – – (111)
Most of the settlement amounts shown above relate to the US, where assets and obligations for some pensions in payment were transferred to an insurance company.
In determining the extent to which the asset ceiling has an effect, the Group considers the funding legislation in each country and the rules specific to each pension plan. The calculation takes into account any minimum funding requirements that may be applicable to the plan, whether any reduction in future Group contributions is available, and whether a refund of surplus may be available. In considering whether any refund of surplus is available the Group considers the powers of trustee boards and similar bodies to augment benefits or wind up a plan. Where such powers are unilateral, the Group does not consider a refund to be available at the end of the life of a plan. Where the plan rules and legislation both permit the employer to take a refund of surplus, the asset ceiling may have no effect, although it may be the case that a refund will only be available many years in the future.
Main assumptions (rates per annum)The main assumptions for the valuations of the plans under IAS 19 are set out below.
Canada UK US Switzerland
At 31 December 2018
Discount rate 3.9% 2.8% 4.2% 0.7%
Inflation(a) 1.6% 3.3% 2.0% 1.2%
Rate of increase in pensions 0.2% 2.9% 0.0% 0.0%
Rate of increase in salaries 2.9% 3.7% 3.5% 2.2%
At 31 December 2017
Discount rate 3.4% 2.3% 3.5% 0.5%
Inflation(a) 1.8% 3.2% 2.1% 1.2%
Rate of increase in pensions 0.5% 2.8% 0.0% 0.4%
Rate of increase in salaries 3.1% 3.6% 3.6% 2.2%
(a) The inflation assumption shown for the UK is for the Retail Price Index. The assumption for the Consumer Price Index at 31 December 2018 was 2.2% (2017: 2.1%).
The main financial assumptions used for the healthcare plans, which are predominantly in the US and Canada, were: discount rate: 4.2% (2017: 3.6%); medical trend rate: 7.6% reducing to 4.6% by the year 2029 broadly on a straight line basis (2017: 9.8%, reducing to 4.7% by the year 2026); claims costs based on individual company experience.
For both the pension and healthcare arrangements the post-retirement mortality assumptions allow for future improvements in longevity. The mortality tables used imply that a man aged 60 at the balance sheet date has a weighted average expected future lifetime of 27 years (2017: 27 years) and that a man aged 60 in 2038 would have a weighted average expected future lifetime of 28 years (2017: 28 years).
Annual report 2018 | riotinto.com218
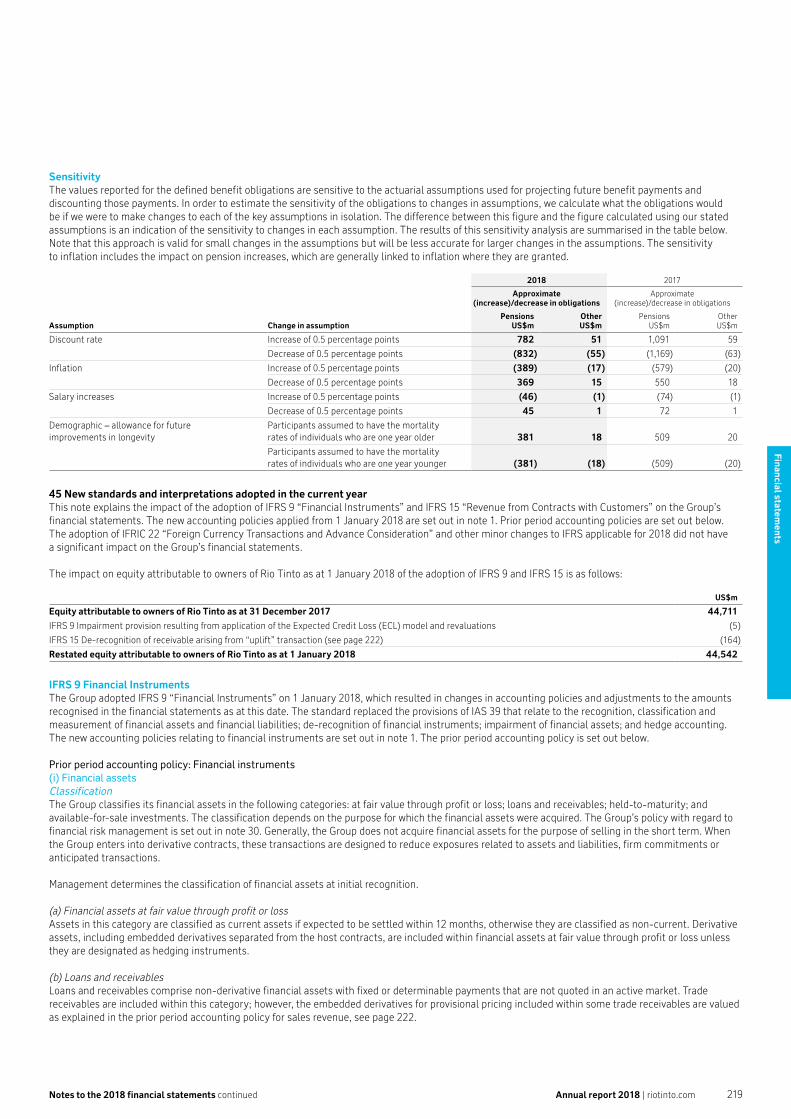
Notes to the 2018 financial statements continued
SensitivityThe values reported for the defined benefit obligations are sensitive to the actuarial assumptions used for projecting future benefit payments and discounting those payments. In order to estimate the sensitivity of the obligations to changes in assumptions, we calculate what the obligations would be if we were to make changes to each of the key assumptions in isolation. The difference between this figure and the figure calculated using our stated assumptions is an indication of the sensitivity to changes in each assumption. The results of this sensitivity analysis are summarised in the table below. Note that this approach is valid for small changes in the assumptions but will be less accurate for larger changes in the assumptions. The sensitivity to inflation includes the impact on pension increases, which are generally linked to inflation where they are granted.
Assumption Change in assumption
2018 2017
Approximate (increase)/decrease in obligations
Approximate (increase)/decrease in obligations
PensionsUS$m
OtherUS$m
PensionsUS$m
OtherUS$m
Discount rate Increase of 0.5 percentage points 782 51 1,091 59
Decrease of 0.5 percentage points (832) (55) (1,169) (63)
Inflation Increase of 0.5 percentage points (389) (17) (579) (20)
Decrease of 0.5 percentage points 369 15 550 18
Salary increases Increase of 0.5 percentage points (46) (1) (74) (1)
Decrease of 0.5 percentage points 45 1 72 1
Demographic – allowance for future improvements in longevity
Participants assumed to have the mortality rates of individuals who are one year older 381 18 509 20
Participants assumed to have the mortality rates of individuals who are one year younger (381) (18) (509) (20)
45 New standards and interpretations adopted in the current year This note explains the impact of the adoption of IFRS 9 “Financial Instruments” and IFRS 15 “Revenue from Contracts with Customers” on the Group’s financial statements. The new accounting policies applied from 1 January 2018 are set out in note 1. Prior period accounting policies are set out below. The adoption of IFRIC 22 “Foreign Currency Transactions and Advance Consideration” and other minor changes to IFRS applicable for 2018 did not have a significant impact on the Group’s financial statements.
The impact on equity attributable to owners of Rio Tinto as at 1 January 2018 of the adoption of IFRS 9 and IFRS 15 is as follows:
US$m
Equity attributable to owners of Rio Tinto as at 31 December 2017 44,711
IFRS 9 Impairment provision resulting from application of the Expected Credit Loss (ECL) model and revaluations (5)
IFRS 15 De-recognition of receivable arising from “uplift” transaction (see page 222) (164)
Restated equity attributable to owners of Rio Tinto as at 1 January 2018 44,542
IFRS 9 Financial InstrumentsThe Group adopted IFRS 9 “Financial Instruments” on 1 January 2018, which resulted in changes in accounting policies and adjustments to the amounts recognised in the financial statements as at this date. The standard replaced the provisions of IAS 39 that relate to the recognition, classification and measurement of financial assets and financial liabilities; de-recognition of financial instruments; impairment of financial assets; and hedge accounting. The new accounting policies relating to financial instruments are set out in note 1. The prior period accounting policy is set out below.
Prior period accounting policy: Financial instruments(i) Financial assetsClassificationThe Group classifies its financial assets in the following categories: at fair value through profit or loss; loans and receivables; held-to-maturity; and available-for-sale investments. The classification depends on the purpose for which the financial assets were acquired. The Group’s policy with regard to financial risk management is set out in note 30. Generally, the Group does not acquire financial assets for the purpose of selling in the short term. When the Group enters into derivative contracts, these transactions are designed to reduce exposures related to assets and liabilities, firm commitments or anticipated transactions.
Management determines the classification of financial assets at initial recognition.
(a) Financial assets at fair value through profit or lossAssets in this category are classified as current assets if expected to be settled within 12 months, otherwise they are classified as non-current. Derivative assets, including embedded derivatives separated from the host contracts, are included within financial assets at fair value through profit or loss unless they are designated as hedging instruments.
(b) Loans and receivablesLoans and receivables comprise non-derivative financial assets with fixed or determinable payments that are not quoted in an active market. Trade receivables are included within this category; however, the embedded derivatives for provisional pricing included within some trade receivables are valued as explained in the prior period accounting policy for sales revenue, see page 222.
Annual report 2018 | riotinto.com 219
Financial statements

Financial statements
Notes to the 2018 financial statements continued
45 New standards and interpretations adopted in the current year continued(c) Held-to-maturityHeld-to-maturity investments are non-derivative financial assets with fixed or determinable payments and fixed maturity that the Group has the intention and ability to hold to maturity and which do not qualify as loans and receivables. Assets in this category are classified as Other investments and are classified as current assets or non-current assets based on their maturity.
(d) Available-for-sale Available-for-sale financial assets are non-derivative financial assets that are either designated as available-for-sale or not classified in any of the other categories. Assets in this category are included in non-current assets unless the Group intends to dispose of the assets within 12 months of the balance sheet date or the asset matures within 12 months.
Recognition and measurementAvailable-for-sale financial assets and financial assets at fair value through profit or loss are initially recognised at fair value and are subsequently measured at fair value. Initial transaction costs are expensed in the income statement for those assets at fair value through profit or loss. Loans and receivables and held-to-maturity financial assets are initially recognised at fair value plus transaction costs and are subsequently measured at amortised cost using the effective interest method.
The fair values of the various derivative instruments used for hedging purposes are disclosed in note 30. Movements on the hedging reserve are disclosed in note 29.
(ii) Financial liabilitiesBorrowings and other financial liabilities (including trade payables but excluding derivative liabilities) are recognised initially at fair value, net of transaction costs incurred, and are subsequently measured at amortised cost.
The Group participates in supply chain finance arrangements whereby vendors may elect to receive early payment of their invoice from a bank by factoring their receivable from Rio Tinto. These arrangements do not modify the terms of the original liability and therefore, financial liabilities subject to supply chain finance continue to be classified as trade payables.
Impact of transition to IFRS 9 “Financial Instruments” as at 1 January 2018For transition, the Group has elected to apply the limited exemption in IFRS 9 relating to the classification, measurement and impairment requirements for financial assets and accordingly has not restated comparative periods. Any resulting adjustments to carrying values in the opening balance sheet have been recognised in opening retained earnings at 1 January 2018. The Group has elected for retrospective application for certain aspects of hedge accounting in particular relating to the treatment of the cost of hedging.
The Group applies the new forward looking expected credit loss model required by IFRS 9, using the simplified approach for its trade receivables portfolio review and the general approach for all other financial assets as required by the standard.
The impact of transition to IFRS 9 on the Group’s opening retained earnings as at 1 January 2018 is as follows:
US$m
Closing retained earnings 31 December 2017 23,761
Costs of hedging adjustment (22)
Reclassification of equity investments from available-for-sale to FVPL 12
Impairment provision resulting from the application of the ECL model (7)
Tax impact 1
Revaluation of funds 1
Adjustment to retained earnings from adoption of IFRS 9 on 1 January 2018 (sub-total) (15)
Opening retained earnings 1 January 2018 – IFRS 9 (before restatement for IFRS 15) 23,746
A Classification and measurement of financial assetsOn 1 January 2018, the Group’s management assessed the classification of its financial assets on the basis of the contractual terms of their cash flows and the business model by which they are managed.
Financial assets have been classified into the appropriate IFRS 9 categories below. Refer to note 1 for the Group’s revised financial asset classification and measurement policies.
Annual report 2018 | riotinto.com220

Notes to the 2018 financial statements continued
IFRS 9 classification at 1 January 2018 Held at FVPLHeld at FVOCI
(designated)Held at
amortised cost
IAS 39 classification at 1 January 2018Total
US$m
Held fortrading
US$m
Available- for-sale
US$m
Loans and receivables,
Held-to-maturity
US$m
Opening balance – IAS 39 15,288 1,482 136 13,670
Cash and cash equivalents(a) (b)
Reclassification of money market funds from amortised cost to FVPL – 7,813 – (7,813)
Trade and other receivables(b) (c)
Reclassification of trade and other receivables from amortised cost to FVPL – 1,316 – (1,316)
Investments in equity shares and funds(d)
Reclassification of investments from available-for-sale to FVPL – 90 (90) –
Other investment including loans
Reclassification of a financial asset from held-to-maturity to FVPL – 6 – (6)
Opening balance – IFRS 9 (excluding expected credit losses and revaluation of funds) 15,288 10,707 46 4,535
Impairment provision resulting from the application of the ECL model (7)
Revaluation of funds 1
Opening balance – IFRS 9 (including expected credit losses and revaluation of funds) 15,282
The material reclassification adjustments related to:(a) Money market funds of US$7.8 billion did not meet the strict solely principal and interest on principal (SPPI) criteria resulting in a reclassification from amortised cost to FVPL. These
instruments continue to meet the IAS 7 “Statement of Cash Flows” criteria for classification as cash and cash equivalents and will continue to be included within net debt, as disclosed in note 24.
(b) Due to the short-term nature of these financial assets the fair value of the reclassified assets does not differ significantly from their amortised cost.(c) Trade receivables of US$1.3 billion with embedded derivatives (relating to provisional pricing terms at the time control of goods passed) did not meet the SPPI criteria; these balances
are considered in their entirety for classification purposes under IFRS 9.(d) Investments not meeting the SPPI test have been reclassified to FVPL.
B Retained earnings and reserves
Effect on Available-
for sale (AfS)reserve
US$m
Effect on FVOCI reserve
US$m
Costs of hedging reserve
US$m
Cash flowhedge
reserveUS$m
Effect onretainedearnings
US$m
Closing balance – 31 December 2017 20 – – 32 23,761
Reclassification of equity investments from AfS(e) (20) 8 – – 12
Impact of costs of hedging adjustment(f) – – 26 (4) (22)
Impairment provisions(g) – – – – (7)
Tax impact – – – – 1
Re-measurement of funds – – – – 1
Total impact (20) 8 26 (4) (15)
Opening balance – 1 January 2018 – 8 26 28 23,746
(e) The Group has elected to classify certain equity investments as fair value through OCI.(f) The costs of hedging adjustment is explained in C below.(g) The impairment provision is explained in D below.
C Derivatives and hedging activitiesThe Group’s risk management strategies and associated hedge documentation have been aligned with the requirements of IFRS 9 and existing hedging relationships under IAS 39 have been treated as continuing hedges.
Amendments to the hedge accounting rules under the new standard have allowed the Group to apply hedge accounting to the aluminium forward and option contracts embedded in the electricity purchase contracts of certain aluminium smelters thus reducing volatility in the income statement.
IFRS 9 allows for the deferral of certain costs of hedging including foreign currency basis spreads. The Group has designated cross currency interest rate swaps as hedging instruments and excluded the foreign currency basis spreads from the hedge relationship. Changes in the foreign currency basis spread are included in a cost of hedging reserve and will be subsequently recycled to profit or loss as the hedged item impacts on profit or loss. The retrospective application for the treatment of foreign currency spreads has resulted in a transfer of US$22 million from retained earnings to the cost of hedging reserve and a transfer of US$4 million from the cash flow hedge reserve to the cost of hedging reserve.
Annual report 2018 | riotinto.com 221
Financial statements

Financial statements
Notes to the 2018 financial statements continued
45 New standards and interpretations adopted in the current year continuedD Impairment of financial assetsThe Group implemented the new forward looking expected credit loss model which is required for certain financial instruments. The simplified approach was used for the trade receivables portfolio and the general approach was applied to all other financial assets requiring review. The transition impact of US$7 million on opening retained earnings is disclosed on page 220.
IFRS 15 Revenue from contracts with customers IFRS 15 replaces IAS 18 “Revenue”. The prior period IAS 18 accounting policy is set out below:
Prior period accounting policy: Sales revenueSales revenue comprises sales to third parties. All shipping and handling costs incurred by the Group are recognised as operating costs. If the Group is acting solely as an agent, amounts billed to customers for shipping and handling are offset against the relevant costs. Revenue from services is recognised as those services are rendered to, and accepted by, the customer.
Sales revenue excludes any applicable sales taxes. Mining royalties payable are presented as an operating cost or, where they are in substance a profit-based tax, within taxation.
Revenues from the sale of significant by-products, such as gold, are included in sales revenue. Other operating income, incidental to the main revenue-generating activities of the operations, is treated as a credit to operating costs.
Third-party commodity swap arrangements principally for delivery and receipt of smelter grade alumina are offset within operating costs.
Sales of copper concentrate are stated at their invoiced amount which is net of treatment and refining charges.
Sales revenue is only recognised on individual sales when all of the following criteria are met:
– the significant risks and rewards of ownership of the product have been transferred to the buyer; – neither continuing managerial involvement to the degree usually associated with ownership, nor effective control over the goods sold,
has been retained; – the amount of revenue can be measured reliably; – it is probable that the economic benefits associated with the sale will flow to the Group; and – the costs incurred or to be incurred in respect of the sale can be measured reliably.
In most instances, sales revenue is recognised when the product is delivered to the destination specified by the customer, which is typically the vessel on which it will be shipped, the destination port or the customer’s premises.
The Group’s products are sold to customers under contracts which vary in tenure and pricing mechanisms, including some volumes sold in the spot market. Sales revenue may be subject to adjustment if the product specification does not conform to the terms specified in the sales contract.
Pricing for iron ore is on a range of terms, the majority being either monthly or quarterly average pricing mechanisms, with a smaller proportion of iron ore volumes being sold on the spot market.
Certain of the Group’s products are provisionally priced at the date revenue is recognised; however, with the exception of copper, prices are generally finalised within the calendar quarter of the month of shipment. The final selling price is based on the price for the quotational period stipulated in the contract. Substantially all iron ore and aluminium sales are reflected at final prices in the results for the period. Final prices for copper concentrate are normally determined between 30 to 180 days after delivery to the customer. The change in value of the embedded pricing derivative included in the receivable is based on relevant forward market prices and is included in sales revenue.
Information on provisionally priced sales contracts is included in note 30.
Impact of transition to IFRS 15 “Revenue from Contracts with Customers”The impact of transition to IFRS 15 “Revenue from Contracts with Customers” as at 1 January 2018 is as follows:
The core principle of IFRS 15 is that an entity recognises revenue related to the transfer of promised goods or services when control of the goods or services passes to the customer. The amount of revenue recognised should reflect the consideration to which the entity expects to be entitled in exchange for those goods or services.
The Group has adopted the modified transitional approach to implementation and the new standard has therefore been applied only to contracts that remain in force at 1 January 2018. A US$164 million (US$235 million pre-tax) transition adjustment has been recognised in retained earnings on transition at 1 January 2018 without adjustment of comparatives. The adjustment reduces trade and other receivables by US$235 million and deferred tax liabilities by US$71 million.
Annual report 2018 | riotinto.com222

Notes to the 2018 financial statements continued
The transition adjustment related to an “uplift” arrangement with a partner in a joint operation whereby sales revenue was recognised under IAS 18 when the Group sold product from other operations to its partner to allow it to meet its contractual obligations when insufficient product was available in the jointly owned operation. The Group recognised an asset for product which will be receivable from the partner out of the partner’s share of future production of the joint operation. Under IFRS 15, such transactions with partners in joint operations cannot be recognised as sales revenue. The US$235 million receivable has accumulated over prior years. The change in accounting has no impact on the commercial arrangement or current or future cash flows. Under IFRS 15, sales revenue is recognised in the income statement when product is received from the partner and sold to a customer of the Group. The impact for the year is a US$19 million decrease in sales revenue compared with the amount that would have been reflected under IAS 18. The impact of all other measurement differences identified between IAS 18 and IFRS 15 was immaterial at 1 January 2018 and 31 December 2018.
46 Rio Tinto Limited parent company disclosuresAs at 31 December
2018A$m
2017A$m
Assets
Current assets 8,948 11,914
Non-current assets 6,962 7,954
Total assets 15,910 19,868
Liabilities
Current liabilities (3,063) (7,448)
Non-current liabilities (330) (35)
Total liabilities (3,393) (7,483)
Net assets 12,517 12,385
Shareholders’ equity
Share capital 3,504 3,893
Other reserves 362 420
Retained earnings 8,651 8,072
Total equity 12,517 12,385
Profit of the parent company 10,707 9,688
Total comprehensive income of the parent company 10,707 9,688
Prepared under Australian Accounting Standards (AAS). In relation to Rio Tinto Limited there are no significant measurement differences between AAS and IFRS as defined in note 1.
Rio Tinto Limited guaranteesRio Tinto Limited provides a number of guarantees in respect of Group companies.
Rio Tinto plc and Rio Tinto Limited have jointly guaranteed the Group’s external listed debt under the US Shelf Programme, European Debt Issuance Programme and Commercial Paper Programme which totalled A$8.4 billion at 31 December 2018 (31 December 2017: A$10.2 billion); in addition, these entities also jointly guarantee the Group’s undrawn credit facility which was A$10.6 billion at 31 December 2018 (31 December 2017: A$9.6 billion).
Rio Tinto Limited has guaranteed other external debt held by Rio Tinto Group entities which totalled A$0.1 billion at 31 December 2018 (31 December 2017: A$0.1 billion) and provided guarantees in respect of certain derivative contracts which were in a liability position of A$26 million at 31 December 2018 (31 December 2017: A$48 million).
In addition, Rio Tinto Limited has provided a guarantee of all obligations, including contingent obligations, of Rio Tinto Finance Limited, a wholly owned subsidiary.
Pursuant to the DLC Merger, both Rio Tinto plc and Rio Tinto Limited issued deed poll guarantees by which each company guaranteed contractual obligations incurred by the other or guaranteed by the other.
Annual report 2018 | riotinto.com 223
Financial statements

Financial statements
Notes to the 2018 financial statements continued
47 Related undertakingsIn accordance with section 409 of the UK Companies Act 2006, disclosed below is a full list of related undertakings of the Group. Related undertakings include “subsidiaries”, “associated undertakings”, and “significant holdings in undertakings other than subsidiary companies”. The registered office address, country of incorporation, classes of shares and the effective percentage of equity owned by the Group calculated by reference to voting rights, is disclosed as at 31 December 2018.
The definition of a subsidiary undertaking in accordance with the UK Companies Act 2006 is different from the definition under IFRS. As a result, the related undertakings included within this list may not be the same as the related undertakings consolidated in the Group IFRS financial statements. Unless otherwise disclosed, all undertakings with an effective equity holding of greater than 50% are considered subsidiary undertakings for the purpose of this note.
Refer to notes 33-36 for further information on accounting policies, basis of consolidation, principal subsidiaries, joint operations, joint ventures and associates.
An explanation of the dual listed companies structure of Rio Tinto plc and Rio Tinto Limited can be found on pages 292 to 293. For completeness, the effective ownership by the Group relates to effective holdings by both entities either together or individually.
Wholly owned subsidiary undertakings continued
Name of undertaking and countryof incorporation Share class
% of shareclass heldby Groupcompanies
EffectiveGroup %ownership Registered office address
10029734 Canada Inc.; Canada CAD$1.00Common shares
100100
400-1190 Avenue des Canadiens-de-Montréal,Montréal Québec H3B 0E3, CanadaCAD$1.00
Preferred shares100
1043802 Ontario Ltd.; Canada CADOrdinary shares
100 10066 Wellington Street West, Suite 4700, Toronto Dominion Bank Tower, Toronto ON M5K 1E6, Canada
10676276 Canada Inc.; Canada CADCommon shares
100 100400-1190 Avenue des Canadiens-de-Montréal, Montréal Québec H3B 0E3, Canada
10676284 Canada Inc.; Canada CADCommon shares
100 100400-1190 Avenue des Canadiens-de-Montréal, Montréal Québec H3B 0E3, Canada
11091905 Canada Inc.; Canada CAD$1.00 Common shares
100100
400-1190 Avenue des Canadiens-de-Montréal, Montréal Québec H3B 0E3, CanadaCAD$1.00
Preferred shares100
1109723 B.C. Ltd.; Canada CADCommon shares
100 1001800-510 West Georgia Street, Vancouver BC V6B 0M3, Canada
46106 YUKON INC.; Canada CADCommon shares
100 100 200-204 Lambert Street, Whitehorse YT Y1A 3T2, Canada
46117 YUKON INC.; Canada CADCommon shares
100 100200-204 Lambert Street, Whitehorse YT Y1A 3T2, Canada
CADPreferred shares
100 100
535630 YUKON INC.; Canada CADCommon shares
100 100c/o Macdonald & Company, 200-204 Lambert Street, Whitehorse YT Y1A 3T2, CanadaCAD
Preferred shares100 100
7999674 CANADA INC.; Canada CADCommon shares
100 100400-1190 Avenue des Canadiens-de-Montréal, Montréal Québec H3B 0E3, Canada
9230556 CANADA INC.; Canada CADCommon shares
100100
400-1190 Avenue des Canadiens-de-Montréal, Montréal Québec H3B 0E3, CanadaCAD
Preferred shares100
9539549 CANADA INC.; Canada US$Common shares
100 100400-1190 Avenue des Canadiens-de-Montréal, Montréal Québec H3B 0E3, Canada
Alcan Alumina Ltda.; Brazil BRL1.00Quota shares
100 100Avenida Engenheiro Emiliano Macieira, 1–km 18,Pedrinhas, São Luis, MA, 65095-603, Brazil
Alcan Asia Limited; Hong Kong HKDOrdinary shares
100 100Suite 2802, 28/F, Lippo Centre Tower 2, 89 Queensway, Admiralty, Hong Kong
Alcan Betriebs- und VerwaltungsgesellschaftGmbH; Germany
€51.13Ordinary shares
100 100 Alusingenplatz 1, D-78221, Singen, Germany
Alcan Chemicals Limited; United Kingdom £1.00Ordinary shares
100 100 6 St James’s Square, London, SW1Y 4AD, United Kingdom
Alcan Composites Brasil Ltda; Brazil BRL0.01Ordinary shares
100 100Avenida das Nações Unidas, 10.989, 14th floor, Suite 141, São Paulo, 04578-900, Brazil
Alcan Corporation; United States US$0.01Ordinary shares
100 100CSC, 211 East 7th Street, Suite 620, Austin TX 78701-3218, United States
Annual report 2018 | riotinto.com224

Notes to the 2018 financial statements continued
Wholly owned subsidiary undertakings continued
Name of undertaking and countryof incorporation Share class
% of shareclass heldby Groupcompanies
EffectiveGroup %ownership Registered office address
Alcan Farms Limited; United Kingdom £1.00Ordinary shares
100 100 6 St James’s Square, London, SW1Y 4AD, United Kingdom
Alcan Finances USA LLC; United States US$1,000.00Ordinary shares
100 100CSC, 251 Little Falls Drive, Wilmington DE 19808, United States
Alcan Gove Development Pty Limited; Australia AUDOrdinary shares
100 100 123 Albert Street, Brisbane QLD 4000, Australia
Alcan Gove Pty Limited; Australia AUDClass A shares
100100 123 Albert Street, Brisbane QLD 4000, Australia
AUDClass B shares
100
Alcan Gove Superannuation Pty Limited;Australia
AUDOrdinary shares
100 100 123 Albert Street, Brisbane QLD 4000, Australia
Alcan Holdings Australia Pty Limited;Australia
AUDClass A shares
100 100123 Albert Street, Brisbane QLD 4000, Australia
AUDOrdinary shares
100 100
Alcan Holdings Europe B.V.; Netherlands €455.00Ordinary shares
100 100 Welplaatweg 104, 3197 KS, Botlek-Rotterdam, Netherlands
Alcan Holdings Nederland B.V.; Netherlands €4,555.00Ordinary shares
100 100 Welplaatweg 104, 3197 KS, Botlek-Rotterdam, Netherlands
Alcan Holdings Switzerland AG (SA/Ltd.);Switzerland
CHF0.01Registered shares
100 100 Herostrasse 9, P.O. Box 1954, CH-8048 Zürich, Switzerland
Alcan International Network U.S.A. Inc.;United States
US$Ordinary shares
100 100 CSC, 80 State Street, Albany NY 12207-2543, United States
Alcan Lebensmittelverpackungen GmbH;Germany
€51.13Ordinary shares
100 100 Alusingenplatz 1, D-78221, Singen, Germany
Alcan Management Services (Shanghai) Co., Ltd.; China
US$1.00Ordinary shares
100 100Unit E, 40F Wheelock Square, No. 1717 West Nanjing Road, Jing’an District, Shanghai, 200040, China
Alcan Management Services Canada Limited; Canada
CADOrdinary shares
100 100400-1190 Avenue des Canadiens-de-Montréal, Montréal Québec H3B 0E3, Canada
Alcan Northern Territory Alumina Pty Limited; Australia
AUDOrdinary shares
100 100 123 Albert Street, Brisbane QLD 4000, Australia
Alcan Packaging Canada Limited; Canada CADOrdinary shares
100 100McCarthy Tetrault LLP, c/o Joanne Pierucci, Suite 5300 Toronto Dominion Bank Tower, Toronto ON M5K 1E6, Canada
Alcan Packaging Mühltal GmbH & Co. KG; Germany €51.13Ordinary shares
100 100 Alusingenplatz 1, D-78221, Singen, Germany
Alcan Primary Metal Australia Pty Ltd; Australia AUDOrdinary shares
100 100 123 Albert Street, Brisbane QLD 4000, Australia
Alcan Primary Products Company LLC; United States
US$Shares
100 100CSC, 251 Little Falls Drive, Wilmington DE 19808, United States
Alcan Primary Products Corporation;United States
US$0.01Ordinary shares
100 100CSC, 211 East 7th Street, Suite 620, Austin TX 78701-3218, United States
Alcan Realty Limited; Canada CADOrdinary shares
100 100400-1190 Avenue des Canadiens-de-Montréal, Montréal Québec H3B 0E3, Canada
Alcan South Pacific Pty Ltd; Australia AUDOrdinary shares
100 100 123 Albert Street, Brisbane QLD 4000, Australia
Alcan Trading AG (SA/Ltd.); Switzerland CHF1000.00Registered shares
100 100 Herostrasse 9, P.O. Box 1954, CH-8048 Zürich, Switzerland
Aluminium Pechiney; France €16.00Ordinary shares
100 100 725 rue Aristide Bergès, 38341 Voreppe Cedex, France
Aluminium Company of Canada Limited; Canada CADOrdinary shares
100 100400-1190 Avenue des Canadiens-de-Montréal, Montréal Québec H3B 0E3, Canada
AML Properties Pty Ltd; Australia AUDOrdinary shares
100 100Level 18 Central Park, 152-158 St. Georges Terrace, Perth WA 6000, Australia
Anglesey Aluminium Metal Limited; United Kingdom
£1.00Ordinary shares
100 100 6 St James’s Square, London, SW1Y 4AD, United Kingdom
AP Service; France €15.00Ordinary shares
100 100 725 rue Aristide Bergès, 38341 Voreppe Cedex, France
Argyle Diamond Mines Pty Limited; Australia AUDOrdinary shares
100 100Level 18 Central Park, 152-158 St. Georges Terrace, Perth WA 6000, Australia
Argyle Diamonds (2013) Ltd; Australia(d) AUDOrdinary shares
100 100Level 18 Central Park, 152-158 St. Georges Terrace, Perth WA 6000, Australia
Annual report 2018 | riotinto.com 225
Financial statements

Financial statements
Notes to the 2018 financial statements continued
Wholly owned subsidiary undertakings continued
Name of undertaking and countryof incorporation Share class
% of shareclass heldby Groupcompanies
EffectiveGroup %ownership Registered office address
Argyle Diamonds Limited; Australia(a) AUDClass A shares
100100
Level 18 Central Park, 152-158 St. Georges Terrace, Perth WA 6000, AustraliaAUD
Class B shares100
Ashton Mining Pty Ltd; Australia AUDOrdinary shares
100 100Level 18 Central Park, 152-158 St. Georges Terrace, Perth WA 6000, Australia
Ashton Nominees Pty Limited; Australia AUDOrdinary shares
100 100Level 18 Central Park, 152-158 St. Georges Terrace, Perth WA 6000, Australia
Australian Coal Holdings Pty. Limited; Australia(a) AUDClass A shares
100100 123 Albert Street, Brisbane QLD 4000, Australia
AUDOrdinary shares
100
Australian Mining & Smelting Pty Ltd; Australia(a) AUDOrdinary shares
100 100 Level 7, 360 Collins Street, Melbourne VIC 3000, Australia
Beasley River Management Pty Limited; Australia AUDOrdinary shares
100 100Level 18 Central Park, 152-158 St. Georges Terrace, Perth WA 6000, Australia
Beasley River Mining Pty Limited; Australia AUDOrdinary shares
100 100Level 18 Central Park, 152-158 St. Georges Terrace, Perth WA 6000, Australia
Borax España, S.A.; Spain €150.00Ordinary shares
100 100 CN 340, Km 954, 12520 NULES, Castellón, Spain
Borax Europe Limited; United Kingdom £0.25Ordinary shares
100 100 6 St James’s Square, London, SW1Y 4AD, United Kingdom
Borax Francais; France €2.75Ordinary shares
100 100 89 Route de Bourbourg, 59210, Coudekerque-Branche, France
Borax Malaysia Sdn Bhd; Malaysia MYR1.00 Ordinary shares 100 100
Level 7, Menara Milenium, Jalan Damanlela, Pusat Bandar Damansara, Damansara Heights 50490 Kuala Lumpur, Malaysia
Borax Rotterdam N.V.; Netherlands €453.78Ordinary shares
100 100Welplaatweg 104, 3197 KS, Botlek-Rotterdam,Netherlands
British Alcan Aluminium Limited; United Kingdom £1.00Ordinary shares
100 100 6 St James’s Square, London, SW1Y 4AD, United Kingdom
Canning Resources Pty Limited; Australia(a) AUDOrdinary shares
100 100 Level 7, 360 Collins Street, Melbourne VIC 3000, Australia
Capricorn Diamonds Investments Pty Limited; Australia
AUDOrdinary shares
100 100Level 18 Central Park, 152-158 St. Georges Terrace, Perth WA 6000, Australia
Cathjoh Holdings Pty Limited; Australia AUDOrdinary shares
100 100Pacific Aluminium, 123 Albert Street, Brisbane QLD 4000, Australia
Champlain Reinsurance Company Ltd.; Switzerland CHF1.23Registered shares
100 100 Herostrasse 9, P.O. Box 1954, CH-8048 Zürich, Switzerland
Channar Management Services Pty Limited; Australia
AUDOrdinary shares
100 100Level 18 Central Park, 152-158 St. Georges Terrace, Perth WA 6000, Australia
Channar Mining Pty Ltd; Australia AUDOrdinary shares
100 100Level 18 Central Park, 152-158 St. Georges Terrace, Perth WA 6000, Australia
CIA. Inmobiliaria e Inversiones Cosmos S.A.C.; Peru PEN1,000.00Ordinary shares
100 100Calle Santa Maria No. 110 Urb. Miraflores – Miraflores-Lima, Peru
Compagnie Générale D’électrolyse Du Palais; France
€0.94Ordinary shares
100 100 17 Place des Reflets, La Défense 2, 92400, Courbevoie, France
Compania de Transmision Sierraoriente S.A.C.; Peru PEN1,000.00Ordinary shares
100 100Calle Santa Maria No. 110 Urb. Miraflores – Miraflores-Lima, Peru
CRA Exploration (India) Private Limited; India INR10.00 Ordinary shares
100 100Apartment No. 100 a/5 Ground Floor, The Capital Court, Olof Palmer Marg, Munirka New Delhi 110067, India
CRA Investments Pty. Limited; Australia(a) AUDOrdinary shares
100 100 Level 7, 360 Collins Street, Melbourne VIC 3000, Australia
CRA Pty Ltd; Australia(a) AUDOrdinary shares
100 100 Level 7, 360 Collins Street, Melbourne VIC 3000, Australia
Daybreak Development LLC; United States US$0.01Common shares
100 100CSC, 251 Little Falls Drive, Wilmington DE 19808, United States
Daybreak Property Holdings LLC; United States(c)
— — 100CSC, 15 West South Temple, Suite 1701, Salt Lake City UT 84101, United States
Daybreak Secondary Water Distribution Company; United States
US$0.01Common shares
100 100CSC, 251 Little Falls Drive, Wilmington DE 19808, United States
47 Related undertakings continued
Annual report 2018 | riotinto.com226
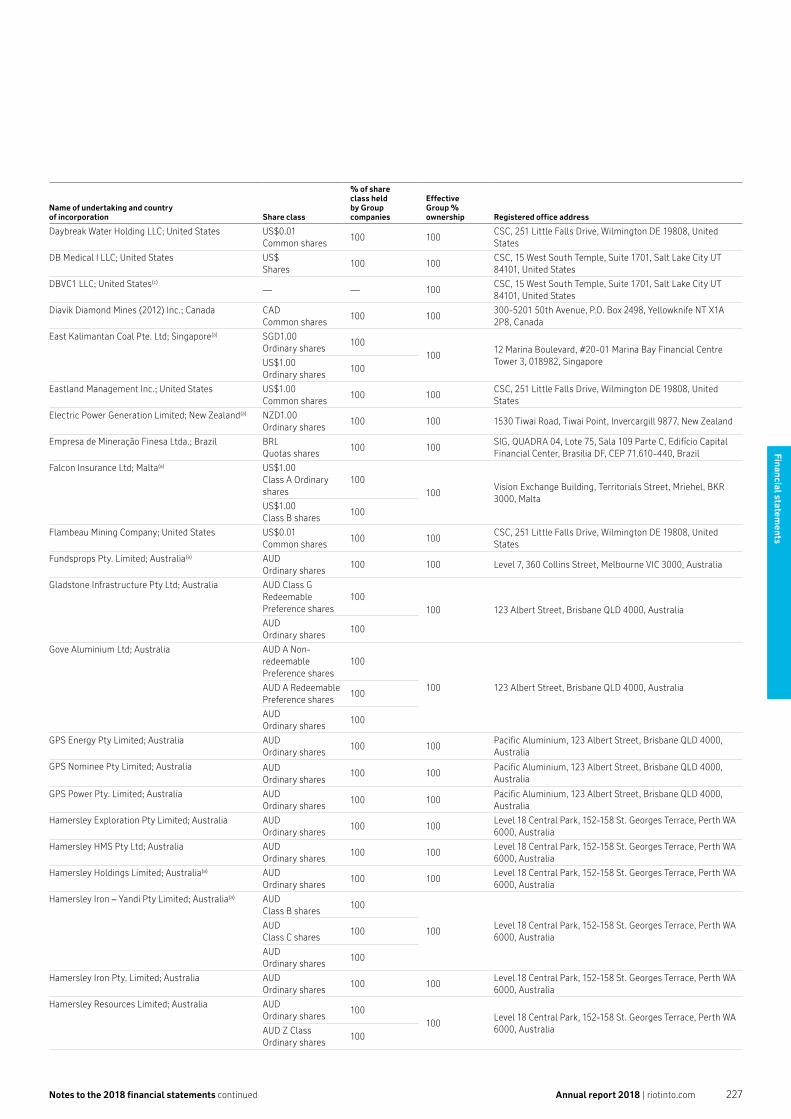
Wholly owned subsidiary undertakings continued
Name of undertaking and countryof incorporation Share class
% of shareclass heldby Groupcompanies
EffectiveGroup %ownership Registered office address
Daybreak Water Holding LLC; United States US$0.01Common shares
100 100CSC, 251 Little Falls Drive, Wilmington DE 19808, United States
DB Medical I LLC; United States US$Shares
100 100CSC, 15 West South Temple, Suite 1701, Salt Lake City UT 84101, United States
DBVC1 LLC; United States(c)
— — 100CSC, 15 West South Temple, Suite 1701, Salt Lake City UT 84101, United States
Diavik Diamond Mines (2012) Inc.; Canada CADCommon shares
100 100300-5201 50th Avenue, P.O. Box 2498, Yellowknife NT X1A 2P8, Canada
East Kalimantan Coal Pte. Ltd; Singapore(a) SGD1.00Ordinary shares
100100
12 Marina Boulevard, #20-01 Marina Bay Financial Centre Tower 3, 018982, SingaporeUS$1.00
Ordinary shares100
Eastland Management Inc.; United States US$1.00Common shares
100 100CSC, 251 Little Falls Drive, Wilmington DE 19808, United States
Electric Power Generation Limited; New Zealand(a) NZD1.00Ordinary shares
100 100 1530 Tiwai Road, Tiwai Point, Invercargill 9877, New Zealand
Empresa de Mineração Finesa Ltda.; Brazil BRLQuotas shares
100 100SIG, QUADRA 04, Lote 75, Sala 109 Parte C, Edifício Capital Financial Center, Brasilia DF, CEP 71.610-440, Brazil
Falcon Insurance Ltd; Malta(a) US$1.00Class A Ordinary shares
100100
Vision Exchange Building, Territorials Street, Mriehel, BKR 3000, Malta
US$1.00Class B shares
100
Flambeau Mining Company; United States US$0.01Common shares
100 100CSC, 251 Little Falls Drive, Wilmington DE 19808, United States
Fundsprops Pty. Limited; Australia(a) AUDOrdinary shares
100 100 Level 7, 360 Collins Street, Melbourne VIC 3000, Australia
Gladstone Infrastructure Pty Ltd; Australia AUD Class GRedeemablePreference shares
100100 123 Albert Street, Brisbane QLD 4000, Australia
AUDOrdinary shares
100
Gove Aluminium Ltd; Australia AUD A Non- redeemable Preference shares
100
100 123 Albert Street, Brisbane QLD 4000, AustraliaAUD A Redeemable Preference shares
100
AUDOrdinary shares
100
GPS Energy Pty Limited; Australia AUDOrdinary shares
100 100Pacific Aluminium, 123 Albert Street, Brisbane QLD 4000, Australia
GPS Nominee Pty Limited; Australia AUDOrdinary shares
100 100Pacific Aluminium, 123 Albert Street, Brisbane QLD 4000, Australia
GPS Power Pty. Limited; Australia AUDOrdinary shares
100 100Pacific Aluminium, 123 Albert Street, Brisbane QLD 4000, Australia
Hamersley Exploration Pty Limited; Australia AUDOrdinary shares
100 100Level 18 Central Park, 152-158 St. Georges Terrace, Perth WA 6000, Australia
Hamersley HMS Pty Ltd; Australia AUDOrdinary shares
100 100Level 18 Central Park, 152-158 St. Georges Terrace, Perth WA 6000, Australia
Hamersley Holdings Limited; Australia(a) AUDOrdinary shares
100 100Level 18 Central Park, 152-158 St. Georges Terrace, Perth WA 6000, Australia
Hamersley Iron – Yandi Pty Limited; Australia(a) AUDClass B shares
100
100Level 18 Central Park, 152-158 St. Georges Terrace, Perth WA 6000, Australia
AUDClass C shares
100
AUDOrdinary shares
100
Hamersley Iron Pty. Limited; Australia AUDOrdinary shares
100 100Level 18 Central Park, 152-158 St. Georges Terrace, Perth WA 6000, Australia
Hamersley Resources Limited; Australia AUDOrdinary shares
100100
Level 18 Central Park, 152-158 St. Georges Terrace, Perth WA 6000, AustraliaAUD Z Class
Ordinary shares100
Notes to the 2018 financial statements continued Annual report 2018 | riotinto.com 227
Financial statements

Financial statements
Notes to the 2018 financial statements continued
Wholly owned subsidiary undertakings continued
Name of undertaking and countryof incorporation Share class
% of shareclass heldby Groupcompanies
EffectiveGroup %ownership Registered office address
Hamersley WA Pty Ltd; Australia AUDOrdinary shares
100 100Level 18 Central Park, 152-158 St. Georges Terrace, Perth WA 6000, Australia
Henlopen Manufacturing Co., Inc.; United States US$100.00Ordinary shares
100 100 CSC, 80 State Street, Albany NY 12207-2543, United States
High Purity Iron Inc.; United States US$1.00Common shares
100 100CSC, 251 Little Falls Drive, Wilmington DE 19808, United States
HIsmelt Corporation Pty Limited; Australia(a) AUDClass A shares
100 100Level 18 Central Park, 152-158 St. Georges Terrace, Perth WA 6000, Australia
Hunter Valley Resources Pty Ltd; Australia AUD A Class shares
100100 123 Albert Street, Brisbane QLD 4000, Australia
AUD B Class shares
100
IEA Coal Research Limited; United Kingdom £1.00Ordinary shares
100 100Apsley House, Third Floor, 176 Upper Richmond Road, London, SW15 2SH, United Kingdom
IEA Environmental Projects Limited; United Kingdom
£1.00Ordinary shares
100 100IEAGHG, Pure Offices Cheltenham Office Park, Hatherley Lane, Cheltenham, GL51 6SH, United Kingdom
Industrias Metalicas Castello S.A.; Spain €6.01Ordinary shares
100 100 Calle Tuset 10, 08006, Barcelona, Catalonia, Spain
Integrity Land and Cattle LLC; United States US$Shares
100 100CSC, 2338 W. Royal Palm Road, Suite J, Phoenix AZ 85021, United States
IOC Sales Limited; United Kingdom £1.00Ordinary shares
100 100 6 St James’s Square, London, SW1Y 4AD, United Kingdom
Itallumina Srl; Italy(d) €1.00Quotas shares
100 100 Viale Castro Pretorio 122, 00185, Roma, Italy
Johcath Holdings Pty Limited; Australia AUDOrdinary shares
100 100Pacific Aluminium, 123 Albert Street, Brisbane QLD 4000, Australia
Juna Station Pty Ltd; Australia AUDOrdinary shares
100 100Level 18 Central Park, 152-158 St. Georges Terrace, Perth WA 6000, Australia
Kalimantan Gold Pty Limited; Australia AUDOrdinary shares
100 100 Level 7, 360 Collins Street, Melbourne VIC 3000, Australia
Kalteng Pty. Ltd; Australia(a) AUD A Class Ordinary shares
100
100 37 Belmont Avenue, Belmont WA 6104, Australia
AUD1.00 Class B(fully paid $1.0013/01/2003)
100
AUD1.00 Class B(paid to $0.1202/09/2005)
100
AUDOrdinary shares
100
Kelian Pty. Limited; Australia(a) AUDOrdinary shares
100 100 Level 7, 360 Collins Street, Melbourne VIC 3000, Australia
Kembla Coal & Coke Pty. Limited; Australia AUDOrdinary shares
100 100 123 Albert Street, Brisbane QLD 4000, Australia
Kennecott Barneys Canyon Mining Company; United States
US$0.01Common shares
100 100CSC, 251 Little Falls Drive, Wilmington DE 19808, United States
Kennecott Exploration Company; United States US$0.01Common shares
100 100CSC, 251 Little Falls Drive, Wilmington DE 19808, United States
Kennecott Exploration Mexico, S.A. de C.V.; Mexico MXN1,000.00Ordinary shares
100 100Felix Berenguer 125 – 4 Col. Lomas Virreyes, DistritoFederal, 11000, Mexico
Kennecott Holdings Corporation; United States US$0.01Common shares
100 100CSC, 251 Little Falls Drive, Wilmington DE 19808, United States
Kennecott Land Company; United States US$0.01Common shares
100 100CSC, 251 Little Falls Drive, Wilmington DE 19808, United States
Kennecott Land Investment Company LLC;United States(c) — — 100
CSC, 251 Little Falls Drive, Wilmington DE 19808, United States
Kennecott Molybdenum Company; United States US$0.01Common shares
100 100CSC, 251 Little Falls Drive, Wilmington DE 19808, United States
Kennecott Nevada Copper Company; United States US$0.01Common shares
100 100CSC, 251 Little Falls Drive, Wilmington DE 19808, United States
Kennecott Ridgeway Mining Company; United States
US$1.00Common shares
100 100CSC, 251 Little Falls Drive, Wilmington DE 19808, United States
47 Related undertakings continued
Annual report 2018 | riotinto.com228
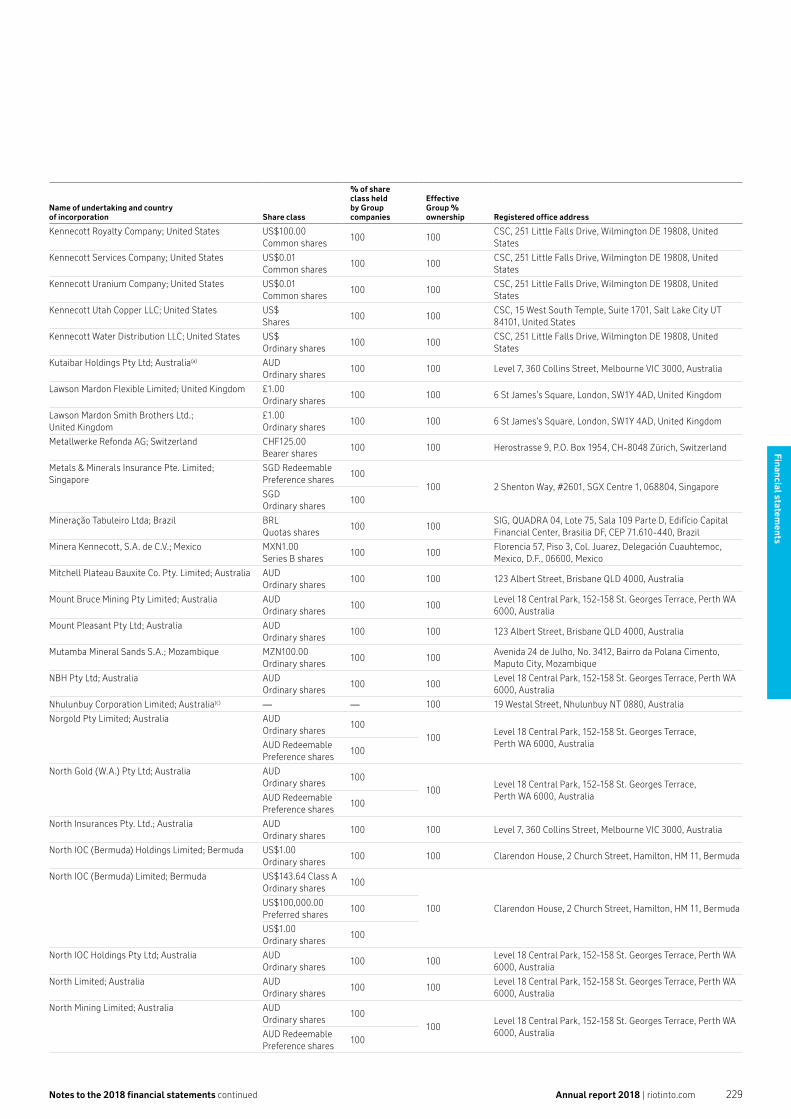
Wholly owned subsidiary undertakings continued
Name of undertaking and countryof incorporation Share class
% of shareclass heldby Groupcompanies
EffectiveGroup %ownership Registered office address
Kennecott Royalty Company; United States US$100.00Common shares
100 100CSC, 251 Little Falls Drive, Wilmington DE 19808, United States
Kennecott Services Company; United States US$0.01Common shares
100 100CSC, 251 Little Falls Drive, Wilmington DE 19808, United States
Kennecott Uranium Company; United States US$0.01Common shares
100 100CSC, 251 Little Falls Drive, Wilmington DE 19808, United States
Kennecott Utah Copper LLC; United States US$Shares
100 100CSC, 15 West South Temple, Suite 1701, Salt Lake City UT 84101, United States
Kennecott Water Distribution LLC; United States US$Ordinary shares
100 100CSC, 251 Little Falls Drive, Wilmington DE 19808, United States
Kutaibar Holdings Pty Ltd; Australia(a) AUDOrdinary shares
100 100 Level 7, 360 Collins Street, Melbourne VIC 3000, Australia
Lawson Mardon Flexible Limited; United Kingdom £1.00Ordinary shares
100 100 6 St James’s Square, London, SW1Y 4AD, United Kingdom
Lawson Mardon Smith Brothers Ltd.; United Kingdom
£1.00Ordinary shares
100 100 6 St James’s Square, London, SW1Y 4AD, United Kingdom
Metallwerke Refonda AG; Switzerland CHF125.00Bearer shares
100 100 Herostrasse 9, P.O. Box 1954, CH-8048 Zürich, Switzerland
Metals & Minerals Insurance Pte. Limited; Singapore
SGD RedeemablePreference shares
100100 2 Shenton Way, #2601, SGX Centre 1, 068804, Singapore
SGDOrdinary shares
100
Mineração Tabuleiro Ltda; Brazil BRLQuotas shares
100 100SIG, QUADRA 04, Lote 75, Sala 109 Parte D, Edifício Capital Financial Center, Brasilia DF, CEP 71.610-440, Brazil
Minera Kennecott, S.A. de C.V.; Mexico MXN1.00Series B shares
100 100Florencia 57, Piso 3, Col. Juarez, Delegación Cuauhtemoc,Mexico, D.F., 06600, Mexico
Mitchell Plateau Bauxite Co. Pty. Limited; Australia AUDOrdinary shares
100 100 123 Albert Street, Brisbane QLD 4000, Australia
Mount Bruce Mining Pty Limited; Australia AUDOrdinary shares
100 100Level 18 Central Park, 152-158 St. Georges Terrace, Perth WA 6000, Australia
Mount Pleasant Pty Ltd; Australia AUDOrdinary shares
100 100 123 Albert Street, Brisbane QLD 4000, Australia
Mutamba Mineral Sands S.A.; Mozambique MZN100.00Ordinary shares
100 100Avenida 24 de Julho, No. 3412, Bairro da Polana Cimento,Maputo City, Mozambique
NBH Pty Ltd; Australia AUDOrdinary shares
100 100Level 18 Central Park, 152-158 St. Georges Terrace, Perth WA 6000, Australia
Nhulunbuy Corporation Limited; Australia(c) — — 100 19 Westal Street, Nhulunbuy NT 0880, Australia
Norgold Pty Limited; Australia AUDOrdinary shares
100100
Level 18 Central Park, 152-158 St. Georges Terrace,Perth WA 6000, AustraliaAUD Redeemable
Preference shares100
North Gold (W.A.) Pty Ltd; Australia AUDOrdinary shares
100100
Level 18 Central Park, 152-158 St. Georges Terrace,Perth WA 6000, AustraliaAUD Redeemable
Preference shares100
North Insurances Pty. Ltd.; Australia AUDOrdinary shares
100 100 Level 7, 360 Collins Street, Melbourne VIC 3000, Australia
North IOC (Bermuda) Holdings Limited; Bermuda US$1.00Ordinary shares
100 100 Clarendon House, 2 Church Street, Hamilton, HM 11, Bermuda
North IOC (Bermuda) Limited; Bermuda US$143.64 Class AOrdinary shares
100
100 Clarendon House, 2 Church Street, Hamilton, HM 11, BermudaUS$100,000.00Preferred shares
100
US$1.00Ordinary shares
100
North IOC Holdings Pty Ltd; Australia AUDOrdinary shares
100 100Level 18 Central Park, 152-158 St. Georges Terrace, Perth WA 6000, Australia
North Limited; Australia AUDOrdinary shares
100 100Level 18 Central Park, 152-158 St. Georges Terrace, Perth WA 6000, Australia
North Mining Limited; Australia AUDOrdinary shares
100100
Level 18 Central Park, 152-158 St. Georges Terrace, Perth WA 6000, AustraliaAUD Redeemable
Preference shares100
Notes to the 2018 financial statements continued Annual report 2018 | riotinto.com 229
Financial statements

Financial statements
Notes to the 2018 financial statements continued
Wholly owned subsidiary undertakings continued
Name of undertaking and countryof incorporation Share class
% of shareclass heldby Groupcompanies
EffectiveGroup %ownership Registered office address
Pacific Aluminium (New Zealand) Limited; New Zealand
NZD1.00Ordinary shares
100 100 1530 Tiwai Road, Tiwai Point, Invercargill 9872, New Zealand
Pacific Aluminium Bell Bay Sales Pty Limited; Australia
AUDOrdinary shares
100 100Pacific Aluminium, 123 Albert Street, Brisbane QLD 4000, Australia
Pacific Aluminium Pty. Limited; Australia(a) AUDOrdinary shares
100 100 Level 7, 360 Collins Street, Melbourne VIC 3000, Australia
Pacific Aluminium Services Pty Limited; Australia AUDOrdinary shares
100 100Pacific Aluminium, 123 Albert Street, Brisbane QLD 4000, Australia
Pacific Coast Mines, Inc.; United States US$1.00Common shares
100 100CSC, 251 Little Falls Drive, Wilmington DE 19808, United States
Pechiney Aviatube Limited; United Kingdom £1.00Ordinary shares
100 100 6 St James’s Square, London, SW1Y 4AD, United Kingdom
Pechiney Bâtiment; France €15.00Ordinary shares
100 100 725 rue Aristide Bergès, 38341 Voreppe Cedex, France
Pechiney Bécancour, Inc.; United States US$1.00Ordinary shares
100 100CSC, 251 Little Falls Drive, Wilmington DE 19808, United States
Pechiney Cast Plate, Inc.; United States US$1.00Ordinary shares
100 100CSC, 251 Little Falls Drive, Wilmington DE 19808, United States
Pechiney Consolidated Australia Pty Limited; Australia
US$1.00Ordinary shares
100100 123 Albert Street, Brisbane QLD 4000, Australia
US$1.00Preference shares
100
Pechiney Holdings, Inc.; United States US$1.00Ordinary shares
100 100CSC, 251 Little Falls Drive, Wilmington DE 19808, United States
Pechiney Metals LLC; United States(c)
— — 100CSC, 251 Little Falls Drive, Wilmington DE 19808, United States
Pechiney Plastic Packaging, Inc.; United States US$Ordinary shares
100 100CSC, 251 Little Falls Drive, Wilmington DE 19808, United States
Pechiney Sales Corporation; United States US$1.00Ordinary shares
100 100CSC, 251 Little Falls Drive, Wilmington DE 19808, United States
Peko Exploration Pty Ltd.; Australia AUDOrdinary shares
100 100 37 Belmont Avenue, Belmont WA 6104, Australia
Peko-Wallsend Pty Ltd; Australia AUDOrdinary shares
100 100Level 18 Central Park, 152-158 St. Georges Terrace, Perth WA 6000, Australia
Pilbara Iron Company (Services) Pty Ltd; Australia AUDOrdinary shares
100 100Level 18 Central Park, 152-158 St. Georges Terrace, Perth WA 6000, Australia
Pilbara Iron Pty Ltd; Australia AUDOrdinary shares
100 100Level 18 Central Park, 152-158 St. Georges Terrace, Perth WA 6000, Australia
Port d’Ehoala S.A.; Madagascar US$100.00Ordinary shares
100 100Immeuble ASSIST, Ivandry, Lot N°35, 5ème étage, 101Antananarivo, Madagascar
Project Generation Group Pty Ltd; Australia(a) AUDOrdinary shares
100 100 Level 7, 360 Collins Street, Melbourne VIC 3000, Australia
PSZ Pty Limited; Australia AUDOrdinary shares
100 100Level 18 Central Park, 152-158 St. Georges Terrace, Perth WA 6000, Australia
PT Alcan Packaging Flexipack; Indonesia(d) IDR1,000,000.00Ordinary shares
100 10031st Floor, Menara BTPN, Jl. Dr. Ide Anak Agung Gde AgungLot 5.5-5.6, Mega Kuningan, Jakarta, 12950, Indonesia
PT Rio Tinto Consultants; Indonesia(d) US$1.00Ordinary shares
100 10031st Floor, Menara BTPN, Jl. Dr. Ide Anak Agung Gde AgungLot 5.5-5.6, Mega Kuningan, Jakarta, 12950, Indonesia
QIT Madagascar Minerals Ltd; Bermuda US$1.00Ordinay shares
100 100 Canon’s Court, 22 Victoria Street, Hamilton, HM 12, Bermuda
Queensland Coal Pty. Limited; Australia AUDOrdinary shares
100 100 123 Albert Street, Brisbane QLD 4000, Australia
Química e Metalúrgica Mequital Ltda.; Brazil BRLOrdinary shares
100 100Av. das Nacoes Unida, 12551 19o, andar, CJ 1911, 04578-000, São Paulo, SP, Brazil
Ranges Management Company Pty Ltd; Australia AUDOrdinary shares
100 100Level 18 Central Park, 152-158 St. Georges Terrace, Perth WA 6000, Australia
Ranges Mining Pty Ltd; Australia AUDOrdinary shares
100 100Level 18 Central Park, 152-158 St. Georges Terrace, Perth WA 6000, Australia
Resolution Copper Company; United States US$0.01Common shares
100 100CSC, 251 Little Falls Drive, Wilmington DE 19808, United States
47 Related undertakings continued
Annual report 2018 | riotinto.com230
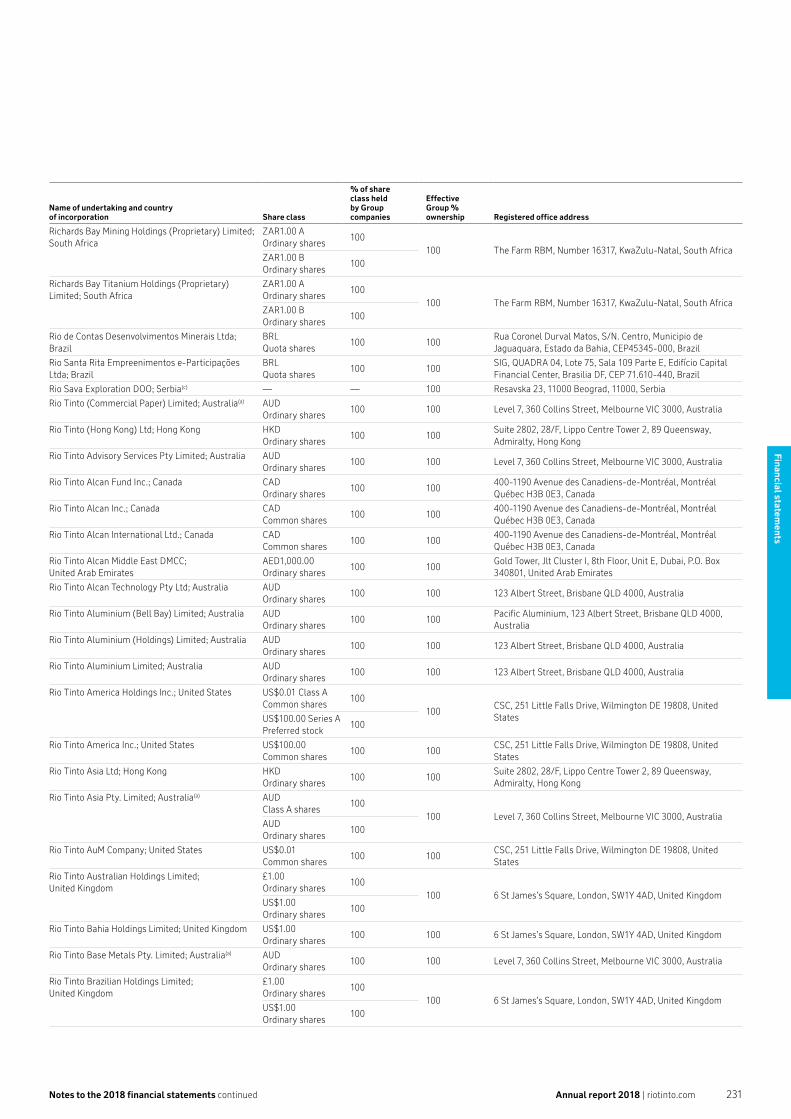
Wholly owned subsidiary undertakings continued
Name of undertaking and countryof incorporation Share class
% of shareclass heldby Groupcompanies
EffectiveGroup %ownership Registered office address
Richards Bay Mining Holdings (Proprietary) Limited; South Africa
ZAR1.00 AOrdinary shares
100100 The Farm RBM, Number 16317, KwaZulu-Natal, South Africa
ZAR1.00 BOrdinary shares
100
Richards Bay Titanium Holdings (Proprietary) Limited; South Africa
ZAR1.00 AOrdinary shares
100100 The Farm RBM, Number 16317, KwaZulu-Natal, South Africa
ZAR1.00 BOrdinary shares
100
Rio de Contas Desenvolvimentos Minerais Ltda; Brazil
BRLQuota shares
100 100Rua Coronel Durval Matos, S/N. Centro, Municipio deJaguaquara, Estado da Bahia, CEP45345-000, Brazil
Rio Santa Rita Empreenimentos e-Participações Ltda; Brazil
BRLQuota shares
100 100SIG, QUADRA 04, Lote 75, Sala 109 Parte E, Edifício Capital Financial Center, Brasilia DF, CEP 71.610-440, Brazil
Rio Sava Exploration DOO; Serbia(c) — — 100 Resavska 23, 11000 Beograd, 11000, Serbia
Rio Tinto (Commercial Paper) Limited; Australia(a) AUDOrdinary shares
100 100 Level 7, 360 Collins Street, Melbourne VIC 3000, Australia
Rio Tinto (Hong Kong) Ltd; Hong Kong HKDOrdinary shares
100 100Suite 2802, 28/F, Lippo Centre Tower 2, 89 Queensway, Admiralty, Hong Kong
Rio Tinto Advisory Services Pty Limited; Australia AUDOrdinary shares
100 100 Level 7, 360 Collins Street, Melbourne VIC 3000, Australia
Rio Tinto Alcan Fund Inc.; Canada CADOrdinary shares
100 100400-1190 Avenue des Canadiens-de-Montréal, Montréal Québec H3B 0E3, Canada
Rio Tinto Alcan Inc.; Canada CADCommon shares
100 100400-1190 Avenue des Canadiens-de-Montréal, Montréal Québec H3B 0E3, Canada
Rio Tinto Alcan International Ltd.; Canada CADCommon shares
100 100400-1190 Avenue des Canadiens-de-Montréal, Montréal Québec H3B 0E3, Canada
Rio Tinto Alcan Middle East DMCC; United Arab Emirates
AED1,000.00Ordinary shares
100 100Gold Tower, Jlt Cluster I, 8th Floor, Unit E, Dubai, P.O. Box 340801, United Arab Emirates
Rio Tinto Alcan Technology Pty Ltd; Australia AUDOrdinary shares
100 100 123 Albert Street, Brisbane QLD 4000, Australia
Rio Tinto Aluminium (Bell Bay) Limited; Australia AUDOrdinary shares
100 100Pacific Aluminium, 123 Albert Street, Brisbane QLD 4000, Australia
Rio Tinto Aluminium (Holdings) Limited; Australia AUD Ordinary shares
100 100 123 Albert Street, Brisbane QLD 4000, Australia
Rio Tinto Aluminium Limited; Australia AUDOrdinary shares
100 100 123 Albert Street, Brisbane QLD 4000, Australia
Rio Tinto America Holdings Inc.; United States US$0.01 Class ACommon shares
100100
CSC, 251 Little Falls Drive, Wilmington DE 19808, United StatesUS$100.00 Series A
Preferred stock100
Rio Tinto America Inc.; United States US$100.00Common shares
100 100CSC, 251 Little Falls Drive, Wilmington DE 19808, United States
Rio Tinto Asia Ltd; Hong Kong HKDOrdinary shares
100 100Suite 2802, 28/F, Lippo Centre Tower 2, 89 Queensway, Admiralty, Hong Kong
Rio Tinto Asia Pty. Limited; Australia(a) AUDClass A shares
100100 Level 7, 360 Collins Street, Melbourne VIC 3000, Australia
AUDOrdinary shares
100
Rio Tinto AuM Company; United States US$0.01Common shares
100 100CSC, 251 Little Falls Drive, Wilmington DE 19808, United States
Rio Tinto Australian Holdings Limited; United Kingdom
£1.00Ordinary shares
100100 6 St James’s Square, London, SW1Y 4AD, United Kingdom
US$1.00Ordinary shares
100
Rio Tinto Bahia Holdings Limited; United Kingdom US$1.00Ordinary shares
100 100 6 St James’s Square, London, SW1Y 4AD, United Kingdom
Rio Tinto Base Metals Pty. Limited; Australia(a) AUDOrdinary shares
100 100 Level 7, 360 Collins Street, Melbourne VIC 3000, Australia
Rio Tinto Brazilian Holdings Limited; United Kingdom
£1.00Ordinary shares
100100 6 St James’s Square, London, SW1Y 4AD, United Kingdom
US$1.00Ordinary shares
100
Notes to the 2018 financial statements continued Annual report 2018 | riotinto.com 231
Financial statements

Financial statements
Notes to the 2018 financial statements continued
Wholly owned subsidiary undertakings continued
Name of undertaking and countryof incorporation Share class
% of shareclass heldby Groupcompanies
EffectiveGroup %ownership Registered office address
Rio Tinto Brazilian Investments Limited; United Kingdom
£1.00Ordinary shares
100100 6 St James’s Square, London, SW1Y 4AD, United Kingdom
US$1.00Ordinary shares
100
Rio Tinto Canada Diamond OperationManagement Inc.; Canada
CADCommon shares
100 100300-5201 50th Avenue, P.O. Box 2498, Yellowknife NT X1A 2P8, Canada
Rio Tinto Canada Inc.; Canada CAD Class B shares 100
100400-1190 Avenue des Canadiens-de-Montréal, Montréal Québec H3B 0E3, Canada
CAD Class C shares 100
CAD Class D shares 100
CAD Class J shares 100
CAD Class K shares 100
Rio Tinto Canada Management Inc.; Canada CADCommon shares
100100
400-1190 Avenue des Canadiens-de-Montréal, Montréal Québec H3B 0E3, CanadaCAD
Preferred shares100
Rio Tinto Canada Uranium Corporation; Canada CADCommon shares
100 100 354-200 Granville Street, Vancouver BC V6C 1S4, Canada
Rio Tinto Coal (Clermont) Pty Ltd; Australia AUDOrdinary shares
100 100 123 Albert Street, Brisbane QLD 4000, Australia
Rio Tinto Coal Australia Pty Limited; Australia AUDOrdinary shares
100 100 123 Albert Street, Brisbane QLD 4000, Australia
Rio Tinto Coal Investments Pty Limited; Australia AUDOrdinary shares
100 100 123 Albert Street, Brisbane QLD 4000, Australia
Rio Tinto Coal NSW Holdings Limited; Australia(a) AUDOrdinary shares
100 100 123 Albert Street, Brisbane QLD 4000, Australia
Rio Tinto Commercial Pte. Ltd; Singapore US$1.00Ordinary shares
100 10012 Marina Boulevard, #20-01 Marina Bay Financial Centre Tower 3, 018982, Singapore
Rio Tinto Desenvolvimentos Minerais Ltda.; Brazil BRLQuotas shares
100 100SIG Quadra 04, Lote 175, Torre A, Salas 106 a 109, Edifício Capital Financial Center, Brasilia, CEP 70610-440, Brazil
Rio Tinto Diamonds and Minerals Canada Holding Inc.; Canada
CAD Class A(dividend rights) shares
100
100300-5201 50th Avenue, P. O. Box 2498, Yellowknife NT X1A 2P8, Canada
CAD Class B shares 100
CAD Class C (voting rights) shares
100
CAD Class P1Preferred shares
100
Rio Tinto Diamonds Limited; United Kingdom US$1.00Ordinary shares
100 100 6 St James’s Square, London, SW1Y 4AD, United Kingdom
Rio Tinto Diamonds Netherlands B.V.; Netherlands €500.00Ordinary shares
100 100 Welplaatweg 104, 3197 KS, Botlek-Rotterdam, Netherlands
Rio Tinto Diamonds NV; Belgium €Ordinary shares
100 100 Hoveniersstraat 53, 2018 Antwerp, Belgium
Rio Tinto Eastern Investments B.V.; Netherlands €12,510,234,217.00 Ordinary shares
100 100 6 St James’s Square, London, SW1Y 4AD, United Kingdom
Rio Tinto Energy America Inc.; United States US$0.01Common shares
100 100CSC, 251 Little Falls Drive, Wilmington DE 19808, United States
Rio Tinto Energy Limited; United Kingdom US$1.00Ordinary shares
100 100 6 St James’s Square, London, SW1Y 4AD, United Kingdom
Rio Tinto Escondida Limited; Bermuda US$1.00Ordinary shares
100 100 22 Canon’s Court, Victoria Street, Hamilton, HM 12, Bermuda
Rio Tinto European Holdings Limited; United Kingdom(b)
£1.00Ordinary shares
100 100 6 St James’s Square, London, SW1Y 4AD, United Kingdom
Rio Tinto Exploration (Asia) Holdings Pte. Ltd.; Singapore
US$1.00Ordinary shares
100 10012 Marina Boulevard, #20-01 Marina Bay Financial Centre Tower 3, 018982, Singapore
Rio Tinto Exploration (PNG) Limited; Papua New Guinea(a)
PGK1.00Ordinary shares
100 100c/o BDO Accountants, Section 15, Lot 15, Bernal Street, National Capital District, Papua New Guinea
Rio Tinto Exploration and Mining (India) Private Limited; India
INR10.00Ordinary shares
100 10021st Floor, DLF Building No.5, Tower A, DLF Cyber City, Phase –III, Gurgaon, Haryana, 122002, India
47 Related undertakings continued
Annual report 2018 | riotinto.com232

Wholly owned subsidiary undertakings continued
Name of undertaking and countryof incorporation Share class
% of shareclass heldby Groupcompanies
EffectiveGroup %ownership Registered office address
Rio Tinto Exploration Canada Inc.; Canada CAD Class A shares 100
100 354-200 Granville Street, Vancouver BC V6C 1S4, Canada
CAD Class B shares 100
CAD Class C shares 100
CAD Class D shares 100
CAD Class EPreferred shares
100
Rio Tinto Exploration Dunav d.o.o. Beograd-Vracar; Serbia(c) — — 100 Resavska 23, 11000 Beograd, 11000, Serbia
Rio Tinto Exploration Gabon SA; Gabon(d) XAF10,000.00Ordinary shares
100 100C/O NEW ACE Baker Tilly, Quartier Louis – Quaben, Libreville, B.P:3981, Gabon
Rio Tinto Exploration India Private Limited; India INR10.00Ordinary shares
100 100Apartment No.100 A/5, Ground Floor, The Capital Court, Olof Palme Marg, Munirka, New Delhi 110067, India
Rio Tinto Exploration Kazakhstan LLP; Kazakhstan(c) — — 100 Dostyk 310/G, Almaty, 050020, Kazakhstan
Rio Tinto Exploration Pty Limited; Australia(a) AUD Class B shares 100
100 37 Belmont Avenue, Belmont WA 6104, AustraliaAUD Class C shares 100
AUDOrdinary shares
100
Rio Tinto Exploration Zambia Limited; Zambia ZMW1.00Ordinary shares
100 100 Plot 3827, Parliament Road, Olympia, Lusaka, Zambia
Rio Tinto FalCon Diamonds Inc.; Canada CAD1,000.00 Common shares
100 100400-1190 Avenue des Canadiens-de-Montréal, Montréal Québec H3B 0E3, Canada
Rio Tinto Fer et Titane Inc.; Canada CAD Class BPreference shares
100
100 1625 Route Marie-Victorin, Sorel-Tracy QC J3R 1M6, CanadaCADCommon shares
100
CAD$0.01Preferred shares
100
Rio Tinto Finance (USA) Limited; Australia(a) AUDOrdinary shares
100 100 Level 7, 360 Collins Street, Melbourne VIC 3000, Australia
Rio Tinto Finance (USA) plc; United Kingdom £1.00Ordinary shares
100 100 6 St James’s Square, London, SW1Y 4AD, United Kingdom
Rio Tinto Finance Limited; Australia(a) AUDOrdinary shares
100 100 Level 7, 360 Collins Street, Melbourne VIC 3000, Australia
Rio Tinto Finance plc; United Kingdom £1.00Ordinary shares
100100 6 St James’s Square, London, SW1Y 4AD, United Kingdom
US$1.00Ordinary shares
100
Rio Tinto France S.A.S.; France €15.25Ordinary shares
100 100 17 Place des Reflets, La Défense 2, 92400, Courbevoie, France
Rio Tinto Global Employment Company Pte. Ltd.; Singapore
US$1.00Ordinary shares
100 10012 Marina Boulevard, #20-01 Marina Bay Financial Centre Tower 3, 018982, Singapore
Rio Tinto Guinée S.A.; Guinea GNF100,000.00Ordinary shares
100 100Manquépas-Commune de Kaloum, République de Guinée, Guinea
Rio Tinto Holdings LLC; Mongolia MNT20,000.00Ordinary shares
100 100Level 17, Shangri-La Centre, Olympic Street 19A, Sukhbaatar District, Ulaanbaatar, 14241, Mongolia
Rio Tinto Hydrogen Energy Australia Pty Limited; Australia(a)
AUDOrdinary shares
100 100 Level 7, 360 Collins Street, Melbourne VIC 3000, Australia
Rio Tinto Hydrogen Energy LLC; United States(c)
— — 100CSC, 251 Little Falls Drive, Wilmington DE 19808, United States
Rio Tinto Iceland Ltd.; Iceland ISK1.00Registered shares
100 100 P.O. Box 244, IS-222, Hafnarfjördur, Iceland
Rio Tinto India Private Limited; India INR10.00Ordinary shares
100 10021st Floor, DLF Building No.5, Tower A, DLF Cyber City, Phase–III, Gurgaon, Haryana, 122022, India
Rio Tinto Indonesian Holdings Limited; United Kingdom
£1.00Ordinary shares
100100 6 St James’s Square, London, SW1Y 4AD, United Kingdom
US$1.00Ordinary shares
100
Rio Tinto International Holdings Limited; United Kingdom(b)
£1.00Ordinary shares
100 100 6 St James’s Square, London, SW1Y 4AD, United Kingdom
Rio Tinto Investments One Pty Limited; Australia AUDOrdinary shares
100 100Level 18 Central Park, 152-158 St. Georges Terrace, Perth WA 6000, Australia
Notes to the 2018 financial statements continued Annual report 2018 | riotinto.com 233
Financial statements

Financial statements
Notes to the 2018 financial statements continued
Wholly owned subsidiary undertakings continued
Name of undertaking and countryof incorporation Share class
% of shareclass heldby Groupcompanies
EffectiveGroup %ownership Registered office address
Rio Tinto Investments Two Pty Limited; Australia AUDOrdinary shares
100 100Level 18 Central Park, 152-158 St. Georges Terrace, Perth WA 6000, Australia
Rio Tinto Iron & Titanium (Suzhou) Co., Ltd; China US$1.00Ordinary shares
100 100418 Nanshi Street, Suzhou Industrial Park, Suzhou, 215021, China
Rio Tinto Iron & Titanium GmbH; Germany(c)
— — 100Mergenthalerallee 77, D-65760, Eschborn, (Frankfurt am Main), Germany
Rio Tinto Iron & Titanium Holdings GmbH; Germany(c) — — 100
Mergenthalerallee 77, D-65760, Eschborn, (Frankfurt am Main), Germany
Rio Tinto Iron & Titanium Limited; United Kingdom £1.00Ordinary shares
100 100 6 St James’s Square, London, SW1Y 4AD, United Kingdom
Rio Tinto Iron and Titanium Canada Inc.; Canada CADCommon shares
100 100 1625 Route Marie-Victorin, Sorel-Tracy QC J3R 1M6, Canada
Rio Tinto Iron Ore Atlantic Limited; United Kingdom US$1.00Ordinary shares
100 100 6 St James’s Square, London, SW1Y 4AD, United Kingdom
Rio Tinto Iron Ore Europe S.A.S.; France €100.00Ordinary shares
100 100 17 Place des Reflets, La Défense 2, 92400, Courbevoie, France
Rio Tinto Iron Ore Trading China Limited; United Kingdom
US$1.00Ordinary shares
100 100 6 St James’s Square, London, SW1Y 4AD, United Kingdom
Rio Tinto Japan Ltd; Japan JPY500.00Ordinary shares
100 1008th Floor, Kojimachi Diamond Building, 1 Kojimachi4-chome, Chiyoda-ku, Tokyo 102-0083, Japan
Rio Tinto Jersey Holdings 2010 Limited; Jersey US$Ordinary shares
100 100 22 Grenville Street, St Helier, JE4 8PX, Jersey
Rio Tinto Korea Ltd; Republic of Korea KRW10,000.00 Ordinary shares
100 1002nd Floor, JS Tower, 6 Teheran-ro 79-gil, Gangnam-Gu, Seoul, 135-877, Republic of Korea
Rio Tinto London Limited; United Kingdom £1.00Ordinary shares
100 100 6 St James’s Square, London, SW1Y 4AD, United Kingdom
Rio Tinto Management Services South Africa (Proprietary) Ltd; South Africa
ZAR2.00Ordinary shares
100 100 1 Harries Road, Illovo, Sandton, 2196, South Africa
Rio Tinto Marketing Pte. Ltd.; Singapore SGD$1.00Ordinary shares
100100
12 Marina Boulevard, #20-01 Marina Bay Financial Centre Tower 3, 018982, SingaporeUS$1.00
Ordinary shares100
Rio Tinto Marketing Services Limited; United Kingdom
£1.00Ordinary shares
100 100 6 St James’s Square, London, SW1Y 4AD, United Kingdom
Rio Tinto Medical Plan Trustees Limited; United Kingdom
£1.00Ordinary shares
100 100 6 St James’s Square, London, SW1Y 4AD, United Kingdom
Rio Tinto Metals Limited; United Kingdom £1.00Ordinary shares
100100 6 St James’s Square, London, SW1Y 4AD, United Kingdom
US$1.00Ordinary shares
100
Rio Tinto Minera Peru Limitada SAC; Peru PEN100.00Ordinary shares
100 100 Av. La Paz 1049, Oficina 503, Miraflores, Lima 18, Peru
Rio Tinto Mineração do Brasil Ltda; Brazil BRL1.00Quotas shares 100 100
SIG Quadra 04, Lote 175, Torre A, Salas 106 a 109, Edifício Capital Financial Center, Brasilia, CEP 70610-440, Brazil
Rio Tinto Minerals Asia Pte Ltd; Singapore SGD$1.00Ordinary shares
100100
12 Marina Boulevard, #20-01 Marina Bay Financial Centre Tower 3, 018982, SingaporeUS$1.00
Ordinary shares100
Rio Tinto Minerals Development Limited; United Kingdom
£0.25Ordinary shares
100 100 6 St James’s Square, London, SW1Y 4AD, United Kingdom
Rio Tinto Minerals Exploration (Beijing) Co., Ltd; China
US$1.00Ordinary shares
100 100Units 15-16, 18/F, China World Office Building 2, No. 1 Jianguomenwai Dajie, Chaoyang District, Beijing, China
Rio Tinto Minerals Inc.; United States US$0.01Common shares
100 100CSC, 15 West South Temple, Suite 1701, Salt Lake City UT 84101, United States
Rio Tinto Mining and Exploration Inc.; United States US$1.00Common shares
100 100CSC, 251 Little Falls Drive, Wilmington DE 19808, United States
Rio Tinto Mining and Exploration Limited; United Kingdom
£1.00Ordinary shares
100100 6 St James’s Square, London, SW1Y 4AD, United Kingdom
US$1.00Ordinary shares
100
47 Related undertakings continued
Annual report 2018 | riotinto.com234

Wholly owned subsidiary undertakings continued
Name of undertaking and countryof incorporation Share class
% of shareclass heldby Groupcompanies
EffectiveGroup %ownership Registered office address
Rio Tinto Mining and Exploration S.A.C.; Peru PEN0.50Ordinary shares
100 100 Av, La Paz 1049, Oficina 503, Miraflores, Lima 18, Peru
Rio Tinto Mongolia LLC; Mongolia MNT1,240.00 Common shares
100 100Level 17, Shangri-La Centre, Olympic Street 19A, Sukhbaatar District, Ulaanbaatar, 14241, Mongolia
Rio Tinto Namibian Holdings Limited; United Kingdom
£1.00Ordinary shares
100 100 6 St James’s Square, London, SW1Y 4AD, United Kingdom
Rio Tinto Nickel Company; United States US$0.01Common shares
100 100CSC, 251 Little Falls Drive, Wilmington DE 19808, United States
Rio Tinto Nominees Limited; United Kingdom £1.00Ordinary shares
100 100 6 St James’s Square, London, SW1Y 4AD, United Kingdom
Rio Tinto OT Management Limited; United Kingdom US$1.00Ordinary shares
100 100 6 St James’s Square, London, SW1Y 4AD, United Kingdom
Rio Tinto Overseas Holdings Limited; United Kingdom
£1.00Ordinary shares
100100 6 St James’s Square, London, SW1Y 4AD, United Kingdom
US$1.00Ordinary shares
100
Rio Tinto PACE Australia Pty Limited; Australia(a) AUD Ordinary shares
100 100Level 18 152-158 St. Georges Terrace, Perth WA 6000, Australia
Rio Tinto PACE Canada Inc.; Canada CAD Ordinary shares
100 100400-1190 Avenue des Canadiens-de-Montréal, Montréal Québec H3B 0E3, Canada
Rio Tinto Pension Investments Limited; United Kingdom(b)
£1.00Ordinary shares
100 100 6 St James’s Square, London, SW1Y 4AD, United Kingdom
Rio Tinto Peru Limited; United Kingdom US$1.00Ordinary shares
100 100 6 St James’s Square, London, SW1Y 4AD, United Kingdom
Rio Tinto Potash Management Inc.; Canada CADCommon shares
100 100 354-200 Granville Street, Vancouver BC V6C 1S4, Canada
Rio Tinto Procurement (Singapore) Pte Ltd; Singapore
US$1.00Ordinary shares
100 10012 Marina Boulevard, #20-01 Marina Bay Financial Centre Tower 3, 018982, Singapore
Rio Tinto Pte Ltd; Singapore SGD$1.00Ordinary shares
100100
12 Marina Boulevard, #20-01 Marina Bay Financial Centre Tower 3, 018982, SingaporeSGD$1.00
Preference shares100
Rio Tinto Saskatchewan Management Inc.; Canada CADCommon shares
100 100 354-200 Granville Street, Vancouver BC V6C 1S4, Canada
Rio Tinto Saskatchewan Potash Holdings General Partner Inc.; Canada
CADCommon shares
100 100McCarthy Tetrault LLP, Suite 5300, TD Bank Tower 66 Wellington Street West, Toronto ON M5K 1E6, Canada
Rio Tinto Saskatchewan Potash Holdings Limited Partnership; Canada(c) — — 100
McCarthy Tetrault LLP, Suite 5300, TD Bank Tower 66 Wellington Street West, Toronto ON M5K 1E6, Canada
Rio Tinto Secretariat Limited; United Kingdom £1.00Ordinary shares
100 100 6 St James’s Square, London, SW1Y 4AD, United Kingdom
Rio Tinto Services Inc.; United States US$0.01Common shares
100 100CSC, 251 Little Falls Drive, Wilmington DE 19808, United States
Rio Tinto Services Limited; Australia(a) AUDClass Z shares
100100 Level 7, 360 Collins Street, Melbourne VIC 3000, Australia
AUDOrdinary shares
100
Rio Tinto Shared Services Pty Limited; Australia AUDOrdinary shares
100 100 Level 7, 360 Collins Street, Melbourne VIC 3000, Australia
Rio Tinto Shipping (Asia) Pte. Ltd.; Singapore US$1.00Ordinary shares
100 10012 Marina Boulevard, #20-01 Marina Bay Financial Centre Tower 3, 018982, Singapore
Rio Tinto Shipping Pty. Limited; Australia(a) AUDOrdinary shares
100 100 Level 7, 360 Collins Street, Melbourne VIC 3000, Australia
Rio Tinto Simfer UK Limited; United Kingdom US$1.00Ordinary shares
100 100 6 St James’s Square, London, SW1Y 4AD, United Kingdom
Rio Tinto Singapore Holdings Pte Ltd; Singapore SGD$1.00Ordinary shares
100100
12 Marina Boulevard, #20-01 Marina Bay Financial Centre Tower 3, 018982, SingaporeUS$
Ordinary shares100
Rio Tinto South East Asia Limited; United Kingdom £1.00Ordinary shares
100100 6 St James’s Square, London, SW1Y 4AD, United Kingdom
US$1.00Ordinary shares
100
Rio Tinto Staff Fund (Retired) Pty Limited; Australia(a)
AUDOrdinary shares
100 100 Level 7, 360 Collins Street, Melbourne VIC 3000, Australia
Notes to the 2018 financial statements continued Annual report 2018 | riotinto.com 235
Financial statements

Financial statements
Notes to the 2018 financial statements continued
Wholly owned subsidiary undertakings continued
Name of undertaking and countryof incorporation Share class
% of shareclass heldby Groupcompanies
EffectiveGroup %ownership Registered office address
Rio Tinto Sulawesi Holdings Limited; United Kingdom
US$1.00Ordinary shares
100 100 6 St James’s Square, London, SW1Y 4AD, United Kingdom
Rio Tinto Technological Resources Inc.; United States
US$0.01Common shares
100 100CSC, 251 Little Falls Drive, Wilmington DE 19808, United States
Rio Tinto Technological Resources UK Limited; United Kingdom
US$1.00Ordinary shares
100 100 6 St James’s Square, London, SW1Y 4AD, United Kingdom
Rio Tinto Trading (Shanghai) Co., Ltd.; China US$1.00Ordinary shares
100 10041/F Wheelock Square, No. 1717 West Nanjing Road, Jing’an District, Shanghai, 200040, China
Rio Tinto Uranium Limited; United Kingdom US$1.00Ordinary shares
100 100 6 St James’s Square, London, SW1Y 4AD, United Kingdom
Rio Tinto Western Holdings Limited; United Kingdom
£1.00Ordinary shares
100100 6 St James’s Square, London, SW1Y 4AD, United Kingdom
US$1.00Ordinary shares
100
Riversdale Connections (Proprietary) Ltd; South Africa
ZAR1.00 Ordinary shares 100 100
Ground Floor – Cypress Place North, Woodmead Business Park140/142 Western Service Road, Woodmead, 2191, South Africa
Robe River Limited; Australia AUDOrdinary shares
100 100Level 18 Central Park, 152-158 St. Georges Terrace, Perth WA 6000, Australia
Rocklea Station Pty Ltd; Australia AUDOrdinary shares
100 100Level 18 Central Park, 152-158 St. Georges Terrace, Perth WA 6000, Australia
RTA AAL Australia Limited; Australia AUDOrdinary shares
100 100 123 Albert Street, Brisbane QLD 4000, Australia
RTA Boyne Limited; Australia AUDOrdinary shares
100 100Pacific Aluminium, 123 Albert Street, Brisbane QLD 4000, Australia
RTA Holdco 1 Limited; United Kingdom US$0.0001 Ordinary shares
100 100 6 St James’s Square, London, SW1Y 4AD, United Kingdom
RTA Holdco 4 Limited; United Kingdom US$1.00Ordinary shares
100100 6 St James’s Square, London, SW1Y 4AD, United Kingdom
US$0.73Ordinary shares
100
RTA Holdco 7 Limited; United Kingdom US$1.00Ordinary shares
100100 6 St James’s Square, London, SW1Y 4AD, United Kingdom
US$0.001 Class A Preference shares
100
RTA Holdco 8 Limited; United Kingdom US$1.00Ordinary shares
100100 6 St James’s Square, London, SW1Y 4AD, United Kingdom
US$0.001 Class A Preference shares
100
RTA Holdco Australia 1 Pty Ltd; Australia AUDOrdinary shares
100 100 123 Albert Street, Brisbane QLD 4000, Australia
RTA Holdco Australia 3 Pty Ltd; Australia AUDOrdinary shares
100 100 123 Albert Street, Brisbane QLD 4000, Australia
RTA Holdco Australia 5 Pty Ltd; Australia AUDOrdinary shares
100 100 123 Albert Street, Brisbane QLD 4000, Australia
RTA Holdco Australia 6 Pty Ltd; Australia AUDOrdinary shares
100 100 123 Albert Street, Brisbane QLD 4000, Australia
RTA Holdco France 2017 S.A.S.; France €10.00Ordinary shares
100 100 17 Place des Reflets, La Défense 2, 92400, Courbevoie, France
RTA Pacific Pty Limited; Australia AUDOrdinary shares
100 100 123 Albert Street, Brisbane QLD 4000, Australia
RTA Sales Pty Ltd; Australia AUDClass A shares
100100 123 Albert Street, Brisbane QLD 4000, Australia
AUDClass B shares
100
RTA Smelter Development Pty Limited; Australia AUDOrdinary shares
100 100 123 Albert Street, Brisbane QLD 4000, Australia
RTA Weipa Pty Ltd; Australia AUDOrdinary shares
100 100 123 Albert Street, Brisbane QLD 4000, Australia
RTA Yarwun Pty Ltd; Australia AUDOrdinary shares
100 100 123 Albert Street, Brisbane QLD 4000, Australia
47 Related undertakings continued
Annual report 2018 | riotinto.com236

Wholly owned subsidiary undertakings continued
Name of undertaking and countryof incorporation Share class
% of shareclass heldby Groupcompanies
EffectiveGroup %ownership Registered office address
RTAlcan 1 LLC; United States US$Common shares
100
100CSC, 251 Little Falls Drive, Wilmington DE 19808, United StatesUS$
Class A Preferred shares
100
RTAlcan 2 LLC; United States US$Common shares
100 100CSC, 251 Little Falls Drive, Wilmington DE 19808, United States
RTAlcan 3 LLC; United States US$Common shares
100 100CSC, 251 Little Falls Drive, Wilmington DE 19808, United States
RTLDS Aus Pty. Ltd; Australia(a) AUDOrdinary shares
100 100 Level 7, 360 Collins Street, Melbourne VIC 3000, Australia
RTLDS UK Limited; United Kingdom £1.00Ordinary shares
100 100 6 St James’s Square, London, SW1Y 4AD, United Kingdom
RTPDS Aus Pty Ltd; Australia AUDOrdinary shares
100 100 Level 7, 360 Collins Street, Melbourne VIC 3000, Australia
Savoie Services Y.K.; Japan JPY50,000.00Ordinary shares
100 100Harumi, 3 Nagahama-cho, Ozu-city, Ehime-ken, 799-3412, Japan
Scheuch Unterstuetzungskasse GmbH; Germany €51.13Ordinary shares
100 100 Alusingenplatz 1, D-78221, Singen, Germany
Skeleton Coast Diamonds Limited; Namibia NAD2.00Ordinary shares
100 100 360 Sam Nujoma Drive, Klein Windhoek, Windhoek, Namibia
Skymont Corporation; United States US$Common shares
100 100CSC, 251 Little Falls Drive, Wilmington DE 19808, United States
Société De Financement Des Risques Industriels; Luxembourg
€Ordinary shares
100 100 534, rue de Neudorf, B.P. 593, L-2015, Luxembourg
Société D’entreprises, Carrières Et Mines De L’Esterel; France
€9.33Ordinary shares
100 100 17 Place des Reflets, La Défense 2, 92400, Courbevoie, France
Société Générale de Recherches et d’exploitations Minières; France
€0.02Ordinary shares
100 100 17 Place des Reflets, La Défense 2, 92400, Courbevoie, France
Sohio Western Mining Company; United States US$100.00 Common shares
100 100CSC, 251 Little Falls Drive, Wilmington DE 19808, United States
Southern Copper Pty. Limited; Australia AUDA shares
100
100 Level 7, 360 Collins Street, Melbourne VIC 3000, Australia
AUDB shares
100
AUD Non-cumulative Redeemable Preference shares
100
AUDOrdinary shares
100
Swift Current Land & Cattle LLC; United States(c)
— — 100CSC, 2338 W. Royal Palm Road, Suite J, Phoenix AZ 85021, United States
Swiss Aluminium Australia Limited; Australia AUDOrdinary shares
100
100 123 Albert Street, Brisbane QLD 4000, Australia
AUDStock Unit A shares
100
AUDStock Unit B shares
100
AUDStock Unit C shares
100
TBAC Limited; United Kingdom £1.00Ordinary shares
100 100 6 St James’s Square, London, SW1Y 4AD, United Kingdom
Technological Resources Pty. Limited; Australia(a) AUDA Ordinary shares
100100 Level 7, 360 Collins Street, Melbourne VIC 3000, Australia
AUDB Ordinary shares
100
The Barrier Corporation (Vic.) Pty. Limited; Australia(a)
AUDOrdinary shares
100 100 Level 7, 360 Collins Street, Melbourne VIC 3000, Australia
The Kelian Community and Forest Protection Trust; Singapore(c) — — 100
10 Collyer Quay, #10-01 Ocean Financial Centre, 049315, Singapore
The Pyrites Company, Inc.; United States US$1.00Common shares
100 100CSC, 251 Little Falls Drive, Wilmington DE 19808, United States
Notes to the 2018 financial statements continued Annual report 2018 | riotinto.com 237
Financial statements
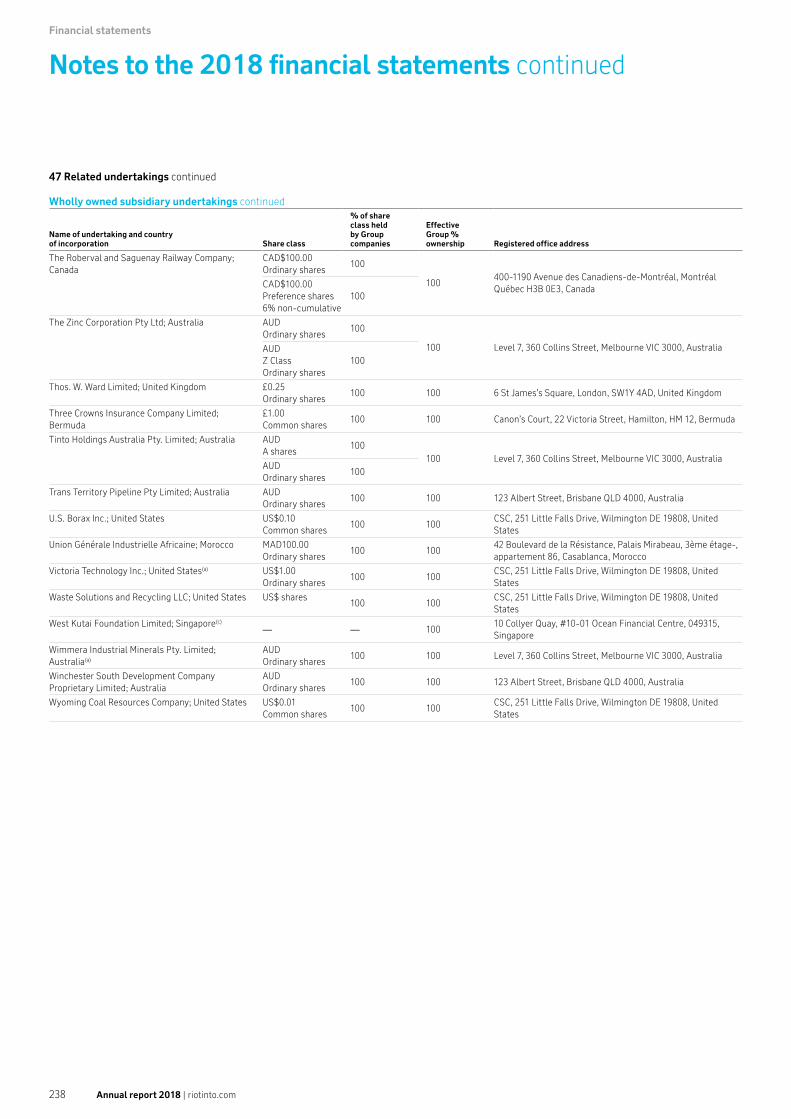
Financial statements
Notes to the 2018 financial statements continued
Wholly owned subsidiary undertakings continued
Name of undertaking and countryof incorporation Share class
% of shareclass heldby Groupcompanies
EffectiveGroup %ownership Registered office address
The Roberval and Saguenay Railway Company; Canada
CAD$100.00 Ordinary shares
100
100400-1190 Avenue des Canadiens-de-Montréal, Montréal Québec H3B 0E3, CanadaCAD$100.00
Preference shares 6% non-cumulative
100
The Zinc Corporation Pty Ltd; Australia AUDOrdinary shares
100
100 Level 7, 360 Collins Street, Melbourne VIC 3000, AustraliaAUDZ Class Ordinary shares
100
Thos. W. Ward Limited; United Kingdom £0.25Ordinary shares
100 100 6 St James’s Square, London, SW1Y 4AD, United Kingdom
Three Crowns Insurance Company Limited; Bermuda
£1.00Common shares
100 100 Canon’s Court, 22 Victoria Street, Hamilton, HM 12, Bermuda
Tinto Holdings Australia Pty. Limited; Australia AUDA shares
100100 Level 7, 360 Collins Street, Melbourne VIC 3000, Australia
AUDOrdinary shares
100
Trans Territory Pipeline Pty Limited; Australia AUDOrdinary shares
100 100 123 Albert Street, Brisbane QLD 4000, Australia
U.S. Borax Inc.; United States US$0.10Common shares
100 100CSC, 251 Little Falls Drive, Wilmington DE 19808, United States
Union Générale Industrielle Africaine; Morocco MAD100.00 Ordinary shares
100 10042 Boulevard de la Résistance, Palais Mirabeau, 3ème étage-, appartement 86, Casablanca, Morocco
Victoria Technology Inc.; United States(a) US$1.00Ordinary shares
100 100CSC, 251 Little Falls Drive, Wilmington DE 19808, United States
Waste Solutions and Recycling LLC; United States US$ shares 100 100
CSC, 251 Little Falls Drive, Wilmington DE 19808, United States
West Kutai Foundation Limited; Singapore(c)
— — 10010 Collyer Quay, #10-01 Ocean Financial Centre, 049315, Singapore
Wimmera Industrial Minerals Pty. Limited; Australia(a)
AUDOrdinary shares
100 100 Level 7, 360 Collins Street, Melbourne VIC 3000, Australia
Winchester South Development Company Proprietary Limited; Australia
AUDOrdinary shares
100 100 123 Albert Street, Brisbane QLD 4000, Australia
Wyoming Coal Resources Company; United States US$0.01Common shares
100 100CSC, 251 Little Falls Drive, Wilmington DE 19808, United States
47 Related undertakings continued
Annual report 2018 | riotinto.com238

Notes to the 2018 financial statements continued
Other Group entities including subsidiaries where the effective ownership is less than 100%, associated undertakings and significant holdings in undertakings other than subsidiary companies continued
Name of undertaking and countryof incorporation Share class
% of shareclass heldby Groupcompanies
EffectiveGroup %ownership Registered office address
201 Logistics Center, LLC; United States(c)
— — 50Corporation Trust Center, 1209 Orange Street, Wilmington DE 19801, United States
AGM Holding Company Pte Ltd; Singapore US$Ordinary shares
100 50.8 77 Robinson Road, #13-00, Robinson 77, 068896, Singapore
Alufluor AB; Sweden SEK1,000.00 Ordinary shares
50 50 Industrigatan 70, Box 902, S-25109, Helsingborg, Sweden
Aluminerie Alouette Inc.; Canada CAD Ordinary shares
40 40400, Chemin de la Pointe-Noire, C.P. 1650, Sept-Îles Québec G4R 5M9, Canada
Aluminerie De Bécancour, Inc.; Canada CAD1.00 Ordinary shares
50.1 25.25555 Pierre Thibault Street, PO 30, Becancour, Québec G9H 2T7, Canada
Aluminium & Chemie Rotterdam B.V.; Netherlands €4,555.00 Ordinary shares
65.8 65.8 Oude Maasweg 80, 3197 KJ, Botlek, Rotterdam, Netherlands
Asia Gold Mongolia LLC; Mongolia MNT1,250.00 Common shares
100 50.7Level 17, Shangri-La Centre, Olympic Street 19A, Sukhbaatar District, Ulaanbaatar, 14241 Mongolia
Asia Naran Bulag LLC; Mongolia MNT1,000.00 Common shares
100 50.7Level 17, Shangri-La Centre, Olympic Street 19A, Sukhbaatar District, Ulaanbaatar, 14241 Mongolia
Balkhash Saryshagan LLP; Kazakhstan(c) — — 75 Dostyk 310/G, Almaty, 050020, Kazakhstan
Beasley River Marketing Pty Ltd; Australia AUDA class shares
100 53Level 18 Central Park, 152-158 St. Georges Terrace, Perth WA 6000, Australia
Bektau B.V.; Netherlands €200.00 Ordinary shares
75 75 Welplaatweg 104, 3197 KS, Botlek-Rotterdam, Netherlands
Boyne Smelters Limited; Australia AUD A1 Class shares
100
59.4Pacific Aluminium, 123 Albert Street, Brisbane QLD 4000, Australia
AUD A2 Class shares
100
AUD B1 Class shares
100
CanPacific Potash Inc.; Canada(c)
— — 32c/o McKercher LLP, 374 Third Avenue South, Saskatoon SK S7K 1M5, Canada
Carol Lake Company Ltd.; Canada CAD$100.00 Ordinary shares
100 58.7400-1190 Avenue des Canadiens-de-Montréal, Montréal Québec H3B 0E3, Canada
Chinalco Rio Tinto Exploration Co. Ltd; China(d) CNY1.00 Capital Contribution (Ordinary shares)
49 49Unit 402, China Resources Building, No. 8 Jianguomenbei Avenue, Dong Cheng District, Beijing, 100005 P.R., China
Chlor Alkali Unit Pte Ltd; Singapore SGD$1.00 Ordinary (SGD) shares
10068.4
12 Marina Boulevard, #20-01 Marina Bay Financial Centre Tower 3, 018982, SingaporeUS$1.00 Ordinary
(USD) shares68.4
Dampier Salt Limited; Australia AUD Ordinary ($1.00257) shares
68.4
68.4Level 18 Central Park, 152-158 St. Georges Terrace, Perth WA 6000, AustraliaAUD Ordinary
($1.88 on 31/01/2013) shares
68.4
Elysis Limited Partnership/Elysis Société en Commandite; Canada
US$1,000.00 Class B shares
100 48.2400-1190 Avenue des Canadiens-de-Montréal, Montréal Québec H3B 0E3, Canada
Enarotali Gold Project Limited; Jersey £0.001 Ordinary shares
25 25 13 Castle Street, St Helier, JE4 5UT, Jersey
Energy Resources of Australia Ltd; Australia AUD A Class Ordinary shares
68.4 68.4c/o Mallesons Stephen Jacques, 60 Marcus Clarke Street, Canberra ACT, Australia
Fabrica De Plasticos Mycsa, S.A.; Bolivarian Republic of Venezuela(d)
VEF1.00 Common shares
49 49Urbanización Industrial San Ignacio, parcela 2-A, víaSan Pedro, Los Teques, Estado Miranda, Venezuela
Global Hubco B.V.; Netherlands €1.00 Ordinary shares
33.3 33.3c/o TMF Netherlands B.V., Luna Arena, Herikerbergweg 238, 1101, CM Amsterdam Zuidoost, Netherlands
Gulf Power Company; Canada CAD$100.00 Ordinary shares
100 58.7400-1190 Avenue des Canadiens-de-Montréal, Montréal Québec H3B 0E3, Canada
Halco (Mining) Inc.; United States US$100.00 Ordinary shares
45 45The Prentice-Hall Corporation System, Inc., 2711 Centerville Road, Suite 400, Willmington DE 19808, United States
Heruga Exploration LLC; Mongolia MNT12,500.00 Common Shares
100 50.8Level 17, Shangri-La Centre, Olympic Street 19A, Sukhbaatar District, Ulaanbaatar, 14241 Mongolia
Hope Downs Marketing Company Pty Ltd; Australia AUD A Class shares
100 50Level 18 Central Park, 152-158 St. Georges Terrace, Perth WA 6000, Australia
IAL Holdings Singapore Pte Ltd; Singapore US$ Ordinary shares
100 50.8 77 Robinson Road, #13-00, Robinson 77, 068896, Singapore
Annual report 2018 | riotinto.com 239
Financial statements
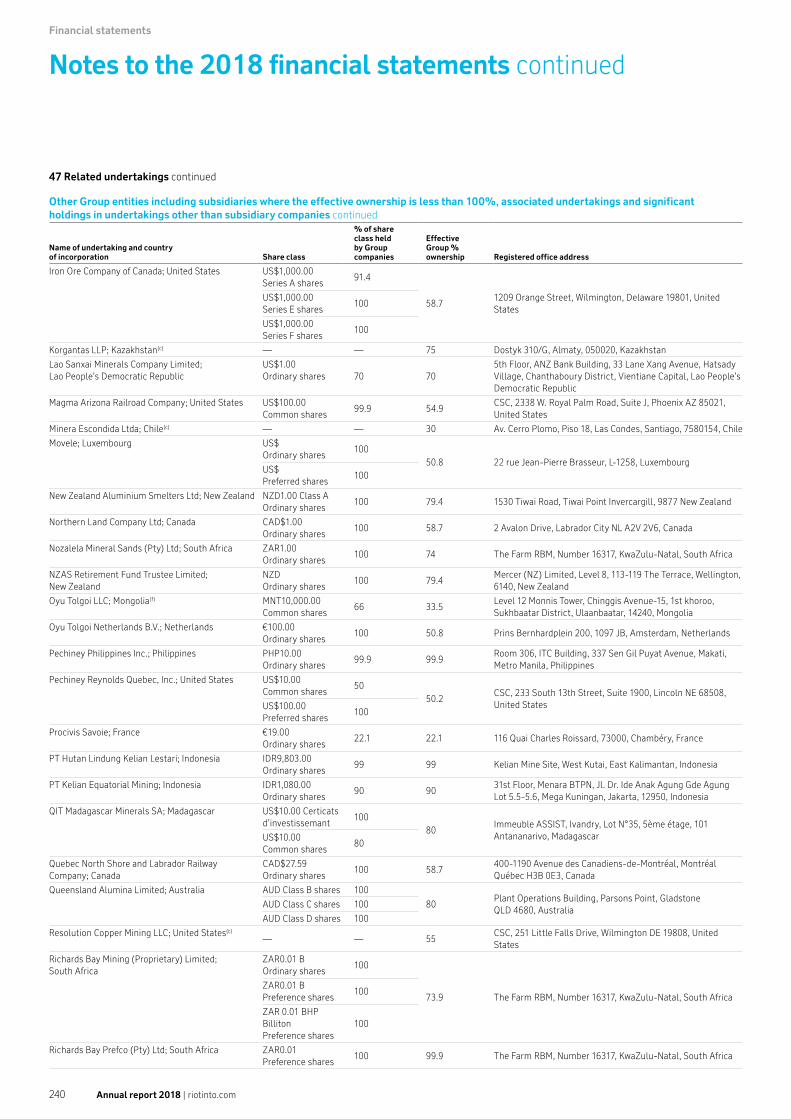
Financial statements
Notes to the 2018 financial statements continued
Other Group entities including subsidiaries where the effective ownership is less than 100%, associated undertakings and significant holdings in undertakings other than subsidiary companies continued
Name of undertaking and countryof incorporation Share class
% of shareclass heldby Groupcompanies
EffectiveGroup %ownership Registered office address
Iron Ore Company of Canada; United States US$1,000.00 Series A shares
91.4
58.71209 Orange Street, Wilmington, Delaware 19801, United States
US$1,000.00 Series E shares
100
US$1,000.00 Series F shares
100
Korgantas LLP; Kazakhstan(c) — — 75 Dostyk 310/G, Almaty, 050020, Kazakhstan
Lao Sanxai Minerals Company Limited; Lao People’s Democratic Republic
US$1.00 Ordinary shares 70 70
5th Floor, ANZ Bank Building, 33 Lane Xang Avenue, Hatsady Village, Chanthaboury District, Vientiane Capital, Lao People’s Democratic Republic
Magma Arizona Railroad Company; United States US$100.00 Common shares
99.9 54.9CSC, 2338 W. Royal Palm Road, Suite J, Phoenix AZ 85021, United States
Minera Escondida Ltda; Chile(c) — — 30 Av. Cerro Plomo, Piso 18, Las Condes, Santiago, 7580154, Chile
Movele; Luxembourg US$Ordinary shares
10050.8 22 rue Jean-Pierre Brasseur, L-1258, Luxembourg
US$Preferred shares
100
New Zealand Aluminium Smelters Ltd; New Zealand NZD1.00 Class A Ordinary shares
100 79.4 1530 Tiwai Road, Tiwai Point Invercargill, 9877 New Zealand
Northern Land Company Ltd; Canada CAD$1.00Ordinary shares
100 58.7 2 Avalon Drive, Labrador City NL A2V 2V6, Canada
Nozalela Mineral Sands (Pty) Ltd; South Africa ZAR1.00Ordinary shares
100 74 The Farm RBM, Number 16317, KwaZulu-Natal, South Africa
NZAS Retirement Fund Trustee Limited; New Zealand
NZDOrdinary shares
100 79.4Mercer (NZ) Limited, Level 8, 113-119 The Terrace, Wellington, 6140, New Zealand
Oyu Tolgoi LLC; Mongolia(f) MNT10,000.00 Common shares
66 33.5Level 12 Monnis Tower, Chinggis Avenue-15, 1st khoroo, Sukhbaatar District, Ulaanbaatar, 14240, Mongolia
Oyu Tolgoi Netherlands B.V.; Netherlands €100.00Ordinary shares
100 50.8 Prins Bernhardplein 200, 1097 JB, Amsterdam, Netherlands
Pechiney Philippines Inc.; Philippines PHP10.00Ordinary shares
99.9 99.9Room 306, ITC Building, 337 Sen Gil Puyat Avenue, Makati, Metro Manila, Philippines
Pechiney Reynolds Quebec, Inc.; United States US$10.00Common shares
5050.2
CSC, 233 South 13th Street, Suite 1900, Lincoln NE 68508, United StatesUS$100.00
Preferred shares100
Procivis Savoie; France €19.00Ordinary shares
22.1 22.1 116 Quai Charles Roissard, 73000, Chambéry, France
PT Hutan Lindung Kelian Lestari; Indonesia IDR9,803.00 Ordinary shares
99 99 Kelian Mine Site, West Kutai, East Kalimantan, Indonesia
PT Kelian Equatorial Mining; Indonesia IDR1,080.00 Ordinary shares
90 9031st Floor, Menara BTPN, Jl. Dr. Ide Anak Agung Gde Agung Lot 5.5-5.6, Mega Kuningan, Jakarta, 12950, Indonesia
QIT Madagascar Minerals SA; Madagascar US$10.00 Certicats d’investissemant
10080
Immeuble ASSIST, Ivandry, Lot N°35, 5ème étage, 101 Antananarivo, MadagascarUS$10.00
Common shares80
Quebec North Shore and Labrador Railway Company; Canada
CAD$27.59 Ordinary shares
100 58.7400-1190 Avenue des Canadiens-de-Montréal, Montréal Québec H3B 0E3, Canada
Queensland Alumina Limited; Australia AUD Class B shares 100
80Plant Operations Building, Parsons Point, Gladstone QLD 4680, Australia
AUD Class C shares 100
AUD Class D shares 100
Resolution Copper Mining LLC; United States(c)
— — 55CSC, 251 Little Falls Drive, Wilmington DE 19808, United States
Richards Bay Mining (Proprietary) Limited; South Africa
ZAR0.01 BOrdinary shares
100
73.9 The Farm RBM, Number 16317, KwaZulu-Natal, South AfricaZAR0.01 B Preference shares
100
ZAR 0.01 BHP BillitonPreference shares
100
Richards Bay Prefco (Pty) Ltd; South Africa ZAR0.01Preference shares
100 99.9 The Farm RBM, Number 16317, KwaZulu-Natal, South Africa
47 Related undertakings continued
Annual report 2018 | riotinto.com240

Other Group entities including subsidiaries where the effective ownership is less than 100%, associated undertakings and significant holdings in undertakings other than subsidiary companies continued
Name of undertaking and countryof incorporation Share class
% of shareclass heldby Groupcompanies
EffectiveGroup %ownership Registered office address
Richards Bay Titanium (Proprietary) Limited; South Africa
ZAR0.01 B Preference shares
100
73.9 The Farm RBM, Number 16317, KwaZulu-Natal, South AfricaZAR0.01 BHP BillitonPreference shares
100
ZAR0.01 BOrdinary shares
100
Rightship Pty Ltd; Australia AUDOrdinary shares
33.3 33.3 Level 20, 500 Collins Street, Melbourne VIC 3000, Australia
Rio Tinto Orissa Mining Private Ltd; India INR100.00Ordinary shares
51 51N-3/356, IRC Village, Nayapalli, Bhubaneswar, Orissa, 751015, India
Rio Tinto Sohar Logistics LLC; Oman OMR1.00Ordinary shares
70 70 P.O. Box 686, Ruwi, 112, Oman
Riversdale Anthracite Colliery (Proprietary) Ltd; South Africa
ZAR2.00Ordinary shares
74 74 1 Harries Road, Illovo, Sandton, 2196, South Africa
Robe River Mining Co. Pty. Ltd.; Australia AUDA shares
4073.6
Level 18 Central Park, 152-158 St. Georges Terrace, Perth WA 6000, AustraliaAUD
B shares76.4
Robe River Ore Sales Pty. Ltd.; Australia AUDOrdinary shares
65 57.1Level 18 Central Park, 152-158 St. Georges Terrace, Perth WA 6000, Australia
Rössing Uranium Limited; Namibia(f) NAD1.00 B shares
71.235.6 360 Sam Nujoma Drive, Klein Windhoek, Windhoek, Namibia
NAD0.1 C shares
70.6
Saryarka B.V.; Netherlands €200.00Ordinary shares
75 75 Welplaatweg 104, 3197 KS, Botlek-Rotterdam, Netherlands
SGLS LLC; Mongolia MNT10,000.00 Common shares
100 50.8Level 17, Shangri-La Centre, Olympic Street 19A, Sukhbaatar District, Ulaanbaatar, 14241 Mongolia
Sharp Strategic Funding Pte. Ltd.; Singapore US$1.00 Ordinary shares
100 50.8 77 Robinson Road, #13-00, Robinson 77, 068896, Singapore
Simfer Jersey Finance 1 Ltd; Jersey US$Ordinary shares
100 53 22 Grenville Street, St Helier, JE4 8PX, Jersey
Simfer Jersey Finance 2 Ltd; Jersey US$Ordinary shares
53 53 22 Grenville Street, St Helier, JE4 8PX, Jersey
Simfer Jersey Limited; Jersey US$Ordinary shares
53 53 22 Grenville Street, St Helier, JE4 8PX, Jersey
Simfer Jersey Nominee Limited; United Kingdom £1.00Ordinary shares
100 53 6 St James’s Square, London, SW1Y 4AD, United Kingdom
SIMFER S.A.; Guinea(f) GNF100,000.00 Ordinary shares
85 45Résidence Dolphine1-Coleah Corniche Sud, Commune de Matam, Conakry, BP 848, Guinea
Singapore Metals Pte. Ltd.; Singapore US$Ordinary shares
100 50.8 77 Robinson Road, #13-00, Robinson 77, 068896, Singapore
Société Minière Et De Participations Guinée-Alusuisse; Guinea(c) — — 50 Tougue, Guinea
Sohar Aluminium Co. L.L.C.; Oman OMR1.00Ordinary shares
20 20Sohar Industrial Estate, P.O. Box 80, PC 327, Sohar, Sultanate of Oman
THR Aruba Holdings LLC A.V.V.; Aruba US$1.00Common shares
100 50.8IMC International Management Trust Company N.V., L.G. Smith Blvd. 62, Miramar Building, Oranjestad, Aruba
THR Delaware Holdings, LLC; United States(c)
— — 50.8National Corporate Research, Ltd., 850 New Burton Road, Suite 201, Dover DE 19904, United States
THR Kharmagtai Pte Ltd.; Singapore US$Ordinary shares
100 50.8 77 Robinson Road, #13-00, Robinson 77, 068896, Singapore
THR MINES (BC) LTD.; Canada CADCommon shares
10050.8 354-200 Granville Street, Vancouver BC V6C 1S4, Canada
US$Common shares
100
THR Mines Services Co. Ltd.; Canada CADCommon shares
100 50.8Lackowicz Shier & Hoffman Barristers & Solicitors, 300-204 Black Street, Whitehorse YT Y1A 2M9, Canada
THR OYU TOLGOI LTD.; British Virgin Islands US$1.00Ordinary shares
100 50.8Craigmuir Chambers, Road Town, Tortola, VG1110, British Virgin Islands
THR Ulaan Pte. Ltd.; Singapore US$Ordinary shares
100 50.8 77 Robinson Road, #13-00, Robinson 77, 068896, Singapore
Notes to the 2018 financial statements continued Annual report 2018 | riotinto.com 241
Financial statements

Financial statements
Notes to the 2018 financial statements continued
Other Group entities including subsidiaries where the effective ownership is less than 100%, associated undertakings and significant holdings in undertakings other than subsidiary companies continued
Name of undertaking and countryof incorporation Share class
% of shareclass heldby Groupcompanies
EffectiveGroup %ownership Registered office address
Tisand (Proprietary) Limited; South Africa ZAR1.00 AOrdinary shares
100
74 The Farm RBM, Number 16317, KwaZulu-Natal, South AfricaZAR1.00 BOrdinary shares
100
ZAR1,000.00 Cumulative Preference shares
100
Tomago Aluminium Company Pty Limited; Australia AUDOrdinary shares
100 51.6 638 Tomago Road, Tomago, NSW 2322, Australia
Turquoise Hill (Beijing) Services Company Ltd; China(c) — — 50.8
Room 2913, Cameo Center, No.16 GuangShun South Street, WangJing ChaoYang District, Beijing 100102, China
Turquoise Hill Netherlands Cooperatief U.A.; Netherlands
US$COOP shares
100 50.8 Prins Bernhardplein 200, 1097 JB, Amsterdam, Netherlands
Turquoise Hill Resources Ltd.; Canada CADCommon shares
50.8 50.8300-204 Black Street, Whitehorse Yukon Territories Y1A 2M9, Canada
Turquoise Hill Resources Philippines Inc.; Philippines(d)
PHP100.00 Common shares 99.9 50.8
Romulo Mabanta Buenaventura Sayoc & De Los Angeles, 21st Floor, Philamlife Tower, 8767 Paseo Roxas, Makati City, 1226, Philippines
Turquoise Hill Resources Singapore Pte Ltd.; Singapore
SGD1.00Common shares
100 50.8 2 Venture Drive, #24-01 Vision Exchange, Singapore 608526
Twin Falls Power Corporation Ltd; Canada CADClass B shares
74.4 34.6Hydro Place, P.O. Box 12500, St-John’s Newfounland and Labrador A1B 3T5, Canada
Wright Mgmt Services Pte. Ltd.; Singapore US$ Ordinary shares
100 50.8 77 Robinson Road, #13-00, Robinson 77, 068896, Singapore
Yalleen Pastoral Co Pty Ltd; Australia AUDOrdinary shares
63.7 56Level 18 Central Park, 152-158 St. Georges Terrace, Perth WA 6000, Australia
Zululand Titanium (Pty) Ltd; South Africa ZAR1.00Ordinary shares
100 74 The Farm RBM, Number 16317, KwaZulu-Natal, South Africa
47 Related undertakings continued
Annual report 2018 | riotinto.com242

In addition, the Group participates in the following unincorporated arrangements:
Name of undertaking and country of incorporation Address or principal place of businessInterest % ownedby the Group
Bao-HI Ranges Joint Venture; Australia Level 18 Central Park, 152-158 St. Georges Terrace, Perth WA6000, Australia
54
Beasley River Joint Venture; Australia Level 18 Central Park, 152-158 St. Georges Terrace, Perth WA6000, Australia
53
Cape Bougainville Joint Venture; Australia 123 Albert Street, Brisbane QLD 4000, Australia 67.5
Channar Mining Joint Venture; Australia Level 18 Central Park, 152-158 St. Georges Terrace, Perth WA6000, Australia
60
Diavik Joint Venture; Canada 300-5201 50th Avenue, Yellowknife NT X1A 2P9, Canada 60
Gladstone Power Station Joint Venture; Australia NRG Gladstone Operating Service, Gladstone Power Station,Gladstone QLD 4680, Australia
42.1
Green Mountain Mining Venture; United States CSC 251 Little Falls Drive, Wilmington DE 19808, United States 100
Hope Downs Joint Venture; Australia Level 18 Central Park, 152-158 St. Georges Terrace, Perth WA6000, Australia
50
Mitchell Plateau Joint Venture; Australia 123 Albert Street, Brisbane QLD 4000, Australia 65.6
Rhodes Ridge Joint Venture; Australia Level 18 Central Park, 152-158 St. Georges Terrace, Perth WA6000, Australia
50
Robe River Iron Associates Joint Venture; Australia Level 18, Central Park, 152-158 St. Georges Terrace, Perth WA6000, Australia
57.1
Tomago Aluminium Joint Venture; Australia 638 Tomago Road, NSW 2322, Tomago, Australia 51.6
Winter Road Joint Venture; Canada 300-5201 50th Avenue, Yellowknife NT X1A 2P9, Canada 33.3
(a) Directly held by Rio Tinto Limited.(b) Directly held by Rio Tinto plc.(c) Group ownership is held through an interest in capital. The entity has no classes of shares.(d) In liquidation or application for dissolution filed.(e) Dissolved after 31 December 2018.(f) Classed as a subsidiary in accordance with section 1162(4)(a) of the UK Companies Act 2006 on the grounds of dominant influence.
Notes to the 2018 financial statements continued Annual report 2018 | riotinto.com 243
Financial statements

Financial statements
Rio Tinto plc Company balance sheet
As at 31 December Note2018
US$m2017
US$m
Non-current assets
Investments B 36,159 36,093
Trade and other receivables 301 396
36,460 36,489
Current assets
Trade and other receivables C 10,751 9,242
Cash at bank and in hand 4 5
10,755 9,247
Total assets 47,215 45,736
Current liabilities
Trade and other payables D (12,697) (12,388)
Dividends payable (17) (18)
Other financial liabilities G (706) (347)
(13,420) (12,753)
Non-current liabilities
Other financial liabilities G (277) (341)
Total liabilities (13,697) (13,094)
Net assets 33,518 32,642
Capital and reserves
Share capital E 211 220
Share premium account 4,311 4,306
Other reserves F 12,001 11,992
Retained earnings 16,995 16,124
Total equity 33,518 32,642
The Rio Tinto plc company balance sheet has been prepared in accordance with Financial Reporting Standard 101 “Reduced Disclosure Framework” (FRS 101). Note A explains the principal accounting policies.
Profit after tax and total comprehensive income for the year amounted to US$8,538 million (2017: US$7,816 million). As permitted by section 408 of the UK Companies Act 2006, no statement of comprehensive income for the Rio Tinto plc parent company is shown.
The Rio Tinto plc company balance sheet, statement of comprehensive income and the related notes were approved by the directors on 27 February 2019 and the balance sheet is signed on their behalf by
Simon ThompsonChairman
Jean-Sébastien JacquesChief executive
Jakob StausholmChief financial officer
Rio Tinto plc
Registered number: 719885
Rio Tinto plc (the “Company”) is incorporated in the United Kingdom, registered in England and Wales, and domiciled in the United Kingdom
Annual report 2018 | riotinto.com244

Rio Tinto plc company information
Rio Tinto plc Company statement of changes in equity
Year ended 31 December 2018
SharecapitalUS$m
Sharepremiumaccount
US$m
Otherreserves
US$m
Retainedearnings
US$m
TotalequityUS$m
Opening balance 220 4,306 11,992 16,124 32,642
Profit for the financial year (comprehensive income) – – – 8,538 8,538
Dividends – – – (4,113) (4,113)
Proceeds from issue of shares – 5 – – 5
Share buy-back (9) – 9 (3,624) (3,624)
Share-based payments – – – 70 70
Total 211 4,311 12,001 16,995 33,518
Year ended 31 December 2017
SharecapitalUS$m
Sharepremiumaccount
US$m
Otherreserves
US$m
Retainedearnings
US$m
TotalequityUS$m
Opening balance 224 4,304 11,988 13,346 29,862
Profit for the financial year (comprehensive income) – – – 7,816 7,816
Dividends – – – (3,255) (3,255)
Proceeds from issue of shares – 2 – – 2
Share buy-back (4) – 4 (1,828) (1,828)
Share-based payments – – – 45 45
Total 220 4,306 11,992 16,124 32,642
Annual report 2018 | riotinto.com 245
Financial statements
Financial statements
Notes to the Rio Tinto plc financial statements
A Principal accounting policiesa. Basis of preparationThe Rio Tinto plc company financial statements have been prepared using the historical cost convention, as modified by the revaluation of certain financial liabilities and in accordance with the UK Companies Act 2006 and FRS 101. The financial statements have been prepared on a going concern basis.
The accounting policies set out below have been applied consistently to all periods presented in these financial statements. The following exemptions available under FRS 101 have been applied:
– Paragraphs 45(b) and 46 to 52 of IFRS 2, “Share-based payment” (details of the number and weighted average exercise prices of share options and how the fair value of goods and services received was determined).
– Paragraphs 91-99 of IFRS 13 “Fair value measurement” (disclosure of valuation techniques and inputs used for fair value measurement of assets and liabilities).
– IFRS 7 “Financial Instruments: Disclosures”. – Paragraph 38 of IAS 1 “Presentation of financial statements”,
comparative information requirements in respect of Paragraph 79(a)(iv) of IAS 1.
– The following paragraphs of IAS 1 “Presentation of financial statements”: – 10 (d) (statement of cash flows); – 16 (statement of compliance with all IFRS); – 38A (requirement for minimum of two primary statements, including
cash flow statements); – 38B-D (additional comparative information); – 111 (cash flow statement information); and – 134-136 (capital management disclosures).
– IAS 7 “Statement of cash flows”. – Paragraph 30 and 31 of IAS 8 “Accounting policies, changes in
accounting estimates and errors” (requirement for the disclosure of information when an entity has not applied a new IFRS that has been issued and is not yet effective).
– Paragraph 17 of IAS 24 “Related party disclosures” (key management compensation).
– The requirements of IAS 24, “Related party disclosures” to disclose related party transactions entered into between two or more members of a group.
b. Judgments in applying accounting policies and key sources of estimation uncertaintyThe preparation of the financial statements requires management to make assumptions, judgments and estimates and to use judgment in applying accounting policies and making critical accounting estimates. These judgments, estimates and assumptions are based on management’s best knowledge of the relevant facts and circumstances, having regard to previous experience, but actual results may differ materially from the amounts included in the financial statements.
The key area of judgment that has the most significant effect on the amounts recognised in the financial statements is the review for impairment of investment carrying values.
c. Currency translationItems included in the financial statements are measured using the currency of the primary economic environment in which the Company operates (the functional currency). The financial statements are presented in US dollars, which is the Company’s functional and presentation currency. Transactions denominated in other currencies, including the issue of shares, are translated into the functional currency using the exchange rates prevailing at the date of the transaction.
Foreign exchange gains and losses resulting from the settlement of such transactions, and from the translation at year-end exchange rates of monetary assets and liabilities denominated in foreign currencies, are recognised in the profit and loss account.
Exchange rates used are consistent with the rates used by the Group as disclosed in the consolidated financial statements (note 41).
d. InvestmentsInvestments in Group companies are valued at cost less accumulated impairment losses. Investments are reviewed for impairment if events or changes in circumstances indicate that the carrying amount may not be recoverable.
e. Financial guaranteesFinancial guarantees are recognised initially at fair value. Subsequently, the liability is measured at the higher of the best estimate of the expenditure required to settle the present obligation and the amount initially recognised less cumulative amortisation.
f. Share-based paymentsThe Company operates a number of share-based payment plans for Group employees, the details of which are included in the consolidated financial statements (note 43). The fair value of the Company’s share plans is recognised as an addition to the cost of the investment in the subsidiary in which the relevant employees work over the expected vesting period, with a corresponding entry to retained earnings. Payments received from the Company’s subsidiaries in respect of these share-based payments are recognised as a reduction in the cost of the investment. The Company uses fair values provided by independent actuaries calculated using either a lattice-based option valuation model or a Monte Carlo simulation model. The fair value of the share plans is determined at the date of grant, taking into account any market-based vesting conditions attached to the award.
Non-market based vesting conditions (eg relative EBIT margin performance targets) are taken into account in estimating the number of awards likely to vest. The estimate of the number of awards likely to vest is reviewed at each balance sheet date up to the vesting date, at which point the estimate is adjusted to reflect the actual awards issued. No adjustment is made after the vesting date even if the awards are forfeited or not exercised.
g. Dividend incomeDividend income is recognised when the right to receive payment is established.
h. Treasury sharesThe consideration paid for shares repurchased by the Company and held as treasury shares is recognised as a reduction in shareholders’ funds through retained earnings.
Annual report 2018 | riotinto.com246

Rio Tinto plc company information
B Investments
2018US$m
2017US$m
Investments in Group companiesAt 1 January 36,093 36,050
Additions 66 45
Other adjustments – (2)
At 31 December 36,159 36,093
At 31 December 2018 the Company had the following principal subsidiaries:
Company Principal activityCountry of
incorporationPercentage
shareholding
Rio Tinto International Holdings Limited Holding company UK 100%
Rio Tinto European Holdings Limited Holding company UK 100%
In accordance with section 409 of the UK Companies Act 2006, a full list of related undertakings is disclosed in the consolidated financial statements (note 47).
C Trade and other receivablesTrade and other receivables includes US$10,603 million (31 December 2017: US$9,114 million), which is subject to interest based on LIBOR, is unsecured and repayable on demand.
D Trade and other payablesTrade and other payables includes US$12,568 million (31 December 2017: US$12,265 million), which is subject to interest rates based on LIBOR, is unsecured and repayable on demand.
E Share capital
2018US$m
2017US$m
Issued and fully paid up share capital of 10p each(a)
At 1 January 220 224
Ordinary shares purchased and cancelled(b) (9) (4)
At 31 December 211 220
(a) 35,380 new shares (2017: 26,241 new shares) were issued during the year and 106,045 shares (2017: 147,126 shares) were reissued from Treasury pursuant to share plans.(b) During the year 63,984,287 shares (2017: 32,937,109 shares) were purchased and immediately cancelled.
F Other reservesOther reserves includes US$11,936 million (2017: US$11,936 million), which represents the difference between the nominal value and issue price of the shares issued arising from Rio Tinto plc’s rights issue completed in July 2009.
G Rio Tinto plc guaranteesRio Tinto plc provides a number of guarantees in respect of Group companies.
Rio Tinto plc and Rio Tinto Limited have jointly guaranteed the Group’s external listed debt under the US Shelf Programme, European Debt Issuance Programme and Commercial Paper Programme which totalled US$5.9 billion at 31 December 2018 (31 December 2017: US$7.9 billion). In addition, these entities also jointly guarantee the Group’s undrawn credit facility which was US$7.5 billion at 31 December 2018 (31 December 2017: US$7.5 billion). Rio Tinto plc has provided guarantees in respect of certain derivative contracts that are in a liability position of US$374 million at 31 December 2018 (31 December 2017: US$231 million).
Rio Tinto plc has provided a guarantee, known as the completion support undertaking (CSU), in favour of the Oyu Tolgoi LLC project finance lenders. At 31 December 2018 US$4.3 billion of project finance debt was outstanding under this facility (31 December 2017: US$4.3 billion). Oyu Tolgoi LLC is owned by Erdenes Oyu Tolgoi LLC (34%), which is controlled by the Government of Mongolia, and Turquoise Hill Resources Ltd (66%, of which Rio Tinto owns 51%). The project finance has been raised for development of the underground mine and the CSU will terminate on the completion of the underground mine according to a set of completion tests set out in the project finance facility.
Annual report 2018 | riotinto.com 247
Financial statements
Financial statements
G Rio Tinto plc guarantees continuedThe Rio Tinto guarantee applies to the extent that Turquoise Hill Resources Ltd cannot satisfy Oyu Tolgoi LLC’s project finance debt servicing obligations under its own guarantee to the lenders, called the sponsor debt service undertaking (DSU). Both the CSU and DSU contain a carve-out for certain political risk events.
During 2018, fees of US$40 million (2017: US$44 million) were received from Oyu Tolgoi LLC and Turquoise Hill Resources Ltd as consideration for provision of the CSU with an additional balance of US$5 million (31 December 2017: US$12 million) due and included within Current assets – Trade and other receivables.
Rio Tinto plc has provided a number of guarantees in relation to various pension funds. Subject to certain conditions, Rio Tinto plc would pay any contributions due from Group companies participating in these funds in the event that the companies fail to meet their contribution requirements. The guarantees were not called upon in 2018. The aggregate of company contributions to these plans in 2018 was US$11 million (2017: US$51 million).
Other guarantees issued by Rio Tinto plc in relation to Rio Tinto Group entities as at 31 December 2018 amount to US$360 million (31 December 2017: US$338 million). Included within this balance is US$32 million (31 December 2017: US$60 million) in relation to non-wholly owned subsidiaries.
Pursuant to the DLC Merger, both Rio Tinto plc and Rio Tinto Limited issued deed poll guarantees by which each company guaranteed contractual obligations incurred by the other or guaranteed by the other.
The liability recognised for financial guarantees is US$359 million (31 December 2017: US$389 million).
H Contingent liabilitiesDetails of contingent liabilities are included in note 31 to the Group financial statements.
I Events after the balance sheet dateThere were no significant events identified after the balance sheet date that are required to be disclosed.
Notes to the Rio Tinto plc financial statements continued
Annual report 2018 | riotinto.com248

Rio Tinto financial information by business unit
Rio Tinto financial information by business unit
Gross revenue(a)
for the year ended 31 December
EBITDA(b)
for the year ended31 December
Net earnings(c)
for the yearended 31 December
Rio Tintointerest
%2018
US$m 2017
US$m 2016
US$m2018
US$m 2017
US$m 2016
US$m2018
US$m 2017
US$m 2016
US$m
Iron Ore Pilbara (d) 18,359 18,143 14,530 11,267 11,383 8,558 6,460 6,576 4,662Evaluation projects/other 126 108 75 58 137 (32) 54 116 (51)Total Iron Ore 18,485 18,251 14,605 11,325 11,520 8,526 6,514 6,692 4,611 Aluminium (e) Bauxite 2,324 2,019 1,913 790 804 848 412 463 493Alumina 3,340 2,661 2,118 1,137 454 27 634 180 (121)Intrasegment (861) (790) (786) (7) (25) – (5) (17) –Bauxite & Alumina 4,803 3,890 3,245 1,920 1,233 875 1,041 626 372Primary Metal 6,468 5,808 4,913 1,418 1,762 1,258 595 778 402Pacific Aluminium 2,541 2,305 1,971 148 453 264 – 176 62Inter-segment and other (3,226) (2,321) (1,822) (88) (19) (50) (67) (12) (13)Integrated operations 10,586 9,682 8,307 3,398 3,429 2,347 1,569 1,568 823Other product group items 1,479 1,214 1,075 (440) (132) (42) (344) (100) (30)Product group operations 12,065 10,896 9,382 2,958 3,297 2,305 1,225 1,468 793Evaluation projects/other 126 109 76 137 126 167 122 115 154Total Aluminium 12,191 11,005 9,458 3,095 3,423 2,472 1,347 1,583 947 Copper & Diamonds Rio Tinto Kennecott 100.0 1,862 1,352 1,243 785 539 126 293 78 (228)Escondida 30.0 2,274 1,811 1,465 1,301 1,030 793 506 325 270Grasberg joint venture (g) 457 33 – 281 (3) (17) 217 (169) (64)Oyu Tolgoi and Turquoise Hill (h) 1,180 940 1,203 375 256 436 69 36 52Diamonds (i) 695 706 613 301 287 239 118 92 47Product group operations 6,468 4,842 4,524 3,043 2,109 1,577 1,203 362 77Evaluation projects/other – – – (267) (205) (190) (149) (99) (95)Total Copper & Diamonds 6,468 4,842 4,524 2,776 1,904 1,387 1,054 263 (18) Energy & Minerals Rio Tinto Coal Australia ( j) 989 2,829 2,634 893 1,223 893 591 716 382Iron Ore Company of Canada 58.7 1,583 1,867 1,324 586 770 335 166 235 64Rio Tinto Iron & Titanium (k) 1,782 1,763 1,419 510 546 370 174 201 86Rio Tinto Borates 100.0 622 630 620 197 244 213 111 126 117Dampier Salt 68.4 246 215 259 56 27 74 18 3 25Uranium (l) 415 417 456 18 15 54 (4) (26) 10Product group operations 5,637 7,721 6,712 2,260 2,825 1,939 1,056 1,255 684Simandou iron ore project (m) – – – (15) (13) (102) (7) (6) (47)Evaluation projects/other 60 43 22 (52) (9) (31) (37) (7) (25)Total Energy & Minerals 5,697 7,764 6,734 2,193 2,803 1,806 1,012 1,242 612 Other operations (n) 9 10 8 (70) (116) (95) (102) (138) (88) Inter-segment transactions (15) (15) (11) – – – – – – Product group total 42,835 41,857 35,318 19,319 19,534 14,096 9,825 9,642 6,064 Central pension costs, share-based payments and insurance (128) (68) (34) (90) (48) (24)Restructuring, project and one-off costs (272) (177) (13) (190) (124) (9)Central costs (552) (491) (364) (410) (311) (208)Exploration and evaluation (231) (218) (175) (193) (178) (147)Net interest (134) (354) (576)Underlying EBITDA/earnings 18,136 18,580 13,510 8,808 8,627 5,100Items excluded from underlying EBITDA/earnings – 10 18 5,127 1,912 (687) 4,830 135 (483)EBITDA/net earnings 23,263 20,492 12,823 13,638 8,762 4,617Reconciliation to Group income statement Share of equity accounted unit sales and intra-subsidiary/equity accounted unit sales (2,313) (1,837) (1,555)Depreciation and amortisation in subsidiaries excluding capitalised depreciation (3,909) (4,302) (4,691)Impairment charges (132) (796) (249)Depreciation and amortisation in equity accounted units (650) (648) (526)Taxation and finance items in equity accounted units (372) (272) (241)Consolidated sales revenue/profit on ordinary activities before finance items and taxation 40,522 40,030 33,781 18,200 14,474 7,116
Annual report 2018 | riotinto.com 249
Financial statements

Financial statements
Capital expenditure(o)
for the yearended 31 December
Depreciation andamortisation for the year
ended 31 DecemberOperating assets(p)
as at 31 December
Employeesfor the year
ended 31 December
Rio Tintointerest
%2018
US$m 2017
US$m 2016
US$m2018
US$m 2017
US$m 2016
US$m2018
US$m 2017
US$m 2016
US$m2018
US$m 2017
US$m 2016
US$m
Iron Ore
Pilbara (d) 1,288 1,201 868 1,682 1,645 1,645 14,486 16,535 16,357 10,422 10,159 10,424
Evaluation projects/other – – – – – – 2 2 2 – – –
Total Iron Ore 1,288 1,201 868 1,682 1,645 1,645 14,488 16,537 16,359 10,422 10,159 10,424 Aluminium (e)
Bauxite 953 825 343 165 123 110 2,494 1,897 1,278 2,676 2,534 2,592
Alumina 218 108 87 194 209 206 2,721 2,733 2,588 2,009 2,012 2,139
Intrasegment – – – – – – (20) (18) – – – –
Bauxite & Alumina 1,171 933 430 359 332 316 5,195 4,612 3,866 4,685 4,546 4,731
Primary Metal 595 389 394 615 665 716 9,306 9,946 10,701 6,497 6,404 6,799
Pacific Aluminium 115 109 91 149 196 193 1,156 1,016 1,044 2,278 2,173 2,276
Inter-segment and other – 5 1 (1) 6 25 789 772 171 180 222 231
Integrated operations 1,881 1,436 916 1,122 1,199 1,250 16,446 16,346 15,782 13,640 13,345 14,037
Other product group items (f) (508) – – – – – – – – – – –
Total Aluminium 1,373 1,436 916 1,122 1,199 1,250 16,446 16,346 15,782 13,640 13,345 14,037 Copper & Diamonds
Rio Tinto Kennecott 100.0 318 249 333 427 422 530 1,864 1,936 2,189 1,993 1,734 1,638
Escondida 30.0 302 248 517 518 507 364 3,057 3,369 3,565 1,087 1,079 1,230
Grasberg joint venture (g) 171 138 174 30 42 89 – 1,137 1,151 1,615 1,642 2,859
Oyu Tolgoi and Turquoise Hill (h) 1,284 901 322 219 344 450 6,072 4,725 3,804 2,863 2,835 2,728
Diamonds (i) 64 85 97 118 132 164 267 441 655 967 922 907
Product group operations 2,139 1,621 1,443 1,312 1,447 1,597 11,260 11,608 11,364 8,525 8,212 9,362
Evaluation projects/other 11 1 (2) 5 5 4 129 135 166 146 142 127
Total Copper & Diamonds 2,150 1,622 1,441 1,317 1,452 1,601 11,389 11,743 11,530 8,671 8,354 9,489 Energy & Minerals
Rio Tinto Coal Australia ( j)/(q) 32 84 (107) 34 152 297 (837) 1,040 1,807 1,005 1,924 3,049
Iron Ore Company of Canada 58.7 189 202 75 154 157 151 975 988 1,018 2,397 2,382 2,308
Rio Tinto Iron & Titanium (k) 169 119 97 201 219 189 3,390 3,881 3,662 4,058 4,048 4,094
Rio Tinto Borates 100.0 44 28 31 62 65 53 518 523 508 980 936 984
Dampier Salt 68.4 14 13 11 20 22 23 165 150 146 239 232 317
Uranium (l) 8 21 30 4 37 25 (406) (327) (143) 1,324 1,307 1,303
Product group operations 456 467 137 475 652 738 3,805 6,255 6,998 10,003 10,829 12,055
Simandou iron ore project (m) – – – – – – 15 17 13 70 10 635
Evaluation projects/other – – 4 – – 1 41 41 38 33 25 763
Total Energy & Minerals 456 467 141 475 652 739 3,861 6,313 7,049 10,106 10,864 13,453 Other operations (n) 12 (35) (11) 26 32 34 (442) (328) 203 187 203 249 Product group total 5,279 4,691 3,355 4,622 4,980 5,269 45,742 50,611 50,923 43,026 42,925 47,652
Inter-segment transactions 129 206 142
Net assets/(liabilities) of disposal groups held for sale (r) 440 370 (7)
Other items 65 70 (46) 43 42 51 (2,880) (2,631) (2,181) 4,432 3,882 3,377
Less: equity accounted units (500) (417) (651) (650) (647) (526) – – – – – –
Total 4,844 4,344 2,658 4,015 4,375 4,794 43,431 48,556 48,877 47,458 46,807 51,029
Add back: Proceeds from disposal of property, plant and equipment 586 138 354
Total capital expenditure per cash flow statement 5,430 4,482 3,012
Less: Net cash/(debt) 255 (3,845) (9,587)
Less: EAU funded balances excluded from net debt – – –
Equity attributable to owners of Rio Tinto 43,686 44,711 39,290
Rio Tinto financial information by business unit continued
Annual report 2018 | riotinto.com250

Rio Tinto financial information by business unit
Notes to financial information by business unit
Business units are classified according to the Group’s management structure.
a) Gross sales revenue includes the sales revenue of equity accounted units on a proportionately consolidated basis (after adjusting for sales to subsidiaries) in addition to consolidated sales. Consolidated sales revenue includes subsidiary sales to equity accounted units which are not included in gross sales revenue.
b) EBITDA of subsidiaries and the Group’s share of EBITDA relating to equity accounted units represents profit before: tax, net finance items, depreciation and amortisation charged to the income statement in the period. Underlying EBITDA excludes the EBITDA impact of the same items that are excluded from underlying earnings.
c) Represents profit after tax for the period attributable to the owners of the Rio Tinto Group. Business unit earnings are stated before finance items but after the amortisation of discount related to provisions. Earnings attributed to business units do not include amounts that are excluded in arriving at underlying earnings.
d) Pilbara represents the Group’s 100% holding in Hamersley, 50% holding of Hope Downs Joint Venture and 65% holding of Robe River Iron Associates. The Group’s net beneficial interest in Robe River Iron Associates is 53%, as 30% is held through a 60% owned subsidiary and 35% is held through a 100% owned subsidiary.
e) Presented on an integrated operations basis, splitting activities between Bauxite & Alumina, Primary Metal, Pacific Aluminium and Other integrated operations (which reflect the results of the integrated production of aluminium) and other product group items which relate to other commercial activities.
f) Aluminium capital expenditure is reported net of US$508 million proceeds received on the sale of surplus land at Kitimat. These proceeds are not included in Aluminium’s free cash flow and the associated gain is excluded from business unit earnings and EBITDA.
g) Through a joint venture agreement with Freeport-McMoRan Inc. (Freeport), we were entitled to 40% of material mined above an agreed threshold as a consequence of expansions and developments of the Grasberg facilities since 1998 (until 21 December 2018). On 28 September 2018, we entered into a binding agreement to sell our entire interest in the Grasberg mine to PT Indonesia Asahan Aluminium (Persero) (Inalum). The sale completed on 21 December 2018.
h) Our interest in Oyu Tolgoi is held indirectly through our 50.8% investment in Turquoise Hill Resources Ltd (TRQ), where TRQ’s principal asset is its 66% investment in Oyu Tolgoi LLC, which owns the Oyu Tolgoi copper-gold mine.
i) Includes our interests in Argyle (100%) and Diavik (60%).
j) Includes our 82% interest in the Hail Creek coal mine (until 1 August 2018), our 80% interest in the Kestrel underground coal mine (until 1 August 2018) and interests in the Winchester South (until 1 June 2018) and Valeria development projects (until 1 August 2018).
On 1 June 2018, we sold our entire 75% interest in the Winchester South coal development project in Queensland, Australia, to Whitehaven Coal Limited for US$200 million.
On 1 August 2018, we sold our entire 82% interest in the Hail Creek coal mine and 71.2% interest in the Valeria coal development project in Queensland, Australia, to Glencore for US$1.7 billion.
On 1 August 2018, we sold our entire 80% interest in the Kestrel underground coal mine in Queensland, Australia, to a consortium comprising private equity manager EMR Capital (EMR) and PT Adaro Energy Tbk (Adaro), an Indonesian listed coal company, for US$2.25 billion.
On 1 September 2017, we sold our 100% shareholding in Coal & Allied Industries Limited to Yancoal Australia Limited for US$2.69 billion (before working capital adjustments).
Rio Tinto Coal Australia’s operating assets of US$(837) million at 31 December 2018 include provisions for onerous contracts in relation to rail infrastructure capacity and capital gains tax payable on the divestments announced in the year, partly offset by financial assets and receivables relating to contingent royalties and disposal proceeds.
k) Includes our interests in Rio Tinto Fer et Titane (100%), QIT Madagascar Minerals (QMM, 80%) and Richards Bay Minerals (attributable interest of 74%).
l) Includes our interests in Energy Resources of Australia (68.4%) and Rössing Uranium Limited (Rössing) (68.6%). On 26 November 2018, we entered into a binding agreement with China National Uranium Corporation Limited (CNUC) to sell our entire 68.6% interest in the Rössing mine in Namibia, subject to certain conditions.
m) Simfer Jersey Limited, a company incorporated in Jersey in which the Group has a 53% interest, has an 85% interest in Simfer S.A., the company that manages the Simandou project in Guinea. The Group therefore has a 45.05% indirect interest in Simfer S.A. These entities are consolidated as subsidiaries and together referred to as the Simandou iron ore project.
n) Other operations include our 100% interest in the curtailed Gove alumina refinery and Rio Tinto Marine.
o) Capital expenditure is the net cash outflow on purchases less sales of property, plant and equipment, capitalised evaluation costs and purchases less sales of other intangible assets. The details provided include 100% of subsidiaries’ capital expenditure and Rio Tinto’s share of the capital expenditure of joint operations and equity accounted units.
p) Operating assets of subsidiaries is comprised of net assets excluding post-retirement assets and liabilities, net of tax, and before deducting net debt. Operating assets are stated after the deduction of non-controlling interests – these are calculated by reference to the net assets of the relevant companies (ie inclusive of such companies’ debt and amounts due to or from Rio Tinto Group companies).
q) Capital expenditure in 2016 for Rio Tinto Coal Australia includes net proceeds of US$192 million for the sale of our 100% interest in the Mount Pleasant thermal coal project to MACH Energy Australia Pty Ltd on 5 August 2016.
r) Assets and liabilities held for sale at 31 December 2018 include our interest in Rössing Uranium Limited, the ISAL smelter, the Aluchemie anode plant, and the Alufluor aluminium fluoride plant.
Assets and liabilities held for sale at 31 December 2017 included our interest in the Dunkerque aluminium smelter and certain other separate assets.
Assets and liabilities held for sale at 31 December 2016 included our interests in the Blair Athol coal project and certain separate assets.
Annual report 2018 | riotinto.com 251
Financial statements

Financial statements
Australian Corporations Act – summary of ASIC relief
Pursuant to section 340 of the Australian Corporations Act 2001 (Corporations Act), the Australian Securities and Investments Commission issued an order dated 14 December 2015 that granted relief to Rio Tinto Limited from certain requirements of the Corporations Act in relation to its financial statements and associated reports. The order essentially continues the relief that has applied to Rio Tinto Limited since the formation of the Group’s dual listed companies (DLC) structure in 1995. The order applies to Rio Tinto Limited’s financial reporting obligations for the financial years and half-years ending between 31 December 2015 and 30 June 2020 inclusive.
In essence, instead of being required under the Corporations Act to prepare consolidated financial statements covering only itself and its controlled entities, the order allows Rio Tinto Limited to prepare consolidated financial statements in which it, Rio Tinto plc and their respective controlled entities are treated as a single economic entity. In addition, those consolidated financial statements are to be prepared: – in accordance with the principles and requirements of International
Financial Reporting Standards as adopted by the European Union (EU IFRS) rather than the Australian Accounting Standards (AAS) (except for one limited instance in the case of any concise report), and in accordance with UK financial reporting obligations generally;
– on the basis that the transitional provisions of International Financial Reporting Standard 1, First-time Adoption of International Financial Reporting Standards, should be applied using the combined financial statements previously prepared for Rio Tinto Limited, Rio Tinto plc and their respective controlled entities under Generally Accepted Accounting Principles in the United Kingdom, under which the DLC Merger between Rio Tinto Limited and Rio Tinto plc was accounted for using “merger”, rather than “acquisition”, accounting (reflecting that neither Rio Tinto Limited nor Rio Tinto plc was acquired by, or is controlled by, the other; and meaning that the existing carrying amounts, rather than fair values, of assets and liabilities at the time of the DLC Merger were used to measure those assets and liabilities at formation);
– on the basis that Rio Tinto Limited and Rio Tinto plc are a single company (with their respective shareholders being the shareholders in that single company); and
– with a reconciliation, from EU IFRS to AAS, of the following amounts: consolidated loss/profit for the financial year, total consolidated comprehensive loss/income for the financial year and total consolidated equity at the end of the financial year (see page 149).
Those consolidated financial statements must also be audited in relation to their compliance with relevant Australian and UK requirements. Rio Tinto Limited must also prepare a Directors’ report which satisfies the content requirements of the Corporations Act (applied on the basis that for these purposes the consolidated entity is the Group, and the consolidated financial statements cover the Group). This includes a Remuneration report (see pages 101 to 136) prepared in accordance with the requirements of the Corporations Act.
Rio Tinto Limited is also required to comply generally with the lodgement and distribution requirements of the Corporations Act (including timing requirements) in relation to those consolidated financial statements (including any concise financial statements), the Auditors’ report and the Directors’ report. The Corporations Act also requires that a non-binding resolution to adopt the Remuneration report be voted on by shareholders at Rio Tinto Limited’s annual general meeting.
Rio Tinto Limited is not required to prepare separate consolidated financial statements solely for it and its controlled entities. Rio Tinto Limited is also not required to prepare and lodge parent entity financial statements for itself in respect of each relevant financial year.
Rio Tinto Limited must, however, in accordance with the Corporations Act include in the consolidated financial statements for the Group, as a note, various parent entity information regarding Rio Tinto Limited (including in relation to assets, liabilities, shareholders’ equity, profit and loss, income, guarantees, contingent liabilities, and contractual commitments) prepared in accordance with AAS (see page 223).
Annual report 2018 | riotinto.com252

Directors’ declaration
The directors are responsible for preparing the Annual report, the Remuneration report and the financial statements in accordance with applicable law and regulations.
UK and Australian company law requires the directors to prepare financial statements for each financial year. Under UK law the directors have elected to prepare the Group financial statements in accordance with International Financial Reporting Standards (IFRSs) as adopted by the European Union (EU) and the Rio Tinto plc financial statements in accordance with United Kingdom Generally Accepted Accounting Practice (United Kingdom Accounting Standards and applicable law), including FRS 101 “Reduced disclosure framework”.
Under Australian law, the directors are also required to prepare certain Rio Tinto Limited parent company financial statements in accordance with Australian Accounting Standards (AAS). In preparing the Group financial statements, the directors have also elected to comply with IFRSs, issued by the International Accounting Standards Board (IASB).
Under UK and Australian company law the directors must not approve the financial statements unless they are satisfied that they give a true and fair view of the state of affairs of the Group and the companies as at the end of the financial year, and of the profit or loss of the companies and Group for the period (as applicable).
In preparing these financial statements, the directors are required to: – select suitable accounting policies and apply them consistently; – make judgments and estimates that are reasonable and prudent; – state whether IFRSs as adopted by the EU, applicable UK Accounting
Standards and AAS have been followed, subject to any material departures disclosed and explained in the Group and parent company financial statements respectively; and
– prepare the financial statements on the going concern basis unless it is inappropriate to presume that the Group and the companies will continue in business.
The directors are responsible for keeping adequate accounting records that are sufficient to show and explain the transactions of the companies and the Group and disclose with reasonable accuracy at any time the financial position of the companies and the Group and enable them to ensure that: – the Group financial statements comply with the UK Companies Act 2006,
the Australian Corporations Act 2001 as amended by the Australian Securities and Investments Commission Order dated 14 December 2015 and Article 4 of the IAS Regulation;
– the Rio Tinto plc financial statements comply with the UK Companies Act 2006;
– the Rio Tinto Limited parent company disclosures comply with the Corporations Act as amended by the Australian Securities and Investments Commission Order dated 14 December 2015; and
– the Remuneration report complies with the UK Companies Act 2006 and the Australian Corporations Act 2001 as amended by the Australian Securities and Investments Commission Order dated 14 December 2015.
The directors are also responsible for safeguarding the assets of the Companies and the Group and hence for taking reasonable steps for the prevention and detection of fraud and other irregularities.
The directors are responsible for the maintenance and integrity of the Group’s website. Legislation governing the preparation and dissemination of financial statements may differ between jurisdictions in which the Group reports.
Each of the current directors, whose names and function are listed on pages 76 to 77 in the Governance section, confirm that, to the best of their knowledge: – the Rio Tinto Group financial statements and notes, which have been
prepared in accordance with IFRS as adopted by the EU, the Australian Corporations Act 2001 as amended by the Australian Securities and Investments Commission Order dated 14 December 2015, the UK Companies Act 2006 and Article 4 of the IAS Regulation, give a true and fair view of the assets, liabilities, financial position and profit of the Group;
– the Rio Tinto plc financial statements and notes, which have been prepared in accordance with United Kingdom Generally Accepted Accounting Practice give a true and fair view of the assets, liabilities, financial position and profit of the company;
– the Rio Tinto Limited parent company disclosures, which have been prepared in accordance with the AAS and Australian Corporations Act 2001 as amended by the Australian Securities and Investments Commission Order dated 14 December 2015, give a true and fair view of the assets, liabilities, financial position and profit of the company;
– the Strategic report section of the Annual report include a fair review of the development and performance of the business and the position of the Group, together with a description of the principal risks and uncertainties that it faces; and
– there are reasonable grounds to believe that each of the Rio Tinto Group, Rio Tinto plc and Rio Tinto Limited will be able to pay its debts as and when they become due and payable.
The directors have been given the declarations by the chief executive and chief financial officer required by section 295A of the Australian Corporations Act 2001 as amended by the Australian Securities and Investments Commission Order dated 14 December 2015.
Disclosure of information to auditorsThe directors in office at the date of this report have each confirmed that: – so far as they are aware, there is no relevant audit information of which
the Group’s auditors are unaware; and – they have taken all the steps that they ought to have taken as a director
to make themselves aware of any relevant audit information and to establish that the Group’s auditors are aware of that information.
This declaration is made in accordance with a resolution of the board.
Directors’ declarationDirectors’ statement of responsibilities in relation to the Group financial statements, Rio Tinto plc financial statements and Rio Tinto Limited financial statements
Simon ThompsonChairman27 February 2019
Jean-Sébastien JacquesChief executive27 February 2019
Jakob StausholmChief financial officer27 February 2019
Annual report 2018 | riotinto.com 253
Financial statements
Financial statements
As lead auditor for the audit of Rio Tinto Limited for the year ended 31 December 2018, I declare that to the best of my knowledge and belief, there have been:
(a) no contraventions of the auditor independence requirements of the Corporations Act 2001 in relation to the audit; and
(b) no contraventions of any applicable code of professional conduct in relation to the audit.
This declaration is in respect of Rio Tinto Limited and the entities it controlled during the period.
Debbie SmithPartnerPricewaterhouseCoopers Brisbane 27 February 2019
Liability limited by a scheme approved under Professional Standards Legislation
Auditor’s independence declaration
Annual report 2018 | riotinto.com254

Independent auditors’ report
Independent auditors’ reportof PricewaterhouseCoopers LLP to the members of Rio Tinto plc and of PricewaterhouseCoopers to the members of Rio Tinto Limited
For the purpose of this report, the terms “we” and “our” denote PricewaterhouseCoopers LLP in relation to UK legal, professional and regulatory responsibilities and reporting obligations to the members of Rio Tinto plc and PricewaterhouseCoopers in relation to Australian legal, professional and regulatory responsibilities and reporting obligations to the members of Rio Tinto Limited. For the purposes of the table on pages 257 to 258 that sets out the key audit matters and how our audit addressed the key audit matters, the terms “we” and “our” refer to PricewaterhouseCoopers LLP and/or PricewaterhouseCoopers and/or our component teams. The Group financial statements, as defined below, consolidate the accounts of Rio Tinto plc and Rio Tinto Limited and their respective subsidiaries (the “Group”) and include the Group’s share of joint arrangements and associates. The “Parent Companies” are defined as Rio Tinto plc and Rio Tinto Limited.
The relevant legislation governing the Parent Companies is the United Kingdom Companies Act 2006 (“Companies Act 2006”) for Rio Tinto plc and the Australian Corporations Act 2001 (“Corporations Act 2001”) as amended by the ASIC order dated 14 December 2015 (the “ASIC Order”) for Rio Tinto Limited.
Report on the audit of the financial statements and the financial report
OpinionOpinion of PricewaterhouseCoopers LLP on the financial statements to the members of Rio Tinto plc
In our opinion: – the financial statements, defined below, give a true and fair view of the
state of the Group’s and of Rio Tinto plc’s affairs as at 31 December 2018 and of the Group’s profit and cash flows for the year then ended;
– the Group financial statements have been properly prepared in accordance with International Financial Reporting Standards (“IFRSs”) as adopted by the European Union;
– the Rio Tinto plc financial statements have been properly prepared in accordance with United Kingdom Generally Accepted Accounting Practice (United Kingdom Accounting Standards, comprising FRS 101 “Reduced Disclosure Framework”, and applicable law); and
– the financial statements have been prepared in accordance with the requirements of the Companies Act 2006 and, as regards the Group financial statements, Article 4 of the IAS Regulation.
PricewaterhouseCoopers LLP’s opinion is consistent with our reporting to the Audit Committee.
Separate opinion of PricewaterhouseCoopers LLP in relation to financial statements prepared in accordance with IFRSs as issued by the International Accounting Standards Board (“IASB”)As explained in note 1 to the financial statements, the Group, in addition to applying IFRSs as adopted by the European Union, has also applied IFRSs as issued by the IASB.
In our opinion, the Group financial statements have been properly prepared in accordance with IFRSs as issued by the IASB.
Opinion of PricewaterhouseCoopers on the financial report to the members of Rio Tinto Limited
In our opinion:The accompanying financial report, defined below, is in accordance with the Corporations Act 2001 as amended by the ASIC Order, including:
– giving a true and fair view of the Group’s financial position as at 31 December 2018 and of its financial performance for the year then ended; and
– complying with Australian Accounting Standards and the Corporations Regulations 2001.
What we have auditedThe Group financial statements (as defined below) and the Rio Tinto plc financial statements (as defined below) are referred to in this report as the “financial statements”. The Group financial statements, note 46 “Rio Tinto Limited parent company disclosures” and the Directors’ declaration on page 253 are collectively referred to in this report as the “financial report”.
PricewaterhouseCoopers LLP has audited the financial statements for the year ended 31 December 2018.
PricewaterhouseCoopers has audited the Reconciliation with Australian Accounting Standards, the Remuneration report included in the Directors’ report and the financial report for the year ended 31 December 2018.
The Group financial statements, included within the Annual report and Accounts (the “Annual report”), comprise: the Group balance sheet as at 31 December 2018; the Group income statement and Group statement of comprehensive income for the year then ended; the Group cash flow statement for the year then ended; the Group statement of changes in equity for the year then ended; notes 1–45 and 47 to the Group financial statements, which include a description of the significant accounting policies and other explanatory information; the outline of dual listed companies structure and basis of financial statements; and the Rio Tinto financial information by business unit.
The Rio Tinto plc financial statements, included within the Annual report, comprise: the Rio Tinto plc Company balance sheet as at 31 December 2018; the Rio Tinto plc Company statement of changes in equity for the year then ended; and notes A-I to the Rio Tinto plc financial statements, which include a description of the significant accounting policies and other explanatory information.
Basis for opinionWe conducted our audit in accordance with International Standards on Auditing (UK) (“ISAs (UK)”), Australian Auditing Standards (“ASAs”) and applicable law. Our responsibilities under those standards are further described in the Auditors’ responsibilities for the audit of the financial statements and financial report section of our report. We believe that the audit evidence we have obtained is sufficient and appropriate to provide a basis for our opinion.
Independence PricewaterhouseCoopers LLP remained independent of the Group in accordance with the ethical requirements that are relevant to our audit of the financial statements in the UK, which includes the FRC Ethical Standard, as applicable to listed public interest entities, and we have fulfilled our other ethical responsibilities in accordance with these requirements. To the best of our knowledge and belief, we declare that non-audit services prohibited by the FRC’s Ethical Standard were not provided to the Group or Rio Tinto plc. Other than those disclosed in note 39 to the financial statements, we have provided no non-audit services to the Group or Rio Tinto plc in the period from 1 January 2018 to 31 December 2018.
PricewaterhouseCoopers remained independent of the Group in accordance with the auditor independence requirements of the Corporations Act 2001 and the ethical requirements of the Accounting Professional and Ethical Standards Board’s APES 110 Code of Ethics for Professional Accountants (“APES 110”) that are relevant to our audit of the financial report in Australia. We have also fulfilled our other ethical responsibilities in accordance with APES 110.
Annual report 2018 | riotinto.com 255
Financial statements
Financial statements
Independent auditors’ reportof PricewaterhouseCoopers LLP to the members of Rio Tinto plc and of PricewaterhouseCoopers to the members of Rio Tinto Limited continued
Our audit approachThe Group’s principal activities are minerals and metals exploration, development, production and processing. The Group operates through four product groups which are supported by the Growth & Innovation group and other centralised functions. Together these comprise 48 business units containing multiple reporting units.
Overview
Materiality Overall Group materiality: US$350 million (2017: US$350 million). Overall Rio Tinto plc materiality: US$325 million (2017: US$325 million)
Scope We identified the Pilbara business unit as a significant component which required an audit of its complete financial information due to its financial significance to the Group.
Aside from Pilbara, we obtained full scope reporting from a further 21 reporting units (2017: 21). Specific audit procedures on certain balances and transactions were performed at a further 20 reporting units (2017: 16), which comprised 11 (2017: ten) operating reporting units and nine (2017: six) central reporting units, such as treasury entities.
Key audit matters We assessed the risks of material misstatement in the financial statements and the financial report and determined the following key audit matters for 2018: – assessment of indicators of impairment/reversal of impairment of intangible assets and property, plant and equipment; – provisions for close-down, restoration and environmental obligations; and – provisions for uncertain tax positions, with a particular focus on transfer pricing of certain transactions with the Group’s
commercial centre in Singapore.
The scope of our audit and our key audit mattersAs part of designing our audit, we determined materiality and assessed the risks of material misstatement in the financial statements and the financial report. In particular, we looked at where the directors made subjective judgments, for example in respect of significant accounting estimates that involved making assumptions and considering future events that are inherently uncertain.
Capabilities of the audit in detecting irregularities, including fraudBased on our understanding of the Group we identified that the principal risks of non-compliance with laws and regulations related to breaches of safety and environmental regulations and unethical and prohibited business practices. We considered the extent to which non-compliance may have a material effect on the financial statements and the financial report. We also considered those laws and regulations that have a direct impact on the financial statements and financial report such as the Companies Act 2006, the Corporations Act 2001, the UK Listing Rules and the Listing Rules of the Australian Stock Exchange.
We evaluated management’s incentives and opportunities for fraudulent manipulation of the financial statements and the financial report (including the risk of override of controls), and determined that the principal risks were related to posting inappropriate journal entries to overstate revenue or understate expenditure, and management bias in accounting estimates. The Group engagement team shared this risk assessment with the component auditors referred to in the scoping section of our report below, so that they could include appropriate audit procedures in response to such risks in their work. Audit procedures performed by the Group engagement team and/or component auditors included:
– discussions with management, Group Internal Audit, Ethics & Integrity and the Group’s legal advisers, including consideration of known or suspected instances of non-compliance with laws and regulations and fraud;
– evaluation and testing of the operating effectiveness of management’s controls designed to prevent and detect irregularities;
– assessment of matters reported through the Group’s whistleblowing programme and the results of management’s investigation of such matters;
– challenging assumptions and judgments made by management in its significant accounting estimates;
– identifying and testing journal entries, in particular any journal entries posted with unusual account combinations.
There are inherent limitations in the audit procedures described above. We are less likely to become aware of instances of non-compliance with laws and regulations that are not closely related to events and transactions reflected in the financial statements and financial report. Also, the risk of not detecting a material misstatement due to fraud is higher than the risk of not detecting one resulting from error, as fraud may involve deliberate concealment by, for example, forgery or intentional misrepresentations, or through collusion.
We did not identify any key audit matters relating to irregularities, including fraud.
Key audit matters are those matters that, in the auditors’ professional judgement, were of most significance in the audit of the financial statements and financial report of the current period and include the most significant assessed risks of material misstatement (whether or not due to fraud) identified by the auditors, including those which had the greatest effect on: the overall audit strategy; the allocation of resources in the audit; and directing the efforts of the engagement team. These matters, and any comments we make on the results of our procedures thereon, were addressed in the context of our audit of the financial statements and the financial report as a whole, and in forming our opinions thereon, and we do not provide a separate opinion on these matters. This is not a complete list of all risks identified by our audit. We note that there are no key audit matters specifically applicable to Rio Tinto plc.
Annual report 2018 | riotinto.com256

Independent auditors’ report
Key audit matter How our audit addressed the key audit matter
Assessment of indicators of impairment/reversal of impairmentThe Group has finite-lived intangible assets totaling US$1,095 million and property, plant and equipment of US$56,361 million as at 31 December 2018. Impairment charges to both of these asset categories have been recognised in previous years.
The determination of whether an impairment or impairment reversal trigger exists can be judgemental. Management must determine the recoverable amount for finite-lived intangible assets and property, plant and equipment when impairment indicators or indicators of impairment reversal are identified.
The determination of recoverable amount, being the higher of value-in-use (“VIU”) and fair value less costs of disposal (“FVLCD”), requires judgement and estimation on the part of management in identifying and then determining the recoverable amount for the relevant CGUs. Recoverable amounts are based on management’s view of key internal value driver inputs and external market conditions such as future commodity prices, the timing and approval of future capital and operating expenditure, and the most appropriate discount rate.
The CGU where we focussed our procedures was Oyu Tolgoi. Management observed a deterioration in some internal and external indicators of value for the Oyu Tolgoi CGU and therefore prepared an assessment of the recoverable amount. It concluded that no impairment loss had occurred.
Refer to note 6 for management’s conclusions and the Audit Committee’s views set out on page 91.
For material property, plant and equipment and finite-lived intangible assets we undertook the following to test management’s assessment for indicators of impairment/impairment reversal: – satisfied ourselves as to the appropriateness of management’s
identification of the Group’s CGUs and the continued satisfactory operation of the Group’s key controls over the impairment assessment process; and
– evaluated management’s assessment of impairment indicators, as well as indicators of impairment reversal, including the conclusions reached.
In addition, specifically for the Oyu Tolgoi CGU, we: – tested management’s determination of the recoverable amount of the
Oyu Tolgoi CGU, prepared using the FVLCD methodology, which included the assessment of the reasonableness of key inputs into the valuation such as the discount rate and future copper price. For the discount rate, this included our valuations experts independently calculating a discount rate and comparing it with management’s own calculation;
– understood the impact of the latest life of mine plan assumptions and assessed the competence and objectivity of management’s internal technical experts in preparing this plan;
– verified the integrity of formulae and mathematical accuracy of management’s valuation model;
– considered the current project status and the length of time remaining to complete the underground mine and related uncertainties; and
– satisfied ourselves that management’s conclusion that no impairment loss had occurred is supportable and validated the appropriateness of the related disclosures in note 6 to the financial statements.
Based on the procedures performed, we noted no material issues from our work.
Provisions for close-down, restoration and environmental obligationsThe Group has provisions for close-down, restoration and environmental obligations of US$9,975 million as at 31 December 2018.
The calculation of these provisions requires management to estimate the quantum and timing of future costs, particularly given the unique nature of each site, the long timescales involved and the potential associated obligations. These calculations also require management to determine an appropriate rate to discount future costs to their net present value.
There are limited restoration and rehabilitation activity and historical precedent against which to benchmark estimates of future costs.
Management reviews the close-down, restoration and environmental obligations on an annual basis, using experts to provide support in its assessment where appropriate. This review incorporates the effects of any changes in local regulations and management’s anticipated approach to restoration and rehabilitation.
As at 31 December 2018, the total provision held on the balance sheet has decreased from US$9,983 million to US$9,975 million.
Refer to notes 2 and 26, and the Audit Committee’s views set out on page 91.
We assessed management’s process for the review of closure provisions, and performed detailed testing for reporting units that recorded a movement in their closure provision in the year, or a closure provision as at 31 December 2018, that was above the respective individual component’s materiality level.
As part of our detailed testing of the cost estimates prepared by management, we established the existence of legal and/or constructive obligations with respect to the closure provision and considered the intended method of restoration and rehabilitation and associated cost estimate.
We also considered the competence and objectivity of management’s experts, whether internal or external to the Group, who produced the cost estimates and, where we considered it appropriate, engaged our own internal expert to assess the work performed by management’s experts.
We checked the mathematical accuracy of management’s calculations and assessed the appropriateness of the discount rate using our valuations experts.
Annual report 2018 | riotinto.com 257
Financial statements
Financial statements
Independent auditors’ reportof PricewaterhouseCoopers LLP to the members of Rio Tinto plc and of PricewaterhouseCoopers to the members of Rio Tinto Limited continued
Key audit matter How our audit addressed the key audit matter
Provisions for close-down, restoration and environmental obligations continued
In addition to the overall response to the risk described above, we performed additional procedures in respect of the largest increase in obligations during the year:
– read the latest available technical studies and assessed the appropriateness of the scope of work performed by management and the various third party experts; and
– considered whether the updates in provisions reflect changes to previous estimates or the correction of prior period errors.
For the reporting units in scope that did not have a movement in the year, or a closure provision as at 31 December 2018, that was above the respective individual component’s materiality level we considered whether the provision relating to close-down, restoration and environmental obligations was consistent with our understanding of the obligations associated with the operation and the remediation plans.
We considered the appropriateness of the related disclosures in notes 2 and 26 to the financial statements.
Based on the procedures performed, we noted no material issues from our work.
Provisions for uncertain tax positions The Group operates across a large number of jurisdictions and is subject to periodic challenges by local tax authorities on a range of tax matters during the normal course of business, including transfer pricing, indirect taxes and transaction related tax matters.
As at 31 December 2018, the Group has current and non-current taxes payable of US$2,190 million. Where the amount of tax payable is uncertain, the Group establishes provisions based on management’s best estimate of the most likely outcome.
In relation to specific uncertain tax positions, we focussed on matters relating to the transfer pricing of certain transactions between the Group’s entities based in Australia and the Group’s commercial centre in Singapore. Over the past financial year, the Group has been in continued discussions with the Australian Taxation Office on these matters.
Refer to notes 2 and 9, and the Audit Committee’s views set out on page 91.
We assessed management’s process for identifying uncertain tax positions and the related accounting policy of providing for tax exposures. We engaged our tax specialists to understand the current status of tax assessments and investigations and to monitor developments in ongoing disputes. We read recent rulings and correspondence with local tax authorities, as well as external advice received by the Group where relevant, to satisfy ourselves that the tax provisions had been appropriately recorded or adjusted to reflect the latest external developments.
In addition to our overall response to the risk described above, we performed procedures in respect of the Group’s Singapore commercial centre as follows: – read the latest available correspondence between management and
the relevant tax authorities and expert reports to assess the continued appropriateness of the provision recognised by management;
– checked the mathematical accuracy of management’s provision calculations and agreed relevant input data to supporting records; and
– engaged our experts in the field of transfer pricing to evaluate the basis on which the provision has been determined.
Based on the procedures performed, we determined the provision reflects management’s current best estimate of the expected economic outflow.
We considered the appropriateness of the related disclosures in notes 2 and 9 to the financial statements.
Based on the procedures performed, we noted no material issues arising from our work.
Annual report 2018 | riotinto.com258

Independent auditors’ report
How we tailored the audit scopeAs the Group engagement team, we tailored the scope of our audit to ensure that we performed enough work to be able to give opinions on the financial statements and the financial report as a whole, taking into account the geographical structure of the Group, the accounting processes and controls, and the industry in which the Group operates.
The Group is organised into four product groups – Aluminium, Copper & Diamonds, Energy & Minerals and Iron Ore, all of which are supported by the Growth & Innovation group and other centralised functions. Each product group is made up of a number of operating businesses which represent separate business units. Each business unit is comprised of individual reporting units which align to discrete operations. The Group financial statements are a consolidation of reporting units, comprising the Group’s operating businesses and centralised functions. We determined the appropriate reporting units to perform work based on factors such as the size of the balances, the key audit matters as noted above and known accounting matters, and to include unpredictability in our audit procedures.
In establishing the overall approach to the Group audit, we determined the type of work that needed to be performed at reporting units by us, as the Group engagement team, or component auditors from either other PwC network firms or non-PwC firms operating under our instruction.
We identified the Pilbara reporting unit as a significant component (as defined within ISAs (UK) and ASAs) which, in our view, required an audit of its complete financial information, due to its financial significance to the Group. Outside of the Pilbara reporting unit, we obtained full scope reporting from a further 21 reporting units (2017: 21). Specific audit procedures on certain balances and transactions were performed at a further 20 reporting units (2017: 16), which comprised 11 (2017: ten) operating reporting units and nine (2017: six) central reporting units, such as treasury entities, primarily to ensure appropriate audit coverage.
As we seek to vary our audit procedures each year to ensure an element of unpredictability, three different smaller reporting units (2017: two) were included in our Group audit scope for 2018. We also performed work centrally on IT general controls, journals, taxation and pensions.
Where work was performed by component auditors, we determined the level of involvement we needed to have in the audit work at those reporting units to be able to conclude whether sufficient appropriate audit evidence had been obtained as a basis for our opinions on the Group financial statements and financial report as a whole.
We issued formal written instructions to all component auditors setting out the audit work to be performed by each of them and maintained regular communication with the component auditors throughout the audit cycle. These interactions included attending certain component clearance meetings and holding regular conference calls, as well as reviewing and assessing any matters reported. The Group engagement team also reviewed selected audit working papers for certain component teams.
In addition, senior members of the Group engagement team visited component teams across all four product groups in Australia, Canada, Chile, Mongolia, Singapore and the United States of America. These visits included meetings with local management and with the component auditors, and typically operating site tours.
Annual report 2018 | riotinto.com 259
Financial statements

Financial statements
Independent auditors’ reportof PricewaterhouseCoopers LLP to the members of Rio Tinto plc and of PricewaterhouseCoopers to the members of Rio Tinto Limited continued
MaterialityThe scope of our audit was influenced by our application of materiality. We set certain quantitative thresholds for materiality. These, together with qualitative considerations, helped us to determine the scope of our audit and the nature, timing and extent of our audit procedures on the individual financial statement line items and disclosures and to evaluate the effect of misstatements, both individually and in aggregate, on the financial statements and the financial report as a whole.
Based on our professional judgment, we determined materiality for the financial statements and the financial report as a whole as follows:
Overall materiality Overall Group materiality US$350 million (2017: US$350 million).
Overall Rio Tinto plc materiality: US$325 million (2017: US$325 million).
How we determined it For overall Group materiality we used an average of underlying earnings before tax (as defined in note 2 to the financial statements) of the current and previous three years (2017: average underlying earnings before tax of the then current year and previous three years).
For overall Rio Tinto plc materiality we used total assets as a basis for determining materiality.
Rationale for benchmark applied
For overall Group materiality, we chose to use an underlying earnings measure as the benchmark because an underlying measure removes the impact of material items which do not recur from year to year or otherwise significantly affect the underlying trend of performance from continuing operations. This is the metric against which the performance of the Group is most commonly assessed by management and reported to members.
Our approach to determine materiality is based on a four year average of profit before tax adjusted for items excluded from underlying earnings. The adoption of a multi-year average benchmark for materiality responds to longer-term trends in commodity markets and reduces volatility in the measure year-on-year. Using our professional judgment, we determined materiality for this year at US$350 million, which equates to approximately 2.8% of the current year’s underlying earnings before tax.
For overall Rio Tinto plc materiality we determined our materiality based on total assets, which is more applicable than a performance-related measure as the company is an investment holding company for the Group. Using our professional judgment, we determined materiality for this year at US$325 million, which equates to approximately 0.7% of the current year’s total assets.
Component materiality
For each reporting unit (component) in our audit scope, we allocated a materiality that was less than our overall Group materiality. The materiality allocated to each component was between US$15 million and US$320 million (2017: US$15 million and US$320 million).
We agreed with the Audit Committee that we would report to them misstatements identified during our audit above US$25 million (2017: US$25 million) as well as misstatements below those amounts that, in our view, warranted reporting for qualitative reasons.
Going concern
Reporting obligationIn accordance with ISAs (UK) we report as follows:
We are required to report to you if we have anything material to add or to draw attention to in respect of the directors’ statement about whether they considered it appropriate to adopt the going concern basis of accounting in preparing the financial statements and the directors’ identification of any material uncertainties to the Group’s and Rio Tinto plc’s ability to continue as a going concern over a period of at least twelve months from the date of the approval of the financial statements. We have nothing material to add or draw attention to. However, because not all future events or conditions can be predicted, this statement is not a guarantee as to the Group’s and Rio Tinto plc’s ability to continue as a going concern. For example, the terms on which the United Kingdom may withdraw from the European Union, which is currently due to occur on 29 March 2019, are not clear, and it is difficult to evaluate all of the potential implications to the Group’s and Rio Tinto plc’s trade, customers, suppliers and the wider economy.
We are also required to report if the directors’ statement relating to going concern in accordance with Listing Rule 9.8.6R(3) is materially inconsistent with our knowledge obtained in the audit. We have nothing to report.
In accordance with ASAs:
We are required to conclude on the appropriateness of the directors' use of the going concern basis of accounting and, based on the audit evidence obtained, whether a material uncertainty exists related to events or conditions that may cast significant doubt on the Group’s ability to continue as a going concern. If we conclude that a material uncertainty exists, we are required to draw attention in our auditor’s report to the related disclosures in the financial report or, if such disclosures are inadequate, to modify our opinion. Our conclusions are based on the audit evidence obtained up to the date of our auditor’s report. However, future events or conditions may cause the Group to cease to continue as a going concern.
Annual report 2018 | riotinto.com260
Independent auditors’ report
Reporting on other information – PricewaterhouseCoopers LLPThe other information comprises all of the information in the Annual report other than the financial statements and our auditors’ report thereon. The directors are responsible for the other information. Our opinion on the financial statements does not cover the other information and, accordingly, we do not express an audit opinion or, except to the extent otherwise explicitly stated in this report, any form of assurance thereon.
In connection with our audit of the financial statements, our responsibility is to read the other information and, in doing so, consider whether the other information is materially inconsistent with the financial statements or our knowledge obtained in the audit, or otherwise appears to be materially misstated. If we identify an apparent material inconsistency or material misstatement, we are required to perform procedures to conclude whether there is a material misstatement of the financial statements or a material misstatement of the other information. If, based on the work we have performed, we conclude that there is a material misstatement of this other information, we are required to report that fact. We have nothing to report based on these responsibilities.
With respect to the Strategic report and the Directors’ report, we also considered whether the disclosures required by the Companies Act 2006 have been included.
Based on the responsibilities described above and our work undertaken in the course of the audit, the Companies Act 2006 (CA06), ISAs (UK) and the Listing Rules of the Financial Conduct Authority (FCA) require us also to report certain opinions and matters as described below (required by ISAs (UK) unless otherwise stated).
Strategic report and Directors’ report
In our opinion, based on the work undertaken in the course of the audit, the information given in the Strategic report and the Directors’ report for the year ended 31 December 2018 is consistent with the financial statements and has been prepared in accordance with applicable legal requirements. (CA06)
In light of the knowledge and understanding of the Group and Rio Tinto plc and their environment obtained in the course of the audit, we did not identify any material misstatement in the Strategic report and Directors’ report. (CA06)
The directors’ assessment of the prospects of the Group and of the principal risks that would threaten the solvency or liquidity of the Group
We have nothing material to add or draw attention to regarding: – The directors’ confirmation on page 65 of the Annual report that they have carried out a robust assessment of the principal risks facing the Group,
including those that would threaten its business model, future performance, solvency or liquidity. – The disclosures in the Annual report that describe those risks and explain how they are being managed or mitigated. – The directors’ explanation on page 65 of the Annual report as to how they have assessed the prospects of the Group, over what period they have
done so and why they consider that period to be appropriate, and their statement as to whether they have a reasonable expectation that the Group will be able to continue in operation and meet its liabilities as they fall due over the period of their assessment, including any related disclosures drawing attention to any necessary qualifications or assumptions.
We have nothing to report having performed a review of the directors’ statement that they have carried out a robust assessment of the principal risks facing the Group and statement in relation to the longer-term viability of the Group. Our review was substantially less in scope than an audit and only consisted of making inquiries and considering the directors’ process supporting their statements; checking that the statements are in alignment with the relevant provisions of the UK Corporate Governance Code (the “Code”); and considering whether the statements are consistent with the knowledge and understanding of the Group and Rio Tinto plc and their environment obtained in the course of the audit. (Listing Rules)
Other Code provisions
We have nothing to report in respect of our responsibility to report when: – The statement given by the directors, on page 140, that they consider the Annual report taken as a whole to be fair, balanced and understandable,
and provides the information necessary for members to assess the Group’s and Rio Tinto plc’s position and performance, business model and strategy, is materially inconsistent with our knowledge of the Group and Rio Tinto plc acquired in the course of performing our audit.
– The section of the Annual report on page 91 describing the work of the Audit Committee does not appropriately address matters communicated by us to the Audit Committee.
– The directors’ statement relating to Rio Tinto plc’s compliance with the Code does not properly disclose a departure from a relevant provision of the Code specified, under the Listing Rules, for review by the auditors.
Directors’ remunerationIn our opinion, the part of the Remuneration report to be audited has been properly prepared in accordance with the Companies Act 2006. (CA06)
Annual report 2018 | riotinto.com 261
Financial statements

Financial statements
Independent auditors’ reportof PricewaterhouseCoopers LLP to the members of Rio Tinto plc and of PricewaterhouseCoopers to the members of Rio Tinto Limited continued
Reporting on other information – PricewaterhouseCoopersThe directors are responsible for the other information. The other information comprises the information included in the Annual report for the year ended 31 December 2018, but does not include the financial report and our auditors’ report thereon.
Our opinion on the financial report does not cover the other information and accordingly we do not express any form of assurance conclusion thereon.
In connection with our audit of the financial report, our responsibility is to read the other information and, in doing so, consider whether the other information is materially inconsistent with the financial report or our knowledge obtained in the audit, or otherwise appears to be materially misstated.
If, based on the work we have performed, we conclude that there is a material misstatement of this other information, we are required to report that fact. We have nothing to report in this regard.
Remuneration reportRemuneration report – Corporations Act 2001 opinionUnder the Corporations Act 2001 (in respect of Rio Tinto Limited) we are required to express an opinion on the Remuneration report based on our audit conducted in accordance with ASAs.
Opinion on the Remuneration reportWe have audited the Remuneration report included on pages 106 to 136 of the Directors’ report for the year ended 31 December 2018.
In our opinion, the Remuneration report of Rio Tinto Limited complies with the requirements of section 300A of the Corporations Act 2001 as amended by the ASIC Order.
Responsibilities The directors of Rio Tinto Limited are responsible for the preparation and presentation of the Remuneration report in accordance with section 300A of the Corporations Act 2001 as amended by the ASIC Order.
Our responsibility is to express an opinion on the Remuneration report, based on our audit conducted in accordance with ASAs.
Responsibilities for the financial statements, the financial report and the auditResponsibilities of the directors for the financial statements and financial reportAs explained more fully in the Directors’ statement of responsibilities set out on page 253, the directors are responsible for the preparation of the financial statements and the financial report in accordance with the applicable financial reporting frameworks and for being satisfied that they give a true and fair view. The directors are also responsible for such internal control as they determine is necessary to enable the preparation of financial statements and the financial report that are free from material misstatement, whether due to fraud or error.
In preparing the financial statements and financial report, the directors are responsible for assessing the Group’s and Parent Companies’ ability to continue as a going concern, disclosing as applicable matters related to going concern and using the going concern basis of accounting unless the directors either intend to liquidate the Group or the Parent Companies or to cease operations, or have no realistic alternative but to do so.
Auditors’ responsibilities for the audit of the financial statements and financial reportOur objectives are to obtain reasonable assurance about whether the financial statements and financial report as a whole are free from material misstatement, whether due to fraud or error, and to issue an auditors’ report that includes our opinion. Reasonable assurance is a high level of assurance, but is not a guarantee that an audit conducted in accordance with ISAs (UK) and ASAs will always detect a material misstatement when it exists. Misstatements can arise from fraud or error and are considered material if, individually or in the aggregate, they could reasonably be expected to influence the economic decisions of users taken on the basis of these financial statements or financial report.
A further description of PricewaterhouseCoopers LLP’s responsibilities for the audit of the financial statements is located on the FRC’s website at: www.frc.org.uk/auditors. A further description of PricewaterhouseCoopers’ responsibilities for the audit of the financial report is located on the Auditing and Assurance Standards Board website at: http://www.auasb.gov.au/auditors_responsibilities/ar1.pdf. The descriptions on these websites form part of the auditors’ report for PricewaterhouseCoopers LLP and PricewaterhouseCoopers respectively.
Use of this reportThis report, including the opinions, has been prepared for and only for the members of Rio Tinto plc and Rio Tinto Limited as a body in accordance with Chapter 3 of Part 16 of the Companies Act 2006 (in respect of Rio Tinto plc) and the Corporations Act 2001 as amended by the ASIC Order (in respect of Rio Tinto Limited) and for no other purpose. We do not, in giving these opinions, accept or assume responsibility for any other purpose or to any other person to whom this report is shown or into whose hands it may come save where expressly agreed by our prior consent in writing.
Annual report 2018 | riotinto.com262

Independent auditors’ report
Other required reporting – PricewaterhouseCoopers LLPCompanies Act 2006 exception reportingUnder the Companies Act 2006 we are required to report to you if, in our opinion: – we have not received all the information and explanations we require for
our audit; or – adequate accounting records have not been kept by Rio Tinto plc, or
returns adequate for our audit have not been received from branches not visited by us; or
– certain disclosures of directors’ remuneration specified by law are not made; or
– the Rio Tinto plc financial statements and the part of the Remuneration report to be audited are not in agreement with the accounting records and returns.
We have no exceptions to report arising from this responsibility.
Appointment – PricewaterhouseCoopers LLP and PricewaterhouseCoopersPricewaterhouseCoopers LLP and PricewaterhouseCoopers have acted as auditors of Rio Tinto since its formation under a dual listed company structure in 1995.
A predecessor firm of PricewaterhouseCoopers LLP was appointed by the members of a predecessor company of Rio Tinto plc on 8 May 1958 to audit the financial statements for the year ended 31 May 1958 and subsequent financial periods. The period of total uninterrupted engagement is 61 years, covering the years ended 31 May 1958 to 31 December 2018.
A predecessor firm of PricewaterhouseCoopers was appointed by the members of a predecessor company of Rio Tinto Limited on 31 December 1959 to audit the financial statements for the year ended 31 December 1959 and subsequent financial periods. The period of total uninterrupted engagement is 60 years, covering the years ended 31 December 1959 to 31 December 2018.
Debbie Smith Partnerfor and on behalf of PricewaterhouseCoopers
Brisbane, Australia27 February 2019
Paul Barkus Senior Statutory Auditorfor and on behalf of PricewaterhouseCoopers LLPChartered Accountants and Statutory Auditors
London, United Kingdom27 February 2019
Annual report 2018 | riotinto.com 263
Financial statements

Financial statements
Financial summary 2009-2018
US$m 2009 2010 2011 2012 2013 2014 2015 2016 2017 2018
Gross sales revenue(a) 42,734 59,008 65,298 55,597 54,575 50,041 36,784 35,336 41,867 42,835
Share of equity accounted units’ sales revenue and items excluded from underlying earnings (2,472) (3,837) (4,769) (4,655) (3,404) (2,377) (1,955) (1,555) (1,837) (2,313)
Consolidated sales revenue 40,262 55,171 60,529 50,942 51,171 47,664 34,829 33,781 40,030 40,522
Underlying profit before interest and tax (PBIT) 9,843 21,128 23,662 13,467 16,039 13,851 7,310 8,053 13,363 13,208
Finance costs(b) (1,058) (909) (759) (616) (794) (967) (1,076) (1,360) (1,090) (680)
Exchange differences and derivatives(c) 528 529 2 695 (3,362) (2,021) (3,458) 622 (1,078) 923
Other exclusions from underlying earnings (1,453) (257) (9,633) (15,977) (8,378) (1,311) (3,502) (972) 1,621 4,716
Profit/(loss) before tax (PBT) 7,860 20,491 13,272 (2,431) 3,505 9,552 (726) 6,343 12,816 18,167
Tax on exclusions (91) 42 135 2,896 2,642 423 567 (155) (596) (801)
Tax on underlying PBT (1,985) (5,338) (6,607) (3,485) (5,068) (3,476) (1,560) (1,412) (3,369) (3,441)
Loss after tax from discontinued operations (449) (97) (10) (7) – – – – – –
Attributable to non-controlling interests (463) (860) (955) (1) 2,586 28 853 (159) (89) (287)
Net earnings/(loss)(d) 4,872 14,238 5,835 (3,028) 3,665 6,527 (866) 4,617 8,762 13,638
Underlying EBITDA 14,312 25,978 28,640 19,245 21,509 19,665 12,621 13,510 18,580 18,136
Underlying earnings 6,298 13,987 15,572 9,269 10,217 9,305 4,540 5,100 8,627 8,808
Earnings/(loss) per share (basic) – continuing operations(e) 301.7c 731.0c 303.9c (163.4)c 198.4c 353.1c (47.5)c 256.9c 490.4c 793.2c
Underlying earnings per share (basic) – continuing operations(e) 357.1c 713.3c 809.7c 501.3c 553.1c 503.4c 248.8c 283.8c 482.8c 512.3c
Dividends per share: declared for year(f)
Rio Tinto shareholders (US cents) 45.00c 108.00c 145.00c 167.00c 192.00c 215.00c 215.00c 170.00c 290.00c 307.00c
Rio Tinto plc (pence) 28.84p 67.35p 90.47p 106.77p 120.10p 134.88p 143.13p 134.36p 212.56p 232.78p
Rio Tinto Limited (Aus. cents) 51.56c 111.21c 134.01c 160.18c 213.14c 256.07c 296.80c 222.75c 366.25c 421.73c
Net assets
Fixed assets(g) 72,706 83,895 91,529 90,580 81,554 80,669 70,226 68,104 70,735 64,351
Other assets less liabilities 10,078 4,394 1,632 8,478 8,224 4,596 4,037 4,128 2,495 2,498
Provisions (including deferred tax liabilities) (17,998) (19,706) (25,935) (22,126) (18,221) (18,176) (16,352) (16,915) (18,270) (17,281)
Net (debt)/cash (18,861) (4,071) (8,342) (19,192) (18,055) (12,495) (13,783) (9,587) (3,845) 255
Non-controlling interests (2,094) (6,265) (6,685) (11,187) (7,616) (8,309) (6,779) (6,440) (6,404) (6,137)
Equity attributable to owners of Rio Tinto 43,831 58,247 52,199 46,553 45,886 46,285 37,349 39,290 44,711 43,686
Capital expenditure(h) (5,388) (4,591) (12,573) (17,615) (13,001) (8,162) (4,685) (3,012) (4,482) (5,430)
Acquisitions (396) (907) (4,156) (1,335) 4 – (3) – – (5)
Disposals 2,424 3,800 386 251 1,896 887 (38) 761 2,675 7,733
Net cash generated from operating activities(i) 9,212 18,277 20,235 9,430 15,078 14,286 9,383 8,465 13,884 11,821
Cash flows before financing activities(j) 5,855 16,566 3,245 (8,813) 4,132 7,783 4,783 6,361 11,511 13,142
Ratios
Operating margin(k) 24% 37% 37% 25% 30% 28% 20% 23% 32% 31%
Net (debt)/cash to total capital(l) -29% -6% -12% -25% -25% -19% -24% -17% -7% 1%
Underlying earnings: owners’ equity(m) 20% 27% 28% 19% 22% 20% 11% 13% 21% 20%
Interest cover(n) 9 27 27 13 13 13 7 7 14 22
(a) Gross sales revenue includes 100% of subsidiaries’ sales revenue and the Group’s share of the sales revenue of equity accounted units (after adjusting for sales to subsidiaries).(b) Finance costs include net interest and amortisation of discount.(c) Under IFRS, as defined in note 1, certain gains and losses on currency exchange and on revaluation of derivatives are included in the Group’s net earnings/(loss). These items are excluded from
underlying earnings.(d) Underlying earnings is an additional measure of earnings, which is reported by Rio Tinto with its IFRS (as defined in note 1) results to provide greater understanding of the underlying business
performance of its operations. It is defined in note 2 to the financial statements. Underlying profit before interest and tax (PBIT) is similar to underlying earnings except that it is stated before interest and tax.
(e) 2009 earnings per share from continuing operations and underlying earnings per share have been calculated using a number of shares which reflects the discounted price of the July 2009 rights issues (the bonus factor).
(f) Dividends per share are the amounts declared in respect of each financial year. These usually include an interim dividend paid in the year, and a final dividend paid after the end of the year. The special dividend of 243 US cents per share proposed in the announcement of the 2018 results is not included above.
(g) Fixed assets include: property, plant and equipment, intangible assets, goodwill, and investments in, and long-term loans to, equity accounted units.(h) Capital expenditure is presented gross, before taking into account any disposals of property, plant and equipment or intangible assets.(i) Net cash generated from operating activities represents the cash generated by the Group’s consolidated operations, after payment of interest, taxes, and dividends to non-controlling interests
in subsidiaries.( j) Cash flow before financing activities is stated before deducting dividends payable to owners of Rio Tinto.(k) Operating margin is the percentage of underlying PBIT, after excluding tax on equity accounted units, to gross sales revenue.(l) Total capital comprises equity attributable to owners of Rio Tinto plus net debt and non-controlling interests.(m) Underlying earnings: owners’ equity represents underlying earnings expressed as a percentage of the mean of opening and closing equity attributable to owners of Rio Tinto.(n) Interest cover represents the number of times interest payable less receivable (excluding the amortisation of discount but including capitalised interest) is covered by underlying operating
profit, less amortisation of discount, plus dividends from equity accounted units. Underlying operating profit is similar to underlying earnings but is stated before tax, interest and share of profit after tax of equity accounted units.
Annual report 2018 | riotinto.com264

Summary financial data in Australian dollars, sterling and US dollars
Summary financial data in Australian dollars, sterling and US dollars
2018A$m
2017A$m
2018£m
2017£m
2018US$m
2017US$m
57,113 54,373 31,966 32,455 Gross sales revenue 42,835 41,867
54,029 51,987 30,240 31,031 Consolidated sales revenue 40,522 40,030
24,223 16,644 13,557 9,935 Profit before tax from continuing operations 18,167 12,816
18,567 11,495 10,392 6,861 Profit for the year from continuing operations 13,925 8,851
18,184 11,379 10,178 6,792 Net earnings attributable to Rio Tinto shareholders 13,638 8,762
24,181 24,130 13,534 14,403 Underlying EBITDA 18,136 18,580
11,744 11,204 6,573 6,688 Underlying earnings(a) 8,808 8,627
1,057.6c 636.9c 592.0p 380.2p Basic earnings per ordinary share(b) 793.2c 490.4c
683.1c 627.1c 382.3p 374.3p Basic underlying earnings per ordinary share(a) (b) 512.3c 482.8c
Dividends per share to Rio Tinto shareholders(c)
399.37c 301.34c 226.25p 183.69p – paid 307.0c 235.0c
250.89c 228.53c 135.96p 129.43p – proposed – ordinary dividend 180.0c 180.0c
338.70c – 183.55p – – proposed – special dividend 243.0c –
17,523 14,949 9,807 8,923 Cash flow before financing activities 13,142 11,511
364 (4,929) 201 (2,869) Net cash/(debt) 255 (3,845)
62,409 57,322 34,398 33,366 Equity attributable to Rio Tinto shareholders 43,686 44,711
(a) Underlying earnings exclude net gains on disposal of businesses and other charges of US$4,830 million (2017: net gains on disposals of businesses and other charges of US$135 million), which are analysed on page 167.
(b) Basic earnings per ordinary share and basic underlying earnings per ordinary share do not recognise the dilution resulting from share options on issue.(c) The Australian dollar and sterling amounts are based on the US dollar amounts, retranslated at average or closing rates as appropriate, except for the dividends which are the actual amounts.
The financial data above has been extracted from the financial information set out on pages 142 to 243.
Annual report 2018 | riotinto.com 265
Financial statements

Metals and minerals production 268Ore reserves 271Mineral resources 275Competent Persons 280Mines and production facilities 282
Production, reserves and operations
Annual report 2018 | riotinto.com266
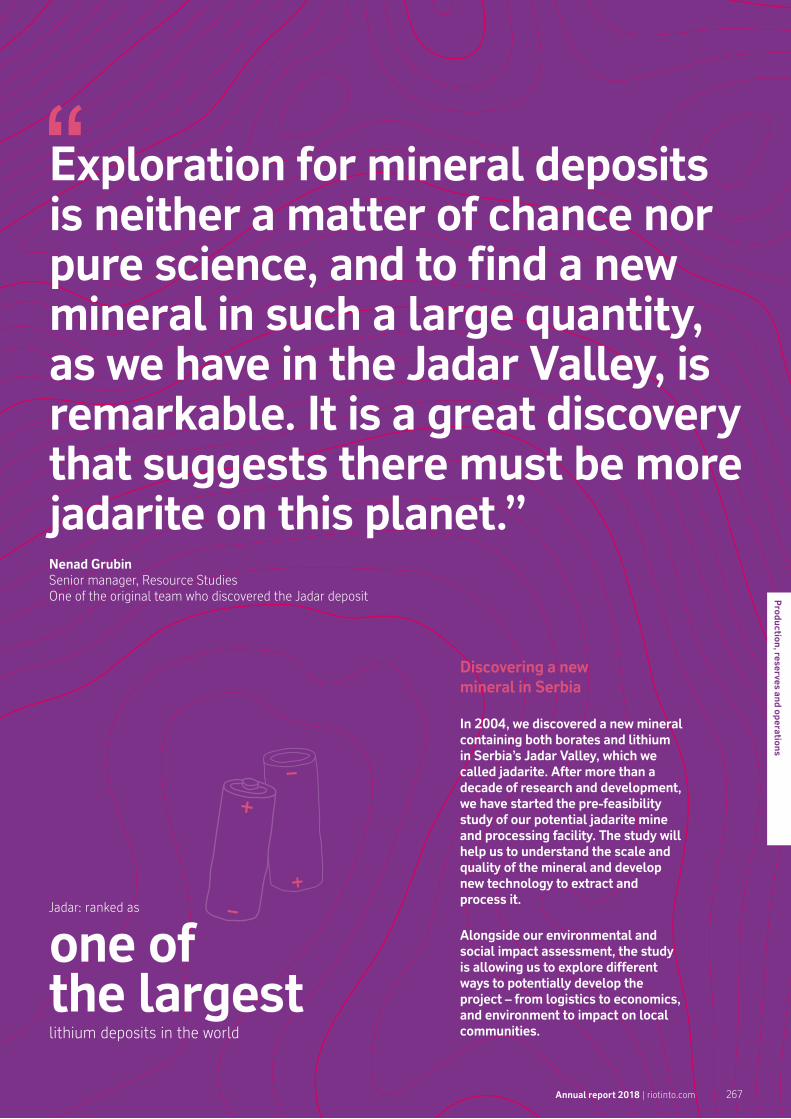
Discovering a new mineral in Serbia
In 2004, we discovered a new mineral containing both borates and lithium in Serbia’s Jadar Valley, which we called jadarite. After more than a decade of research and development, we have started the pre-feasibility study of our potential jadarite mine and processing facility. The study will help us to understand the scale and quality of the mineral and develop new technology to extract and process it.
Alongside our environmental and social impact assessment, the study is allowing us to explore different ways to potentially develop the project – from logistics to economics, and environment to impact on local communities.
Exploration for mineral deposits is neither a matter of chance nor pure science, and to find a new mineral in such a large quantity, as we have in the Jadar Valley, is remarkable. It is a great discovery that suggests there must be more jadarite on this planet.”Nenad GrubinSenior manager, Resource Studies One of the original team who discovered the Jadar deposit
Jadar: ranked as
one of the largest lithium deposits in the world
Annual report 2018 | riotinto.com 267
Production, reserves and operations

Production, reserves and operations
Metals and minerals production
2018 Production 2017 Production 2016 Production
Rio Tinto % share(a)
Total
Rio Tinto share
Total
Rio Tinto share
Total
Rio Tinto share
Alumina (‘000 tonnes)
Jonquière (Vaudreuil) (Canada)(b) 100.0% 1,444 1,444 1,448 1,448 1,452 1,452
Jonquière (Vaudreuil) specialty plant (Canada) 100.0% 124 124 122 122 115 115
Queensland Alumina (Australia) 80.0% 3,697 2,958 3,735 2,988 3,848 3,078
São Luis (Alumar) (Brazil) 10.0% 3,509 351 3,697 370 3,707 371
Yarwun (Australia) 100.0% 3,103 3,103 3,203 3,203 3,176 3,176
Rio Tinto total 7,980 8,131 8,192
Aluminium (‘000 tonnes)
Alma (Canada) 100.0% 465 465 457 457 467 467
Alouette (Sept-Îles) (Canada) 40.0% 584 234 598 239 609 244
Arvida (Canada) 100.0% 173 173 171 171 172 172
Arvida AP60 (Canada) 100.0% 52 52 57 57 60 60
Bécancour (Canada) 25.1% 136 34 438 110 445 111
Bell Bay (Australia) 100.0% 189 189 187 187 182 182
Boyne Island (Australia) 59.4% 497 295 508 302 583 346
Dunkerque (France)(c) – 227 227 284 284 280 280
Grande-Baie (Canada) 100.0% 233 233 229 229 227 227
ISAL (Reykjavik) (Iceland) 100.0% 212 212 212 212 205 205
Kitimat (Canada) 100.0% 436 436 433 433 408 408
Laterrière (Canada) 100.0% 257 257 249 249 247 247
Lochaber (UK)(d) – – – – – 46 46
Sohar (Oman) 20.0% 380 76 253 51 386 77
Tiwai Point (New Zealand) 79.4% 341 270 337 267 339 269
Tomago (Australia) 51.6% 592 305 590 304 589 304
Rio Tinto total 3,458 3,551 3,646
Bauxite (‘000 tonnes)
Gove (Australia) 100.0% 12,540 12,540 11,201 11,201 9,091 9,091
Porto Trombetas (MRN) (Brazil) 12.0% 13,134 1,576 14,698 1,764 16,462 1,975
Sangaredi (Guinea) 23.0(e) 13,039 5,868 15,409 6,934 16,023 7,210
Weipa (Australia) 100.0% 30,437 30,437 30,898 30,898 29,427 29,427
Rio Tinto total 50,421 50,796 47,703
Borates (‘000 tonnes)(f)
Rio Tinto Borates – Boron (US) 100.0% 512 512 517 517 503 503
Coal (hard coking) (‘000 tonnes)
Rio Tinto Coal Australia
Hail Creek Coal (Australia)(g)(h) – 2,700 2,214 5,247 4,303 5,950 4,879
Kestrel Coal (Australia)(g)(h) – 2,217 1,774 4,252 3,402 4,077 3,262
Rio Tinto total hard coking coal 3,988 7,704 8,141
Coal (semi-soft coking) (‘000 tonnes)
Rio Tinto Coal Australia
Hunter Valley (Australia)(i) – – – 1,529 1,034 3,720 2,540
Mount Thorley (Australia)(i) – – – 876 700 1,420 1,127
Warkworth (Australia)(i) – – – 514 286 809 436
Rio Tinto total semi-soft coking coal – 2,020 4,102
Please see notes on Page 270
Annual report 2018 | riotinto.com268

Metals and minerals production
2018 Production 2017 Production 2016 Production
Rio Tinto % share(a)
Total
Rio Tinto share
Total
Rio Tinto share
Total
Rio Tinto share
Coal (thermal) (‘000 tonnes)
Rio Tinto Coal Australia
Bengalla (Australia)(j) – – – – – 1,476 527
Hail Creek Coal (Australia)(g)(h) – 2,760 2,264 4,134 3,390 3,767 3,089
Hunter Valley (Australia)(i) – – – 8,502 5,747 9,925 6,782
Kestrel Coal (Australia)(g)(h) – 329 263 843 674 846 676
Mount Thorley (Australia)(i) – – – 2,011 1,609 2,850 2,235
Warkworth (Australia)(i) – – – 4,521 2,512 7,225 3,945
Rio Tinto total thermal coal 2,527 13,933 17,254
Copper (mined) (‘000 tonnes)
Bingham Canyon (US) 100.0% 203.9 203.9 148.9 148.9 152.7 152.7
Escondida (Chile) 30.0% 1,167.9 350.4 902.7 270.8 1,010.7 303.1
Grasberg – Joint Venture (Indonesia)(k) – 64.8 25.9 14.3 5.7 0.0 0.0
Oyu Tolgoi (Mongolia)(l) 33.5% 159.1 53.3 157.4 52.8 201.3 67.5
Rio Tinto total 633.5 478.1 523.3
Copper (refined) (‘000 tonnes)
Escondida (Chile) 30.0% 266.8 80.0 238.0 71.4 312.1 93.6
Rio Tinto Kennecott (US) 100.0% 194.7 194.7 125.8 125.8 156.5 156.5
Rio Tinto total 274.8 197.2 250.1
Diamonds (‘000 carats)
Argyle (Australia) 100.0% 14,069 14,069 17,135 17,135 13,958 13,958
Diavik (Canada) 60.0% 7,264 4,358 7,486 4,492 6,658 3,995
Rio Tinto total 18,427 21,627 17,953Gold (mined) (‘000 ounces)
Bingham Canyon (US) 100.0% 196.7 196.7 177.9 177.9 153.2 153.2
Escondida (Chile) 30.0% 265.6 79.7 146.2 43.9 132.6 39.8
Grasberg – Joint Venture (Indonesia)(k) – 666.8 266.7 0.0 0.0 0.0 0.0
Oyu Tolgoi (Mongolia)(l) 33.5% 285.4 95.7 114.3 38.3 300.0 100.5
Rio Tinto total 638.8 260.1 293.5
Gold (refined) (‘000 ounces)
Rio Tinto Kennecott (US) 100.0% 198.0 198.0 203.7 203.7 135.4 135.4Iron Ore (‘000 tonnes)
Hamersley mines (Australia) (m) 220,612 220,612 206,760 206,760 205,902 205,902
Hamersley – Channar (Australia) 60.0% 7,173 4,304 10,798 6,479 9,731 5,839
Hope Downs (Australia) 50.0% 45,368 22,684 46,941 23,470 47,010 23,505
Iron Ore Company of Canada (Canada) 58.7% 15,245 8,952 19,016 11,166 18,155 10,661
Robe River – Robe Valley (Australia) 53.0% 31,947 16,932 31,182 16,526 32,776 17,371
Robe River – West Angelas (Australia) 53.0% 32,672 17,316 34,116 18,082 34,044 18,044
Rio Tinto total 290,800 282,484 281,321
Please see notes on Page 270
Annual report 2018 | riotinto.com 269
Production, reserves and operations

Production, reserves and operations
2018 Production 2017 Production 2016 Production
Rio Tinto % share(a)
Total
Rio Tinto share
Total
Rio Tinto share
Total
Rio Tinto share
Molybdenum (‘000 tonnes)
Bingham Canyon (US) 100% 5.8 5.8 5.0 5.0 2.8 2.8
Salt (‘000 tonnes)
Dampier Salt (Australia) 68.4% 9,001 6,153 7,446 5,090 7,578 5,180Silver (mined) (‘000 ounces)
Bingham Canyon (US) 100.0% 2,520 2,520 2,156 2,156 1,943 1,943
Escondida (Chile) 30.0% 9,433 2,830 5,707 1,712 5,971 1,791
Grasberg – Joint Venture (Indonesia)(k) – 634 253 0 0 0 0
Oyu Tolgoi (Mongolia)(l) 33.5% 914 306 974 326 1,420 476
Rio Tinto total 5,910 4,194 4,210Silver (refined) (‘000 ounces)
Rio Tinto Kennecott (US) 100.0% 2,865 2,865 2,378 2,378 1,815 1,815Titanium Dioxide Slag (‘000 tonnes)
Rio Tinto Iron & Titanium (Canada/South Africa)(n) 100.0% 1,116 1,116 1,315 1,315 1,048 1,048
Uranium (‘000 lbs U3O8)
Energy Resources of Australia (Australia)(o) 68.4% 4,407 3,014 5,056 3,458 5,182 3,544
Rössing (Namibia)(o)(p) 68.6% 5,465 3,750 4,652 3,192 4,078 2,798
Rio Tinto total 6,764 6,650 6,342
Production data notes:Mine production figures for metals refer to the total quantity of metal produced in concentrates, leach liquor or doré bullion irrespective of whether these products are then refined onsite, except for the data for bauxite and iron ore which can represent production of marketable quantities of ore plus concentrates and pellets. Production figures are sometimes more precise than the rounded numbers shown, hence small differences may result from calculation of Rio Tinto share of production.
(a) Rio Tinto percentage share, shown above, is as at the end of 2018. The footnotes below include all ownership changes over the three years.(b) Jonquière’s (Vaudreuil’s) production shows smelter grade alumina only and excludes hydrate produced and used for specialty alumina.(c) On 14 December 2018, Rio Tinto completed the sale of its 100% interest in the Dunkerque aluminium smelter. Production is reported up to the date of completion.(d) On 16 December 2016, Rio Tinto completed the sale of its 100% interest in the Lochaber aluminium smelter. Production is reported up to the date of completion.(e) Rio Tinto has a 22.95% shareholding in the Sangaredi mine but benefits from 45% of production.(f) Borate quantities are expressed as B2O3.(g) Kestrel and Hail Creek produce hard coking coal and thermal coal through their mining operations. Both mines may blend coal types at ports.(h) On 1 August 2018, Rio Tinto completed the sale of its entire interest in the Hail Creek and Kestrel mines. Production is reported up to the date of completion.(i) On 1 September 2017, Rio Tinto completed the sale of Coal & Allied, a wholly owned subsidiary of Rio Tinto Coal Australia (RTCA) and production from these assets is included to this date. This
included Coal & Allied’s 67.6% interest in the Hunter Valley Operations mine, 80% interest in the Mount Thorley mine and 55.6% interest in the Warkworth mine. In an earlier restructuring of the Coal & Allied group completed on 3 February 2016, Rio Tinto had obtained 100% of Coal & Allied and retained a 67.6% interest in the newly created Hunter Valley Operations joint venture. Prior to restructuring, Rio Tinto’s interest in the Hunter Valley Operations, Mount Thorley and Warkworth mines was 80%, 64% and 44.46% respectively.
( j) On 1 March 2016, Rio Tinto completed the sale of its entire interest in the Bengalla Joint Venture. Production is reported up to the date of completion.(k) Through a joint venture agreement with Freeport-McMoRan (FCX), Rio Tinto is entitled to 40% of additional material mined as a consequence of expansions and developments of the Grasberg
facilities since 1998. Total production reflects the quantities attributable to the joint venture. On 21 December 2018, Rio Tinto completed the sale of its entire interest in the Grasberg mine in Indonesia to PT Indonesia Asahan Aluminium (Persero) (Inalum). Production is reported up to 30 November 2018.
(l) Rio Tinto owns a 33.52% indirect interest in Oyu Tolgoi through its 50.79% interest in Turquoise Hill Resources Ltd.(m) Includes 100% of production from Paraburdoo, Mt Tom Price, Marandoo, Yandicoogina, Brockman, Nammuldi, Silvergrass and the Eastern Range mines. Whilst Rio Tinto owns 54% of the
Eastern Range mine, under the terms of the joint venture agreement, Hamersley Iron manages the operation and is obliged to purchase all mine production from the joint venture and therefore all of the production is included in Rio Tinto’s share of production.
(n) Quantities comprise 100% of Rio Tinto Fer et Titane and Rio Tinto’s share of Richards Bay Minerals’ production. Ilmenite mined in Madagascar is being processed in Canada.(o) ERA and Rössing report drummed U3O8(p) On 26 November 2018, Rio Tinto signed a binding agreement to sell its 68.62% interest in the Rössing mine in Namibia to China National Uranium Corporation Limited.
Metals and minerals production continued
Annual report 2018 | riotinto.com270

Ore reserves
Ore reserves
Type ofmine(a)
Proved ore reserves at end 2018
Probable ore reserves at end 2018
Total ore reserves 2018 compared with 2017
Interest %
2018 2017 2018 2017
Tonnage Grade Tonnage Grade Tonnage Tonnage Grade Grade Rio Tinto share
Recoverable mineral
Bauxite(b)millions
of tonnes % Al2O3
millionsof tonnes % Al2O3
millionsof tonnes
millionsof tonnes % Al2O3 % Al2O3
millionsof tonnes
Reserves at operating mines
Gove (Australia)(c) O/P 138 49.3 3.8 49.5 142 147 49.3 49.4 100.0 142
Porto Trombetas (MRN) (Brazil) O/P 35 49.9 13 50.8 48 48 50.1 50.1 12.0 6
Sangaredi (Guinea)(d) O/P 278 47.7 188 46.7 466 331 47.3 48.8 23.0 107
Weipa (Australia)(e)
– Amrun(f) O/P 286 53.1 818 53.3 1,104 1,258 53.2 53.0 100.0 1,104
– East Weipa and Andoom(g) O/P 163 50.5 163 196 50.5 50.7 100.0 163
Total 1,522Marketable
product
Borates(h)millions
of tonnesmillions
of tonnesmillions
of tonnesmillions
of tonnesmillions
of tonnes
Reserves at operating mine
Rio Tinto Borates – Boron (US) O/P 11 4.6 15 16 100.0 15
Type ofmine(a)
Coaltype(i)
Reserves Marketable reserves Marketable reserves Marketable coal quality Average % yield to givemarketable
reserves
Provedat end
2018
Probableat end
2018
Provedat end
2018
Probableat end
2018Total2018
Total2017
Calorificvalue
Sulphur content Rio Tinto share
Marketable reserves
Coal(j)millions
of tonnesmillions
of tonnesmillions
of tonnesmillions
of tonnesmillions
of tonnesmillions
of tonnes MJ/kg(k) %(k)millions
of tonnes
Reserves at operating mines
Rio Tinto Coal Australia(l)
Hail Creek O/C SC + MC – 142 – – – –
Kestrel Coal U/G SC + MC – 146 – – – –
Total –
Ore Reserves and Mineral Resources for Rio Tinto managed operations are reported in accordance with the Australasian Code for Reporting of Exploration Results, Mineral Resources and Ore Reserves, December 2012 (the JORC Code) as required by the Australian Securities Exchange (ASX). Codes or guidelines similar to JORC with only minor regional variations have been adopted in South Africa, Canada, the US, Chile, Peru, the Philippines, the UK, Ireland and Europe. Together these Codes represent current best practice for reporting Ore Reserves and Mineral Resources.
The JORC Code envisages the use of reasonable investment assumptions, including the use of projected long-term commodity prices, in calculating Ore Reserve estimates. However, for US reporting, the US Securities and Exchange Commission requires historical price data to be used. For this reason, some Ore Reserves reported to the SEC in the Form 20-F may differ from those reported below.
Ore Reserve and Mineral Resource information in the tables below is based on information compiled by Competent Persons (as defined by JORC), most of whom are full-time employees of Rio Tinto or related companies.
Each has had a minimum of five years’ relevant estimation experience and is a member of a recognised professional body whose members are bound by a professional code of ethics. Each Competent Person consents to the inclusion in this report of information they have provided in the form and context in which it appears. Competent Persons responsible for the estimates are listed on pages 280 and 281, by operation, along with their professional affiliation, employer and accountability for Ore Reserves and/or Mineral Resources. Where operations are not managed by Rio Tinto, the Ore Reserves are published as received from the managing company. The Ore Reserve figures in the following tables are as of 31 December 2018. Summary data for year end 2017 are shown for comparison. Metric units are used throughout. The figures used to calculate Rio Tinto’s share of Ore Reserves are often more precise than the rounded numbers shown in the tables, hence small differences might result if the calculations are repeated using the tabulated figures.
Annual report 2018 | riotinto.com 271
Production, reserves and operations
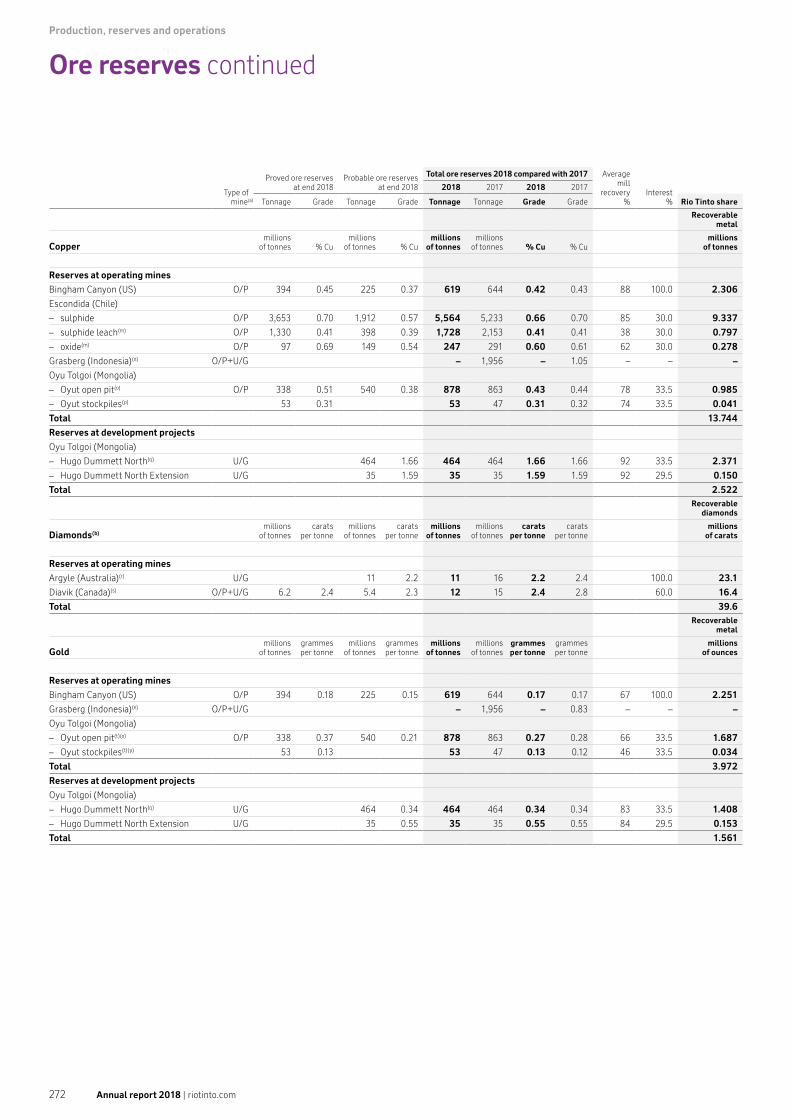
Production, reserves and operations
Ore reserves continued
Type ofmine(a)
Proved ore reserves at end 2018
Probable ore reserves at end 2018
Total ore reserves 2018 compared with 2017 Average mill
recovery %
Interest %
2018 2017 2018 2017
Tonnage Grade Tonnage Grade Tonnage Tonnage Grade Grade Rio Tinto share
Recoverable metal
Coppermillions
of tonnes % Cumillions
of tonnes % Cumillions
of tonnesmillions
of tonnes % Cu % Cumillions
of tonnes
Reserves at operating mines
Bingham Canyon (US) O/P 394 0.45 225 0.37 619 644 0.42 0.43 88 100.0 2.306
Escondida (Chile)
– sulphide O/P 3,653 0.70 1,912 0.57 5,564 5,233 0.66 0.70 85 30.0 9.337
– sulphide leach(m) O/P 1,330 0.41 398 0.39 1,728 2,153 0.41 0.41 38 30.0 0.797
– oxide(m) O/P 97 0.69 149 0.54 247 291 0.60 0.61 62 30.0 0.278
Grasberg (Indonesia)(n) O/P+U/G – 1,956 – 1.05 – – –
Oyu Tolgoi (Mongolia)
– Oyut open pit(o) O/P 338 0.51 540 0.38 878 863 0.43 0.44 78 33.5 0.985
– Oyut stockpiles(p) 53 0.31 53 47 0.31 0.32 74 33.5 0.041
Total 13.744
Reserves at development projects
Oyu Tolgoi (Mongolia)
– Hugo Dummett North(q) U/G 464 1.66 464 464 1.66 1.66 92 33.5 2.371
– Hugo Dummett North Extension U/G 35 1.59 35 35 1.59 1.59 92 29.5 0.150
Total 2.522Recoverable
diamonds
Diamonds(b)millions
of tonnescarats
per tonnemillions
of tonnescarats
per tonnemillions
of tonnesmillions
of tonnescarats
per tonnecarats
per tonnemillions
of carats
Reserves at operating mines
Argyle (Australia)(r) U/G 11 2.2 11 16 2.2 2.4 100.0 23.1
Diavik (Canada)(s) O/P+U/G 6.2 2.4 5.4 2.3 12 15 2.4 2.8 60.0 16.4
Total 39.6Recoverable
metal
Goldmillions
of tonnesgrammesper tonne
millionsof tonnes
grammesper tonne
millionsof tonnes
millionsof tonnes
grammesper tonne
grammesper tonne
millionsof ounces
Reserves at operating mines
Bingham Canyon (US) O/P 394 0.18 225 0.15 619 644 0.17 0.17 67 100.0 2.251
Grasberg (Indonesia)(n) O/P+U/G – 1,956 – 0.83 – – –
Oyu Tolgoi (Mongolia)
– Oyut open pit(t)(o) O/P 338 0.37 540 0.21 878 863 0.27 0.28 66 33.5 1.687
– Oyut stockpiles(t)(p) 53 0.13 53 47 0.13 0.12 46 33.5 0.034
Total 3.972
Reserves at development projects
Oyu Tolgoi (Mongolia)
– Hugo Dummett North(q) U/G 464 0.34 464 464 0.34 0.34 83 33.5 1.408
– Hugo Dummett North Extension U/G 35 0.55 35 35 0.55 0.55 84 29.5 0.153
Total 1.561
Annual report 2018 | riotinto.com272

Ore reserves
Type ofmine(a)
Proved ore reserves at end 2018
Probable ore reserves at end 2018
Total ore reserves 2018 compared with 2017 Average mill
recovery %
Interest %
2018 2017 2018 2017
Tonnage Grade Tonnage Grade Tonnage Tonnage Grade Grade Rio Tinto share
Marketable product
Iron Ore(u)(b) millions
of tonnes % Femillions
of tonnes % Femillions
of tonnesmillions
of tonnes % Fe % Femillions
of tonnes
Reserves at operating mines
Hamersley Iron (Australia)
– Greater Brockman 2 Nammuldi (Brockman and Marra Mamba ore)(v) O/P 212 62.2 150 60.6 362 413 61.5 61.5 100.0 362
– Brockman 4 (Brockman and Marra Mamba ore)(w) O/P 263 62.3 102 61.6 365 410 62.1 62.0 100.0 365
– Marandoo (Marra Mamba ore)(x) O/P 159 63.8 33 58.4 192 164 62.9 63.5 100.0 192
– Greater Tom Price (Brockman and Marra Mamba ore)(y) O/P 211 62.1 120 61.7 332 318 62.0 62.0 100.0 332
– Paraburdoo (Brockman ore)(z) O/P 3 61.4 6 63.2 9 15 62.6 62.5 100.0 9
– Yandicoogina (Pisolite ore) O/P 549 58.4 549 589 58.4 58.5 100.0 549
Channar JV (Australia)
– Channar (Brockman ore)(aa) O/P 15 61.2 9 60.9 24 27 61.1 61.0 60.0 14
Eastern Range JV (Australia)
– Eastern Range (Brockman ore) O/P 35 61.6 8 60.2 43 43 61.3 61.5 54.0 23
Hope Downs JV (Australia)
– Hope Downs 1 (Marra Mamba ore) O/P 96 62.7 93 60.2 188 204 61.5 61.5 50.0 94
– Hope Downs 4 (Brockman ore)(bb) O/P 61 63.7 72 63.1 133 147 63.4 63.2 50.0 66
Robe River JV (Australia)
– Robe Valley (Pisolite ore)(cc) O/P 148 56.6 222 56.2 370 412 56.4 56.5 53.0 196
– West Angelas (Marra Mamba ore)(dd) O/P 155 62.2 78 61.3 233 262 61.9 61.8 53.0 123
Iron Ore Company of Canada (Canada)(ee) O/P 244 65.0 301 65.0 545 513 65.0 65.0 58.7 320
Total 2,645
Reserves at development projects
Hamersley Iron (Australia)
– Koodaideri (Brockman ore) O/P 239 62.3 310 61.5 549 598 61.8 61.9 100.0 549
– Turee Central (Brockman ore) O/P 72 62.0 6 61.4 78 78 61.9 61.9 100.0 78
Total 627Recoverable
metal
Molybdenummillions
of tonnes % Momillions
of tonnes % Momillions
of tonnesmillions
of tonnes % Mo % Momillions
of tonnes
Reserves at operating mine
Bingham Canyon (US)(ff) O/P 394 0.042 225 0.022 619 644 0.035 0.033 65 100.0 0.140
Total 0.140Recoverable
metal
Silvermillions
of tonnesgrammesper tonne
millionsof tonnes
grammesper tonne
millionsof tonnes
millionsof tonnes
grammesper tonne
grammesper tonne
millionsof ounces
Reserves at operating mines
Bingham Canyon (US) O/P 394 2.02 225 2.08 619 644 2.04 2.09 73 100.0 29.639
Grasberg (Indonesia)(n) O/P+U/G – 1,956 – 4.46 – – –
Oyu Tolgoi (Mongolia)
– Oyut open pit(t)(o) O/P 338 1.31 540 1.10 878 863 1.18 1.20 52 33.5 5.797
– Oyut stockpiles(t)(p) 53 0.95 53 47 0.95 1.04 47 33.5 0.252
Total 35.688
Reserves at development projects
Oyu Tolgoi (Mongolia)
– Hugo Dummett North(q) U/G 464 3.37 464 464 3.37 3.37 86 33.5 14.579
– Hugo Dummett North Extension U/G 35 3.72 35 35 3.72 3.72 86 29.5 1.061
Total 15.639
Annual report 2018 | riotinto.com 273
Production, reserves and operations

Production, reserves and operations
Ore reserves continued
Type ofmine(a)
Proved ore reserves at end 2018
Probable ore reserves at end 2018
Total ore reserves 2018 compared with 2017 Average mill
recovery %
Interest %
2018 2017 2018 2017
Tonnage Grade Tonnage Grade Tonnage Tonnage Grade Grade Rio Tinto share
Marketableproduct
Titanium dioxide feedstock(gg)millions
of tonnes%Ti
Mineralsmillions
of tonnes%Ti
Mineralsmillions
of tonnesmillions
of tonnes%Ti
Minerals%Ti
Mineralsmillions
of tonnes
Reserves at operating mines
QMM (Madagascar)(hh) D/O 392 3.5 13 3.6 405 447 3.5 3.5 80.0 5.7
RBM (South Africa) D/O+O/P 970 2.2 614 2.6 1,584 1,686 2.4 2.3 74.0 11.9
RTFT (Canada)(ii) O/P 119 83.2 119 120 83.2 83.2 100.0 39.1
Total 56.7Recoverable
metal
Uraniummillions
of tonnes % U308
millionsof tonnes % U308
millionsof tonnes
millionsof tonnes % U308 % U308
millionsof tonnes
Reserves at operating mines
Energy Resources of Australia (Australia)
– Ranger #3 stockpiles(jj) 4.9 0.076 4.9 7.4 0.076 0.078 85 68.4 0.002
Rössing SJ (Namibia)(kk) O/P 72 0.039 72 80 0.039 0.040 85 68.6 0.016
Total 0.019Marketable
product
Zircon(ll)millions
of tonnes % Zirconmillions
of tonnes % Zirconmillions
of tonnesmillions
of tonnes % Zircon % Zirconmillions
of tonnes
Reserves at operating mines
QMM (Madagascar)(hh) D/O 392 0.2 13 0.2 405 447 0.2 0.2 80.0 0.4
RBM (South Africa) D/O+O/P 970 0.3 614 0.4 1,584 1,686 0.3 0.3 74.0 3.1
Total 3.5
(a) Type of mine: O/P = open pit, O/C = open cut, U/G = underground, D/O = dredging operation. (b) Reserves of bauxite, diamonds and iron ore are shown as recoverable Reserves of marketable product after accounting for all mining and processing losses. Mill recoveries are therefore not shown. (c) Gove Reserves are stated as dry tonnes and total alumina grade. (d) Sangaredi Reserve tonnes are reported on a 3% moisture basis and alumina grades are reported as total alumina. The increase in Reserve tonnes follows an updated life of mine plan.(e) Weipa Reserves are stated as dry tonnes and total alumina grade. (f) Amrun was previously reported as South of Embley. The decrease in Reserve tonnes follows mining depletion and an updated economic evaluation and life of mine plan. (g) The decrease in East Weipa and Andoom Reserve tonnes follows mining depletion and an updated life of mine plan. (h) Reserves of borates are expressed in terms of marketable product (B2O3) after all mining and processing losses. (i) Coal type: SC: steam/thermal coal, MC: metallurgical/coking coal. ( j) For coal, the yield factors shown reflect the impact of further processing, where necessary, to provide marketable coal. (k) Coals have been analysed on an “air dried” moisture basis in accordance with Australian Standards and gross calorific value and sulphur content are reported here on that basis. Marketable
Reserves tonnages are reported on a product moisture basis. (l) Released to the market on 1 August 2018, Rio Tinto sold its interest in the Hail Creek and Kestrel mines. (m) The decrease in Escondida – sulphide leach mine and oxide mine Reserve tonnes is a result of a new geological model based on additional drilling. (n) Released to the market by Rio Tinto on 21 December 2018, Rio Tinto sold its interest in the Grasberg mine.(o) Geological and resource models were updated during 2018, but have not contributed to material changes in Oyut open pit Reserves. (p) The change in Oyut stockpiles Reserve tonnes and grade follows mine production.(q) The Hugo Dummett North underground mine is currently under construction. (r) Argyle Reserves are based on a 0.8 millimetre lower cut-off size and a final re-crushing size of 8 millimetres. The decrease in Reserve tonnes follows mining depletion. (s) Diavik Reserves are based on a nominal 1 millimetre lower cut-off size and a final re-crushing size of 5 millimetres. Reserve tonnes and grade decreased following mining depletion and an
updated geological model and life of mine plan. (t) Silver and gold recovery factors for Oyut open pit and stockpiles Reserves have been changed following a metallurgical update reflecting six years of operating history. (u) Australian iron ore Reserve tonnes are reported on a dry weight basis. As Rio Tinto only markets blended iron ore products from multiple mine sources, a detailed breakdown of constituent
elements by individual deposit is not reported. (v) Greater Brockman 2 Nammuldi (Brockman and Marra Mamba ore) was previously individually reported as Brockman 2 (Brockman ore), Nammuldi (Marra Mamba ore), and Silvergrass (Marra
Mamba ore). They are now consolidated into a single production hub. Reserve tonnes decreased following mining depletion and cut-off grade changes. (w) Brockman 4 (Brockman and Marra Mamba ore) Reserve tonnes decreased following mining depletion and cut-off grade changes.(x) Marandoo (Marra Mamba ore) Reserve tonnes increased following a geological model update, cut-off grade changes and pit design modifications. (y) Greater Tom Price (Brockman and Marra Mamba ore) was previously individually reported as Tom Price (Brockman and Marra Mamba ore) and Western Turner Syncline (Brockman and Marra
Mamba ore). They are now consolidated into a single production hub.(z) Paraburdoo (Brockman ore) Reserve tonnes decreased following mining depletion and pit design changes.(aa) Channar (Brockman ore) Reserve tonnes decreased following mining depletion and pit design changes. (bb) Hope Downs 4 (Brockman ore) Reserve tonnes decreased following mining depletion. (cc) Robe Valley (Pisolite ore) Reserve tonnes decreased following an updated geological model, mining depletion and pit design changes. (dd) West Angelas (Marra Mamba ore) Reserve tonnes decreased following mining depletion and pit design changes. (ee) Reserves at Iron Ore Company of Canada are reported as marketable product (60% pellets and 40% concentrate for sale) at a natural moisture content of 2%. The marketable product is derived
from mined material comprising 580 million dry tonnes at 38.6% iron (Proved) and 718 million dry tonnes at 38.1% iron (Probable) using process recovery factors derived from current IOC concentrating and pellet operations.
(ff) Bingham Canyon Reserves molybdenum grades interpolated from exploration drilling assays have been factored based on a long reconciliation history to blast hole and mill samples. (gg) The marketable product (TiO2 slag) is shown after all mining and processing losses. The Reserves are expressed as in situ tonnes. (hh) QMM Reserve tonnes decreased following a revision of cut-off grades and mine design changes.(ii) The permitting process of a new waste dump to support full extraction of RTFT Reserves to 2063 is progressing with permit application submitted in 2017.( jj) The decrease in Ranger #3 stockpiles Reserves follows processing depletion.(kk) Released to the market by Rio Tinto on 26 November 2018, Rio Tinto has entered into a binding agreement for its entire interest in Rössing Uranium Limited. Reserve tonnes decreased
following an update to the life of mine plan.(ll) The marketable product (zircon at RBM and zirsil at QMM) is shown after all mining and processing losses. The Reserves are expressed as in situ tonnes.
Annual report 2018 | riotinto.com274

Mineral resources
Likely mining
method(a)
Measured resources at end 2018
Indicated resources at end 2018
Inferred resources at end 2018
Total resources 2018 compared with 2017Rio Tinto Interest
%
2018 2017 2018 2017
Tonnage Grade Tonnage Grade Tonnage Grade Tonnage Tonnage Grade Grade
Bauxitemillions
of tonnes % Al2O3
millionsof tonnes % Al2O3
millionsof tonnes % Al2O3
millionsof tonnes
millionsof tonnes % Al2O3 % Al2O3
Gove (Australia)(b) O/P 15 48.9 12 47.5 1.4 48.3 28 33 48.2 49.3 100.0
Porto Trombetas (MRN) (Brazil)(c) O/P 281 49.7 41 48.9 134 49.9 456 468 49.7 49.6 12.0
Sangaredi (Guinea)(d) O/P 23 44.8 4,996 47.4 642 46.4 5,660 5,850 47.2 47.2 23.0
Weipa (Australia)(e)
– East Weipa and Andoom(f) O/P 15 49.5 15 48 49.5 53.2 100.0
– North of Weipa(g) O/P 1,330 52.0 1,330 1,054 52.0 52.2 100.0
– Amrun(h) O/P 60 50.9 305 49.3 270 50.5 635 628 49.9 50.1 100.0
Borates(i)millions
of tonnesmillions
of tonnesmillions
of tonnesmillions
of tonnesmillions
of tonnes
Rio Tinto Borates – Boron (US)(j) O/P – 8.5 100.0
Jadar (Serbia)(k) U/G 10 11 21 21 100.0
Likely mining
method(a)Coaltype(l)
Coal resources at end 2018
Total resources 2018 compared with 2017Rio Tinto Interest
%
2018 2017
Measured Indicated Inferred Tonnage Tonnage
Coalmillions
of tonnesmillions
of tonnesmillions
of tonnesmillions
of tonnesmillions
of tonnes
Rio Tinto Coal Australia(m)
Hail Creek O/C+U/G SC+MC – 601 –
Kestrel Coal U/G SC+MC – 241 –
Lake Elphinstone O/C SC+MC – 162 –
Mount Robert O/C SC+MC – 31 –
Valeria O/C SC – 762 –
Winchester South O/C MC – 356 –
Mineral resources
As required by the Australian Securities Exchange, the following tables contain details of other mineralisation that has a reasonable prospect of being economically extracted in the future but which is not yet classified as Proved or Probable Ore Reserves. This material is defined as Mineral Resources under the JORC Code. Estimates of such material are based largely on geological information with only preliminary consideration of mining, economic and other factors. While in the judgment of the Competent Person there are realistic expectations that all or part of the Mineral Resources will eventually become Proved or Probable Ore Reserves, there is no guarantee that this will occur as the result depends on further
technical and economic studies and prevailing economic conditions in the future. As in the case of Ore Reserves, managed operations’ estimates are completed using or testing against Rio Tinto long-term pricing and market forecasts/scenarios. Mineral Resources are stated as additional to the Ore Reserves reported earlier. Where operations are not managed by Rio Tinto, the Mineral Resources are published as received from the managing company. Where new project Mineral Resources or Ore Reserves are footnoted as being reported for the first time, additional information about them can be viewed on the Rio Tinto website.
Annual report 2018 | riotinto.com 275
Production, reserves and operations
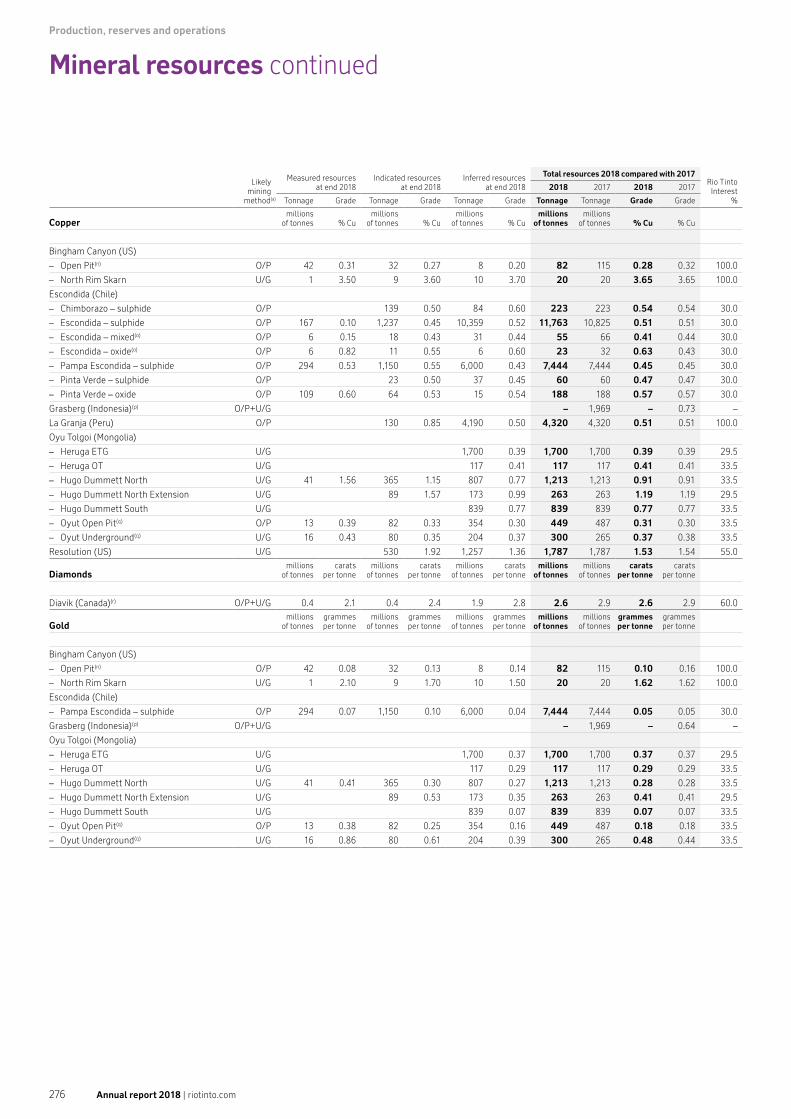
Production, reserves and operations
Mineral resources continued
Likely mining
method(a)
Measured resources at end 2018
Indicated resources at end 2018
Inferred resources at end 2018
Total resources 2018 compared with 2017Rio Tinto Interest
%
2018 2017 2018 2017
Tonnage Grade Tonnage Grade Tonnage Grade Tonnage Tonnage Grade Grade
Coppermillions
of tonnes % Cumillions
of tonnes % Cumillions
of tonnes % Cumillions
of tonnesmillions
of tonnes % Cu % Cu
Bingham Canyon (US)
– Open Pit(n) O/P 42 0.31 32 0.27 8 0.20 82 115 0.28 0.32 100.0
– North Rim Skarn U/G 1 3.50 9 3.60 10 3.70 20 20 3.65 3.65 100.0
Escondida (Chile)
– Chimborazo – sulphide O/P 139 0.50 84 0.60 223 223 0.54 0.54 30.0
– Escondida – sulphide O/P 167 0.10 1,237 0.45 10,359 0.52 11,763 10,825 0.51 0.51 30.0
– Escondida – mixed(o) O/P 6 0.15 18 0.43 31 0.44 55 66 0.41 0.44 30.0
– Escondida – oxide(o) O/P 6 0.82 11 0.55 6 0.60 23 32 0.63 0.43 30.0
– Pampa Escondida – sulphide O/P 294 0.53 1,150 0.55 6,000 0.43 7,444 7,444 0.45 0.45 30.0
– Pinta Verde – sulphide O/P 23 0.50 37 0.45 60 60 0.47 0.47 30.0
– Pinta Verde – oxide O/P 109 0.60 64 0.53 15 0.54 188 188 0.57 0.57 30.0
Grasberg (Indonesia)(p) O/P+U/G – 1,969 – 0.73 –
La Granja (Peru) O/P 130 0.85 4,190 0.50 4,320 4,320 0.51 0.51 100.0
Oyu Tolgoi (Mongolia)
– Heruga ETG U/G 1,700 0.39 1,700 1,700 0.39 0.39 29.5
– Heruga OT U/G 117 0.41 117 117 0.41 0.41 33.5
– Hugo Dummett North U/G 41 1.56 365 1.15 807 0.77 1,213 1,213 0.91 0.91 33.5
– Hugo Dummett North Extension U/G 89 1.57 173 0.99 263 263 1.19 1.19 29.5
– Hugo Dummett South U/G 839 0.77 839 839 0.77 0.77 33.5
– Oyut Open Pit(q) O/P 13 0.39 82 0.33 354 0.30 449 487 0.31 0.30 33.5
– Oyut Underground(q) U/G 16 0.43 80 0.35 204 0.37 300 265 0.37 0.38 33.5
Resolution (US) U/G 530 1.92 1,257 1.36 1,787 1,787 1.53 1.54 55.0
Diamondsmillions
of tonnescarats
per tonnemillions
of tonnescarats
per tonnemillions
of tonnescarats
per tonnemillions
of tonnesmillions
of tonnescarats
per tonnecarats
per tonne
Diavik (Canada)(r) O/P+U/G 0.4 2.1 0.4 2.4 1.9 2.8 2.6 2.9 2.6 2.9 60.0
Goldmillions
of tonnesgrammesper tonne
millionsof tonnes
grammesper tonne
millionsof tonnes
grammesper tonne
millionsof tonnes
millionsof tonnes
grammesper tonne
grammesper tonne
Bingham Canyon (US)
– Open Pit(n) O/P 42 0.08 32 0.13 8 0.14 82 115 0.10 0.16 100.0
– North Rim Skarn U/G 1 2.10 9 1.70 10 1.50 20 20 1.62 1.62 100.0
Escondida (Chile)
– Pampa Escondida – sulphide O/P 294 0.07 1,150 0.10 6,000 0.04 7,444 7,444 0.05 0.05 30.0
Grasberg (Indonesia)(p) O/P+U/G – 1,969 – 0.64 –
Oyu Tolgoi (Mongolia)
– Heruga ETG U/G 1,700 0.37 1,700 1,700 0.37 0.37 29.5
– Heruga OT U/G 117 0.29 117 117 0.29 0.29 33.5
– Hugo Dummett North U/G 41 0.41 365 0.30 807 0.27 1,213 1,213 0.28 0.28 33.5
– Hugo Dummett North Extension U/G 89 0.53 173 0.35 263 263 0.41 0.41 29.5
– Hugo Dummett South U/G 839 0.07 839 839 0.07 0.07 33.5
– Oyut Open Pit(q) O/P 13 0.38 82 0.25 354 0.16 449 487 0.18 0.18 33.5
– Oyut Underground(q) U/G 16 0.86 80 0.61 204 0.39 300 265 0.48 0.44 33.5
Annual report 2018 | riotinto.com276

Mineral resources
Likely mining
method(a)
Measured resources at end 2018
Indicated resources at end 2018
Inferred resources at end 2018
Total resources 2018 compared with 2017Rio Tinto Interest
%
2018 2017 2018 2017
Tonnage Grade Tonnage Grade Tonnage Grade Tonnage Tonnage Grade Grade
Iron ore(s)millions
of tonnes % Femillions
of tonnes % Femillions
of tonnes % Femillions
of tonnesmillions
of tonnes % Fe % Fe
Hamersley Iron (Australia)
– Brockman O/P 438 62.4 753 62.4 2,098 62.1 3,289 3,141 62.2 62.2 100.0
– Brockman Process Ore O/P 279 57.4 236 57.1 655 57.3 1,170 1,181 57.3 57.4 100.0
– Marra Mamba(t) O/P 180 62.1 361 61.8 1,144 61.3 1,685 1,594 61.5 61.7 100.0
– Detrital(u) O/P 3 61.1 120 61.4 691 60.9 814 666 61.0 61.2 100.0
– Channel Iron Deposit O/P 596 57.0 265 56.6 2,138 56.8 2,999 2,891 56.8 56.9 100.0
Channar JV (Australia)
– Brockman O/P 28 62.1 7 61.9 6 61.7 41 38 62.0 61.9 60.0
– Brockman Process Ore O/P 13 57.5 3 57.0 1 56.9 17 18 57.4 57.4 60.0
Eastern Range JV (Australia)
– Brockman(v) O/P 15 61.9 5 61.7 1 61.4 21 28 61.8 61.9 54.0
– Brockman Process Ore(v) O/P 11 56.6 3 56.7 1 58.1 15 17 56.7 56.7 54.0
Hope Downs JV (Australia)
– Brockman O/P 51 62.7 373 62.6 242 62.1 666 668 62.4 62.4 50.0
– Brockman Process Ore O/P 24 57.1 254 56.5 106 56.4 384 393 56.5 56.6 50.0
– Marra Mamba O/P 138 62.9 127 61.5 158 60.7 423 434 61.7 61.6 50.0
– Detrital O/P 23 59.2 83 59.5 106 116 59.4 59.6 50.0
Rhodes Ridge JV (Australia)
– Brockman O/P 565 63.9 1,462 62.6 2,027 2,027 62.9 62.9 50.0
– Brockman Process Ore O/P 176 57.6 484 56.5 660 660 56.8 56.8 50.0
– Marra Mamba O/P 25 61.3 2,589 62.0 2,614 2,574 61.9 62.0 50.0
– Detrital(w) O/P 328 60.1 328 263 60.1 60.0 50.0
Robe JV (Australia)
– Brockman(x) O/P 156 62.5 462 61.3 618 489 61.6 61.3 53.0
– Brockman Process Ore(x) O/P 75 56.8 413 56.7 488 359 56.7 56.7 53.0
– Marra Mamba O/P 140 61.8 201 61.5 186 61.1 527 510 61.4 61.5 53.0
– Detrital(x) O/P 23 59.5 101 61.0 124 95 60.8 60.7 53.0
– Channel Iron Deposit O/P 230 55.1 1,611 58.7 2,462 55.8 4,303 4,376 56.8 56.8 53.0
Iron Ore Company of Canada (Canada)(y) O/P 156 41.0 727 38.7 1,033 38.0 1,916 1,934 38.5 38.5 58.7
Simandou (Guinea) O/P 324 66.8 1,709 65.3 723 65.1 2,757 2,757 65.5 65.5 45.1
Lithiummillions
of tonnes % Li2Omillions
of tonnes % Li2Omillions
of tonnes % Li2Omillions
of tonnesmillions
of tonnes % Li2O % Li2O
Jadar (Serbia) U/G 53 1.8 83 1.9 136 136 1.9 1.9 100.0
Molydenummillions
of tonnes % Momillions
of tonnes % Momillions
of tonnes % Momillions
of tonnesmillions
of tonnes % Mo % Mo
Bingham Canyon (US)(z)
– Open Pit(n) O/P 42 0.037 32 0.060 8 0.006 82 115 0.043 0.047 100.0
Oyu Tolgoi (Mongolia)
– Heruga ETG U/G 1,700 0.011 1,700 1,700 0.011 0.011 29.5
– Heruga OT U/G 117 0.011 117 117 0.011 0.011 33.5
Resolution (US) U/G 530 0.039 1,257 0.035 1,787 1,787 0.036 0.035 55.0
Annual report 2018 | riotinto.com 277
Production, reserves and operations
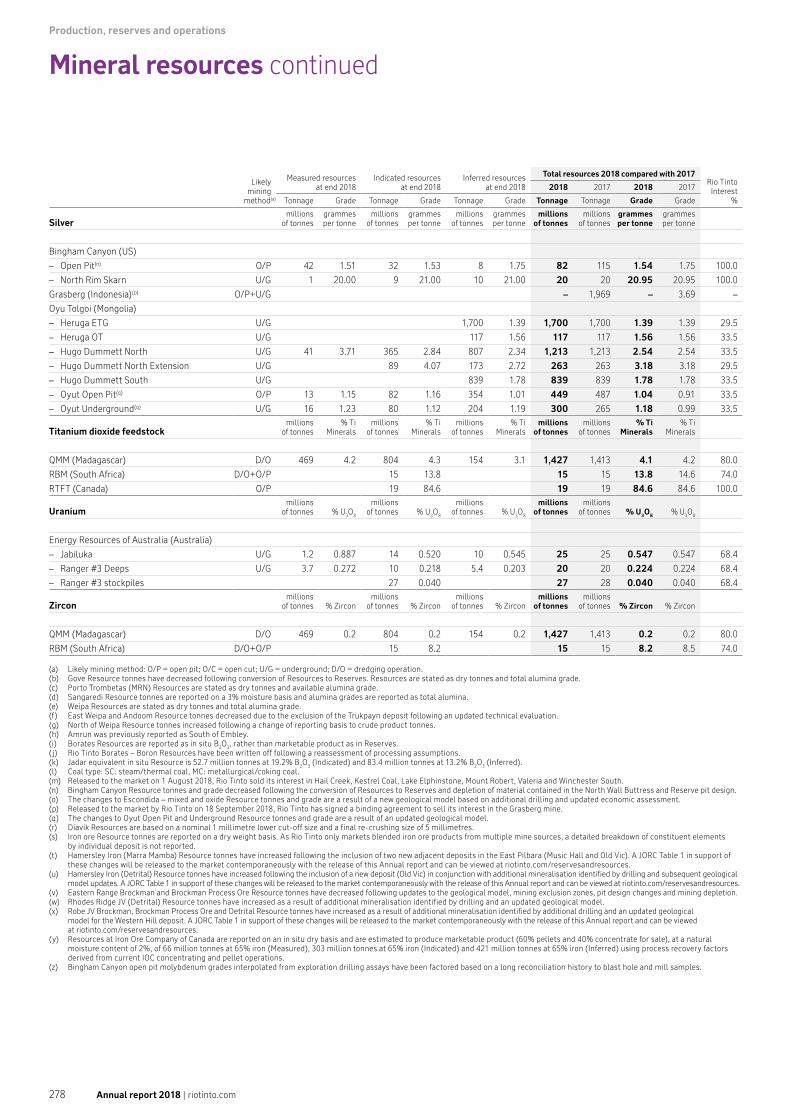
Production, reserves and operations
Mineral resources continued
Likely mining
method(a)
Measured resources at end 2018
Indicated resources at end 2018
Inferred resources at end 2018
Total resources 2018 compared with 2017Rio Tinto Interest
%
2018 2017 2018 2017
Tonnage Grade Tonnage Grade Tonnage Grade Tonnage Tonnage Grade Grade
Silvermillions
of tonnesgrammesper tonne
millionsof tonnes
grammesper tonne
millionsof tonnes
grammesper tonne
millionsof tonnes
millionsof tonnes
grammesper tonne
grammesper tonne
Bingham Canyon (US)
– Open Pit(n) O/P 42 1.51 32 1.53 8 1.75 82 115 1.54 1.75 100.0
– North Rim Skarn U/G 1 20.00 9 21.00 10 21.00 20 20 20.95 20.95 100.0
Grasberg (Indonesia)(p) O/P+U/G – 1,969 – 3.69 –
Oyu Tolgoi (Mongolia)
– Heruga ETG U/G 1,700 1.39 1,700 1,700 1.39 1.39 29.5
– Heruga OT U/G 117 1.56 117 117 1.56 1.56 33.5
– Hugo Dummett North U/G 41 3.71 365 2.84 807 2.34 1,213 1,213 2.54 2.54 33.5
– Hugo Dummett North Extension U/G 89 4.07 173 2.72 263 263 3.18 3.18 29.5
– Hugo Dummett South U/G 839 1.78 839 839 1.78 1.78 33.5
– Oyut Open Pit(q) O/P 13 1.15 82 1.16 354 1.01 449 487 1.04 0.91 33.5
– Oyut Underground(q) U/G 16 1.23 80 1.12 204 1.19 300 265 1.18 0.99 33.5
Titanium dioxide feedstockmillions
of tonnes% Ti
Mineralsmillions
of tonnes% Ti
Mineralsmillions
of tonnes% Ti
Mineralsmillions
of tonnesmillions
of tonnes% Ti
Minerals% Ti
Minerals
QMM (Madagascar) D/O 469 4.2 804 4.3 154 3.1 1,427 1,413 4.1 4.2 80.0
RBM (South Africa) D/O+O/P 15 13.8 15 15 13.8 14.6 74.0
RTFT (Canada) O/P 19 84.6 19 19 84.6 84.6 100.0
Uraniummillions
of tonnes % U3O8
millionsof tonnes % U3O8
millionsof tonnes % U3O8
millionsof tonnes
millionsof tonnes % U3O8 % U3O8
Energy Resources of Australia (Australia)
– Jabiluka U/G 1.2 0.887 14 0.520 10 0.545 25 25 0.547 0.547 68.4
– Ranger #3 Deeps U/G 3.7 0.272 10 0.218 5.4 0.203 20 20 0.224 0.224 68.4
– Ranger #3 stockpiles 27 0.040 27 28 0.040 0.040 68.4
Zirconmillions
of tonnes % Zirconmillions
of tonnes % Zirconmillions
of tonnes % Zirconmillions
of tonnesmillions
of tonnes % Zircon % Zircon
QMM (Madagascar) D/O 469 0.2 804 0.2 154 0.2 1,427 1,413 0.2 0.2 80.0
RBM (South Africa) D/O+O/P 15 8.2 15 15 8.2 8.5 74.0
(a) Likely mining method: O/P = open pit; O/C = open cut; U/G = underground; D/O = dredging operation. (b) Gove Resource tonnes have decreased following conversion of Resources to Reserves. Resources are stated as dry tonnes and total alumina grade. (c) Porto Trombetas (MRN) Resources are stated as dry tonnes and available alumina grade. (d) Sangaredi Resource tonnes are reported on a 3% moisture basis and alumina grades are reported as total alumina. (e) Weipa Resources are stated as dry tonnes and total alumina grade. (f) East Weipa and Andoom Resource tonnes decreased due to the exclusion of the Trukpayn deposit following an updated technical evaluation. (g) North of Weipa Resource tonnes increased following a change of reporting basis to crude product tonnes. (h) Amrun was previously reported as South of Embley. (i) Borates Resources are reported as in situ B2O3, rather than marketable product as in Reserves. ( j) Rio Tinto Borates – Boron Resources have been written off following a reassessment of processing assumptions. (k) Jadar equivalent in situ Resource is 52.7 million tonnes at 19.2% B2O3 (Indicated) and 83.4 million tonnes at 13.2% B2O3 (Inferred).(l) Coal type: SC: steam/thermal coal, MC: metallurgical/coking coal. (m) Released to the market on 1 August 2018, Rio Tinto sold its interest in Hail Creek, Kestrel Coal, Lake Elphinstone, Mount Robert, Valeria and Winchester South. (n) Bingham Canyon Resource tonnes and grade decreased following the conversion of Resources to Reserves and depletion of material contained in the North Wall Buttress and Reserve pit design. (o) The changes to Escondida – mixed and oxide Resource tonnes and grade are a result of a new geological model based on additional drilling and updated economic assessment. (p) Released to the market by Rio Tinto on 18 September 2018, Rio Tinto has signed a binding agreement to sell its interest in the Grasberg mine.(q) The changes to Oyut Open Pit and Underground Resource tonnes and grade are a result of an updated geological model.(r) Diavik Resources are based on a nominal 1 millimetre lower cut-off size and a final re-crushing size of 5 millimetres.(s) Iron ore Resource tonnes are reported on a dry weight basis. As Rio Tinto only markets blended iron ore products from multiple mine sources, a detailed breakdown of constituent elements
by individual deposit is not reported.(t) Hamersley Iron (Marra Mamba) Resource tonnes have increased following the inclusion of two new adjacent deposits in the East Pilbara (Music Hall and Old Vic). A JORC Table 1 in support of
these changes will be released to the market contemporaneously with the release of this Annual report and can be viewed at riotinto.com/reservesandresources. (u) Hamersley Iron (Detrital) Resource tonnes have increased following the inclusion of a new deposit (Old Vic) in conjunction with additional mineralisation identified by drilling and subsequent geological
model updates. A JORC Table 1 in support of these changes will be released to the market contemporaneously with the release of this Annual report and can be viewed at riotinto.com/reservesandresources. (v) Eastern Range Brockman and Brockman Process Ore Resource tonnes have decreased following updates to the geological model, mining exclusion zones, pit design changes and mining depletion. (w) Rhodes Ridge JV (Detrital) Resource tonnes have increased as a result of additional mineralisation identified by drilling and an updated geological model. (x) Robe JV Brockman, Brockman Process Ore and Detrital Resource tonnes have increased as a result of additional mineralisation identified by additional drilling and an updated geological
model for the Western Hill deposit. A JORC Table 1 in support of these changes will be released to the market contemporaneously with the release of this Annual report and can be viewed at riotinto.com/reservesandresources.
(y) Resources at Iron Ore Company of Canada are reported on an in situ dry basis and are estimated to produce marketable product (60% pellets and 40% concentrate for sale), at a natural moisture content of 2%, of 66 million tonnes at 65% iron (Measured), 303 million tonnes at 65% iron (Indicated) and 421 million tonnes at 65% iron (Inferred) using process recovery factors derived from current IOC concentrating and pellet operations.
(z) Bingham Canyon open pit molybdenum grades interpolated from exploration drilling assays have been factored based on a long reconciliation history to blast hole and mill samples.
Annual report 2018 | riotinto.com278
Mineral resources
Mineral resources and ore reserves corporate governanceRio Tinto has established a governance process supporting the generation and publication of Mineral Resources and Ore Reserves, which includes a series of structures and processes independent of the operational reporting through business units and product groups.
The Audit Committee has in its remit the governance of resources and reserves. This includes an annual review of Mineral Resources and Ore Reserves at a Group level, as well as review of findings and progress from the Group Resources and Reserves internal audit programme within the regular meeting schedule.
Rio Tinto also has an Ore Reserves Steering Committee (ORSC), which meets at least quarterly, chaired by the Group executive, Growth & Innovation, and comprises senior representatives from technical, financial, governance and business groups within the Group. The ORSC role includes oversight of the appointment of Competent Persons nominated by the business units, review of Exploration results, Mineral Resources or Ore Reserve data prior to public reporting and development of Group Resource and Reserves standards and guidance.
The Resource and Reserve internal audit programme is conducted by independent external consulting personnel in a programme managed by Group Internal Audit with the assistance of the ORSC. In 2018, four internal audits were completed. Material findings are reported outside of the product group reporting line to the Audit Committee, and all reports and action plans are reviewed by the ORSC for alignment to internal and external reporting standards.
Mineral Resources and Ore Reserves from externally managed operations, where Rio Tinto holds a minority share, are reported as received from the managing entity. Figures from Rio Tinto managed operations are the responsibility of the managing directors of the business units and estimates are carried out by Competent Persons as defined by JORC.
Rio Tinto has continued the development of internal systems and controls in order to meet JORC (2012) compliance in all external reporting including the preparation of all reported data by Competent Persons as members of The Australasian Institute of Mining and Metallurgy (The AusIMM), Australian Institute of Geoscientists (AIG) or recognised professional organisations (RPOs). JORC Table 1 reports for new or materially upgraded significant deposits are released to market by Rio Tinto and are also available on the Group’s website. JORC Table 1 and NI 43-101 technical reports generated by non-managed units or joint venture partners are referenced within the reporting footnotes with the location and initial reporting date identified.
As well as the establishment of an enhanced governance process, there have been a number of process improvements and training initiatives introduced by the ORSC over recent years, including a web-based group reporting and sign-off database, annual internal Competent Person reports and Competent Person development and training workshops.
Annual report 2018 | riotinto.com 279
Production, reserves and operations

Production, reserves and operations
Competent Persons
Association(a) Employer Accountability Deposits
Bauxite
L McAndrew AusIMMRio Tinto
Reserve Gove, East Weipa and Andoom, Amrun
G Rogers AusIMM Resource Gove, East Weipa and Andoom, North of Weipa, Amrun
M Keersemaker AusIMM CBG Consultant ReserveSangaredi
G Girouard AusIMM Compagnie des Bauxites de Guinée Resource
C J da Silva AusIMM MRN Consultant ReserveTrombetas
M A H Monteiro AusIMM Mineração Rio do Norte Resource
Borates
B Griffiths SMERio Tinto
Resource and ReserveRio Tinto Borates – Boron
R Torres AusIMM Resource
Copper
C Hehnke AusIMM Rio Tinto Resource Resolution(c)
M Bixley AusIMM
Rio Tinto
Reserve
Oyu Tolgoi(b)(c)(d)J Dudley AusIMM Reserve
O Dendev AusIMM Resource
K Schroeder AusIMM
Rio Tinto
Resource
Bingham Canyon(b)(c)(d)R Hayes AusIMM Resource
P Rodriguez AusIMM Resource
E Woods AusIMM Reserve
R Maureira AusIMMMinera Escondida Ltda.
ResourceEscondida, Escondida – Chimborazo – sulphide, Pampa Escondida – sulphide(b), Pinta Verde
F B Vargara AusIMM Reserve Escondida
J Marshall AusIMM Rio Tinto Resource La Granja
Diamonds
S Brennan AusIMMRio Tinto
Resource and ReserveArgyle Diamonds
M Rayner AusIMM Resource and Reserve
K Pollock NAPEGRio Tinto
Resource and ReserveDiavik
C Yip AusIMM Resource and Reserve
Iron ore
K Tindale AusIMM Rio Tinto Resource Simandou
T Leriche PEGNL
Rio Tinto
Resource and Reserve
Iron Ore Company of Canada
B Power PEGNL Resource
B Wallace PEGNL Resource
R Way PEGNL Resource
R Williams PEGNL Reserve
A Bertram AusIMM
Rio Tinto
ResourceRio Tinto Iron Ore – Hamersley, Channar, Eastern Range, Hope Downs, Robe, Rhodes Ridge
P Savory AusIMM Resource
B Sommerville AusIMM Resource
L Couto AusIMM Reserve
Rio Tinto Iron Ore – Hamersley, Channar, Eastern Range, Hope Downs, Robe
M Janas AusIMM Reserve
R Sarin AusIMM Reserve
R Verma AusIMM Reserve
Annual report 2018 | riotinto.com280
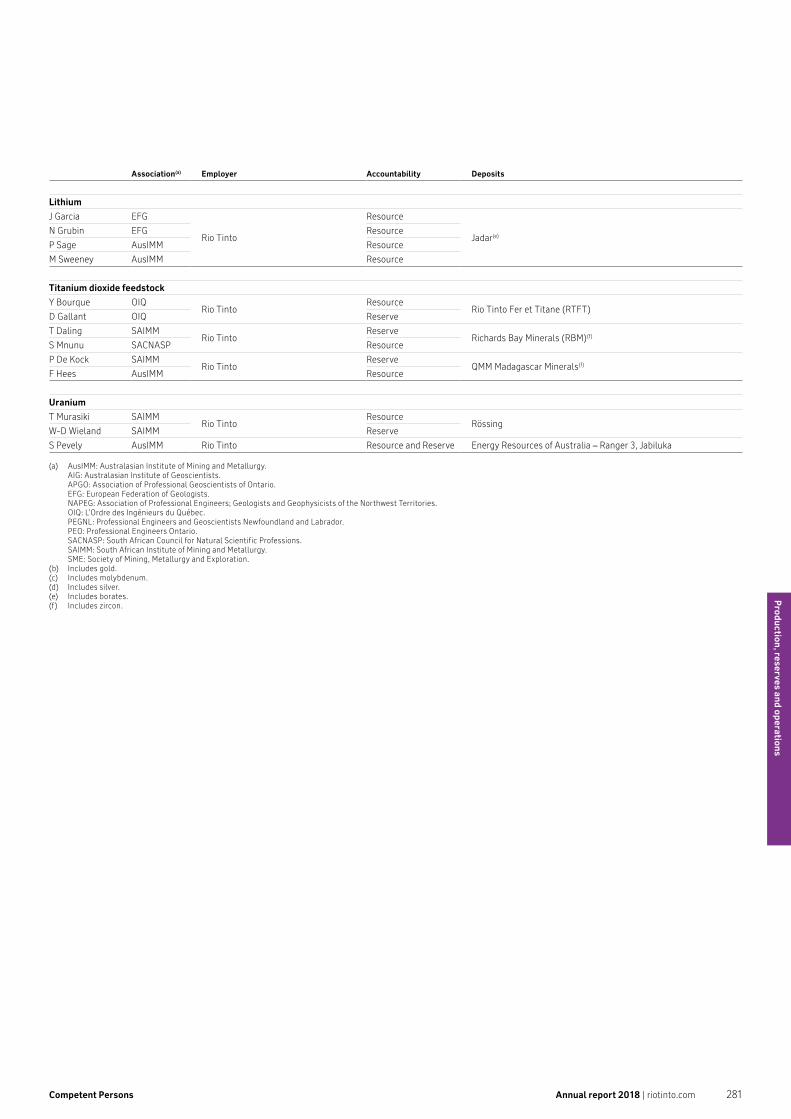
Competent Persons
Association(a) Employer Accountability Deposits
Lithium
J Garcia EFG
Rio Tinto
Resource
Jadar(e)N Grubin EFG Resource
P Sage AusIMM Resource
M Sweeney AusIMM Resource
Titanium dioxide feedstock
Y Bourque OIQRio Tinto
ResourceRio Tinto Fer et Titane (RTFT)
D Gallant OIQ Reserve
T Daling SAIMMRio Tinto
ReserveRichards Bay Minerals (RBM)(f)
S Mnunu SACNASP Resource
P De Kock SAIMMRio Tinto
ReserveQMM Madagascar Minerals(f)
F Hees AusIMM Resource
Uranium
T Murasiki SAIMMRio Tinto
ResourceRössing
W-D Wieland SAIMM Reserve
S Pevely AusIMM Rio Tinto Resource and Reserve Energy Resources of Australia – Ranger 3, Jabiluka
(a) AusIMM: Australasian Institute of Mining and Metallurgy. AIG: Australasian Institute of Geoscientists. APGO: Association of Professional Geoscientists of Ontario. EFG: European Federation of Geologists. NAPEG: Association of Professional Engineers; Geologists and Geophysicists of the Northwest Territories. OIQ: L’Ordre des Ingénieurs du Québec. PEGNL: Professional Engineers and Geoscientists Newfoundland and Labrador. PEO: Professional Engineers Ontario. SACNASP: South African Council for Natural Scientific Professions. SAIMM: South African Institute of Mining and Metallurgy. SME: Society of Mining, Metallurgy and Exploration.
(b) Includes gold.(c) Includes molybdenum.(d) Includes silver.(e) Includes borates.(f) Includes zircon.
Annual report 2018 | riotinto.com 281
Production, reserves and operations

Production, reserves and operations
Mines and production facilities
Group mines as at 31 December 2018 (Rio Tinto’s interest is 100% unless otherwise shown)
Mine Location Access Title/lease History Type of mine Power source
Iron Ore Iron OreHamersley Iron Brockman 2Brockman 4 MarandooMount Tom Price NammuldiParaburdoo SilvergrassWestern Turner Syncline Yandicoogina
Pilbara region, Western Australia
Railway and port (ownedby Hamersley Iron and operated by Pilbara Iron)
Agreements for life of mine with Government of Western Australia, save for the Yandicoogina mining lease, which expires in 2039 with an option to extend for 21 years.
Mount Tom Price began operations in 1966, followed by Paraburdoo in 1974. In the 1990s, Channar, Brockman 2, Marandoo and Yandicoogina achieved first ore. Annual capacity increased to 68 million tonnes during the 1990s and has more than doubled in the past 25 years. Since 2000, Eastern Ranges, Nammuldi, Brockman 4 and Western Turner Syncline have joined the network of Hamersley Iron mines. The brownfield mine expansion at such sites as Paraburdoo, Brockman 2, Nammuldi and Yandicoogina will enable production to meet expanded port and rail capacity in the coming years.
Open pit Supplied through the integrated Hamersley and Robe power network operated by Pilbara Iron
Eastern Range (54%) Pilbara region, Western Australia
Railway and port (owned by Hamersley Iron and operated by Pilbara Iron)
Mineral lease expires in 2028 with successive options to extend by 21 years. Rio Tinto owns 54% of the Bao-Hi joint venture with the remaining 46% held by China Baowu Group. The joint venture was created in 2002.
Open pit Supplied through the integrated Hamersley and Robe powernetwork operated by Pilbara Iron
Channar (60%) Pilbara region, Western Australia
Railway and port (owned by Hamersley Iron and operated by Pilbara Iron)
Mining lease expires in 2028 with an option to extend by five years. The Channar Mining Joint Venture, signed in 1987, was the first large-scale mining initiative between China and Australia. The joint venture is 60% owned by Rio Tinto (through Hamersley Iron) and 40% by Sinosteel Corporation. It has delivered more than 250 million tonnes to China.
Open pit Supplied through the integrated Hamersley and Robe power network operated by Pilbara Iron
Hope Downs 1 (50%) Pilbara region, Western Australia
Railway and port (owned by Hamersley Iron and operated by Pilbara Iron)
Mining lease expires in 2027 with two options to extend of 21 years each. Joint venture between Rio Tinto and Hancock Prospecting. Construction of Stage 1 to 22 million tonnes per annum commenced 2006 and first production occurred 2007. Stage 2 to 30 million tonnes per annum completed 2009.
Open pit Supplied through the integrated Hamersley and Robe power network operated by Pilbara Iron
Hope Downs 4 (50%) Pilbara region, Western Australia
Railway and port (owned by Hamersley Iron and operated by Pilbara Iron)
Mining lease expires in 2027 with two options to extend of 21 years each. Joint venture between Rio Tinto and Hancock Prospecting. Construction of wet plant processing to 15 million tonnes per annum commenced 2011 and first production occurred 2013.
Open pit Supplied through the integrated Hamersley and Robe power network operated by Pilbara Iron
Robe River Iron Associates (53%)Robe Valley (Mesa A and Mesa J)West Angelas
Pilbara region, Western Australia
Railway and port (owned by Robe River and operated by Pilbara Iron)
Agreements for life of mine with Government of Western Australia. First shipment in 1972 from Robe Valley. Interest acquired in 2000 through North Limited acquisition. First ore was shipped from West Angelas in 2002.
Open pit Supplied through the integrated Hamersley and Robe power network operated by Pilbara Iron
Aluminium AluminiumBauxite Bauxite
CBG Sangaredi (22.95%) Sangaredi, Guinea Road, air and port Mining concession expires in 2040. Bauxite mining commenced in 1973. Shareholders are 51% Halco and 49% Government of Guinea. Rio Tinto holds a 45% interest in Halco. Rated production capacity is 13.5 million tonnes per annum and actual annual production in 2017 was 15.6 million tonnes on a dry basis. Rio Tinto currently benefits from approximately 45% of the mine’s production. Expansion of the CBG bauxite mine, processing plant, port facility and associated infrastructure is currently ongoing, increasing production from 13.5 million tonnes to 18.5 million tonnes per annum in mid 2019.
Open cut On-site generation (fuel oil)
Gove Gove, Northern Territory, Australia
Road, air and port All leases were renewed in 2011 for a further period of 42 years. The residue disposal area is leased from the Arnhem Land Aboriginal Land Trust. The Northern Territory government is the lessor of the balance of the leases; however, on expiry of the 42-year renewed term, the land subject of the balances of the leases will all vest to the Arnhem Land Aboriginal Land Trust.
Bauxite mining commenced in 1970, feeding both the Gove refinery and export market, capped at two million tonnes per annum. Bauxite export ceased in 2006 with feed intended for the expanded Gove refinery. Bauxite exports recommenced in 2008 and will increase in the coming years following the curtailment of the refinery production in 2014 and permanent shut decision made by the board of Rio Tinto in October 2017. Current annual production capacity is 12.5 million tonnes on a dry basis.
Open cut On-site diesel fired power station
MRN Porto Trombetas (12%)
Porto Trombetas, Para, Brazil
Air or port Mining concession granted under the Brazilian mining code with no expiration date. Mineral extraction commenced in 1979. Initial production capacity 3.4 million tonnes annually. From 2003, production capacity up to 16.3 million tonnes per year on a dry basis. Capital structure currently: Vale (40%), BHP Billiton (14.8%), Rio Tinto (12%), CBA (10%), Alcoa/Abalco (18.2%), and Norsk Hydro (5%).
Open cut On-site generation (diesel)
Weipa/Ely Weipa, Queensland,Australia
Road, air and port The Queensland Government Comalco (ML7024) lease expires in 2042 with an option of a 21-year extension, then two years’ notice of termination; the Queensland Government Alcan lease (ML7031) expires in 2048 with a 21-year right of renewal with a two-year notice period.
Bauxite mining commenced in 1961 at Weipa. Major upgrade completed in 1998. Rio Tinto interest increased from 72.4% to 100% in 2000. In 1997, Ely Bauxite Mining Project Agreement signed with local Aboriginal land owners. Bauxite Mining and Exchange Agreement signed in 1998 with Comalco to allow for extraction of ore at Ely. The Western Cape Communities Co-Existence Agreement, an Indigenous Land Use Agreement, was signed in 2001. The current annual production of the Weipa mine is 30.4 million tonnes during the transition to Amrun. Shipments of Amrun bauxite commenced in December 2018 with the mine expected to reach a full production rate of 22.8 million tonnes a year during 2019. Amrun is expected to extend the Weipa mine life by approximately 40 years.
Open cut On-site generation (diesel) supplemented by a solar generation facility
Annual report 2018 | riotinto.com282

Mines and production facilities
Group mines as at 31 December 2018 (Rio Tinto’s interest is 100% unless otherwise shown)
Mine Location Access Title/lease History Type of mine Power source
Iron Ore Iron OreHamersley Iron Brockman 2Brockman 4 MarandooMount Tom Price NammuldiParaburdoo SilvergrassWestern Turner Syncline Yandicoogina
Pilbara region, Western Australia
Railway and port (ownedby Hamersley Iron and operated by Pilbara Iron)
Agreements for life of mine with Government of Western Australia, save for the Yandicoogina mining lease, which expires in 2039 with an option to extend for 21 years.
Mount Tom Price began operations in 1966, followed by Paraburdoo in 1974. In the 1990s, Channar, Brockman 2, Marandoo and Yandicoogina achieved first ore. Annual capacity increased to 68 million tonnes during the 1990s and has more than doubled in the past 25 years. Since 2000, Eastern Ranges, Nammuldi, Brockman 4 and Western Turner Syncline have joined the network of Hamersley Iron mines. The brownfield mine expansion at such sites as Paraburdoo, Brockman 2, Nammuldi and Yandicoogina will enable production to meet expanded port and rail capacity in the coming years.
Open pit Supplied through the integrated Hamersley and Robe power network operated by Pilbara Iron
Eastern Range (54%) Pilbara region, Western Australia
Railway and port (owned by Hamersley Iron and operated by Pilbara Iron)
Mineral lease expires in 2028 with successive options to extend by 21 years. Rio Tinto owns 54% of the Bao-Hi joint venture with the remaining 46% held by China Baowu Group. The joint venture was created in 2002.
Open pit Supplied through the integrated Hamersley and Robe powernetwork operated by Pilbara Iron
Channar (60%) Pilbara region, Western Australia
Railway and port (owned by Hamersley Iron and operated by Pilbara Iron)
Mining lease expires in 2028 with an option to extend by five years. The Channar Mining Joint Venture, signed in 1987, was the first large-scale mining initiative between China and Australia. The joint venture is 60% owned by Rio Tinto (through Hamersley Iron) and 40% by Sinosteel Corporation. It has delivered more than 250 million tonnes to China.
Open pit Supplied through the integrated Hamersley and Robe power network operated by Pilbara Iron
Hope Downs 1 (50%) Pilbara region, Western Australia
Railway and port (owned by Hamersley Iron and operated by Pilbara Iron)
Mining lease expires in 2027 with two options to extend of 21 years each. Joint venture between Rio Tinto and Hancock Prospecting. Construction of Stage 1 to 22 million tonnes per annum commenced 2006 and first production occurred 2007. Stage 2 to 30 million tonnes per annum completed 2009.
Open pit Supplied through the integrated Hamersley and Robe power network operated by Pilbara Iron
Hope Downs 4 (50%) Pilbara region, Western Australia
Railway and port (owned by Hamersley Iron and operated by Pilbara Iron)
Mining lease expires in 2027 with two options to extend of 21 years each. Joint venture between Rio Tinto and Hancock Prospecting. Construction of wet plant processing to 15 million tonnes per annum commenced 2011 and first production occurred 2013.
Open pit Supplied through the integrated Hamersley and Robe power network operated by Pilbara Iron
Robe River Iron Associates (53%)Robe Valley (Mesa A and Mesa J)West Angelas
Pilbara region, Western Australia
Railway and port (owned by Robe River and operated by Pilbara Iron)
Agreements for life of mine with Government of Western Australia. First shipment in 1972 from Robe Valley. Interest acquired in 2000 through North Limited acquisition. First ore was shipped from West Angelas in 2002.
Open pit Supplied through the integrated Hamersley and Robe power network operated by Pilbara Iron
Aluminium AluminiumBauxite Bauxite
CBG Sangaredi (22.95%) Sangaredi, Guinea Road, air and port Mining concession expires in 2040. Bauxite mining commenced in 1973. Shareholders are 51% Halco and 49% Government of Guinea. Rio Tinto holds a 45% interest in Halco. Rated production capacity is 13.5 million tonnes per annum and actual annual production in 2017 was 15.6 million tonnes on a dry basis. Rio Tinto currently benefits from approximately 45% of the mine’s production. Expansion of the CBG bauxite mine, processing plant, port facility and associated infrastructure is currently ongoing, increasing production from 13.5 million tonnes to 18.5 million tonnes per annum in mid 2019.
Open cut On-site generation (fuel oil)
Gove Gove, Northern Territory, Australia
Road, air and port All leases were renewed in 2011 for a further period of 42 years. The residue disposal area is leased from the Arnhem Land Aboriginal Land Trust. The Northern Territory government is the lessor of the balance of the leases; however, on expiry of the 42-year renewed term, the land subject of the balances of the leases will all vest to the Arnhem Land Aboriginal Land Trust.
Bauxite mining commenced in 1970, feeding both the Gove refinery and export market, capped at two million tonnes per annum. Bauxite export ceased in 2006 with feed intended for the expanded Gove refinery. Bauxite exports recommenced in 2008 and will increase in the coming years following the curtailment of the refinery production in 2014 and permanent shut decision made by the board of Rio Tinto in October 2017. Current annual production capacity is 12.5 million tonnes on a dry basis.
Open cut On-site diesel fired power station
MRN Porto Trombetas (12%)
Porto Trombetas, Para, Brazil
Air or port Mining concession granted under the Brazilian mining code with no expiration date. Mineral extraction commenced in 1979. Initial production capacity 3.4 million tonnes annually. From 2003, production capacity up to 16.3 million tonnes per year on a dry basis. Capital structure currently: Vale (40%), BHP Billiton (14.8%), Rio Tinto (12%), CBA (10%), Alcoa/Abalco (18.2%), and Norsk Hydro (5%).
Open cut On-site generation (diesel)
Weipa/Ely Weipa, Queensland,Australia
Road, air and port The Queensland Government Comalco (ML7024) lease expires in 2042 with an option of a 21-year extension, then two years’ notice of termination; the Queensland Government Alcan lease (ML7031) expires in 2048 with a 21-year right of renewal with a two-year notice period.
Bauxite mining commenced in 1961 at Weipa. Major upgrade completed in 1998. Rio Tinto interest increased from 72.4% to 100% in 2000. In 1997, Ely Bauxite Mining Project Agreement signed with local Aboriginal land owners. Bauxite Mining and Exchange Agreement signed in 1998 with Comalco to allow for extraction of ore at Ely. The Western Cape Communities Co-Existence Agreement, an Indigenous Land Use Agreement, was signed in 2001. The current annual production of the Weipa mine is 30.4 million tonnes during the transition to Amrun. Shipments of Amrun bauxite commenced in December 2018 with the mine expected to reach a full production rate of 22.8 million tonnes a year during 2019. Amrun is expected to extend the Weipa mine life by approximately 40 years.
Open cut On-site generation (diesel) supplemented by a solar generation facility
Annual report 2018 | riotinto.com 283
Production, reserves and operations
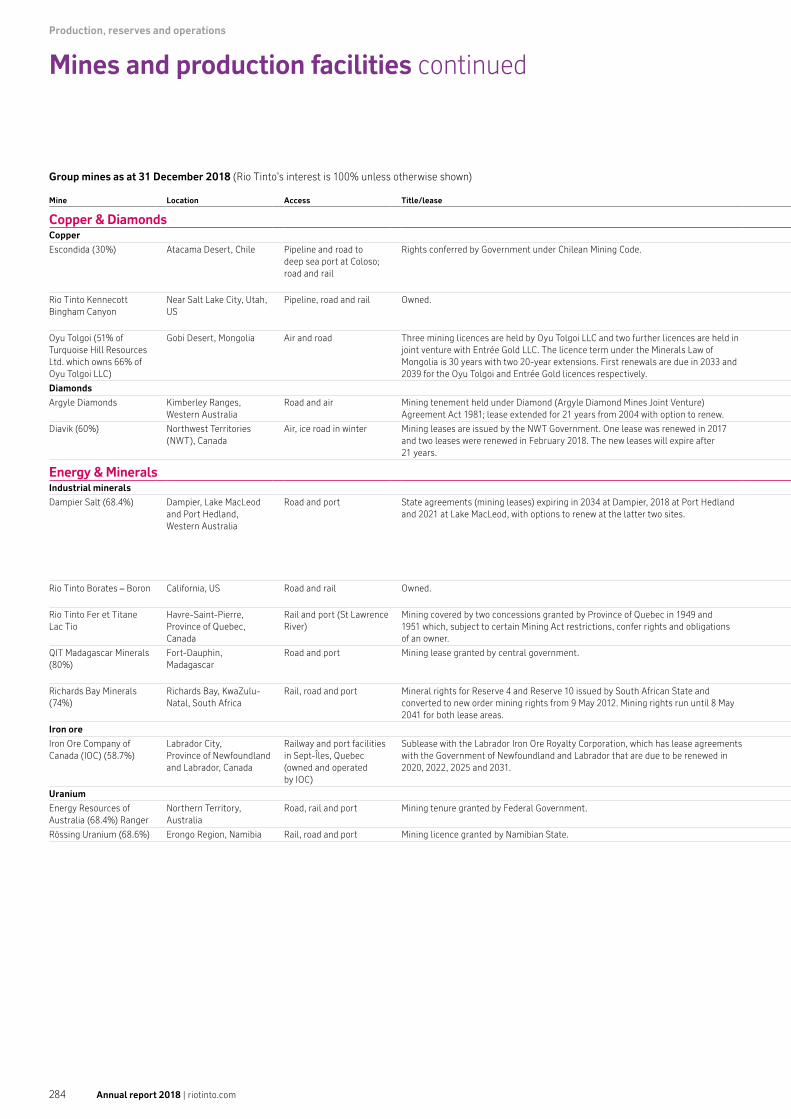
Production, reserves and operations
Group mines as at 31 December 2018 (Rio Tinto’s interest is 100% unless otherwise shown)
Mine Location Access Title/lease History Type of mine Power source
Copper & Diamonds Copper & DiamondsCopper Copper
Escondida (30%) Atacama Desert, Chile Pipeline and road to deep sea port at Coloso;road and rail
Rights conferred by Government under Chilean Mining Code. Production started in 1990 and since then capacity has been expanded numerous times. In 1998 first cathode was produced from the oxide leach plant, and during 2006 the sulphide leach plant was inaugurated, a year after the start of Escondida Norte pit production. During 2016, the third concentrator plant was commissioned.
Open pit Supplied from grid under various contracts with local generating companies
Rio Tinto Kennecott Bingham Canyon
Near Salt Lake City, Utah, US
Pipeline, road and rail Owned. Interest acquired in 1989. In 2012, the pushback of the south wall commenced, extending the mine life from 2018 to 2032.
Open pit On-site generation supplemented by long-term contracts with Rocky Mountain Power
Oyu Tolgoi (51% of Turquoise Hill Resources Ltd. which owns 66% of Oyu Tolgoi LLC)
Gobi Desert, Mongolia Air and road Three mining licences are held by Oyu Tolgoi LLC and two further licences are held in joint venture with Entrée Gold LLC. The licence term under the Minerals Law of Mongolia is 30 years with two 20-year extensions. First renewals are due in 2033 and 2039 for the Oyu Tolgoi and Entrée Gold licences respectively.
Oyu Tolgoi was first discovered in 1996. Construction began in late 2009 after signing of an Investment Agreement with the Government of Mongolia, and first concentrate was produced in 2012. First sales of concentrate were made to Chinese customers in 2013.
Open pit and underground Grid power from China and supplementary diesel power generation site
Diamonds Diamonds
Argyle Diamonds Kimberley Ranges, Western Australia
Road and air Mining tenement held under Diamond (Argyle Diamond Mines Joint Venture) Agreement Act 1981; lease extended for 21 years from 2004 with option to renew.
Interest increased from 59.7% following purchase of Ashton Mining in 2000. Underground mine project approved in 2005 to extend mine life to 2020.
Underground (previously open pit)
Long-term contract with Ord Hydro Consortium and on-site generation
Diavik (60%) Northwest Territories (NWT), Canada
Air, ice road in winter Mining leases are issued by the NWT Government. One lease was renewed in 2017 and two leases were renewed in February 2018. The new leases will expire after 21 years.
Deposits discovered 1994-1995. Construction approved 2000. Diamond production started 2003. Fourth pipe commenced production in 2018. Mine life through 2025.
Underground (previously open pit) and new A21 pipe is open pit
On-site diesel generators; installed capacity 44MW and 9.2MW of wind capacity
Energy & Minerals Energy & MineralsIndustrial minerals Industrial minerals
Dampier Salt (68.4%) Dampier, Lake MacLeod and Port Hedland, Western Australia
Road and port State agreements (mining leases) expiring in 2034 at Dampier, 2018 at Port Hedland and 2021 at Lake MacLeod, with options to renew at the latter two sites.
Construction of the Dampier field started in 1969; first shipment in 1972. Lake MacLeod was acquired in 1978 as an operating field. Port Hedland was acquired in 2001 as an operating field.
Solar evaporation of seawater (Dampier and Port Hedland) and underground brine (Lake MacLeod); extraction of gypsum from surface of Lake MacLeod
Dampier supply from Hamersley Iron Pty Ltd; Lake MacLeod from Horizon Power and on-site generation units; Port Hedland from Horizon Power
Rio Tinto Borates – Boron California, US Road and rail Owned. Deposit discovered in 1925 and acquired by Rio Tinto in 1967. Open pit On-site co-generation units and local power grid
Rio Tinto Fer et Titane Lac Tio
Havre-Saint-Pierre, Province of Quebec, Canada
Rail and port (St Lawrence River)
Mining covered by two concessions granted by Province of Quebec in 1949 and 1951 which, subject to certain Mining Act restrictions, confer rights and obligations of an owner.
Production started 1950; interest acquired in 1989. Open pit Supplied by Hydro Quebec at regulated tariff
QIT Madagascar Minerals (80%)
Fort-Dauphin, Madagascar
Road and port Mining lease granted by central government. Exploration project started in 1986; construction approved 2005. Ilmenite and zirsil production started 2008. QMM intends to extract ilmenite and zirsil from heavy mineral sands over an area of about 6,000 hectares along the coast over the next 40 years.
Mineral sand dredging On-site heavy fuel oil generators
Richards Bay Minerals (74%)
Richards Bay, KwaZulu-Natal, South Africa
Rail, road and port Mineral rights for Reserve 4 and Reserve 10 issued by South African State and converted to new order mining rights from 9 May 2012. Mining rights run until 8 May 2041 for both lease areas.
Production started 1977; initial interest acquired 1989. Fifth mining plant commissioned in 2000. One mining plant decommissioned in 2008. In September 2012, Rio Tinto doubled its holding in Richards Bay Minerals to 74% following the acquisition of BHP Billiton’s entire interests.
Dune sand dredging Contract with ESKOM
Iron ore Iron ore
Iron Ore Company of Canada (IOC) (58.7%)
Labrador City, Province of Newfoundland and Labrador, Canada
Railway and port facilitiesin Sept-Îles, Quebec (owned and operated by IOC)
Sublease with the Labrador Iron Ore Royalty Corporation, which has lease agreements with the Government of Newfoundland and Labrador that are due to be renewed in 2020, 2022, 2025 and 2031.
Interest acquired in 2000 through North. Current operation began in 1962 and has processed over one billion tonnes of crude ore since. Annual capacity 23 million tonnes of concentrate of which 12.5 million tonnes can be pelletised.
Open pit Supplied by Newfoundland and Labrador Hydro
Uranium Uranium
Energy Resources of Australia (68.4%) Ranger
Northern Territory, Australia
Road, rail and port Mining tenure granted by Federal Government. Mining commenced 1981. Interest acquired through acquisition of North 2000. Open pit mining ended 2012, since then ERA has been processing ore stockpiles.
Stockpile On-site diesel generation
Rössing Uranium (68.6%) Erongo Region, Namibia Rail, road and port Mining licence granted by Namibian State. Production began in 1976. Open pit Supplied by NamPower via grid network
Mines and production facilities continued
Annual report 2018 | riotinto.com284

Mines and production facilities
Group mines as at 31 December 2018 (Rio Tinto’s interest is 100% unless otherwise shown)
Mine Location Access Title/lease History Type of mine Power source
Copper & Diamonds Copper & DiamondsCopper Copper
Escondida (30%) Atacama Desert, Chile Pipeline and road to deep sea port at Coloso;road and rail
Rights conferred by Government under Chilean Mining Code. Production started in 1990 and since then capacity has been expanded numerous times. In 1998 first cathode was produced from the oxide leach plant, and during 2006 the sulphide leach plant was inaugurated, a year after the start of Escondida Norte pit production. During 2016, the third concentrator plant was commissioned.
Open pit Supplied from grid under various contracts with local generating companies
Rio Tinto Kennecott Bingham Canyon
Near Salt Lake City, Utah, US
Pipeline, road and rail Owned. Interest acquired in 1989. In 2012, the pushback of the south wall commenced, extending the mine life from 2018 to 2032.
Open pit On-site generation supplemented by long-term contracts with Rocky Mountain Power
Oyu Tolgoi (51% of Turquoise Hill Resources Ltd. which owns 66% of Oyu Tolgoi LLC)
Gobi Desert, Mongolia Air and road Three mining licences are held by Oyu Tolgoi LLC and two further licences are held in joint venture with Entrée Gold LLC. The licence term under the Minerals Law of Mongolia is 30 years with two 20-year extensions. First renewals are due in 2033 and 2039 for the Oyu Tolgoi and Entrée Gold licences respectively.
Oyu Tolgoi was first discovered in 1996. Construction began in late 2009 after signing of an Investment Agreement with the Government of Mongolia, and first concentrate was produced in 2012. First sales of concentrate were made to Chinese customers in 2013.
Open pit and underground Grid power from China and supplementary diesel power generation site
Diamonds Diamonds
Argyle Diamonds Kimberley Ranges, Western Australia
Road and air Mining tenement held under Diamond (Argyle Diamond Mines Joint Venture) Agreement Act 1981; lease extended for 21 years from 2004 with option to renew.
Interest increased from 59.7% following purchase of Ashton Mining in 2000. Underground mine project approved in 2005 to extend mine life to 2020.
Underground (previously open pit)
Long-term contract with Ord Hydro Consortium and on-site generation
Diavik (60%) Northwest Territories (NWT), Canada
Air, ice road in winter Mining leases are issued by the NWT Government. One lease was renewed in 2017 and two leases were renewed in February 2018. The new leases will expire after 21 years.
Deposits discovered 1994-1995. Construction approved 2000. Diamond production started 2003. Fourth pipe commenced production in 2018. Mine life through 2025.
Underground (previously open pit) and new A21 pipe is open pit
On-site diesel generators; installed capacity 44MW and 9.2MW of wind capacity
Energy & Minerals Energy & MineralsIndustrial minerals Industrial minerals
Dampier Salt (68.4%) Dampier, Lake MacLeod and Port Hedland, Western Australia
Road and port State agreements (mining leases) expiring in 2034 at Dampier, 2018 at Port Hedland and 2021 at Lake MacLeod, with options to renew at the latter two sites.
Construction of the Dampier field started in 1969; first shipment in 1972. Lake MacLeod was acquired in 1978 as an operating field. Port Hedland was acquired in 2001 as an operating field.
Solar evaporation of seawater (Dampier and Port Hedland) and underground brine (Lake MacLeod); extraction of gypsum from surface of Lake MacLeod
Dampier supply from Hamersley Iron Pty Ltd; Lake MacLeod from Horizon Power and on-site generation units; Port Hedland from Horizon Power
Rio Tinto Borates – Boron California, US Road and rail Owned. Deposit discovered in 1925 and acquired by Rio Tinto in 1967. Open pit On-site co-generation units and local power grid
Rio Tinto Fer et Titane Lac Tio
Havre-Saint-Pierre, Province of Quebec, Canada
Rail and port (St Lawrence River)
Mining covered by two concessions granted by Province of Quebec in 1949 and 1951 which, subject to certain Mining Act restrictions, confer rights and obligations of an owner.
Production started 1950; interest acquired in 1989. Open pit Supplied by Hydro Quebec at regulated tariff
QIT Madagascar Minerals (80%)
Fort-Dauphin, Madagascar
Road and port Mining lease granted by central government. Exploration project started in 1986; construction approved 2005. Ilmenite and zirsil production started 2008. QMM intends to extract ilmenite and zirsil from heavy mineral sands over an area of about 6,000 hectares along the coast over the next 40 years.
Mineral sand dredging On-site heavy fuel oil generators
Richards Bay Minerals (74%)
Richards Bay, KwaZulu-Natal, South Africa
Rail, road and port Mineral rights for Reserve 4 and Reserve 10 issued by South African State and converted to new order mining rights from 9 May 2012. Mining rights run until 8 May 2041 for both lease areas.
Production started 1977; initial interest acquired 1989. Fifth mining plant commissioned in 2000. One mining plant decommissioned in 2008. In September 2012, Rio Tinto doubled its holding in Richards Bay Minerals to 74% following the acquisition of BHP Billiton’s entire interests.
Dune sand dredging Contract with ESKOM
Iron ore Iron ore
Iron Ore Company of Canada (IOC) (58.7%)
Labrador City, Province of Newfoundland and Labrador, Canada
Railway and port facilitiesin Sept-Îles, Quebec (owned and operated by IOC)
Sublease with the Labrador Iron Ore Royalty Corporation, which has lease agreements with the Government of Newfoundland and Labrador that are due to be renewed in 2020, 2022, 2025 and 2031.
Interest acquired in 2000 through North. Current operation began in 1962 and has processed over one billion tonnes of crude ore since. Annual capacity 23 million tonnes of concentrate of which 12.5 million tonnes can be pelletised.
Open pit Supplied by Newfoundland and Labrador Hydro
Uranium Uranium
Energy Resources of Australia (68.4%) Ranger
Northern Territory, Australia
Road, rail and port Mining tenure granted by Federal Government. Mining commenced 1981. Interest acquired through acquisition of North 2000. Open pit mining ended 2012, since then ERA has been processing ore stockpiles.
Stockpile On-site diesel generation
Rössing Uranium (68.6%) Erongo Region, Namibia Rail, road and port Mining licence granted by Namibian State. Production began in 1976. Open pit Supplied by NamPower via grid network
Annual report 2018 | riotinto.com 285
Production, reserves and operations
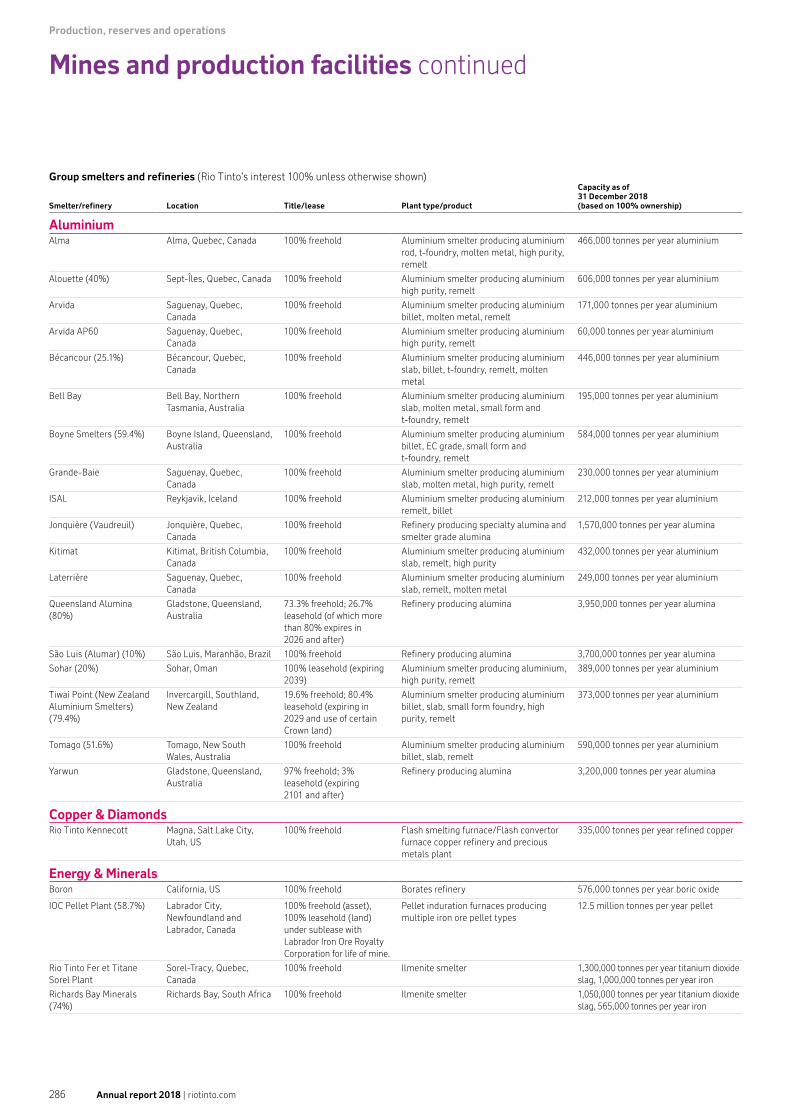
Production, reserves and operations
Group smelters and refineries (Rio Tinto’s interest 100% unless otherwise shown)
Smelter/refinery Location Title/lease Plant type/product
Capacity as of31 December 2018(based on 100% ownership)
AluminiumAlma Alma, Quebec, Canada 100% freehold Aluminium smelter producing aluminium
rod, t-foundry, molten metal, high purity, remelt
466,000 tonnes per year aluminium
Alouette (40%) Sept-Îles, Quebec, Canada 100% freehold Aluminium smelter producing aluminium high purity, remelt
606,000 tonnes per year aluminium
Arvida Saguenay, Quebec, Canada
100% freehold Aluminium smelter producing aluminium billet, molten metal, remelt
171,000 tonnes per year aluminium
Arvida AP60 Saguenay, Quebec, Canada
100% freehold Aluminium smelter producing aluminium high purity, remelt
60,000 tonnes per year aluminium
Bécancour (25.1%) Bécancour, Quebec, Canada
100% freehold Aluminium smelter producing aluminium slab, billet, t-foundry, remelt, molten metal
446,000 tonnes per year aluminium
Bell Bay Bell Bay, Northern Tasmania, Australia
100% freehold Aluminium smelter producing aluminium slab, molten metal, small form and t-foundry, remelt
195,000 tonnes per year aluminium
Boyne Smelters (59.4%) Boyne Island, Queensland, Australia
100% freehold Aluminium smelter producing aluminium billet, EC grade, small form and t-foundry, remelt
584,000 tonnes per year aluminium
Grande-Baie Saguenay, Quebec, Canada
100% freehold Aluminium smelter producing aluminium slab, molten metal, high purity, remelt
230,000 tonnes per year aluminium
ISAL Reykjavik, Iceland 100% freehold Aluminium smelter producing aluminium remelt, billet
212,000 tonnes per year aluminium
Jonquière (Vaudreuil) Jonquière, Quebec, Canada
100% freehold Refinery producing specialty alumina and smelter grade alumina
1,570,000 tonnes per year alumina
Kitimat Kitimat, British Columbia, Canada
100% freehold Aluminium smelter producing aluminium slab, remelt, high purity
432,000 tonnes per year aluminium
Laterrière Saguenay, Quebec, Canada
100% freehold Aluminium smelter producing aluminium slab, remelt, molten metal
249,000 tonnes per year aluminium
Queensland Alumina (80%)
Gladstone, Queensland, Australia
73.3% freehold; 26.7% leasehold (of which more than 80% expires in 2026 and after)
Refinery producing alumina 3,950,000 tonnes per year alumina
São Luis (Alumar) (10%) São Luis, Maranhão, Brazil 100% freehold Refinery producing alumina 3,700,000 tonnes per year alumina
Sohar (20%) Sohar, Oman 100% leasehold (expiring 2039)
Aluminium smelter producing aluminium, high purity, remelt
389,000 tonnes per year aluminium
Tiwai Point (New Zealand Aluminium Smelters) (79.4%)
Invercargill, Southland, New Zealand
19.6% freehold; 80.4% leasehold (expiring in 2029 and use of certain Crown land)
Aluminium smelter producing aluminium billet, slab, small form foundry, high purity, remelt
373,000 tonnes per year aluminium
Tomago (51.6%) Tomago, New South Wales, Australia
100% freehold Aluminium smelter producing aluminium billet, slab, remelt
590,000 tonnes per year aluminium
Yarwun Gladstone, Queensland, Australia
97% freehold; 3% leasehold (expiring 2101 and after)
Refinery producing alumina 3,200,000 tonnes per year alumina
Copper & DiamondsRio Tinto Kennecott Magna, Salt Lake City,
Utah, US100% freehold Flash smelting furnace/Flash convertor
furnace copper refinery and precious metals plant
335,000 tonnes per year refined copper
Energy & MineralsBoron California, US 100% freehold Borates refinery 576,000 tonnes per year boric oxide
IOC Pellet Plant (58.7%) Labrador City, Newfoundland and Labrador, Canada
100% freehold (asset), 100% leasehold (land) under sublease with Labrador Iron Ore Royalty Corporation for life of mine.
Pellet induration furnaces producing multiple iron ore pellet types
12.5 million tonnes per year pellet
Rio Tinto Fer et Titane Sorel Plant
Sorel-Tracy, Quebec, Canada
100% freehold Ilmenite smelter 1,300,000 tonnes per year titanium dioxide slag, 1,000,000 tonnes per year iron
Richards Bay Minerals (74%)
Richards Bay, South Africa 100% freehold Ilmenite smelter 1,050,000 tonnes per year titanium dioxide slag, 565,000 tonnes per year iron
Mines and production facilities continued
Annual report 2018 | riotinto.com286

Mines and production facilities
Information on Group power plants (Rio Tinto’s interest 100% unless otherwise shown)
Power plant Location Title/lease Plant type/product
Capacity as of31 December 2018(based on 100% ownership)
Iron OreCape Lambert power station(Rio Tinto: 67%)
Cape Lambert, Western Australia, Australia
Lease Two LM6000PS gas-fired turbines 80MW
Paraburdoo power station Paraburdoo, Western Australia, Australia
Lease Three LM6000PC gas-fired turbines One Frame5 dual-fuel turbine
138MW
Yurralyi Maya power station (Rio Tinto: 84.2%)
Dampier, Western Australia, Australia
Miscellaneous licence Four LM6000PD gas-fired turbines One LM6000PF gas-fired turbine (dual-fuel potential)
200MW
West Angelas power station (Rio Tinto: 67%)
West Angelas, Western Australia, Australia
Miscellaneous licence Two LM6000PF dual-fuel turbines 80MW
AluminiumGladstone power station (42%)
Gladstone, Queensland, Australia
100% freehold Thermal power station 1,680MW
Gove power station Nhulunbuy, Northern Territory, Australia
100% leasehold Diesel generation 24MW
Kemano power station Kemano, British Columbia, Canada
100% freehold Hydroelectric power 896MW
Quebec power stations Saguenay, Quebec, Canada (Chute-à-Caron, Chute-à-la- Savane, Chute-des-Passes, Chute-du-Diable, Isle-Maligne, Shipshaw)
100% freehold (certain facilities leased from Quebec Government until 2058 pursuant to Peribonka Lease)
Hydroelectric power 3,147MW
Yarwun alumina refinery co-generation plant
Gladstone, Queensland, Australia
100% freehold Gas turbine and heat recovery steam generator
160MW
Weipa power stations and solar generation facility
Lorim Point, Andoom, and Weipa, Australia
100% leasehold Diesel generation supplemented by solar generation facility
38MW
Amrun power station Amrun, Australia 100% leasehold Diesel generation 24MW
Copper & DiamondsRio Tinto Kennecott power stations
Salt Lake City, Utah, US 100% freehold Thermal power station
Steam turbine running off waste heat boilers at the copper smelter
Combined heat and power plant supplying steam to the copper refinery
75MW
31.8MW
6.2MW
Energy & MineralsBoron co-generation plant Boron, California, US 100% freehold Co-generation uses natural gas to
generate steam and electricity, used to run Boron’s refining operations
48MW
Energy Resources of Australia (Rio Tinto: 68.4%)
Ranger Mine, Jabiru, Northern Territory, Australia
Lease Five diesel generator sets rated at 5.17MW; one diesel generator set rated at 2MW; four additional diesel generator sets rated at 2MW
35.8MW
IOC power station Sept Îles, Quebec, Canada Statutory grant Hydroelectric power 22MW
QMM power plant Fort Dauphin, Madagascar 100% freehold Diesel generation 24MW
Annual report 2018 | riotinto.com 287
Production, reserves and operations

Independent Limited Assurance Report – Sustainable Development 290Shareholder information 292UK listing rules cross reference table 298Financial calendar 298Contact details 299Cautionary statement about forward-looking statements 300
Additional information
Annual report 2018 | riotinto.com288

Contributing to Queensland: Amrun comes online
Our flagship bauxite development in Queensland, Australia made its first shipment in December 2018, six weeks ahead of schedule.
This was a milestone for the award-winning project, which was built with advanced technology and a commitment to the Western Cape York community and strong partnership with the local Wik-Waya Traditional Owners.
Amrun’s economic impact has been felt across Australia; we have made more than A$2.1 billion in purchases from more than 1,200 Australian suppliers – over 800 from the state of Queensland. Western Cape York businesses alone have supplied more than A$240 million worth of goods and services. By the end of 2019, the mine is expected to produce up to 22.8 million tonnes of bauxite per year.
When I work at Amrun, it feels like home. I am surrounded by friends, some new and some old. I’ve grown new skills, and now I will continue to work at Amrun through operations. I am proud of what I’ve been able to achieve.”Helen KaryukaRio Tinto employee and Wik-Waya Traditional Owner
>A$2.1billionspent with >1,200 Australian suppliers
Annual report 2018 | riotinto.com 289
Additional inform
ation

Additional information
The board of directors of Rio Tinto plc and Rio Tinto Limited (together “Rio Tinto”) engaged us to provide limited assurance on the selected subject matter within the Sustainable development sections of the Rio Tinto 2018 Annual Report and the Rio Tinto 2018 Strategic report for the year ended 31 December 2018.
Our conclusion Based on the procedures we have performed and the evidence we have obtained, nothing has been identified that causes us to believe that the selected subject matter within the Sustainable Development sections of the Rio Tinto 2018 Annual Report and the Rio Tinto 2018 Strategic report for the year ended 31 December 2018 has not been prepared, in all material respects, in accordance with the Reporting Criteria. This conclusion is to be read in the context of what we say in the remainder of our report.
Selected informationThe scope of our work was limited to assurance over the selected subject matter within the Sustainable development sections of the Rio Tinto 2018 Annual Report and the Rio Tinto 2018 Strategic report for the year ended 31 December 2018 (the “Selected Information”).
The Selected Information and the Reporting Criteria against which it was assessed are summarised below.
Selected subject matter – Rio Tinto’s assertion that it has incorporated the requirements of the
10 sustainable development principles of the International Council on Mining and Metals (ICMM) and the mandatory requirements set out in ICMM Position Statements into its own policies.
– Rio Tinto’s assertions regarding the approach that it has adopted to identify and prioritise its material sustainable development risks and opportunities.
– Rio Tinto’s assertions regarding the existence and status of implementation of systems and approaches used to manage the following selected sustainable development risk areas: – Safety – Greenhouse gas emissions – Energy use – Water management
– The following Rio Tinto performance data related to the selected sustainable development risk areas: – Number of fatalities – All injury frequency rate – Lost time injury frequency rate – Number of lost time injuries – Total greenhouse gas emissions – Greenhouse gas emissions intensity – Total energy use – Percentage of managed operations with material water risk that
achieved their approved local water performance target
Our Independence and Quality ControlWe applied the Institute of Chartered Accountants in England and Wales (ICAEW) Code of Ethics, which includes independence and other requirements founded on fundamental principles of integrity, objectivity, professional competence and due care, confidentiality and professional behaviour. We apply International Standard on Quality Control (UK) 1 and accordingly maintain a comprehensive system of quality control including documented policies and procedures regarding compliance with ethical requirements, professional standards and applicable legal and regulatory requirements. Our work was carried out by an independent and multi-disciplinary team with experience in sustainability reporting and assurance.
Understanding reporting and measurement methodologiesThe Selected Information needs to be read and understood together with the Reporting Criteria, being the ICMM Sustainable Development Framework and the definitions and approaches within the Glossary which will be presented at www.riotinto.com/sd2018/glossary as at 27 February 2019, which Rio Tinto is solely responsible for selecting and applying. The absence of a significant body of established practice on which to draw to evaluate and measure non-financial information allows for different, but acceptable, measurement techniques and can affect comparability between entities and over time.
ResponsibilitiesPricewaterhouseCoopersWe are responsible for:
– planning and performing the engagement to obtain limited assurance about whether the Selected Information is free from material misstatement, whether due to fraud or error;
– forming an independent conclusion, based on the procedures we have performed and the evidence we have obtained; and
– reporting our conclusion to the Directors of Rio Tinto.
Rio TintoRio Tinto management are responsible for: – designing, implementing and maintaining internal controls over
information relevant to the preparation of the Selected Information that is free from material misstatement, whether due to fraud or error;
– establishing objective Reporting Criteria for preparing the Selected Information;
– measuring and reporting the Selected Information based on the Reporting Criteria; and
– the content of the Rio Tinto 2018 Annual Report and the Rio Tinto 2018 Strategic report.
Professional standards applied We performed a limited assurance engagement in accordance with International Standard on Assurance Engagements 3000 (Revised) ‘Assurance Engagements other than Audits and Reviews of Historical Financial Information’, issued by the International Auditing and Assurance Standards Board.
Independent Limited Assurance Report to the Directors of Rio Tinto plc and Rio Tinto Limited
Annual report 2018 | riotinto.com290
Inherent limitationsInherent limitations exist in all assurance engagements due to the selective testing of the information being examined. Therefore fraud, error or non-compliance may occur and not be detected. Additionally, non-financial data may be subject to more inherent limitations than financial data, given both its nature and the methods used for determining, calculating and sampling or estimating such data.
Restriction on useThis report, including our conclusions, has been prepared solely for the board of directors of Rio Tinto in accordance with the agreement between us, to assist the Directors in reporting Rio Tinto’s 2018 Annual Report and the Rio Tinto 2018 Strategic report performance and activities. To the fullest extent permitted by law, we do not accept or assume responsibility to anyone other than the board of directors and Rio Tinto for our work or this report except where terms are expressly agreed between us in writing. We permit this report to be disclosed in the Rio Tinto 2018 Annual Report and the Rio Tinto 2018 Strategic report for the year ended 31 December 2018, to assist the Directors in responding to their governance responsibilities by obtaining an independent assurance report in connection with the Selected Information.
Limited assuranceA limited assurance engagement is substantially less in scope than a reasonable assurance engagement in relation to both the risk assessment procedures, including an understanding of internal control, and the procedures performed in response to the assessed risks.
Work doneWe are required to plan and perform our work in order to consider the risk of material misstatement of the Selected Information. In doing so, we: – Made enquiries of relevant management of Rio Tinto regarding the
processes and controls for capturing, collating and reporting the performance data within the selected subject matter, and evaluating the design and effectiveness of these processes and controls;
– Validated the operation of controls over the accuracy of injury classification and assessing the final injury classification applied for a sample of injuries reported during the year ended 31 December 2018;
– Tested the arithmetic accuracy of a sample of calculations of performance data within the selected subject matter;
– Assessed the appropriateness of the greenhouse gas emission factors applied in calculating the Total greenhouse gas emissions and Greenhouse gas emissions intensity;
– Tested performance data, on a selective basis, substantively at both an operational and corporate level, which included testing at a selection of 5 operations from across Aluminium, Copper & Diamonds, Energy & Minerals, and Iron Ore;
– Undertook analytical procedures over the performance data within the selected subject matter; and
– Made enquiries of relevant management and reviewing a sample of relevant management information and documentation supporting assertions made in the selected subject matter.
We believe that the information we have obtained is sufficient and appropriate to provide a basis for our conclusion.
27 February 2019
PricewaterhouseCoopers LLPChartered Accountants 1 Embankment Place, London WC2N 6RH, United Kingdom
Independent Limited Assurance Report Annual report 2018 | riotinto.com 291
Additional inform
ation

Additional information
Shareholder information
Organisational structureThe Rio Tinto Group consists of Rio Tinto plc (registered in England and Wales as company number 719885 under the UK Companies Act 2006 and listed on the London Stock Exchange), and Rio Tinto Limited (registered in Australia as ABN 96 004 458 404 under the Australian Corporations Act 2001 and listed on the Australian Securities Exchange).
Rio Tinto is headquartered in London with a corporate office in Melbourne.
Rio Tinto plc has a sponsored American depositary receipts (ADR) facility, with underlying shares registered with the US Securities and Exchange Commission and listed on the New York Stock Exchange.
Nomenclature and financial dataRio Tinto plc and Rio Tinto Limited operate together and are referred to in this report as Rio Tinto, the Rio Tinto Group or the Group. These expressions are used for convenience, since both companies, and other companies in which they directly or indirectly own investments, are separate and distinct legal entities. We usually omit “Limited”, “plc”, “Pty”, “Inc.”, “Limitada”, “L.L.C.”, “A.S.” or “SA” from Group company names, except to distinguish between Rio Tinto plc and Rio Tinto Limited. Financial data in US dollars ($) is derived from, and should be read in conjunction with, the 2018 financial statements. In general, we have translated financial data in pounds sterling (£) and Australian dollars (A$) from the consolidated financial statements and have been provided solely for convenience; exceptions arise where data has been extracted directly from source records. Certain key information has been provided in US dollars, pounds sterling and Australian dollars in the 2018 financial statements.
HistoryRio Tinto plc was incorporated on 30 March 1962 (then called The Rio Tinto-Zinc Corporation Limited (RTZ)) and was formed by the merger of The Rio Tinto Company Limited and The Consolidated Zinc Corporation Limited. The Rio Tinto Company was incorporated in 1873 to reopen ancient copper workings in Spain. The Consolidated Zinc Corporation Limited began operations in the early twentieth century as part of the Australian mining industry. Based at Broken Hill in New South Wales, it began mining silver, lead and zinc deposits and later expanded into lead and zinc smelting.
Rio Tinto Limited was incorporated on 17 December 1959 (then called The Rio Tinto Mining Company of Australia Pty Limited). In 1962 the Australian interests of The Consolidated Zinc Corporation Limited and The Rio Tinto Company Limited were merged to form Conzinc Riotinto of Australia Limited, a limited liability company under the laws of the State of Victoria, Australia. In 1980, Conzinc Riotinto of Australia Limited changed its name to CRA Limited.
Between 1962 and 1995, both RTZ and CRA discovered important mineral deposits, developed major mining projects and grew through acquisition.
RTZ and CRA began operating in 1995 through a dual listed companies structure. In 1997, RTZ became Rio Tinto plc and CRA became Rio Tinto Limited.
Dual listed companies structureIn 1995, Rio Tinto shareholders approved the terms of the dual listed companies’ merger (the DLC structure). The aim was to put shareholders of both companies in substantially the same position they would be in if they held shares in a single entity owning all assets of both companies.
Following the approval of the DLC structure, both companies entered into a DLC Merger Sharing Agreement (the Sharing Agreement). As part of this both companies agreed to be managed in a unified way, to share the same board of directors, and to put in place arrangements to provide shareholders of both companies with a common economic interest in the DLC structure.
To achieve this third objective, the Sharing Agreement fixed the ratio of dividend, voting and capital distribution rights attached to each Rio Tinto
plc share and each Rio Tinto Limited share at an Equalisation Ratio of 1:1. This has remained unchanged ever since, although the Sharing Agreement makes clear this can be revised in special circumstances, for example where certain modifications are made to the share capital of one company (such as rights issues, bonus issues, share splits and share consolidations) but not to the other.
Outside the circumstances specified in the Sharing Agreement, the Equalisation Ratio can only be altered with the approval of shareholders under the class rights action approval procedure, described in the Voting arrangements section below. Any adjustments must be confirmed by the Group’s external auditors.
Consistent with the DLC structure, the directors of both companies aim to act in the best interests of Rio Tinto as a whole. The class rights action approval procedure exists to deal with instances where there may be a conflict of interest between the shareholders of the two companies.
To ensure that the boards of both companies are identical, resolutions to appoint or remove directors must be put to shareholders of both companies as Joint Decisions, described in the Voting arrangements section below. The Articles of Association of Rio Tinto plc and the Constitution of Rio Tinto Limited make clear that a person can only be a director of one company if he or she is also a director of the other. This means that if a person were removed as a director of Rio Tinto plc, he or she would also cease to be a director of Rio Tinto Limited.
One consequence of the DLC merger is that Rio Tinto is subject to a wide range of laws, rules and regulatory reviews across multiple jurisdictions. Where these rules differ, Rio Tinto will comply with the requirements in each jurisdiction at a minimum.
Dividend arrangementsThe Sharing Agreement ensures that dividends paid on Rio Tinto plc and Rio Tinto Limited shares are equalised on a net cash basis without taking into account any associated tax credits. Dividends are determined in US dollars and (with the exception of ADR holders, paid in sterling and Australian dollars), both companies are required to announce and pay dividends and other distributions at the same time or as close to this as possible.
In the unlikely event that one company does not have sufficient distributable reserves to pay the equalised dividend or equalised capital distribution, it would be entitled to a top-up payment from the other company. The top-up payment could be made as a dividend on the DLC dividend share, or by way of a contractual payment.
If the payment of an equalised dividend would contravene the law applicable to one of the companies, they can depart from the Equalisation Ratio. In that situation, the relevant company must put aside reserves for payment on the relevant shares at a later date.
Rio Tinto shareholders have no direct rights to enforce the dividend equalisation provisions of the Sharing Agreement.
By allowing dividends to be paid between companies and their subsidiaries, DLC dividend shares give the Group extra flexibility to manage internal funds.
Voting arrangementsIn principle, the Sharing Agreement enables the shareholders of Rio Tinto plc and Rio Tinto Limited to vote as a joint electorate on any matters that affect them in similar ways. These are referred to as Joint Decisions, and include the creation of new classes of share capital, the appointment or removal of directors and auditors, and the receiving of annual financial statements. All shareholder resolutions that include Joint Decisions are voted on a poll.
The Sharing Agreement also protects shareholders of both companies by
Annual report 2018 | riotinto.com292

Shareholder information
requiring joint approval for decisions that do not affect the shareholders of both companies equally. These are known as class rights actions, and are voted on a poll. For example, fundamental elements of the DLC structure cannot be changed unless approved separately by the shareholders of both companies.
Exceptions to these principles can arise in situations such as where legislation requires the separate approval of a decision by the appropriate majority of shareholders in one company, and where approval of the matter by shareholders of the other company is not required.
Where a matter has been expressly categorised as either a Joint Decision or a class rights action, the directors cannot change that categorisation. If a matter falls within both categories, it is treated as a class rights action. In addition, if an issue is not expressly listed in either category, directors can decide how it should be put to shareholders for approval.
To support joint voting arrangements, both companies have entered into shareholder voting agreements, where a Special Voting Share is issued to a special purpose company (SVC) and held in trust for shareholders by a common trustee. Rio Tinto plc (RTP) has issued its Special Voting Share (RTP Special Voting Share) to Rio Tinto Limited (RTL) Shareholder SVC, while Rio Tinto Limited has issued its Special Voting Share (RTL Special Voting Share) to RTP Shareholder SVC. The total number of votes cast on Joint Decisions by the shareholders of one company are decided at a parallel meeting of the other company. The exact role of these SVCs is described below.
In exceptional circumstances, certain shareholders can be excluded from voting at their respective company’s general meetings. For example, they may have acquired shares in the other company in excess of a given threshold without making an offer for all the shares in the other company. In this situation, votes cast by these excluded shareholders are disregarded.
Following the companies’ general meetings, the overall results of the voting are announced to relevant stock exchanges and the media, and published on the Rio Tinto website.
At a Rio Tinto plc shareholders’ meeting during which a Joint Decision is considered, each Rio Tinto plc share carries one vote. The holder of the Special Voting Share has one vote for each vote cast by the public shareholders of Rio Tinto Limited in their parallel meeting. The holder of the Special Voting Share must vote in accordance with the votes cast by public shareholders for and against the equivalent resolution at the parallel Rio Tinto Limited shareholders’ meeting. The holders of Rio Tinto Limited ordinary shares do not hold voting shares in Rio Tinto plc by virtue of their holding in Rio Tinto Limited, and cannot enforce the voting arrangements relating to the Special Voting Share.
Similarly, at a Rio Tinto Limited shareholders’ meeting during which a Joint Decision is considered, each Rio Tinto Limited share carries one vote and the holder of its Special Voting Share will have one vote for each vote cast by the public shareholders of Rio Tinto plc in their parallel meeting. The holder of the Special Voting Share must vote in accordance with the votes cast for and against the equivalent resolution at the parallel Rio Tinto plc shareholders’ meeting. The holders of Rio Tinto plc ordinary shares do not hold any voting shares in Rio Tinto Limited by virtue of their holding in Rio Tinto plc, and cannot enforce the voting arrangements relating to the Special Voting Share.
Capital distribution arrangementsIf either company goes into liquidation, the Sharing Agreement ensures a valuation is made of the surplus assets of both companies. If the surplus assets available for distribution by one company on each of the shares held by its shareholders exceed the surplus assets available for distribution by the other company on each of the shares held by its shareholders, then an equalising payment must be made – to the extent permitted by applicable law – such that the amount available for distribution on each share held by shareholders of both companies reflects the Equalisation Ratio.
The aim is to ensure the shareholders of both companies have equivalent entitlements to the assets of the combined Group on a per share basis, taking account of the equalisation ratio.
The Sharing Agreement does not grant any enforceable rights to the shareholders of either company upon liquidation of either company.
Limitations on ownership of shares and merger obligationsThe laws and regulations of the UK and Australia impose restrictions and obligations on persons who control interests in publicly listed companies in excess of defined thresholds. These can include an obligation to make a public offer for all outstanding issued shares of the relevant company. The threshold applicable to Rio Tinto plc under UK law and regulations is 30% and to Rio Tinto Limited under Australian law and regulations is 20% on both a standalone and Joint Decision basis.
As part of the DLC merger, the Articles of Association of Rio Tinto plc and the Constitution of Rio Tinto Limited were amended with the aim of extending these laws and regulations to the combined enterprise. This amendment also ensures that a person cannot exercise control over one company without having made offers to the public shareholders of both companies.
This guarantees the equal treatment of both sets of shareholders, and that the two companies are considered as a single economic entity. The Articles of Association of Rio Tinto plc and the Constitution of Rio Tinto Limited impose restrictions on any person who controls, directly or indirectly, 20% or more of the votes on a Joint Decision. If, however, such a person has an interest in either Rio Tinto Limited or Rio Tinto plc only, then the restrictions only apply if they control, directly or indirectly, 30% or more of the votes at that company’s general meetings.
If one of these thresholds is exceeded, the person cannot attend or vote at general meetings of the relevant company, cannot receive dividends or other distributions from the relevant company, and may be divested of their interest by the directors of the relevant company (subject to certain limited exceptions and notification by the relevant company). These restrictions continue to apply until that person has either made a public offer for all the publicly held shares of the other company, has reduced their controlling interest below the thresholds specified, or has acquired through a permitted means at least 50% of the publicly held shares of each company.
This arrangement ensures that offers for the publicly held shares of both companies would be required to avoid the restrictions set out above, even if the interests which breach the thresholds are held in just one of the companies. The directors do not have the discretion to exempt a person from the operation of these rules.
Under the Sharing Agreement, the companies agree to co-operate to enforce the above restrictions contained in their Articles of Association and Constitution.
GuaranteesIn 1995, each company entered into a deed poll guarantee in favour of creditors of the other company. In addition, each company guaranteed the contractual obligations of the other and the obligations of other persons guaranteed by the other company, subject to certain limited exceptions.
Beneficiaries under deed poll guarantees can make demands on the relevant guarantor without first having recourse to the company or persons whose obligations are being guaranteed. The obligations of the guarantor under each deed poll guarantee expire upon termination of the Sharing Agreement and under other limited circumstances, but only in respect of obligations arising after such termination and, in the case of other limited circumstances, the publication and expiry of due notice.
The shareholders of the companies cannot enforce the provisions of the deed poll guarantees in relation to their interest in the shares of the other company.
Annual report 2018 | riotinto.com 293
Additional inform
ation

Additional information
MarketsRio Tinto plcThe principal market for Rio Tinto plc shares is the London Stock Exchange, with shares trading through the Stock Exchange Electronic Trading Service (SETS) system.
Rio Tinto plc American depositary receipts (ADRs) are listed on the New York Stock Exchange.
Further details relating to Rio Tinto plc ADRs are available in Rio Tinto’s Annual report on Form 20-F.
The shareholders who have provided this notice or an equivalent as of 15 February 2019, being the last practicable date, are:
Rio Tinto plc Date of notice Number of shares
Percentage ofissued share
capital
BlackRock, Inc. 4 Dec 2009 127,744,871 8.38
The Capital Group Companies, Inc. 24 Feb 2015 56,647,518 4.01
The Capital Group Companies, Inc. 17 Sep 2015 54,763,331 3.93
The Capital Group Companies, Inc. 9 Oct 2015 55,867,795 4.02
Shining Prospect Pte. Ltd 26 Jan 2016 182,550,329 13.10
The Capital Group Companies, Inc. 8 Jan 2018 67,470,318 5.03
Shining Prospect Pte. Ltd 7 Dec 2018 182,550,329 14.02 (a)
Rio Tinto Limited (b)
BlackRock, Inc. 13 Apr 2015 See footnote (c) See footnote (c)
BlackRock, Inc. 14 Apr 2016 21,479,771 5.06
BlackRock, Inc. 11 Oct 2016 26,656,003 6.28
BlackRock, Inc. 19 Nov 2018 21,263,770 5.15
Blackrock, Inc. 13 Feb 2019 22,870,305 6.16
Shining Prospect Pte. Ltd 9 Feb 2018 See footnote (d) See footnote (d)
The Vanguard Group, Inc. 16 Feb 2018 See footnote (e) See footnote (e)
The Vanguard Group, Inc. 19 Jul 2018 20,623,906 5.00
(a) In its notification of major holdings filed on 7 December 2018, Shining Prospect Pte. Ltd, a Singapore-based entity owned by Chinalco (Aluminium Corporation of China) disclosed that its percentage of voting rights in Rio Tinto plc had increased to 14.02% on 18 October 2018. This increase in voting rights is due to the ongoing on-market share buy-back programme of Rio Tinto plc shares and the number of shares held by Shining Prospect Pte. Ltd has remained unchanged.(b) Entities in bold indicate the most recent substantial shareholder notices that have not been superseded by subsequent notices.(c) In its substantial holding notice filed on 13 April 2015, BlackRock, Inc. and its associates disclosed a holding of 120,174,604 shares in Rio Tinto plc and 22,330,443 shares in Rio Tinto Limited.
Through the operation of the Australian Corporations Act 2001 as modified, these interests gave BlackRock, Inc. and its associates voting power of 7.7% in the Rio Tinto Group on a Joint Decision matter, making them substantial shareholders of Rio Tinto Limited, as well as of Rio Tinto plc.
(d) In its notice of change of interests of substantial holder filed on 9 February 2018 Shining Prospect Pte. Ltd, disclosed a holding of 182,550,329 Rio Tinto plc shares which, as at 28 November 2017, gave this entity and its associates voting power of 10.32% in the Rio Tinto Group on a Joint Decision matter. Accordingly, in addition to being substantial shareholders of Rio Tinto plc, through the operation of the Australian Corporations Act 2001 as modified and the DLC structure, these entities are substantial shareholders of Rio Tinto Limited.
(e) In its substantial holding notice filed on 16 February 2018, The Vanguard Group, Inc. and its associate Vanguard Investments Australia Ltd (Vanguard) disclosed that on 16 June 2017 it held 21,914,711 shares in Rio Tinto Limited, giving it voting power of 5.166%. By separate notice dated 16 February 2018, Vanguard disclosed that on 15 December 2017 it had ceased to be a substantial holder of shares in Rio Tinto Limited.
As far as is known, Rio Tinto plc and Rio Tinto Limited are not directly or indirectly owned or controlled by another corporation or by any government or natural person. Rio Tinto is not aware of any arrangement that may result in a change in control of Rio Tinto plc or Rio Tinto Limited. No shareholder possesses voting rights that differ from those attaching to Rio Tinto plc’s and Rio Tinto Limited’s securities.
As of 15 February 2019, the total amount of the Group’s voting securities owned by the directors and executives in Rio Tinto plc was 160,388 ordinary shares of 10p each or ADRs, and in Rio Tinto Limited was 137,251 ordinary shares, in aggregate representing less than 1% of the Group’s total number of ordinary shares in issue.
Rio Tinto LimitedRio Tinto Limited shares are listed on the Australian Securities Exchange (ASX).
The ASX is the principal trading market for Rio Tinto Limited shares. The ASX is a national stock exchange with an automated trading system.
Share ownershipSubstantial shareholdersUnder the UK Disclosure and Transparency Rules and the Australian Corporations Act 2001, any shareholder of Rio Tinto plc with voting rights of 3% or more, or any person with voting power of 5% or more in Rio Tinto Limited, is required to provide the relevant companies with notice.
Shareholder information continued
Annual report 2018 | riotinto.com294

Analysis of ordinary shareholders
As at 15 February 2019 (last practicable date)
Rio Tinto plc Rio Tinto Limited
No. ofaccounts % Shares %
No. ofaccounts % Shares %
1 to 1,000 shares 24,933 75.58 7,670,827 0.60 133,905 84.36 38,143,860 10.28
1,001 to 5,000 shares 5,859 17.76 11,733,711 0.92 22,249 14.02 44,204,997 11.91
5,001 to 10,000 shares 633 1.92 4,376,745 0.34 1,724 1.09 11,921,263 3.21
10,001 to 25,000 shares 460 1.39 7,323,741 0.57 655 0.41 9,595,567 2.58
25,001 to 125,000 shares 553 1.68 32,864,409 2.57 147 0.09 6,524,292 1.76
125,001 to 250,000 shares 169 0.51 29,327,168 2.29 13 0.01 2,249,261 0.61
250,001 to 1,250,000 shares 248 0.75 137,302,429 10.74 21 0.01 11,421,222 3.08
1,250,001 to 2,500,000 shares 63 0.19 112,250,872 8.78 3 0.00 6,526,392 1.76
2,500,001 shares and over(a) 71 0.22 935,778,083(b) 73.19 8 0.01 240,629,360 64.82
1,278,627,985(c) 100 371,216,214(d) 100
Number of holdings less than marketable parcel of A$500 2,948
(a) Excludes shares held in Treasury.(b) This includes 119,178,675 shares held in the name of a nominee on the share register. The shares are listed on the NYSE in the form of American depositary receipts (ADRs). (c) The total issued share capital is made up of 1,278,627,985 publicly held shares, of which 9,440,735 are held in Treasury. (d) Publicly held shares in Rio Tinto Limited.
Twenty largest registered shareholdersThe following table lists the 20 largest registered holders of Rio Tinto Limited shares in accordance with the ASX listing rules, together with the number of shares and the percentage of issued capital each holds, as of 15 February 2019, being the last practicable date.
Rio Tinto Limited Number of shares
Percentage ofissued share
capital
HSBC Custody Nominees (Australia) Limited 113,813,123 30.66
J. P. Morgan Nominees Australia Limited 67,951,092 18.30
Citicorp Nominees Pty Ltd 21,357,600 5.75
National Nominees Limited 13,675,423 3.68
BNP Paribas Nominees Pty Ltd (Agency Lending DRP A/C) 11,725,761 3.16
BNP Paribas Noms Pty Ltd (DRP) 4,961,988 1.34
Citicorp Nominees Pty Limited (Colonial First State Inv A/C) 4,317,767 1.16
HSBC Custody Nominees (Australia) Limited (NT-Comnwlth Super Corp A/C) 2,826,606 0.76
Computershare Trustees Jey Ltd (RE 3000086 A/C) 2,360,137 0.64
Argo Investments Limited 2,220,739 0.60
Australian Foundation Investment Company Limited 1,945,516 0.52
AMP Life Limited 1,144,180 0.31
Computershare Comp Noms Ltd (VSA A/C) 1,140,572 0.31
Computershare Trustees Jey Ltd (RE 3000091 A/C) 1,061,326 0.29
Custodial Services Limited (Beneficiaries Holding A/C) 742,402 0.20
Milton Corporation Limited 660,118 0.18
The Senior Master of the Supreme Court (Common Fund No.3 A/C) 586,563 0.16
BNP Paribas Nominees Pty Ltd (Hub24 Custodial Serv Ltd DRP) 564,831 0.15
BNP Paribas Noms (NZ) Ltd (DRP) 538,001 0.14
Australian United Investment Company Limited 500,000 0.13
Shareholder information Annual report 2018 | riotinto.com 295
Additional inform
ation

Material contractsArticles of Association, Constitution, and DLC Sharing AgreementAs explained on pages 292 and 293, under the terms of the DLC structure shareholders of Rio Tinto plc and of Rio Tinto Limited entered into certain contractual arrangements designed to place the shareholders of both companies in substantially the same position as if they held shares in a single entity which owned all the assets of both companies. As far as is permitted by the UK Companies Act 2006, the Australian Corporations Act 2001 and ASX Listing Rules, this principle is reflected in the Articles of Association of Rio Tinto plc and in the Constitution of Rio Tinto Limited. The following summaries describe the material rights of shareholders of both Rio Tinto plc and Rio Tinto Limited.
ObjectsAt the 2009 AGMs, shareholders of Rio Tinto plc and Rio Tinto Limited approved amendments to their Articles of Association and Constitution whereby the object clauses were removed to allow the companies to have the widest possible scope of activities.
DirectorsUnder Rio Tinto plc’s Articles of Association, a director may not vote in respect of any proposal in which he or she, or any other person connected with him or her, has any interest, other than by virtue of his or her interests in shares or debentures or other securities of, in or through the company, except in certain circumstances, including in respect of resolutions:
– indemnifying him or her or a third party in respect of obligations incurred by the director on behalf of, or for the benefit of, the company, or in respect of obligations of the company, for which the director has assumed responsibility under an indemnity, security or guarantee;
– relating to an offer of securities in which he or she may be interested as a holder of securities or as an underwriter;
– concerning another body corporate in which the director is beneficially interested in less than 1% of the issued shares of any class of shares of such a body corporate;
– relating to an employee benefit in which the director will share equally with other employees;
– relating to liability insurance that the company is empowered to purchase for the benefit of directors of the company in respect of actions undertaken as directors (or officers) of the company; and
– concerning the giving of indemnities in favour of directors or the funding of expenditure by directors to defend criminal, civil or regulatory proceedings or actions against a director.
Under Rio Tinto Limited’s Constitution, a director may be present at a meeting of the board while a matter in which the director has a material personal interest is being considered and may vote in respect of that matter, except where a director is constrained by Australian law.
The directors are empowered to exercise all the powers of the companies to borrow money, to charge any property or business of the companies or all, or any, of their uncalled capital, and to issue debentures or give any other security for a debt, liability or obligation of the companies or of any other person. The directors shall restrict the borrowings of Rio Tinto plc to the limitation that the aggregate amount of all monies borrowed by the company and its subsidiaries shall not exceed an amount equal to 1 ½ times the companies’ share capital plus aggregate reserves unless sanctioned by an ordinary resolution of the company.
Directors are not required to hold any shares of either company by way of qualification. The Remuneration report on pages 101 to 136 provides information on shareholding policies relating to executive and non-executive directors. Please refer to the Directors’ report for information on the appointment of directors.
Rights attaching to sharesUnder UK law, dividends on shares may only be paid out of profits available for distribution, as determined in accordance with generally accepted accounting principles and by the relevant law. Shareholders are entitled to receive such dividends as may be declared by the directors. Directors may also pay shareholders interim dividends as justified by the financial position of the Group.
Under the Australian Corporations Act 2001, dividends on shares may only be paid if the company’s assets exceed its liabilities immediately before the dividend is declared, the excess is sufficient for the payment of the dividend, the payment is fair and reasonable to the company’s shareholders as a whole, and the payment does not materially prejudice the company’s ability to pay its creditors. Any Rio Tinto plc dividend unclaimed after 12 years from the date the dividend was declared, or became due for payment, will be forfeited and returned to the company. Any Rio Tinto Limited dividend unclaimed may be invested or otherwise used by the board for the benefit of the company until claimed or otherwise disposed of according to Australian law. Rio Tinto Limited is governed by the State of Victoria’s unclaimed monies legislation, which requires the company to pay to the state revenue office any unclaimed dividend payments of A$20 or more that on 1 March each year have remained unclaimed for over 12 months.
VotingVoting at any general meeting of shareholders on a resolution on which the holder of the Special Voting Share is entitled to vote shall be decided by a poll, and any other resolution shall be decided by a show of hands unless a poll has been duly demanded. On a show of hands, every shareholder who is present in person or by proxy (or other duly authorised representative) and is entitled to vote, has one vote regardless of the number of shares held. The holder of the Special Voting Share is not entitled to vote in a show of hands. On a poll, every shareholder who is present in person or by proxy (or other duly authorised representative) and is entitled to vote, has one vote for every ordinary share for which he or she is the holder. In the case of Joint Decisions, the holder of the Special Voting Share has one vote for each vote cast in respect of the publicly held shares of the other company.
A poll may be demanded by any of the following:
– the chairman of the meeting; – at least five shareholders entitled to vote on the resolution; – any shareholder(s) representing in the aggregate not less than one tenth
(Rio Tinto plc) or one 20th (Rio Tinto Limited) of the total voting rights of all shareholders entitled to vote on the resolution;
– any shareholder(s) holding Rio Tinto plc shares conferring a right to vote at the meeting on which there have been paid-up sums in the aggregate equal to not less than one tenth of the total sum paid up on all the shares conferring that right; or
– the holder of the Special Voting Share of either company.
A proxy form gives the proxy the authority to demand a poll, or to join others in demanding one.
The necessary quorum for a Rio Tinto plc general meeting is three members present (in person or by proxy or other duly authorised representative) and entitled to vote. For a Rio Tinto Limited general meeting it is two members present (in person or by proxy or other duly authorised representative).
Matters are transacted at general meetings by the proposing and passing of resolutions as:
– ordinary resolutions (for example the election of directors), which require the affirmative vote of a majority of persons voting at a meeting for which there is a quorum; and
– special resolutions (for example amending the Articles of Association of Rio Tinto plc or the Constitution of Rio Tinto Limited), which require the affirmative vote of not less than three-quarters of the persons voting at a meeting at which there is a quorum.
Additional information
Shareholder information continued
Annual report 2018 | riotinto.com296

The Sharing Agreement further classifies resolutions as Joint Decisions and class rights actions as explained on pages 292 and 293.
Annual general meetings must be convened with 21 days’ written notice for Rio Tinto plc and with 28 days’ notice for Rio Tinto Limited. In accordance with the authority granted by shareholders at the Rio Tinto plc AGM in 2018, other meetings of Rio Tinto plc may be convened with 14 days’ written notice for the passing of a special resolution, and with 14 days’ notice for any other resolution, depending on the nature of the business to be transacted. All meetings of Rio Tinto Limited require 28 days’ notice. In calculating the period of notice, any time taken to deliver the notice and the day of the meeting itself are not included. The notice must specify the nature of the business to be transacted.
Variation of rightsIf, at any time, the share capital is divided into different classes of shares, the rights attached to each class may be varied, subject to the provisions of the relevant legislation, the written consent of holders of three-quarters in value of the shares of that class, or upon the adoption of a special resolution passed at a separate meeting of the holders of the shares of that class. At every such meeting, all of the provisions of the Articles of Association and Constitution relating to proceedings at a general meeting apply, except that the quorum for Rio Tinto plc should be two or more persons who hold or represent by proxy not less than one-third in nominal value of the issued shares of the class.
Rights upon a winding-upExcept as the shareholders have agreed or may otherwise agree, upon a winding-up, the balance of assets available for distribution after the payment of all creditors (including certain preferential creditors, whether statutorily preferred creditors or normal creditors) and subject to any special rights attaching to any class of shares, is to be distributed among the holders of ordinary shares according to the amounts paid-up on the shares held by them. This distribution should generally be made in cash. A liquidator may, however, upon the adoption of a special resolution of the shareholders, divide among the shareholders the whole or any part of the assets in specie or kind.
The Sharing Agreement describes the distribution of assets of each of the companies in the event of a liquidation, as explained on pages 292 and 293.
Facility agreementDetails of the Group’s $7.5 billion multi-currency committed revolving credit facilities are set out in note 30 to the 2018 financial statements.
Exchange controls and foreign investmentRio Tinto plcThere are no UK foreign exchange controls or other restrictions on the import or export of capital by, or on the payment of dividends to, non-resident holders of Rio Tinto plc shares, or that materially affect the conduct of Rio Tinto plc’s operations. It should be noted, however, that various sanctions, laws, regulations or conventions may restrict the import or export of capital by, or the payment of dividends to, non-resident holders of Rio Tinto plc shares. There are no restrictions under Rio Tinto plc’s Articles of Association or under UK law that limit the right of non-resident owners to hold or vote Rio Tinto plc shares. However, certain of the provisions of the Australian Foreign Acquisitions and Takeovers Act 1975 (the Takeovers Act) described below also apply to the acquisition by non-Australian persons of interests in securities of Rio Tinto plc.
Rio Tinto LimitedUnder current Australian legislation, Australia does not impose general exchange or foreign currency controls. Subject to some specific requirements and restrictions, Australian and foreign currency may be freely brought into and sent out of Australia. There are requirements to report cash transfers in or out of Australia of A$10,000 or more. There is a prohibition on (or in some cases the specific prior approval of the
Shareholder information
Department of Foreign Affairs and Trade or Minister for Foreign Affairs must be obtained for) certain payments or other dealings connected with countries or parties identified with terrorism, or to whom United Nations or autonomous Australian sanctions apply. Sanction, anti-money laundering and counterterrorism laws may restrict or prohibit payments, transactions and dealings or require reporting of certain transactions.
Rio Tinto Limited may be required to deduct withholding tax from foreign remittances of dividends, to the extent that they are unfranked, and from payments of interest.
Acquisitions of interests in shares, and certain other equity instruments in Australian companies by non-Australian (“foreign”) persons are subject to review and approval by the Treasurer of the Commonwealth of Australia under the Takeovers Act.
In broad terms, the Takeovers Act applies to acquisitions of interests in securities in an Australian entity by a foreign person where, as a result, a single foreign person (and any associate) would control 20% or more of the voting power or potential voting power in the entity, or several foreign persons (and any associates) would control 40% or more of the voting power or the potential voting power in the entity. The potential voting power in an entity is determined having regard to the voting shares in the entity that would be issued if all rights (whether or not presently exercisable) in the entity were exercised.
The Takeovers Act also applies to direct investments by foreign government investors, in certain circumstances regardless of the size of the investment. Persons who are proposing relevant acquisitions or transactions may be required to provide notice to the Treasurer before proceeding with the acquisition or transaction.
The Treasurer has the power to order divestment in cases where relevant acquisitions or transactions have already occurred, including where prior notice to the Treasurer was not required. The Takeovers Act does not affect the rights of owners whose interests are held in compliance with the legislation.
Limitations on voting and shareholding Except for the provisions of the Takeovers Act, there are no limitations imposed by law, Rio Tinto plc’s Articles of Association or Rio Tinto Limited’s Constitution, on the rights of non-residents or foreigners to hold the Group’s ordinary shares or ADRs, or to vote that would not apply generally to all shareholders.
DirectorsAppointment and removal of directorsThe appointment and replacement of directors is governed by Rio Tinto plc's Articles of Association and Rio Tinto Limited’s Constitution, relevant UK and Australian legislation, and the UK Corporate Governance Code. The board may appoint a director either to fill a casual vacancy or as an addition to the board, so long as the total number of directors does not exceed the limit prescribed in these constitutional documents. An appointed director must retire and seek election to office at the next AGM of each company. In addition to any powers of removal conferred by the UK Companies Act 2006 and the Australian Corporations Act 2001, the company may by ordinary resolution remove any director before the expiry of his or her period of office and may, subject to these constitutional documents, by ordinary resolution appoint another person who is willing to act as a director in their place. In line with the UK Corporate Governance Code, all directors are required to stand for re-election at each AGM.
Annual report 2018 | riotinto.com 297
Additional inform
ation

Directors' powersThe board manages the business of Rio Tinto under the powers set out in these constitutional documents. These powers include the directors' ability to issue or buy-back shares. Shareholders’ authority to empower the directors to purchase its own ordinary shares is sought at the AGM each year. The constitutional documents can only be amended, or replaced, by a special resolution passed in general meeting by at least 75% of the votes cast.
UK listing rules cross reference table The following table contains only those sections of UK listing rule 9.8.4 C which are relevant. The remaining sections of listing rule 9.8.4 C are not applicable.
Listing rule Description of listing rule Reference in report
9.8.4 (1) A statement of any interest capitalised by the Group during the year
Note 8 Finance income and finance costs and note 17 Deferred taxation
9.8.4 (12) Details of any arrangement under which a shareholder has waived or agreed to waive any dividends
Note 11 Dividends
Shareholder security Shareholders tell us that they sometimes receive unsolicited approaches, usually by telephone, inviting them to undertake a transaction in shares they own.
If a shareholder does not know the source of the call, they should check the details against the Financial Conduct Authority (FCA) website below and, if they have specific information, report it to the FCA using the consumer helpline or the online reporting form.
If a shareholder is worried that they are a victim of fraud and is resident in the UK, they should report the facts immediately using the Action Fraud helpline on 0300 123 2040. More information about potential scams and other investment-based fraud can be found at actionfraud.police.uk or fca.org.uk/scamsmart.
Metal prices and exchange rates
Metal prices – averagefor the year 2018 2017
increase/ (decrease)
Copper – US cents/lb 297 281 6%
Aluminium – US$/tonne 2,110 1969 7%
Gold – US$/troy oz 1,269 1257 1%
Average exchange rates against the US dollar
Sterling 1.34 1.29 4%
Australian dollar 0.75 0.77 -3%
Canadian dollar 0.77 0.77 0%
Euro 1.18 1.13 4%
South African rand 0.076 0.075 1%
Year-end exchange rates against the US dollar
Sterling 1.27 1.34 -5%
Australian dollar 0.70 0.78 -10%
Canadian dollar 0.73 0.79 -8%
Euro 1.14 1.20 -5%
South African rand 0.069 0.081 -15%
Financial calendar
2019
17 January Fourth quarter 2018 operations review (Sydney 18 January)
27 February Announcement of results for 2018
27 February Publication of 2018 Annual report and notices of AGMs (Sydney 28 February)
4 March Form 20-F publication
7 March Rio Tinto plc and Rio Tinto Limited ordinary shares quoted “ex-dividend” for the 2018 final dividend
7 March Rio Tinto plc ADRs quoted “ex-dividend” for the 2018 final dividend
8 March Record date for the 2018 final dividend for Rio Tinto plc and Rio Tinto Limited shares and Rio Tinto plc ADRs
28 March Final date for elections under the Rio Tinto plc and Rio Tinto Limited dividend reinvestment plans and under facilities for dividends to be paid in alternative currency for the 2018 final dividend
10 April Annual general meeting for Rio Tinto plc, London
11 April Dividend currency conversion date (Rio Tinto plc holders electing to receive Australian dollars and Rio Tinto Limited holders electing to receive pounds sterling)
15 April First quarter 2019 operations review (Sydney 16 April)
18 April Payment date for the 2018 final dividend to holders of ordinary shares and ADRs
9 May Annual general meeting for Rio Tinto Limited, Perth
15 July Second quarter 2019 operations review (Sydney 16 July)
1 August Announcement of half-year results for 2019
8 August Rio Tinto plc and Rio Tinto Limited ordinary shares quoted “ex-dividend” for the 2019 interim dividend
8 August Rio Tinto plc ADRs quoted “ex-dividend” for the 2019 interim dividend
9 August Record date for the 2019 interim dividend for Rio Tinto plc and Rio Tinto Limited shares and Rio Tinto plc ADRs
29 August Final date for elections under the Rio Tinto plc and Rio Tinto Limited dividend reinvestment plans and under facilities for dividends to be paid in alternative currency for the 2019 interim dividend
12 September Dividend currency conversion date (Rio Tinto plc holders electing to receive Australian dollars and Rio Tinto Limited holders electing to receive pounds sterling)
19 September Payment date for the 2019 interim dividend to holders of ordinary shares and ADRs
15 October Third quarter 2019 operations review (Sydney 16 October)
2020
January Fourth quarter 2019 operations review
February Announcement of results for 2019
April Annual general meeting for Rio Tinto plc, London
April First quarter 2020 operations review
May Annual general meeting for Rio Tinto Limited, Brisbane
July Second quarter 2020 operations review
August Announcement of half-year results for 2020
October Third quarter 2020 operations review
Additional information
Shareholder information continued
Annual report 2018 | riotinto.com298
Registered officesRio Tinto plc6 St James’s Square LondonUKSW1Y 4ADRegistered in England No. 719885Telephone: +44 (0)20 7781 2000 Website: riotinto.com
Rio Tinto LimitedLevel 7360 Collins Street Melbourne Victoria 3000AustraliaABN 96 004 458 404Telephone: +61 (0) 3 9283 3333Fax: +61 (0) 3 9283 3707Website: riotinto.com
Rio Tinto’s agent in the US is Cheree Finan, who may be contacted atRio Tinto Services Inc.80 State StreetAlbanyUSNY 12207-2543
Contact details
ShareholdersPlease refer queries about shareholdings to the investor centre of the respective registrar.
Rio Tinto plcComputershare Investor Services PLC The PavilionsBridgwater RoadBristolBS99 6ZZUKTelephone: +44 (0)370 703 6364Fax: +44 (0)370 703 6119UK residents only Freephone: +44 (0)800 435021 Website: computershare.com
Holders of Rio Tinto American depositary receipts (ADRs)Please contact the ADR administrator if you have any queries about your ADRs.
ADR administrator JPMorgan Chase & Co PO Box 64504St. PaulMN 55164-0854USTelephone: +1 (651)453 2128US residents only, toll free general: +1(800) 990 1135US residents only, toll free Global invest direct: +1 (800) 428 4267Website: adr.comEmail: [email protected]
Contact details
Rio Tinto Limited Computershare Investor Services Pty LimitedGPO Box 2975Melbourne Victoria 3001AustraliaTelephone: +61 (0) 3 9415 4030Fax: +61 (0) 3 9473 2500Australian residents only, toll free: 1800 813 292 New Zealand residents only, toll free: 0800 450 740 Website: computershare.com
Former Alcan Inc. shareholders Computershare Investor Services Inc. 8th Floor100 University AvenueToronto, ONCanada M5J 2Y1 Telephone: +1 514-982-7555 North American residents only, toll free: +1 (800) 564-6253 Website: computershare.com
Annual report 2018 | riotinto.com 299
Additional inform
ation

Additional information
Investor CentreInvestor Centre is Computershare’s free, secure, self-service website, where shareholders can manage their holdings online. The website enables shareholders to: – View share balances – Change address details – View payment and tax information – Update payment instructions
In addition, shareholders who register their email address can be notified electronically of events such as annual general meetings, and can receive shareholder communications such as the Annual report or notice of meeting electronically online.
Rio Tinto plc shareholdersWebsite: investorcentre.co.uk/riotinto
Rio Tinto Limited shareholders Website: investorcentre.com/rio
Forward-looking statements This announcement includes "forward-looking statements" within the meaning of the Private Securities Litigation Reform Act of 1995. All statements other than statements of historical facts included in this announcement, including, without limitation, those regarding Rio Tinto’s financial position, business strategy, plans and objectives of management for future operations (including development plans and objectives relating to Rio Tinto’s products, production forecasts and reserve and resource positions), are forward-looking statements. The words “intend”, “aim”, “project”, “anticipate”, “estimate”, “plan”, “believes”, “expects”, “may”, “should”, “will”, “target”, “set to” or similar expressions, commonly identify such forward-looking statements.
Such forward-looking statements involve known and unknown risks, uncertainties and other factors which may cause the actual results, performance or achievements of Rio Tinto, or industry results, to be materially different from any future results, performance or achievements expressed or implied by such forward-looking statements. Such forward-looking statements are based on numerous assumptions regarding Rio Tinto’s present and future business strategies and the environment in which Rio Tinto will operate in the future. Among the important factors that could cause Rio Tinto’s actual results, performance or achievements to differ materially from those in the forward-looking statements are levels of actual production during any period, levels of demand and market prices, the ability to produce and transport products profitably, the impact of foreign currency exchange rates on market prices and operating costs, operational problems, political uncertainty and economic conditions in relevant areas of the world, the actions of competitors, activities by governmental authorities such as changes in taxation or regulation and such other risk factors identified in Rio Tinto’s most recent Annual report and accounts in Australia and the United Kingdom and the most recent Annual report on Form 20-F filed with the United States Securities and Exchange Commission (the “SEC”) or Form 6-Ks furnished to, or filed with, the SEC. Forward-looking statements should, therefore, be construed in light of such risk factors and undue reliance should not be placed on forward-looking statements. These forward-looking statements speak only as of the date of this announcement. Rio Tinto expressly disclaims any obligation or undertaking (except as required by applicable law, the UK Listing Rules, the Disclosure Guidance and Transparency Rules of the Financial Conduct Authority and the Listing Rules of the Australian Securities Exchange) to release publicly any updates or revisions to any forward-looking statement contained herein to reflect any change in Rio Tinto’s expectations with regard thereto or any change in events, conditions or circumstances on which any such statement is based.
Nothing in this announcement should be interpreted to mean that future earnings per share of Rio Tinto plc or Rio Tinto Limited will necessarily match or exceed its historical published earnings per share.
Annual report 2018 | riotinto.com300

Produced by Superunionwww.superunion.com
Printed by Park Communications on FSC® certified paper.
Park is an EMAS certified company and its Environmental Management System is certified to ISO 14001.
100% of the inks used are vegetable oil based, 95% of press chemicals are recycled for further use and, on average, 99% of any waste associated with this production will be recycled.
This document is printed on GalerieArt Matt, a paper containing fibre sourced from well managed, responsible, FSC® certified forests, and other controlled sources. The pulp used in this product is bleached using an elemental chlorine free (ECF) process.
