ridges to reefs assessment for new britain ......idges to eefs assessment or new britain, png:...
TRANSCRIPT

Conservation and Environment Protection
Authority
RIDGES TO REEFS ASSESSMENT FORNEW BRITAIN, PNG:
PLANNING FOR SUSTAINABLE DEVELOPMENTEast and West New Britain
September 2017

© 2018 Papua New Guinea Government through the Conservation and Environment Protection Authority
Available from worldwide web at: https://research.csiro.au/bismarcksea Website also includes additional appendices, project details, workshop presentations, and other related reports. Please note this report has been developed for both East and West New Britain Provinces. The main body of the report applies to both provinces, with specific information for each province provided under Appendix One and Appendix Two.
Citation: Geoff Lipsett-Moore, Nate Peterson, James Butler, Russell Wise, Cosmas Apelis, Seona Meharg, Kelly Kalit, Robyn James, Richard Hamilton, Barbara Masike-Liri, James Allan, Donna Hayes, Jessica Cheok, Tahlia Seeto and Mibu Fischer (2017). Ridges to Reefs Assessment for New Britain, PNG: Planning for Responsible, Sustainable Development. TNC Pacific Division Report No. 2/10. 83pp
Contributors: The Nature Conservancy, Pacific DivisionContact: Nate PetersonThe Nature Conservancy Level 1, 48 Montague Road South Brisbane, QLD 4101 AustraliaEmail: [email protected]
The views and opinions expressed in this publication are those of the authors and do not necessarily reflect the official policy or position of the UNDP.
Cover Photo: Orcaella brevirostris, PNG © Arun Vongtacome/ Shutterstock
This publication was developed through the Conservation and Environment Protection Authority in partnership with the United Nations Development Programme’s Global Environment Facility.
Ridges To Reefs Assessment For New Britain, PNG:Planning For Sustainable Development
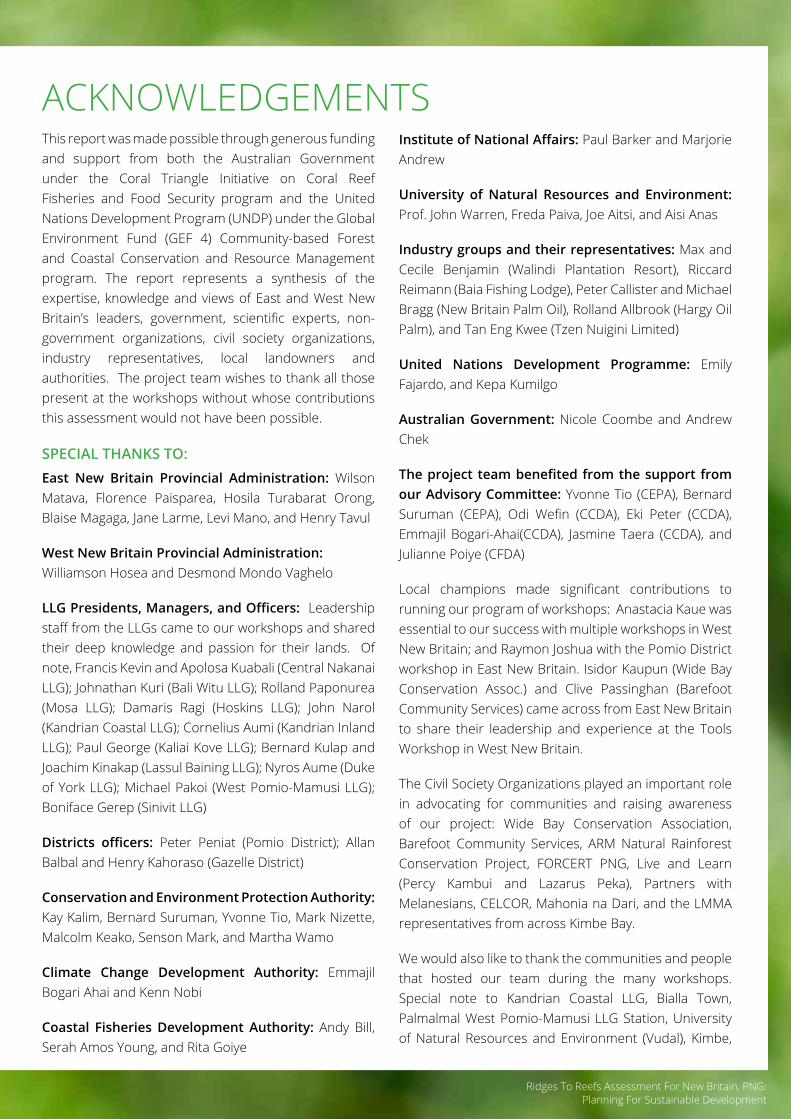
ACKNOWLEDGEMENTSThis report was made possible through generous funding and support from both the Australian Government under the Coral Triangle Initiative on Coral Reef Fisheries and Food Security program and the United Nations Development Program (UNDP) under the Global Environment Fund (GEF 4) Community-based Forest and Coastal Conservation and Resource Management program. The report represents a synthesis of the expertise, knowledge and views of East and West New Britain’s leaders, government, scientific experts, non-government organizations, civil society organizations, industry representatives, local landowners and authorities. The project team wishes to thank all those present at the workshops without whose contributions this assessment would not have been possible.
SPECIAL THANKS TO: East New Britain Provincial Administration: Wilson Matava, Florence Paisparea, Hosila Turabarat Orong, Blaise Magaga, Jane Larme, Levi Mano, and Henry Tavul
West New Britain Provincial Administration: Williamson Hosea and Desmond Mondo Vaghelo
LLG Presidents, Managers, and Officers: Leadership staff from the LLGs came to our workshops and shared their deep knowledge and passion for their lands. Of note, Francis Kevin and Apolosa Kuabali (Central Nakanai LLG); Johnathan Kuri (Bali Witu LLG); Rolland Paponurea (Mosa LLG); Damaris Ragi (Hoskins LLG); John Narol (Kandrian Coastal LLG); Cornelius Aumi (Kandrian Inland LLG); Paul George (Kaliai Kove LLG); Bernard Kulap and Joachim Kinakap (Lassul Baining LLG); Nyros Aume (Duke of York LLG); Michael Pakoi (West Pomio-Mamusi LLG); Boniface Gerep (Sinivit LLG)
Districts officers: Peter Peniat (Pomio District); Allan Balbal and Henry Kahoraso (Gazelle District)
Conservation and Environment Protection Authority: Kay Kalim, Bernard Suruman, Yvonne Tio, Mark Nizette, Malcolm Keako, Senson Mark, and Martha Wamo
Climate Change Development Authority: Emmajil Bogari Ahai and Kenn Nobi
Coastal Fisheries Development Authority: Andy Bill, Serah Amos Young, and Rita Goiye
Institute of National Affairs: Paul Barker and Marjorie Andrew
University of Natural Resources and Environment: Prof. John Warren, Freda Paiva, Joe Aitsi, and Aisi Anas
Industry groups and their representatives: Max and Cecile Benjamin (Walindi Plantation Resort), Riccard Reimann (Baia Fishing Lodge), Peter Callister and Michael Bragg (New Britain Palm Oil), Rolland Allbrook (Hargy Oil Palm), and Tan Eng Kwee (Tzen Nuigini Limited)
United Nations Development Programme: Emily Fajardo, and Kepa Kumilgo
Australian Government: Nicole Coombe and Andrew Chek
The project team benefited from the support from our Advisory Committee: Yvonne Tio (CEPA), Bernard Suruman (CEPA), Odi Wefin (CCDA), Eki Peter (CCDA), Emmajil Bogari-Ahai(CCDA), Jasmine Taera (CCDA), and Julianne Poiye (CFDA)
Local champions made significant contributions to running our program of workshops: Anastacia Kaue was essential to our success with multiple workshops in West New Britain; and Raymon Joshua with the Pomio District workshop in East New Britain. Isidor Kaupun (Wide Bay Conservation Assoc.) and Clive Passinghan (Barefoot Community Services) came across from East New Britain to share their leadership and experience at the Tools Workshop in West New Britain.
The Civil Society Organizations played an important role in advocating for communities and raising awareness of our project: Wide Bay Conservation Association, Barefoot Community Services, ARM Natural Rainforest Conservation Project, FORCERT PNG, Live and Learn (Percy Kambui and Lazarus Peka), Partners with Melanesians, CELCOR, Mahonia na Dari, and the LMMA representatives from across Kimbe Bay.
We would also like to thank the communities and people that hosted our team during the many workshops. Special note to Kandrian Coastal LLG, Bialla Town, Palmalmal West Pomio-Mamusi LLG Station, University of Natural Resources and Environment (Vudal), Kimbe,

Ridges To Reefs Assessment For New Britain, PNG:Planning For Sustainable Development
and of course Kokopo. You welcomed us into your communities, sharing your energy, knowledge and passion for your homelands with us. From coast to coast, across every river, and down from the highest peaks, the good people of New Britain came together to mark their path towards a sustainable future. We thank you for your support, participation, and commitments.
The core project team consisted of staff from both CSIRO and TNC:
TNC: Nate Peterson, Geoff Lipsett-Moore, Cosmas Apelis, Kelly Kalit, Barbara Masike-Liri, Senita Wauwia, Ruth Konia, Teneke Tefatu, Avoa Malala, Robyn James, Rick Hamilton, Megan Ryan, and Yu Wu
CSIRO: James Butler, Seona Meharg, Russell Wise, Erin Bohensky, Piers Dunstan, Donna Hayes, Mibu Fischer, Tim Skewes, and Chris Moeseneder
More broadly the project benefited from additional technical and advisory support from University of Queensland staff and students: James Allan, Vanessa Adams, Viv Tulloch, Tahlia Seeto; and Jessica Cheok from James Cook University.

5 Ridges To Reefs Assessment For New Britain, PNG:Planning For Sustainable Development
TABLE OF CONTENTSAcronyms 1
Executive summary 2
Introduction 4
Policy context 6
Draft framework 8
Environment 8
Society 9
Economy 9
Values, tools and zones 11
Physical Constraints Zone 12
Food Security Zone 14
Fresh Water Security Zone 16
Health and Wellbeing 17
Marine and Terrestrial Conservation Zones 17
- Marine Protected Areas 19
- Terrestrial Protected Areas 20
Commercial Agriculture Zone 20
- Forestry Zone 20
- Fisheries Zone 22
Urban Development 23
Steps for responsible sustainable development 24
Step 1 – Vision 2050 24
Step 2 – Defining zones 25
Step 3 – Mapping zones 25
Step 4 – Goals and strategies 29
Step 5 – Areas of conflict and benefit 30
LLG report cards to inform decisions 31
Key results 34
1. Significant Commercial Agriculture and Forestry Zones
34
2. Food Security and Freshwater Security (main island)
35
3. Small Island LLGs 36
4. Conflict Areas 36
5. Benefit Areas 38
Conclusions 39
References 43
Appendix 1: Report Cards for East New Britain 46
Zoning Report Card: Melkoi LLG 46
Zoning Report Card: West Pomio - Mamusi LLG 50
Zoning Report Card: Central Inland Pomio LLG 55
Zoning Report Card: East Pomio LLG 59
Zoning Report Card: Sinivit LLG 64
Zoning Report Card: Lassul Baining LLG 68
Zoning Report Card: Inland Baining LLG 72
Zoning Report Card: Duke of York LLG 76
Appendix 2: Report cards for West New Britain 80
Zoning Report Card: Bali Witu LLG 80
Zoning Report Card: Gloucester LLG 84
Zoning Report Card: Kandrian Coastal LLG 89
Zoning Report Card: Kandrian Inland LLG 95
Zoning Report Card: Kaliai - Kove LLG 99
Zoning Report Card: Gasmata LLG 104
Zoning Report Card: Talasea LLG 110
Zoning Report Card: Mosa LLG 115
Zoning Report Card: Hoskin LLG 119
Zoning Report Card: Central Nakanai LLG 124
Zoning Report Card: East Nakanai LLG 128
List of figures
Figure 1: The Bismarck Sea Seascape, and the surrounding maritime provinces of East and West New Britain, New Ireland, Manus, Morobe and Madang
4
Figure 2: The four primary activities of the Building capacity for sustainable and responsible development in the Bismarck Sea program
5
Figure 3: PNG’s commitment to the Paris Agreement and Agenda 2030 (the SDGs)
6
Figure 4: Adapted from Johan Rockström and Pavan Sukhdev of the Stockholm Resilience Centre a new way of viewing the Sustainable Development Goals and how they are all linked to food
8
Ridges To Reefs Assessment For New Britain, PNG:Planning For Sustainable Development
Figure 5: Top 30 Ecosystem Goods and Services for East New Britain by Zone
11
Figure 6: Constraints as used in this study 13
Figure 7: Population projections (blue) and food security requirements (ha – red) – CSIRO projections based on best available data and intrinsic growth estimates
15
Figure 8: Food Security area estimates 15
Figure 9: Water catchments of New Britain 16
Figure 10: Conservation Priority Areas 19
Figure 11: Draft Zoning Map (Lassul Baining LLG) 27
Figure 12: Draft Zoning for East and West New Britain
28
Figure 13: 5 year LLG plan is one step on the journey towards responsible sustainable development
30
Figure 14: Aspirational improvement of sustainable development indicators over successive LLG planning cycles (From red to green)
31
Figure 15: Urban, Peri-Urban and island LLG’s in ENB (blue lines represent the net movement of food from rural LLGs to urban peri-urban LLGs to support a growing population)
35
Figure 16: Melkoi LLG - 2050 Zoning Plan 47
Figure 17: West Pomio - Mamusi LLG - 2050 Zoning Plan
51
Figure 18: Central Inland Pomio LLG - 2050 Zoning Plan
56
Figure 19: East Pomio LLG - 2050 Zoning Plan 60
Figure 20: Sinivit LLG - 2050 Zoning Plan 65
Figure 21: Lassul Baining LLG - 2050 Zoning Plan 69
Figure 22: Inland Baining LLG - 2050 Zoning Plan 73
Figure 23: Duke of York LLG - Zoning Plan 77
Figure 24: Bali Witu LLG - 2050 Zoning Plan 81
Figure 25: Gloucester LLG – 2050 Zoning Plan 86
Figure 26: Kandrian Coastal LLG – 2050 Zoning Plan (east)
90
Figure 27: Kandrian Coastal LLG – 2050 Zoning Plan (west)
91
Figure 28: Kandrian Inland LLG – 2050 Zoning Plan
96
Figure 29: Kaliai - Kove LLG – 2050 Zoning Plan (east)
100
Figure 30: Kaliai - Kove LLG – 2050 Zoning Plan (west)
101
Figure 31: Gasmata LLG - 2050 Zoning Plan (east) 106
Figure 32: Gasmata LLG – 2050 Zoning Plan (west) 107
Figure 33: Talasea LLG – 2050 Zoning Plan 111
Figure 34: Mosa LLG – 2050 Zoning Plan 116
Figure 35: Hoskins LLG – 2050 Zoning Plan 120
Figure 36: Central Nakanai LLG – 2050 Zoning Plan
125
Figure 37: East Nakanai LLG – 2050 Zoning Plan 129
List of tables
Table 1: Preliminary list of key zones (as detailed in the previous sections)
26
Table 2: Sustainability indicators to assess land and sea use zoning plans
32
Table 3: Total area of conflicts for East New Britain 37
Table 4: Total area of conflicts for West New Britain
37
Table 5: West Pomio-Mamusi Conflict Areas 38
Table 6: Total area of benefit for East New Britain 38
Table 7: Total area of benefit for West New Britain 38
Table 8: Key Principles for RSD 41
Table 9: Melkoi LLG – Area Summaries 46
Table 10: Melkoi LLG - Zone Area Summaries 48
Table 11: Melkoi LLG - Areas of Conflict 49
Table 12: Melkoi LLG - Areas of Mutual Benefit 49
Table 13: West Pomio - Mamusi LLG - Area Summaries
50
Table 14: West Pomio - Mamusi LLG - Zone Area Summaries
52
Table 15: West Pomio - Mamusi LLG - Areas of Conflict
53
Table 16: West Pomio - Mamusi LLG - Areas of Mutual Benefit
53
Table 17: Central Inland Pomio LLG - Area Summaries
55
Table 18: Central Inland Pomio LLG - Zone Area Summaries
57
Table 19: Central Inland Pomio LLG - Areas of Conflict
58
Table 20: Central Inland Pomio LLG - Areas of Mutual Benefit
58
Table 21: East Pomio LLG - Area summaries 59

7 Ridges To Reefs Assessment For New Britain, PNG:Planning For Sustainable Development
Table 22: East Pomio LLG - Zone Area Summaries 61
Table 23: East Pomio LLG - Areas of Conflict 62
Table 24: East Pomio LLG - Areas of Mutual Benefit
62
Table 25: Sinivit LLG - Area Summaries 64
Table 26: Sinivit LLG - Zone Area Summaries 66
Table 27: Sinivit LLG - Areas of Conflict 67
Table 28: Sinivit LLG - Areas of Mutual Benefit 67
Table 29: Lassul Baining LLG - Area Summaries 68
Table 30: Lassul Baining LLG - Zone Area Summaries
70
Table 31: Lassul Baining LLG - Areas of Conflict 71
Table 32: Lassul Baining LLG - Areas of Mutual Benefit
71
Table 33: Inland Baining LLG – Area Summaries 72
Table 34: Inland Baining LLG - Zone Area Summaries
74
Table 35: Inland Baining LLG - Areas of Conflict 75
Table 36: Inland Baining LLG - Areas of Mutual Benefit
75
Table 37: Duke of York LLG - Area Summaries 76
Table 38: Duke of York LLG - Zone Area Summaries
78
Table 39: Duke of York LLG - Areas of Conflict 79
Table 40: Duke of York LLG - Areas of Mutual Benefit
79
Table 41: Bali Witu LLG - Area Summaries 80
Table 42: Bali Witu LLG - Zone Area Summaries 82
Table 43: Bali Witu LLG - Areas of Conflict 83
Table 44: Bali Witu LLG - Areas of Mutual Benefit 83
Table 45: Gloucester LLG - Area Summaries 84
Table 46: Gloucester LLG – Zone Area Summaries 87
Table 47: Gloucester LLG - Areas of Conflict 88
Table 48: Gloucester LLG - Areas of Mutual Benefit 88
Table 49: Kandrian Coastal LLG - Area Summaries 89
Table 50: Kandrian Coastal LLG - Zone Area Summaries
92
Table 51: Kandrian Coastal LLG - Areas of Conflict 93
Table 52: Kandrian Coastal LLG - Areas of Mutual Benefit
93
Table 53: Kandrian Inland LLG - Area Summaries 95
Table 54: Kandrian Inland LLG - Zone Area Summaries
97
Table 55: Kandrian Inland LLG – Areas of Conflict 98
Table 56: Kandrian Inland LLG – Areas of Mutual Benefit
98
Table 57: Kaliai - Kove LLG – Area Summaries 99
Table 58: Kaliai - Kove LLG – Zone Area Summaries
102
Table 59: Kaliai - Kove LLG – Areas of Conflict 103
Table 60: Kaliai - Kove LLG - Areas of Mutual Benefit
103
Table 61: Gasmata LLG – Area Summaries 104
Table 62: Gasmata LLG – Zone Area Summaries 108
Table 63: Gasmata LLG – Areas of Conflict 109
Table 64: Gasmata LLG – Areas of Mutual Benefit 109
Table 65: Talasea LLG – Area Summaries 110
Table 66: Talasea LLG – Zone Area Summaries 112
Table 67: Talasea LLG – Areas of Conflict 113
Table 68: Talasea LLG – Areas of Mutual Benefit 113
Table 69: Mosa LLG – Area Summaries 115
Table 70: Mosa LLG – Zone Area Summaries 117
Table 71: Mosa LLG – Areas of Conflict 118
Table 72: Mosa LLG – Areas of Mutual Benefit 118
Table 73: Hoskins LLG – Area Summaries 119
Table 74: Hoskins LLG – Zone Area Summaries 121
Table 75: Hoskins LLG – Areas of Conflict 122
Table 76: Hoskins LLG – Areas of Mutual Benefit 122
Table 77: Central Nakanai LLG – Area Summaries 124
Table 78: Central Nakanai LLG – Zone Area Summaries
126
Table 79: Central Nakanai LLG – Areas of Conflict 127
Table 80: Central Nakanai LLG – Areas of Mutual Benefit
127
Table 81: East Nakanai LLG – Area Summaries 128
Table 82: East Nakanai LLG – Zone Area Summaries
130
Table 83: East Nakanai LLG – Areas of Conflict 131
Table 84: East Nakanai LLG – Areas of Mutual Benefit
131

Ridges To Reefs Assessment For New Britain, PNG:Planning For Sustainable Development 1
Agenda 2030
Transforming our world: the 2030 Agenda for Sustainable Development
CCDA Climate Change Development Authority
CEPA Conservation and Environmental Protection Authority
CPA Conservation Priority Areas
CSIRO Commonwealth Scientific and Industrial Research Organisation - Australia
CTI Coral Triangle Initiative
CTMPAS Coral Triangle Marine Protected Area System
DSP 2030 Papua New Guinea Development Strategic Plan 2010-2030 - Our guide to success
ESEG Environmentally Sustainable Economic Growth
FIM Forest Inventory Mapping
FPIC Free Prior Informed Consent
FSC Forest Stewardship Council
FORCERT Forest Management & Product Certification Service
FPCD Foundation for People and Community Development
FPIC Free Prior and Informed Consent
GDP Gross Domestic Product
LDC Least Developed Countries
LLG Local Level Government
LMMA Locally Managed Marine Area
MDG Millennium Development Goals
MTDPs Medium Tern Development Plans
NCP National Conservation Plan
NBSAP National Biodiversity Strategy and Action Plan
MPA Marine Protected Area
NBR2R New Britain Ridges to Reefs
MTDPS Medium Term Development Plan
NCP National Conservation Plan
NGO Non-Government Organization
NNL No Net Loss
NPI Net Positive impact
OLPLLG Organic law on Provincial and Local Level Governments
PA Protected Area
ACRONYMSPES Payment for Ecosystem Service
PNGFA PNG Forest Authority
PNG PoPA Papua New Guinea Policy on Protected Areas (2014)
PNGRIS Papua New Guinea Resource Information System
PNG-Vision 2050
Papua New Guinea Vision 2050 (2011)
PoWPA Program of Work on Protected Areas
REDD+ Reduced Emissions from Deforestation and Degradation
RSD Responsible Sustainable Development
RSPO Round Table for Sustainable Pal Oil
SABL Special Agricultural Business Lease
SDGs Sustainable Development Goals
SFM Sustainable Forest Management
SIDS Small Island Developing States
StaRs National Strategy for Responsible Sustainable Development for Papua New Guinea (2014) 2nd ed.
TNC The Nature Conservancy
UNDP United Nations Development Programme
WMA Wildlife Management Area

2 Ridges To Reefs Assessment For New Britain, PNG:Planning For Sustainable Development
EXECUTIVE SUMMARYBy 2050 the population of New Britain will be more than 1.9 million people, more than three times the current population. In addition, the looming threat of climate change and, in particular, periods of drought and sea level events will pose further challenges. The foundation for a climate resilient future for New Britain will be to ensure the ecological integrity of the land and sea, in order to continue the provision of ecosystem goods and services which can support the growing demands of the society and the economy. A key climate change adaptation strategy for New Britain and a natural insurance policy against future impacts will be to ensure food security and freshwater security from the land and sea for 2050. Ensuring food security from the land will require securing sufficient land to support food production for local communities. Food security from the sea will require sufficient marine conservation areas to replenish local fish stocks, and to maintain water quality of nearshore waters.
To achieve this, in 2015-2017 the Papua New Guinea Conservation and Environmental Protection Authority (CEPA) and the Australian Government collaborated with The Nature Conservancy and Australia’s national science agency, CSIRO to deliver a program entitled ‘Building capacity for responsible and sustainable development in the Bismarck Sea’. The project worked with the East and West New Britain Provincial Administrations, communities, NGOs and the private sector to investigate the potential costs and benefits of future development in New Britain and the Bismarck Sea. In parallel, the overall program was also supported by UNDP under the Community-based Forest and Coastal Conservation and Resource Management program to develop a land use plan for West New Britain. Objectives and activities under this project were aligned to support the national Protected Areas Policy, StaRs 2014 and PNG Vision 2050. The program worked collaboratively across both Provinces to explore sustainable development tools and options. Activities included: identifying and collating the environmental features and services that stakeholders value in New Britain, assessing the decision-making processes, identifying gaps in knowledge, and delivering pilot planning workshops to investigate potential future options for development. All components were brought together in a final set of tools workshops to develop LLG
land/sea use plans and report cards to address the key requests from the LLGs.
The aim of this New Britain Ridges to Reefs Assessment (hereafter NBR2R Assessment) was to address some of the land and sea use planning needs, and to provide some preliminary decision-support tools to support responsible and sustainable development of LLGs. Tools workshops were carried out in ENB and WNB with LLG representatives, who developed DRAFT 2050 Land and Sea Use Zoning Plans. These Plans were assessed against simple indicators and rankings to provide an initial analysis of how the LLG might perform relative to the Sustainable Development Goals by 2050 (LLG Report Cards). In addition, potential conflicts between landuses are identified for each LLG, with suggested solutions and recommendations to improve responsible sustainable development outcomes. The resulting LLG Report Cards are intended to help support future decision-making at the LLG scale.
Key issues were also identified at the Provincial scale with preliminary recommendations to assist local decision makers. It is envisaged that the refined 2050 Land and Sea Use Zoning plans and recommendations will be incorporated within future 5 year LLG plans, Medium Term Development Plans and annual budgets and that the effective implementation of this guidance will improve responsible sustainable development outcomes.
Finally, some key conclusions from the project are as follows:1. Population-constrained LLGs – a number of LLG’s
are already experiencing food and water shortages as well as a myriad of other problems associated with population pressure. These include the three island LLG’s Bali Witu, Watom and Duke of York, and some of the LLGs with significant Commercial and Village Oil Palm Estates such as Hoskins LLG. Population-constrained LLGs would all benefit greatly from proactive family planning initiatives to help alleviate both current and future pressures in these LLGs, as already highlighted by previous TNC-CSIRO work in WNB.
2. Climate change adaptation – population-constrained LLG’s are also likely the most vulnerable to the impacts of climate change events and would benefit greatly from the development of climate change

Ridges To Reefs Assessment For New Britain, PNG:Planning For Sustainable Development 3
adaptation strategies to ensure food security and freshwater security during periods of drought as well as the potential impacts of sea level events for those communities in low lying areas. These have already been identified for Bali-Witu LLG in 2013, and strategies overlap and complement the land use zoning presented in the Report Card for this LLG.
3. Best practice for commercial agriculture – it is essential to ensure best practice is applied at the outset of any proposed commercial agriculture development. For example, if a company displaces local people and clears all arable land for oil palm development without ensuring food security, fresh water security and the retention of High Conservation Areas (HCV), then it may be in breach of its permit conditions. A company might become RSPO accredited after the land has been cleared, but all of the damage has already been done and all options for food security, freshwater security and retention of HCV are already lost. It is essential therefore that
all companies operate with best practise from the inception of a project to ensure RSD, and that the regulatory authorities ensure this occurs.
4. Equity – when arable land is allocated to commercial operators, decision-makers need to be extremely aware of the long-term direct and indirect impacts of the proposed development. If all arable land is allocated to commercial agriculture or forestry, then as the population grows and the demand for food security grows the rural population will be forced to develop gardens on steep slopes and other inappropriate land. This will result in increased soil erosion, increased sedimentation of nearshore waters and impacts on reefs which will put pressure on food security derived from both land and marine resources. If planning is done correctly at the outset and sufficient land is set aside to ensure food security for 2050, then many future issues of conflict and the degradation of the LLG can be avoided or minimized.
Clean freshwater stream in West New Britain, PNG © Nate Peterson/ The Nature Conservancy

4 Ridges To Reefs Assessment For New Britain, PNG:Planning For Sustainable Development
INTRODUCTIONIn 2015-2017, The Nature Conservancy (TNC) and the Commonwealth Scientific and Industrial Research Organisation (CSIRO) worked with national and provincial governments, industry and communities to design and build decision-making tools and processes that would enable better consideration of potential social and environmental benefits and costs of large-scale development across land and sea in the Bismarck Sea under conditions of future uncertainty (i.e. climate change and associated drought, seal level rise and population growth, immigration). The initial focus is East New Britain (ENB) and West New Britain (WNB), bordering the eastern part of the Bismarck Sea (Figure 1). The program’s goal is to “improve capacity for strategic decision-making for sustainable and responsible economic development in New Britain and the eastern Bismarck Sea”.
This project is one component of a broader collaborative program, Building Capacity for Sustainable and Responsible Development in the Bismarck Sea, which contributes to Papua New Guinea’s (PNG) activities in the Coral Triangle Initiative for Coral Reefs, Fisheries and Food Security (CTI). Under the CTI the Bismarck Sea is
a priority geography because it holds globally-important marine biodiversity, and is also the focus for rapid economic development in its maritime provinces of East and West New Britain, New Ireland, Manus, Morobe and Madang. Consequently, PNG’s Conservation and Environment Protection Authority (CEPA) has identified the Bismarck Sea as a demonstration site for integrated ‘seascapes’ planning, which is one of the CTI’s five goals.
The Bismarck Sea (Figure 1) has abundant natural resources including fish, reefs and mineral deposits. Subsequently, there are many opportunities for large-scale mining, agriculture, fisheries and tourism which, if developed without adequate foresight, could impact upon future livelihood and conservation objectives and values of the region, ‘Seascapes’ planning is a process applied in this program to assist decision-makers to responsibly consider the potential intended and unintended consequences of development on all stakeholders and account for future uncertainties such as climate change. In addition, they must understand and manage potential linked impacts of different developments across space (e.g. from land to sea) and time (e.g. cumulative effects), which could result in unanticipated outcomes.
Figure 1: The Bismarck Sea Seascape, and the surrounding maritime provinces of East and West New Britain, New Ireland, Manus, Morobe and Madang
Ridges To Reefs Assessment For New Britain, PNG:Planning For Sustainable Development 5
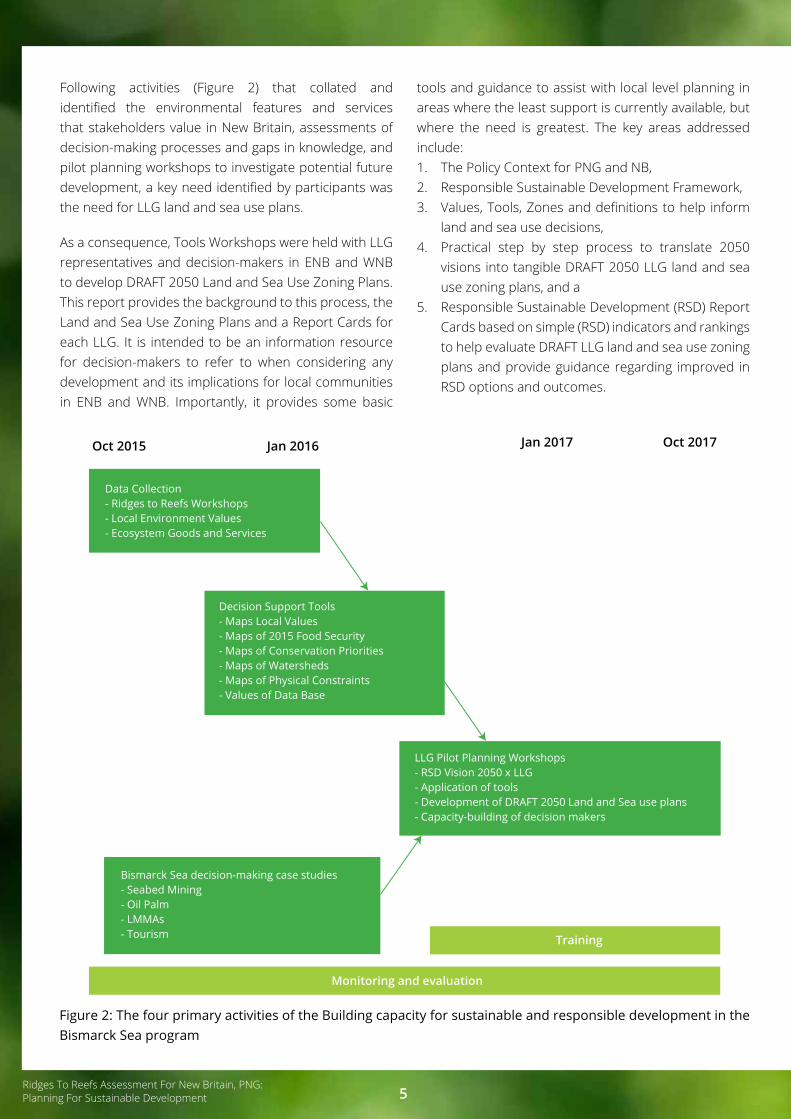
Figure 2: The four primary activities of the Building capacity for sustainable and responsible development in the Bismarck Sea program
Following activities (Figure 2) that collated and identified the environmental features and services that stakeholders value in New Britain, assessments of decision-making processes and gaps in knowledge, and pilot planning workshops to investigate potential future development, a key need identified by participants was the need for LLG land and sea use plans.
As a consequence, Tools Workshops were held with LLG representatives and decision-makers in ENB and WNB to develop DRAFT 2050 Land and Sea Use Zoning Plans. This report provides the background to this process, the Land and Sea Use Zoning Plans and a Report Cards for each LLG. It is intended to be an information resource for decision-makers to refer to when considering any development and its implications for local communities in ENB and WNB. Importantly, it provides some basic
tools and guidance to assist with local level planning in areas where the least support is currently available, but where the need is greatest. The key areas addressed include:1. The Policy Context for PNG and NB,2. Responsible Sustainable Development Framework, 3. Values, Tools, Zones and definitions to help inform
land and sea use decisions,4. Practical step by step process to translate 2050
visions into tangible DRAFT 2050 LLG land and sea use zoning plans, and a
5. Responsible Sustainable Development (RSD) Report Cards based on simple (RSD) indicators and rankings to help evaluate DRAFT LLG land and sea use zoning plans and provide guidance regarding improved in RSD options and outcomes.
Data Collection- Ridges to Reefs Workshops- Local Environment Values- Ecosystem Goods and Services
Decision Support Tools- Maps Local Values- Maps of 2015 Food Security- Maps of Conservation Priorities- Maps of Watersheds- Maps of Physical Constraints- Values of Data Base
LLG Pilot Planning Workshops- RSD Vision 2050 x LLG- Application of tools- Development of DRAFT 2050 Land and Sea use plans- Capacity-building of decision makers
Bismarck Sea decision-making case studies- Seabed Mining- Oil Palm- LMMAs- Tourism
Oct 2015 Jan 2016 Jan 2017 Oct 2017
Training
Monitoring and evaluation

6 Ridges To Reefs Assessment For New Britain, PNG:Planning For Sustainable Development
POLICY CONTEXTThis section provides a brief overview of PNG’s National Policies and commitments that shape responsible sustainable development (RSD). The 4th Goal of the PNG National Constitution states that “Papua New Guinea‘s natural resource and environment should be conserved and used for the collective benefit of all and should be replenished for the future generations”(Government of PNG, 1975). This requires:1. Wise use to be made of our natural resources and
the environment in and on the land or seabed, in the sea, under the land, and in the air, in the interests of our development and in trust for future generations; and
2. The conservation and replenishment, for the benefit of ourselves and posterity, of the environment and its sacred, scenic, and historical qualities; and
3. All necessary steps to be taken to give adequate protection to our valued birds, animals, fish, insects, plants and trees.
PNG’s National Constitution embraces RSD, that is, “Development that meets the needs of the present while safeguarding Earth’s life-support system, on which the welfare of current and future generations depends” (Griggs et al 2013). PNG Vision 2050 (Government of PNG, 2009), PNGDSP 2030 (Government of PNG, 2010) provide the long-term visions for sustainable development in PNG. The National Strategy for Responsible Sustainable Development for PNG (StaRs)
(Government of PNG, 2014a), provides the overarching guidance for the effective consideration of responsible sustainable development and inclusive green growth across all development plans (20 year plans, Medium Term Development Plans (MTDPs), sectoral plans and annual budgets). RSD requires a paradigm shift from unlimited growth towards more RSD and inclusive green economic growth outcomes. This approach is then expected to strengthen PNG’s strategic positioning and economic competitiveness in the world. It is also intended to contribute to a better quality of life for all Papua New Guineans now and in the future as well as helping PNG to meet the Sustainable Development Goals (SDGs – see below).
In 2015 PNG became a signatory to the Paris Agreement, under the United Nations Framework Convention on Climate Change (Figure 3). The Paris Agreement aims to combat climate change and adapt to its effects, with enhanced support to assist developing countries to address these challenges (UN 2015a). PNG pledged to focus abatement potential through measures relating to forestry and agriculture. PNG’s most important greenhouse gas abatement measures will include: (1) review of the clearance of primary forest for large-scale agricultural development that would contribute about 25% of total emissions in 2030 by reviewing agricultural concessions, (2) reduce collateral damage and forest degradation via reduced impact logging, (3) increase yields in subsistence and smallholder agriculture through an agricultural extension program in order to preserve forest cover PNG NDC (Government of PNG, 2016)
In 2015, PNG also became a signatory to the 2030
Figure 3: PNG’s commitment to the Paris Agreement and Agenda 2030 (the SDGs)
2015
PARISAGREEMENT
ADOPTED
GLOBAL GHG
GLOBAL GDP
CLIMATETURNING
POINT
TARGETSOF 17 SDGs
ARE MET WORLDREACHESNET ZERO
EMISSIONS
20202030
2050

Ridges To Reefs Assessment For New Britain, PNG:Planning For Sustainable Development 7
Agenda for Sustainable Development (UN 2015b). The Sustainable Development Goals (SDGs) builds upon the success of the eight Millennium Development Goals. The eight MDGs were adopted in 2002 as a framework to operationalize the Millennium Declaration. The Declaration, adopted by Member States of the UN General Assembly in the year 2000, articulated the world’s “collective responsibility to uphold the principles of human dignity, equality and equity at the global level” and to eradicate the world’s most extreme and deplorable conditions, including poverty and destitution. The SDG 2030 Agenda moves away from siloed approaches to development and promotes the integration of the econ¬omy, environment, and society. The 2030 Agenda for Sustainable Development (SDGs) focusses on three key areas for effective implementation include: (1) Mainstreaming, (2) Acceleration and (3) Policy support. This project focuses specifically on (1) Mainstreaming and developing way to integrate key SDGs at sub-national, and local plans for development; and subsequently to inform budget allocations (UN 2015c, UN 2015d).
PNG is also a signatory to the United Nations Convention on Biodiversity (CBD), where PNG has committed by 2020 to establish a “comprehensive, effectively managed and ecologically-representative national system of
protected areas” including specific targets which include: Aichi Target 11 which requires that by 2020, at least 17% of terrestrial and inland water, and 10% of coastal and marine areas, are conserved through effectively and equitably managed, ecologically representative and well-connected systems of protected areas. PNG’s Policy on Protected Areas (PNG PoPA) provides a pathway for the more effective delivery of terrestrial and marine conservation areas with Provincial, District and Local Level Governments expected to play a critical role in the establishment of Regional Protected Areas and in the management of both National and Regional Protected Areas (Government of PNG, 2014b).
PNG’s international commitments outlined above require translation to effectively deliver outcomes at the local level. For example, StaRs provides part of this translation and high-level guidance for the responsible sustainable development and inclusive green growth. However, it provides little operational guidance to inform decisions regarding development and priorities at the local level. This project is an attempt to provide some additional practical guidance at the LLG scale to assist communities, government and industry to develop a shared understanding of the issues and to provide a simple framework and tools to help better inform RSD decisions and outcomes.
Deserted and pristine beaches are common in coastal areas of PNG © Alice Plate/ UNDP

8 Ridges To Reefs Assessment For New Britain, PNG:Planning For Sustainable Development
DRAFT FRAMEWORK PNG is committed to Responsible Sustainable Development (RSD) under StaRs and to the SDGs. Sustainable development can be seen as three layers (see Figure 4 below). Under this model, the environment provides the goods and services (the environmental foundation) which supports the activities of humankind (society the middle layer) which in turn supports the economy (the top layer). The crucial point when considering long-term planning and sustainable development is that the effective long-term function of the environment is the foundation that underpins the prosperity of society and the economy. Without a resilient environment, there is a less prosperous society and economy. This principle forms the underlying basis of this assessment.
ENVIRONMENTWhen considering the environment from a sustainable development perspective (the foundation (bottom layer in Figure 4), we recognize that all the goods and services upon which all life depends come from the environment – the air we breathe, the fresh water we drink, the food we eat and the shelter that protects
us. We share these environmental goods and services with all other life, whether in our forests, freshwaters or within our oceans. If the environment is intact and resilient it can support the needs of humans and all other life (biodiversity). However, if the environment is pushed beyond its natural boundaries (physical limits) through overpopulation, unsustainable development practices or pollutants, then our environment loses its resilience (its ability to replenish the natural systems) and its capacity to support humans, biodiversity and the economy is greatly reduced (Rockstrom et al. 2009).
Increasingly, our environment is under new and increasing threats such as climate change. These additional impacts, over and above local human development impacts place an increasing requirement to think about the long term impacts we expect to experience and to factor in additional resources or reserves to account for these periods of impact. For example, it is expected that sea level and storm surge events, drought and flood will increase in both frequency and intensity. Planning to address these issues, would mean ensuring that we have sufficient additional food and freshwater reserves to accommodate periods of impact to buffer against expected loss.
Figure 4: Adapted from Johan Rockström and Pavan Sukhdev of the Stockholm Resilience Centre a new way of viewing the Sustainable Development Goals and how they are all linked to food1
1see more at http://www.stockholmresilience.org/research/research-news/2016-06-14-how-food-connects-all-the-sdgs.html

Ridges To Reefs Assessment For New Britain, PNG:Planning For Sustainable Development 9
SOCIETYHuman population - when thinking about society, the first step is to think about is the human population, the current rate of growth and the expected population by 2050. What will the demands be by the human population in 2050 for key life requirements: food, freshwater, shelter and jobs to support families? It is important to recognize that New Britain and its resources are finite. New Britain has finite area of land for the development of large scale agriculture and these same lands are required for food security, small scale cash crops, urban development and a host of other human activities. Society is supported by the Environment (see second layer in Figure 4).
Population census data is crucial when considering the sustainable development of New Britain. The net trend for New Britain will be a more than doubling of the population over the next 30 years (see Figure 10). The population of New Britain is growing at a rapid rate of 3.1-3.6%/year. Even with conservative estimates of 3.1%/year (the PNG average), annual growth rates have been higher in West New Britain than East New Britain, primarily driven by government sponsored land settlement schemes to produce oil palm and internal migration to earn cash incomes from the oil palm industry. Given the similar expansion of the oil palm industry in ENB at the present time, similar immigration and settlement patterns are expected. New Britain’s population is expected to increase from 603,443 (2011) to 1,909,911 by 2050 assuming business as usual (more than 3x the current population).
ECONOMYThe economy in New Britain comes in two forms: (1) the economy linked to economic growth or Gross Domestic Product (GDP) (e.g. the oil palm industry or timber industry) and the (2) the “local economy” upon which many small and vulnerable rural communities depend which includes both subsistence and the local cash economy. These economies may be linked in some areas where various families might also be working in the oil palm or timber industry and receive additional income. The important point about this distinction is to ensure that vulnerable rural communities are not adversely impacted by GDP linked developments and that GDP linked development approvals are based on a fair and equitable distribution of the natural capital (that is, equal shares of arable land to industry and local
people). If communities are adversely impacted by GDP linked developments, then these developments are unsustainable and do not meet the requirements under PNG StaRs (2014) for RSD. Key to the fair and equitable distribution of natural capital is adherence to national laws and policies and good governance at all levels of government (transparency and accountability) (see Butler et al 2015, Butler et al 2016, Meharg et al 2016).
Developments linked to (GDP) - Developments linked to GDP are often large-scale developments (>10,000 ha) which require approvals at the National, Provincial and local level and most importantly by the customary landholders whose land will be leased. When considering these developments in the context of a Local Level Government (LLG) it is important that all landowners likely to be impacted are consulted and that all landholders have a full understanding of the costs and benefits of the proposed development (i.e. free, prior and informed consent). No development should be approved without the customary landowners having a full understanding of the costs and benefits of the proposed development and their full approval and consent (as per the PNG constitution).
In addition, all large scale (GDP) developments should stay within the “natural boundaries” of the environment for that development to be considered sustainable (Rockstrom et al. 2009). Equally, GDP based development should stay within the “social boundaries” of responsible sustainable development, that is: not impact the long term (e.g. 2050) food and fresh water security needs of vulnerable communities. For example, if an oil palm development occurs on steep slopes, or excludes the use of riparian buffers to protect freshwaters, or coastal foreshores then the result of this development is increased erosion and loss of topsoil, leading to increased sediment load in waterways and nearshore waters. These have a negative impact on the environment. In addition, if the development compromises the food and freshwater security requirements of vulnerable rural communities, then again this violates the social boundaries of responsible sustainable development. This type of development is an example of unsustainable development.
Conversely, if a large scale commercial agriculture development is kept to flatter land and maintains good riparian buffers along waterways and the coastline and

10 Ridges To Reefs Assessment For New Britain, PNG:Planning For Sustainable Development
retains high conservation value forest (HCV), then this is an example of best practice. Best practice development focuses on minimizing impacts on biodiversity, soils, fresh water and nearshore waters and goes beyond minimizing impacts to ensuring no net loss or net
positive impact (Aiama et al. 2015). Equally, it focuses on avoiding or minimizing the social impacts to vulnerable rural communities (e.g. ensuring long-term (2050) food security, fresh water security).
Lack of riparian buffers and terracing on steep slopes degrades water quality, Inland Baining, PNG © Nate Peterson/ The Nature Conservancy

Ridges To Reefs Assessment For New Britain, PNG:Planning For Sustainable Development 11
VALUES, TOOLS AND ZONESThe previous section provides the broad principles for RSD. This section attempts to translate these principles into a simple practical framework that we can use to guide local land and sea use decisions. The framework is based on three key core elements:1. Values - (those things that people care about)
form the building blocks for determining areas appropriate for different activities. Values include all local values and ecosystem goods and services collected in stakeholder workshops across New Britain (see Appendix 2 and 3).
2. Decision Support Tools - gather together values (i.e. groups of values) in a meaningful way so that we can define appropriate areas for different land and sea management activities (Zones) (see Appendix 4 and 5) and finally,
3. Zones - are defined in the Tools Workshops using a combination of values maps, decision support tools and local expert knowledge to assign land and sea into appropriate management units (Zones). For example, the top 30 ranked ecosystem goods and services (values) for East New Britain correspond to three zones: Food Security Zone (14 values), Fisheries Zone (9 values) and the Commercial Agriculture Zone (2 values), (see Figure 6 below).
Assumptions:
1. The decision support tools developed by this project to inform decisions are based on best available national and local data.
2. That productivity of gardens and crops grown will remain the same between now and 2050 (in fact, fertility of gardens is probably declining because of the reduced fallow times, but this may be compensated for by new varieties/cultivars which are more productive).
3. That population projections are based on intrinsic growth; that is, they do not consider immigration of people for labour in commercial agriculture or industry, or emigration due to over-population, or movement of people to urban areas within New Britain which will mitigate rural population densities (all three are possible). In addition, the population projections also presume no comprehensive implementation of family planning.
4. That cash and jobs created by commercial agriculture or other industry will not be sufficient to enable people to buy imported shop-bought food (the conventional model of development – capitalisation, intensification, people moving off subsistence production to employment and a cash economy. Nutrition-wise people who have at least some home-grown diet are likely to be healthier,
Figure 5: Top 30 Ecosystem Goods and Services for East New Britain by Zone
1. Banana2. Pigs (domestic)3. Green vegetables4. Citrus5. Sweet Potato6. Tapioca7. Peanuts8. Chickens9. Ferns (Kumu gras)10. Mangoes11. Mustard12. Tobacco13. Betel Nut14. Home brew
1. Fish (Coastal)2. Fish Reef3. Tuna (offshore)4. Fish Extuarine5. Lobster6. Clams7. Turtles8. Crabs9. Seaweed
1. Copra2. Cocoa
Food
Sec
urit
y Zo
ne
Fish
erie
s Zo
ne
Com
mer
cial
Agr
icul
ture
Zon
e

12 Ridges To Reefs Assessment For New Britain, PNG:Planning For Sustainable Development
and more resilient to shocks to the global economic system which our projections suggest will become more common).
5. That 5-year LLG planning cycles will happen, and are effectively informed by information provided by this program (evidence seems to be that this is not the case at present - the LLG planning process is imperfect, and hence the need for building capacity for decision-making).
Limitations of the data: Given available resources and time, we focused our efforts on the development of limited number of decisions support tools in the first instance to inform land and sea use decisions. These included:1. The Physical Constraints Tool (to ensure
environmental integrity)2. The Food Security Tool (based on projected
population and food area requirements)3. Fresh water security Tool (based on watersheds/
catchments)4. Marine and Terrestrial Conservation Priorities Tool,
and5. Comprehensive values maps (which included all
local values)6. All data was compiled in the Values Database (ELVIS)
for future local use
Data gaps include: 1. Sea Level Rise Tool - to enable the identification of
vulnerable communities in low lying areas and to inform coastal developments, and a
2. Soil Suitability Tool – to better inform the development of Food Security and Commercial Agriculture areas.
PHYSICAL CONSTRAINTS ZONEDescription - Identifying and illustrating areas of New Britain that are inappropriate or unavailable for development is the first key step in planning for RSD. These are the areas that if developed would put at risk the ecological integrity of the land and sea (our environmental foundation) and would therefore not be responsible nor sustainable.
Arable or Available Land - is all the flat, fertile, accessible, non-flooded land suitable for: subsistence agriculture, large scale agriculture, cash crops, forestry, plantations and urban development.
Non-arable or Unavailable Land - is all the steep, flooded, infertile or inaccessible land that is unsuitable for large scale agriculture, food security areas, forestry or urban development.
The combination of: extreme and serious physical constraints and riparian and coastal buffers provides clear boundaries across the land to be avoided (see Appendix 4 for detailed description). If we compromise these boundaries, we start to undermine the integrity of the environment (land, fresh water and sea) or undermine the environmental foundation upon which society and the economy is dependent. This also provides a useful way to measure our performance towards sustainability across the landscape. For example, where an agricultural development has all its riparian areas intact and no development on unavailable land then the agriculture development is “more sustainable”. In contrast, where a large agriculture development has no streamside buffers and spans large unavailable areas on steep slopes then this is clearly “less sustainable”, that is, it has compromised the natural boundaries developed to ensure the ecological integrity of the landscape (i.e. the physical constraints) (Figure 8).
After mapping the physical constraints of the land and seascape we can look at how values (things people care about) are distributed. In some cases, these will be protected or conserved if the physical constraints to sustainable development are respected. In other cases, where land could be developed there is a question of how PNG stakeholders might choose to balance or trade-off one value against another while staying within the bounds of sustainable development. The amount of each value and where on the land and sea these are to be developed or conserved when considered against current and future needs is the subject of the remainder of the assessment.
Having determined the unavailable land, we can now focus on the available land and sea to decide how we will allocate values (those resources that people care about).

Ridges To Reefs Assessment For New Britain, PNG:Planning For Sustainable Development 13
Figure 6: Constraints as used in this study
10 m buffer on coast
10 m buffer on rivers
Physical Constraints (FIMS)
Legend
River running through a plantation, PNG © Nate Peterson/ The Nature Conservancy

14 Ridges To Reefs Assessment For New Britain, PNG:Planning For Sustainable Development
FOOD SECURITY ZONEDescription - People are considered food secure when they have sufficient, safe, nutritious food to maintain a healthy and active life, and that food is available and accessible at all times (World Food Programme 2009). If decision makers are planning for food security in 2050, then they will need to determine how big the population will be in 2050 and how much area each village will require to feed their future population. If we secure these areas for food to feed the people in the first instance then we provide a food security insurance policy, particularly given potential impacts of drought and flood associated with climate change.
Most food grown in PNG is consumed by the producing household. In rural areas 84% of food energy is from locally grown food and 50% in urban areas (Bourke and Harwood 2009). Given the dependence of people on locally grown food (particularly the rural poor) there is a fundamental need to consider area requirements of cultivated land to meet the need of the rapidly growing population. If we consider the population growth of East and West New Britain from 2011, (3.1 - 3.6% as in Society section on page 8) then the population in New Britain will increase from 603,443 in 2011 to 1,127,825 by 2030 and 1,909,911 by 2050 (see Figure 10).
Food Security Tool - We calculated the amount of food consumed per person per year based on key staple crops that are produced and consumed in East and West New Britain and then calculated the area (ha) that would be required to produce that food based on crop yield/ha (see Appendix 4 for detailed description). We then projected the population forward to 2050 x 0.2 ha (our estimate for area required/person/year) to provide a minimum mapped area for food security in 2050. We then generated a 2050 food security map for each LLG in NB (Figure 11).
If we consider the area required to feed the growing population into the future, then this will require 120,689 ha in 2011, 225,565 ha in 2030 and 381,982 ha in 2050. What this means from a planning perspective, is that any development approval for arable land needs to be extremely mindful of the requirements to feed local populations first before entertaining the thought of conversion of food security land to commercial agriculture. When using this tool from a planning perspective, it is important to ensure that we retain 2050 food security areas around communities as step two to ensure food security.
A view of the volcano in Rabaul, East New Britain Province © Alice Plate/ UNDP

Ridges To Reefs Assessment For New Britain, PNG:Planning For Sustainable Development 15
Figure 7: Population projections (dark green) and food security requirements (ha - light green) – CSIRO projections based on best available data and intrinsic growth estimates
Figure 8: Food Security area estimates
2011 2030 2050 2080
603,443
1,127,825
1,909,911
3,320,628
120,689 225,565
381,982
664,126
0
500,000
1,000,000
1,500,000
2,000,000
2,500,000
3,000,000
3,500,000
Popu
latio
n G
row
th (n
) and
Foo
d Se
curi
ty (h
a)
Year

16 Ridges To Reefs Assessment For New Britain, PNG:Planning For Sustainable Development
FRESH WATER SECURITY ZONEDescription - Access to safe drinking water and adequate sanitation services is vital to human health and essential for the wellbeing of communities (UNEP 2008). In the case of New Britain, access to safe drinking water may be compromised by inappropriate agricultural practices (pollutants), or poor hygiene practices; or impacts from climate change, such as seawater incursion into fresh water wells on islands or low lying coastal areas.
By projecting the water requirements of the population for each village, town or city to 2050 it is possible to determine how big the population will be and how much freshwater they will require and where this water will come from. Fortunately, across much of New Britain, there are many intact catchments (watersheds) that, if managed well, can supply an abundance of fresh drinking water. In the case of planning for New Britain, we don’t have precise amounts of water required by each community, but what we do know is that if we effectively manage key sources of freshwater and keep
their catchments intact, then we can ensure the long-term supply of clean drinking water.
Freshwater Security Tool – We used intact catchments above major growth centres as a surrogate for freshwater security (Figure 9) If we secure these areas specifically for fresh water security then we provide an insurance policy for expanding communities and buffer against the potential impacts of increased drought associated with climate change. If large-scale agriculture or development contaminates primary fresh water resources, then community’s infrastructure is required to replace the freshwater including: rainwater tanks, pipelines, bores or wells. This infrastructure may cost far more to install and maintain than prevention of contamination by careful planning of the type and location of developments.
Figure 9: Water catchments of New Britain

Ridges To Reefs Assessment For New Britain, PNG:Planning For Sustainable Development 17
HEALTH AND WELLBEING An important additional consideration when considering food security and freshwater security is that if good nutrition and clean drinking water are effectively maintained, then the incidence of malnutrition related diseases and the incidence of water borne diseases are significantly less (Hunter et al 2010, Hurney 2017). Improved health and wellbeing are direct and indirect benefits of ensuring food and freshwater security.
MARINE AND TERRESTRIAL CONSERVATION ZONESDescription of zones and values - Under the CBD PNG has committed to Aichi Target 11 which requires that by 2020, at least 17 per cent of terrestrial and inland water, and 10 per cent of coastal and marine areas, especially areas of particular importance for biodiversity and ecosystem services, are conserved through effectively and equitably managed, ecologically representative and well-connected systems of protected areas and other effective area-based conservation measures, and integrated into the wider landscapes and seascapes In order to maintain the viability and the resilience of our environment we need to conserve the full range of biodiversity. There are some exiting marine conservation areas, Locally Management Marine Areas (LMMA’s) in Kimbe Bay (Green et. Al. 2009), and a number of WMA’s and terrestrial conservation areas including: Tavalo WMA, Garu WMA, Pokili WMA, Kavakuna Caves WMA, Klampun WMA, two smaller reserves off the top of Gazelle Peninsula, and new proposed area for Lake Hargy.
The Conservation Priorities Tool - helps us to identify those areas that are important to conserve to maintain the full range of biodiversity for NB. The Conservation priorities tool was derived from two major sources: (1) The National Ridges to Reefs Assessment which includes National priority data sets, which were endorsed by the PNG National Government (Adams et. al. 2016 and Appendix 5), combined with (2) local features identified by communities through participatory mapping workshops that were held across New Britain (see Appendix 2). We combined the community conservation values (bottom up) with national conservation priorities (top down) through a MARXAN analysis (see Appendix 5 for detailed explanation). The tool developed identify both terrestrial and marine conservation priorities for New Britain. We reduced the size of the planning units for the analysis to ensure that the scale of the results would be tailored appropriately to LLG scale planning.
The combined result provides a map of the terrestrial and marine conservation priorities for NB and identifies areas that would be required to achieve both the PNG National Government targets and equally local areas that are important to the community, based on consultation workshops with each LLG (Figure 14). The conservation priorities map identifies those areas that are important, for both land and sea, but does not define how the conservation should be achieved. The development of any conservation area, whether marine or terrestrial, would require significant consultation with local communities and stakeholders to determine the most appropriate form of management or protection.
Formidable terrain around a volcano in Rabaul, East New Britain, PNG © Alice Plate/ UNDP

18 Ridges To Reefs Assessment For New Britain, PNG:Planning For Sustainable Development
Land clearing for a palm oil plantation, Inland Baining © Nate Peterson/ The Nature Conservancy

Ridges To Reefs Assessment For New Britain, PNG:Planning For Sustainable Development 19
Marine Protected AreasMany coastal fisheries around the Pacific are in decline from overfishing (SPC 2013) and are threatened by climate change (Pratchett et al. 2011). Overfishing has been driven by population growth, improvements in technology that make it easier to harvest fish (e.g. monofilament fishing line and nets) and greater access to local, regional and global markets. Pacific Island communities have interacted with their fisheries for thousands of years based on accumulated, detailed knowledge about their environment and the animals they harvest (Johannes 1981). Throughout the Pacific many coastal communities have developed and implemented a diverse range of traditional forms of community-based management. The foundation for effective fisheries management in the Pacific is the ability of certain community members (e.g. community leaders or chiefs, family groups, clans, and whole communities) to control fishing in a particular area (Almany et al., 2015).
This type of “spatial management” is made possible by the existence of customary marine tenure (CMT)
systems that remain common in Melanesia. A common management strategy is the practice of closing an area to some or all types of fishing for a certain period of time, which are often referred to as ‘‘locally managed marine areas’’ (LMMAs) (Govan 2009). Kimbe Bay, in WNB, has a long history of establishing LMMAs to achieve both food security and biodiversity objectives (Green et. al. 2009). There are numerous reasons why an LMMA is established, such as increasing the number of fish in the area or stockpiling for important events such as funerals, weddings, feasts (Foale et al. 2011). More recently, scientists have shown that establishing areas that are permanently closed to fishing — called “reserves” — is an effective way to rebuild and sustain coastal fisheries in the long term (Almany et al., 2015).
When fishing stops on any reef or within a certain area, it is no surprise that with time, the number and size of fish inside that area increases, and numerous scientific studies have shown this effect clearly (Lester et al 2009, Roberts and Hawkins 1997, Russ and Alcala 1996). Marine reserves can help rebuild and sustain fisheries
Figure 10: Conservation Priority Areas

20 Ridges To Reefs Assessment For New Britain, PNG:Planning For Sustainable Development
in two ways; The first way is called “spillover”, when fish leaving the reserve and travel to fishing areas where they can be harvested by fishers. The second way in which reserves can help rebuild and sustain fisheries is through the increased production of eggs and larvae from inside the reserve. Because there are more and larger fish inside the reserve, there are significantly more larvae produced from within marine reserves than a similar sized fished area (Harrison et al., 2012). Marine protected areas are therefore essential for ensuring Food Security from Marine Resources.
Terrestrial Protected AreasThe main human activities driving forest conversion in PNG include: commercial forestry, subsistence agriculture, fires and the development of plantations and mines (Shearman et al. 2008). By 2002 primary forests accessible to mechanised logging were being degraded or cleared at a rate of 2.6%/year. Of the 1972 commercially accessible forest area, it is estimated that 83% will have been cleared or degraded by 2021 (Shearman et al 2008). Effective, well managed terrestrial conservation areas in concert with sustainable forestry operations are therefore essential to maintain forests in PNG and NB. Terrestrial conservation areas represent a secured area where ecological processes can continue unabated. Sites may also serve to maintain watershed integrity, safeguard representative, unique and/or rare habitats, cultural values, and/or a feature of interest for eco-tourism ventures. New Britain has long been identified as a priority for the exploration of conservation options (both Locally and Nationally) (Lipsett-Moore et al. 2010, Adams et al 2016). A set of areas of interest are to be scheduled for immediate further investigation and implementation to create a tangible set of short term conservation priorities for CEPA to action. In addition, under the Papua New Guinea Policy on Protected Areas (Government of PNG 2014b) there are clear options for LLGs and the Provincial Governments to develop conservation areas.
COMMERCIAL AGRICULTURE ZONEDescription - Commercial agriculture is the production of food, fibre, or other plant or animal products using farming techniques that cover large areas of arable land, often in a monoculture. In the case of New Britain, the Commercial Agriculture Zone refers specifically to those areas proposed or allocated to large scale industrial
agriculture that contributes to GDP (e.g. oil palm, copra). In instances where there are: no buffers on streams, contaminated freshwater, planting on steep slopes, evidence of significant erosion, heavy sedimentation in nearshore waters, then agricultural practices would be considered unsustainable. However, the long-term goal for this zone should be to move Industry and operators towards responsible sustainable agriculture practices, for example RSPO accreditation for oil palm. It’s important to note the commercial agriculture zone is not equivalent to the food security zone. These two zones are mutually exclusive. The commercial agriculture zone refers to those industries that contribute to PNG’s GDP, while the food security zone contributes specifically to ensuring people have enough food to eat but also contributes to the local economy through sale of produce at local markets. Sustainable Agriculture for the purpose of meeting StaRs (2014) requirements includes: RSPO or equivalent standards for oil palm, and other best practice definitions as currently expressed under PNG laws and guidance.
Commercial Agriculture Zone – There is no specific tool to define the commercial agriculture zone, however, the commercial agriculture zone should be confined only to those areas identified as arable and available (using the physical constraints tool). In addition, the commercial agriculture zone is only for arable areas that have not already been allocated as: food security areas, fresh water security areas, urban areas or conservation priority areas.
FORESTRY ZONEDescription - Forests are critical for sustainable development. They provide a wealth of goods and services that are essential for people’s lives, livelihoods and the green economy. Effectively maintaining and enhancing NB’s forests is essential to alleviate poverty, assist with fresh water security, to reduce the loss of biodiversity and mitigate climate change. The forests of NB are rich in endemic species. They also provide clean water for many rivers, helping to secure the quality and purity of what that people drink and use every day. NB’s forests are also of great importance culturally to local communities. Sustainable Forest Management (SFM) entails the management of forests to maintain their full range of environmental, social and economic values.

Ridges To Reefs Assessment For New Britain, PNG:Planning For Sustainable Development 21
The Papua New Guinea Forest Authority (PNGFA) was established in 1993 under the 1991 Forestry Act replacing the former Department of Forest, and unifying all Provincial Forest Divisions and the Forest Industries Council. The PNGFA mission statement is to: Promote the management and wise utilization of the forest resources of Papua New Guinea as a renewable asset for the well- being of present and future generations. Forestry Zones are currently defined by active Timber Concessions allocated by PNGFA across New Britain.
Many of PNG’s forest areas have been established as Forestry Concessions and allocated to foreign timber companies. The Organic Law of 1995 also grants powers to Provincial Authorities to determine their own forest policies. In terms of actual forest development, the 1991 Forestry Act allocates forest resource rights and responsibilities through Forest Management Agreements (FMAs) between customary landholders and the state. Since the majority of PNG’s forest lands (97-98%) are held under customary forms of ownership, forest development rights must be acquired from `willing’ landholders. In other words, landholders sell temporary cutting rights to the PNGFA for periods of up to 40 years, in exchange for timber royalties.
PNG is a major exporter of tropical logs, shipping out an estimated 2.02 million m3 in 2003 to China, Japan and other mostly Asian destinations. The government collects revenues from a log export tax and a reforestation levy, while resource owners receive a
royalty on timber harvested (10 kina per m3) and other levies and premiums. Customary landowners participate in the processes by which the Forest Authority purchases timber rights but are generally not involved in the subsequent management and development of the resources. Unfortunately, in New Britain, most current operations are not responsible or sustainable and often result in the conversion of forests to agriculture (notably oil palm).
Community eco-forestry enterprises are good examples of responsible and sustainable development for local communities. Eco-forestry enterprises have been in place across PNG for many years with varying degrees of success. With the support of local NGO partners such as FORCERT and Foundation for People and Community Development (FPCD), communities have been able to put in place an alternative to industrial logging and Special Agricultural Business Leases (SABLs) and are protecting their forest for future generations. FORCERT and FPCD help promote sustainable forest management through providing certification and marketing services for forests and products for local small-scale producers and timber yards. They use FSC certification as a management tool – linking community forests enterprises to timber yards, and combining the outputs of these yards to service overseas markets through group certification under FSC. In addition, FORCERT and others have been trialling and investigating Payment for Ecosystem Services (PES) mechanisms for forestry and are interested in the potential for REDD+ as a financing
PNG’s natural beauty (pictured in East New Britain Province) offers many ecotourism opportunities © Alice Plate/ UNDP
22 Ridges To Reefs Assessment For New Britain, PNG:Planning For Sustainable Development
mechanism to enhance small scale forestry operations through reduced impact logging. Other small scale eco-forestry operations, clearly demonstrate best practice forestry operations, while large scale forestry operations have resulted in significant environmental damage and degradation.
Forestry Zone – There is no Forestry Tool and the Forestry Zone is currently defined as active forest management areas (FMA’s) across NB.
FISHERIES ZONEPapua New Guineans have some of highest consumptions of reef fish/capita in the world, with the majority of the nation’s subsistence based coastal population dependent on near shore marine resources for food security and income. Until recently, low human populations, a relatively large resource base and limited infrastructure have kept most coastal finfish fisheries in relatively good health. Yet this is changing rapidly, with population growth, globalisation and climate change impacts putting PNG’s coastal ecosystems under increasing pressure and threatening a cornerstone PNGs informal economy.
Many vulnerable coral reef fish species and macro invertebrates such as sea cucumbers and trochus are already overfished, and total coastal finfish production
is predicted to have reached maximum sustainable levels (Bell et al., 2009). In NB the impacts of land based practices are also apparent, with high sedimentation loads as a result of deforestation and oil palm development implicated in the decline of many inshore reefs in Kimbe Bay (Jones et al., 2004). These inshore areas often represent critical nursery habitat, and the loss of theses habitats threatens the long-term viability of many commercially important reef fisheries (Hamilton et al., 2017).
It is widely recognised that ensuring long term food security and climate resilience will require improved fisheries management practices. While communities can assist with this through establishing marine reserves on their customarily owned inshore reefs, a range of approaches is required. Strategies include; establishment of marine reserve networks, minimizing the impacts of land based run off, shifting fishing pressure to nearshore pelagic species such as tuna through the establishment of inshore fish aggregating deceives (IFADS) and placing closed seasons and size restrictions for high value species. For some high value species such as sea cucumber the PNG national Fisheries Authority already regulates resources at a provincial and national level, imposing size limits, quotas by province and a closed season.
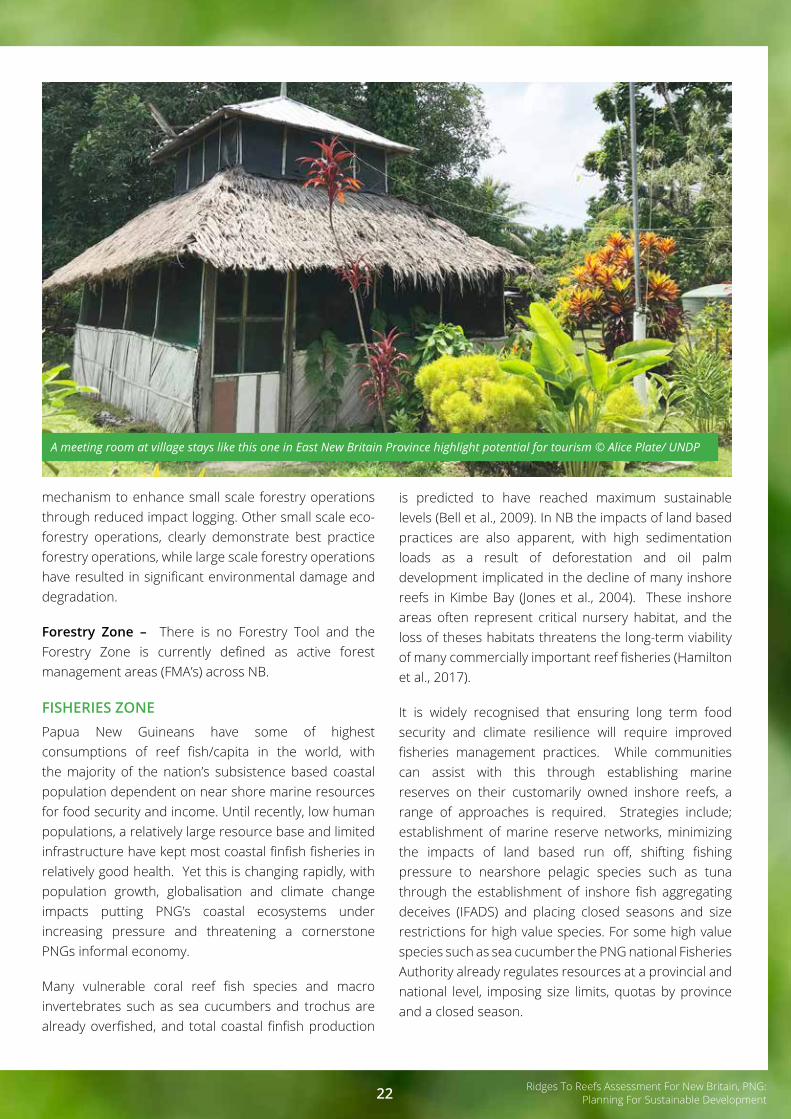
A meeting room at village stays like this one in East New Britain Province highlight potential for tourism © Alice Plate/ UNDP

Ridges To Reefs Assessment For New Britain, PNG:Planning For Sustainable Development 23
For the purpose of this report, we defined the LLG Fisheries Zones as extending 3-nautical miles from shore. This defines the outer boundary for the Fisheries Zone, with the expectation that most local fishers would operate within these nearshore waters. It would also encompass the likely location of IFADS that may be established in the future.
URBAN DEVELOPMENTPopulation growth in many urban areas in PNG exceeds national growth rates. This can result in social problems in urban centres where population growth exceeds employment. This can be further complicated by increasing rural to urban migration, particularly where rural communities are displaced from their rural lands through large scale developments (e.g. oil palm). The increasing population in urban areas can present many challenges such as: increased unemployment, squatter settlements, the lack of service provision, and increased crime.
The growth of informal settlements can also result from uncontrolled migration, increased population and the failure of the government to provide affordable housing and land. The high cost of living can also result in overcrowded living conditions. Informal settlements are often in the urban centres, within the existing fabric and on the fringes of the built-up areas. They are found on state and customary land and are characterized by a lack of planning, lack of basic urban services and infrastructure. Most of the city’s low-income workforce and displaced people live in informal settlements.
As New Britain grows it will be important to ensure effective planning for growth centres and associated urban development. The demand for shelter in urban areas far exceeds supply, fuelling the growth of squatter and informal settlements. Again, it is important to plan, not just for the Urban growth to 2050, but also food security and fresh water security areas to effectively support these centres.
Busy markets in PNG reflect the nation’s rapidly growing population © Alice Plate/ UNDP

24 Ridges To Reefs Assessment For New Britain, PNG:Planning For Sustainable Development
STEPS FOR RESPONSIBLE SUSTAINABLE DEVELOPMENT In the previous section we described the different values, tools and zones - the building blocks for creating a Land and Sea Use Plan. In this section, we describe how we used the values, tools and zones in a series of logical steps to build a Land and Sea Use Plan for 2050. The ultimate aim of this process was to take a Vision for RSD for each LLG and to translate that vision into a spatially explicit DRAFT 2050 Land and Sea Use Plan.
We held two, two and a half day Tools Workshops, one for East New Britain and one for West New Britain. We invited LLG officers and representatives for all rural LLGs and had representatives from 8 LLG’s for ENB and 11 LLGs for WNB. We attempted to ensure gender balance where possible and practical. At each workshop, we had a specific table allocated to each LLG and each table had a complete set of tools and values maps (as defined in the previous section).
Over the two and half days we took the LLG representatives through a process to translate a Vision for RSD into a spatially explicit 2050 Land and Sea Use Plan. The process involved five major steps: (1) Developing and articulating a 2050 Vision, (2) Defining zones and the activities for those zones, (3) Mapping the zones using the tools provided, (4) Developing goals and strategies for managing those zones and (5) Exploring areas of overlap between zones (Conflicts and Benefits). The remainder of this section provides the details of the individual steps.
STEP 1 – VISION 2050Developing a clear “shared” vision in line with PNG Vision 2050 - is the first step to determining where you want to go (Government of PNG, 2009). When everyone agrees on the direction - then you can map out a plan on how to get there. Responsible sustainable development requires the development of a clear, shared vision for the long-term. What do we want the world to look like in 2050? Across NB, communities, government and industry often have different visions for the future. Some may see comprehensive large-scale agriculture as the way to a prosperous future, while others may see a balance between protecting valuable natural assets and a diversity of agriculture, fisheries and small-scale
industry. Regardless of the vision, under the StaRs guidance the key requirement is that it is responsible and sustainable.
We all have different ideas about what our vision might look like. What sort of future do you want for children and your grandchildren? What will your legacy be? The decisions that you make today will determine the future of the people and the lands and seas of the LLG. Making “informed decisions” will ensure a better future.
When thinking about implementing the StaRs guidance and creating a vision for responsible sustainable development for 2050, there are a number of key questions we need to ask when thinking about the future parameters of an LLG, including: 1. How big will our growing population be by 2050? 2. How much food will be required and how much land
should we set aside to grow that food? 3. How much clean fresh water will be required and
where will we get it from? 4. What jobs and incomes will be available to support
the community?5. What infrastructure, roads, power, water and
housing will we need and where should we put it? 6. We also need to be mindful that the natural
resources: forests, land, fresh water and fish are finite (limited). Ultimately, the capacity of the land and sea (the environmental foundation) that supports the growing human population and its associated demands is finite (limited).
7. Also, when considering future developments, we need to avoid or minimize the risk of damaging the environment from growing pressures on land and sea and
8. Equally, manage the potential risk of future shocks such as climate change
A clear vision for 2050, requires that we attempt to meet all these multiple objectives for the LLG, while also minimizing the risk of damaging the environmental foundation that supports society and economy of New Britain. It is important that communities, government and industry all agree on a “shared vision”. Articulating the vision graphically (as a picture) is a powerful way to visualize the desired future for the LLG. For a comprehensive overview of the visioning process see (Butler et al. 2015, Butler et al. 2016)

Ridges To Reefs Assessment For New Britain, PNG:Planning For Sustainable Development 25
STEP 2 – DEFINING ZONES The second step in our workshops was to define the key zones for each LLG. As a guide, we provided the following broad categories (see Table 2). Within each of these zone categories, workshop participants then assigned specific activities for their LLG to each of the zones. In this way, we established a set of zones and a draft set of activities that we could then map across the land and sea. These included:
STEP 3 – MAPPING ZONES The third step involved using the tools identified in the previous section to systematically map each of the zones identified using participatory mapping. Each LLG group was provided with a base map populated with the rich range of locally identified features of the LLG. LLG groups then systematically mapped out the areas for each of the zones. They started by using: (1) the Physical Constraints Tool to identify the unavailable land, then (2) the Freshwater Security Tool to identify water sheds and catchments in relation to growth centres and larger towns and communities to identify priority Fresh water Security areas, then (3) the Food Security Tool to identify priority Food Security Zones across the LLG, then (4) the Terrestrial and Marine Conservation Tool and local knowledge to identified Terrestrial and Marine Conservation Zones, then Forestry Zones, Commercial Agriculture Zones, Fisheries Zones and Urban Development Zones using local knowledge and other available data. Local knowledge was used by workshop participants to refine the line work for each zone.
The result at the end of the workshop was a draft land and sea use zoning plan for each LLG within NB. An important component of the mapping was to ensure that where a group believed that overlap would occur between different zones, whether positive or negative, that overlap was to an acceptable part of the participatory mapping process. In this way, we could begin to define areas of possible conflict (e.g. commercial agriculture and food security) and equally areas where positive outcomes between two zones may occur (e.g. terrestrial conservation and freshwater security). At the end of the participatory mapping process we had a hand drawn DRAFT LLG Land and Sea Use Plan that could be assessed, refined and discussed with the broader community. At the end of this session, each LLG group reported back to meeting on their Draft Plan, highlighting key outcomes of their plan.
Zones for each map were then digitized into a GIS for each LLG in WNB and ENB. We subsequently analysed each LLG to provide some basic statistics for each zone and each zone interaction between zones as follows: 1. Area contribution of each zone,2. Area of conflict by zone (e.g. Conservation Zone x
Commercial Agriculture Zone; Food Security Zone x Commercial Agriculture Zone)
3. Area of mutual benefit by zone (e.g. Conservation Zone x Freshwater Security Zone).
The resulting statistics provide an overview of the relative contribution of each zone in relation to population size and also identifies areas of potential conflict and congruence for further exploration.
Mapping out protected areas, PNG © Nate Peterson/ The Nature Conservancy

26 Ridges To Reefs Assessment For New Britain, PNG:Planning For Sustainable Development
2Lassul Baining LLG was the only LLG group to designate a Multiple Use Zone (western portion of Ataliklikun Bay)
Table 1: Preliminary list of key zones (as detailed in the previous sections)
1. Physical constraints Zone to ensure the ecological integrity of land and sea
2. Food Security Zone to ensure food security
3. Freshwater Security Zone to ensure freshwater security
4. Terrestrial Conservation Zone to ensure the maintenance of terrestrial biodiversity
5. Marine Conservation Zone to ensure the maintenance of marine biodiversity and fish stocks
6. Forestry Zone to provide production Timber for export
7. Commercial Agriculture Zone to provide export agriculture to contribute to GDP
8. Fisheries Zone to provide local food for artisanal fishers and food security
9. Urban Zone to provide for urban development
10. Multiple Use Zone to cater to a range of integrated activities2
Mapping out protected areas, PNG © Nate Peterson/ The Nature Conservancy

Ridges To Reefs Assessment For New Britain, PNG:Planning For Sustainable Development 27
Figure 11: Draft Zoning Map (Lassul Baining LLG)

28 Ridges To Reefs Assessment For New Britain, PNG:Planning For Sustainable Development
Figure 12: Draft Zoning for East and West New Britain

Ridges To Reefs Assessment For New Britain, PNG:Planning For Sustainable Development 29
STEP 4 – GOALS AND STRATEGIES
The fourth step involved each LLG group selecting one zone of their choice and then developing goals and strategies (see text box below for definition) to advance RSD for that zone over the next 5 years for inclusion in their LLG Plan. In this way, a draft set of goals and strategies was developed for each group to refine and use at a later date.
Translating a vision of responsible sustainable development into action represents a major challenge. The greatest challenge is that there are often multiple and conflicting goals for limited areas of land or sea. While the shared vision creates the grand aspirations for the LLG, there may be many possible and competing pathways for achieving this. Across New Britain communities, government and industry often have different approaches to achieving the future vision. Some may see comprehensive large-scale agriculture as the way to a prosperous future, while others may see a balance between protection valuable natural assets and a diversity of agriculture, fisheries and small-scale industry.
One way to address multiple and conflicting goals and strategies is to assign different zones to the land and sea for different activities and management. Within each zone, we can then develop specific goals and strategies relating to that zone to ensure that responsible sustainable development is achieved for that zone. A crucial step in the use of these tools is to define your zones and what activities contribute to these zones for your LLG (see Step 2 – Defining Zones page 25). It is important to be clear about these contributions. For example, the food security zone includes all those activities that contribute to food security and local incomes from the sale of cash crops. Whereas the commercial agriculture zone contributes specifically to large scale agriculture that contributes to GDP. Similarly, the marine conservation zone is specifically for the protection of a marine area, where as the sustainable
Goals and Strategies are absolutely key to shifting to solutions focused thinking
Goals - What are we going to accomplish?
Strategies - How are we going to get there?
fisheries zone allows for fishing, use and take. There may be seasonal closures from fishing for particular species, but this is different from a formal marine conservation area.
When setting goals and strategies we need to be mindful of the planning context within which these goals and strategies might sit. Specifically, the LLG Plans are 5 year plans linked to the District budget. It is also important to recognize that a 5 Year MTDP is only one small step on the journey towards sustainable development and achieving the vision by 2050.
A goal (sometimes called an objective) is just a statement of the specific future conditions we would like to see attained. Ideally, these will have a time attached to them, are measurable, and realistic. For each zone described above an LLG could have a goal (or even goals).
For example, within the Physical Constraint Zone a goal might be:
By 2022, reduce the area of steep land converted by 10% and restore > 80% of riparian and coastal buffers.
The strategies might include:1. Map out a comprehensive plan and budget for the
restoration of steep areas and buffers2. Consult with oil palm company in collaboration with
the LLG to support the replanting of steep slopes and buffers with tree crops and fuel wood
3. Consult with communities clearing steep land for gardens
4. Develop a partnership between communities, LLG and the oil palm company to restore the integrity of steep slopes and buffers
5. Develop a community nursery to grow the appropriate species
6. Develop community planting events and collaborative replanting and management initiatives amongst the partnership
Within the Tools Planning Workshops, the development of goals and strategies received only minor attention due to time constraints. It was clear, that this area will require significant attention in the future to assist LLG’s to achieve effective RSD outcomes.

30 Ridges To Reefs Assessment For New Britain, PNG:Planning For Sustainable Development
Figure 13: 5 year LLG plan is one step on the journey towards responsible sustainable development
STEP 5 – AREAS OF CONFLICT AND BENEFITStep 5 of the Tools Workshops involved LLG groups identifying areas of potential conflict and benefit across their LLG and then developing options for avoiding or minimizing conflict for one conflict area.
Areas of mutual benefit - occur where there is overlap between compatible or complementary land use. This represents an area of opportunity for an LLG to achieve multiple goals towards RSD. For example, where a Freshwater Security Zone, Terrestrial Conservation Zone and Physical Constraints Zone co-occur then this is a good opportunity for protection to achieve the multiple goals of Freshwater Security, Terrestrial Conservation and maintaining the ecological integrity of the LLG.
Areas of potential conflict - occur where there is overlap between incompatible land use. For example, where a Commercial Agriculture overlaps with a Terrestrial Conservation Zone or Food Security Zone or Physical Constraints Zone, then these areas of overlap represent areas of potential conflict. Areas of conflict represent major issues for an LLG and for RSD. The greater the number and areas of conflict the less sustainable the development and LLG.
Available arable land in NB is finite and population growth and development will continue to increase.
Finding the right balance of land and sea use to ensure the ongoing ecological integrity of each LLG by 2050 is essential for RS. However, areas of conflict are inevitable as population demands and industry demands on the environment increase. Developing effective ways to minimize the impacts of development (whether environmental or social) and equally, effective ways to deal with conflict are an essential part of the sustainable development process.
The mitigation hierarchy is widely regarded as the best practice approach for managing biodiversity risk and realizing conservation opportunities in development projects (Aiama et al 2015). The same approach could equally be applied to any value that is important to the community to manage social risk (e.g. food security areas). The approach is based on two concepts: (1) No Net Loss (NNL) and (2) Net Positive Impact (NPI). NNL or NPI means no net reduction in the value that is important to the community. This might be land for food security, conservation areas, freshwater security or areas of cultural significance.
We provided LLG groups with an introduction to areas of conflict and benefit and worked through a practical example of how to avoid and minimize conflict for a hypothetical example of a 10,000 ha oil palm expansion area using the first two steps of the mitigation hierarchy (avoid and minimize) (see Appendix 6).
Sustainable development is about planning and“implementing” for the long term
2050Vision
32 years
2023-2027
2018-2022
2028-2032
2033-2037
2038-2042
2043-2047
Physical Constraint ZoneBy 2050 all large developments and food security areas operate
outside the constraint zone.
Physical Constraint Zone (first 5 year plan)Goal vy 2022, <10% of large developments
within constrained landGoal vy 2022, >80% of buffers are in place or
restored on all riparian areas and coastalbuffer areas

Ridges To Reefs Assessment For New Britain, PNG:Planning For Sustainable Development 31
We then asked LLG groups to choose one area of conflict area and to explore options to avoid or minimize conflict for that area. We then asked groups to report back regarding their respective solutions. What are your options to avoid or minimize impacts/conflict? Avoid and minimize is also the simplest and cheapest form of biodiversity and social impact mitigation.
LLG REPORT CARDS TO INFORM DECISIONS We used 2050 as a future benchmark for sustainable development in PNG guided by PNG Vision 2050 (Government of PNG 2009). Visions for Responsible Sustainable Development (RSD) in 2050 were created for each LLG as part of the R2R Assessment Pilot Planning and Tools workshops. These visions (pictures) portrayed the desired future state for each LLG. LLG representatives then translated these visions into real tangible DRAFT Land and Sea Use zoning plans for 2050 using best available information (values and tools). The resulting DRAFT LLG 2050 Land and Sea Use zoning plans helps us better define what the future LLG might look like. Also, while aspirations for sustainable development (visions) paint the picture the LLG would like to see, the results of the participatory mapping of expected zones may tell a very different story. Some LLG’s might be in a good position to operate sustainably by 2050, while others may face major challenges in terms of food security, freshwater security and sustainable development generally.
We photographed every hand drawn paper LLG land and sea use zoning map then digitised them in the GIS to produce digital zoning maps for each LLG. This then gave us the ability to analyse each map and measure each zone and the relationships between each zone. To assess the relative sustainability of each zone we developed a simple set of indicators and rankings to help us define how sustainable key activities might be in each
LLG by 2050 (see Table 2). Each Indicator is numbered on the left-hand side of the table. A detailed description is then provided on how each value (%) is calculated for each indicator and then the value is assessed against a ranking coloured from red (unsustainable) to green sustainable (see Table 2). These simple indicators and rankings provide us with an understanding of where the key issues and priorities might be for each LLG with respect to RSD. From these we can then develop goals and strategies within LLG plans to help improve RSD outcomes within each zone. Where a key indicator is identified as red for a specific zone, then goals and strategies need to be put in place to improve sustainable development outcomes for that indicator. Within the context of the current planning processes within PNG, this would mean incorporating interventions (goals and strategies) that move indicator rankings from red to green over successive planning cycles, so that by 2050, all indicators would be green (i.e. meet all RSD requirements).
Report Cards were developed for all the LLG groups that participated in the Tools Workshops held in Kokopo and Kimbe. For simplicity, Report Cards for West New Britain have been amended to the WNB version of the report, and East New Britain cards the ENB version.
Large format maps of the Local Features and the Zoning’s have been prepared and distributed to LLG representatives. District and Provincial scale equivalents have also been distributed as appropriate.
2017 2025 2030 2040 2050
Figure 14: Aspirational improvement of sustainable development indicators over successive LLG planning cycles.

32 Ridges To Reefs Assessment For New Britain, PNG:Planning For Sustainable Development
Table 2: Sustainability indicators to assess land and sea use zoning plans
Indicator number
Least RSD
Most RSD
Draft RSD Sustainability Indicators %
1 % of Arable Land exceeded by 2050 = sum of all proposed land use (-) the total area of arable/available land and the difference expressed as a % of total arable land.
>40 30-40 20-30 10-20 0-10
2 % of Physical Constraints Zone converted by 2050 = total proposed land use (-) total available arable land expressed as a % of the total area of physical constraints
>40 30-40 20-30 10-20 0-10
3 % of LLG secured for the Fresh Water Security Zone = total area of mapped freshwater security areas expressed as a % of the total land area of the LLG 0-10 10-20 20-30 30-40 >40
4 % of LLG Terrestrial Conservation Zone3 = total area of mapped terrestrial conservation area expressed as a % of the total land area of the LLG. 0-4 4-8 8-12 12-16 >16
5 % of LLG Marine Conservation Zone4 = total area of mapped marine conservation area expressed as a % of the total LLG marine areas out to 3nms
0-3 3-6 6-9 9-12 >12
6a % of Projected Food Security Area met by 2050 = total mapped food security area / the total projected food security area expressed as a % 0-25 25-50 50-75 75-100 >100
6b % of arable land under Food Security Zone = total area of mapped Food Security Zone / total area of arable land within the LLG expressed as a % >50 40-50 30-40 20-30 0-20
7 % of arable land under Forestry Zone = the total area of mapped Forestry Zone / total area of arable land within the LLG expressed as a % >50 40-50 30-40 20-30 0-20
8 % of arable land under Commercial Agriculture Zone = total area of mapped Commercial Agriculture Zone / total area of arable land within the LLG expressed as a %
>50 40-50 30-40 20-30 0-20
Conflicts (Incompatible Land-use Zones)
9a % of Food Security Zone x Commercial Agriculture Zone overlap = total area of overlap between the Food Security Zone and the Commercial Agriculture Zone / the total land area of the LLG expressed as a %
>10 7-9 5-6 3-4 <2
9b % of Food Security Zone x Terrestrial Conservation Zone overlap = the total area of overlap between the Food Security Zone and the Terrestrial Conservation Zone / the total land area of the LLG expressed as a %
>10 7-9 5-6 3-4 <2
9c % of Food Security Zone x Freshwater Security Zone overlap = the total area of overlap between the Food Security Zone and Freshwater Security Zone / the total land area of the LLG expressed as a %
>10 7-9 5-6 3-4 <2
9d % Physical Constraints Zone x Food Security Zone overlap = the total area of overlap between the Food Security Zone and the Physical Constraints Zone / total land area of the LLG expressed as a %
>10 7-9 5-6 3-4 <2
9e % Physical Constraints Zone x Forestry Zone overlap = the total area of overlap between Physical Constraints Zone and Forestry Zone / the total land area of the LLG expressed as a %
>10 7-9 5-6 3-4 <2
9f % Physical Constraints Zone x Commercial Agriculture Zone overlap: = the total area of overlap between the Physical Constraints Zone and the Commercial Agriculture Zone / the total land area of the LLG expressed as a %
>10 7-9 5-6 3-4 <2
9 % of TOTAL LAND AREA under Conflict by 2050: (overlap of all incompatible landuse) = sum of all incompatible areas of overlap / total LLG Land area expressed as a %
>10 7-9 5-6 3-4 <2
3Terrestrial Conservation Zone target refers to PNG’s commitment to the CBD - Aichi Target (17% of Terrestrial Areas to be conserved by 2020) 4Marine Conservation Zone target refers to PNG’s commitment to the CBD – Aichi Target (10% of Marine Areas to be conserved by 2020)

Ridges To Reefs Assessment For New Britain, PNG:Planning For Sustainable Development 33
Indicator number
Least RSD
Most RSD
Benefit (Compatible Land-use Zones)
10a % Physical Constraints Zone x Freshwater Security Zone overlap = the total area of overlap between Physical Constraints Zone x Freshwater Security Zone / the total LLG land area expressed as a %
0-9 10-19 20-29 30-39 >40
10b % Physical Constraints Zone x Terrestrial Conservation Zone = the total area of overlap between Physical Constraints Zone x Terrestrial Conservation Zone / the total LLG land area expressed as a %
0-9 10-19 20-29 30-39 >40
10c % Freshwater Security Zone x Terrestrial Conservation Zone overlap = the total area of overlap between Terrestrial Conservation Zone / the total LLG land area expressed as a %
0-9 10-19 20-29 30-39 >40
10 % of Total Land Area overlap across all compatible land uses: = the total area of overlap between all complementary land categories (physical constraints, terrestrial conservation, freshwater security) / the total LLG land area expressed as a %
0-9 10-19 20-29 30-39 >40
For example, for Indicator #2, if more than 40% of land within Physical Constraints Zone is designated for land use that will significantly alter the land (i.e. Commercial Agriculture Zone, Forestry Zone) then the indicator will be flagged in red. Therefore, goals and strategies would need to be developed to minimize or restore the amount of land impacted in the Physical Constraints Zone over time. These goals and strategies can be readily incorporated and integrated within a five year LLG, District or Provincial Plans to improve responsible sustainable development outcomes for that zone. Goals and Strategies might include:
Goal:By 2030, all gardens are developed outside the constraints zone and 50% of converted land is restored by reafforestation projects that include fuel wood.
Strategies:1. Community awareness program is introduced to
reduce the number of areas converted for gardens on steeper slopes
2. Community nursery is established to assist with replanting initiatives on steep slopes
3. 50 ha of steep slopes is replanted with native tree species to stabilize steep slopes
4. Family planning initiatives and awareness are conducted in areas with severe constraints conversion to help reduce the number of people from developing gardens in these areas
5. Riparian areas within Commercial Agriculture Zones are planted with tree crops and fuel wood trees to help minimize the impact on steeper slopes and to provide food and fuel wood alternatives for
communities associated with severe constraints conversion
6. Etc.
The ultimate aim of this guidance is to help improve RSD practices within LLG’s and the Province more broadly. Where an indicator is red within a Report Card, the primary aim is to introduce interventions (management strategies), that will help move an indicator from red to green over successive LLG planning cycles and for goals and strategies to be incorporated within an LLG plan as a normal part of the planning cycle. The effective implementation of RSD goals and strategies for a specific zone would be expected to improve RSD outcomes over time.
A crucial consideration when evaluating the different indicators is that they all interact with one another. For example, if Indicators 1. (i.e. % of Arable Land exceeded by 2050) and 2. (i.e. % of Physical Constraints Zone converted by 2050) (Table 2) are both red, then it generally means that proposed land use greatly exceeds available arable land. If we dig a little deeper into this, we generally find that significant areas have been marked or converted to oil palm, or have been allocated to forestry operations, or other land-use activities that might contribute to GDP. While this might be good for PNG’s economy, it might not be good for the local populations that live within an LLG.
When companies (i.e. operating best practise) plan for a proposed development, whether the expansion of oil palm areas or other commercial crops, they generally produce a static plan that considers local impacts and

34 Ridges To Reefs Assessment For New Britain, PNG:Planning For Sustainable Development
how these might be avoided or minimized. What they don’t tend to plan for is the future, or what the direct and indirect impacts of their development might be by 2050. If we consider an example where:1. 60% of the arable land is allocated to oil palm 2. 60% is allocated to a forestry company 3. 10% to current food production and 4. 10% is allocated to urban areas
Then we can rapidly see that proposed land use (total = 140%) already exceeds available arable land (100%). Given that the local population will continue to grow at 2-3%/year, then this generally means that by 2050 demands for food security will also increase in proportion with the growing population. If an additional 10% area of land is required to feed the population by 2050, then clearly the only available land is that within the Physical Constraints Zone. What this means for the ecosystem goods and services upon which the LLG depends is: increased erosion, increased loss of topsoils, increased sedimentation into nearshore water, impacts on coral reefs, decrease in fish recruitment in nearshore waters and a reduction in food security from both the land and the sea.
When allocating limited arable land to multiple and conflicting land uses, serious consideration needs to be given to intergenerational equity. That is, the decisions that we make today should not impact negatively the circumstances for the children and families of the future. What this means if we are planning in terms of RSD is that the arable land needs to be allocated in such a way that the companies and the local people benefit equally from the decision. A good example might be:1. 30% arable land to Commercial Agriculture Zone (i.e.
oil palm) 2. 30% arable land to Forestry Zone3. 30% arable land to Food Security Zone4. 10% of arable land to Urban Development Zone
Each LLG Report Card has its own unique RSD signature. Some LLG’s have significant oil palm developments, while others have large scale forestry operations, some are more remote with little road access and are relatively undeveloped, while others are urban, peri-urban and islands, all with their own unique issues.
Each LLG Report Card contains:1. A very general geographic description of the LLG
2. A summary table of the major land and sea components (arable, vs non arable lands)
3. A brief summary of poulation, food security and freshwater security projections
4. A detailed map of the Zones for each LLG5. A summary table of the Zones againts specific
indicators6. A summary table of the major areas of conflict
(overlap of incompatible landuse)7. A summary table of the major areas of mutual
benefit (overlap of compatible land use)8. A brief summary of the key issues in relation to the
indicators, and9. A brief summary of key recommenadtions to
advance RSD.
The zones and indicators largely focus on the ecosystem goods and services and environmental values that underpin each LLG. The realtive health of the environment ultimately determines how productive and resilient an LLG might be. In addition, we have allocated some of the key SDG’s against our draft indicators in recognition of the strong link between our draft indicators and the SDG’s. It is also our first attempt to operationalize the SDG’s in a meaningful way to assist with incorporating these considerations in LLG Plans.
KEY RESULTS1. SIGNIFICANT COMMERCIAL AGRICULTURE AND FORESTRY ZONES Because significant areas of arable land are allocated to commercial agriculture and forestry for some LLG’s, limited arable land is then available for gardens and food security. In addition, gardens are forced onto steeper slopes and less appropriate land as a result of unavailable arable land. This results in increased impacts on ecosystem goods and services, such as soil erosion and sedimentation of nearshore waters which results in increased impacts on both land and marine based food security. Key LLG’s with these impacts include:
1. ENB: West Pomio-Mamusi, East Pomio, Lassul Baining
2. WNB: Mosa, Hoskins, Talasea, East Nakanai

Ridges To Reefs Assessment For New Britain, PNG:Planning For Sustainable Development 35
2. FOOD SECURITY AND FRESHWATER SECURITY (MAIN ISLAND)Each LLG has very different geographic characteristics, populations and commercial activities, which means that each LLG has its own unique RSD profile. Most larger rural LLG’s with little commercial agriculture will be in a good position to provide for their own food and freshwater security by 2050. However, some LLG’s such as those with extensive commercial agriculture, Urban and Peri-urban LLG’s and Island LLG’s will lack the arable land-base to support their growing population by 2050. In WNB, this is the case for Hoskins LLG, largely due to established, broad scale oil palm plantations and population growth (Butler et al. 2013a). These LLG’s will require specific support from neighbouring LLG’s to provide the necessary food to feed the growing populations in these growth centres. This means that greater areas of food security land will need to set aside in those rural LLG’s adjacent to Urban, Peri Urban and Island LLG’s. For example, by 2050 the projected population of the combined island, urban and peri-urban LLG’s for ENB will be 798,032 people. The demand for food security will require an additional 159,606 ha of land to feed this population. The actual land available
across these LLG’s is extremely limited and it is highly likely that these LLG’s will need to draw heavily from both Inland Baining and Sinivit LLG’s to support the growing population. Provincial and District Governments will need to be extremely mindful of these issues as they plan for their respective areas and will need to ensure approvals for large scale commercial agriculture do not compromise the future ability of a Province or District to feed their people and their neighbours.
Access to fresh water will also be a key consideration for all communities in the future. A number of LLG’s within New Britain are coastal LLG’s, that is, they have little access or control over the landward catchments that provide freshwater to the coast including:1. WNB: Kimbe Urban, 2. ENB: Kombiu, Rabaul, Balanataman, Livuan Reimber,
Central Gazelle, Vunadidir/Toma, Raluana, Kokopo/Vunamani Urban, Bitapaka,
All the above LLGs have limited control over their access to freshwater. The Province, District and LLG’s will need to ensure the ecological integrity of the landward catchments associated with all Urban, Peri-Urban and coastal LLG’s to ensure fresh water security by 2050.
Figure 15: Urban, Peri-Urban and island LLG’s in ENB (blue lines represent the net movement of food from rural LLGs to urban peri-urban LLGs to support a growing population)

36 Ridges To Reefs Assessment For New Britain, PNG:Planning For Sustainable Development
3. SMALL ISLAND LLGSSmall island LLG’s (Bali Witu, Watom Island and Duke of York Islands) represent a special case. Each of these LLGs have rapidly growing populations and will likely have exceeded their carrying capacity (i.e. their ability to produce enough food to feed themselves and sufficient fresh water to support the communities) by 2040. This means that the Island LLG’s will become increasingly reliant on the importation of food from mainland New Britain to feed the population. For islands in Milne Bay Province, the threshold for self-sufficiency is approximately 100 people/km2 (Butler et al. 2014), and this has already been reached for Bali-Witu LLGs (Butler et al. 2013b). Island LLG’s also require special consideration with regards to freshwater security. Emphasis needs to be placed on protecting wells and ensuring sufficient rainwater tanks to maintain essential water supplies.
In the event of climate change impacts such as drought or sea level rise, these challenges could rapidly become extreme. Adaptation strategies, particularly in relation to ensuring food and freshwater security will be essential. Most importantly, proactive family planning initiatives are required as a matter of urgency to help alleviate both current and future pressures and impacts. Similarly, for Bali Witu LLG the previous WNB Livelihood Futures project (Butler et al. 2013ba) identified population control as the most important strategy.
4. CONFLICT AREASAreas of overlap between zones are good indicators of future conflict within the Province, Districts and LLGs. The larger the area of overlap between incompatible activities, the less sustainable is the activity (see Table 2 (indicators), Table 3 and Table 4 below). For example, high overlap between food security areas and physical constraints, means that there will be growing pressures for local communities to grow their food on steeper slopes. This may be because all the available arable land has been allocated to commercial agriculture and other activities. In this case, while commercial agriculture is doing the right thing by operating in the flatter available arable areas, it also means there has been little consideration of the human population demands and growth in the area and the future need for food. When planning for responsible sustainable development, we need to plan for food security and commercial agriculture together
so that we can minimize the collective impacts on the Physical Constraints Zone. By doing this we ensure the ecological integrity of the landscape and then its ability to support the population and industry.
If we look at the total impacts of conflict areas by 2050, then ENB has a total of 403,158 ha (i.e. 28%) of the total land area is under some form of potential conflict (see Table 3). If we look at WNB, the impacts are less with a total of 306,240 ha (i.e. 15%) (see Table 4). If we are planning for RSD, then we need to work out how to avoid or minimize these conflicts. The larger the area of conflict, the less sustainable the practise. If we are planning for RSD at the LLG, District or Provincial level, then our primary goal is to avoid or minimize these areas of conflicts. The less conflict, the more sustainable the plan.
Food Security related areas of conflict (i.e. the sum of all food security conflicts across zones) account for 16% and 5% of all conflicts by 2050 for ENB and WNB respectively (see Table 3 and Table 4). However, if we look at the relative contribution of different forms of conflict at the LLG scale then some interesting patterns emerge. By and large, those LLG’s with larger areas of land allocated to commercial agriculture and forestry have more areas of conflict between food security and all other categories. This is not surprising and demonstrates the need to consider food security carefully when assessing the impacts of proposed developments, particularly when considering the long-term impacts of commercial agriculture and forestry and the displacement of food security to less suitable areas such as physical constraints (see LLG Report Cards, Appendix 1).
In addition, we can also see at a glance that both Commercial Agriculture and Forestry are variously impacting the physical constraints area. Best practice agriculture and forestry (i.e. RSD) will minimize their operations in the Physical Constraints Zone. Likewise, best practise food security development will also seek to minimize expansion into the Physical Constraints Zone.
The great challenge with RSD is that available arable land is limited (finite). How we allocate and manage this limited land resource is extremely important. As the human population increases, the demand for food (gardens) and water also increases. If most of the arable land is allocated to commercial agriculture, then it is

Ridges To Reefs Assessment For New Britain, PNG:Planning For Sustainable Development 37
inevitable that people will need to grow their gardens on steeper slopes. It is also inevitable that there will be more conflict between areas. This also means more erosion, loss of topsoils and a reduction of food production (fish recruitment) in near shore waters, that is, a decrease in the resilience of the environment and its ability to support the population and industry.
For each LLG Report Card we have provided some initial observations regarding areas of conflict for each LLG. These areas can be used as a guide by LLG officials and representatives regarding key issues for their LLG that will need to be addressed as the LLG develops. For example, in West Pomio-Mamusi, 37% of the LLG land area is likely to be under some form of conflict by 2050 as the population continues to grow (see Table 5). Most of this conflict (24%) will be related to Food Security, where people will need to expand gardens into terrestrial conservation areas, areas of commercial agriculture and up steep slopes into areas of constraints to grow gardens to feed the rapidly growing local population. The expansion of gardens into the Physical Constraints Zone will result in greater erosion and will impact food security on the land and from the sea.
Most of these issues are a consequence of the lack of
initial planning with oil palm development. Every LLG needs to be extremely mindful of large scale approvals for commercial agriculture and the need to ensure that sufficient area is available for food production for the population (i.e. at least as much as the projected Food Security area for each LLG for 2050.
In the case of West Pomio LLG, the projected Food Security area for 2050 is 7,886 ha to feed a population of 42,861 people. The mapped area for Food Security for West Pomio-Mamusi was 23,422 ha or almost three times larger than the area required. While this looks good in terms of meeting Food Security, it also means that significant areas for food security will be pushed into the Physical Constraints Zone and conservation areas because almost all the arable land has been allocated to oil palm.
The best option when developing oil palm and ensuring food security is to make sure that these discussions are had before development occurs so that appropriate areas of land can be set aside to ensure food security. In addition, allocation of land should ensure equity, that is equal amounts of arable land for the community and industry. Finally, ensuring best practice from the outset of any project is essential to ensure RSD.
Table 3: Total area of conflicts for East New Britain
Table 4: Total area of conflicts for West New Britain
Food Security overlaps with: Hectares (ha) % of Province Sustainability Indicator and Ranking
Commercial Agriculture 49,582 3% 9a
Terrestrial Conservation 74,689 5% 9b
Freshwater Security 4,130 0% 9c
Physical Constraints overlaps with:
Food Security 109,713 8% 9d
Forestry 86,498 6% 9e
Commercial Agriculture 78,546 5% 9f
Total 403,158 28% 9
Food Security overlaps with: Hectares (ha) % of Province Sustainability Indicator and Ranking
Commercial Agriculture 3,715 0% 9a
Terrestrial Conservation 8,021 0% 9b
Freshwater Security 51,865 3% 9c
Physical Constraints overlaps with:
Food Security 43,718 2% 9d
Forestry 133,810 7% 9e
Commercial Agriculture 65,112 3% 9f
Total 306,240 15% 9

38 Ridges To Reefs Assessment For New Britain, PNG:Planning For Sustainable Development
Table 5: West Pomio-Mamusi Conflict Areas
Table 6: Total area of benefit for East New Britain
Table 7: Total area of benefit for West New Britain
Food Security overlaps with: Hectares (ha) % of Province Sustainability Indicator and Ranking
Commercial Agriculture 2,590 1% 9a
Terrestrial Conservation 23,426 13% 9b
Freshwater Security 22 0% 9c
Physical Constraints overlaps with:
Food Security 17,586 10% 9d
Forestry 995 1% 9e
Commercial Agriculture 19,571 11% 9f
Total 64,190 37% 9
Physical Constraints overlaps with: Hectares (ha) % of Province Sustainability Indicator and Ranking
Freshwater Security 126,772 9% 10aTerrestrial Conservation 583,330 40% 10b
Fresh Water Security overlaps with:
Terrestrial Conservation 110,624 8% 10cTotal 820,725 57% 10
Physical Constraints overlaps with: Hectares (ha) % of Province Sustainability Indicator and Ranking
Freshwater Security 420,128 21% 10a
Terrestrial Conservation 90,899 4% 10bFresh Water Security overlaps with:
Terrestrial Conservation 286,963 14% 10cTotal 797,990 39% 10
5. BENEFIT AREASAreas of overlap between some zones are also good indicators of future benefit within the Province, Districts and LLGs. The larger the area of overlap between compatible land use activities, the less more sustainable the activity (see Table 6 and Table 7 below). For example, high overlap between freshwater security areas, physical constraints and terrestrial conservation areas, means that there will be good opportunities achieving multiple LLG goals across the one area and reinforcing the protection of valuable resources (i.e. freshwater, biodiversity and the ecological and physical integrity of the landscape). When planning for RSD, overlap between these areas is seen as a “no regrets” outcome or opportunity for the LLG, where securing these areas of overlap ensures the ecological integrity of the landscape and the nearshore waters, which in turn increases the ability of the land and sea to support the population and industry.
If we look at the total area of benefit areas by 2050, then ENB has a total of 820,725 ha (i.e. 57%) of the total land area is under some form of potential benefit (see Table 6). If we look at WNB, the potential benefits are less 797,990 ha (i.e. 39%) (see Table 7). If we are planning for RSD, then the areas of mutual benefit where land use is compatible represent good opportunities for protection and multiple benefits. The larger the area of benefit, the more sustainable the practise. If we are planning for RSD at the LLG, District or Provincial level, then our primary goal is to maximise these areas of benefit. The greater the areas of mutual benefit, the more sustainable the plan.
Freshwater Security areas of benefit (i.e. the sum of all freshwater security related overlaps between compatible zones) account for 17% and 35% of all benefit by 2050 for ENB and WNB respectively (see Table 6 and 7). Significant opportunities exist to expand these “no regrets” areas.
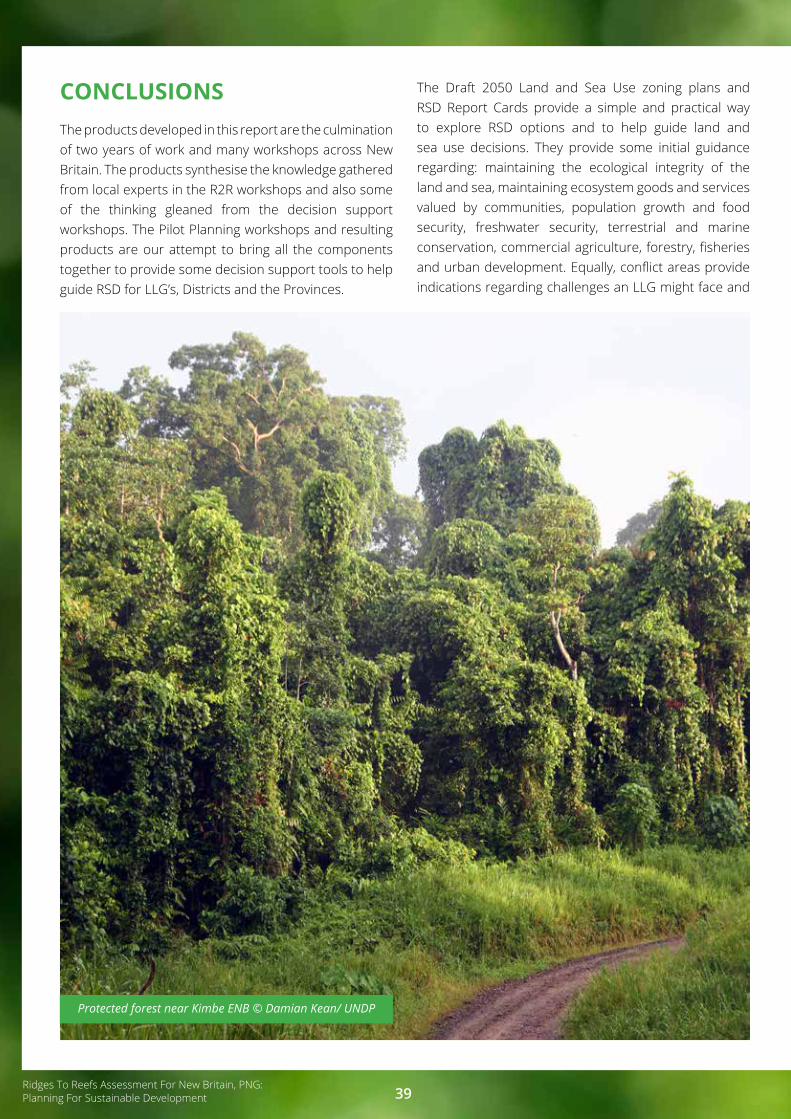
Ridges To Reefs Assessment For New Britain, PNG:Planning For Sustainable Development 39
CONCLUSIONSThe products developed in this report are the culmination of two years of work and many workshops across New Britain. The products synthesise the knowledge gathered from local experts in the R2R workshops and also some of the thinking gleaned from the decision support workshops. The Pilot Planning workshops and resulting products are our attempt to bring all the components together to provide some decision support tools to help guide RSD for LLG’s, Districts and the Provinces.
The Draft 2050 Land and Sea Use zoning plans and RSD Report Cards provide a simple and practical way to explore RSD options and to help guide land and sea use decisions. They provide some initial guidance regarding: maintaining the ecological integrity of the land and sea, maintaining ecosystem goods and services valued by communities, population growth and food security, freshwater security, terrestrial and marine conservation, commercial agriculture, forestry, fisheries and urban development. Equally, conflict areas provide indications regarding challenges an LLG might face and
Protected forest near Kimbe ENB © Damian Kean/ UNDP

40 Ridges To Reefs Assessment For New Britain, PNG:Planning For Sustainable Development
mutual benefit areas provide indications of no regrets areas and opportunities for LLG’s. The indicators developed provide initial guidance regarding the relative sustainability of development within the LLGs. These can be used to further refine plans, but also guide goals and strategies to reduce future impacts.
The Draft zoning plans and their associated Report Cards are based on the input of a few LLG representatives using best available data and projections and are based on a number of assumptions (see pp 10). The Report Cards are intended to be decision-support tools for the development of 5-year LLG plans. However, they are only a first step, and their incorporation and inclusion into LLG plans will require deeper consultation with the broader LLG community, industry and government support to refine boundaries, develop goals and strategies, and to gain approval and budget support. How the LLG’s, District and Provincial Governments choose to use these DRAFT zoning plans and Report Cards to support their decision-making is at the discretion of each level of government. That said, there are a number of key observations from this report that require specific attention:1. Population-constrained LLGs – a number of LLG’s
are already experiencing food and water shortages as well as a myriad of other problems associated with population pressure. These include the three island LLG’s Bali Witu, Watom and Duke of York, and some of the LLGs with significant Commercial and Village Oil Palm Estates such as Hoskins LLG. Population-constrained LLGs would all benefit greatly from proactive family planning initiatives to help alleviate both current and future pressures in these LLGs, as already highlighted by previous TNC-CSIRO work in WNB.
2. Climate change adaptation – population-constrained LLG’s are also likely the most vulnerable to the impacts of climate change events and would benefit greatly from the development of climate change adaptation strategies to ensure food security and freshwater security during periods of drought as well as the potential impacts of sea level events for those communities in low lying areas. These have already been identified for Bali-Witu LLG in 2013, and strategies overlap and complement the land use zoning presented in the Report Card for this LLG.
3. Best Practice for commercial agriculture – it is essential to ensure best practice is applied at the
outset of any proposed commercial agriculture development. For example, if a company displaces local people and clears all arable land for oil palm development without ensuring food security, fresh water security and the retention of High Conservation Areas (HCV), then it may be in breach of its permit conditions. A company might become RSPO accredited after the land has been cleared, but all of the damage has already been done and all options for food security, freshwater security and retention of HCV are already lost. It is essential therefore that all companies operate with best practise from the inception of a project to ensure RSD, and that the regulatory authorities ensure this occurs.
4. Equity – when arable land is allocated to commercial operators, decision-makers need to be extremely aware of the long-term direct and indirect impacts of the proposed development. If all arable land is allocated to commercial agriculture or forestry, then as the population grows and the demand for food security grows the rural population will be forced to develop gardens on steep slopes and other inappropriate land. This will result in increased soil erosion, increased sedimentation of nearshore waters and impacts on reefs which will put pressure on food security derived from both land and marine resources. If planning is done correctly at the outset and sufficient land is set aside to ensure food security for 2050, then many future issues of conflict and the degradation of the LLG can be avoided or minimized.
5. Emerging Principles for RSD – A number of key issues have consistently emerged over the last two years that provide the basis for the development of a set of RSD principles to be considered with the development of any LLG plan. These are outlined below for consideration by LLG, District and Provincial Governments.
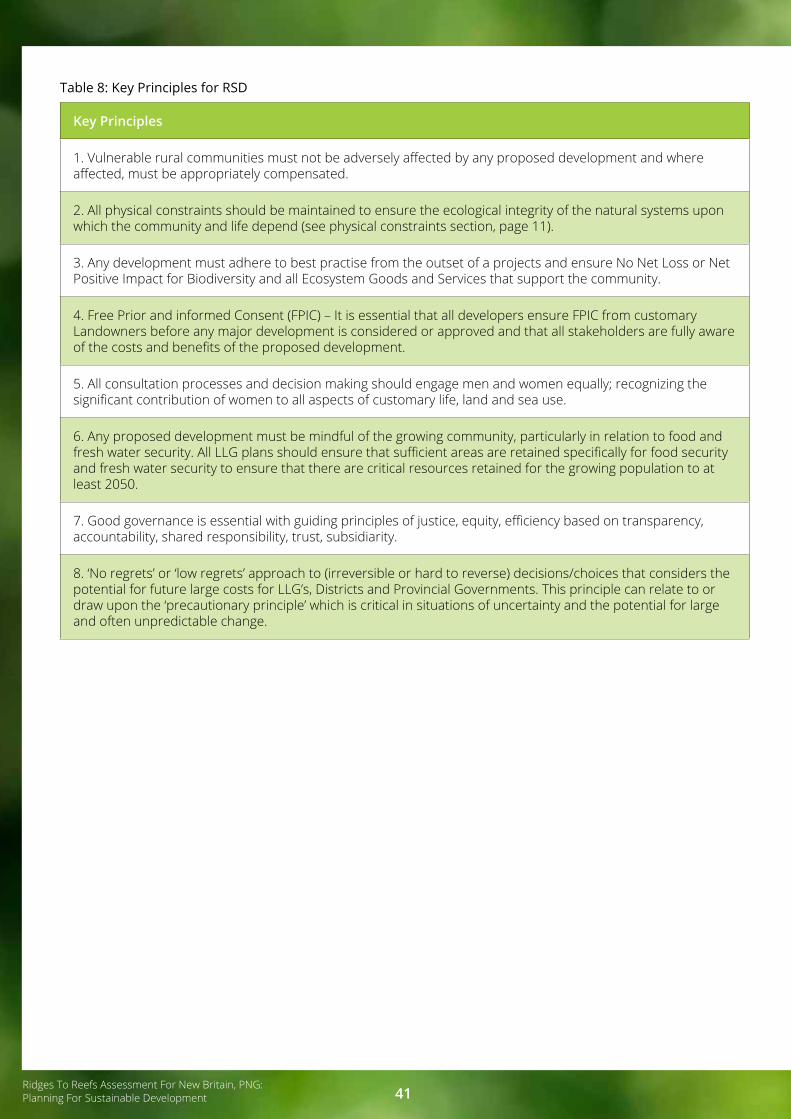
Ridges To Reefs Assessment For New Britain, PNG:Planning For Sustainable Development 41
Table 8: Key Principles for RSD
Key Principles
1. Vulnerable rural communities must not be adversely affected by any proposed development and where affected, must be appropriately compensated.
2. All physical constraints should be maintained to ensure the ecological integrity of the natural systems upon which the community and life depend (see physical constraints section, page 11).
3. Any development must adhere to best practise from the outset of a projects and ensure No Net Loss or Net Positive Impact for Biodiversity and all Ecosystem Goods and Services that support the community.
4. Free Prior and informed Consent (FPIC) – It is essential that all developers ensure FPIC from customary Landowners before any major development is considered or approved and that all stakeholders are fully aware of the costs and benefits of the proposed development.
5. All consultation processes and decision making should engage men and women equally; recognizing the significant contribution of women to all aspects of customary life, land and sea use.
6. Any proposed development must be mindful of the growing community, particularly in relation to food and fresh water security. All LLG plans should ensure that sufficient areas are retained specifically for food security and fresh water security to ensure that there are critical resources retained for the growing population to at least 2050.
7. Good governance is essential with guiding principles of justice, equity, efficiency based on transparency, accountability, shared responsibility, trust, subsidiarity.
8. ‘No regrets’ or ‘low regrets’ approach to (irreversible or hard to reverse) decisions/choices that considers the potential for future large costs for LLG’s, Districts and Provincial Governments. This principle can relate to or draw upon the ‘precautionary principle’ which is critical in situations of uncertainty and the potential for large and often unpredictable change.

42 Ridges To Reefs Assessment For New Britain, PNG:Planning For Sustainable Development
PNG’s native flora is very attractive to tourists © Alice Plate/ UNDP
Ridges To Reefs Assessment For New Britain, PNG:Planning For Sustainable Development 43
REFERENCESAdams, V.M., Tulloch, V.J. and Possingham, H.P (2016) Land-sea conservation assessment for Papua New Guinea. University of Queensland Publication
Aiama D., Edwards S., Bos G., Ekstrom J., Krueger L., Quétier F., Savy C., Semroc B., Sneary M. and Bennun L. 2015. No Net Loss and Net Positive Impact Approaches for Biodiversity: exploring the potential application of these approaches in the commercial agriculture and forestry sectors. Gland, Switzerland: IUCN. XX pp
Almany, G.R., Hamilton, R.J., Matawai, M. and Kichawen, P. (2015). Local benefits from community actions: small managed areas can help rebuild and sustain some coastal fisheries. SPC Traditional Marine Resource Management and Knowledge Bulletin 35: 3-17.
Bourke, R.M. and Harwood, T. (eds) (2009). Food and Agriculture in Papua New Guinea.
ANU E Press, The Australian National University, Canberra.
Butler, J.R.A., Skewes, T.D., Wise, R.M., Bohensky, E., Peterson, N., Bou, N. and Masike-Liri, B. (2012) West New Britain Futures Workshop Report 18-19 July 2012. Report prepared for the Australian and Papua New Guinea Government under the Coral Triangle Initiative on Coral Reefs, Fisheries and Food Security. CSIRO Climate Adaptation Flagship, Canberra, Australia. 64 pp.
Butler, J.R.A., Skewes, T.D., Wise, R.M., Bou, N., Vaghelo, D. and Masike-Liri, B. 2013a. Adaptation strategy integration and policy evaluation workshop report: Hoskins LLG. Climate Futures, Ecosystem Services and Livelihood Adaptation Strategies in West New Britain, Papua New Guinea. Report to the Australian Government’s Department of Sustainability, Environment, Water, Population and Communities for the Coral Triangle Initiative on Coral Reefs, Fisheries and Food Security. 33 pp.
Butler, J.R.A., Skewes, T.D., Wise, R.M., Bou, N., Vaghelo, D. and Masike-Liri, B. 2013b. Adaptation strategy integration and policy evaluation workshop report: Bali-Witu LLG. Climate Futures, Ecosystem Services and Livelihood Adaptation Strategies in West New Britain, Papua New Guinea. Report to the Australian Government’s
Department of Sustainability, Environment, Water, Population and Communities for the Coral Triangle Initiative on Coral Reefs, Fisheries and Food Security. 20 pp.
Butler, J.R.A., Skewes, T., Mitchell, D., Pontio, M. and T. Hills 2014. Declining ecosystem service trajectories in Milne Bay, Papua New Guinea: is human population pressure a more critical driver than climate change? Marine Policy 46:1-13.
Butler, J.R.A., Wise, R.M., Skewes, T.D., Bohensky, E.L., Peterson, N., Suadnya, W., Yanuartati, Y., Handayani, T., Habibi, P., Puspadi, K., Bou, N., Vaghelo, D. and Rochester, W. 2015. Integrating top-down and bottom-up adaptation planning to build adaptive capacity: a structured learning approach. Coastal Management 43:346-364.
Butler, J.R.A., Allan, J., Apelis, C., Bohensky, E.L., Masike-Liri, B., Meharg, S., Peterson, N., Wise, R.M. and Paisparea, F. 2016. East New Britain pilot planning workshop 1: oil palm. Building capacity for adaptive governance of the Bismarck Sea, Papua New Guinea. Report to the Australian Department for the Environment, Canberra. 60 pp.
Colding & Folke 2001;
Foale S., Cohen P., Januchowski-Hartley S., Wenger A. and Macintyre M. 2011. Tenure and taboos:
Origins and implications for fisheries in the Pacific. Fish and Fisheries 12(4):357–369.
Government of PNG (1975), Constitution of the Independent State of Papua New Guinea.
Government of PNG (2009), VISION 2050.
Government of PNG (2010), Papua New Guinea Development Strategic Plan 2010-2030
- Our guide to success (PNGDSP 2030)
Government of PNG (2011) National Population and Housing Census
Government of PNG (2014a) - NATIONAL STRATEGY FOR RESPONSIBLE SUSTAINABLE DEVELOPMENT FOR PAPUA NEW GUINEA (StaRs) Department of National Planning and Monitoring

44 Ridges To Reefs Assessment For New Britain, PNG:Planning For Sustainable Development
Government of PNG (2014b), Papua New Guinea Policy on Protected Areas. Conservation & Environment Protection Authority. Waigani, National Capital District, Papua New Guinea.
Government of PNG (2016) PNG Nationally Determined Contribution (NDC) Under the United Nations Framework Convention on Climate Change
Govan H (2009) Achieving the potential of locally managed marine areas in the South Pacific. SPC Tradit Mar Resour Manag Knowl Inf Bull 25: 16–25
Green, A., Smith, S.E., Lipsett-Moore, G., Groves, C., Peterson, N., Sheppard, S., Lokani, P., Hamilton, R.,
Almany, J., Aitsi, J., and Bualia, L. 2009. Designing a resilient network of marine protected areas for Kimbe Bay, Papua New Guinea, Oryx 43 (4): 488–498
Griggs, D., Stafford-Smith, M., Gaffney, O., Rockström, J., Öhman, M.C, Shyamsundar, P., Steffen, W., Glaser,G., Kanie, N., and Noble I., (2013) Policy: Sustainable development goals for people and planet
Nature 495, 305–307 (21 March 2013) doi:10.1038/495305a
Hamilton, R., and F. Taniveke. (2004). Indigenous Knowledge of Coral Reef Fish Spawning Aggregations in Choiseul Province, Solomon Islands. (RESTRICTED ACCESS VERSION). Report prepared for the Pacific Island Countries Coastal Marine Program, The Nature Conservancy. TNC Pacific Island Countries Report No. 8/04
Hamilton, R., A. Green and J. Almany (eds.) 2009. Rapid Ecological Assessment: Northern Bismarck Sea, Papua New Guinea. Technical report of survey conducted August 13 to September 7, 2006. TNC Pacific Island Countries Report No. 1/09.
Hamilton, R., Ramohia, P., Hughes, A., Siota, C., Kere, N., Giningele, M., Kereseka, J., Taniveke, F., Tanito, N., Atu, W. and L. Tanavalu, 2007. Post-Tsunami Assessment of Zinoa Marine Conservation Area, South Choiseul, Solomon Islands. TNC Pacific Island Countries Report No. 4/07.
Hamilton, R.J., Almany, G.R., Brown, CJ, Pita, J.,
Peterson, N.A. and Choat JH. (2017). Logging degrades nursery habitat for an iconic coral reef fish. Biological Conservation. 210 Part A, 273-280.
Harrison H.B., Williamson D.H., Evans R.D.,Almany G.R., Thorrold S.R., Russ G.R., Feldheim K.A., van Herwerden L., Planes S., Srinivasan M., Berumen M.L. and Jones G.P. 2012. Larval export from marine reserves and the recruitment benefit for fish and fisheries. Current Biology 22(11):1023–1028.
Hurney, M. (2017) The Human and Economic Cost of Child Undernutrition in Papua New Guinea. Save the Children Australia
Hunter PR, MacDonald AM, Carter RC (2010) Water Supply and Health. PLoS Med7(11): e1000361. https://doi.org/10.1371/journal.pmed.1000361
Johannes R.E. 1981. Words of the lagoon: Fishing and marine lore in the Palau District of Micronesia.
University of California Press, Berkeley. 245 p.
Lester S, Halpern B, Grorud-Colvert K, Lubchenco J, Ruttenberg B, et al. (2009) Biological effects within no-take marine reserves: a global synthesis. Mar Ecol Prog Ser 384: 33–46. doi:10.3354/meps08029
Lipsett-Moore G, Game E, Peterson N, Saxon E, Sheppard S, Allison A, Michael J, Singadan R, Sabi J, Kula G. 2010. Interim national terrestrial conservation assessment for Papua New Guinea: Protecting biodiversity in a changing climate. Papua New Guinea Department of Environment and Conservation, The Nature Conservancy, and United Nations Development Programme, Brisbane.
Meharg, S., Wise, R.M. and Butler, J.R.A. 2016. Decision-making case studies summary report: Building
capacity for adaptive governance of the Bismarck Sea, Papua New Guinea. Report to the Australian
Department for the Environment, Canberra. 20 pp.
Nelson P.N., Webb M.J., Orrell I., van Rees H., Banabas M., Berthelsen S., Sheaves M., Bakani F., Pukam O., Hoare M., Griffiths W., King G., Carberry P., Pipai R., McNeill A., Meekers P., Lord S., Butler J., Pattison T., Armour J. and Dewhurst C. 2010. Environmental sustainability of oil palm cultivation in Papua New Guinea. ACIAR Technical

Ridges To Reefs Assessment For New Britain, PNG:Planning For Sustainable Development 45
Reports No. 75. Australian Centre for International Agricultural Research: Canberra. 66 pp.
Pratchett M.S., Munday P.L., Graham N.A.J., Kronen M., Pinca S., Friedman K., Brewer T.D., Bell J.D., Shaun K. Wilson, Cinner J.E., Kinch J.P., Lawton R.J., Ashley J. Williams, Chapman L., Magron F. and Webb A. 2011. Vulnerability of coastal fisheries in the tropical Pacific to climate change. p 493–576. In: Bell J.D., Johnson J.E. and Hobday A.J. (eds). Vulnerability of tropical Pacific fisheries and aquaculture to climate change. Secretariat of the Pacific Community: Noumea, New Caledonia.
Rockström, J., W. Steffen, K. Noone, Å. Persson, F. S. Chapin, III, E. Lambin, T. M. Lenton, M. Scheffer,
C. Folke, H. Schellnhuber, B. Nykvist, C. A. De Wit, T. Hughes, S. van der Leeuw, H. Rodhe, S. Sörlin, P.
K. Snyder, R. Costanza, U. Svedin, M. Falkenmark, L. Karlberg, R. W. Corell, V. J. Fabry, J. Hansen, B.
Walker, D. Liverman, K. Richardson, P. Crutzen, and J. Foley. (2009). Planetary boundaries: exploring the
safe operating space for humanity. Ecology and Society 14(2): 32. [online] URL: http://www.
ecologyandsociety.org/vol14/iss2/art32/
RSPO (Roundtable on Sustainable Palm Oil) 2007. RSPO principles and criteria for sustainable palm oil production. Including indicators and guidance. October 2007. RSPO. At: <http://www.rspo.org>.
Russ GR and Alcala AC (1996) Marine Reserves: Rates and Patterns of Recovery and Decline of Large Predatory Fish. Ecol Appl 6: 947–961. doi:10.2307/2269497
Shearman P, Bryan J, Ash J, Hunnam P, Mackey B, Lokes B. 2008. The state of the forests of Papua New Guinea. Port Moresby.
SPC (Secretariat of the Pacific Community). 2013. Status report: Pacific Islands reef and nearshore fisheries and aquaculture. Noumea, New Caledonia: Secretariat of the Pacific Community. 60 p.
United Nations (2015a) Adoption of the Paris Agreement (ref - http://unfccc.int/paris_agreement/items/9485.php)
United Nations (2015b) Transforming our world: the 2030 Agenda for Sustainable Development
United Nations (2015c) - Mainstreaming the 2030 Agenda for Sustainable Development Interim Reference Guide to UN Country Teams United Nations Development Group
United Nations (2015d) Getting Started with the Sustainable Development Goals: A Guide for Stakeholders, (Sustainable Development Solutions Network). A global initiative for the United Nations
World Food Programme (2009) Comprehensive Food Security & Vulnerability Analysis Guidelines, Food Security Analysis Service

46 Ridges To Reefs Assessment For New Britain, PNG:Planning For Sustainable Development
APPENDIX 1: REPORT CARDS FOR EAST NEW BRITAINZONING REPORT CARD: MELKOI LLGMelkoi LLG is characterised by a narrow arable coastal strip 3-5 km wide and some isolated arable plateaus inland. These arable areas are suitable for growing crops (food security, cash crops and commercial agriculture), forestry and urban areas. The coastal strip in Melkoi LLG is backed by rugged slopes and hillsides that grade into the Whiteman Mountain Range. Some areas of the coastal strip were established as a Special Agricultural Business Lease (SABL) and has been identified as part of a growth corridor in PNG DSP 2030. A portion of the coastal lowland forest within the SABL has been converted to oil palm since 2011. Steep areas associated with the foothills and mountains are mostly unsuitable for commercial agriculture, but suitable for the retention of intact catchments for fresh water security and terrestrial conservation areas. Nearshore waters have some reefs systems that drop into deep water.
Population, food security and freshwater security:The projected population for Melkoi LLG by 2050 will be 35,629 (more than 3 times the current population). This will require a minimum area of 7,126 ha of land specifically dedicated to food production to ensure food security. The mapped area of food security in the current draft zoning plan is 34,309 ha (4.8 times) the minimum area required, which means that under this draft plan, Melkoi LLG will be in a good position to ensure food security by 2050. However, any decisions around proposed commercial agriculture developments will still need to ensure that food security is appropriately considered for this LLG.
Table 9: Melkoi LLG – Area Summaries
Feature Hectares (ha) % of LLG Land
Total Area of Land 141,359
Total Area of Sea (out to 3nm) 40,715
Total Combined Land and Sea 182,074
Total Area Constraints:
Extreme (>30 degrees slope) 14,153 10%
Serious (20-30 degrees slope) 77,204 55%
Riparian Buffers (10 m each side) 1,247 1%
Coastal Buffers (10 m along coast) 68 0%
Total Area Terrestrial Constraints 92,672 66%
Total Area of Land 141,359
Total Area Unavailable Land - 92,672 66%
Total Area Available Land (Total land – unavailable land) = 48,687 34%

Ridges To Reefs Assessment For New Britain, PNG:Planning For Sustainable Development 47
Figure 16: Melkoi LLG - 2050 Zoning Plan

48 Ridges To Reefs Assessment For New Britain, PNG:Planning For Sustainable Development
Table 10: Melkoi LLG - Zone Area Summaries
Parameter Hectares (ha) % ofLLG Land
% ofLLG Available
Land
Sustainability Indicator and
Ranking
TERRESTRIAL
Zone 1: Physical Constraints (Table 9) 92,672 66%
Zone 2: Fresh Water Security - 0% 3
Zone 5: Terrestrial Conservation 39,097 28% 4
Projected Food Security 2050 7,126 (481%) 15% 6a
Zone 3: Food Security 34,309 70% 6b
Zone 6: Forestry 6,038 12% 7
Zone 7: Commercial Agriculture 15,145 31% 8
Zone 9: Urban Development 1,321 3%
Zone 10: Multiple Use - 0%
Available Land (Table 9) 48,687 100%
Proposed Land Use by 2050(= Zone 3 + 6 + 7 + 9 + 10) 56,814 117% 1
Index of Sustainability (= available land - proposed land use) -8,127 - 17% 2
% of LLG Marine
MARINE
Zone 4: Marine Conservation 1,5821 4% 5
Zone 8: Sustainable Fisheries 38,893 96%
Total Marine Area per LLG (Table 9) 40,715
1Marine area within Tavalo WMA

Ridges To Reefs Assessment For New Britain, PNG:Planning For Sustainable Development 49
Table 11: Melkoi LLG - Areas of Conflict
Table 12: Melkoi LLG - Areas of Mutual Benefit
Food Security overlaps with: Hectares (ha) % of Province Sustainability Indicator and Ranking
Commercial Agriculture 15,145 11% 9a
Terrestrial Conservation 5,094 4% 9b
Freshwater Security 0 9c
Physical Constraints overlaps with:
Food Security 23,656 17% 9d
Forestry 4,977 4% 9e
Commercial Agriculture 12,627 9% 9f
Total 61,499 44% 9
Physical Constraints overlaps with: Hectares (ha) % of Province Sustainability Indicator and Ranking
Freshwater Security 0 0% 10a
Terrestrial Conservation 35,215 25% 10b
Fresh Water Security overlaps with:
Terrestrial Conservation 648 0.5% 10c
Total 35,683 25% 10
Key Issues and Opportunities: 1. Under the current draft plan, proposed land use
(56,814 ha) exceeds the area of available land (48,687 ha) by 117%. When this happens, additional land needs to be found somewhere – in most instances this means on steeper slopes, within the physical constraints areas, which results in increased soil erosion impacts to near shore water and marine food security.
2. Fresh water security is not addressed in this plan and it will be important to ensure freshwater security upstream of communities and particularly for growth centres.
3. Terrestrial conservation is effectively considered in the plan with 28% of LLG land area mapped. This meets and exceeds RSD requirements.
4. Mapped food security exceeds the minimum food security area required for 2050 by 4.8 times. This means that the LLG will ensure food security, but will also be in a position to export food if required. However, the expanded area for food security is met on steep slopes (see constraints 9d)
5. Areas of conflict between physical constraints and food security, forestry and commercial agriculture, are all related to the proposed use exceeding the available arable land.
6. Areas of conflict between food security and commercial agriculture (15,145 ha).
7. There are large opportunities to strengthen fresh water security jointly with terrestrial conservation.
Key Recommendations:1. Thoughtful planning and refinement of boundaries
could enable Melkoi LLG to meet food security requirements without violating the physical constraints (possible reduction in food security areas to by 3-4,000 ha.
2. Need to expand freshwater security areas upstream of communities and growth centres.
3. Tavalo WMA represents a good start towards marine conservation, additional areas need to be established to ensure food security for marine resources.
4. Resolve areas of conflict between terrestrial conservation and food security (Avoid, Minimize).
5. Resolve areas of conflict between food security and commercial agriculture (Avoid Minimize).

50 Ridges To Reefs Assessment For New Britain, PNG:Planning For Sustainable Development
ZONING REPORT CARD: WEST POMIO - MAMUSI LLGWest Pomio - Mamusi LLG is characterised by a narrow arable coastal strip 3-5 kms wide and some isolated arable plateaus inland. These arable areas are suitable for growing crops (food security, cash crops and commercial agriculture), forestry and urban areas. The coastal strip in West Pomio - Mamusi LLG is backed by rugged slopes and hillsides that grade into the Nakanai Mountain Range. The same coastal strip was established as a Special Agricultural Business Lease (SABL) and has been identified as part of a growth corridor in PNG DSP 2030. The lowland forest within the SABL has been converted to oil palm by RH since 2011. Steep areas associated with the foothills and mountains are mostly unsuitable for commercial agriculture, but suitable for the retention of intact catchments for fresh water security and terrestrial conservation areas. Nearshore waters have some reefs systems that drop into deep water.
Population, food security and freshwater security:The projected population for West Pomio - Mamusi LLG by 2050 will be 42,861 (more than 3 times the current population). This will require a minimum area of 8,572 ha of land specifically dedicated to food production to ensure food security. The mapped area of food security in the current draft zoning plan is 23,422 ha, three times the minimum area required, which means that under this draft plan, West Pomio - Mamusi LLG will be in a good position to ensure food security by 2050. However, any decisions around proposed commercial agriculture developments will need to ensure food security for this LLG.
Table 13: West Pomio - Mamusi LLG - Area Summaries
Feature Hectares (ha) % of LLG Land
Total Area of Land 174,023
Total Area of Sea (out to 3nm) 35,108
Total Combined Land and Sea 209,130
Total Area Constraints:
Extreme (>30 degrees slope) 113,226 65%
Serious (20-30 degrees slope) 40,645 23%
Riparian Buffers (10 m each side) 355 0%
Coastal Buffers (10 m along coast) 87 0%
Total Area Terrestrial Constraints 154,313 89%
Total Area of Land 174,023 100%
Total Area Unavailable Land - 154,313 89%
Total Area Available Land (Total land – unavailable land) = 19,710 11%

Ridges To Reefs Assessment For New Britain, PNG:Planning For Sustainable Development 51
Figure 17: West Pomio - Mamusi LLG - 2050 Zoning Plan

52 Ridges To Reefs Assessment For New Britain, PNG:Planning For Sustainable Development
Table 14: West Pomio - Mamusi LLG - Zone Area Summaries
Parameter Hectares (ha) % ofLLG Land
% ofLLG Available
Land
Sustainability Indicator and
Ranking
TERRESTRIAL
Zone 1: Physical Constraints (Table 13) 154,313 89%
Zone 2: Fresh Water Security 1,290 1% 3
Zone 5: Terrestrial Conservation 141,450 81% 4
Projected Food Security 2050 8,572 (277%) 43% 6a
Zone 3: Food Security 23,781 121% 6b
Zone 6: Forestry 1,929 10% 7
Zone 7: Commercial Agriculture 25,867 131% 8
Zone 9: Urban Development - 0%
Zone 10: Multiple Use - 0%
Available Land (Table 13) 19,710 100
Proposed Land Use by 2050(= Zone 3 + 6 + 7 + 9 + 10) 51,577 262% 1
Index of Sustainability (= available land - proposed land use) - 31,867 - 162 2
% of LLG Marine
MARINE
Zone 4: Marine Conservation 17,865 51% 5
Zone 8: Sustainable Fisheries 21,999 63%
Total Marine Area per LLG (Table 13) 35,108

Ridges To Reefs Assessment For New Britain, PNG:Planning For Sustainable Development 53
Table 15: West Pomio - Mamusi LLG - Areas of Conflict
Table 16: West Pomio - Mamusi LLG - Areas of Mutual Benefit
Food Security overlaps with: Hectares (ha) % of Province Sustainability Indicator and Ranking
Commercial Agriculture 2,590 1% 9a
Terrestrial Conservation 23,426 13% 9b
Freshwater Security 22 0% 9c
Physical Constraints overlaps with:
Food Security 17,586 10% 9d
Forestry 995 1% 9e
Commercial Agriculture 19,571 11% 9f
Total 64,190 37% 9
Physical Constraints overlaps with: Hectares (ha) % of Province Sustainability Indicator and Ranking
Freshwater Security 1,077 0.6% 10a
Terrestrial Conservation 134,685 77% 10b
Fresh Water Security overlaps with:
Terrestrial Conservation 1,187 0.7% 10c
Total 136,950 79% 10
Key Issues and Opportunities: 1. Under the current draft plan, proposed land use
greatly exceeds available arable land by 31,867 ha (262%). This does not meet RSD requirements and operations of the key arable zones will need considerable refinement of boundaries and improved practices to transition the draft plan to a more sustainable position.
2. Under the current draft plan commercial agriculture accounts for 131% of the available arable land. This means that there is no arable land available for other activities such as: food security, forestry or urban development. The result is that these other activities are forced to extend into areas of physical constraints which result in significant erosion and impact to the nearshore waters, which will impact marine resources and food security.
3. Under the current draft plan mapped food security is 2.7x projected food security, which means the LLG will be in a good position to feed itself, however, this will be done at the expense of the Physical Constraints areas.
4. There conflicts between physical constraints and food security and commercial agriculture conflict (9d, 9f – see Table 7) and also where food security is forced to conflict with terrestrial conservation (9b – see Table 7).
5. In addition, fresh water security is inadequately considered and will require significant expansion to identify and allocate the appropriate catchments to support local communities and growth centres.
This could be reinforced by developing freshwater security areas in concert with terrestrial conservation areas to meet multiple RSD goals.
6. No marine conservation areas under the current plan (does not meet RSD goals for marine conservation or food security.
Key Recommendations:1. Under this draft plan, the proposed land use greatly
exceeds the available land. Careful refinement will be required to minimise the impacts of food security and commercial agriculture on physical constraints. Given that commercial agriculture holds all the arable land, there may be a requirement to hand back some land to support food security in order to meet RSD requirements.
2. Ensure best practise by oil palm companies from the outset of development (RSPO accreditation) to minimize both short term and potential long-term impacts by development.
3. In addition, each of the major arable land use components will need to carefully consider the physical constraints and refine boundaries of operations to minimize erosion (Table 7).
4. Fresh water security areas will need to be expanded and distributed across the LLG to meet community needs. These catchments can also be strengthened with the establishment of terrestrial conservation areas to assist in meeting mutual benefit goals and RSD outcomes.
5. Marine conservation areas need to be established to meet RSD goals and to ensure marine food security.

54 Ridges To Reefs Assessment For New Britain, PNG:Planning For Sustainable Development
Locally grown produce is an essential component of life in PNG © Nate Peterson/ The Nature Conservancy

Ridges To Reefs Assessment For New Britain, PNG:Planning For Sustainable Development 55
ZONING REPORT CARD: CENTRAL INLAND POMIO LLGThe Central Inland Pomio LLG geography is characterised by a narrow arable coastal strip 2-5 kms wide and some arable areas that flank the river valleys, although many of these are steep. There are also some isolated arable plateaus inland. These arable areas are suitable for growing crops (food security, cash crops and commercial agriculture), forestry and urban areas. The coastal strip in Central Inland Pomio LLG is backed by rugged slopes and hillsides that grade into the Nakanai Mountain Range. These areas are mostly unsuitable for commercial agriculture, but suitable for the retention of intact catchments for fresh water security and terrestrial conservation areas. Nearshore waters have some reefs systems that drop into deep water beyond 3 nautical miles.
Population, food security and freshwater security:The projected population for Central Inland Pomio LLG by 2050 will be 64,744 (more than 3 times the current population). This will require a minimum area of 12,949 ha of land specifically dedicated to food production to ensure food security. The mapped area of food security in the current draft zoning plan is 57,153 ha, significantly more than the minimum area required, which means that under this draft plan, Central Inland Pomio LLG will be in a good position to act as a food bowl for other LLG’s, but equally to guarantee its food security beyond 2050. Current estimates indicate that with the present population growth, Central Inland Pomio LLG will readily sustain itself and its growing population by 2050. However, any decisions around proposed commercial agriculture developments will still need to ensure food security for this LLG.
Table 17: Central Inland Pomio LLG - Area Summaries
Feature Hectares (ha) % of LLG Land
Total Area of Land 433,444
Total Area of Sea (out to 3nm) 44,807
Total Combined Land and Sea 478,251
Total Area Constraints:
Extreme (>30 degrees slope) 283,124 65%
Serious (20-30 degrees slope) 77,165 18%
Riparian Buffers (10 m each side) 1,843 0%
Coastal Buffers (10 m along coast) 102 0%
Total Area Terrestrial Constraints 362,232 84%
Total Area of Land 433,444 100%
Total Area Unavailable Land - 362,232 83%
Total Area Available Land (Total land – unavailable land) = 71,211 17%

56 Ridges To Reefs Assessment For New Britain, PNG:Planning For Sustainable Development
Figure 18: Central Inland Pomio LLG - 2050 Zoning Plan

Ridges To Reefs Assessment For New Britain, PNG:Planning For Sustainable Development 57
Table 18: Central Inland Pomio LLG - Zone Area Summaries
Parameter Hectares (ha) % ofLLG Land
% ofLLG Available
Land
Sustainability Indicator and
Ranking
TERRESTRIAL
Zone 1: Physical Constraints (Table 17) 362,232 84%
Zone 2: Fresh Water Security 70,235 16% 3
Zone 5: Terrestrial Conservation 266,905 62% 4
Projected Food Security 2050 12,949 (441%) 18% 6a
Zone 3: Food Security 57,153 80% 6b
Zone 6: Forestry 41,156 58% 7
Zone 7: Commercial Agriculture 52,236 73% 8
Zone 9: Urban Development 3,449 5%
Zone 10: Multiple Use - 0%
Available Land (Table 17) 71,211 100%
Proposed Land Use by 2050(= Zone 3 + 6 + 7 + 9 + 10) 153,994 216% 1
Index of Sustainability (= available land - proposed land use) - 82,783 - 116% 2
% of LLG Marine
MARINE
Zone 4: Marine Conservation 972 2% 5
Zone 8: Sustainable Fisheries 40,422 90%
Total Marine Area per LLG (Table 17) 44,807

58 Ridges To Reefs Assessment For New Britain, PNG:Planning For Sustainable Development
Table 19: Central Inland Pomio LLG - Areas of Conflict
Table 20: Central Inland Pomio LLG - Areas of Mutual Benefit
Food Security overlaps with: Hectares (ha) % of Province Sustainability Indicator and Ranking
Commercial Agriculture 21,189 5% 9a
Terrestrial Conservation 32,864 8% 9b
Freshwater Security 607 0.1% 9cPhysical Constraints overlaps with:
Food Security 38,441 9% 9d
Forestry 30,967 7% 9e
Commercial Agriculture 20,941 5% 9f
Total 145,008 33% 9
Physical Constraints overlaps with: Hectares (ha) % of Province Sustainability Indicator and Ranking
Freshwater Security 53,229 12% 10a
Terrestrial Conservation 257,157 59% 10bFresh Water Security overlaps with:
Terrestrial Conservation 56,851 13% 10c
Total 367,238 85% 10
Key Issues and Opportunities: 1. Proposed land use exceeds available arable land by
82,783 ha driven in part by large scale commercial agriculture exceeding 216% of the LLG arable land. Some food security and commercial agriculture areas are inland on small plateaus. Current available data suggests that these areas are within the constraints zone (i.e. unsuitable for agriculture). Finer scale constraints data may be required to better inform decisions for small plateau areas within inland mountainous areas.
2. Mapped food security 57,152 ha greatly exceeds projected food security 12,949 ha. Reducing food security areas will significantly improve the sustainability of the plan.
3. Sustainability Indicator for Fresh Water Security Zone is under-represented in the current plan (16% of the LLG land area). However, the Terrestrial Conservation Zone is extensive (61%). There may be good opportunities to readily expand the freshwater security areas within the terrestrial conservation zone to ensure freshwater security for all communities.
4. There are conflicts between Food Security, Terrestrial Conservation and the Commercial Agriculture Zones (9b – Table 11) and conflicts between Physical Constraints and Food Security, Forestry and Commercial Agriculture (9d, 9e, 9f). These areas will require thoughtful planning to avoid and minimize impacts.
5. Central Inland Pomio LLG has both coastal communities and more remote inland communities. Both have more than sufficient areas for both cash crops and food security beyond 2050.
6. In a number of areas food security and small scale local cash crops are grown together, particularly for inland communities. Fine scale planning may be required to achieve a sustainable balance.
Key Recommendations:1. Under this draft plan, the proposed land use greatly
exceeds the available land by 82,783 ha. Options to minimize food security areas, but also constrain forestry and commercial agriculture areas will greatly improve the sustainability of the plan.
2. Resolve areas of conflict between food security, fresh water security and commercial agriculture (Avoid, Minimize).
3. Fresh water security areas will need to be expanded and areas of mutual benefit (terrestrial conservation, fresh water security, constraints) represent good candidates for protection and meet multiple goals for the LLG.
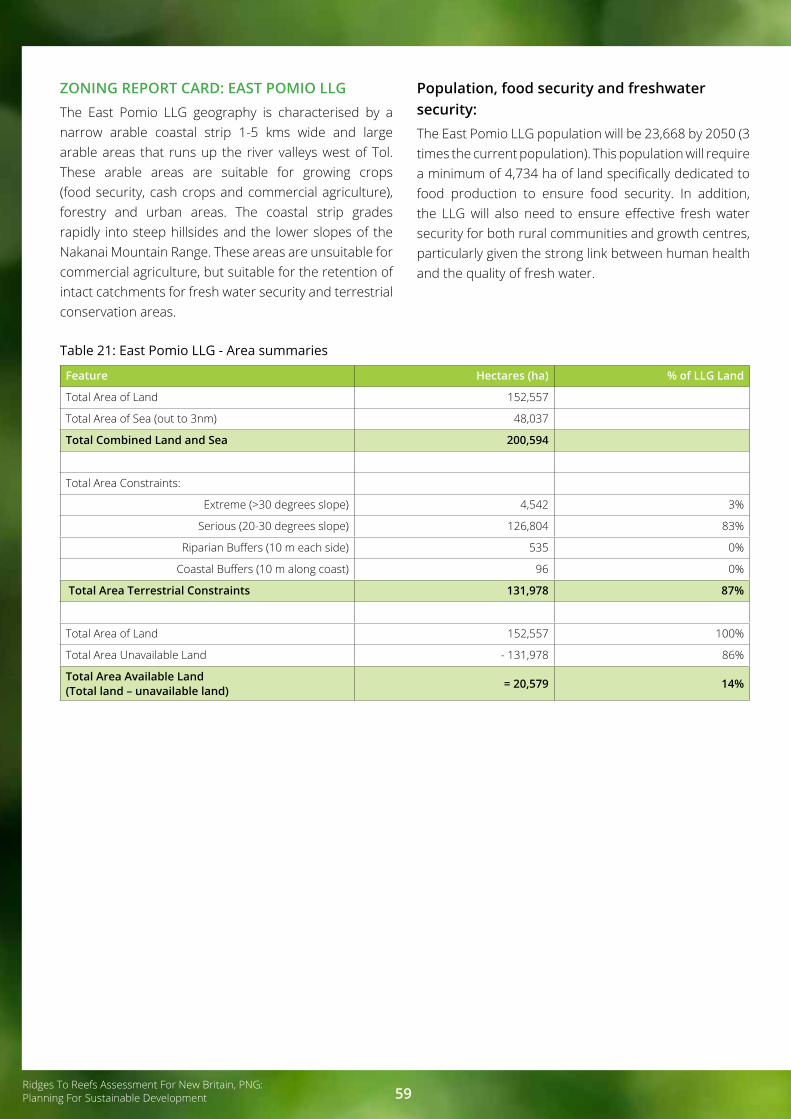
Ridges To Reefs Assessment For New Britain, PNG:Planning For Sustainable Development 59
ZONING REPORT CARD: EAST POMIO LLGThe East Pomio LLG geography is characterised by a narrow arable coastal strip 1-5 kms wide and large arable areas that runs up the river valleys west of Tol. These arable areas are suitable for growing crops (food security, cash crops and commercial agriculture), forestry and urban areas. The coastal strip grades rapidly into steep hillsides and the lower slopes of the Nakanai Mountain Range. These areas are unsuitable for commercial agriculture, but suitable for the retention of intact catchments for fresh water security and terrestrial conservation areas.
Population, food security and freshwater security:The East Pomio LLG population will be 23,668 by 2050 (3 times the current population). This population will require a minimum of 4,734 ha of land specifically dedicated to food production to ensure food security. In addition, the LLG will also need to ensure effective fresh water security for both rural communities and growth centres, particularly given the strong link between human health and the quality of fresh water.
Table 21: East Pomio LLG - Area summaries
Feature Hectares (ha) % of LLG Land
Total Area of Land 152,557
Total Area of Sea (out to 3nm) 48,037
Total Combined Land and Sea 200,594
Total Area Constraints:
Extreme (>30 degrees slope) 4,542 3%
Serious (20-30 degrees slope) 126,804 83%
Riparian Buffers (10 m each side) 535 0%
Coastal Buffers (10 m along coast) 96 0%
Total Area Terrestrial Constraints 131,978 87%
Total Area of Land 152,557 100%
Total Area Unavailable Land - 131,978 86%
Total Area Available Land (Total land – unavailable land) = 20,579 14%

60 Ridges To Reefs Assessment For New Britain, PNG:Planning For Sustainable Development
Figure 19: East Pomio LLG - 2050 Zoning Plan

Ridges To Reefs Assessment For New Britain, PNG:Planning For Sustainable Development 61
Table 22: East Pomio LLG - Zone Area Summaries
Parameter Hectares (ha) % ofLLG Land
% ofLLG Available
Land
Sustainability Indicator and
Ranking
TERRESTRIAL
Zone 1: Physical Constraints (Table 21) 131,978 87%
Zone 2: Fresh Water Security 0 1% 3
Zone 5: Terrestrial Conservation 16,308 11% 4
Projected Food Security 2050 4,734 (309%) 23% 6a
Zone 3: Food Security 14,659 71% 6b
Zone 6: Forestry 2,893 14% 7
Zone 7: Commercial Agriculture 24,438 119% 8
Zone 9: Urban Development 126 1%
Zone 10: Multiple Use - 0%
Available Land (Table 21) 20,579 100%
Proposed Land Use by 2050(= Zone 3 + 6 + 7 + 9 + 10) 42,116 205% 1
Index of Sustainability (= available land - proposed land use) - 21,537 - 105% 2
% of LLG Marine
MARINE
Zone 4: Marine Conservation 10,318 21% 5
Zone 8: Sustainable Fisheries 39,001 81%
Total Marine Area per LLG (Table 21) 48,037

62 Ridges To Reefs Assessment For New Britain, PNG:Planning For Sustainable Development
Table 23: East Pomio LLG - Areas of Conflict
Table 24: East Pomio LLG - Areas of Mutual Benefit
Food Security overlaps with: Hectares (ha) % of Province Sustainability Indicator and Ranking
Commercial Agriculture 312 0.2% 9a
Terrestrial Conservation 3,213 2% 9b
Freshwater Security 0 0% 9c
Physical Constraints overlaps with:
Food Security 5,374 4% 9d
Forestry 2,798 2% 9e
Commercial Agriculture 15,637 10% 9f
Total 27,333 18% 9
Physical Constraints overlaps with: Hectares (ha) % of Province Sustainability Indicator and Ranking
Freshwater Security 0 0% 10a
Terrestrial Conservation 9,658 6% 10b
Fresh Water Security overlaps with:
Terrestrial Conservation 0 0% 10c
Total 9,658 6% 10
Key Issues and Opportunities: 1. Significant areas of lowland forest and community
areas have been converted to oil palm west of Tol and further up the larger river valleys with some additional areas east of Tol. As this development continues, the LLG will need to recognize that the displaced rural communities from these valleys will need to build gardens and it is likely that these gardens will be upslope and into the constraints zone which will result in greater soil erosion. This is particularly true for Tol which is likely to be a growth centre where demands for food to feed the growing population will increase.
2. Under the present draft, food security around Tol (the growth centre) is not addressed. Options to address this issue might be to ensure food security areas around Tol or to ensure a permanent and effective road system between Tol and the food security areas to the south. The major issue with this second option is that roads and food supply can be cut with floods and bridge washout, greatly reducing the food security for the growth centre
3. Mapped food security is 3 times projected food security, which means there will be good options to feed the growing community
4. The current draft 2050 zoning plan is not sustainable (see Table 14). The proposed land use exceeds the available land by 21,537 ha (205%). This is primarily
driven by the demands for arable land by oil palm and food security by the local communities.
5. There are several areas of conflict between commercial agriculture and physical constraints (see Table 15 – 9f) which will need to be resolved to mitigate against soil erosion.
6. There are large opportunities for the development of areas of mutual benefit areas (freshwater security, terrestrial conservation and constraints 10a, 10b, 10c – see Table 16).
Key Recommendations:1. Seek to reduce the area of arable land exceeded
where possible and practical to ensure the LLG meets RSD requirements.
2. Expand area of food security and fresh water around growth centres.
3. Resolve areas of conflict between commercial agriculture and physical constraints (Avoid, Minimize)
4. Resolve areas of conflict between food security and sustainable agriculture (Avoid, Minimize)
5. Ensure careful consideration of proposed developments to ensure sufficient food security and fresh water security areas considered and secured.
6. Ensure best practise by oil palm companies from the outset of development (RSPO accreditation) to minimize both short term and potential long-term impacts by development.

Ridges To Reefs Assessment For New Britain, PNG:Planning For Sustainable Development 63
7. Minimize and reduce garden or commercial agriculture within the constraints zone (constraints and buffers).
8. Secure terrestrial conservation areas and freshwater security areas to maximize mutual benefits.
The view of Rabaul Bay, East New Britain, PNG © Alice Plate/ UNDP
9. Secure marine conservation areas, ideally downstream from terrestrial and freshwater security areas to ensure good water quality and fish recruitment and more sustainable nearshore fish production.

64 Ridges To Reefs Assessment For New Britain, PNG:Planning For Sustainable Development
ZONING REPORT CARD: SINIVIT LLGThe Sinivit LLG geography is characterised by a very narrow arable coastal strip 1-3 kms wide. There are also some isolated arable plateau areas inland. These arable areas are suitable for growing crops (food security, cash crops and commercial agriculture), forestry and urban areas. The coastal strip in Sinivit LLG is backed by rugged slopes and hillsides that grade into the Baining Mountains. These inland areas are mostly unsuitable for commercial agriculture, but suitable for the retention of intact catchments for fresh water security and terrestrial conservation areas. Nearshore waters have some reefs systems that drop into deep water beyond 3 nautical miles.
Population, food security and freshwater security:The projected population for Sinivit LLG by 2050 will be 60,461 (more than 3 times the current population). This will require a minimum area of 12,092 ha of land specifically dedicated to food production to ensure food security. The mapped area of food security in the current draft zoning plan is 17,781 ha (1.5 times) the minimum area required, which means that under this draft plan, Sinivit LLG will be in a good position to ensure food security by 2050. In addition, the rugged landscape lends itself well to establishing extensive areas of fresh water security. However, there are likely to be significant demands from neighbouring LLG’s for additional food security needs for peri-urban and urban LLG’s associated with Kokopo District.
Table 25: Sinivit LLG - Area Summaries
Feature Hectares (ha) % of LLG Land
Total Area of Land 244,679
Total Area of Sea (out to 3nm) 50,042
Total Combined Land and Sea 294,721
Total Area Constraints:
Extreme (>30 degrees slope) 10,912 4%
Serious (20-30 degrees slope) 169,977 69%
Riparian Buffers (10 m each side) 1,820 1%
Coastal Buffers (10 m along coast) 76 0%
Total Area Terrestrial Constraints 182,785 75%
Total Area of Land 244,679 100%
Total Area Unavailable Land - 182,785 75%
Total Area Available Land (Total land – unavailable land) = 61,895 25%

Ridges To Reefs Assessment For New Britain, PNG:Planning For Sustainable Development 65
Figure 20: Sinivit LLG - 2050 Zoning Plan

66 Ridges To Reefs Assessment For New Britain, PNG:Planning For Sustainable Development
Table 26: Sinivit LLG - Zone Area Summaries
Parameter Hectares (ha) % ofLLG Land
% ofLLG Available
Land
Sustainability Indicator and
Ranking
TERRESTRIAL
Zone 1: Physical Constraints (Table 25) 182,785 75%
Zone 2: Fresh Water Security 43,627 18% 3
Zone 5: Terrestrial Conservation 92,596 38% 4
Projected Food Security 2050 12,092 (147%) 19% 6a
Zone 3: Food Security 17,781 29% 6b
Zone 6: Forestry 2,492 4% 7
Zone 7: Commercial Agriculture 10,149 16% 8
Zone 9: Urban Development 851 1%
Zone 10: Multiple Use - 0%
Available Land (Table 25) 61,895 100%
Proposed Land Use by 2050(= Zone 3 + 6 + 7 + 9 + 10) 31,272 51% 1
Index of Sustainability (= available land - proposed land use) 30,623 49% 2
% of LLG Marine
MARINE
Zone 4: Marine Conservation - 0% 5
Zone 8: Sustainable Fisheries 817 2%
Total Marine Area per LLG (Table 25) 50,042

Ridges To Reefs Assessment For New Britain, PNG:Planning For Sustainable Development 67
Table 27: Sinivit LLG - Areas of Conflict
Table 28: Sinivit LLG - Areas of Mutual Benefit
Food Security overlaps with: Hectares (ha) % of Province Sustainability Indicator and Ranking
Commercial Agriculture 6,204 3% 9a
Terrestrial Conservation 3,109 1% 9b
Freshwater Security 2,939 1% 9c
Physical Constraints overlaps with:
Food Security 1,602 1% 9d
Forestry 824 0% 9e
Commercial Agriculture 856 0% 9f
Total 15,535 6% 9
Physical Constraints overlaps with: Hectares (ha) % of Province Sustainability Indicator and Ranking
Freshwater Security 38,865 16% 10a
Terrestrial Conservation 83,003 34% 10b
Fresh Water Security overlaps with:
Terrestrial Conservation 32,841 13% 10c
Total 154,709 63% 10
Key Issues and Opportunities: 1. Under the current plan, proposed land use is
31,272 ha, is 51% of the available arable land area (i.e. meets or exceeds RSD requirements). This provides opportunities for a wide range of RSD activities in the remaining 30,623 ha (49%) of arable land. Opportunities include: reduced impact and sustainable logging initiatives, diversified crop production and REDD+ initiatives. Importantly, because of the expected increased demands for food security from the urban and peri-urban LLG’s in Kokopo District, this may be a good opportunity to further accommodate the growing needs from these areas by providing a food bowl.
2. Mapped food security (17,781 ha) exceeds the projected food security 12,092 ha (1.5 times), providing good opportunities for Sinivit LLG to produce and export food surplus.
3. Fresh water security areas need to be expanded and reinforced by the establishment of mutually compatible terrestrial conservation areas.
4. There are significant opportunities to expand marine conservation areas to meet or exceed sustainability targets and ensure food security for marine resources.
Key Recommendations:1. Expand areas of food security in Sinivit LLG to
accommodate growing needs from neighbouring LLGs.
2. Expand areas of freshwater security in concert with terrestrial protected areas.
3. Expand marine conservation areas in nearshore waters.
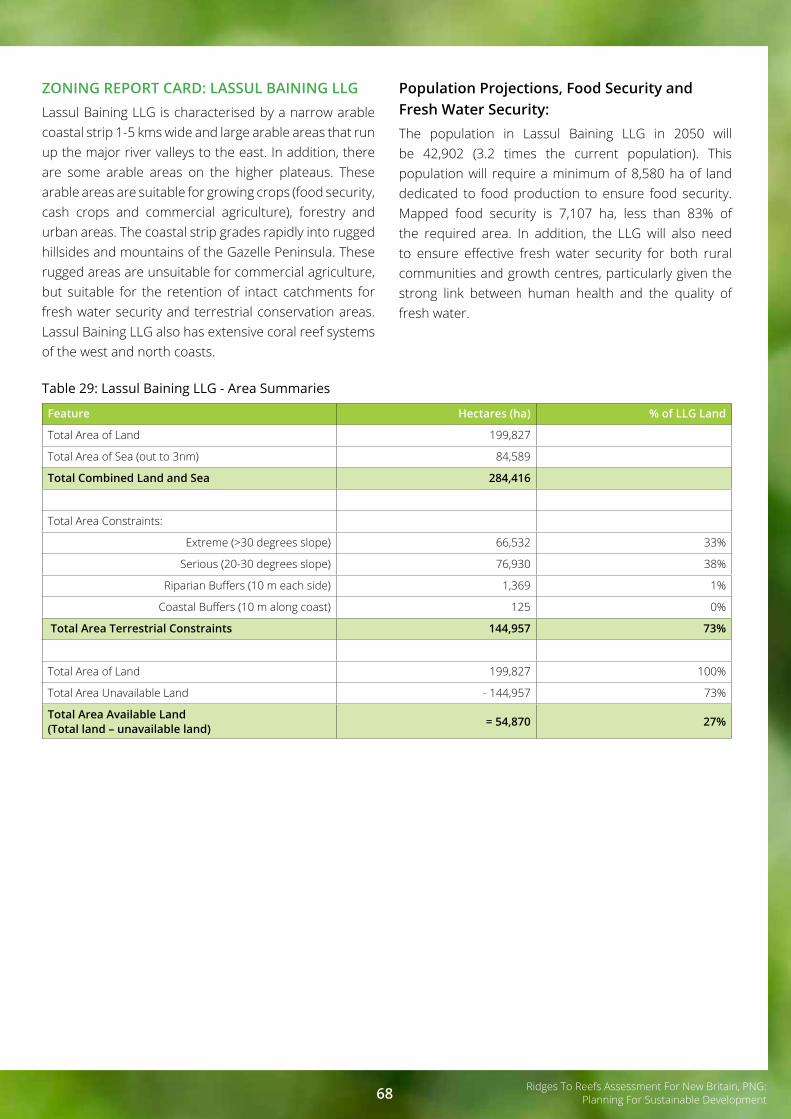
68 Ridges To Reefs Assessment For New Britain, PNG:Planning For Sustainable Development
ZONING REPORT CARD: LASSUL BAINING LLGLassul Baining LLG is characterised by a narrow arable coastal strip 1-5 kms wide and large arable areas that run up the major river valleys to the east. In addition, there are some arable areas on the higher plateaus. These arable areas are suitable for growing crops (food security, cash crops and commercial agriculture), forestry and urban areas. The coastal strip grades rapidly into rugged hillsides and mountains of the Gazelle Peninsula. These rugged areas are unsuitable for commercial agriculture, but suitable for the retention of intact catchments for fresh water security and terrestrial conservation areas. Lassul Baining LLG also has extensive coral reef systems of the west and north coasts.
Population Projections, Food Security and Fresh Water Security:The population in Lassul Baining LLG in 2050 will be 42,902 (3.2 times the current population). This population will require a minimum of 8,580 ha of land dedicated to food production to ensure food security. Mapped food security is 7,107 ha, less than 83% of the required area. In addition, the LLG will also need to ensure effective fresh water security for both rural communities and growth centres, particularly given the strong link between human health and the quality of fresh water.
Table 29: Lassul Baining LLG - Area Summaries
Feature Hectares (ha) % of LLG Land
Total Area of Land 199,827
Total Area of Sea (out to 3nm) 84,589
Total Combined Land and Sea 284,416
Total Area Constraints:
Extreme (>30 degrees slope) 66,532 33%
Serious (20-30 degrees slope) 76,930 38%
Riparian Buffers (10 m each side) 1,369 1%
Coastal Buffers (10 m along coast) 125 0%
Total Area Terrestrial Constraints 144,957 73%
Total Area of Land 199,827 100%
Total Area Unavailable Land - 144,957 73%
Total Area Available Land (Total land – unavailable land) = 54,870 27%

Ridges To Reefs Assessment For New Britain, PNG:Planning For Sustainable Development 69
Figure 21: Lassul Baining LLG - 2050 Zoning Plan

70 Ridges To Reefs Assessment For New Britain, PNG:Planning For Sustainable Development
Table 30: Lassul Baining LLG - Zone Area Summaries
Parameter Hectares (ha) % ofLLG Land
% ofLLG Available
Land
Sustainability Indicator and
Ranking
TERRESTRIAL
Zone 1: Physical Constraints (Table 29) 144,957 73%
Zone 2: Fresh Water Security 38,177 19% 3
Zone 5: Terrestrial Conservation 64,256 32% 4
Projected Food Security 2050 8,580 (82%)16% 6a
Zone 3: Food Security 7,107 13% 6b
Zone 6: Forestry 70,157 128% 7
Zone 7: Commercial Agriculture 26,229 48% 8
Zone 9: Urban Development 1,424 3%
Zone 10: Multiple Use - 0%
Available Land (Table 29) 54,870 100
Proposed Land Use by 2050(= Zone 3 + 6 + 7 + 9 + 10) 104,917 191% 1
Index of Sustainability (= available land - proposed land use)
- 50,047 - 91% 2
% of LLG Marine
MARINE
Zone 4: Marine Conservation 42,318 50% 5
Zone 8: Sustainable Fisheries 62,529 74%
Total Marine Area per LLG (Table 29) 84,589

Ridges To Reefs Assessment For New Britain, PNG:Planning For Sustainable Development 71
Table 31: Lassul Baining LLG - Areas of Conflict
Table 32: Lassul Baining LLG - Areas of Mutual Benefit
Food Security overlaps with: Hectares (ha) % of Province Sustainability Indicator and Ranking
Commercial Agriculture 0 0% 9a
Terrestrial Conservation 3,138 2% 9b
Freshwater Security 562 0.2% 9c
Physical Constraints overlaps with:
Food Security 4,257 2% 9d
Forestry 45,937 23% 9e
Commercial Agriculture 6,243 3% 9f
Total 60,137 30% 9
Physical Constraints overlaps with: Hectares (ha) % of Province Sustainability Indicator and Ranking
Freshwater Security 33,600 17% 10a
Terrestrial Conservation 56,589 28% 10b
Fresh Water Security overlaps with:
Terrestrial Conservation 19,096 10% 10c
Total 109,285 55% 10
Key Issues and Opportunities: 1. Under the current draft plan, proposed land use
104,917 ha, exceeds available arable land by 191%. Significant areas of arable land are allocated to both forestry and commercial agriculture. This means the extra 91% occurs in areas of physical constraints, which means increased erosion, increased sedimentation of nearshore water and decrease in food security.
2. Mapped food security (7,107 ha) is less than 83% of the minimum area required to ensure food security by 2050 (8,580 ha). In addition, with growing populations, there will be increasing demands for food from the island, urban and peri-urban LLG’s.
3. Fresh water security areas are extensive but will need to be expanded and could be readily reinforced with mutually compatible terrestrial conservation areas.
4. Commercial agriculture and forestry account for 128% of the arable land, which means there is little or no arable land available for food security, or where future food security areas occurs, it will be on steeper slopes.
5. There are significant conflicts between forestry and physical constraints (9e – Table 23).
6. The proposed marine conservation areas meet or exceed sustainability targets.
7. There are significant opportunities for mutual benefit areas (freshwater security, terrestrial conservation, physical constraints (10a, 10b, 10c).
Key Recommendations:1. Reduce the area of arable land exceeded in order
to meet RSD requirements (i.e. reduce forestry/commercial agriculture areas to accommodate food security areas on arable land).
2. Expand area of food security areas to meet and preferably exceed current minimum requirements, particularly given the expected growth of island, urban and peri-urban LLGs.
3. Resolve areas of conflict between forestry and physical constraints (Avoid, Minimize).

72 Ridges To Reefs Assessment For New Britain, PNG:Planning For Sustainable Development
ZONING REPORT CARD: INLAND BAINING LLG Inland Baining LLG is characterised by a broad arable area between the coast and foothills 5-10 kms wide and large arable areas that runs up the river valleys. In addition, there are some arable areas on the higher plateaus. These arable areas are suitable for growing crops (food security, cash crops and commercial agriculture), forestry and urban areas. The coastal strip grades rapidly into rugged hillsides and mountains of the Gazelle Peninsula. These rugged areas are unsuitable for commercial agriculture, but suitable for the retention of intact catchments for fresh water security and terrestrial conservation areas. Inland Baining LLG also has a range of coral reef systems in nearshore waters. Note that additional oil palm areas currently exist in the LLG but were not available to be included in the map below.
Population Projections, Food Security and Fresh Water Security:The population in Inland Baining LLG in 2050 will be 84,905 (3.2 times the current population). This population will require a minimum of 16,981 ha of land dedicated to food production to ensure food security. The current mapped food security is 28,611 ha or 1.7 times the minimum area required to feed to local population. In addition, the LLG will also need to ensure fresh water security for both rural communities and growth centres.
An important additional consideration is that Inland Baining LLG is adjacent to seven island, urban and peri-urban LLG’s. It is highly likely that these LLG’s will have insufficient land area to support their own food security by 2050. Consequently, these LLG’s are likely to draw heavily on Inland Baining LLG for food production and freshwater. Inland Baining LLG will need to be extremely mindful of these future demands when considering any development proposals that require large areas of arable land.
Table 33: Inland Baining LLG – Area Summaries
Feature Hectares (ha) % of LLG Land
Total Area of Land 94,280
Total Area of Sea (out to 3nm) 19,728
Total Combined Land and Sea 114,007
Total Area Constraints:
Extreme (>30 degrees slope) 9,060 10%
Serious (20-30 degrees slope) 37,094 39%
Riparian Buffers (10 m each side) 1,145 1%
Coastal Buffers (10 m along coast) 29 0%
Total Area Terrestrial Constraints 47,328 50%
Total Area of Land 94,280 100%
Total Area Unavailable Land 47,328 50%
Total Area Available Land (Total land – unavailable land) = 46,952 50%

Ridges To Reefs Assessment For New Britain, PNG:Planning For Sustainable Development 73
Figure 22: Inland Baining LLG - 2050 Zoning Plan

74 Ridges To Reefs Assessment For New Britain, PNG:Planning For Sustainable Development
Table 34: Inland Baining LLG - Zone Area Summaries
Parameter Hectares (ha) % ofLLG Land
% ofLLG Available
Land
Sustainability Indicator and
Ranking
TERRESTRIAL
Zone 1: Physical Constraints (Table 33) 47,328 50%
Zone 2: Fresh Water Security - 0% 3
Zone 5: Terrestrial Conservation 8,730 9% 4
Projected Food Security 2050 15,623 (183%) 33% 6a
Zone 3: Food Security 28,611 61% 6b
Zone 6: Forestry - 0% 7
Zone 7: Commercial Agriculture 3,0733 4% 8
Zone 9: Urban Development - 0%
Available Land (Table 33) 46,952 100%
Proposed Land Use by 2050(= Zone 3 + 6 + 7 + 9) 28,611 61% 1
Index of Sustainability (= available land - proposed land use) 18,340 39% 2
% of LLG Marine
MARINE
Zone 4: Marine Conservation - 0% 5
Zone 8: Sustainable Fisheries - 0%
Zone 10: Multiple Use (*marine area)
14,218 72%
Total Marine Area per LLG (Table 33) 19,728
3This figure represents oil palm areas that we could interpret from satellite imagery. Additional areas are known, but not mapped. Agricultural fields on the NARI campus are also not included in this figure.
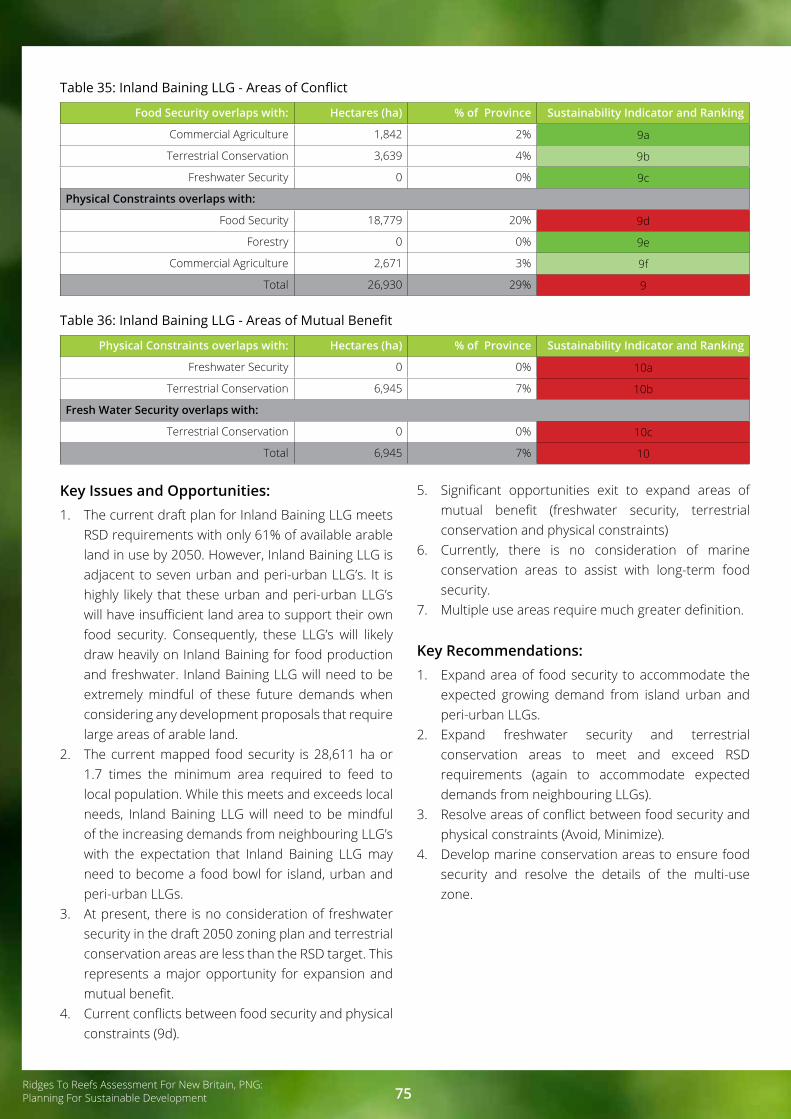
Ridges To Reefs Assessment For New Britain, PNG:Planning For Sustainable Development 75
Table 35: Inland Baining LLG - Areas of Conflict
Table 36: Inland Baining LLG - Areas of Mutual Benefit
Food Security overlaps with: Hectares (ha) % of Province Sustainability Indicator and Ranking
Commercial Agriculture 1,842 2% 9a
Terrestrial Conservation 3,639 4% 9b
Freshwater Security 0 0% 9c
Physical Constraints overlaps with:
Food Security 18,779 20% 9d
Forestry 0 0% 9e
Commercial Agriculture 2,671 3% 9f
Total 26,930 29% 9
Physical Constraints overlaps with: Hectares (ha) % of Province Sustainability Indicator and Ranking
Freshwater Security 0 0% 10a
Terrestrial Conservation 6,945 7% 10b
Fresh Water Security overlaps with:
Terrestrial Conservation 0 0% 10c
Total 6,945 7% 10
Key Issues and Opportunities: 1. The current draft plan for Inland Baining LLG meets
RSD requirements with only 61% of available arable land in use by 2050. However, Inland Baining LLG is adjacent to seven urban and peri-urban LLG’s. It is highly likely that these urban and peri-urban LLG’s will have insufficient land area to support their own food security. Consequently, these LLG’s will likely draw heavily on Inland Baining for food production and freshwater. Inland Baining LLG will need to be extremely mindful of these future demands when considering any development proposals that require large areas of arable land.
2. The current mapped food security is 28,611 ha or 1.7 times the minimum area required to feed to local population. While this meets and exceeds local needs, Inland Baining LLG will need to be mindful of the increasing demands from neighbouring LLG’s with the expectation that Inland Baining LLG may need to become a food bowl for island, urban and peri-urban LLGs.
3. At present, there is no consideration of freshwater security in the draft 2050 zoning plan and terrestrial conservation areas are less than the RSD target. This represents a major opportunity for expansion and mutual benefit.
4. Current conflicts between food security and physical constraints (9d).
5. Significant opportunities exit to expand areas of mutual benefit (freshwater security, terrestrial conservation and physical constraints)
6. Currently, there is no consideration of marine conservation areas to assist with long-term food security.
7. Multiple use areas require much greater definition.
Key Recommendations:1. Expand area of food security to accommodate the
expected growing demand from island urban and peri-urban LLGs.
2. Expand freshwater security and terrestrial conservation areas to meet and exceed RSD requirements (again to accommodate expected demands from neighbouring LLGs).
3. Resolve areas of conflict between food security and physical constraints (Avoid, Minimize).
4. Develop marine conservation areas to ensure food security and resolve the details of the multi-use zone.

76 Ridges To Reefs Assessment For New Britain, PNG:Planning For Sustainable Development
ZONING REPORT CARD: DUKE OF YORK LLG The Duke of York Islands is characterised by 13 islands with 7 major Islands. It lies in the straits of Saint Georges Channel between East New Britain and New Ireland. The largest Island (Duke of York) is mostly forested and low lying. The islands have extensive nearshore reefs systems and some areas of mangroves on the south-eastern side.
Population, food security and fresh water security projections:The projected population for Duke of York LLG by 2050 will be 44,339 (3 times the current population). This will require a minimum area of 8,868 ha of land specifically dedicated to food production to ensure food security. The mapped area of food security in the current draft zoning plan is 4,203 ha (47% of the area required to feed the 2050 population), which means is that there will be insufficient food to feed the population by 2050.
Fresh water security for Duke of York LLG is dependent on both wells and tank water (there is little or no free flowing water on the island). This means that ensuring both fresh water security and food security by 2050 will be a major challenge for the LLG. In addition, if there are climate change impacts such as major storm surge events, or drought, this will further exacerbate these issues.
Clearly, the area of land available for agriculture on the Duke of York Islands is limited. Current estimates indicate that with the present population growth, Duke of York LLG will likely exceed its carrying capacity (i.e. the ability to sustain itself) by 2040. It is expected that there will be increasing reliance on food from the mainland to supplement the growing population.
Table 37: Duke of York LLG - Area Summaries
Feature Hectares (ha) % of LLG Land
Total Area of Land 6,814
Total Area of Sea (out to 3nm) 43,647
Total Combined Land and Sea 50,461
Total Area Constraints:
Extreme (>30 degrees slope) 90 1%
Serious (20-30 degrees slope) - 0%
Riparian Buffers (10 m each side) - 0%
Coastal Buffers (10 m along coast) 90 1%
Total Area Terrestrial Constraints 180 3%
Total Area of Land 6,814 100%
Total Area Unavailable Land - 180 3%
Total Area Available Land (Total land – unavailable land) = 6,634 97%

Ridges To Reefs Assessment For New Britain, PNG:Planning For Sustainable Development 77
Figure 23: Duke of York LLG - Zoning Plan

78 Ridges To Reefs Assessment For New Britain, PNG:Planning For Sustainable Development
Table 38: Duke of York LLG - Zone Area Summaries
Parameter Hectares (ha) % ofLLG Land
% ofLLG Available
Land
Sustainability Indicator and
Ranking
TERRESTRIAL
Zone 1: Physical Constraints (Table 37) 180 3%
Zone 2: Fresh Water Security - 0% 3
Zone 5: Terrestrial Conservation 618 9% 4
Projected Food Security 2050 8,868 (47%) 134% 6a
Zone 3: Food Security 4,203 63% 6b
Zone 6: Forestry 123 2% 7
Zone 7: Commercial Agriculture 2,301 35% 8
Zone 9: Urban Development 193 3%
Zone 10: Multiple Use - 0%
Available Land (Table 37) 6,634 100%
Proposed Land Use by 2050(= Zone 3 + 6 + 7 + 9 + 10) 6,820 97% 1
Index of Sustainability (= available land - proposed land use) - 186 3% 2
% of LLG Marine
MARINE
Zone 4: Marine Conservation 11,784 27% 5
Zone 8: Sustainable Fisheries 52,027 119%
Total Marine Area per LLG (Table 37) 43,647

Ridges To Reefs Assessment For New Britain, PNG:Planning For Sustainable Development 79
Table 39: Duke of York LLG - Areas of Conflict
Table 40: Duke of York LLG - Areas of Mutual Benefit
Food Security overlaps with: Hectares (ha) % of Province Sustainability Indicator and Ranking
Commercial Agriculture 2,301 34% 9a
Terrestrial Conservation 206 3% 9b
Freshwater Security 0 0% 9c
Physical Constraints overlaps with:
Food Security 18 0% 9d
Forestry 0 0% 9e
Commercial Agriculture 0 0% 9f
Total 2,525 37% 9
Physical Constraints overlaps with: Hectares (ha) % of Province Sustainability Indicator and Ranking
Freshwater Security 0 0% 10a
Terrestrial Conservation 77 1% 10b
Fresh Water Security overlaps with:
Terrestrial Conservation 0 0% 10c
Total 77 1% 10
Key Issues and Opportunities: 1. Under the current draft plan, proposed land use
6,820 ha, exceeds available arable land by 3%. 2. Current estimates indicate that with the present
population growth, Duke of York LLG will likely exceed its carrying capacity (i.e. the ability to sustain itself) by 2040. It is expected that there will be an increasing reliance on food from the mainland to supplement the growing population and that fresh water security challenges will increase (i.e. food and water shortages).
3. The Food Security Zone in the current draft zoning plan is 4,203 ha (is 47% of what will be required for 2050 population), which means that under this plan there will be insufficient food to feed the population.
4. In the event of climate change impacts, by 2050 Duke of York LLG will lack the resources and resilience to manage effectively for these events. Climate change adaptation strategies particularly around food and fresh water security will be crucial considerations to minimize future impacts.
5. While Duke of York LLG appears to meet RSD requirements by using less arable land than the total available (Table 30), this is more a reflection of the limited area of productive agricultural land on the islands.
6. In addition, there will need to be careful consideration around family planning initiatives to
help the communities better manage the increasing limitations around food and fresh water security.
7. Conflicts currently exist between commercial agriculture and food security.
8. Unlike the mainland, Duke of York LLG is reliant on wells and rain water tanks for fresh water security. These resources need to be expanded and protected.
Key Recommendations:1. Introduce thoughtful and proactive family planning
initiatives to help alleviate future food and fresh water security issues.
2. Expand areas dedicated to food security to accommodate and feed the growing populations.
3. Negotiate arrangements with mainland LLG’s to ensure food security.
4. Introduce rainwater tanks to help communities better manage for periods of water shortage (i.e. drought).

80 Ridges To Reefs Assessment For New Britain, PNG:Planning For Sustainable Development
ZONING REPORT CARD: BALI WITU LLGBali Witu LLG is characterised by a small group of volcanic reef ringed islands off the northern coast of WNB. The islands are fertile and were once used for Copra production, but this has transitioned to Cocoa production.
Population, food security and freshwater security:The projected population for Bali Witu LLG by 2050 will be 68,336 (more than 3 times the current population). Currently the average population density already exceeds 100 people/km2 (Butler et al. 2013b), which is the threshold for PNG islands above which food security
rapidly declines (Butler et al. 2014). A population of 68,336 will require a minimum area of 13,667 ha of land specifically dedicated to food production to ensure food security. The mapped area of food security in the current draft zoning plan is 6,104 ha - less than half the minimum area required to feed the expected population by 2050. Given the current population growth, it is likely that Bali Witu will exceed its food security requirements by 2030 which will mean an increasing need to supplement local food production with food imported from the mainland. At the present time, fresh water is obtained from wells and water tanks. As the population continues to grow Bali Witu will become increasing vulnerable to periods of drought and associated water shortages.
Table 41: Bali Witu LLG - Area Summaries
Feature Hectares (ha) % of LLG Land
Total Area of Land 9,939
Total Area of Sea (out to 3nm) 89,757
Total Combined Land and Sea 99,696
Total Area Constraints:
Extreme (>30 degrees slope) 0 0
Serious (20-30 degrees slope) 3,265 33
Riparian Buffers (10 m each side) 95 1
Coastal Buffers (10 m along coast) 144 1
Total Area Terrestrial Constraints 3,503 35
Total Area of Land 9,939
Total Area Unavailable Land - 3,503 35
Total Area Available Land (Total land – unavailable land) = 6,436 65
APPENDIX 2: REPORT CARDS FOR WEST NEW BRITAIN
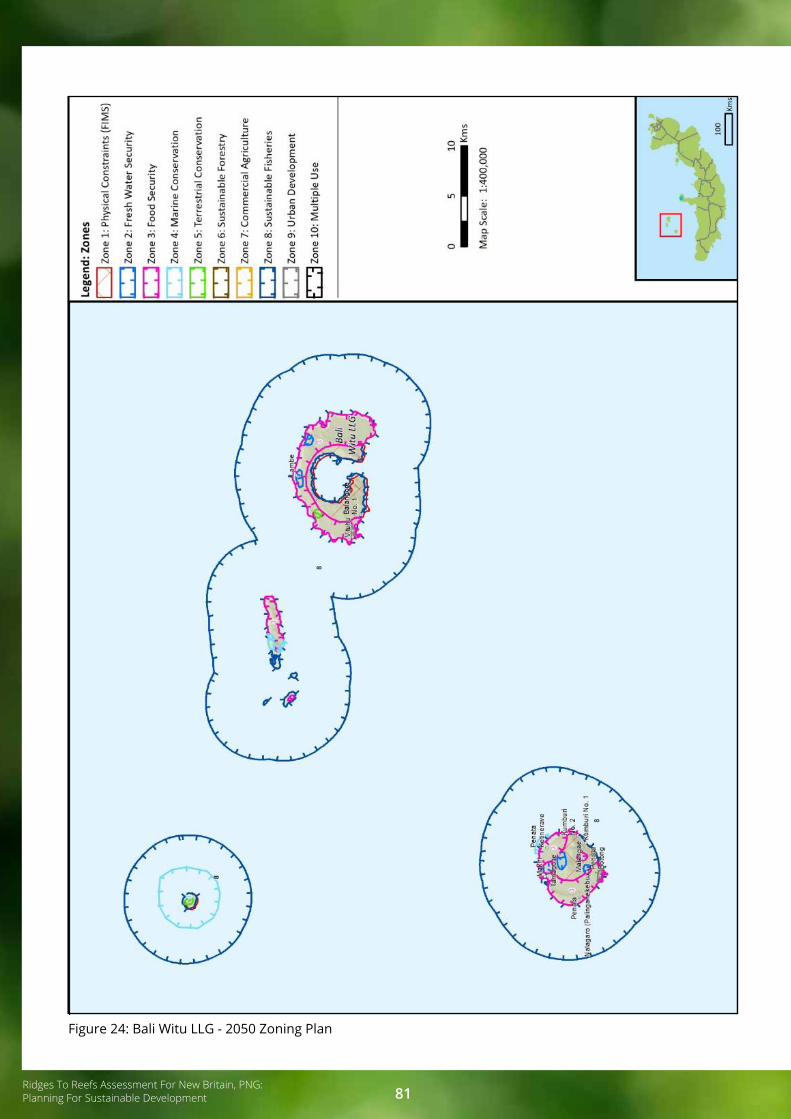
Ridges To Reefs Assessment For New Britain, PNG:Planning For Sustainable Development 81
Figure 24: Bali Witu LLG - 2050 Zoning Plan

82 Ridges To Reefs Assessment For New Britain, PNG:Planning For Sustainable Development
Table 42: Bali Witu LLG - Zone Area Summaries
Parameter Hectares (ha) % ofLLG Land
% ofLLG Available
Land
Sustainability Indicator and
Ranking
TERRESTRIAL
Zone 1: Physical Constraints (Table 41) 3,503 35%
Zone 2: Fresh Water Security 402 4% 6% 3
Zone 5: Terrestrial Conservation 96 1% 1% 4
Projected Food Security 2050 13,667 (48%) 212% 6a
Zone 3: Food Security 6,104 95% 6b
Zone 6: Forestry 0 0% 7
Zone 7: Commercial Agriculture 0 0% 8
Zone 9: Urban Development 76 1%
Zone 10: Multiple Use 0 0%
Available Land (Table 41) 6,436 100%
Proposed Land Use by 2050(= Zone 3 + 6 + 7 + 9 + 10) 6,180 96% 1
Index of Sustainability (= available land - proposed land use) 256 4% 2
% of LLG Marine
MARINE
Zone 4: Marine Conservation 3,182 3% 5
Zone 8: Sustainable Fisheries 89,487 100%
Total Marine Area per LLG (Table 41) 89,757
1Marine area within Tavalo WMA

Ridges To Reefs Assessment For New Britain, PNG:Planning For Sustainable Development 83
Table 43: Bali Witu LLG - Areas of Conflict
Table 44: Bali Witu LLG - Areas of Mutual Benefit
Food Security overlaps with: Hectares (ha) % of Province Sustainability Indicator and Ranking
Commercial Agriculture 0 0% 9a
Terrestrial Conservation 52 1% 9b
Freshwater Security 138 1% 9c
Physical Constraints overlaps with:
Food Security 60 1% 9d
Forestry 0 0% 9e
Commercial Agriculture 0 0% 9f
Total 251 3% 9
Physical Constraints overlaps with: Hectares (ha) % of Province Sustainability Indicator and Ranking
Freshwater Security 157 2% 10a
Terrestrial Conservation 42 0% 10b
Fresh Water Security overlaps with:
Terrestrial Conservation 0 0% 10c
Total 199 2% 10
Key Issues and Opportunities: 1. Lack of food security and freshwater security are
already major issues for Bali Witu LLG, particularly given the small available areas of arable land and the rapidly growing population. Current projections suggest that population will exceed carrying capacity by 2030, resulting in an increasing reliance on imported food and water from the mainland.
2. Mapped food security is only 48% of projected food security by 2050, which means that Bali Witu LLG will not be able to grow sufficient food to feed the population.
3. Marine conservation as currently mapped (3%) is likely to be insufficient to maintain local nearshore reef fish species, which will further reduce food security of marine resources.
4. Bali Witu LLG will be extremely vulnerable to the impact of major climate change events (e.g. drought or seawater incursion of freshwater supplies).
Key Recommendations:1. Food security and freshwater security initiatives
should be a major priority for Bali Witu LLG to ensure the health and wellbeing of the population by 2050.
2. Proactive family planning initiatives will help to alleviate or reduce potential impacts such as food and water shortages by 2050.
3. In 2013, priority climate adaptation strategy objectives were identified by the WNB Livelihood Futures project, which complement the above recommendations (Butler et al. 2012). They were ranked as follows:
• Objective 1: Population densities of no more than 320 people/km2 for Bali, 200 people/km2 for Ningau, and 100 people/km2 for Witu by 2050.
• Objective 2: Healthy land, trees, soils and vegetation for sustainable harvesting and conservation for all in the LLG.
• Objective 3: Diversify income sources to create reliable income for the whole LLG
• Objective 4: A strong, well-functioning, widespread barter system for all islands
• Objective 5: Healthy fish stocks and marine ecosystems for sustainable harvesting and biodiversity conservation for the whole LLG.

84 Ridges To Reefs Assessment For New Britain, PNG:Planning For Sustainable Development
ZONING REPORT CARD: GLOUCESTER LLGGloucester LLG sits at western end of the island of New Britain and is characterised by an extensive arable area with two large steep volcanic cones on the western end of the LLG grading through a broad valley to rugged steep terrain on the eastern side of the LLG. The arable areas are suitable for growing crops (food security, cash crops and commercial agriculture), forestry and urban areas. The volcanoes and steep areas are unsuitable for commercial agriculture and forestry, but suitable for the retention of intact catchments for fresh water security and terrestrial conservation areas. Coastal waters have some extensive reefs and nearshore reefs systems on the north coast, with very few reefs on the west coast and scattered reef systems on the south coast.
Population, food security and freshwater security:The projected population for Gloucester LLG by 2050 will be 46,120 (more than 3 times the current population) by 2050. This will require a minimum area of 9,224 ha of land specifically dedicated to food production to ensure food security by 2050. The mapped area of food security in the current draft zoning plan is 27,476 ha or around 3 times the minimum area required. Under this draft plan, Gloucester LLG would readily guarantee its food security by 2050. Similarly, extensive and well distributed areas have been identified and mapped for fresh water security providing significant long-term provisions to ensure the health and wellbeing of the community.
Table 45: Gloucester LLG - Area Summaries
Feature Hectares (ha) % of LLG Land
Total Area of Land 141,838Total Area of Sea (out to 3nm) 76,523Total Combined Land and Sea 218,361
Total Area Constraints:
Extreme (>30 degrees slope) 694 0%
Serious (20-30 degrees slope) 34,400 24%Riparian Buffers (10 m each side) 2,532 2%
Coastal Buffers (10 m along coast) 143 0% Total Area Terrestrial Constraints 37,770 27%
Total Area of Land 141,838 100%Total Area Unavailable Land - 37,770 27%Total Area Available Land (Total land – unavailable land) = 104,069 73%

Ridges To Reefs Assessment For New Britain, PNG:Planning For Sustainable Development 85
Coral life, Pacific Ocean, PNG © Valerijs Novickis/ Shutterstock

86 Ridges To Reefs Assessment For New Britain, PNG:Planning For Sustainable Development
Figure 25: Gloucester LLG – 2050 Zoning Plan

Ridges To Reefs Assessment For New Britain, PNG:Planning For Sustainable Development 87
Table 46: Gloucester LLG – Zone Area Summaries
Parameter Hectares (ha) % ofLLG Land
% ofLLG Available
Land
Sustainability Indicator and
Ranking
TERRESTRIAL
Zone 1: Physical Constraints (Table 45) 37,770 27%
Zone 2: Fresh Water Security 27,183 19% 3
Zone 5: Terrestrial Conservation 9,116 6% 4
Projected Food Security 2050 8,486 (324%) 9% 6a
Zone 3: Food Security 27,476 26% 6b
Zone 6: Forestry 5,149 5% 7
Zone 7: Commercial Agriculture 10,030 10% 8
Zone 9: Urban Development 247 0%
Zone 10: Multiple Use 0 0%
Available Land (Table 45) 104,069 100%
Proposed Land Use by 2050(= Zone 3 + 6 + 7 + 9 + 10) 42,902 41% 1
Index of Sustainability (= available land - proposed land use) 61,167 59% 2
MARINE
Zone 4: Marine Conservation 60,668 79% 5
Zone 8: Sustainable Fisheries 51,877 68%
Total Marine Area per LLG (Table 45) 76,253

88 Ridges To Reefs Assessment For New Britain, PNG:Planning For Sustainable Development
Table 47: Gloucester LLG - Areas of Conflict
Table 48: Gloucester LLG - Areas of Mutual Benefit
Food Security overlaps with: Hectares (ha) % of Province Sustainability Indicator and Ranking
Commercial Agriculture 2,215 2% 9a
Terrestrial Conservation 2,618 2% 9b
Freshwater Security 2,457 2% 9c
Physical Constraints overlaps with:
Food Security 224 0% 9d
Forestry 0 0% 9e
Commercial Agriculture 12 9% 9f
Total 7,526 5% 9
Physical Constraints overlaps with: Hectares (ha) % of Province Sustainability Indicator and Ranking
Freshwater Security 3,233 2% 10a
Terrestrial Conservation 993 1% 10b
Fresh Water Security overlaps with:
Terrestrial Conservation 0 0% 10c
Total 4,226 3% 10
Key Issues and Opportunities: 1. Under the current plan, proposed land use is 42,902
ha, less than 41% of the available land area. This provides unique opportunities for a wide range of RSD activities in the remaining 61,167 ha (59%) of arable land. Opportunities include: reduced impact and sustainable logging initiatives, diversified crop production and REDD+ initiatives.
2. Mapped food security 27,476 ha exceeds the projected food security (8,486 ha) by > 3 times providing good opportunities for Gloucester to produce and export food surplus.
3. Fresh water security areas are extensive and well distributed across the LLG.
4. Fresh water security areas could be reinforced by the establishment of mutually compatible terrestrial conservation areas.
5. Commercial agriculture occupies less than 10% of the arable land.
6. The proposed marine conservation areas meet or exceed sustainability targets.
Key Recommendations:1. The Gloucester draft plan, meets or exceeds most
sustainability targets.2. The Gloucester plan would benefit from expanding
the terrestrial conservation areas in concert with fresh water security areas.
3. Thoughtful planning in the remaining arable areas to maximize RSD outcomes would greatly benefit the local populations and economic returns for the LLG.
4. Under the previous WNB Livelihood Futures project (Butler et al. 2012), the following LLG-specific climate adaptation strategies were prioritised, which complement the above recommendations:
• Improve infrastructure (wharf, roads to villages, relocation of airstrip)
• Establish a cocoa and copra marketing agency• Provide effective support for LMMA Network

Ridges To Reefs Assessment For New Britain, PNG:Planning For Sustainable Development 89
ZONING REPORT CARD: KANDRIAN COASTAL LLGKandrian Coastal LLG is as the name suggests a largely coastal LLG with a narrow arable coastal strip 2-10 kilometres wide on the eastern end broadening to 40 kilometres wide in the west. It also has a number of arable areas that flank the river valleys. These arable areas are suitable for growing crops (food security, cash crops and commercial agriculture), forestry and urban areas. The coastal strip in Kandrian Coastal is backed by steep slopes and rugged hillsides that grade into the Whiteman Mountain Range. These rugged areas are mostly unsuitable for commercial agriculture, but suitable for the retention of intact catchments for fresh water security and terrestrial conservation areas. Nearshore waters have some reefs systems towards the west that drop into deep water beyond 3 nautical miles.
Population, food security and freshwater security:The projected population for Kandrian Coastal will be 62,674 (more than 3 times the current population) by 2050. This will require a minimum area of 12,535 ha of land specifically dedicated to food production for the local population to ensure food security. The mapped area of food security in the current draft zoning plan is 3 times (38,599 ha) the minimum area required for 2050, which means that under this draft plan, Kandrian Coastal will be in a good position to act as a food bowl for other LLG’s, but equally to guarantee its own food security beyond 2050. Current estimates indicate that with the present population growth, Kandrian Coastal will readily sustain itself and its growing population by 2050. However, any decisions around proposed commercial agriculture developments will need to ensure food security and freshwater security for this LLG.
Table 49: Kandrian Coastal LLG - Area Summaries
Feature Hectares (ha) % of LLG Land
Total Area of Land 224,263
Total Area of Sea (out to 3nm) 160,153
Total Combined Land and Sea 384,416
Total Area Constraints:
Extreme (>30 degrees slope) 4,416 2%
Serious (20-30 degrees slope) 97,600 44%
Riparian Buffers (10 m each side) 1,581 1%
Coastal Buffers (10 m along coast) 403 0.1%
Total Area Terrestrial Constraints 104,001 46%
Total Area of Land 224,263 100%
Total Area Unavailable Land - 104,001 46%
Total Area Available Land (Total land – unavailable land) = 120,262 54%

90 Ridges To Reefs Assessment For New Britain, PNG:Planning For Sustainable Development
Figure 26: Kandrian Coastal LLG – 2050 Zoning Plan (east)

Ridges To Reefs Assessment For New Britain, PNG:Planning For Sustainable Development 91
Figure 27: Kandrian Coastal LLG – 2050 Zoning Plan (west)

92 Ridges To Reefs Assessment For New Britain, PNG:Planning For Sustainable Development
Table 50: Kandrian Coastal LLG - Zone Area Summaries
Parameter Hectares (ha) % ofLLG Land
% ofLLG Available
Land
Sustainability Indicator and
Ranking
TERRESTRIAL
Zone 1: Physical Constraints (Table 49) 104,000 46%
Zone 2: Fresh Water Security 1,708 1% 3
Zone 5: Terrestrial Conservation 0 0% 4
Projected Food Security 2050 12,535 (335%) 10% 6a
Zone 3: Food Security 38,599 32% 6b
Zone 6: Forestry 63,746 53% 7
Zone 7: Commercial Agriculture 0 0% 8
Zone 9: Urban Development 1,317 1%
Zone 10: Multiple Use 0 0%
Available Land (Table 49) 120,263 100%
Proposed Land Use by 2050(= Zone 3 + 6 + 7 + 9 + 10) 103,662 86% 1
Index of Sustainability (= available land - proposed land use) 16,600 14% 2
% of LLG Marine
MARINE
Zone 4: Marine Conservation 77,145 48% 5
Zone 8: Sustainable Fisheries 131,090 82%
Total Marine Area per LLG (Table 49) 160,153

Ridges To Reefs Assessment For New Britain, PNG:Planning For Sustainable Development 93
Table 51: Kandrian Coastal LLG - Areas of Conflict
Table 52: Central Inland Pomio LLG - Areas of Mutual Benefit
Food Security overlaps with: Hectares (ha) % of Province Sustainability Indicator and Ranking
Commercial Agriculture 0 0% 9a
Terrestrial Conservation 0 0% 9b
Freshwater Security 29 0.1% 9c
Physical Constraints overlaps with:
Food Security 12,866 6% 9d
Forestry 42,367 19% 9e
Commercial Agriculture 0 0% 9f
Total 55,261 25% 9
Physical Constraints overlaps with: Hectares (ha) % of Province Sustainability Indicator and Ranking
Freshwater Security 0 0% 10a
Terrestrial Conservation 0 0% 10b
Fresh Water Security overlaps with:
Terrestrial Conservation 0 0% 10c
Total 0 0% 10
Key Issues and Opportunities: 1. Under the current draft 2050 plan, the proposed
land use is almost equal to the available arable land, which means it meets good RSD requirements (i.e. it doesn’t exceed the available arable land).
2. In addition, the mapped food security exceeds the projected food security requirements food by 3 times, which means that food security also exceeds RSD requirements.
3. However, fresh water security is greatly under-represented in the current plan accounting for less than 1% of the LLG. Similarly, the terrestrial conservation zone is also non-existent in the current draft plan. There are some good opportunities to expand the freshwater security areas with terrestrial conservation areas to ensure freshwater security for at the western end of the LLG. However, most inland areas and small coastal catchments on the eastern end of the LLG will require discussions with Kandiran Inland LLG to ensure fresh water security.
4. Kandrian Coastal LLG has extensive Commercial Forestry Zone which accounts for 53% of the arable land base. This component also represents an opportunity to transition to RSD options such as Sustainable Logging practices, Reduced Impact Logging and REDD+ areas as a means to retain and value add to the lowland forest resources.
5. There are some areas of conflict between physical
constraints and forestry (i.e. logging practices on steeper slopes). This is un-sustainable and not best practise under RSD considerations and results in increased erosion and sedimentation of nearshore waters, which also impacts the condition of marine resources (i.e. impacts food security).
6. There are some significant opportunities for the thoughtful development of fresh water security areas in concert with terrestrial conservation areas to meet multiple goals.
7. Marine conservation areas are well considered in the plan.
Key Recommendations:Under this draft plan, the key considerations are all the areas flagged as red in the sustainability indicators. These include: 8. A requirement to expand freshwater security areas
and terrestrial conservation areas to meet RSD requirements
9. To transition forestry operations to more sustainable practices including: removal of operations from areas of physical constraints and the development of other options including: Sustainable Logging practices, Reduced Impact Logging and REDD+ areas as a means to retain and value add to the lowland forest resources and better support local communities.

94 Ridges To Reefs Assessment For New Britain, PNG:Planning For Sustainable Development
1. Some areas on the eastern half of Kandrian Coastal LLG will require cross border discussions with Kandrian Inland LLG to develop mutually beneficial freshwater and terrestrial conservation options.
2. Under the previous WNB Livelihood Futures project (Butler et al. 2012), the following LLG-specific climate adaptation strategies were prioritised, which complement the above recommendations:
• Establish Marine Protected Areas• Introduce regulation of coastal fisheries• Encourage reforestation
A fuel outlet in PNG’s East New Britain Province highlights the challenges with limited services © Alice Plate/ UNDP

Ridges To Reefs Assessment For New Britain, PNG:Planning For Sustainable Development 95
ZONING REPORT CARD: KANDRIAN INLAND LLGKandrian Inland LLG is an inland LLG with no coastal areas. It is characterised by extensive forests interspersed with plateaus’ of arable land. The arable areas are suitable for growing crops (food security, cash crops and commercial agriculture), forestry and urban areas. These steeper and flood areas (physical constraints) are largely unsuitable for commercial agriculture or forestry but suitable for the retention of intact catchments for fresh water security and terrestrial conservation areas.
Population, food security and freshwater security:The projected population for Kandrian Inland LLG will be 49,827 (more than 3 times the current population). This will require a minimum area of 9,965 ha of land specifically dedicated to food production to ensure food security. The mapped area of food security in the current draft zoning plan (11,635 ha) exceeds the minimum area required for food security, which means that under this draft plan, Kandrian Inland LLG will be in a good position to feed its population (ensure food security) as well as potentially act as a food bowl for other LLG’s. Current estimates indicate that with the present population growth, Kandrian Inland LLG will readily sustain itself and its growing population by 2050. However, any decisions around proposed commercial agriculture or forestry developments will need to ensure food security and fresh water security as a matter of priority.
Table 53: Kandrian Inland LLG - Area Summaries
Feature Hectares (ha) % of LLG Land
Total Area of Land 252,344
Total Area of Sea (out to 3nm) 0
Total Combined Land and Sea 252,344
Total Area Constraints:
Extreme (>30 degrees slope) 131,179 52
Serious (20-30 degrees slope) 18,677 7
Riparian Buffers (10 m each side) 1,270 1
Coastal Buffers (10 m along coast) 0 0
Total Area Terrestrial Constraints 151,126 60
Total Area of Land 252,344 100
Total Area Unavailable Land - 151,126 60
Total Area Available Land (Total land – unavailable land) = 101,218 40

96 Ridges To Reefs Assessment For New Britain, PNG:Planning For Sustainable Development
Figure 28: Kandrian Inland LLG – 2050 Zoning Plan

Ridges To Reefs Assessment For New Britain, PNG:Planning For Sustainable Development 97
Table 54: Kandrian Inland LLG - Zone Area Summaries
Parameter Hectares (ha) % ofLLG Land
% ofLLG Available
Land
Sustainability Indicator and
Ranking
TERRESTRIAL
Zone 1: Physical Constraints (Table 53) 151,126 60%
Zone 2: Fresh Water Security 39,886 16% 3
Zone 5: Terrestrial Conservation 69,121 27% 4
Projected Food Security 2050 9,965 (127%) 10% 6a
Zone 3: Food Security 11,635 11% 6b
Zone 6: Forestry 80,516 80% 7
Zone 7: Commercial Agriculture 74,586 74% 8
Zone 9: Urban Development 160 0%
Zone 10: Multiple Use 0 0%
Available Land (Table 53) 101,218 100%
Proposed Land Use by 2050(= Zone 3 + 6 + 7 + 9 + 10) 166,898 165% 1
Index of Sustainability (= available land - proposed land use) - 65,680 - 65% 2
% of LLG Marine
MARINE
Zone 4: Marine Conservation
Zone 8: Sustainable Fisheries
Total Marine Area per LLG (Table 53)

98 Ridges To Reefs Assessment For New Britain, PNG:Planning For Sustainable Development
Table 55: Kandrian Inland LLG - Areas of Conflict
Table 56: Kandrian Inland LLG- Areas of Mutual Benefit
Food Security overlaps with: Hectares (ha) % of Province Sustainability Indicator and Ranking
Commercial Agriculture 0 0% 9a
Terrestrial Conservation 0 0% 9b
Freshwater Security 2,970 1% 9c
Physical Constraints overlaps with:
Food Security 3,417 1% 9d
Forestry 51,638 20% 9e
Commercial Agriculture 36,859 15% 9f
Total 94,884 38% 9
Physical Constraints overlaps with: Hectares (ha) % of Province Sustainability Indicator and Ranking
Freshwater Security 0 0% 10a
Terrestrial Conservation 57,103 23% 10b
Fresh Water Security overlaps with:
Terrestrial Conservation 7,076 3% 10c
Total 64,179 25% 10
Key Issues and Opportunities: 1. Under the current draft plan, proposed land use
exceeds available arable land by 65,680 ha. This does not meet RSD requirements and operations of the key arable zones will need refinement of boundaries and improved practices to transition the draft plan to a more RSD position.
2. Mapped food security exceeds 2050 projected food security which means Kandrian Inland will be in a good position to ensure food security.
3. Under the current draft plan there is significant equity between commercial agriculture and forestry operations (each around 75-80,000 ha). However, all these areas are too large and extend into areas of physical constraints which will result in significant erosion and impact to the nearshore water of Kandrian Coastal, which will impact their marine resources food security.
4. These conflicts are clearly evident in the conflicts section, where forestry and commercial agriculture conflict significantly with physical constraints.
5. In addition, fresh water security will require significant thought to identify and allocate the appropriate catchments to support the widespread local communities. This could be reinforced by developing freshwater security areas in concert with terrestrial conservation areas to meet multiple RSD goals.
Key Recommendations:1. Under this draft plan, the proposed land use greatly
exceeds the available land by 65,680 ha. This will require careful refinement to reduce the food security, forestry and commercial agriculture areas to meet RSD requirements where proposed land use = available arable land.
2. In addition, each of the major arable land use components will also need to carefully consider the physical constraints to and refine boundaries of operations to minimize erosion (see conflicts table above).
3. Fresh water security areas will need to be expanded and distributed across the LLG to meet community needs. These catchments can also be strengthened with the establishment of terrestrial conservation areas to assist in meeting mutual benefit goals and RSD outcomes.

Ridges To Reefs Assessment For New Britain, PNG:Planning For Sustainable Development 99
ZONING REPORT CARD: KALIAI - KOVE LLGKaliai - Kove LLG is characterised by a narrow coastal strip and patches of arable land throughout the hinterland. These arable areas are suitable for growing crops (food security, cash crops and commercial agriculture), forestry and urban areas. The arable areas are interspersed by rugged, steep and swampy areas which are mostly unsuitable for commercial agriculture, but suitable for the retention of intact catchments for fresh water security and terrestrial conservation areas. Nearshore waters have extensive scattered reefs systems with deep water beyond 3 nautical miles.
Population, food security and freshwater security:The projected population for Kaliai - Kove LLG will be 73,595 (more than 3 times the current population) by 2050. This population will require a minimum of 14,719 ha of land specifically dedicated to food production to ensure food security. The mapped area of food security in the current draft zoning plan is 3,812 ha, less than 26% of the minimum area that will be required to feed the population by 2050. However, given the large area of arable land and limited current commercial developments in Kaliai Kove LLG at the present time, thoughtful planning could readily expand food security areas to reasonably meet the 14,719 ha food security target by 2050. The current draft plan includes extensive freshwater security areas, which should readily support the growing population.
Table 57: Kaliai - Kove LLG – Area Summaries
Feature Hectares (ha) % of LLG Land
Total Area of Land 360,361
Total Area of Sea (out to 3nm) 106,864
Total Combined Land and Sea 467,225
Total Area Constraints:
Extreme (>30 degrees slope) 39,128 11%
Serious (20-30 degrees slope) 110,012 31%
Riparian Buffers (10 m each side) 3,194 1%
Coastal Buffers (10 m along coast) 210 0.1%
Total Area Terrestrial Constraints 152,544 42%
Total Area of Land 360,361 100%
Total Area Unavailable Land - 152,544 42%
Total Area Available Land (Total land – unavailable land) = 207,816 58%

100 Ridges To Reefs Assessment For New Britain, PNG:Planning For Sustainable Development
Figure 29: Kaliai - Kove LLG – 2050 Zoning Plan (east)

Ridges To Reefs Assessment For New Britain, PNG:Planning For Sustainable Development 101
Figure 30: Kaliai - Kove LLG – 2050 Zoning Plan (west)

102 Ridges To Reefs Assessment For New Britain, PNG:Planning For Sustainable Development
Table 58: Kaliai - Kove LLG - Zone Area Summaries
Parameter Hectares (ha) % ofLLG Land
% ofLLG Available
Land
Sustainability Indicator and
Ranking
TERRESTRIAL
Zone 1: Physical Constraints (Table 57) 152,544 42%
Zone 2: Fresh Water Security 160,384 45% 3
Zone 5: Terrestrial Conservation 0 0% 4
Projected Food Security 205014,719
(26%) 7%6a
Zone 3: Food Security 3,812 2% 6b
Zone 6: Forestry 7,399 4% 7
Zone 7: Commercial Agriculture 1,517 1% 8
Zone 9: Urban Development 0 0%
Zone 10: Multiple Use 0 0%
Available Land (Table 57) 207,816 100%
Proposed Land Use by 2050(= Zone 3 + 6 + 7 + 9 + 10) 12,729 10% 1
Index of Sustainability (= available land - proposed land use) 195,088 94% 2
% of LLG Marine
MARINE
Zone 4: Marine Conservation 8,930 8% 5
Zone 8: Sustainable Fisheries 96,076 90%
Total Marine Area per LLG (Table 57) 106,864

Ridges To Reefs Assessment For New Britain, PNG:Planning For Sustainable Development 103
Table 59: Kaliai - Kove LLG – Areas of Conflict
Table 60: Kaliai - Kove LLG - Areas of Mutual Benefit
Food Security overlaps with: Hectares (ha) % of Province Sustainability Indicator and Ranking
Commercial Agriculture 0 0% 9a
Terrestrial Conservation 0 0% 9b
Freshwater Security 469 0.1% 9c
Physical Constraints overlaps with:
Food Security 55 0% 9d
Forestry 2,877 1% 9e
Commercial Agriculture 3,548 1% 9f
Total 6,950 2% 9
Physical Constraints overlaps with: Hectares (ha) % of Province Sustainability Indicator and Ranking
Freshwater Security 88,631 25% 10a
Terrestrial Conservation 0 0% 10b
Fresh Water Security overlaps with:
Terrestrial Conservation 0 0% 10c
Total 88,631 25% 10
Key Issues and Opportunities: 1. Under the current draft plan, proposed land use
12,729 ha is a small fraction (6%) of the available arable land (207,816 ha) in Kaliai - Kove LLG. This provides unique opportunities for a wide range of RSD activities across the remaining 207,816 ha (94%) of arable land. Opportunities might include: reduced impact and sustainable logging initiatives, diversified crop production, food security support for Talasea, Mosa and Kimbe Urban LLGs and REDD+ initiatives.
2. Extensive freshwater security areas have been mapped across the entire constraints areas (160,384 ha).
3. At the present time, mapped food security (3,812 ha) is less than the minimum area required (14,719 ha) to ensure food security by 2050.
4. 4. Commercial agriculture occupies a small fraction (1%) of the available arable area in Kaliai Kove LLG.
5. The fresh water security areas would be strengthened with the establishment of terrestrial conservation areas. The combined effect would be mutual beneficial.
Key Recommendations:1. Thoughtful forward planning will be essential
to maximize the RSD opportunities across the remaining 207,816 ha of available arable area: A broad range of opportunities should be considered to ensure the best long-term outcomes for the communities and also to minimize impacts.
2. The food security areas will need to be expanded to meet or exceed the projected minimum area of 14,719 ha.
3. Areas of mutual benefit should be expanded (terrestrial conservation, fresh water security, constraints). These represent good candidates for protection and meeting multiple goals for the LLG.
4. Terrestrial conservation areas could be readily expanded to achieve the 17% terrestrial conservation target.
5. The marine conservation areas could also be expanded to meet the 10% target.

104 Ridges To Reefs Assessment For New Britain, PNG:Planning For Sustainable Development
ZONING REPORT CARD: GASMATA LLGGasmata LLG lies on the southern coast of New Britain and is characterised by a narrow arable coastal strip 2-5 kms wide on the eastern side of the LLG, expanding to broad river valleys up to 20 kilometres wide cross the western third of the LLG. The arable areas are suitable for growing crops (food security, cash crops and commercial agriculture), as well as forestry and urban areas. The coastal strip in Gasmata LLG is backed by rugged slopes and hillsides that grade into the Whiteman Mountain Range. These areas are mostly unsuitable for commercial agriculture, but suitable for the retention of intact catchments for fresh water security and terrestrial conservation areas. Nearshore waters have some reefs systems that drop rapidly into deep water.
Population Projections, Food Security and Fresh Water Security:The projected population for Gasmata LLG will be 44,891 by 2050 (more than 3 times the current population). This will require a minimum area of 8,978 ha of land specifically dedicated to food production to ensure food security. The mapped area of food security in the current draft zoning plan is 9,286 ha, exceeding the minimum area required, which means that under this draft plan, Gasmata LLG will be in a good position to feed the local population by 2050. However, any large scale commercial agriculture proposals will need to factor the community food security into their estimates for Gasmata LLG.
Table 61: Gasmata LLG – Area Summaries
Feature Hectares (ha) % of LLG Land
Total Area of Land 340,483
Total Area of Sea (out to 3nm) 89,140
Total Combined Land and Sea 429,623
Total Area Constraints:
Extreme (>30 degrees slope) 48,231 14%
Serious (20-30 degrees slope) 196,035 58%
Riparian Buffers (10 m each side) 2,010 1%
Coastal Buffers (10 m along coast) 284 0.1%
Total Area Terrestrial Constraints 246,561 72%
Total Area of Land 340,483 100%
Total Area Unavailable Land - 246,561 72%
Total Area Available Land (Total land – unavailable land) = 93,923 28%
Workshop, PNG © Nate Peterson/ The Nature Conservancy

Ridges To Reefs Assessment For New Britain, PNG:Planning For Sustainable Development 105
A rare orchid, PNG © Pavaphon Supananatananont/ Shutterstock

106 Ridges To Reefs Assessment For New Britain, PNG:Planning For Sustainable Development
Figure 31: Gasmata LLG - 2050 Zoning Plan (east)

Ridges To Reefs Assessment For New Britain, PNG:Planning For Sustainable Development 107
Figure 32: Gasmata LLG – 2050 Zoning Plan (west)

108 Ridges To Reefs Assessment For New Britain, PNG:Planning For Sustainable Development
Table 62: Gasmata LLG – Zone Area Summaries
Parameter Hectares (ha) % ofLLG Land
% ofLLG Available
Land
Sustainability Indicator and
Ranking
TERRESTRIAL
Zone 1: Physical Constraints (Table 61) 246,561 72%
Zone 2: Fresh Water Security 119,065 35% 3
Zone 5: Terrestrial Conservation 187,026 55% 4
Projected Food Security 2050 8,978 (112%) 10% 6a
Zone 3: Food Security 9,286 10% 6b
Zone 6: Forestry 12,664 13% 7
Zone 7: Commercial Agriculture 572 1% 8
Zone 9: Urban Development 112 0%
Zone 10: Multiple Use - 0%
Available Land (Table 61) 93,923 100%
Proposed Land Use by 2050(= Zone 3 + 6 + 7 + 9 + 10) 22,634 24% 1
Index of Sustainability (= available land - proposed land use) 71,289 76% 2
% of LLG Marine
MARINE
Zone 4: Marine Conservation 1,248 1% 5
Zone 8: Sustainable Fisheries 87,743 98%
Total Marine Area per LLG (Table 61) 89,140
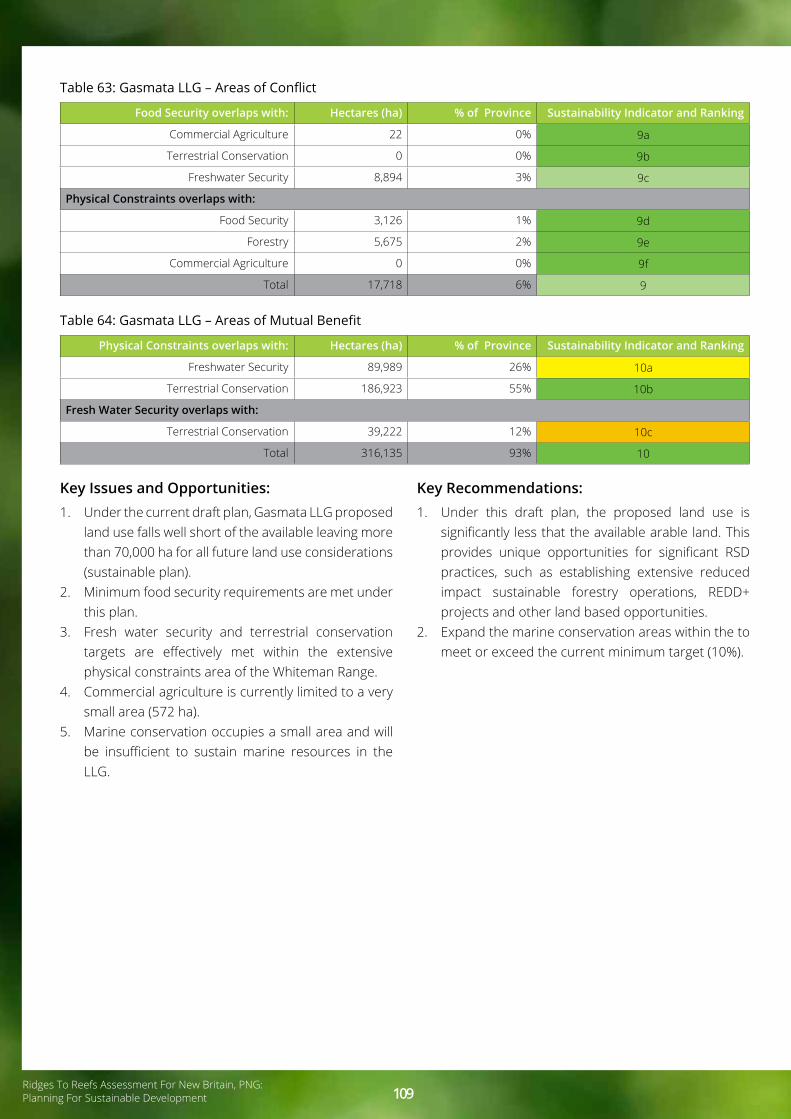
Ridges To Reefs Assessment For New Britain, PNG:Planning For Sustainable Development 109
Table 63: Gasmata LLG – Areas of Conflict
Table 64: Gasmata LLG – Areas of Mutual Benefit
Food Security overlaps with: Hectares (ha) % of Province Sustainability Indicator and Ranking
Commercial Agriculture 22 0% 9a
Terrestrial Conservation 0 0% 9b
Freshwater Security 8,894 3% 9c
Physical Constraints overlaps with:
Food Security 3,126 1% 9d
Forestry 5,675 2% 9e
Commercial Agriculture 0 0% 9f
Total 17,718 6% 9
Physical Constraints overlaps with: Hectares (ha) % of Province Sustainability Indicator and Ranking
Freshwater Security 89,989 26% 10a
Terrestrial Conservation 186,923 55% 10b
Fresh Water Security overlaps with:
Terrestrial Conservation 39,222 12% 10c
Total 316,135 93% 10
Key Issues and Opportunities: 1. Under the current draft plan, Gasmata LLG proposed
land use falls well short of the available leaving more than 70,000 ha for all future land use considerations (sustainable plan).
2. Minimum food security requirements are met under this plan.
3. Fresh water security and terrestrial conservation targets are effectively met within the extensive physical constraints area of the Whiteman Range.
4. Commercial agriculture is currently limited to a very small area (572 ha).
5. Marine conservation occupies a small area and will be insufficient to sustain marine resources in the LLG.
Key Recommendations:1. Under this draft plan, the proposed land use is
significantly less that the available arable land. This provides unique opportunities for significant RSD practices, such as establishing extensive reduced impact sustainable forestry operations, REDD+ projects and other land based opportunities.
2. Expand the marine conservation areas within the to meet or exceed the current minimum target (10%).

110 Ridges To Reefs Assessment For New Britain, PNG:Planning For Sustainable Development
ZONING REPORT CARD: TALASEA LLG Talasea LLG is characterised by a narrow arable coastal peninsula variously interspersed by volcanic cones strip 5-10 kilometres wide and a section running south that rapidly grades into steeper slopes and mountain ranges. The arable areas are suitable for growing crops (food security, cash crops and commercial agriculture), forestry and urban areas. The steeper slopes are largely unsuitable for commercial agriculture, but suitable for the retention of intact catchments for fresh water security and terrestrial conservation areas. Nearshore waters around Talasea LLG have well developed and extensive nearshore and offshore reefs systems.
Population Projections, Food Security and Fresh Water Security:The projected population for Talasea LLG will be 102,111 (more than 3 times the current population) by 2050. This will require a minimum area of 20,422 ha of land specifically dedicated to food production to ensure food security. The mapped area of food security in the current draft zoning plan is 30,225 ha or around 1.6 times the projected Food Security. Under this draft plan, Talasea will be in a good position to act as a food bowl for other LLG’s, but equally to guarantee its food security beyond 2050. It is highly likely that both Mosa and Talasea LLGs already significantly support the food needs of Kimbe Urban LLG.
Table 65: Talasea LLG – Area Summaries
Feature Hectares (ha) % of LLG Land
Total Area of Land 219,352
Total Area of Sea (out to 3nm) 106,214
Total Combined Land and Sea 325,566
Total Area Constraints:
Extreme (>30 degrees slope) 27,548 13%
Serious (20-30 degrees slope) 99,777 45%
Riparian Buffers (10 m each side) 1,854 1%
Coastal Buffers (10 m along coast) 225 0.1%
Total Area Terrestrial Constraints 129,404 59%
Total Area of Land 219,352 100%
Total Area Unavailable Land 129,404 59%Total Area Available Land (Total land – unavailable land) = 89,948 41%

Ridges To Reefs Assessment For New Britain, PNG:Planning For Sustainable Development 111
Figure 33: Talasea LLG – 2050 Zoning Plan

112 Ridges To Reefs Assessment For New Britain, PNG:Planning For Sustainable Development
Table 66: Talasea LLG – Zone Area Summaries
Parameter Hectares (ha) % ofLLG Land
% ofLLG Available
Land
Sustainability Indicator and
Ranking
TERRESTRIAL
Zone 1: Physical Constraints (Table 65) 129,404 59%
Zone 2: Fresh Water Security 144,709 66% 3
Zone 5: Terrestrial Conservation 10,660 5% 4
Projected Food Security 2050 20,442 (147%) 23% 6a
Zone 3: Food Security 30,225 34% 6b
Zone 6: Forestry 0 0% 7
Zone 7: Commercial Agriculture 28,549 32% 8
Zone 9: Urban Development 1,633 22%
Zone 10:Multiple Use 0 0%
Available Land (Table 65) 89,948 100%
Proposed Land Use by 2050(= Zone 3 + 6 + 7 + 9) 60,407 67% 1
Index of Sustainability (= available land - proposed land use) 29,540 33% 2
% of LLG Marine
MARINE
Zone 4: Marine Conservation 2,095 2% 5
Zone 8: Sustainable Fisheries 100,873 95%
Total Marine Area per LLG (Table 65) 106,214
3This figure represents oil palm areas that we could interpret from satellite imagery. Additional areas are known, but not mapped. Agricultural fields on the NARI campus are also not included in this figure.

Ridges To Reefs Assessment For New Britain, PNG:Planning For Sustainable Development 113
Table 67: Talasea LLG – Areas of Conflict
Table 68: Talasea LLG – Areas of Mutual Benefit
Food Security overlaps with: Hectares (ha) % of Province Sustainability Indicator and Ranking
Commercial Agriculture 70 0% 9a
Terrestrial Conservation 0 0% 9b
Freshwater Security 23,211 11% 9c
Physical Constraints overlaps with:
Food Security 40 0% 9d
Forestry 0 0% 9e
Commercial Agriculture 6,246 3% 9f
Total 29,565 13% 9
Physical Constraints overlaps with: Hectares (ha) % of Province Sustainability Indicator and Ranking
Freshwater Security 96,561 44% 10a
Terrestrial Conservation 1,854 1% 10b
Fresh Water Security overlaps with:
Terrestrial Conservation 0 0% 10c
Total 98,415 45% 10
Key Issues and Opportunities: 1. Under the current plan, proposed land is less than
the available arable land (i.e. there is a surplus of 29,541 ha or 33% of arable land by 2050) which means Talasea LLG meets RSD requirements.
2. Sustainability indicator for fresh water security also meets and exceeds RSD requirements, but could benefit from enhanced terrestrial conservation areas that also reinforce freshwater security to meet or exceed the LLG target.
3. Mapped food security exceeds 2050 projected food security by 1.5 times, which means Talasea will meet RSD food security requirements under the current plan (see Table 27)
4. Marine conservation (LMMAs) occur on the Kimbe Bay side of the peninsula. However, marine conservation areas need to be expanded to meet or exceed RSD requirements to ensure sustainable food production from marine resources.
Key Recommendations:1. Under this draft plan, the proposed land use meets
or exceeds most RSD requirements across most sustainability indicators.
2. Some areas will require enhancement such as expanding terrestrial protected areas to reinforce freshwater security areas.
3. Conflicts - In some instances, proposed food security areas impact freshwater security areas. These boundaries will require further refinement to minimize these impacts.
4. A focused effort to expand marine conservation areas will help reinforce food security from marine resources for the region.
5. Proactive family planning initiatives will also help to reduce potential future impacts from climate change such as food and fresh water shortages (e.g. drought).
6. Under the previous WNB Livelihood Futures project (Butler et al. 2012), the following LLG-specific climate adaptation strategies were prioritised, which complement the above recommendations: Increase variety and quality of food production; and provide effective support for LMMA network.

114 Ridges To Reefs Assessment For New Britain, PNG:Planning For Sustainable Development
Kimbe Bay, PNG © Damian Keane/ UNDP

Ridges To Reefs Assessment For New Britain, PNG:Planning For Sustainable Development 115
ZONING REPORT CARD: MOSA LLG Mosa LLG is largely an inland LLG, with a small area of coastline on the northwest corner. The northern third has extensive oil palm development and the areas in the southern half of the LLG grade rapidly into steep and rugged hillsides to mountains. The arable area between Hoskins LLG and the steeper slopes is 10-20 kilometres wide flanking the major rivers that flow into the LLG. These arable areas are suitable for growing crops (food security, cash crops and commercial agriculture), forestry and urban areas. The rugged slopes and hillsides that grade into the Whiteman Mountain Range to the south is largely unsuitable for commercial agriculture, but suitable for the retention of intact catchments for fresh water security and terrestrial conservation areas. The nearshore waters area is small and has some reefs systems that drop into deep water.
Population, food security and fresh water security projections:The projected population for Mosa LLG will be 123,531 (more than 3 times the current population) by 2050. This will require a minimum area of 24,706 ha of land specifically dedicated to food production to ensure food security for the local population. The mapped area of food security in the current draft zoning plan 26,961 ha, which means that under this draft plan, Mosa LLG will be in a good position to feed its local population by 2050. However, current estimates also indicate that with the present population growth, Mosa LLG will be greatly land constrained by 2050.
Table 69: Mosa LLG – Area Summaries
Feature Hectares (ha) % of LLG Land
Total Area of Land 174,228
Total Area of Sea (out to 3nm) 2,798
Total Combined Land and Sea 177,026
Total Area Constraints:
Extreme (>30 degrees slope) 66 0%
Serious (20-30 degrees slope) 126,206 72%
Riparian Buffers (10 m each side) 1,098 1%
Coastal Buffers (10 m along coast) 5 0%
Total Area Terrestrial Constraints 127,375 73%
Total Area of Land 174,228 100%
Total Area Unavailable Land - 127,375 73%
Total Area Available Land (Total land – unavailable land) = 48,854 27%

116 Ridges To Reefs Assessment For New Britain, PNG:Planning For Sustainable Development
Figure 34: Mosa LLG – 2050 Zoning Plan

Ridges To Reefs Assessment For New Britain, PNG:Planning For Sustainable Development 117
Table 70: Mosa LLG – Zone Area Summaries
Parameter Hectares (ha) % ofLLG Land
% ofLLG Available
Land
Sustainability Indicator and
Ranking
TERRESTRIAL
Zone 1: Physical Constraints (Table 69) 127,375 73%
Zone 2: Fresh Water Security 67,738 39% 3
Zone 5: Terrestrial Conservation 37,081 21% 4
Projected Food Security 2050 24,706 (119%) 53% 6a
Zone 3: Food Security 26,961 58% 6b
Zone 6: Forestry 32,062 68% 7
Zone 7: Commercial Agriculture 28,288 60% 8
Zone 9: Urban Development 230 0.1%
Zone 10: Multiple Use 0 0%
Available Land (Table 69) 46,854 100%
Proposed Land Use by 2050(= Zone 3 + 6 + 7 + 9 + 10) 87,541 187% 1
Index of Sustainability (= available land - proposed land use) - 40,687 - 87% 2
% of LLG Marine
MARINE
Zone 4: Marine Conservation 0 0% 5
Zone 8: Sustainable Fisheries 206 7%
Total Marine Area per LLG (Table 69) 2,798

118 Ridges To Reefs Assessment For New Britain, PNG:Planning For Sustainable Development
Table 71: Mosa LLG – Areas of Conflict
Table 72: Mosa LLG – Areas of Mutual Benefit
Food Security overlaps with: Hectares (ha) % of Province Sustainability Indicator and Ranking
Commercial Agriculture 23 0% 9a
Terrestrial Conservation 5,350 3% 9b
Freshwater Security 12,581 7% 9c
Physical Constraints overlaps with:
Food Security 17,877 10% 9d
Forestry 28,097 16% 9e
Commercial Agriculture 8,355 5% 9f
Total 72,284 41% 9
Physical Constraints overlaps with: Hectares (ha) % of Province Sustainability Indicator and Ranking
Freshwater Security 63,750 37% 10a
Terrestrial Conservation 36,349 21% 10b
Fresh Water Security overlaps with:
Terrestrial Conservation 41,118 24% 10c
Total 141,217 81% 10
Key Issues and Opportunities: 1. Under the draft current plan, proposed land use will
exceed available arable land by 40,688 ha by 2050 (186% of available land). Which means that Mosa LLG will not meet RSD requirements by 2050 under the current draft zoning plan.
2. The major issue is that while mapped food security meets and exceeds the RSD requirement to feed the local population, it does so at the expense of the integrity of the local environment. That is, most of the garden expansion for food security will occur on steeper slopes (physical constraint areas) which will result in increased erosion, which will impact the near shore waters of Mosa, Talasea and Hoskins LLGs that is, it will impact food production from marine resources and food security. The main reason for this is that most of the arable land is allocated to forestry and oil palm production.
3. Forestry and Commercial Agriculture account for 68% and 60% of the arable land respectively. This means that there is only limited land available for local food productions and small scale cash crops. Under the current draft plan mapped food security accounts for a further 58% of the arable land. Clearly, Mosa LLG will be greatly land constrained by 2050 and innovative strategies and approaches will be required to manage the increasing pressures and conflicts likely to occur in the LLG.
4. Fresh water security and terrestrial conservation area effectively considered in the draft plan and
meet or exceed RSD requirements. However, the plan would benefit from the expansion of terrestrial conservation areas to reduce the impacts of food production on steeper slopes.
5. An additional consideration is that Mosa LLG is also bordered by other populated LLG’s: Talasea, Kimbe Urban and Hoskins. Pressures in neighbouring LLG’s will also impose additional demands for food security from Mosa LLG.
Key Recommendations:1. Clever land use strategies will need to be developed
to minimize the impacts of the rapidly growing population in Mosa LLG, particularly given that most of the arable land is already allocated to commercial agriculture and forestry.
2. Opportunities may exist for the production of tree crops and fuel wood trees within riparian buffers and on steeper slopes to help stabilize these areas, but also provide valuable resources to the communities.
3. Proactive and strategic family planning initiatives will need to be developed to help minimise future impacts from the rapidly expanding population.
4. Limiting ongoing village oil palm expansion will be essential to allow the production of food crops to feed the local population.
5. Greater coordination between Hoskins, Mosa, Talasea and Kimbe LLGs will also be required to develop climate change adaptation strategies to minimize future food and water shortages as a result of climate change impacts such as drought.

Ridges To Reefs Assessment For New Britain, PNG:Planning For Sustainable Development 119
ZONING REPORT CARD: HOSKINS LLG Hoskins LLG is characterised by a coastal strip 1-10 kilometres wide and some arable areas inland. The arable areas are suitable for growing crops (food security, cash crops and commercial agriculture), forestry and urban areas. The coastal strip in Hoskins LLG is backed by rugged steeper slopes and hillsides. The steeper areas are unsuitable for commercial agriculture, but suitable for the retention of intact catchments for fresh water security and terrestrial conservation areas. Nearshore waters have extensive reefs systems that drop into deep water.
Population, food security and fresh water security projections:The projected population for Hoskins LLG will be 96,165 (more than 3 times the current population) by 2050. This will require a minimum area of 19,233 ha of land specifically dedicated to food production to ensure food security. The mapped area of food security in the current draft zoning plan is 11,722 ha which represents only 61% of the food security area required to feed the local population by 2050. Current estimates indicate that with the present population growth, Hoskins LLG will need to expand its food security areas to feed the local population by 2050. Commercial agriculture expansion has ceased in the area, but village oil palm as a cash crop for local communities may continue to expand.
Table 73: Hoskins LLG – Area Summaries
Feature Hectares (ha) % of LLG Land
Total Area of Land 58,956
Total Area of Sea (out to 3nm) 53,159
Total Combined Land and Sea 112,115
Total Area Constraints:
Extreme (>30 degrees slope) 10,590 18%
Serious (20-30 degrees slope) 14,401 24%
Riparian Buffers (10 m each side) 577 1%
Coastal Buffers (10 m along coast) 68 0%
Total Area Terrestrial Constraints 25,636 43%
Total Area of Land 58,956 100%
Total Area Unavailable Land - 25,636 43%
Total Area Available Land (Total land – unavailable land) = 33,320 57%

120 Ridges To Reefs Assessment For New Britain, PNG:Planning For Sustainable Development
Figure 35: Hoskins LLG – 2050 Zoning Plan

Ridges To Reefs Assessment For New Britain, PNG:Planning For Sustainable Development 121
Table 74: Hoskins LLG – Zone Area Summaries
Parameter Hectares (ha) % ofLLG Land
% ofLLG Available
Land
Sustainability Indicator and
Ranking
TERRESTRIAL
Zone 1: Physical Constraints (Table 73) 25,636 43%
Zone 2: Fresh Water Security 5,589 9% 3
Zone 5: Terrestrial Conservation 94 0% 4
Projected Food Security 2050 19,233 (66%) 58% 6a
Zone 3: Food Security 11,722 35% 6b
Zone 6: Forestry 0 0% 7
Zone 7: Commercial Agriculture 12,046 36% 8
Zone 9: Urban Development 0 0%
Zone 10: Multiple Use 0 0%
Available Land (Table 73) 33,320 100%
Proposed Land Use by 2050(= Zone 3 + 6 + 7 + 9 + 10) 23,768 71% 1
Index of Sustainability (= available land - proposed land use) 9,553 29% 2
% of LLG Marine
MARINE
Zone 4: Marine Conservation 34,624 65% 5
Zone 8: Sustainable Fisheries 20,250 38%
Total Marine Area per LLG (Table 73) 53,159

122 Ridges To Reefs Assessment For New Britain, PNG:Planning For Sustainable Development
Table 75: Hoskins LLG – Areas of Conflict
Table 76: Hoskins LLG – Areas of Mutual Benefit
Food Security overlaps with: Hectares (ha) % of Province Sustainability Indicator and Ranking
Commercial Agriculture 1,386 2% 9a
Terrestrial Conservation 0 0% 9b
Freshwater Security 711 1% 9c
Physical Constraints overlaps with:
Food Security 1,098 2% 9d
Forestry 0 0% 9e
Commercial Agriculture 1,336 2% 9f
Total 4,531 8% 9
Physical Constraints overlaps with: Hectares (ha) % of Province Sustainability Indicator and Ranking
Freshwater Security 841 1% 10a
Terrestrial Conservation 88 0% 10b
Fresh Water Security overlaps with:
Terrestrial Conservation 0 0% 10c
Total 929 1% 10
Key Issues and Opportunities: 1. Under the current draft plan, proposed land use
is 29% less than the available arable land. While this suggests that the plan has a high index of sustainability, there are likely some fine scale land use components not considered within the current plan as well as some additional limitations.
2. Both fresh water security and terrestrial conservation are limited in the current plan and could benefit from expansion.
3. Mapped food security is only 66% of 2050 projected food security, which means that Hoskins LLG will not produce sufficient food to feed its population.
4. Existing commercial agriculture occupies 36% of the arable land.
5. Marine conservation is well developed with extensive LMMAs across the nearshore reef and other marine systems.
6. There are at present limited conflicts.7. There are good opportunities for the expansion of
mutual benefit areas. Key Recommendations:1. This plan could benefit from additional fine scale
mapping to better define the land use activities within Hoskins LLG.
2. There is a need to expand food security areas by 7,500 ha.
3. There is a need to expand fresh water security areas and terrestrial conservation to reinforce protection and provide multiple benefits.
4. Hoskins LLG would likely benefit from thoughtful and proactive family planning initiatives to ensure the future resilience of the communities to the impacts of climate change (e.g. drought) as well as minimize future impacts of food and water shortages.
5. In 2013, priority climate adaptation strategy objectives and actions were identified by the WNB Livelihood Futures project (Butler et al. 2013a), which complement the above recommendations. They were prioritised as follows:
• Objective 1: Build the literacy, leadership, awareness and skills of the people and LLG management of Hoskins
• Objective 2: Control population growth by 70% by 2050 and control immigration
• Objective 3: Improve transparency, effectiveness and accountability of local/traditional and provincial government/decision makers
• Objective 4: Improve the physical, mental and spiritual and social wellbeing of people in Hoskins

Ridges To Reefs Assessment For New Britain, PNG:Planning For Sustainable Development 123
Blue-faced honeyeater, PNG © Thomasmales/ iStock

124 Ridges To Reefs Assessment For New Britain, PNG:Planning For Sustainable Development
ZONING REPORT CARD: CENTRAL NAKANAI LLG Central Nakanai LLG is characterised by a narrow arable coastal strip 2-5 kms wide and arable areas flanking some of the river valleys. These arable areas are suitable for growing crops (food security, cash crops and commercial agriculture), forestry and urban areas. The coastal strip of Central Nakanai LLG is backed by rugged slopes and hillsides that grade into the Nakanai Mountain Range. These areas are mostly unsuitable for commercial agriculture, but suitable for the retention of intact catchments for fresh water security and terrestrial conservation areas. Nearshore waters have extensive reefs systems that drop into deep water beyond 3 nautical miles.
Population, food security and fresh water security projections:The projected population for Central Nakanai LLG by 2050 will be 70,326 (more than 3 times the current population). This will require a minimum area of 14,065 ha of land specifically dedicated to food production to ensure food security by 2050. The mapped area of food security in the current draft zoning plan is 10,237 ha, or around 73% of the minimum area projected to ensure food security by 2050. Current estimates suggest that with the current population growth Central Nakanai LLG will reach carry capacity by 2040 and will likely exceed its carrying capacity by 2050. Any oil palm expansion, particularly in relation to village oil palm, will need to make sure that food security is effectively addressed first.
Table 77: Central Nakanai LLG – Area Summaries
Feature Hectares (ha) % of LLG Land
Total Area of Land 145,821
Total Area of Sea (out to 3nm) 32,398
Total Combined Land and Sea 178,219
Total Area Constraints:
Extreme (>30 degrees slope) 21,593 15%
Serious (20-30 degrees slope) 97,911 67%
Riparian Buffers (10 m each side) 323 0%
Coastal Buffers (10 m along coast) 59 0%
Total Area Terrestrial Constraints 119,885 82%
Total Area of Land 145,821 100%
Total Area Unavailable Land - 119,885 82%
Total Area Available Land (Total land – unavailable land) = 25,936 18%

Ridges To Reefs Assessment For New Britain, PNG:Planning For Sustainable Development 125
Figure 36: Central Nakanai LLG – 2050 Zoning Plan

126 Ridges To Reefs Assessment For New Britain, PNG:Planning For Sustainable Development
Table 78: Central Nakanai LLG – Zone Area Summaries
Parameter Hectares (ha) % ofLLG Land
% ofLLG Available
Land
Sustainability Indicator and
Ranking
TERRESTRIAL
Zone 1: Physical Constraints (Table 77) 119,886 82%
Zone 2: Fresh Water Security 72,864 50% 3
Zone 5: Terrestrial Conservation 0 0% 4
Projected Food Security 2050 14,065 (79%) 54% 6a
Zone 3: Food Security 10,237 39% 6b
Zone 6: Forestry 3,168 12% 7
Zone 7: Commercial Agriculture 31,456 121% 8
Zone 9: Urban Development 0 0%
Zone 10: Multiple Use 0 0%
Available Land (Table 77) 25,936 100%
Proposed Land Use by 2050(= Zone 3 + 6 + 7 + 9 + 10) 44,861 173% 1
Index of Sustainability (= available land - proposed land use) - 18,925 - 73% 2
% of LLG Marine
MARINE
Zone 4: Marine Conservation 26,535 82% 5
Zone 8: Sustainable Fisheries 13,807 43%
Total Marine Area per LLG (Table 77) 32,398

Ridges To Reefs Assessment For New Britain, PNG:Planning For Sustainable Development 127
Table 79: Central Nakanai LLG – Areas of Conflict
Table 80: Central Nakanai LLG – Areas of Mutual Benefit
Food Security overlaps with: Hectares (ha) % of Province Sustainability Indicator and Ranking
Commercial Agriculture 0 0% 9a
Terrestrial Conservation 0 0% 9b
Freshwater Security 405 0.3% 9c
Physical Constraints overlaps with:
Food Security 4,783 3% 9d
Forestry 3,141 2% 9e
Commercial Agriculture 8,529 6% 9f
Total 16,857 12% 9
Physical Constraints overlaps with: Hectares (ha) % of Province Sustainability Indicator and Ranking
Freshwater Security 68,422 47% 10a
Terrestrial Conservation 0 0% 10b
Fresh Water Security overlaps with:
Terrestrial Conservation 0 0% 10c
Total 68,422 47% 10
Key Issues and Opportunities: 1. Under the current draft plan, proposed land use
will exceed available arable land by 18,925 ha by 2050, which means that Central Nakanai LLG will become increasing unsustainable beyond 2040. The combined demands for commercial agriculture, forestry, and food security from the limited arable land area will mean that expanding needs for food security will likely need to be met on steeper slopes, resulting in increased soil erosion and sediment impacts to nearshore waters which may also limit fish recruitment.
2. At the present time, projected food security 14,065 ha exceeds mapped food security 10,237 ha. This means that the by 2050 that the mapped area will only meet 79% of the food required to meet the daily needs of the population by 2050.
3. Fresh water security is well considered in the plan (50%).
4. Marine conservation is well considered within the plan (82%).
Key Recommendations:1. Proactively introduce family planning initiatives to
reduce the size of the areas requirement for food security by and equally the potential impact of food shortages by 2050.
2. In addition, ensure effective road networks to enable the transportation of food between LLG’s if required.
3. Where possible and practical minimize the development of gardens on steeper slopes.
4. Where possible and practical limit further development of village oil palm.
5. Reinforce freshwater security areas with terrestrial conservation to meet multiple benefits.

128 Ridges To Reefs Assessment For New Britain, PNG:Planning For Sustainable Development
ZONING REPORT CARD: EAST NAKANAI LLGEast Nakanai LLG is characterised by a narrow arable coastal strip 4-9 kilometres wide with arable areas flanking the river valleys. These arable areas are suitable for growing crops (food security, cash crops and commercial agriculture), forestry and development. The coastal strip in East Nakanai LLG is backed by rugged slopes and hillsides that grade into the Nakanai Mountain Range. These rugged steep areas are mostly unsuitable for commercial agriculture, but suitable for the retention of intact catchments for fresh water security and terrestrial conservation areas. Nearshore areas in the East Nakanai LLG have well developed reefs systems that drop into deep water beyond 3 nautical miles. In addition, the large island of Lolobau with its extensive reefs systems lies a short distance off the northern coast.
Population, food security and fresh water security projections:The projected population for East Nakanai LLG will be 109,734 (more than 3 times the current population) by 2050. This will require a minimum area of 21,947 ha of land specifically dedicated to food production to ensure food security by 2050. The mapped area of food security in the current draft zoning plan is 3,774 ha, only 17% of the area projected to ensure food security by 2050. In addition, only a small area (9,403 ha) has been mapped for freshwater security in the draft plan. Given the extensive area of arable land in East Nakanai (79,203 ha), there should be a wide range of options available to expand the area required for food security. However, any decisions around proposed commercial agriculture developments or expansion of village oil palm should be mindful of the additional need for food security areas for this LLG.
Table 81: East Nakanai LLG – Area Summaries
Feature Hectares (ha) % of LLG Land
Total Area of Land 112,780
Total Area of Sea (out to 3nm) 95,213
Total Combined Land and Sea 207,994
Total Area Constraints:
Extreme (>30 degrees slope) 3,141 3%
Serious (20-30 degrees slope) 28,538 25%
Riparian Buffers (10 m each side) 1,739 2%
Coastal Buffers (10 m along coast) 160 0.1%
Total Area Terrestrial Constraints 33,577 30%
Total Area of Land 112,780 100%
Total Area Unavailable Land - 33,577 30%
Total Area Available Land (Total land – unavailable land) = 79,203 70%

Ridges To Reefs Assessment For New Britain, PNG:Planning For Sustainable Development 129
Figure 37: East Nakanai LLG – 2050 Zoning Plan

130 Ridges To Reefs Assessment For New Britain, PNG:Planning For Sustainable Development
Table 82: East Nakanai LLG – Zone Area Summaries
Parameter Hectares (ha) % ofLLG Land
% ofLLG Available
Land
Sustainability Indicator and
Ranking
TERRESTRIAL
Zone 1: Physical Constraints (Table 81) 33,577 30%
Zone 2: Fresh Water Security 9,403 8% 3
Zone 5: Terrestrial Conservation 4,985 4% 4
Projected Food Security 2050 21,947 (17%) 28% 6a
Zone 3: Food Security 3,774 5% 6b
Zone 6: Forestry 1,061 1% 7
Zone 7: Commercial Agriculture 31,206 39% 8
Zone 9: Urban Development 0 0%
Zone 10: Multiple Use 0 0%
Available Land (Table 81) 79,203 100%
Proposed Land Use by 2050(= Zone 3 + 6 + 7 + 9 + 10) 36,041 46% 1
Index of Sustainability (= available land - proposed land use) 43,162 54% 2
% of LLG Marine
MARINE
Zone 4: Marine Conservation 120,431 126% 5
Zone 8: Sustainable Fisheries 62,813 66%
Total Marine Area per LLG (Table 81) 95,213

Ridges To Reefs Assessment For New Britain, PNG:Planning For Sustainable Development 131
Table 83: East Nakanai LLG – Areas of Conflict
Table 84: East Nakanai LLG – Areas of Mutual Benefit
Food Security overlaps with: Hectares (ha) % of Province Sustainability Indicator and Ranking
Commercial Agriculture 0 0% 9a
Terrestrial Conservation 0 0% 9b
Freshwater Security 0 0% 9c
Physical Constraints overlaps with:
Food Security 173 0% 9d
Forestry 14 0% 9e
Commercial Agriculture 228 0% 9f
Total 415 0% 9
Physical Constraints overlaps with: Hectares (ha) % of Province Sustainability Indicator and Ranking
Freshwater Security 8,545 8% 10a
Terrestrial Conservation 3,610 3% 10b
Fresh Water Security overlaps with:
Terrestrial Conservation 3,482 3% 10c
Total 15,637 14% 10
Key Issues and Opportunities: 1. Under this draft plan, proposed land use is only
36,041 ha, 46% of the available 79,203 ha. However, a number of key areas are underrepresented in the current plan.
2. Mapped food security is constrained to 3,774 ha, well short of the minimum area projected to 2050 (21,947 ha).
3. Similarly, only 9,403 ha of fresh water security areas are currently defined in the plan. Given the expected large population, the retention of intact catchments in the Nakanai upstream from larger settlements will be an important consideration.
4. Commercial agriculture is approaching 40% of available arable land, leaving 60% of the remaining arable land for all other uses.
5. Under the draft plan there are minimal areas of conflict, suggesting very good allocation of available land.
6. Under the draft plan there are many good opportunities for mutual benefit by expanding fresh water security, terrestrial conservation across steep areas of physical constraints.
7. The marine protected area network of LMMA’s exceeds the current target strengthening the resilience and food security from marine resources for the local populations.
Key Recommendations:1. Expand the land based food security area to at
least meet if not exceed the minimum projected requirement of 21,947 ha.
2. Expand the area of freshwater security to exceed 40% of the LLG area. Where possible and practical do this in concert with the establishment of terrestrial conservation areas to reinforce the protection.
3. Proactively introduce family planning initiatives to help alleviate future population pressures.

This publication is a part of a set of knowledge products, supported by PNG Government through the Conservation and Environment Protection Authority in partnership with UNDP’s Global Environment Facility program. The set can be downloaded in the ‘Research and Publication’ section at www.pg.undp.org
Conservation and Environment Protection
Authority
PROTECTED AREAS POLICY IMPLEMENTATION PLAN 2018-2028
November 2017
Papua New Guinea POLICY ON
PROTECTED AREASLukautim abus, graun na wara b’long nau na bihain taimEda uda, tano bona davara naridia hari bona nega vaira
Conservation and Environment Protection
Authority
A GUIDE TO PROTECTED AREA TYPESPAPUA NEW GUINEA
July 2017
Conservation and Environment Protection
Authority
COMMUNITY ENGAGEMENT TOOLKITON CONSERVATION
June 2018
LAND-SEA CONSERVATION ASSESSMENT FOR PAPUA NEW GUINEA
June 2017
Conservation and Environment Protection
Authority
Conservation and Environment Protection
Authority
FACT SHEETS ON PAPUA NEW GUINEA’S PROTECTED AREAS
2017
Conservation and Environment Protection
Authority
ASSESSMENT OF MANAGEMENTEFFECTIVENESS FOR PAPUA NEW GUINEA’S
PROTECTED AREAS 2017August 2017
Conservation and Environment Protection
Authority
RIDGES TO REEFS ASSESSMENT FORNEW BRITAIN, PNG:
PLANNING FOR SUSTAINABLE DEVELOPMENTEast and West New Britain
September 2017
Conservation and Environment Protection
Authority
THE PNG-METT A METHOD FOR ASSESSING EFFECTIVENESS
IN PAPUA NEW GUINEA’S PROTECTED AREASAugust 2017
Conservation and Environment Protection
Authority
PAYMENT FOR ECOSYSTEM SERVICESOPTIONS AND OPPORTUNITIES FOR NEW
BRITAIN ISLAND PAPUA NEW GUINEANovember 2015
Acknowledgements: Published in May, 2018, the compilation and design of this suite of publications was managed by Alice Plate, Nicola Gage and Rosalinda Mercuri for UNDP PNG with input and much welcomed assistance from the publication authors and Conservation and Protection Authority (CEPA) staff. Graphic design by Dreamedia Creative.
Conservation andEnvironment Protection
Authority
