rick shoup, research analyst center for postsecondary research, indiana university bloomington nsse...
Post on 21-Dec-2015
215 views
TRANSCRIPT

Rick Shoup, Research Analyst
Center for Postsecondary Research, Indiana University
Bloomington
NSSE Foundations Session:Experienced Users
Regional NSSE User’s WorkshopOctober 2006

Overview
Review NSSE Reports
Discuss Benchmarks
Reading & Sharing your Reports
Beyond the Standard Report
Future NSSE Developments
Discussion & Questions
“NESSIE”

Goals
Provide good introduction to later sessions
Cover issues of interest to veteran NSSE participants
Answer your questions
A Quick Survey to Get Things Started….
Years of participation in NSSE
Years of involvement in project
Background of attendees

The NSSE Reports
Respondent Characteristics
Mean Comparisons
Detailed Statistics
Frequency Distributions
Benchmark Comparisons
Benchmark Recalculation Report

The NSSE Reports: New Features
Selected peer group (2005)
Selected carnegie group (2006)
Early benchmark report (2006)
Frequency distributions and mean comparisons reports weighted (2006)
Weighted to account for population size (2006)
New carnegie groups available (2006)

The NSSE Reports:Respondent Characteristics
A quick snapshot of your institution
Data quality: Confirming if sample is representative
Response Rate and Sample Error
FY SR FY SR FY SR FY SR
Response Ratea
OverallBy class 30% 34% 32% 32% 34% 38% 33% 36%
NSSE sample sizeb 1,342 972 21,757 19,066 26,219 19,739 392,958 360,687
Sampling Errorc
OverallBy class 4.1% 4.4% 1.0% 1.1% 0.9% 0.9% 0.2% 0.2%
Number of respondentsb 402 331 6,894 6,101 8,877 7,460 131,249 128,733Total population 1,373 975 28,971 27,569 32,496 22,604 591,361 552,621
Student Characteristicsd
Mode of Completion
Paper 4% 4% 3% 5% 8% 14% 4% 7%Web 96% 96% 97% 95% 92% 86% 96% 93%
Class Level e55% 45% 53% 47% 54% 46% 50% 50%
Enrollment Status e
Full-time 84% 84% 94% 83% 91% 80% 95% 86%Less than full-time 16% 16% 6% 17% 9% 20% 5% 14%
Gender e
Female 81% 74% 67% 67% 65% 68% 64% 64%Male 19% 26% 33% 33% 35% 32% 36% 36%
Race/Ethnicity
Am. Indian/Native American 1% 1% 2% 1% 1% 1% 1% 1%Asian/Asian Am./Pacific Isl. 2% 0% 4% 3% 2% 2% 5% 4%Black/African American 1% 0% 3% 4% 8% 9% 6% 6%White (non-Hispanic) 87% 89% 79% 78% 78% 76% 74% 74%Mexican/Mexican American 0% 0% 2% 1% 1% 1% 2% 2%Puerto Rican 0% 0% 1% 0% 0% 1% 1% 1%Other Hispanic or Latino 0% 0% 1% 1% 1% 2% 2% 2%Multiracial 2% 1% 2% 2% 2% 2% 2% 2%Other 2% 1% 1% 1% 1% 1% 1% 2%I prefer not to respond 5% 8% 6% 8% 5% 6% 6% 7%
International Student 2% 1% 4% 4% 5% 4% 5% 5%
Place of Residence
On-campus 60% 13% 65% 18% 56% 19% 71% 20%Off-campus 40% 87% 35% 82% 44% 81% 29% 80%
Transfer Status
Transfer students 9% 37% 8% 39% 13% 42% 9% 39%
Age
Non-traditional (24 or older) 18% 40% 7% 34% 12% 41% 6% 31%Traditional (less than 24) 82% 60% 93% 66% 88% 59% 94% 69%
3.0% 0.6% 0.2%0.8%
NSSE 2006 Respondent Characteristics
NSSEville State University
Selected Peers Carnegie Peers NSSE 2006NSSEville State
34%32%32% 36%
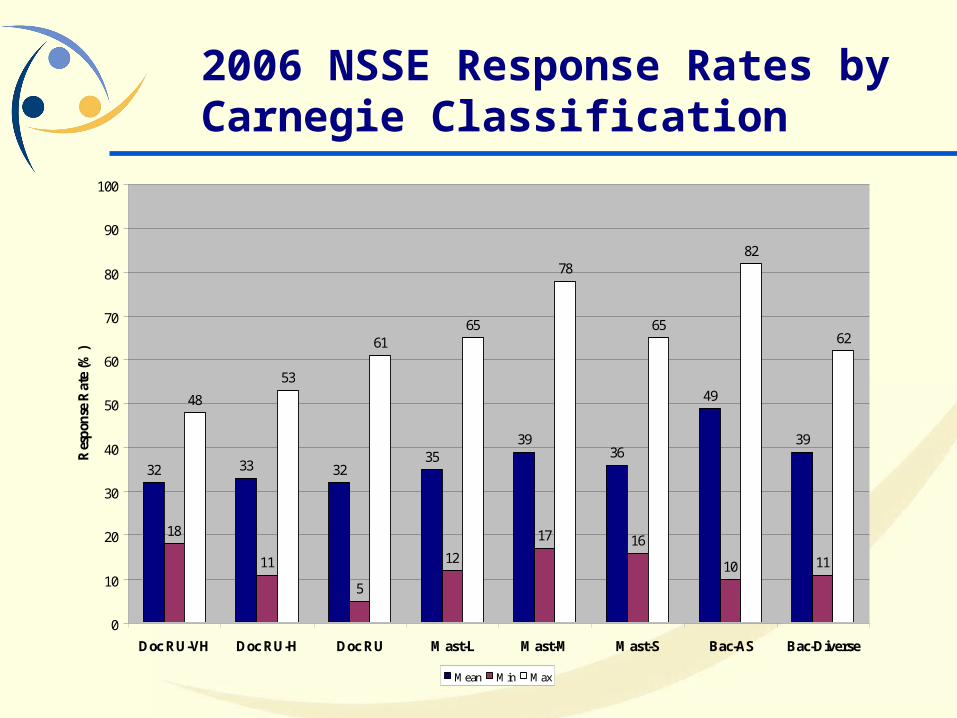
2006 NSSE Response Rates by Carnegie Classification
32 33 3235
3936
49
39
18
11
5
12
17 16
10 11
48
53
6165
78
65
82
62
0
10
20
30
40
50
60
70
80
90
100
Doc RU-VH Doc RU-H Doc RU Mast-L Mast-M Mast-S Bac-AS Bac-Diverse
Res
pon
se R
ate
(%)
Mean Min Max

The NSSE Reports:Respondent Characteristics
What is Sampling Error?
Assumes random sampling
An estimate of the margin likely to contain your "true" score, for example:
If 60% of your students reply "very often" and the sampling error is ± 5%, it is likely that the true value is between 55% and 65%.
More respondents --> smaller sampling error

2006 NSSE Sampling Error by Carnegie Classification
3 3 3
4
5 5
4
6
2 2 2 2 2 2 2 2
6 6
9
11
12
10
16
15
0
2
4
6
8
10
12
14
16
18
20
Doc RU-VH Doc RU-H Doc RU Mast-L Mast-M Mast-S Bac-AS Bac-Diverse
Res
pon
se R
ate
(%)
Mean
Min
Max

The NSSE Reports:Mean Comparisons
Means, statistical significan
ce and effect sizes
Variable
Bench-mark Class Mean a Mean a Sig b
Effect
Size c Mean a Sig b
Effect
Size c Mean a Sig b
Effect
Size c
1. Academic and Intellectual Experiences
FY 2.94 2.76 *** .22 2.88 2.78 *** .19
SR 3.28 3.08 *** .24 3.20 3.06 *** .26
FY 2.27 2.24 2.34 2.23
SR 2.82 2.77 2.87 2.80
FY 2.85 2.61 *** .25 2.77 2.65 *** .21
SR 2.45 2.43 2.58 * -.14 2.49
FY 3.13 3.01 ** .15 3.05 3.03 * .13
SR 3.26 3.31 3.32 3.30
FY 2.76 2.75 2.71 2.76
SR 2.88 2.83 2.78 2.78
FY 1.86 2.07 *** -.28 1.93 2.03 *** -.23
SR 1.89 2.14 *** -.32 1.98 2.12 *** -.30
Carnegie Peers
ACL
ACL
Come to class without completing readings or assignments
CLUNPREP
Worked on a paper or project that required integrating ideas or information from various sources
INTEGRAT
Included diverse perspectives (different races, religions, genders, political beliefs, etc.) in class discussions or writing assignments
DIVCLASS
Made a class presentation CLPRESEN
Prepared two or more drafts of a paper or assignment before turning it in
REWROPAP
NSSEville State UniversityNSSE 2006 Mean Comparisons
Asked questions in class or contributed to class discussions
CLQUEST
In your experience at your institution during the current school year, about how often have you done each of the following? 1=never, 2=sometimes, 3=often, 4=very often
NSSE 2006NSSEville State
NSSEville State compared with:
Selected Peers
a.
b.
c.
d.
e.
f.

The NSSE Reports:Mean Comparisons
What is Statistical Significance?
Helps you answer the question, “How likely is it that the difference between my average student and the average student at [comparison group] is due to chance?
Significance determined by standard alpha values of p<.05, .01, or .001

Potential problem:As N becomes large, almost everything becomes statistically significant
How do we identify truly significant differences?
This is a question of …
practical significance
The NSSE Reports:Mean Comparisons

The NSSE Reports:Mean Comparisons
What is Effect Size?
Practical significance of the mean difference
ES=mean difference/standard deviation
.2 is often considered small, .5 moderate, and .8 large (but rare!)
For example, while the difference in the means is statistically significant, the difference is so nominal that it doesn’t warrant further attention

The NSSE Reports:Detailed Statistics
Mean, N,
SEM, SD,
p-value, effect size
Sele
cted
Pe
ers
Car
negi
e Pe
ers
NSS
E 2
006
Sele
cted
Pe
ers
Car
negi
e Pe
ers
NSS
E 2
006
2.94 2.76 2.88 2.78 .05 .01 .01 .00 .79 .83 .83 .84 305 6,416 7,001 130,759 .000 .213 .001 .22 .07 .19
2.27 2.24 2.34 2.23 .04 .01 .01 .00 .75 .78 .81 .80 305 6,412 6,994 130,631 .550 .109 .354 .04 -.09 .05
2.85 2.61 2.77 2.65 .05 .01 .01 .00 .95 .98 .97 .98 304 6,406 6,995 130,646 .000 .127 .000 .25 .09 .21
3.13 3.01 3.05 3.03 .05 .01 .01 .00 .79 .78 .79 .80 305 6,397 6,995 130,632 .009 .069 .021 .15 .11 .13
2.76 2.75 2.71 2.76 .05 .01 .01 .00 .86 .87 .88 .88 305 6,398 6,990 130,595 .823 .322 .962 .01 .06 .00
1.86 2.07 1.93 2.03 .04 .01 .01 .00 .68 .77 .74 .76 304 6,400 6,979 130,504 .000 .087 .000 -.28 -.10 -.23
2.51 2.42 2.50 2.40 .04 .01 .01 .00 .77 .82 .83 .83 305 6,400 6,976 130,552 .060 .742 .020 .11 .02 .13
2.11 2.34 2.33 2.36 .05 .01 .01 .00 .82 .83 .87 .87 305 6,403 6,996 130,654 .000 .000 .000 -.27 -.24 -.28
2.54 2.56 2.50 2.57 .05 .01 .01 .00 .80 .79 .80 .81 292 6,007 6,715 123,571 .732 .321 .631 -.02 .06 -.03
1.58 1.63 1.63 1.67 .05 .01 .01 .00 .85 .81 .82 .83 293 6,007 6,726 123,581 .266 .322 .053 -.07 -.06 -.11
1.42 1.46 1.49 1.50 .04 .01 .01 .00 .69 .76 .77 .78 293 6,003 6,717 123,499 .436 .114 .072 -.05 -.09 -.09
2.52 2.62 2.52 2.64 .06 .01 .01 .00 1.03 1.02 1.06 1.04 293 6,007 6,728 123,585 .088 .961 .041 -.10 .00 -.12
3.14 3.04 2.87 3.01 .05 .01 .01 .00 .81 .82 .90 .86 293 6,011 6,722 123,565 .045 .000 .015 .12 .30 .14
2.68 2.54 2.61 2.56 .05 .01 .01 .00 .89 .86 .86 .87 292 6,003 6,720 123,519 .009 .218 .017 .16 .07 .14
2.17 2.10 2.14 2.10 .05 .01 .01 .00 .84 .86 .89 .88 292 6,010 6,727 123,529 .129 .553 .184 .09 .04 .08
1.86 1.80 1.83 1.81 .05 .01 .01 .00 .82 .86 .86 .86 293 6,009 6,727 123,535 .196 .604 .279 .07 .03 .06
2.70 2.62 2.59 2.58 .05 .01 .01 .00 .78 .81 .84 .83 290 5,924 6,667 121,863 .105 .022 .013 .10 .13 .14
2.65 2.52 2.60 2.57 .05 .01 .01 .00 .81 .84 .83 .84 290 5,921 6,667 121,822 .009 .309 .113 .16 .06 .09
1.47 1.55 1.59 1.56 .04 .01 .01 .00 .74 .81 .83 .81 290 5,916 6,666 121,772 .108 .007 .059 -.09 -.14 -.10
2.68 2.65 2.65 2.68 .05 .01 .01 .00 .88 .87 .89 .87 290 5,922 6,657 121,733 .590 .648 .866 .03 .03 -.01
2.21 2.48 2.45 2.55 .06 .01 .01 .00 .95 1.01 1.02 1.02 290 5,924 6,664 121,756 .000 .000 .000 -.27 -.23 -.33
2.60 2.70 2.57 2.68 .05 .01 .01 .00 .92 .97 .99 .98 286 5,921 6,666 121,775 .080 .606 .121 -.11 .03 -.09
2.81 2.85 2.87 2.87 .05 .01 .01 .00 .87 .86 .84 .86 286 5,880 6,622 120,808 .448 .233 .227 -.05 -.07 -.07
2.95 3.05 2.98 3.06 .05 .01 .01 .00 .80 .76 .80 .79 286 5,878 6,616 120,739 .023 .451 .015 -.14 -.05 -.14
2.80 2.81 2.75 2.83 .05 .01 .01 .00 .80 .83 .84 .84 286 5,877 6,613 120,669 .705 .372 .508 -.02 .05 -.04
2.77 2.81 2.78 2.82 .05 .01 .01 .00 .91 .84 .87 .86 286 5,875 6,612 120,680 .466 .848 .353 -.04 -.01 -.05
2.85 2.95 2.93 2.98 .05 .01 .01 .00 .91 .84 .85 .85 286 5,874 6,616 120,707 .095 .151 .017 -.11 -.09 -.15
3.23 3.31 3.12 3.26 .06 .01 .01 .00 1.01 .91 .94 .93 287 5,868 6,602 120,580 .154 .070 .583 -.09 .12 -.03
Sele
cted
Pee
rs
Sele
cted
Pee
rs
Sele
cted
Pee
rs
NSS
Evi
lle S
tate
NSS
E 2
006
Car
negi
e Pe
ers
Car
negi
e Pe
ers
APPLYING
READASGN
MEMORIZE
ANALYZE
SYNTHESZ
EVALUATE
FACOTHER
DIVRSTUD
OOCIDEAS
DIFFSTU2
FACPLANS
FACIDEAS
FACFEED
WORKHARD
COMMPROJ
ITACADEM
FACGRADE
CLASSGRP
INTIDEAS
OCCGRP
TUTOR
REWROPAP
INTEGRAT
DIVCLASS
CLUNPREP
CLPRESEN
NSS
Evi
lle S
tate
NSS
E 2
006
NSS
Evi
lle S
tate
Car
negi
e Pe
ers
CLQUEST
Sele
cted
Pee
rs
Car
negi
e Pe
ers
NSSE 2006 Detailed Statistics a
First-Year Students
Significance d Effect size e
NSS
Evi
lle S
tate
NSS
E 2
006
NSSEville Statecompared with:
NSSEville Statecompared with:
NSS
E 2
006
NSSEville State University
Mean Standard Error of the Mean b Standard deviation c Number of respondents

The NSSE Reports:Detailed Statistics
What are Confidence Intervals?
CI = Mean +/- 2SEM
Multiplying the SEM by 2 creates a margin around the sample mean that is 95% likely to contain the true population mean.
More respondents smaller standard error of the mean (SEM), more precise estimate
Higher standard deviation greater SEM, less precise estimate

The NSSE Reports:Frequency Distributions
Counts and percentages for each response
option
Variable Response Options Count % Count % Count % Count % Count % Count % Count % Count %
1a. CLQUEST Never 7 1% 210 3% 202 2% 3,791 3% 1 0% 99 2% 89 1% 2,111 2%Sometimes 138 31% 2721 40% 3,083 33% 47,772 38% 58 17% 1570 27% 1,566 21% 32,172 27%Often 163 40% 2404 35% 3,290 38% 46,652 35% 118 37% 1958 32% 2,458 34% 42,486 33%
Very often 94 27% 1549 22% 2,158 26% 32,486 23% 154 46% 2465 39% 3,233 44% 51,477 37%Total 402 100% 6884 100% 8,733 100% 130,701 100% 331 100% 6092 100% 7,346 100% 128,246 100%
b. CLPRESEN Never 43 11% 948 14% 955 12% 17,353 16% 8 3% 261 5% 274 4% 5,026 5%Sometimes 244 57% 3768 54% 4,515 50% 71,227 53% 120 36% 2097 36% 2,153 31% 41,250 34%Often 98 25% 1739 25% 2,529 28% 32,693 24% 124 37% 2334 38% 2,856 38% 49,222 37%
Very often 17 7% 426 7% 726 9% 9,340 7% 79 24% 1398 22% 2,061 27% 32,693 24%Total 402 100% 6881 100% 8,725 100% 130,613 100% 331 100% 6090 100% 7,344 100% 128,191 100%
c. REWROPAP Never 35 10% 988 14% 884 11% 17,251 13% 62 19% 982 17% 1,065 14% 20,747 16%
Sometimes 101 23% 2170 32% 2,494 29% 41,938 31% 123 36% 2387 40% 2,702 36% 49,272 38%
Often 150 38% 2195 32% 2,998 34% 42,107 32% 81 26% 1620 26% 2,024 28% 34,025 27%Very often 115 29% 1525 22% 2,349 27% 29,281 23% 65 19% 1101 17% 1,556 22% 24,132 19%
Total 401 100% 6878 100% 8,725 100% 130,577 100% 331 100% 6090 100% 7,347 100% 128,176 100%d. INTEGRAT Never 10 3% 157 2% 179 3% 2,737 3% 2 1% 52 1% 78 1% 1,210 1%
Sometimes 76 16% 1536 22% 1,758 21% 28,128 22% 50 15% 716 13% 869 12% 15,432 13%Often 186 46% 3174 46% 3,963 45% 58,796 44% 134 41% 2389 40% 2,913 40% 49,980 40%
Very often 130 35% 2007 29% 2,826 31% 40,907 31% 145 43% 2934 46% 3,485 47% 61,533 46%Total 402 100% 6874 100% 8,726 100% 130,568 100% 331 100% 6091 100% 7,345 100% 128,155 100%
e. DIVCLASS Never 25 6% 422 6% 598 8% 7,741 7% 16 5% 348 6% 507 7% 8,164 8%Sometimes 134 33% 2343 34% 3,107 34% 42,685 33% 100 30% 1926 32% 2,470 33% 40,724 33%Often 172 39% 2613 38% 3,246 38% 49,846 38% 117 35% 2129 35% 2,489 34% 44,705 34%
Very often 71 22% 1497 22% 1,771 21% 30,252 22% 97 29% 1683 27% 1,870 25% 34,484 26%
Total 402 100% 6875 100% 8,722 100% 130,524 100% 330 100% 6086 100% 7,336 100% 128,077 100%f. CLUNPREP Never 107 28% 1373 20% 2,078 26% 28,780 22% 88 26% 1045 17% 1,618 24% 23,551 18%
Sometimes 255 62% 4160 60% 5,234 58% 78,122 59% 207 63% 3712 60% 4,416 59% 77,090 59%
Often 28 7% 921 14% 988 11% 16,589 14% 25 7% 886 15% 902 12% 18,790 16%Very often 11 3% 419 7% 414 4% 6,972 6% 11 4% 444 8% 397 5% 8,636 7%
Total 401 100% 6873 100% 8,714 100% 130,463 100% 331 100% 6087 100% 7,333 100% 128,067 100%g. CLASSGRP Never 34 8% 806 11% 844 10% 15,870 12% 36 12% 583 10% 564 7% 13,024 10%
Sometimes 179 43% 3180 46% 3,957 43% 61,148 46% 144 43% 2722 44% 3,078 41% 55,974 43%
Often 160 40% 2209 32% 3,004 35% 40,839 32% 103 30% 1903 31% 2,484 35% 39,643 31%
Very often 29 10% 679 10% 916 12% 12,661 10% 48 15% 879 15% 1,215 17% 19,476 15%Total 402 100% 6874 100% 8,721 100% 130,518 100% 331 100% 6087 100% 7,341 100% 128,117 100%
NSSE 2006 Engagement Item Frequency Distributions a
NSSEville State University
NSSE 2006
Seniors
NSSE 2006NSSEville State NSSEville State Carnegie PeersSelected Peers
Worked with other students on projects during class
First-Year Students
Included diverse perspectives (different races, religions, genders, political beliefs, etc.) in class discussions or assignments
Come to class without completing readings or assignments
Selected Peers Carnegie Peers
Asked questions in class or contributed to class discussions
Made a class presentation
Prepared two or more drafts of a paper or assignment before turning it in
Worked on a paper or project that required integrating ideas or information from various sources

Tip: Consider merging response options to create dichotomous variables (1/0)
Frequently = often + very often
Substantial = quite a bit + very much
The NSSE Reports:Frequency Distributions

5 Benchmarks of Effective Educational Practice
Level of Academic Challenge
Active and Collaborative Learning
Student Faculty Interaction
Enriching Educational Experiences
Supportive Campus Environment
Level of Academic Challenge
Challenging intellectual and creative work is central to student learning and collegiate quality.
Institutions promote high levels of achievement by setting high expectations for student performance.
11 items include:
Preparing for class
Reading and writing
Using higher-order thinking skills
Institutional environment emphasizes academic work

Active and Collaborative Learning
Students learn more when they are more intensely involved in their education.
Collaborating with others prepares students to handle practical, real-world problems.
7 items include:
Asking questions in class
Making presentations
Working with other students on projects
Discussing ideas from readings or classes with others
Student Interactions with Faculty
Interacting with faculty show students first-hand how to think about and solve practical problems.
Teachers become role models and mentors for learning.
6 items include: Discussing assignments with a professor
Talking about career plans with faculty member or advisor
Getting prompt feedback on academic performance
Working with a faculty member on a research project

Enriching Educational Experiences
Students need learning opportunities that complement the goals of the academic program.
Provide opportunities to integrate and apply knowledge.
11 items include:
Experiencing diversity
Using technology
Participating in internships
Culminating senior experience

Supportive Campus Environment
Students perform better and are more satisfied at colleges that are committed to their success.
Does institution cultivate positive working and social relationships among different groups on campus?
6 items include:
Helping students achieve academically
Helping students cope with non-academic responsibilities
Quality of relationship between student and peers, faculty, and administrative personnel

Using Benchmark Scores
Used to stimulate conversation on campus:
How does your institution compare to your peers/nationally?
Have your scores changed from prior years?
Are scores aligned with your institutional mission?
Do scores make sense in light of recent institutional initiatives?
Do scores mirror impressions of your institution on campus and in your community?
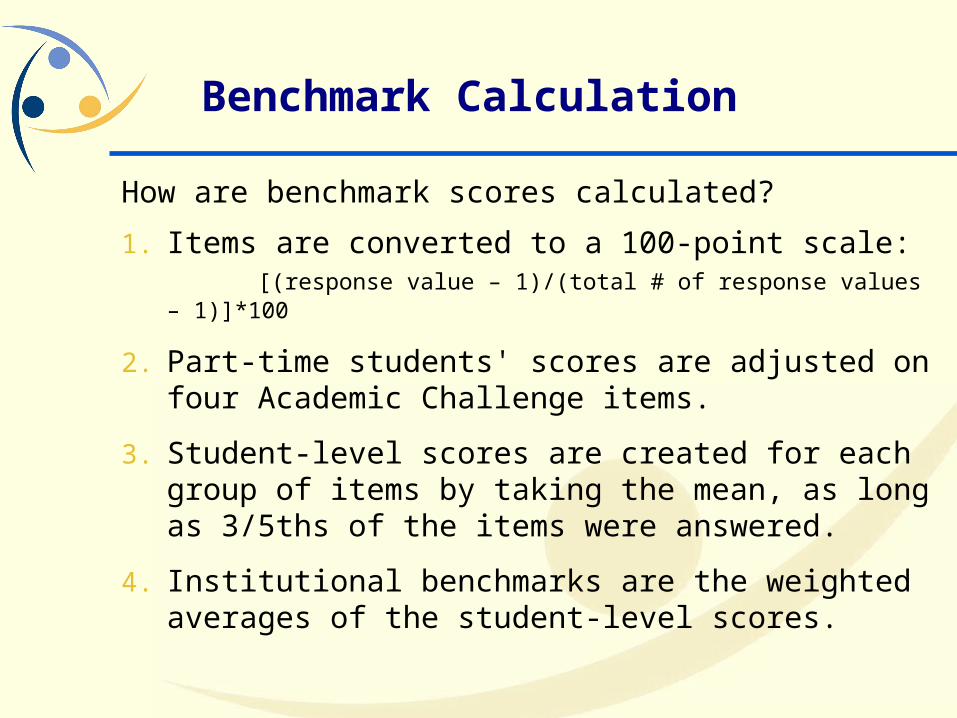
How are benchmark scores calculated?
1. Items are converted to a 100-point scale: [(response value – 1)/(total # of response values – 1)]*100
2. Part-time students' scores are adjusted on four Academic Challenge items.
3. Student-level scores are created for each group of items by taking the mean, as long as 3/5ths of the items were answered.
4. Institutional benchmarks are the weighted averages of the student-level scores.
Benchmark Calculation

Using Student-Level “Benchmarks”
Enables meaningful intra-institutional analysis
Higher power of analysis than institution-level
Institutions may use student-level “benchmarks” to: Investigate differences in key institutional
subgroups (Program, departments, colleges, etc.)
Investigate difference in key student sub-groups (gender, major, etc.)
Incorporate scale scores into predictive models of student outcomes
Investigate what groups are served better than others on your campus.

The NSSE Reports: New Benchmark Report Features
Student-level comparisons
Statistical comparisons
Decile tables and engagement index discontinued
Two new reference groups, top 50% and top 10%

The NSSE Reports:Benchmark Comparisons
Class Mean a
Sig bEffect
Size c Mean a
Sig bEffect
Size c Mean a
Sig bEffect
Size c
First-Year 51.6 50.4 * .14 51.8Senior 55.9 55.6 55.8
NSSE 2006 Benchmark Comparisons
Carnegie Peers
55.8
Mean a
NSSEville State
NSSEville State University
Level of Academic Challenge (LAC)
Selected Peers
Benchmark Comparisons
NSSE 2006
52.3
NSSEville State compared with:
First-Year
52.3 51.6 50.4 51.8
0
25
50
75
100
NSSEville State Selected Peers Carnegie Peers NSSE 2006
Senior
55.8 55.9 55.6 55.8
0
25
50
75
100
NSSEville State Selected Peers Carnegie Peers NSSE 2006
Analysis mirrors Means report

The NSSE Reports:Benchmark Comparisons
HLM used to identify top
50% and top 10% of
NSSE institutions
by class and benchmark
score
Active and Collaborative Learning (ACL)
40.8
51.345.8
54.650.7
58.6
0
25
50
75
100
First-Year Senior
Enriching Educational Experiences (EEE)
21.8
38.130.0
46.6
34.4
57.9
0
25
50
75
100
First-Year Senior
Top 50%
Top 10%
Legend
This display compares your students with those attending schools that scored in the top 50% and top 10% of all NSSE 2006 U.S. institutions on the benchmark.
NSSEville State

The NSSE Reports:Benchmark Comparisons
Detailed statistics provided, including
distributions of student scores
First-Year Students
N Mean SD SE 5 25 50 75 95 SE Sig.
LEVEL OF ACADEMIC CHALLENGE (LAC)
NSSEville State 285 52.3 13.8 .8 33 43 52 62 74
Selected Peers 5,854 51.6 13.1 .2 31 43 51 60 73 .7 .8 .375 .05
Carnegie Peers 6,600 50.4 13.5 .2 29 41 51 60 73 1.8 .8 .024 .14
NSSE 2006 120,444 51.8 13.4 .0 30 43 52 61 74 .5 .8 .509 .04
Top 50% 38,442 55.8 12.9 .1 34 47 56 65 77 -3.5 .8 .000 -.27
Top 10% 5,824 60.5 12.2 .2 40 52 60 69 80 -8.2 .8 .000 -.67
Percentiles Mean Diff.
Effectsize
NSSEville State University
NSSE 2006 Benchmark ComparisonsDetailed Statistics and Effect Sizes a
Mean Statistics Distribution StatisticsReference Group
Comparison Statistics
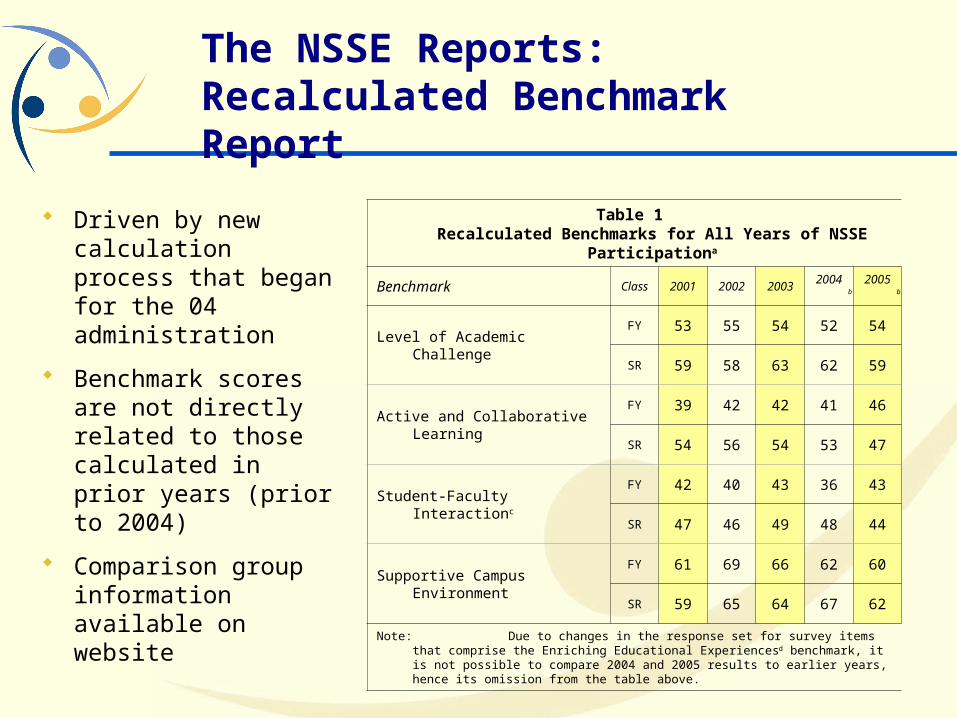
Driven by new calculation process that began for the 04 administration
Benchmark scores are not directly related to those calculated in prior years (prior to 2004)
Comparison group information available on website
The NSSE Reports:Recalculated Benchmark Report
Table 1 Recalculated Benchmarks for All Years of NSSE Participationa
Benchmark Class 2001 2002 2003 2004b 2005b
Level of Academic Challenge
FY 53 55 54 52 54
SR 59 58 63 62 59
Active and Collaborative Learning
FY 39 42 42 41 46
SR 54 56 54 53 47
Student-Faculty Interactionc
FY 42 40 43 36 43
SR 47 46 49 48 44
Supportive Campus Environment
FY 61 69 66 62 60
SR 59 65 64 67 62
Note: Due to changes in the response set for survey items that comprise the Enriching Educational Experiencesd benchmark, it is not possible to compare 2004 and 2005 results to earlier years, hence its omission from the table above.

Reading Your Reports
Ask general questions first
What confirms what you suspected?
What surprises you?
How accurate was your NSSE sample?
Look at trends as well as individual items
Reading Your Reports
Think about who your comparison groups are
Look at significance and effect size
Go back to data set – there is more variance within institutions than between
Do different types of students answer in different ways?

Sharing Your Results
Share results…
Provide summaries of results
Involve the groups from the beginning
Make meaning of the data; why are the numbers what they are?
Go back to other data sources
How might scores be improved

Next Steps:Beyond the Standard Reports
Doing NSSE is just the first step. What you do with it is what makes a difference
Use is institutional specific- what are the questions on your campus? Diversity? Adult learners? Community service initiatives?
Start thinking about follow-ups, next NSSE administration, what other questions do you want answered?

Next Steps: Beyond Standard Reports
Work with your data file
Examine subsets of your campus
Multi-year comparisons
Work with student-level benchmarks
What constitutes meaningful change?
Work with scales
NSSE special peer analysis

Working with Your Data File
Maintain student “crosswalk” files
Develop appropriate population files
Document how population files are created
Familiarize yourself with your data file
Merge data file with other sources of data on your campus and nationally student educational outcomes other student characteristics other campus surveys other national surveys

Working with Your Data File
NSSE DATA FILE
ID
CROSSWALK
EDUCATIONAL OUTCOMES• GPA• Retention/Graduation• Progress to Degree
INTERNAL SURVEYS• Grad Senior Survey• Campus Experience Survey• Dept-Specific Surveys
OTHER CHARACTERISTICS• Program Participation• Provisional Status• Specific Degree Tracks
EXTERNAL SURVEYS• YFCY• HERI• Etc.

2006 NSSE Dataset Details
What do you need to know to match your Institutional Report numbers?
“smpl05” (sampling type)
use 1 (base sample), 2 (standard oversample), 3 (requested oversample) values
“inelig”
exclude all ineligible respondents use those with values of 1 for “inelig”

Examining Subsets of Your Campus
Comparisons by Demographics Minority Students
Adult/Transfer Students
Athletes
By College or Department
Comparisons by Behaviors Community Service
Study Abroad
High Faculty Interaction
Oversampling
Moving to deeper understanding
Comparisons over time
Program implementation
First year students Seniors
Create your own benchmark scales
Technology
Spirituality/Ethics
Satisfaction
Other Surveys
FSSE: Faculty/Student Perceptions
BCSS: Incoming characteristics
Outside Surveys: YFYC, HERI
Internal Data
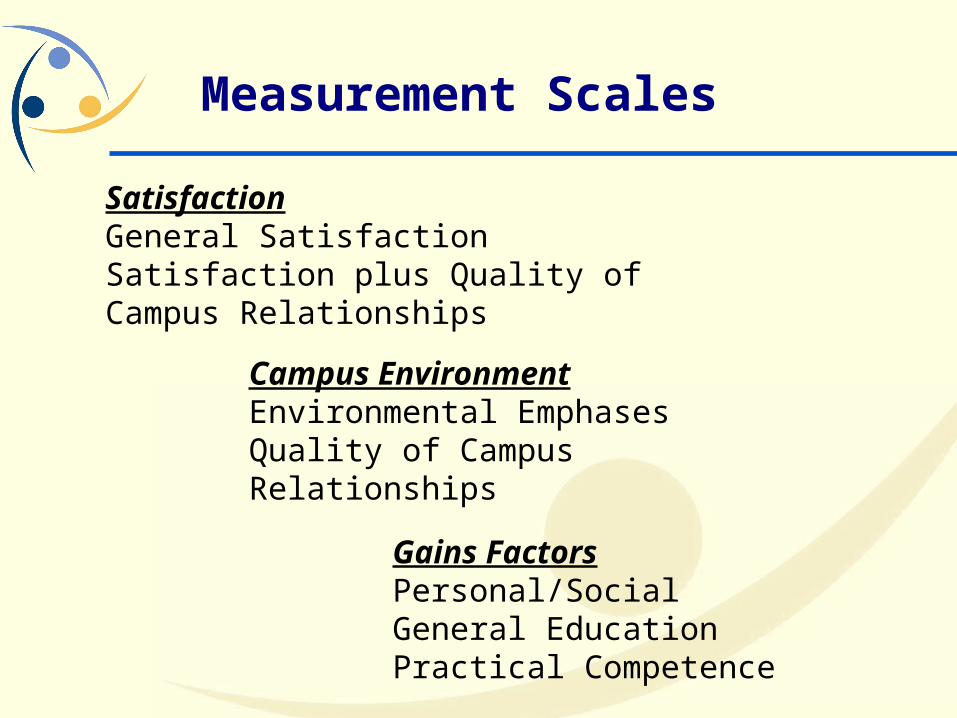
SatisfactionGeneral SatisfactionSatisfaction plus Quality of Campus Relationships
Campus EnvironmentEnvironmental EmphasesQuality of Campus Relationships
Gains FactorsPersonal/SocialGeneral EducationPractical Competence
Measurement Scales

Deep Learning Activities
Higher-Order Learning activities that require students to utilize higher levels of mental activity than those required for rote memorization (2b,c,d,e)
Integrative Learning activities that require integrating acquired knowledge, skills, and competencies into a meaningful whole (1d,e,i,p,t)
Reflective Learning activities that ask students to explore their experiences of learning to better understand how they learn (6d,e,f)

NSSE Scalets
Course Challenge
Writing
Active Learning
Collaborative Learning
Course Interaction
Out-of-Class Interaction
Gains (academic, personal, vocational)
Varied Experiences
Information Technology
Diversity
Support for Student Success
Interpersonal Environment

The NSSE Reports:Special Analysis
Allows wider scope of analysis than possible with just your data file
Customized based on individual needs
Can be used to target specific research questions
No limit to requests

Special Analyses Examples
Aspirational peer group of institutions
Alternate carnegie classification
Institutions with specific characteristics Private/Public Urbanicity Size
Comparison of particular major/group at your institution against similar students in national sample

Some final thoughts
Decide early
Get Buy-In
Include students
NSSE is only one instrument
What surprises you is probably more important than what you expect

NSSE Cautions
Only one source of information about student experience
Not everyone will jump on the student engagement bandwagon
Managing denial when confronted with less-than-desirable results
Data don’t speak for themselves
Link results to other data points

Future Developments
Executive Summary Report
Customized Report Engine
Common URL project
Archiving of reports and datasets online
Pocket Guide Report

Discussion and Comments
Rick ShoupResearch Analyst
Indiana University Center for Postsecondary Research1900 East 10th Street
Eigenmann Hall, Suite 419Bloomington, IN 47406
Ph: 812-856-5824
www.nsse.iub.edu