rice grain yield and nitrogen uptake and ammonia
TRANSCRIPT
University of Arkansas, Fayetteville University of Arkansas, Fayetteville
ScholarWorks@UARK ScholarWorks@UARK
Graduate Theses and Dissertations
5-2015
Rice Grain Yield and Nitrogen Uptake and Ammonia Volatilization Rice Grain Yield and Nitrogen Uptake and Ammonia Volatilization
from Urea as Affected by Urea Amendment and Simulated from Urea as Affected by Urea Amendment and Simulated
Rainfall Rainfall
Randy Dempsey University of Arkansas, Fayetteville
Follow this and additional works at: https://scholarworks.uark.edu/etd
Part of the Agronomy and Crop Sciences Commons, Plant Biology Commons, and the Soil Science
Commons
Citation Citation Dempsey, R. (2015). Rice Grain Yield and Nitrogen Uptake and Ammonia Volatilization from Urea as Affected by Urea Amendment and Simulated Rainfall. Graduate Theses and Dissertations Retrieved from https://scholarworks.uark.edu/etd/1043
This Thesis is brought to you for free and open access by ScholarWorks@UARK. It has been accepted for inclusion in Graduate Theses and Dissertations by an authorized administrator of ScholarWorks@UARK. For more information, please contact [email protected].
Rice Grain Yield and Nitrogen Uptake and Ammonia Volatilization from Urea as Affected by
Urea Amendment and Simulated Rainfall
Rice Grain Yield and Nitrogen Uptake and Ammonia Volatilization from Urea as Affected by
Urea Amendment and Simulated Rainfall
A thesis submitted in partial fulfillment
of the requirements for the degree of
Master of Science in Crop, Soil, and Environmental Sciences
by
Randy James Dempsey
Arkansas State University
Bachelor of Science in Agriculture, 2012
May 2015
University of Arkansas
This thesis is approved for recommendation to the Graduate Council.
Dr. Nathan A. Slaton
Thesis Director
Dr. Richard J. Norman
Committee Member
Dr. Trenton L. Roberts
Committee Member
Dr. Richard E. Mason
Committee Member
Dr. Edward E. Gbur Jr.
Committee Member
ABSTRACT
The effect of rainfall between urea application and flood establishment on N loss and
grain yield of rice (Oryza sativa L.) has not been studied. The first research objective was to
compare the effects of simulated rainfall amounts and N-(n-butyl) thiophosphoric triamide
(NBPT) urease inhibitor rate on NH3 volatilization and rice growth. Three field experiments were
conducted and NH3 volatilization was measured in two experiments for 11 days after urea
application (DAU) in semi-open chambers. Urea or NBPT-treated urea (NBPT-Urea) was
subjected to six simulated rainfall amounts (0-25 mm) applied 5 to 15 h after urea application
and flooded 7 to 12 DAU. Cumulative NH3 loss from Urea accounted for 8.6% of the applied N
with no simulated rainfall and decreased quadratically to 0.6% with 24 mm of simulated rainfall.
Cumulative NH3 loss from NBPT-Urea also decreased quadratically as simulated rainfall amount
increased but loss was 0.2-2.0% of the applied-N. Depending on the site, yields of rice fertilized
with Urea decreased linearly or nonlinearly as simulated rainfall increased with the greatest yield
produced by rice receiving no simulated rainfall. The yields of rice fertilized with NBPT-Urea
were not affected by simulated rainfall amount in two trials. In the third trial, the yields of rice
fertilized with NBPT-Urea decreased nonlinearly as simulated rainfall amount increased but
were 8.9 to 18.1% greater than the yields of Urea-fertilized rice. Rainfall following preflood urea
application appears to reduce NH3 loss but increase N loss via denitrification. Total-N loss was
reduced when urea was treated with NBPT. Our second research objective was to compare the
effects of simulated rainfall time and selected urea-N amendments on rice N uptake and grain
yield. Two field experiments were conducted to evaluate rice growth as affected by two NBPT
rates (0 and 0.89 g NBPT kg-1 urea), two nitrapyrin (NP) rates (0 and 572 g NP ha-1), and three
simulated rainfall timings [no simulated rainfall (NOSR), simulated rainfall before N (SRBN),
and simulated rainfall after N (SRAN)]. Yield was unaffected by simulated rainfall timing when
rice was fertilized with NBPT-treated urea (7904-8264 kg ha-1). When rice was fertilized with
untreated urea (no NBPT), grain yields were greater with NOSR than with SRAN or SRBN.
Within each simulated rainfall timing, rice yields were 6.9 to 21.3% greater when NBPT-treated
urea was applied. Nitrapyrin rate had no effect on grain yield in 2013, but, compared to untreated
urea (no NP), NP-treated urea decreased yield by 5.6% in 2014. Application of untreated urea to
moist soil or dry soil followed by rainfall are field environments that result in more substantial N
loss than urea applied to a dry soil that remains dry until the rice field is flooded. Use of NBPT-
treated urea minimized N loss and maximized grain yield in each simulated rainfall scenario
examined.
ACKNOWLEDGMENTS
I would like to express my gratitude to my major professor, Dr. Nathan Slaton, for not
only being an exceptional advisor but an even better friend. His patience, motivation, optimism,
enthusiasm, and immense knowledge have helped me throughout all aspects of my research and
writing of this thesis. The advice, corrections, opportunities, experience, and guidance he has
given me over the past few years will be extremely beneficial in my future career.
I would also like to thank my peer graduate students (Rasel Parvej and Matthew Fryer)
for all of their help and making my struggles more enjoyable. I would also like to thank Russ
DeLong, Colin Massey, and everyone in the Soil Testing Lab for their help in the collection
and/or analysis of soil and plant samples. To those serving on my committee, Dr. Richard
Norman, Dr. Trenton Roberts, Dr. Ed Gbur, and Dr. Esten Mason, thank you for your guidance
and knowledge throughout the pursuit of this degree. I cannot begin to say enough thanks to all
of the people at the Pine Tree Research Station that have helped me with my research and
enduring the heat and sun of an Arkansas summer. A very special thank you goes to my wife for
putting up with me and her encouragement to push through the tough times.

DEDICATION
I would like to dedicate this thesis to my wife, Mesha Dempsey, without her continuing
support, I would not have had the courage to persevere and accomplish my goals and the
willingness to move. I would like to also dedicate this to my advisor, Dr. Nathan Slaton, who
without his continuous enthusiasm, advice, and humor, I would have gone mad. I greatly
appreciate everyone’s support and help with making this thesis and my Master’s career possible.
TABLE OF CONTENTS
Chapter 1 ..........................................................................................................................................1
Literature Review
Introduction ..............................................................................................................2
Rice Production ........................................................................................................5
Wheat Production.....................................................................................................7
Nitrogen Dynamics ..................................................................................................9
Urease Inhibitors ....................................................................................................14
Nitrification Inhibitors ...........................................................................................16
Summary ............................................................................................................................19
References ..........................................................................................................................23
Chapter 2 ........................................................................................................................................29
Ammonia Volatilization and Rice Growth as Affected by Rainfall Amount and Urease
Inhibitor
Abstract ..............................................................................................................................30
Introduction ........................................................................................................................31
Materials and Methods .......................................................................................................33
Results and Discussion ......................................................................................................39
Conclusion .........................................................................................................................51
References ..........................................................................................................................52
Chapter 3 ........................................................................................................................................72
Rice Nitrogen Uptake and Grain Yield as Affected by Urea Amendment and Simulated
Rainfall Timing
Abstract ..............................................................................................................................73
Introduction ........................................................................................................................74

Materials and Methods .......................................................................................................77
Results ................................................................................................................................82
Discussion ..........................................................................................................................87
Conclusion .........................................................................................................................93
References ..........................................................................................................................94
Chapter 4 ......................................................................................................................................109
Conclusions
LIST OF TABLES
Table Page
CHAPTER 2
2.1 Rainfall frequencies and amounts for 15 May to 20 June 2005 through 2014 from the St.
Francis County, AR weather station (NCDC, 2015). Days between events were counted for every
day that received no rainfall. If rain occurred in two consecutive days, then the number of days
between rainfall events was 0 ........................................................................................................56
2.2 Selected soil property means of three simulated rainfall trials conducted on Calhoun silt
loam soils .......................................................................................................................................57
2.3 Selected rice crop management dates for three simulated rainfall trials ...........................58
2.4 Analysis of variance p-values for cumulative NH3 volatilization loss measured with semi-
open chambers as affected by N source (NS), trial (T), and their interactions across simulated
rainfall amount (RA) defined by the final model for 2013-A and 2014-C field experiments .......59
2.5 Regression coefficients for cumulative NH3 volatilization loss measured 2, 3, 5, 8, and 11
d after urea (DAU) application as affected by N source, trial, and simulated rainfall amount .....60
2.6 Analysis of variance p-values for urea-N, NH4-N, NO3-N, and recovered-N content
expressed as the percentage of total-N applied as affected by N source (NS) across simulated
rainfall amount (RA) defined by the final model for the 2014-C field experiment .......................61
2.7 Regression coefficients for the percent of fertilizer-N applied and recovered in the soil as
urea-N, NH4-N, NO3-N, or the sum of the three N forms measured 2 and 4 d after urea (DAU)
application as affected by N source and simulated rainfall amount ..............................................62
2.8 Analysis of variance p-values for aboveground-N uptake and rice grain yield as affected
by N source (NS) across simulated rainfall amount (RA) defined by the final model for three
field experiments ............................................................................................................................63
2.9 Regression coefficients for aboveground-N uptake and grain yield as affected by N
source and simulated rainfall amount for three field experiments .................................................64
CHAPTER 3
3.1 Selected chemical property means of two simulated rainfall trials conducted on Calhoun
silt loam soils in 2013 and 2014 ....................................................................................................98
3.2 Selected rice crop management dates for two simulated rainfall trials conducted in 2013
and 2014 .........................................................................................................................................99
3.3 Analysis of variance p-values for aboveground dry matter tissue N concentration (Tissue
N), aboveground-N uptake, and rice grain yield as affected by trial year (YR), N-(n-butyl)
thiophosphoric triamide (NBPT) rate, nitrapyrin rate (NP), simulated rainfall timing (SRT), and
their interactions for field experiments conducted in 2013 and 2014 ..........................................100
3.4 Mean aboveground dry matter at early heading as affected by the interaction of trial year,
N-(n-butyl) thiophosphoric triamide (NBPT) rate, and simulated rainfall timing, averaged across
nitrapyrin rates .............................................................................................................................101
3.5 Aboveground dry matter, tissue N concentration, and aboveground-N uptake at early
heading as affected by the interaction of trial year, N-(n-butyl) thiophosphoric triamide (NBPT)
rate, and nitrapyrin (NP) rate, averaged across simulated rainfall
timing ..........................................................................................................................................102
3.6 Mean aboveground N uptake as affected by the interaction of nitrapyrin (NP) rate and
simulated rainfall timing, averaged across trial years and N-(n-butyl) thiophosphoric triamide
rates 103
3.7 Rice grain yield means as affected by the interaction of N-(n-butyl) thiophosphoric
triamide (NBPT) rate and simulated rainfall timing, averaged across trial years and nitrapyrin
rate ..........................................................................................................................................104
3.8 Rice grain yield means as affected by the interaction of nitrapyrin (NP) rate and trial year,
averaged across simulated rainfall timings and N-(n-butyl) thiophosphoric triamide rates ........105
3.9 Grain yield, the predicted equivalent N-(n-butyl) thiophosphoric triamide (NBPT)-treated
urea-N rate, and estimated N-loss above NBPT-treated urea as affected by the NBPT rate and
simulated rainfall timing interaction for the 2014 trial ................................................................106
LIST OF FIGURES
Figure Page
CHAPTER 2
2.1 Fig. 2.1. Ambient relative humidity, critical relative humidity of urea, ambient
temperature, and rainfall events between N application and permanent flood establishment for
the three rice trials. The rainfall events marked on each figure, in order of occurrence, include 89
mm for 2013-A; 5 and 3 mm for 2013-B; and 9 mm for 2014-C with amounts for 2013-B and
2014-C listed in the order of each rainfall event ............................................................................65
2.2 Semi-open chamber air temperature, relative humidity, and critical relative humidity of
urea for two rice trials where NH3 volatilization was measured (2013-A and 2014-C) ................66
2.3 Cumulative NH3 volatilization loss from N-(n-buytl) thiophosphoric triamide-treated urea
(NBPT-Urea) and untreated urea (Urea) applied to two rice trials (2013-A and 2014-C) as
measured 2, 3, 5, 8, and 11 d after urea-N application. Regression coefficients are listed in Table
2.5 ............................................................................................................................................67
2.4 The percentage of applied fertilizer-N recovered as urea-N (A), NH4-N (B), NO3-N (C)
and recovered-N (D) in the top 5-cm of soil 2 d after urea application for rice fertilized with N-
(n-butyl) thiophosphoric triamide-treated urea (NBPT-Urea) and untreated urea (Urea).
Regression coefficients are listed in Table 2.7 ..............................................................................68
2.5 The percentage of applied fertilizer-N recovered as urea-N (A), NH4-N (B), NO3-N (C)
and recovered-N (D) in the top 5-cm of soil 4 d after urea application for rice fertilized with N-
(n-butyl) thiophosphoric triamide-treated urea (NBPT-Urea) and untreated urea (Urea).
Regression coefficients are listed in Table 2.7 ..............................................................................69
2.6 Mean aboveground-N uptake at early heading by rice fertilized with N-(n-buytl)
thiophosphoric triamide-treated urea (NBPT-Urea) and untreated urea (Urea) from three trials
(2013-A, 2013-B, and 2014-C). Regression coefficients listed in Table 2.9 .................................70
2.7 Mean grain yield of rice fertilized with N-(n-butyl) thiophosphoric triamide-treated urea
(NBPT-Urea) and untreated urea (Urea) from three trials (2013-A, 2013-B, and 2014-C).
Regression coefficients are listed in Table 2.9 ..............................................................................71
CHAPTER 3
3.1 Temperature, relative humidity, critical relative humidity, and rainfall events that
occurred between N fertilization and permanent flood establishment for field experiments
conducted in 2013 and 2014. The rainfall event in 2013 was 89 mm and rainfall event in 2014
was 9 mm .....................................................................................................................................107
3.2 Rice grain yield response to untreated urea- and N-(n-butyl) thiophosphoric triamide
(NBPT)-treated urea-N rate (34 – 170 kg N ha-1) for CL111 rice grown in 2014 with no
simulated rainfall .........................................................................................................................108

1
CHAPTER 1
Literature Review
2
LITERATURE REVIEW
INTRODUCTION
Rice (Oryza sativa L.) and wheat (Triticum aestivum L.) are important commodities
grown in the United States. In 2011, there were 1.09 million ha of rice and 22.02 million ha of
wheat planted in the USA (USDA-NASS, 2012a). The harvested hectares produced 8.39 million
Mg [185.01 million hundredweight (CWT)] of rice and 54.43 million Mg of wheat with a
combined value of nearly $17 billion ($2.6 and $14.3 billion for rice and wheat, respectively).
Rice and wheat are very important to the Arkansas economy. In 2011, Arkansas farmers
planted 484,380 ha of rice and 251,100 ha of soft red winter wheat which produced 3.54 million
Mg and 820,654 Mg (USDA-NASS, 2012a) of rice and wheat, respectively. Rice ($1.05 billion)
and winter wheat ($221.6 million) accounted for a combined production value of almost $1.3
billion in 2011. Winter wheat production and hectarage in Arkansas has dropped dramatically
since 2001. In 2001, Arkansas produced 13% of the winter wheat and planted 27% of the total
US winter wheat hectarage. In contrast, in 2011, Arkansas production accounted for only 2% of
the winter wheat produced and 1.5% of the total hectarage. Arkansas has been the top rice-
producing state in the United States since 1973 (Slaton, 2001). For example, in 2010, Arkansas
produced 47.6% of the rice and planted 49.3% of the total USA rice area (USDA-NASS, 2012a).
Crops need an adequate supply of nitrogen (N) to produce high yields, and for non-
legume crops, this is accomplished by applying N fertilizers. In 2010, Arkansas producers
applied 256,119 Mg of elemental N (Slater and Kirby, 2011) with 69% being granulated urea
[(NH2)2CO]. Urea is a popular N fertilizer because of its high N content (460 g N kg-1), it can
applied with ground- or air-based application equipment, and its low cost relative to other N
fertilizers. Non-legume crops require large amounts of N to maximize yield, so production costs
3
are connected with the fluctuation of N fertilizer prices. In Arkansas, a South Central State, urea
prices have increased significantly during the last decade. Urea cost producers an average of
$277 Mg-1 between 2001 and 2005 and increased to an average of $497 Mg-1 between 2007 and
2010 (USDA-NASS, 2012a). Urea prices have increased in the last five years and in March
2012, Arkansas producers purchased urea for $581 Mg-1 (USDA-NASS, 2012b). Crop
production budgets for 2012 show that N fertilizer costs accounted for 15% and 24% of the
variable costs associated with rice and wheat production, respectively (Dunn et al., 2011).
Nitrogen loss from agricultural systems is a major concern because it represents an
economic loss to the grower and can be harmful to the environment. If N is not managed
properly, it can be lost shortly after application through various pathways. Scharf (2009)
estimated that Missouri farmers lost $305 million in corn yield due to N loss in 2008. In rice
production, ammonia (NH3) volatilization and denitrification are the pathways of concern, while
NH3 volatilization, leaching, and runoff are the primary concerns in winter wheat. The
worldwide N-use efficiency of cereal crops is estimated to be around 33% (Raun and Johnson,
1999). Bashir et al. (1997) reported that winter wheat recovered 74% of the applied urea-N in
Arkansas. DeDatta et al. (1968) reported that flood-irrigated rice typically recovers only 30 to
40% of the N applied but can recover 60 to 65% of the applied N fertilizer with proper
application strategies. Wilson et al. (1989) found rice can recover 53 to 75% of the N applied,
depending on application time. DeDatta et al. (1991) suggested that NH3 volatilization from urea
accounts for 84 to 88% of the total N lost in rice and denitrification accounts for 6 to 10%.
The environment can be negatively affected by large amounts of N loss from N
fertilizers. Soil erosion and leaching can contribute to surface and ground water contamination,
while volatilization and denitrification can contribute to air quality issues and the Greenhouse

4
Effect (Follett and Delgado, 2002). Arkansas is located in the Mississippi River Basin and the
lost N can contribute to hypoxia and eutrophication problems in the Gulf of Mexico (Shumway
et al., 2012). Between 1980 and 1996, 1.42 million Mg yr-1 of N traveled to the Gulf of Mexico
(Goolsby et al., 2001).
The 4R Nutrient Stewardship program promotes the right fertilizer source, right rate,
right time, and right place (Bruulsema et al., 2012). Following these general rules in N
management is important to maximizing crop N use efficiency and reducing N losses.
Knowledge of the field conditions and fertilizer properties that facilitate N loss potential is
important to developing proper guidelines for farmers to implement the 4R program. Extensive
field research has been conducted to characterize crop response to N fertilization strategies
(Sandhu et al., 1981; Jokela and Randall, 1989; Norman et al., 1992; Wilson et al., 1994) and lab
research has been conducted to understand the N cycle as influenced by environmental
conditions (Ernest and Massey, 1960; Reynolds and Wolf, 1987; Clay et al., 1990; Norman et al.,
1993). Interest in N and phosphorous (P) losses via runoff and leaching has increased the use of
in-field rainfall simulation trials to quantify nutrient losses into the landscape (Hill et al., 1991;
Penn et al., 2004; Wienhold and Gilley, 2010). However, the peer-reviewed literature contains
little or no research describing in-field manipulation of soil moisture or simulated rainfall on
crop N fertilization strategies in agriculture crops, although there has been at least one study in a
loblolly pine (Pinus taeda L.) production system (Kissel et al., 2004) and one of a urea solution
applied to bare soil (McInnes et al., 1986). Studies that combine field-environment manipulation
with N fertilization strategies (e.g., 4 R’s) could help to develop more accurate guidelines on the
use of urease and nitrification inhibitors. The following literature review will examine research
concerning the production of rice and winter wheat in Arkansas; N dynamics, NH3 volatilization,
5
nitrification, and denitrification; and the use of urease and nitrification inhibitors in agriculture
systems.
RICE PRODUCTION IN ARKANSAS
Arkansas, Louisiana, Mississippi, Missouri, Texas, and California are the six states that
produce rice in the United States; Florida has a small number of rice hectares (Street and Bollich,
2003). Arkansas is the top rice-producing state in the US and has been since 1973 (Slaton, 2001).
Street and Bollich (2003) and Wilson et al. (2009) summarized the range of soil characteristics
and common production practices used to manage rice in the mid-South US and Arkansas,
respectively. In Arkansas, rice is produced using two different direct-seeding systems: dry
seeding and water seeding. Producers in most states use the dry-seeded method, except for
California and parts of Louisiana (Street and Bollich, 2003), but the direct-seeded, delayed-flood
method is used by 96% of the Arkansas producers (Wilson et al., 2009). Dry seed is distributed
across fields by use of a grain drill or broadcast via spreader truck, buggy or airplane and
incorporated with shallow tillage. When rice is established using a grain drill, the seed is placed
about 0.8-2.5 cm deep with 15-25 cm drill row spacing (Street and Bollich, 2003). For pure-line
varieties (non-hybrid), seeding rates are typically aimed at establishing stand densities of 108-
215 plants m-2 which equates to 78-112 kg ha-1 for drill-seeding or 101-134 kg ha-1 for broadcast-
seeding.
The life cycle of modern rice varieties and hybrids grown in Arkansas ranges from
110-150 d between emergence and maturity (Moldenhauer and Slaton, 2001). As a general rule,
rice is planted from the first of April to early June, fields are flooded at the end of May to early
June, and harvesting begins mid-August and continues through mid-September (Slaton, 2001).
The majority of rice grown in Arkansas and other mid-South states is flood-irrigated, but furrow-
6
irrigated rice is grown on some fields that have enough of a slope to make flood irrigation
difficult (Wilson et al., 2009). The soils used for rice production usually range from silt loam to
clayey texture and are poorly drained because they contain an impervious subsoil layer, such as a
fragipan or claypan. In order to reduce NH3 volatilization, a permanent flood needs to be
established within 3 days of N-fertilizer application (Griggs et al., 2007). Rice requires around
7,615 m3 ha-1 of irrigation water throughout the season (Scott et al., 1998).
The 4R Nutrient Stewardship program is represented in the production of rice. The
program promotes sound nutrient management by using the right fertilizer source, right rate,
right time, and right place (Bruulsema et al., 2012). The most popular N source in rice
production is urea because it has the greatest N analysis among granular N forms and converts to
ammonium (NH4+) making it well suited for its application to optimize yields. Ammonia
volatilization and denitrification are the N loss mechanisms of greatest concern in rice
production. Rice requires 123-202 kg N ha-1, 22-67 kg P2O5 ha-1, and 67-134 kg K2O ha-1 to
maximize yield, depending on the soil’s fertility level. Zinc (Zn) is also a very important nutrient
in rice and may need to be applied to Zn-deficient soils (Wilson et al., 2001). Nitrogen is usually
applied using one of three different strategies that are known as the single preflood, 2-way split
(preflood and midseason applications), and 3-way split (preflood and two midseason
applications). Depending on the N application method used, Norman et al. (2003) noted that 65-
100% of the total N needed is applied preflood at the 4- to 5-leaf stage onto a dry soil surface and
followed immediately by flooding to incorporate the urea-N and minimize N loss via NH3
volatilization. For pure-line varieties, the remaining N is applied into the flood about 4 to 5
weeks later when rice plants are at the panicle initiation to differentiation stage which is also
known as ‘midseason’ or beginning internode elongation. For hybrids, the midseason N
7
application is typically delayed for an additional four weeks until plants reach the late boot or
early heading stage.
WHEAT PRODUCTION IN ARKANSAS
Wheat in Arkansas is typically grown in a double-crop system in combination with
soybean (Johnson, 1999). A general timeline for wheat is: planted first of October to mid-
November, fertilized with N February to March, heading in April to May, and harvest late May
to mid-July (Milus et al., 1999). Johnson and Bacon (1999) noted that within Arkansas the
recommended planting times are different depending on the location in Arkansas. The optimal
wheat planting period in Arkansas is divided into three areas: North Arkansas (1 Oct. to 1 Nov.),
Central Arkansas (10 Oct. to 10 Nov.), and South Arkansas (15 Oct. to 20 Nov.). If wheat is
planted too early, wheat development may advance to rapidly making wheat spikes more
susceptible to the freezing temperatures at an earlier date. Wheat is normally drill-seeded, but
can be aerially-seeded when conditions are too wet for field equipment. The typical seeding rate
used to obtain an optimal plant density for drilled wheat is 280 seeds m-2 which equates to 78-
106 kg ha-1 depending on seed size. The seeding rate for the aerial seeding method ranges from
134-202 kg ha-1.
Phosphorous and K fertilizers are usually applied before planting, but N is typically
applied in the late winter during the tillering phase or when wheat is at Feekes growth stage 2 to
4 (Feekes, 1941; Johnson and Bacon, 1999). When soil fertility is below optimum, University of
Arkansas recommendations suggest applying 101-112 kg N ha-1, 56-112 kg P2O5 ha-1, and 67-
157 kg K2O ha-1, depending on the soils’ fertility level (N.A. Slaton, personal communication,
2012). Sulfur (S) deficiencies sometimes occur on well-drained soils and supplemental S may be
needed on these S-deficient soils. In Arkansas, N is usually applied in the late winter, but some
8
fall-applied N (34-45 kg N ha-1) is recommended when wheat is planted late (after 15 Oct. north
of Interstate-40 and after 1 Nov. south of Interstate-40) or when it follows rice in the crop
rotation, (Johnson and Bacon, 1999; N.A. Slaton, personal communication, 2012).
The nutrient management principles highlighted by the 4R Stewardship program are well
represented in the winter wheat N management recommendations. Johnson and Bacon (1999)
stated that N rates and timings depend on soil texture and drainage characteristics of the field.
Wheat planted in sandy and loamy soils need an average of 101 kg N ha-1, while silt-loam and
clay soils require 112 kg N ha-1. On well-drained sandy/loamy soils the entire recommended
amount of N can be applied in one application, around midtillering (mid-Feb. to mid-Mar.). On
poorly-drained silt-loam/clay soils the N fertilizer should be split into at least two applications:
early tillering (mid- to late-Feb.) and late tillering (mid- to late-Mar.). Urea is the most
commonly used N source in wheat due to cost and ease of application. However, ammonium
nitrate, ammonium phosphate, ammonium sulfate and urea ammonium nitrate (UAN) are also
good N sources (Johnson and Bacon, 1999), but are not used as much due to lack of availability
or cost. There is limited literature reviewing N-fertilizer recovery by winter wheat. Van Sanford
and MacKown (1986) studied 25 different soft red winter wheat genotypes and reported that N
uptake was between 42.5 and 68.3% with an average of 52.3%. Bashir et al. (1997) used urea-
15N in winter wheat and found N-use efficiency to be 74.4% in Arkansas.
The optimal conditions for applying N in winter wheat can be difficult to achieve due to
frequent precipitation (i.e. rainfall or snow) events that can occur. Urea effectiveness is
optimized when it is applied to a dry soil and incorporated immediately by adequate rainfall or
irrigation. Ammonia volatilization, runoff and/or leaching are the major N-loss mechanisms in
winter wheat. However, in general, the risk of NH3 volatilization loss from urea applied to the
9
soil surface in February or March is less than the risk for NH3-loss from urea applied to rice in
May or June because of the differences in temperature.
NITROGEN DYNAMICS
A large percentage of the N in the environment is in the atmosphere and in the form of
dinitrogen gas (N2). The N in the soil is important in supplying organisms with the nutrition for
growth and protein synthesis. Nitrogen fertilizers are needed to supply an adequate amount of N
to non-legume crops. Urea is the most common N source that is applied to rice and winter wheat
production systems in Arkansas. Soil and fertilizer N present in the soil may follow one of
several pathways in the N cycle such as, mineralization/immobilization, NH3 volatilization,
nitrification, denitrification, and/or plant uptake. To understand the fate of fertilizer-N, it is
important to examine the most common pathways that fertilizer-N can follow as influenced by
fertilizer properties/source, soil properties, the environment, and the interaction among these
factors.
A great deal of research has been performed to determine the most efficient agronomic N
fertilization practices including the comparison of crop performance with different N sources.
Organic-N forms must be mineralized before becoming plant available, whereas more soluble
inorganic fertilizers contain N forms that are immediately plant available (Harmel et al., 2004).
Nitrogen fertilizers are all produced with the Haber-Bosch process to industrially
manufacture NH3. Zmacynski (2003) explained that the Haber-Bosch process takes N2 gas and
combines it with H2 under extreme heat and pressure with a catalyst to form anhydrous ammonia
(NH3). The most widely used N fertilizer in Arkansas is urea which accounted for 69% of all N
fertilizers used in 2011 (Slater and Kirby, 2011). Urea is an organic compound formed in the
livers of mammals and found in excreta from the breakdown of metabolic wastes including
10
ammonia, amino acids, and other proteins. Urea [(NH2)2CO] fertilizer is a synthetically produced
granule from anhydrous ammonia (NH3) and carbon dioxide (CO2). Urea is preferred in many
agricultural systems, especially rice and winter wheat, because of its low production cost and
high N analysis (460 g N kg-1). Urea is generally less expensive to manufacture and transport
than other solid N fertilizers (Whitehead, 1995).
Soil moisture, temperature, pH, and microbial activity can greatly reduce the efficiency
of surface-applied urea. Urea is prone to substantial NH3 volatilization if it is not incorporated
quickly by either irrigation or rainfall. The amount of rainfall needed to incorporate urea is
reportedly between 0.64 and 1.27 cm depending on soil texture (Meyer et al., 1961; Overdahl et
al., 1991). Urea can lose around 30% of the N applied in 3 d after application and up to 90% by 7
d via NH3 volatilization if not incorporated (He et al., 1999). With the use of urease and
nitrification inhibitors, this N can be used more efficiently by the crop.
Nitrogen is an essential nutrient for the growth and development of plants. In agricultural
systems, N fertilizer is added to maximize yields in non-legume crops. Plant roots take up N in
the forms of NH4+ and NO3
-. Brady and Weil (1999) summarized the importance of N in plants
and noted that N is a major part of all amino acids, a component of nucleic acids (DNA and
RNA), used in chlorophyll, and essential for carbohydrate use. A healthy plant typically contains
2.5 to 4.0% N in the tissue. To assess total-N uptake of rice and winter wheat, plant samples are
taken at early heading and analyzed for N concentrations. The plants are sampled at this time
because this is the maximum N uptake the plant will have in rice and winter wheat systems in
Arkansas (Guindo et al., 1994; Bashir et al., 1997). Nitrogen is mobile in the plant and
deficiency symptoms first appear in the lower/older leaves. With N-deficiency, the plant will
11
have older leaves that are pale yellowish to green in color (chlorosis), stunted growth, spindly
stems, and reduced yields.
Organic N is not readily available to plants and must be mineralized into inorganic-N by
soil microorganisms (Brady and Weil, 1999). Organic residues that are added to the soil undergo
decomposition by microbes in the soil or the residues themselves (Cabrera et al., 2005).
Immobilization mostly occurs when soil microbes incorporate N into their biomass, where it will
remain until the organism dies. The mineralization/immobilization process is dependent on many
factors, especially the carbon (C) to N ratio of the residue. When the applied residue has a high
C:N ratio (>30:1), immobilization occurs; but if the amount of N is sufficient for the microbes to
break down the C, net mineralization will occur (<20:1). Other factors that play a role in
mineralization/immobilization include soil pH, salinity, and heavy metals in organic residue
(Cabrera et al., 2005).
Nitrogen fertilizers applied for agricultural production are responsible for a majority of
the gaseous N released into the atmosphere (Khalil et al., 2006) with global emissions of NH3
amounting to approximately 75 Tg of N annually (Aneja et al., 2001). The N loss from the
fertilizers applied to rice and winter wheat represents a financial loss to the grower and a threat
to the environment. Sharpe et al. (2004) stated that NH3 emissions and their role in acidification
are being realized as an important factor for eutrophication of terrestrial ecosystems. Ammonia
emissions can also be environmentally harmful as volatilized N is deposited across the landscape
in various N forms (Marshall et al., 1998).
Ammonia volatilization is one of the primary N-loss mechanisms and is affected by a
number of environmental factors including, but not limited to, soil pH, soil moisture,
temperature, and timing of application (Brady and Weil, 1999). Urea is the most common N-
12
fertilizer source sold in Arkansas (Slater and Kirby, 2011) and has a high potential of NH3
volatilization. He et al. (1999) reported that 21.4% of the applied urea-N was lost through NH3
volatilization during a 65 d incubation study. The NH3 volatilization process occurs when urea
reacts with the urease enzyme and is hydrolyzed to form NH3 gas. Hydrolysis of urea generally
requires 2 d to surpass the soil’s ability to buffer the NH3 formed by converting it into NH4+
(Beyrouty et al., 1988; Clay et al., 1990).
The potential for NH3 volatilization increases as soil pH increases. Ernst and Massey
(1960) reported the influence of soil pH on NH3 volatilization from urea during a 10 d incubation
study. They reported that 50% of urea-N was lost via NH3 volatilization for a soil pH of 7.5 and
10% for a soil pH of 5.5. Rice production areas in Arkansas have a high soil pH due to the
groundwater that is used for irrigation. The soils in Arkansas encompass a range of pH, but 59%
of the acreage in rice production has a pH >6.3 (DeLong et al., 2012). Ernst and Massey (1960)
reported the influence of temperature on NH3 volatilization with an 11 d incubation study with
temperatures of 7.2, 15.6, 23.9, and 32°C (45, 60, 75, and 90°F). They reported 24% of the
applied-N lost via NH3 volatilization at 32°C (90°F). Ernst and Massey (1960) also reported NH3
volatilization was directly related to soil moisture content, with 20% of the applied urea-N being
lost after 14 d in a soil with an initial soil moisture of 37.5% (gravimetric content). He et al.
(1999) incubated ammonium nitrate, ammonium sulfate, urea, and ammonium bicarbonate and
reported that more than 90% of the total-NH3 loss occurred within 14 d. He et al. (1999) also
reported that 82 to 91% of the urea-N applied was lost by 7 d, while 60 to 70% of the ammonium
bicarbonate-N was lost by 3 d.
Ammonia volatilization losses from urea applied to winter wheat are reported to range
from 9.5 to 13% of the applied-N (Griggs, 2004; Turner et al., 2010). Ammonia volatilization

13
from urea applied to a conventionally-tilled soil cropped to rice averaged 24% when applied 14 d
preflood (Griggs et al., 2005). If urea is applied 5 to 10 d preflood, 17 to 24% of the total
applied-N may be lost via NH3 volatilization on Arkansas soils (Norman et al., 2009). Zhao et al.
(2009) reported that NH3 volatilization from flooded rice paddies in China averaged 12% while
NH3 volatilization in wheat was <1%. DeDatta et al. (1991) reported that NH3 volatilization from
urea accounts for 84 to 88% of the total N-loss in rice. Thus, for efficient N use, a permanent
flood should to be established within 2 to 3 d of urea application to reduce NH3 volatilization
(Griggs et al., 2007; Norman et al., 2009).
Nitrogen is present in soils because of natural decomposition processes, atmospheric
deposition, and commercial fertilizer inputs. Nitrification is an aerobic process resulting in the
oxidation of NH4+ to nitrite (NO2
-) then to nitrate (NO3-). Nitrification itself is not a loss
mechanism, but can be a pathway for highly mobile NO3- to be leached or denitrified from soils
(Whitehead, 1995). Two types of bacteria are responsible for the nitrification process,
Nitrosomonas and Nirtobacter. Nitrosomonas plays a crucial role in the oxidation of NH4+ to
NO2- and Nitrobacter converts NO2
- to NO3-. Nitrite is toxic to plants at high concentrations in
the soil.
Denitrification is an anaerobic process that results in the gaseous loss of N from the
reduction of NO3- to nitrous oxide (N2O), N dioxide/nitric oxide (NOx), and N2. Dinitrogen gas is
quite inert and environmentally harmless, but the oxides of N are very reactive and can do
serious environmental damage (Brady and Weil, 1999). Principally, the reactive N gases can
contribute to the formation of nitric acid (HNO3, acid rain) and additions of greenhouse gases to
the atmosphere. Denitrification is most pronounced in anaerobic soil conditions such as in
14
flooded rice fields. DeDatta et al. (1991) suggested that denitrification accounts for 6-10% of the
total-N lost in rice.
Just as in NH3 volatilization, temperature and soil pH play an essential role in
nitrification/denitrification. In most soils, the optimum temperature range for nitrification is 25 to
30°C (77 to 86°F), with a maximum of 40°C (104°F) (Keeney and Bremner, 1967). Schmidt
(1982) noted that nitrifying organisms nearly cease activity when temperatures become too cold
(<5°C or 41°F). However, nitrification has been measured in frozen soils. Nyborg and Malhi
(1979) reported that 39% of fertilizer-N was nitrified within 6 mo after application of
incorporated urea. Soil pH also has an effect on nitrification with the rate of nitrification tending
to increase as soil pH increases (Kyveryga et al., 2004). Schmidt (1982) noted that nitrification in
soil is relatively slow at pH <5.5. Kyveryga et al. (2004) reported that fall-application of
anhydrous ammonia shows a significant relationship between soil pH and nitrification. They
reported that just before planting (mid-April) in the Corn Belt region on soils with a pH <6.0 and
>7.5, 39 and 89% of the applied anhydrous ammonia-N, respectively, had undergone
nitrification.
UREASE INHIBITORS
Urea is the most commonly used N-fertilizer in rice and winter wheat in Arkansas, but
UAN is also a frequently used N fertilizer for corn and cotton fertilization. Urea and urea-
containing fertilizers have a high potential of NH3 volatilization. Urea has a high potential of
volatilization and may lose up to 30% of its N within 3 d after application (He et al., 1999).
Norman et al. (2009) reported that if a rice field cannot be flooded within 2 d, a urease inhibitor
should be considered. There are many different types of urease inhibitors, such as N-
(diaminophosphinyl)-cyclohexylamine (DPCA), phenylphosphorodiamidate (PPD),
15
hydroquinone (HQ), and polymer-coatings; but the most commercially available inhibitor is N-
(n-butyl) thiophosphoric triamide (NBPT). The most common trade name for NBPT is Agrotain®
and most experiments use this as the urease inhibitor. A urease inhibitor is a substance which
inhibits hydrolytic action on urea by the urease enzyme and results in less urea-N lost by NH3
volatilization. Urease inhibitors can delay the hydrolysis process for 2 to 10 wk depending on
soil temperature and moisture (Jones et al., 2007). An inhibitors’ ability to delay the urea
hydrolysis process allows additional time for rainfall or irrigation to incorporate the urea into the
soil before NH3 volatilization begins.
The inhibitor NBPT has been extensively researched for its ability to reduce NH3
volatilization from surfaced-applied urea. Bremner and Chai (1989) researched different urease
inhibitors (PPD, DPCA, NBPT, and HQ) and found that NBPT reduced NH3 volatilization by the
greatest amount in 7 and 14 d soil incubations compared to non-treated urea. The NPBT reduced
NH3 loss from 44% to 1% after 7 d and 52% to 5% after 14 d. Bremner and Chai (1989) reported
that DPCA- and NBPT-treated urea reduced NH3 volatilization by similar amounts. Rawluk et al.
(2001) examined different rates of NBPT added to urea and found that a low rate of 0.05%
NBPT reduced NH3 volatilization. Rawluk et al. (2001) also noted that NBPT reduced total NH3
volatilization by 28 to 88% over the entire study.
The use of NBPT on urea in rice and winter wheat production has greatly helped to
reduce NH3 volatilization and increase grain yields. Qui-xiang et al. (1994) reported that after an
8 d experiment in flooded conditions, NBPT-treated urea (rate of 10% urea weight) reduced urea
hydrolysis by 25%. Slaton et al. (2011) reported that NBPT-treated urea produced a 3% yield
benefit compared to untreated urea across 24 N application times. Norman et al. (2009) noted
that when a permanent flood is established within 1 d after N application, the yields from rice

16
receiving urea, NBPT-treated urea, ammonium sulfate, and urea ammonium sulfate with varying
rates did not differ significantly. Norman et al. (2009) also noted that if >5 d is required to
establish a flood, NBPT-treated urea or ammonium sulfate should be used.
Agrotain® Ultra is a commonly used urease inhibitor and is a registered trade name for
NBPT of the Koch Fertilizer, L.L.C (Wichita, KS). The active ingredients in Agrotain® Ultra are
NBPT and N-methyl pyrroidon, containing 26 to 27% NBPT and 13 to 15% N-methyl
pyrrolidone by weight. Agrotain® Ultra is a green-liquid that is applied to the N source at the rate
of:
Urea 4.2 L Mg-1 (3 qt ton-1)
UAN 3.1 L Mg-1 (1.5 qt ton-1)
Agrotain® Ultra can be added to urea granules and urea-ammonium nitrate (UAN) solutions to
reduce NH3 volatilzation; it uniformly covers the urea granule to protect from urease breakdown
(Sutton, 2005).
NITRIFICATION INHIBITORS
Most of the rice production in Arkansas uses the direct-seeded, delayed-flood method
which consists of applying a 10 cm deep flood at the 5-leaf stage and maintaining the flood until
physiological maturity when it is drained to prepare the field for harvest. Nitrification is the
process of NH4+ being converted to NO3
- by bacteria. Nitrate is more susceptible to N loss than
NH4+ because NO3
- has much greater potential to be lost through leaching or denitrification in
anaerobic conditions. Thus, the use of a nitrification inhibitor may help reduce the amount of N
lost to the environment. A nitrification inhibitor reduces NO3- leaching and nitrous oxide
emissions by reducing the amount of NH4+ being nitrified into NO2
-. Nitrification inhibitors do
this by controlling the population of the Nitrosomonas bacteria (Sutton, 2005). A vast amount of
17
research has been conducted in the use of nitrification inhibitors and such inhibitors include, but
are not limited to: Nitrapyrin (2-chloro-6 (trichloromethyl) pyridine), dicyandiamide (DCD),
Terrazole (5-ethoxy-3 (trichloromethyl) 1,2,3 Thiadizole), and DMPP (3,4 dimethylpyrazole-
phosphate) [Ledgard, 2004].
The environment plays a significant role in determining the effectiveness of a nitrification
inhibitor. In general, an inhibitors’ effectiveness decreases as time, soil temperature, soil pH,
soil moisture, and organic matter content increase (Ledgard, 2004). Rao and Popham (1999)
looked at placement of urea (broadcast and band) with the nitrification inhibitors nitrapyrin and
DCD in winter wheat used as forage, and reported that banded DCD-treated urea accumulated
28% more N at final harvest compared to broadcast urea without an inhibitor. They also reported
that wheat N concentration for broadcast NBPT-treated urea was 70% higher than broadcast urea
without an inhibitor. Rao and Popham (1999) also concluded that DCD was effective in reducing
nitrification and increasing plant N uptake when conditions were favorable for leaching. Pasda et
al. (2001) conducted a field study using DMPP as a nitrification inhibitor and looked at its
effectiveness among many different agricultural and horticultural crops and reported that the
mean crop yield could be increased as much as 0.25 t ha-1 and 0.29 t ha-1 in winter wheat and
rice, respectively. Boeckx et al. (2005) looked at N2O and CH4 emissions with the use of a
nitrification inhibitor (DCD) and urease inhibitor (hydroquinone [HQ]) on urea in rice and wheat
cropping systems. In wheat, they found that N2O emissions decreased by 11.4, 22.3, and 25.1%
when urea was treated with DCD, HQ, and DCD+HQ, respectively. In rice, N2O emissions
decreased by 10.6, 47.0, and 62.3% when urea was treated with DCD, HQ, and DCD+HQ,
respectively. Carrasco et al. (2004) conducted laboratory and field experiments using the
nitrification inhibitor Terrazole with ammonium sulfate on rice soils. They found that with the
18
nitrification inhibitor, N loss was decreased by 60 and 52% under laboratory conditions and field
conditions, respectively. Wells et al. (1989) conducted an experiment on the effectiveness of
DCD in paddy rice production in Arkansas, California, Louisiana, Mississippi, and Texas. The
experiment looked at urea-N rate, N placement, application timing, and DCD rate (7 or 10% of
total N as DCD-N). This experiment found that the use of DCD delayed nitrification and, in
Arkansas, increased rice N-recovery (34 to 44%) compared to untreated urea (16 to 23%) when
the N was broadcast preplant and incorporated 10 cm into the soil.
Nitrapyrin is a commonly used nitrification inhibiting compound that can be used in rice
production. Wells (1977) found that in Arkansas, rice grain yield, plant height, and N uptake
were significantly increased from the use of nitrapyrin-treated urea (1.12 kg nitrapyrin ha-1)
compared to untreated urea. Wells (1977) also found that coating the urea or spraying the soil
surface followed by incorporation with tillage were equally effective in reducing nitrification.
Just as there is an environmental concern from N loss, inhibitors should be
environmentally inert. Wolt (2000) conducted an experiment examining the potential
environmental damage of using nitrapyrin with respect to N application timing, rate, and method
of application. The experiment showed that nitrapyrin degrades in various ways within the upper
soil profile and keeps it from contaminating ground and surface water.
A commercially produced source of nitrapyrin is Instinct™ (Dow AgroSciences,
Indianapolis, IN). Instinct™ contains 17.67% nitrapyrin as the active ingredient. Instinct™ is
marketed as a N stabilizer and works by slowing the conversion of NH4+ to NO2
-. Instinct™ is a
tan liquid amendment that can be applied to a range of N fertilizers. Instinct™ can be mixed with
liquid N sources, such as aqua ammonia, UAN, liquid manure, and ammonium sulfate. Instinct™
19
can also be added to herbicides and insecticides, but not all sources are compatible. When
Instinct™ is applied to a liquid source of N, the rates are as follows (Dow Agrosciences, 2009):
Spring Application
UAN (28 to 32% N) 2.6 L ha-1
Liquid manure 2.6 L ha-1
Fall Application
Liquid manure 2.6 to 5.1 L ha-1
Instinct™ also can be applied to granular ammonium and urea at a rate of 2.6 L ha-1. Guidelines
recommend that Instinct™ should be applied to no less than 45.4 kg of a granular N source.
Instinct™ can also be sprayed onto the soil surface prior to N application.
SUMMARY
The ability of crops to efficiently use N fertilizer is of great concern both economically
and environmentally. The primary N loss mechanisms of concern for rice production systems
used in the mid-South USA are ammonia volatilization and denitrification. For winter wheat
production, NH3 volatilization and leaching/runoff are the primary N loss pathways of concern.
Following the 4R Nutrient Stewardship rules in N management (Bruulsema et al., 2012) is
important for maximizing crop N use efficiency and reducing N losses. Knowledge of the field
conditions and fertilizer properties that facilitate N loss potential is important for developing best
management practices for farmers. Extensive field research has been conducted to characterize
crop response to N fertilization strategies (Sandhu et al., 1981; Jokela and Randall, 1989;
Norman et al., 1992; Wilson et al., 1994) and lab research has been conducted to understand the
N cycle as influenced by environmental conditions (Ernest and Massey, 1960; Reynolds and
Wolf, 1987; Clay et al., 1990; Norman et al., 1993). Interest in N and P losses via runoff and
20
leaching has increased the use of in-field rainfall simulation to quantify nutrient losses into the
landscape (Hill et al., 1991; Penn et al., 2004; Wienhold and Gilley, 2010). However, the peer-
reviewed literature contains minimal research describing in-field manipulation of soil moisture
or simulated rainfall on crop N fertilization strategies in agriculture crops. The ability to
accurately assess a urea amendment’s ability to reduce N losses under field conditions is of
interest.
Nitrogen management in rice and winter wheat production systems, as practiced in
Arkansas, were both discussed in the literature review, however, the thesis research will focus on
enhancing our knowledge of N management with urea-N amendments in the direct-seeded,
delayed flood rice production system. Research with winter wheat may be done as side projects,
performed in conjunction with other students or personnel, or to refine lab and field techniques
that will be used in rice research.
In order to enhance our knowledge of N management, we will conduct two research trials
with rice. The goal of these trials is to verify the efficacy of urea amendments under field
conditions and develop accurate guidelines for the use of the urea amendments under different
conditions. The specific research objectives for the two trials are to compare, 1) the effects of
rainfall amounts and urea amendments (urea and urea plus Agrotain [urease inhibitor]) on N
uptake, NH3 volatilization, and grain yield of flood-irrigated rice and 2) the effects of rainfall
timing (no water applied, water applied before N application, and water applied after N
application) and urea amendment (no N, untreated urea, urea plus Agrotain® [urease inhibitor],
urea plus Instinct™ [nitrification inhibitor], and urea plus Agrotain® and Instinct™) on N uptake
and grain yield of flood-irrigated rice.
The hypotheses for each objective are:

21
1. Compare effects of amendments and rainfall amounts
a. Grain yield and total N uptake of rice fertilized with NBPT-treated urea with any
amount of rainfall will be greater than untreated urea because the amendment can
delay urease from hydrolyzing urea.
b. Grain yield and total N uptake of rice fertilized with untreated urea will be
greatest (among urea treatments receiving simulated rainfall) when at least 1.3 cm
of simulated rainfall is used to thoroughly incorporate urea in to the soil.
c. Ammonia volatilization from untreated urea will be greater than that from rice
fertilized with NBPT-treated urea because NH3 loss is enhanced when urea
hydrolysis occurs rapidly and the urea is not effectively incorporated into the soil
(Meyer et al., 1961; Overdahl et al., 1991)
2. Compare the effects of amendments and rainfall timings
a. Grain yield and total N uptake of rice fertilized with urea+NBPT+nitrapyrin and
urea+NBPT will be the greatest when no water is applied because it presents the
optimal conditions for urea-N application.
b. Grain yield and total N uptake of rice fertilized with urea+NBPT+nitrapyrin and
urea+NBPT when water is applied before N application will be greater than that
fertilized with urea+nitrapyrin and untreated urea because NH3 loss is enhanced
when urea is applied to a moist soil (Ernst and Massey, 1960).
c. Grain yield and total N uptake of rice fertilized with urea+NBPT+nitrapyrin,
urea+NBPT, urea+nitrapyrin, and untreated urea will be equal when water is
applied after N application because the urea will be incorporated into the soil and
have less of a chance of being lost into the environment.

22
d. Compared to NBPT-treated urea, rice fertilized with nitrapyrin-treated urea and
untreated urea will yield lower due to the urease’s ability to quickly hydrolyze
urea allowing NH3 formation and loss into the environment.
23
REFERENCES
Aneja, V.P., B.P. Malik, Q. Tong, D. Kang, and J.H. Overton. 2001. Measurement and modeling
of ammonia emissions at waste treatment lagoon-atmospheric interface. Water, Air, and Soil
Pollution: Focus. 1(5-6):177-188.
Bashir, R., R.J. Norman, R.K. Bacon, and B.R. Wells. 1997. Accumulation and redistribution of
fertilizer nitrogen-15 in soft red winter wheat. Soil Sci. Am. J. 61:1407-1412.
Beyrouty, C.A., L.E. Sommers, and D.W. Nelson. 1988. Ammonia volatilization from surface-
applied urea as affected by several phosphoroamide compunds. Soil Sci. Soc. Am. J.
52:1173-1178.
Boeckx, P., X. Xu, and O. Van Cleemput. 2005. Mitigation of N2O and CH4 from rice and wheat
cropping systems using dicyandiamide and hydroquinone. Nutrient Cycling in
Agroecosystems 72:41-49.
Brady, N.C. and R.R. Weil. 1999. The nature and property of soils 12th ed. Prentice Hall, Inc.
Upper Saddle Hall, NJ.
Bremner, J.M. and H.S. Chai. 1989. Effects of phosphoroamides on ammonia volatilization and
nitrite accumulation in soils treated with urea. Biol. Fertil. Soils 8:227-230.
Bruulsema, T.W., P. E. Fixen, and G.D. Sulewski, editors. 2012. 4R plant nutrition: a manual for
improving the management of plant nutrition. International Plant Nutrition Institute,
Norcross, GA.
Cabrera, M.L., D.E. Kissel, and M.F. Vigil. 2005. Nitrogen mineralization from organic
residues: research opportunities. J. Environ. Qual. 34:75-79.
Carrasco, D., E. Fernández-Valiente, Y. Ariosa, and A. Quesada. 2004. Measurement of coupled
nitrification-denitrification in paddy fields affected by Terrazole, a nitrification inhibitor.
Biol. Fertil. Soils 39:186-192.
Clay, D.E., G.L. Malzer, and J.L. Anderson. 1990. Ammonia volatilization from urea as
influenced by soil temperature, soil water content, and nitrification and hydrolysis inhibitors.
Soil Sci. Soc. Am. J. 54:263-266.
DeDatta, S.K., C.P. Magnaye, and J.C. Moomaw. 1968. Efficiency of fertilizer nitrogen (15N-
labelled) for flooded rice. In: 9th International Congress of Soil Science Transactions, Vol.
IV. American Elsevier Publishing Company, Inc., New York, NY. p. 67-76.
DeDatta, S.K., R.J. Buresh, M.I. Samson, W.N. Obcemea, and J.G. Real. 1991. Direct
measurement of ammonia and denitification fluxes from urea applied to rice. Soil Sci. Soc.
Am. J. 55:543-548.
DeLong, R.E., S.D. Carroll, N.A. Slaton, M. Mozaffari, and C. Herron. 2012. Soil test and
fertilizer sales data: summary of the 2010 growing season. In: N.A. Slaton, editor. Wayne E.
Sabbe Arkansas Soil Fertility Studies 2011. Series 599. Univ. of Arkansas, Fayetteville. p. 7-
15.
24
Dunn, C., A. Flanders, S. Stiles, C. Grimes, S. Kelley, K. Lawson, R. Mazzanti, B. McClelland,
and S. Runsick. 2011. 2012 crop enterprise budgets for Arkansas field crops planted in 2012.
Publication AG-1272. Univ. of Arkansas Coop. Ext. Ser., Little Rock, AR.
Ernst, J.W. and H.F. Massey. 1960. The effects of several factors on volatilization of ammonia
formed from urea in the soil. Soil Sci. Soc. Am. J. 24:87-90.
Feekes, W. 1941. De tarwe en haar milieu (Wheat and its environments). In: Verslag van de
technische tarwe commissie. Groningen, The Netherlands. p. 560-561.
Follet, R.F. and J.A. Delgado. 2002. Nitrogen fate and transport in agricultural systems. J. Soil
and Water Cons. 57:402-408.
Goolsby, D.A., W.A. Battaglin, B.T. Aulenbach, and R.P. Hooper. 2001. Nitrogen input to the
Gulf of Mexico. J. Environ. Qual. 30:329-336.
Griggs, B.R, R.J. Norman, C.E. Wilson, N.A. Slaton. 2005. Ammonia volatilization and grain
yield by delayed flood rice utilizing conventional and conservation tillage practices. In:
Norman, R.J., J.F. Meullenet, and K.A. Moldenhauer, editors. B.R. Wells Rice Research
Studies 2004. Series 529. Univ. of Arkansas, Fayetteville. p. 282-289.
Griggs, B.R. 2004. Ammonia volatilization and nitrogen uptake for winter wheat (Triticum
aestivum L.) and rice (Oryza sativa L.) in Arkansas. Ph.D. diss., Publ. No. AAT 3149229.
Univ. of Arkansas, Fayetteville.
Griggs, B.R., R.J. Norman, C.E. Wilson, and N.A. Slaton. 2007. Ammonia volatilization and
nitrogen uptake for conventional and conservation tilled dry-seeded, delayed-flood rice. Soil
Sci. Soc. Am. J. 71:745-751.
Guindo, D., B.R. Wells, and R.J. Norman, 1994. Cultivar and nitrogen rate influence on nitrogen
uptake and portioning in rice. Soil Sci. Soc. Am. J. 58:840-845.
Harmel, R.D., H.A. Torbert, B.E. Haggard, R. Haney, and M. Dozier. 2004. Water quality
impacts of converting to a poultry litter fertilization strategy. J. Environ. Qual. 33:2229-2242.
He, Z.L., A.K. Alva, D.V. Calvert, and D.J. Banks. 1999. Ammonia volatilization from different
fertilizer sources and effects of temperature and soil pH. Soil Science 164:750-758.
Hill, R.L., C.M. Gross, and J.S. Angle. 1991. Rainfall simulation for evaluating agrochemical
surface loss. Am. Chem. Soc. 465:367-382.
Johnson, W.F. 1999. Introduction. In: Arkansas Wheat Production and Management. Publication
MP 404. Univ. of Arkansas Coop. Ext. Ser., Little Rock, AR. p. 1-2.
Johnson, W.F. and R.K. Bacon. 1999. Cultural practices for wheat production. In: Arkansas
Wheat Production and Management. Publication MP 404. Univ. of Arkansas Coop. Ext. Ser.,
Little Rock, AR. p. 7-12.
Jokela, W.E. and G.W. Randall. 1989. Corn yield and residual soil nitrate as affected by time and
rate of nitrogen application. Agron. J. 81:720-726.
25
Jones, C.A., R.T. Koenig, J.W. Ellsworth, B.D. Brown, and G.D. Jackson. 2007. Management of
urea fertilizer to minimize volatilization. Publication EB 173. Montana State University
Extension, Bozeman, MT
Keeney, D.R. and J.M. Bremner. 1967. Determination and isotope-ratio analysis of different
forms of nitrogen in soils: 6. Mineralizable nitrogen. Soil Sci. Soc. Am. Proc. 31:34-39.
Khalil, M.I., U. Schmidhalter, and R. Gutser. 2006. N2O, NH3, and NOx emissions as a function
of urea granule size and soil type under aerobic conditions. Water, Air, and Soil Pollution
175:127-148.
Kissel, D.E., M.L. Cabrera, N. Vaio, J.R. Craig, J.A. Rema, and L.A. Morris. 2004. Rainfall
timing and ammonia loss from urea in a Loblolly Pine plantation. Soil Sci. Soc. Am. J.
68:1744-1750.
Kyveryga, P.M., A.M. Blackmer, J.W. Ellsworth, and R. Isla. 2004. Soil pH effects on
nitrification on fall-applied anhydrous ammonia. Soil Sci. Soc. Am. J. 68:545-551.
Ledgard, S., editor. 2004. Nitrification and urease inhibitors: a review of the national and
international literature on their effects on nitrate leaching, greenhouse gas emissions, and
ammonia volatilisation from temperate legume-based pastoral systems. Environment
Waikato Technical Report 2004/22.
Marshall, S.B, C.W. Wood, L.C. Braun, M.L. Cabrera, M.D. Mullen, and E.A. Guertal. 1998.
Ammonia volatilization from tall fescue pastures fertilized with broiler litter. J. Environ.
Qual. 27:1125-1129.
McInnes, K.J., R.B. Ferguson, D.E. Kissel, and E.T. Kanemasu. 1986. Field measurements of
ammonia loss from surface applications of urea solution to bare soil. Agron. J. 78:192-196.
Meyer, R.D, R.A. Olson, and H.F. Rhoades. 1961. Ammonia losses from fertilized Nebraska
soils. Agron. J. 53:241-244.
Milus, G., R. Cartwright, T.L. Kirkpatrick, and C. Coker. 1999. Important wheat diseases in
Arkansas and their control. In: Arkansas Wheat Production and Management. Publication
MP 404. Univ. of Arkansas Coop. Ext. Ser., Little Rock, AR. p. 25-38.
Moldenhauer, K. and N.A. Slaton. 2001. Rice growth and development. In: N.A. Slaton, editor.
Rice Production Handbook. Publication MP192. University of Arkansas Coop. Ext. Ser.,
Little Rock, AR. p. 7-14.
Norman, R.J., C.E. Wilson Jr., and N.A. Slaton. 2003. Soil fertilization and mineral nutrition in
US mechanized rice culture. In: Smith, C.W. and R.H. Dilday, editors. Rice: Origin, History,
Technology, and Production. John Wiley & Sons, Inc., Hoboken, NJ. p. 331-412.
Norman, R.J., C.E. Wilson, N.A. Slaton, B.R. Griggs, J.T. Bushong, and E.E. Gbur. 2009.
Nitrogen fertilizer sources and timing before flooding dry-seeded, delayed-flood rice. Soil
Sci. Soc. Am. J. 73:2184-2190.
26
Norman, R.J., D.C. Wolf, B.R. Wells, R.S. Helms, and N.A. Slaton. 1993. Influence of
application time and soil moisture conditions on yield and recovery of fertilizer 15N in dry-
seeded rice. In: W.E. Sabbe, editor. Arkansas Soil Fertility Studies 1992. Series 425. Univ. of
Arkansas Fayetteville. p. 7-10.
Norman, R.J., R.S. Helms, and B.R. Wells. 1992. Influence of delaying flood and preflood
nitrogen application on dry-seeded rice. Fert. Res. 32:55-59.
Nyborg, M. and S.S. Malhi. 1979. Increasing the efficiency of fall-applied urea fertilizer by
placing in big pellets or in nests. Plant Soil 52:461-465.
Pasda, G., R. Hähndel, W. Zerulla. 2001. Effect of fertilizers with the new nitrification inhibitor
DMPP (3,4-dimethylpyrazole phosphate) on yield and quality of agricultural and
horticultural crops. Biol. Fertil. Soils 34:85-97.
Penn, C.J., G.L. Mullins, L.W. Zelazny, J.G. Warren, and J.M. McGrath. 2004. Surface runoff
losses of phosphorus from Virginia soils amended with turkey manure using phytase and
high available phosphorous corn diets. J. Environ. Qual. 33:1431-1439.
Qui-xiang, L., J.R. Freney, D.G. Keerthisinghe, and M.B. Peoples. 1994. Inhibition of urease
activity in flooded soils by phenylphosphorodiamidate and N-(n-butyl)
thiophosphorictriamide. Soil Biol. Biochem. 26:1059-1065.
Rao, S.C. and T.W. Popham. 1999. Urea placement and nitrification inhibitor effects on growth
and nitrogen accumulation by no-till winter wheat. Crop Sci. 39:1115-1119.
Raun, W.R. and G.V. Johnson. 1999. Improving nitrogen use efficiency for cereal production.
Agron. J. 91:357-363.
Rawluk, C.D., C.A. Grant, and G.J. Racz. 2001. Ammonia volatilization from soils fertilized
with urea and varying of urease inhibitor NBPT. Can. J. Soil Sci. 81:239-246.
Reynolds, C.M. and D.C. Wolf. 1987. Effect of soil moisture and air relative humidity on
ammonia volatilization from surfaced-applied urea. Soil Sci. 143:144-152.
Sandhu, H.S., S.S. Brar, and G.S. Gill. 1981. Improving nitrogen use efficiency in wheat. Indian
Farming 31:61-63,79.
Scharf, P. 2009. Nitrogen loss in 2008. University of Missouri: Integrated Pest and Crop
Management 19:2-4.
Schmidt, E.L. 1982. Nitrification in soil. In: F.J. Stevenson, editor. Nitrogen in agricultural soils.
Agron. Monogr. No. 22. ASA-CSA-SSSA, Madison, WI. p. 253-288.
Scott, H.D., J.A. Ferguson, L. Hanson, T. Fugitt, and E. Smith. 1998. Agricultural water
management in the Mississippi delta region of Arkansas. Res. Bulletin 959. Arkansas Agric.
Exp. Stn., Fayetteville.
27
Sharpe, R.R., H.H. Schomberg, L.A. Harper, D.M. Endale, M.B. Jenkins, and A.J.
Franzluebbers. 2004. Ammonia volatilization from surface-applied poultry litter under
conservation tillage management practices. J. Environ. Qual. 33:1183-1188.
Shumway, C., J.A. Delgado, T. Bunch, L. Hansen, and M. Ribaudo. 2012. Best nitrogen
management practices can reduce the potential flux of nitrogen out of the Arkansas Delta.
Soil Sci. 177:198-209.
Slater, J.V. and B.J. Kirby, editors. 2011. Commercial fertilizers 2010. Association of American
Plant Food Control Officials, Inc. and The Fertilizer Institute, Columbia, MO.
Slaton, N.A, R.J. Norman, and J. Kelley. 2011. Winter wheat yield response to a urea amended
with a urease inhibitor and fertilization time [Online]. Crop Management doi: 10.1094/CM-
2011-0126-01-RS.
Slaton, N.A. 2001. Introduction. In: N.A. Slaton, editor. Rice Production Handbook. Publication
MP192. Univ. of Arkansas Coop. Ext. Ser., Little Rock, AR. p. 1-14.
Slaton, N.A. and R. Cartwright. 2001. Rice stand establishment. In: N.A. Slaton, editor. Rice
Production Handbook. Publication MP192. Univ. of Arkansas Coop. Ext. Ser., Little Rock,
AR. p. 21-28.
Smith, C.W. 1995. Wheat (Triticum spp.). In: Crop Production: Evolution, History, and
Technology. John Wiley & Sons, Inc., New York, NY. p. 57-127.
Street, J.E. and P.K. Bollich. 2003. Rice Production. In: C.W. Smith and R.H. Dilday, editors.
Rice: Origin, History, Technology, and Production. John Wiley & Sons, Inc., Hoboken, NJ.
p. 271-296.
Sutton, A. 2005. Urease and nitrification inhibitors [Online]. Available at
http://www.firt.org/sites/default/files/Sutton_Inhibitors%26Stabilizers_presentation.pdf
(accessed 22 June 2012).
Turner, D.A., R.B. Edis, D. Chen, J.R. Freney, O.Y. Denmead, and R. Christie. 2010.
Determination and mitigation of ammonia loss from urea applied to winter wheat with N-(n-
butyl) thiophosphoric triamide. Agric. Ecosyst. Environ. 135:261-266
USDA-National Agricultural Statistics Service. 2012a. Crop production 2011 summary [Online].
USDA, Washington, D.C. Available at
http://usda01.library.cornell.edu/usda/current/CropProdSu/CropProdSu-01-12-2012.pdf
(accessed 16 July 2012).
USDA-National Agricultural Statistics Service. 2012b. Agricultural prices [Online]. USDA,
Washington, D.C. Available at
http://www.nass.usda.gov/Publications/Todays_Reports/reports/agpr0412.pdf (accessed 16
July 2012).
Van Sanford, D.A. and C.T. MacKown. 1986. Variation in nitrogen use efficiency among soft
red winter wheat genotypes. Theor. Appl. Genet. 72:158-163
28
Wells, B.R. 1977. Nitrapyrin (2-chloro-6-(trichloromethyl)-pyridine) as a nitrification inhibitor
for paddy rice. Down to Earth 32:28-32.
Wells, B.R., P.K. Bollich, W. Ebelhar, D.S. Mikkelsen, R.J. Norman, D.M. Brandon, R.S.
Helms, F.T. Turner, and M.P. Westcott. 1989. Dicyandiamide (DCD) as a nitrification
inhibitor for rice culture in the United States. Commun. In Soil Sci. Plant Anal. 20:2023-
2047.
Whitehead, D.C., editor. 1995. Grassland nitrogen. CAB Intl., Guildford, UK.
Wienhold, B.J. and J.E. Gilley. 2010. Cob removal effect on sediment and runoff nutrient loss
from a silt loam soil. Agron. J. 102:1448-1452.
Wilson, C.E., B.R. Wells, and R.J. Norman. 1994. Fertilizer nitrogen uptake by rice from urea-
ammonium nitrate solution vs. granular urea. Soil Sci. Soc. Am. J. 58:1825-1828.
Wilson, C.E., N.A. Slaton, R. Norman, and D. Miller. 2001. Efficient use of fertilizer. In: N.A.
Slaton, editor. Rice Production Handbook. Publication MP192. Univ. of Arkansas Coop. Ext.
Ser., Little Rock, AR. p. 51-74.
Wilson, C.E., R.J. Norman, and B.R. Wells. 1989. Seasonal uptake patterns of fertilizer nitrogen
applied in split applications to rice. Soil Sci. Soc. Am. J. 53:1884-1887.
Wilson, C.E., S.K. Runsick, and R. Mazzanti. 2009. Trends in Arkansas rice production. In:
Norman, R.J., J.F. Meullenet, and K.A. Moldenhauer, editors. B.R. Wells Rice Research
Studies 2008. Series. 571. Univ. of Arkansas Fayetteville. p. 13-23.
Wolt, J. 2000. Nitrapyrin behavior in soils and environmental considerations. J. Environ. Qual.
29:367-379.
Zhao, X., Y. Xie, Z. Xiong, X. Yan, G. Xing, and Z. Zhu. 2009. Nitrogen fate and environmental
consequence in paddy soil under rice-wheat rotation in the Taihu Lake Region, China. Plant
Soil 319:225-234
Zmacynski, R. 2003. The effect of the Haber process on fertilizers [Online]. Available at
http://www.princeton.edu/~hos/mike/texts/readmach/zmaczynski.htm (accessed 3 July 2012).

29
CHAPTER 2
Ammonia Volatilization and Rice Growth as Affected by
Simulated Rainfall Amount and Urease Inhibitor
30
ABSTRACT
The effect of rainfall between urea application and flood establishment on N loss and grain
yield of rice (Oryza sativa L.) has not been studied. We compared the effects of simulated
rainfall amount and N-(n-butyl) thiophosphoric triamide (NBPT) urease inhibitor rate on NH3
volatilization and rice growth. Three field experiments were conducted and NH3 volatilization
was measured in two experiments for 11 days after urea application (DAU) in semi-open
chambers. Urea or NBPT-treated urea (NBPT-Urea) was subjected to six simulated rainfall
amounts (0-25 mm) applied 5 to 15 h after urea application and flooded 7 to 12 DAU.
Cumulative NH3 loss from Urea accounted for 8.6% of the applied N with no simulated rainfall
and decreased quadratically to 0.6% with 24 mm of simulated rainfall. Cumulative NH3 loss
from NBPT-Urea also decreased quadratically as simulated rainfall amount increased but loss
was 0.2-2.0% of the applied-N. Depending on the site, yields of rice fertilized with Urea
decreased linearly or nonlinearly as simulated rainfall increased with the greatest yield produced
by rice receiving no simulated rainfall. The yields of rice fertilized with NBPT-Urea were not
affected by simulated rainfall amount in two trials. In the third trial, the yields of rice fertilized
with NBPT-Urea decreased nonlinearly as simulated rainfall amount increased but were 8.9 to
18.1% greater than the yields of Urea-fertilized rice. Rainfall following preflood urea application
appears to reduce NH3 loss but increase N loss via denitrification. Total-N loss was reduced
when urea was treated with NBPT.

31
INTRODUCTION
Rice can be one of the most efficient or inefficient crops in regards to fertilizer-N uptake
efficiency (FNUE). The literature shows a large disparity in the FNUE by rice, which largely
depends on how the N is applied and managed. DeDatta (1968) reported that the FNUE of rice
can be as low as 27% for transplanted rice. In contrast, Norman et al. (2003) summarized that
rice grown with the direct-seeded, delayed-flood production method used in the mid-South USA
could routinely achieve FNUE of 60 to 75% when urea was applied to a dry soil surface and
flooded within 3 to 5 d. Immobilization accounts for 10 to 30% of the preflood-applied fertilizer-
N (Wilson et al., 1989; 1990; Norman et al., 1989) suggesting 5 to 30% of the applied fertilizer-
N is lost in the direct-seeded, delayed-flood production system. The use of NBPT-containing
urease inhibitors has further enhanced FNUE by delaying the onset and reducing the magnitude
of NH3 volatilization (Norman et al., 2009).
The primary concern of urea-N management is minimizing N loss via NH3 volatilization,
the primary N-loss mechanism in flooded-rice production systems, which accounts for 84 to 88%
of the total-N lost (De Datta et al., 1991). Prior research with direct-seeded, delayed-flood rice
has reported NH3 volatilization losses from 17 to 30% of the total applied-N (Griggs et al., 2007;
Norman et al., 2009). The magnitude of NH3 volatilization loss is influenced by many soil and
environmental factors including soil pH, soil moisture, texture, temperature, relative humidity
(RH), and timing of application (Ernst and Massey, 1960; Fenn and Hossner, 1985).
In the direct-seeded, delayed-flood rice management system used in the mid-South USA,
urea-N loss from NH3 volatilization is managed by applying NBPT-treated urea to a dry soil
surface when rice reaches the four- to five-leaf stage and the field is flooded as rapidly as
possible to incorporate the urea (Norman et al., 2013). In Arkansas, 10 d or more may be
32
required to completely establish the permanent flood on a field, during which time rainfall events
may occur. Examination of ten years of annual climatic records for the St. Francis county
weather station from 15 May to 20 June, the period that most rice fields are ready for preflood N
and flood establishment, shows that the average daily maximum temperature was 29.9C and the
average number of days between rainfall events was 6 d (Table 2.1). Rainfall events that occur
between the time of urea application and incorporation by flooding have generally been
considered as helpful in reducing NH3 loss and flooding the field since rainfall incorporates the
urea into the soil.
The literature review performed by Holcomb et al. (2011) showed that limited field
research has been published to determine the amount of rainfall needed to incorporate urea to
reduce or prevent NH3 loss. Holcomb et al. (2011) demonstrated a minimum of 14.6 mm of
rainfall was needed to significantly reduce NH3 volatilization from urea-N on an Adkins fine
sandy loam (coarse-loamy, mixed, superactive, mesic Xeric Haplocalcids). Applying urea to a
dry soil surface followed by incorporation with sufficient irrigation or rainfall within 24 to 48 h
of application likely reduces NH3 volatilization to negligible amounts on most soils. One often
overlooked aspect of applying urea to a dry soil surface is that very dry soil not only delays urea
hydrolysis to help minimize NH3 loss, but it also slows the nitrification rate of the NH4+ formed
after urea hydrolysis (Greaves and Carter, 1920; Garcia et al., 2014). Although timely rainfall
may effectively incorporate urea to prevent or substantially reduce NH3 loss, the added soil
moisture may stimulate nitrification increasing denitrification loss once the flood is established.
Conditions conducive for denitrification are guaranteed in flood-irrigated rice production
systems and applying the urea and establishing the flood in a short-time period has the objective
of minimizing NH3 loss and preventing nitrification of urea derived NH4-N.
33
Laboratory assessments of the nitrification rates among soils show that NH4+ may be
converted to NO3- in as few as 5 to 20 d after urea application (Hadas et al., 1986; Golden et al.,
2009; Fitts et al., 2014). The effect of rainfall following preflood urea-N application and before
flooding has not been examined. Furthermore, peer-reviewed literature describing in-field
manipulation of simulated rainfall on N fertilization strategies in agricultural crops are limited
(McInnes et al., 1989; Kissel et al., 2004; Holcomb et al., 2011).
Our research objectives were to compare the effects of simulated rainfall amount and
urease inhibitor, NBPT, on NH3 volatilization loss of preflood-applied urea and rice grain yield.
We hypothesized that urea treated with an NBPT-containing urease inhibitor would significantly
reduce NH3 volatilization on a silt-loam soil compared to urea (no inhibitor) and that 10-15 mm
of simulated rainfall would be needed to incorporate urea and significantly reduce NH3
volatilization. We also anticipated that rice N uptake and grain yield would decline when NH3
volatilization was successfully controlled by a sufficient amount of rainfall shortly after urea
application and flood establishment was delayed as a result of nitrification of fertilizer-N
followed by rapid denitrification after the flood was established.
MATERIALS AND METHODS
SITE DESCRIPTION
Three field experiments with rice were established at the University of Arkansas Division
of Agriculture Pine Tree Research Station near Colt, AR in 2013 and 2014. Individual
experiments will be referred to by the year they were conducted and the chronological order in
which they were planted (2013-A, 2013-B, or 2014-C). Each experiment was located on soil
mapped as a Calhoun silt loam (fine-silty, mixed, active, thermic Typic Glossaqualfs). Before
each test was established, two composite soil samples were collected from each of two depths
34
including the 0- to 10-cm and 0- to 45-cm depths. Samples were dried at 55°C and crushed to
pass through a 2-mm sieve. The 0- to 10-cm deep samples were analyzed for soil water pH (1:2
soil volume: water volume ratio), Mehlich-3 extractable nutrients (Helmke and Sparks, 1996),
total C and N (Nelson and Sommers, 1996), and NO3-N and NH4-N concentrations (Mulvaney,
1996, Table 2.2). The 0- to 45-cm samples were analyzed for alkaline-hydrolyzable N using
direct-steam distillation (Roberts et al., 2011). Rice followed soybean [Glycine max (L.) Merr.]
at all three site-years.
Rice was drill-seeded into conventionally tilled seedbeds at an average rate of 101 kg
seed ha-1 with ‘CL152’ rice for Trials 2013-A and 2013-B and 95 kg seed ha-1 with ‘CL111’ for
Trial 2014-C on the dates listed in Table 2.3. Individual plots were 2.3-m long and 1.8-m wide
and consisted of nine rows of rice with a row spacing of 19 cm. A 0.4-m wide, plant-free alley
surrounded each plot. Crop management practices were similar to guidelines recommended by
the Cooperative Extension Service for the direct-seeded, delayed-flood production system
(Hardke, 2013), except the permanent flood was delayed 7 to 12 DAU (Table 2.3).
TREATMENTS
Each trial was a randomized complete block design with a 2 (N source) by 6 (rainfall
amounts) factorial treatment structure with four blocks per treatment. Nitrogen sources were
untreated urea (Urea) and NBPT-treated urea (NBPT-Urea) applied at 112 kg N ha-1 in 2013-A
and 2013-B and 118 kg N ha-1 in 2014-C. The N-fertilizer rate was applied at 80% of the N rate
predicted to produce maximum grain yield (Roberts et al., 2011). A suboptimal N rate was used
to ensure that potential differences in N loss among treatments would result in grain yield
differences. Each block also contained two no-N control plots. The NBPT (Agrotain® Ultra, 267
g NBPT kg-1, Koch Fertilizer, L.L.C., Wichita, KS) was applied to the urea by hand at a rate of

35
0.88 g NBPT kg-1 urea. A composite of two 5.1-cm deep soil samples was collected from the no-
N control plots from each block to assess soil moisture and bulk density at the time of urea
application. Prior to applying the N-fertilizer treatments, a 153.3-cm2 aluminum ring, the same
diameter as the NH3 volatilization chamber, was placed over one of the first inside rows of (e.g.,
rows 2 or 8). The aluminum ring was temporarily covered to identify the location of the chamber
in each plot and ensure no fertilizer was applied to that area. Once the assigned N treatment was
hand applied to each plot, a preweighed amount (0.374 g urea, ±0.002 g for 2013-A and 0.392 g
urea, ±0.002 g for 2014-C) of the assigned N source was placed inside the ring, simulated
rainfall was applied, the ring was removed, and the acrylic chamber was situated. Nitrogen was
applied to a dry soil surface at the four- to five-leaf stage as recommended by the University of
Arkansas (Norman et al., 2013) on the dates listed in Table 2.3.
Portable rainfall simulators measuring 1.8-m wide × 2.3-m long were constructed to
simulate rainfall. Each simulator was equipped with two Rain Bird® (Rain Bird Corp., Azusa,
CA and Tuscon, AZ) SQ Series full-circle and two Rain Bird® SQ Series half-circle nozzles
positioned 68.6-cm apart and 73.7-cm above the ground on a 2.5-cm polyvinyl chloride tubing
(PVC) frame. Water was delivered to the nozzles through 1.3-cm polyethylene tubing (Raindrip,
Inc. subsidiary of NDS, Inc., Woodland Hills, CA) which was connected to a 94.6-L spray tank
(County Line® Deluxe Spot Sprayer, Green Leaf, Inc., Fontanet, IN). The water used for rainfall
simulation was groundwater from the alluvial aquifer.
At the four-leaf stage, Urea and NBPT-Urea were applied to a dry soil surface at 0800 h
(2013-A and 2013-B) or 1700 h (2014-C) on the dates listed in Table 2.3. Simulated rainfall
amounts of 0, 3.2, 6.4, 12.7, 19.0, or 25.4 mm were applied 5 (2013-A and 2013-B) to 15 h
(2014-C) after the preflood urea-N application. The simulated rainfall was applied in 3.2 mm
36
intervals with 10 min between each interval until the desired simulated rainfall amount was
applied.
MEASUREMENTS
AMMONIA VOLATILIZATION
To assess potential N-loss via NH3 volatilization, NH3 was measured using the semi-open
chamber method described by Griggs et al. (2007) and Massey et al. (2011). Clear acrylic
chambers 14-cm i.d. × 61-cm tall were driven 10-cm into the soil to prevent air flux at the soil
surface. The chambers were placed within the plots after N-fertilizer application and simulated
rainfall. Ammonia volatilization was measured in Trials 2013-A and 2014-C for 11 d after urea
application.
Volatilized NH3 was trapped by polyurethane foam sorbers (14-cm diam. × 2.5-cm
height) saturated with 20-mL of 0.73 mol L-1 H3PO4-33% glycerin (v:v). Each acrylic chamber
contained two foam sorbers, which were positioned immediately after the chamber was driven
into the soil. The first sorber was 15 cm below the top of the chamber to trap NH3 from the urea,
and the second sorber was level with the top of the chamber to absorb atmospheric NH3. Sorbers
were changed 2, 3, 5, 8, and 11 DAU and rainfall simulation. Chambers were removed from the
field after the last NH3 volatilization sample was collected. At each sample date, the innermost
sorber was removed and replaced immediately. The removed sorber was placed into a labeled
3.8-L plastic bag (Uline, Pleasant Prairie, WI), which was sealed and taken to the lab for
extraction. Sorbers were extracted by adding 100-mL of 2 mol L-1 KCl solution to each bag and
allowing saturation of the sorber overnight. Each saturated sorber was hand-squeezed to extract a
50-mL aliquot that was used to determine NH4-N concentration by colorimetery (SanPlus
Segmented Flow Analyzer, Skalar Analytical B.V., The Netherlands; Mulvaney, 1996).

37
Prior research has reported that air temperature and RH influence NH3 loss due to the
critical relative humidity (CRH) of urea (Vaio et al., 2008). Outdoor temperature and RH data
loggers (HOBO Pro v2-Part No. U23-001, Onset Computer Corp. Inc., Bourne, MA) were
suspended 1.3 cm above the soil surface both inside and outside of one volatilization chamber in
each block and set to record every 30 min (Figs. 2.1 and 2.2). To reduce the differences in
temperature and RH, a white trash bag was wrapped around each chamber. A white, 18.2-L
bucket was also placed on top of the chamber to protect the sorbers from precipitation. The
equation described by Vaio et al. (2008) was used to calculate the CRH of urea inside and
outside of the chamber (Figs. 2.1 and 2.2).
CRH (%) = 84.669 – 0.1457T – 0.0055T 2 where T is temperature (°C),
SOIL UREA-N AND INORGANIC-N
Soil samples were collected from each plot of the 2014-C Trial to assess the urea- and
inorganic-N concentrations remaining following urea application. Prior to fertilizer and
simulated rainfall application, two 7.5-cm i.d. × 10-cm length PVC rings were placed 5 cm into
the soil within the harvested area of each plot between the first and second row of rice and
covered to ensure no urea-N was applied inside. Once the assigned N treatment was hand applied
to each plot, a preweighed amount (0.117 g urea, ±0.002 g) of the assigned N source was placed
inside the PVC ring and simulated rainfall was applied. The PVC rings and the soil inside were
collected 2 and 4 DAU, placed into a labeled 0.9-L plastic bag (Uline, Pleasant Prairie, WI), and
immediately frozen to stop urea hydrolysis and nitrification. Samples were dried at -12°C in a
freeze-dryer (Botanique Model 18DX48, Botanique Preservation Equipment, Inc, Phoenix, AZ)
for 72 to 96 h and the dry soil weight was recorded. The dried soil samples were crushed, passed
through a 2-mm sieve, and stored in a -20ºC freezer for 7 wk until urea- and inorganic-N were
38
extracted. Duplicate 5-g subsamples of each composite were extracted with 50 mL of 2 mol L-1
KCl solution and analyzed for urea-N (BioTek Epoch, BioTek®, Winooski, VT) using a
modification (the potassium chloride-phenylmercuric acetate solution was omitted) of the
method described by Greenan et al. (1995) and NO3-N and NH4-N (SanPlus Segmented Flow
Analyzer, Skalar Analytical B.V., The Netherlands; Mulvaney, 1996).
TOTAL DRY MATTER, ABOVEGROUND-N UPTAKE, AND GRAIN YIELD
To assess aboveground-N uptake by rice, whole, aboveground-plant samples were
collected at early heading by harvesting a 0.9-m linear section from an inside row in all three
trials. Plant samples were collected when rice was 5 to 10% headed, which represents the
approximate time of maximum N uptake by rice (Guindo et al., 1994; Bashir et al., 1997). Plant
samples were placed in paper bags, dried to a constant weight at 60°C, weighed for dry matter
accumulation, and ground to pass through a 1-mm sieve. Tissue N concentration was measured
for each treatment by weighing a subsample of the ground plant tissue into a crucible and
determining total-N concentration by combustion [elementar vario Max CN (2013-A and 2013-B
samples); elementar rapid N III (2014-C samples), Elementar Analysensysteme GmbH, Hanau,
Germany; Campbell, 1992]. Aboveground-N uptake (kg N ha-1) was calculated as the product of
dry matter accumulation and N concentration. For calculating FNUE using the difference method
(Schindler and Knighton, 1999) we assumed that rice uptake of soil N was the same across all
simulated rainfall amounts.
At maturity, a 3.5-m2 section from eight of the nine rows of each plot was harvested for
grain yield using a small-plot combine. Immediately after harvest, grain weight and moisture
were determined. The reported grain yields were adjusted to a uniform moisture content of 120 g
H2O kg-1 for statistical analysis.
39
STATISTICAL ANALYSIS
All statistical analyses were performed using the MIXED procedure in SAS v9.3 (SAS Institute
Inc., Cary, NC). Replicate data for cumulative NH3 volatilization on each measurement day were
regressed on simulated rainfall amount, allowing for linear, quadratic, and cubic terms with
coefficients depending on Trial (2013-A and 2014-C), N source, and their interaction. The most
complex, nonsignificant (P>0.15) model terms were removed sequentially and the model was
refit until a satisfactory model was obtained. The Cook’s D statistic and studentized residuals (<
-3.0 or >3.0) were used to identify and examine influential and outlying replicate data,
respectively. Comparisons between N sources were evaluated at α = 0.10 using LSMEANS when
necessary. The same statistical approach was used to model soil urea-N and inorganic-N content,
aboveground-N uptake at early heading, and grain yield data with the exception that the cubic
term was not included in the model. As expected, there was a significant trial effect for
aboveground-N uptake and grain yield due to vastly different environmental conditions during
each Trial (Fig. 2.1). Therefore, aboveground-N uptake and grain yield data was reanalyzed by
trial.
RESULTS AND DISCUSSION
AMMONIA VOLATILIZATION
Ammonia volatilization was measured for 11 DAU in 2013-A and 2014-C using the
semi-open chamber method. A microenvironment exists within the chamber that may not
represent the conditions outside of the chamber and is generally believed to be more conducive
for NH3 loss (Cabrera et al., 2001). Ambient RH fluctuated throughout the day with RH being
above the CRH of urea during the evening and early morning hours and below the CRH during
the day when temperatures were greatest (Fig. 2.1). Within the chamber, RH was consistently
40
above the CRH of urea creating an environment conducive for NH3 loss (Fig. 2.2). Outside of the
chamber, the ambient RH was greater than the CRH of urea 60% of the time in 2013-A and 66%
of the time in 2014-C (Fig. 2.1). The mean temperature inside the chamber averaged 28.3 °C in
2013-A and 29.0°C in 2014-B, an average of 0.4 to 1.0°C higher than the outside temperature.
Cumulative NH3 loss was regressed on simulated rainfall amount for each of the five
sampling times (Table 2.4; Fig. 2.3). The predicted cumulative NH3 volatilization from NBPT-
Urea 2 and 3 DAU was not different than zero across the range of simulated rainfall amounts
indicating that the NBPT urease inhibitor effectively stopped NH3 volatilization for at least 3
DAU (Table 2.5; Fig. 2.3). Ammonia loss from Urea followed a cubic pattern across simulated
rainfall amounts that differed somewhat between Trials 2013-A and 2014-C. For 2 DAU in
2013-A, the predicted cumulative NH3 loss with no simulated rainfall was 1.3% of the applied
urea-N and cumulative NH3 loss increased to a peak of 3.4% as simulated rainfall increased to
6.1 mm. At simulated rainfall amounts >6.1 mm, cumulative NH3-N loss decreased until the
cumulative loss was not different than zero at ≥17.8 mm of simulated rainfall. For 3 DAU in
2013-A, cumulative NH3 loss followed a similar pattern as described for 2 DAU. The primary
difference (i.e., not statistically compared) between 2 and 3 DAU was the amount of predicted
NH3 loss increased numerically across simulated-rainfall amounts, especially for the no
simulated rainfall treatment (3.2% of the applied urea-N).
For 2014-C, predicted cumulative NH3 loss 2 or 3 DAU did not exhibit the increase from
0 to 6.1 mm of simulated rainfall that was observed in 2013-A (Fig. 2.3). For 2 DAU in 2014-C,
predicted cumulative NH3-N loss accounted for 4.0% of the applied urea-N when simulated
rainfall ranged from 0 to 5.3 mm and NH3 loss gradually declined as the amount of simulated
rainfall increased but NH3 loss was always different than zero. The trend for cumulative NH3-N

41
loss 3 DAU in 2014-C was similar to that described for 2 DAU with a slight numerical increase
in loss when simulated rainfall amounts were <3.3 mm. The 2 and 3 DAU results suggest that
NH3 loss from Urea was: i) effectively stopped (<1% of applied N) by >17 mm of simulated
rainfall, ii) compared to no rainfall, NH3 loss may be temporally accentuated by low (<5.3 mm)
amounts of rainfall, and iii) NBPT effectively prevented NH3-N loss across all rainfall amounts
for at least 3 DAU.
Cumulative NH3 loss 5, 8, and 11 DAU followed a quadratic pattern across rainfall
amounts and depended only on N source indicating the cumulative NH3 loss responses for 2013-
A and 2014-C were the same (Table 2.4). The overall pattern of cumulative NH3 loss for each N
source on each of these three sample days was similar and showed small numerical differences in
the magnitude of loss (Fig. 2.3). By 5 DAU and continuing until 11 DAU, cumulative NH3 loss
from both N sources decreased nonlinearly (quadratic) as simulated rainfall amount increased
with the greatest loss occurring when no simulated rainfall was applied. By 11 DAU, the
predicted NH3 loss with no simulated rainfall accounted for 8.6% of the applied Urea and 1.8%
of the applied NBPT-Urea. Based on the predicted relationships for each day, the majority of
NH3 loss measured 11 DAU occurred within 5 DAU (87%) for Urea, but only 37% of the total
NH3 loss had occurred within 5 DAU for NBPT-Urea. Cumulative NH3 loss from NBPT-Urea
by 11 DAU was not different than zero when simulated rainfall amounts were >14.0 mm at 5
DAU, >16.5 mm at 8 DAU, and >15.3 mm at 11 DAU.
Cumulative NH3 loss from Urea was greater than zero across the range of simulated
rainfall amounts 5, 8, and 11 DAU suggesting that NH3 loss from Urea was reduced but not
eliminated by simulated rainfall applied 5 to 12 h after fertilizer application. By 11 DAU, the
cumulative NH3 loss between the two N sources was similar when simulated rainfall amount
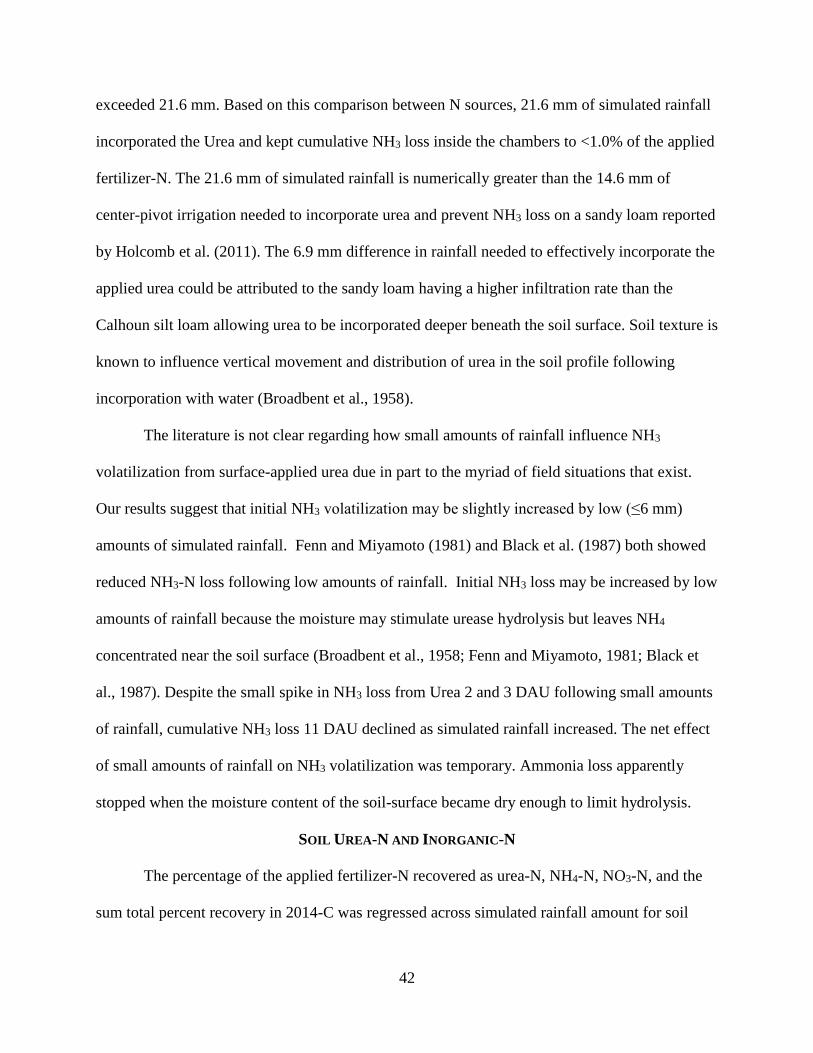
42
exceeded 21.6 mm. Based on this comparison between N sources, 21.6 mm of simulated rainfall
incorporated the Urea and kept cumulative NH3 loss inside the chambers to <1.0% of the applied
fertilizer-N. The 21.6 mm of simulated rainfall is numerically greater than the 14.6 mm of
center-pivot irrigation needed to incorporate urea and prevent NH3 loss on a sandy loam reported
by Holcomb et al. (2011). The 6.9 mm difference in rainfall needed to effectively incorporate the
applied urea could be attributed to the sandy loam having a higher infiltration rate than the
Calhoun silt loam allowing urea to be incorporated deeper beneath the soil surface. Soil texture is
known to influence vertical movement and distribution of urea in the soil profile following
incorporation with water (Broadbent et al., 1958).
The literature is not clear regarding how small amounts of rainfall influence NH3
volatilization from surface-applied urea due in part to the myriad of field situations that exist.
Our results suggest that initial NH3 volatilization may be slightly increased by low (≤6 mm)
amounts of simulated rainfall. Fenn and Miyamoto (1981) and Black et al. (1987) both showed
reduced NH3-N loss following low amounts of rainfall. Initial NH3 loss may be increased by low
amounts of rainfall because the moisture may stimulate urease hydrolysis but leaves NH4
concentrated near the soil surface (Broadbent et al., 1958; Fenn and Miyamoto, 1981; Black et
al., 1987). Despite the small spike in NH3 loss from Urea 2 and 3 DAU following small amounts
of rainfall, cumulative NH3 loss 11 DAU declined as simulated rainfall increased. The net effect
of small amounts of rainfall on NH3 volatilization was temporary. Ammonia loss apparently
stopped when the moisture content of the soil-surface became dry enough to limit hydrolysis.
SOIL UREA-N AND INORGANIC-N
The percentage of the applied fertilizer-N recovered as urea-N, NH4-N, NO3-N, and the
sum total percent recovery in 2014-C was regressed across simulated rainfall amount for soil
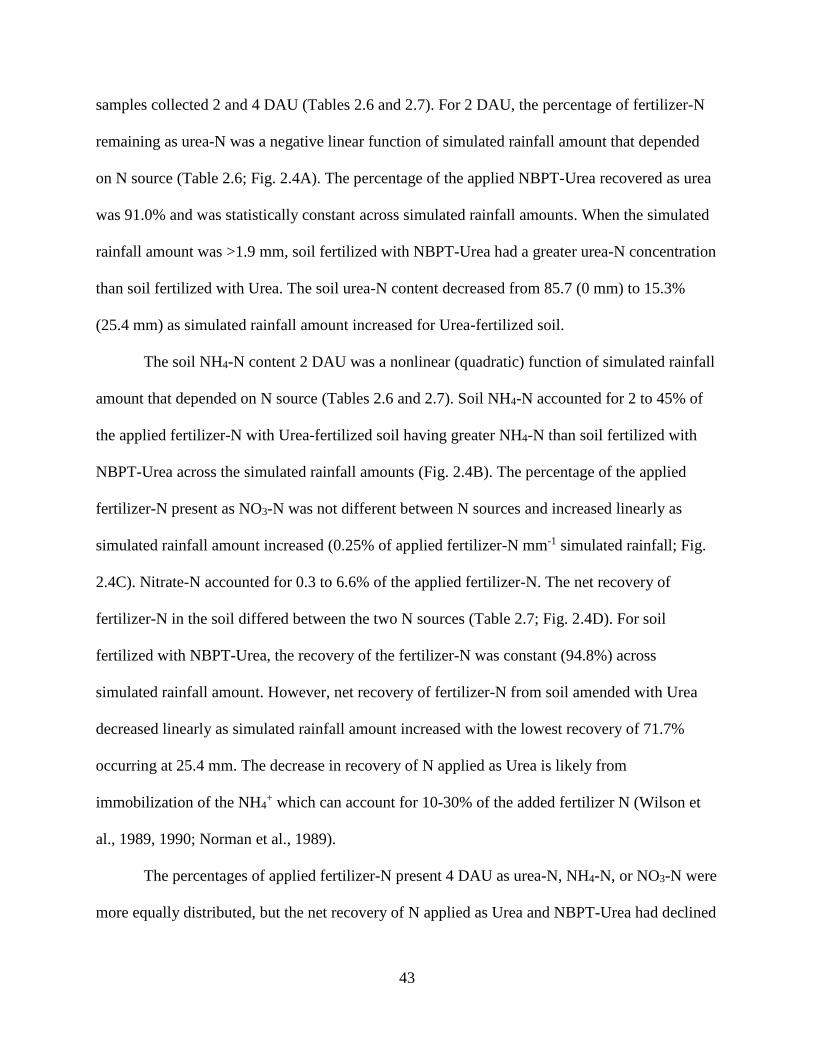
43
samples collected 2 and 4 DAU (Tables 2.6 and 2.7). For 2 DAU, the percentage of fertilizer-N
remaining as urea-N was a negative linear function of simulated rainfall amount that depended
on N source (Table 2.6; Fig. 2.4A). The percentage of the applied NBPT-Urea recovered as urea
was 91.0% and was statistically constant across simulated rainfall amounts. When the simulated
rainfall amount was >1.9 mm, soil fertilized with NBPT-Urea had a greater urea-N concentration
than soil fertilized with Urea. The soil urea-N content decreased from 85.7 (0 mm) to 15.3%
(25.4 mm) as simulated rainfall amount increased for Urea-fertilized soil.
The soil NH4-N content 2 DAU was a nonlinear (quadratic) function of simulated rainfall
amount that depended on N source (Tables 2.6 and 2.7). Soil NH4-N accounted for 2 to 45% of
the applied fertilizer-N with Urea-fertilized soil having greater NH4-N than soil fertilized with
NBPT-Urea across the simulated rainfall amounts (Fig. 2.4B). The percentage of the applied
fertilizer-N present as NO3-N was not different between N sources and increased linearly as
simulated rainfall amount increased (0.25% of applied fertilizer-N mm-1 simulated rainfall; Fig.
2.4C). Nitrate-N accounted for 0.3 to 6.6% of the applied fertilizer-N. The net recovery of
fertilizer-N in the soil differed between the two N sources (Table 2.7; Fig. 2.4D). For soil
fertilized with NBPT-Urea, the recovery of the fertilizer-N was constant (94.8%) across
simulated rainfall amount. However, net recovery of fertilizer-N from soil amended with Urea
decreased linearly as simulated rainfall amount increased with the lowest recovery of 71.7%
occurring at 25.4 mm. The decrease in recovery of N applied as Urea is likely from
immobilization of the NH4+ which can account for 10-30% of the added fertilizer N (Wilson et
al., 1989, 1990; Norman et al., 1989).
The percentages of applied fertilizer-N present 4 DAU as urea-N, NH4-N, or NO3-N were
more equally distributed, but the net recovery of N applied as Urea and NBPT-Urea had declined
44
numerically compared to 2 DAU (not statistically compared, Fig. 2.5). By 4 DAU, the
percentage of applied fertilizer-N remaining as urea-N ranged from 41 to 0% and was a negative
linear function of simulated rainfall amount that depended on N source (Table 2.6; Fig. 2.5A).
Soil fertilized with NBPT-Urea contained significantly greater amounts of urea-N than soil
fertilized with Urea when simulated rainfall was >3.0 mm. The results show that urea hydrolysis
was inhibited by dry soil conditions regardless of whether the urea fertilizer was treated with
NBPT. As expected, NBPT provided additional inhibition of urea hydrolysis when moisture was
added via simulated rainfall. When simulated rainfall was applied, the majority of Urea was
hydrolyzed in 2 d. The presence of NBPT delayed urea hydrolysis for at least 2 d but urea-N
disappeared rapidly between 2 and 4 DAU. Dawar et al. (2011) also reported that hydrolysis of
urea was nearly complete 2 DAU and about 40% of the added NBPT-Urea was recovered as urea
4 DAU. Urea hydrolysis is quite slow when the soil surface is very dry at the time of application
or dries rapidly after application (McInnes et al., 1986; Garcia et al., 2014).
By 4 DAU, soil NH4-N accounted for 4.7 to 29.3% of applied fertilizer-N and was a
nonlinear (quadratic) function of simulated rainfall amount that differed between the two N
sources (Table 2.6; Fig. 2.5B). Soil fertilized with Urea had a greater percentage of NH4-N
present than the NBPT-Urea fertilized soil when simulated rainfall was >0.3 mm. The predicted
NH4-N contents peaked at 29.3% of the applied Urea at 14.0 mm of simulated rainfall and 13.4%
of the applied NBPT-Urea at 15.4 mm of simulated rainfall. Soil NO3-N was also a nonlinear
(quadratic) function of simulated rainfall amount that differed between N sources (Table 2.6;
Fig. 2.5C). Nitrate-N represented <1% of the applied fertilizer-N, regardless of N source, when
no simulated rainfall was applied but rapidly increased to predicted maximums of 19.1% for
NBPT-Urea and 32.3% for Urea at 25.4 mm of simulated rainfall. The percentage of applied
45
fertilizer-N recovered as NO3-N was similar for the two N sources with 0 to 18.6 mm of
simulated rainfall, but as simulated rainfall amount increased beyond 18.6 mm, soil receiving
Urea had greater amounts of NO3-N present. The greater NO3-N content of soil amended with
Urea accounts for the decline in NH4-N (Fig 2.5B) observed at the highest simulated rainfall
amount.
The net recovery of fertilizer-N 4 DAU was a nonlinear (quadratic) function of simulated
rainfall amount that was the same for the two N sources and ranged from 47.2 to 57.2% of
fertilizer-N applied as Urea- or NBPT-Urea-N (Fig. 2.5D). When urea is applied to warm and
moist soil, urea hydrolysis occurs rapidly, nitrification of the NH4 begins, and nitrification of the
fertilizer-N can be nearly complete in <1 wk in some soils (Broadbent et al., 1958; Fitts et al.,
2014). Two DAU, 5.2 to 29.3% of the applied fertilizer-N was unaccounted for (Fig. 2.4) and
was assumed to have been lost as NH3 (Fig. 2.3), immobilized by soil microbes, or both. By 4
DAU, 42-52% of the applied fertilizer-N was unaccounted for and its location cannot be
reasonably explained by expectations for NH3 loss or immobilization (Fig 2.5D). Loss via
denitrification, NH4 fixation or plant uptake would be minimal during this short time when the
soil was not flooded. Vertical movement of urea below the 5.1 cm sample depth is possible but
seems unlikely provided the rapid hydrolysis of urea when adequate moisture is present, the
absence of rainfall by 4 DAU, good soil drying conditions (Fig. 2.1, 2014-C), and the uniformity
of fertilizer-N recovery across simulated rainfall amounts. The unlikely movement of urea below
the collars emplaced to a 5.1 cm depth is supported by the results from Daigh et al. (2014)
showing <15% of the recovered urea-N of a silt loam soil had moved below 6 cm when soil
cores were flooded 5 DAU. Immobilization usually accounts for an average of 20% of the
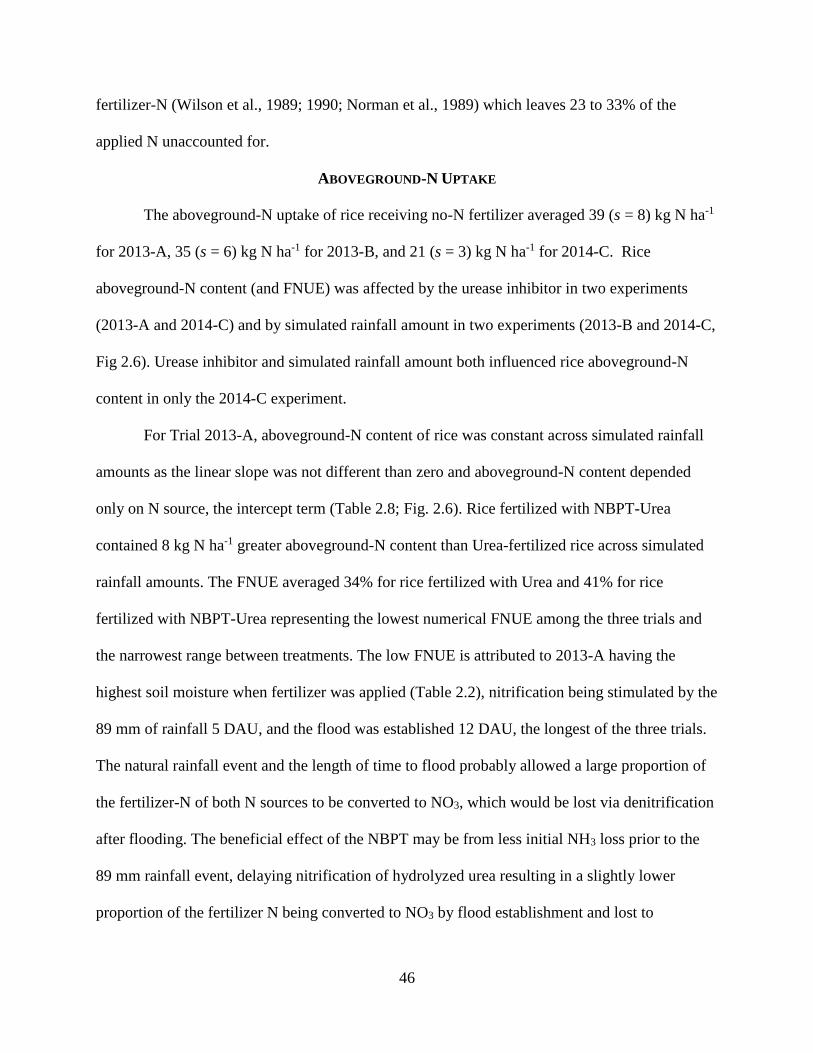
46
fertilizer-N (Wilson et al., 1989; 1990; Norman et al., 1989) which leaves 23 to 33% of the
applied N unaccounted for.
ABOVEGROUND-N UPTAKE
The aboveground-N uptake of rice receiving no-N fertilizer averaged 39 (s = 8) kg N ha-1
for 2013-A, 35 (s = 6) kg N ha-1 for 2013-B, and 21 (s = 3) kg N ha-1 for 2014-C. Rice
aboveground-N content (and FNUE) was affected by the urease inhibitor in two experiments
(2013-A and 2014-C) and by simulated rainfall amount in two experiments (2013-B and 2014-C,
Fig 2.6). Urease inhibitor and simulated rainfall amount both influenced rice aboveground-N
content in only the 2014-C experiment.
For Trial 2013-A, aboveground-N content of rice was constant across simulated rainfall
amounts as the linear slope was not different than zero and aboveground-N content depended
only on N source, the intercept term (Table 2.8; Fig. 2.6). Rice fertilized with NBPT-Urea
contained 8 kg N ha-1 greater aboveground-N content than Urea-fertilized rice across simulated
rainfall amounts. The FNUE averaged 34% for rice fertilized with Urea and 41% for rice
fertilized with NBPT-Urea representing the lowest numerical FNUE among the three trials and
the narrowest range between treatments. The low FNUE is attributed to 2013-A having the
highest soil moisture when fertilizer was applied (Table 2.2), nitrification being stimulated by the
89 mm of rainfall 5 DAU, and the flood was established 12 DAU, the longest of the three trials.
The natural rainfall event and the length of time to flood probably allowed a large proportion of
the fertilizer-N of both N sources to be converted to NO3, which would be lost via denitrification
after flooding. The beneficial effect of the NBPT may be from less initial NH3 loss prior to the
89 mm rainfall event, delaying nitrification of hydrolyzed urea resulting in a slightly lower
proportion of the fertilizer N being converted to NO3 by flood establishment and lost to
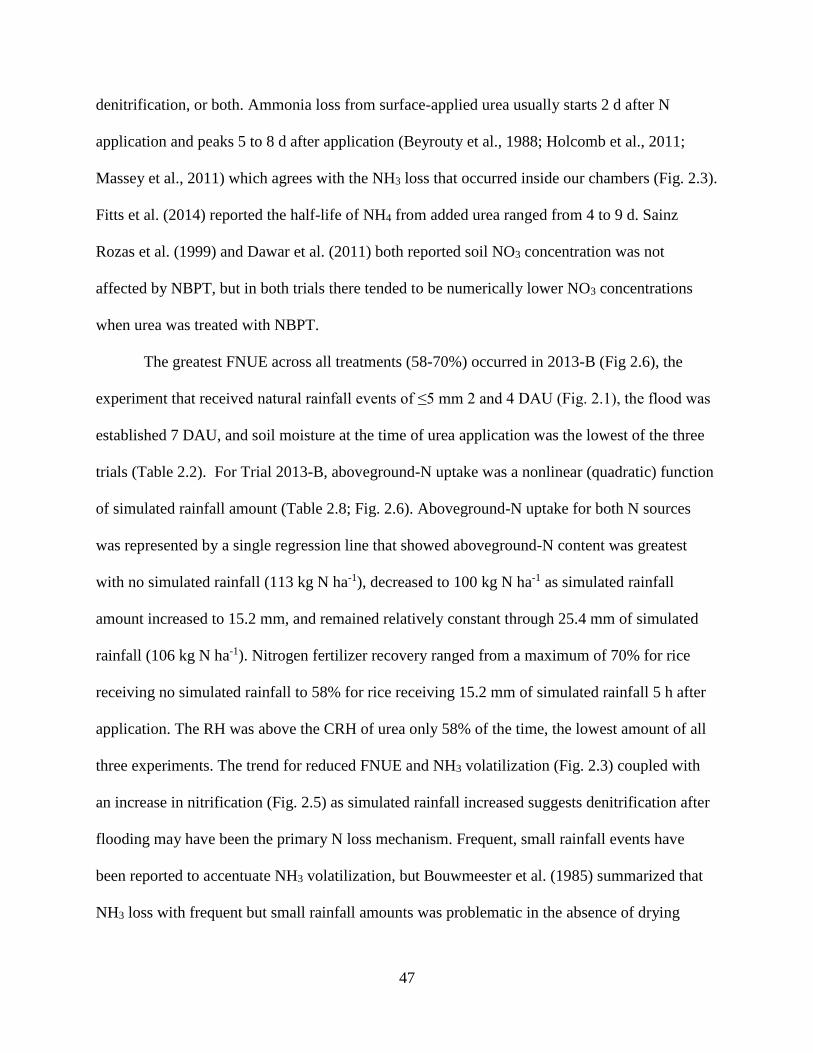
47
denitrification, or both. Ammonia loss from surface-applied urea usually starts 2 d after N
application and peaks 5 to 8 d after application (Beyrouty et al., 1988; Holcomb et al., 2011;
Massey et al., 2011) which agrees with the NH3 loss that occurred inside our chambers (Fig. 2.3).
Fitts et al. (2014) reported the half-life of NH4 from added urea ranged from 4 to 9 d. Sainz
Rozas et al. (1999) and Dawar et al. (2011) both reported soil NO3 concentration was not
affected by NBPT, but in both trials there tended to be numerically lower NO3 concentrations
when urea was treated with NBPT.
The greatest FNUE across all treatments (58-70%) occurred in 2013-B (Fig 2.6), the
experiment that received natural rainfall events of ≤5 mm 2 and 4 DAU (Fig. 2.1), the flood was
established 7 DAU, and soil moisture at the time of urea application was the lowest of the three
trials (Table 2.2). For Trial 2013-B, aboveground-N uptake was a nonlinear (quadratic) function
of simulated rainfall amount (Table 2.8; Fig. 2.6). Aboveground-N uptake for both N sources
was represented by a single regression line that showed aboveground-N content was greatest
with no simulated rainfall (113 kg N ha-1), decreased to 100 kg N ha-1 as simulated rainfall
amount increased to 15.2 mm, and remained relatively constant through 25.4 mm of simulated
rainfall (106 kg N ha-1). Nitrogen fertilizer recovery ranged from a maximum of 70% for rice
receiving no simulated rainfall to 58% for rice receiving 15.2 mm of simulated rainfall 5 h after
application. The RH was above the CRH of urea only 58% of the time, the lowest amount of all
three experiments. The trend for reduced FNUE and NH3 volatilization (Fig. 2.3) coupled with
an increase in nitrification (Fig. 2.5) as simulated rainfall increased suggests denitrification after
flooding may have been the primary N loss mechanism. Frequent, small rainfall events have
been reported to accentuate NH3 volatilization, but Bouwmeester et al. (1985) summarized that
NH3 loss with frequent but small rainfall amounts was problematic in the absence of drying
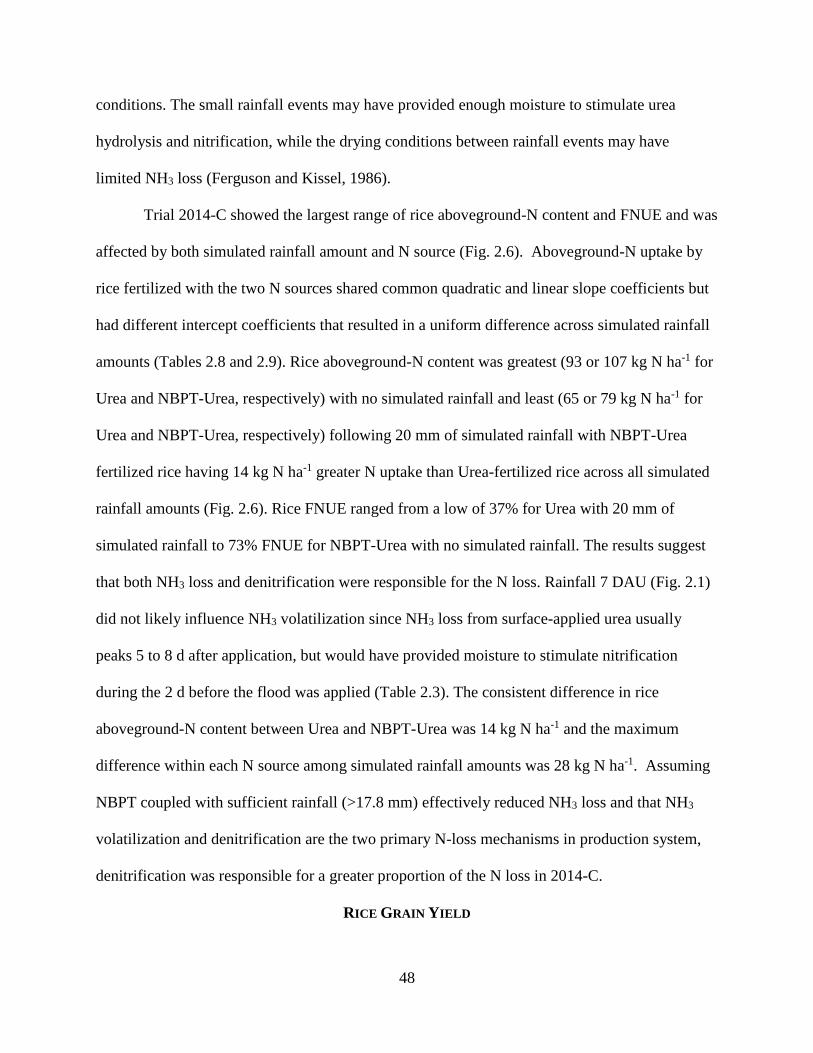
48
conditions. The small rainfall events may have provided enough moisture to stimulate urea
hydrolysis and nitrification, while the drying conditions between rainfall events may have
limited NH3 loss (Ferguson and Kissel, 1986).
Trial 2014-C showed the largest range of rice aboveground-N content and FNUE and was
affected by both simulated rainfall amount and N source (Fig. 2.6). Aboveground-N uptake by
rice fertilized with the two N sources shared common quadratic and linear slope coefficients but
had different intercept coefficients that resulted in a uniform difference across simulated rainfall
amounts (Tables 2.8 and 2.9). Rice aboveground-N content was greatest (93 or 107 kg N ha-1 for
Urea and NBPT-Urea, respectively) with no simulated rainfall and least (65 or 79 kg N ha-1 for
Urea and NBPT-Urea, respectively) following 20 mm of simulated rainfall with NBPT-Urea
fertilized rice having 14 kg N ha-1 greater N uptake than Urea-fertilized rice across all simulated
rainfall amounts (Fig. 2.6). Rice FNUE ranged from a low of 37% for Urea with 20 mm of
simulated rainfall to 73% FNUE for NBPT-Urea with no simulated rainfall. The results suggest
that both NH3 loss and denitrification were responsible for the N loss. Rainfall 7 DAU (Fig. 2.1)
did not likely influence NH3 volatilization since NH3 loss from surface-applied urea usually
peaks 5 to 8 d after application, but would have provided moisture to stimulate nitrification
during the 2 d before the flood was applied (Table 2.3). The consistent difference in rice
aboveground-N content between Urea and NBPT-Urea was 14 kg N ha-1 and the maximum
difference within each N source among simulated rainfall amounts was 28 kg N ha-1. Assuming
NBPT coupled with sufficient rainfall (>17.8 mm) effectively reduced NH3 loss and that NH3
volatilization and denitrification are the two primary N-loss mechanisms in production system,
denitrification was responsible for a greater proportion of the N loss in 2014-C.
RICE GRAIN YIELD

49
The grain yield of rice receiving no-N fertilizer produced average yields of 5694 (s =
431) kg ha-1 for 2013-A, 4284 (s = 409) kg ha-1 for 2013-B, and 3313 (s = 343) kg ha-1 for 2014-
C. The three trials showed different trends in response to N source and simulated rainfall
amount. In 2013-A, rice grain yield was a nonlinear (quadratic) function of simulated rainfall
amount with N sources sharing a common intercept coefficient but having different linear and
quadratic coefficients (Table 2.8; Fig. 2.7). Rice fertilized with NBPT-Urea had statistically
similar grain yields across simulated rainfall amounts as the linear and quadratic coefficients
were not different than zero (Table 2.9). Urea-fertilized rice yields decreased as simulated
rainfall amount increased to 16.9 mm and then plateaued as simulated rainfall increased to 25.4
mm (Fig. 2.7). Yields of rice fertilized with NBPT-Urea were greater than rice fertilized with
Urea when simulated rainfall amounts were between 5.0 and 24.6 mm.
For Trial 2013-B, rice grain yield was a linear function of simulated rainfall amount with
the two N sources sharing a common intercept coefficient but having different linear coefficients
(Tables 2.8 and 2.9; Fig. 2.7). The yields of rice fertilized with NBPT-Urea were statistically
similar across simulated rainfall amounts as the linear slope was not different than zero. The
yield of Urea-fertilized rice decreased by 39.44 kg ha-1 mm-1 simulated rainfall. Grain yields
from the two N sources were not different from one another across simulated rainfall amounts,
but were close to being different when 25.4 mm of simulated rainfall was applied (P = 0.1480).
Rice grain yield from Trial 2014-C was a nonlinear (quadratic) function of simulated
rainfall amount with the two N sources sharing a common quadratic coefficient and having
unique intercept and linear slope coefficients (Tables 2.8 and 2.9; Fig. 2.7). Rice grain yield from
both N sources decreased as simulated rainfall amount increased with rice fertilized with NBPT-
Urea producing 8.9 to 18.1% greater yields than Urea-fertilized rice across the range of
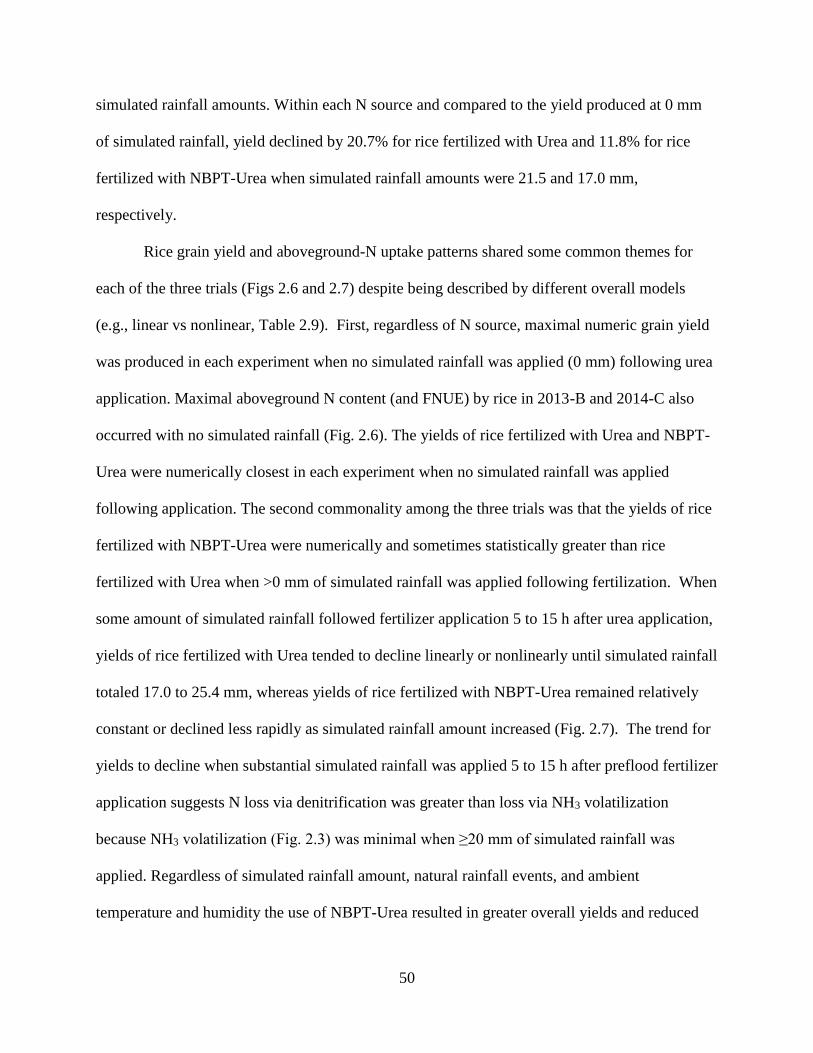
50
simulated rainfall amounts. Within each N source and compared to the yield produced at 0 mm
of simulated rainfall, yield declined by 20.7% for rice fertilized with Urea and 11.8% for rice
fertilized with NBPT-Urea when simulated rainfall amounts were 21.5 and 17.0 mm,
respectively.
Rice grain yield and aboveground-N uptake patterns shared some common themes for
each of the three trials (Figs 2.6 and 2.7) despite being described by different overall models
(e.g., linear vs nonlinear, Table 2.9). First, regardless of N source, maximal numeric grain yield
was produced in each experiment when no simulated rainfall was applied (0 mm) following urea
application. Maximal aboveground N content (and FNUE) by rice in 2013-B and 2014-C also
occurred with no simulated rainfall (Fig. 2.6). The yields of rice fertilized with Urea and NBPT-
Urea were numerically closest in each experiment when no simulated rainfall was applied
following application. The second commonality among the three trials was that the yields of rice
fertilized with NBPT-Urea were numerically and sometimes statistically greater than rice
fertilized with Urea when >0 mm of simulated rainfall was applied following fertilization. When
some amount of simulated rainfall followed fertilizer application 5 to 15 h after urea application,
yields of rice fertilized with Urea tended to decline linearly or nonlinearly until simulated rainfall
totaled 17.0 to 25.4 mm, whereas yields of rice fertilized with NBPT-Urea remained relatively
constant or declined less rapidly as simulated rainfall amount increased (Fig. 2.7). The trend for
yields to decline when substantial simulated rainfall was applied 5 to 15 h after preflood fertilizer
application suggests N loss via denitrification was greater than loss via NH3 volatilization
because NH3 volatilization (Fig. 2.3) was minimal when ≥20 mm of simulated rainfall was
applied. Regardless of simulated rainfall amount, natural rainfall events, and ambient
temperature and humidity the use of NBPT-Urea resulted in greater overall yields and reduced
51
yield loss under like conditions. Norman et al. (2009) also reported that rice fertilized with
NBPT-Urea produced more consistent rice aboveground-N contents and grain yields than rice
fertilized with Urea when the flood was established 5 to 10 DAU.
CONCLUSION
Rainfall soon after urea fertilizer application to dry soil has usually been perceived as
having a positive effect on FNUE by incorporating urea into the soil and reducing NH3
volatilization loss. This research represents the first rainfall simulation trials conducted under
field conditions and reported in the literature for the direct-seeded, delayed-flood rice production
system. The median number of days between rainfall events over a ten-year period at our
research site was 5.5 d (Table 2.1) meaning that, in at least one-half of the years, rainfall can be
expected at least once between urea application and before the flood is completely established in
fields that require ≥7 d to establish a 10-cm deep flood. Results show that rainfall following urea
application and followed by ≥7 d of nonflooded conditions results in yield loss presumably due
to the stimulation of nitrification and eventual loss of fertilizer N via denitrification because rice
yields, total-N uptake, and NH3 volatilization declined as simulated rainfall amount increased.
Amending NBPT to granular urea fertilizer that will be applied immediately before the
permanent flood is established should be considered a best management practice for reducing
fertilizer-N loss even when the soil surface is very dry at the time of urea application because
predicting when, where, and how much rainfall will occur following preflood urea application
cannot be predicted with great accuracy.
52
REFERENCES
Bashir, R., R.J. Norman, R.K. Bacon, and B.R. Wells. 1997. Accumulation and redistribution of
fertilizer nitrogen-15 in soft red winter wheat. Soil Sci. Am. J. 61:1407-1412.
Beyrouty, C.A., L.E. Sommers, and D.W. Nelson. 1988. Ammonia volatilization from surface-
applied urea as affected by several phosphoroamide compunds. Soil Sci. Soc. Am. J.
52:1173-1178.
Black, A.S., R.R. Sherlock, and N.P. Smith. 1987. Effect of timing of simulated rainfall on
ammonia volatilization from urea, applied to soil of varying moisture content. Journal of Soil
Sci. 38:679-687.
Bouwmeester, R.J.B., P.L.G. Vlek, and J.M. Stumpe. 1985. Effect of environmental factors on
ammonia volatilization from a urea-fertilized soil. Soil Soc. Am. J. 49:376-381.
Broadbent, F.E., G.N. Hill, and K.B. Tyler. 1958. Transformations and movement of urea in
soils. Soil Sci. Soc. Proc. 22:303-307.
Cabrera, M.L., D.E. Kissel, R.C. Davis, N.P. Oafoku, and W.I. Segars. 2001. Designs and
ammonia-recovery evaluation of a wind speed-sensitive chamber system. Soil Sci. Soc. Am.
J. 65:1302–1306.
Campbell, C.R. 1992. Determination of total nitrogen in plant tissue by combustion. In: C.O.
Plank, editor, Plant analysis reference procedures for the southern U.S. Coop. Ser. Bull.
368:20-22. Univ. of Georgia, Athens.
Daigh, A.L., M.C. Savin, K. Brye, R. Norman, and D. Miller. 2014. Urea persistence in
floodwater and soil used for flooded rice production. Soil Use and Management 30:463-470.
doi:10.1111/sum.12142.
Dawar, J., M. Zaman, J.S. Rowarth, J. Blennerhassett, and M.H. Turnbull. 2011. Urea hydrolysis
and lateral and vertical movement in the soil: effects of urease inhibitor and irrigation. Biol.
Fert. Soils 47:139-146. doi:10.1007/s00374-010-0515-3.
DeDatta, S.K., C.P. Magnaye, and J.C. Moomaw. 1968. Efficiency of fertilizer nitrogen (15N-
labelled) for flooded rice. In: 9th International Congress of Soil Science Transactions, Vol.
IV. American Elsevier Publishing Company, Inc., New York, NY. p. 67-76.
DeDatta, S.K., R.J. Buresh, M.I. Samson, W.N. Obcemea, and J.G. Real. 1991. Direct
measurement of ammonia and denitification fluxes from urea applied to rice. Soil Sci. Soc.
Am. J. 55:543-548.
Ernst, J.W. and H.F. Massey. 1960. The effects of several factors on volatilization of ammonia
formed from urea in the soil. Soil Sci. Soc. Am. J. 24:87-90.
Fenn, L.B. and L.R. Hossner. 1985. Ammonia volatilization from ammonium or ammonium-
forming nitrogen fertilizers. Adv. Soil Sci. 1:123-169.
53
Fenn, L.B. and S. Miyamoto. 1981. Ammonia loss and associated reactions of urea in calcareous
soils. Soil Sci. Soc. Am. J. 45:537-540.
Ferguson, R.B., and D.E. Kissel. 1986. Effects of soil drying on ammonia volatilization from
surface-applied urea. Soil Sci. Soc. Am. J. 50:485-490.
Fitts, P.W., T.W. Walker, L.J. Krutz, B.R. Golden, J.J. Varco, J. Gore, J.L. Corbin, and N.A.
Slaton. 2014. Nitrification and yield for delayed-flood rice as affected by a nitrification
inhibitor and coated urea. Agron. J. 106:1541-1548. doi:10.2134/agronj13.0586.
Garcia, F.O., D.E. Kissel, and M.L. Cabrera. 2014. Effect of soil matric potential on urea
hydrolysis. Soil Sci. Soc. Am. J. 78:2078-2082. doi:10.2136/sssaj2014.05.0216.
Golden, B.R, N.A. Slaton, R.E. DeLong, R.J. Norman, and E.T. Maschmann. 2009. Nitrification
inhibitors influence on rice grain yield and soil inorganic nitrogen fractions. In: R.J. Norman,
J.F. Meullenet, and K.A.K. Moldenhauer, editors. B.R. Wells Rice Research Studies 2008.
Series 571. Univ. of Arkansas, Fayetteville. p. 215-223.
Greaves, J.E. and E.G. Carter. 1920. Influence of moisture on the bacterial activities of the soil.
Soil Sci. 10:361-387.
Greenan, N.S., R.L. Mulvaney, and G.K. Sims. 1995. A microscale method for colorimetric
determination of urea in soil extracts. Commun. Soil Sci. Plant Anal. 26:2519-2529.
Griggs, B.R., R.J. Norman, C.E. Wilson, and N.A. Slaton. 2007. Ammonia volatilization and
nitrogen uptake for conventional and conservation tilled dry-seeded, delayed-flood rice. Soil
Sci. Soc. Am. J. 71: 745-751. doi:10.2136/sssaj2006.0180.
Guindo, D., B.R. Wells, and R.J. Norman, 1994. Cultivar and nitrogen rate influence on nitrogen
uptake and portioning in rice. Soil Sci. Soc. Am. J. 58:840-845.
Hadas, A., S. Feigenbaum, A. Feigin, and R. Portnoy. 1986. Nitrification rates in profiles of
differently managed soil types. Soil Sci. Soc. Am. J. 50:633-639.
Hardke, J.T., editor. 2013. Arkansas Rice Production Handbook. Publication MP 192. University
of Arkansas Coop. Ext. Ser., Little Rock, AR.
Helmke, P.A., and D.L. Sparks. 1996. Lithium, sodium, potassium, rubidium, and cesium. In:
D.L. Sparks, editor, Methods of soil analysis. Part 3. SSSA Book Ser. 5. SSSA, Madison,
WI. p. 551–574.
Holcomb, J.C., D.M. Sullivan, D.A. Horneck, and G.H. Clough. 2011. Effect of irrigation rate on
ammonia volatilization. Soil Sci. Soc. Am. J. 75:2341-2347. doi:10.2136/sssaj2010.0446.
Kissel, D.E., M.L. Cabrera, N. Vaio, J.R. Craig, J.A. Rema, and L.A. Morris. 2004. Rainfall
timing and ammonia loss from urea in a Loblolly Pine plantation. Soil Sci. Soc. Am. J.
68:1744-1750.

54
Massey, C.G., N.A. Slaton, R.J. Norman, E.E. Gbur, R.E. DeLong, and B.R. Golden. 2011.
Bermudagrass forage yield and ammonia volatilization as affected by nitrogen fertilization.
Soil Sci. Soc. Am. J. 75:638-648. doi:10.2136/sssaj2010.0254.
McInnes, K.J., R.B. Ferguson, D.E. Kissel, and E.T. Kanemasu. 1986. Field measurements of
ammonia loss from surface applications of urea solution to bare soil. Agron. J. 78:192-196.
Mulvaney, R.L. 1996. Nitrogen-inorganic forms. In: D.L. Sparks, editor, Methods of soil
analysis. Part 3. SSSA Book Series 5. SSSA, Madison, WI. p. 1123-1184.
National Climatic Data Center (NCDC). 2015. On-line climate weather inventories. [Online].
Available at http://www.ncdc.noaa.gov/cdo-web/datasets#ANNUAL (accessed 26 Jan. 2015)
Nelson, D.W. and L.E. Sommers. 1996. Total carbon, organic carbon, and organic matter. P.
961-1010. In: D.L. Sparks, editor, Methods of soil analysis. Part 3. SSSA Book Series 5.
SSSA, Madison, WI.
Norman, R., N. Slaton, and T. Roberts. 2013. Soil Fertility. In: Hardke, J.T., editor, Arkansas
Rice Production Handbook. Publication MP192. Univ. of Arkansas, Fayetteville. p. 69-101.
Norman, R.J., B.R. Wells, and K.A.K. Moldenhauer. 1989. Effect of application method and
dicyandiamide on urea-nitrogen-15 recovery in rice. Soil Sci. Soc. Am. J. 53:1269-1274.
Norman, R.J., C.E. Wilson Jr., and N.A. Slaton. 2003. Soil fertilization and mineral nutrition in
US mechanized rice culture. In: Smith, C.W. and R.H. Dilday, editors, Rice: Origin, History,
Technology, and Production. John Wiley & Sons, Inc., Hoboken, NJ. p. 331-412
Norman, R.J., C.E. Wilson, Jr., N.A. Slaton, B.R. Griggs, J.T. Bushong, and E.E. Gbur. 2009.
Nitrogen fertilizer sources and timing before flooding dry-seeded, delayed-flood rice. Soil
Sci. Soc. Am. J. 73:2184-2190. doi:10.2136/sssaj2008.0309.
Roberts, T.L., W.J. Ross, R.J. Norman, N.A. Slaton, and C.E. Wilson. 2011. Predicting nitrogen
fertilizer needs for rice in Arkansas using alkaline hydrolyzable-nitrogen. Soil Sci. Soc. Am.
J. 75:1161-1171. doi:10.2136/sssaj2010.0145.
Sainz Rozas, H.R., H.E. Echeverr´ıa, G.A. Studdert, and F.H. Andrade. 1999. No-tillage maize
nitrogen uptake and yield: Effect of source on denitrification and nitrous oxide emissions in a
maize- urease inhibitor and application time. Agron. J. 91:950–955.
doi:10.2134/agronj1999.916950x.
Schindler, F.V, and R.E. Knighton. 1999. Fate of fertilizer nitrogen applied to corn as estimated
by the isotopic and difference methods. Soil Sci. Soc. Am. J. 63:1734-1740.
Vaio, N., M.L. Cabrera, D.E. Kissel, J.A. Rema, J.F. Newsome, and V.H. Calvert. 2008.
Ammonia volatilization from urea-based fertilizers applied to tall fescue pastures in Georgia,
USA. Soil Sci. Soc. Am. J. 72:1665-1671. doi:10.2136/sssaj2007.0300.
Wilson, C.E., R.J. Norman, and B.R. Wells. 1989. Seasonal uptake patterns of fertilizer nitrogen
applied in split application to rice. Soil Sci. Soc. Am. J. 53:1884-1887.
55
Wilson, C.E., R.J. Norman, and B.R. Wells. 1990. Dicyandiamide influence on uptake of
preplant-applied fertilizer nitrogen by rice. Soil Sci. Soc. Am. J. 54:1157-1161.
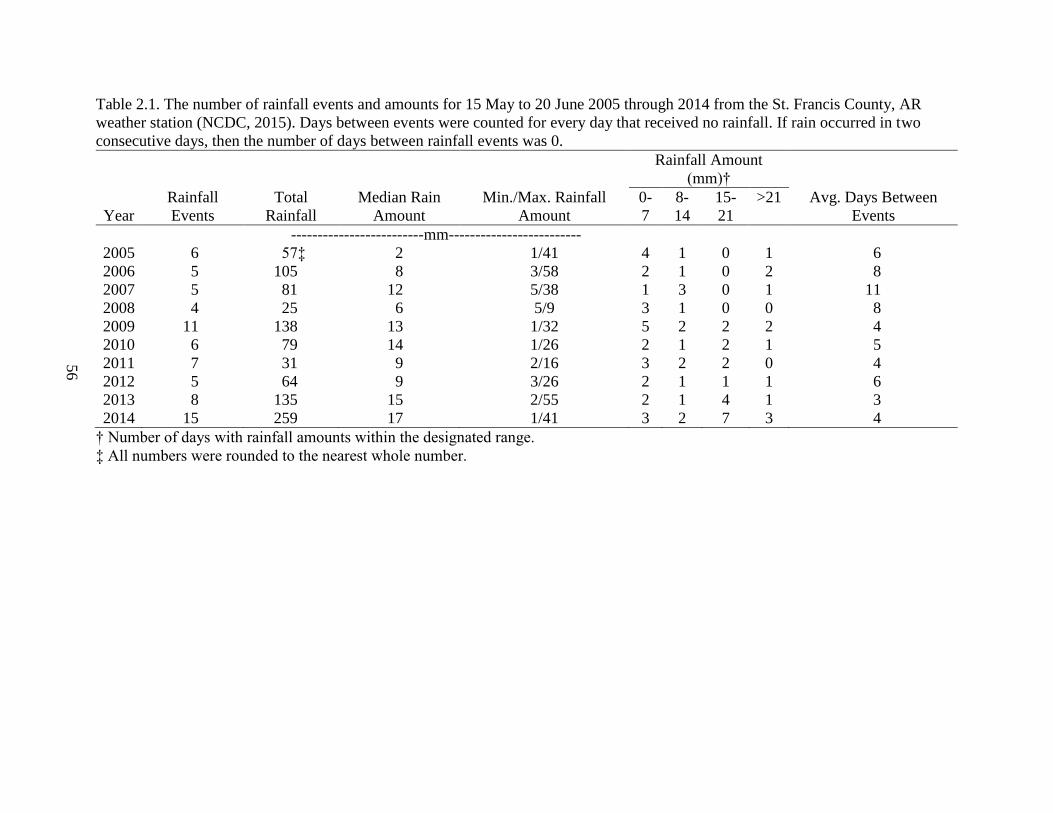
Table 2.1. The number of rainfall events and amounts for 15 May to 20 June 2005 through 2014 from the St. Francis County, AR
weather station (NCDC, 2015). Days between events were counted for every day that received no rainfall. If rain occurred in two
consecutive days, then the number of days between rainfall events was 0.
Rainfall Amount
(mm)†
Year
Rainfall
Events
Total
Rainfall
Median Rain
Amount
Min./Max. Rainfall
Amount
0-
7
8-
14
15-
21
>21 Avg. Days Between
Events
-------------------------mm-------------------------
2005 6 57‡ 2 1/41 4 1 0 1 6
2006 5 105 8 3/58 2 1 0 2 8
2007 5 81 12 5/38 1 3 0 1 11
2008 4 25 6 5/9 3 1 0 0 8
2009 11 138 13 1/32 5 2 2 2 4
2010 6 79 14 1/26 2 1 2 1 5
2011 7 31 9 2/16 3 2 2 0 4
2012 5 64 9 3/26 2 1 1 1 6
2013 8 135 15 2/55 2 1 4 1 3
2014 15 259 17 1/41 3 2 7 3 4
† Number of days with rainfall amounts within the designated range.
‡ All numbers were rounded to the nearest whole number.
56
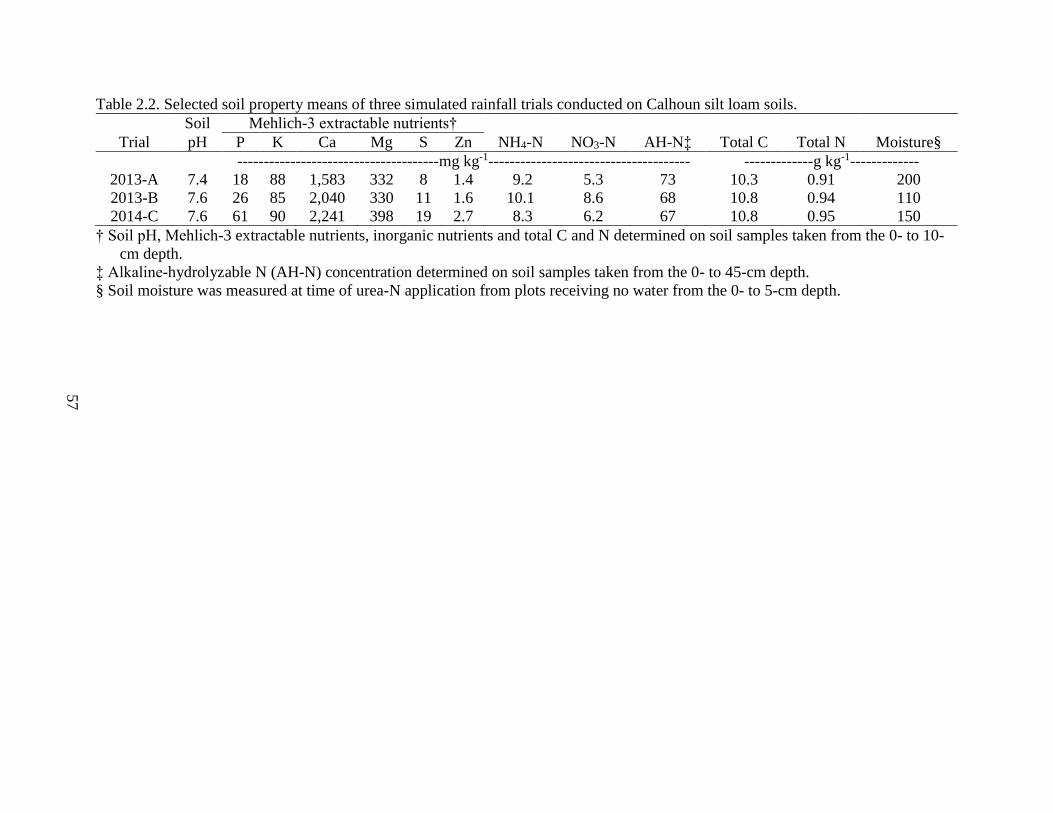
Table 2.2. Selected soil property means of three simulated rainfall trials conducted on Calhoun silt loam soils.
Soil Mehlich-3 extractable nutrients†
Trial pH P K Ca Mg S Zn NH4-N NO3-N AH-N‡ Total C Total N Moisture§
--------------------------------------mg kg-1-------------------------------------- -------------g kg-1-------------
2013-A 7.4 18 88 1,583 332 8 1.4 9.2 5.3 73 10.3 0.91 200
2013-B 7.6 26 85 2,040 330 11 1.6 10.1 8.6 68 10.8 0.94 110
2014-C 7.6 61 90 2,241 398 19 2.7 8.3 6.2 67 10.8 0.95 150
† Soil pH, Mehlich-3 extractable nutrients, inorganic nutrients and total C and N determined on soil samples taken from the 0- to 10-
cm depth.
‡ Alkaline-hydrolyzable N (AH-N) concentration determined on soil samples taken from the 0- to 45-cm depth.
§ Soil moisture was measured at time of urea-N application from plots receiving no water from the 0- to 5-cm depth.
57
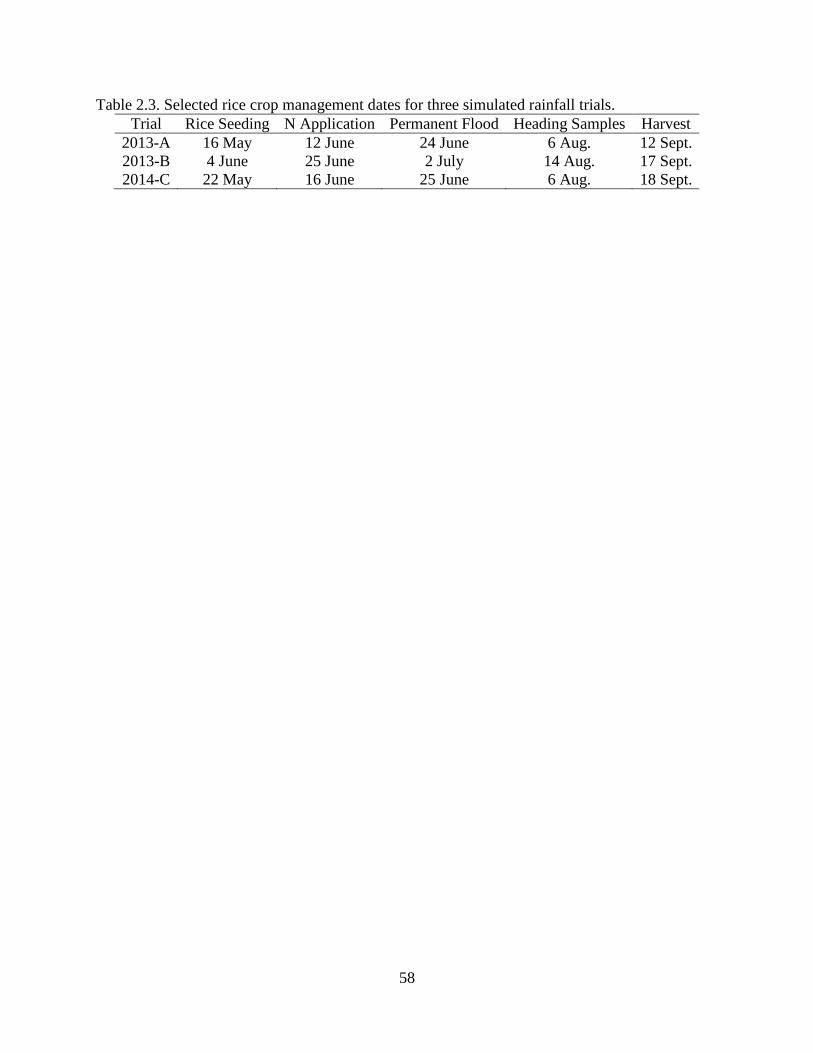
58
Table 2.3. Selected rice crop management dates for three simulated rainfall trials.
Trial Rice Seeding N Application Permanent Flood Heading Samples Harvest
2013-A 16 May 12 June 24 June 6 Aug. 12 Sept.
2013-B 4 June 25 June 2 July 14 Aug. 17 Sept.
2014-C 22 May 16 June 25 June 6 Aug. 18 Sept.

Table 2.4. Analysis of variance p-values for cumulative NH3 volatilization loss measured with semi-open chambers as affected by N
source (NS), trial (T), and their interactions across simulated rainfall amount (RA) defined by the final model for 2013-A and 2014-C
field experiments.
Days After Urea Application
Source of Variation df† 2 3 5 8 11
-----------------------------------P value-----------------------------------
T 1 --‡ -- -- -- --
NS 1 -- -- <0.0001 <0.0001 <0.0001
T×NS 1 <0.0001 <0.0001 -- -- --
RA 1 -- -- -- -- --
T×RA 1 -- -- -- -- --
NS×RA 1 -- -- <0.0001 <0.0001 <0.0001
T×NS×RA 1 <0.0001 0.0014 -- -- --
RA2 1 -- -- -- -- --
T×RA2 1 -- -- -- -- --
NS×RA2 1 -- -- <0.0001 <0.0001 <0.0001
T×NS×RA2 1 <0.0001 <0.0001 -- -- --
RA3 1 -- -- -- -- --
T×RA3 1 -- -- -- -- --
NS×RA3 1 -- -- -- -- --
T×NS×RA3 1 <0.0001 <0.0001 -- -- --
† The df for the final model is the sum of the df for each model term (intercept, linear, quadratic, and cubic) listed as a source of
variation. For example, for 2 d after urea application, the df for the intercept coefficient was 3 and for the cubic, quadratic, and linear
slope coefficients the df was 4.
‡ Not significant in the final model.
59
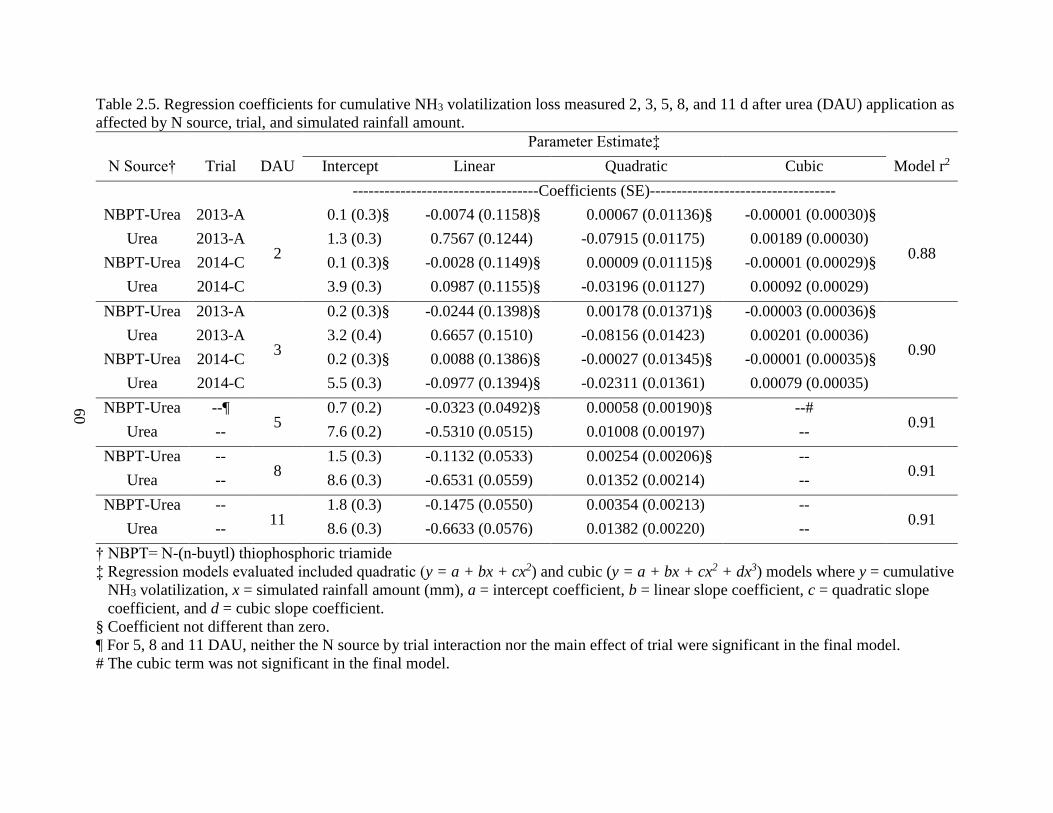
Table 2.5. Regression coefficients for cumulative NH3 volatilization loss measured 2, 3, 5, 8, and 11 d after urea (DAU) application as
affected by N source, trial, and simulated rainfall amount.
Parameter Estimate‡
N Source† Trial DAU Intercept Linear Quadratic Cubic Model r2
-----------------------------------Coefficients (SE)-----------------------------------
NBPT-Urea 2013-A
2
0.1 (0.3)§ -0.0074 (0.1158)§ 0.00067 (0.01136)§ -0.00001 (0.00030)§
0.88 Urea 2013-A 1.3 (0.3) 0.7567 (0.1244) -0.07915 (0.01175) 0.00189 (0.00030)
NBPT-Urea 2014-C 0.1 (0.3)§ -0.0028 (0.1149)§ 0.00009 (0.01115)§ -0.00001 (0.00029)§
Urea 2014-C 3.9 (0.3) 0.0987 (0.1155)§ -0.03196 (0.01127) 0.00092 (0.00029)
NBPT-Urea 2013-A
3
0.2 (0.3)§ -0.0244 (0.1398)§ 0.00178 (0.01371)§ -0.00003 (0.00036)§
0.90 Urea 2013-A 3.2 (0.4) 0.6657 (0.1510) -0.08156 (0.01423) 0.00201 (0.00036)
NBPT-Urea 2014-C 0.2 (0.3)§ 0.0088 (0.1386)§ -0.00027 (0.01345)§ -0.00001 (0.00035)§
Urea 2014-C 5.5 (0.3) -0.0977 (0.1394)§ -0.02311 (0.01361) 0.00079 (0.00035)
NBPT-Urea --¶ 5
0.7 (0.2) -0.0323 (0.0492)§ 0.00058 (0.00190)§ --# 0.91
Urea -- 7.6 (0.2) -0.5310 (0.0515) 0.01008 (0.00197) --
NBPT-Urea -- 8
1.5 (0.3) -0.1132 (0.0533) 0.00254 (0.00206)§ -- 0.91
Urea -- 8.6 (0.3) -0.6531 (0.0559) 0.01352 (0.00214) --
NBPT-Urea -- 11
1.8 (0.3) -0.1475 (0.0550) 0.00354 (0.00213) -- 0.91
Urea -- 8.6 (0.3) -0.6633 (0.0576) 0.01382 (0.00220) --
† NBPT= N-(n-buytl) thiophosphoric triamide
‡ Regression models evaluated included quadratic (y = a + bx + cx2) and cubic (y = a + bx + cx2 + dx3) models where y = cumulative
NH3 volatilization, x = simulated rainfall amount (mm), a = intercept coefficient, b = linear slope coefficient, c = quadratic slope
coefficient, and d = cubic slope coefficient.
§ Coefficient not different than zero.
¶ For 5, 8 and 11 DAU, neither the N source by trial interaction nor the main effect of trial were significant in the final model.
# The cubic term was not significant in the final model.
60

61
Table 2.6. Analysis of variance p-values for urea-N, NH4-N, NO3-N, and recovered-N content
expressed as the percentage of total-N applied as affected by N source (NS) across simulated
rainfall amount (RA) defined by the final model for the 2014-C field experiment.
Days After Urea Application
Soil-N Source of Variation df† 2 4
------------P value------------
Urea-N
NS 1 <0.0001 --‡
RA 1 -- --
NS×RA 1 <0.0001 <0.0001
RA2 1 -- --
NS×RA2 1 -- --
NH4-N
NS 1 <0.0001 --
RA 1 -- --
NS×RA 1 <0.0001 <0.0001
RA2 1 -- --
NS×RA2 1 -- <0.0001
NO3-N
NS 1 -- --
RA 1 <0.0001 --
NS×RA 1 -- 0.0026
RA2 1 -- --
NS×RA2 1 -- 0.0715
Recovered-N
NS 1 -- --
RA 1 -- 0.0136
NS×RA 1 <0.0001 --
RA2 1 -- 0.0139
NS×RA2 1 -- --
† The df for the final model is the sum of the df for each model term (intercept, linear, and
quadratic) listed as a source of variation.
‡ The model term or interaction was not significant in the final model at α = 0.15.
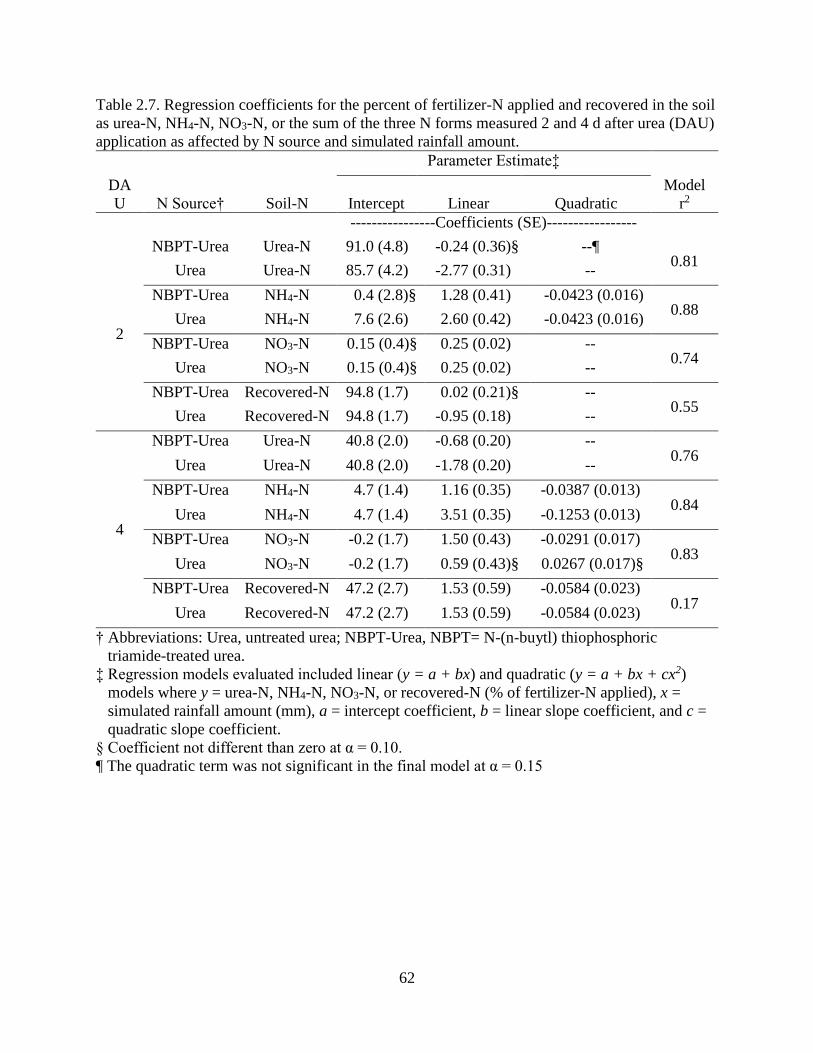
62
Table 2.7. Regression coefficients for the percent of fertilizer-N applied and recovered in the soil
as urea-N, NH4-N, NO3-N, or the sum of the three N forms measured 2 and 4 d after urea (DAU)
application as affected by N source and simulated rainfall amount.
Parameter Estimate‡
Model
r2
DA
U N Source† Soil-N Intercept Linear Quadratic
----------------Coefficients (SE)-----------------
2
NBPT-Urea Urea-N 91.0 (4.8) -0.24 (0.36)§ --¶ 0.81
Urea Urea-N 85.7 (4.2) -2.77 (0.31) --
NBPT-Urea NH4-N 0.4 (2.8)§ 1.28 (0.41) -0.0423 (0.016) 0.88
Urea NH4-N 7.6 (2.6) 2.60 (0.42) -0.0423 (0.016)
NBPT-Urea NO3-N 0.15 (0.4)§ 0.25 (0.02) -- 0.74
Urea NO3-N 0.15 (0.4)§ 0.25 (0.02) --
NBPT-Urea Recovered-N 94.8 (1.7) 0.02 (0.21)§ -- 0.55
Urea Recovered-N 94.8 (1.7) -0.95 (0.18) --
4
NBPT-Urea Urea-N 40.8 (2.0) -0.68 (0.20) -- 0.76
Urea Urea-N 40.8 (2.0) -1.78 (0.20) --
NBPT-Urea NH4-N 4.7 (1.4) 1.16 (0.35) -0.0387 (0.013) 0.84
Urea NH4-N 4.7 (1.4) 3.51 (0.35) -0.1253 (0.013)
NBPT-Urea NO3-N -0.2 (1.7) 1.50 (0.43) -0.0291 (0.017) 0.83
Urea NO3-N -0.2 (1.7) 0.59 (0.43)§ 0.0267 (0.017)§
NBPT-Urea Recovered-N 47.2 (2.7) 1.53 (0.59) -0.0584 (0.023) 0.17
Urea Recovered-N 47.2 (2.7) 1.53 (0.59) -0.0584 (0.023)
† Abbreviations: Urea, untreated urea; NBPT-Urea, NBPT= N-(n-buytl) thiophosphoric
triamide-treated urea.
‡ Regression models evaluated included linear (y = a + bx) and quadratic (y = a + bx + cx2)
models where y = urea-N, NH4-N, NO3-N, or recovered-N (% of fertilizer-N applied), x =
simulated rainfall amount (mm), a = intercept coefficient, b = linear slope coefficient, and c =
quadratic slope coefficient.
§ Coefficient not different than zero at α = 0.10.
¶ The quadratic term was not significant in the final model at α = 0.15
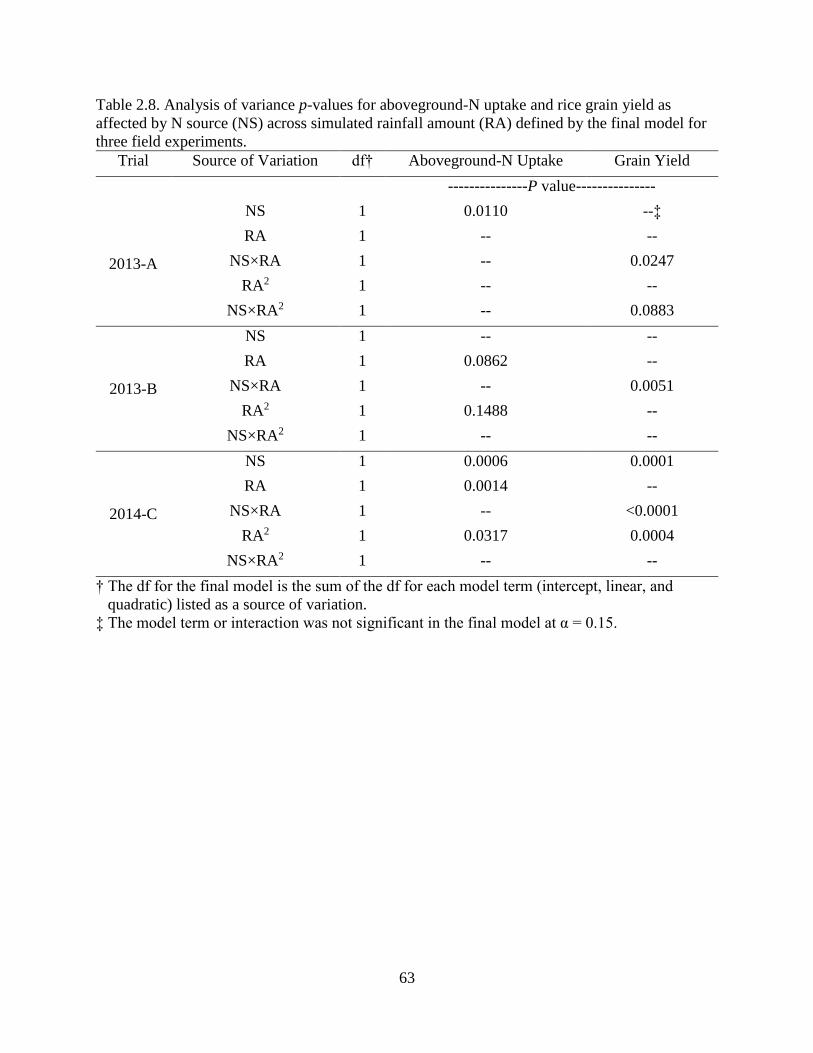
63
Table 2.8. Analysis of variance p-values for aboveground-N uptake and rice grain yield as
affected by N source (NS) across simulated rainfall amount (RA) defined by the final model for
three field experiments.
Trial Source of Variation df† Aboveground-N Uptake Grain Yield
---------------P value---------------
2013-A
NS 1 0.0110 --‡
RA 1 -- --
NS×RA 1 -- 0.0247
RA2 1 -- --
NS×RA2 1 -- 0.0883
2013-B
NS 1 -- --
RA 1 0.0862 --
NS×RA 1 -- 0.0051
RA2 1 0.1488 --
NS×RA2 1 -- --
2014-C
NS 1 0.0006 0.0001
RA 1 0.0014 --
NS×RA 1 -- <0.0001
RA2 1 0.0317 0.0004
NS×RA2 1 -- --
† The df for the final model is the sum of the df for each model term (intercept, linear, and
quadratic) listed as a source of variation.
‡ The model term or interaction was not significant in the final model at α = 0.15.
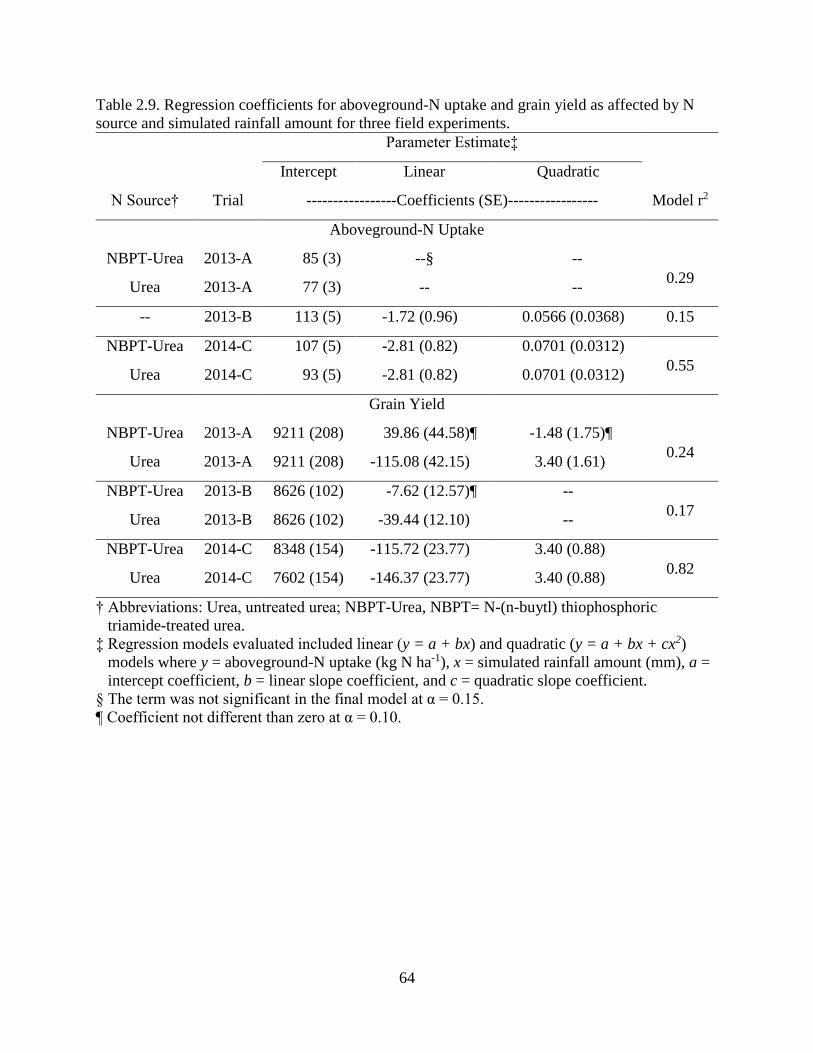
64
Table 2.9. Regression coefficients for aboveground-N uptake and grain yield as affected by N
source and simulated rainfall amount for three field experiments.
Parameter Estimate‡
Intercept Linear Quadratic
N Source† Trial -----------------Coefficients (SE)----------------- Model r2
Aboveground-N Uptake
NBPT-Urea 2013-A 85 (3) --§ --
0.29 Urea 2013-A 77 (3) -- --
-- 2013-B 113 (5) -1.72 (0.96) 0.0566 (0.0368) 0.15
NBPT-Urea 2014-C 107 (5) -2.81 (0.82) 0.0701 (0.0312)
0.55 Urea 2014-C 93 (5) -2.81 (0.82) 0.0701 (0.0312)
Grain Yield
NBPT-Urea 2013-A 9211 (208) 39.86 (44.58)¶ -1.48 (1.75)¶
0.24 Urea 2013-A 9211 (208) -115.08 (42.15) 3.40 (1.61)
NBPT-Urea 2013-B 8626 (102) -7.62 (12.57)¶ --
0.17 Urea 2013-B 8626 (102) -39.44 (12.10) --
NBPT-Urea 2014-C 8348 (154) -115.72 (23.77) 3.40 (0.88)
0.82 Urea 2014-C 7602 (154) -146.37 (23.77) 3.40 (0.88)
† Abbreviations: Urea, untreated urea; NBPT-Urea, NBPT= N-(n-buytl) thiophosphoric
triamide-treated urea.
‡ Regression models evaluated included linear (y = a + bx) and quadratic (y = a + bx + cx2)
models where y = aboveground-N uptake (kg N ha-1), x = simulated rainfall amount (mm), a =
intercept coefficient, b = linear slope coefficient, and c = quadratic slope coefficient.
§ The term was not significant in the final model at α = 0.15.
¶ Coefficient not different than zero at α = 0.10.
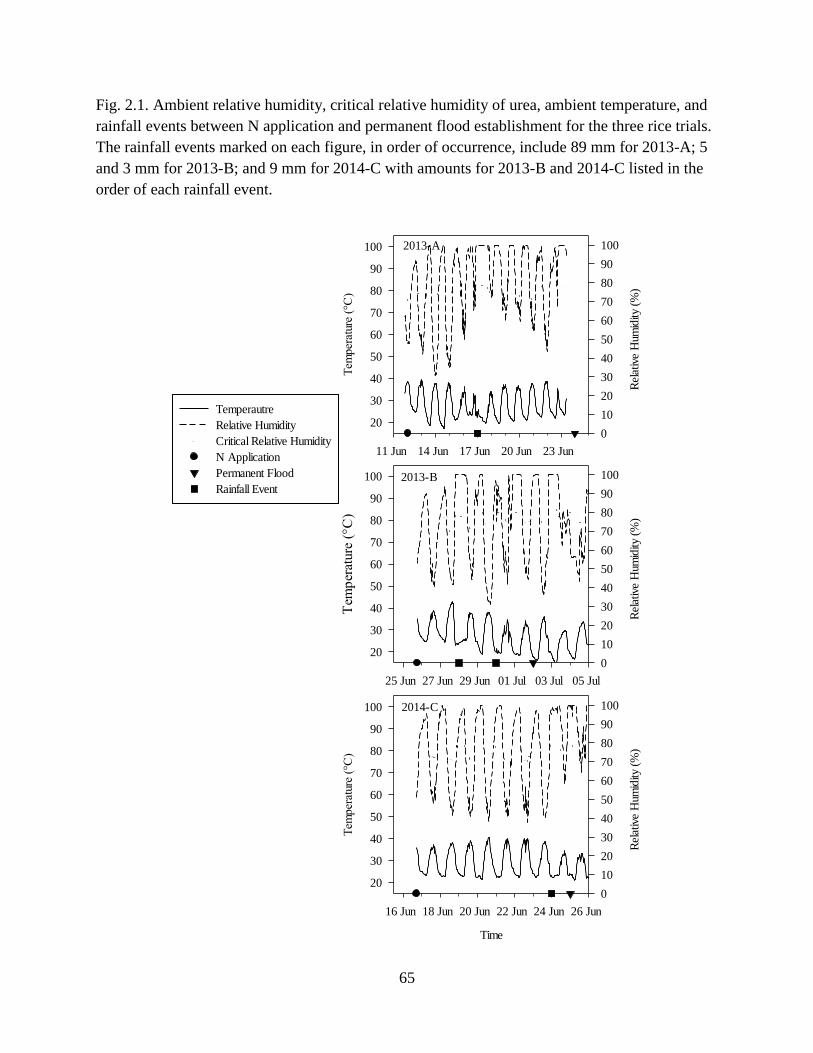
65
Fig. 2.1. Ambient relative humidity, critical relative humidity of urea, ambient temperature, and
rainfall events between N application and permanent flood establishment for the three rice trials.
The rainfall events marked on each figure, in order of occurrence, include 89 mm for 2013-A; 5
and 3 mm for 2013-B; and 9 mm for 2014-C with amounts for 2013-B and 2014-C listed in the
order of each rainfall event.
2013-A
11 Jun 14 Jun 17 Jun 20 Jun 23 Jun
Tem
per
atur
e (°
C)
20
30
40
50
60
70
80
90
100
Rel
ativ
e H
umid
ity (
%)
0
10
20
30
40
50
60
70
80
90
100
Temperautre
Relative Humidity
Critical Relative Humidity
N Application
Permanent Flood
Rainfall Event2013-B
25 Jun 27 Jun 29 Jun 01 Jul 03 Jul 05 Jul
Tem
per
ature
(°C
)
20
30
40
50
60
70
80
90
100
Rel
ativ
e H
umid
ity (
%)
0
10
20
30
40
50
60
70
80
90
100
2014-C
Time
16 Jun 18 Jun 20 Jun 22 Jun 24 Jun 26 Jun
Tem
per
atur
e (°
C)
20
30
40
50
60
70
80
90
100
Rel
ativ
e H
umid
ity (
%)
0
10
20
30
40
50
60
70
80
90
100
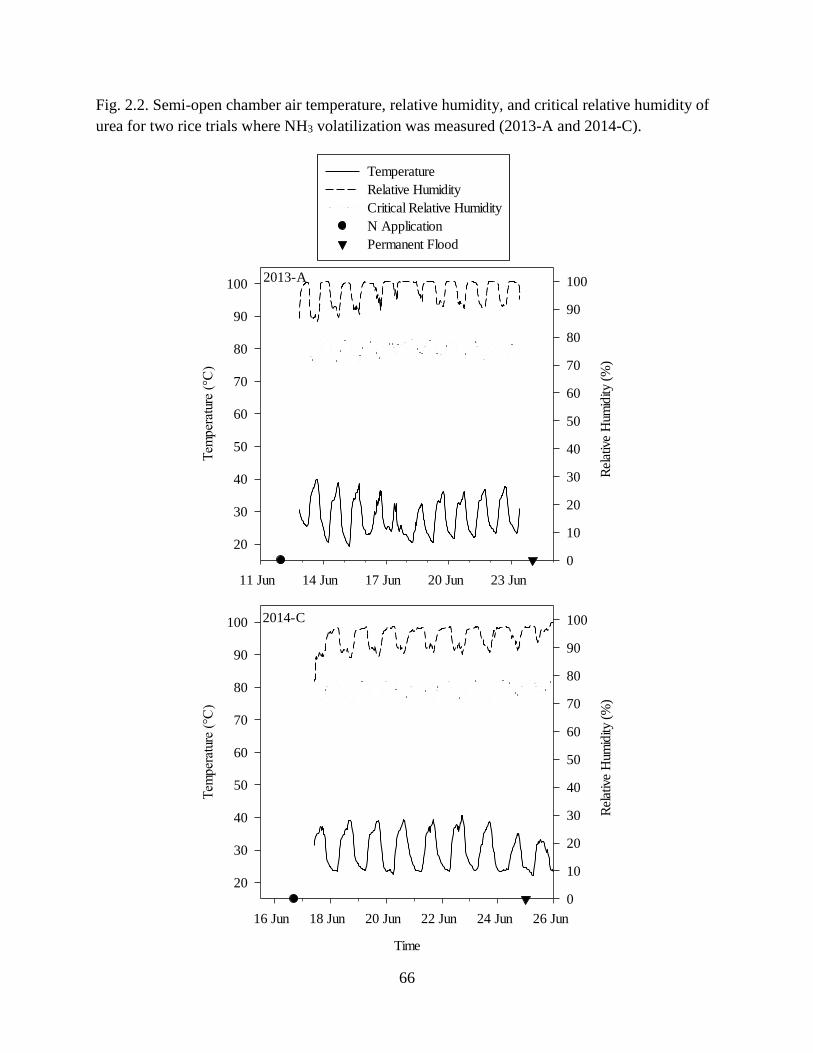
66
Fig. 2.2. Semi-open chamber air temperature, relative humidity, and critical relative humidity of
urea for two rice trials where NH3 volatilization was measured (2013-A and 2014-C).
2014-C
Time
16 Jun 18 Jun 20 Jun 22 Jun 24 Jun 26 Jun
Tem
per
atur
e (°
C)
20
30
40
50
60
70
80
90
100
Rel
ativ
e H
umid
ity (
%)
0
10
20
30
40
50
60
70
80
90
100
2013-A
11 Jun 14 Jun 17 Jun 20 Jun 23 Jun
Tem
per
atur
e (°
C)
20
30
40
50
60
70
80
90
100
Rel
ativ
e H
umid
ity (
%)
0
10
20
30
40
50
60
70
80
90
100
Temperature
Relative Humidity
Critical Relative Humidity
N Application
Permanent Flood
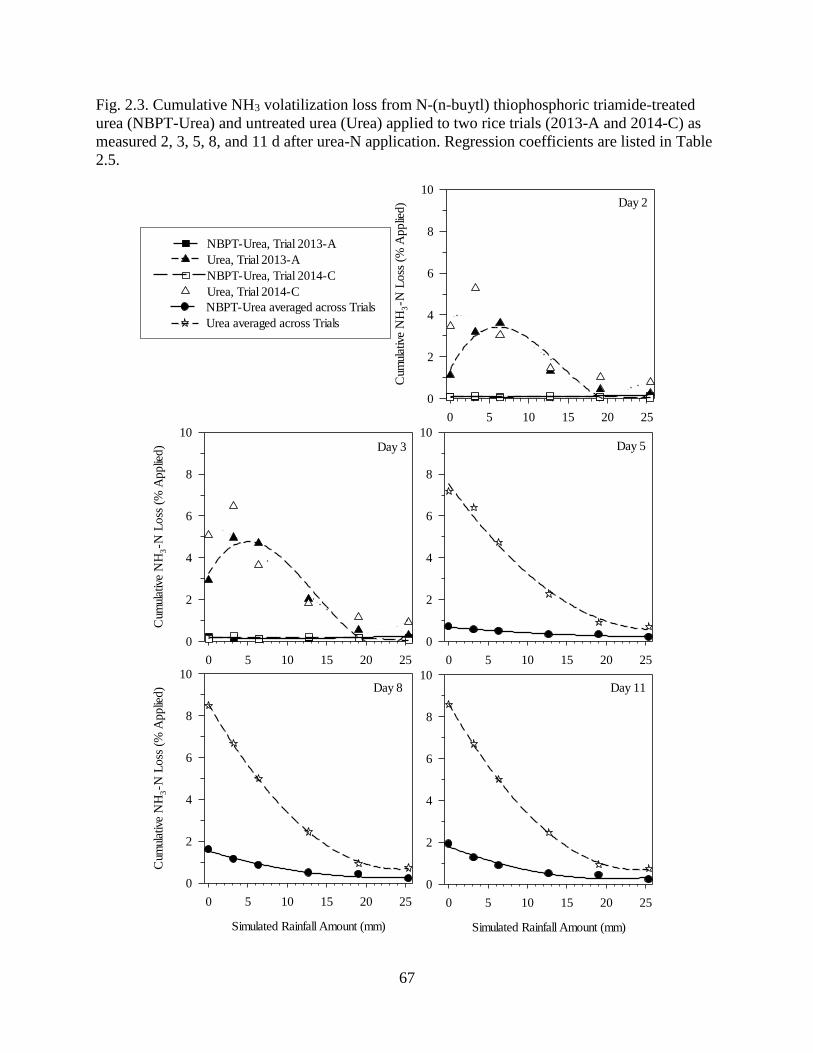
67
Fig. 2.3. Cumulative NH3 volatilization loss from N-(n-buytl) thiophosphoric triamide-treated
urea (NBPT-Urea) and untreated urea (Urea) applied to two rice trials (2013-A and 2014-C) as
measured 2, 3, 5, 8, and 11 d after urea-N application. Regression coefficients are listed in Table
2.5.
Day 3
0 5 10 15 20 25
Cum
ulat
ive
NH
3-N
Loss
(%
Applie
d)
0
2
4
6
8
10
Day 8
Simulated Rainfall Amount (mm)
0 5 10 15 20 25
Cum
ulat
ive
NH
3-N
Loss
(%
Applie
d)
0
2
4
6
8
10Day 11
Simulated Rainfall Amount (mm)
0 5 10 15 20 25
0
2
4
6
8
10
Day 5
0 5 10 15 20 25
0
2
4
6
8
10
Day 2
0 5 10 15 20 25
Cum
ulat
ive
NH
3-N
Loss
(%
Applie
d)
0
2
4
6
8
10
NBPT-Urea, Trial 2013-A
Urea, Trial 2013-A
NBPT-Urea, Trial 2014-C
Urea, Trial 2014-C
NBPT-Urea averaged across Trials
Urea averaged across Trials
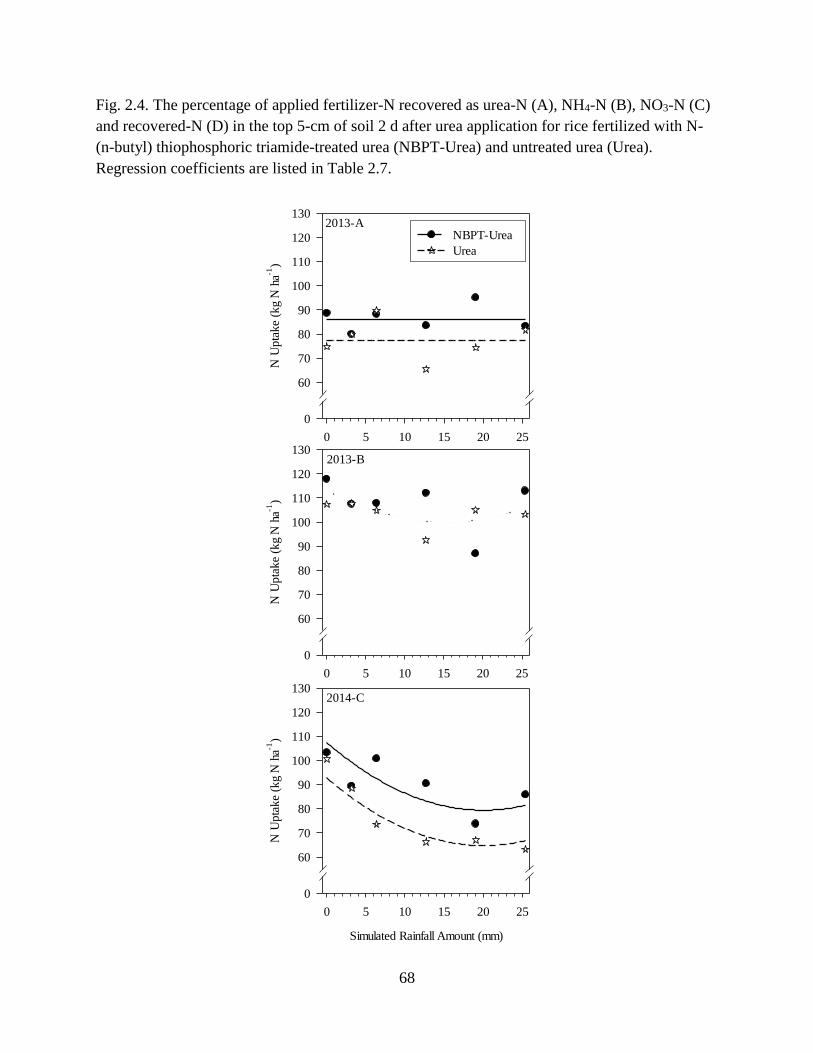
68
Fig. 2.4. The percentage of applied fertilizer-N recovered as urea-N (A), NH4-N (B), NO3-N (C)
and recovered-N (D) in the top 5-cm of soil 2 d after urea application for rice fertilized with N-
(n-butyl) thiophosphoric triamide-treated urea (NBPT-Urea) and untreated urea (Urea).
Regression coefficients are listed in Table 2.7.
2013-A
0 5 10 15 20 25
N U
pta
ke
(kg
N h
a-1)
0
60
70
80
90
100
110
120
130
2013-B
0 5 10 15 20 25
N U
pta
ke
(kg
N h
a-1)
0
60
70
80
90
100
110
120
130
2014-C
Simulated Rainfall Amount (mm)
0 5 10 15 20 25
N U
pta
ke
(kg
N h
a-1)
0
60
70
80
90
100
110
120
130
NBPT-Urea
Urea
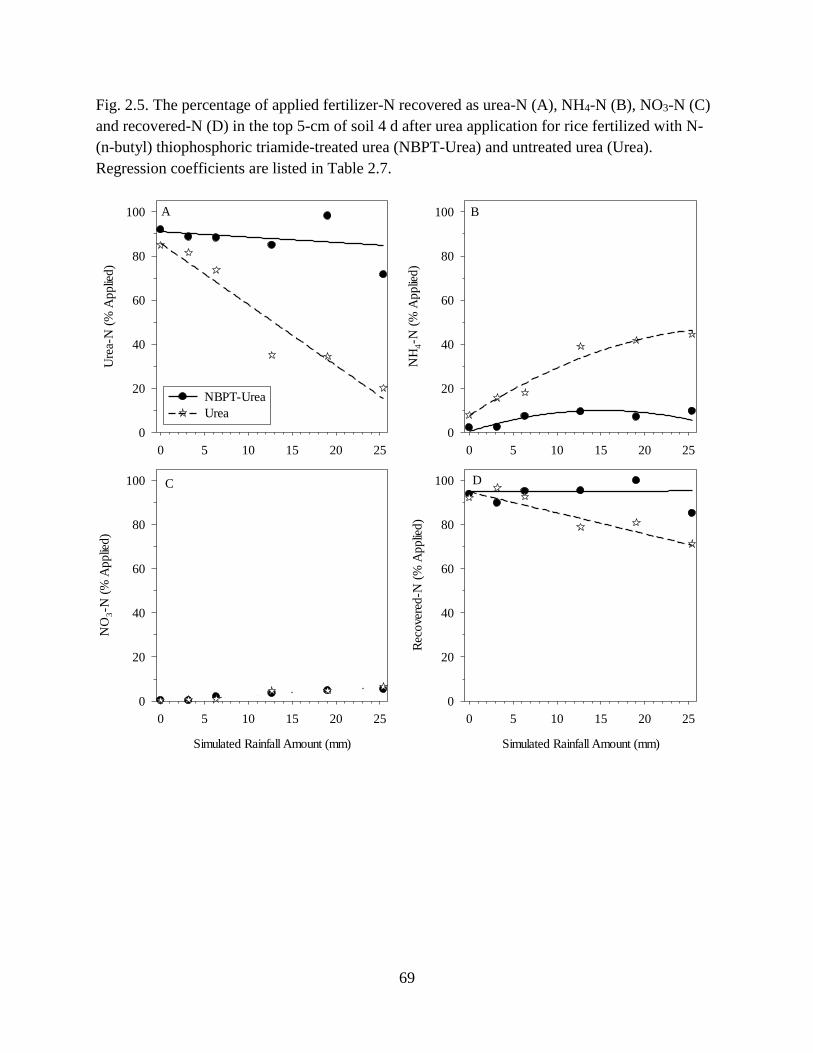
69
Fig. 2.5. The percentage of applied fertilizer-N recovered as urea-N (A), NH4-N (B), NO3-N (C)
and recovered-N (D) in the top 5-cm of soil 4 d after urea application for rice fertilized with N-
(n-butyl) thiophosphoric triamide-treated urea (NBPT-Urea) and untreated urea (Urea).
Regression coefficients are listed in Table 2.7.
0 5 10 15 20 25
Ure
a-N
(%
Applie
d)
0
20
40
60
80
100
0 5 10 15 20 25
NH
4-N
(%
Applie
d)
0
20
40
60
80
100
Simulated Rainfall Amount (mm)
0 5 10 15 20 25
NO
3-N
(%
Ap
plie
d)
0
20
40
60
80
100
Simulated Rainfall Amount (mm)
0 5 10 15 20 25
Rec
ove
red
-N (
% A
pplie
d)
0
20
40
60
80
100
A B
C D
NBPT-Urea
Urea

70
Fig. 2.6. Mean aboveground-N uptake at early heading by rice fertilized with N-(n-buytl)
thiophosphoric triamide-treated urea (NBPT-Urea) and untreated urea (Urea) from three trials
(2013-A, 2013-B, and 2014-C). Regression coefficients listed in Table 2.9.
0 5 10 15 20 25
Ure
a-N
(%
Applie
d)
0
20
40
60
80
100
0 5 10 15 20 25N
H4-N
(%
Applie
d)
0
20
40
60
80
100
Simulated Rainfall Amount (mm)
0 5 10 15 20 25
NO
3-N
(%
Applie
d)
0
20
40
60
80
100
Simulated Rainfall Amount (mm)
0 5 10 15 20 25
Rec
ove
red-N
(%
Applie
d)
0
20
40
60
80
100
A B
C D
NBPT-Urea
Urea

71
Fig. 2.7. Mean grain yield of rice fertilized with N-(n-butyl) thiophosphoric triamide-treated urea
(NBPT-Urea) and untreated urea (Urea) from three trials (2013-A, 2013-B, and 2014-C).
Regression coefficients are listed in Table 2.9.
0 5 10 15 20 25
Gra
in Y
ield
(kg
ha-1
)
0
5000
6000
7000
8000
9000
100002013-A
0 5 10 15 20 25
Gra
in Y
ield
(kg
ha-1
)
0
5000
6000
7000
8000
9000
100002013-B
Simulated Rainfall Amount (mm)
0 5 10 15 20 25
Gra
in Y
ield
(kg
ha-1
)
0
5000
6000
7000
8000
9000
100002014-C
NBPT-Urea
Urea
72
CHAPTER 3
Rice Grain Yield and Nitrogen Uptake as Affected by
Urea Amendment and Simulated Rainfall Timing
73
ABSTRACT
Nitrogen loss in the delayed-flood method of rice (Oryza sativa L.) production is
minimized by applying urea to a dry soil, use of a urease inhibitor, and immediate flooding. The
time required to flood fields is often a factor limiting efficient fertilizer-N recovery. Our
objectives were to compare the effects of simulated rainfall timing, N-(n-butyl) thiophosphoric
triamide (NBPT) rate, and nitrapyrin (NP) rate on rice N uptake and grain yield. Field
experiments were conducted to evaluate rice growth as affected by two NBPT rates (0 and 0.89 g
NBPT kg-1 urea), two NP rates (0 and 572 g NP ha-1), and three simulated rainfall timings [no
simulated rainfall (NOSR), simulated rainfall before N (SRBN), and simulated rainfall after N
(SRAN)]. Yield was unaffected by simulated rainfall timing when rice was fertilized with
NBPT-treated urea (7904-8264 kg ha-1). When rice was fertilized with untreated urea, grain
yields were greater with NOSR than with SRAN or SRBN. Within each simulated rainfall
timing, rice yields were 6.9 to 21.3% greater when NBPT-treated urea was applied. Nitrapyrin
rate had no effect on grain yield in 2013, but, compared to untreated urea, NP-treated urea
decreased yield by 5.6% in 2014. Application of urea to moist soil or dry soil followed by
rainfall are field environments that result in more substantial N loss than urea applied to a dry
soil that remains dry until the rice field is flooded. Use of NBPT-treated urea minimized N loss
and maximized grain yield in each simulated rainfall scenario examined.
74
INTRODUCTION
Urea is the ammonium-forming fertilizer most commonly used to fertilize flood-irrigated
rice (Oryza sativa L.) because of its high N analysis, low cost relative to other N-containing
fertilizers (USDA-ERS, 2013), and lack of NO3-N. Despite these favorable characteristics, urea
is also the granular N fertilizer that is most prone to NH3 volatilization. Urea management is
based on two fundamental principles that include application to a dry soil surface (Greaves and
Carter, 1920; Vlek and Carter, 1983) and timely incorporation into the soil with tillage or
sufficient rainfall or irrigation (Ernst and Massey, 1960; Holcomb et al., 2011). Ernst and
Massey (1960) reported that NH3 loss decreased from 20 to 10% of the surface-applied urea-N as
soil moisture content decreased from 375 to 210 g H2O kg-1 soil. Research characterizing NH3
volatilization shows that 2 d is needed to surpass the soil’s ability to buffer the NH3 formed by
surface-applied urea and convert it into NH4 (Beyrouty et al., 1988; Clay et al., 1990). Ammonia
volatilization loss usually peaks 5 to 8 d after urea application under warm, humid conditions
depending on the method used to measure NH3 volatilization (Norman et al., 1992; McGinn and
Janze, 1998; Holcomb et al., 2011; Massey et al., 2011). Factors like crop residue (Kissel et al.,
2009), urea application rate (Sainz Rozas et al., 2004; Kissel et al., 2013), soil cation exchange
capacity (Fenn and Kissel, 1976), and soil pH (Ernst and Massey, 1960) influence the magnitude
and rate of NH3 loss from surface-applied urea. Application of an effective urease inhibitor has
also been shown to reduce NH3 volatilization loss in both laboratory (Goos, 2013) and field
(Norman et al., 2006; 2009) environments and is now considered a third principle for successful
management of urea applied in environments conducive for NH3 loss.
The two primary N-loss pathways present in flood-irrigated rice production systems are
NH3 volatilization and denitrification. Ammonia volatilization is considered the primary N-loss
75
pathway in the mid-South USA rice production system because urea is usually applied to the soil
surface immediately before flooding and the anaerobic, flooded soil conditions prevent
nitrification. The direct-seeded, delayed-flood rice production system used in the mid-South is a
highly-managed system that seeks to minimize NH3 loss by applying 70 to 100% of the N
requirement as urea to a dry soil surface at the 4- to 5-leaf stage and establishing a 5- to 10-cm
deep flood as quickly as possible to incorporate the urea-N into the soil and stop NH3
volatilization and nitrification (Norman et al., 2013). The flooded soil condition is generally
maintained for the duration of the season until the field is prepared for harvest. The ability to
apply urea to a dry soil surface and rapidly incorporate it with irrigation water is sometimes
compromised by weather events, field size, pumping capacity, or combinations of these factors.
Two situations that require further research to develop best-management practices that
enhance fertilizer-N uptake efficiency and reduce gaseous N losses into the atmosphere include
moist soil conditions i) at the time of urea application (e.g., from frequent and untimely rainfall)
and ii) during the period between urea application and establishing the permanent flood, which
can take more than 10 d in some fields. Norman et al. (1992) reported the preflood-N and
permanent flood could be delayed up to 21 d after the 5-leaf growth stage of the obsolete, longer-
season varieties grown in the 1980s with no detrimental effect on grain yield. However, delaying
the flood while waiting on dry soil conditions for urea application may increase weed
competition, increase weed control costs, increase the incidence and severity of some diseases,
and delay rice maturation. Farmers often decide the risks of waiting for fields to dry are too great
and apply the preflood urea to a moist soil and establish the flood. Application of urea to a moist
soil surface is generally considered to increase NH3 loss (Ernst and Massey, 1960; Norman et al.,
2006). However, Ferguson and Kissel (1986) reported a decrease in NH3 volatilization when
76
urea-N was applied to a moist soil and the soil dried rapidly. Rainfall shortly after urea-N is
applied to a dry soil may incorporate the urea and prevent or reduce NH3 loss, but the moisture
from rainfall may accentuate nitrification of the applied urea before the flood is established with
the end result of increasing total-N loss through a combination of NH3 volatilization and
denitrification.
The use of NBPT-containing urease inhibitors as a tool for reducing NH3 loss is well
documented under a variety of field situations (Rawluk et al., 2001; Norman et al., 2006, 2009).
However, the literature contains very limited information regarding N and rice yield losses from
denitrification and whether nitrification inhibitors might be effective N management tools for
fields that require a substantial amount of time to establish the flood. Two common nitrification
inhibitors, 2-chloro-6-(trichloromethyl)-prydine (nitrapyrin, NP) and dicyandiamide (DCD),
have been researched in flooded rice and sold commercially in the USA. Nitrification inhibitors
slow the conversion of NH4 to NO3 by influencing the activity of ammonia-oxidizing bacteria,
like Nitrosomonas, in the soil (Hauck, 1980). Research with NP and DCD in rice has shown the
inhibitors to effectively reduce nitrification in some soils while having little to no effect in other
soils (Wells, 1977; Sharma and Prasad, 1980; Wells et al., 1989; Wilson et al., 1990; Watanabe,
2006; Golden et al., 2009).
Our research objectives were to compare the effects of simulated rainfall timing and
NBPT and NP rates applied to urea-N on rice N uptake and grain yield. We hypothesized that i)
the use of an NBPT-containing urease inhibitor would significantly reduce N loss when urea was
applied to a dry or moist soil surface and ii) the addition of the NP nitrification inhibitor would
reduce N losses associated with NO3-N (e.g., denitrification). We also anticipated that urea-N
applied to a dry soil surface or incorporated by an adequate rainfall amount would reduce NH3
77
volatilization compared to urea applied to a moist soil, and rice grain yield would decline when
urea-N was incorporated by rainfall due to more favorable conditions for nitrification of fertilizer
N followed by denitrification after flood establishment.
MATERIALS AND METHODS
SITE DESCRIPTION
Two field experiments with rice were established at the University of Arkansas Division
of Agriculture Pine Tree Research Station near Colt, AR in 2013 and 2014. Soil for each site was
mapped as a Calhoun silt loam (fine-silty, mixed, active, thermic Typic Glossaqualfs). For each
experiment, a composite soil sample was collected from the 0-10 cm depth and a second
composite sample was collected from the 0-45 cm depth. Soil samples were dried at 55°C and
crushed to pass through a 2-mm sieve. The 0- to 10-cm depth sample was analyzed for soil water
pH (1:2 soil volume: water volume ratio), Mehlich-3 extractable nutrients (Helmke and Sparks,
1996), total C and N (Nelson and Sommers, 1996), and NO3-N and NH4-N concentrations
(Mulvaney, 1996; Table 3.1). The 0- to 45-cm depth sample was analyzed for alkaline-
hydrolyzable N using direct-steam distillation (Roberts et al., 2011). Rice followed soybean
[Glycine max (L.) Merr.] at both site-years. Phosphorus, K, and Zn fertilizers were applied based
on University of Arkansas soil-test recommendations. The amounts of fertilizer nutrients applied
varied between the site-years, but the rates were sufficient to produce near-maximal grain yields
for rice grown on silt-loam soils.
Rice was drill-seeded into conventionally tilled seedbeds with 101 kg ha-1 of ‘CL152’
rice or 95 kg ha-1 of ‘CL111’ rice on the dates listed in Table 3.2. Individual plots were 2.3-m
long and 1.8-m wide, which allowed for nine rows of rice with a 19.1 cm row spacing. A 0.4-m
wide, plant-free alley surrounded each plot. Crop management practices were similar to
78
guidelines recommended for the dry-seeded, delayed-flood rice cultural system (Hardke et al.,
2013), except establishment of the permanent flood was delayed for at least 9 d after urea-N
application.
TREATMENTS
Each experiment was a randomized complete block design with a 2 (NP rate) by 2
(NBPT rate) by 3 (simulated rainfall timing) factorial treatment structure and four blocks
including each treatment. The N source used in both experiments was granular urea (460 g N kg-
1) applied at 112 kg N ha-1 in 2013 or 118 kg N ha-1 in 2014. Each N fertilizer rate was applied at
80% of the N rate predicted to produce maximum (100%) grain yield by the N Soil Test for Rice
(Roberts et al., 2011). A suboptimal N rate was used to ensure that potential differences in N loss
among treatments would result in grain yield differences. The nitrification inhibitor NP was
applied at two rates [0 and 572 g NP ha-1; Instinct (222 g NP L-1); Dow Agrosciences,
Indianapolis, IN]. The urease inhibitor NBPT was also applied at two rates [0 and 0.89 g NBPT
kg-1 urea; Agrotain Ultra (285 g NBPT L-1), Koch Fertilizer LLC., Wichita, KS]. The NP and
NBPT were hand applied to the urea within 1 wk of field application.
Each of the four possible urease and nitrification inhibitor combinations were represented
in three different simulated rainfall treatments including no simulated rainfall (NOSR), simulated
rainfall applied before N application (SRBN), and simulated rainfall applied after N application
(SRAN). For the SRBN treatment, simulated rainfall was applied 4 (2014) to 18 h (2013) before
the N fertilizer to simulate urea being applied to a moist soil with no standing water. For the
SRAN treatment, the simulated rainfall was applied 5 (2013) to 20 h (2014) following N
application.
79
Prior to N application, two, 7.6 cm (i.d.) × 5.1 cm (deep) soil samples were composited
from each no-N plot receiving the three simulated rainfall timing treatments in each block, to
assess soil moisture at the time of N application and bulk density. The mean (n = 12 soil
samples) bulk density was 1.35 g cm-3 (s = 0.04 g cm-3) for 2013 and 1.36 g cm-3 (s = 0.01 g cm-
1) for 2014. Nitrogen was applied in a single-preflood application at the 4- to 5-leaf stage as
recommended by the University of Arkansas (Norman et al., 2013) in an area that matched the
size of the mobile rainfall simulator. The specific application dates are listed in Table 3.2.
The portable rainfall simulators were 1.8-m wide × 2.3-m long. Each simulator was
equipped with two Rain Bird (Rain Bird Corp., Azusa, CA and Tucson, AZ) SQ Series full circle
and two Rain Bird SQ Series half-circle nozzles positioned 68.6-cm apart and 73.7-cm above the
ground on a 2.5-cm polyvinyl chloride tube frame. Water was delivered to the nozzles through a
1.3-cm (i.d.) polyethylene tubing (Raindrip, Inc. subsidiary of NDS, Inc., Woodland Hills, CA),
which was connected to a 94.6-L spray tank (County Line Deluxe Spot Sprayer; Green Leaf,
Inc., Fontanet, IN). The desired amount of simulated rainfall was 12.7 mm and was applied at a
rate of 14 mm h-1. Holcomb et al. (2011) reported that a minimum of 14.6-mm of rainfall was
need to incorporate urea-N and significantly reduce NH3 volatilization on an Adkins fine sandy
loam (coarse-loamy, mixed superactive, mesic Xeric Haplocalcids). For 2013, only 7.6 mm of
simulated rainfall was applied due to the higher initial soil moisture content (Table 3.1). A
permanent flood was established 9 to 13 d after urea-N application (Table 3.2).
Temperature and relative humidity were measured every 30 min (Fig. 3.1) using data
loggers (HOBO Pro v2-Part No. U23-001, Onset Computer Corp. Inc., Proccasett, MA) that
were suspended 1.3-cm above the soil surface in each block (n = 4) to calculate the percent
critical relative humidity [84.669 – 0.1457T – 0.0055T2, where T = temperature in C; Vaio et
80
al., 2008]. The critical relative humidity is the minimum relative humidity that urea dissolves
from the moisture in the air and is reported to have a substantial influence on the urea hydrolysis
rate and NH3 volatilization amount (Vaio et al., 2008).
MEASUREMENTS
Whole, aboveground plant samples were collected at early heading by harvesting a 0.91-
m section from an inside row to assess N uptake. Plant samples were collected when rice was 5
to 10% headed, which represents the growth stage of maximum N accumulation by rice grown in
the direct-seeded, delayed-flood system (Guindo et al., 1994). Plant samples were placed in
paper bags, dried to a constant weight at 60°C, weighed for dry matter accumulation, and ground
to pass through a 1-mm sieve. Total-N uptake was measured for each treatment by weighing a
subsample of the ground plant tissue into a crucible and determining total-N concentration by
combustion [elementar vario Max CN (2013); elementar rapid N III (2014), Elementar
Analysensysteme GmbH, Hanau, Germany; Campbell, 1992). Aboveground-N content (kg N ha-
1) was calculated as the product of aboveground dry matter and N concentration. The net-N
uptake by rice was calculated using the difference method (Schindler and Knighton, 1999), in
which the mean aboveground-N uptake of rice receiving no N (0 kg N ha-1) was subtracted from
the mean aboveground-N uptake of each treatment receiving N.
At maturity, a 3.5-m2 section from eight of the nine rows in each plot was harvested for
grain yield using a small-plot combine. Immediately after harvest, grain weight and moisture
were determined for each plot. The grain yields were adjusted to a uniform moisture content of
120 g H2O kg-1 for statistical analysis.
STATISTICAL ANALYSIS
81
The data were analyzed using a split-plot treatment structure with trial year (fixed effect)
as the main plot and the 2 (NP rate, fixed effect) × 2 (NBPT rate, fixed effect) × 3 (simulated
rainfall timing, fixed effect) factorial treatment structure as the subplot. The no-N control was
not included in the ANOVA. A second ANOVA was performed by trial year to determine
whether simulated rainfall timing influenced dry matter, tissue N concentration, N uptake and
grain yield for rice receiving no N and showed there was no difference among rainfall timings
when no N was applied (data not shown). Therefore, means and standard deviations of the no-N
control are given for reference. All statistical analyses were performed using the MIXED
procedure in SAS version 9.3 (SAS Inst., Cary, NC). Fisher’s protected LSD procedure was used
to separate means for significant effects at α = 0.05.
YIELD RESPONSE TO N RATE CURVE
In 2014, an N-rate experiment was established with CL111 rice using the same
equipment and seeded on the same day in an area adjacent to the rainfall simulation trial.
Individual plots were 4.8-m long and 1.8-m wide. The experiment was a randomized complete
block design with four blocks that included urea and NBPT-treated urea (0.89 g NBPT kg-1 urea)
applied at 0, 34, 68, 102, 136, 170 kg N ha-1. The preflood-N treatments were applied to a dry
soil surface on 15 June 2014, 1 d before the rainfall simulation N was applied, and flooded the
same day as the rainfall simulation trial (Table 3.1). Management was the same as for the NOSR
treatment. This added trial was intended to provide a grain yield comparison of rice fertilized
with urea and NBPT-treated urea across a common range of N rates that would allow
extrapolation of the amount of N lost among the N source and rainfall simulation treatments.
Regression analysis was performed using the MIXED procedure of SAS using a model
where grain yield was regressed across N rates of 34 to 170 kg N ha-1, allowing for both linear
82
and quadratic terms with coefficients depending on N source. The model was simplified by
omitting the most complex term and rerunning the model until the simplest, significant model
was derived. A p-value of 0.15 was used to include or omit model terms. The final model
included a unique intercept for each N source which shared common linear and quadratic
coefficients (Fig. 3.2). The NBPT-treated urea equation was used to calculate the equivalent N
rate that would have produced the mean yield in each plot. Nitrogen loss above the loss
experienced by the NOSR treatment fertilized with NBPT-treated urea was estimated by
subtracting each predicted equivalent N rate from the greatest NBPT-treated urea N rate
calculated from the NOSR treatment. The MIXED procedure was used to perform ANOVA on
the 2014 trial grain yield data with the 2 (NP rate) by 2 (NBPT rate) by 3 (simulated rainfall
timing) factorial treatment structure. Nitrogen loss estimates for the 2013 trial were not
performed since a yield response curve to N rate for the exact seeding date and experimental
conditions was not available.
RESULTS
ABOVEGROUND DRY MATTER
Rice receiving no N fertilizer had average (n = 16) dry matter accumulations of 5086 kg
ha-1 (s = 1107) in 2013 and 3011 kg ha-1 (s = 552) in 2014. Aboveground dry matter was
influenced by the three-way interactions involving trial year × NBPT rate × simulated rainfall
timing and trial year × NP rate × NBPT rate (Table 3.3). The interaction showed that dry matter
accumulation was numerically and sometimes statistically greater in 2013 than 2014 but the
magnitude of differences among treatments were greater in 2014 than 2013 (Table 3.4).
Averaged across NP rate, the numerical ranking of rice dry matter among treatments followed
the same order within each year (NOSR + 0.89 g NBPT > SRBN + 0.89 g NPBT > SRAN + 0.89

83
g NBPT > NOSR + 0 g NPBT > SRAN + 0 g NBPT > SRBN + 0 g NBPT). Rice fertilized with
0.89 g NBPT kg-1 urea and receiving NOSR produced 17.4 to 19.2% more dry matter than rice
fertilized with 0 g NBPT kg-1 urea and receiving SRAN and SRBN in 2013. In 2014, the dry
matter differences between these same treatments were 20.3 to 31.4%.
The trial year × NP rate × NBPT rate interaction, averaged across simulated rainfall
timings, also showed that dry matter was numerically greater in 2013, the magnitude of
differences between the high and low dry matter yields was greater in 2014, and the rank of the
NP rate and NBPT rate combinations was different between years (Table 3.5). The differences
among the four NP and NBPT rate combinations within each year are the most important aspect
of this interaction. In 2013, rice receiving urea treated with NP (572 g ha-1) plus NBPT (0.89 g
kg-1 urea) produced equal dry matter as rice receiving NBPT-treated urea (0.89 g kg-1 urea), but
both treatments produced greater dry matter than rice fertilized with NP-treated urea (572 g ha-1).
Rice fertilized with urea having no NP or NBPT produced an intermediate dry matter similar to
that of NBPT-treated urea and NP-treated urea. In 2014, rice fertilized with NBPT-treated urea
produced greater dry matter than the three other treatment combinations, which had similar dry
matter accumulations.
TISSUE N CONCENTRATION
Rice tissue-N concentration is typically narrow among treatments due to the dilution
effect that occurs when biomass increases as N uptake increases. For reference, the average (n =
16) tissue-N concentration at early heading of rice receiving no-N fertilizer averaged 7.6 (s =
0.7) g N kg-1 in 2013 and 7.4 (s = 0.6) g N kg-1 in 2014. Tissue N concentration was influenced
by the main effect of simulated rainfall timing and the interaction of trial year × NBPT rate × NP
rate (Table 3.3). Averaged across trials, NBPT rates, and NP rates, tissue N concentration from
84
rice receiving NOSR (9.3 g N kg-1; LSD0.05 = 0.4 g N kg-1) was significantly greater than rice
receiving SRBN (8.7 g N kg-1) or SRAN (8.6 g N kg-1), which were similar to each other. The
three-way interaction, averaged across simulated rainfall timings, showed that whole-plant tissue
N concentrations for each of the four NP and NBPT combinations were numerically or
statistically greater in 2014 than 2013 (Table 3.5). The relative rank and differences among the
four NP and NBPT combinations were also different within each year. In 2013, rice fertilized
with urea treated with both NP (572 g ha-1) plus NBPT (0.89 g kg-1 urea) had greater tissue N
concentration than rice receiving urea treated with either NP or NPBT alone, but not untreated
urea (no inhibitor). In 2014, rice fertilized with NBPT-treated, NP-treated, or NBPT + NP-
treated urea produced equal tissue N concentrations, but only the NBPT-treated urea produced
greater tissue N concentrations than rice fertilized with untreated urea.
ABOVEGROUND-N UPTAKE
The aboveground-N uptake of rice receiving no N contained an average of 39 (s = 9) kg
N ha-1 in 2013 and 22 (s = 4) kg N ha-1 in 2014. Aboveground-N uptake was influenced by the
trial year × NP rate × NBPT rate and NP rate × simulated rainfall timing interactions (Table 3.3).
The trial year × NP rate × NBPT rate interaction showed that N uptake within each year
responded differently to the NP and NBPT combinations (Table 3.5). In 2013, N uptake was
maximized by fertilization with urea treated with both NBPT plus NP and NBPT-treated urea,
but only rice fertilized with urea treated with both NBPT plus NP produced yields that were
significantly (21.4 to 32.4%) greater than rice fertilized with NP-treated urea or untreated urea.
In 2014, rice fertilized with NBPT-treated urea had 22.9 to 35.9% greater aboveground N uptake
than all other treatments, which had similar N uptakes. Comparison of the same treatment across
years showed that urea treated with NBPT plus NP produced different aboveground N uptake
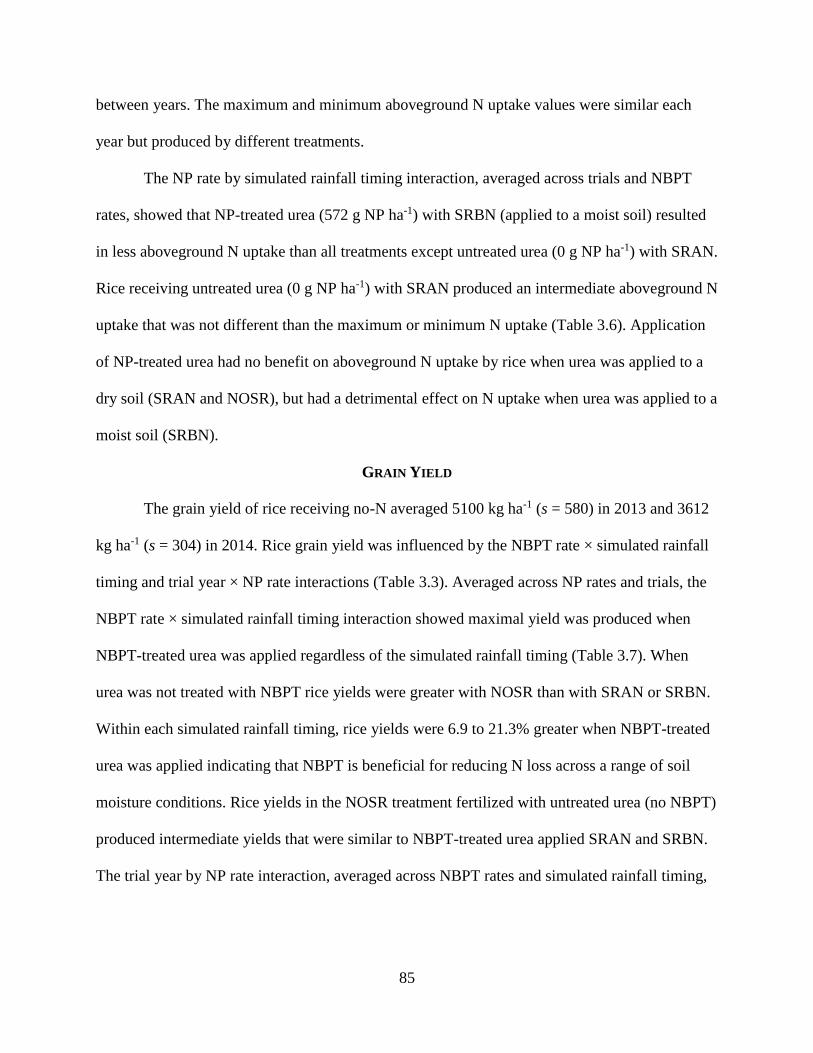
85
between years. The maximum and minimum aboveground N uptake values were similar each
year but produced by different treatments.
The NP rate by simulated rainfall timing interaction, averaged across trials and NBPT
rates, showed that NP-treated urea (572 g NP ha-1) with SRBN (applied to a moist soil) resulted
in less aboveground N uptake than all treatments except untreated urea (0 g NP ha-1) with SRAN.
Rice receiving untreated urea (0 g NP ha-1) with SRAN produced an intermediate aboveground N
uptake that was not different than the maximum or minimum N uptake (Table 3.6). Application
of NP-treated urea had no benefit on aboveground N uptake by rice when urea was applied to a
dry soil (SRAN and NOSR), but had a detrimental effect on N uptake when urea was applied to a
moist soil (SRBN).
GRAIN YIELD
The grain yield of rice receiving no-N averaged 5100 kg ha-1 (s = 580) in 2013 and 3612
kg ha-1 (s = 304) in 2014. Rice grain yield was influenced by the NBPT rate × simulated rainfall
timing and trial year × NP rate interactions (Table 3.3). Averaged across NP rates and trials, the
NBPT rate × simulated rainfall timing interaction showed maximal yield was produced when
NBPT-treated urea was applied regardless of the simulated rainfall timing (Table 3.7). When
urea was not treated with NBPT rice yields were greater with NOSR than with SRAN or SRBN.
Within each simulated rainfall timing, rice yields were 6.9 to 21.3% greater when NBPT-treated
urea was applied indicating that NBPT is beneficial for reducing N loss across a range of soil
moisture conditions. Rice yields in the NOSR treatment fertilized with untreated urea (no NBPT)
produced intermediate yields that were similar to NBPT-treated urea applied SRAN and SRBN.
The trial year by NP rate interaction, averaged across NBPT rates and simulated rainfall timing,

86
showed that yields were greater in 2013 than in 2014 and NP-treated urea had no effect on grain
yield in 2013, but compared to urea without NP decreased yield by 5.6% in 2014 (Table 3.8).
ESTIMATED N LOSS FROM YIELD CURVE
Grain yield of rice managed with NOSR showed a nonlinear response to N rate that
depended on N source (Fig. 3.2). Rice yields across all N rates were consistently 234 kg ha-1
greater when NBPT-treated urea was the N source. The equations predicted a maximum grain
yield of 9340 kg ha-1 with 204 kg NBPT-treated urea-N ha-1 or 9106 kg ha-1 with 204 kg urea-N
ha-1. Rice receiving no N produced a mean (n = 4) yield of 4023 kg ha-1 (s = 499), which is
numerically comparable to the 3612 kg ha-1 from the no-N control in the rainfall simulation trial.
The ANOVA of the 2014 predicted equivalent NBPT-treated urea N rate showed the
three-way interaction was not significant (P=0.1249), but the main effect of NP rate (P=0.0034)
and the NBPT rate by simulated rainfall timing (P=0.0020) interaction were significant.
Averaged across simulated rainfall timing and NBPT rates, rice fertilized with urea treated with
0 or 572 g NP ha-1 produced yields that were equivalent to 64 and 77 kg NBPT-treated urea N
ha-1, respectively. This result suggests that the overall effect of treating urea with NP in 2014
resulted in 17% greater N loss.
The NBPT rate by simulated rainfall timing interaction, averaged across NP rates,
showed that the predicted-N rates required to produce the mean grain yields were equal and
greatest when NBPT-treated urea was applied regardless of simulated rainfall timing (Table 3.9).
When urea with no NPBT was applied, the equivalent N rates were affected by simulated rainfall
timing and decreased incrementally in the order of NOSR > SRAN > SRBN. The equivalent N
rate produced by urea (no NBPT) plus NOSR was statistically similar only to NBPT-treated urea
plus SRAN, which produced the lowest numerical yield and equivalent N rate of rice fertilized
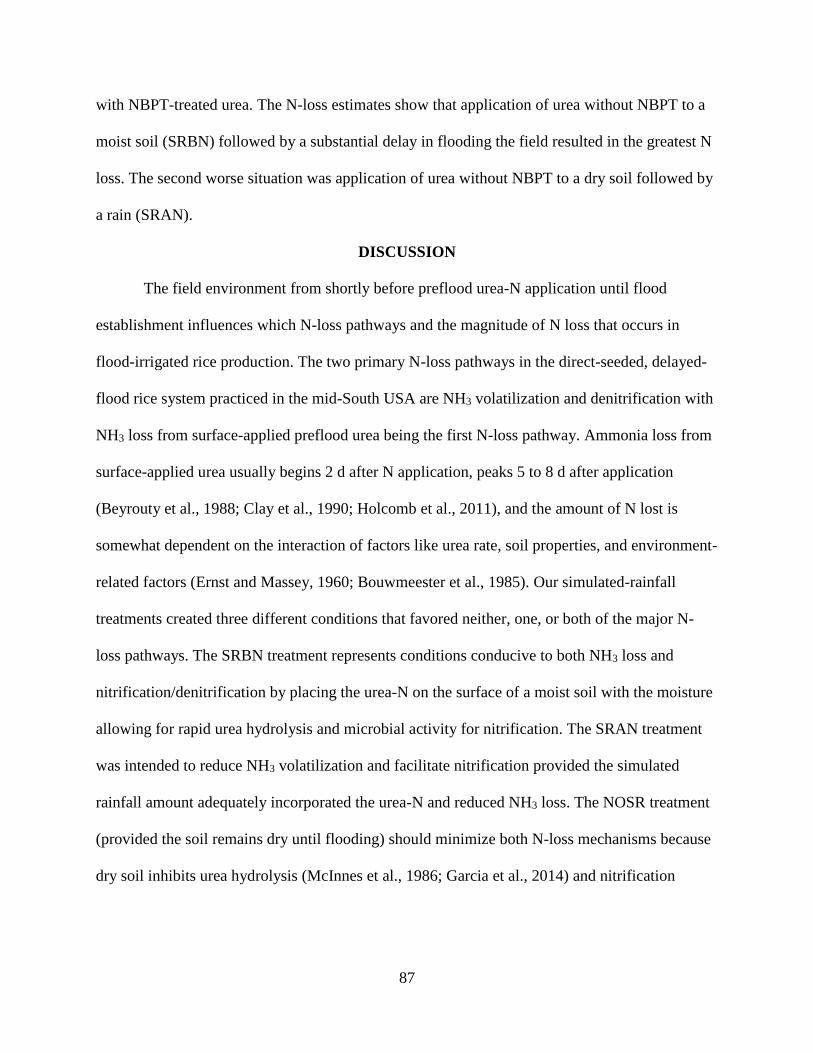
87
with NBPT-treated urea. The N-loss estimates show that application of urea without NBPT to a
moist soil (SRBN) followed by a substantial delay in flooding the field resulted in the greatest N
loss. The second worse situation was application of urea without NBPT to a dry soil followed by
a rain (SRAN).
DISCUSSION
The field environment from shortly before preflood urea-N application until flood
establishment influences which N-loss pathways and the magnitude of N loss that occurs in
flood-irrigated rice production. The two primary N-loss pathways in the direct-seeded, delayed-
flood rice system practiced in the mid-South USA are NH3 volatilization and denitrification with
NH3 loss from surface-applied preflood urea being the first N-loss pathway. Ammonia loss from
surface-applied urea usually begins 2 d after N application, peaks 5 to 8 d after application
(Beyrouty et al., 1988; Clay et al., 1990; Holcomb et al., 2011), and the amount of N lost is
somewhat dependent on the interaction of factors like urea rate, soil properties, and environment-
related factors (Ernst and Massey, 1960; Bouwmeester et al., 1985). Our simulated-rainfall
treatments created three different conditions that favored neither, one, or both of the major N-
loss pathways. The SRBN treatment represents conditions conducive to both NH3 loss and
nitrification/denitrification by placing the urea-N on the surface of a moist soil with the moisture
allowing for rapid urea hydrolysis and microbial activity for nitrification. The SRAN treatment
was intended to reduce NH3 volatilization and facilitate nitrification provided the simulated
rainfall amount adequately incorporated the urea-N and reduced NH3 loss. The NOSR treatment
(provided the soil remains dry until flooding) should minimize both N-loss mechanisms because
dry soil inhibits urea hydrolysis (McInnes et al., 1986; Garcia et al., 2014) and nitrification
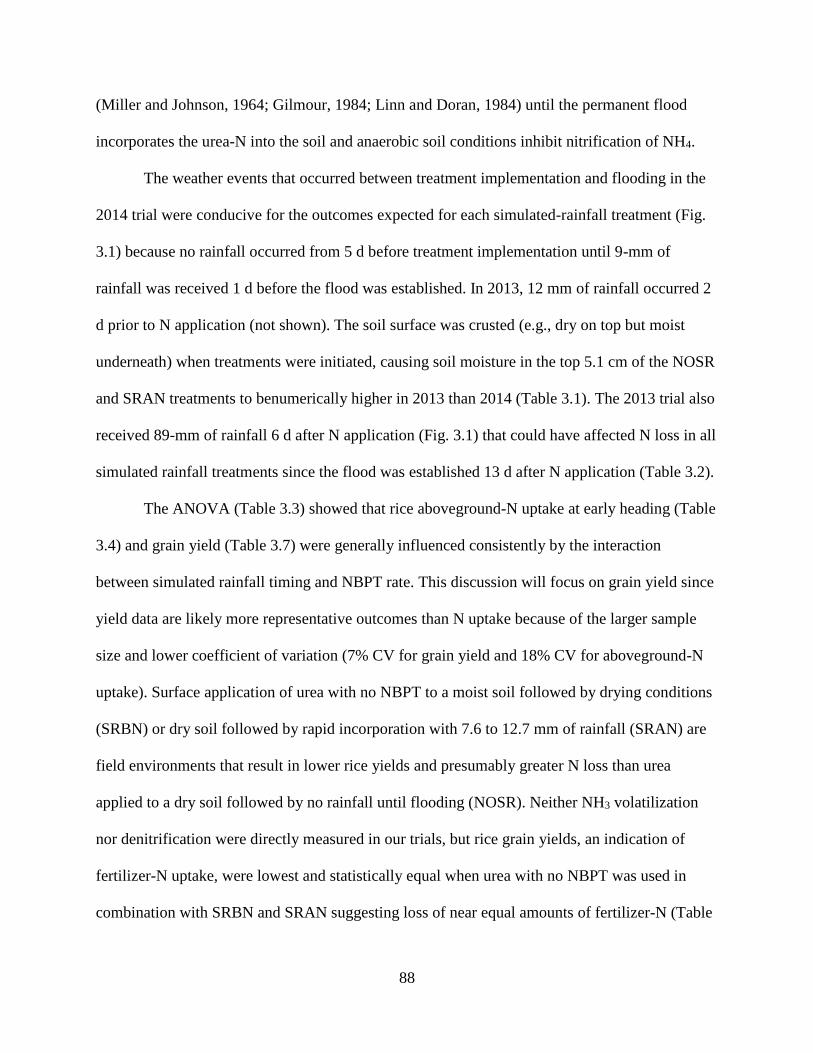
88
(Miller and Johnson, 1964; Gilmour, 1984; Linn and Doran, 1984) until the permanent flood
incorporates the urea-N into the soil and anaerobic soil conditions inhibit nitrification of NH4.
The weather events that occurred between treatment implementation and flooding in the
2014 trial were conducive for the outcomes expected for each simulated-rainfall treatment (Fig.
3.1) because no rainfall occurred from 5 d before treatment implementation until 9-mm of
rainfall was received 1 d before the flood was established. In 2013, 12 mm of rainfall occurred 2
d prior to N application (not shown). The soil surface was crusted (e.g., dry on top but moist
underneath) when treatments were initiated, causing soil moisture in the top 5.1 cm of the NOSR
and SRAN treatments to benumerically higher in 2013 than 2014 (Table 3.1). The 2013 trial also
received 89-mm of rainfall 6 d after N application (Fig. 3.1) that could have affected N loss in all
simulated rainfall treatments since the flood was established 13 d after N application (Table 3.2).
The ANOVA (Table 3.3) showed that rice aboveground-N uptake at early heading (Table
3.4) and grain yield (Table 3.7) were generally influenced consistently by the interaction
between simulated rainfall timing and NBPT rate. This discussion will focus on grain yield since
yield data are likely more representative outcomes than N uptake because of the larger sample
size and lower coefficient of variation (7% CV for grain yield and 18% CV for aboveground-N
uptake). Surface application of urea with no NBPT to a moist soil followed by drying conditions
(SRBN) or dry soil followed by rapid incorporation with 7.6 to 12.7 mm of rainfall (SRAN) are
field environments that result in lower rice yields and presumably greater N loss than urea
applied to a dry soil followed by no rainfall until flooding (NOSR). Neither NH3 volatilization
nor denitrification were directly measured in our trials, but rice grain yields, an indication of
fertilizer-N uptake, were lowest and statistically equal when urea with no NBPT was used in
combination with SRBN and SRAN suggesting loss of near equal amounts of fertilizer-N (Table

89
3.7). Rice fertilized with urea coupled with SRBN produced numerically lower yields than urea
in combination with SRAN. The N-loss estimates for 2014 show that application of untreated
urea (no NBPT) to a moist soil (SRBN) resulted in the largest estimated N losses and lowest
yield (Table 3.9). Results from both years suggest that application of urea without NBPT to a
moist soil represents the worst case situation for rice recovery of urea-N fertilizer. Norman et al.
(2006) reported that rice produced greater yields and NH3 volatilization losses were less when
NBPT-treated urea was applied to a muddy soil compared to untreated urea (no NBPT). Ernst
and Massey (1960) also showed NH3 loss from surface-applied urea increased as initial soil
moisture increased and other factors remained constant. The amount of NH3 loss depends on the
interaction of a number of factors and the greatest NH3 losses from surface-applied urea typically
occurs under moist soil conditions and high relative humidity, which would describe SRBN
(Table 3.1 and Fig. 3.1; Bouwmeester et al., 1985). The surprising result was that untreated urea
(no NBPT) applied to a dry soil and followed by simulated rainfall also produced relatively high
yields (Tables 3.7 and 3.9).
Research has shown that rainfall amounts close to 7.6 mm following urea application
may substantially reduce, have no influence, or increase NH3 loss from surface-applied urea
(Bouwmeester et al., 1985; McInnes et al., 1986; Holcomb et al., 2011). In the absence of direct
measurements of N2, N2O, and NH3 loss, an accurate prediction of the primary N-loss
mechanism present in SRAN and responsible for the low rice yields is not possible. Although we
cannot confirm, we suspect that N loss in SRAN was due primarily to denitrification. The yield
response to the N rate curve from 2014 provides strong evidence that NH3 loss was present but
did not result in large amounts of N loss when untreated urea (no NBPT) was applied with
NOSR (Fig. 3.2 and Table 3.9). The two-year trial results also support this conclusion (Table
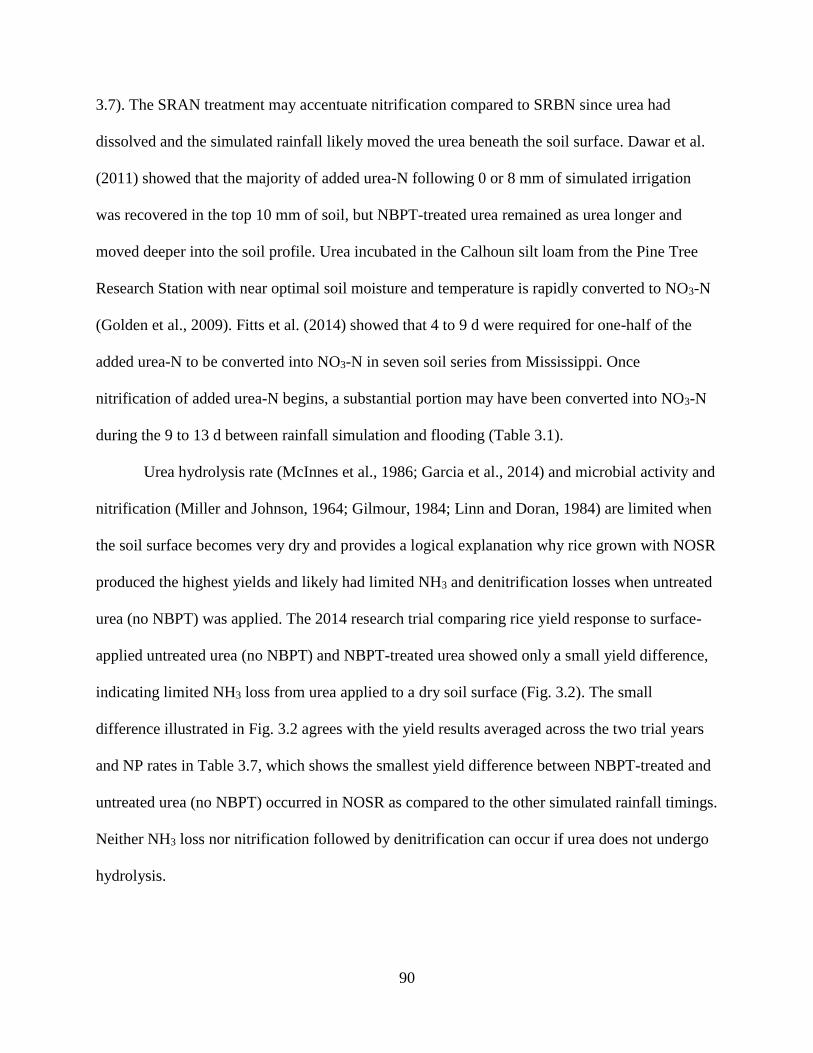
90
3.7). The SRAN treatment may accentuate nitrification compared to SRBN since urea had
dissolved and the simulated rainfall likely moved the urea beneath the soil surface. Dawar et al.
(2011) showed that the majority of added urea-N following 0 or 8 mm of simulated irrigation
was recovered in the top 10 mm of soil, but NBPT-treated urea remained as urea longer and
moved deeper into the soil profile. Urea incubated in the Calhoun silt loam from the Pine Tree
Research Station with near optimal soil moisture and temperature is rapidly converted to NO3-N
(Golden et al., 2009). Fitts et al. (2014) showed that 4 to 9 d were required for one-half of the
added urea-N to be converted into NO3-N in seven soil series from Mississippi. Once
nitrification of added urea-N begins, a substantial portion may have been converted into NO3-N
during the 9 to 13 d between rainfall simulation and flooding (Table 3.1).
Urea hydrolysis rate (McInnes et al., 1986; Garcia et al., 2014) and microbial activity and
nitrification (Miller and Johnson, 1964; Gilmour, 1984; Linn and Doran, 1984) are limited when
the soil surface becomes very dry and provides a logical explanation why rice grown with NOSR
produced the highest yields and likely had limited NH3 and denitrification losses when untreated
urea (no NBPT) was applied. The 2014 research trial comparing rice yield response to surface-
applied untreated urea (no NBPT) and NBPT-treated urea showed only a small yield difference,
indicating limited NH3 loss from urea applied to a dry soil surface (Fig. 3.2). The small
difference illustrated in Fig. 3.2 agrees with the yield results averaged across the two trial years
and NP rates in Table 3.7, which shows the smallest yield difference between NBPT-treated and
untreated urea (no NBPT) occurred in NOSR as compared to the other simulated rainfall timings.
Neither NH3 loss nor nitrification followed by denitrification can occur if urea does not undergo
hydrolysis.
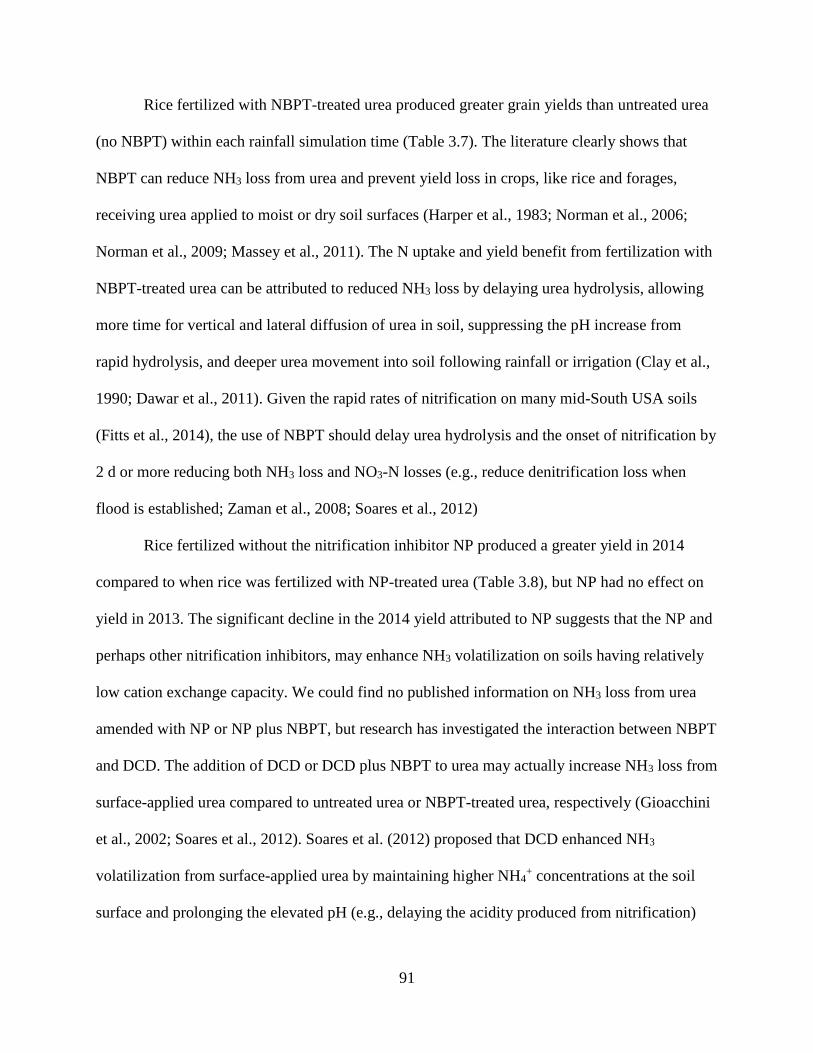
91
Rice fertilized with NBPT-treated urea produced greater grain yields than untreated urea
(no NBPT) within each rainfall simulation time (Table 3.7). The literature clearly shows that
NBPT can reduce NH3 loss from urea and prevent yield loss in crops, like rice and forages,
receiving urea applied to moist or dry soil surfaces (Harper et al., 1983; Norman et al., 2006;
Norman et al., 2009; Massey et al., 2011). The N uptake and yield benefit from fertilization with
NBPT-treated urea can be attributed to reduced NH3 loss by delaying urea hydrolysis, allowing
more time for vertical and lateral diffusion of urea in soil, suppressing the pH increase from
rapid hydrolysis, and deeper urea movement into soil following rainfall or irrigation (Clay et al.,
1990; Dawar et al., 2011). Given the rapid rates of nitrification on many mid-South USA soils
(Fitts et al., 2014), the use of NBPT should delay urea hydrolysis and the onset of nitrification by
2 d or more reducing both NH3 loss and NO3-N losses (e.g., reduce denitrification loss when
flood is established; Zaman et al., 2008; Soares et al., 2012)
Rice fertilized without the nitrification inhibitor NP produced a greater yield in 2014
compared to when rice was fertilized with NP-treated urea (Table 3.8), but NP had no effect on
yield in 2013. The significant decline in the 2014 yield attributed to NP suggests that the NP and
perhaps other nitrification inhibitors, may enhance NH3 volatilization on soils having relatively
low cation exchange capacity. We could find no published information on NH3 loss from urea
amended with NP or NP plus NBPT, but research has investigated the interaction between NBPT
and DCD. The addition of DCD or DCD plus NBPT to urea may actually increase NH3 loss from
surface-applied urea compared to untreated urea or NBPT-treated urea, respectively (Gioacchini
et al., 2002; Soares et al., 2012). Soares et al. (2012) proposed that DCD enhanced NH3
volatilization from surface-applied urea by maintaining higher NH4+ concentrations at the soil
surface and prolonging the elevated pH (e.g., delaying the acidity produced from nitrification)

92
that occurs around the urea granule after hydrolysis rather than inhibiting the effectiveness of
NBPT. Provided that nitrification is effectively inhibited, the mechanism by which DCD
enhanced NH3 loss from urea would likely be the same for NP.
Nitrification inhibitors have the potential benefit to increase rice grain yield and reduce
N2O emissions (Wells, 1977; Watanabe, 2006). Our specific interest in nitrification inhibitors for
the direct-seeded, delayed-flood rice production system is to maintain urea-N as NH4+ for 5-15 d
following urea application while commercial rice fields are flooded. Nitrapyrin showed no
benefit or detriment to rice grain yield in 2013, but caused a significant yield decline in 2014
(Table 3.8). The lack of benefit in 2013 could be attributed to i) NP failed to sufficiently inhibit
nitrification and NO3-N was eventually denitrified, ii) the nitrification-denitrification N-loss
pathway was not a substantial N-loss pathway in 2013, or iii) NP inhibited nitrification but
accentuated NH3 loss by maintaining high NH4+ concentrations near the soil surface. The yield
detriment attributed to NP in 2014 is most likely due to the last scenario involving accentuation
of NH3 loss. We know that a large proportion of soil or fertilizer NO3-N is lost rapidly after
flooding (Patrick and Wyatt, 1964; Wilson et al., 1994) and the conditions for nitrification
(before flooding) and denitrification (after flooding) were present. The Calhoun soil has been
shown to have a rapid nitrification rate (Golden et al., 2009), and NP and other nitrification
inhibitors may inhibit nitrification, albeit only briefly, to benefit crop N uptake in some warm
and moist soils (Touchton and Boswell, 1980; McCarty and Bremner, 1990). Unpublished field
trial results indicate that NP has provided no rice yield benefit when NP-treated urea was applied
10-14 d in advance of flooding compared to regular urea (N.A. Slaton, personal communication,
2015). The dynamics and interaction between NBPT and NP warrant additional investigation to
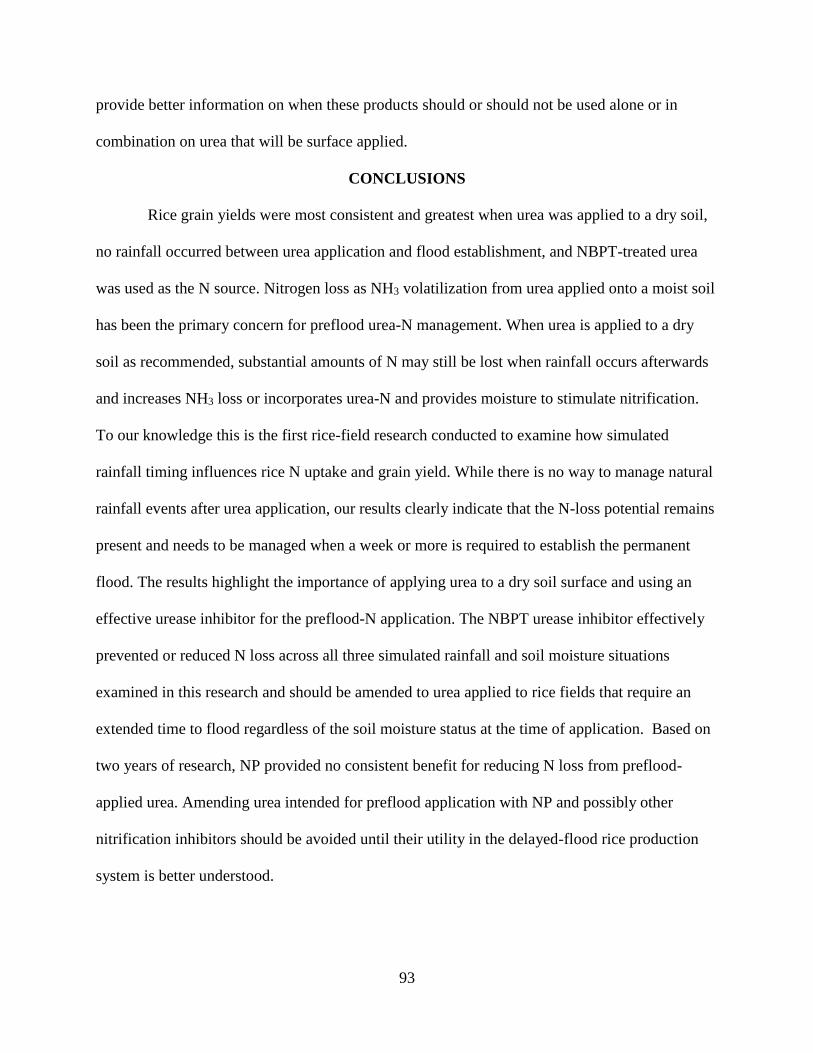
93
provide better information on when these products should or should not be used alone or in
combination on urea that will be surface applied.
CONCLUSIONS
Rice grain yields were most consistent and greatest when urea was applied to a dry soil,
no rainfall occurred between urea application and flood establishment, and NBPT-treated urea
was used as the N source. Nitrogen loss as NH3 volatilization from urea applied onto a moist soil
has been the primary concern for preflood urea-N management. When urea is applied to a dry
soil as recommended, substantial amounts of N may still be lost when rainfall occurs afterwards
and increases NH3 loss or incorporates urea-N and provides moisture to stimulate nitrification.
To our knowledge this is the first rice-field research conducted to examine how simulated
rainfall timing influences rice N uptake and grain yield. While there is no way to manage natural
rainfall events after urea application, our results clearly indicate that the N-loss potential remains
present and needs to be managed when a week or more is required to establish the permanent
flood. The results highlight the importance of applying urea to a dry soil surface and using an
effective urease inhibitor for the preflood-N application. The NBPT urease inhibitor effectively
prevented or reduced N loss across all three simulated rainfall and soil moisture situations
examined in this research and should be amended to urea applied to rice fields that require an
extended time to flood regardless of the soil moisture status at the time of application. Based on
two years of research, NP provided no consistent benefit for reducing N loss from preflood-
applied urea. Amending urea intended for preflood application with NP and possibly other
nitrification inhibitors should be avoided until their utility in the delayed-flood rice production
system is better understood.

94
REFERENCES
Beyrouty, C.A., L.E. Sommers, and D.W. Nelson. 1988. Ammonia volatilization from surface-
applied urea as affected by several phosphoroamide compunds. Soil Sci. Soc. Am. J.
52:1173-1178.
Bouwmeester, R.J.B., P.L.G. Vlek, and J.M. Stumpe. 1985. Effect of environmental factors on
ammonia volatilization from a urea-fertilized soil. Soil Sci. Soc. Am. J. 49:376–381.
doi:10.2136/sssaj1985.03615995004900020021x.
Campbell, C.R. 1992. Determination of total nitrogen in plant tissue by combustion. In: C.O.
Plank, editor, Plant analysis reference procedures for the southern U.S. Coop. Ser. Bull. 368.
Univ. of Georgia, Athens. p. 20-22.
Clay, D.E., G.L. Malzer, and J.L. Anderson. 1990. Ammonia volatilization from urea as
influenced by soil temperature, soil water content, and nitrification and hydrolysis inhibitors.
Soil Sci. Soc. Am. J. 54:263-266.
Dawar, J., M. Zaman, J.S. Rowarth, J. Blennerhassett, and M.H. Turnbull. 2011. Urea hydrolysis
and lateral and vertical movement in the soil: effects of urease inhibitor and irrigation. Biol.
Fert. Soils 47:139-146. doi:10.1007/s00374-010-0515-3.
Ernst, J.W. and H.F. Massey. 1960. The effects of several factors on volatilization of ammonia
formed from urea in the soil. Soil Sci. Soc. Am. J. 24:87-90.
Fenn, L.B. and D.E. Kissel. 1976. The influence of cation exchange capacity and depth of
incorporation on ammonia volatilization from ammonium compounds applied to calcareous
soils. Soil Sci. Soc. Am. J. 40:394-398.
Ferguson, R.B. and D.E. Kissel. 1986. Effects of soil drying on ammonia volatilization from
surface-applied urea. Soil Sci. Soc. Am. J. 50:485-490.
Fitts, P.W., T.W. Walker, L.J. Krutz, B.R. Golden, J.J. Varco, J. Gore, J.L. Corbin, N.A. Slaton.
2014. Nitrification and yield for delayed-flood rice as affected by a nitrification inhibitor and
coated urea. Agron. J. 106: 1541-1548. doi:10.2134/agronj13.0586.
Garcia, F.O., D.E. Kissel, and M.L. Cabrera. 2014. Effect of soil matric potential on urea
hydrolysis. Soil Sci. Soc. Am. J. 78:2078–2082. doi:10.2136/sssaj2014.05.0216.
Gilmour, J.T. 1984. The effects of soil properties on nitrification and nitrification inhibition. Soil
Sci. Soc. Am. J. 48:1262-1266.
Gioacchini, P., A. Nastri, C. Marzadori, C. Giovannini, L.V. Antisari, and C. Gessa. 2002.
Influence of urease and nitrification inhibitors on N losses from soils fertilized with urea.
Biol. Fert. Soils 36:129-135. doi:10.1007/s00374-002-0521-1.
Golden, B.R., N.A. Slaton, R.E. DeLong, R.J. Norman, and E.T. Maschmann. 2009. Nitrification
inhibitors influence on rice grain yield and soil inorganic nitrogen fractions. In: R.J. Norman,
J.F. Meullenet, and K.A.K. Moldenhauer, editors, B.R. Wells Rice Research Studies 2008.
Series 571. Univ. of Arkansas, Fayetteville. p. 215-223.
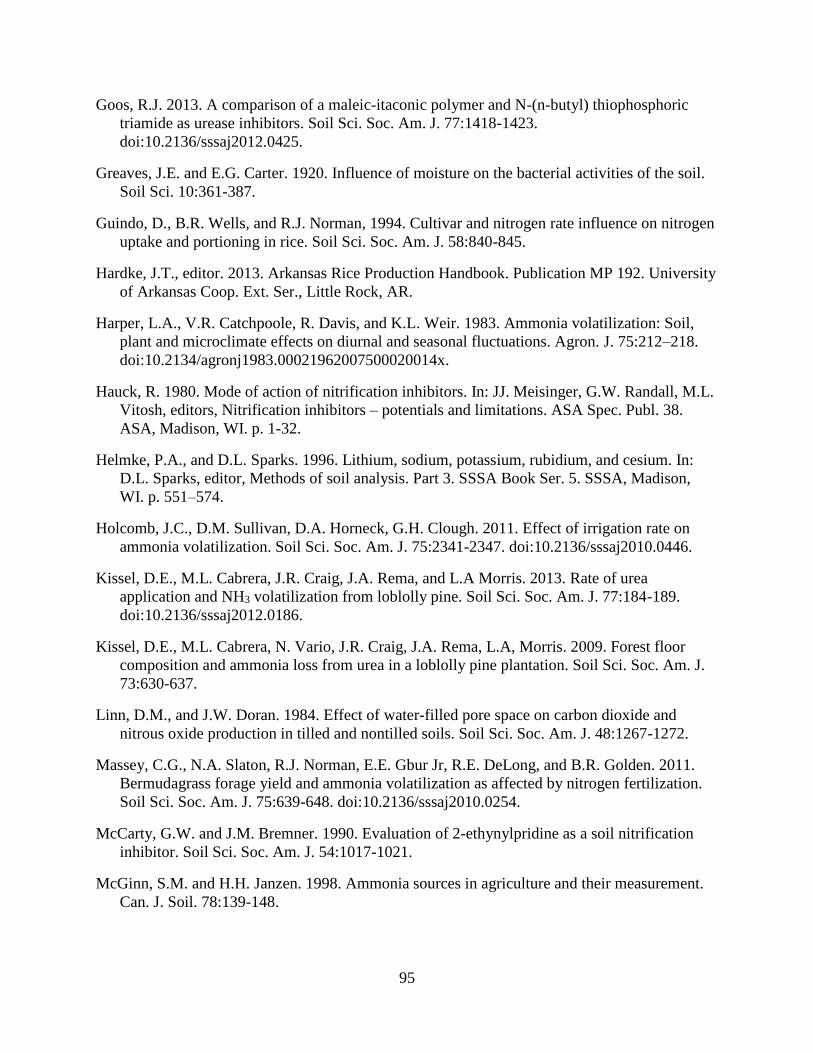
95
Goos, R.J. 2013. A comparison of a maleic-itaconic polymer and N-(n-butyl) thiophosphoric
triamide as urease inhibitors. Soil Sci. Soc. Am. J. 77:1418-1423.
doi:10.2136/sssaj2012.0425.
Greaves, J.E. and E.G. Carter. 1920. Influence of moisture on the bacterial activities of the soil.
Soil Sci. 10:361-387.
Guindo, D., B.R. Wells, and R.J. Norman, 1994. Cultivar and nitrogen rate influence on nitrogen
uptake and portioning in rice. Soil Sci. Soc. Am. J. 58:840-845.
Hardke, J.T., editor. 2013. Arkansas Rice Production Handbook. Publication MP 192. University
of Arkansas Coop. Ext. Ser., Little Rock, AR.
Harper, L.A., V.R. Catchpoole, R. Davis, and K.L. Weir. 1983. Ammonia volatilization: Soil,
plant and microclimate effects on diurnal and seasonal fluctuations. Agron. J. 75:212–218.
doi:10.2134/agronj1983.00021962007500020014x.
Hauck, R. 1980. Mode of action of nitrification inhibitors. In: JJ. Meisinger, G.W. Randall, M.L.
Vitosh, editors, Nitrification inhibitors – potentials and limitations. ASA Spec. Publ. 38.
ASA, Madison, WI. p. 1-32.
Helmke, P.A., and D.L. Sparks. 1996. Lithium, sodium, potassium, rubidium, and cesium. In:
D.L. Sparks, editor, Methods of soil analysis. Part 3. SSSA Book Ser. 5. SSSA, Madison,
WI. p. 551–574.
Holcomb, J.C., D.M. Sullivan, D.A. Horneck, G.H. Clough. 2011. Effect of irrigation rate on
ammonia volatilization. Soil Sci. Soc. Am. J. 75:2341-2347. doi:10.2136/sssaj2010.0446.
Kissel, D.E., M.L. Cabrera, J.R. Craig, J.A. Rema, and L.A Morris. 2013. Rate of urea
application and NH3 volatilization from loblolly pine. Soil Sci. Soc. Am. J. 77:184-189.
doi:10.2136/sssaj2012.0186.
Kissel, D.E., M.L. Cabrera, N. Vario, J.R. Craig, J.A. Rema, L.A, Morris. 2009. Forest floor
composition and ammonia loss from urea in a loblolly pine plantation. Soil Sci. Soc. Am. J.
73:630-637.
Linn, D.M., and J.W. Doran. 1984. Effect of water-filled pore space on carbon dioxide and
nitrous oxide production in tilled and nontilled soils. Soil Sci. Soc. Am. J. 48:1267-1272.
Massey, C.G., N.A. Slaton, R.J. Norman, E.E. Gbur Jr, R.E. DeLong, and B.R. Golden. 2011.
Bermudagrass forage yield and ammonia volatilization as affected by nitrogen fertilization.
Soil Sci. Soc. Am. J. 75:639-648. doi:10.2136/sssaj2010.0254.
McCarty, G.W. and J.M. Bremner. 1990. Evaluation of 2-ethynylpridine as a soil nitrification
inhibitor. Soil Sci. Soc. Am. J. 54:1017-1021.
McGinn, S.M. and H.H. Janzen. 1998. Ammonia sources in agriculture and their measurement.
Can. J. Soil. 78:139-148.

96
McInnes, K.J., R.B. Ferguson, D.E. Kissel, and E.T. Kanemasu. 1986. Field measurements of
ammonia loss from surface applications of urea solution to bare soil. Agron. J. 78:192–196.
doi:10.2134/agronj1986.00021962007800010038x.
Miller, R.D., and D.D. Johnson. 1964. The effect of soil moisture tension on carbon dioxide
evolution, nitrification, and nitrogen mineralization. Soil Sci. Soc. Am. Proc. 28:644-647.
doi:10.2136/sssaj1964.03615995002800050020x
Mulvaney, R.L. 1996. Nitrogen-inorganic forms. In: D.L. Sparks, editor, Methods of soil
analysis. Part 3. SSSA Book Series 5. SSSA, Madison. WI. p. 1123-1184.
Nelson, D.W. and L.E. Sommers. 1996. Total carbon, organic carbon, and organic matter. In:
D.L. Sparks, editor, Methods of soil analysis. Part 3. SSSA Book Series 5. SSSA, Madison,
WI. p. 961-1010.
Norman, R., N. Slaton, and T. Roberts. 2013. Soil Fertility. In: Hardke, J.T., editor, Arkansas
Rice Production Handbook. Publication MP192. University of Arkansas Coop. Ext. Ser.,
Little Rock, AR. p. 69-101.
Norman, R.J., C.E. Wilson, Jr., N.A. Slaton, B.R. Griggs, J.T. Bushong, and E.E. Gbur. 2009.
Nitrogen fertilizer sources and timing before flooding dry-seeded, delayed-flood rice. Soil
Sci. Soc. Am. J. 73:2184-2190.
Norman, R.J., C.E. Wilson Jr., N.A. Slaton, D.L. Frizzell, W.J. Ross, J.T. Bushong, and A.L.
2006. Influence of urea and agrotain applied to dry and muddy silt loam soils several days
prior to flooding on ammonia volatilization and grain yields of delayed-flood rice. In: R.J.
Norman, J.F. Meullenet, and K.A.K Modenhauer, editors, B.R. Wells Rice Research Studies
2005. Res. Ser. 540. Univ. of Arkansas, Fayetteville. p. 291-297.
Norman, R.J., R.S. Helms, and B.R. Wells. 1992. Influence of delaying flood and preflood
nitrogen application on dry-seeded rice. Fert. Res. 32:55-59.
Patrick, W.H., and R.Wyatt. 1964 Soil nitrogen loss as a result of alternate submergence and
drying. Soil Sci. Soc. Proc. 28:647-653. doi:10.2136/sssaj1964.03615995002800050021x.
Rawluk, C.D.L., C.A. Grant, and G.J. Racz. 2001. Ammonia volatilization from soils fertilized
with urea and varying rates of urease inhibitor NBPT. Can. J. Soil Sci. 81:239-246.
Roberts, T.L., W.J. Ross, R.J. Norman, N.A. Slaton, and C.E. Wilson, Jr. 2011. Predicting
nitrogen fertilizer needs for rice in Arkansas using alkaline hydrolyzable-nitrogen. Soil Sci.
Soc. Am. J. 75:1161-1171. doi:10.2136/sssaj2010.0145.
Saniz Rozas, H.R., H.E. Echeverrfa, and P.A. Barbieri. 2004. Nitrogen balance as affected by
application time and nitrogen fertilizer rate in irrigated no-tillage maize. Agron. J. 96:1622-
1631. doi:10.2134/agronj1999.916950x.
Schindler, F.V, and R.E. Knighton. 1999. Fate of fertilizer nitrogen applied to corn as estimated
by the isotopic and difference methods. Soil Sci. Soc. Am. J. 63:1734-1740.
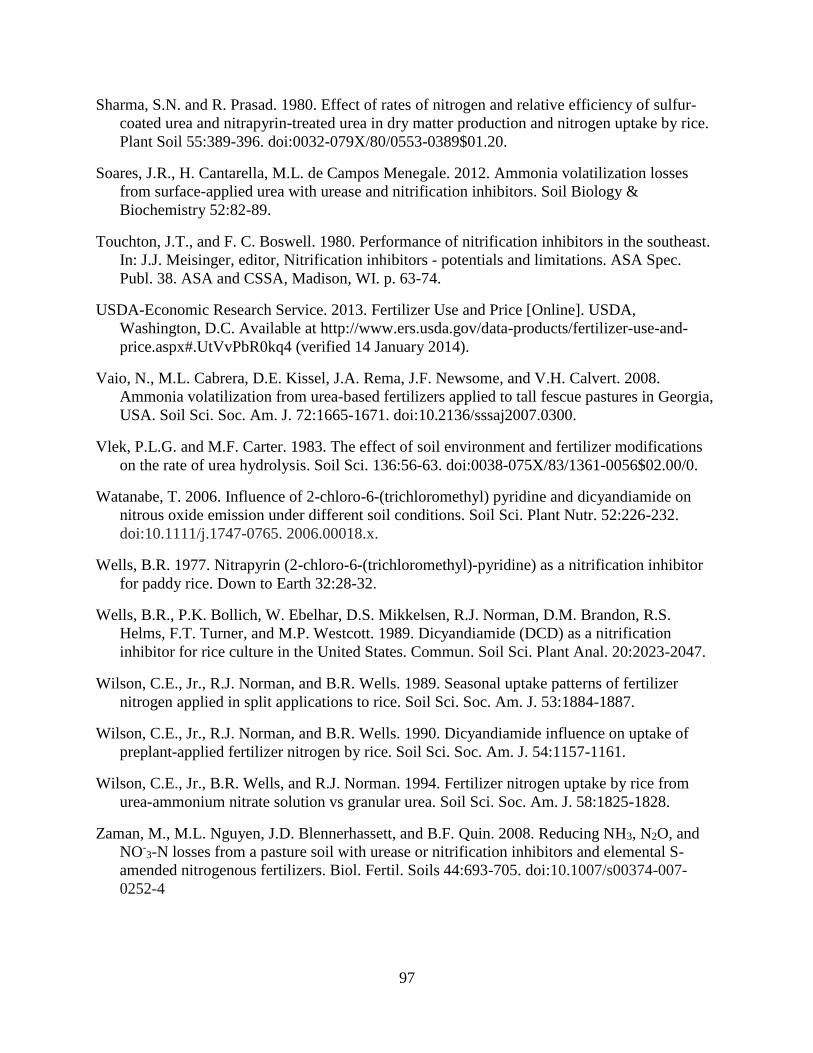
97
Sharma, S.N. and R. Prasad. 1980. Effect of rates of nitrogen and relative efficiency of sulfur-
coated urea and nitrapyrin-treated urea in dry matter production and nitrogen uptake by rice.
Plant Soil 55:389-396. doi:0032-079X/80/0553-0389$01.20.
Soares, J.R., H. Cantarella, M.L. de Campos Menegale. 2012. Ammonia volatilization losses
from surface-applied urea with urease and nitrification inhibitors. Soil Biology &
Biochemistry 52:82-89.
Touchton, J.T., and F. C. Boswell. 1980. Performance of nitrification inhibitors in the southeast.
In: J.J. Meisinger, editor, Nitrification inhibitors - potentials and limitations. ASA Spec.
Publ. 38. ASA and CSSA, Madison, WI. p. 63-74.
USDA-Economic Research Service. 2013. Fertilizer Use and Price [Online]. USDA,
Washington, D.C. Available at http://www.ers.usda.gov/data-products/fertilizer-use-and-
price.aspx#.UtVvPbR0kq4 (verified 14 January 2014).
Vaio, N., M.L. Cabrera, D.E. Kissel, J.A. Rema, J.F. Newsome, and V.H. Calvert. 2008.
Ammonia volatilization from urea-based fertilizers applied to tall fescue pastures in Georgia,
USA. Soil Sci. Soc. Am. J. 72:1665-1671. doi:10.2136/sssaj2007.0300.
Vlek, P.L.G. and M.F. Carter. 1983. The effect of soil environment and fertilizer modifications
on the rate of urea hydrolysis. Soil Sci. 136:56-63. doi:0038-075X/83/1361-0056$02.00/0.
Watanabe, T. 2006. Influence of 2-chloro-6-(trichloromethyl) pyridine and dicyandiamide on
nitrous oxide emission under different soil conditions. Soil Sci. Plant Nutr. 52:226-232.
doi:10.1111/j.1747-0765. 2006.00018.x.
Wells, B.R. 1977. Nitrapyrin (2-chloro-6-(trichloromethyl)-pyridine) as a nitrification inhibitor
for paddy rice. Down to Earth 32:28-32.
Wells, B.R., P.K. Bollich, W. Ebelhar, D.S. Mikkelsen, R.J. Norman, D.M. Brandon, R.S.
Helms, F.T. Turner, and M.P. Westcott. 1989. Dicyandiamide (DCD) as a nitrification
inhibitor for rice culture in the United States. Commun. Soil Sci. Plant Anal. 20:2023-2047.
Wilson, C.E., Jr., R.J. Norman, and B.R. Wells. 1989. Seasonal uptake patterns of fertilizer
nitrogen applied in split applications to rice. Soil Sci. Soc. Am. J. 53:1884-1887.
Wilson, C.E., Jr., R.J. Norman, and B.R. Wells. 1990. Dicyandiamide influence on uptake of
preplant-applied fertilizer nitrogen by rice. Soil Sci. Soc. Am. J. 54:1157-1161.
Wilson, C.E., Jr., B.R. Wells, and R.J. Norman. 1994. Fertilizer nitrogen uptake by rice from
urea-ammonium nitrate solution vs granular urea. Soil Sci. Soc. Am. J. 58:1825-1828.
Zaman, M., M.L. Nguyen, J.D. Blennerhassett, and B.F. Quin. 2008. Reducing NH3, N2O, and
NO-3-N losses from a pasture soil with urease or nitrification inhibitors and elemental S-
amended nitrogenous fertilizers. Biol. Fertil. Soils 44:693-705. doi:10.1007/s00374-007-
0252-4
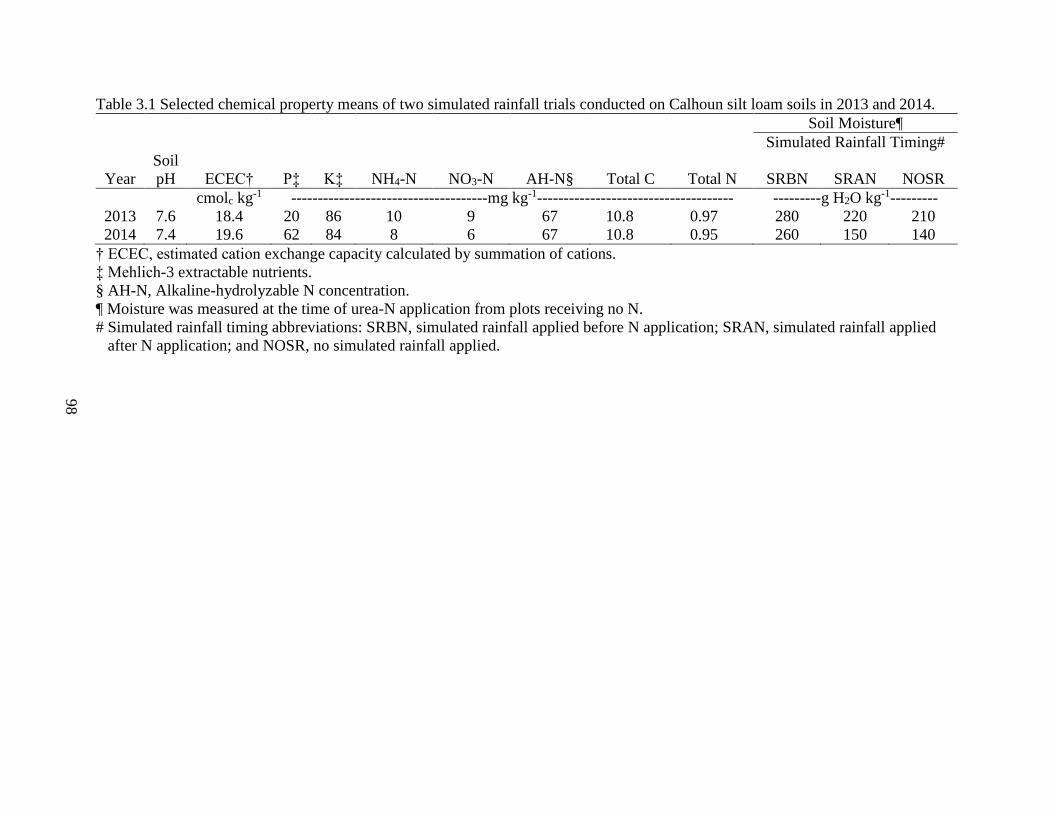
Table 3.1 Selected chemical property means of two simulated rainfall trials conducted on Calhoun silt loam soils in 2013 and 2014.
Soil Moisture¶
Simulated Rainfall Timing#
Year
Soil
pH ECEC† P‡ K‡ NH4-N NO3-N AH-N§ Total C Total N SRBN SRAN NOSR
cmolc kg-1 -------------------------------------mg kg-1------------------------------------- ---------g H2O kg-1---------
2013 7.6 18.4 20 86 10 9 67 10.8 0.97 280 220 210
2014 7.4 19.6 62 84 8 6 67 10.8 0.95 260 150 140
† ECEC, estimated cation exchange capacity calculated by summation of cations.
‡ Mehlich-3 extractable nutrients.
§ AH-N, Alkaline-hydrolyzable N concentration.
¶ Moisture was measured at the time of urea-N application from plots receiving no N.
# Simulated rainfall timing abbreviations: SRBN, simulated rainfall applied before N application; SRAN, simulated rainfall applied
after N application; and NOSR, no simulated rainfall applied.
98

99
Table 3.2. Selected rice crop management dates for two simulated rainfall trials conducted in
2013 and 2014.
Year Rice Seeding N Application
Flood
Establishment
Heading
Samples Grain Harvest
-----------------------------------Day Month-----------------------------------
2013 16 May 11 June 24 June 7 Aug. 12 Sept.
2014 22 May 16 June 25 June 6 Aug. 18 Sept.

100
Table 3.3. Analysis of variance p-values for aboveground dry matter tissue N concentration
(Tissue N), aboveground-N uptake, and rice grain yield as affected by trial year (YR), N-(n-
butyl) thiophosphoric triamide (NBPT) rate, nitrapyrin rate (NP), simulated rainfall timing
(SRT), and their interactions for field experiments conducted in 2013 and 2014.
Source of Variation df Dry Matter Tissue N
Aboveground-N
Uptake Grain Yield
------------------------------P values------------------------------
YR 1 0.0151 0.0210 0.5023 0.0176
NP 1 0.1864 0.4983 0.4625 0.1950
NBPT 1 <0.0001 0.0215 <0.0001 <0.0001
SRT 2 0.0383 0.0017 0.1547 <0.0001
YR × NP 1 0.1807 0.6723 0.1564 0.0361
YR × NBPT 1 0.9138 0.7835 0.9857 0.3604
YR × SRT 2 0.8841 0.2394 0.7727 0.8659
NP × NBPT 1 0.8278 0.6455 0.8199 0.6635
NP × SRT 2 0.0654 0.1236 0.0467 0.5681
NBPT × SRT 2 0.2951 0.0690 0.0587 0.0060
NP × NBPT × SRT 2 0.6403 0.3355 0.8006 0.6779
YR × NP × NBPT 1 0.0160 0.0425 0.0057 0.4996
YR × NP × SRT 2 0.2555 0.8222 0.5940 0.1323
YR × NBPT × SRT 2 0.0385 0.3605 0.1246 0.4240
YR × NP × NBPT × SRT 2 0.2524 0.8770 0.6526 0.5136

101
Table 3.4. Mean aboveground dry matter at early heading as affected by the interaction of trial
year, N-(n-butyl) thiophosphoric triamide (NBPT) rate, and simulated rainfall timing, averaged
across nitrapyrin rates.
2013 2014
NBPT Rate SRBN† SRAN NOSR SRBN SRAN NOSR
g NBPT kg-1 urea --------------------------kg dry matter ha-1--------------------------
0.00 7226 7335 8165 5979 6535 7291
0.89 8320 8309 8616 7704 7500 7862
LSD(0.05)‡ 1115
LSD(0.05)§ 1217
† Simulated rainfall timing abbreviations: SRBN, simulated rainfall applied before N
application; SRAN, simulated rainfall applied after N application; and no NOSR, simulated
rainfall applied.
‡ LSD to compare NBPT rate means within the same year.
§ LSD to compare any two means.
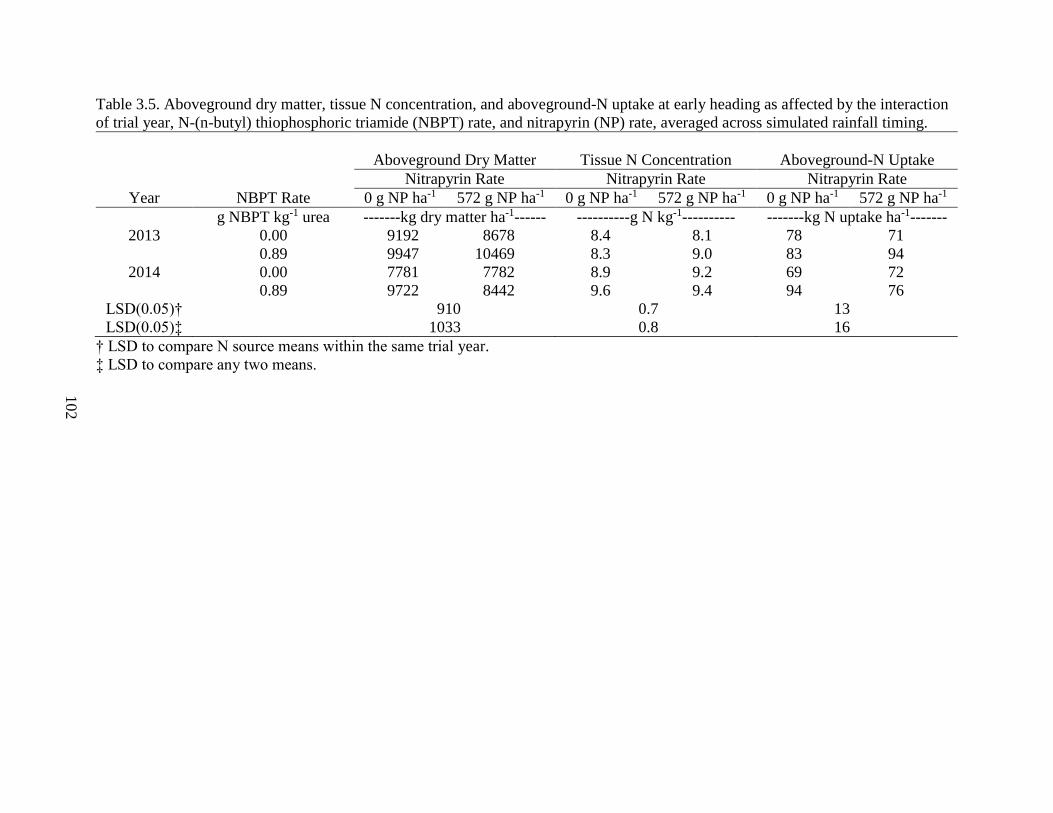
Table 3.5. Aboveground dry matter, tissue N concentration, and aboveground-N uptake at early heading as affected by the interaction
of trial year, N-(n-butyl) thiophosphoric triamide (NBPT) rate, and nitrapyrin (NP) rate, averaged across simulated rainfall timing.
Aboveground Dry Matter Tissue N Concentration Aboveground-N Uptake
Nitrapyrin Rate Nitrapyrin Rate Nitrapyrin Rate
Year NBPT Rate 0 g NP ha-1 572 g NP ha-1 0 g NP ha-1 572 g NP ha-1 0 g NP ha-1 572 g NP ha-1
g NBPT kg-1 urea -------kg dry matter ha-1------ ----------g N kg-1---------- -------kg N uptake ha-1-------
2013 0.00 9192 8678 8.4 8.1 78 71
0.89 9947 10469 8.3 9.0 83 94
2014 0.00 7781 7782 8.9 9.2 69 72
0.89 9722 8442 9.6 9.4 94 76
LSD(0.05)† 910 0.7 13
LSD(0.05)‡ 1033 0.8 16
† LSD to compare N source means within the same trial year.
‡ LSD to compare any two means.
10
2

103
Table 3.6. Mean aboveground N uptake as affected by the interaction of nitrapyrin (NP) rate and
simulated rainfall timing, averaged across trial years and N-(n-butyl) thiophosphoric triamide
rates.
Simulated Rainfall Timing†
Nitrapyrin Rate SRBN SRAN NOSR
g NP ha-1 ----------------------kg N uptake ha-1----------------------
0 81 a‡ 76 ab 85 a
572 70 b 85 a 81 a
LSD(0.05) 11
† Simulated rainfall timing abbreviations: SRBN, simulated rainfall applied before N
application; SRAN, simulated rainfall applied after N application; and NOSR, no simulated
rainfall applied.
‡ Means followed by the same lowercase letter are not different at p <0.05.
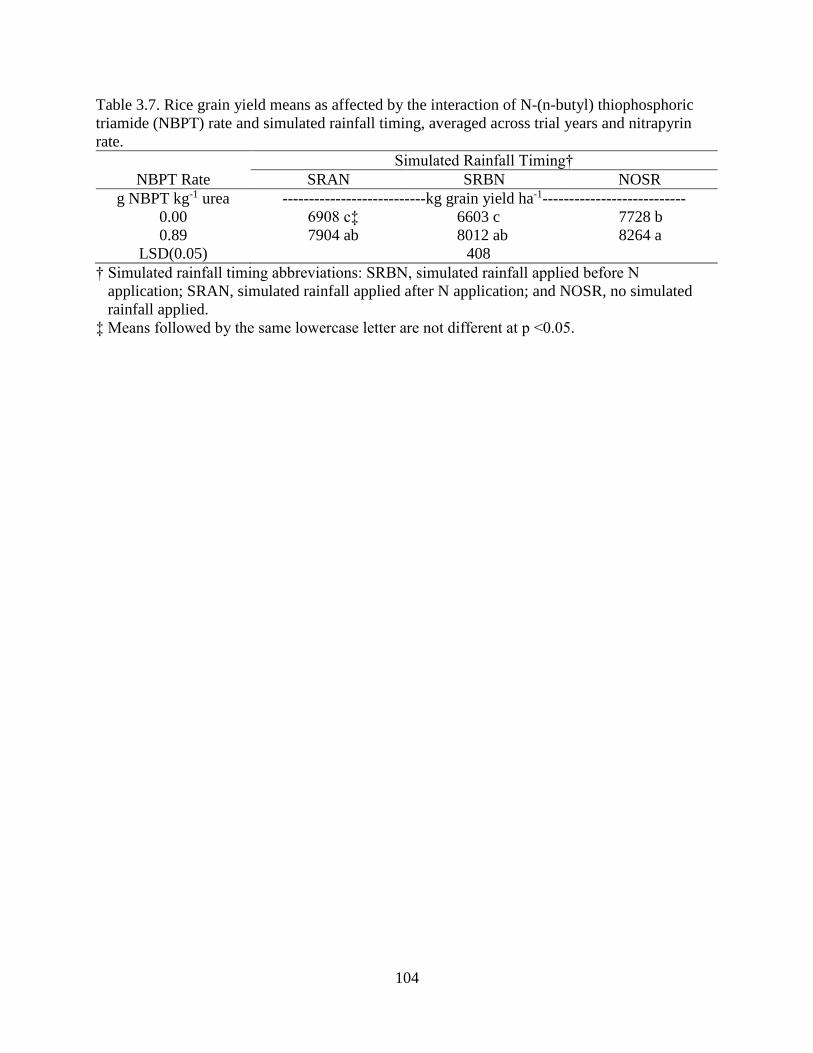
104
Table 3.7. Rice grain yield means as affected by the interaction of N-(n-butyl) thiophosphoric
triamide (NBPT) rate and simulated rainfall timing, averaged across trial years and nitrapyrin
rate.
Simulated Rainfall Timing†
NBPT Rate SRAN SRBN NOSR
g NBPT kg-1 urea ---------------------------kg grain yield ha-1---------------------------
0.00 6908 c‡ 6603 c 7728 b
0.89 7904 ab 8012 ab 8264 a
LSD(0.05) 408
† Simulated rainfall timing abbreviations: SRBN, simulated rainfall applied before N
application; SRAN, simulated rainfall applied after N application; and NOSR, no simulated
rainfall applied.
‡ Means followed by the same lowercase letter are not different at p <0.05.
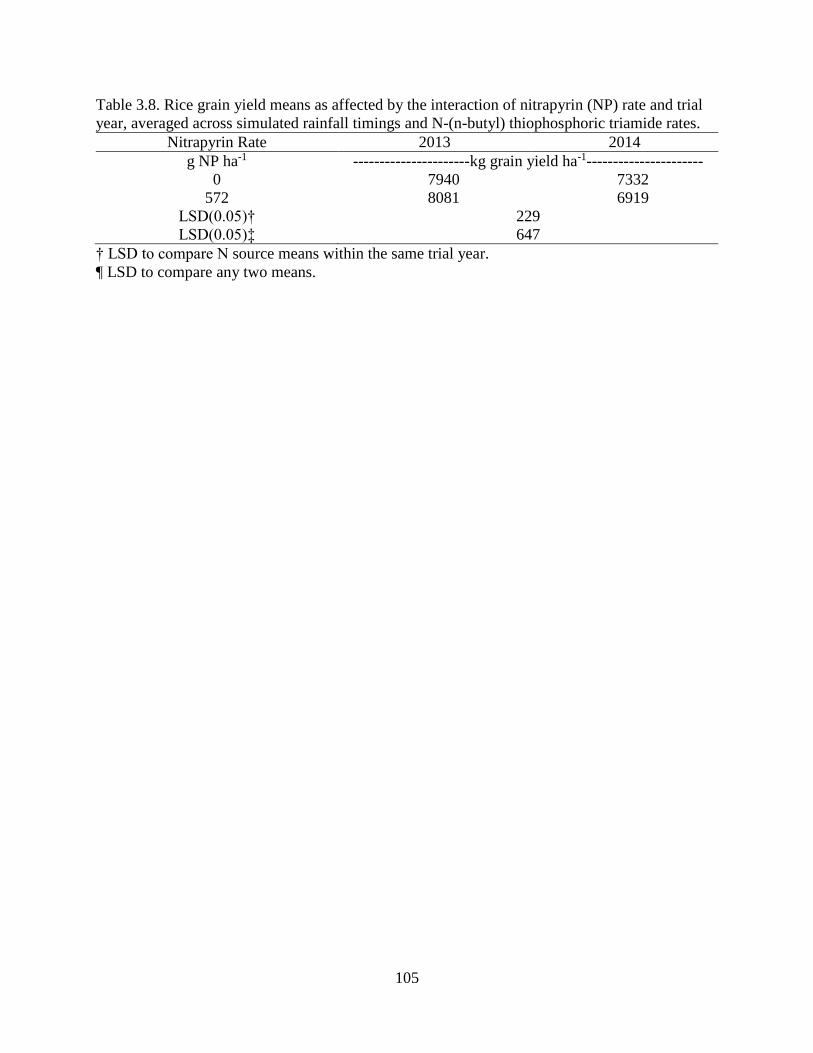
105
Table 3.8. Rice grain yield means as affected by the interaction of nitrapyrin (NP) rate and trial
year, averaged across simulated rainfall timings and N-(n-butyl) thiophosphoric triamide rates.
Nitrapyrin Rate 2013 2014
g NP ha-1 ----------------------kg grain yield ha-1----------------------
0 7940 7332
572 8081 6919
LSD(0.05)† 229
LSD(0.05)‡ 647
† LSD to compare N source means within the same trial year.
¶ LSD to compare any two means.

106
Table 3.9. Grain yield, the predicted equivalent N-(n-butyl) thiophosphoric triamide (NBPT)-
treated urea-N rate, and estimated N-loss above NBPT-treated urea as affected by the NBPT rate
and simulated rainfall timing interaction for the 2014 trial.
NBPT Rate
Simulated Rainfall
Timing†
Grain
Yield
Predicted N
Rate‡
Estimated N
Loss§
g NBPT kg-1 urea kg ha-1 kg NBPT-N ha-1 kg N ha-1
0 NOSR 7291 b¶ 74 b 17
0 SRAN 6535 c 52 c 39
0 SRBN 5980 d 37 d 54
0.89 NOSR 7802 a 91 a 0
0.89 SRAN 7500 ab 78 ab 0
0.89 SRBN 7704 a 91 a 13
LSD(0.05) 390 14 --
† Simulated rainfall timing abbreviations: SRAN, simulated rainfall after N application; SRBN,
simulated rainfall before N application; and NOSR, no simulated rainfall applied.
‡ N rates predicted using the rice response to NBPT-treated urea-N rate curve shown in Fig. 3.2
(kg grain yield ha-1 = 4332 + 49.03x – 0.120x2, where x = kg NBPT-treated urea-N ha-1.
§ N loss estimate calculated by subtracting each predicted N rate from the value predicted for
NBPT-treated urea with the NOSR simulated rainfall time.
¶ Means followed by the same lowercase letter are not different at p <0.05. Yield values were
rounded to the nearest whole number.

107
Fig. 3.1 Temperature, relative humidity, critical relative humidity, and rainfall events that
occurred between N fertilization and permanent flood establishment for field experiments
conducted in 2013 and 2014. The rainfall event in 2013 was 89 mm and rainfall event in 2014
was 9 mm.
2013
11 Jun 13 Jun 15 Jun 17 Jun 19 Jun 21 Jun 23 Jun
Tem
per
atur
e (°
C)
20
30
40
50
60
70
80
90
100
Rel
ativ
e H
umid
ity (
%)
0
10
20
30
40
50
60
70
80
90
100
Temperature
Relative Humidity
Critical Relative Humidity
N Application
Rainfall Event
Permanent Flood
2014
Time
16 Jun 18 Jun 20 Jun 22 Jun 24 Jun 26 Jun
Tem
per
atur
e (°
C)
20
30
40
50
60
70
80
90
100
Rel
ativ
e H
umid
ity (
%)
0
10
20
30
40
50
60
70
80
90
100
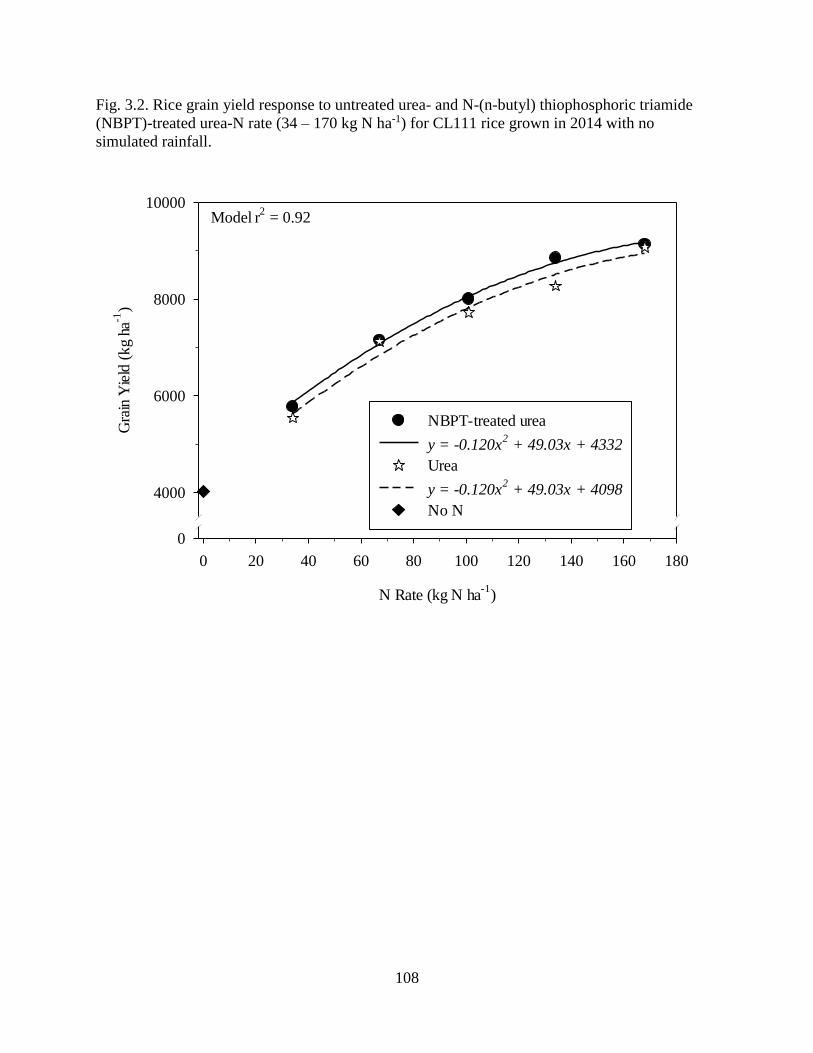
108
Fig. 3.2. Rice grain yield response to untreated urea- and N-(n-butyl) thiophosphoric triamide
(NBPT)-treated urea-N rate (34 – 170 kg N ha-1) for CL111 rice grown in 2014 with no
simulated rainfall.
N Rate (kg N ha-1
)
0 20 40 60 80 100 120 140 160 180
Gra
in Y
ield
(k
g ha
- 1)
0
4000
6000
8000
10000
NBPT-treated urea
y = -0.120x2 + 49.03x + 4332
Urea
y = -0.120x2 + 49.03x + 4098
No N
Model r2 = 0.92

109
Chapter 4
Conclusions
110
Ammonia volatilization and denitrification are the two primary N-loss mechanisms of
urea fertilizer applied preflood to rice grown in the direct-seeded, delayed-flood production
system. Rainfall soon after urea fertilizer application to dry soil has usually been perceived as
having a positive effect on fertilizer-N use efficiency by incorporating urea into the soil and
reducing NH3 volatilization loss. The overall research goal was to evaluate N loss from flood-
irrigated rice when rainfall occurs just prior to or within 24 h after preflood urea application
followed by an extended amount of time (>7 d) before permanent flood establishment. The first
objective examined how rainfall amount (0-25 mm) following urea (Urea) or N-(n-butyl)
thiophoshoric triamide (NBPT)-treated urea was applied to a dry soil influenced NH3 loss as
measured with the semi-open chamber method and rice grain yield. The second objective
examined how simulated rainfall (none, before preflood urea, or after preflood urea), nitrapyrin
rate (NP), and NBPT rate, or both influence rice grain yield and estimated N loss. This research
represents the first in-field, rainfall-simulation trials conducted and reported in the literature for
direct-seeded, delayed-flood rice.
Results from the first experiment showed that NH3 volatilization is greatly reduced when
NBPT-treated urea is used compared to untreated urea across simulated rainfall amounts.
Cumulative NH3 loss from untreated urea accounted for 8.6% of the applied N with no simulated
rainfall and decreased quadratically to 0.6% with 24 mm of simulated rainfall. Cumulative NH3
loss from NBPT-treated urea also decreased qaudratically as simulated rainfall amount increased,
but loss was only 0.2-2.0% of the applied-N. Ammonia volatilization was effectively stopped
(not statistically different than zero) when simulated rainfall was >15.3 mm with NBPT-treated-
urea. For untreated area, ≥7.7 mm of simulated rainfall reduced NH3 loss to less than 4.3% of the
applied urea-N. Yields of rice fertilized with urea decreased linearly or nonlinearly as simulated

111
rainfall increased with the greatest yield produced by rice receiving no simulated rainfall. The
yields of rice fertilized with NBPT-treated Urea were not affected by simulated rainfall amount
(two trials) or decreased nonlinearly (one trial) as rainfall amount increased but were 8.9 to
18.1% greater than the yields of rice fertilized with untreated urea. Rainfall following preflood
urea application appears to reduce NH3 loss but increase N loss presumably via denitrification.
The second experiment showed that NP rate had no effect on grain yield in 2013, but,
compared to untreated urea, NP-treated urea decreased yield by 5.6% in 2014. Yield was
unaffected by simulated rainfall timing when rice was fertilized with NBPT-treated urea (7904-
8264 kg ha-1). When rice was fertilized with untreated urea, grain yields were greater with NOSR
than with SRAN or SRBN. Within each simulated rainfall timing, rice yields were 6.9 to 21.3%
greater when NBPT-treated urea was applied. Application of urea to moist soil or dry soil
followed by rainfall are field environments that result in more substantial N loss than urea
applied to a dry soil that remains dry until the rice field is flooded. Use of NBPT-treated urea
minimized N loss and maximized grain yield in each simulated rainfall scenario examined. When
an extended time (>7 d) is required to flood a field, application of untreated urea to moist soil
followed by drying conditions or dry soil followed by rainfall are field environments that result
in greater N loss and lower rice yields than urea applied to a dry soil followed by no rainfall. Use
of NBPT-treated urea minimized N loss and maximized grain yield in each of the three simulated
rainfall scenarios examined.
The experiments showed that amending urea with the recommended amount of an NBPT-
containing urease inhibitor should be considered as a best management practice for reducing
fertilizer-N loss. Regardless of whether the soil was moistened before or after preflood-N urea
application, use of NBPT-treated urea resulted in greater rice yields than an equivalent amount of

112
N applied as urea when the flood could not be rapidly established. The results suggest that urea-
N loss via NH3 volatilization and possibly denitrification were reduced by NBPT. In many years,
the time, place, and amount of rainfall cannot be accurately predicted and the use of NBPT to
reduce N loss is warranted in fields that require several days to establish a permanent flood.