rhum-rum – seismological imaging of a mantle plume under
TRANSCRIPT
METEOR-Berichte
RHUM-RUM – Seismological Imaging of a Mantle Plume under La Réunion, Western Indian Ocean
Cruise No. M101
October 23 – December 04, 2013, Port Louis (Mauritius) – Le Port (La Réunion, France)
K. Sigloch
Editorial Assistance:
DFG-Senatskommission für Ozeanographie MARUM – Zentrum für Marine Umweltwissenschaften der Universität Bremen
2014
The METEOR-Berichte are published at irregular intervals. They are working papers for people who are occupied with the respective expedition and are intended as reports for the funding institutions. The opinions expressed in the METEOR-Berichte are only those of the authors. The METEOR expeditions are funded by the Deutsche Forschungsgemeinschaft (DFG) and the Bundesministerium für Bildung und Forschung (BMBF). Editor: DFG-Senatskommission für Ozeanographie c/o MARUM – Zentrum für Marine Umweltwissenschaften Universität Bremen Leobener Strasse 28359 Bremen Author: Dr. Karin Sigloch Telefon:+49-89-2180-4138 Ludwig-Maximilians-Universität München Telefax:+49-89-2180-4205 Department für Geo- und Umweltwissenschaften e-mail: [email protected] Theresienstr. 41 80333 München Citation: K. Sigloch (2014) RHUM-RUM – Seismological Imaging of a Mantle Plume under La Réunion, Western Indian Ocean - Cruise No. M101 – October 23 – December 4, 2013 – Port Louis (Mauritius) – Le Port (La Réunion, France). METEOR-Berichte, M101, 39 pp., DFG-Senatskommission für Ozeanographie, DOI:10.2312/cr_m101 _________________________________________________________________________________ ISSN 2195-8475
Meteor-Berichte, Cruise 101, Legs 1+2, Port Louis, Mauritius – Le Port, La Réunion, 23/10 – 04/12/2013 2
Table of Contents
Page
1 Summary 3 2 Participants 4 3 Research Program 7 4 Narrative of the Cruise 8 5 Preliminary Results
5.1 Ocean-Bottom Seismometers 17 5.2 Underway Bathymetry and Magnetics 22
5.2.1 System Overview and Data Processing 22 5.2.2 Specific Profiles Acquired 23
5.3 Expected Results – Geophysics 28 5.4 Greenhouse Gas Measurements (guest project MPI Jena) 29
6 Ship’s Meteorological Station 6.1 Weather during Leg 1 (M101/1) 31 6.2 Weather during Leg 2 (M101/2) 33
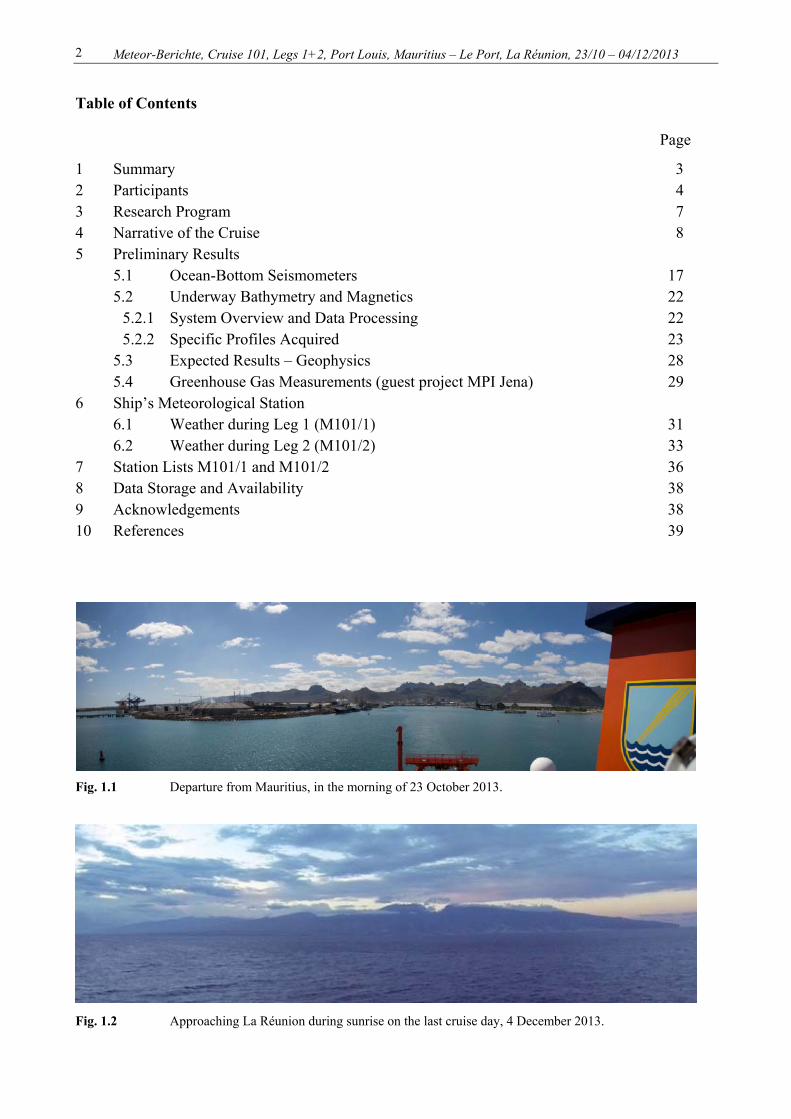
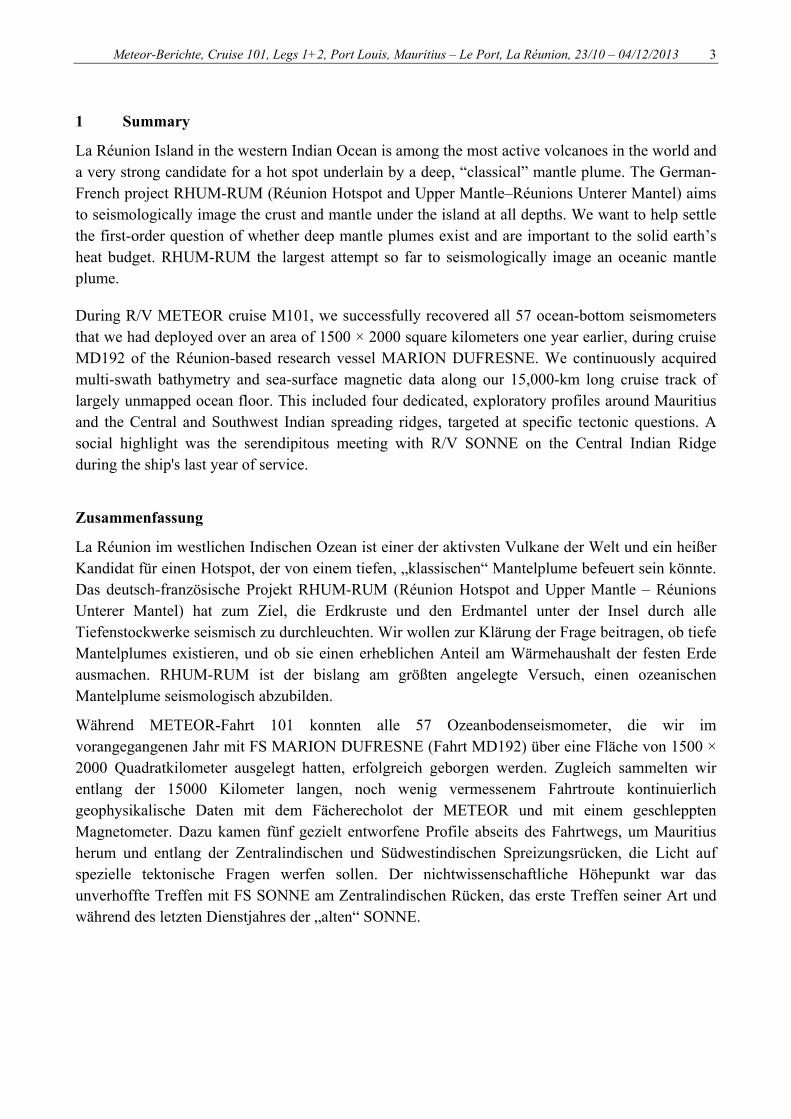
7 Station Lists M101/1 and M101/2 36 8 Data Storage and Availability 38 9 Acknowledgements 38 10 References 39 Fig. 1.1 Departure from Mauritius, in the morning of 23 October 2013. Fig. 1.2 Approaching La Réunion during sunrise on the last cruise day, 4 December 2013.
Meteor-Berichte, Cruise 101, Legs 1+2, Port Louis, Mauritius – Le Port, La Réunion, 23/10 – 04/12/2013 3
1 Summary
La Réunion Island in the western Indian Ocean is among the most active volcanoes in the world and a very strong candidate for a hot spot underlain by a deep, “classical” mantle plume. The German-French project RHUM-RUM (Réunion Hotspot and Upper Mantle–Réunions Unterer Mantel) aims to seismologically image the crust and mantle under the island at all depths. We want to help settle the first-order question of whether deep mantle plumes exist and are important to the solid earth’s heat budget. RHUM-RUM the largest attempt so far to seismologically image an oceanic mantle plume.
During R/V METEOR cruise M101, we successfully recovered all 57 ocean-bottom seismometers that we had deployed over an area of 1500 × 2000 square kilometers one year earlier, during cruise MD192 of the Réunion-based research vessel MARION DUFRESNE. We continuously acquired multi-swath bathymetry and sea-surface magnetic data along our 15,000-km long cruise track of largely unmapped ocean floor. This included four dedicated, exploratory profiles around Mauritius and the Central and Southwest Indian spreading ridges, targeted at specific tectonic questions. A social highlight was the serendipitous meeting with R/V SONNE on the Central Indian Ridge during the ship's last year of service.
Zusammenfassung
La Réunion im westlichen Indischen Ozean ist einer der aktivsten Vulkane der Welt und ein heißer Kandidat für einen Hotspot, der von einem tiefen, „klassischen“ Mantelplume befeuert sein könnte. Das deutsch-französische Projekt RHUM-RUM (Réunion Hotspot and Upper Mantle – Réunions Unterer Mantel) hat zum Ziel, die Erdkruste und den Erdmantel unter der Insel durch alle Tiefenstockwerke seismisch zu durchleuchten. Wir wollen zur Klärung der Frage beitragen, ob tiefe Mantelplumes existieren, und ob sie einen erheblichen Anteil am Wärmehaushalt der festen Erde ausmachen. RHUM-RUM ist der bislang am größten angelegte Versuch, einen ozeanischen Mantelplume seismologisch abzubilden.
Während METEOR-Fahrt 101 konnten alle 57 Ozeanbodenseismometer, die wir im vorangegangenen Jahr mit FS MARION DUFRESNE (Fahrt MD192) über eine Fläche von 1500 × 2000 Quadratkilometer ausgelegt hatten, erfolgreich geborgen werden. Zugleich sammelten wir entlang der 15000 Kilometer langen, noch wenig vermessenem Fahrtroute kontinuierlich geophysikalische Daten mit dem Fächerecholot der METEOR und mit einem geschleppten Magnetometer. Dazu kamen fünf gezielt entworfene Profile abseits des Fahrtwegs, um Mauritius herum und entlang der Zentralindischen und Südwestindischen Spreizungsrücken, die Licht auf spezielle tektonische Fragen werfen sollen. Der nichtwissenschaftliche Höhepunkt war das unverhoffte Treffen mit FS SONNE am Zentralindischen Rücken, das erste Treffen seiner Art und während des letzten Dienstjahres der „alten“ SONNE.
Meteor-Berichte, Cruise 101, Legs 1+2, Port Louis, Mauritius – Le Port, La Réunion, 23/10 – 04/12/2013 4
2 Participants
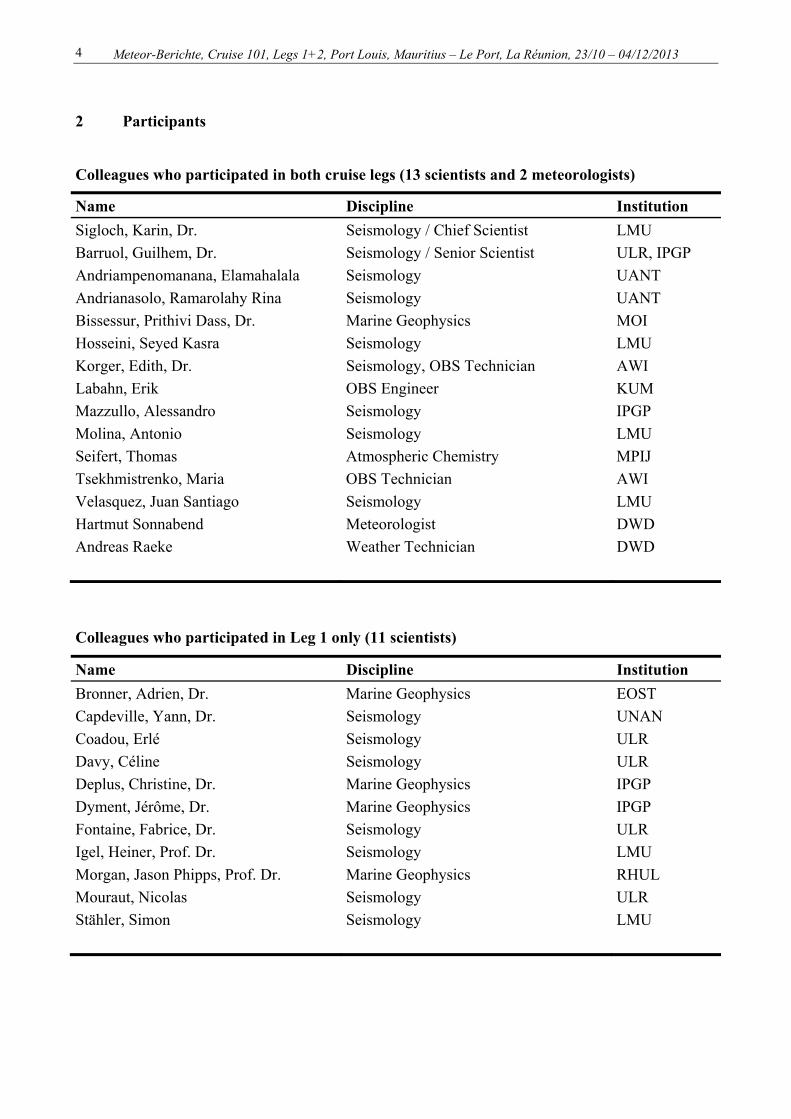
Colleagues who participated in both cruise legs (13 scientists and 2 meteorologists)
Name Discipline Institution Sigloch, Karin, Dr. Seismology / Chief Scientist LMU Barruol, Guilhem, Dr. Seismology / Senior Scientist ULR, IPGP Andriampenomanana, Elamahalala Seismology UANT Andrianasolo, Ramarolahy Rina Seismology UANT Bissessur, Prithivi Dass, Dr. Marine Geophysics MOI Hosseini, Seyed Kasra Seismology LMU Korger, Edith, Dr. Seismology, OBS Technician AWI Labahn, Erik OBS Engineer KUM Mazzullo, Alessandro Seismology IPGP Molina, Antonio Seismology LMU Seifert, Thomas Atmospheric Chemistry MPIJ Tsekhmistrenko, Maria OBS Technician AWI Velasquez, Juan Santiago Seismology LMU Hartmut Sonnabend Meteorologist DWD Andreas Raeke Weather Technician DWD Colleagues who participated in Leg 1 only (11 scientists)
Name Discipline Institution Bronner, Adrien, Dr. Marine Geophysics EOST Capdeville, Yann, Dr. Seismology UNAN Coadou, Erlé Seismology ULR Davy, Céline Seismology ULR Deplus, Christine, Dr. Marine Geophysics IPGP Dyment, Jérôme, Dr. Marine Geophysics IPGP Fontaine, Fabrice, Dr. Seismology ULR Igel, Heiner, Prof. Dr. Seismology LMU Morgan, Jason Phipps, Prof. Dr. Marine Geophysics RHUL Mouraut, Nicolas Seismology ULR Stähler, Simon Seismology LMU
Meteor-Berichte, Cruise 101, Legs 1+2, Port Louis, Mauritius – Le Port, La Réunion, 23/10 – 04/12/2013 5
Colleagues who participated in Leg 2 only (9 scientists)
Name Discipline Institution Berthod, Carole Geology ULR Daniel, Romuald OBS Engineer IPGP Gabriel, Anne Alice, Dr. Seismology LMU Gaina, Carmen, Dr. Marine Geophysics UOS Muller, Elisabeth Marine Geophysics UOX Li, Xuan OBS Engineer IPGP Roult, Geneviève, Dr. Seismology IPGP Rümpker, Georg, Prof. Dr. Seismology UFR Bonnieux, Sébastien Marine Engineer UNIC
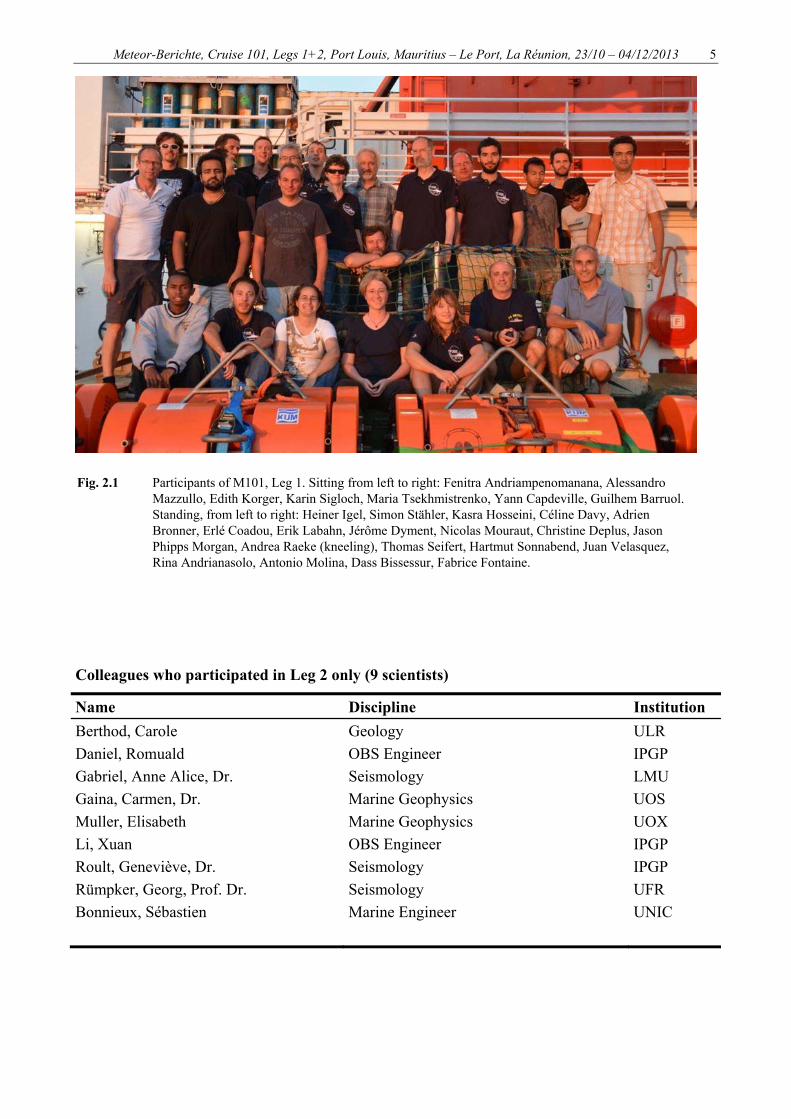
Fig. 2.1 Participants of M101, Leg 1. Sitting from left to right: Fenitra Andriampenomanana, Alessandro Mazzullo, Edith Korger, Karin Sigloch, Maria Tsekhmistrenko, Yann Capdeville, Guilhem Barruol. Standing, from left to right: Heiner Igel, Simon Stähler, Kasra Hosseini, Céline Davy, Adrien Bronner, Erlé Coadou, Erik Labahn, Jérôme Dyment, Nicolas Mouraut, Christine Deplus, Jason Phipps Morgan, Andrea Raeke (kneeling), Thomas Seifert, Hartmut Sonnabend, Juan Velasquez, Rina Andrianasolo, Antonio Molina, Dass Bissessur, Fabrice Fontaine.
Meteor-Berichte, Cruise 101, Legs 1+2, Port Louis, Mauritius – Le Port, La Réunion, 23/10 – 04/12/2013 6
LMU Ludwig-Maximilians-Universität München ULR Université de La Réunion AWI Alfred Wegener Institut Bremerhaven DWD Deutscher Wetterdienst, Geschäftsfeld Seeschiffahrt EOST Ecole et Observatoire des Sciences de la Terre, Strasbourg IPGP Institut de Physique du Globe, Paris KUM Kiel Umwelt- und Meerestechnik, Kiel MOI Mauritius Oceanography Institute MPIJ Max Planck Institut für Biogeochemie, Jena RHUL Royal Holloway University London UANT University of Antananarivo, Institute and Observatory of Geophysics UFR Goethe-Universität Frankfurt am Main UNAN Université de Nantes UNIC Université de Nice UOS University of Oslo UOX University of Oxford
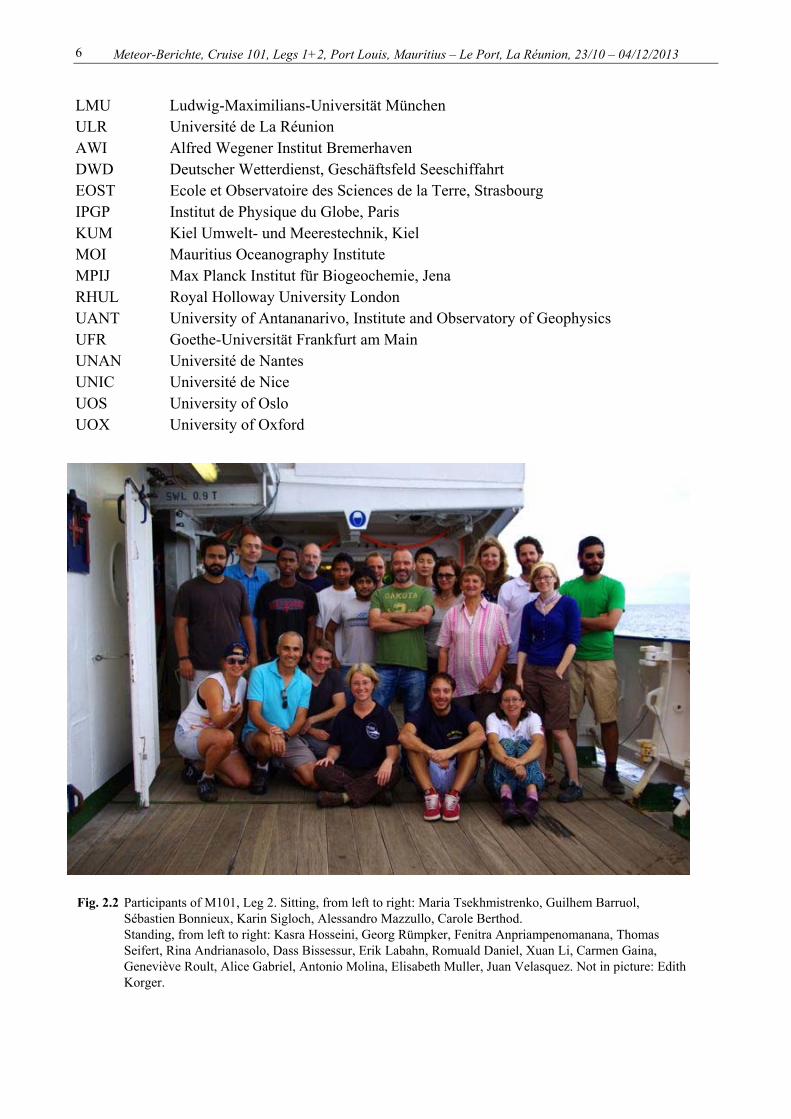
Fig. 2.2 Participants of M101, Leg 2. Sitting, from left to right: Maria Tsekhmistrenko, Guilhem Barruol, Sébastien Bonnieux, Karin Sigloch, Alessandro Mazzullo, Carole Berthod. Standing, from left to right: Kasra Hosseini, Georg Rümpker, Fenitra Anpriampenomanana, Thomas Seifert, Rina Andrianasolo, Dass Bissessur, Erik Labahn, Romuald Daniel, Xuan Li, Carmen Gaina, Geneviève Roult, Alice Gabriel, Antonio Molina, Elisabeth Muller, Juan Velasquez. Not in picture: Edith Korger.
Meteor-Berichte, Cruise 101, Legs 1+2, Port Louis, Mauritius – Le Port, La Réunion, 23/10 – 04/12/2013 7
3 Research Program
Whether volcanic intraplate hot spots are underlain by deep mantle plumes continues to be debated 40 years after the hypothesis was proposed by Morgan (1972). Seismology could settle the controversy regarding the existence and significance of plumes by imaging plume conduits—or lack thereof—in situ, but the most promising hot spots are located well into the oceans, and large-scale instrumentation of the seafloor has been coming into reach only recently.
La Réunion Island in the western Indian Ocean is among the most active volcanoes in the world and a very strong candidate for a hot spot underlain by a deep, “classical” mantle plume. The German-French project RHUM-RUM (Réunion Hotspot and Upper Mantle – Réunions Unterer Mantel) aims to seismologically image the crust and mantle under the island at all depths. Through what is thus far the most expansive attempt to work out the deep plumbing of hot spots, we may be able to clarify the feeding mechanism for hot spot volcanism, estimate ascending material and heat fluxes, and document interaction with the overlying African plate and with neighboring mid-ocean ridges.
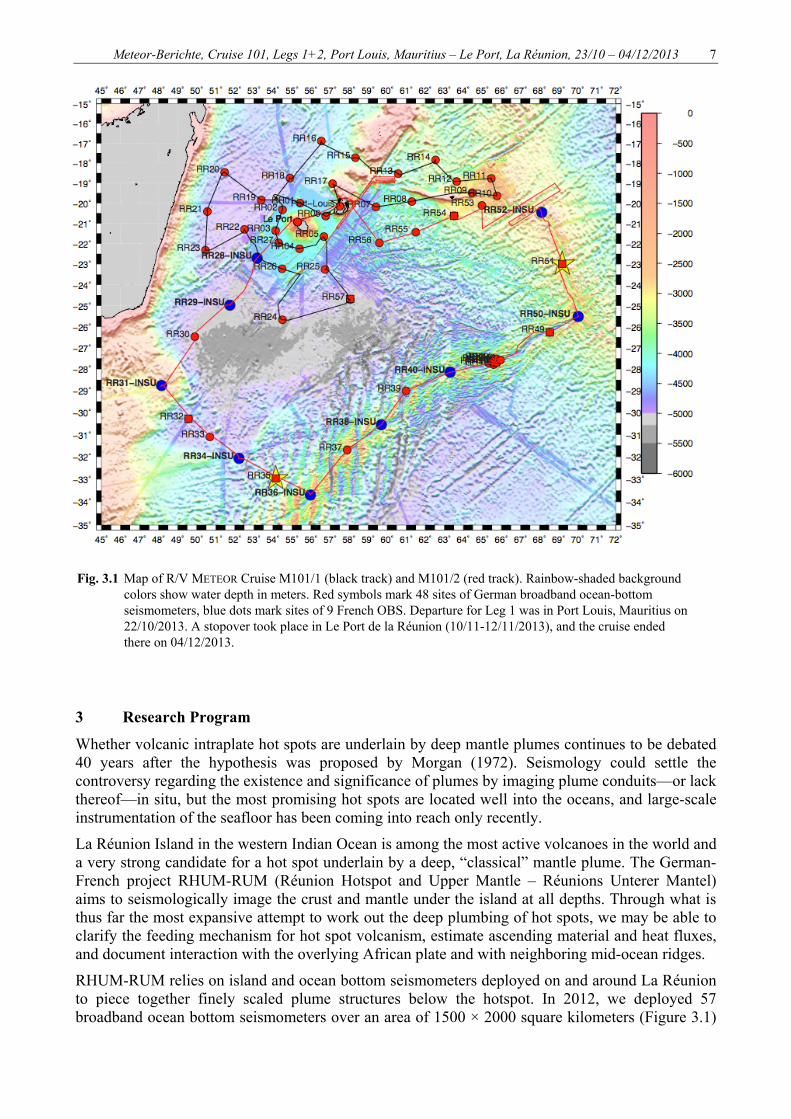
RHUM-RUM relies on island and ocean bottom seismometers deployed on and around La Réunion to piece together finely scaled plume structures below the hotspot. In 2012, we deployed 57 broadband ocean bottom seismometers over an area of 1500 × 2000 square kilometers (Figure 3.1)
Fig. 3.1 Map of R/V METEOR Cruise M101/1 (black track) and M101/2 (red track). Rainbow-shaded background colors show water depth in meters. Red symbols mark 48 sites of German broadband ocean-bottom seismometers, blue dots mark sites of 9 French OBS. Departure for Leg 1 was in Port Louis, Mauritius on 22/10/2013. A stopover took place in Le Port de la Réunion (10/11-12/11/2013), and the cruise ended there on 04/12/2013.
Meteor-Berichte, Cruise 101, Legs 1+2, Port Louis, Mauritius – Le Port, La Réunion, 23/10 – 04/12/2013 8
using R/V MARION DUFRESNE. This ocean-bottom component is supplemented by 20 existing and 10 new land stations on La Réunion Island as well as 27 RHUM-RUM stations on Mauritius, Rodrigues, the southern Seychelles, Madagascar, and the Iles Eparses in the Mozambique Channel. Existing land instrumentation on Africa and Madagascar extends the effective array aperture to several thousand kilometers. In total, around 120 broadband seismometers will have been operating in the western Indian Ocean in 2012/2013, making RHUM- RUM the largest attempt to image an oceanic mantle plume so far.
The ocean-bottom instruments had recorded for 13 months when we recovered them on the cruise METEOR 101. They constitute the largest volume and the most innovative aspect of our plume imaging experiment. They are complemented by a wealth of marine geophysical measurements acquired during both RHUM-RUM cruises, which will complete the picture as to the likely subsurface processes and tectonic history of this suspected plume territory.
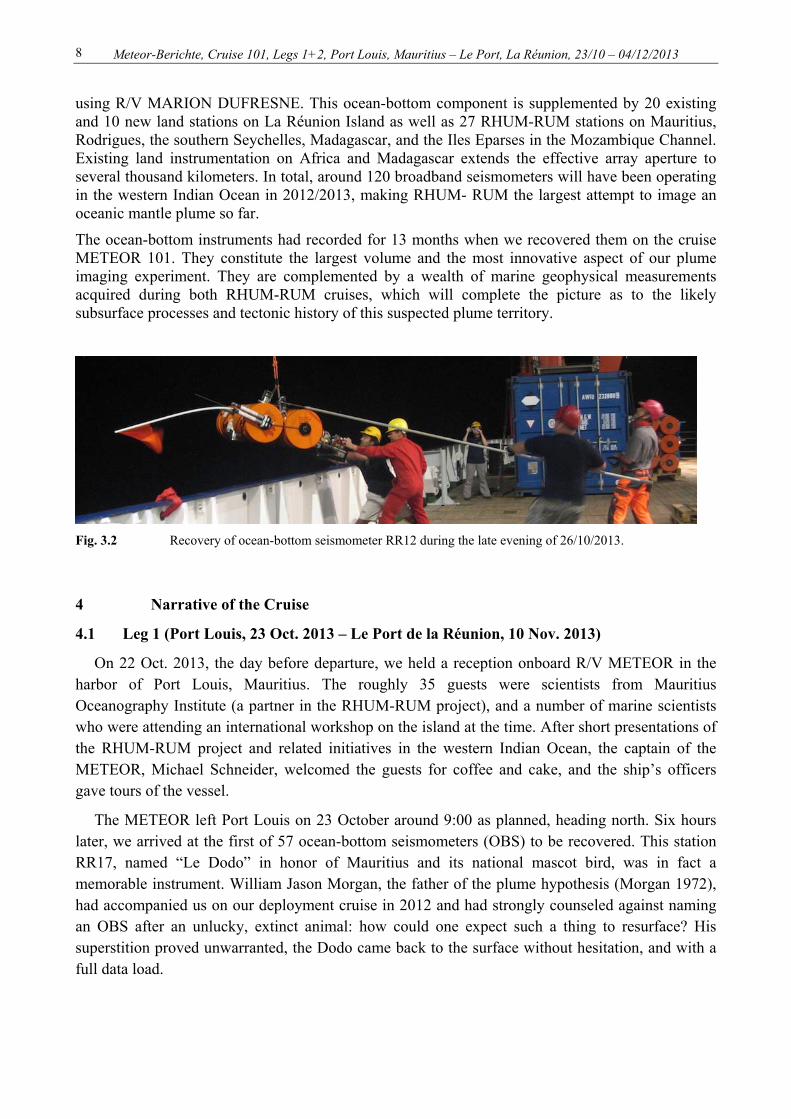
Fig. 3.2 Recovery of ocean-bottom seismometer RR12 during the late evening of 26/10/2013.
4 Narrative of the Cruise
4.1 Leg 1 (Port Louis, 23 Oct. 2013 – Le Port de la Réunion, 10 Nov. 2013)
On 22 Oct. 2013, the day before departure, we held a reception onboard R/V METEOR in the harbor of Port Louis, Mauritius. The roughly 35 guests were scientists from Mauritius Oceanography Institute (a partner in the RHUM-RUM project), and a number of marine scientists who were attending an international workshop on the island at the time. After short presentations of the RHUM-RUM project and related initiatives in the western Indian Ocean, the captain of the METEOR, Michael Schneider, welcomed the guests for coffee and cake, and the ship’s officers gave tours of the vessel.
The METEOR left Port Louis on 23 October around 9:00 as planned, heading north. Six hours later, we arrived at the first of 57 ocean-bottom seismometers (OBS) to be recovered. This station RR17, named “Le Dodo” in honor of Mauritius and its national mascot bird, was in fact a memorable instrument. William Jason Morgan, the father of the plume hypothesis (Morgan 1972), had accompanied us on our deployment cruise in 2012 and had strongly counseled against naming an OBS after an unlucky, extinct animal: how could one expect such a thing to resurface? His superstition proved unwarranted, the Dodo came back to the surface without hesitation, and with a full data load.

Meteor-Berichte, Cruise 101, Legs 1+2, Port Louis, Mauritius – Le Port, La Réunion, 23/10 – 04/12/2013 9
Fig. 4.1 When in 2012, shortly before deployment, our AWI-KUM engineering crew decorated and baptized this OBS “Le Dodo”, Jason Morgan (left) was worried that it would take an ill-fated dive.
But in fact the Dodo (RR17) became the first instrument to return in 2013.
The OBS recovery procedure would become the structuring activity of the cruise: slowing to a halt several hundred meters before the deployment position; sending several acoustic release commands toward the seafloor using the ship’s hydrophone; listening for replies by the OBS, the acknowledgments that it had released from its steel anchor and was rising (though only audible in 80-90% of the cases); waiting for the instrument to appear at the surface and to announce itself by its bright orange colors, its flashing beacon and its radio beacon; slow approach of the METEOR, positioning the OBS against the starboard hull of the ship; the sailors’ hooking of the OBS frame and manual attachment to the hook of the ship crane; hoisting the OBS onboard by the ship crane; immediate spray cleaning with fresh water, followed by synchronization of the internal clock with GPS, removal of the hard disk and reading out of the data in the seismology lab.
In this routine of recovering 1-3 OBS per day, we would encounter minor issues, such as no reply upon calling, a flasher beacon failing in a night recovery, or realizations that certain seismometers, batteries, data loggers, or internal clocks had not worked as desired. The most basic measure of success however is that we did recover 100% of our ocean-bottom seismometers, a remarkable statistic. In particular, it is also a measure of reliability for the German OBS community pool DEPAS, managed by AWI Bremerhaven. We had deployed 48 DEPAS broadband seismometers, the largest number of unique instruments ever deployed from the pool, plus 9 French broadband seismometers from the INSU pool, managed by IPG Paris. All in all, this was one of the largest long-term (13 month) deployments of ocean-bottom seismometers worldwide so far.
During Oct 24-26, the cruise continued east toward the Central Indian Ridge and past the island of Rodrigues (part of Mauritius). After the second OBS, RR07, we started the continuous acquisition of multi-swath bathymetry data using the METEOR’s Kongsberg EM122 sounder, and of scalar magnetic data, acquired by a SeaSpy magnetometer towed 200 meters behind the ship. During stretches where we would by default retrace our route on R/V MARION DUFRESNE from
Meteor-Berichte, Cruise 101, Legs 1+2, Port Louis, Mauritius – Le Port, La Réunion, 23/10 – 04/12/2013 10
the previous year, we often chose to offset our path by one swath width to one or the other side of the 2012 track, in order to acquire new data. The largest parts of our 15,000-km-long cruise tracks in 2012 and 2013 had not been previously covered by a modern multi-swath sounding system, and the Kongsberg EM122 of the METEOR delivered very good raw data.
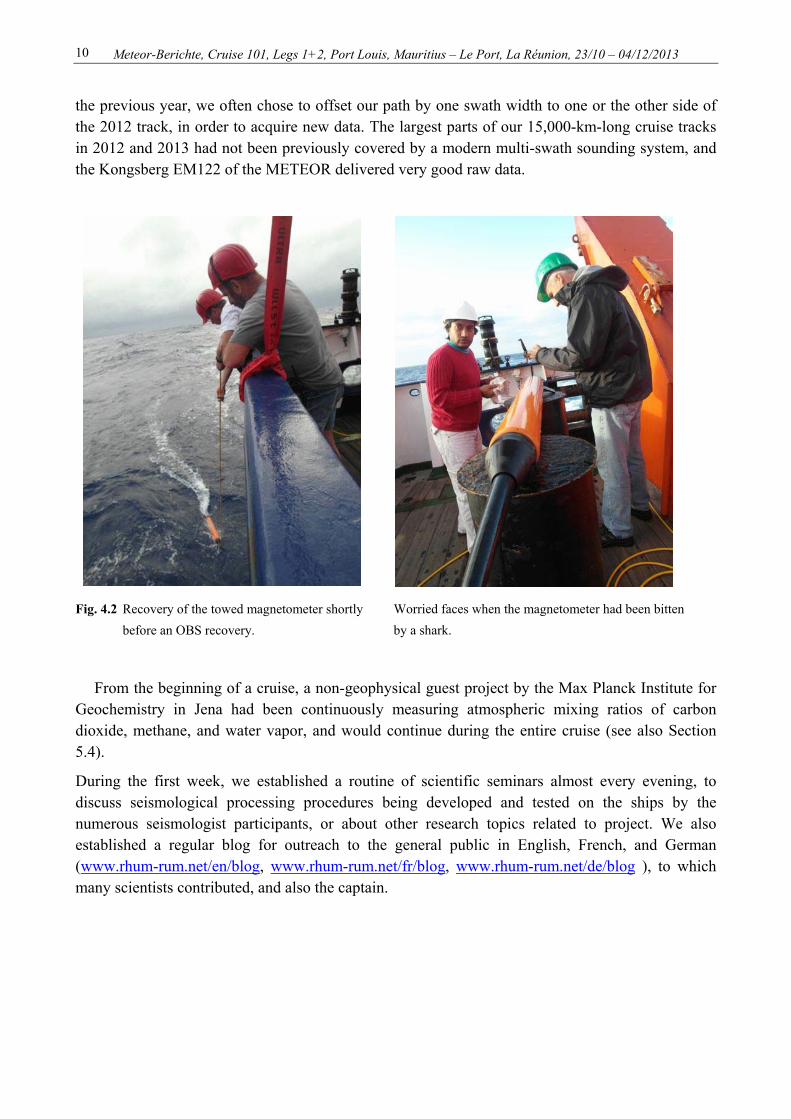
Fig. 4.2 Recovery of the towed magnetometer shortly before an OBS recovery.
Worried faces when the magnetometer had been bitten by a shark.
From the beginning of a cruise, a non-geophysical guest project by the Max Planck Institute for Geochemistry in Jena had been continuously measuring atmospheric mixing ratios of carbon dioxide, methane, and water vapor, and would continue during the entire cruise (see also Section 5.4).
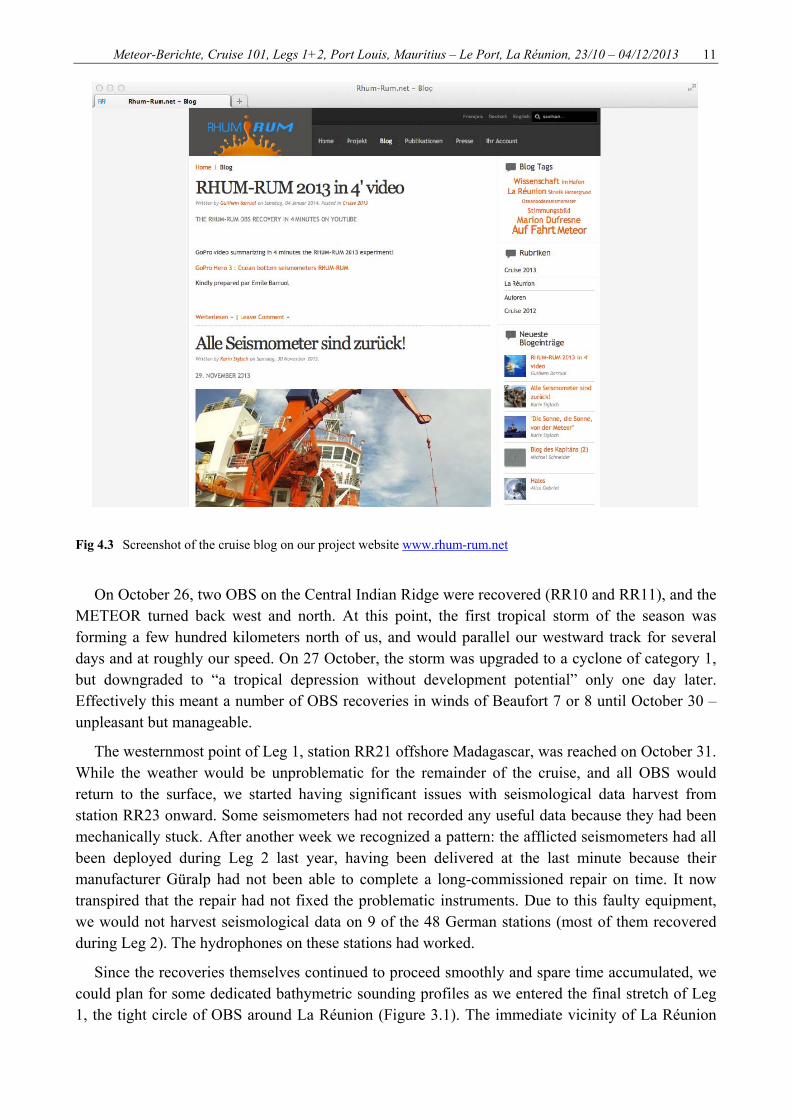
During the first week, we established a routine of scientific seminars almost every evening, to discuss seismological processing procedures being developed and tested on the ships by the numerous seismologist participants, or about other research topics related to project. We also established a regular blog for outreach to the general public in English, French, and German (www.rhum-rum.net/en/blog, www.rhum-rum.net/fr/blog, www.rhum-rum.net/de/blog ), to which many scientists contributed, and also the captain.
Meteor-Berichte, Cruise 101, Legs 1+2, Port Louis, Mauritius – Le Port, La Réunion, 23/10 – 04/12/2013 11
Fig 4.3 Screenshot of the cruise blog on our project website www.rhum-rum.net
On October 26, two OBS on the Central Indian Ridge were recovered (RR10 and RR11), and the METEOR turned back west and north. At this point, the first tropical storm of the season was forming a few hundred kilometers north of us, and would parallel our westward track for several days and at roughly our speed. On 27 October, the storm was upgraded to a cyclone of category 1, but downgraded to “a tropical depression without development potential” only one day later. Effectively this meant a number of OBS recoveries in winds of Beaufort 7 or 8 until October 30 – unpleasant but manageable.
The westernmost point of Leg 1, station RR21 offshore Madagascar, was reached on October 31. While the weather would be unproblematic for the remainder of the cruise, and all OBS would return to the surface, we started having significant issues with seismological data harvest from station RR23 onward. Some seismometers had not recorded any useful data because they had been mechanically stuck. After another week we recognized a pattern: the afflicted seismometers had all been deployed during Leg 2 last year, having been delivered at the last minute because their manufacturer Güralp had not been able to complete a long-commissioned repair on time. It now transpired that the repair had not fixed the problematic instruments. Due to this faulty equipment, we would not harvest seismological data on 9 of the 48 German stations (most of them recovered during Leg 2). The hydrophones on these stations had worked.
Since the recoveries themselves continued to proceed smoothly and spare time accumulated, we could plan for some dedicated bathymetric sounding profiles as we entered the final stretch of Leg 1, the tight circle of OBS around La Réunion (Figure 3.1). The immediate vicinity of La Réunion
Meteor-Berichte, Cruise 101, Legs 1+2, Port Louis, Mauritius – Le Port, La Réunion, 23/10 – 04/12/2013 12
has generally been well mapped (by cruise FOREVER of NO L’Atalante and cruise ERODER of BHO Beautemps Beaupré in 2006), so instead we targeted a major, unmapped seamount named La Pérouse, located between RR02 and RR19 and surveyed on 6 Nov 2013, and the steep flanks of the plateau that hosts the island of Mauritius on 7-8 Nov. 2013 (see also Sections 5.2.21 and 5.2.2.2).
Approaching Mauritius again had become necessary because the port of La Réunion would not be able to supply the METEOR with fuel during the stopover on 10-12 November, so that 9 November had to be dedicated to refueling in Mauritius and for subsequent transit to La Réunion.
Leg 1 ended as planned in the harbor of Le Port de la Réunion on the morning of 10 November. 11 scientists left the ship, 9 new colleagues joined us, and new provisions were stocked. On 11 November, a holiday and hot summer day in the tropics, we organized an on-board reception, ship tours, and coffee and cakes for roughly 20 scientists from the University of La Réunion and their families, again graciously co-hosted by Captain Michael Schneider.
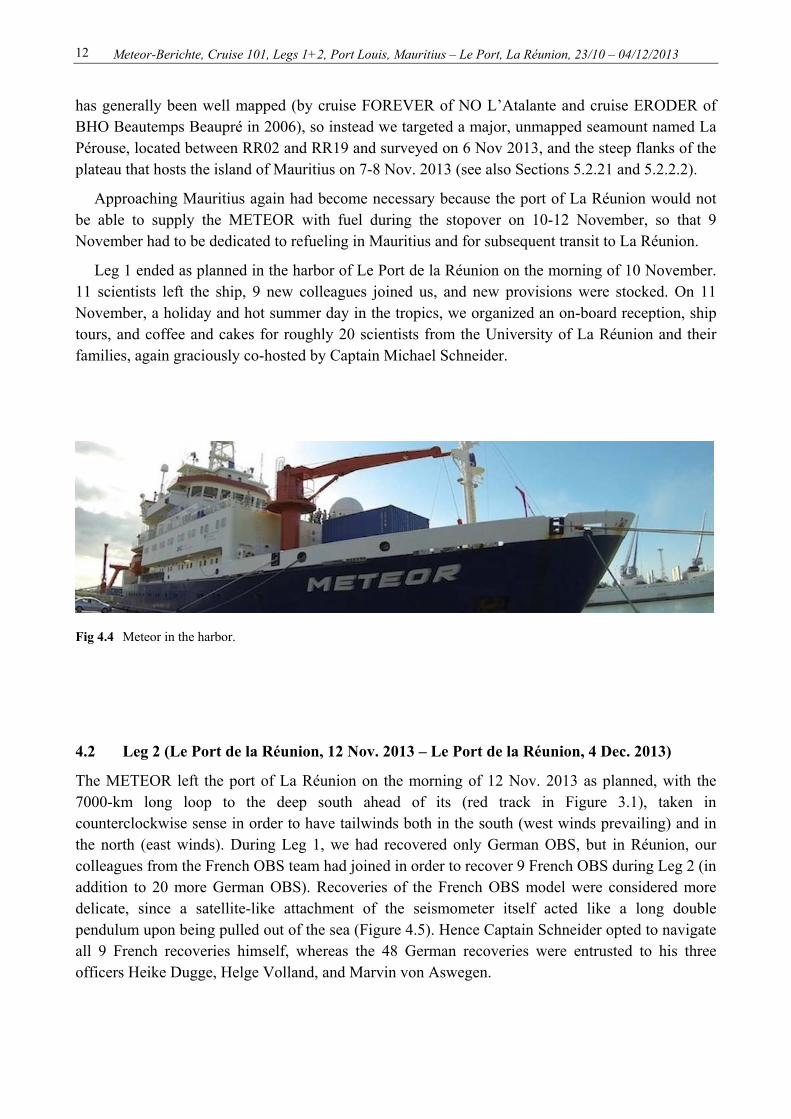
Fig 4.4 Meteor in the harbor.
4.2 Leg 2 (Le Port de la Réunion, 12 Nov. 2013 – Le Port de la Réunion, 4 Dec. 2013)
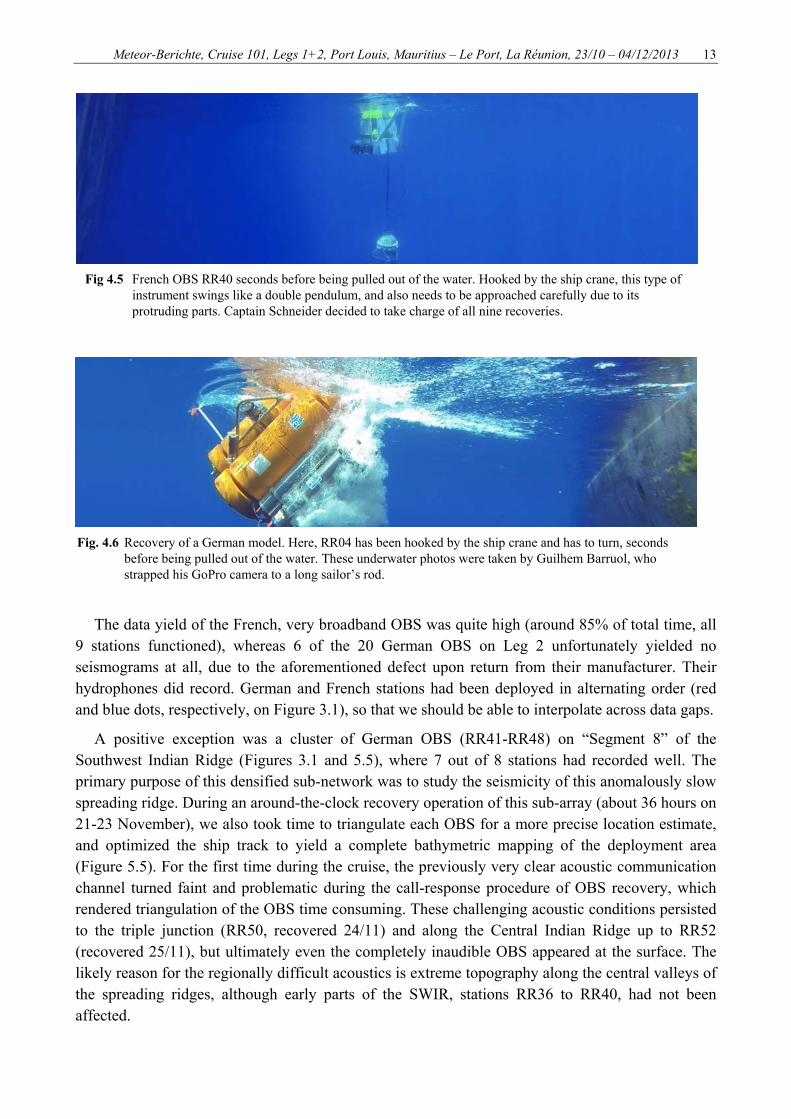
The METEOR left the port of La Réunion on the morning of 12 Nov. 2013 as planned, with the 7000-km long loop to the deep south ahead of its (red track in Figure 3.1), taken in counterclockwise sense in order to have tailwinds both in the south (west winds prevailing) and in the north (east winds). During Leg 1, we had recovered only German OBS, but in Réunion, our colleagues from the French OBS team had joined in order to recover 9 French OBS during Leg 2 (in addition to 20 more German OBS). Recoveries of the French OBS model were considered more delicate, since a satellite-like attachment of the seismometer itself acted like a long double pendulum upon being pulled out of the sea (Figure 4.5). Hence Captain Schneider opted to navigate all 9 French recoveries himself, whereas the 48 German recoveries were entrusted to his three officers Heike Dugge, Helge Volland, and Marvin von Aswegen.
Meteor-Berichte, Cruise 101, Legs 1+2, Port Louis, Mauritius – Le Port, La Réunion, 23/10 – 04/12/2013 13
The data yield of the French, very broadband OBS was quite high (around 85% of total time, all 9 stations functioned), whereas 6 of the 20 German OBS on Leg 2 unfortunately yielded no seismograms at all, due to the aforementioned defect upon return from their manufacturer. Their hydrophones did record. German and French stations had been deployed in alternating order (red and blue dots, respectively, on Figure 3.1), so that we should be able to interpolate across data gaps.
A positive exception was a cluster of German OBS (RR41-RR48) on “Segment 8” of the Southwest Indian Ridge (Figures 3.1 and 5.5), where 7 out of 8 stations had recorded well. The primary purpose of this densified sub-network was to study the seismicity of this anomalously slow spreading ridge. During an around-the-clock recovery operation of this sub-array (about 36 hours on 21-23 November), we also took time to triangulate each OBS for a more precise location estimate, and optimized the ship track to yield a complete bathymetric mapping of the deployment area (Figure 5.5). For the first time during the cruise, the previously very clear acoustic communication channel turned faint and problematic during the call-response procedure of OBS recovery, which rendered triangulation of the OBS time consuming. These challenging acoustic conditions persisted to the triple junction (RR50, recovered 24/11) and along the Central Indian Ridge up to RR52 (recovered 25/11), but ultimately even the completely inaudible OBS appeared at the surface. The likely reason for the regionally difficult acoustics is extreme topography along the central valleys of the spreading ridges, although early parts of the SWIR, stations RR36 to RR40, had not been affected.
Fig 4.5 French OBS RR40 seconds before being pulled out of the water. Hooked by the ship crane, this type of instrument swings like a double pendulum, and also needs to be approached carefully due to its protruding parts. Captain Schneider decided to take charge of all nine recoveries.
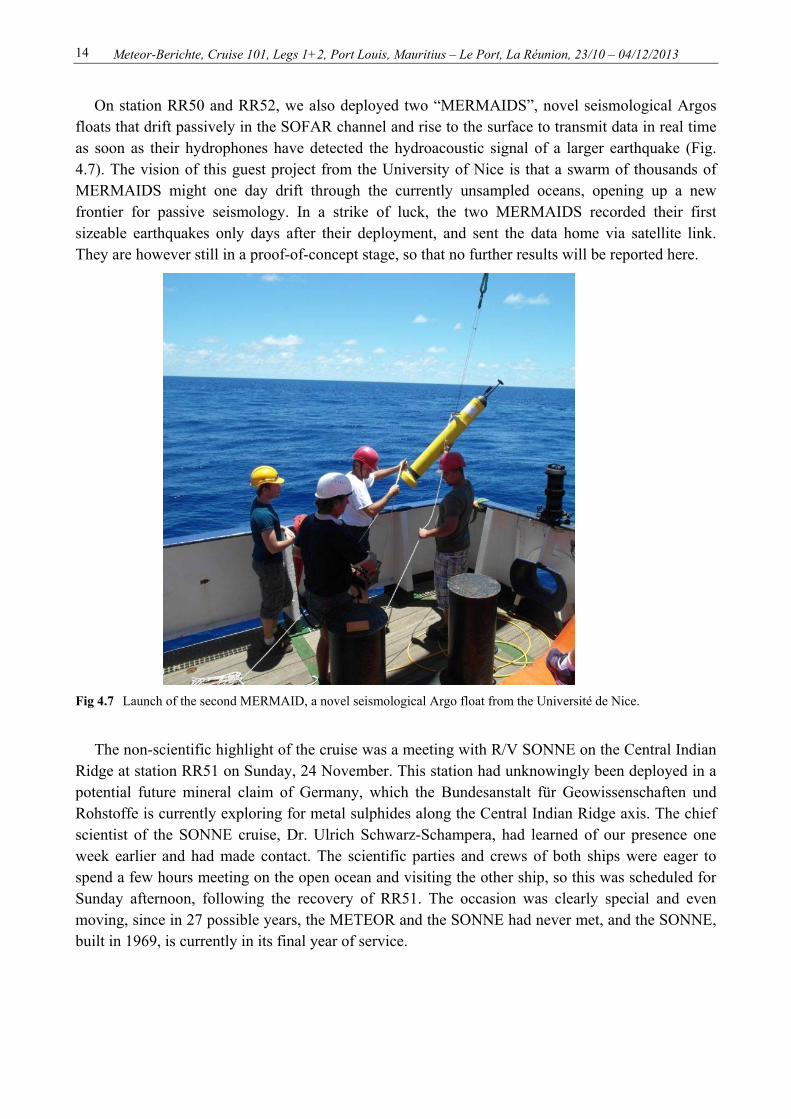
Fig. 4.6 Recovery of a German model. Here, RR04 has been hooked by the ship crane and has to turn, seconds before being pulled out of the water. These underwater photos were taken by Guilhem Barruol, who strapped his GoPro camera to a long sailor’s rod.
Meteor-Berichte, Cruise 101, Legs 1+2, Port Louis, Mauritius – Le Port, La Réunion, 23/10 – 04/12/2013 14
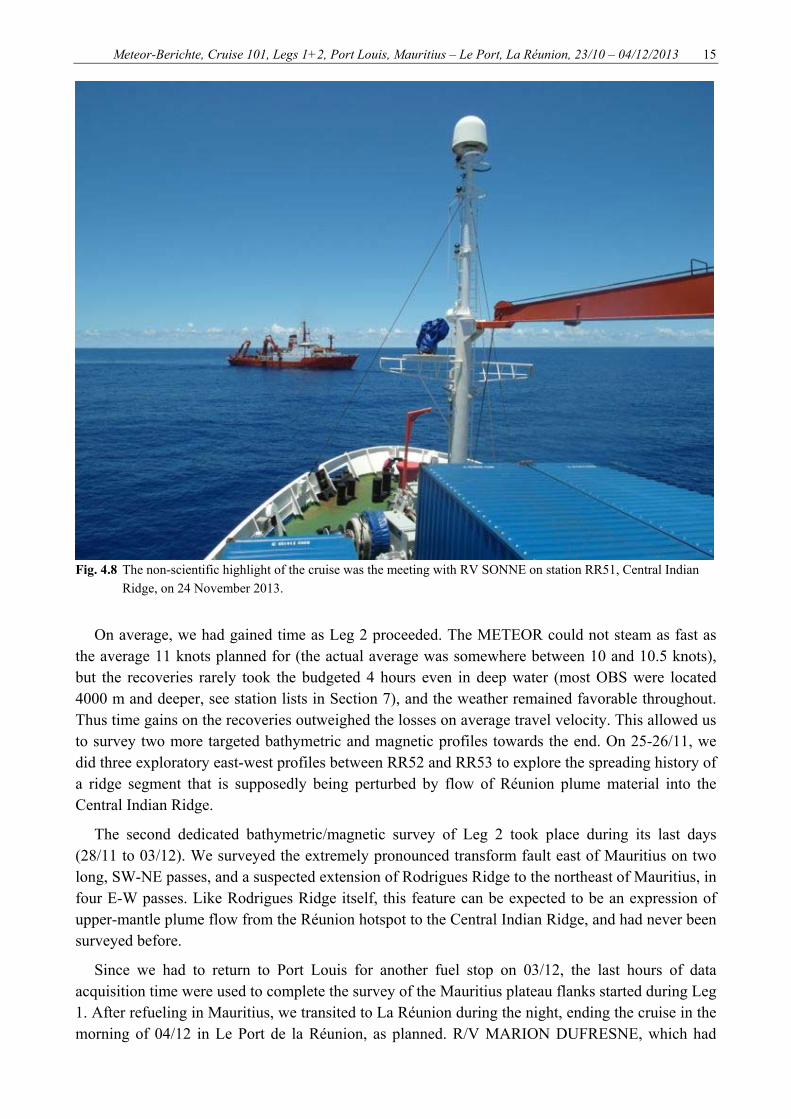
On station RR50 and RR52, we also deployed two “MERMAIDS”, novel seismological Argos floats that drift passively in the SOFAR channel and rise to the surface to transmit data in real time as soon as their hydrophones have detected the hydroacoustic signal of a larger earthquake (Fig. 4.7). The vision of this guest project from the University of Nice is that a swarm of thousands of MERMAIDS might one day drift through the currently unsampled oceans, opening up a new frontier for passive seismology. In a strike of luck, the two MERMAIDS recorded their first sizeable earthquakes only days after their deployment, and sent the data home via satellite link. They are however still in a proof-of-concept stage, so that no further results will be reported here.
Fig 4.7 Launch of the second MERMAID, a novel seismological Argo float from the Université de Nice.
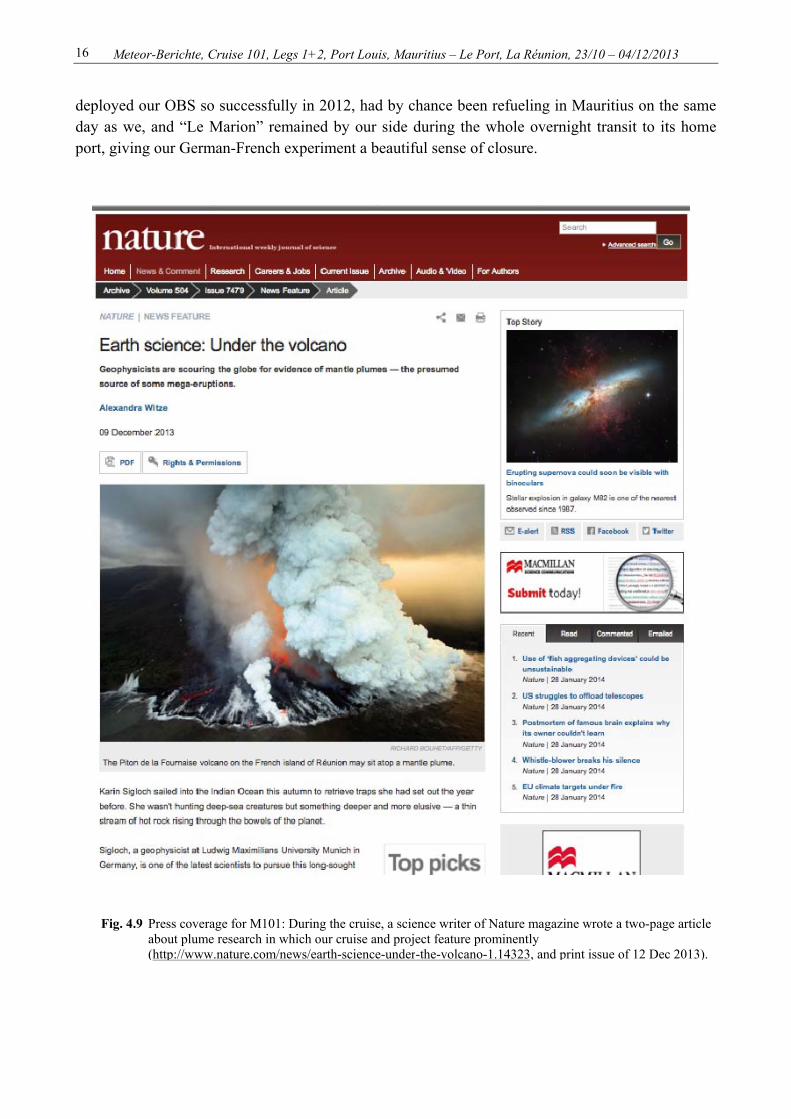
The non-scientific highlight of the cruise was a meeting with R/V SONNE on the Central Indian Ridge at station RR51 on Sunday, 24 November. This station had unknowingly been deployed in a potential future mineral claim of Germany, which the Bundesanstalt für Geowissenschaften und Rohstoffe is currently exploring for metal sulphides along the Central Indian Ridge axis. The chief scientist of the SONNE cruise, Dr. Ulrich Schwarz-Schampera, had learned of our presence one week earlier and had made contact. The scientific parties and crews of both ships were eager to spend a few hours meeting on the open ocean and visiting the other ship, so this was scheduled for Sunday afternoon, following the recovery of RR51. The occasion was clearly special and even moving, since in 27 possible years, the METEOR and the SONNE had never met, and the SONNE, built in 1969, is currently in its final year of service.
Meteor-Berichte, Cruise 101, Legs 1+2, Port Louis, Mauritius – Le Port, La Réunion, 23/10 – 04/12/2013 15
Fig. 4.8 The non-scientific highlight of the cruise was the meeting with RV SONNE on station RR51, Central Indian Ridge, on 24 November 2013.
On average, we had gained time as Leg 2 proceeded. The METEOR could not steam as fast as the average 11 knots planned for (the actual average was somewhere between 10 and 10.5 knots), but the recoveries rarely took the budgeted 4 hours even in deep water (most OBS were located 4000 m and deeper, see station lists in Section 7), and the weather remained favorable throughout. Thus time gains on the recoveries outweighed the losses on average travel velocity. This allowed us to survey two more targeted bathymetric and magnetic profiles towards the end. On 25-26/11, we did three exploratory east-west profiles between RR52 and RR53 to explore the spreading history of a ridge segment that is supposedly being perturbed by flow of Réunion plume material into the Central Indian Ridge.
The second dedicated bathymetric/magnetic survey of Leg 2 took place during its last days (28/11 to 03/12). We surveyed the extremely pronounced transform fault east of Mauritius on two long, SW-NE passes, and a suspected extension of Rodrigues Ridge to the northeast of Mauritius, in four E-W passes. Like Rodrigues Ridge itself, this feature can be expected to be an expression of upper-mantle plume flow from the Réunion hotspot to the Central Indian Ridge, and had never been surveyed before.
Since we had to return to Port Louis for another fuel stop on 03/12, the last hours of data acquisition time were used to complete the survey of the Mauritius plateau flanks started during Leg 1. After refueling in Mauritius, we transited to La Réunion during the night, ending the cruise in the morning of 04/12 in Le Port de la Réunion, as planned. R/V MARION DUFRESNE, which had
Meteor-Berichte, Cruise 101, Legs 1+2, Port Louis, Mauritius – Le Port, La Réunion, 23/10 – 04/12/2013 16
deployed our OBS so successfully in 2012, had by chance been refueling in Mauritius on the same day as we, and “Le Marion” remained by our side during the whole overnight transit to its home port, giving our German-French experiment a beautiful sense of closure.
Fig. 4.9 Press coverage for M101: During the cruise, a science writer of Nature magazine wrote a two-page article about plume research in which our cruise and project feature prominently (http://www.nature.com/news/earth-science-under-the-volcano-1.14323, and print issue of 12 Dec 2013).
Meteor-Berichte, Cruise 101, Legs 1+2, Port Louis, Mauritius – Le Port, La Réunion, 23/10 – 04/12/2013 17
5 Preliminary Results
5.1 Ocean-Bottom Seismometers
(Karin Sigloch, Guilhem Barruol, Kasra Hosseini, Edith Korger, Fabrice Fontaine, Maria Tsekhmistrenko, Simon Stähler, Geneviève Roult, Heiner Igel, Yann Capdeville, Céline Davy, Georg Rümpker, and Shipboard Scientific Party)
All 48 German and 9 French ocean-bottom seismometers deployed in 2012 during cruise MD192 were successfully recovered in 2013. From the 57 ocean-bottom seismometers, we harvested about 1 terabyte of passive seismological waveform data.
The actual data analysis in terms of scientific questions (“Is there a mantle plume under La Réunion?”) will take much more work than can be accomplished during a cruise. However, we did have an impressive assemblage of seismologists and seismological expertise on board, and we used it to assess the quality of the raw data and to detect and understand technical glitches encountered, a challenging and multi-faceted process. We also worked on certain pre-processing steps from which most RHUM-RUM projects will benefit, no matter what their exact seismological techniques will be.
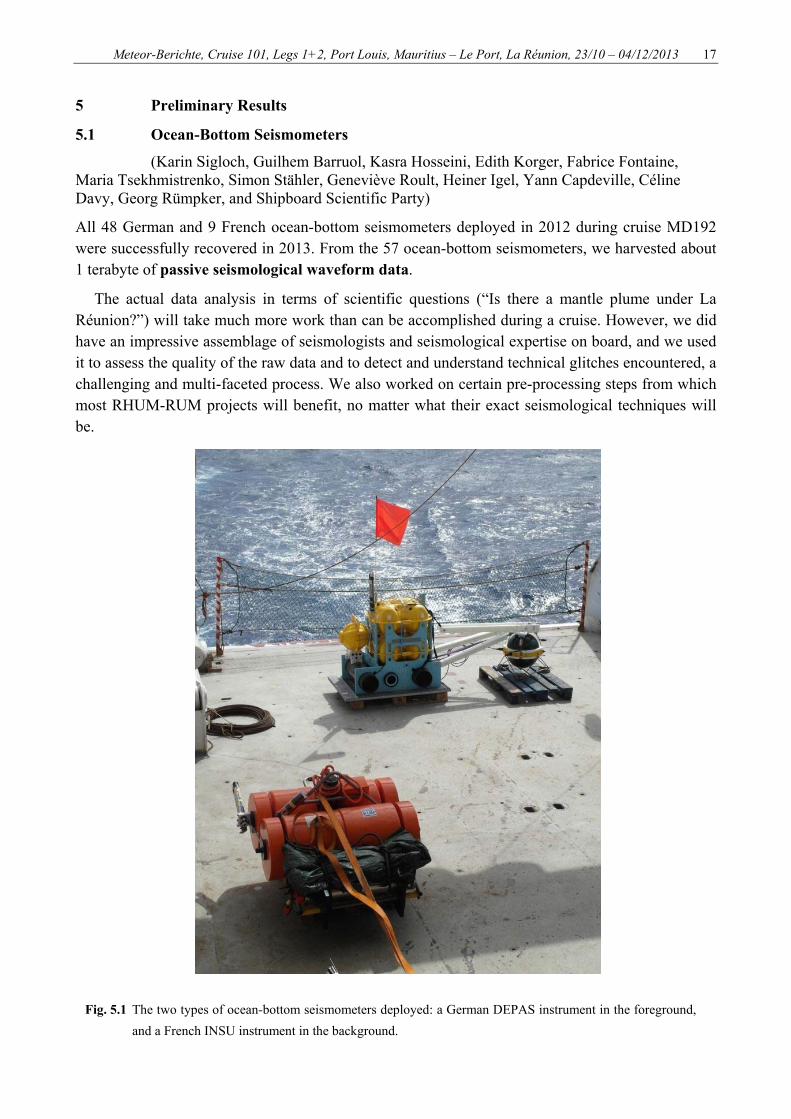
Fig. 5.1 The two types of ocean-bottom seismometers deployed: a German DEPAS instrument in the foreground, and a French INSU instrument in the background.
Meteor-Berichte, Cruise 101, Legs 1+2, Port Louis, Mauritius – Le Port, La Réunion, 23/10 – 04/12/2013 18
The technical specifications of the German DEPAS ocean-bottom seismometers are given on the website of the DEPAs instrument pool at AWI Bremerhaven:
http://www.awi.de/en/research/research_divisions/geosciences/geophysics/depas_german_instrument_pool_for_amphibian_seismology/ http://www.awi.de/en/research/research_divisions/geosciences/geophysics/depas_german_instrument_pool_for_amphibian_seismology/technical_description/ The instruments have also been described in detail in earlier cruise reports, e.g., MSM20/1, MSM20/2, MSM24:
http://www.ifm.zmaw.de/de/ldf/reisen-des-fs-maria-s-merian/ http://www.dfg-ozean.de/de/berichte/fs_maria_s_merian/
The French INSU ocean-bottom seismometers are essentially the “Scripps model” hardware, i.e., the OBS developed at the Scripps Institution of Oceanography in La Jolla, California, but they are equipped with very broadband (240-sec) Nanometrics Trillium seismometers and with a modified data logger. For technical information see:
http://parc-obs.insu.cnrs.fr/spip.php?article130
Recovering OBS with the METEOR was a very positive experience. The acoustic link between the ship and the seismometers on the ocean floor (the crucial ingredient for sending successful release commands) was unusually clear for the vast majority of the track (the exception being RR41 to RR51 on the mountainous spreading ridges). The release commands were sent via the ship hydrophone, rather than the handheld hydrophones we had brought, which worked in all cases (100% recovery rate). An extraordinarily useful feature, and previously not known to us, was the goniometer on the bridge, a directional radio receiver. It was vastly more sensitive and effective for detecting and locating the weak radio signals emitted by the resurfaced OBS than the handheld devices we had brought for this purpose. This saved a considerable amount of ship time, because visual spotting of the OBS was easy once the goniometer started to beep and to signal the direction. In cases where we happened to see the OBS surface before our eyes, we could confirm that the goniometer had started to beep immediately. Hence this device enables the fastest possible detection result. From experience, visual searching or work with the weaker handheld devices can take significantly longer. Once spotted, the METEOR’s highly skilled officers and sailors recovered all 57 OBS safe and sound within 10 to 50 minutes. Given the large volume of digital data to handle (about 1 terabyte in total), we were also pleasantly surprised with the capacity and speed of the METEOR’s computer server.
The data analysis and pre-processing work was carried out by the substantial number of experienced seismologists on board, with participation of the Ph.D. and M.Sc. students. Specifically,
1) We wrote software to efficiently visualize and characterize the quality of the huge amounts of digital waveform recordings acquired.
2) We implemented and compared three different approaches to estimate the random horizontal rotation angle at which each OBS had dropped on the seafloor.
Meteor-Berichte, Cruise 101, Legs 1+2, Port Louis, Mauritius – Le Port, La Réunion, 23/10 – 04/12/2013 19
3) We attempted to correct for the instrument response functions. 4) We investigated a data-based method to correct for internal clock errors.
These four lines of work are described in the following subsections 5.1.1 to 5.1.4, which are quite technical discussions but may help future project leaders.
5.1.1 Quality control and problem diagnosis
(K. Hosseini, M. Tsekhmistrenko, K. Sigloch, G. Roult, R. Daniel, G. Barruol, E. Labahn, J. Velasquez, A. Mazzullo) German DEPAS instruments
The hard drive in every instrument had recorded on the order of 10 GB of raw binaries over 13 months of deployment, from three seismometer channels plus one hydrophone channel at a sampling rate of 50 Hz. (Sampling rate on the SWIR array RR41-RR48 was 100 Hz, recording duration 6-8 months.) Conversion from the SEND data logger’s proprietary format to standard Miniseed or SAC format doubled the initial data volume.
42 of our 48 DEPAS instruments were of the “standard” configuration, equipped with a wideband Guralp CMG-40T with a corner period of 60 sec. The remaining 6 OBS were also equipped with Guralp CMG-40T instruments, but the more broadband version with a corner period of 120 sec. Unfortunately none of these six 120-sec Guralp seismometers yielded useful data because they all remained mechanically stuck under seafloor conditions. Three of the 60-sec instruments suffered from the same problem and failed to yield data. The faulty instruments came from two specific manufacturing batches, judging by the similarity of their serial numbers. Another systematic issue, though far less consequential, is that many data loggers unexpectedly lost the synchronization of their internal clocks (see also Section 5.1.4), which implies a significantly higher effort in post-processing for some of the planned applications, especially seismic tomography.
For the seismometers that worked, data quality was good. Figure 5.2 shows a trace plot for one Pakistan earthquake (mb 7.7.) recorded on the vertical components of the DEPAS stations. The waveforms are consistent, P-, S-, and surface waves are clearly distinguishable.
With the focus of on-board manpower on data quality control, a variety of more minor technical problems and quirks was also identified, and interested parties are welcome to contact us for a more detailed report.
The hydrophones in the DEPAS instruments (HighTechInc HTI-04-PCA/ULF, with a corner period of 100 sec, upper cut-off frequency 8 kHz) generally functioned very reliably, with only few problems noted in the yield and the data quality.
French INSU instruments
These 9 INSU instruments (three OBS components plus hydrophone) sampled at a rate of 62.5 Hz, producing 25-30 GB of Miniseed waveform data per instrument. All 9 Trillium broadband seismometers worked well. Any problems noted with the waveform data seem to have been due to issues with the data loggers rather than the sensors themselves. Two data loggers appear to have lost

Meteor-Berichte, Cruise 101, Legs 1+2, Port Louis, Mauritius – Le Port, La Réunion, 23/10 – 04/12/2013 20
power temporarily and started overwriting their earlier data from the beginning of the hard drive as soon as they rebooted – in both cases this led to a loss of several months of data. In a third instrument, corrupted sectors on the hard disk led to loss of a small percentage of data, the gaps being randomly distributed over 13 months. A persistent problem with all 9 data loggers on the vertical seismometer channel is a regular, artificial spike occurring every 3620 seconds, the cause of which is still unclear. Altogether, the performance of these seismometers was very satisfactory.
The hydrophones of all 9 INSU instruments worked reliably, a (minor) problem was noted for only one of them.
Fig. 5.2 Data quality: broadband recordings across the RHUM-RUM network of a teleseismic earthquake of mb 7.7 in Pakistan (vertical component). Rendering by K. Hosseini.
5.1.2 Estimating and correction for the random rotation of horizontal components
The OBS land on the ocean upright, but in some random rotation, meaning the two horizontal components are not oriented along the geographical north and east directions as are land seismometers. For applications in which the horizontal components are to be used, the angular shift of each OBS relative to the north-east coordinate system hence needs to be estimated. Different groups of colleagues on-board tried three different methods that had previously been suggested in the literature for this task:
a) by considering the polarization of long-period surface waves: Rayleigh versus Love, minimize energy on transverse component (K. Hosseini, M. Tsekhmistrenko). This method was applied for orienting OBS deployed around New Zealand during the MOANA experiment (Stachnick et al., 2012, Zietlow et al., 2014).
b) by considering the polarization of short-period P-waves: theoretically zero signal in the transverse direction. Two different flavors of this method were tried (F. Fontaine, H. Igel). This method was described by Fontaine et al. (2009).
Meteor-Berichte, Cruise 101, Legs 1+2, Port Louis, Mauritius – Le Port, La Réunion, 23/10 – 04/12/2013 21
c) by forward-modeling long-period seismograms and fitting to recorded data (Y. Capdeville).
In each case, the signal sources were teleseismic earthquakes. The results were encouraging in that, for a subset of stations that were recovered early in the cruise, and for a few large earthquakes considered, the four different approaches yielded estimates that agreed to within 3° to 13°, depending on OBS. In other words, this estimation looks feasible, but still needs to be scaled and optimized. There was the feeling that it may be preferable to use only a few strong events rather than trying to use as many as possible.
5.1.3 Correction for instrument response functions (K. Hosseini, G. Roult) The feedback seismometers record voltage, which for some applications must be converted to physical ground displacement, using the instrument response calibration curve provided by the manufacturer. For the DEPAS instruments, this had apparently not been attempted before. Formally, this is simply a question of filtering with the EVALRESP software (for full RESP files or for pole-zero only), or with other filtering software if only pole-zero information is given (such as for our OBS). In practice however, this is a fickle issue for several reasons: varying formats for the required filter coefficients, and “data-ageing”, i.e., different versions of the EVALRESP software giving different outputs on the same RESP file (on a useful but lengthy side track, while trying to cross-validate different software packages, a problem was discovered for the RESP metadata information for the permanent international land station RER on La Réunion). We did not finish this task on the ship, but the path toward finishing did become clear.
5.1.4 Estimating and correcting errors in the internal clocks of the OBS (S. Stähler) Each digital data logger runs autonomously during its year on the seafloor. Its internal oscillators are not arbitrarily precise, so that upon recovery and comparison of the internal clock with GPS time, it typically shows that the internal clock ran 1-3 second too slow over the year. (Interestingly, we encountered only very few clocks that ran too fast.) One then has a choice to assume that the delay was accumulated evenly over the whole year, or else attempt to estimate the episode(s) when the delay was incurred. In a second, worse scenario, the internal clock cannot be synchronized with GPS upon recovery because it shut down prematurely. We encountered this situation unexpectedly often, for reasons that are not entirely clear. In this case, no estimate of clock skew is available in the first place.
Hence a method was investigated for estimating the skew (as a function of experiment time elapsed) based on the symmetry of Green’s functions obtained from cross-correlation of microseismic noise. The cross-correlation method had previously been applied successfully to smaller OBS networks of <100 km interstation distance (Hannemann et al. 2013, Zha et al. 2013)) and clocks drifts from a terrestrial volcano monitoring network had thus been estimated (Sens-Schönfelder 2008). However, no clear Green’s functions emerged from our on-board processing, although ideas were gathered for potential remedies. More computer power will clearly be needed, but this problem is likely to remain the most challenging correction operation of the ones discussed. Currently, the alternative route is considered of running the instrument clocks again over a few weeks or months in the lab in order to measure their drift, and to use this information for correction of the field recordings.
Meteor-Berichte, Cruise 101, Legs 1+2, Port Louis, Mauritius – Le Port, La Réunion, 23/10 – 04/12/2013 22
5.2 Underway Bathymetry and Magnetics
(Dass Bissessur, Christine Deplus, Jérôme Dyment, Carmen Gaina, Elisabeth Muller, Guilhem Barruol, Karin Sigloch, and Shipboard Scientific Party)
5.2.1 System Overview and Data Processing
The METEOR’s two hull-mounted multibeam echosounder systems, the Kongsberg EM122 (for deep water) and the Kongsberg EM710 (for shallow water) acquired data essentially during the entire cruise of 15,000 km length (Figure 3.1), at typical transit speeds of 9-12 knots. The beam opening angle was set to 60°, which typically yielded a swath width of 3-5 times seafloor depth. We used the highest possible ping repetition rate (“double frequency pinging”), and the maximum number of beams (143). The vast majority of our route led across deep-sea waters, so that the Kongsberg EM710, which is most suitable for water depths shallower than 700 m, was rarely used, but notably in some of the five dedicated profile studies of seamounts and plateaus discussed below. For technical details on the EM122 and EM710 systems, we refer to the specs and manuals on the manufacturer website:
http://www.km.kongsberg.com/ks/web/nokbg0240.nsf/AllWeb/01FB0F22974EA50FC125715E002B2143?OpenDocument
http://www.km.kongsberg.com/ks/web/nokbg0240.nsf/AllWeb/993132242751F5EDC1256FA300360548?OpenDocument
Kongsberg’s operating software SIS (“Seafloor Information System”) was used for visualization and data assessment in real time, whereas renderings of longer stretches of data were usually plotted with the software packages MB and Fledermaus. Some of the raw bathymetry data were partially post-processed during the cruise.
Starting on 22-11, two days before the meeting with R/V SONNE and at the request of the SONNE’s chief scientist, we also began logging and saving the water column data acquired by the Kongsberg EM122, until the end of the cruise.
In order to calibrate the bathymetry, we regularly acquired sound velocity profiles of the water column, usually down to 2000 m depth. The METEOR’s sound velocity profiler SVPlus was used for this purpose, lowered into the water by the starboard winch. Altogether, we acquired 10 sound velocity profiles during the cruise, for locations refer to the station lists of Section 7, entries denoted “SVP” in column “Gear”. These data were fed into the EM122 and EM710 multibeam systems in order to calibrate the conversion from acoustic two-way travel times to absolute water depth.
Scalar magnetic data were acquired using a SeaSpy magnetometer by the manufacturer Marine Magnetics, provided by IPG Paris/Jérôme Dyment. For instrument specs, see the company website http://www.marinemagnetics.com/products/seaspy). The magnetometer was towed 250 meters behind the ship on a cable that transmitted the magnetic data to the echo-sounding lab in real time. Magnetic data should be corrected for this distance, increased by the distance between the reference point and the rear of the ship. The magnetometer was recovered roughly 1-3 nautical miles before arriving at each OBS station, and redeployed immediately after leaving a station.
Data were acquired continuously during almost all transits, except in the first cruise days (prior to RR07, due to shallow and risky bathymetry); during the inner circle of ocean-bottom seismometers around La Réunion (RR05 to RR01, since older data existed); during 16-17 Nov
Meteor-Berichte, Cruise 101, Legs 1+2, Port Louis, Mauritius – Le Port, La Réunion, 23/10 – 04/12/2013 23
(instrument had to be checked after shark bites on its hull); and during the recovery of the SWIR OBS cluster (RR41-RR48, due to fast-paced OBS recovery operations).
5.2.2 Specific Profiles Acquired
As detailed above, multibeam bathymetry and scalar magnetic data were acquired almost continuously during transits, at typical transit speeds of 9-12 knots. Wherever we would have redoubled on last year’s track using the shortest path, but had the opportunity to acquire new data by slightly offsetting with respect to the 2012 track or other existing tracks, we chose to do so. Besides these underway measurements, we acquired 5 dedicated bathymetric and magnetic profiles at speeds of 8-10 knots:
1) La Pérouse seamount, located between RR18, RR19, and RR02.
2) Along the flanks of Mauritius island.
3) On Segment 8 of the Southwest Indian Ridge, covering our 60 km x 30 km large array of 8 OBS.
4) On the Central Indian Ridge, south of the Egeria Fracture Zone (between RR52 and RR53)
5) Along the Mauritius Fracture Zone, which borders the Mauritius-Réunion segment to the east, and on a possible extension of Rodrigues Ridge.
These targets are briefly discussed in the following. Each sub-section shows a track map of the M101 route, plotted on top of bathymetric data that existed before cruise M101, and a second map or perspective rendering showing the newly acquired bathymetry data. C. Deplus, J. Dyment, M. Cannat, and D. Sauter made available bathymetry data collected during various cruises led by them, data that had already been very helpful in 2012 for optimal siting of the OBS. Where no such detailed bathymetry was available, the track maps show satellite-derived predicted bathymetry (Smith and Sandwell 1997) in fainter color shades.
5.2.2.1 La Pérouse Seamount
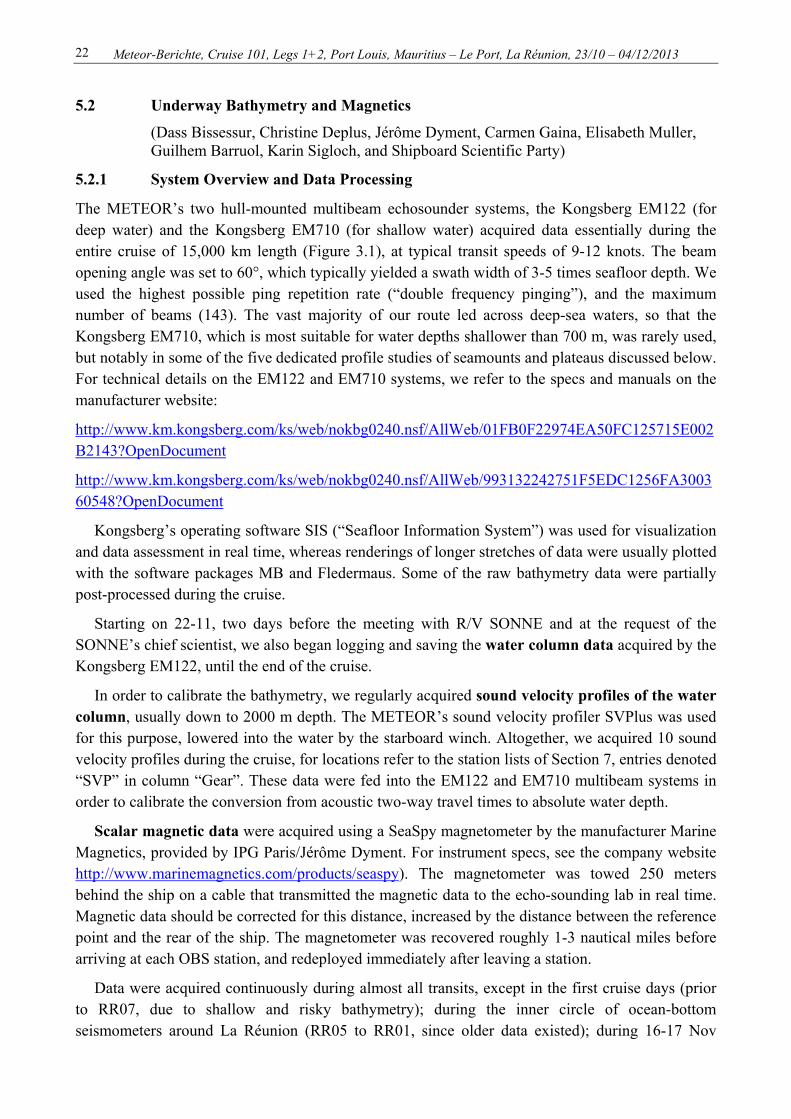
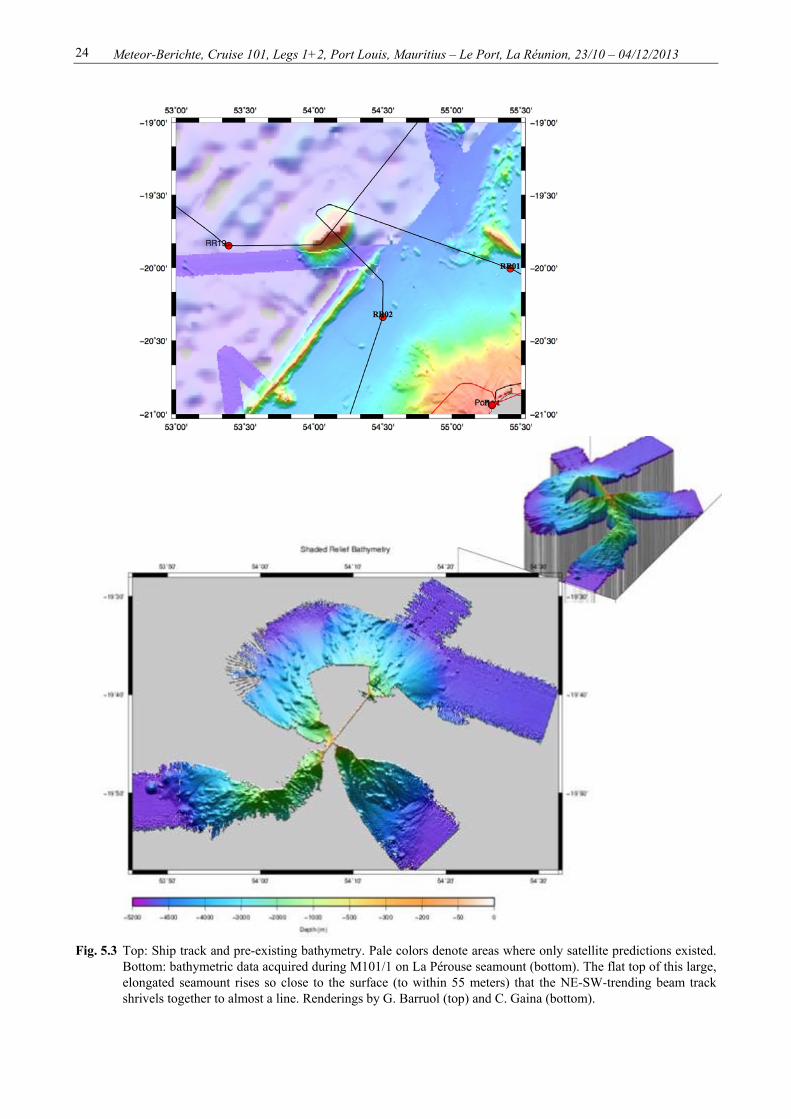
La Pérouse is a large seamount northwest of La Réunion, at around (19°50’S, 54°10’E). It is the largest seamount of the region, and located immediately adjacent to the very prominent, “swollen” fracture zone that marks the western border of the Réunion-Madagascar segment of the African (Somali) plate. The segment is presumably being uplifted by buoyant plume material underneath, and the genesis of La Pérouse could hence be related to plume magmatism. The seamount is prominently visible on satellite maps of predicted bathymetry, but to our knowledge had not been surveyed with a modern swath echo sounder prior to the RHUM-RUM cruises. In 2012, we had passed over part of its flank once. With METEOR cruise M101/1, we returned for two more passes this year, the results of which are plotted in figure 5.3. On 29-30 Oct 2013 (RR18 RR19), we took a NE-SW-trending profile, which revealed that La Pérouse is a guyot – a flat-topped seamount that rises to within 55 meters of the surface, and is probably rimmed and capped by drowned coral reefs. On 6 Nov 2013 (RR02 RR01), we returned for a profile perpendicular to the first, which imaged massive underwater landslides along the flanks of the seamount.
Meteor-Berichte, Cruise 101, Legs 1+2, Port Louis, Mauritius – Le Port, La Réunion, 23/10 – 04/12/2013 24
Fig. 5.3 Top: Ship track and pre-existing bathymetry. Pale colors denote areas where only satellite predictions existed. Bottom: bathymetric data acquired during M101/1 on La Pérouse seamount (bottom). The flat top of this large, elongated seamount rises so close to the surface (to within 55 meters) that the NE-SW-trending beam track shrivels together to almost a line. Renderings by G. Barruol (top) and C. Gaina (bottom).
Meteor-Berichte, Cruise 101, Legs 1+2, Port Louis, Mauritius – Le Port, La Réunion, 23/10 – 04/12/2013 25
5.2.2.2 Profiles along the flanks of Mauritius Island
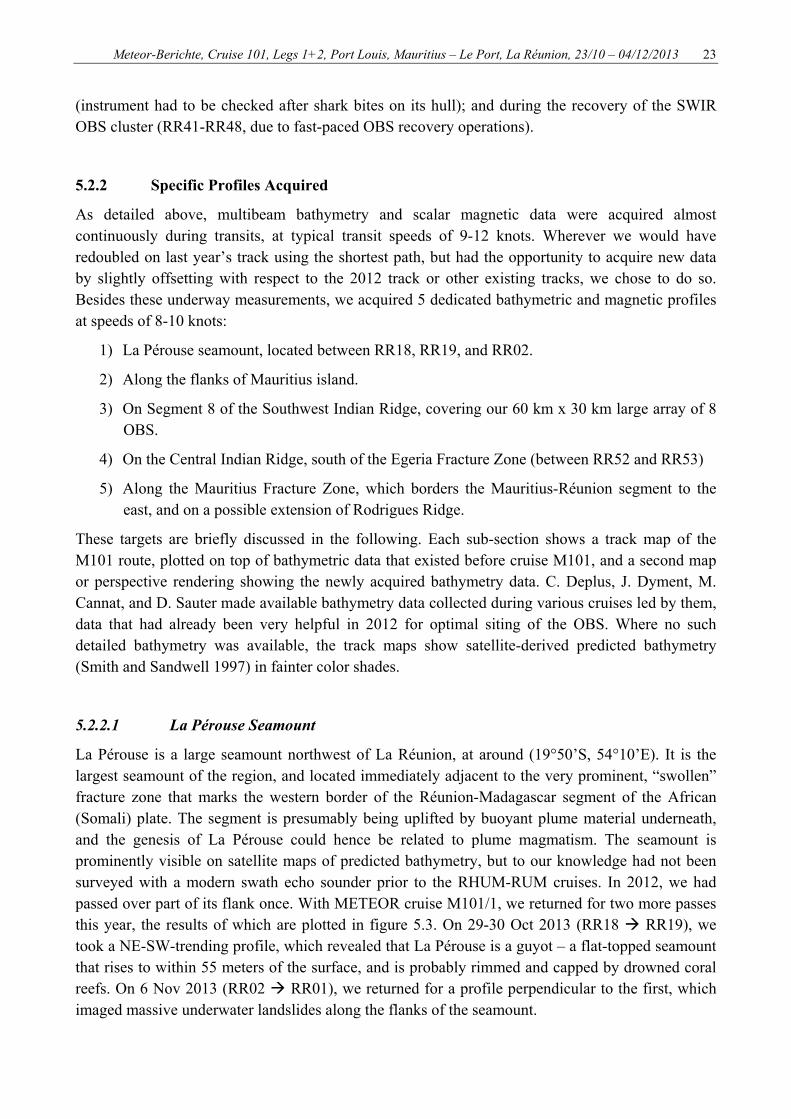
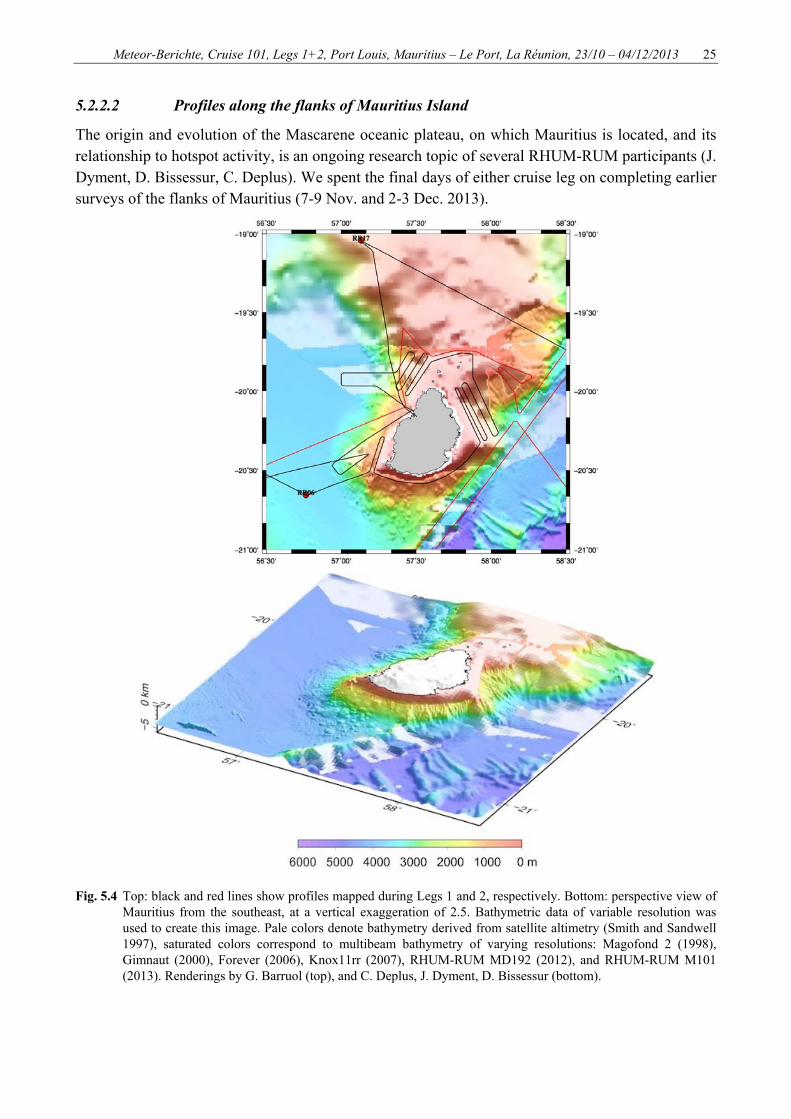
The origin and evolution of the Mascarene oceanic plateau, on which Mauritius is located, and its relationship to hotspot activity, is an ongoing research topic of several RHUM-RUM participants (J. Dyment, D. Bissessur, C. Deplus). We spent the final days of either cruise leg on completing earlier surveys of the flanks of Mauritius (7-9 Nov. and 2-3 Dec. 2013).
Fig. 5.4 Top: black and red lines show profiles mapped during Legs 1 and 2, respectively. Bottom: perspective view of Mauritius from the southeast, at a vertical exaggeration of 2.5. Bathymetric data of variable resolution was used to create this image. Pale colors denote bathymetry derived from satellite altimetry (Smith and Sandwell 1997), saturated colors correspond to multibeam bathymetry of varying resolutions: Magofond 2 (1998), Gimnaut (2000), Forever (2006), Knox11rr (2007), RHUM-RUM MD192 (2012), and RHUM-RUM M101 (2013). Renderings by G. Barruol (top), and C. Deplus, J. Dyment, D. Bissessur (bottom).
Meteor-Berichte, Cruise 101, Legs 1+2, Port Louis, Mauritius – Le Port, La Réunion, 23/10 – 04/12/2013 26
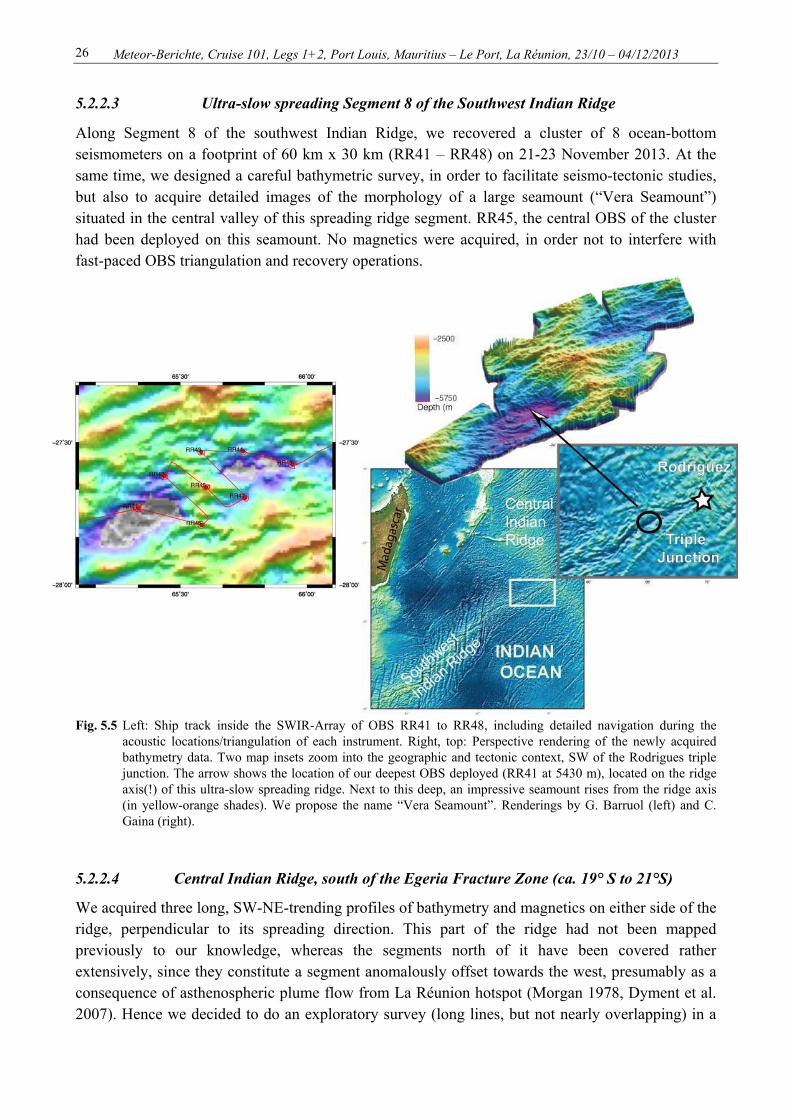
5.2.2.3 Ultra-slow spreading Segment 8 of the Southwest Indian Ridge
Along Segment 8 of the southwest Indian Ridge, we recovered a cluster of 8 ocean-bottom seismometers on a footprint of 60 km x 30 km (RR41 – RR48) on 21-23 November 2013. At the same time, we designed a careful bathymetric survey, in order to facilitate seismo-tectonic studies, but also to acquire detailed images of the morphology of a large seamount (“Vera Seamount”) situated in the central valley of this spreading ridge segment. RR45, the central OBS of the cluster had been deployed on this seamount. No magnetics were acquired, in order not to interfere with fast-paced OBS triangulation and recovery operations.
Fig. 5.5 Left: Ship track inside the SWIR-Array of OBS RR41 to RR48, including detailed navigation during the acoustic locations/triangulation of each instrument. Right, top: Perspective rendering of the newly acquired bathymetry data. Two map insets zoom into the geographic and tectonic context, SW of the Rodrigues triple junction. The arrow shows the location of our deepest OBS deployed (RR41 at 5430 m), located on the ridge axis(!) of this ultra-slow spreading ridge. Next to this deep, an impressive seamount rises from the ridge axis (in yellow-orange shades). We propose the name “Vera Seamount”. Renderings by G. Barruol (left) and C. Gaina (right).
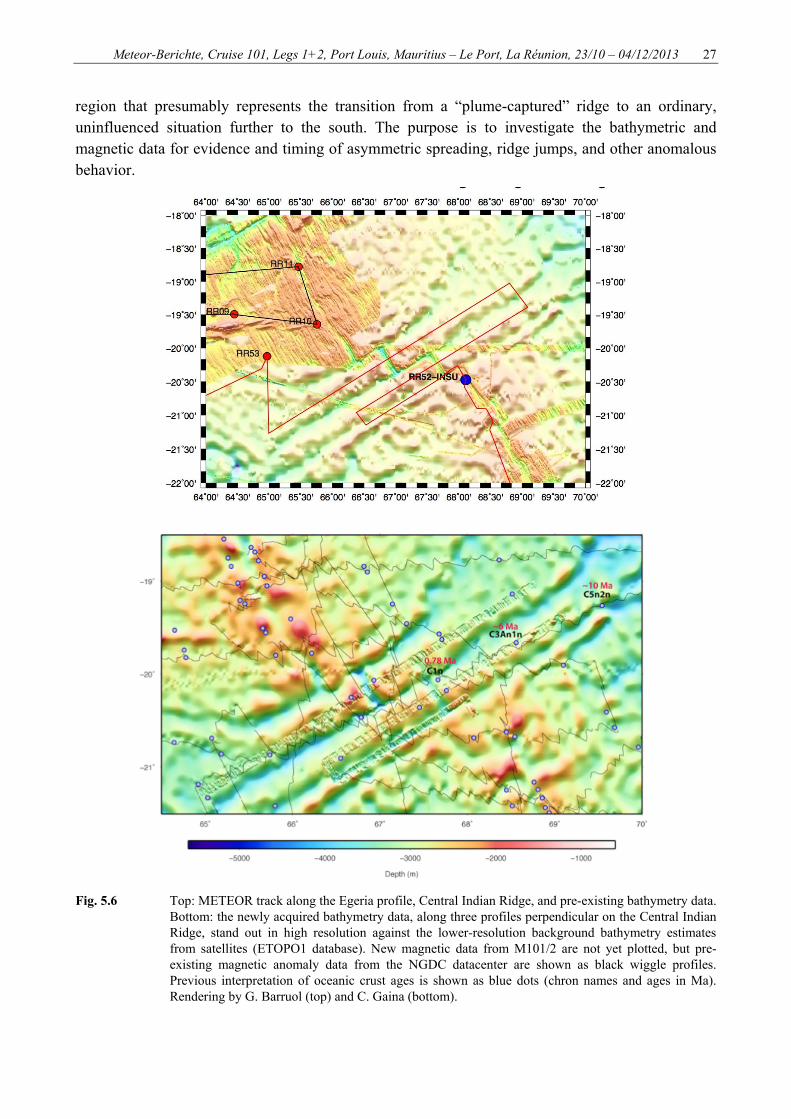
5.2.2.4 Central Indian Ridge, south of the Egeria Fracture Zone (ca. 19° S to 21°S)
We acquired three long, SW-NE-trending profiles of bathymetry and magnetics on either side of the ridge, perpendicular to its spreading direction. This part of the ridge had not been mapped previously to our knowledge, whereas the segments north of it have been covered rather extensively, since they constitute a segment anomalously offset towards the west, presumably as a consequence of asthenospheric plume flow from La Réunion hotspot (Morgan 1978, Dyment et al. 2007). Hence we decided to do an exploratory survey (long lines, but not nearly overlapping) in a
Meteor-Berichte, Cruise 101, Legs 1+2, Port Louis, Mauritius – Le Port, La Réunion, 23/10 – 04/12/2013 27
region that presumably represents the transition from a “plume-captured” ridge to an ordinary, uninfluenced situation further to the south. The purpose is to investigate the bathymetric and magnetic data for evidence and timing of asymmetric spreading, ridge jumps, and other anomalous behavior.
Fig. 5.6 Top: METEOR track along the Egeria profile, Central Indian Ridge, and pre-existing bathymetry data.
Bottom: the newly acquired bathymetry data, along three profiles perpendicular on the Central Indian Ridge, stand out in high resolution against the lower-resolution background bathymetry estimates from satellites (ETOPO1 database). New magnetic data from M101/2 are not yet plotted, but pre-existing magnetic anomaly data from the NGDC datacenter are shown as black wiggle profiles. Previous interpretation of oceanic crust ages is shown as blue dots (chron names and ages in Ma). Rendering by G. Barruol (top) and C. Gaina (bottom).
Meteor-Berichte, Cruise 101, Legs 1+2, Port Louis, Mauritius – Le Port, La Réunion, 23/10 – 04/12/2013 28
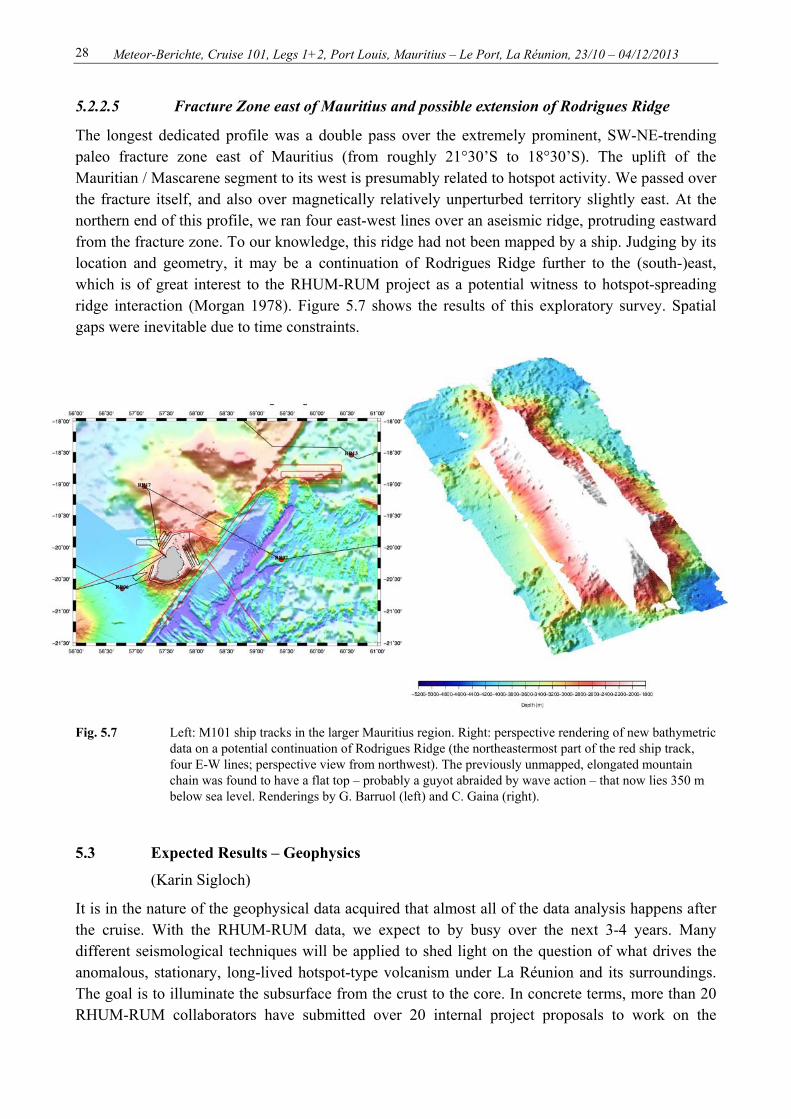
5.2.2.5 Fracture Zone east of Mauritius and possible extension of Rodrigues Ridge
The longest dedicated profile was a double pass over the extremely prominent, SW-NE-trending paleo fracture zone east of Mauritius (from roughly 21°30’S to 18°30’S). The uplift of the Mauritian / Mascarene segment to its west is presumably related to hotspot activity. We passed over the fracture itself, and also over magnetically relatively unperturbed territory slightly east. At the northern end of this profile, we ran four east-west lines over an aseismic ridge, protruding eastward from the fracture zone. To our knowledge, this ridge had not been mapped by a ship. Judging by its location and geometry, it may be a continuation of Rodrigues Ridge further to the (south-)east, which is of great interest to the RHUM-RUM project as a potential witness to hotspot-spreading ridge interaction (Morgan 1978). Figure 5.7 shows the results of this exploratory survey. Spatial gaps were inevitable due to time constraints.
Fig. 5.7 Left: M101 ship tracks in the larger Mauritius region. Right: perspective rendering of new bathymetric data on a potential continuation of Rodrigues Ridge (the northeastermost part of the red ship track, four E-W lines; perspective view from northwest). The previously unmapped, elongated mountain chain was found to have a flat top – probably a guyot abraided by wave action – that now lies 350 m below sea level. Renderings by G. Barruol (left) and C. Gaina (right).
5.3 Expected Results – Geophysics
(Karin Sigloch)
It is in the nature of the geophysical data acquired that almost all of the data analysis happens after the cruise. With the RHUM-RUM data, we expect to by busy over the next 3-4 years. Many different seismological techniques will be applied to shed light on the question of what drives the anomalous, stationary, long-lived hotspot-type volcanism under La Réunion and its surroundings. The goal is to illuminate the subsurface from the crust to the core. In concrete terms, more than 20 RHUM-RUM collaborators have submitted over 20 internal project proposals to work on the

Meteor-Berichte, Cruise 101, Legs 1+2, Port Louis, Mauritius – Le Port, La Réunion, 23/10 – 04/12/2013 29
seismological and marine geophysical data, and on accompanying geodynamic modeling studies. Funding proposals for Ph.D. students are in review with the DFG and with various French funding agencies, and M.Sc. thesis projects have been announced in several of our institutions. They aim at providing a comprehensive view of what the subsurface looks like in a place that is traded as one of the “hottest candidates” for harboring a deep, classical mantle plume.
5.4 Greenhouse gas measurements (guest project by MPI Jena, in collaboration with ZMT Bremen)
(Thomas Seifert, with text contributions by Tim Rixen, Bremen)
The Tall Tower Group at the Max Planck Institute for Biogeochemistry in Jena specializes in measurements of greenhouse gases in the atmosphere. On M101 we continued our continuous measurements of atmospheric mixing ratios of carbon dioxide, methane, and water vapor on the Meteor. The motivation for participating was to make a regionally representative comparison of marine boundary layer air to one of our coastal ground-based stations in Namibia, in order to have in situ measurements to compare to efforts in modeling the spatial distribution of methane and CO2. We also wanted to contribute to the SATRE group which was making trace gas measurements of GHGs in surface water over the course of several Meteor cruises. The atmospheric mixing ratio of a species is necessary for calculating its air-sea flux, and typically underway systems do not measure the atmosphere with such high frequency. In the Indian Ocean we are particularly interested in characterizing background CH4/CO2 ratios with what is measured at other coastal sites in southern Africa, due to the prevalence of polluted layers transported from South Asia over the Indian Ocean.
One of the main joint objectives of the BMBF funded project GENUS (Geochemistry and Ecology of the Namibian Upwelling System) and the initiative SATRE (South African TRace gas Experiment) is to study the influence of the Eastern South Atlantic (ESACW) and the Indian Ocean Central Water (ICW) on the greenhouse gases emissions from the Benguela Upwelling System (BUS). During the cruise M101 the sea water properties (temperature, salinity, oxygen concentrations and the pH) as well as greenhouse gas concentrations (CO2 and CH4) including their stabile isotopic composition (13CCO2 and 13CCH4) were measured in the water and the atmosphere in order to characterize the ICW and the overlying air masses east of Madagascar. During the cruises M100/2 and M102 we followed the water masses and studied its modification on its way into the Benguela Upwelling System.
During the cruise M101 we maintained a Picarro G1301 (CFADO-96) determining continuously the concentrations of CO2 and CH4 in the atmosphere. The ocean/atmosphere underway systems consisting out of SUNDANS (#001), a Picarro G2201-i (1510CFIDS2047_v1.0) and a Ferry Box were complemented by data measured by a thermosalinograph (TSG) and the DWD office on board RV Meteor. The TSG and DWD data were provided via the DSHIP system. Altogether we measured 16 parameters by using four different underway systems (Table 5.1).
Meteor-Berichte, Cruise 101, Legs 1+2, Port Louis, Mauritius – Le Port, La Réunion, 23/10 – 04/12/2013 30
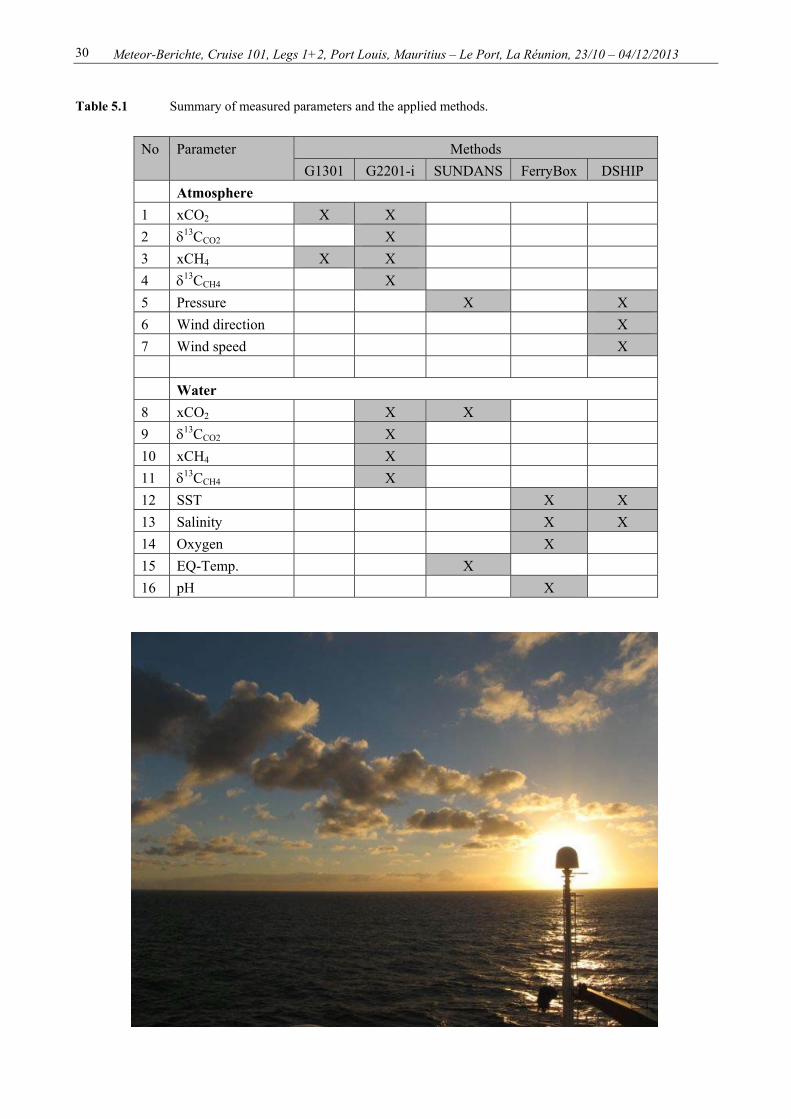
Table 5.1 Summary of measured parameters and the applied methods.
No Parameter Methods G1301 G2201-i SUNDANS FerryBox DSHIP
Atmosphere 1 xCO2 X X 2 13CCO2 X 3 xCH4 X X 4 13CCH4 X 5 Pressure X X 6 Wind direction X 7 Wind speed X Water 8 xCO2 X X 9 13CCO2 X 10 xCH4 X 11 13CCH4 X 12 SST X X 13 Salinity X X 14 Oxygen X 15 EQ-Temp. X 16 pH X

Meteor-Berichte, Cruise 101, Legs 1+2, Port Louis, Mauritius – Le Port, La Réunion, 23/10 – 04/12/2013 31
6 Ship’s Meteorological Station
(Hartmut Sonnabend, German Meteorological Service)
6.1 Weather conditions during Leg 1 (M101/1)
As scheduled RV Meteor left the harbour of Port Louis/Mauritius in the morning 23th of October 2013 heading north towards the first of 57 deployed broadband ocean bottom seismometers. The weather conditions were very fine and bright with sunshine and soon after having left the Island, the trade wind set in as a moderate breeze from east to southeast. These cooperative conditions continued through the following days before during 27th of October the wind started to increase gradually to force 5 – 6 Beaufort from southeast. At same time a southsouthwesterly swell of origin from the frontal zone in the south reached the working area with wave heights of 3 – 3.5 meters, producing some uncomfortable rolling of the ship during station work.
During that time the development of a tropical wave some hundred miles northeast of our working area got into the focus of interest. In the evening of 25th of October this system had been classified as a Tropical Disturbance and was upgraded to a Tropical Depression by the Tropical Cyclone Center Réunion (Meteo France) in the morning of 26th of October. With advisory from October 27th at 00 UTC the Joint Typhoon Center in Pearl Harbour the system was even classified as a Tropical Cyclone (1s; TC one), before having been downgraded to a Tropical Depression without any chance of further development due to unfavourable environmental conditions only 24 hours later by the same institute.
Fig. 6.1 OBS recovery in the fringes of the first tropical storm of the season.
Meteor-Berichte, Cruise 101, Legs 1+2, Port Louis, Mauritius – Le Port, La Réunion, 23/10 – 04/12/2013 32
The rapidly weakening remnants of this system were predicted to track along the latitude of 13°South westsouthwestward towards the northern parts of Madagascar. Nevertheless this constellation produced bad weather conditions for nearly 3 days. Located half way between a new strong high pressure cell moving eastnortheastward from the sea areas south of Madagascar towards the Central Southern Indian Ocean and the above mentioned tropical trough in the north, a sharp air pressure gradient formed above our cruise- and working area. In the morning of 28th of October the southeast wind increased to force 6-7 Bft. at first and to force 7 Bft. with gusts 8 during the following night, lasting until afternoon of 29.10. The sea state became rough to very rough with wave heights up to 4 meters as combination of windsea and swell. Shifting eastsoutheast to east the wind decreased only very slowly persisting for a long time at force 6 and gusts 7 through nearly whole 30.10. During both days the sky was overcast by low clouds and the shower activity was very frequent.
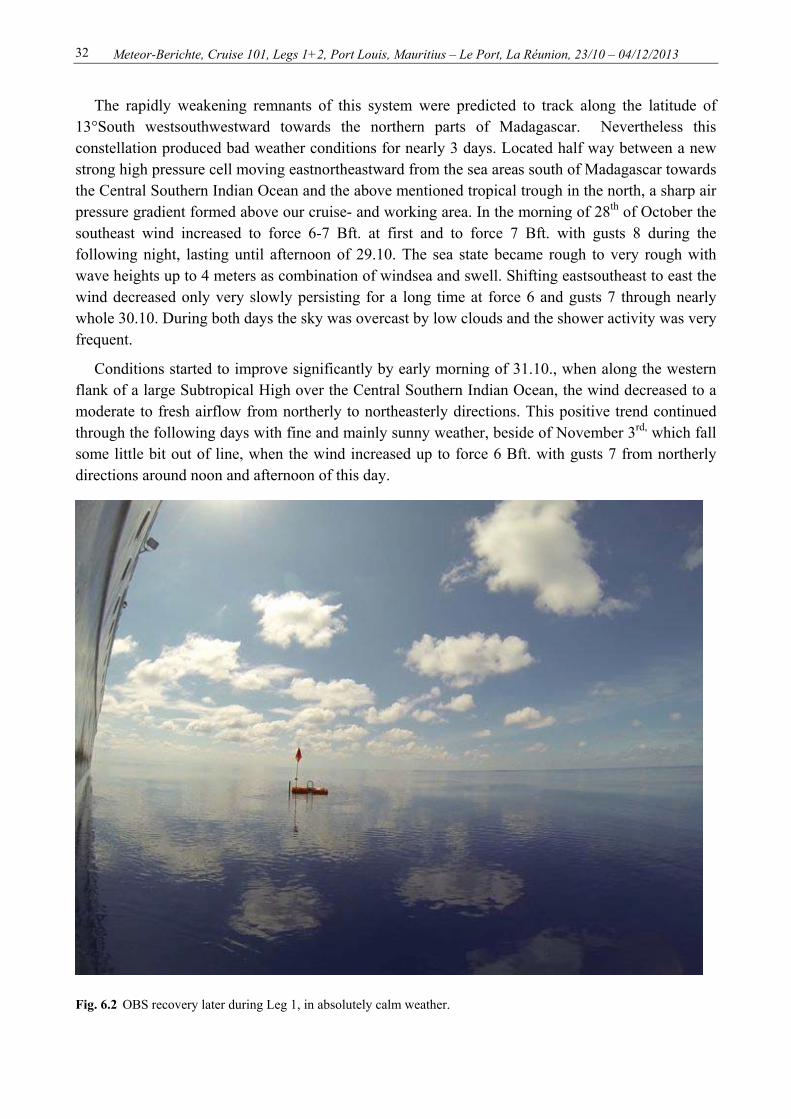
Conditions started to improve significantly by early morning of 31.10., when along the western flank of a large Subtropical High over the Central Southern Indian Ocean, the wind decreased to a moderate to fresh airflow from northerly to northeasterly directions. This positive trend continued through the following days with fine and mainly sunny weather, beside of November 3rd, which fall some little bit out of line, when the wind increased up to force 6 Bft. with gusts 7 from northerly directions around noon and afternoon of this day.
Fig. 6.2 OBS recovery later during Leg 1, in absolutely calm weather.

Meteor-Berichte, Cruise 101, Legs 1+2, Port Louis, Mauritius – Le Port, La Réunion, 23/10 – 04/12/2013 33
This short intermezzo was followed soon by a 3 days lasting event with a soft to gentle breeze and even a longer interval of nearly calm winds through 4th and 5th of November. Apart of a flat swell from the south the sea became smooth and glassy at times. The afternoon 7th of November brought a slight increase of the easterly airflow up to force 4-5 Bft., when RV Meteor started a geological profile around the island of Mauritius. But all in all the weather remained fine und mainly sunny. As scheduled RV Meteor took a short stop to bunker fuel at berth outside the harbour of Port Louis in the forenoon of 09.11., and set course towards the Island of La Réunion, directly after having finished this operation. This transit was dominated by moderate easterly to eastsoutheasterly winds and a moderate swell from southerly directions with heights up to 2.5 meters at times. In the morning of 10th of November RV Meteor entered the harbour of Le Port/La Réunion for a stop-over and the exchange of scientists and equipment.
6.2 Weather conditions during Leg 2 (M101/2)
The second half of the cruise started as scheduled in the morning of 12.11.2013 with the transit to the first station RR28. Being located in the middle of a weak high pressure ridge, the weather was fine and mainly sunny with a soft breeze and even temporarily calm. These comfortable conditions changed next day, when the cruise line of RV Meteor passed the compact cloud band belonging to the cold front of a gale centre near Kerguelen Islands. This cloud band produced partially heavy rainfall during noon and evening. Already in the morning and forenoon of this day a southsouthwesterly swell, having been induced in the western flank of the gale centre in the south, reached the cruise line and working area with wave heights around 3 meters. Additionally a strong high pressure cell, wandering eastsoutheastward some hundred miles south of our working area, produced a sharp pressure gradient opposite to a flat trough over the strait of Mozambique and the southwest of Madagascar. Subsequently the wind breezed up to force 5-6 Bft. from easterly to eastsoutheasterly directions during the night to 14.11. The combination of southsouthwesterly swell, which continued passing the working area with waves heights around 3 meters and the shearing windsea caused some rolling of the ship during station work. During afternoon and evening of 14.11., the wind added to Bft. 6-7 and in addition to the only very slowly flattening swell came a rough wind sea of around 2 meters at times. Shifting eastnortheast and northeast later on, strong winds persisted with only little decrease until evening of the following day.
After a short period of moderate weather conditions the cold front of a gale centre, approaching the Kerguelen Islands, crossed the cruise line of RV Meteor in the early afternoon of 17.11. During its passage the wind breezed up to force 6 Bft. with gusts reaching gale force 8 while shifting from westnorthwest to southeast rapidly, followed by a significant drop of temperature from 21°Celsius immediately before passage to an intermediate value of 16°Celsius behind the front within only a few minutes. Strong southeasterly winds started to decrease soon during first part of the night and favoured by a new high pressure cell, wandering across the working areas during 17.11.,the wind merged into a light breeze to nearly calm. However, another area of swell from southsouthwest with wave heights of 2.5 – 3 meters acted as a disruptive factor again. Being surrounded by an aging air mass of subpolar origin and consistent to the southern most stations, the lowest temperature over the entire cruise was recorded with a minimum value of 13.5° Celsius.
Meteor-Berichte, Cruise 101, Legs 1+2, Port Louis, Mauritius – Le Port, La Réunion, 23/10 – 04/12/2013 34
After the passage of the high pressure cell and in front of a flat trough approaching from the west, the wind shifted to northerly directions and increased to force 5 Bft. during 18th of November, whilst temperatures started to rise quickly until evening of this day. The next days brought only little change in basic synoptic constellation – high pressure in the east and a flat trough west and southwest of Meteor’s working area – and so a mainly moderate to fresh northerly to northwesterly airflow persisted during this time.
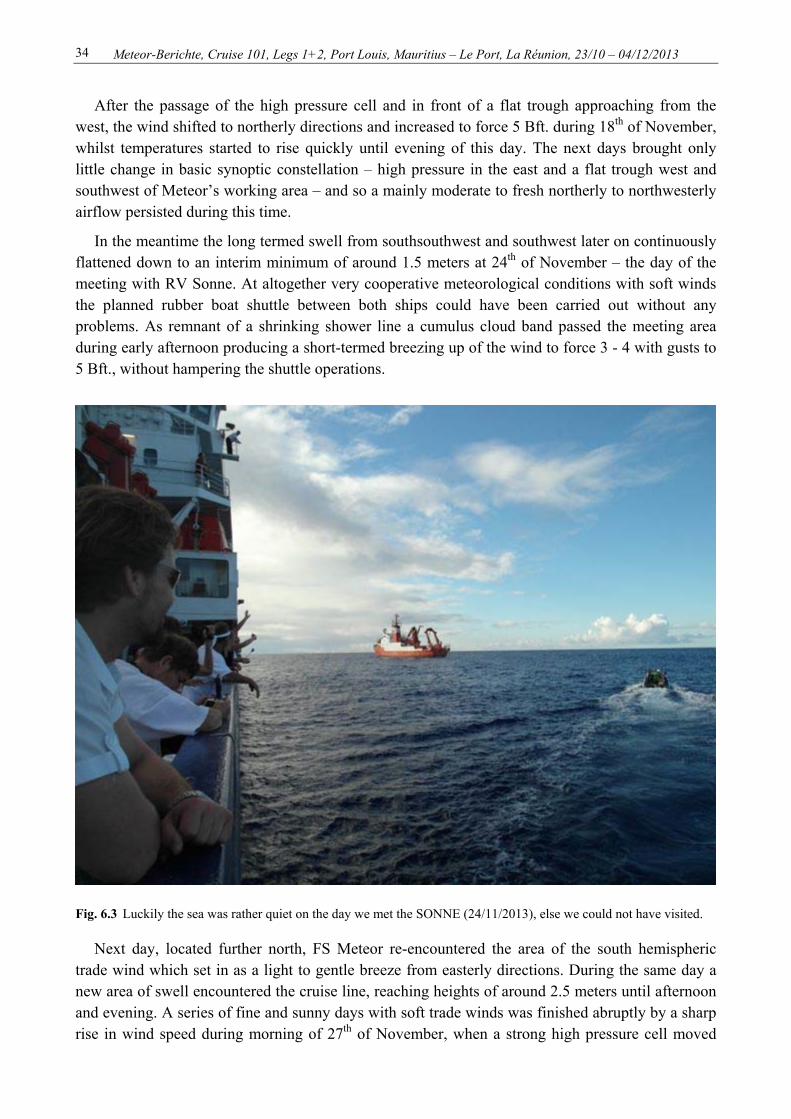
In the meantime the long termed swell from southsouthwest and southwest later on continuously flattened down to an interim minimum of around 1.5 meters at 24th of November – the day of the meeting with RV Sonne. At altogether very cooperative meteorological conditions with soft winds the planned rubber boat shuttle between both ships could have been carried out without any problems. As remnant of a shrinking shower line a cumulus cloud band passed the meeting area during early afternoon producing a short-termed breezing up of the wind to force 3 - 4 with gusts to 5 Bft., without hampering the shuttle operations.
Fig. 6.3 Luckily the sea was rather quiet on the day we met the SONNE (24/11/2013), else we could not have visited.
Next day, located further north, FS Meteor re-encountered the area of the south hemispheric trade wind which set in as a light to gentle breeze from easterly directions. During the same day a new area of swell encountered the cruise line, reaching heights of around 2.5 meters until afternoon and evening. A series of fine and sunny days with soft trade winds was finished abruptly by a sharp rise in wind speed during morning of 27th of November, when a strong high pressure cell moved
Meteor-Berichte, Cruise 101, Legs 1+2, Port Louis, Mauritius – Le Port, La Réunion, 23/10 – 04/12/2013 35
eastnorthward some hundred miles south of our cruise line, forming a strong pressure gradient towards the equatorial trough in the north. Favoured by this constellation the trade wind accelerated quickly to force 6 Bft. and gusts around 7 Bft. from southeast to eastsoutheast and east later on. A rough wind sea with heights of 1.5 – 2 m formed soon, joining with the still existing southsouthwesterly swell to a combined wave height around 3 meters. These rough conditions merged soon into a moderate to fresh air flow one day later and into a gentle breeze during 29th of November, the day of the recovery of the last OBS. The remaining time was used for an additional bathymetric profile east and northeast of Mauritius. The weather conditions continued to be mainly fine with a moderate and occasionally fresh breeze from easterly directions and a few rainshowers in a warm airflow. Through the final part of this profile until its last waypoint the wind blew as a soft to gentle breeze. After having completed this mission successfully early morning 3rd of December, RV Meteor set course to the berth of Port Louis/Mauritius for another bunker operation. During the following transit to Réunion the ship ssed the cold front of a trough south of the Mascarene Islands, which produced rain, showers, locally associated with thunderstorms and temporarily gusty winds from southeasterly directions. In the morning of 4th of December RV Meteor entered the harbour of Le Port/La Reunion.
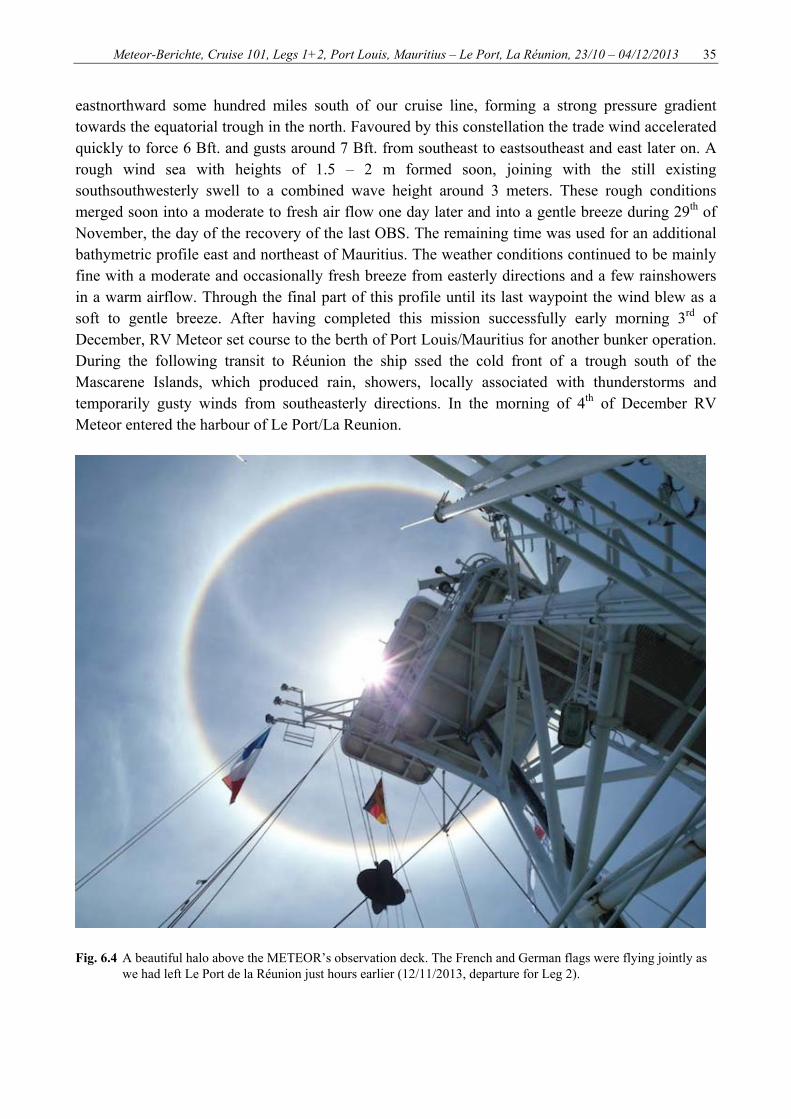
Fig. 6.4 A beautiful halo above the METEOR’s observation deck. The French and German flags were flying jointly as
we had left Le Port de la Réunion just hours earlier (12/11/2013, departure for Leg 2).

Meteor-Berichte, Cruise 101, Legs 1+2, Port Louis, Mauritius – Le Port, La Réunion, 23/10 – 04/12/2013 36
7 Station Lists
7.1 Station List M101/1
Date Time Latitude Longitude Water Depth Gear
METEOR RHUM-RUM [UTC] [°S] [°E] [m] M101-1/1990-1 RR 17 23.10.2013 12:02 19° 04.52' S 057° 10.18' E 2205 OBS+SVP M101-1/1993-1 RR 07 24.10.2013 4:09 20° 10.37' S 059° 21.39' E 4370 OBS M101-1/1996-1 RR 08 24.10.2013 17:04 19° 55.33' S 061° 16.67' E 4190 OBS M101-1/1999-1 RR 09 25.10.2013 13:00 19° 29.25' S 064° 26.23' E 2976 OBS M101-1/2002-1 RR 10 25.10.2013 22:04 19° 38.40' S 065° 44.74' E 2310 OBS M101-1/2005-1 RR 11 26.10.2013 4:25 18° 46.26' S 065° 27.18' E 3941 OBS M101-1/2009-1 RR 12 26.10.2013 16:15 18° 55.26' S 063° 38.60' E 3185 OBS+SVP M101-1/2012-1 RR 14 27.10.2013 2:59 17° 50.34' S 062° 31.52' E 3420 OBS M101-1/2015-1 RR 13 27.10.2013 16:12 18° 32.26' S 060° 33.49' E 4130 OBS M101-1/2018-1 RR 15 28.10.2013 7:50 17° 44.03' S 058° 19.54' E 3959 OBS M101-1/2021-1 RR 16 28.10.2013 20:00 16° 53.83' S 056° 32.24' E 4426 OBS M101-1/2025-1 RR 18 29.10.2013 13:54 18° 44.83' S 054° 52.96' E 4743 OBS+SVP M101-1/2028-1 RR 19 30.10.2013 3:11 19° 50.83' S 053° 22.63' E 4901 OBS M101-1/2031-1 RR 20 30.10.2013 17:18 18° 28.75' S 051° 26.97' E 4820 OBS M101-1/2034-1 RR 21 31.10.2013 7:42 20° 25.47' S 050° 33.12' E 4782 OBS M101-1/2037-1 RR 23 31.10.2013 20:04 22° 19.74' S 050° 26.33' E 4893 OBS M101-1/2040-1 RR 22 01.11.2013 11:28 21° 18.52' S 052° 29.77' E 4920 OBS M101-1/2043-1 RR26 02.11.2013 5:01 23° 13.90' S 054° 27.74' E 4259 OBS M101-1/2046-1 RR24 03.11.2013 2:12 25° 40.92' S 054° 29.07' E 5074 OBS M101-1/2049-1 RR57 03.11.2013 23:14 24° 44.00' S 058° 03.26' E 5200 OBS M101-1/2052-1 RR25 04.11.2013 12:10 23° 16.20' S 056° 43.97' E 4759 OBS M101-1/2055-1 RR05 05.11.2013 23:28 21° 40.24' S 056° 39.97' E 4092 OBS M101-1/2059-1 RR04 05.11.2013 9:00 22° 14.91' S 055° 22.98' E 4168 OBS+SVP M101-1/2061-1 RR27 05.11.2013 16:07 21° 57.97' S 054° 17.52' E 4277 OBS M101-1/2063-1 RR03 05.11.2013 20:46 21° 22.42' S 054° 07.30' E 4340 OBS M101-1/2065-1 RR02 06.11.2013 4:11 20° 20.40' S 054° 29.71' E 4436 OBS M101-1/2068-1 RR 01 06.11.2013 20:26 20° 00.17' S 055° 24.95' E 4298 OBS M101-1/2071-1 RR 06 07.11.2013 6:46 20° 39.25' S 056° 45.41' E 4216 OBS+SVP
7.2 Station List M101/2
Date Time Latitude Longitude Water Depth Gear
METEOR RHUM-RUM [UTC] [°S] [°E] [m] M101-2/2076-1 RR28-INSU 12.11.2013 21:10 22° 43.27' S 053° 09.24' E 4540 OBS+SVP M101-2/2080-1 RR29- INSU 13.11.2013 16:06 24° 58.12' S 051° 44.80' E 4825 OBS M101-2/2083-1 RR30 14.11.2013 9:10 26° 29.03' S 049° 52.83' E 5140 OBS+SVP M101-2/2087-1 RR31-INSU 15.11.2013 3:39 28° 46.23' S 048° 08.17' E 2710 OBS M101-2/2090-1 RR32 15.11.2013 17:45 30° 17.72' S 049° 33.09' E 4670 OBS M101-2/2093-1 RR33 16.11.2013 2:44 31° 07.32' S 050° 41.25' E 4904 OBS M101-2/2096-1 RR34-INSU 16.11.2013 14:49 32° 04.41' S 052° 12.61' E 4260 OBS M101-2/2098-1 RR 35 17.11.2013 6:27 32° 58.20' S 054° 09.03' E 4214 OBS M101-2/2101-1 RR 36- INSU 17.11.2013 18:31 33° 41.84' S 055° 57.19' E 3560 OBS M101-2/2104-1 RR 37 18.11.2013 11:38 31° 42.55' S 057° 53.10' E 4036 OBS M101-2/2107-1 RR 38-INSU 19.11.2013 0:24 30° 34.13' S 059° 40.95' E 4540 OBS M101-2/2110-1 RR 39-GM 19.11.2013 15:35 29° 01.11' S 060° 58.34' E 4700 OBS M101-2/2113-1 RR 40 INSU 20.11.2013 6:29 28° 09.02' S 063° 18.24' E 4750 OBS+SVP M101-2/2117-1 RR 41 20.11.2013 19:40 27° 44.03' S 065° 19.79' E 5430 OBS M101-2/2119-1 RR 46 21.11.2013 2:12 27° 47.73' S 065° 35.80' E 3640 OBS M101-2/2121-1 RR 42 21.11.2013 7:30 27° 36.61' S 065° 25.55' E 4776 OBS M101-2/2123-1 RR45 21.11.2013 12:57 27° 39.97' S 065° 36.67' E 2822 OBS M101-2/2125-1 RR 47 21.11.2013 15:55 27° 41.37' S 065° 46.05' E 4582 OBS
Meteor-Berichte, Cruise 101, Legs 1+2, Port Louis, Mauritius – Le Port, La Réunion, 23/10 – 04/12/2013 37
M101-2/2127-1 RR 43 21.11.2013 20:05 27° 31.46' S 065° 34.23' E 4264 OBS M101-2/2129-1 RR 44 22.11.2013 0:18 27° 31.94' S 065° 45.64' E 4548 OBS M101-2/2131-1 RR 48 22.11.2013 4:31 27° 34.83' S 065° 57.57' E 4830 OBS M101-2/2134-1 RR 49 23.11.2013 0:27 26° 16.71' S 068° 31.94' E 4444 OBS M101-2/2137-1 RR50-INSU 23.11.2013 10:54 25° 31.63' S 070° 01.46' E 4100 OBS M101-2/2141-1 RR 51 24.11.2013 5:43 23° 00.05' S 069° 11.66' E 3463 OBS M101-2/2144-1 RR 52-INSU 25.11.2013 3:38 20° 28.43' S 068° 06.22' E 2880 OBS+SVP M101-2/2149-1 RR 53-GM 28.11.2013 0:51 20° 07.39' S 064° 57.65' E 2940 OBS M101-2/2152-1 RR 54 28.11.2013 11:30 20° 38.83' S 063° 29.84' E 2499 OBS M101-2/2155-1 RR 55 28.11.2013 23:38 21° 26.54' S 061° 29.68' E 4462 OBS M101-2/2158-1 RR56-GM 29.11.2013 10:40 21° 58.05' S 059° 35.51' E 4230 OBS M101-2/2161-1 -- 30/11/2013 2:10 20° 23.43' S 057° 59.82' E 5089 SVP only
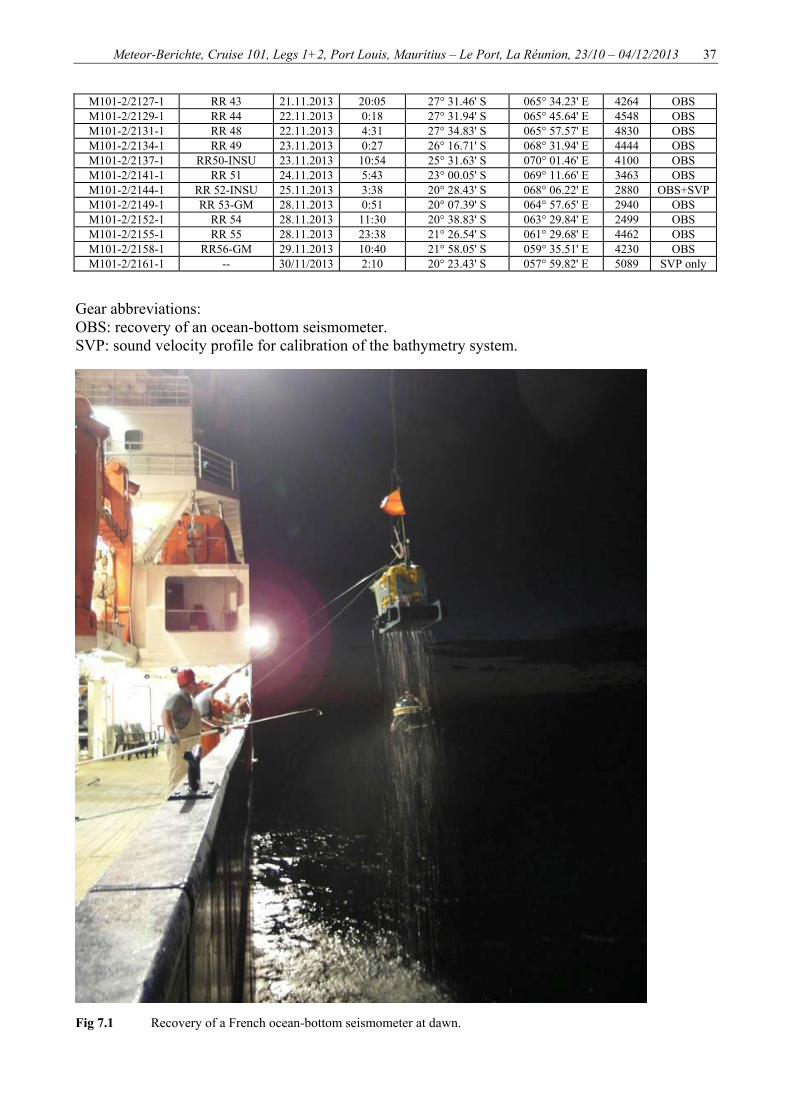
Gear abbreviations: OBS: recovery of an ocean-bottom seismometer. SVP: sound velocity profile for calibration of the bathymetry system. Fig 7.1 Recovery of a French ocean-bottom seismometer at dawn.
Meteor-Berichte, Cruise 101, Legs 1+2, Port Louis, Mauritius – Le Port, La Réunion, 23/10 – 04/12/2013 38
8 Data and Sample Storage and Availability
Seismological waveform data and metadata: Several copies of the German-French OBS data set left the ship on hard drives of various senior scientists, including a colleague from AWI Bremerhaven, where the DEPAS instrument pool is being managed. The official working copy of the seismological RHUM-RUM data and metadata will reside on the seismological data server RESIF in Grenoble (http://www.resif.fr/ ), and will be maintained and updated there. Access to the data will be managed via the RHUM-RUM Agreement on Data Usage. Until 2016, the data will be accessible only to approved RHUM-RUM collaborators via password-protected accounts on the Grenoble data server. In 2017, the data will enter into the public domain. By then, we aim to make all seismological land and ocean-bottom recordings easily and freely available via the European community data center ORFEUS in the Netherlands (http://www.orfeus-eu.org/ ).
Bathymetry and magnetic data: Until 2016, access to the bathymetric and magnetic data collected during M101 is managed via the RHUM-RUM Agreement on Data Usage, and needs to be agreed to by the two Principal Investigators of RHUM-RUM, Guilhem Barruol and Karin Sigloch. In 2017, these data will enter into the public domain and will be freely available, probably via the NGDC (www.ngdc.noaa.gov).
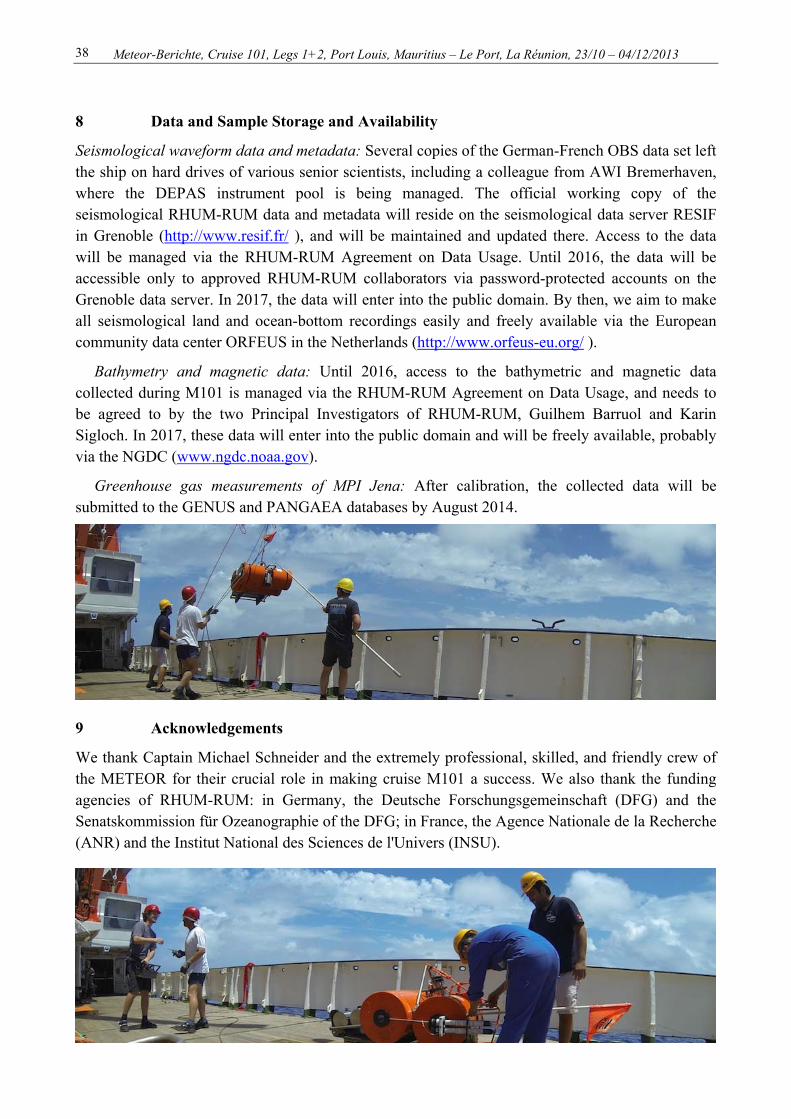
Greenhouse gas measurements of MPI Jena: After calibration, the collected data will be submitted to the GENUS and PANGAEA databases by August 2014.
9 Acknowledgements
We thank Captain Michael Schneider and the extremely professional, skilled, and friendly crew of the METEOR for their crucial role in making cruise M101 a success. We also thank the funding agencies of RHUM-RUM: in Germany, the Deutsche Forschungsgemeinschaft (DFG) and the Senatskommission für Ozeanographie of the DFG; in France, the Agence Nationale de la Recherche (ANR) and the Institut National des Sciences de l'Univers (INSU).
Meteor-Berichte, Cruise 101, Legs 1+2, Port Louis, Mauritius – Le Port, La Réunion, 23/10 – 04/12/2013 39
10 References
Barruol, G., & Sigloch, K., 2013. Investigating La Réunion Hot Spot From Crust to Core, Eos, Transactions American Geophysical Union 94(23), 205-207.
Dyment, J., Lin, J., Baker, E.T., 2007. Ridge-hotspot interactions: what mid-ocean ridges tell us about deep earth processes, Oceanography 12(1), 102-115.
Gordon A.L.,1981. South Atlantic thermocline ventilation. Deep Sea Research Part A. Oceanographic Research Papers 28, 1239-1264.
Gordon A.L., Lutjeharms J.R.E., Gründlingh M.L., 1987. Stratification and circulation at the Agulhas Retroflection. Deep Sea Research Part A. Oceanographic Research Papers 34: 565-599.
Hannemann, K., Krüger, F., Dahm, T., 2013. Measuring of clock drift rates and static time offsets of ocean bottom stations by means of ambient noise, Geophysical Journal International, 196(2), 1034–1042, doi:10.1093/gji/ggt434.
Morgan, W.J., 1972. Deep mantle convection plumes and plate motions. Am. Assoc. Pet. Geol. Bull, 56(2), 203-213.
Morgan, W.J., 1978. Rodriguez, Darwin, Amsterdam,..., a second type of hotspot island. Journal of Geophysical Research: Solid Earth (1978–2012), 83(B11), 5355-5360.
Sens-Schönfelder, C., 2008. Synchronizing seismic networks with ambient noise, Geophysical Journal International, 174(3), 966–970, doi:10.1111/j.1365-246X.2008.03842.x.
Smith, W.H.F, and D. T. Sandwell (1997) Global sea floor topography from satellite altimetry and ship depth soundings, Science 277.5334, 1956-1962.
Stachnik, J., A. F. Sheehan, D. W. Zietlow, Z. Yang, J. Collins, and A. Ferris (2012), Determination of New Zealand Ocean Bottom Seismometer Orientation via Rayleigh- Wave Orientation, Seismological Research Letters, 83, 704-713, doi:10.1785/ 0220110128.
Witze, A., 2013. Earth science: Under the volcano. Nature, 504(7479), 206.
Zha, Y., S. C. Webb, and W. Menke (2013), Determining the orientations of ocean bottom seismometers using ambient noise correlation, Geophysical Research Letters, 40(April), 1–6, doi:10.1002/grl.50698.
Zietlow, D. W., A. F. Sheehan, P. H. Molnar, M. K. Savage, G. Hirth, J. A. Collins, and B. H. Hager (2014), Upper Mantle Seismic Anisotropy at a Strike-Slip Boundary: South Island, New Zealand, J. Geophys. Res., In press, 2013JB010676, doi:10.1002/2013jb010676.