rhino conservation strategy · historical occurrence of africa’s rhinos species persisted in lost...
TRANSCRIPT

Rhino conservation strategy
Dr Mike Knight & Dr Richard Emslie

DEA, SANParks, Provincial conservation agencies, Namibia, Swaziland, Zimbabwe, Private land owners, WRSA, specialists, plans for Botswana, Malawi, Zambia & Tanzania
National conservation authorities, DEA, Private landowners
African rhino range state reps, RMG chair, TRAFFIC, specialists, RESG/Interpol, private land owners donors
CITES
Rhino & Elephant Security Group/ Interpol Environmental Crime Working Group
RESG

Roles of SADC RMG
• Advisory body (initially black rhinos) - now white rhinos • Biological management • Technical advice • Facilitates cooperation nationally & regionally = TRUST • Share rhino management experiences to lower level • Regional black rhino status reports – 23 years data! • Draft rhino management plans • Assists DEA in hunting applications reviews • Provides information to AfRSG • Engages with Rhino & Elephant Security Group
Extensive rhino experience &
understanding

Historical occurrence of Africa’s rhinos
Species Persisted in Lost from Reintroduced to
Black 5 (SA, Namibia, Zimbabwe, Kenya, Tanzania
20 4 (Malawi, Zambia, Swaziland, Botswana)
S’n White 1 (SA)
4 6 (Botswana, Zimbabwe, Swaziland, Mozambique, Zambia, Kenya)
SA played major role in the persistence and recovery of rhinos
Lost from ≈ 70% of range states

Africa’s black rhinos
2000
2500
3000
3500
4000
4500
5000
1991 1993 1995 1997 1999 2001 2003 2005 2007 2009
Year
Nu
mb
er
of
bla
ck
rh
ino
s
SA=39% SADC = 88%
(4,210)

Africa’s white rhinos
5000
7000
9000
11000
13000
15000
17000
19000
21000
1991 1993 1995 1997 1999 2001 2003 2005 2007 2009
Year
Nu
mb
er
of
wh
ite r
hin
os
SA=93% SADC= 98%
(19,770)
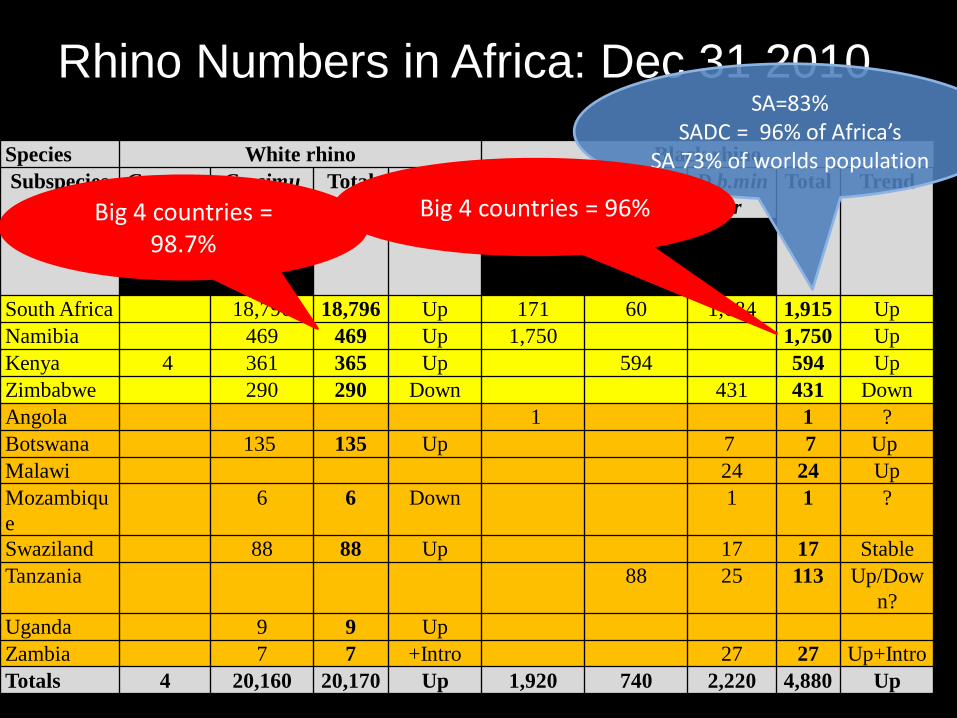
Species White rhino Black rhino
Subspecies C.s.cotto
ni
C.s.simu
m
Total Trend D.b.bicor
nis
D.b.micha
eli
D.b.min
or
Total Trend
(norther
n)
(southern
)
(south-
western)
(eastern) (souther
n-
central)
South Africa 18,796 18,796 Up 171 60 1,684 1,915 Up
Namibia 469 469 Up 1,750 1,750 Up
Kenya 4 361 365 Up 594 594 Up
Zimbabwe 290 290 Down 431 431 Down
Angola 1 1 ?
Botswana 135 135 Up 7 7 Up
Malawi 24 24 Up
Mozambiqu
e
6 6 Down 1 1 ?
Swaziland 88 88 Up 17 17 Stable
Tanzania 88 25 113 Up/Dow
n?
Uganda 9 9 Up
Zambia 7 7 +Intro 27 27 Up+Intro
Totals 4 20,160 20,170 Up 1,920 740 2,220 4,880 Up
Rhino Numbers in Africa: Dec 31 2010 SA=83%
SADC = 96% of Africa’s SA 73% of worlds population
Big 4 countries = 98.7%
Big 4 countries = 96%

SA rhino ownership
11424
4339
4977 SANParks
Provincialreserves
Private
23%
21% 56%
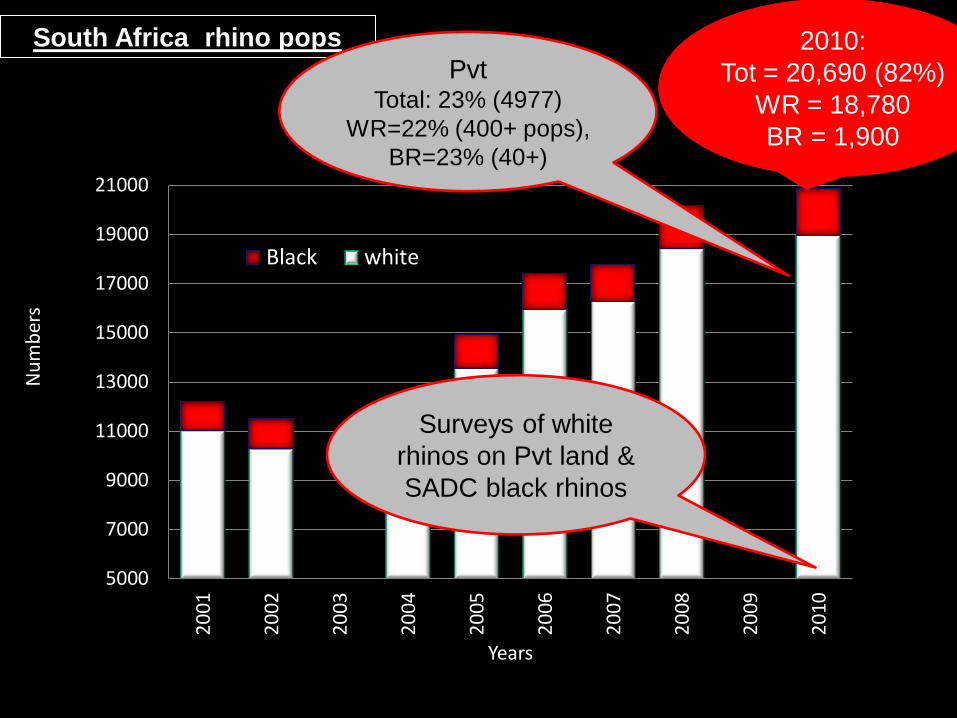
South Africa rhino pops
5000
7000
9000
11000
13000
15000
17000
19000
210002
001
20
02
20
03
20
04
20
05
20
06
20
07
20
08
20
09
20
10
Nu
mb
ers
Years
South African rhino population
Black white
2010:
Tot = 20,690 (82%)
WR = 18,780
BR = 1,900
Pvt Total: 23% (4977)
WR=22% (400+ pops),
BR=23% (40+)
Surveys of white
rhinos on Pvt land &
SADC black rhinos
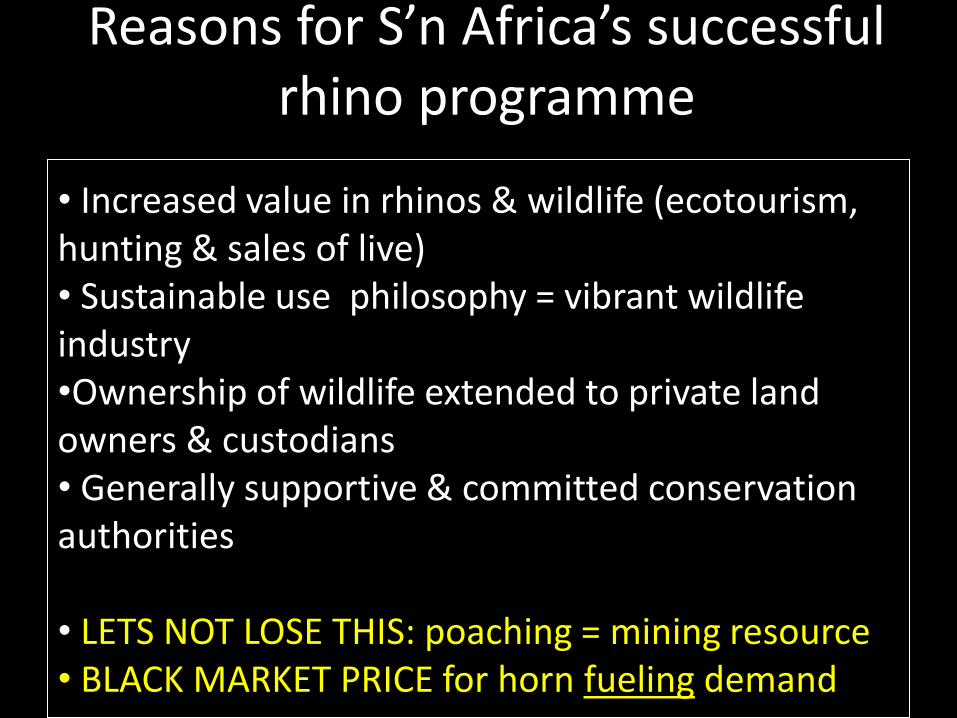
Reasons for S’n Africa’s successful rhino programme
• Increased value in rhinos & wildlife (ecotourism, hunting & sales of live) • Sustainable use philosophy = vibrant wildlife industry •Ownership of wildlife extended to private land owners & custodians • Generally supportive & committed conservation authorities
• LETS NOT LOSE THIS: poaching = mining resource • BLACK MARKET PRICE for horn fueling demand

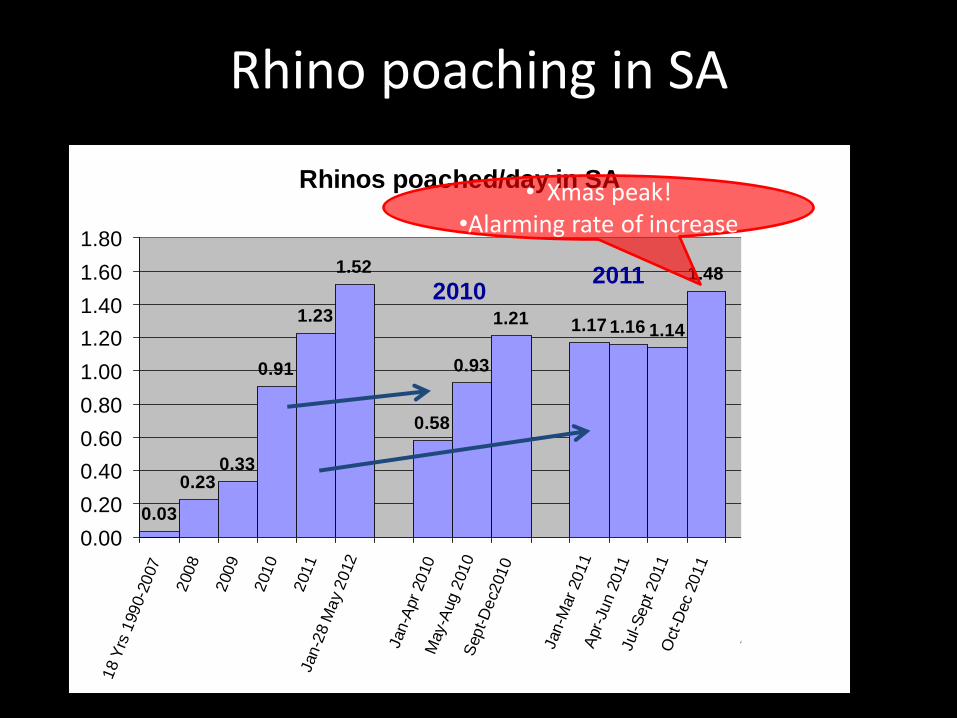
Rapid escalation then levelling off then increase again since Dec 2011
Rhinos poached/day in SA
0.03
0.230.33
0.91
1.23
1.52
0.58
0.93
1.21 1.17 1.16 1.14
1.48
1.69
1.28
0.00
0.20
0.40
0.60
0.80
1.00
1.20
1.40
1.60
1.80
18 Y
rs 1
990-2
007
2008
2009
2010
2011
Jan-2
8 M
ay
2012
Jan-A
pr
2010
May-A
ug 2
010
Sept-D
ec2
010
Jan-M
ar
2011
Apr-
Jun 2
011
Jul-S
ept 2011
Oct
-Dec 2
011
Jan-M
ar
2012
April-M
ay2
8 2
012
Rhino poaching in SA
2010
Rapid escalation then levelling off then increase again since Dec 2011
Rhinos poached/day in SA
0.03
0.230.33
0.91
1.23
1.52
0.58
0.93
1.21 1.17 1.16 1.14
1.48
1.69
1.28
0.00
0.20
0.40
0.60
0.80
1.00
1.20
1.40
1.60
1.80
18 Y
rs 1
990-2
007
2008
2009
2010
2011
Jan-2
8 M
ay
2012
Jan-A
pr
2010
May-A
ug 2
010
Sept-D
ec2
010
Jan-M
ar
2011
Apr-
Jun 2
011
Jul-S
ept 2011
Oct
-Dec 2
011
Jan-M
ar
2012
April-M
ay2
8 2
012
Rhino poaching in SA
2010 2011
• Xmas peak! •Alarming rate of increase

Rapid escalation then levelling off then increase again since Dec 2011
Rhinos poached/day in SA
0.03
0.230.33
0.91
1.23
1.52
0.58
0.93
1.21 1.17 1.16 1.14
1.48
1.69
1.28
0.00
0.20
0.40
0.60
0.80
1.00
1.20
1.40
1.60
1.80
18 Y
rs 1
990-2
007
2008
2009
2010
2011
Jan-2
8 M
ay
2012
Jan-A
pr
2010
May-A
ug 2
010
Sept-D
ec2
010
Jan-M
ar
2011
Apr-
Jun 2
011
Jul-S
ept 2011
Oct
-Dec 2
011
Jan-M
ar
2012
April-M
ay2
8 2
012
Rhino poaching in SA
2010 2011
2012

Despite poaching numbers still increasing
20700
Starting population beginning 2011
2011

Average annual growth
20700
1428
2011
growth 6.9%

Minus poaching
448 980
2011
Poaching
Balance ofgrowth
20700

Minus additional pseudo-hunting
448 90 890
2011
Poaching
Pseudohunting
Balance ofgrowth
20700

Rhino conservation objectives
• Reduction of number of rhinos being poached;
• Reduction of the black market prices of rhino horn;
• Reduction in the illegal demand for horn;
• Incentivize the private sector and communities to invest in rhino conservation through continued range expansion and numbers;
• Ensure rapid population growth rates through biological management & reduction in loss of genetic diversity;
• Enhanced law enforcement, especially stopping poachers BEFORE they kill rhinos.
• BUT NEEDS SUSTAINABLE FUNDING

Address objectives • NO SINGLE SILVER BULLET!!!!!! = COMPLEX ISSUE • NATIONAL level:
• Increase in situ protection – focused training & staffing. • Remove pseudo-hunting. • Central integrated & secure database (rhinos , horns etc.) & permitting process (hunts etc). • Intelligence use & cooperation = STOP poachers. • Improved investigative & prosecution skills. • Increasing deterrent with higher sentences. • Use technology (DNA profiling) • Improved detection at ports of entry/exit. • Improved management of horn stocks (declaration & database) • Cooperation by private rhino owners • Address national TOPS legislation pitfalls. • Greater inter Dept cooperation.

Address objectives (cont.) • INTERNATIONAL level:
• Intelligence sharing & cooperation. • Higher comparative sentences. • Institute stricter domestic measures for export of trophies & internal control in importing countries. • Address legislative short falls. Eg Kenya, Mozambique
• CROSS-CUTTING issues: • Incentivise private & community sectors (range & numbers) • Increase value of rhinos:
• Better regulated hunting industry. • Explore possible trade in rhino horn &/or rhinos (detailed cost-benefit analysis of different scenarios with other alternatives)