rga analysis and surface analysis of sst-1 graphite …
TRANSCRIPT

ARUNPRAKASH ARUMUGAM et al.
1
RGA ANALYSIS AND SURFACE ANALYSIS OF SST-1 GRAPHITE TILES IN HIGH TEMPERATURE VACUUM BAKING
ARUNPRAKASH ARUMUGAM, RAMESH GATTU, PURVI DAVE, A. ZALA, D.C. RAVAL, Z. KHAN Institute for Plasma Research Bhat, Gandhinagar, India Email: [email protected]
Abstract
Steady state Superconducting Tokamak (SST-1) is a large aspect ratio Tokamak with a major radius of 1.1 m and minor radius of 0.20 m. Plasma Facing Components (PFC) is one of the major sub-systems of SST-1 Tokamak. Plasma Facing Components of SST-1 consists of divertors, passive stabilizers, baffles and poloidal limiters. PFCs are designed and fabricated to be Ultra High Vacuum (UHV) compatible and high temperature compatible for steady state plasma operation. All PFCs are made up of graphite tiles mechanically attached to the copper alloy substrate. Graphite is chosen as a first wall armour material in SST-1 Tokamak because of its high thermal shock resistance and low atomic number of carbon. Graphite, because of its porous nature absorbs water vapour and other gasses from atmosphere. Generally graphite tiles are given a high temperature bake-out treatment prior to installation inside the tokamak to reduce the in-situ wall conditioning period. There are about 3800 numbers of graphite tiles of different sizes to be fitted on 132 numbers of PFC copper modules. All the 3800 graphite tiles were given a high temperature bake-out at 1000 oC to remove the entrapped gasses, under high vacuum in a vacuum furnace before installation into the SST-1 vacuum vessel. Residual Gas Analyser (RGA) was used to measure the outgassing at various temperatures during the entire vacuum baking process. RGA works on the principle of Quadrupole Mass Spectrometer. It is used to detect and analyse the residual gases during vacuum pumping and high temperature baking of graphite tiles. Surface analysis of graphite tiles have been carried out using Scanning Electron Microscope (SEM) before and after baking. Elemental mapping of the raw and baked graphite samples were also carried out. This paper will discuss about the residual gas analysis and surface analysis of SST-1 graphite tiles in high temperature vacuum baking process.
1. INTRODUCTION
Steady-state Superconducting Tokamak (SST-1) is a medium sized Tokamak which has been designed for a steady state plasma operation.[1] Plasma Facing Components (PFC) is one of the major sub-systems of SST-1 Tokamak. Plasma Facing Components of SST-1 consists of Inboard Divertor Plates (IDP), Outboard Divertor Plates (ODP), Inboard Passive Stabilizers (IPS), Outboard Passive Stabilizers (OPS), main Baffles (MBAF) and poloidal Limiters. Each IDP, ODP, IPS, MBAF and OPS has top and bottom modules mounted inside the SST-1 Vacuum Vessel (VV) as shown in the figure 1.[2] All PFCs except Limiters are structurally continuous in toroidal direction. Each Plasma Facing Component is made up of copper module on which the graphite tiles are fixed by bolting. SS cooling tubes are vacuum brazed on the back side of the copper modules as shown in figure 4. These SS tubes were used for baking or cooling of the PFC by passing hot nitrogen gas or chilled water through them. There are a total of 132 PFC copper modules installed inside the vacuum vessel of SST-1 Tokamak.
FIG. 1. PFC inside SST-1 FIG. 2. Baffle 3d model FIG. 3. Baffle with tiles FIG. 4. Baffle backside

FIP/P3-16
2. GRAPHITE AS ARMOUR MATERIAL IN SST-1 PFC
Carbon based materials, namely; Graphite and Carbon-Carbon Composites are the preferred armour materials in present day tokamaks. High thermal shock resistance and low atomic number of carbon are the most important properties of graphite for its application as an armour material in tokamaks. High density graphite of grade FP479 is chosen as plasma facing armour material in SST-1 Tokamak. Selection of graphite is based on criteria involving different thermo-physical properties. Some of the important requirements are: ash content, thermal conductivity, open porosity, flexural Strength etc.[3] The properties of graphite material used in SST-1 tokamak is given in Table-1. There are about 3800 numbers of graphite tiles of different sizes to be fitted on 132 numbers of PFC copper modules. About 1,200 kg of graphite material will be used as plasma facing material in SST-1 tokamak in the form of shaped tiles.
TABLE 1. Thermo-physical properties of graphite material for SST-1 tokamak
Element 2 Density (g/cm3) Rockwell Hardness (HR5/40)
1.82 100
CTE (x E-6 /K) (T=20 oC to 1000 oC) Electrical Resistivity (µΩm) Porosity (%) Ash Content ( ppm) Thermal Conductivity (W/mK) Young’s Modulus (GPa) Compressive Strength (MPa) Flexural Strength (MPa)
5.2 12 9 20 95 10
105 45
3. BAKING OF GRAPHITE TILES IN VACUUM FURNACE
During plasma operations in tokamaks, the plasma facing armour materials may reach high temperature. The result is that volatile compounds or impurities are introduced into the tokamak plasma. An expensive Tokamak conditioning period extending over weeks of discharge cleaning and hundreds of high power shots may be required to obtain acceptably clean plasmas. Generally graphite tiles are given a high temperature bake-out treatment prior to installation inside the tokamak to reduce the conditioning period. Thermal desorption is a part of the conditioning process. Removal of water vapour from graphite can be accomplished by a bake-out at about 250 oC in vacuum. In order to remove all the absorbed gases it is necessary to bake the graphite at high temperature of about 1000°C in a vacuum furnace prior to installation inside the tokamak. High temperature outgassing experiments on all the 3800 graphite tiles has been carried out, in order to understand the outgassing behaviour of graphite at various temperatures. These studies have been performed in a vacuum furnace specially designed and commissioned for baking the graphite tiles. A high vacuum furnace specially designed for graphite tile baking is shown in figure 2.
FIG. 5. Schematic of vacuum furnace FIG. 6. High temperature vacuum furnace
It has a double walled chamber fabricated with SS-304. Inside the rectangular hot zone all materials including heating elements, insulation, etc. are made of graphite. Pumping system consists of a diffusion pump with pumping speed of 6000 liters/sec, which can evacuate the furnace chamber to 1x10⁻⁶
mbar. Roots and rotary pump combination was used for roughing and backing. Water-cooled chevron baffle and LN2 trap is provided above the diffusion pump, which provides effective condensation of vapour to prevent back streaming of vapour
ARUNPRAKASH ARUMUGAM et al.
3
into the chamber. All the valves like roughing valve, backing valve, high vacuum valve, holding valve and vent valve are electro-pneumatically operated and interlocked wherever necessary for fail-safe operation. Schematic of the vacuum furnace and its pumping system are shown in figure 2. Prior to actual baking of the graphite tiles, the oven itself should be baked to 1000 °C in high vacuum in order to avoid oven impurities depositing on the graphite tiles. Sample coupons were used to qualify the baking process. Graphite tiles are ultrasonically cleaned in alcohol to remove all the loose particles. It is then air dried to remove any entrapped alcohol. Cleaned tiles along with test coupons are kept inside the hot zone. Baking of 3800 graphite tiles is done in batch-wise. About 180 graphite tiles are loaded inside the hot zone in each batch. Figure 4. Shows the arrangement of graphite tiles inside the hot zone of Vacuum furnace.
FIG. 7. Graphite tiles inside vacuum furnace FIG. 8. PFC with tiles in SST-1 FIG. 9. PFC backside
After attaining a high vacuum <1x10⁻⁵ mbar baking is started as per pre-programmed temperature ramp rate and the outgassing species are analysed using a Residual Gas Analyzer (RGA). When the appropriate baking temperature 1000°C is reached the charge is soaked at this temperature for 8 hours. At the end of the heat soaking, temperature is allowed to cool down to room temperature naturally under vacuum. Thermal desorption of outgassing species has been observed throughout the entire baking procedure. When the furnace reaches the room temperature, the furnace is vented with pure Nitrogen gas. The baked tiles are removed and packed in vacuum packing machine. 4. RESIDUAL GAS ANALYSIS
Residual Gas Analyzer (RGA) has been used to study the qualitative and quantitative behaviour of the outgassing species. Observations of the residual gas composition during baking are summarized in this section. Quadrapole Mass Analysis (QMA) is a useful technique for monitoring out-gassed species in a vacuum system. QMA (Make: SRS; Model: RGA200) was employed in our outgassing studies. An RGA is a mass spectrometer consisting of a quadrupole probe. It works on the principle that a small fraction of the gas molecules are ionized and the resulting ions are separated, detected and measured according to their molecular masses.
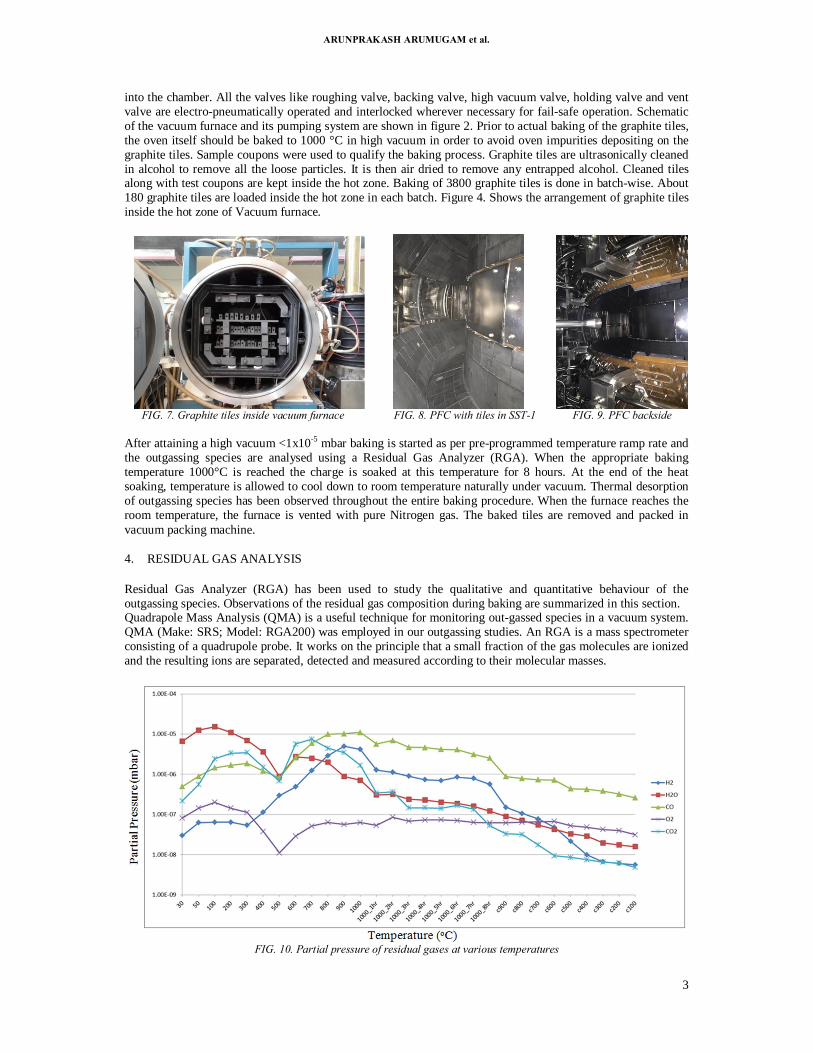
FIG. 10. Partial pressure of residual gases at various temperatures

FIP/P3-16
Transient behaviour of the residual gas during baking of graphite tile is observed. Figure 10 shows the plot of partial pressure verses baking temperature. Water vapour seems to be the dominant impurity at room temperature. The remaining outgassing species are N2, CO, CO2, O2 and H2. As the baking temperature rises, Water vapour starts rising up to 100 oC and it starts decreasing gradually at higher temperatures. Other gases such as N2, CO, CO2 rises as per the temperature up to 300 oC and starts decreases at higher temperatures. Above 500 oC it is found that CO and CO2 increases rapidly along with H2. This is due to the fact that water vapour breaks into Hydrogen and Oxygen and it starts reacting with the carbon to form CO and CO2 at higher temperatures. After reaching 1000 oC all the residual gases decreases gradually during the soaking period and then rapidly during cool down period. 5. SEM ANALYSIS
Morphological study of graphite tile samples before and after baking at 1000 °C has been carried out by High Resolution Scanning Electron Microscopy in VP Merlin HR-SEM system. Surface analysis has been carried out with VP Merlin HR-SEM system. Morphological changes on the graphite test coupons are summarized in this section. Cylindrical shaped graphite samples were prepared with 10mm diameter and 8mm height. This cylindrical shape was chosen, so that the graphite sample can be mounted on the holders for both SEM and XRD machines. The prepared sample was kept on the SEM sample holder. The sample holder was placed inside SEM system. SEM images have been taken for graphite test samples before and after baking at 1000o C.
Surface analysis of these test coupons was performed with SEM to qualify the vacuum outgassing procedure for graphite tiles. Surface characterization of graphite tiles is important to establish the initial condition as base line data for graphite tiles conditioning process.[4] Conditioning is a term applied to the physical and chemical changes that occur in the near surface region of graphite tiles as a result of high temperature vacuum bake-out procedure. The SEM images of raw and baked graphite samples are shown below. For comparison, an as-received sample of graphite is shown in figure 11. It is characterized by fairly uniform porosity. During the course of surface analysis, of the SEM images of baked samples, it is found that there are no cracks on the graphite samples, which shows that there is no damage caused on the graphite samples due to high temperature vacuum baking. It is also found that there is no change in the pores size and the pores are more clearly visible in the baked sample as shown in figure 12.
FIG. 11. SEM of unbaked graphite sample FIG. 12. SEM of baked graphite sample
6. EDS ANALYSIS
The Energy Dispersive Spectroscopy (EDS) analysis usually involves the generation of an X-ray spectrum from the entire scan area of the SEM. When an electron beam of the SEM interacts with the atoms of the specimen, X-rays are generated. Backscattered electron images in the SEM display compositional contrast. This compositional contrast results from elements with different atomic number and their distribution. EDS analysis allows one to identify what those particular elements are and their relative proportions in atomic % or in weight %. Below is the corresponding X-ray spectra that was generated from the entire scan area of the graphite specimen. Y-axis shows the counts or number of X-rays received and processed by the detector. X-axis shows the energy level of those counts.

ARUNPRAKASH ARUMUGAM et al.
5
FIG. 13. EDS analysis on graphite sample
EDS analysis was done on graphite sample before and after baking at high temperature. The elements of interest are mapped and its atomic % was tabulated for both unbaked and baked sample. Bar graph was plotted for the elements of higher concentration for both raw and baked sample.
TABLE 2. EDS elemental concentration for raw and baked sample
Element Unbaked sample (at. %)
Baked sample (at. %)
C 96.48 98.31 N O
0.78 2.73
0.63 1.03
EDS analysis shows that Oxygen and Nitrogen were the dominant impurities on graphite which is carbon. From the EDS elemental analysis it is evident that the raw sample has slightly higher atomic % of Nitrogen and Oxygen. For the baked sample the atomic % of Nitrogen and Oxygen is lesser than the raw sample. This shows that these impurities are removed in the process of high temperature vacuum baking.
Carbon (Raw) Carbon (Baked)

FIP/P3-16
Oxygen (Raw) Oxygen (Baked)
Nitrogen (Raw) Nitrogen (Baked)
FIG. 14. 2D elemental distributions from an area of the Raw (left) and baked (right) graphite sample. The lighter areas indicate higher elemental concentrations.
Figure 14 displays a 2D elemental distribution image of an area of the raw and baked graphite sample. The lighter areas indicate higher elemental concentration and the dark area indicates the lower concentration of the mapped elements. It is evident from the elemental mapping that the baked sample has less concentration of Oxygen and Nitrogen than the raw sample. This is due to the high temperature vacuum baking process which removes the impurities from the graphite samples. EDS analysis also shows that there is no presence of any metallic impurities on the graphite samples.
7. XRD ANALYSIS
XRD was conducted with D8 discover model of Bruker with Cu Kα radiation (λ=1.5406 A°) in Bragg-Brentano geometry. The 2θ range was 10-100 at 0.05 step/size increment and 0.5 sec/step time. Then the graphs were plotted with counts against 2Theta angle for both unbaked and baked graphite sample.

ARUNPRAKASH ARUMUGAM et al.
7
FIG. 15: XRD plot for unbaked graphite sample
FIG. 16: XRD plot for baked graphite sample
As per the ICDD card number 01-075-1621, the major peak revealed the graphite. From the XRD readings it is found that 100% relative intensity is obtained when the angle is around 26.19o and when the d value is around 3.399 Angstroms. It is observed that the d value remains the same for both the unbaked and baked graphite samples. This shows that there is no change in the interatomic spacing of the graphite due to high temperature conditioning process. XRD analysis also shows that there is no presence of metallic impurities on the graphite samples.
8. RESULTS AND DISCUSSION
The desorption spectrum of graphite tile baking shows water as a dominant gas load at lower temperature, since numerous types of nuclear grade graphite absorb atmospheric H2O rapidly during relatively short air exposures. Thermal desorption measurements shows that the peak desorption of H2O, occurs around 100 oC, while desorption of H2O is comparatively smaller at higher temperatures, which ensures that temperature of 250 oC are required for complete outgassing of water from graphite tiles in SST-1. There are several other peaks seen when water is present in vacuum chamber. This is due to the primary ions formed from water by electron bombardment are H2O+, OH+, O+
and H+ giving mass spectrum with peaks at m/e= 18,17,16 and 1.[5] CO and
CO2 are formed due to the reaction of carbon with Oxygen and water vapour. The decrease in CO2 with simultaneous increase in CO and O2 is found after 500
oC. This is due to the fact that CO2 gives CO and O2 at higher temperature. Continuous rise in H2 till 1000 oC is due the decrease in water vapour and at 1000 oC it

FIP/P3-16
reduces rapidly. No significant presence of O2 peaks reveals the absence of oxygen gas inside the chamber, ensuring that the chamber is free from leak. Surface analysis of unbaked and baked tiles is done using SEM, EDS and XRD to certify the baking process. SEM images of graphite samples are characterized by uniform porosity and absence of cracks. This qualifies the baked graphite tiles to be installed inside SST-1 tokamak. EDS analysis shows that the atomic % of Nitrogen and Oxygen for the baked sample is lesser than the unbaked sample. This shows that these impurities are removed in the process of high temperature vacuum baking and it matches with the RGA analysis results. XRD analysis shows that there is no change in the interatomic spacing of the graphite due to high temperature conditioning process. XRD analysis also shows that there is no presence of metallic impurities on the graphite samples which coincides with EDS analysis.
9. CONCLUSION
All the 3800 graphite tiles of SST-1 plasma facing components were vacuum baked successfully at 1000 oC in the high temperature vacuum furnace before its installation inside the SST-1 vacuum vessel. Surface characterization of baked tiles is also done using SEM, EDS and XRD techniques to certify the baking process. With the above surface analysis techniques the baked graphite tiles are examined at microscopic levels and the tiles are qualified for installation inside the SST-1 Tokamak. This work shows the advantages of pre-conditioning of new tiles. High temperature baking process shows extensive removal of water vapour and other residual gases that have been regarded as impurity sources in tokamaks. As a result of pre-conditioning process, the major plasma contaminants were significantly reduced. Minimization of outgassing will lead to shorter conditioning times and cleaner plasmas. Clearly, it could be cost effective to pre-condition new tiles prior to installation inside the tokamak without using weeks of machine time in in-situ baking of PFCs. Baked graphite tiles are assembled on the PFC copper modules. PFCs are then installed and integrated with SST-1 Tokamak and several plasma operation campaigns were carried out with the installed PFCs.
REFERENCES
[1] Y.C. SAXENA, SST-1 Team, “Present status of the SST-1 project”, Nucl. Fusion, 40, [2000] 1069. [2] Z. KHAN, Journal of Physics: Conf. Series 18234 (526071879) 0012060 [3] CHENNA REDDY. D, et.al. 2002 IVS Bulletin, Vol.5, No.4, pp. 19-29. [4] DYLLA H F, Ulrickson M A, LaMarche P H, Owens D K and Doyle B L, 1985 J.Vac.Sci.Technol. A 3 1105. [5] JAMES A. Basford, 1994 J.Vac.Sci.Technology. A12(4) 1778.