rg mvt t2-2016 an 10 aout 2016 vfinale
TRANSCRIPT

Second quarter – June 30, 2016 1
Desjardins Group (hereinafter also referred to as Desjardins) comprises the Desjardins caisse network in Quebec and Ontario (the caisses), theFédération des caisses Desjardins du Québec (the Federation) and its subsidiaries (including Capital Desjardins inc.), Caisse centrale Desjardins, theFédération des caisses populaires de l’Ontario Inc. and the Fonds de sécurité Desjardins.
Desjardins Grouprecords surplus earnings of $427 million
FINANCIAL HIGHLIGHTS
FINANCIAL RESULTS AND INDICATORS
For the three-month periods For the six-month periods
(in millions of dollars and as a percentage) ended ended
June 30, 2016 March 31, 2016(1) June 30, 2015(1) June 30, 2016 June 30, 2015(1)
Net interest income $ 1,053 $ 1,049 $ 1,057 $ 2,102 $ 2,052
Net premiums 1,740 1,721 1,698 3,461 3,574
Other operating income(2) 720 715 673 1,435 1,402
Operating income(2) 3,513 3,485 3,428 6,998 7,028
Investment income (loss)(2) 1,027 641 (413) 1,668 910
Total income 4,540 4,126 3,015 8,666 7,938
Provision for credit losses 75 91 103 166 192
Claims, benefits, annuities and changes in insurancecontract liabilities 2,065 1,758 332 3,823 2,835
Non-interest expense 1,865 1,787 1,781 3,652 3,529
Income taxes on surplus earnings 108 108 170 216 289
Surplus earnings before member dividends $ 427 $ 382 $ 629 $ 809 $ 1,093
Return on equity(2) 7.8% 7.1% 11.4% 7.4% 10.4%
Productivity index(2) 75.4 75.5 66.4 75.4 69.2
Provisioning rate(2) 0.19 0.23 0.27 0.21 0.25(1)
Prior-period data have been reclassified to reflect the current period's presentation.(2) See “Basis of presentation of financial information”.
BALANCE SHEET AND INDICATORS
(in millions of dollars and as a percentage) As at June 30, 2016 As at December 31, 2015
Balance sheet
Assets $ 260,711 $ 248,128
Net loans and acceptances 162,733 159,881
Deposits 163,662 156,574
Equity 22,017 21,725
Indicators
Assets under management and under administration $ 409,890 $ 403,350
Tier 1A capital ratio 15.9% 16.0%
Tier 1 capital ratio 15.9 16.0
Total capital ratio 16.6 17.2
Leverage ratio 7.5 7.8
Gross impaired loans/gross loans and acceptances(1) 0.35 0.34(1)
See "Basis of presentation of financial information".
Financial Report
Second quarter of 2016

DESJARDINS GROUP INTERIM FINANCIAL REPORT
Second quarter – June 30, 2016 2
MESSAGE FROM SENIOR MANAGEMENT
Lévis, August 12, 2016 — For the second quarter ended June 30, 2016, Desjardins Group, the leading financial cooperative group in Canada, recordedsurplus earnings before member dividends of $427 million, a reduction of $202 million, or 32.1%, compared to the corresponding quarter of 2015. Secondquarter 2015 surplus earnings were affected by an especially favourable claims experience, which had improved the loss ratio for P&C insurance to thehistorical low of 43.0%, whereas it was 67.4% in the second quarter of 2016. Other special items such as changes in actuarial assumptions related to lifeand health insurance operations and gains on the disposal of real estate investments had also enhanced surplus earnings in 2015.
This result reflects the contribution of $226 million, or 52.9% of surplus earnings, made by the Personal Services and Business and Institutional Servicessegment. The Wealth Management and Life and Health Insurance segment and the Property and Casualty Insurance segment contributed $124 millionand $49 million, respectively, representing 29.0% and 11.5% of surplus earnings. The operations grouped under the Other category made a contribution of$28 million, or 6.6% of surplus earnings.
“We’re satisfied with these results, particularly given that the results from the same period last year benefited from specific items and were much higherthan previous quarters,” said Guy Cormier, President and Chief Executive Officer. “With the new management team now in place, we’ve committed toensuring that Desjardins is always simple to do business with, people-focused, modern and high-performing for our members and clients. Lastly, I amthrilled to see that Desjardins is one of the 20 most influential brands in Canada, compelling evidence of our growth and rising profile across the country.”
Desjardins Group complies with Basel III rules and still has very good capitalization. As at June 30, 2016, Desjardins Group’s Tier 1A and total capitalratios were 15.9% and 16.6%, respectively, compared to 16.0% and 17.2%, respectively, as at December 31, 2015.
Guy Cormier Daniel Dupuis, CPA, CAChair of the Board, President and Chief Executive Officer Senior Vice-President, Finance, and Chief Financial OfficerDesjardins Group Desjardins Group
TABLE OF CONTENTS
1 Financial highlights 9 Review of financial results 38 Additional information
2 Message from senior management 9 Analysis of results 38 Controls and procedures
3 Management’s Discussion and Analysis 12 Results by business segment 38 Related party disclosures
3 Caution concerning forward-looking 19 Summary of interim results 38 Critical accounting policies and
statements 20 Balance sheet review estimates
4 Desjardins Group profile 20 Balance sheet management 38 Future accounting changes
4 Significant events in 2016 21 Capital management 39 Unaudited Condensed Interim
4 Basis of presentation of financial 25 Off-balance sheet arrangements Combined Financial Statements
information 26 Risk management
7 Changes in the regulatory environment 27 Risk management
8 Economic environment and outlook 37 Additional information related to
certain risk exposures

DESJARDINS GROUP INTERIM FINANCIAL REPORT
Second quarter – June 30, 2016 3
MANAGEMENT’S DISCUSSION AND ANALYSIS
The Management’s Discussion and Analysis (MD&A) dated August 12, 2016 presents the analysis of the results of and main changes to DesjardinsGroup’s balance sheet for the period ended June 30, 2016, in comparison to previous periods. Desjardins Group reports financial information incompliance with National Instrument 52-109 Certification of Disclosure in Issuers’ Annual and Interim Filings issued by the Canadian SecuritiesAdministrators (CSA). Desjardins Group is not a reporting issuer, on a combined basis, under this National Instrument. However, it has chosen to applythe practices provided in this National Instrument to demonstrate its willingness to comply with best practices in financial governance. Information onDesjardins Group’s controls and procedures is presented in the “Additional information” section of this MD&A.
This MD&A should be read in conjunction with the unaudited Condensed Interim Combined Financial Statements (the Interim Combined FinancialStatements), including the notes thereto, as at June 30, 2016, and the 2015 Desjardins Group Annual Report (the 2015 Annual Report), which containsthe MD&A and the audited Annual Combined Financial Statements (the Annual Combined Financial Statements).
Additional information about Desjardins Group is available on the website of the System for Electronic Document Analysis and Retrieval (SEDAR) atwww.sedar.com (under the Capital Desjardins inc. profile). The Annual Information Forms of Caisse centrale Desjardins (under theCaisse centrale Desjardins profile) and of the Federation (under the Fédération des caisses Desjardins du Québec profile) can also be found on SEDAR.Further information is also available on the Desjardins website at http://www.desjardins.com/ca/about-us/investor-relations. However, none of theinformation presented on these sites is incorporated by reference into this MD&A.
CAUTION CONCERNING FORWARD-LOOKING STATEMENTS
Desjardins Group’s public communications often include oral or written forward-looking statements. Such forward-looking statements are contained in thisMD&A and may be incorporated in other filings with Canadian regulators or in any other communications. Forward-looking statements in this MD&Ainclude, but are not limited to, comments about Desjardins Group’s objectives regarding financial performance, priorities, operations, the review ofeconomic conditions and markets, as well as the outlook for the Canadian, U.S., European and other international economies. These forward-lookingstatements include, among others, those appearing in the “Economic environment and outlook”, “Review of financial results”, “Balance sheet review” and“Additional information” sections of this MD&A. Such statements are typically identified by words or phrases such as “believe”, “expect”, “anticipate”,“intend”, “estimate”, "plan" and “may”, words and expressions of similar import, and future and conditional verbs.
By their very nature, such statements involve assumptions, uncertainties and inherent risks, both general and specific. It is therefore possible that, due tomany factors, these predictions, forecasts or other forward-looking statements as well as Desjardins Group’s objectives and priorities may not materializeor may prove to be inaccurate and that actual results differ materially. Desjardins Group cautions readers against placing undue reliance on these forward-looking statements since actual results, conditions, actions and future events could differ significantly from the targets, expectations, estimates or intents inthe forward-looking statements, either explicitly or implicitly.
A number of factors, many of which are beyond Desjardins Group’s control and the effects of which can be difficult to predict, could influence the accuracyof the forward-looking statements in this MD&A. These factors include those discussed in section 4.0, “Risk management”, of the 2015 Annual Report,such as credit, market, liquidity, operational, insurance, strategic and reputation risk. Additional factors include regulatory and legal environment risk,including legislative or regulatory developments in Quebec, Canada or globally, such as changes in fiscal and monetary policies, reporting guidance andliquidity regulatory guidance, or interpretations thereof, and amendments to and new interpretations of capital guidelines; and environmental risk, which isthe risk of financial, operational or reputational loss for Desjardins Group as a result of environmental impacts or issues, whether they are a result ofDesjardins Group’s credit or investment activities or its operations. Lastly, there is the risk related to pension plans, which is the risk of losses resultingfrom pension plan commitments made by Desjardins Group for the benefit of its employees arising primarily from interest rate, price, foreign exchange andlongevity risks.
Additional factors that may affect the accuracy of the forward-looking statements in this MD&A also include factors related to the economic and businessconditions in regions in which Desjardins Group operates; changes in the economic and financial environment in Quebec, Canada and globally, includingshort- and long-term interest rates, inflation, debt market fluctuations, foreign exchange rates, the volatility of capital markets, tighter liquidity conditions incertain markets, the strength of the economy and the volume of business conducted by Desjardins Group in a given region; monetary policies;competition; changes in standards, laws and regulations; the accuracy and completeness of information concerning clients and counterparties; theaccounting policies used by Desjardins Group; new products and services to maintain or increase Desjardins Group’s market share; the ability to recruitand retain key management personnel, including senior management; business infrastructure; geographic concentration; acquisitions and jointarrangements; social media and credit ratings.
Other factors that could influence the accuracy of the forward-looking statements in this MD&A include amendments to tax laws, unexpected changes inconsumer spending and saving habits, technological developments, the ability to implement Desjardins Group’s disaster recovery plan within a reasonabletime, the potential impact on operations of international conflicts or natural disasters, and Desjardins Group’s ability to anticipate and properly manage therisks associated with these factors, despite a disciplined risk management environment.
It is important to note that the above list of factors that could influence future results is not exhaustive. Other factors could have an adverse effect onDesjardins Group’s results. Additional information about these and other factors is found in section 4.0, “Risk management" of the 2015 Annual Report.Although Desjardins Group believes that the expectations expressed in these forward-looking statements are reasonable, it cannot guarantee that theseexpectations will prove to be correct. Desjardins Group cautions readers against placing undue reliance on forward-looking statements when makingdecisions. Readers who rely on these statements must carefully consider these risk factors and other uncertainties and potential events.
Any forward-looking statements contained in this MD&A represent the views of management only as at the date hereof, and are presented for the purposeof assisting readers in understanding and interpreting Desjardins Group’s balance sheet as at the dates indicated or its results for the periods then ended,as well as its strategic priorities and objectives. These statements may not be appropriate for other purposes. Desjardins Group does not undertake toupdate any oral or written forward-looking statements that could be made from time to time by or on behalf of Desjardins Group, except as required underapplicable securities legislation.

DESJARDINS GROUP INTERIM FINANCIAL REPORT
Second quarter – June 30, 2016 4
DESJARDINS GROUP PROFILE
Desjardins Group is the largest financial cooperative in Canada, with assets of $260.7 billion. The organization brings together 313 caisses in Quebec andOntario, the Fédération des caisses Desjardins du Québec and its subsidiaries (including Capital Desjardins inc.), Caisse centrale Desjardins, theFédération des caisses populaires de l’Ontario Inc. and the Fonds de sécurité Desjardins. A number of its subsidiaries and components are active acrossCanada. Desjardins Group’s Personal Services and Business and Institutional Services, Wealth Management and Life and Health Insurance, and Propertyand Casualty Insurance business segments offer a full range of financial services to members and clients, individuals and businesses alike, designed tomeet their needs. As one of the largest employers in the country, Desjardins Group capitalizes on the skills of more than 47,000 employees and thecommitment of more than 4,600 elected officers.
Caisse centrale Desjardins, also a cooperative financial institution that is an integral part of Desjardins Group, is the treasurer and official representative ofDesjardins Group with the Bank of Canada and the Canadian banking system.
SIGNIFICANT EVENTS IN 2016
Changes in senior management at Desjardins Group
On March 19, 2016, an electoral college comprised of Desjardins caisse officers from all regions of Quebec as well as from Ontario elected Guy Cormieras President and Chief Executive Officer of Desjardins Group for a first four-year term of office beginning on April 9, 2016. He succeeds MoniqueF. Leroux, who had held this position since March 29, 2008. In the second quarter of 2016, the Board of Directors approved the formation of a newManagement Committee. Denis Berthiaume was appointed Senior Executive Vice-President and Chief Operating Officer, Desjardins Group, with themandate of supervising Desjardins Group’s overall operations. Mr. Berthiaume will continue to act as Senior Vice-President Wealth Management and Lifeand Health Insurance in an interim capacity until his replacement is appointed. In addition, Réal Bellemare was appointed Senior Vice-President Finance,Treasury and Administration, Desjardins Group, and will succeed Daniel Dupuis as Chief Financial Officer as of August 13, 2016. Rounding out the newManagement Committee are Éric Lachaîne, Senior Vice-President Caisse Network and Member and Client Services; André Chatelain, SeniorVice-President Personal Services and Desjardins Group Marketing; Marie-Claude Boisvert, Senior Vice-President Business Services; Denis Dubois,Senior Vice-President Property and Casualty Insurance; Marie-Huguette Cormier, Senior Vice-President Human Resources and Communications;Francine Champoux, Senior Vice-President Risk Management; and Chadi Habib, Senior Vice-President Information Technology.
Status of the wildfire in Fort McMurray, Alberta
Like its peers in the insurance industry, Desjardins Group continues to assess the financial impact of this catastrophe. It estimates that damages, afterreinsurance, could amount to $41 million before taxes. Desjardins Group will continue to support its members and its clients through the measures it hasintroduced to guide them through the entire claims process and help them deal with this difficult situation.
Sale of Western Financial Insurance Company
On May 17, 2016, Desjardins Group announced the sale of its pet insurance subsidiary, Western Financial Insurance Company, to Economical Insurance.The transaction should close in the third quarter of 2016, subject to the usual closing formalities, including obtaining the necessary regulatory approvals.
BASIS OF PRESENTATION OF FINANCIAL INFORMATION
The Annual and Interim Combined Financial Statements have been prepared by Desjardins Group’s management in accordance with the InternationalFinancial Reporting Standards (IFRS) issued by the International Accounting Standards Board (IASB) and the accounting requirements of the Autorité desmarchés financiers (AMF) in Quebec, which do not differ from IFRS. These Interim Combined Financial Statements have been prepared in accordancewith International Accounting Standard (IAS) 34, “Interim Financial Reporting”. For further information about the accounting policies applied, see theAnnual and Interim Combined Financial Statements.
This MD&A was prepared in accordance with the regulations in force on continuous disclosure obligations issued by the CSA. Unless otherwise indicated,all amounts are presented in Canadian dollars ($) and are primarily from Desjardins Group’s Annual and Interim Combined Financial Statements.
To assess its performance, Desjardins Group uses IFRS measures and various non-IFRS financial measures. Non-IFRS financial measures, other thanthe regulatory ratios, do not have a standardized definition and are not directly comparable to similar measures used by other companies, and may not bedirectly comparable to any IFRS measures. Investors, among others, may find these non-IFRS measures useful in analyzing financial performance. Themeasures currently used are defined as follows:
Adjusted net surplus earnings − Property and Casualty Insurance segment
The net surplus earnings of the Property and Casualty Insurance segment are adjusted to exclude the gain at the acquisition date and the expenses, netof income taxes, incurred as part of the acquisition of the Canadian operations of State Farm Mutual Automobile Insurance Company (State Farm). Theseexpenses include the costs related to the transaction and the integration of operations as well as processing expenses. These costs were not significantfor the other business segments.

DESJARDINS GROUP INTERIM FINANCIAL REPORT
Second quarter – June 30, 2016 5
The following table presents a reconciliation of the net surplus earnings of the Property and Casualty Insurance segment as presented in the CombinedFinancial Statements, and the adjusted net surplus earnings as presented in the MD&A.
For the three-month periods For the six-month periods
(in millions of dollars) ended ended
June 30, 2016 March 31, 2016 June 30, 2015 June 30, 2016 June 30, 2015
Presentation of the net surplus earnings of the Property
and Casualty Insurance segment in the Combined
Financial Statements $ 49 $ 39 $ 194 $ 88 $ 270
Gain as at the acquisition date of State Farm's
Canadian operations - - - - (55)
Expenses related to the acquisition of State Farm's
Canadian operations, net of income taxes 10 7 11 17 18
Presentation of the adjusted net surplus earnings
of the Property and Casualty Insurance segment
in the MD&A $ 59 $ 46 $ 205 $ 105 $ 233
Productivity index
The productivity index is used to measure efficiency and is equal to the ratio of non-interest expense to total income, less expenses related to claims,benefits, annuities and changes in insurance contract liabilities, expressed as a percentage. A lower ratio indicates greater productivity.
Gross impaired loans/gross loans and acceptances ratio
The gross impaired loans/gross loans and acceptances ratio is used to measure loan portfolio quality and is equal to gross impaired loans expressed as apercentage of total gross loans and acceptances.
Average loans and acceptances – Average deposits
The average balance for these items is used to measure growth. It is equal to the average of the amounts presented in the Combined FinancialStatements at the end of the quarters calculated starting from the quarter prior to the period concerned.
Combined ratio
The combined ratio is used to measure the profitability of the Property and Casualty Insurance segment. It is equal to incurred claims plus operatingexpenses expressed as a percentage of net premiums earned, excluding the market yield adjustment. Market yield adjustment is defined as the impact ofchanges in the discount rate on the provisions for claims and adjustment expenses based on the change in the market-based yield of the underlyingassets for these provisions.
Expense ratio
The expense ratio is used to measure the profitability of the Property and Casualty Insurance segment and is equal to operating expenses expressed as apercentage of net premiums earned.
Loss ratio
The loss ratio is used to measure the profitability of the Property and Casualty Insurance segment and is equal to incurred claims, net of reinsurance,expressed as a percentage of net premiums earned, excluding the market yield adjustment. Market yield adjustment is defined as the impact of changes inthe discount rate on the provisions for claims and adjustment expenses based on the change in the market-based yield of the underlying assets for theseprovisions.
Return on equity
Return on equity is used to measure profitability. Expressed as a percentage, it is equal to surplus earnings before member dividends, excluding the non-controlling interests’ share, divided by average equity before non-controlling interests.
Income
Operating income
The concept of operating income is used to analyze financial results. This concept allows for better structuring of financial data and makes it easier tocompare operating activities from one period to the next by excluding investment income. The analysis therefore breaks down Desjardins Group’s incomeinto two parts, namely operating income and investment income, which make up total income. This measure is not directly comparable to similar measuresused by other companies.
Operating income includes net interest income, net premiums and other operating income such as deposit and payment service charges, lending fees andcredit card service revenues, income from brokerage and investment fund services, management and custodial service fees, foreign exchange income aswell as other income. These items, taken individually, correspond to those presented in the Combined Financial Statements.

DESJARDINS GROUP INTERIM FINANCIAL REPORT
Second quarter – June 30, 2016 6
Investment income
Investment income includes net income on securities at fair value through profit or loss, net income on available-for-sale securities and net otherinvestment income. These items, taken individually, correspond to those presented in the Combined Financial Statements. Investment income alsoincludes income from the insurance subsidiaries’ matching activities and from derivative financial instruments not designated as part of a hedgingrelationship.
The following table shows the correspondence of total income between the MD&A and the Combined Financial Statements.
For the three-month periods For the six-month periods
(in millions of dollars) ended ended
June 30, 2016 March 31, 2016 June 30, 2015 June 30, 2016 June 30, 2015
Presentation of income in the Combined FinancialStatements
Net interest income $ 1,053 $ 1,049 $ 1,057 $ 2,102 $ 2,052
Net premiums 1,740 1,721 1,698 3,461 3,574
Other income
Deposit and payment service charges 119 118 122 237 240
Lending fees and credit card service revenues 155 168 156 323 310
Brokerage and investment fund services 286 260 267 546 519
Management and custodial service fees 92 88 95 180 184
Net income (loss) on securities at fair value through
profit or loss 878 512 (612) 1,390 562
Net income on available-for-sale securities 99 79 107 178 212
Net other investment income 50 50 92 100 136
Foreign exchange income 22 16 21 38 47
Other 46 65 12 111 102
Total income $ 4,540 $ 4,126 $ 3,015 $ 8,666 $ 7,938
Presentation of income in Management’sDiscussion and Analysis
Net interest income $ 1,053 $ 1,049 $ 1,057 $ 2,102 $ 2,052
Net premiums 1,740 1,721 1,698 3,461 3,574
Other operating income
Deposit and payment service charges 119 118 122 237 240
Lending fees and credit card service revenues 155 168 156 323 310
Brokerage and investment fund services 286 260 267 546 519
Management and custodial service fees 92 88 95 180 184
Foreign exchange income 22 16 21 38 47
Other 46 65 12 111 102
Operating income 3,513 3,485 3,428 6,998 7,028
Investment income (loss)
Net income (loss) on securities at fair value through
profit or loss 878 512 (612) 1,390 562
Net income on available-for-sale securities 99 79 107 178 212
Net other investment income 50 50 92 100 136
1,027 641 (413) 1,668 910
Total income $ 4,540 $ 4,126 $ 3,015 $ 8,666 $ 7,938
Provisioning rate
The provisioning rate is used to measure loan portfolio quality, and is equal to the provision for credit losses divided by average gross loans andacceptances.

DESJARDINS GROUP INTERIM FINANCIAL REPORT
Second quarter – June 30, 2016 7
CHANGES IN THE REGULATORY ENVIRONMENT
Desjardins Group closely monitors changes in regulation as they relate to financial products and services, as well as new developments in fraud,corruption, protection of personal information, money laundering and terrorist financing in order to mitigate any negative impact on its operations, and aimsto comply with best practices in this regard.
In June 2013, the AMF determined that Desjardins Group met the criteria for designation as a domestic systemically important financial institution (D-SIFI),which subjects Desjardins Group to higher capital requirements and enhanced disclosure requirements, among other things, as instructed by the AMF.Since January 1, 2016, Desjardins Group has therefore been subject, as a D-SIFI, to an additional capital requirement of 1% on its minimum capital ratios.Based on the recommendations issued by the Enhanced Disclosure Task Force of the Financial Stability Board contained in the document “Enhancing theRisk Disclosures of Banks”, Desjardins Group is continuing to develop its external disclosures and is working on integrating these recommendations intoits risk management disclosure framework. Furthermore, Desjardins Group developed a living will, detailing the actions it will take to restore its financialposition in the event of a crisis. Note that the Office of the Superintendent of Financial Institutions (OSFI) has also determined that Canada’s six majorfinancial institutions meet the criteria for designation as D-SIFI.
On December 5, 2013, the then Quebec Minister of Finance and the Economy tabled his “Report on the application of the Act respecting financial servicescooperatives” in the National Assembly. The report contains proposals that will serve as criteria for amendments to the current legislative framework aimedat adapting it to the changing realities of financial services cooperatives as well as the requirements of the new international standards imposed onfinancial institutions. The law amending the legislative framework is expected to come into force in the second half of 2016.
The Quebec Act to amend the Supplemental Pension Plans Act mainly with respect to the funding of defined benefit pension plans came into force onJanuary 1, 2016. The changes to the funding rules are intended to promote the sustainability of private pension plans by ensuring funding that mustinclude an explicit stabilization provision determined according to the plan’s investment policy. Funding on a solvency basis is no longer required. OnApril 6, 2016, the Quebec government issued a draft regulation under the Act that outlines the rules for determining the stabilization provision. Thisprovision will be based on two variables, i.e. the percentage of assets allocated to variable-income securities, and the ratio between the duration of planassets and the duration of plan liabilities. Other draft regulations should be issued in 2016 to clarify, among other things, the requirements of the fundingpolicy and the annuity purchase policy.
Since January 1, 2013, the Capital Adequacy Requirements (CAR) Guideline of the OSFI applicable to Canadian financial institutions has includedrequirements for Non-Viability Contingent Capital as part of regulatory capital. Desjardins Group, under the AMF’s guidelines on adequacy of capital basestandards, is subject to similar rules applicable to non-viability contingent capital in its regulatory capital (which came into force on January 1, 2013).However, Desjardins Group has not issued any instrument subject to these rules. Given that discussions are still underway at the international level onhow to apply these provisions on contingent capital to cooperative entities, the guidelines may be changed.
On June 19, 2014, to strengthen the Canadian regime to fight money laundering and terrorist financing as well as improve the effectiveness of its targetedfinancial sanctions and lighten the burden of compliance on the private sector, the Parliament of Canada passed the Economic Action Plan 2014 Act,No. 1, which was part of the budget implementation bill. The Act includes amendments to the Proceeds of Crime (Money Laundering) and TerroristFinancing Act and the regulations thereunder, and to the Income Tax Act. Some of these amendments came into effect in June 2016. The rest will comeinto effect gradually, in particular in June 2017. In parallel with these changes, the Financial Transactions and Reports Analysis Centre of Canada(FINTRAC) issued a new guideline on more flexible methods to ascertain the identity of individual clients, which came into force onJune 30, 2016. Desjardins Group is preparing to implement these legislative changes and is closely monitoring developments to know the dates on whichthey will come into force and is assessing their impact on its operations.
On August 1, 2014, the Government of Canada initiated public consultation on a proposed taxpayer protection and bank recapitalization regime applicableto national systemically important Canadian banks. The consultation period ended in September 2014, although no implementation date has beenannounced yet. This regime is not applicable immediately to Desjardins Group because it is regulated by the AMF. Moreover, the Quebec government hasnot yet publicly reacted, nor has it announced its intentions with regard to this subject.
On December 16, 2014, the Government of Canada adopted Bill C-43 – Economic Action Plan 2014 Act, No. 2. Among other things, this Act amendsseveral laws, limiting access by provincial cooperative credit associations to federal intervention tools. More specifically, the Act formalizes that the Bankof Canada may grant a loan or an advance to a provincial cooperative credit association only if the province has agreed, in writing, to indemnify the Bankfor any losses arising from the loan or advance that the Bank could incur. The Bank of Canada’s policies on emergency lending assistance have alreadyrequired such indemnification commitments from the provinces since 2009. The Act also brings an end to liquidity financial support agreements enteredinto by, among others, the Canada Deposit Insurance Corporation and the Régie de l’assurance-dépôts du Québec (replaced by the AMF). The Act’sprovisions on emergency lending assistance and the federal-provincial agreement on deposit insurance are not yet in force. Desjardins Group expects thatsatisfactory agreements will be negotiated between the two levels of government before the provisions come into force so that the Act does not affect thestability of the Canadian financial system.
On May 5, 2015, the Bank of Canada launched a public consultation on the framework for its capital market operations and its emergency lendingassistance policies. The consultation period ended on July 4, 2015. On September 30, 2015, the Bank of Canada announced its decision to implement theproposed changes in the consultation document distributed in May 2015. The changes, which took effect on September 30, 2015, require, among otherthings, that emergency lending assistance be reserved for institutions that have in place credible recovery and resolution frameworks and, under certainconditions, that emergency lending assistance be provided to provincial institutions such as caisses or credit unions and their centrals. This emergencylending assistance to provincial institutions is however limited to cases that are considered necessary to support the stability of the Canadian financialsystem. The Bank of Canada has issued an updated version of its policy statement on the provision of emergency lending assistance, which takes thesechanges into account. Desjardins Group will continue to closely monitor developments in Bank of Canada policies that could have an impact on itsoperations.

DESJARDINS GROUP INTERIM FINANCIAL REPORT
Second quarter – June 30, 2016 8
The U.S. Federal Reserve (the Fed) has implemented a number of rules and standards that affect non-U.S. financial institutions with activities in the U.S.These measures have various repercussions on Desjardins Group. The rules resulting from the Dodd-Frank Wall Street Reform and Consumer ProtectionAct, adopted in 2010, affect, in particular, the implementation of provisions on swap trading, proprietary trading and ownership interests in hedge funds(the Volcker rule), as well as those concerning the Enhanced Prudential Standards and the submission of a resolution plan. On December 10, 2013, theU.S. authorities issued the final rules implementing the Volcker Rule, which was adopted to limit speculation by financial institutions. Desjardins Group hasimplemented frameworks to ensure compliance with the Volcker Rule, which took effect on July 21, 2015. The Fed has allowed an additional period up toJuly 21, 2017 for the coming into force of certain requirements concerning hedge fund ownership. The Enhanced Prudential Standards, effective as ofJuly 1, 2016, impose certain requirements regarding capital adequacy, maintaining of liquidity, risk management and stress testing. Desjardins Group willcontinue to closely monitor developments in these requirements to ensure compliance when they take effect.
The Organisation for Economic Co-operation and Development has set up a “Standard for Automatic Exchange of Financial Information in Tax Matters”,based on the same general principles and obligations as those of the Foreign Account Tax Compliance Act (FATCA), but globally. Canada confirmed itsendorsement of the standard effective July 1, 2017, with the first exchange of information between Canada and the competent authorities scheduled forMay 1, 2018. Desjardins Group has begun work to comply with the new regulation when it takes effect, while minimizing the impact on member and clientexperience.
Finally, Desjardins Group continues to monitor changes in capital and liquidity requirements under global standards developed by the Basel Committee onBanking Supervision. To this end, in January 2015, the Committee issued a new standard related to the third pillar, which aims to enhance comparabilityacross financial institutions, transparency and disclosure with regard to regulatory capital adequacy and risk exposure. Desjardins Group has assessedthe impact of adopting this standard and has begun work to ensure compliance with the standard once it takes effect. However, the AMF must define theapplication rules for Desjardins and specify the implementation date. The “Capital management” section of this MD&A presents a summary of the mainchanges in capital currently under study.
ECONOMIC ENVIRONMENT AND OUTLOOK
The second quarter of 2016 began on a positive note. The renewed investor confidence that began in mid-February continued through April and May. Byearly June the North American stock indices had reached levels not seen in close to a year. The Toronto Stock Exchange performed well, with the indexup over 10% since the start of 2016. Oil prices rallied to near USD 50/barrel as the large output surpluses in the global oil market appeared to be givingway to a balanced market. This left the door open for a second hike in the U.S. federal funds rate. However, a marked slowdown in U.S. job creation anduncertainty over the United Kingdom’s referendum on leaving the European Union (“Brexit”) convinced the Federal Reserve (the Fed) to leave its keyinterest rate unchanged at its June 15 meeting. Then the “Leave” campaign won the Brexit referendum, which led to higher volatility in the markets, alower British pound and declines in the world’s stock exchanges. North American exchanges nevertheless erased most of their losses during the lasttrading sessions of June, ending the second quarter in positive territory.
The vote in favour of Brexit should convince the Fed not to tighten monetary policy before 2017. Some overseas central banks may even announce newmonetary easing measures in the near term in order to offset the negative impacts of this event. The Bank of Canada is not expected to change its keyinterest rates before 2018. In this environment, bond rates are expected to remain low for several more quarters. The impact that Brexit will have on riskierassets is uncertain, as more accommodative monetary policies may compensate for weaker-than-expected global growth.
The Euroland and Japanese economies demonstrated surprising strength in the first quarter of 2016, although growth in the eurozone dropped by half inthe second quarter, while in Japan it probably slowed in this period. Furthermore, the uncertainty caused by Britain’s vote to have the United Kingdomwithdraw from the European Union has added another negative factor. Beyond the actual impacts of future trade and financial constraints, the greater riskto the British, European Union and global economies in the short term is the climate of uncertainty. The outlook for the British economy can be expected todeteriorate over the next few quarters. The United Kingdom’s real GDP should grow 1.4% in 2016 and only 0.8% next year. In the eurozone, real GDP isexpected to grow 1.5% this year and 1.3% in 2017. China’s economic growth should continue to slow: from 6.9% in 2015, growth in China’s real GDP isexpected to fall to 6.4% in 2016 and 6.1% in 2017. The global economy’s real GDP should grow 3.0% in 2016 and 3.4% in 2017.
In the U.S., real GDP growth for the first quarter of 2016 was revised to 0.8%. Even if several factors, in particular consumer spending, suggested thatgrowth would be stronger in the spring, annualized real GDP growth was only 1.2% in the second quarter. Brexit’s impact on the U.S. economy isexpected to be relatively small. For 2016 as a whole, real GDP in the U.S. should climb 1.9%, followed by another 2.4% gain in 2017.
In Canada, expectations were high for strong economic growth in the first quarter of 2016. So the 2.4% increase in real GDP on an annualized quarterlybasis reported by Statistics Canada fell short of expectations, even if it surpassed the economy’s performance in the four previous quarters. The generalportrait of the Canadian economy is well aligned with the forecasts. Non-residential investments continued to fall as energy prices kept being adjusteddownward. Other components of domestic demand have improved, and foreign trade has contributed to economic growth. The Canadian economy isnevertheless expected to have experienced some difficulties in the second quarter. The upward trend in exports faltered as exports slipped, and thisshould slow real GDP growth in the spring. On the other hand, the interruptions in crude oil output caused by the forest fires in Alberta will have a negativeimpact on real GDP, which is expected to have dropped approximately 1.5% in the second quarter. Economic growth should return in the summer as longas the uncertainties surrounding Brexit have minimal impacts on the Canadian economy. Real GDP is expected to grow 1.2% in 2016 and may growanother 2.3% in 2017.
In Quebec, consumer spending has increased since the first quarter of 2016. Growth should also be positive in the second quarter since consumerconfidence is good, there has been sustained job growth, and the tax relief provided by the federal government is having a positive impact on theeconomy. However, residential real estate is in the midst of an adjustment period, although it has presented some positive signals. Existing home saleshave rallied throughout the province, and the year-over-year price increase held steady at approximately 2% in the second quarter of 2016. However, themarket is characterized by ample supply that is limiting the construction of new homes and condominiums. The residential market in Quebec is growing ata moderate pace, which is calming concerns over a sharp increase in prices and the risk of a sudden correction. The outlook is good for Quebecbusinesses. SMEs’ confidence rose at the end of the second quarter, and Statistics Canada’s survey on investment intentions for 2016 yielded good newsfor Quebec. Furthermore, the federal government’s infrastructure program will soon spur a return to growth in public investment in Quebec. The province’sreal GDP is expected to grow 1.3% in 2016 compared to 1.1% in 2015.

DESJARDINS GROUP INTERIM FINANCIAL REPORT
Second quarter – June 30, 2016 9
REVIEW OF FINANCIAL RESULTS
FINANCIAL RESULTS AND INDICATORSFor the three-month periods For the six-month periods
(in millions of dollars and as a percentage) ended ended
June 30, 2016 March 31, 2016(1) June 30, 2015(1) June 30, 2016 June 30, 2015(1)
Results
Net interest income $ 1,053 $ 1,049 $ 1,057 $ 2,102 $ 2,052
Net premiums 1,740 1,721 1,698 3,461 3,574
Other operating income
Deposit and payment service charges 119 118 122 237 240
Lending fees and credit card service revenues 155 168 156 323 310
Brokerage and investment fund services 286 260 267 546 519
Management and custodial service fees 92 88 95 180 184
Foreign exchange income 22 16 21 38 47
Other 46 65 12 111 102
Operating income(2) 3,513 3,485 3,428 6,998 7,028
Investment income (loss)(2)
Net income (loss) on securities at fair value through
profit or loss 878 512 (612) 1,390 562
Net income on available-for-sale securities 99 79 107 178 212
Net other investment income 50 50 92 100 136
1,027 641 (413) 1,668 910
Total income 4,540 4,126 3,015 8,666 7,938
Provision for credit losses 75 91 103 166 192Claims, benefits, annuities and changes in insurance
contract liabilities 2,065 1,758 332 3,823 2,835
Non-interest expense 1,865 1,787 1,781 3,652 3,529
Income taxes on surplus earnings 108 108 170 216 289
Surplus earnings before member dividends $ 427 $ 382 $ 629 $ 809 $ 1,093
Contribution to combined surplus earnings bybusiness segment(3)
Personal Services and Business and Institutional Services $ 226 $ 211 $ 239 $ 437 $ 435
Wealth Management and Life and Health Insurance 124 97 195 221 293
Property and Casualty Insurance 49 39 194 88 270
Other 28 35 1 63 95
$ 427 $ 382 $ 629 $ 809 $ 1,093
Amount returned to members and the community
Member dividends $ 22 $ 30 $ 34 $ 52 $ 74
Sponsorships and donations 22 16 23 38 38
Desjardins Member Advantages program 8 7 7 15 14
$ 52 $ 53 $ 64 $ 105 $ 126
Indicators
Return on equity(2) 7.8% 7.1% 11.4% 7.4% 10.4%
Productivity index(2) 75.4 75.5 66.4 75.4 69.2
Provisioning rate(2) 0.19 0.23 0.27 0.21 0.25(1)
Prior-period data have been reclassified to reflect the current period's presentation.(2)
See “Basis of presentation of financial information”.(3)
The breakdown by line item is presented in Note 14, “Segmented information”, to the Interim Combined Financial Statements.
ANALYSIS OF RESULTS
Comparison of the second quarters of 2016 and 2015
Surplus earnings
For the second quarter ended June 30, 2016, Desjardins Group recorded surplus earnings before member dividends of $427 million, a reduction of$202 million, or 32.1%, compared to the corresponding quarter of 2015. Second quarter 2015 surplus earnings were affected by an especially favourableclaims experience, which had improved the loss ratio for P&C insurance to the historical low of 43.0%, whereas it was 67.4% in the second quarter of2016. Other special items such as changes in actuarial assumptions related to life and health insurance operations and gains on the disposal of real estateinvestments had also enhanced surplus earnings in 2015.

DESJARDINS GROUP INTERIM FINANCIAL REPORT
Second quarter – June 30, 2016 10
This result reflects the contribution of $226 million, or 52.9% of surplus earnings, made by the Personal Services and Business and Institutional Servicessegment. The Wealth Management and Life and Health Insurance segment and the Property and Casualty Insurance segment contributed $124 millionand $49 million, respectively, representing 29.0% and 11.5% of surplus earnings. The operations grouped under the Other category made a contribution of$28 million, or 6.6% of surplus earnings.
Return on equity was 7.8%, compared to 11.4% in the corresponding quarter of 2015. This decrease was mainly due to the reduction in surplus earnings,as explained above.
By its very nature as a cooperative financial group, Desjardins Group’s mission is to improve the economic and social well-being of people andcommunities, which it continued to strive to achieve in the second quarter of 2016. The amount set aside for member dividends therefore totalled$22 million for the quarter, compared to $34 million for the same period of the previous year. If we add this amount to the $22 million given to variousorganizations in the form of donations and sponsorships, and the $8 million paid out through the Desjardins Member Advantages program, the amountreturned to the community totalled $52 million for the second quarter, compared to $64 million for the same quarter in 2015.
Operating income
Operating income stood at $3,513 million, up $85 million, or 2.5%, compared to the second quarter of 2015.
Net interest income was $1,053 million, compared to $1,057 million for the same period in the previous year, a decrease of $4 million, or 0.4%, as a resultof fierce competition in the market, which continued to put pressure on interest margins, despite growth in the entire portfolio of loans and acceptancesoutstanding, amounting to $7.3 billion, or 4.7%, during the year. Higher income from treasury activities, generated by asset/liability matching managementactivities, partially offset this reduction.
Net premiums were up $42 million, or 2.5%, to total $1,740 million as at June 30, 2016.
The overall insurance operations of the Wealth Management and Life and Health Insurance segment posted net insurance and annuity premium income of$1,000 million for the second quarter of 2016, up $22 million, or 2.2%, compared to the same period in 2015. Insurance premiums, essentially fromindividual insurance for $13 million, increased by $15 million, while annuity premiums increased by $7 million.
The Property and Casualty Insurance segment's operations generated net premium income of $797 million for the second quarter of 2016, compared to$785 million for the same period in 2015, an increase of $12 million, or 1.5%, mainly on account of the reinsurance treaty signed as part of the acquisitionof State Farm’s Canadian operations, which provides for the cession, scaled down over a five-year term, of the premiums and claims arising from newbusiness and renewals after the acquisition date. To a lesser extent, the increase was also due to the larger number of policies issued as a result ofmultiple growth initiatives across all market segments and regions. The increase in premiums was partly offset, however, by a decrease in net premiumsafter unearned premiums transferred at the acquisition of State Farm’s Canadian operations (which had generated significant income in the secondquarter of 2015) were taken over as at January 1, 2015.
Other operating income totalled $720 million, up $47 million, or 7.0%, compared to the corresponding quarter in 2015, chiefly as a result of a lowerincrease in the contingent consideration payable arising from the claims taken over as part of the acquisition of State Farm’s Canadian operations in thefirst quarter of 2015.
Investment income
Investment income was up $1,440 million compared to the second quarter of 2015, primarily due to changes in the fair value of assets backing liabilitiesrelated to insurance operations. This increase was partly offset by higher expenses related to claims, benefits, annuities and changes in insurancecontract liabilities. These changes were for the most part due to fluctuations in the fair value of the bond portfolio, stemming largely from fluctuations inmedium- and long-term interest rates. In addition, favourable changes in the fair value of available-for-sale securities in second quarter 2016 helped toraise investment income. However, gains on the disposal of real estate investments in the second quarter of 2015 mitigated this increase.
Total income
Total income amounted to $4,540 million, up $1,525 million, or 50.6%, compared to the same period in 2015, mainly because of the increase in investmentincome, as explained earlier.
Provision for credit losses
The provision for credit losses totalled $75 million for the second quarter of 2016, down by $28 million, or 27.2%, compared to the corresponding quarter in2015, mainly due to favourable developments in the parameters used in the model for measurement of provisions and the improved risk profile of thebusiness loan portfolio. In addition, the lower rate of losses on the loan portfolio at Card and Payment Services contributed to this change. Theprovisioning rate was 0.19%, compared to 0.27% in the corresponding quarter of 2015. Desjardins Group’s loan portfolio continued to be of high quality.The ratio of gross impaired loans, as a percentage of the total gross loan and acceptances portfolio, was 0.35% as at June 30, 2016, up slightly from0.34% in the corresponding quarter of 2015.
Claims, benefits, annuities and changes in insurance contract liabilities
Expenses related to claims, benefits, annuities and changes in insurance contract liabilities totalled $2,065 million, up $1,733 million compared to thecorresponding quarter of 2015.
The Wealth Management and Life and Health Insurance segment recorded expenses of $1,492 million related to claims, benefits, annuities and changesin insurance contract liabilities, an increase of $1,392 million compared to 2015. This change mainly resulted from a $1,402 million increase in the actuarialliabilities recognized under “Insurance contract liabilities”, which includes the effect of an increase of $1,299 million in the fair value of investments. Inaddition, a favourable change in assumptions made in 2015 following changes to the investment portfolio contributed $44 million to the reduction inactuarial liabilities.

DESJARDINS GROUP INTERIM FINANCIAL REPORT
Second quarter – June 30, 2016 11
The cost of claims for the Property and Casualty Insurance segment was $569 million for the second quarter, for an increase of $333 million, or 141.1%,compared to the second quarter of 2015. The increase was mainly due to significant favourable developments, in the second quarter of 2015, ofautomobile insurance claims from previous years taken over from State Farm as at January 1, 2015. In addition, the lower discount rates used to measurethe provision for claims contributed to the higher cost of claims, whereas an increase in discount rates had had the opposite effect in the same period in2015. The loss ratio of the P&C insurers was 67.4% for the second quarter of 2016, compared to 43.0% in the corresponding quarter of 2015. Theincrease was due to a higher claims experience in automobile insurance as a result of favourable developments in claims from previous years and thehigher claims experience for the current period than in the second quarter of 2015. Home insurance claims were also higher than in the correspondingquarter of 2015, mainly because of damage related to the Fort McMurray wildfire.
Non-interest expense and other item
Non-interest expense totalled $1,865 million, up $84 million, or 4.7%, compared to the second quarter of 2015, chiefly due to business growth, particularlyin credit card and point-of-sale financing activities, as well as in insurance operations. It was also affected by annual salary indexing and an increase in ITexpenses.
The productivity index stood at 75.4% for the second quarter of 2016, compared to 66.4% for the same quarter a year earlier. Second quarter 2015surplus earnings were affected by an especially favourable claims experience, which had improved the loss ratio for P&C insurance to the historical low of43.0%, whereas it was 67.4% in the second quarter of 2016. Other special items such as changes in actuarial assumptions related to life and healthinsurance operations and gains on the disposal of real estate investments had also enhanced the productivity index in 2015.
Income taxes
Income taxes on surplus earnings before member dividends totalled $108 million for the second quarter of 2016, a $62 million decrease compared to thecorresponding quarter in 2015. The effective tax rate was 20.2%, compared to 21.3% for the same quarter in 2015.
Comparison of the first six months of 2016 and 2015
Surplus earnings
For the first six months ended June 30, 2016, Desjardins Group recorded surplus earnings before member dividends of $809 million, a reduction of$284 million, or 26.0%, compared to the corresponding six months of 2015. Surplus earnings in the first six months of 2015 were affected by a morefavourable claims experience as well as by special items such as changes in actuarial assumptions related to life and health insurance operations, thegain as at the acquisition date of State Farm’s Canadian operations and gains on the disposal of real estate investments, which had also enhancedsurplus earnings in 2015.
This result reflects the contribution of $437 million, or 54.0% of surplus earnings, made by the Personal Services and Business and Institutional Servicessegment. The Wealth Management and Life and Health Insurance segment and the Property and Casualty Insurance segment contributed $221 millionand $88 million, respectively, representing 27.3% and 10.9% of surplus earnings. The operations grouped under the Other category made a contribution of$63 million, or 7.8%, of surplus earnings.
Return on equity was 7.4%, compared to 10.4% in the corresponding six months of 2015. This decrease was mainly due to the reduction in surplusearnings, as explained above.
By its very nature as a cooperative financial group, Desjardins Group’s mission is to improve the economic and social well-being of people andcommunities, which it continued to strive to achieve in the first half of 2016. The amount set aside for member dividends therefore totalled $52 million forthe first six months, compared to $74 million for the same period of the previous year. If we add this amount to the $38 million given to variousorganizations in the form of donations and sponsorships, and the $15 million paid out through the Desjardins Member Advantages program, the amountreturned to the community totalled $105 million for the first six months, compared to $126 million for the same period in 2015.
Operating income
Operating income stood at $6,998 million, down $30 million, or 0.4%, compared to the first six months of 2015.
Net interest income was $2,102 million, compared to $2,052 million for the same period in the previous year, an increase of $50 million, or 2.4%, as aresult of growth in the entire loan portfolio outstanding, amounting to $7.3 billion, or 4.7%, during the year. Fierce competition in the market continued toput pressure on interest margins. In addition, higher income from treasury activities, generated by asset/liability matching management activities, alsocontributed to this increase.
Net premiums were down $113 million, or 3.2%, to total $3,461 million as at June 30, 2016. The reduction was mostly due to Property and CasualtyInsurance segment operations, as described below.
The overall insurance operations of the Wealth Management and Life and Health Insurance segment posted net insurance and annuity premium income of$2,003 million for the first six months of 2016, compared to $1,982 million for the same period in 2015, an increase of $21 million, or 1.1%. Insurancepremiums, essentially from individual insurance for $22 million, increased by $24 million, while annuity premiums decreased by $3 million.
The Property and Casualty Insurance segment's operations generated net premium income of $1,580 million for the first six months of 2016, compared to$1,723 million for the same period in 2015, down $143 million, or 8.3%, mainly on account of a decrease in net premiums after unearned premiumstransferred at the acquisition of State Farm’s Canadian operations (which had generated significant income in the first half of 2015) were taken over as atJanuary 1, 2015. This impact is also reflected in the cost of claims. The reduction in net premium income was offset by business growth and by thereinsurance treaty signed as part of the acquisition of State Farm’s Canadian operations, which provides for the cession, scaled down over a five-yearterm, of the premiums and claims arising from new business and renewals after the acquisition date.

DESJARDINS GROUP INTERIM FINANCIAL REPORT
Second quarter – June 30, 2016 12
Other operating income totalled $1,435 million, up $33 million, or 2.4%, compared to the corresponding six months in 2015. Income from growth in creditcard and point-of-sale financing activities and in assets under management from the sale of various products was the main factor in this increase. Inaddition, the lower increase in the contingent consideration payable arising from the claims taken over as part of the acquisition of State Farm’s Canadianoperations in the first quarter of 2015 also contributed to the increase, which was however mitigated by the gain as at the acquisition date in 2015.
Investment income
Investment income was up $758 million compared to the first half of 2015, primarily due to changes in the fair value of assets backing liabilities related tolife and health insurance operations. This increase was partly offset by higher expenses related to claims, benefits, annuities and changes in insurancecontract liabilities. These changes were for the most part due to fluctuations in the fair value of the bond portfolio, stemming largely from fluctuations inmedium- and long-term interest rates. However, higher gains on the disposal of real estate investments and on the disposal of available-for-sale securitiesin the first half of 2015 partially offset this increase.
Total income
Total income amounted to $8,666 million, up $728 million, or 9.2%, compared to the same period in 2015, mainly because of the increase in investmentincome, as explained earlier.
Provision for credit losses
The provision for credit losses totalled $166 million for the first half of 2016, down by $26 million, or 13.5%, compared to the corresponding period in 2015,mainly due to favourable developments in the parameters used in the model for measurement of the collective allowance and the allowance for off-balance sheet items. The provisioning rate was 0.21%, compared to 0.25% in the corresponding period of 2015. Desjardins Group’s loan portfoliocontinued to be of high quality. The ratio of gross impaired loans, as a percentage of the total gross loan and acceptances portfolio, was 0.35% as atJune 30, 2016, up slightly from 0.34% in the corresponding period of 2015.
Claims, benefits, annuities and changes in insurance contract liabilities
Expenses related to claims, benefits, annuities and changes in insurance contract liabilities totalled $3,823 million, up $988 million, or 34.9%, compared tothe corresponding period of 2015.
The Wealth Management and Life and Health Insurance segment recorded expenses of $2,671 million related to claims, benefits, annuities and changesin insurance contract liabilities, an increase of $921 million compared to the first six months of 2015. This change mainly resulted from a $944 millionincrease in the actuarial liabilities recognized under “Insurance contract liabilities”, which includes the effect of an increase of $838 million in the fair valueof investments. In addition, a favourable change in assumptions made in 2015 following changes to the investment portfolio contributed $44 million to thereduction in actuarial liabilities.
The cost of claims for the Property and Casualty Insurance segment was $1,153 million for the first six months of 2016, for an increase of $61 million, or5.6%, compared to the corresponding period of 2015. The increase was mainly due to a higher claims experience in automobile insurance than in thecorresponding period of 2015. The loss ratio of the P&C insurers was 70.7% for the first half of 2016, compared to 62.8% in the corresponding period of2015. The increase was due to a higher claims experience in automobile insurance as a result of favourable developments in claims from previous yearsand the higher claims experience for the current period than in the first half of 2015.
Non-interest expense and other item
Non-interest expense totalled $3,652 million, up $123 million, or 3.5%, compared to the first half of 2015, chiefly due to business growth, particularly incredit card and point-of-sale financing activities, as well as in insurance operations. It was also affected by annual salary indexing and an increase in ITexpenses.
The productivity index stood at 75.4% for the first half of 2016, compared to 69.2% for the same period a year earlier. Surplus earnings in the first half of2015 were affected by a more favourable claims experience as well as by special items such as changes in actuarial assumptions related to life and healthinsurance operations, the gain as at the acquisition date of State Farm’s Canadian operations and gains on the disposal of real estate investments, whichhad also enhanced surplus earnings in 2015.
Income taxes
Income taxes on surplus earnings before member dividends totalled $216 million for the first half of 2016, a $73 million decrease compared to thecorresponding period in 2015. The effective tax rate was 21.1%, compared to 20.9% for the same period in 2015.
RESULTS BY BUSINESS SEGMENT
Desjardins Group’s financial reporting is organized by business segments, which are defined based on the needs of its members and clients, the marketsin which Desjardins operates, and on its internal management structure. Desjardins Group’s financial results are therefore divided into the following threebusiness segments: Personal Services and Business and Institutional Services; Wealth Management and Life and Health Insurance; and Property andCasualty Insurance. In addition to these three segments, there is also the Other category. This section presents an analysis of results for each of thesesegments.
Intersegment transactions are recognized at the exchange amount, which represents the amount agreed upon by the various legal entities and businessunits. The terms and conditions of these transactions are comparable to those offered on financial markets.
Additional information about each business segment, particularly its profile, activities, industry and 2016 strategies and priorities, can be found on pages36 to 47 of the 2015 Annual Report.

DESJARDINS GROUP INTERIM FINANCIAL REPORT
Second quarter – June 30, 2016 13
PERSONAL SERVICES AND BUSINESS AND INSTITUTIONAL SERVICES
The Personal Services and Business and Institutional Services segment offers Desjardins Group’s members and clients a comprehensive, integrated lineof products and services designed to meet the needs of individuals, businesses, institutions, non-profit organizations and cooperatives, through theDesjardins caisse network, Desjardins Business centres as well as specialized teams. It also makes its products and services available throughcomplementary distribution networks and mortgage representatives, by phone, online, via applications for mobile devices, as well as at ATMs.
PERSONAL SERVICES AND BUSINESS AND INSTITUTIONAL SERVICES – SEGMENT RESULTS
For the three-month periods For the six-month periods
(in millions of dollars and as a percentage) ended ended
June 30, 2016 March 31, 2016 June 30, 2015(1) June 30, 2016 June 30, 2015(1)
Net interest income $ 982 $ 977 $ 1,003 $ 1,959 $ 1,944
Other operating income 493 494 499 987 970
Operating income 1,475 1,471 1,502 2,946 2,914
Investment income 18 15 12 33 23
Total income 1,493 1,486 1,514 2,979 2,937
Provision for credit losses 79 94 103 173 192
Non-interest expense 1,105 1,102 1,086 2,207 2,157
Income taxes on surplus earnings 83 79 86 162 153
Surplus earnings before member dividends 226 211 239 437 435
Member dividends, net of income tax recovery 16 22 24 38 54
Net surplus earnings for the period aftermember dividends $ 210 $ 189 $ 215 $ 399 $ 381
Of which:
Group’s share $ 210 $ 188 $ 215 $ 398 $ 380
Non-controlling interests’ share - 1 - 1 1
Indicators
Average gross loans and acceptances(2) $ 157,973 $ 156,636 $ 151,253 $ 157,480 $ 150,014
Average deposits(2) 131,406 127,592 124,237 129,497 123,477
Provisioning rate(2) 0.20% 0.24% 0.27% 0.22% 0.26%
Gross impaired loans/gross loans and acceptances(2) 0.36 0.36 0.35 0.36 0.35(1) Data for 2015 have been reclassified to reflect the current period's presentation.(2)
See "Basis of presentation of financial information".
Comparison of the second quarters of 2016 and 2015
For the second quarter of 2016, the Personal Services and Business and Institutional Services segment’s surplus earnings before member dividendstotalled $226 million, down $13 million, or 5.4%, compared to the corresponding quarter of 2015. The decrease in surplus earnings was mainly on accountof lower net interest income, partially offset by a reduction in the provision for credit losses.
Operating income totalled $1,475 million, down $27 million, or 1.8%. It was affected by a $21 million, or 2.1%, decrease in net interest income as a resultof fierce competition in the market, which continued to put pressure on interest margins, despite growth in the average overall portfolio outstanding ofloans and acceptances, amounting to $6.7 billion, or 4.4%, during the year.
Other operating income was down $6 million, or 1.2%, compared to the same period in 2015, to total $493 million.
Investment income was $18 million, an increase of $6 million compared to June 30, 2015, due to gains on the disposal of securities in the second quarterof 2016.
Total income for the segment was $1,493 million, a decrease of $21 million, or 1.4%, compared to the second quarter of 2015.
The provision for credit losses was $79 million for the second quarter of 2016, down $24 million, or 23.3%, compared to the same period in 2015, mainlydue to favourable developments in the parameters used in the model for measurement of provisions and the improved risk profile of the business loanportfolio. In addition, the lower rate of losses on the loan portfolio at Card and Payment Services contributed to this change.
Non-interest expense was $1,105 million, for an increase of $19 million, or 1.7%, compared to the same period in 2015, primarily because of businessgrowth, including growth in credit card and point-of-sale financing activities.
Comparison of the first six months of 2016 and 2015
For the first six months of 2016, the Personal Services and Business and Institutional Services segment’s surplus earnings before member dividendstotalled $437 million, which is stable compared to the corresponding period of 2015.
Operating income totalled $2,946 million, up $32 million, or 1.1%. It was affected by a $15 million, or 0.8%, increase in net interest income as a result ofgrowth in the average overall portfolio outstanding of loans and acceptances, amounting to $7.5 billion, or 5.0%, during the year. Fierce competition in themarket continued to put pressure on interest margins.
Other operating income was up $17 million, or 1.8%, compared to the same period in 2015, to total $987 million, primarily because of income from growthin credit card and point-of-sale financing activities and an increase in caisse network sales of various Desjardins Group products designed by thesubsidiaries, such as investment funds. However, it was partially offset by lower income from share issuances.

DESJARDINS GROUP INTERIM FINANCIAL REPORT
Second quarter – June 30, 2016 14
Investment income was $33 million, an increase of $10 million compared to June 30, 2015, due to higher trading income on capital markets, partially offsetby the lower gains on the disposal of securities in the first half of 2016.
Total income for the segment was $2,979 million, up $42 million, or 1.4%, compared to the first half of 2015.
The provision for credit losses was $173 million for the first half of 2016, down $19 million, or 9.9%, compared to the same period in 2015, mainly due tofavourable developments in the parameters used in the model for measurement of the collective allowance and the allowance for off-balance sheet items.
Non-interest expense was $2,207 million, for an increase of $50 million, or 2.3%, compared to the same period in 2015, primarily because of businessgrowth, including growth in credit card and point-of-sale financing activities, as well as growth in investments aimed, in particular, at enhancing the serviceoffer to caisse members and clients. In addition, expenses increased due to higher trading income on capital markets that performed well.
WEALTH MANAGEMENT AND LIFE AND HEALTH INSURANCE
The Wealth Management and Life and Health Insurance segment offers Desjardins Group members and clients a range of products and services tailoredto the changing wealth management and financial security needs of individuals, groups, businesses and cooperatives. These products and services aredistributed by advisors and financial planners in the Desjardins caisse network and the Private Management sector, financial security advisors, life andhealth insurance and employee benefit agents and brokers, and securities brokers. Some product lines are also distributed directly online, via applicationsfor mobile devices and through client care centres.
WEALTH MANAGEMENT AND LIFE AND HEALTH INSURANCE – SEGMENT RESULTS
For the three-month periods For the six-month periods
(in millions of dollars) ended ended
June 30, 2016 March 31, 2016(1) June 30, 2015(1) June 30, 2016 June 30, 2015(1)
Net premiums $ 1,000 $ 1,003 $ 978 $ 2,003 $ 1,982
Other operating income 342 341 319 683 634
Operating income 1,342 1,344 1,297 2,686 2,616
Investment income (loss) 854 512 (435) 1,366 558
Total income 2,196 1,856 862 4,052 3,174
Claims, benefits, annuities and changes in insurance
contract liabilities 1,492 1,179 100 2,671 1,750
Non-interest expense 548 551 521 1,099 1,055
Income taxes on surplus earnings 32 29 46 61 76
Net surplus earnings for the period $ 124 $ 97 $ 195 $ 221 $ 293
Of which:
Group’s share $ 115 $ 86 $ 147 $ 201 $ 235
Non-controlling interests’ share 9 11 48 20 58
Indicators
Net sales of savings products(2) $ 1,679 $ 2,271 $ 1,725 $ 3,950 $ 4,497
Insurance sales(2) 119 141 129 260 246
Group insurance premiums 762 754 760 1,516 1,514
Individual insurance premiums 194 193 181 387 365
Annuity premiums 44 56 37 100 103
Segregated fund receipts(3) 297 560 223 857 1,315(1)
Prior-period data have been reclassified to reflect the current period's presentation.(2)
See "Basis of presentation of financial information".(3)
Segregated fund receipts are used to measure the growth of the Wealth Management and Life and Health Insurance segment’s operations. They are the amounts investedby clients in the segregated funds offered, which are comprised of investment funds whose capital is guaranteed upon death or at maturity.
Comparison of the second quarters of 2016 and 2015
For the second quarter of 2016, the Wealth Management and Life and Health Insurance segment posted net surplus earnings of $124 million, down$71 million, or 36.4%, compared to the corresponding period in 2015, mainly as a result of adjustments to actuarial assumptions related to the Canadianlife and health operations acquired from State Farm as well as the gains on the disposal of real estate investments that had contributed favourably in thesecond quarter of 2015.
Operating income stood at $1,342 million, up $45 million, or 3.5%, compared to the same period in 2015. Insurance premiums were up $15 millionessentially due to growth of $13 million in individual insurance premiums while annuity premiums increased by $7 million.

DESJARDINS GROUP INTERIM FINANCIAL REPORT
Second quarter – June 30, 2016 15
Other operating income grew by $23 million, or 7.2%, to total $342 million for the second quarter of 2016, chiefly because of income related to growth inassets under management arising from the sale of various products.
Investment income was up $1,289 million, primarily as a result of the fluctuation in the fair value of assets backing liabilities related to life and healthinsurance operations. This increase was offset by the change in actuarial liabilities, leading to higher expenses related to claims, benefits, annuities andchanges in insurance contract liabilities. These changes were mostly due to fluctuations in the fair value of the bond portfolio, stemming largely fromfluctuations in medium- and long-term interest rates. However, gains on the disposal of real estate investments in the second quarter of 2015 mitigatedthis increase.
The segment’s total income was $2,196 million, for an increase of $1,334 million, or 154.8%, compared to the corresponding quarter in 2015, mainlybecause of the higher investment income, as previously explained.
Expenses related to claims, benefits, annuities and changes in insurance contract liabilities stood at $1,492 million, up $1,392 million compared to 2015.This change primarily resulted from a $1,402 million increase in the actuarial liabilities recognized under “Insurance contract liabilities”, which includes theeffect of a $1,299 million increase in the fair value of investments. Furthermore, a favourable change in assumptions in 2015, following changes made tothe investment portfolio, helped to push down actuarial liabilities by $44 million.
Non-interest expense was $548 million for the second quarter of 2016, up $27 million, or 5.2%, compared to the same period in 2015. This increase wasmainly the result of the higher expenses resulting from growth in average outstanding Desjardins Funds and Market-Linked Guaranteed Investments.
Comparison of the first six months of 2016 and 2015
For the first six months of 2016, the Wealth Management and Life and Health Insurance segment posted net surplus earnings of $221 million, down$72 million, or 24.6%, mainly as a result of adjustments to actuarial assumptions related to the Canadian life and health operations acquired from StateFarm as well as the gains on the disposal of real estate investments that had contributed favourably in the first half of 2015. The decrease in net surplusearnings was also due to a deterioration in claims experience for certain group and individual insurance products.
Operating income stood at $2,686 million, up $70 million, or 2.7%, compared to the same period in 2015. Insurance premiums were up $24 millionessentially due to growth of $22 million in individual insurance premiums while annuity premiums fell by $3 million.
Other operating income grew by $49 million, or 7.7%, to total $683 million for the first half of 2016, chiefly because of income related to growth in assetsunder management arising from the sale of various products.
Investment income was up $808 million, primarily as a result of the fluctuation in the fair value of assets backing liabilities related to life and healthinsurance operations. This increase was offset by the change in actuarial liabilities, leading to higher expenses related to claims, benefits, annuities andchanges in insurance contract liabilities. These changes were mostly due to fluctuations in the fair value of the bond portfolio, stemming largely fromfluctuations in medium- and long-term interest rates. However, lower gains on the disposal of real estate investments in the first six months of 2016compared to the same period in 2015 partially offset the increase in investment income.
The segment’s total income was $4,052 million, for an increase of $878 million, or 27.7%, compared to the corresponding six months in 2015, mainlybecause of the higher investment income, as previously explained.
Expenses related to claims, benefits, annuities and changes in insurance contract liabilities stood at $2,671 million, up $921 million compared to 2015.This change primarily resulted from a $944 million increase in the actuarial liabilities recognized under “Insurance contract liabilities”, which includes theeffect of a $838 million increase in the fair value of investments. Furthermore, a favourable change in assumptions in 2015, following changes made to theinvestment portfolio, helped to push down actuarial liabilities by $44 million.
Non-interest expense was $1,099 million for the first six months of 2016, up $44 million, or 4.2%, compared to the same period in 2015. This increase wasmainly the result of the higher expenses resulting from growth in average outstanding Desjardins Funds and Market-Linked Guaranteed Investments.
PROPERTY AND CASUALTY INSURANCE SEGMENT
The Property and Casualty Insurance segment offers insurance products allowing Desjardins Group members and clients to protect themselves againstdisasters. It includes the operations of Desjardins General Insurance Group Inc. and Western Financial Group Inc. Its products are distributed throughP&C insurance agents in the Desjardins caisse network, a number of client care centres (call centres) and Desjardins Business centres, through anexclusive agent network, as well as online and via applications for mobile devices.

DESJARDINS GROUP INTERIM FINANCIAL REPORT
Second quarter – June 30, 2016 16
PROPERTY AND CASUALTY INSURANCE – SEGMENT RESULTS
For the three-month periods For the six-month periods
(in millions of dollars and as a percentage) ended ended
June 30, 2016 March 31, 2016 June 30, 2015 June 30, 2016 June 30, 2015
Net interest income $ 1 $ - $ - $ 1 $ -
Net premiums 797 783 785 1,580 1,723
Other operating income 42 43 (12) 85 64
Operating income 840 826 773 1,666 1,787
Investment income 121 79 14 200 200
Total income 961 905 787 1,866 1,987
Claims, benefits, annuities and changes in insurance
contract liabilities 569 584 236 1,153 1,092
Non-interest expense 326 269 293 595 553
Income taxes on surplus earnings 17 13 64 30 72
Net surplus earnings for the period $ 49 $ 39 $ 194 $ 88 $ 270
Gain as at the acquisition date of State Farm's
Canadian operations(1) - - - - (55)
Expenses related to the acquisition of State Farm's
Canadian operations net of income taxes(1) 10 7 11 17 18
Adjusted net surplus earnings for the period(1) $ 59 $ 46 $ 205 $ 105 $ 233
According to net surplus earnings for the period:
Group’s share $ 39 $ 30 $ 169 $ 69 $ 232
Non-controlling interests’ share 10 9 25 19 38
Indicators
Gross written premiums(1)(2) $ 1,357 $ 1,100 $ 1,196 $ 2,458 $ 2,147
Loss ratio(1) 67.4% 74.1% 43.0% 70.7% 62.8%
Expense ratio(1) 31.6 27.6 29.8 29.6 25.4
Adjusted expense ratio(1) 29.8 26.2 27.8 28.0 24.0
Combined ratio(1) 99.0 101.7 72.8 100.3 88.2
Adjusted combined ratio(1) 97.2 100.3 70.8 98.7 86.8(1)
See "Basis of presentation of financial information".(2)
Includes Western Financial Group Inc. life insurance premiums.
Comparison of the second quarters of 2016 and 2015
For the second quarter of 2016, the Property and Casualty Insurance segment’s net surplus earnings totalled $49 million, down $145 million, or 74.7%,compared to the second quarter of 2015. The adjusted net surplus earnings stood at $59 million, down $146 million, or 71.2%. Surplus earnings for thesecond quarter of 2015 were affected by an especially favourable claims experience that had improved the loss ratio of P&C insurance to a historic low of43.0%, whereas it was 67.4% in the second quarter of 2016.
Operating income totalled $840 million, up $67 million, or 8.7%, including an increase of $12 million, or 1.5%, in net premiums compared to the secondquarter of 2015. This increase was mainly due to the reinsurance treaty signed as part of the acquisition of State Farm’s Canadian operations, whichprovides for the cession, scaled down over a five-year term, of the premiums and claims on new business and renewals after the acquisition date. To alesser extent, the increase was also due to the larger number of policies issued as a result of multiple growth initiatives across all market segments andregions. The increase in premiums was partly offset, however, by a decrease in net premiums after unearned premiums transferred at the acquisition ofState Farm’s Canadian operations (which had generated significant income in the second quarter of 2015) were taken over as at January 1, 2015.
Other operating income was up $54 million, chiefly as a result of the smaller increase in the contingent consideration payable, compared to the secondquarter of 2015, because of favourable developments in the claims taken over as part of the acquisition of State Farm’s Canadian operations.
Investment income was up $107 million, compared to the same period in 2015, mainly due to an increase in the fair value of bonds arising from lowerinterest rates on the markets, while a significant decrease had been recorded for the second quarter of 2015. It should be remembered that this increasein the value of bonds was offset by a similar increase in the cost of claims because of a matching strategy.
The segment’s total income rose to $961 million for the second quarter of 2016, up $174 million, or 22.1%, compared to the second quarter of 2015.
The Property and Casualty Insurance segment’s cost of claims was $569 million for the second quarter, for an increase of $333 million, or 141.1%,compared to the second quarter of 2015. The increase was mainly due to significant favourable developments, in the second quarter of 2015, ofautomobile insurance claims from previous years taken over from State Farm as at January 1, 2015. In addition, the lower discount rates used to measurethe provision for claims helped to increase the cost of claims, whereas an increase in discount rates had had the opposite effect in the same period in2015. The loss ratio of the P&C insurers was 67.4% for the second quarter of 2016, compared to 43.0% in the corresponding quarter of 2015. Theincrease was due to a higher claims experience in automobile insurance as a result of favourable developments in claims from previous years and thehigher claims experience for the current period than in the second quarter of 2015. Home insurance claims were also higher than in the correspondingquarter of 2015, mainly because of damage related to the Fort McMurray wildfire.
Non-interest expense was $326 million for the second quarter of 2016, up $33 million, or 11.3%, compared to the same quarter a year earlier. If expensesrelated to the acquisition of State Farm’s Canadian operations are excluded, non-interest expense was $313 million, up $35 million, or 12.6%. This lastincrease is primarily due to organic business growth.

DESJARDINS GROUP INTERIM FINANCIAL REPORT
Second quarter – June 30, 2016 17
Comparison of the first six months of 2016 and 2015
For the first six months of 2016, the Property and Casualty Insurance segment’s net surplus earnings totalled $88 million, down $182 million, or 67.4%,compared to the first half of 2015. The adjusted net surplus earnings stood at $105 million, down $128 million, or 54.9%. This decrease in surplus earningswas mainly due to the higher claims experience in 2016, and the gain on the acquisition of State Farm’s Canadian operations in the first half of 2015.
Operating income totalled $1,666 million, down $121 million, or 6.8%, mainly due to the decrease in net premiums after unearned premiums transferred atthe acquisition of State Farm’s Canadian operations (which had generated significant income in the first half of 2015) were taken over as atJanuary 1, 2015. This impact was also reflected in the cost of claims. The decrease in net premium income was offset by business growth and thereinsurance treaty signed as part of the acquisition of State Farm’s Canadian operations. The treaty provides for the cession, scaled down over a five-yearterm, of the premiums and claims on new business and renewals after the acquisition date.
Other operating income was up $21 million, or 32.8%, chiefly as a result of the smaller increase in the contingent consideration payable, compared to thefirst half of 2015, because of favourable developments in the claims taken over as part of the acquisition of State Farm’s Canadian operations. Thisincrease was partially offset by the gain recognized as at the acquisition date of State Farm’s Canadian operations in the first half of 2015.
Investment income remained stable, compared to the same period in 2015.
The segment’s total income rose to $1,866 million for the first six months of 2016, down $121 million, or 6.1%, compared to the first half of 2015.
The Property and Casualty Insurance segment’s cost of claims was $1,153 million for the first half of 2016, up $61 million, or 5.6%, compared to the firstsix months of 2015. The increase was mainly due to a higher claims experience in automobile insurance for the corresponding six months in 2015. Theloss ratio of the P&C insurers was 70.7% for the first half of 2016, compared to 62.8% in the corresponding six months of 2015. This increase was due to ahigher claims experience in automobile insurance arising from favourable developments in claims from previous years and a higher claims experience forthe current period than in the first half of 2015.
Non-interest expense was $595 million for the first half of 2016, up $42 million, or 7.6%, compared to the same period a year earlier. If expenses related tothe acquisition of State Farm’s Canadian operations are excluded, non-interest expense was $572 million, up $43 million, or 8.1%. This last increase isprimarily due to organic business growth.
OTHER CATEGORY
The Other category includes financial information that is not specific to a business segment. It mainly includes treasury activities related to Caisse centraleDesjardins’s operations and financial intermediation between the caisses’ liquidity surpluses and needs. This category also includes the results for thesupport functions provided by the Federation to Desjardins Group as a whole, the operations of Capital Desjardins inc. and Fonds de sécurité Desjardins,as well as the activities related to asset-backed term notes (ABTN) held by Desjardins Group. It further includes Desjardins Technology Group Inc., whichencompasses all of Desjardins Group’s IT operations. In addition to various adjustments required to prepare the Interim Combined Financial Statements,this category also contains the intersegment balance eliminations.
Desjardins Group does not consider an item-by-item comparative analysis of the operations in this category to be relevant given the integration of variousconsolidation adjustments and intersegment balance eliminations. Consequently, Desjardins Group presents an analysis of these operations based ontheir contribution to surplus earnings before member dividends.
OTHER CATEGORYFor the three-month periods For the six-month periods
(in millions of dollars) ended ended
June 30, 2016 March 31, 2016 June 30, 2015 June 30, 2016 June 30, 2015
Treasury activities $ 49 $ 42 $ 39 $ 91 $ 103
Fonds de sécurité Desjardins operations 25 22 18 47 35
Activities related to asset-backed term notes 3 3 3 6 25
Activities related to derivatives associated withhedging activities (4) (2) (13) (6) 20
Other(1) (45) (30) (46) (75) (88)
Net surplus earnings for the period $ 28 $ 35 $ 1 $ 63 $ 95
Of which:
Group's share $ 26 $ 35 $ - $ 61 $ 93
Non-controlling interests' share 2 - 1 2 2(1)
Includes support function activities, various adjustments required to prepare the Interim Combined Financial Statements, and intersegment balance eliminations.

DESJARDINS GROUP INTERIM FINANCIAL REPORT
Second quarter – June 30, 2016 18
Contribution to surplus earnings
Comparison of the second quarters of 2016 and 2015
Net surplus earnings for the period arising from operations grouped under the Other category totalled $28 million for the second quarter of 2016,compared to $1 million for the corresponding period in 2015.
Treasury activities contributed $49 million to surplus earnings, up $10 million, due mainly to higher income generated by asset/liability matchingmanagement activities as well as trading activities. This increase was mitigated by the unfavourable effect of fluctuations in spreads between Europeanand Canadian interest rate curves on the portion of derivative financial instruments not qualifying for hedge accounting used to hedge foreign currencydeposits. Higher fees on project-related outsourcing agreements also helped to partially offset this increase.
The operations of Fonds de sécurité Desjardins contributed surplus earnings of $25 million, compared to $18 million in the corresponding period of 2015.This increase was due to the higher gains on the disposal of available-for-sale securities in 2016, compared to 2015.
Surplus earnings arising from ABTN activities totalled $3 million, unchanged from the corresponding period in 2015.
Activities related to derivatives associated with hedging activities recorded a deficit of $4 million, compared to a deficit of $13 million for the correspondingperiod in 2015, for an improvement of $9 million, mainly as a result of an increase in the fair value of swaps related to the lower interest rates in thesecond quarter of 2016, compared to the corresponding period in 2015. The improvement was partially offset by a decrease in amortization related toterminations of hedges and a reduction in the portion not qualifying for hedge accounting.
Other activities were affected in 2016 and 2015, primarily by the expenses related to the continued implementation of Desjardins-wide strategic projects.Projects such as the Desjardins Member Advantages program and the accelerated transformation of the caisse network aim to enhance the products andservices offered to members and clients by better meeting their needs, at the best price.
Comparison of the first six months of 2016 and 2015
Net surplus earnings for the period arising from operations grouped under the Other category totalled $63 million for the first half of 2016, compared to$95 million for the corresponding period in 2015.
Treasury activities contributed $91 million to surplus earnings, for a decrease of $12 million, due mainly to the unfavourable effect of fluctuations inspreads between European and Canadian interest rate curves on the portion of derivative financial instruments not qualifying for hedge accounting used tohedge foreign currency deposits, and to the higher fees on project-related outsourcing agreements. This was partially offset by higher income generatedby asset/liability matching management activities as well as trading activities.
The operations of Fonds de sécurité Desjardins contributed surplus earnings of $47 million, compared to $35 million in the corresponding period of 2015.This increase was due to the higher gains on the disposal of available-for-sale securities in 2016, compared to 2015.
Surplus earnings arising from ABTN activities totalled $6 million, down $19 million compared to the corresponding period in 2015 as a result of theincrease in the fair value of the ABTN portfolio, net of hedging positions, which was lower in 2016 than in 2015. Desjardins Group’s exposure with regardto these activities is decreasing.
Activities related to derivatives associated with hedging activities recorded a deficit of $6 million, compared to a surplus of $20 million for thecorresponding period in 2015, for a decrease of $26 million, mainly as a result of the reduction in the portion not qualifying for hedge accounting and in theamortization related to terminations of hedges.
Other activities were affected in 2016 and 2015, primarily by the expenses related to the continued implementation of Desjardins-wide strategic projects.Projects such as the Desjardins Member Advantages program and the accelerated transformation of the caisse network aim to enhance the products andservices offered to members and clients by better meeting their needs, at the best price.

DESJARDINS GROUP INTERIM FINANCIAL REPORT
Second quarter – June 30, 2016 19
SUMMARY OF INTERIM RESULTS
The table below presents a summary of data related to the results for Desjardins Group’s most recent eight quarters.
RESULTS OF THE MOST RECENT EIGHT QUARTERS
(in millions of dollars) 2016 2015 2014
Q2 Q1(1) Q4(1) Q3(1) Q2(1) Q1(1) Q4 Q3
Net interest income $ 1,053 $ 1,049 $ 1,107 $ 1,094 $ 1,057 $ 995 $ 1,021 $ 1,013
Net premiums 1,740 1,721 1,641 1,692 1,698 1,876 1,480 1,496
Other operating income
Deposit and payment service charges 119 118 124 125 122 118 127 128
Lending fees and credit card service revenues 155 168 161 149 156 154 157 147
Brokerage and investment fund services 286 260 263 255 267 252 239 252
Management and custodial service fees 92 88 67 90 95 89 95 88
Foreign exchange income 22 16 21 20 21 26 22 24
Other 46 65 56 7 12 90 84 52
Operating income 3,513 3,485 3,440 3,432 3,428 3,600 3,225 3,200
Investment income (loss)
Net income (loss) on securities at fair value through
profit or loss 878 512 230 17 (612) 1,174 686 288
Net income on available-for-sale securities 99 79 72 34 107 105 83 36
Net other investment income 50 50 48 51 92 44 36 71
1,027 641 350 102 (413) 1,323 805 395
Total income 4,540 4,126 3,790 3,534 3,015 4,923 4,030 3,595
Provision for credit losses 75 91 83 102 103 89 68 109
Claims, benefits, annuities and changes in insurance
contract liabilities 2,065 1,758 1,350 1,246 332 2,503 1,760 1,369
Non-interest expense 1,865 1,787 1,782 1,668 1,781 1,748 1,745 1,582
Income taxes on surplus earnings 108 108 113 114 170 119 103 126
Surplus earnings before member dividends 427 382 462 404 629 464 354 409
Member dividends, net of income tax recovery 16 22 33 26 24 30 5 49
Surplus earnings for the period after member dividends $ 411 $ 360 $ 429 $ 378 $ 605 $ 434 $ 349 $ 360
Of which:
Group’s share $ 390 $ 339 $ 373 $ 361 $ 531 $ 409 $ 326 $ 348
Non-controlling interests’ share 21 21 56 17 74 25 23 12(1)
Prior-period data have been reclassified to reflect the current period's presentation.
Quarterly income, expenses and surplus earnings before member dividends fluctuate based on certain trends, including seasonal variations and changesin general economic and market conditions. For more information about quarterly trends, see page 50 of the 2015 Annual Report.

DESJARDINS GROUP INTERIM FINANCIAL REPORT
Second quarter – June 30, 2016 20
BALANCE SHEET REVIEW
BALANCE SHEET MANAGEMENT
COMBINED BALANCE SHEETS
(in millions of dollars and as a percentage) As at June 30, 2016 As at December 31, 2015
Assets
Cash and deposits with financial institutions $ 2,183 0.8% $ 1,716 0.7%
Securities 56,213 21.6 51,987 21.0
Securities borrowed or purchased under reverse repurchase agreements 10,362 4.0 7,881 3.2
Net loans and acceptances 162,733 62.4 159,881 64.4
Segregated fund net assets 10,255 3.9 9,781 3.9
Derivative financial instruments 3,919 1.5 4,818 1.9
Other assets 15,046 5.8 12,064 4.9
Total assets $ 260,711 100.0% $ 248,128 100.0%
Liabilities and equity
Deposits $ 163,662 62.8% $ 156,574 63.0%
Commitments related to securities sold short 6,945 2.7 5,464 2.2
Commitments related to securities lent or sold under repurchase agreements 10,601 4.1 10,383 4.2
Derivative financial instruments 1,889 0.7 1,689 0.7
Insurance contract liabilities 28,371 10.9 26,734 10.8
Segregated fund net liabilities 10,247 3.9 9,776 3.9
Other liabilities 15,595 6.0 13,899 5.6
Subordinated notes 1,384 0.5 1,884 0.8
Equity 22,017 8.4 21,725 8.8
Total liabilities and equity $ 260,711 100.0% $ 248,128 100.0%
TOTAL ASSETS
As at June 30, 2016, Desjardins Group’s total assets stood at $260.7 billion, up by $12.6 billion, or 5.1%, since December 31, 2015. This growth wasmainly attributable to a $6.7 billion increase in securities and $2.9 billion growth in the loans and acceptances portfolio.
CASH AND DEPOSITS WITH FINANCIAL INSTITUTIONS, AND SECURITIES
As at June 30, 2016, Desjardins Group’s cash and deposits with financial institutions amounted to $2.2 billion, an increase of $467 million, or 27.2%, sinceDecember 31, 2015. The volume of securities, including securities borrowed or purchased under reverse repurchase agreements, was up $6.7 billion, or11.2%, to total $66.6 billion as at June 30, 2016. The increase was due to growth in market activities and deposits.
LOANS AND ACCEPTANCES
(in millions of dollars and as a percentage) As at June 30, 2016 As at December 31, 2015
Residential mortgages $ 104,977 64.3% $ 102,323 63.8%
Consumer, credit card and other personal loans 21,486 13.2 21,204 13.2
Business and government 36,729 22.5 36,809 23.0
163,192 100.0% 160,336 100.0%
Allowance for credit losses (459) (455)
Total loans and acceptances by borrower category $ 162,733 $ 159,881
Loans guaranteed and/or insured(1) $ 44,397 $ 44,817(1) Loans fully or partially guaranteed or insured by a public or private insurer or a government.
As at June 30, 2016, Desjardins Group’s outstanding loan portfolio, including acceptances, net of the allowance for credit losses, was $162.7 billion, anincrease of $2.9 billion, or 1.8%, since December 31, 2015. This increase was due to residential mortgages, which represented 64.3% of its portfolio forthe second quarter.
Outstanding residential mortgages stood at $105.0 billion as at June 30, 2016, up $2.7 billion, or 2.6%, since December 31, 2015. These resultsdemonstrate Desjardins’s dynamic presence in the Quebec and Ontario housing markets. The good performance of home resales created a favourableenvironment for business development.

DESJARDINS GROUP INTERIM FINANCIAL REPORT
Second quarter – June 30, 2016 21
Consumer, credit card and other personal loans outstanding amounted to $21.5 billion as at June 30, 2016, up $282 million, or 1.3%, sinceDecember 31, 2015. Outstanding business and government loans, including acceptances, totalled $36.7 billion as at June 30, 2016, a slight decrease of$80 million, or 0.2%, during the same period.
Credit quality
Information about the quality of Desjardins Group’s loan portfolio is presented in the “Risk management” section on page 28 of this MD&A.
DEPOSITS
(in millions of dollars and as a percentage) As at June 30, 2016 As at December 31, 2015
Individuals $ 93,588 57.2% $ 91,243 58.2%
Business and government 68,055 41.6 63,833 40.8
Deposit-taking institutions and other 2,019 1.2 1,498 1.0
Total deposits $ 163,662 100.0% $ 156,574 100.0%
As at June 30, 2016, Desjardins Group’s outstanding deposits totalled $163.7 billion, up by $7.1 billion, or 4.5%, since December 31, 2015. Deposits frombusinesses and governments, which comprised 41.6% of this portfolio, were mainly responsible for its growth. They grew by $4.2 billion, or 6.6%, duringthe same period, to total $68.1 billion as at June 30, 2016, particularly because of the various issuances made on the U.S., Canadian and Europeanmarkets, which supported the growth in Desjardins Group’s funding requirements.
Outstanding deposits from individuals, which accounted for 57.2% of the total deposit portfolio, totalled $93.6 billion as at June 30, 2016, for an increase of$2.3 billion, or 2.6%, during the same period. Lastly, savings from deposit-taking institutions and other sources totalled $2.0 billion as at June 30, 2016, up$521 million, or 34.8%, during the same period.
EQUITY
As at June 30, 2016, equity totalled $22.0 billion, up $292 million, or 1.3%, since the prior year-end. Net surplus earnings after member dividends, totalling$771 million for the first half of 2016 and partially offset by the remeasurement of net defined benefit plan liabilities, were the primary source of this growth.
Note 21, “Capital stock”, to the Annual Combined Financial Statements provides additional information about Desjardins Group’s capital stock.
CAPITAL MANAGEMENT
Capital management is crucial to the financial management of Desjardins Group. Its goal is to ensure that the capital level and structure of DesjardinsGroup and its components are consistent with their risk profile, distinctive nature and cooperative objectives. Capital management must also ensure thatthe capital structure is adequate in terms of protection for members and clients, profitability targets, growth objectives, rating agencies’ expectations andregulators’ requirements. In addition, it must optimize the allocation of capital and internal capital flow mechanisms, and support growth, development andasset risk management at Desjardins Group.
Desjardins Group advocates prudent management of its capital. Its purpose is to maintain higher regulatory capital ratios than those of the Canadianbanking industry and regulatory requirements. Desjardins’s prudent capital management is reflected in the quality of the credit ratings assigned by thevarious rating agencies.
The global financial crisis prompted the industry to place more emphasis on sound capitalization of its operations. Now more than ever, rating agenciesand the market favour the best-capitalized institutions. These factors argue in favour of a general increase in the level and quality of capital issued byfinancial institutions. This is also reflected in the enhanced requirements under Basel III implemented on January 1, 2013. It was against this backdrop thatDesjardins Group set its target for Tier 1A and Tier 1 capital at 15%.
Desjardins Group’s Integrated Capital Management Framework
Broadly speaking, Desjardins Group’s Integrated Capital Management Framework includes the policies and processes required to set targets for itscapitalization and to assign targets to its components, to establish strategies to ensure that targets are met, to quickly raise capital, to ensure that thecomponents’ performance is appropriately measured, and to optimize internal capital flow and use mechanisms.
Desjardins Group has developed a stress-testing program aimed at establishing and measuring the effect of various integrated scenarios, i.e. to simulatevarious economic scenarios for all of its components and to assess their financial and regulatory repercussions. This procedure makes it possible todetermine if the minimum capital target, as established in the capitalization plan, is adequate in view of the risks to which Desjardins Group is exposed.
Regulatory framework and internal policies
Desjardins Group’s capital management is the responsibility of the Federation’s Board of Directors. To support it with this task, it has mandated theFinance and Risk Management Committee to ensure that Desjardins Group has a sufficient and reliable capital base. The Finance, Treasury andAdministration Executive Division is responsible for preparing, on an annual basis and with the help of Desjardins Group’s components, a capitalizationplan to forecast capital trends, devise strategies and recommend action plans for achieving capital objectives and targets.
The current situation and the forecasts show that overall, Desjardins Group has a solid capital base that maintains it among the best-capitalized financialinstitutions.

DESJARDINS GROUP INTERIM FINANCIAL REPORT
Second quarter – June 30, 2016 22
Desjardins Group’s regulatory capital ratios are calculated according to the AMF’s guideline on adequacy of capital base standards applicable to financialservices cooperatives (the guideline). This guideline takes into account the global regulatory framework for more resilient banks and banking systems(Basel III) issued by the Bank for International Settlements.
Regulatory authorities require that a minimum amount of capital be maintained on a combined basis by all the Desjardins Group components, mainly thecaisses, the Federation (non-consolidated), Caisse centrale Desjardins, Fonds de sécurité Desjardins, Capital Desjardins inc., Zag Bank, DesjardinsSecurities Inc. and Desjardins Trust Inc.
This capital takes into consideration investments made in other Desjardins Group components. Some of these components are subject to separaterequirements regarding regulatory capital, liquidity and financing, which are set by regulatory authorities governing banks and securities, in particular.Desjardins Group oversees and manages the capital requirements of these entities to ensure efficient use of capital and continuous compliance with theapplicable regulation.
For the purpose of calculating capital, Desjardins Financial Corporation Inc., the holding corporation that mainly includes the insurance subsidiaries, hasbeen deconsolidated and presented as a capital deduction. Desjardins Financial Corporation Inc. is subject to the AMF’s Capital Adequacy RequirementsGuideline — Life and Health Insurance.
As well, certain Desjardins Group subsidiaries, including the insurance companies, are subject to regulatory requirements from the AMF or otherregulators. Most of these subsidiaries must comply with minimum capital requirements that could limit Desjardins Group’s ability to allocate part of thiscapital or these funds to other purposes.
Basel III
The Basel III regulatory framework increases capital requirements. Even though the Basel III regulatory framework provides for a transitional period from2013 to 2019 to mitigate the impact of the new capitalization rules, the AMF required Desjardins Group to meet the Tier 1A capital ratio requirements for2019 in the first quarter of 2013. For the Tier 1 and total capital ratios, the AMF required Desjardins Group to meet the levels established for 2019 in thefirst quarter of 2014. The AMF may also set higher target ratios at its discretion when circumstances warrant.
In June 2013, the AMF determined that Desjardins Group met the criteria to be designated a domestic systemically important financial institution (D-SIFI).As such, Desjardins Group has been subject since January 1, 2016, to an additional capital requirement of 1% of its minimum capital ratios. The OSFI hasalso determined that the six largest Canadian financial institutions meet the criteria to be designated D-SIFIs.
The table below presents a summary of the target regulatory ratios set by the AMF under Basel III.
SUMMARY OF RATIOS REGULATED BY THE AMF UNDER BASEL III(1)(2)
Minimum ratio
Capitalconservation
buffer
Minimum ratioincluding capital
conservation buffer
Supplementapplying to
D-SIFIs(3)
Minimum ratioincluding capital
conservation bufferand supplement
applying to D-SIFIs
Capital andleverage ratio asat June 30, 2016
Tier 1A capital > 4.5% 2.5% > 7.0% 1.0% > 8.0% 15.9%
Tier 1 capital > 6.0 2.5 > 8.5 1.0 > 9.5 15.9
Total capital > 8.0 2.5 > 10.5 1.0 > 11.5 16.6
Leverage ratio > 3.0 N/A > 3.0 N/A > 3.0 7.5(1) The capital ratios are expressed as a percentage of regulatory capital to risk-weighted assets in the guideline.(2) The leverage ratio is calculated according to the general instructions on Leverage Ratio Disclosure Requirements (Basel III) issued by the AMF and is defined as
the capital measure (namely Tier 1 capital) divided by the exposure measure. The exposure measure includes: 1) on-balance sheet exposures, 2) securitiesfinancing transaction exposures, 3) derivative exposures, and 4) other off-balance sheet exposures.
(3) In effect since January 1, 2016.
Future regulatory developments
Desjardins Group continues to monitor changes in capital requirements under the global standards developed by the Basel Committee on BankingSupervision (BCBS).
In this regard, the BCBS issued two consultative documents in December 2014 entitled “Capital floors: the design of a framework based on standardisedapproaches” and “Revisions to the standardized approach for credit risk”, the latter document having been revised a second time in December 2015. Thecapital floor is meant to mitigate the risk related to internal models for calculating credit risk and to enhance the comparability of risk across financialinstitutions. The new floor would replace the existing one based on the Basel I framework. The new standardized approach for credit risk seeks to reducereliance on rating agencies and enhance sensitivity to certain risks.
In July 2015, the BCBS issued a consultative document on the review of the credit valuation adjustment (CVA) framework, as defined in the currentBasel III capital standards for the treatment of counterparty credit risk. The revised framework proposes to make capital standards more compatible withthe fair value measurement method for the CVA charge included in a number of accounting frameworks, and the proposed revision of the market riskframework according to the study entitled “Fundamental Review of the Trading Book”.
On January 14, 2016, the BCBS issued a revised version of the minimum capital requirements for market risk. The objective of the revised framework is toarrange that, for the treatment of market risk, the Standardized Approach and the Internal Ratings-Based Approach produce credible results regarding thecapital base and promote the harmonious implementation of standards in all jurisdictions. The BCBS will require financial institutions to present informationaccording to the new standards by the end of 2019. The AMF has not established a timetable for this yet.

DESJARDINS GROUP INTERIM FINANCIAL REPORT
Second quarter – June 30, 2016 23
On March 4, 2016, the BCBS filed a consultative document that proposed a new approach to calculating regulatory capital for operational risk called the“Standardised Measurement Approach for operational risk”. This new approach would replace the Standardized Approach currently described in theguidelines, thus scrapping the Advanced Measurement Approach.
On March 24, 2016, the BCBS issued a document on the review of internal ratings-based approaches. The objective is to better regulate the use of theseapproaches by removing the option to use them for certain portfolios, by setting up thresholds for certain risk parameters and by further regulating themodelling of parameters of certain portfolios eligible for internal ratings with a view to reducing volatility.
On April 6, 2016, the BCBS released a consultative document on revisions to the Basel III leverage ratio framework and reaffirmed the minimumregulatory requirement of 3%. However, it is examining the possibility of imposing higher requirements for global systemically important banks. Thesehigher requirements would not apply to Desjardins Group.
On April 21, 2016, the BCBS issued a document entitled “Interest rate risk in the banking book”, intended as an update of the document issued in 2004,“Principles for the management and supervision of interest rate risk”, dealing with risk management, the treatment of capital and supervision of interestrate risk in the banking book. Its aim is to ensure that financial institutions have appropriate capital to cover potential losses in the banking book stemmingfrom interest rate fluctuations and thereby limit capital arbitrage between the trading book and the banking book. Application is required as of 2018.
Compliance with requirements
As at June 30, 2016, the Tier 1A, Tier 1 and total capital ratios of Desjardins Group, calculated in accordance with Basel III requirements, were 15.9%,15.9% and 16.6%, respectively. The leverage ratio was 7.5%. Desjardins Group therefore has very good capitalization, with a Tier 1A capital ratio abovethe 15% target.
Desjardins Group and all its components that are subject to minimum regulatory requirements with respect to capitalization were in compliance with saidrequirements as at June 30, 2016.
Regulatory capital
The following tables present Desjardins Group’s main capital components, capital balances, risk-weighted assets, capital ratios, and movements in capitalduring the period.
MAIN CAPITAL COMPONENTS
Total capital
Tier 1 capitalTier 2 capital
Tier 1A Tier 1B
Eligible items > Reserves and undistributed surplus > Non-controlling interests(1) > Eligible collective allowance
earnings > Subordinated notes subject to phase-out
> Eligible accumulated other comprehensive > Eligible qualifying shares
income > Non-controlling interests(1)
> Federation's capital shares
> Permanent shares and surplus shares
subject to phase-out
> Non-controlling interests(1)
Regulatory > Goodwill
adjustments > Software
> Other intangible assets
> Deferred tax assets essentially resulting
from loss carryforwards
> Shortfall in allowance
Deductions > Mainly significant investments in financial > Investment in preferred shares of a
entities(2) component deconsolidated for
regulatory capital purposes
> Subordinated financial instrument
(1) The amount of non-controlling interests allocated to the various capital tiers is determined, in particular, based on the nature of the operations and the capitalizationlevel of the investee.
(2) Represents the portion of investments in the components deconsolidated for regulatory capital purposes (mainly Desjardins Financial Corporation Inc.) that exceeds10% of capital net of regulatory adjustments. In addition, when the non-deducted balance, plus deferred tax assets net of corresponding deferred tax liabilities, exceeds
15% of the adjusted capital, the surplus is also deducted from Tier 1A capital. The net non-deducted balance will be subject to risk-weighting at a rate of 250%.

DESJARDINS GROUP INTERIM FINANCIAL REPORT
Second quarter – June 30, 2016 24
CAPITAL, RISK-WEIGHTED ASSETS AND CAPITAL RATIOS
(in millions of dollars and as a percentage) As at June 30, 2016 As at December 31, 2015
Capital
Tier 1A capital $ 17,397 $ 17,354
Tier 1 capital 17,414 17,371
Total capital 18,230 18,700
Risk-weighted assets
Credit risk $ 76,522 $ 74,845
Market risk 2,318 2,157
Operational risk 13,215 13,032
Total risk-weighted assets before the threshold $ 92,055 $ 90,034
Risk-weighted assets (RWA) after transitional provisions for the credit
valuation adjustment (CVA) charge(1)
RWA for Tier 1A capital $ 91,731 $ 89,706
RWA for Tier 1 capital 91,794 89,769
RWA for total capital 91,848 89,824
Transitional threshold adjustment(1)(2) $ 17,955 $ 18,778
Total risk-weighted assets $ 109,686 $ 108,484
Ratios and leverage ratio exposure
Tier 1A capital 15.9% 16.0%
Tier 1 capital 15.9 16.0
Total capital 16.6 17.2
Leverage 7.5 7.8
Leverage ratio exposure $ 218,125 $ 222,825(1)
As prescribed in Section 1.6 of the AMF guideline. The threshold was presented to account for RWA after the transitional provisions for the CVA charge for capital.(2)
The scaling factors used since January 1, 2014 to account for the requirements for the CVA charge are being phased in to calculate the Tier 1A, Tier 1 and total capitalratios, which are 64%, 71% and 77%, respectively, as in 2015. They will reach 100% for each capital category by 2019.
In compliance with Basel III requirements, capital instruments that no longer meet the eligibility criteria for capital tiers have been excluded from themeffective January 1, 2013. However, in accordance with the transitional provisions set out in the guideline, instruments that meet certain conditions arebeing phased out from capital at an annual rate of 10% over a nine-year period that began on January 1, 2013. These instruments include permanentshares and surplus shares issued before September 12, 2010, which total $2.1 billion.
In addition, the subordinated notes issued by Capital Desjardins inc. are also subject to the 10% amortization. In order to be fully eligible for Tier 2 capital,such notes must meet Non-Viability Contingent Capital (NVCC) requirements. Discussions concerning the application of these requirements tocooperative entities are still in progress at the international level. Desjardins Group does not plan to issue any financial instruments of this type until theserequirements have been further clarified.
On December 18, 2015, the Federation filed a prospectus to issue additional capital shares totalling $500 million. This new issue started onJanuary 25, 2016. During the first six months of 2016, the Federation issued capital shares for gross proceeds of $426 million compared to $762 million forthe same period in 2015, including $100 million in interest paid when the holder elected to receive the remuneration in F capital shares.
On June 1, 2016, Capital Desjardins inc. called all Series F senior notes for early redemption, in the amount of $500 million.
As at June 30, 2016, the Tier 1A capital ratio was down slightly by 14 basis points compared to 2015, essentially because of growth in risk-weightedassets.

DESJARDINS GROUP INTERIM FINANCIAL REPORT
Second quarter – June 30, 2016 25
CHANGE IN REGULATORY CAPITALFor the six-month period ended
(in millions of dollars) June 30, 2016
Tier 1A capital
Balance at beginning of period $ 17,354
Increase in reserves and undistributed surplus earnings(1) 395
Eligible accumulated other comprehensive income 136
Federation's capital shares(2) 425
Permanent shares and surplus shares subject to phase-out (277)
Non-controlling interests -
Deductions (636)
Balance at end of period 17,397
Tier 1B capital
Balance at beginning of period 17
Non-controlling interests -
Balance at end of period 17
Total Tier 1 capital 17,414
Tier 2 capital
Balance at beginning of period 1,329
Eligible qualifying shares (1)
Non-controlling interests 1
Senior notes subject to phase-out (501)
Eligible collective allowance (12)
Deductions -
Balance at end of period 816
Total capital $ 18,230(1) Including the change in defined benefit pension plan liabilities.(2)
Amount net of issuance expenses.
Risk-weighted assets (RWA)
Desjardins Group calculates the risk-weighted assets for credit risk, market risk and operational risk. Since March 2009, Desjardins has been using theInternal Ratings-Based Approach for credit risk related to retail loan portfolios − Personal. Other exposures to credit and market risk are measured according to the Standardized Approach, while operational risk is calculated based on the Basic Indicator Approach. In addition, Desjardins Group issubject to a threshold defined under Basel I, where the threshold is determined by the difference between the minimum regulatory capital requirement inaccordance with the rules of the last version of the AMF guideline based on Basel I and the minimum regulatory capital requirement calculated underBasel III.
For credit risk, movements in RWA during the second quarter of 2016 are presented as two separate items, namely credit risk, and then counterparty andissuer risk. In credit risk, the main fluctuations were due to changes in the portfolio’s size, resulting in a $0.7 billion increase. An improvement in portfolioquality caused a decrease of $0.2 billion. Finally, a change in method and policy led to a drop of $0.1 billion. In counterparty and issuer risk, the qualitydeterioration in the various portfolios subject to counterparty and issuer risk and the higher transaction volume produced an increase of $0.1 billion.
In market risk, a $0.1 billion increase was observed due to a slight change in portfolio quality. A small change was also noted in operational risk, due tofluctuations in income generated, which caused a $0.1 billion increase.
The threshold adjustment as previously defined has decreased by $0.2 billion since March 31, 2016, partially as a result of changes in the portfolio, whichcaused a $0.4 billion reduction in the threshold. The deterioration in portfolio quality and changes in method and policy led to a $0.2 billion increase.
OFF-BALANCE SHEET ARRANGEMENTS
In the normal course of operations, Desjardins Group enters into various off-balance sheet arrangements, including assets under management and underadministration on behalf of its members and clients, credit instruments, contractual commitments, financial assets held as collateral and other, as well asstructured entities, including securitization.
Assets under management and under administration
As at June 30, 2016, Desjardins Group administered and managed, for the account of its members and clients, assets worth $409.9 billion, for an increaseof $6.5 billion, or 1.6%, since December 31, 2015. The financial assets entrusted to Desjardins Group as wealth manager totalled $48.9 billion as atJune 30, 2016, up $2.8 billion, or 6.1%, since December 31, 2015.

DESJARDINS GROUP INTERIM FINANCIAL REPORT
Second quarter – June 30, 2016 26
Structured entities
In the normal course of operations, Desjardins Group enters into various financial transactions with structured entities to diversify its sources of financingand manage its capital. Structured entities are usually created for a unique and distinct purpose, and they frequently have limited activities. Often thestructured entities have insufficient equity to permit them to finance their activities without subordinated financial support, or they often use financing in theform of multiple contractually linked instruments issued to investors. These entities may be included in Desjardins Group’s Combined Balance Sheets if itcontrols them. Detailed information concerning significant exposure to structured entities not included in Desjardins Group’s Combined Balance Sheets isprovided below. Note 13, “Interests in other entities”, to Desjardins Group’s Annual Combined Financial Statements provides more information onstructured entities.
Master Asset Vehicle (MAV) trusts
Desjardins Group holds financial interests in MAV trusts, which are structured entities not included in its Combined Balance Sheets. These trusts carry outtransactions involving synthetic assets, ineligible assets and traditional assets associated with the asset-backed term notes (ABTN) portfolio. DesjardinsGroup entered into several different types of transactions to reduce the risk associated with the ABTN portfolio, the margin funding facility (MFF) related tothe ABTN portfolio and other restructured securities. The implementation of credit index hedges on a significant portion of MAV portfolios, the acquisitionof protection for Desjardins Group’s commitments under the MFF, and the disposal of various restructured portfolios reduced the risk related to theseportfolios very significantly.
These trusts had assets of approximately $6,358 million as at June 30, 2016, compared to $6,392 million as at December 31, 2015, and they had noequity. As at June 30, 2016, Desjardins Group had an MFF of $1,193 million and held notes with a fair value of $806 million, compared to the respectiveamounts of $1,193 million and $801 million as at December 31, 2015. The aggregate of these amounts represents the maximum risk of loss with respectto the MAVs, excluding the effect of the economic hedging strategy. Note 5, “Securities”, to Desjardins Group’s Interim Combined Financial Statementsprovides more information on this subject.
Securitization of Desjardins Group’s financial assets
Desjardins Group participates in the National Housing Act (NHA) Mortgage-Backed Securities Program to manage its liquidities and capital. Transactionscarried out under this Program require the use of a structured entity, the Canada Housing Trust (CHT), set up by Canada Mortgage and HousingCorporation (CMHC) under the Canada Mortgage Bonds (CMB) Program. Note 8, “Derecognition of financial assets”, to the Annual Combined FinancialStatements provides more information about the financial assets transferred by Desjardins Group under securitization transactions. As at June 30, 2016,outstanding mortgage-backed securities issued by Desjardins Group and sold to the CHT totalled $6.3 billion, compared to $6.6 billion as atDecember 31, 2015.
RISK MANAGEMENT
ENHANCED DISCLOSURE TASK FORCE
On October 29, 2012, the Enhanced Disclosure Task Force (EDTF), established by the Financial Stability Board, released its report, “Enhancing the RiskDisclosures of Banks”, in which it issued 32 recommendations aimed at improving risk disclosure and transparency.
Desjardins Group is continuing to develop its external disclosures and is working on enhancing its risk management reporting on an ongoing basis.
Information regarding the EDTF recommendations is presented in the 2015 Annual Report, the interim financial report for the second quarter of 2016 andthe “Supplemental Financial Information” report, which are available on Desjardins Group’s website at www.desjardins.com/en/about_us. The“Supplemental Financial Information” report is not incorporated by reference in this MD&A.

DESJARDINS GROUP INTERIM FINANCIAL REPORT
Second quarter – June 30, 2016 27
Below is a summary of disclosures under the EDTF recommendations and the location of the disclosures:
SUMMARY OF EDTF RECOMMENDATIONS
Pages
Type of risk Disclosure2015
Annual Report
InterimFinancial
Report
SupplementalFinancial
Information
General Summary of risk information 61, 62 Current page
Risk terminology, risk measures and key parameters 62-88, 201-207
Top and emerging risks 55, 63, 64, 68, 78 22, 31, 32
New regulatory ratios 54-57, 78, 79, 170-172 21-25, 31-33 7, 8
Risk governance, riskmanagement and businessmodels
Organizational risk management structure 65-67
Risk management culture 65-67
Risks from business model and risk appetite 23, 63-65, 68
Stress testing 64
Capital adequacy and risk-weighted assets
Minimum regulatory capital requirements 55 22
Reconciliation of the accounting balance sheet and theregulatory balance sheet 56, 57, 170-172 23-25 7, 8, 10-12
Movements in regulatory capital 56, 57 23-25 9
Capital management and planning 54-57 21-25 6
Breakdown of capital requirements by type of risk and bycalculation method 57, 58, 69, 70, 76, 77 30 14
Credit risk 17-22
Movements in risk-weighted assets by type of risk 58, 59 25 15, 16
Back testing and validation of credit models 70
Liquidity Management of liquidity needs and reserve 78-80 31-34
Funding Encumbered and unencumbered assets 81-83, 175-177 34-36
Residual contractual maturities of assets, liabilities andoff-balance sheet commitments 81 34, 35
Funding sources and strategies 53, 54, 78, 81, 82 32, 34-36
Market risk Market risk factors 75-77, 156-160, 178 29-31
Assumptions, limitations and validation procedures formarket risk models 76, 77 30, 31
Extreme loss measures 76, 77 30, 31
Credit risk Credit risk profile 51-53, 64, 70, 74, 75, 89 20, 28 14, 17-25
Policy for identifying gross impaired loans 71, 72, 109-125
Reconciliation of gross impaired loans and allowance forcredit losses
51-53, 70, 73, 74,109-125, 139 20, 28, 56
Counterparty risk related to derivatives 74, 75, 161-166
Credit risk mitigation techniques 71, 74, 75, 161-166 31, 32
Other risks Management of other risks 57, 58, 68, 84-88 25
Publicly known risk events 84, 85, 175-177
RISK MANAGEMENT
Desjardins Group’s objective in risk management is to optimize the risk-return trade-off, within set tolerance limits, by developing and applying integratedrisk management and control strategies, frameworks, practices and procedures to all its operations. To this end, Desjardins developed an Integrated RiskManagement Framework aimed, among other things, at giving its senior management and the Federation’s Board of Directors an appropriate level ofconfidence and comfort regarding the understanding and management of the full spectrum of risks associated with the achievement of its objectives.
Desjardins Group is exposed to different types of risk in its normal course of operations, including credit risk, market risk, liquidity risk, operational risk,insurance risk, strategic risk, reputational risk, risk related to pension plans, environmental risk and risks related to the regulatory and legal environment.
Strict and effective management of these risks is a priority for Desjardins Group, its purpose being to support its major orientations, particularly regardingits financial stability as well as its sustained and profitable growth, while complying with regulatory requirements. Desjardins Group considers risk aninextricable part of its development, and consequently strives to promote a culture in which each of its business segments, employees and managers isresponsible for risk management.
In the first six months of fiscal 2016, Desjardins Group’s governance structure, frameworks and practices for risk management, and the nature anddescription of the risks to which it is exposed (including insurance risk, strategic risk, reputational risk, risk related to pension plans, environmental risk andrisks related to the regulatory and legal environment) did not change significantly from those described on pages 61 to 89 of the 2015 Annual Report.
Risk disclosure developments will be further promoted so as to comply, in coming years, with the principles of effective risk data aggregation and riskreporting (RDARR), which will strengthen risk governance as well as risk data aggregation and risk reporting capabilities, given Desjardins Group’sdesignation as a domestic systemically important financial institution (D-SIFI).

DESJARDINS GROUP INTERIM FINANCIAL REPORT
Second quarter – June 30, 2016 28
CREDIT RISK
Credit risk is the risk of losses resulting from a borrower’s, guarantor’s, issuer’s or counterparty’s failure to honour its contractual obligations, whether ornot such obligations appear on the Combined Balance Sheets.
Desjardins Group is exposed to credit risk first through its direct personal, business and government loans. It is also exposed through various othercommitments, including letters of credit and transactions involving derivative financial instruments and securities.
Quality of loan portfolio
As at June 30, 2016, gross impaired loans outstanding stood at $567 million, up $26 million since December 31, 2015. The ratio of gross impaired loans,as a percentage of the total gross loan and acceptance portfolio, was 0.35% for the second quarter of 2016, up slightly from 0.34% as atDecember 31, 2015. Desjardins Group’s loan portfolio continues to be of high quality.
Individual allowances for credit losses, which totalled $125 million as at June 30, 2016, made it possible to obtain a total coverage ratio of 22.0% of thegross impaired loans portfolio, compared to a ratio of 22.4% as at December 31, 2015.
The collective allowance stood at $334 million as at June 30, 2016, unchanged since year-end 2015. In addition, an allowance for risk related to off-balance sheet arrangements of $88 million was recognized under “Other liabilities – Other” on the Combined Balance Sheets as at June 30, 2016, down$17 million compared to the amount recorded as at December 31, 2015. The collective allowance reflects the best estimate of the allowance for creditlosses that have not yet been designated as impaired loans individually.
GROSS IMPAIRED LOANS BY BORROWER CATEGORY
(in millions of dollars and as a percentage) As at June 30, 2016 As at December 31, 2015Gross Gross Individual Net Net
loans and impaired allowances for impaired impairedacceptances loans credit losses loans loans
Residential mortgages $ 104,977 $ 199 $ 20 $ 179 $ 164
Consumer, credit card and other personal loans 21,486 93 16 77 81
Business and government 36,729 275 89 186 175
Total $ 163,192 $ 567 $ 125 $ 442 $ 420
As a percentage of gross loans and acceptances 0.35% 0.27% 0.26%
SPECIFIC COVERAGE RATIO
(as a percentage) As at June 30, 2016 As at December 31, 2015
Residential mortgages 10.1% 9.9%
Consumer, credit card and other personal loans 17.2 18.2
Business and government 32.4 32.7
Impaired loan portfolio coverage ratio 22.0 22.4
Counterparty and issuer risk
Counterparty and issuer risk is a credit risk relative to different types of securities, derivative financial instrument and securities lending transactions.
The Desjardins Group Risk Management Executive Division sets the maximum exposure for each counterparty and issuer based on quantitative andqualitative criteria. The amounts are then allocated to different components based on their needs.
A large proportion of Desjardins Group’s exposure is to the different levels of government in Canada, Quebec public and parapublic entities and majorCanadian banks. For most of these counterparties and issuers, the credit rating is A- or higher. Desjardins Group’s exposure to U.S. and Europeanfinancial institutions is low, and its exposure to sovereign debt is concentrated in Canada and the U.S. The situation in Europe needs to be monitoredfollowing the unexpected results of the Brexit vote in the United Kingdom at the end of June. Certain countries in the eurozone could be required torecapitalize their banks because of the deterioration in local economies.
MARKET RISK
Market risk refers to the risk of changes in the fair value of financial instruments resulting from fluctuations in the parameters affecting this value, inparticular, interest rates, exchange rates, credit spreads and their volatility.
Desjardins Group is exposed to market risk primarily through positions taken in the course of its traditional financing and saving recruitment activities. It isalso exposed to market risk through its insurance and trading activities. Desjardins Group and its components have adopted policies that set out theprinciples, limits and procedures to use in managing market risk.
All financial instruments generate a market risk for trading activities, structural interest rate risk management activities and insurance activities. The mainmeasurement for structural interest rate risk management and insurance activities is presented in the “Interest rate sensitivity” table. Aggregate VaR andAggregate VaR under stress conditions presented in the “VaR by risk category” table are primarily used to monitor trading activities. These differentmeasurements are completed by stress testing programs.

DESJARDINS GROUP INTERIM FINANCIAL REPORT
Second quarter – June 30, 2016 29
Structural Interest rate risk management
Desjardins Group is exposed to structural interest rate risk, which represents the potential impact of interest rate fluctuations on net interest income andthe economic value of equity. This risk is the main component of market risk for Desjardins Group’s traditional banking activities other than trading, suchas accepting deposits and granting loans, as well as for its securities portfolios used for long-term investment purposes and as liquidity reserves.
Interest rate sensitivity is based on the earlier of the repricing or the maturity date of the assets, liabilities and derivative financial instruments used tomanage structural interest rate risk. The situation presented reflects the position only on the date indicated and can change significantly in subsequentquarters depending on the preferences of Desjardins Group members and clients, and the application of policies on structural interest rate riskmanagement.
Some Combined Balance Sheet items are considered non-interest-rate-sensitive instruments, including investments in equities, non-performing loans,non-interest-bearing deposits, non-maturity interest-bearing deposits with an interest rate not referenced to a specific rate (such as the prime rate), andequity. As dictated in its policies, Desjardins Group’s management practices are based on prudent assumptions with respect to the maturity profile used inits models to determine the interest rate sensitivity of such instruments.
In addition to the total sensitivity gap, the main structural interest rate risk factors are: the trend in interest rate level and volatility the changes in the shape of the interest rate curve member and client behaviour in their choice of products the financial intermediation margin the optionality of the various financial products offered
In order to mitigate risk factors, sound and prudent management is applied to optimize net interest income while minimizing the negative incidence ofinterest rate movements. The established policies describe the principles, limits and procedures that apply to structural interest rate risk management.Simulations are used to measure the effect of different variables on changes in net interest income and the economic value of equity. These policiesspecify the structural interest rate risk factors, the risk measures retained, the risk tolerance levels and the management limits as well as the procedures inthe event that limits are exceeded. Structural interest rate risk is assessed at the required frequency according to portfolio volatility (daily, monthly andquarterly).
The assumptions used in the simulations are based on an analysis of historical data and on the effects of various interest rate environments on changes insuch data. These assumptions concern changes in the structure of assets and liabilities, including modelling for non-maturity deposits and equity, inmember and client behaviour, and in pricing. Desjardins Group’s asset and liability management committee (the Asset/Liability Committee) is responsiblefor analyzing and approving the global matching strategy on a monthly basis while respecting the parameters defined in structural interest rate riskmanagement policies.
The table below presents the potential impact before income taxes, with regard to structural interest rate risk management associated with bankingactivities, of a sudden and sustained 100-basis-point increase or decrease in interest rates on net interest income and the economic value of equity forDesjardins Group. The impact of insurance activities is presented in Note 1 to this table.
INTEREST RATE SENSITIVITY (BEFORE INCOME TAXES)(1)
(in millions of dollars) As at June 30, 2016 As at March 31, 2016 As at June 30, 2015
Net Economic Net Economic Net Economicinterest value of interest value of interest value of
income(2) equity(3)income(2) equity(3) income(2) equity(3)
Impact of a 100-basis-point increase in interest rates $ (14) $ (78) $ 21 $ (89) $ (9) $ (94)
Impact of a 100-basis-point decrease in interest rates(4) (61) 274 (92) 265 (27) 153(1)
Interest rate sensitivity related to insurance activities is not reflected in the amounts above. For these activities, a 100-basis-point increase in interest rates would result ina $219 million decrease in the economic value of equity before taxes as at June 30, 2016, and in a $206 million and $284 million decrease as at March 31, 2016 andJune 30, 2015, respectively. A 100-basis-point decrease in interest rates would result in an increase of $231 million in the economic value of equity before taxes asat June 30, 2016, and in a $205 million and $272 million increase as at March 31, 2016 and June 30, 2015, respectively.
(2)Represents the interest rate sensitivity of net interest income for the next 12 months.
(3)Represents the sensitivity of the present value of assets, liabilities and off-balance sheet instruments.
(4)The results of the impact of a decrease in interest rates take into consideration the use of a floor to avoid negative interest rates.
Foreign exchange risk management
Foreign exchange risk arises when the actual or expected value of assets denominated in a foreign currency is higher or lower than that of liabilitiesdenominated in the same currency.
In certain specific situations, Desjardins Group and its components may become exposed to foreign exchange risk, particularly with respect to the U.S.dollar and the euro. This exposure mainly arises from their intermediation activities with members and clients, and their financing and investment activities.A Desjardins Group policy on market risk has set foreign exchange risk exposure limits, which are monitored by the Risk Management Executive Division.To ensure that this risk is properly controlled, Desjardins Group and its components also use, among other things, derivative financial instruments such asforward exchange contracts and currency swaps. Desjardins Group’s residual exposure to this risk is low because it reduces its foreign exchange risk byusing derivative financial instruments.
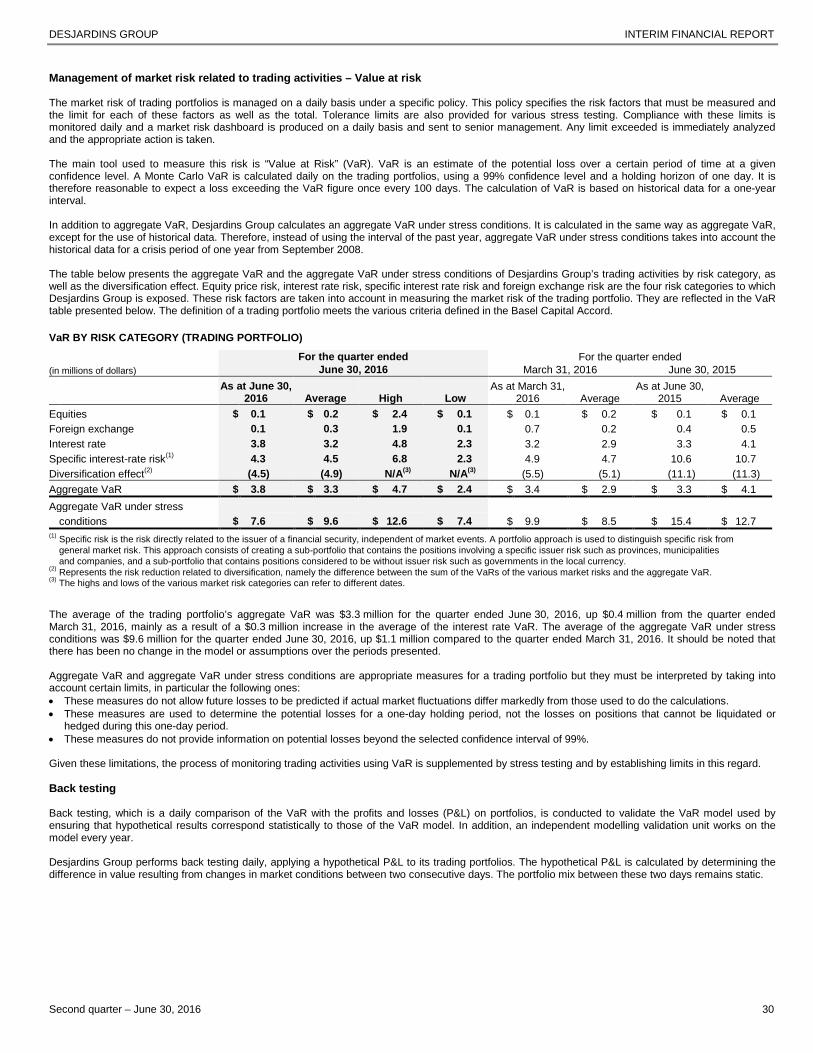
DESJARDINS GROUP INTERIM FINANCIAL REPORT
Second quarter – June 30, 2016 30
Management of market risk related to trading activities – Value at risk
The market risk of trading portfolios is managed on a daily basis under a specific policy. This policy specifies the risk factors that must be measured andthe limit for each of these factors as well as the total. Tolerance limits are also provided for various stress testing. Compliance with these limits ismonitored daily and a market risk dashboard is produced on a daily basis and sent to senior management. Any limit exceeded is immediately analyzedand the appropriate action is taken.
The main tool used to measure this risk is “Value at Risk” (VaR). VaR is an estimate of the potential loss over a certain period of time at a givenconfidence level. A Monte Carlo VaR is calculated daily on the trading portfolios, using a 99% confidence level and a holding horizon of one day. It istherefore reasonable to expect a loss exceeding the VaR figure once every 100 days. The calculation of VaR is based on historical data for a one-yearinterval.
In addition to aggregate VaR, Desjardins Group calculates an aggregate VaR under stress conditions. It is calculated in the same way as aggregate VaR,except for the use of historical data. Therefore, instead of using the interval of the past year, aggregate VaR under stress conditions takes into account thehistorical data for a crisis period of one year from September 2008.
The table below presents the aggregate VaR and the aggregate VaR under stress conditions of Desjardins Group’s trading activities by risk category, aswell as the diversification effect. Equity price risk, interest rate risk, specific interest rate risk and foreign exchange risk are the four risk categories to whichDesjardins Group is exposed. These risk factors are taken into account in measuring the market risk of the trading portfolio. They are reflected in the VaRtable presented below. The definition of a trading portfolio meets the various criteria defined in the Basel Capital Accord.
VaR BY RISK CATEGORY (TRADING PORTFOLIO)
For the quarter ended For the quarter ended
(in millions of dollars) June 30, 2016 March 31, 2016 June 30, 2015
As at June 30,2016 Average High Low
As at March 31,2016 Average
As at June 30,2015 Average
Equities $ 0.1 $ 0.2 $ 2.4 $ 0.1 $ 0.1 $ 0.2 $ 0.1 $ 0.1
Foreign exchange 0.1 0.3 1.9 0.1 0.7 0.2 0.4 0.5
Interest rate 3.8 3.2 4.8 2.3 3.2 2.9 3.3 4.1
Specific interest-rate risk(1) 4.3 4.5 6.8 2.3 4.9 4.7 10.6 10.7
Diversification effect(2) (4.5) (4.9) N/A(3) N/A(3)(5.5) (5.1) (11.1) (11.3)
Aggregate VaR $ 3.8 $ 3.3 $ 4.7 $ 2.4 $ 3.4 $ 2.9 $ 3.3 $ 4.1
Aggregate VaR under stress
conditions $ 7.6 $ 9.6 $ 12.6 $ 7.4 $ 9.9 $ 8.5 $ 15.4 $ 12.7(1)
Specific risk is the risk directly related to the issuer of a financial security, independent of market events. A portfolio approach is used to distinguish specific risk fromgeneral market risk. This approach consists of creating a sub-portfolio that contains the positions involving a specific issuer risk such as provinces, municipalitiesand companies, and a sub-portfolio that contains positions considered to be without issuer risk such as governments in the local currency.
(2)Represents the risk reduction related to diversification, namely the difference between the sum of the VaRs of the various market risks and the aggregate VaR.
(3)The highs and lows of the various market risk categories can refer to different dates.
The average of the trading portfolio’s aggregate VaR was $3.3 million for the quarter ended June 30, 2016, up $0.4 million from the quarter endedMarch 31, 2016, mainly as a result of a $0.3 million increase in the average of the interest rate VaR. The average of the aggregate VaR under stressconditions was $9.6 million for the quarter ended June 30, 2016, up $1.1 million compared to the quarter ended March 31, 2016. It should be noted thatthere has been no change in the model or assumptions over the periods presented.
Aggregate VaR and aggregate VaR under stress conditions are appropriate measures for a trading portfolio but they must be interpreted by taking intoaccount certain limits, in particular the following ones: These measures do not allow future losses to be predicted if actual market fluctuations differ markedly from those used to do the calculations. These measures are used to determine the potential losses for a one-day holding period, not the losses on positions that cannot be liquidated or
hedged during this one-day period. These measures do not provide information on potential losses beyond the selected confidence interval of 99%.
Given these limitations, the process of monitoring trading activities using VaR is supplemented by stress testing and by establishing limits in this regard.
Back testing
Back testing, which is a daily comparison of the VaR with the profits and losses (P&L) on portfolios, is conducted to validate the VaR model used byensuring that hypothetical results correspond statistically to those of the VaR model. In addition, an independent modelling validation unit works on themodel every year.
Desjardins Group performs back testing daily, applying a hypothetical P&L to its trading portfolios. The hypothetical P&L is calculated by determining thedifference in value resulting from changes in market conditions between two consecutive days. The portfolio mix between these two days remains static.

DESJARDINS GROUP INTERIM FINANCIAL REPORT
Second quarter – June 30, 2016 31
The following chart presents changes in VaR for trading activities as well as hypothetical P&L related to these activities. During the second quarter of2016, hypothetical P&L was not exceeded.
VaR COMPARED TO HYPOTHETICAL P&L FOR TRADING ACTIVITIES(in millions of dollars)
Stress testing
Certain events that are considered highly unlikely and that may have a significant impact on trading portfolios may occur from time to time. These eventsare at the tail-end of the distribution and are the result of extreme situations. Use of a stress-testing program is required to assess the impact of thesepotential situations.
The stress-testing program used for trading portfolios includes historical, hypothetical and sensitivity scenarios based, for instance, on events such as 9/11or the 2008 credit crisis. Using these simulations, changes can be monitored in the market value of positions held depending on various scenarios. Moststress-testing is predictive. For a given simulation, shocks are applied to certain risk factors (interest rates, exchange rates, commodities) and the effectsof these shocks are passed on to all the risk factors taking historical correlations into account. The running of each simulation is considered to beindependent of the others. In addition, certain simulations are subject to limit tracking. Stress-testing results are analyzed and reported daily using adashboard, together with VaR calculations, in order to detect vulnerability to such events. The stress-testing program is reviewed periodically to ensurethat it is kept current.
LIQUIDITY RISK
Liquidity risk refers to Desjardins Group’s capacity to raise the necessary funds (by increasing liabilities or converting assets) to meet a financial obligation,whether or not it appears on the Combined Balance Sheets.
Desjardins Group manages liquidity risk in order to ensure that it has timely and cost-effective access to the funds needed to meet its financial obligationsas they become due, in both routine and crisis situations. Managing this risk involves maintaining a sufficient level of liquid securities, ensuring stable anddiversified sources of funding, monitoring indicators and having a contingency plan in the event of a liquidity crisis.
Liquidity risk management is a key component of the overall risk management strategy. Desjardins Group and its components have established policiesdescribing the principles, limits, risk appetite and tolerance thresholds as well as the procedures that apply to liquidity risk management. These policies arereviewed on a regular basis to ensure that they are appropriate for the operating environment and prevailing market conditions. They are also updated toreflect regulatory requirements and sound liquidity risk management practices.
The implementation of Basel III strengthens international minimum liquidity requirements through the application of a liquidity coverage ratio (LCR), a netstable funding ratio (NSFR) and the use of Net Cumulative Cash Flow (NCCF). Under its liquidity risk management policy, Desjardins Group alreadyproduces these two ratios as well as the NCCF, and reports them on a regular basis to the AMF. The regulatory requirements concerning the NSFRshould take effect on January 1, 2018, and Desjardins Group intends to comply with the NSFR requirements once they become effective.
Applying the calculation rules established by the Basel Committee on Banking Supervision and incorporated in the AMF’s Liquidity Adequacy Guideline,Desjardins Group’s average LCR was 121.5% for the quarter ended June 30, 2016, compared to 121.6% for the previous quarter. The AMF requires thatthe ratio be greater than or equal to 100% in the absence of stressed conditions. This ratio is proactively managed by Desjardins Group’s Treasury, andan appropriate level of high-quality liquid assets is maintained for adequate coverage of the theoretical cash outflows associated with the standardizedcrisis scenario within the Basel III framework. Desjardins Group’s main sources of theoretical cash outflows are a potential serious run on deposits bymembers of Desjardins caisses and a sudden drying-up of the short-term institutional funding sources used on a day-to-day basis by Desjardins Group.
Desjardins Group’s Treasury ensures stable and diversified sources of institutional funding by type, source and maturity. It uses a wide range of financialproducts and borrowing programs on various markets to meet its financing needs.
-5
-4
-3
-2
-1
0
1
2
3
April 1, 2016 May 16, 2016 June 29, 2016
Hypothetical P&L 99% Monte Carlo VaR
June 30, 2016

DESJARDINS GROUP INTERIM FINANCIAL REPORT
Second quarter – June 30, 2016 32
Furthermore, Desjardins Group issues covered bonds and securitized CHMC-insured loans in the course of its normal operations. Desjardins Group isalso eligible for the Bank of Canada’s various intervention programs and loan facilities for Emergency Lending Assistance advances. Note that theGovernment of Canada has passed a bill to amend several federal laws, limiting access by provincial cooperative credit associations to federalintervention tools. These amendments are not yet in force. For further information, refer to the “Changes in the regulatory environment” section of thisMD&A.
Liquidity risk measurement and monitoring
Desjardins Group determines its liquidity needs by reviewing its current operations and evaluating its future forecasts for balance sheet growth andinstitutional funding conditions. Various analyses are used to determine the actual liquidity levels of assets and the stability of liabilities based on observedbehaviours or contractual maturities. Maintaining liquidity reserves of high-quality assets is required to offset potential cash outflows following a disruptionin capital markets, or events that would restrict its access to funding or result in a serious run on deposits.
The minimum liquid asset levels to be maintained by Desjardins Group, the caisse network, and Caisse centrale Desjardins are specifically prescribed bypolicies. Daily management of these securities and the reserve level to be maintained is centralized at Desjardins Group Treasury and is subject tomonitoring by the Risk Management sector under the supervision of the Finance and Risk Management Committee. Securities eligible for liquidityreserves must meet high security and negotiability criteria and provide assurance of their adequacy in the event of a severe liquidity crisis. The securitiesheld are largely Canadian government securities.
In addition to complying with regulatory ratios, a Desjardins-wide stress-testing program has been set up. This program incorporates the concepts putforward by the Basel Committee on Banking Supervision in “Basel III: International Framework for Liquidity Risk Measurement, Standards and Monitoring”.The scenarios, based on a downgrade to Desjardins Group combined with a shock on capital markets, make it possible to: Measure the extent, over a one-year period, of potential cash outflows in a crisis situation; Implement liquidity ratios and levels to be maintained across Desjardins Group; Assess the potential marginal cost of such events, depending on the type, severity and level of the crisis.
The calculations are performed daily to ensure compliance with the liquidity levels to be maintained based on crisis scenarios.
Liquidity coverage ratio
The Basel Committee on Banking Supervision has developed a liquidity coverage ratio (LCR) to promote the short-term resilience of the liquidity riskprofile of financial institutions. The LCR is the ratio of a stock of unencumbered high-quality liquid assets (HQLA) to net cash outflows over the next 30days in the event of an acute liquidity stress scenario.
Under the AMF’s Liquidity Adequacy Guideline, HQLA eligible for the purpose of calculating the LCR consist of assets that can be converted quickly intocash at little or no loss of value on capital markets. For Desjardins Group, such high-quality liquid assets are comprised essentially of cash and highlyrated securities issued or guaranteed by various levels of government. The AMF Guideline also prescribes weightings for cash inflows and outflows.
The table below presents quantitative information regarding the LCR, based on the model recommended for disclosure requirements by the BaselCommittee on Banking Supervision.

DESJARDINS GROUP INTERIM FINANCIAL REPORT
Second quarter – June 30, 2016 33
The table below presents quantitative information regarding the LCR, based on the model recommended for disclosure requirements by the BaselCommittee on Banking Supervision.
LIQUIDITY COVERAGE RATIO (1)
For the quarter ended For the quarter ended
June 30, 2016 March 31, 2016
Total non-weightedvalue(2) (average(4))
Total weightedvalue(3) (average (4))
Total weighted value(3)
(average(4))(in millions of dollars and as a percentage)
High-quality liquid assets
Total high-quality liquid assets $ N/A $ 20,629 $ 19,878
Cash outflows
Retail deposits and small business deposits, including:(5) $ 62,277 $ 3,985 $ 4,170
Stable deposits 32,031 960 955
Less stable deposits 30,246 3,025 3,215
Unsecured wholesale funding, including: 19,042 10,851 9,821
Operational deposits (all counterparties) and deposits
in cooperative bank networks 5,603 1,303 890
Non-operational deposits (all counterparties) 6,606 2,715 1,456
Unsecured debt 6,833 6,833 7,475
Secured wholesale funding N/A - -
Additional requirements, including: 11,894 3,831 4,176
Outflows related to exposures on derivatives and
other collateral required 2,624 2,506 2,348
Outflows related to funding loss on debt products - - 468
Credit and liquidity facilities 9,270 1,325 1,360
Other contractual funding liabilities 1,308 - -
Other contingent funding liabilities 90,991 1,628 1,451
Total cash outflows $ N/A $ 20,295 $ 19,618
Cash inflows
Secured loans (e.g. reverse repurchase agreements) $ 3,736 $ 145 $ 156
Inflows related to completely effective exposures 3,273 1,720 1,639
Other cash inflows 1,445 1,445 1,482
Total cash inflows $ 8,454 $ 3,310 $ 3,277
Total adjusted value(6) Total adjusted value(6)
Total high-quality liquid assets $ 20,629 $ 19,878
Total net cash outflows $ 16,985 $ 16,341
Liquidity coverage ratio 121.5% 121.6%(1)
Excluding the insurance subsidiaries.(2)
The non-weighted values of cash inflows and outflows represent unpaid balances either maturing or falling due and payable within 30 days.(3)
Weighted values are calculated after the “haircuts” prescribed for high-quality liquid assets and the rates prescribed for cash inflows and outflows have been applied.(4)
The average is determined on the basis of data for three month-ends of the quarter concerned.(5)
Does not include deposits with cash outflow rates of 0%.(6)
The total adjusted value takes into account, if applicable, the caps prescribed by the AMF for high-quality liquid assets and cash inflows.
Liquid assets
The table below presents a summary of Desjardins Group’s liquid assets, which do not include assets held by the insurance subsidiaries because theseassets are committed to cover insurance liabilities and not the liquidity needs of Desjardins Group’s other components. Liquid assets constitute DesjardinsGroup’s primary liquidity reserve for all its operations. Certain restrictions may apply to the use of all or part of the assets in certain funds, such as theassets of the Fonds de sécurité Desjardins, which cannot be used under normal conditions by Caisse centrale Desjardins. Encumbered liquid assetsmainly include liquid assets that are pledged as collateral or cannot be used as a result of regulatory requirements or internal policies.

DESJARDINS GROUP INTERIM FINANCIAL REPORT
Second quarter – June 30, 2016 34
LIQUID ASSETS(1)
As at June 30, 2016
(in millions of dollars)
Liquid assetsheld by
DesjardinsGroup
Securities held ascollateral - Securities
financing andderivatives trading
Totalliquidassets
Encumberedliquid assets
Unencumberedliquid assets
Cash and deposits with financial institutions $ 1,342 $ - $ 1,342 $ - $ 1,342
Securities
Issued or guaranteed by Canada,
provinces and municipal corporations in
Canada, school or public corporations in
Canada, and foreign public administrations 27,606 11,006 38,612 17,146 21,466
Other securities in Canada 1,465 74 1,539 81 1,458
Issued or guaranteed by foreign issuers 66 - 66 - 66
Loans
Insured residential mortgage-backed securities 1,306 - 1,306 1,004 302
Total $ 31,785 $ 11,080 $ 42,865 $ 18,231 $ 24,634
As at December 31, 2015(2)
(in millions of dollars)
Liquid assetsheld by
DesjardinsGroup
Securities held ascollateral - Securities
financing andderivatives trading
Totalliquid
assetsEncumberedliquid assets
Unencumberedliquid assets
Cash and deposits with financial institutions $ 1,160 $ - $ 1,160 $ - $ 1,160
Securities
Issued or guaranteed by Canada,
provinces and municipal corporations in
Canada, school or public corporations in
Canada, and foreign public administrations 24,240 9,392 33,632 15,384 18,248
Other securities in Canada 1,061 61 1,122 51 1,071
Issued or guaranteed by foreign issuers 31 - 31 - 31
Loans
Insured residential mortgage-backed securities 1,460 - 1,460 793 667
Total $ 27,952 $ 9,453 $ 37,405 $ 16,228 $ 21,177(1)
Excluding assets held by insurance subsidiaries.(2) The amounts have been revised to make them comparable to the current presentation following a refinement in methodology.
UNENCUMBERED LIQUID ASSETS BY ENTITY(1)
(in millions of dollars) As at June 30, 2016 As at December 31, 2015(2)
Caisse centrale Desjardins $ 14,246 $ 10,632
Caisse network 7,577 7,937
Other entities 2,811 2,608
Total $ 24,634 $ 21,177(1)
Excluding assets held by insurance subsidiaries. Virtually all unencumbered liquid assets presented in this table are issued in Canadian dollars.(2)
The amounts have been revised to make them comparable to the current presentation following a refinement in methodology.
Sources of refinancing
Core funding, which includes capital, long-term liabilities and a diversified deposit portfolio, is the foundation upon which Desjardins Group’s liquidityposition depends. The solid base of deposits from individuals combined with wholesale funding, diversified in terms of both the programs used as well asthe staggering of contractual maturities, allows Desjardins to maintain high regulatory liquidity ratios while ensuring their stability. Total deposits presentedon the Combined Balance Sheets amounted to $163.7 billion as at June 30, 2016, up $7.1 billion since December 31, 2015. Additional information ondeposits is presented in the “Balance sheet review” section of this MD&A.

DESJARDINS GROUP INTERIM FINANCIAL REPORT
Second quarter – June 30, 2016 35
The following table represents remaining terms to maturity of wholesale funding.
REMAINING CONTRACTUAL TERMS TO MATURITY OF WHOLESALE FUNDING
(in millions of dollars) As at June 30, 2016
As atDecember31, 2015
Less than1 month
From 1month to3 months
Over 3months to6 months
Over 6months to12 months
Total-Lessthan 1 year
From 1 to2 years
Over 2years Total Total
Bearer discount notes $ 1,594 $ 1,266 $ 133 $ 5 $ 2,998 $ - $ - $ 2,998 $ 2,162
Commercial paper 3,206 5,049 283 51 8,589 - - 8,589 7,069
Medium-term notes - - 799 355 1,154 6,008 4,161 11,323 10,188
Mortgage securitization - - 684 650 1,334 1,508 4,846 7,688 7,619
Covered bonds - - - 1,937 1,937 - 4,288 6,225 7,955
Subordinated notes - - - - - - 1,384 1,384 1,884
Total $ 4,800 $ 6,315 $ 1,899 $ 2,998 $ 16,012 $ 7,516 $ 14,679 $ 38,207 $ 36,877
Including:
Secured $ - $ - $ 684 $ 2,587 $ 3,271 $ 1,508 $ 10,518 $ 15,297 $ 17,458
Unsecured 4,800 6,315 1,215 411 12,741 6,008 4,161 22,910 19,419
Desjardins Group’s total wholesale funding presented in the table above was carried out by Caisse centrale Desjardins except for the subordinated notes,which were issued by Capital Desjardins inc. Total wholesale funding was up $1.3 billion compared to December 31, 2015, mainly because of growth inmedium-term notes and commercial paper, partially offset by a drop in covered bonds.
In addition, Desjardins Group diversifies its refinancing sources in order to limit its dependence on a single currency. The “Wholesale funding by currency”table presents a breakdown of borrowings on markets and subordinated notes by currency. These funds are obtained primarily through short- andmedium-term notes, mortgage securitization, covered bonds and subordinated notes.
WHOLESALE FUNDING BY CURRENCY
(in millions of dollars and as a percentage) As at June 30, 2016 As at December 31, 2015
Canadian dollars $ 16,546 43.3% $ 15,940 43.2%
U.S. dollars 14,137 37.0 13,499 36.6
Other 7,524 19.7 7,438 20.2
$ 38,207 100.0% $ 36,877 100.0%
Refinancing programs and strategies
As Desjardins Group’s Treasurer, Caisse centrale Desjardins meets the needs of the organization’s members and clients. Its first priority is to implementappropriate strategies to identify, measure and manage risks. These strategies are regulated by policies. In the first half of 2016, Caisse centraleDesjardins managed to maintain a liquidity level sufficient to meet Desjardins Group’s needs through its strict treasury policy, solid institutional refinancingand the contribution of the caisse network.
In order to secure long-term refinancing at the lowest cost on the market, Caisse centrale Desjardins maintains an active presence in the federally-guaranteed mortgage securitization market under the National Housing Act (NHA) Mortgage-Backed Securities Program. In addition, to ensure stablerefinancing, Caisse centrale Desjardins diversifies its sources from institutional markets. It therefore regularly resorts to the capital markets whenconditions are favourable and makes public and private issues of term notes on Canadian, U.S. and European markets as required.
The main programs currently used by Caisse centrale Desjardins are as follows:
MAIN REFINANCING PROGRAMSAs at June 30, 2016
Refinancing program Maximum authorized amount
Medium-term notes (Canadian) $7 billion
Covered bonds (multi-currency) €5 billion(1)
Short-term notes (European) €3 billion
Short-term notes (U.S.) US$10 billion
Medium-term notes (multi-currency) €7 billion(1)
This maximum authorized amount covers Caisse centrale Desjardins’s Structured Covered Bond Program (2011) and its Legislative Covered Bond Program (2014).
Caisse centrale Desjardins also participated in new issues under the NHA Mortgage-Backed Securities Program for a total amount of $877 million in thefirst six months of 2016. During the same period, Caisse centrale Desjardins also completed one issue under its multi-currency medium-term note programfor a total amount of €1.0 billion on the European market.

DESJARDINS GROUP INTERIM FINANCIAL REPORT
Second quarter – June 30, 2016 36
Outstanding notes issued under medium-term refinancing programs of Caisse centrale Desjardins amounted to $25.2 billion as at June 30, 2016,compared to $25.8 billion as at December 31, 2015. The outstanding notes for these issues are presented under “Deposits – Business and government”in the Combined Balance Sheets. Capital Desjardins inc.’s senior notes outstanding totalled $1.4 billion as at June 30, 2016, compared to $1.9 billion as atDecember 31, 2015. It should be pointed out that on June 1, 2016, Capital Desjardins inc. called all Series F senior notes for early redemption, in theamount of $500 million. Furthermore, to round out its refinancing and increase its capital base, Desjardins Group, through the Federation, issued capitalshares totalling $426 million, net of issuance expenses, in the first six months of 2016.
Overall, these transactions made it possible to adequately meet the liquidity needs of Desjardins Group, to better diversify its sources of financing and tofurther extend their average term.
Credit ratings of securities issued
Desjardins Group’s credit ratings affect its ability to access sources of funding on capital markets, as well as the conditions of such funding, and also helpto enhance Desjardins Group’s credibility and reputation among institutional investors and counterparties.
Rating agencies assign credit ratings and related ratings outlooks based on their own proprietary methodology, which includes a number of analyticalcriteria such as capitalization and the quality of assets, but also factors that are not under Desjardins Group’s control. The rating agencies evaluateDesjardins Group primarily on a combined basis, because the credit ratings of Caisse centrale Desjardins, a reporting issuer, and of Capital Desjardinsinc., a venture issuer, are backed by Desjardins Group’s financial strength. The agencies recognize its capitalization, the stability of its operating surplusearnings, its significant market shares in Quebec and the quality of its assets.
During the first half of 2016, Desjardins Group’s credit ratings remained unchanged. Furthermore, the rating agencies Fitch, Moody’s and Standard &Poor’s (S&P) confirmed the credit ratings and their outlooks.
S&P’s and Fitch’s ratings outlooks for Desjardins Group are also stable, but DBRS’s and Moody’s outlooks for Desjardins Group and the six majorCanadian banks are still negative. However, Moody’s ratings outlook for Capital Desjardins inc. remains stable. DBRS and Moody’s justified their decisionto assign a negative ratings outlook for Desjardins Group as well as for the six major Canadian banks due to uncertainty about continued governmentsupport to systemically important financial institutions on account of the ‟bail-in” regime proposed by the Canadian government.
Caisse centrale Desjardins and Capital Desjardins inc. thus continue to have first-class credit ratings that are among the best of the major Canadian andinternational banking institutions.
CREDIT RATINGS OF SECURITIES ISSUED
DBRSSTANDARD &
POOR'S MOODY'S FITCH
Caisse centrale Desjardins
Short-term R-1 (high) A-1 P-1 F1+
Medium- and long-term, senior AA A+ Aa2 AA-
Capital Desjardins inc.
Medium- and long-term, senior AA (low) A A2 A+
Desjardins Group regularly monitors the additional level of obligations its counterparties would require in the event of a credit rating downgrade for Caissecentrale Desjardins and Capital Desjardins inc. This monitoring enables Desjardins Group to assess the impact of such a downgrade on its fundingcapacity, perform transactions in the normal course of its operations as well as ensure that it has the additional liquid assets and collateral necessary tomeet its obligations. In the event that Caisse centrale Desjardins’s credit rating were lowered three notches by one or several rating agencies, Caissecentrale Desjardins would be obliged to provide collateral amounting to $1.2 billion in order to meet its commitments related to the program for asset-backed term notes (ABTN) restructured under the Montreal Accord. In such a situation, the pledging of assets would reduce the liquidity reserves ofCaisse centrale Desjardins by an amount equal to the value of the collateral deposited, which would then be considered encumbered and thereforeunusable. This amount will remain in effect until the Montreal Accord expires in January 2017.
OPERATIONAL RISK
Operational risk is the risk of inadequacy or failure attributable to processes, people, internal systems or external events and resulting in losses, failure toachieve objectives or a negative impact on reputation.
Operational risk is inherent to all business activities as well as internal and outsourced activities. It may lead to losses mainly resulting from theft, fraud,damage to tangible assets, non-compliance with legislation or regulations, systems failures, unauthorized access to computer systems (e.g. cybercrime),or problems or errors in process management. Although this risk cannot be eliminated entirely, measures are in place at Desjardins Group to maintain it atan acceptable level.

DESJARDINS GROUP INTERIM FINANCIAL REPORT
Second quarter – June 30, 2016 37
Operational risk management framework
The purpose of the operational risk management framework is to identify, measure, mitigate and monitor this risk as well as make interventions anddisclosures for operational risk in accordance with risk appetite and tolerance and the frameworks adopted by the Board of Directors. It is supported byguidelines setting out operational risk management foundations.
The operational risk management framework is reviewed annually to ensure its adequacy and relevance based on Desjardins Group’s risk profile anddevelopments in industry practices.
In keeping with the global trend, Desjardins Group considers technology risk a major operational risk. To better respond to it, a specific managementframework has been put in place that coordinates with the operational risk management framework and is supported by a specific control framework.
ADDITIONAL INFORMATION RELATED TO CERTAIN RISK EXPOSURES
The tables below provide more details about more complex financial instruments that have a higher risk.
ASSET-BACKED SECURITIES
(in millions of dollars) As at June 30, 2016 As at December 31, 2015Notional Notionalamounts Fair value amounts Fair value
Commercial mortgage-backed securities(1) $ 32 $ 33 $ 49 $ 50
Financial asset-backed and mortgage-backed securities(2) 257 268 307 316(1)
These securities are presented in the Combined Balance Sheets under “Securities at fair value through profit or loss”.(2)
None of the securities held is directly backed by subprime residential mortgage loans. These securities are presented in the Combined Balance Sheets under"Securities at fair value through profit or loss” and “Available-for-sale securities”.
DERIVATIVE FINANCIAL INSTRUMENTS
(in millions of dollars) As at June 30, 2016 As at December 31, 2015Notional Positive Negative Notional Positive Negativeamounts value value amounts value value
Credit default swaps(1) $ 624 $ 7 $ - $ 706 $ 4 $ -
Total return swaps(2) 67 1 - 69 1 -
(1) Credit default swaps are presented in the Combined Balance Sheets as derivative financial instruments.(2) These amounts do not include any amounts realized as part of securitization activities. Total return swaps are presented in the Combined Balance Sheets as
derivative financial instruments.
LEVERAGED FINANCE LOANS AND SUBPRIME LOANS
(in millions of dollars) As at June 30, 2016 As at December 31, 2015
Leveraged finance loans(1) $ 190 $ 203
Alt-A mortgage loans(2) 26 35
Subprime residential mortgage loans(3) 2 2
(1) Leveraged finance loans are defined as loans to large corporations and finance companies whose credit rating is between BB+ and D, and whose level of indebtednessis very high compared to other companies in the same industry.
(2)Alt-A mortgage loans are defined as loans to borrowers with non-standard income documentation. These loans are presented in the Combined Balance Sheets under“Loans – Residential mortgages” and are measured at amortized cost.
(3)Subprime residential mortgage loans are defined as loans to borrowers with a high credit risk profile. Subprime residential mortgages are recorded in the CombinedBalance Sheets under “Loans – Residential mortgages” and are measured at amortized cost.
DESJARDINS GROUP INTERIM FINANCIAL REPORT
Second quarter – June 30, 2016 38
ADDITIONAL INFORMATION
CONTROLS AND PROCEDURES
During the interim period ended June 30, 2016, Desjardins Group did not make any changes to its internal control over financial reporting that havematerially affected, or may materially affect, its operations. The parties involved and their responsibilities regarding internal control are described onpages 90 and 91 of the 2015 Annual Report.
RELATED PARTY DISCLOSURES
In the normal course of business, Desjardins Group offers financial services to related parties, including its associates and other related companies, andenters into agreements for operating services with them. It also pays its key management personnel compensation under normal market conditions.
Furthermore, Desjardins Group provides its financial products and services, under normal market conditions, to its directors, its key managementpersonnel and the persons related to them.
Desjardins Group has set up a process to obtain assurance that all transactions with its officers and the persons related to them have been carried out asarm’s length transactions and in compliance with the legislative framework for its various components. These policies and procedures have not changedsignificantly since December 31, 2015.
Additional information on Desjardins Group’s related party transactions is provided in Note 33, "Related party disclosures", to Desjardins Group's AnnualCombined Financial Statements.
CRITICAL ACCOUNTING POLICIES AND ESTIMATES
A description of the accounting policies used by Desjardins Group is essential to understanding the Annual and Interim Combined Financial Statements.The significant accounting policies are described in Note 2, “Basis of presentation and significant accounting policies”, to Desjardins Group’s AnnualCombined Financial Statements on pages 109 to 125 of the 2015 Annual Report.
Some of these policies are of particular importance in presenting Desjardins Group’s financial position and operating results because they requiremanagement to make judgments as well as estimates and assumptions that may affect the reported amounts of some assets, liabilities, income andexpenses, as well as related information. Explanations of the significant accounting policies that have required management to make difficult, subjective orcomplex judgments, often about matters that are inherently uncertain, are provided on pages 92 to 96 of the 2015 Annual Report.
No material change was made to these judgments, estimates, assumptions and accounting policies during the first six months of 2016.
FUTURE ACCOUNTING CHANGES
Accounting standards issued by the IASB but not yet effective as at December 31, 2015 are discussed in Note 2, “Basis of presentation and significantaccounting policies”, to Desjardins Group's Annual Combined Financial Statements, on page 125 of the 2015 Annual Report. Since then, the IASB hasissued the following standard and amendments:
IFRS 16, ‟Leases”
In January 2016, the IASB issued IFRS 16, “Leases”, to replace the current standard IAS 17, “Leases”. IFRS 16 sets out lease recognition, measurement,presentation and disclosure principles. It introduces a single accounting model for lessees, requiring on-balance sheet recognition of lease assets andliabilities for most leases and eliminating the current distinction between operating and finance leases. For lessors, however, the distinction betweenoperating and finance leases is retained. Desjardins Group is currently assessing the impact of adopting IFRS 16, which will be effective for annualperiods beginning on or after January 1, 2019.
IFRS 15, ‟Revenue from Contracts with Customers”
In April 2016, the IASB issued amendments to IFRS 15, ‟Revenue from Contracts with Customers”, to further clarify revenue recognition and transitionprovisions with respect to the initial application. Desjardins Group is currently assessing the impact of adopting these amendments, which will beapplicable on the effective date of IFRS 15 (annual periods beginning on or after January 1, 2018).

DESJARDINS GROUP INTERIM FINANCIAL REPORT
Second quarter – June 30, 2016 39
COMBINED BALANCE SHEETS
(unaudited)
As at As at
(in millions of Canadian dollars) Notes June 30, 2016 December 31, 2015
ASSETS
Cash and deposits with financial institutions $ 2,183 $ 1,716
Securities
Securities at fair value through profit and loss 32,577 28,715
Available-for-sale securities 5 23,636 23,272
56,213 51,987
Securities borrowed or purchased under reverse repurchase agreements 10,362 7,881
Loans 6
Residential mortgages 104,977 102,323
Consumer, credit card and other personal loans 21,486 21,204
Business and government 36,682 36,433
163,145 159,960
Allowance for credit losses 6 (459) (455)
162,686 159,505
Segregated fund net assets 10,255 9,781
Other assets
Clients' liability under acceptances 47 376
Premiums receivable 1,936 1,662
Derivative financial instruments 9 3,919 4,818
Amounts receivable from clients, brokers and financial institutions 3,745 2,033
Reinsurance assets 2,311 1,964
Investment property 736 683
Property, plant and equipment 1,451 1,451
Goodwill 470 472
Intangible assets 705 661
Deferred tax assets 962 784
Other 2,730 2,354
19,012 17,258
TOTAL ASSETS $ 260,711 $ 248,128
LIABILITIES AND EQUITY
LIABILITIES
Deposits 8
Individuals $ 93,588 $ 91,243
Business and government 68,055 63,833
Deposit-taking institutions 2,019 1,498
163,662 156,574
Other liabilities
Acceptances 47 376
Commitments related to securities sold short 6,945 5,464
Commitments related to securities lent or sold under repurchase agreements 10,601 10,383
Derivative financial instruments 9 1,889 1,689
Amounts payable to clients, brokers and financial institutions 6,386 4,713
Insurance contract liabilities 28,371 26,734
Segregated fund net liabilities 10,247 9,776
Net defined benefit plan liabilities 3,044 2,428
Deferred tax liabilities 170 163
Other 5,948 6,219
73,648 67,945
Subordinated notes 1,384 1,884
TOTAL LIABILITIES 238,694 226,403
EQUITY
Capital stock 10 5,258 5,158
Share capital 89 86
Undistributed surplus earnings 748 1,793
Accumulated other comprehensive income 11 730 589
Reserves 14,339 12,864
Equity - Group's share 21,164 20,490
Non-controlling interests 853 1,235
TOTAL EQUITY 22,017 21,725
TOTAL LIABILITIES AND EQUITY $ 260,711 $ 248,128
The accompanying notes are an integral part of the Condensed Interim Combined Financial Statements.
On behalf of the Board of Directors of the Fédération des caisses Desjardins du Québec,
Guy Cormier Yvon Vinet, LL.L., D.D.N.
Chair of the Board Vice-Chair of the Board

DESJARDINS GROUP INTERIM FINANCIAL REPORT
Second quarter – June 30, 2016 40
COMBINED STATEMENTS OF INCOME
(unaudited)For the three-month periods For the six-month periods
ended June 30 ended June 30
(in millions of Canadian dollars) Notes 2016 2015 2016 2015
INTEREST INCOME
Loans $ 1,399 $ 1,438 $ 2,803 $ 2,823
Securities 83 78 160 155
1,482 1,516 2,963 2,978
INTEREST EXPENSE
Deposits 406 428 812 863
Subordinated notes and other 23 31 49 63
429 459 861 926
NET INTEREST INCOME 1,053 1,057 2,102 2,052
NET PREMIUMS 1,740 1,698 3,461 3,574
OTHER INCOME
Deposit and payment service charges 119 122 237 240
Lending fees and credit card service revenues 155 156 323 310
Brokerage and investment fund services 286 267 546 519
Management and custodial service fees 92 95 180 184
Net income (loss) on securities at fair value through profit or loss 13 878 (612) 1,390 562
Net income on available-for-sale securities 99 107 178 212
Net other investment income 50 92 100 136
Foreign exchange income 22 21 38 47
Other 46 12 111 102
1,747 260 3,103 2,312
TOTAL INCOME 4,540 3,015 8,666 7,938
PROVISION FOR CREDIT LOSSES 6 75 103 166 192
CLAIMS, BENEFITS, ANNUITIES AND CHANGES IN INSURANCE
CONTRACT LIABILITIES 2,065 332 3,823 2,835
NON-INTEREST EXPENSE
Salaries and fringe benefits 907 889 1,817 1,774
Premises, equipment and furniture, including depreciation 165 152 324 301
Service agreements and outsourcing 78 88 161 171
Communications 82 76 153 148
Other 633 576 1,197 1,135
1,865 1,781 3,652 3,529
OPERATING SURPLUS EARNINGS 535 799 1,025 1,382
Income taxes on surplus earnings 108 170 216 289
SURPLUS EARNINGS BEFORE MEMBER DIVIDENDS(1) 427 629 809 1,093
Member dividends 22 34 52 74
Tax recovery on member dividends (6) (10) (14) (20)
NET SURPLUS EARNINGS FOR THE PERIOD AFTER MEMBER DIVIDENDS $ 411 $ 605 $ 771 $ 1,039
of which:
Group's share $ 390 $ 531 $ 729 $ 940
Non-controlling interests' share 21 74 42 99
(1) The Group's share of "Surplus earnings before member dividends" is presented in Note 14, "Segmented information".
The accompanying notes are an integral part of the Condensed Interim Combined Financial Statements.
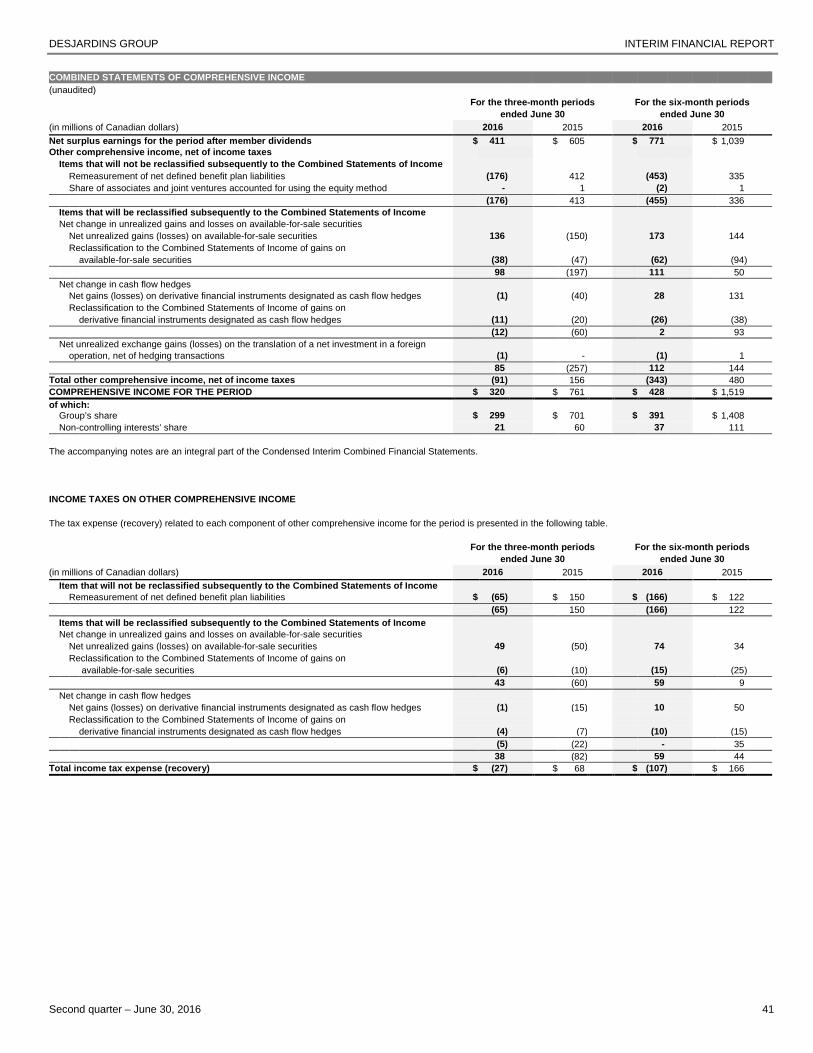
DESJARDINS GROUP INTERIM FINANCIAL REPORT
Second quarter – June 30, 2016 41
COMBINED STATEMENTS OF COMPREHENSIVE INCOME
(unaudited)
For the three-month periods For the six-month periods
ended June 30 ended June 30
(in millions of Canadian dollars) 2016 2015 2016 2015
Net surplus earnings for the period after member dividends $ 411 $ 605 $ 771 $ 1,039Other comprehensive income, net of income taxes
Items that will not be reclassified subsequently to the Combined Statements of Income
Remeasurement of net defined benefit plan liabilities (176) 412 (453) 335
Share of associates and joint ventures accounted for using the equity method - 1 (2) 1
(176) 413 (455) 336
Items that will be reclassified subsequently to the Combined Statements of Income
Net change in unrealized gains and losses on available-for-sale securities
Net unrealized gains (losses) on available-for-sale securities 136 (150) 173 144
Reclassification to the Combined Statements of Income of gains on
available-for-sale securities (38) (47) (62) (94)
98 (197) 111 50
Net change in cash flow hedgesNet gains (losses) on derivative financial instruments designated as cash flow hedges (1) (40) 28 131
Reclassification to the Combined Statements of Income of gains on
derivative financial instruments designated as cash flow hedges (11) (20) (26) (38)
(12) (60) 2 93
Net unrealized exchange gains (losses) on the translation of a net investment in a foreignoperation, net of hedging transactions (1) - (1) 1
85 (257) 112 144
Total other comprehensive income, net of income taxes (91) 156 (343) 480
COMPREHENSIVE INCOME FOR THE PERIOD $ 320 $ 761 $ 428 $ 1,519
of which:Group’s share $ 299 $ 701 $ 391 $ 1,408
Non-controlling interests’ share 21 60 37 111
The accompanying notes are an integral part of the Condensed Interim Combined Financial Statements.
INCOME TAXES ON OTHER COMPREHENSIVE INCOME
The tax expense (recovery) related to each component of other comprehensive income for the period is presented in the following table.
For the three-month periods For the six-month periods
ended June 30 ended June 30
(in millions of Canadian dollars) 2016 2015 2016 2015
Item that will not be reclassified subsequently to the Combined Statements of IncomeRemeasurement of net defined benefit plan liabilities $ (65) $ 150 $ (166) $ 122
(65) 150 (166) 122
Items that will be reclassified subsequently to the Combined Statements of IncomeNet change in unrealized gains and losses on available-for-sale securities
Net unrealized gains (losses) on available-for-sale securities 49 (50) 74 34
Reclassification to the Combined Statements of Income of gains on
available-for-sale securities (6) (10) (15) (25)
43 (60) 59 9
Net change in cash flow hedges
Net gains (losses) on derivative financial instruments designated as cash flow hedges (1) (15) 10 50
Reclassification to the Combined Statements of Income of gains on
derivative financial instruments designated as cash flow hedges (4) (7) (10) (15)
(5) (22) - 35
38 (82) 59 44
Total income tax expense (recovery) $ (27) $ 68 $ (107) $ 166

DESJARDINS GROUP INTERIM FINANCIAL REPORT
Second quarter – June 30, 2016 42
COMBINED STATEMENTS OF CHANGES IN EQUITY
(unaudited)
For the six-month periods ended June 30 Capital
Un
dis
trib
ute
dsu
rplu
searn
ing
s
Acc
um
ula
ted
oth
er
co
mp
reh
en
siv
ein
co
me
(No
te11
)
Reserves
Eq
uit
y-
Gro
up
'ss
hare
No
n-c
on
tro
llin
gin
tere
sts
To
tal
eq
uit
y
(in millions of Canadian dollars)
Cap
ital
sto
ck
(No
te10
)
Sh
are
ca
pit
al
Sta
biliz
ati
on
res
erv
e
Reserv
efo
rfu
ture
mem
ber
div
iden
ds
Gen
era
la
nd
oth
er
reserv
es
To
tal
res
erv
es
BALANCE AS AT DECEMBER 31, 2015 $ 5,158 $ 86 $ 1,793 $ 589 $ 983 $ 479 $ 11,402 $ 12,864 $ 20,490 $ 1,235 $ 21,725
Net surplus earnings for the period after member dividends - - 729 - - - - - 729 42 771
Other comprehensive income for the period - - (445) 107 - - - - (338) (5) (343)
Comprehensive income for the period - - 284 107 - - - - 391 37 428
Issuance of F capital shares 426 - - - - - - - 426 - 426
Other net change in capital stock (326) - - - - - - - (326) - (326)
Issuance of share capital - 3 - - - - - - 3 1 4
Redemption of share capital - - - - - - - - - (3) (3)
Remuneration on capital stock - - (208) - - - - - (208) - (208)
Dividends - - (4) - - - - - (4) (15) (19)
Transfer from participating contract holders(1) - - 362 34 - - - - 396 (396) -
Transfer from undistributed surplus earnings (to reserves) - - (1,479) - - (20) 1,499 1,479 - - -
Other - - - - - - (4) (4) (4) (6) (10)
BALANCE AS AT JUNE 30, 2016 $ 5,258 $ 89 $ 748 $ 730 $ 983 $ 459 $ 12,897 $ 14,339 $ 21,164 $ 853 $ 22,017
BALANCE AS AT DECEMBER 31, 2014 $ 4,777 $ 85 $ 1,468 $ 615 $ 981 $ 479 $ 10,016 $ 11,476 $ 18,421 $ 472 $ 18,893
Net surplus earnings for the period after member dividends - - 940 - - - - - 940 99 1,039
Other comprehensive income for the period - - 327 141 - - - - 468 12 480
Comprehensive income for the period - - 1,267 141 - - - - 1,408 111 1,519
Issuance of F capital shares 762 - - - - - - - 762 - 762
Other net change in capital stock (423) - - - - - - - (423) - (423)
Issuance of share capital - 2 - - - - - - 2 652 654
Redemption of share capital - - - - - - - - - (21) (21)
Remuneration on capital stock - - (198) - - - - - (198) - (198)
Dividends - - (3) - - - - - (3) (22) (25)
Transfer from undistributed surplus earnings (to reserves) - - (1,468) - 4 - 1,464 1,468 - - -
Transactions related to put options - - - - - - 7 7 7 - 7
Other - - - - - - - - - (2) (2)
BALANCE AS AT JUNE 30, 2015 $ 5,116 $ 87 $ 1,066 $ 756 $ 985 $ 479 $ 11,487 $ 12,951 $ 19,976 $ 1,190 $ 21,166(1) Under the Act Respecting Insurance, a life and health insurance company may transfer, in the normal course of business, a portion of the accumulated surplus earnings attributable to participating contract holders to the Group's share of equity.
The accompanying notes are an integral part of the Condensed Interim Combined Financial Statements.

DESJARDINS GROUP INTERIM FINANCIAL REPORT
Second quarter – June 30, 2016 43
COMBINED STATEMENTS OF CASH FLOWS
(unaudited)
For the six-month periodsended June 30
(in millions of Canadian dollars) 2016 2015
CASH FLOWS FROM (USED IN) OPERATING ACTIVITIESOperating surplus earnings $ 1,025 $ 1,382
Non-cash adjustments:
Depreciation of property, plant and equipment and investment property 82 81
Net change in insurance contract liabilities 1,637 284
Provision for credit losses 166 192
Impairment on available-for-sale securities recognized in net income 14 31Net realized gains on available-for-sale securities (91) (159)
Other 75 84
Change in operating assets and liabilities:
Securities at fair value through profit and loss (3,862) (1,853)
Securities borrowed or purchased under reverse repurchase agreements (2,481) (869)
Loans (3,347) (4,742)
Derivative financial instruments, net amount 1,110 (737)
Net amounts receivable from and payable to clients, brokers and financial institutions (39) (9)
Deposits 7,088 6,497
Commitments related to securities sold short 1,481 3,308
Commitments related to securities lent or sold under repurchase agreements 218 (1,102)
Other (1,200) 229
Income taxes paid on surplus earnings (336) (213)
Payment of member dividends (157) (177)
1,383 2,227
CASH FLOWS FROM (USED IN) FINANCING ACTIVITIESIssuance of subordinated notes - 13
Redemption of subordinated notes (500) -
Sale of debt securities and subordinated notes to third parties on the market - 9
Issuance of F capital shares 326 762
Other net change in capital stock (326) (423)
Remuneration on capital stock (108) (198)
Issuance of share capital 4 654
Redemption of share capital (3) (21)
Dividends paid (19) (25)
Exercise of put options written on non-controlling interests (2) (33)
(628) 738
CASH FLOWS FROM (USED IN) INVESTING ACTIVITIESPurchase of available-for-sale securities (25,014) (27,445)
Proceeds from disposals of available-for-sale securities 9,661 15,142
Proceeds from maturities of available-for-sale securities 15,200 9,646
Business acquisitions, net of cash and cash equivalents acquired - (76)
Acquisitions of property, plant and equipment and investment property (135) (165)
(288) (2,898)
Net increase in cash and cash equivalents 467 67
Cash and cash equivalents at beginning of period 1,716 1,781
CASH AND CASH EQUIVALENTS AT END OF PERIOD $ 2,183 $ 1,848
Supplemental information on cash flows from (used in) operating activitiesInterest paid $ 1,067 $ 976
Interest and dividends received 3,668 3,002
The accompanying notes are an integral part of the Condensed Interim Combined Financial Statements.

DESJARDINS GROUP INTERIM FINANCIAL REPORT
Second quarter – June 30, 2016 44
NOTES TO THE CONDENSED INTERIM COMBINED FINANCIALSTATEMENTS(unaudited)
NOTE 1 – INFORMATION ON DESJARDINS GROUP
NATURE OF OPERATIONS
Desjardins Group is made up of the Desjardins caisses in Quebec and Ontario, the Fédération des caisses Desjardins du Québec (the Federation) and itssubsidiaries, the Fédération des caisses populaires de l’Ontario and the Fonds de sécurité Desjardins. A number of the subsidiaries are active acrossCanada. The address of its head office is 100 Des Commandeurs Street, Lévis, Quebec, Canada.
BASIS OF PRESENTATION OF THE COMBINED FINANCIAL STATEMENTS
As an integrated financial services group, Desjardins Group is a complete economic entity. These unaudited Condensed Interim Combined FinancialStatements (the Interim Combined Financial Statements) have been prepared to present the financial position, the financial performance and the cashflows of this economic entity. The Desjardins caisses exercise a collective power over the Federation, which is the cooperative entity responsible forassuming orientation, framework, coordination and development activities for Desjardins Group. The role of the Federation is also to protect the interestsof Desjardins Group members.
As Desjardins caisses and the Federation are financial services cooperatives, these Interim Combined Financial Statements differ from the consolidatedfinancial statements of a group with a traditional organizational structure. Consequently, the Combined Financial Statements of Desjardins Group are acombination of the accounts of the Desjardins caisses of Quebec, the caisses populaires of Ontario, the Federation, the Fédération des caisses populairesde l’Ontario and the entities controlled by them, namely the Federation’s subsidiaries and the Fonds de sécurité Desjardins. The capital stock ofDesjardins Group represents the aggregate of the capital stock issued by the caisses, the Federation and the Fédération des caisses populaires del’Ontario.
NOTE 2 – BASIS OF PRESENTATION AND SIGNIFICANT ACCOUNTING POLICIES
BASIS OF PRESENTATION
STATEMENT OF COMPLIANCE
Pursuant to the Act Respecting Financial Services Cooperatives, these Interim Combined Financial Statements have been prepared by DesjardinsGroup's management in accordance with the International Financial Reporting Standards (IFRS) issued by the International Accounting Standards Board(IASB), more specifically in accordance with International Accounting Standard (IAS) 34, “Interim Financial Reporting”, and the accounting requirements ofthe Autorité des marchés financiers (AMF) in Quebec, which do not differ from IFRS.
These Interim Combined Financial Statements should be read in conjunction with the audited Annual Combined Financial Statements (the AnnualCombined Financial Statements) for the year ended December 31, 2015, and the shaded areas of section 4.1, “Risk management”, of the relatedManagement's Discussion and Analysis, which are an integral part of the Annual Combined Financial Statements. All accounting policies were applied asdescribed in Note 2, “Basis of presentation and significant accounting policies”, to the Annual Combined Financial Statements.
These Interim Combined Financial Statements were approved by the Board of Directors of Desjardins Group, which is the Board of Directors of theFederation, on August 12, 2016.
PRESENTATION AND FUNCTIONAL CURRENCY
These Interim Combined Financial Statements are expressed in Canadian dollars, which is also the functional currency of Desjardins Group. Dollaramounts presented in the tables of the Notes to the Interim Combined Financial Statements are in millions of dollars, unless otherwise stated.

DESJARDINS GROUP INTERIM FINANCIAL REPORT
Second quarter – June 30, 2016 45
NOTE 2 – BASIS OF PRESENTATION AND SIGNIFICANT ACCOUNTING POLICIES (continued)
FUTURE ACCOUNTING CHANGES
Accounting standards issued by the IASB, but not yet effective as at December 31, 2015, are described in Note 2 "Basis of presentation and significantaccounting policies" to the Annual Combined Financial Statements. The IASB since issued the following standard and amendments:
IFRS 16, “Leases”
In January 2016, the IASB issued IFRS 16, Leases, which will replace the current standard, IAS 17, Leases. IFRS 16 establishes principles for therecognition, measurement, presentation and disclosure of leases. IFRS 16 introduces a single recognition model for the lessee that requires recognizinglease assets and liabilities for most leases, thereby eliminating the current distinction between operating and finance leases. For the lessor, the distinctionbetween operating and finance leases remains similar. Desjardins Group is currently assessing the impact of adopting IFRS 16, which will be effective forannual periods beginning on or after January 1, 2019.
IFRS 15, “Revenues from contracts with customers”
In April 2016, the IASB issued amendments to IFRS 15, “Revenues from contracts with customers”, to further clarify revenue recognition and transitionprovisions with respect to initial application. Desjardins Group is currently assessing the impact of adopting these amendments, which will be effective onthe effective date of IFRS 15 (annual periods beginning on or after January 1, 2018).

DESJARDINS GROUP INTERIM FINANCIAL REPORT
Second quarter – June 30, 2016 46
NOTE 3 – CARRYING AMOUNT OF FINANCIAL INSTRUMENTS
CLASSIFICATION AND CARRYING AMOUNT OF FINANCIAL INSTRUMENTS
The following tables present the carrying amount of all financial assets and liabilities according to their classification in the categories defined in thefinancial instrument standards as well as the carrying amount of financial instruments designated as hedging instruments.
At fair value through
profit or lossLoans and
receivables,Designated as and Derivatives
Held at fair value financial designatedfor through Available liabilities at as hedging
As at June 30, 2016 trading profit or loss for sale amortized cost instruments(2) Total
Financial assetsCash and deposits with financial institutions $ 17 $ 63 $ 279 $ 1,824 $ - $ 2,183Securities
Securities at fair value through profit or loss 13,517 19,060 - - - 32,577Available-for-sale securities - - 23,636 - - 23,636
Securities borrowed or purchased under reverserepurchase agreements - - - 10,362 - 10,362
Loans(1) - - - 162,686 - 162,686Other financial assets
Clients’ liability under acceptances - - - 47 - 47Premiums receivable - - - 1,936 - 1,936Derivative financial instruments 2,301 - - - 1,618 3,919Amounts receivable from clients, brokers and
financial institutions - - - 3,745 - 3,745Other - - - 1,248 - 1,248
Total financial assets $ 15,835 $ 19,123 $ 23,915 $ 181,848 $ 1,618 $ 242,339
Financial liabilitiesDeposits $ - $ - $ - $ 163,662 $ - $ 163,662Other financial liabilities
Acceptances - - - 47 - 47Commitments related to securities sold short 6,945 - - - - 6,945Commitments related to securities lent or sold
under repurchase agreements - - - 10,601 - 10,601Derivative financial instruments 1,588 - - - 301 1,889Amounts payable to clients, brokers and
financial institutions - - - 6,386 - 6,386Other 207 - - 3,625 - 3,832
Subordinated notes - - - 1,384 - 1,384
Total financial liabilities $ 8,740 $ - $ - $ 185,705 $ 301 $ 194,746(1) For more information, see Note 6, “Loans and allowance for credit losses”.(2) For details on derivatives designated as hedging instruments, see Note 9, “Derivative financial instruments and hedging activities”.
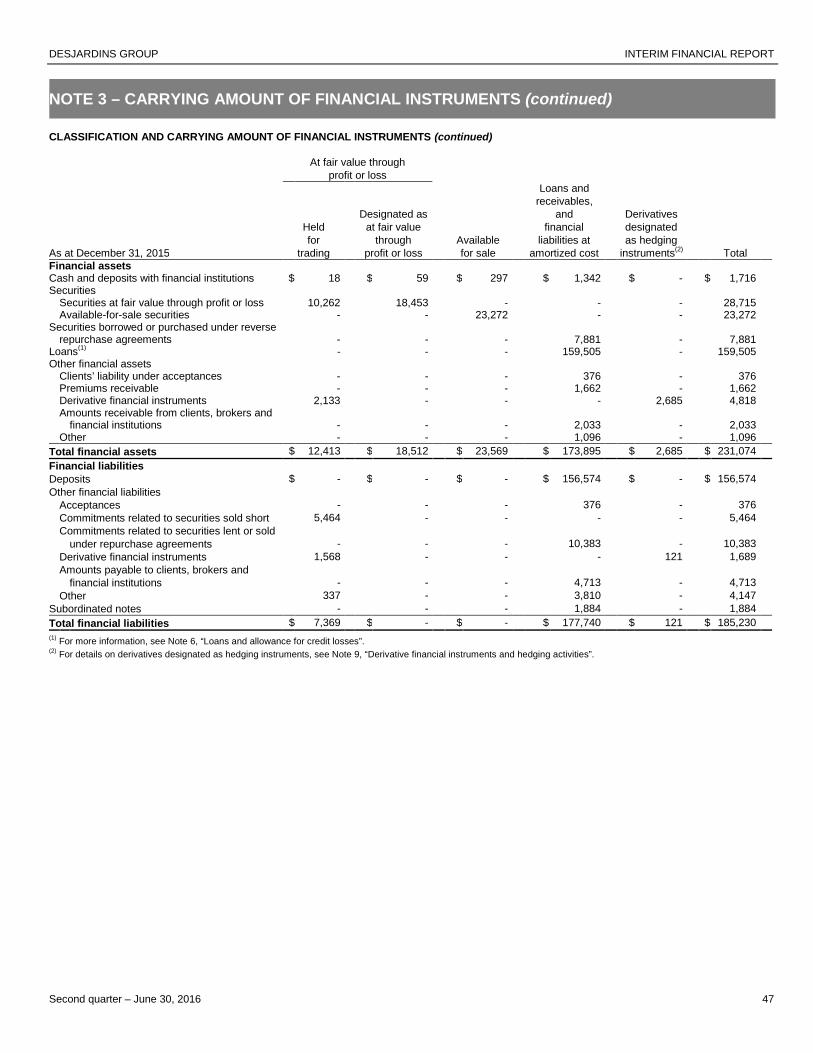
DESJARDINS GROUP INTERIM FINANCIAL REPORT
Second quarter – June 30, 2016 47
NOTE 3 – CARRYING AMOUNT OF FINANCIAL INSTRUMENTS (continued)
CLASSIFICATION AND CARRYING AMOUNT OF FINANCIAL INSTRUMENTS (continued)
At fair value throughprofit or loss
Loans andreceivables,
Designated as and DerivativesHeld at fair value financial designatedfor through Available liabilities at as hedging
As at December 31, 2015 trading profit or loss for sale amortized cost instruments(2) TotalFinancial assetsCash and deposits with financial institutions $ 18 $ 59 $ 297 $ 1,342 $ - $ 1,716Securities
Securities at fair value through profit or loss 10,262 18,453 - - - 28,715Available-for-sale securities - - 23,272 - - 23,272
Securities borrowed or purchased under reverserepurchase agreements - - - 7,881 - 7,881
Loans(1) - - - 159,505 - 159,505Other financial assets
Clients’ liability under acceptances - - - 376 - 376Premiums receivable - - - 1,662 - 1,662Derivative financial instruments 2,133 - - - 2,685 4,818Amounts receivable from clients, brokers and
financial institutions - - - 2,033 - 2,033Other - - - 1,096 - 1,096
Total financial assets $ 12,413 $ 18,512 $ 23,569 $ 173,895 $ 2,685 $ 231,074
Financial liabilitiesDeposits $ - $ - $ - $ 156,574 $ - $ 156,574
Other financial liabilitiesAcceptances - - - 376 - 376Commitments related to securities sold short 5,464 - - - - 5,464Commitments related to securities lent or sold
under repurchase agreements - - - 10,383 - 10,383
Derivative financial instruments 1,568 - - - 121 1,689Amounts payable to clients, brokers and
financial institutions - - - 4,713 - 4,713
Other 337 - - 3,810 - 4,147
Subordinated notes - - - 1,884 - 1,884
Total financial liabilities $ 7,369 $ - $ - $ 177,740 $ 121 $ 185,230
(1) For more information, see Note 6, “Loans and allowance for credit losses”.(2) For details on derivatives designated as hedging instruments, see Note 9, “Derivative financial instruments and hedging activities”.

DESJARDINS GROUP INTERIM FINANCIAL REPORT
Second quarter – June 30, 2016 48
NOTE 4 – FAIR VALUE OF FINANCIAL INSTRUMENTS
DETERMINATION OF THE FAIR VALUE OF FINANCIAL INSTRUMENTS
There is little subjectivity in the determination of the fair value of financial instruments, especially securities and commitments related to securities soldshort, obtained from quoted prices on active markets. This fair value is based on the quoted price within the bid-ask spread that is most representative offair value in the circumstances.
If there are no quoted prices on active markets, fair value is determined using models that maximize the use of observable inputs and minimize the use ofunobservable inputs. In such cases, fair value estimates are established using valuation techniques such as cash flow discounting, comparisons withsimilar financial instruments, option pricing models and other valuation techniques commonly used by market participants, if these techniques have beendemonstrated to provide reliable estimates. Valuation techniques rely on assumptions concerning the amount and timing of estimated future cash flowsand discount rates that are mainly based on observable data, such as interest rate yield curves, exchange rates, credit curves and volatility factors. Whenone or several material inputs are not observable on the market, fair value is determined mainly based on internal inputs and estimates that take intoaccount the characteristics specific to the financial instrument and any factor relevant to the measurement. For complex financial instruments, significantjudgment is made in determining the valuation technique to be used and in selecting inputs and adjustments associated with this technique. Due to theneed to use estimates and make judgments when applying many valuation techniques, fair value estimates for identical or similar assets may differbetween entities. Fair value reflects market conditions on a given date and may not be representative of future fair values. It should not be considered asbeing realizable in the event of immediate settlement of these instruments.
For more information on the valuation techniques used to determine the fair value of the main financial instruments, refer to Note 2, “Basis of presentationand significant accounting policies”, to the Annual Combined Financial Statements.
Financial instruments whose fair value equals carrying amount
The carrying amount of certain financial instruments that mature in the next 12 months is a reasonable approximation of their fair value. These financialinstruments include the following items: “Cash and deposits with financial institutions”; “Securities borrowed or purchased under reverse repurchaseagreements”; “Clients’ liability under acceptances”; “Premiums receivable”; “Amounts receivable from clients, brokers and financial institutions”; someitems included in “Other assets – Other”; “Acceptances”; “Commitments related to securities lent or sold under repurchase agreements”; “Amountspayable to clients, brokers and financial institutions”; and some items included in “Other liabilities – Other”.
FAIR VALUE OF FINANCIAL INSTRUMENTS
The following table presents financial instruments whose carrying amount does not equal fair value.
As at June 30, 2016 As at December 31, 2015Carrying Fair Carrying Fairamount value amount value
Financial assets
Loans $ 162,686 $ 163,120 $ 159,505 $ 159,776
Financial liabilities
Deposits 163,662 163,844 156,574 156,878
Subordinated notes 1,384 1,548 1,884 2,061
FAIR VALUE HIERARCHY
The fair value measurement of financial instruments is determined using the following three-level fair value hierarchy:
Level 1 – Measurement based on quoted prices (unadjusted) in active markets for identical assets or liabilities; Level 2 – Valuation techniques based primarily on observable market data; Level 3 – Valuation techniques not based primarily on observable market data.
Transfers between levels
Transfers between hierarchy levels for instruments measured at fair value are made at the reporting date.

DESJARDINS GROUP INTERIM FINANCIAL REPORT
Second quarter – June 30, 2016 49
NOTE 4 – FAIR VALUE OF FINANCIAL INSTRUMENTS (continued)
HIERARCHY OF FINANCIAL INSTRUMENTS MEASURED AT FAIR VALUE
The following tables present the hierarchy for financial instruments measured at fair value in the Combined Balance Sheets.
As at June 30, 2016 Level 1 Level 2 Level 3 TotalFinancial assetsFinancial assets at fair value through profit or loss
Cash and deposits with financial institutions $ 5 $ 75 $ - $ 80
Securities at fair value through profit or lossDebt securities issued or guaranteed by
Canadian governmental entities 7,752 515 - 8,267
Provincial governmental entities and municipal corporations in Canada 16,701 1,145 - 17,846
School or public corporations in Canada 31 114 - 145Foreign public administrations 334 - - 334
Other securitiesFinancial institutions 30 924 62 1,016Other issuers 1 1,809 1,845 3,655Equity securities 995 220 99 1,314
25,849 4,802 2,006 32,657Derivative financial instruments
Interest rate contracts - 1,712 - 1,712Foreign exchange contracts - 1,107 - 1,107Other contracts - 1,100 - 1,100
- 3,919 - 3,919Total financial assets at fair value through profit or loss 25,849 8,721 2,006 36,576Available-for-sale financial assets
Cash and deposits with financial institutions 15 264 - 279
Available-for-sale securitiesDebt securities issued or guaranteed by
Canadian governmental entities 5,867 2,036 - 7,903Provincial governmental entities and municipal corporations in Canada 9,665 1,210 - 10,875School or public corporations in Canada 8 - - 8Foreign public administrations 13 25 - 38
Other securitiesFinancial institutions - 1,309 - 1,309Other issuers - 465 105 570Equity securities 2,258 552 121 2,931
Total available-for-sale financial assets(1) 17,826 5,861 226 23,913
Financial instruments of segregated funds 4,988 5,272 13 10,273Total financial assets $ 48,663 $ 19,854 $ 2,245 $ 70,762
Financial liabilitiesFinancial liabilities held for tradingOther liabilities
Commitments related to securities sold short $ 6,747 $ 198 $ - $ 6,945
Other - - 207 2076,747 198 207 7,152
Derivative financial instrumentsInterest rate contracts - 416 - 416Foreign exchange contracts - 422 - 422Other contracts - 1,051 - 1,051
- 1,889 - 1,889Total financial liabilities $ 6,747 $ 2,087 $ 207 $ 9,041(1) As at June 30, 2016, certain available-for-sale securities having a carrying amount of $2 million were recognized at cost since their fair value cannot reliably be measured.

DESJARDINS GROUP INTERIM FINANCIAL REPORT
Second quarter – June 30, 2016 50
NOTE 4 – FAIR VALUE OF FINANCIAL INSTRUMENTS (continued)
HIERARCHY OF FINANCIAL INSTRUMENTS MEASURED AT FAIR VALUE (continued)
As at December 31, 2015 Level 1 Level 2 Level 3 TotalFinancial assetsFinancial assets at fair value through profit or loss
Cash and deposits with financial institutions $ 7 $ 70 $ - $ 77Securities at fair value through profit or loss
Debt securities issued or guaranteed byCanadian governmental entities 6,810 500 - 7,310Provincial governmental entities and municipal corporations in Canada 13,886 1,090 - 14,976School or public corporations in Canada 29 111 - 140Foreign public administrations 311 - - 311
Other securitiesFinancial institutions 29 1,054 72 1,155Other issuers - 1,796 1,879 3,675Equity securities 872 208 68 1,148
21,944 4,829 2,019 28,792
Derivative financial instrumentsInterest rate contracts - 1,544 - 1,544Foreign exchange contracts - 2,253 - 2,253Other contracts - 1,021 - 1,021
- 4,818 - 4,818Total financial assets at fair value through profit or loss 21,944 9,647 2,019 33,610Available-for-sale financial assets
Cash and deposits with financial institutions - 297 - 297Available-for-sale securities
Debt securities issued or guaranteed byCanadian governmental entities 5,895 2,025 - 7,920Provincial governmental entities and municipal corporations in Canada 9,966 938 - 10,904School or public corporations in Canada 8 - - 8Foreign public administrations 13 28 - 41
Other securitiesFinancial institutions - 1,218 - 1,218Other issuers - 396 106 502Equity securities 1,999 547 131 2,677
Total available-for-sale financial assets(1)17,881 5,449 237 23,567
Financial instruments of segregated funds 4,961 4,822 8 9,791Total financial assets $ 44,786 $ 19,918 $ 2,264 $ 66,968
Financial liabilitiesFinancial liabilities held for tradingOther liabilities
Commitments related to securities sold short $ 5,297 $ 167 $ - $ 5,464Other - - 337 337
5,297 167 337 5,801
Derivative financial instrumentsInterest rate contracts - 417 - 417Foreign exchange contracts - 250 - 250Other contracts - 984 38 1,022
- 1,651 38 1,689Total financial liabilities $ 5,297 $ 1,818 $ 375 $ 7,490(1)
As at December 31, 2015, certain available-for-sale securities having a carrying amount of $2 million were recognized at cost since their fair value cannot reliably bemeasured.
During the six-month period ended June 30, 2016 and the year ended December 31, 2015, no material transfers attributable to changes in theobservability of market data were made between hierarchy levels for instruments measured at fair value.

DESJARDINS GROUP INTERIM FINANCIAL REPORT
Second quarter – June 30, 2016 51
NOTE 4 – FAIR VALUE OF FINANCIAL INSTRUMENTS (continued)
FAIR VALUE OF FINANCIAL INSTRUMENTS CATEGORIZED WITHIN LEVEL 3
Valuation process for financial instruments categorized within Level 3
Desjardins Group has implemented various key controls and procedures to ensure that financial instruments categorized within Level 3 are appropriatelyand reliably measured. The financial governance framework provides for independent monitoring and segregation of duties in that respect.
The most significant financial instruments categorized within Level 3 that are held by Desjardins Group are asset-backed term notes (ABTN), mortgagebonds, equity securities, the financial liability related to put options written on certain non-controlling interests as well as the financial liability related to acontingent consideration resulting from a price adjustment clause for certain property and casualty insurance contracts acquired.
Desjardins Group uses an internal model to measure ABTNs. Data obtained from third parties are used to validate this measurement afterwards, and anysignificant difference is analyzed. In addition, the results from this model are frequently compared with certain credit indexes and other relevant indicators.
For mortgage bonds, Desjardins Group developed a list of parameters based on comparable inputs that is reviewed annually and adjusted based onmarket trends. Tests are performed quarterly to ensure that the rates used by the system are consistent with this list and evolve reasonably.
Desjardins Group measures the majority of equity securities based on brokers' valuations obtained from independent third parties and it reviews andapproved the data obtained.
In connection with the acquisition of Qtrade Canada Inc., which was completed in 2013, Desjardins Group wrote in favour of certain holders of non-controlling interests put options that give them the right to sell their interests at predetermined dates at a price representing fair value as at such date(hereinafter referred to as “Financial liability related to put options”). The main inputs used in the measurement of this financial liability are derived frominternal forecasts prepared by the management of the acquiree and estimates made by Desjardins Group. The internal forecasts and assumptions onwhich this valuation technique is based have been prepared by an independent third party and have been reviewed and approved afterwards byDesjardins Group.
In connection with the acquisition of the Canadian businesses of State Farm Mutual Automobile Insurance Company (State Farm), Desjardins Grouprecognized a contingent consideration resulting from the price adjustment clause of the agreement. State Farm will compensate Desjardins Group for 95%of the unfavourable development of the provision for claims and adjustment expenses related to the property and casualty insurance contracts transferredas part of the acquisition, while Desjardins Group will have to give State Farm 90% of the favourable development of such provision.
Sensitivity of financial instruments categorized within Level 3
Desjardins Group performs sensitivity analyses to measure the fair value of financial instruments categorized within Level 3. Changing unobservableinputs to one or more reasonably possible alternative assumptions does not significantly change the fair value of financial instruments categorized withinLevel 3.

DESJARDINS GROUP INTERIM FINANCIAL REPORT
Second quarter – June 30, 2016 52
NOTE 4 – FAIR VALUE OF FINANCIAL INSTRUMENTS (continued)
FAIR VALUE OF FINANCIAL INSTRUMENTS CATEGORIZED WITHIN LEVEL 3 (continued)
Changes in fair value of financial instruments categorized within Level 3
The following tables present the changes in fair value of financial instruments categorized within Level 3 of the hierarchy, namely financial instrumentswhose fair value is determined using valuation techniques not based mainly on observable market data.
Unrealized
Realized Unrealized gains / losses
Balance gains / losses gains / losses recognized Transfers of Balance
at recognized in recognized in in other instruments at
For the six-month period beginning profit or profit or comprehensive into (out of) Purchases / Sales / end of
ended June 30, 2016 of period loss(1) loss(2) income(3) Level 3 Issuances Settlements period
Financial assets
Financial assets at fair value
through profit or loss
Securities at fair value through profit or loss
Other securities
Financial institutions
Mortgage bonds $ 72 $ - $ - $ - $ - $ - $ (10) $ 62
Other issuers
Hedge funds 8 - - - - - - 8
Asset-backed term notes 801 - 7 - - - (2) 806
Mortgage bonds 1,043 - 8 - - 5 (25) 1,031
Financial asset-backed securities 27 - 1 - - - (28) -
Equity securities 68 - - - - 47 (16) 99
Total financial assets at fair
value through profit or loss 2,019 - 16 - - 52 (81) 2,006
Available-for-sale financial assets
Available-for-sale securities
Other securities
Other issuers
Mortgage bonds 106 - - 1 - - (2) 105
Equity securities 131 1 (2) 25 (38) 13 (9) 121
Total available-for-sale financial assets 237 1 (2) 26 (38) 13 (11) 226
Financial instruments of segregated funds 8 - - - - 5 - 13
Total financial assets $ 2,264 $ 1 $ 14 $ 26 $ (38) $ 70 $ (92) $ 2,245
Financial liabilities
Financial liabilities held for trading
Other liabilities - Other
Financial liability related to put options $ 79 $ - $ 2 $ - $ - $ - $ - $ 81
Financial liability related to the contingent
consideration 258 - 23 - - - (155) 126
Derivative financial instruments
Other contracts - Other 38 - - - (38) - - -
Total financial liabilities $ 375 $ - $ 25 $ - $ (38) $ - $ (155) $ 207
(1) Realized gains or losses on financial assets held for trading and designated as at fair value through profit or loss are presented under “Net income (loss) on securities at
fair value through profit or loss”. Realized gains or losses on available-for-sale financial assets are recognized under “Net income on available-for-sale securities”.(2)
Unrealized gains or losses on financial assets held for trading and designated as at fair value through profit or loss are presented under “Net income (loss) on securities
at fair value through profit or loss”.(3)
Unrealized gains or losses on available-for-sale financial assets are recognized under “Net unrealized gains (losses) on available-for-sale securities” in the Combined
Statements of Comprehensive Income.

DESJARDINS GROUP INTERIM FINANCIAL REPORT
Second quarter – June 30, 2016 53
NOTE 4 – FAIR VALUE OF FINANCIAL INSTRUMENTS (continued)
FAIR VALUE OF FINANCIAL INSTRUMENTS CATEGORIZED WITHIN LEVEL 3 (continued)
Changes in fair value of financial instruments categorized within Level 3 (continued)
UnrealizedRealized Unrealized gains / losses
Balance gains / losses gains / losses recognized Transfers of Balanceat recognized in recognized in in other instruments at
For the six-month period beginning profit or profit or comprehensive into (out of) Purchases / Sales / end ofended June 30, 2015 of period loss
(1)loss
(2)income
(3)Level 3 Issuances Settlements period
Financial assets
Financial assets at fair value
through profit or loss
Securities at fair value through profit or loss
Other securities
Financial institutions
Mortgage bonds $ 72 $ - $ 1 $ - $ - $ - $ - $ 73
Other issuers
Hedge funds 10 - (3) - - - - 7
Asset-backed term notes 1,641 - 34 - - - (877) 798
Mortgage bonds 850 - 5 - - 29 (15) 869
Financial asset-backed securities 26 - - - - - - 26
Equity securities 21 - - - - 42 - 63
Total financial assets at fair
value through profit or loss 2,620 - 37 - - 71 (892) 1,836
Available-for-sale financial assets
Available-for-sale securities
Other securities
Other issuers
Mortgage bonds 107 - - 1 - - (1) 107
Equity securities 43 (2) - 13 - 68 (7) 115
Total available-for-sale financial assets 150 (2) - 14 - 68 (8) 222
Total financial assets $ 2,770 $ (2) $ 37 $ 14 $ - $ 139 $ (900) $ 2,058
Financial liabilities
Financial liabilities held for trading
Other liabilities - Other
Financial liability related to put options $ 91 $ - $ 3 $ - $ - $ - $ (7) $ 87
Financial liability related to the contingent
consideration - - 87 - - 113 - 200
Derivative financial instruments
Other contracts - Other 17 (2) 10 - - 2 (6) 21
Total financial liabilities $ 108 $ (2) $ 100 $ - $ - $ 115 $ (13) $ 308
(1) Realized gains or losses on financial assets held for trading and designated as at fair value through profit or loss are presented under “Net income (loss) on securities atfair value through profit or loss”. Realized gains or losses on available-for-sale financial assets are recognized under “Net income on available-for-sale securities”.
(2) Unrealized gains or losses on financial assets held for trading and designated as at fair value through profit or loss are presented under “Net income (loss) on securitiesat fair value through profit or loss”.
(3) Unrealized gains or losses on available-for-sale financial assets are recognized under “Net unrealized gains (losses) on available-for-sale securities” in the CombinedStatements of Comprehensive Income.

DESJARDINS GROUP INTERIM FINANCIAL REPORT
Second quarter – June 30, 2016 54
NOTE 4 – FAIR VALUE OF FINANCIAL INSTRUMENTS (continued)
Valuation techniques and inputs used to measure the fair value of financial instruments categorized within Level 3
The following tables present the main techniques and inputs used to measure the fair value of the significant financial instruments categorized withinLevel 3.
Fair Main valuation Unobservable InputAs at June 30, 2016 value techniques inputs value rangesFinancial assets
SecuritiesAsset-backed term notes $ 806 Internal model(1) Illiquidity premium(B) 1.07%
Credit spread(B,C) 0 bp to 300 bpMortgage bonds 1,198 Discounted cash flows Comparable inputs(B,C) 0 bp to 520 bpEquity securities 220 Brokers' valuations Brokers' inputs - - (2)
Other financial assets(3) 21
Total financial assets $ 2,245
Financial liabilitiesOther liabilities - Other
Enterprise value(A,C) - - (4)
Discount rate(B,C) 7.5%Financial liability related to put options $ 81 Discounted cash flows Put option exercise date(B,C) 1 year to 3.5 yearsFinancial liability related to the Provision for claims and
contingent consideration 126 Actuarial techniques(5) adjustment expenses(B) - - (6)
Total financial liabilities $ 207
Fair Main valuation Unobservable Input
As at December 31, 2015 value techniques inputs value ranges
Financial assets
Securities
Asset-backed term notes $ 801 Internal model(1) Illiquidity premium(B) 2%
Credit spread(B,C) 0 bp to 300 bp
Mortgage bonds 1,221 Discounted cash flows Comparable inputs(B,C) 0 bp to 520 bp
Proportion of credit spread(B,C) 75%38 Option valuation model Increase in exercise price(B,C) 5%
Equity securities 161 Brokers' valuations Brokers' inputs - - (2)
Other financial assets(3) 43
Total financial assets $ 2,264
Financial liabilities
Other liabilities - Other
Enterprise value(A,C) - - (4)
Discount rate(B,C) 7.5%
Financial liability related to put options $ 79 Discounted cash flows Put option exercise date(B,C) 6 months to 4 years
Financial liability related to the Provision for claims andcontingent consideration 258 Actuarial techniques(5) adjustment expenses(B) - - (6)
Other financial liabilities(7) 38
Total financial liabilities $ 375
(1) For a description of the internal model, see the “Securities – Asset-backed term notes” section of Note 5, “Securities”.(2)
Due to the nature of this type of investment, no input value range is presented.(3) Include other financial assets such as financial asset-backed securities.(4) Due to the wide-ranging operations of the underlying business lines associated with the enterprise value, no input value range is presented.(5) The actuarial techniques used to measure prospectively the provision for claims and adjustment expenses are in accordance with Canadian accepted actuarial practices.(6)
Due to the nature of this financial liability, no input value range is presented.(7) Include other financial liabilities such as other derivative financial instrument contracts.
Fair value sensitivity to changes in unobservable inputs
(A) An increase (decrease) in this unobservable input, taken individually, generally results in an increase (decrease) in fair value.(B) An increase (decrease) in this unobservable input, taken individually, generally results in a decrease (increase) in fair value.(C)
There is no predictable relationship between this input and other material unobservable inputs.

DESJARDINS GROUP INTERIM FINANCIAL REPORT
Second quarter – June 30, 2016 55
NOTE 5 – SECURITIES
UNREALIZED GAINS AND LOSSES ON AVAILABLE-FOR-SALE SECURITIES
The following tables present unrealized gains and losses on available-for-sale securities.
Amortized Unrealized Unrealized CarryingAs at June 30, 2016 cost gross gains gross losses amountDebt securities issued or guaranteed by:
Canadian governmental entities $ 7,788 $ 117 $ 2 $ 7,903
Provincial governmental entities and municipalcorporations in Canada 10,596 280 1 10,875
School or public corporations in Canada 8 - - 8
Foreign public administrations 38 1 1 38
Other securitiesFinancial institutions 1,303 8 2 1,309
Other issuers 545 26 - 571
Equity securities (1) 2,727 325 120 2,932
$ 23,005 $ 757 $ 126 $ 23,636
Amortized Unrealized Unrealized CarryingAs at December 31, 2015 cost gross gains gross losses amountDebt securities issued or guaranteed by:
Canadian governmental entities $ 7,807 $ 116 $ 3 $ 7,920Provincial governmental entities and municipal
corporations in Canada 10,706 211 13 10,904School or public corporations in Canada 8 - - 8Foreign public administrations 40 1 - 41
Other securitiesFinancial institutions 1,217 5 4 1,218Other issuers 486 19 2 503Equity securities 2,524 304 150 2,678
$ 22,788 $ 656 $ 172 $ 23,272
(1) Since January 1, 2016, the measurement of impairment losses on preferred shares having debt-like features and behaviour has been based on whether there is
any objective evidence of impairment as well as on the judgment made concerning the recovery of the invested amounts.
Impairment losses recognized
During the six-month period ended June 30, 2016, Desjardins Group concluded that there was objective evidence of impairment. Impairment losses of $12million ($14 million for the three-month period ended June 30, 2015) and $14 million ($31 million for the six-month period ended June 30, 2015) onavailable-for-sale securities were recognized under “Net income on available-for-sale securities” in the Combined Statements of Income.
SECURITIES – ASSET-BACKED TERM NOTES (ABTN)
Desjardins Group holds ABTNs from Master Asset Vehicles (MAV) having a fair value and a nominal value of $806 million and $840 million, respectively,as at June 30, 2016 ($801 million and $844 million as at December 31, 2015) and allocated among MAV 1 and MAV 3, with substantially all of the valueattributable to MAV 1.
The credit default swaps serving as an economic hedge for ABTNs had a negative fair value of $1 million as at June 30, 2016 (negative fair value of $3million as at December 31, 2015). For information on the ABTN measurement methodology, see the “Securities – Asset-backed term notes” section ofNote 6, “Securities”, and Note 4, “Fair value of financial instruments”, to the 2015 Annual Combined Financial Statements.
Desjardins Group participates, for an amount of $1,193 million, in the margin funding facility (MFF) intended to cover any potential collateral calls from thecounterparties to the credit default swaps of MAV 1. As at June 30, 2016, no amount had been drawn on the MFF. In addition, Desjardins Grouppurchased a $400 million protection for its commitments under the MFF. For more information on the terms of the MFF and acquired protection, see the“Securities – Asset-backed term notes” section of Note 6, “Securities”, to the 2015 Annual Combined Financial Statements.
Impact on profit or loss
A gain of $4 million related to the fair value of ABTNs was recognized in Desjardins Group's Combined Statement of Income for the three-month periodended June 30, 2016 (gain of $3 million for the three-month period ended June 30, 2015) and a gain of $7 million was recognized for the six-month periodended June 30, 2016 (gain of $34 million for the six-month period ended June 30, 2015). In addition, no gain related to the derivative financial instrumentshedging ABTNs was recognized for the three-month period ended June 30, 2016 (gain of $1 million for the three-month period ended June 30, 2015) anda gain of $1 million was recognized for the six-month period ended June 30, 2016 (immaterial loss for the six-month period ended June 30, 2015).

DESJARDINS GROUP INTERIM FINANCIAL REPORT
Second quarter – June 30, 2016 56
NOTE 6 – LOANS AND ALLOWANCE FOR CREDIT LOSSES
LOANS, IMPAIRED LOANS AND ALLOWANCES FOR CREDIT LOSSES
The following tables present the credit quality of loans.
Gross loans Gross loans Grossneither past due past due but impaired Individual Collective
As at June 30, 2016 nor impaired not impaired loans allowances allowance(1) Net loansResidential mortgages $ 102,732 $ 2,046 $ 199 $ 20 $ 44 $ 104,913Consumer, credit card and other
personal loans 20,713 680 93 16 131 21,339Business and government 35,930 477 275 89 159 36,434
$ 159,375 $ 3,203 $ 567 $ 125 $ 334 $ 162,686(1)
Includes the collective allowance on impaired loans of $20 million.
Gross loans Gross loans Grossneither past due past due but impaired Individual Collective
As at December 31, 2015 nor impaired not impaired loans allowances allowance(1) Net loansResidential mortgages $ 99,960 $ 2,181 $ 182 $ 18 $ 46 $ 102,259Consumer, credit card and other
personal loans 20,350 755 99 18 131 21,055Business and government 35,777 396 260 85 157 36,191
$ 156,087 $ 3,332 $ 541 $ 121 $ 334 $ 159,505(1)
Includes the collective allowance on impaired loans of $19 million.
GROSS LOANS PAST DUE BUT NOT IMPAIRED
The following tables present the aging of gross loans that are past due but not impaired.
1 to 30 to 60 to 90 daysAs at June 30, 2016 29 days 59 days 89 days or more TotalResidential mortgages $ 1,689 $ 156 $ 69 $ 132 $ 2,046Consumer, credit card and other
personal loans 494 109 51 26 680Business and government 321 30 33 93 477
$ 2,504 $ 295 $ 153 $ 251 $ 3,203
1 to 30 to 60 to 90 daysAs at December 31, 2015 29 days 59 days 89 days or more TotalResidential mortgages $ 1,690 $ 249 $ 88 $ 154 $ 2,181Consumer, credit card and other
personal loans 516 155 58 26 755Business and government 227 44 33 92 396
$ 2,433 $ 448 $ 179 $ 272 $ 3,332
ALLOWANCES FOR CREDIT LOSSES
The following table presents the changes in allowances for credit losses.
Residential Consumer, credit card and Business andmortgages other personal loans government Total
For the six-month periods2016 2015 2016 2015 2016 2015 2016 2015ended June 30
Balance at beginning of period $ 65 $ 65 $ 189 $ 176 $ 307 $ 306 $ 561 $ 547Provision for credit losses 14 9 153 161 (1) 22 166 192
Write-offs and recoveries (14) (9) (156) (147) (10) (12) (180) (168)Balance at end of period $ 65 $ 65 $ 186 $ 190 $ 296 $ 316 $ 547 $ 571
Composed of:Allowance for credit losses $ 64 $ 64 $ 147 $ 151 $ 248 $ 261 $ 459 $ 476
Allowance for off-balancesheet items(1) 1 1 39 39 48 55 88 95
(1) The allowance for off-balance sheet items is presented under “Other liabilities – Other”.

DESJARDINS GROUP INTERIM FINANCIAL REPORT
Second quarter – June 30, 2016 57
NOTE 7 – COVERED BONDS
Structured entities are in place to guarantee principal and interest payments owing to the holders of the covered bonds issued by Desjardins Group. Theoperations of each of these entities are included in the Combined Financial Statements of Desjardins Group as they are controlled by Desjardins Group.Desjardins Group sold residential mortgage loans to one or another of these entities and granted them financing to facilitate the acquisition of theseassets. The financing granted by Desjardins Group may reach a maximum amount equal to the outstanding loans held by these entities for purposes ofguaranteeing the covered bonds issued. Under the terms and conditions of each of the issuance agreements, Desjardins Group has limited access to theassets that are legally owned by one or another of these structured entities. The assets, totalling $8,835 million as at June 30, 2016 ($8,116 million as atDecember 31, 2015), are presented under “Loans – Residential mortgages” in the Combined Balance Sheets, and the covered bonds, amounting to$6,225 million as at June 30, 2016 ($7,954 million as at December 31, 2015), are presented under “Deposits – Business and government”.
NOTE 8 – DEPOSITS
Deposits consist of demand deposits (payable on demand), notice deposits (payable upon notice) and term deposits (payable on a fixed date). Demanddeposits are interest-bearing or non-interest-bearing deposits, primarily accounts with chequing privileges, for which Desjardins Group does not have theright to require notice prior to withdrawal. Notice deposits are interest-bearing deposits, primarily savings accounts, for which Desjardins Group has thelegal right to require notice prior to withdrawal. Term deposits are interest-bearing deposits, primarily fixed-term deposit accounts, guaranteed investmentcertificates or other similar instruments, with a term that generally varies from 1 day to 10 years and mature on a predetermined date.
The following table presents the breakdown of deposits.
As at June 30, 2016 As at December 31, 2015Payable Payable Payable Payable Payable Payable
on upon on a on upon on ademand notice fixed date Total demand notice fixed date Total
Individuals $ 39,469 $ 3,868 $ 50,251 $ 93,588 $ 38,079 $ 3,740 $ 49,424 $ 91,243
Business and government 23,215 309 44,531 68,055 19,869 368 43,596 63,833
Deposit-taking institutions 1,372 - 647 2,019 1,200 - 298 1,498
$ 64,056 $ 4,177 $ 95,429 $ 163,662 $ 59,148 $ 4,108 $ 93,318 $ 156,574

DESJARDINS GROUP INTERIM FINANCIAL REPORT
Second quarter – June 30, 2016 58
NOTE 9 – DERIVATIVE FINANCIAL INSTRUMENTS AND HEDGING ACTIVITIES
The following table presents the fair value of derivative financial instruments recognized in the Combined Balance Sheets.
As at June 30, 2016 As at December 31, 2015
Notional Notionalamount Assets Liabilities amount Assets Liabilities
Designated as hedging instruments
Fair value hedges $ 33,075 $ 1,285 $ 262 $ 35,347 $ 2,296 $ 73
Cash flow hedges 23,083 333 39 21,686 389 48
Total - Designated as hedging instruments 56,158 1,618 301 57,033 2,685 121
Trading purposes 166,022 2,301 1,588 169,774 2,133 1,568
Total derivative financial instruments beforeimpact of master netting agreements 222,180 3,919 1,889 226,807 4,818 1,689
Less :
Impact of master netting agreements(1) - 629 629 - 538 538
Total derivative financial instruments afterimpact of master netting agreements $ 222,180 $ 3,290 $ 1,260 $ 226,807 $ 4,280 $ 1,151
(1) Impact of offsetting credit exposure when Desjardins Group holds master netting agreements without the intention of settling on a net basis or simultaneously.
HEDGING ACTIVITIES
The following table presents the net amounts related to the ineffectiveness of fair value hedges and cash flow hedges that are recognized under “Netincome (loss) on securities at fair value through profit or loss” in the Combined Statements of Income.
For the three-month periods For the six-month periodsended June 30 ended June 30
2016 2015 2016 2015Fair value hedge ineffectiveness $ - $ 4 $ 11 $ 32Cash flow hedge ineffectiveness (7) - (7) 7
NOTE 10 – CAPITAL STOCK
ISSUANCE OF SHARES
During the six-month period ended June 30, 2016, the Federation issued 32,565,808 F capital shares for a cash consideration of $326 million. In addition,the Federation issued 10,062,747 F capital shares having a value of $100 million as interest payments when the holders elected to receive theirremuneration in F capital shares.
NOTE 11 – ACCUMULATED OTHER COMPREHENSIVE INCOME
The following table presents the main components of “Accumulated other comprehensive income” (net of taxes).
As at June 30, 2016 As at December 31, 2015Non-controlling Non-controlling
Group's interests' Group's interests'share share share share
Items that will be reclassified subsequently to theCombined Statements of IncomeNet unrealized gains on available-for-sale securities $ 463 $ 8 $ 324 $ 36
Net gains on derivative financial instrumentsdesignated as cash flow hedges 266 1 263 2
Net unrealized exchange gains on the translation of a netinvestment in a foreign operation, net of hedging transactions 1 - 2 -
Accumulated other comprehensive income $ 730 $ 9 $ 589 $ 38

DESJARDINS GROUP INTERIM FINANCIAL REPORT
Second quarter – June 30, 2016 59
NOTE 12 – CAPITAL MANAGEMENT
The goal of capital management at Desjardins Group is to ensure that a sufficient level of high-quality capital is maintained for the following reasons: tohave flexibility for its development, to maintain favourable credit ratings and to maintain the confidence of depositors and financial markets.
Desjardins Group’s capital ratios are calculated according to the guideline on adequacy of capital base standards applicable to financial servicescooperatives (the guideline) issued by the AMF and are expressed as a percentage of regulatory capital over risk-weighted assets.
Designated by the AMF as a domestic systemically important financial institution, Desjardins Group must maintain a minimum Tier 1A capital ratio of 8.0%.In addition, its Tier 1 capital ratio and total capital ratio must be above 9.5% and 11.5%, respectively.
Since January 1, 2015, Desjardins Group has been required by the AMF to meet a minimum leverage ratio of 3%. The leverage ratio is defined as anindependent risk measurement corresponding to the capital measure (namely Tier 1 capital) divided by the exposure measure. The exposure measureincludes: 1) on-balance sheet exposures; 2) securities financing transaction exposures; 3) derivative exposures; and 4) other off-balance sheet exposures.
As mentioned in Note 10, “Capital stock”, the Federation issued F capital shares in 2016 for gross proceeds of $426 million, of which $100 million was asinterest payments to holders who elected to receive their remuneration in shares.
In addition, on June 1, 2016, Desjardins Group called all of its Series F subordinated notes in the amount of $500 million.
As at June 30, 2016, Desjardins Group was in compliance with the AMF's capital ratio and leverage ratio regulatory requirements.
NOTE 13 – NET INCOME (LOSS) ON SECURITIES AT FAIR VALUE THROUGH PROFIT OR LOSS
FINANCIAL INSTRUMENTS HELD FOR TRADING
The following table presents the impact of income (loss) from financial instruments held for trading on the Combined Statements of Income.
For the three-month periods For the six-month periodsended June 30 ended June 30
2016 2015 2016 2015Income
Net interest income $ 13 $ 7 $ 23 $ 12
Net income (loss) on securities at fair value through profit or loss 127 (69) 334 63$ 140 $ (62) $ 357 $ 75
FINANCIAL INSTRUMENTS DESIGNATED AS AT FAIR VALUE THROUGH PROFIT OR LOSS
The following table presents the impact of income (loss) from financial instruments designated as at fair value through profit or loss on the CombinedStatements of Income.
For the three-month periods For the six-month periodsended June 30 ended June 30
2016 2015 2016 2015Income
Net interest income $ 1 $ 3 $ 1 $ 3Net income (loss) on securities at fair value through profit or loss 751 (543) 1,056 499
$ 752 $ (540) $ 1,057 $ 502

DESJARDINS GROUP INTERIM FINANCIAL REPORT
Second quarter – June 30, 2016 60
NOTE 14 – SEGMENTED INFORMATION
RESULTS BY BUSINESS SEGMENT
The following tables provide a summary of Desjardins Group’s financial results by business segment.
Personal Services Wealthand Business Management and Property and
and Institutional Life and Health CasualtyServices Insurance Insurance Other Combined
For the three-month periodsended June 30 2016 2015 2016 2015 2016 2015 2016 2015 2016 2015Net interest income $ 982 $ 1,003 $ - $ - $ 1 $ - $ 70 $ 54 $ 1,053 $ 1,057Net premiums - - 1,000 978 797 785 (57) (65) 1,740 1,698Other income 511 511 1,196 (116) 163 2 (123) (137) 1,747 260Total income 1,493 1,514 2,196 862 961 787 (110) (148) 4,540 3,015Provision for credit losses 79 103 - - - - (4) - 75 103Claims, benefits, annuities and
changes in insurance contractliabilities - - 1,492 100 569 236 4 (4) 2,065 332
Non-interest expense 1,105 1,086 548 521 326 293 (114) (119) 1,865 1,781Operating surplus earnings 309 325 156 241 66 258 4 (25) 535 799Income taxes on surplus earnings 83 86 32 46 17 64 (24) (26) 108 170Surplus earnings before member
dividends(1) 226 239 124 195 49 194 28 1 427 629Member dividends, net of
income tax recovery 16 24 - - - - - - 16 24Net surplus earnings for the period
after member dividends $ 210 $ 215 $ 124 $ 195 $ 49 $ 194 $ 28 $ 1 $ 411 $ 605
of which:
Group’s share $ 210 $ 215 $ 115 $ 147 $ 39 $ 169 $ 26 $ - $ 390 $ 531Non-controlling interests’ share - - 9 48 10 25 2 1 21 74
(1) For the three-month periods ended June 30, 2016 and 2015, the Group’s share of “Surplus earnings before member dividends” was respectively $226 million and
$239 million for the Personal Services and Business and Institutional Services segment, $115 million and $147 million for the Wealth Management and Life and Health
Insurance segment, $39 million and $169 million for the Property and Casualty Insurance segment and $26 million and nil for the Other category.

DESJARDINS GROUP INTERIM FINANCIAL REPORT
Second quarter – June 30, 2016 61
NOTE 14 – SEGMENTED INFORMATION (continued)
RESULTS BY BUSINESS SEGMENT (continued)
Personal Services Wealthand Business Management and Property and
and Institutional Life and Health CasualtyServices Insurance Insurance Other Combined
For the six-month periodsended June 30 2016 2015 2016 2015 2016 2015 2016 2015 2016 2015
Net interest income $ 1,959 $ 1,944 $ - $ - $ 1 $ - $ 142 $ 108 $ 2,102 $ 2,052
Net premiums - - 2,003 1,982 1,580 1,723 (122) (131) 3,461 3,574
Other income 1,020 993 2,049 1,192 285 264 (251) (137) 3,103 2,312
Total income 2,979 2,937 4,052 3,174 1,866 1,987 (231) (160) 8,666 7,938
Provision for credit losses 173 192 - - - - (7) - 166 192Claims, benefits, annuities and
changes in insurance contractliabilities - - 2,671 1,750 1,153 1,092 (1) (7) 3,823 2,835
Non-interest expense 2,207 2,157 1,099 1,055 595 553 (249) (236) 3,652 3,529
Operating surplus earnings 599 588 282 369 118 342 26 83 1,025 1,382
Income taxes on surplus earnings 162 153 61 76 30 72 (37) (12) 216 289
Surplus earnings before member
dividends (1) 437 435 221 293 88 270 63 95 809 1,093
Member dividends, net of
income tax recovery 38 54 - - - - - - 38 54
Net surplus earnings for the period
after member dividends $ 399 $ 381 $ 221 $ 293 $ 88 $ 270 $ 63 $ 95 $ 771 $ 1,039
of which:
Group’s share $ 398 $ 380 $ 201 $ 235 $ 69 $ 232 $ 61 $ 93 $ 729 $ 940
Non-controlling interests’ share 1 1 20 58 19 38 2 2 42 99(1)
For the six-month periods ended June 30, 2016 and 2015, the Group’s share of “Surplus earnings before member dividends” was respectively $436 million and$434 million for the Personal Services and Business and Institutional Services segment, $201 million and $235 million for the Wealth Management and Life and HealthInsurance segment, $69 million and $232 million for the Property and Casualty Insurance segment and $61 million and $93 million for the Other category.
SEGMENT ASSETSPersonal Services Wealth
and Business Management and Property andand Institutional Life and Health Casualty
Services Insurance Insurance Other CombinedAs at June 30, 2016 $ 194,975 $ 37,653 $ 14,557 $ 13,526 $ 260,711
As at December 31, 2015 $ 187,759 $ 35,393 $ 14,420 $ 10,556 $ 248,128