reynolds, p.m., pedersen, r.h., stormonth-darling, j., …eprints.gla.ac.uk/77594/1/77594.pdf ·...
TRANSCRIPT

Reynolds, P.M., Pedersen, R.H., Stormonth-Darling, J., Dalby, M.J., Riehle, M.O., and Gadegaard, N. (2013) Label-free segmentation of co-cultured cells on a nanotopographical gradient. Nano Letters, 13 (2). pp. 570-576. ISSN 1530-6984 Copyright © 2012 American Chemical Society A copy can be downloaded for personal non-commercial research or study, without prior permission or charge The content must not be changed in any way or reproduced in any format or medium without the formal permission of the copyright holder(s) When referring to this work, full bibliographic details must be given http://eprints.gla.ac.uk/77594/
Deposited on: 3 June 2013
Enlighten – Research publications by members of the University of Glasgow http://eprints.gla.ac.uk
Label-Free Segmentation of Co-cultured Cells on aNanotopographical GradientPaul M. Reynolds,† Rasmus H. Pedersen,† John Stormonth-Darling,† Matthew J. Dalby,‡
Mathis O. Riehle,‡ and Nikolaj Gadegaard*,†
†Division of Biomedical Engineering, School of Engineering, University of Glasgow, Glasgow, G12 8LT, United Kingdom‡Center for Cell Engineering, Institute of Molecular Cell and Systems Biology, University of Glasgow, Glasgow, G12 8QQ, UnitedKingdom
*S Supporting Information
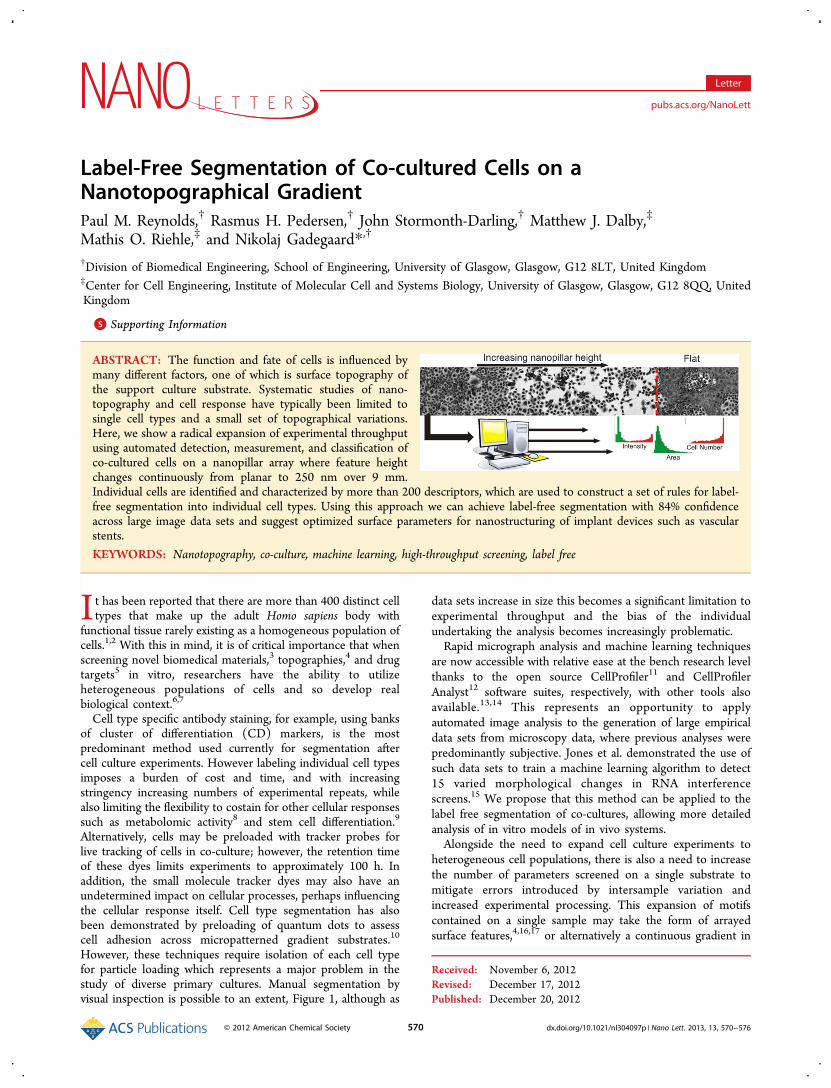
ABSTRACT: The function and fate of cells is influenced bymany different factors, one of which is surface topography ofthe support culture substrate. Systematic studies of nano-topography and cell response have typically been limited tosingle cell types and a small set of topographical variations.Here, we show a radical expansion of experimental throughputusing automated detection, measurement, and classification ofco-cultured cells on a nanopillar array where feature heightchanges continuously from planar to 250 nm over 9 mm.Individual cells are identified and characterized by more than 200 descriptors, which are used to construct a set of rules for label-free segmentation into individual cell types. Using this approach we can achieve label-free segmentation with 84% confidenceacross large image data sets and suggest optimized surface parameters for nanostructuring of implant devices such as vascularstents.
KEYWORDS: Nanotopography, co-culture, machine learning, high-throughput screening, label free
It has been reported that there are more than 400 distinct celltypes that make up the adult Homo sapiens body with
functional tissue rarely existing as a homogeneous population ofcells.1,2 With this in mind, it is of critical importance that whenscreening novel biomedical materials,3 topographies,4 and drugtargets5 in vitro, researchers have the ability to utilizeheterogeneous populations of cells and so develop realbiological context.6,7
Cell type specific antibody staining, for example, using banksof cluster of differentiation (CD) markers, is the mostpredominant method used currently for segmentation aftercell culture experiments. However labeling individual cell typesimposes a burden of cost and time, and with increasingstringency increasing numbers of experimental repeats, whilealso limiting the flexibility to costain for other cellular responsessuch as metabolomic activity8 and stem cell differentiation.9
Alternatively, cells may be preloaded with tracker probes forlive tracking of cells in co-culture; however, the retention timeof these dyes limits experiments to approximately 100 h. Inaddition, the small molecule tracker dyes may also have anundetermined impact on cellular processes, perhaps influencingthe cellular response itself. Cell type segmentation has alsobeen demonstrated by preloading of quantum dots to assesscell adhesion across micropatterned gradient substrates.10
However, these techniques require isolation of each cell typefor particle loading which represents a major problem in thestudy of diverse primary cultures. Manual segmentation byvisual inspection is possible to an extent, Figure 1, although as
data sets increase in size this becomes a significant limitation toexperimental throughput and the bias of the individualundertaking the analysis becomes increasingly problematic.Rapid micrograph analysis and machine learning techniques
are now accessible with relative ease at the bench research levelthanks to the open source CellProfiler11 and CellProfilerAnalyst12 software suites, respectively, with other tools alsoavailable.13,14 This represents an opportunity to applyautomated image analysis to the generation of large empiricaldata sets from microscopy data, where previous analyses werepredominantly subjective. Jones et al. demonstrated the use ofsuch data sets to train a machine learning algorithm to detect15 varied morphological changes in RNA interferencescreens.15 We propose that this method can be applied to thelabel free segmentation of co-cultures, allowing more detailedanalysis of in vitro models of in vivo systems.Alongside the need to expand cell culture experiments to
heterogeneous cell populations, there is also a need to increasethe number of parameters screened on a single substrate tomitigate errors introduced by intersample variation andincreased experimental processing. This expansion of motifscontained on a single sample may take the form of arrayedsurface features,4,16,17 or alternatively a continuous gradient in
Received: November 6, 2012Revised: December 17, 2012Published: December 20, 2012
Letter
pubs.acs.org/NanoLett
© 2012 American Chemical Society 570 dx.doi.org/10.1021/nl304097p | Nano Lett. 2013, 13, 570−576
which features are varied over a millimeter or centimeterscale.18,19 Surface gradients of chemistry20−22 and topogra-phy18,23 have been demonstrated, along with a combination ofthe two.24 We present a novel method for fabrication and massreplication of substrates with a continuous gradient of featureheight, in this case nanopillars. This method can be readilyapplicable to any lithographically predefined two-dimensionalpattern. On this nanopillar gradient topography, Figure 1g, wedemonstrate a technique for the rapid and efficientsegmentation of diverse cell populations without the need forextra labeling steps, by processing cell morphology andcytoskeletal structure with machine learning algorithms. Therelative response, morphological characteristics, and abundanceof each cell type may then be related to the underlyingtopography at that point, and this insight applied to the designof future tissue engineering constructs such as cardiovascularstents.25
To satisfy the need for high-volume, high-fidelity replicationof nanostructured cell culture substrates, we show replication ofa nanostructured master by injection molding of polystyrene(PS). Injection molding, used for decades in industrialmanufacture of parts on the millimeter-scale and above, hasin recent years been shown to be capable of replication on thenanometer-scale, for both academic26−29 and industrialapplications (e.g., Blu-ray Discs).The particular nanostructure used in this work is a regular
array of nanoscale pillars, a topography that is known toinfluence the adhesion, proliferation, and differentiation of arange of cell types.9,30 Notably, we have previously shown thatregular nanopillar arrays can have a cell selective influence ondifferent cell types. Arrays of 110 nm tall pillars were shown toenhance endothelial attachment and proliferation, while
inhibiting fibroblast proliferation, when cultured separately onpolycaprolactone (PCL).31 It is known that the depth or heightof patterns have significant influence on cell adhesion32 andthus producing a sample with a continuous variation in heightover a long distance (1 cm or more) will allow for rapidinvestigation of optimal parameters for substrate driven cellseparation. In addition, a simple and effective method of co-culture analysis allows the effect of nanotopographicalstimulation on the two cell types to be confirmed in a morerealistic representation of the in vivo environment.Briefly, fabrication begins with a clean quartz substrate (25
mm × 25 mm × 1 mm) coated with a 110 nm layer of PMMA(Elvacite 2041, Lucite International). A 20 nm layer ofaluminum is evaporated on the sample for charge compensa-tion during electron beam exposure. A 9 × 9 mm2 regular dotarray (100 nm diameter dots on a 300 nm pitch) is defined bysingle-pixel exposure33 using a Vistec VB6 UHR EWF system.The total exposure time is approximately 1.5 h. Afterdevelopment in 1:3 MIBK/IPA, 40 nm of aluminum isevaporated on the surface and the structure is lifted off in hot(50 °C) Microposit remover 1165 (Shipley), Figure 2a.
To define a smooth variation (gradient) in the eventualpattern height, the sample is coated with a thin layer of plasmapolymerized hexane (ppHex), Figure 2b. Further details of theppHex deposition process have been published else-where.20,34,35 The nanopattern defined in aluminum and thesuperimposed gradient defined in ppHex are transferred to thesubstrate using standard RIE processes for quartz: CHF3/Ar(Oxford Instruments 80+ RIE)). The etch is timed to stopshortly after all the plasma polymer material has been etchedFigure 2c. After etching, the aluminum is removed by wetetching, revealing an array of pillars with a variation in heightacross the sample Figure 2d.Mass replication of the gradient pattern is carried out by
injection molding, Figure 3, for which an inlay is created fromthe quartz substrate as described previously.29 The quartzmaster is gently pressed into contact with a 50 μm layer of SU-
Figure 1. Challenges associated with manual segmentation of co-cultures arise from the diversity of phenotypes on display across asingle cell type. On a flat surface, fibroblasts a and e can displaydrastically different morphologies. Endothelial cells b, c, and d alsodisplay a broad variation in appearance. In this instance, only thedifference in the structure of uropodia (arrows) indicates that d and eare different cell types. Manual classification of large numbers ofimages containing many cells, such as image f, is therefore both time-consuming and prone to a level of subjective error. Illustration goutlines the concept of gradient platforms for screening cellularresponse to a wider range of topographical motifs. Isolating subtlevariations in cell response at different points of a gradient of nanopillarheight may provide insight into the optimal pillar dimensions. Cellcytoskeleton is labeled with rhodamine phalloidin (red) and nuclearDNA is labeled with DAPI (blue). Scale bar: 50 μm.
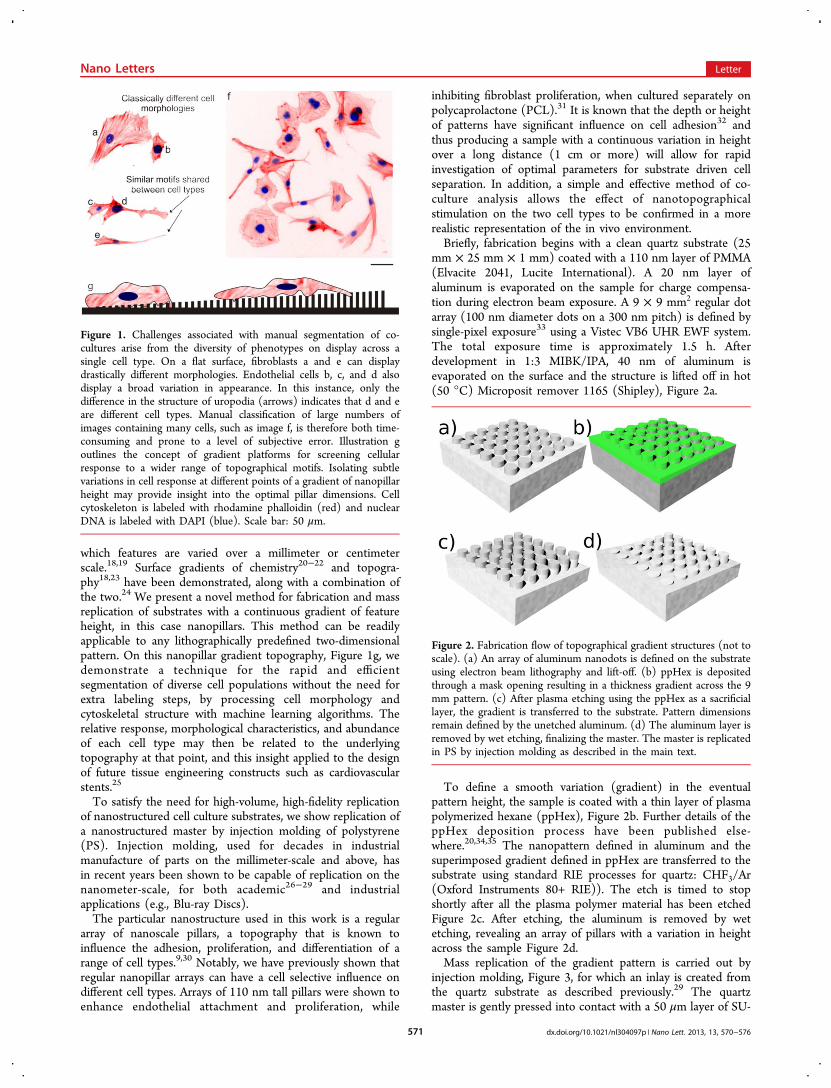
Figure 2. Fabrication flow of topographical gradient structures (not toscale). (a) An array of aluminum nanodots is defined on the substrateusing electron beam lithography and lift-off. (b) ppHex is depositedthrough a mask opening resulting in a thickness gradient across the 9mm pattern. (c) After plasma etching using the ppHex as a sacrificiallayer, the gradient is transferred to the substrate. Pattern dimensionsremain defined by the unetched aluminum. (d) The aluminum layer isremoved by wet etching, finalizing the master. The master is replicatedin PS by injection molding as described in the main text.
Nano Letters Letter
dx.doi.org/10.1021/nl304097p | Nano Lett. 2013, 13, 570−576571
8 3050 (microChem) on a 770 μm thick polyimide substrate(Cirlex, Katco Ltd.) at a temperature of 96 °C. The SU-8 isexposed for 4 min after which the stack is cooled and separated.The Cirlex piece with patterned SU-8 layer is used directly asan inlay for injection molding. PS replicas were manufactured inan injection molding system (Victory 28, Engel GmbH) andproduced samples with a high fidelity to the master in lateraldimensions with an increase in pillar height due to a stretchingeffect which has been previously observed. Further details ofthe SU-8 replication and injection molding processes arepublished elsewhere.29
PS replicas of the gradient pattern were prepared for cellculture by 30s treatment in a 30W air plasma, followed bysterilization by immersion for 10 min in 70% ethanol andthorough rinse in sterilized, deionized water before beingallowed to air dry overnight in a sterile environment. PS waschosen for injection molding samples due to its excellentreplication of nanofeatures27 and its near ubiquitous use intissue culture. Monocultures and 50:50 co-cultures were seededon three material replicates, using fibroblast (hTERT-BJ1) andendothelial (LE2) cells at a density of 5000 cells cm−2. Cellculture media formulations used are included in the SupportingInformation. The co-culture suspension was thoroughlyhomogenized before seeding and care was taken to distributecells evenly across the topography to prevent localized increasesin cell density.Before combining the two cell populations, the endothelial
cells were incubated in suspension with 5 μM greenCellTracker dye (Molecular Probes, U.K.) added to themedia for 30 min at 37 °C as per manufacturers specifications.Additional washing steps were added to ensure completeremoval of excess tracker molecules from the cell suspension.
This membrane permeable nonfluorescent dye is taken up bythe cells and cleaved by common cellular processes, becoming acell-impermeable fluorescent tracker. The intensity of endo-thelial tracker dye reduced with proliferation and there wassome uptake of tracker dye by fibroblasts, presumably due tomembrane−membrane contact and blebbing during mitosisand cell locomotion.36 Across the full data set the meanintensity of tracker dye was 5 times higher in LE2 cells versushTERT cells after 96 h, allowing a robust determination of celltype (a histogram of tracker dye intensity across the data set isprovided in the Supporting Information Figure S1). Positivecontrols confirmed that the dye remained 97% accurate inlabeling the endothelial cells after 96 h. Retention of theCellTracker dye after fixation allows straightforward identi-fication of the endothelial subpopulation in fluorescent imagesets.After seeding, the cells were allowed to settle and attach
before being moved to an incubator set at 37 °C in a 5% CO2atmosphere. Fresh media was added to culture dishes daily, andtotal culture time was 96 h. After this culture period, cells werefixed in 10% (w/v) formaldehyde solution at 37 °C for 10 min,followed by permeabilization at room temperature for 5 minand nonspecific blocking in 1% (w/v) PBS/BSA for 10 min. F-actin fibers and DNA were stained using phalloidin-rhodamine(Life Technologies) and Vectashield DAPI mounting fluidrespectively.Images of the cultured samples were acquired as a linear scan
of 18 contiguous locations across the gradient topography: 4 onthe flat substrate, 10 across the pillar gradient, and a further 4on the flat substrate (Supporting Information Figure S2). Threefluorescent channels were automatically captured for processingusing an Olympus CX41 upright microscope equipped with aPrior motorized stage and 10× objective, camera acquisition,and stage were operated by ImageProPlus (Media Cybernetics,UK). A total of 216 locations were captured, comprising 12linear scans across 3 substrates, Figure 4a. These Images wereanalyzed using CellProfiler to detect individual cells using theDNA and cytoskeleton stain, Figure 4b. The intensity ofCellTracker staining was also measured to act as a positivecontrol classification of the full data set into fibroblast andendothelial cells against which to compare machine learningclassification based on the nucleus and cytoskeleton alone.Processing of the full data set took approximately 2 h on an
Intel Core i7 2600 CPU @ 2.4 GHz with 16Gb DDR2 RAM.Over 10 000 individual cells were detected, 200 distinctmeasurements for each cell computed, and a complete dataset contained over 2 million measurements comprisinginformation on cell size, shape, cytoskeletal texture, intensityand location relative to other cells. The data were thentransferred into CellProfiler Analyst to initialize training of themachine learning algorithm based classifier to distinguish thetwo cell types based solely on “cytoprofile” measurements.Using the CellProfiler Analyst classifier tool, 400 randomly
selected cells were sorted by visual inspection of tracker dyeintensity as fibroblasts or endothelia, as described by Jones etal.15 Images of both cell types in monoculture were also used tosimilar effect. This training set was used to generate a set ofrules for segmentation of the images using the tracker probeinformation, focusing on a threshold intensity of the tracker dyewithin the detected cell shape, as was anticipated, to determinecell type. The full data set was classified using these rules with20 random images selected (approximately 800 cells) andinspected with no visible mis-classifications, Figure 4c. To
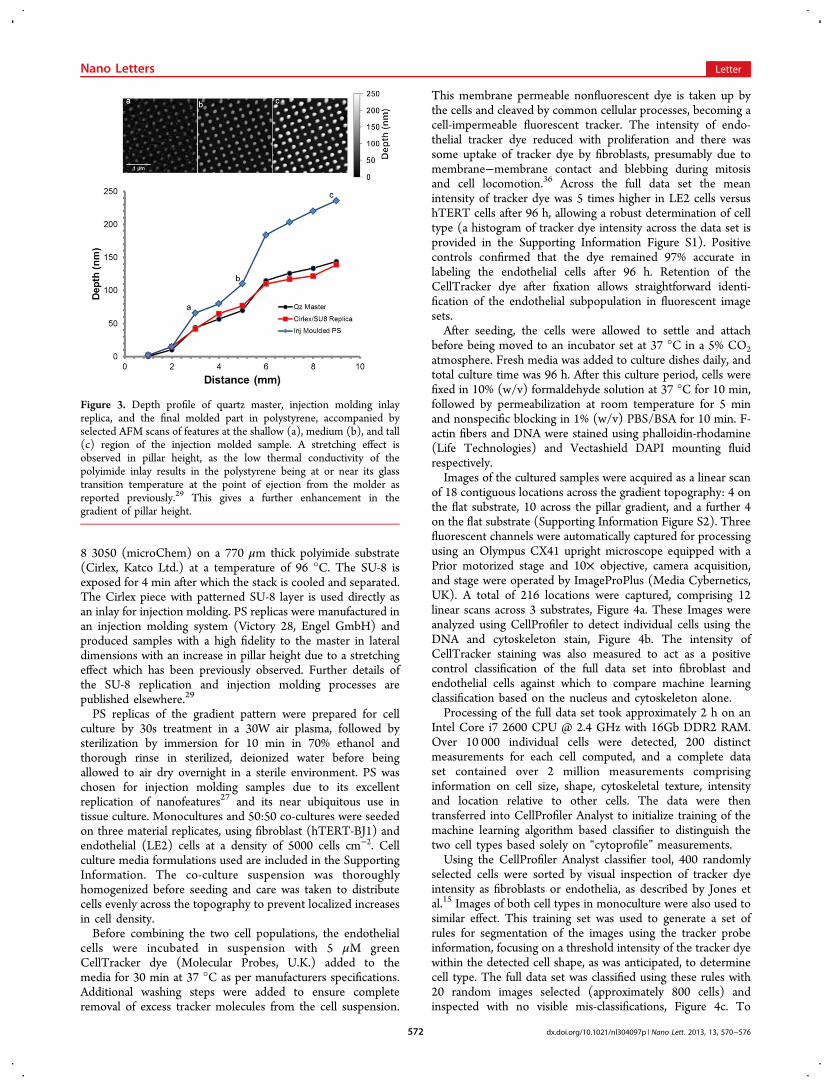
Figure 3. Depth profile of quartz master, injection molding inlayreplica, and the final molded part in polystyrene, accompanied byselected AFM scans of features at the shallow (a), medium (b), and tall(c) region of the injection molded sample. A stretching effect isobserved in pillar height, as the low thermal conductivity of thepolyimide inlay results in the polystyrene being at or near its glasstransition temperature at the point of ejection from the molder asreported previously.29 This gives a further enhancement in thegradient of pillar height.
Nano Letters Letter
dx.doi.org/10.1021/nl304097p | Nano Lett. 2013, 13, 570−576572
determine the experimental error that may be induced by poorretention of the tracker dye, monocultures were processedunder the same conditions. The labeling dye stability wasassessed by a monoculture of endothelial cells loaded with thefluorescent tracker for 96 h and segmentation of thesemonocultures using the co-culture segmentation rules. Anaccuracy of 97% after 96 h culture, Figure 4e, indicated minimallevels of mis-classification due to poor dye uptake by theendothelial cells or poor retention due to loss of cytoplasm/blebbing.Segmentation of the co-culture using only DNA and
cytoskeleton images was carried out by removing theCellTracker information from the data set, Figure 4d. Thetraining set that had been created previously was used, ensuringthat cells presented to the algorithm as endothelial or fibroblastwere correctly identified. This generated a set of 50 rules(Supporting Information data S5) to classify cells based onmorphology (i.e., aspect ratio, area, perimeter, nucleus size) andalso the organization of the cytoskeleton (i.e., radial distributionof actin intensity, actin texture). These rules differentiatebetween the two cell classes by means of the GentleBoostingalgorithm, wherein each rule is a regression stump37 relating toa measured attribute. Visual observation of the cells did indeedindicate that size and cytoskeletal organization are validmethods of distinguishing between the two, and a humanmay draw on these factors. However, when human classificationis compared to rules generated by a machine learning algorithmit is clearly impractical for a human to consider 50 rules when
classifying each cell; reinforcing the power of this newmethodology.Classification of the full 10 000 cell data set using the same
rules gave an accuracy of 83.9%, Figure 4e. This is shownalongside the accuracy achieved by omitting various othermeasurement classes from the learning algorithm. Thisindicates the relative importance of certain feature sets in cellclassification and can provide insight into the characteristicdifferences between the two cell types from a computationalstandpoint. Accuracy for each cell type was consistently lowerfor endothelial cells compared to fibroblasts (SupportingInformation Figure S4). As a comparison, a simple filter,which sets a threshold of cell size, based on the relativedistribution of sizes within each population (MG63 cells FigureS3) has an accuracy of 67%. To indicate the efficacy of thistechnique, a group of 20 researchers of varied experience andspecialty were asked to classify images of 50 randomly selectedcells after a brief training session on the characteristics of eachcell type. The highest individual score was an accuracy of 70%,while the average score was comparable to randomly classifyingeach cell with an accuracy of 52%.With a view to understanding the scalability of this method
toward co-cultures of more than a single pair of cell types, a setof 15 images containing 468 MG63 cells (a humanosteosarcoma cell line) was introduced into the data setalongside the co-culture images. The classifier was modified toinclude a third classification bin for the new cell type, which waspopulated with 100 randomly selected MG63 cells. On thebasis of this new training set of three distinct cell types, 50 rules
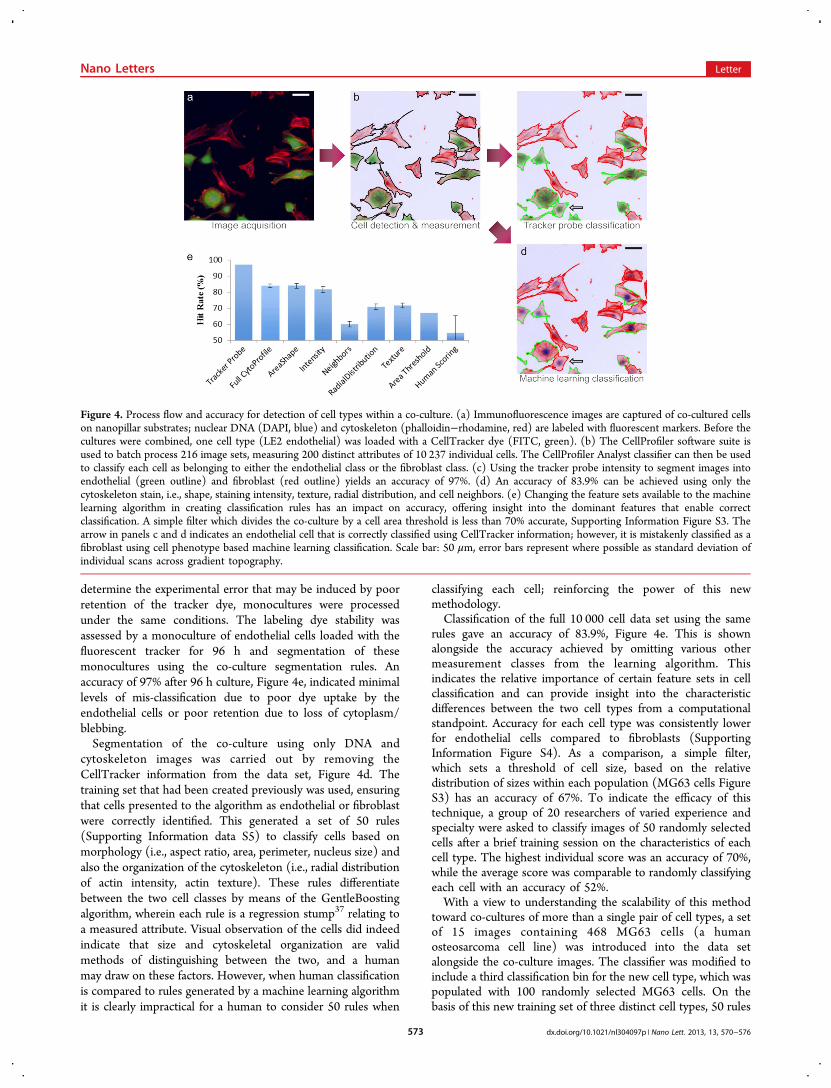
Figure 4. Process flow and accuracy for detection of cell types within a co-culture. (a) Immunofluorescence images are captured of co-cultured cellson nanopillar substrates; nuclear DNA (DAPI, blue) and cytoskeleton (phalloidin−rhodamine, red) are labeled with fluorescent markers. Before thecultures were combined, one cell type (LE2 endothelial) was loaded with a CellTracker dye (FITC, green). (b) The CellProfiler software suite isused to batch process 216 image sets, measuring 200 distinct attributes of 10 237 individual cells. The CellProfiler Analyst classifier can then be usedto classify each cell as belonging to either the endothelial class or the fibroblast class. (c) Using the tracker probe intensity to segment images intoendothelial (green outline) and fibroblast (red outline) yields an accuracy of 97%. (d) An accuracy of 83.9% can be achieved using only thecytoskeleton stain, i.e., shape, staining intensity, texture, radial distribution, and cell neighbors. (e) Changing the feature sets available to the machinelearning algorithm in creating classification rules has an impact on accuracy, offering insight into the dominant features that enable correctclassification. A simple filter which divides the co-culture by a cell area threshold is less than 70% accurate, Supporting Information Figure S3. Thearrow in panels c and d indicates an endothelial cell that is correctly classified using CellTracker information; however, it is mistakenly classified as afibroblast using cell phenotype based machine learning classification. Scale bar: 50 μm, error bars represent where possible as standard deviation ofindividual scans across gradient topography.
Nano Letters Letter
dx.doi.org/10.1021/nl304097p | Nano Lett. 2013, 13, 570−576573

were once again generated to classify both the co-cultureimages and also the MG63 cell images. MG63 cells (94.2%)were classified correctly with 4.9% misclassified as endothelialcells and the remaining 0.9% misclassified as fibroblasts(Supporting Information Table S6 and Figure S7). The higherpropensity to misclassify MG63 cells as LE2 endothelial cellscan be attributed to their similarity in terms of cell size and, tosome extent, shape. Further expansion to more complex co-cultures will be strongly dependent on the cell types themselveshaving suitably distinct features.This new methodology for the rapid screening and analysis
of co-cultures was applied to screening co-culture responseacross the high throughput nanopillar gradient topography,ranging from a planar surface to a regular array of 250 nm highpillars. This continuous variation of feature height across asubstrate provides a modulated stimulation, whose effect oncellular response can be extrapolated from the extensivemeasurements collected by CellProfiler. Having shownpreviously that regular nanopillar arrays can exert a cell specificeffect on proliferation and adhesion,31 this gradient topographywas devised as a means of finding the “optimal” pillar height for
enhanced endothelial response in a co-culture environmentunder substrate driven cell separation.After initial seeding of the two cell types at an even density
across the nanotopographical gradient, the ratio of endothelialto fibroblast cells varied over time as a function of theunderlying and local topographical motifs. Cells were fixed after96 h culture, resulting in a final distribution of cells which was acombination of proliferation and migration − which have bothbeen shown to be influenced by nanotopographical stimulation.The number of fibroblasts was found to fall steadily withincreasing nanopillar height, while there was a moderateincrease in the abundance of endothelial cells with increasingpillar height, although endothelial cell numbers also fell away atextreme pillar heights.There was no evidence that cells were capable of sensing the
local gradient of pillar height as the gradient was shallow, risingfrom a planar surface to 250 nm high pillars across a 9 mmpattern. The average major axis length of endothelial andfibroblast cells was 54.9 and 72.8 μm, respectively, giving anominal local gradient in pillar height of 1.53 and 2.02 nmacross individual cells. Local gradients of approximately 2 nmallow cell activity at any point across the gradient to be
Figure 5. Response of fibroblast (hTERT-BJ1) and endothelial (LE2) cells in co-culture to a gradient of nanopillar height is shown. The ratio ofendothelial/fibroblast cells after 96 h culture was calculated by (a) direct labeling of the subpopulations with CellTracker probes and (b) applyingmachine learning to cell morphology and nucleus data to predict cell type; greyscale background gradient represents increasing pillar height from leftto right with dashed line indicating the nanopillar-flat boundary. Statistically, each data point was compared to the “baseline” flat region, *p < 0.01,**p < 0.001. Images (c−e) show cellular response at various points across the nanogradient sample (f). From this analysis, we can suggest that ananopillar height in excess of 75 nm is sufficient to induce a statistically significant change in the ratio of endothelial/fibroblast cells on thenanopattern, however as pillar height increases the average number of cells per frame was found to fall.
Nano Letters Letter
dx.doi.org/10.1021/nl304097p | Nano Lett. 2013, 13, 570−576574

considered as a response to a single pillar height. This allows ahigh-resolution determination of the impact of varied pillarheights up to 250 nm on cell shape and structure.Comparison of the ratio of endothelial to fibroblast cells as
pillar height increases suggests that there is a height at whichthe cell selective response of the topography is “switched on”and a statistically significant change in the ratio is observed. Atthe same time, a reduction in the total cell number is alsoobserved as pillar height increases, Figure 5a,b. This apparentreduction in cell affinity toward tall nanopillars leads to aconclusion that to maximize cell number with the lowestpossible ratio of endothelial/fibroblast cells, a pillar height ofapproximately 75 nm is recommended. This is a promisingresult, which may be practically applied to the design of cellculture dishes to reduce fibroblast contamination in primaryendothelial cultures, and to attempt to prevent restenosis ofcardiovascular stents, where the potential of the nano-topography to expedite in situ enothelialization may offerconsiderable benefits in terms of implant success.We have compared the ratio of co-cultured cells across a
nanopillar gradient by both fluorescent tracker and machinelearning classifier analysis. In the data set of 10 237 cells, 1653cells were misclassified. This amounts to a success rate of 83.9%in the classification of co-cultures by machine learningalgorithm, which may be open to improvement through furtheroptimization. Analysis of cell response to the variation innanopillar height by fluorescent tracker, Figure 5a, or machinelearning, Figure 5b, yield the same interpretation of the data interms of optimal pillar height, indicating that automatic celltype segmentation of co-culture images by machine learning is aviable alternative to fluorescent tracking or antibody staining.Applying this simple and rapid co-culture segmentationtechnique to gradient and arrayed surface features orchemistries can allow the screening of potential solutions in acontext that is closer to the target in vivo system. We proposean optimized pillar height of 75 nm for a targeted increase inthe ratio of endothelial to fibroblast cells in co-culture, whichmay be applied to the future design of cardiovascular implantswhere rapid enothelialization is required.
■ ASSOCIATED CONTENT*S Supporting InformationDescription of CellTracker labeling accuracy; data acquisitionscheme; fibroblast and endothelial cell size distribution;individual classification accuracy across data set for fibroblastand endothelial cells, and formulations of cell culture mediaused. This material is available free of charge via the Internet athttp://pubs.acs.org.
■ AUTHOR INFORMATIONCorresponding Author*E-mail: [email protected] authors declare no competing financial interest.
■ ACKNOWLEDGMENTSWe would like to thank the staff and technicians of the JamesWatt Nanofabrication Centre for their assistance during thesubstrate fabrication process. We would also like to thank themembers of the Centre for Cell Engineering particularly Carol-Anne Smith for their help and discussion on the topic of cellculture studies. The work has been partially funded by the
Engineering and Physical Sciences Research Council (EPSRC),Grant EP/F500424/1 DTC in Cell and Proteomic Tech-nologies, the Glasgow Research Partnership in engineering(GRPe), and the EC-funded project NAPANIL (Contract no.FP7-CP-IP214249-2). Finally, we would like to thank thecreators of CellProfiler for their prompt and informativeresponses to queries on the CellProfiler Forum (www.cellprofiler.org).
■ REFERENCES(1) Alberts, B.; Johnson, A.; Lewis, J.; Raff, M.; Roberts, K.; Walter,P. Mol. Biol. Cell 2008, 1725.(2) Vickaryous, M. K.; Hall, B. K. Biol. Rev. Cambridge Philos. Soc.2006, 81, 425−55.(3) Anderson, D. G.; Levenberg, S.; Langer, R. Nat. Biotechnol. 2004,22, 863−6.(4) Unadkat, H. V; Hulsman, M.; Cornelissen, K.; Papenburg, B. J.;Truckenmuller, R. K.; Post, G. F.; Uetz, M.; Reinders, M. J. T.;Stamatialis, D.; Van Blitterswijk, C. a; De Boer, J. Proc. Natl. Acad. Sci.U. S. A. 2011, 108, 16565−70.(5) Geysen, H. M.; Schoenen, F.; Wagner, D.; Wagner, R. Nat. Rev.Drug Discovery 2003, 2, 222−30.(6) Kirkpatrick, C. J.; Fuchs, S.; Unger, R. E. Adv. Drug Delivery Rev.2011, 63, 291−9.(7) Khetani, S. R.; Bhatia, S. N. Nat. Biotechnol. 2008, 26, 120−6.(8) Ngo, J. T.; Champion, J. a; Mahdavi, A.; Tanrikulu, I. C.; Beatty,K. E.; Connor, R. E.; Yoo, T. H.; Dieterich, D. C.; Schuman, E. M.;Tirrell, D. a Nat. Chem. Biol. 2009, 5, 715−7.(9) Dalby, M. J.; Gadegaard, N.; Tare, R.; Andar, A.; Riehle, M. O.;Herzyk, P.; Wilkinson, C. D. W.; Oreffo, R. O. C. Nat. Mater. 2007, 6,997−1003.(10) Rivera Gil, P.; Yang, F.; Thomas, H.; Li, L.; Terfort, A.; Parak,W. J. Nano Today 2011, 6, 20−27.(11) Kamentsky, L.; Jones, T. R.; Fraser, A.; Bray, M.-A.; Logan, D.J.; Madden, K. L.; Ljosa, V.; Rueden, C.; Eliceiri, K. W.; Carpenter, A.E. Bioinformatics 2011, 27, 1179−80.(12) Jones, T. R.; Carpenter, A. E.; Lamprecht, M. R.; Moffat, J.;Silver, S. J.; Grenier, J. K.; Castoreno, A. B.; Eggert, U. S.; Root, D. E.;Golland, P.; Sabatini, D. M. Proc. Natl. Acad. Sci. U.S.A. 2009, 106,1826−31.(13) Cardona, A.; Tomancak, P. Nat. Methods 2012, 9, 661−5.(14) Cho, B. H.; Cao-Berg, I.; Bakal, J. A.; Murphy, R. F. Nat.Methods 2012, 9, 633−4.(15) Jones, T. R.; Carpenter, A. E.; Lamprecht, M. R.; Moffat, J.;Silver, S. J.; Grenier, J. K.; Castoreno, A. B.; Eggert, U. S.; Root, D. E.;Golland, P.; Sabatini, D. M. Proc. Natl. Acad. Sci. U.S.A. 2009, 106,1826−31.(16) Anderson, D. G.; Putnam, D.; Lavik, E. B.; Mahmood, T. a;Langer, R. Biomaterials 2005, 26, 4892−7.(17) Kolind, K.; Dolatshahi-Pirouz, A.; Lovmand, J.; Pedersen, F. S.;Foss, M.; Besenbacher, F. Biomaterials 2010, 31, 9182−91.(18) Kunzler, T. P.; Drobek, T.; Schuler, M.; Spencer, N. D.Biomaterials 2007, 28, 2175−82.(19) Gallant, N. D.; Lavery, K. a.; Amis, E. J.; Becker, M. L. Adv.Mater. 2007, 19, 965−969.(20) Zelzer, M.; Majani, R.; Bradley, J. W.; Rose, F. R. a J.; Davies, M.C.; Alexander, M. R. Biomaterials 2008, 29, 172−84.(21) Simon, C. G.; Lin-Gibson, S. Adv. Mater. 2011, 23, 369−87.(22) Glassford, S.; Chan, K. L. A.; Byrne, B.; Kazarian, S. G. Langmuir2012, 28, 3174−9.(23) Ding, Y.; Sun, J.; Ro, H. W.; Wang, Z.; Zhou, J.; Lin, N. J.;Cicerone, M. T.; Soles, C. L.; Lin-Gibson, S. Adv. Mater. 2011, 23,421−5.(24) Yang, J.; Rose, F. R. a. J.; Gadegaard, N.; Alexander, M. R. Adv.Mater. 2009, 21, 300−304.(25) De Mel, A.; Jell, G.; Stevens, M. M.; Seifalian, A. M.Biomacromolecules 2008, 9, 2969−79.
Nano Letters Letter
dx.doi.org/10.1021/nl304097p | Nano Lett. 2013, 13, 570−576575
(26) Bakker, R. M.; Boltasseva, A.; Liu, Z.; Pedersen, R. H.; Gresillon,S.; Kildishev, A. V; Drachev, V. P.; Shalaev, V. M. Opt. Express 2007,15, 13682−13688.(27) Gadegaard, N.; Mosler, S.; Larsen, N. B. Macromol. Mater. Eng.2003, 288, 76−83.(28) Schift, H.; David, C.; Gobrecht, J.; D’ Amore, a.; Simoneta, D.;Kaiser, W.; Gabriel, M. J. Vac. Sci. Technol., B 2000, 18, 3564.(29) Stormonth-Darling, J. M.; Gadegaard, N. Macromol. Mater. Eng.2012, 297, 1075−1080.(30) Curtis, A. S. G. Eur. Cell Mater. 2004, 8, 27−36.(31) Csaderova, L.; Martines, E.; Seunarine, K.; Gadegaard, N.;Wilkinson, C. D. W.; Riehle, M. O. Small 2010, 6, 2755−2761.(32) Dalby, M. J.; Giannaras, D.; Riehle, M. O.; Gadegaard, N.;Affrossman, S.; Curtis, A. S. G. Biomaterials 2004, 25, 77−83.(33) Gadegaard, N.; Thoms, S.; Macintyre, D. S.; Mcghee, K.;Gallagher, J.; Casey, B.; Wilkinson, C. D. W.Micro 2003, 68, 162−168.(34) Pedersen, R. H.; Hamzah, M.; Thoms, S.; Roach, P.; Alexander,M. R.; Gadegaard, N. Microelectron. Eng. 2010, 87, 1112−1114.(35) Reynolds, P. M.; Pedersen, R. H.; Riehle, M. O.; Gadegaard, N.Small 2012, 8, 2541−2547.(36) Boss, J. Exp. Cell Res. 1954, 7, 215−231.(37) Friedman, J.; Hastie, T.; Tibshirani, R.; Friedman, B. Y. J.;Hastie, T. 2000, 28, 337−374.
Nano Letters Letter
dx.doi.org/10.1021/nl304097p | Nano Lett. 2013, 13, 570−576576