review session november 29, 2010. questions study design - 1 questionnaires were mailed to every 10...
TRANSCRIPT

Review Session
November 29, 2010

Questions Study Design - 1
• Questionnaires were mailed to every 10th person listed in city telephone directory. Each person was asked to list age, sex, smoking habits, and respiratory symptoms, during the preceding seven days. About 20% of questionnaires were completed and returned. About 10% of respondents reported having upper respiratory infections.
Cross sectional/prevalence and/ prevalence

Questions Study Design - 2• 1500 employees of a major aircraft company were
initially examined in 1951 and were classified by diagnostic criteria for coronary artery disease (CAD). Later New cases of CAD have been identified by examinations every three years and through death certificates. Incidence rate in different subgroups have been computed
Subgroups from 1951 could be could be smokers or
non smokers; obese and non obese, • Prospective cohort study

Questions Study Design - 3
• A 39 year old woman presents with a mild sore throat, fever, malaise, and headache, and is treated with penicillin for presumed streptococcal infection. She returns in a week with hypertension, fever, rash, and abdominal pain. She responds favorably to chloramphenicol after a diagnosis of rocky mountain spotted fever
• Case report

Questions Study Design - 4• A random sample of middle age sedentary adults
was selected from four survey/census tracts, and each person was examined for coronary artery disease (CAD). All persons without disease were randomly assigned to either a two year program of aerobic exercise or a two year arthritis prevention non aerobic exercise program. Both groups were observed semi annually for incidence of CAD.
• Randomized control trial

Questions Study Design - 5• 50 patients of thyroid cancer are identified and
surveyed by patient interviews to identify previous radiation exposure
• Note that there is No control group
• Case series

Questions Study Design - 6
• Patients admitted for carcinoma of stomach and patients without a diagnosis of cancer are interviewed about their chewing tobacco history to assess possible association of chewing tobacco and gastric cancer
Note that there is a control group without diseaseHence Case control design • Case control study

Questions Study Design - 7• Data on median income for households in census tracts
within a large metropolitan county in USA were obtained from census bureau current population survey. Air pollution levels were measured in these same census tracts during a period f one month. The data were analyzed using a geographic information system (GIS) to produce maps showing pollution and income levels by census tracts
• Note it is looking at group data (air pollution and income)
• Ecologic study design/ correlation

Questions Study Design - 8• In a village 100 Neonatal tetanus cases were
compared with 300 neonates without history of neonatal tetanus (controls); 17% of cases gave history of butter application to umbilical cord; compared to 7% of controls.
• a) State a study design • b) Make a 2x2 table and calculate Odds Ratio.

How to draw 2x2 table
Exposure Disease + Or Cases Neonatal Tetanus
Disease - Controls Healthy neonates
Butter applied Butter not -applied
Total

How to draw 2x2 table
Exposure Disease + Or Cases Neonatal Tetanus
Disease - Controls Healthy neonates
Butter applied Butter not -applied
Total 100 300

How to draw 2x2 table
Exposure Disease + Or Cases Neonatal Tetanus
Disease - Controls Healthy neonates
Butter applied
17 (7/100 x300)
=21Butter not -applied
Can u fill ?
Total 100 300

How to draw 2x2 table
Exposure Disease + Or Cases Neonatal Tetanus
Disease - Controls Healthy neonates
Butter applied
17 (7/100 x300)
=21Butter not -applied
100-17= 83
300-21=279
Total 100 300

How to draw 2x2 table
Exposure Disease + Or Cases Neonatal Tetanus
Disease - Controls Healthy neonates
Butter applied
17 21
Butter not -applied 83 279
Total 100 300

How to draw 2x2 table
Exposure Disease + Or Cases Neonatal Tetanus
Disease - Controls Healthy neonates
Butter applied
(a)17 (b)21
Butter not -applied ( c)83 (d)279
Total 100 300

Odds Ratio
• Done in Case Control Study • Also in Cross Sectional Study
• ad/bc• =(17x279) / 21x83 • = 4743/1743

Question
• In a village 100 Neonatal tetanus cases were compared with 300 neonates without history of neonatal tetanus (controls); 6% of cases were delivered by skilled birth attendants compared 19% of controls. Make a 2x2 table and calculate Odds Ratio.
• a) Make a 2x2 table and calculate Odds Ratio. • b) Interpret Odds Ratio
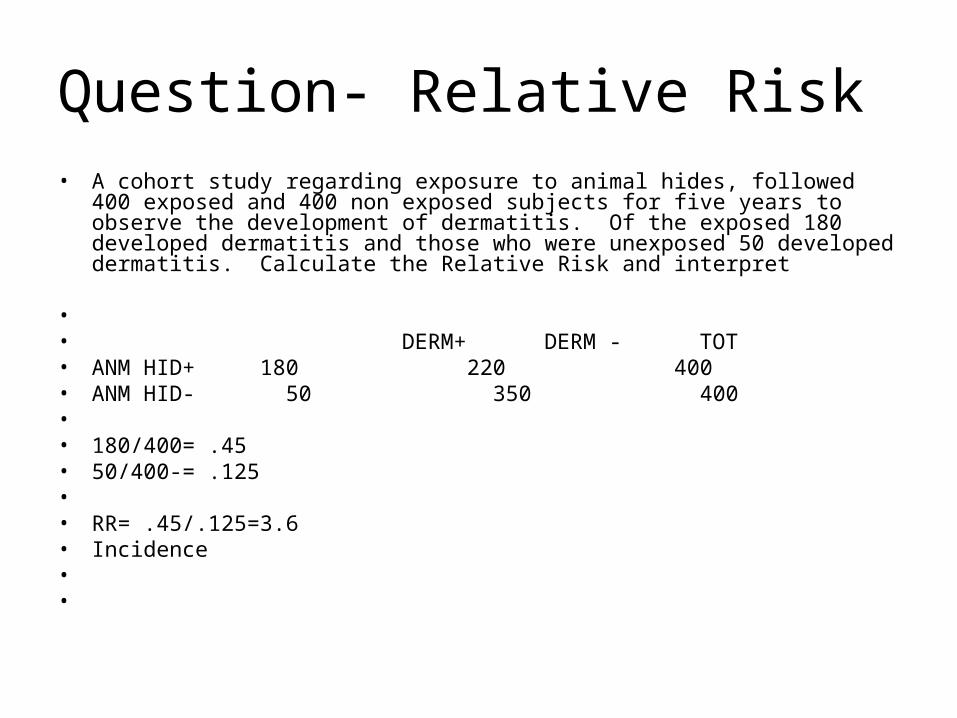
Question- Relative Risk • A cohort study regarding exposure to animal hides, followed 400 exposed and 400 non
exposed subjects for five years to observe the development of dermatitis. Of the exposed 180 developed dermatitis and those who were unexposed 50 developed dermatitis. Calculate the Relative Risk and interpret
• • DERM+ DERM - TOT• ANM HID+ 180 220 400• ANM HID- 50 350 400• • 180/400= .45• 50/400-= .125 • • RR= .45/.125=3.6 • Incidence • •
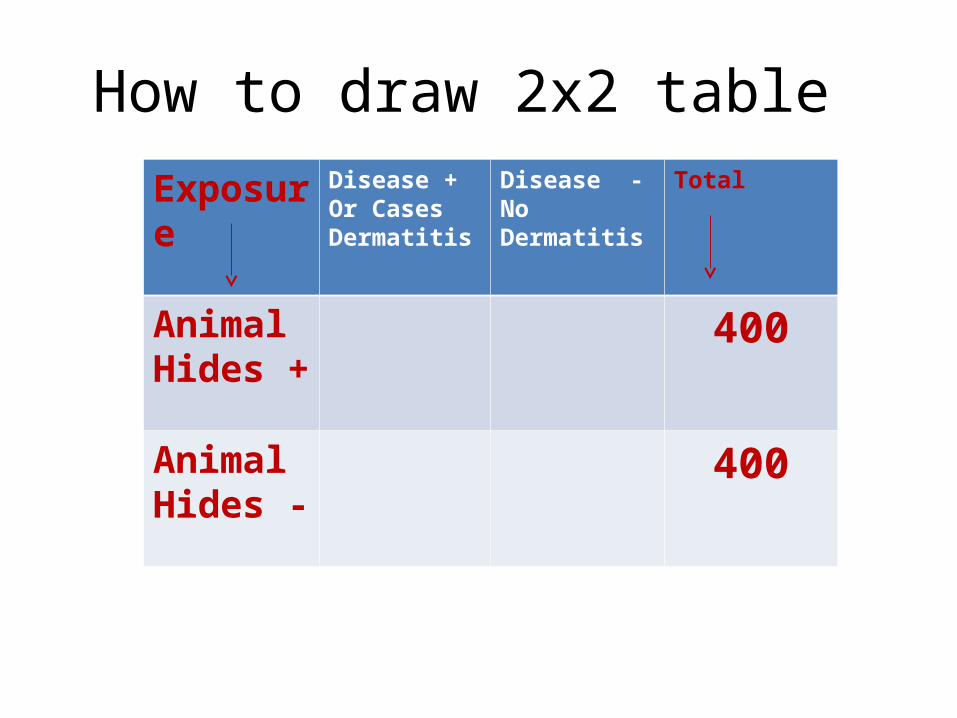
How to draw 2x2 table
Exposure Disease + Or Cases Dermatitis
Disease - No Dermatitis
Total
Animal Hides +
400
Animal Hides -
400
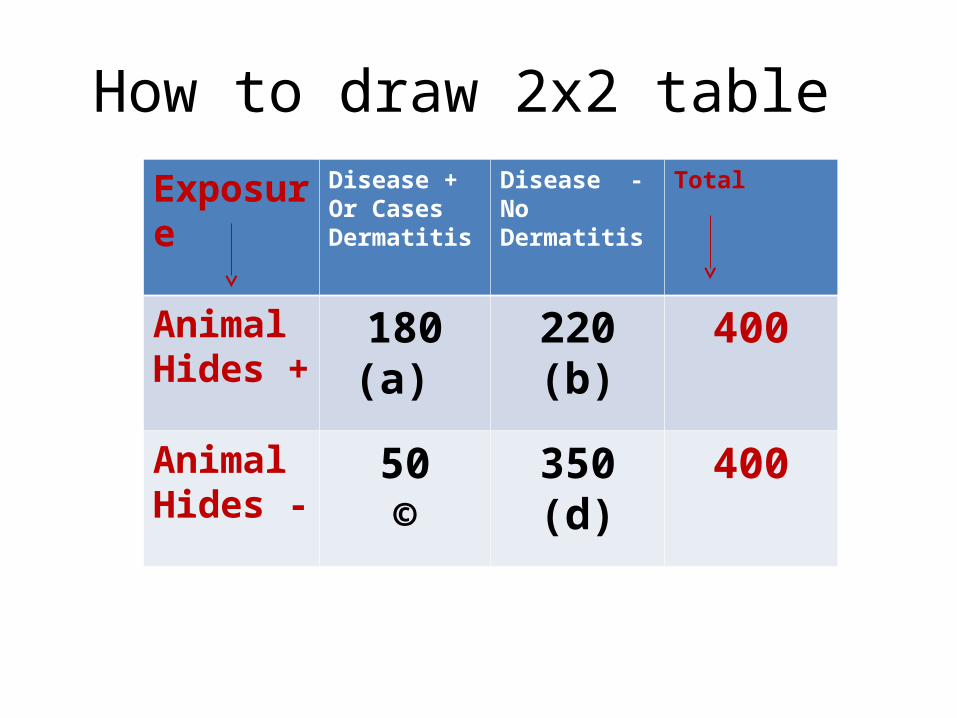
How to draw 2x2 table
Exposure Disease + Or Cases Dermatitis
Disease - No Dermatitis
Total
Animal Hides +
180(a)
220(b)
400
Animal Hides -
50©
350(d)
400

Relative Risk
• RR = a/ (a+b) b/(b+d)
Calculate

Explain the design of case control study What measure of association is used in a case control study
ODDS RATIO