review of thermal properties of graphite composite materials
TRANSCRIPT
- NASA Technical Memorandum 100049
Review of Thermal Properties of Graphite Composite Materials D. A. Kourtides
(EASA-TW-100049) R E V l E E OF 3 t E 6 B A L N88-16825 EbOPERTIES OF G E A F H I T E C C B F C Z I I E E B I E B I A L S (bass) f2 F CSCL 11D
Unclas G3/24 0123310
December 1987
National Aeronautics and Space Administration
NASA Technical Memorandum 100049
Review of Thermal Properties of Graphite Composite Materials D. A. Kourtides, Ames Research Center, Moffett Field, California
December 1987
National Aeronautics and Space Ad mi n 1st rat ion
Arnes Research Center Moffett Field California 94035
REVIEW OF THERMAL PROPERTIES OF
GRAPHITE COMPOSITE MATERIALS
D. A. Kourtides
Thermal Protection Materials Branch
Ames Research Center
Moffett Field, CA 94035
ABSTRACT
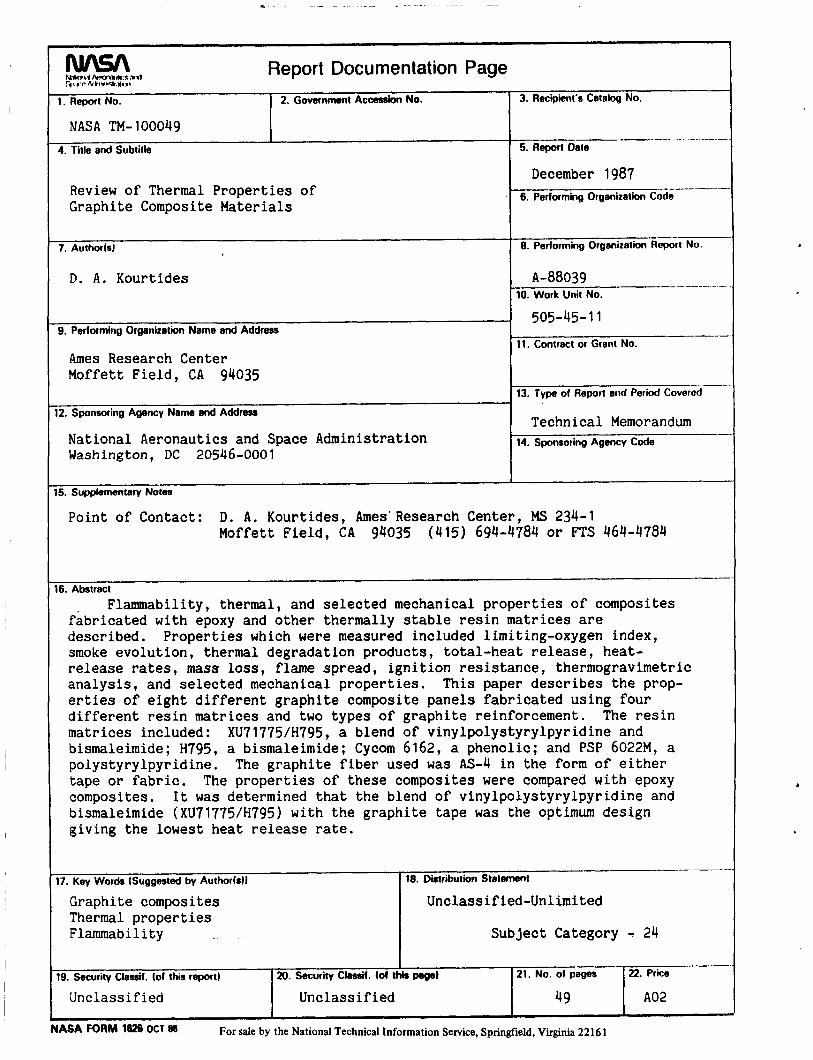
* Flammability, thermal, and selected mechanical properties of composites
fabricated with epoxy and other thermally stable resin matrices are
described.
smoke evolution, thermal degradation products, total-heat release, heat-
release rates, mass loss, flame spread, ignition resistance, thermogravi-
metric analysis, and selected mechanical properties. This paper describes
the properties of eight different graphite composite panels fabricated using
four different resin matrices and two types of graphite reinforcement.
resin matrices included: XU71775/H795, a blend of vinylpolystyrylpyridine
and bismaleimide; H795, a bismaleimide; Cycom 6162, a phenolic; and PSP
6022M, a polystyrylpyridine.
of either tape or fabric.
with epoxy composites.
Properties which were measured included limiting-oxygen index,
The
The graphite fiber used was AS-4 in the form
The properties of these composites were compared
It was determined that the blend of
Presented at the Fall Conference of the Fire Retardant Chemicals
Association, Monterey, CA, USA (Oct. 18-21, 1987).
1
vinylpolystyrylpyridine and bismaleimide (XU71775/H795) with the graphite
tape was the optimum design giving the lowest heat release rate.
INTRODUCTION
Graphite-reinforced composites have potential applications in advanced
aircraft and aerospace vehicles because of their weight saving and perfor-
mance characteristics.
dent on the properties of the materials comprising the composite and the
process by which they are combined. This rule is particularly true of
graphite-reinforced composites, when the thermal and flammability properties
are dependent on the type, amount, and orientation of the fiber, and the
type and amount of the resin matrix used.
Performance characteristics of composites are depen-
The purpose of this paper is to review the thermal and selected mechan-
ical properties of composites fabricated with epoxy and other thermally
stable resin matrices. Properties which are reviewed include limiting-
oxygen index, smoke evolution, thermal degradation products, total-heat
release, heat-release rates, mass loss, flame spread, ignition resistance,
thermogravimetric analysis, and selected mechanical properties. This paper
reviews the properties of different graphite composite panels fabricated
using different resin matrices and types of graphite reinforcement. The
resin matrices reviewed include: epoxy; blends of vinylpolystyrylpyridine
and bismaleimide; bismaleimide; phenolic; and polystyrylpyridine resins.
The graphite fiber used was a high modulus graphite in the form of either
tape or fabric.
composites. This review indicates that thermally stable resins such as
blends of vinylpolystyrylpyridine and bismaleimide provide the lowest heat
release rates which is an important parameter in the design of composite
structures for aircraft and aerospace vehicles.
The properties of these composites are compared with epoxy
2
RESIN CHEMISTRY AND COMPOSITE FABRICATION
Four types of resin matrices were evaluated: a) XU71775/H795
(Hercules, Inc . ) , a bismaleimide/vinylpolystyrylpyr idine (VPSP) formulation ; b) H795 (Technochemie GMBH), a bismaleimide; c) Cycom 6162 (Cyanamid Co.), a
phenolic; and d) PSP 6022 (Societe Nationale et Poudres Explosifs), a poly-
styrylpyridine.
compared with a composite made with an epoxy resin as a matrix.
Graphite composites made from these resin matrices were
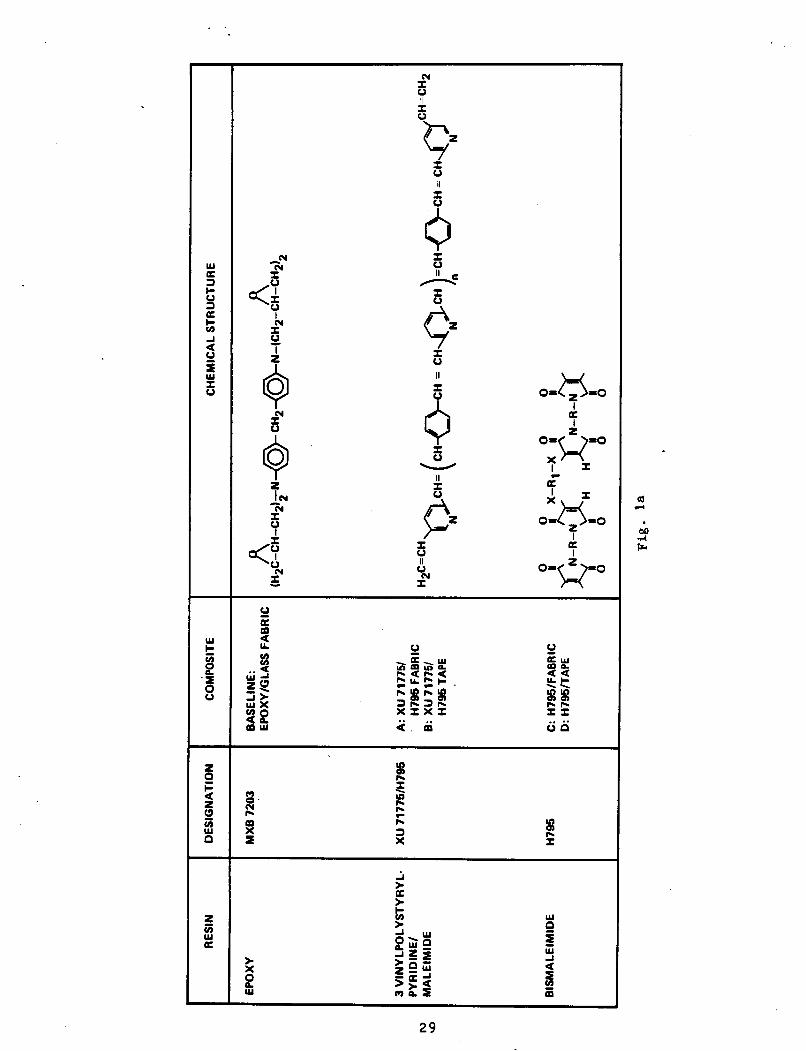
1. Epoxy Resin: The baseline epoxy resin was an amine-cured polyfunc-
The chemistry of this and the other tional glycidyl amine-type epoxy resin.
resins is shown in Fig. 1.
2. XU71775/H795: This formulation is based on a formulation of bis-
maleimide (H795) and a modified VPSP designated as XU71775.01L (Dow Chemical
Co.).
VPSP, but possesses different reactive end groups.
VPSP is shown in Fig. 1 and has been described previously (1,2,3).
XU71775/H795 formulation contains seven parts by weight H795 and three parts
by weight XU71775.01L.
tion to allow hot melt prepregging of the resin.
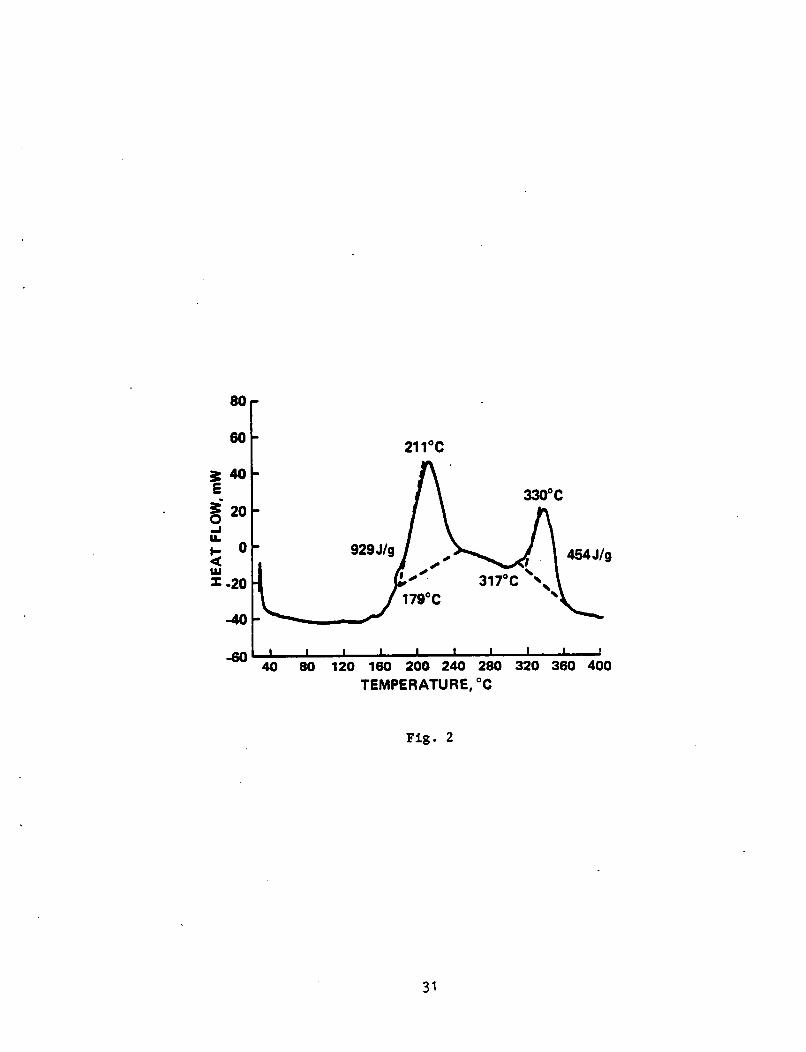
terized thermally by differential scanning calorimetry (DSC), thermograui-
metric analysis (TGA), and exothermicity. The DSC of the resin was measured
at 10°C/min in nitrogen and is shown in Fig. 2. The endothermic peak at
60-140°C is probably due to the evaporation of trace amounts of volatiles.
This resin has the same oligomer backbone (polystyrylpyridine) as
The chemistry of the
The
Other reactive materials are added to this formula-
This resin was charac-
The exothermic cure temperature is at 160-240°C with a cure peak at 211°C.
The resin can be cured at 177°C for a longer time. After heating at 177°C
for 3 hr, the resin showed no residual cure peak.
30O-36O0C is probably related to the decomposition of the resin.
The exothermic peak at
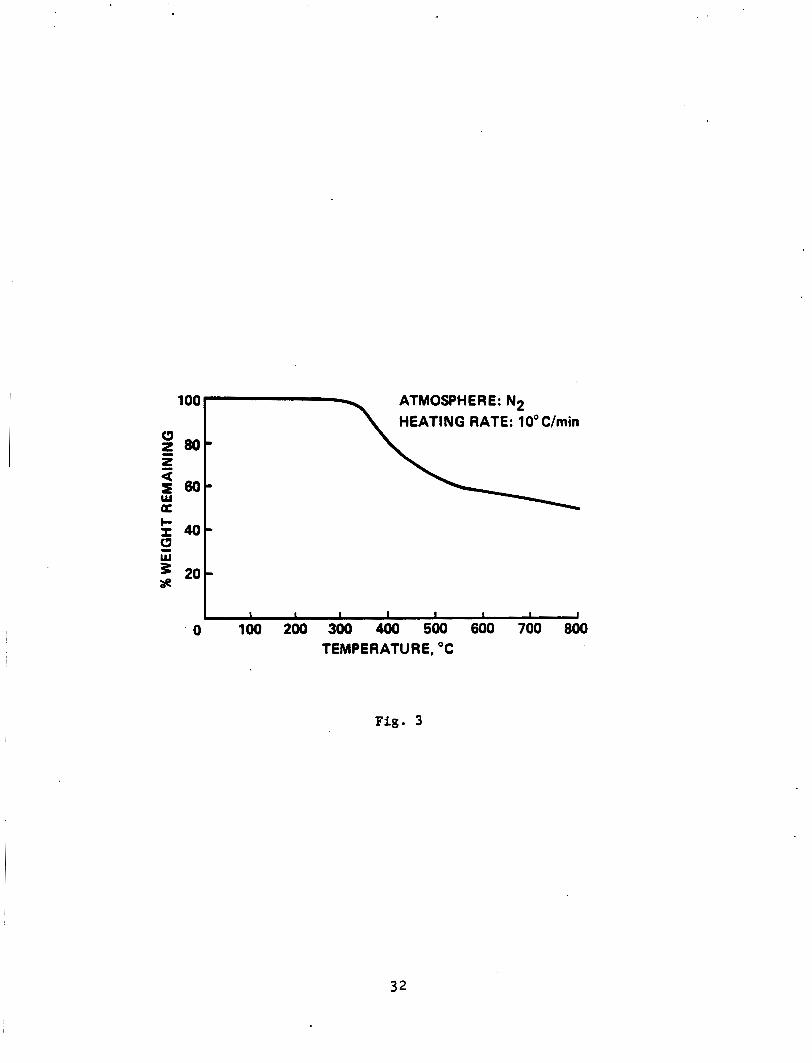
The TGA of
the cured pure resin in nitrogen at 10°C/min is shown in Fig. 3. The resin
starts to decompose at about 320°C. The The char yield at 800°C is 52.5%.
3
viscosity of the resin was determined by obtaining gel curves in the Rheom-
etrics apparatus.
50°C, 6.2 poise at 100°C, and 2.7 poise (minimum) at 127°C. The gel times
for the resin were 5 min at 177"C, 18 min 40 sec at 140°C and greater than
1 hr 15 min at 121°C. The resin exothermed in 10 hr at 8OoC and 3 hr at
100°C. The resin is soluble in tetrahydrofuran and dimethylformamide, and
is dispersible in methyl ethyl ketone.
Viscosities were 800,000 poise at 25OC, 1170 poise at
3. "795: This bismaleimide resin is produced by reacting
m-maleimidobenzoic acid chloride with an aromatic diaminocompound in the
molar proportion of difunctional amine acid halide 1.4:2. The resulting
resin consists of a mixture of a bismaleimide and an aminoterminated
monoimide as shown in Fig. 1. This mixture, close to the eutectic mixture,
is cured by melting at 120° to 140OC which causes polymerization by addition
of the free-amino groups to maleimide double bonds followed by a vinyl poly-
merization of the terminating maleimide double bonds.
tle, glassy solid which becomes tacky and flexible above 5OoC.
room temperature drapeable and tacky prepreg, the resin requires formulation
with a reactive diluent to avoid losing mechanical properties at elevated
temperatures. Thus, H795 was mixed with a reactive, unsaturate, high-
boiling liquid monomer.
in methyl ethyl ketone.
reactivity of this formulation. The resulting formulation possessed physi-
cal and reactivity properties which were suitable for hot-melt and solvent-
based prepregging.
exotherm (4 J/g) occurs at 105-155"C, with a major exotherm (200-250" J/g)
at 214°C.
The H795 is a brit-
To obtain a
This mixture was soluble to at least 70% by weight
A free-radical inhibitor was added to reduce the
The DSC of this resin formulation shows that a small
The resin exotherm started at about 10 hr at 100OC. The TGA shows
about 5% weight loss in volatiles up to 16OoC, with major decomposition
4
occurring at 415°C. The viscosity at 78°C is
1200 poise with minimum viscosity of 4.2 poise at 130°C.
177OC is 8 to 9 min.
methylene chloride and is insoluble in l,l,l-trichloroethane.
Char yield is 55% at 520°C.
The gel time at
The resin is soluble in acetone, methyl ethyl ketone,
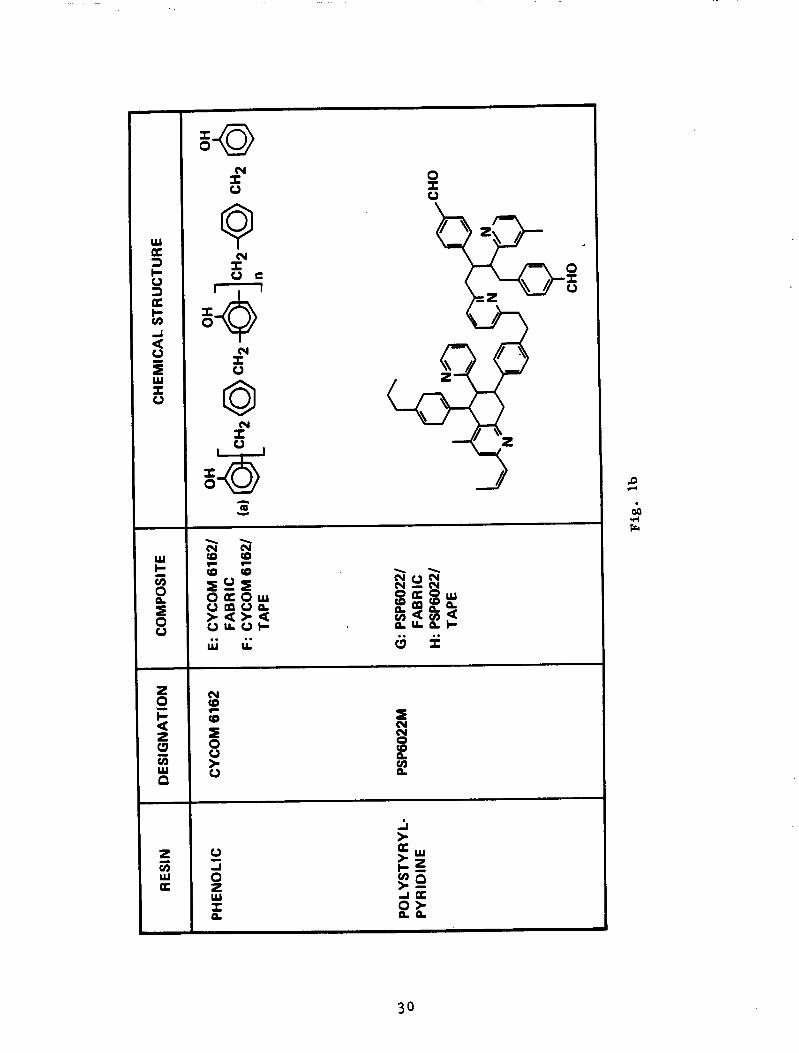
4 . Cycom 6162: The exact chemistry of this commercial phenolic resin
is not known. A probable structure is shown in Fig. 1.
5. PSP 6022: The reaction scheme for this resin is shown in Fig. 1.
This resin has been described previously in detail (4).
The resins just mentioned were used to fabricate eight types of compos-
a) plain-weave woven graphite ite panels using two types of reinforcements:
fabric (A-193, Hercules Inc.), and b) unidirectional tape graphite fiber
(AS-4, Hercules Inc.).
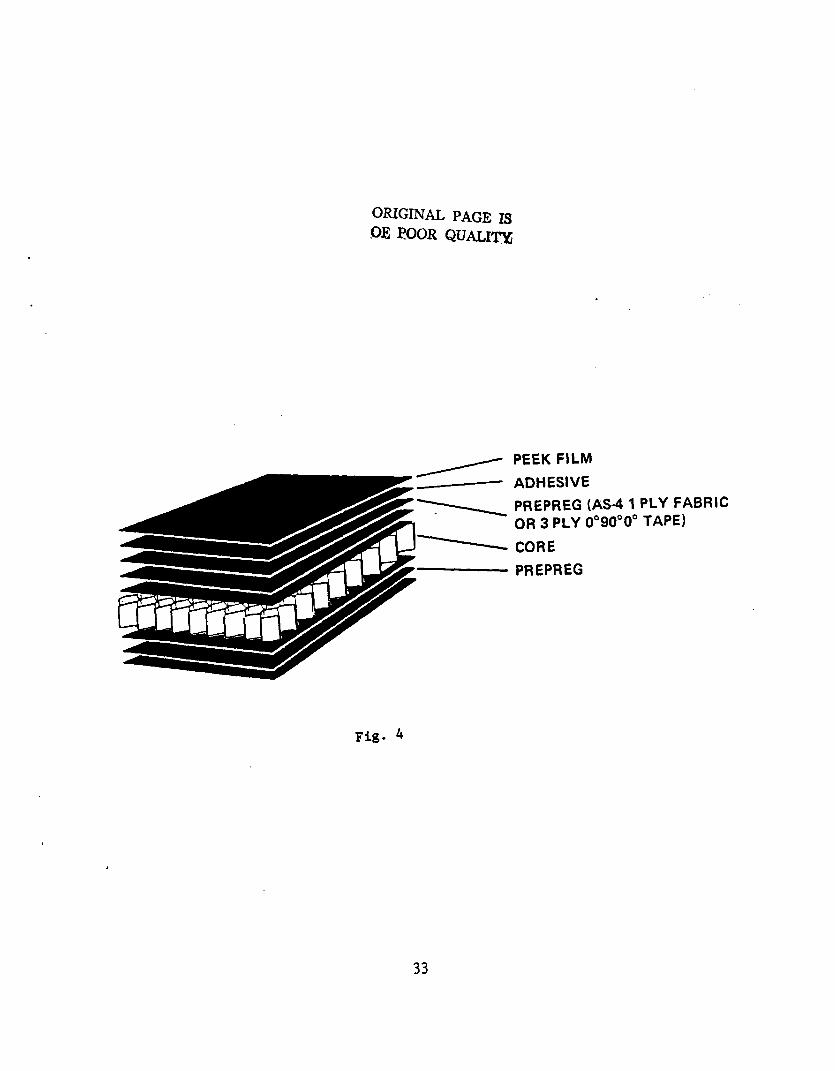
(HR-10, Hexcel Inc.). All composites had a film of polyetheretherketone
(PEEK, Imperial Chemical Co.) adhered with a silicone adhesive (Dow Corning
X3-5815) on one side.
All panels were fabricated using a honeycomb core
The composition of the panels is given in Figs. 1 and 4. The thickness
of the panels varied slightly depending on the number of plies in each
panel. Panels constructed with the graphite fabric had 1 ply on each side
and panels fabricated with the graphite tape had 3 plies on each side placed
at O o , goo, and Oo orientation for maximum strength. The processing of the
baseline panel consisting of epoxy-glass fabric with a polyvinylfluoride
(PVF) film has been described previously in detail (5). Panels type A , B,
E, and F were cocured with the honeycomb core without the use of an addi-
tional adhesive. Panels type C, D, C, and H used a polyimide adhesive film
(FM-34, Cyanamid Co.) to bond the face sheets to the honeycomb.
The XU71775/H795 prepreg used for panels type A and B is prepared by
roll milling the resin onto the graphite fabric. To prepare composites, the
5
. yipreg is precured 20 min at 130°C, cured 6 hr at 177OC, and postcured
18 hr at 177OC.
The H795 fabric prepreg for panel type C is prepared using a solvent
coater with the resin dissolved at 65% by weight in acetone.
panel type D is prepared by hot-melting the resin.
the prepreg is cured 2 hr at 177°C and postcured 1 hr at 204°C and 4 hr at
232OC. The prepregs for panels type E, F, G, and H are available commer-
cially and their curing schedules have been reported previously in Masaline
< 1979) and in Cycom 6162 (Technical Bulletin, Cyanamid Co. 1.
The tape for
To prepare composites
The resin content from the aforementioned prepregs was determined by
e:{t-*acting it with dimethylacetamide. The resin content, R, was determined
3 Y
R = [(W, - wf)/w ] x 100 - Vo P
whereby w = weight of prepreg, wf = weight of fibers, and Vo = volatile
content.
prepregs was in the range of 38-425 by weight.
P The resin content of the composites fabricated using the above
The curing schedule for panels type C, D, G, and H is given in
Table 1.
honeycomb core with the polyimide film adhesive.
panels type A , B, E, and F is given in Table 2. These panels were cocured
with the honeycomb core without the use of an additional adhesive.
panel's adhesiveness is attributed to the inherent adhesive properties of
the prepregs used in these composite panels.
all the composites has been reported previously in detail (6).
The composite laminates were precured prior to bonding to the
The curing schedule for
The
The fabrication procedure for
6
THERMAL AND FLAMMABILITY PROPERTIES
A broad range of flammability and thermal tests were conducted to char-
acterize the composites.
the materials were measured:
2) smoke emission, 3) heat release, 4) toxic-gas emission, 5) ignition
resistance, and 6) surface flammability. In some cases, more than one test
apparatus was used to measure the same property, thus allowing a comparison
of test methods. The thermal stability of the composites was determined by
TCA and by exposure to a radiant heat source to determine mass loss.
Six basic thermal and flammability properties of
1 ) propensity to burn, or oxygen index (01) ,
The composite panels were tested by the oxygen index in accordance with
ASTM D-2863-77 (7).
determine the relative flammability of plastics by measuring the minimum
concentration of oxygen in a slowly rising mixture of oxygen and nitrogen
that will just support combustion; i.e., oxygen index is defined as the
minimum concentration of oxygen and nitrogen that will just support combus-
tion of a material under conditions of this method. The test results are
given in Table 3. Panel D-H795 Tape/PEEK had the highest oxygen index of
all the panels tested followed by Panel A-XU71775/H795 FabridPEEK.
baseline-epoxy glass fabric/PVF had the lowest oxygen index.
The intent of the oxygen index test method is to
The
The smoke emission characteristics of the panels were determined using
two different methods. The first method involves heating the composites in
the National Bureau of Standards (NBS) chamber using the technique of smoke
accumulation (8). The second method involves heating the composites in the
Ohio State University (OSU) heat-release apparatus (9). The first method
subjects
radiant energy source of 2.5 W/cm2 for a period up to 20 min.
evolved is measured through a light path of 91 cm in the sealed chamber
using a light source and photomultiplier tube arrangement.
76.2- x 72.2-mm specimens mounted in a vertical steel holder to a
The smoke
7
The percentage change in the light transmission is converted to an
optical density value by means of the following equations:
DS = (Vl/AL)loglo(lOO/Plt)
where
Ds = specific optical density
V 1 = chamber volume, 0.51 3
L = light-path length, 0.91 m
A 2 = exposed-test-specimen surface area, 42.35 cm
Plt = percent light transmission
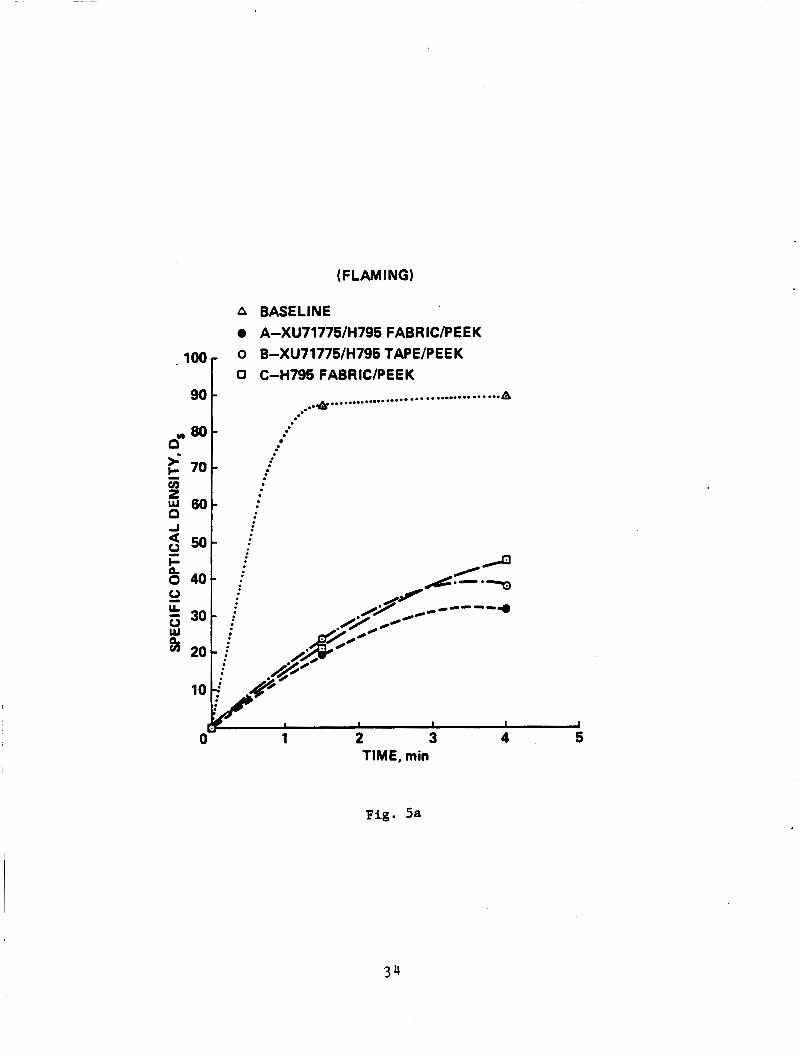
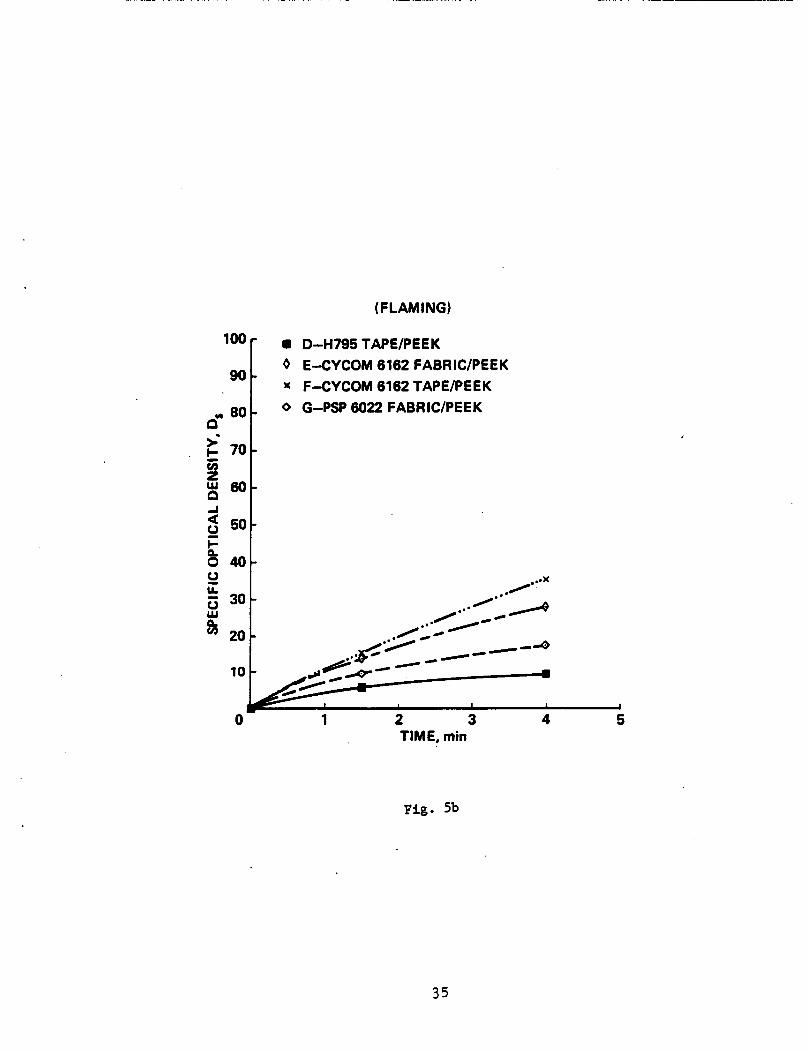
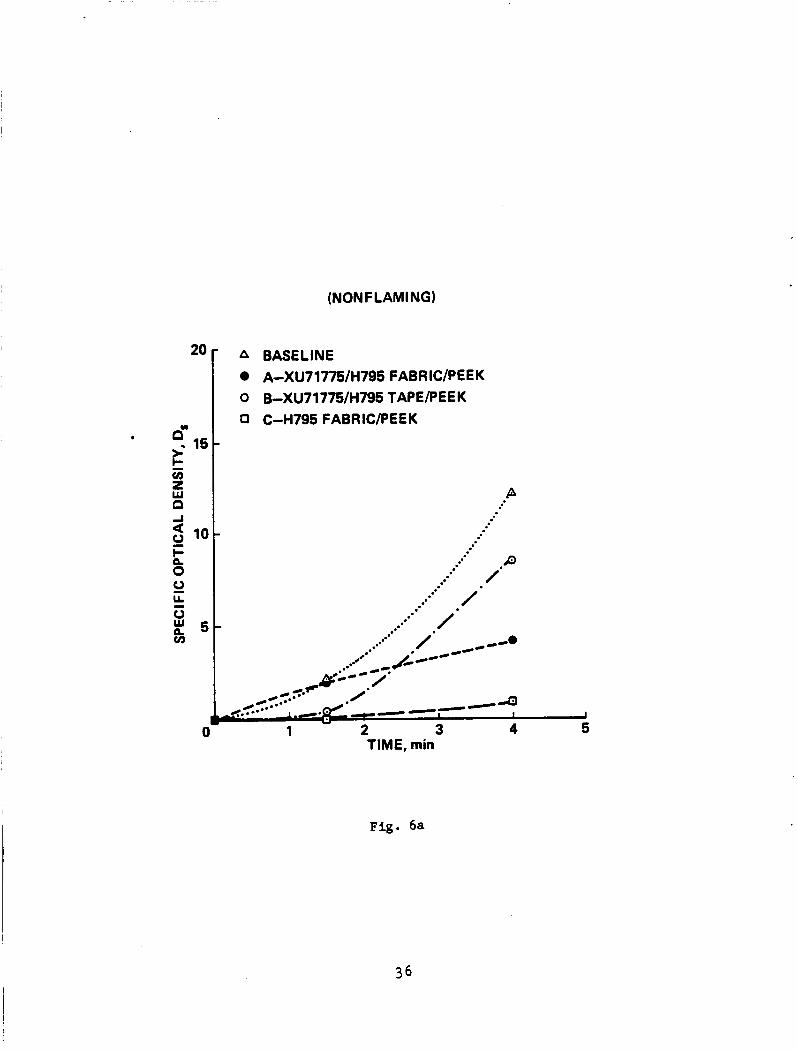
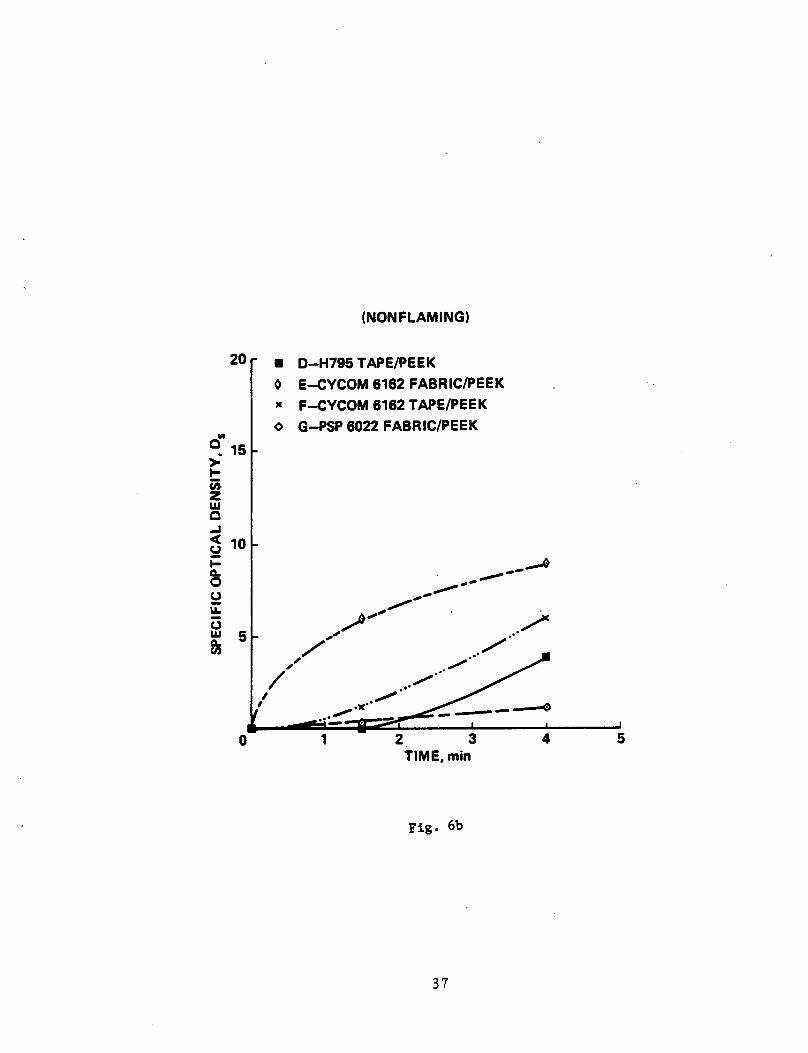
The smaller the Ds value, the better the material. The smoke-test data
are included in Figs. 5 and 6 and give of the composites at specific
times during the test. Composite panel type G (PSP 6022/Fabric/PEEK) had Ds
the lowest smoke evolution at 1.5 min and the baseline epoxy-glass fabric/
PVF had the highest smoke evolution at 1.5 min. Panel type H was not
tested. In the second method, from OSU, the specimen to be tested is
injected into an environmental chamber through which a constant flow of air
passes.
adjusted to produce the desired total heat flux on the specimen of
The specimen's exposure is determined by a radiant heat source
3.5 W/cm'. The specimen is tested so that the exposed surface is verti-
cal. Combustion is initiated by a piloted ignition. The smoke is measured
with a photoelectric tube mounted on top of the apparatus. The smoke dens-
ity is calculated by integrating the light transmission loss over the length
I of the run. t T
( 3 ) - - "2 Ds - AL Specific optical density, max =
8
where
t =
v2 =
A =
L =
Plt =
Ti =
To =
time
volume of air, 2.4 m3/min
area of sample, 232.3 cm 2
length of light path, 0.93 m
percent of light transmission
inlet temperature
outlet temperature
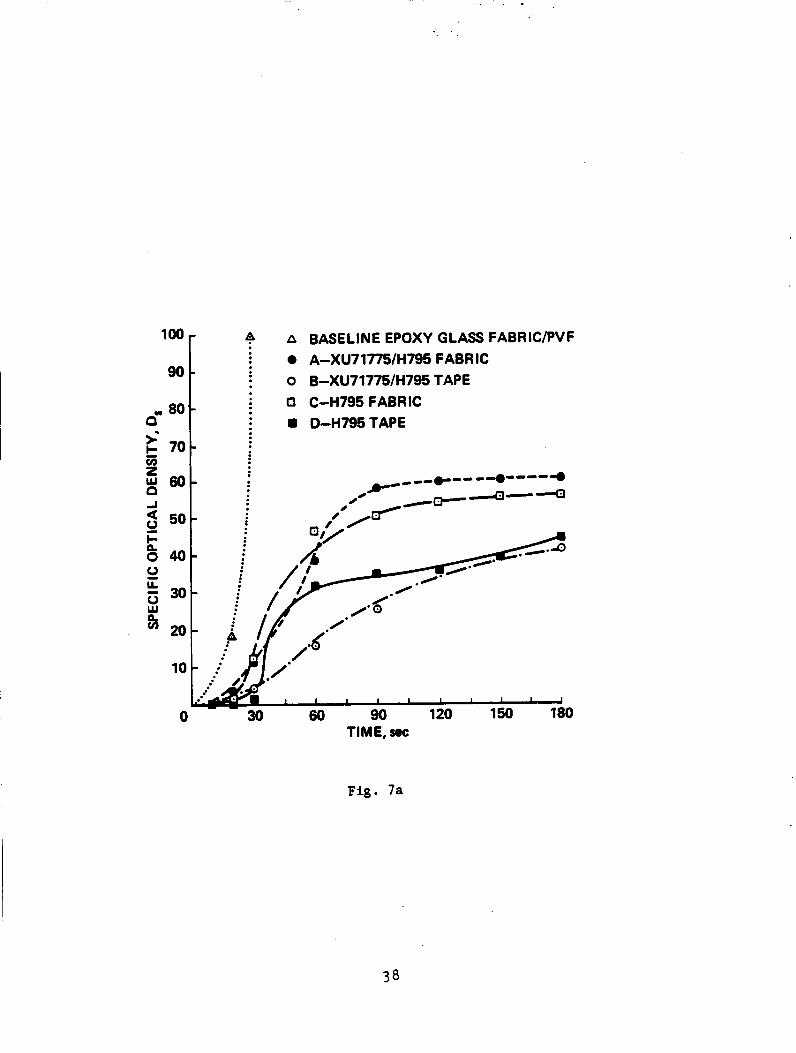
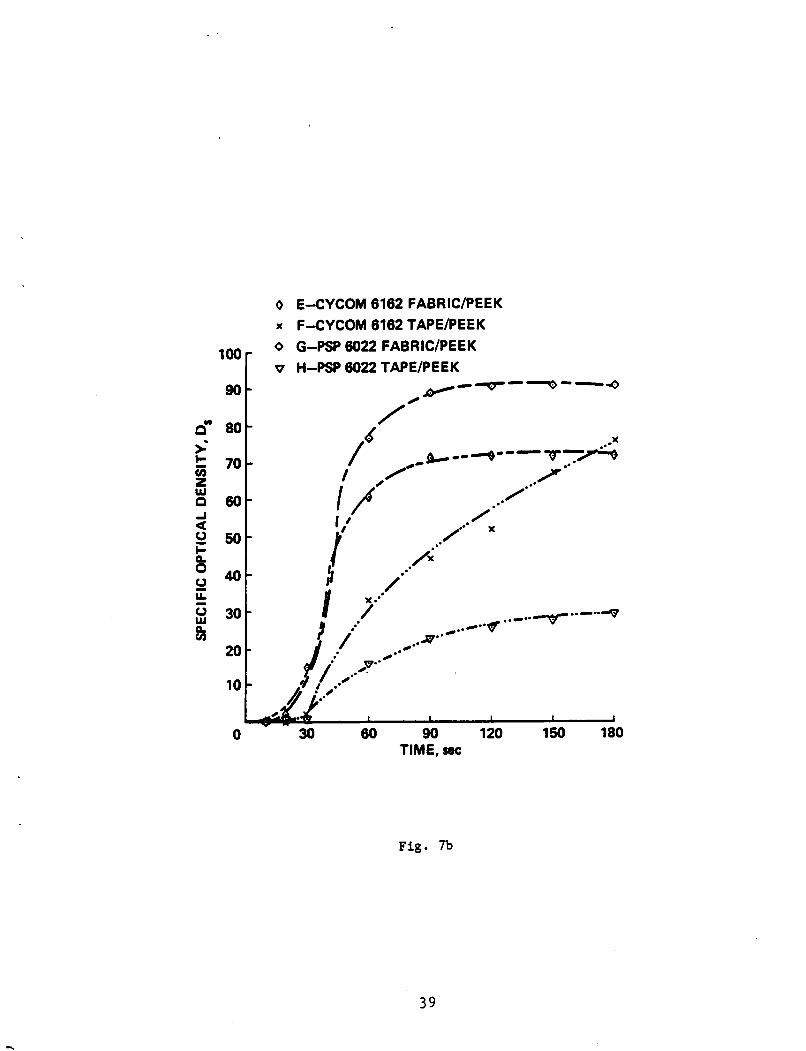
The test results are given in Fig. 7. As in the previous tests, the base-
line epoxy-glass fabric/PVF composite had the highest smoke evolution of all
the composites tested.
smoke evolution. When comparing the two test methods, the relative ranking
of the composites in terms of increased smoke density at 90 sec is as fol-
lows: NBS smoke method, panels type D, G, E, F, A, C, B, and Baseline; OSU
smoke method, panels type H, B, D, F, C, A, E, G, and Baseline. The two
test methods do not correlate very well.
Panel type H (PSP 6022 Tape/PEEK) had the lowest
The heat release of the composite panels was determined using the OSU
Release Calorimeter (9) using a revised test method (10).
dure, the specimen to be tested is injected into the environmental chamber
through which a constant flow of air passes.
determined by a radiant heat source adjusted to produce the desired total-
heat flux on the specimen of 3.5 W/cm2 using a calibrated calorimeter.
temperature difference between the air entering the environmental chamber
and that leaving is monitored by a thermopile having three hot and three
cold, 32-gauge Chromel-Alumel junctions. The hot junctions are spaced
across the top of the exhaust stack.
In this proce-
The specimen's exposure is
The
The cold junctions are located in the
pan below the lower air-distribution plate. Heat-release rates are
9
calculated from the reading of the thermopile output voltage at any instant
of time as
0.02323 mL
where
2 HRR = heat-release rate, kW/m
V,
vb
= measured thermopile voltage, mV
= ttblank't thermopile voltage test obtained by a run
conducted with an empty sample holder assembly
Kh = calibration factor, kW/mV
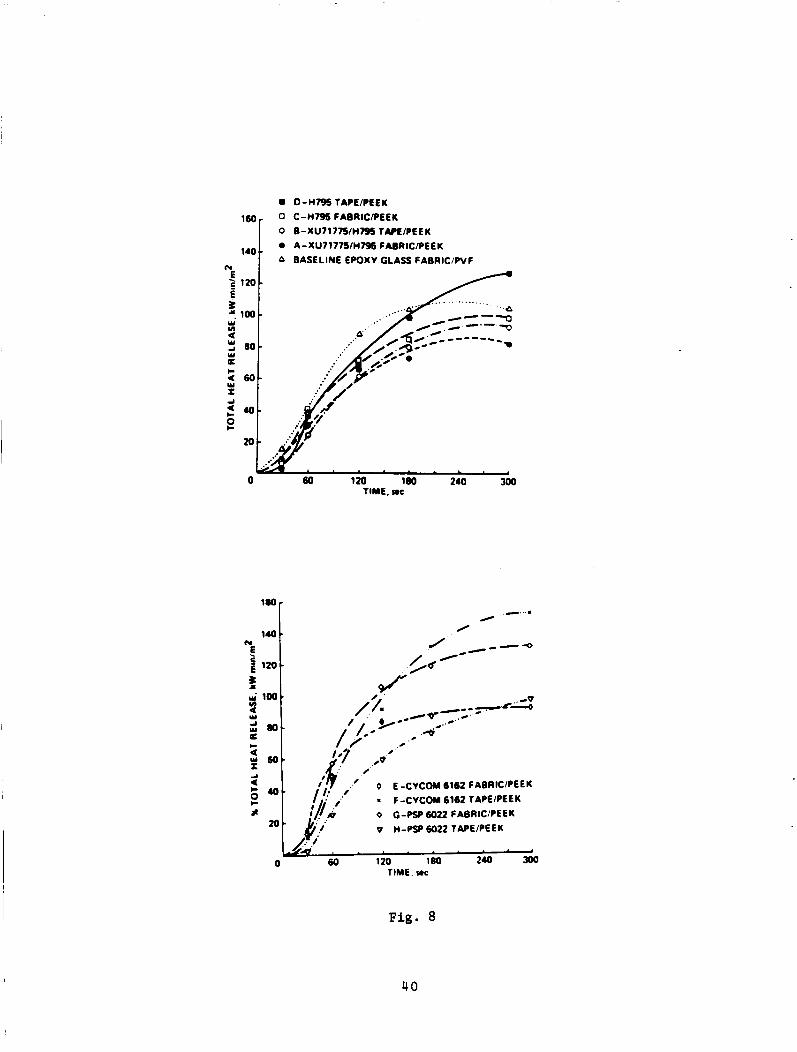
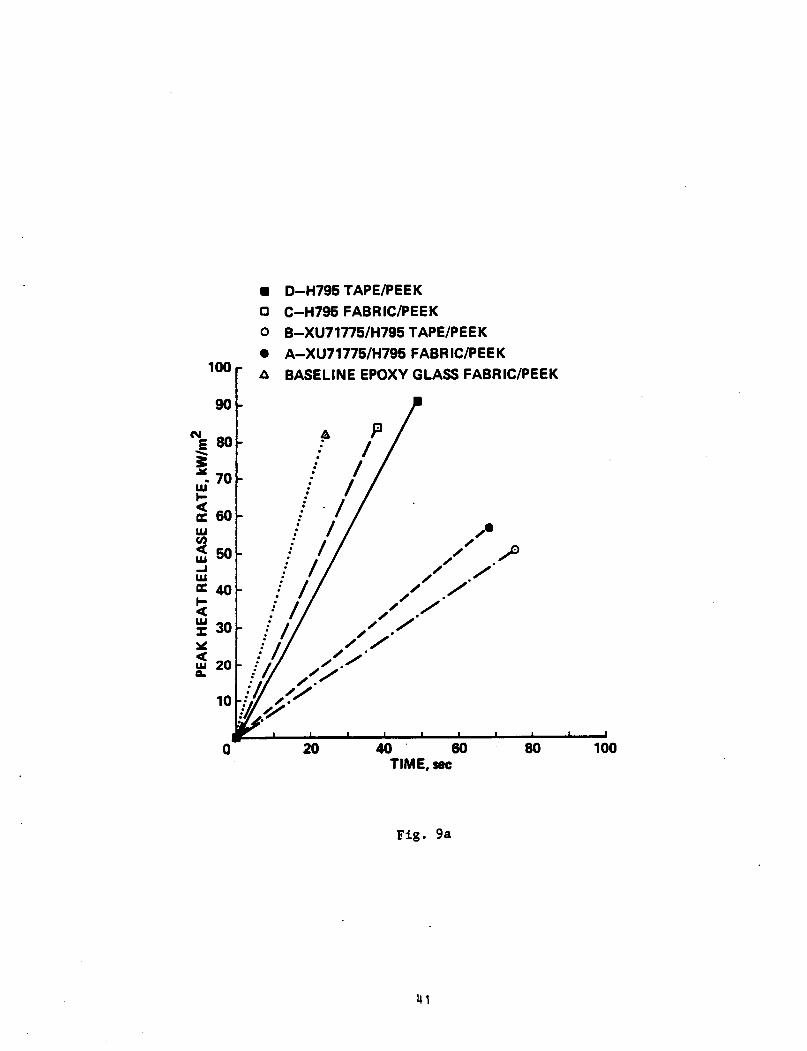
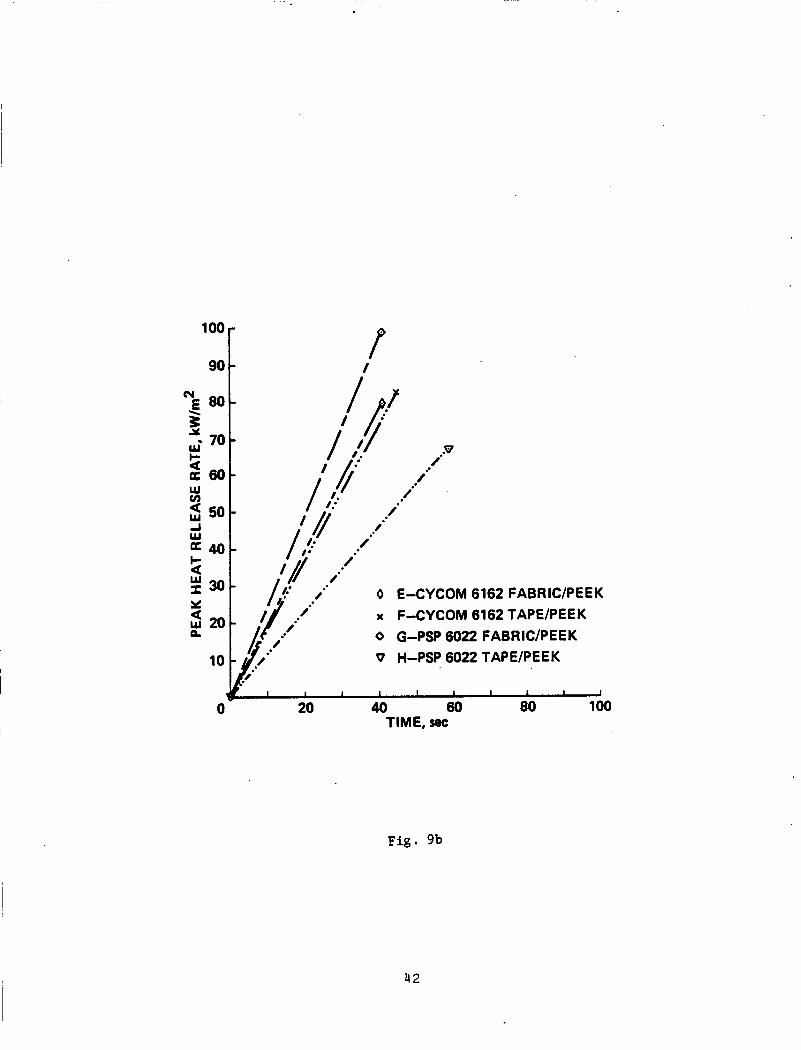
The integral of the heat-release rate is the total-heat release.
According to regulations for aircraft ( 1 1 ) the total-heat release over the
first 2 min of sample exposure shall not exceed 65 kW-min/m2, and the peak-
heat-release rate shall not exceed 65 kW/m*.
total-heat release and peak-heat release rate of the composite panels when
exposed at a heat flux of 3.5 W/cm2. According to these test results, of
the nine panels tested only panel type B (XU7177WH795 Tape/PEEK) met the
earlier criteria.
Figures 8 and 9 give the
The total-heat release of this composite was 62 kW*min/m2
and the peak-heat release rate was 51 kW/m'.
release of 66 and 67 kW/m2, respectively, were marginal failures.
Panels type A and H with heat
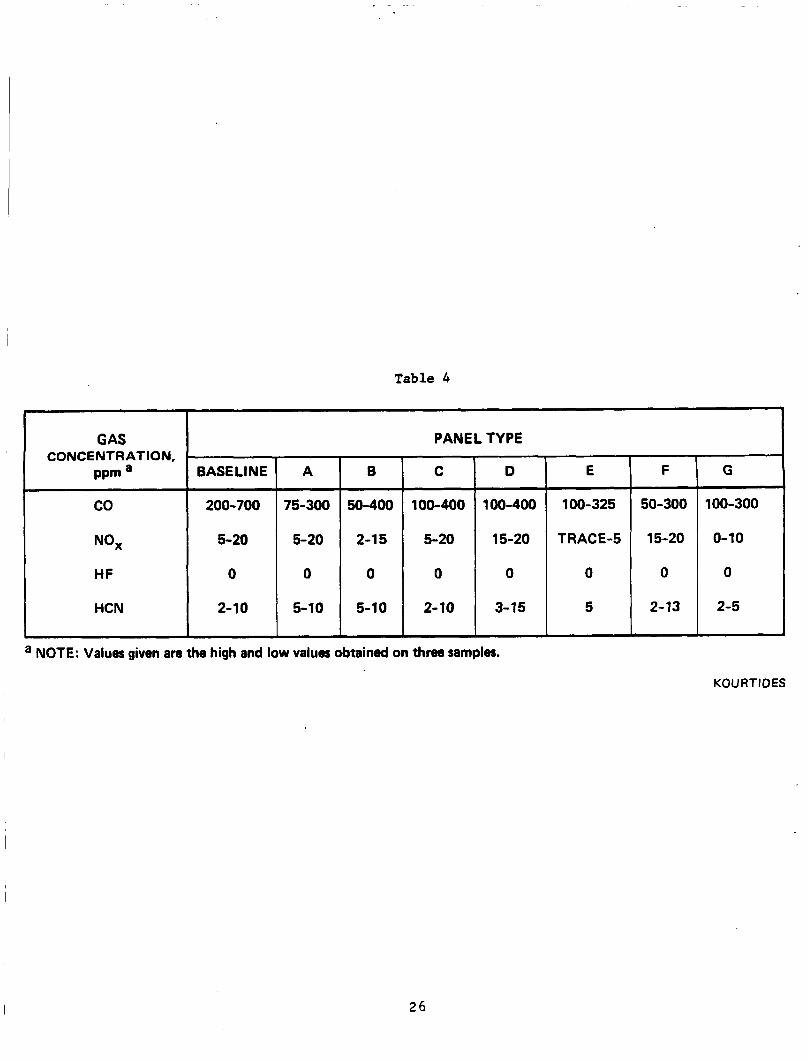
The samples were tested for carbon monoxide (CO), nitrogen oxide (NO,),
hydrogen fluoride (HF), and hydrogen cyanide (HCN).
sured using calorimetric detector tubes as approximate parts per million
(ppm), produced during the flaming mode in the NBS smoke chamber described
previously.
showed the highest CO evolution while NO,, HF, and HCN was approximately the
same in all the composite panels.
These gases are mea-
The test results are given in Table 4 . The baseline panel
Type H panel was not tested. The limits
10
of these gases fall within the guidelines established by the aircraft
industry.
The composite panels were tested for resistance to ignition using the
procedure described previously (12) .
for after-fkame time and burn length.
accordance with the Standard. The test criteria for this test are as fol-
lows: burn-length maximum average, 15.2 cm; after-flame maximum average,
15 sec; and drip-burn maximum average, 3 sec.
Table 5. The panels, except panel type A (XU7177WH795 Fabric/PEEK) , when tested with respect to drip burn, after flame time and burn length, passed
this test. Panel A failed because the burn length extended beyond 15.2 cm.
The composite panels were evaluated
The specimens were conditioned in
The results are given in
The surface flammability of the composites was determined using a radi-
ant energy source.
materials essentially employs a radiant heat source and an inclined speci-
men. The orientation of the specimen is such that ignition is forced near
its upper edge and the flame front progresses downward. The incident heat
flux to the specimen ranged from a maximum of 4.4 W/cm2 at the top to a
minimum of 0.4 W/cm2 at the bottom.
ress of the flame front (F,) and another related to the rate of heat evolu-
tion by the material (Q) are combined to provide a flame spread index (1,)
or The composite panels were tested according to the proce-
dure described previously (13). The panels were tested with the film side
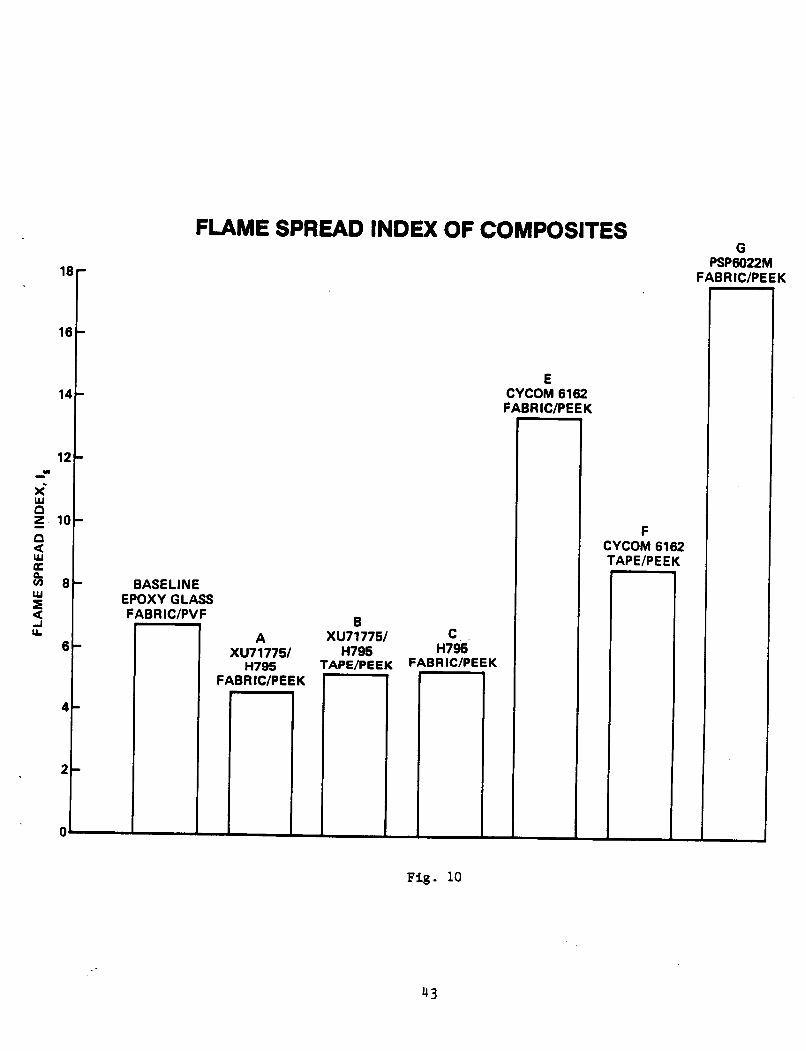
facing the radiant heat source. The test results are given in Fig. 10. The
following observations were made during the testing of these panels:
This method of measuring surface flammability of
A factor derived from the rate of prog-
Is = Fs x Q.
1. Baseline Panel: Considerable charring, bubbling, and cracking
occurred on the specimen surface.
integrity and had slight smoke evolution.
The panel core maintained good structural
11
2. Panel A: Considerable melting, bubbling, and shrinking occurred.
The panel core maintained good structural integrity with moderate charring
on the surface and had slight smoke evolution.
3. Panel B: Considerable melting and shrinking occurred. The panel
core maintained good structural integrity and had very light smoke evolu-
tion. A disparity among the flame-spread indices is indicative of a much
greater heat rise in the case of specimens 3 and 4, and, in the case of
specimen 2, a flame-front advance which did not extend to the first data
point at 7.5 cm.
4. Panel C: Considerable melting, shrinking, and bubbling occurred.
The panel core maintained good structural integrity with moderate charring
and slight flaking, and had slight smoke evolution.
5. Panel E: Considerable melting, bubbling, and shrinking occurred.
The panel core maintained good structural integrity with slight charring and
swelling and had slight smoke evolution.
for specimen 4 are due to a flame-spread advance which extended to the 15-cm
data point.
The higher flame spread indices
6. Panel F: Considerable melting and shrinking occurred. The panel
core maintained good structural integrity, with moderate charring, swelling,
and blistering, and had moderate smoke evolution.
7 . Panel G: Considerable bubbling of the facing noted shortly after
radiant heat exposure.
material. The panel core maintained good structural integrity. A higher
flame-spread index for specimen 1 is due to a greater heat rise.
Surface flaming was confined to the facing
of a
were
8. Panel H:
large specimen.
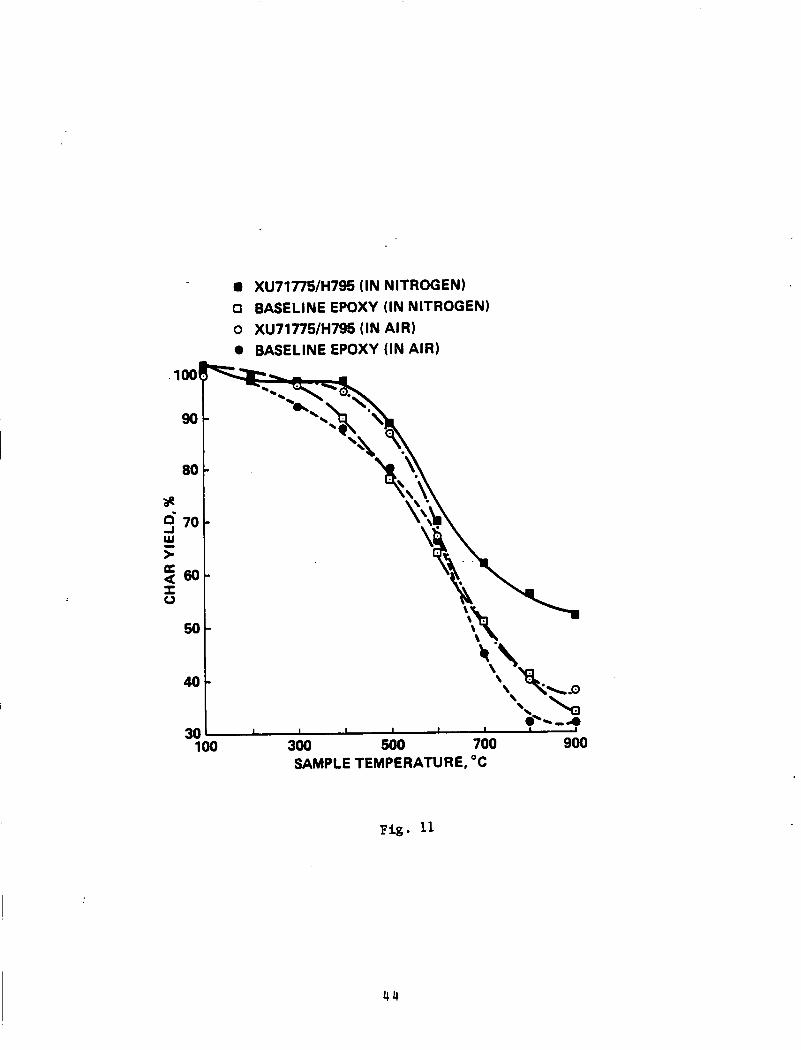
Thermal analyses of the baseline and panel type B (XU71775/H795 Tape)
conducted on a DuPont 1090 thermogravimetric analyzer using both
The panel was not tested because of the nonavailability
12
nitrogen and air atmospheres with a sample size of 10 mg. The TGA data of
10°C/min heating rate in nitrogen and air are shown in Fig. 1 1 . It can be
seen that, under both the nitrogen and air environment, panel type B had a
higher char yield than the baseline epoxy panel.
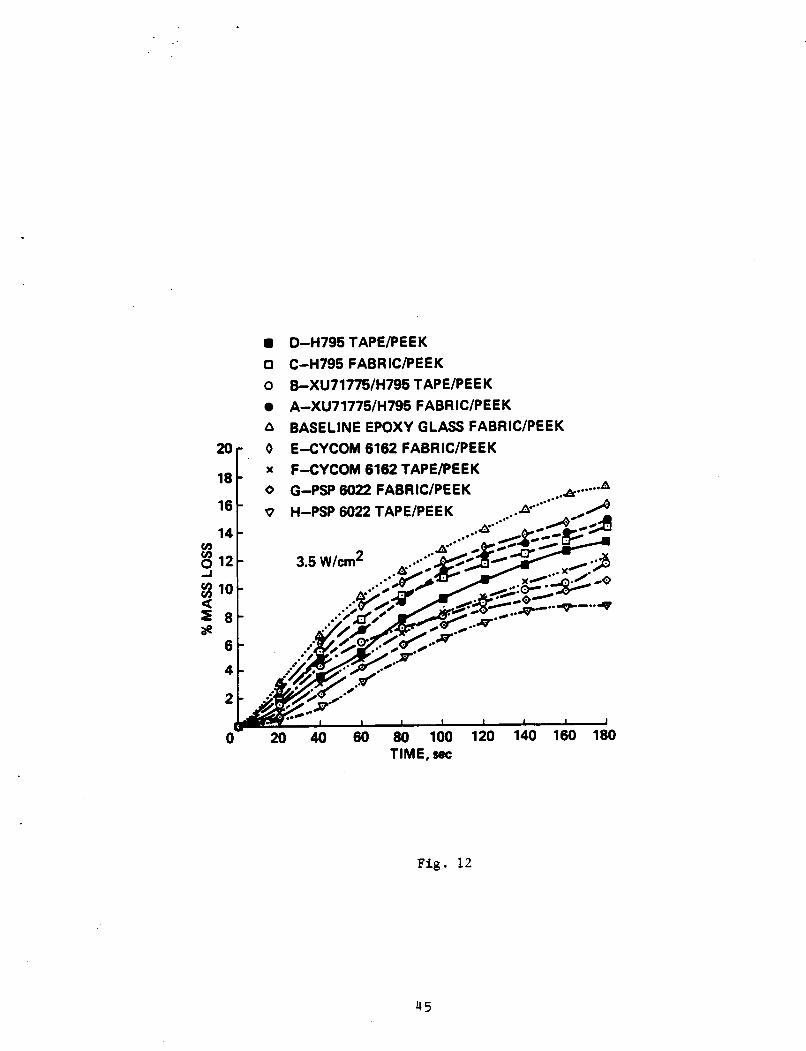
The mass loss of the composite panels was determined using the modified
NBS Smoke Chamber described previously (14).
tested from each of the eight panel configurations at a radiant heat flux of
3.5 W/cm2.
Fig. 12.
At least three specimens were
The percent mass loss as a function of time is shown in
The percent mass loss is governed by this equation:
Mass loss at any time interval Original mass ,oo % Mass loss =
It can be seen that the panels fabricated with the PSP 6022 resin
(panels type C and H) had the lowest weight loss of all the specimens
tested.
resin using the graphite unidirectional tape (panel type B).
the highest weight loss was the baseline epoxy-fiberglass panel.
loss of the composite panel is an important parameter since it corresponds
directly with the amount of visible smoke and other toxic gases produced
during the pyrolysis of the sample.
sponds with a lower rate of pyrolysis products produced. In the mass loss
test, a 6% difference in weight loss was observed between the baseline and
panel type B (XU71775/H795/Tape/PEEK).
also observed between the two panels at 900°C in air, indicating a good
correlation between the thermogravimetric analysis and the mass-loss test
procedure just described.
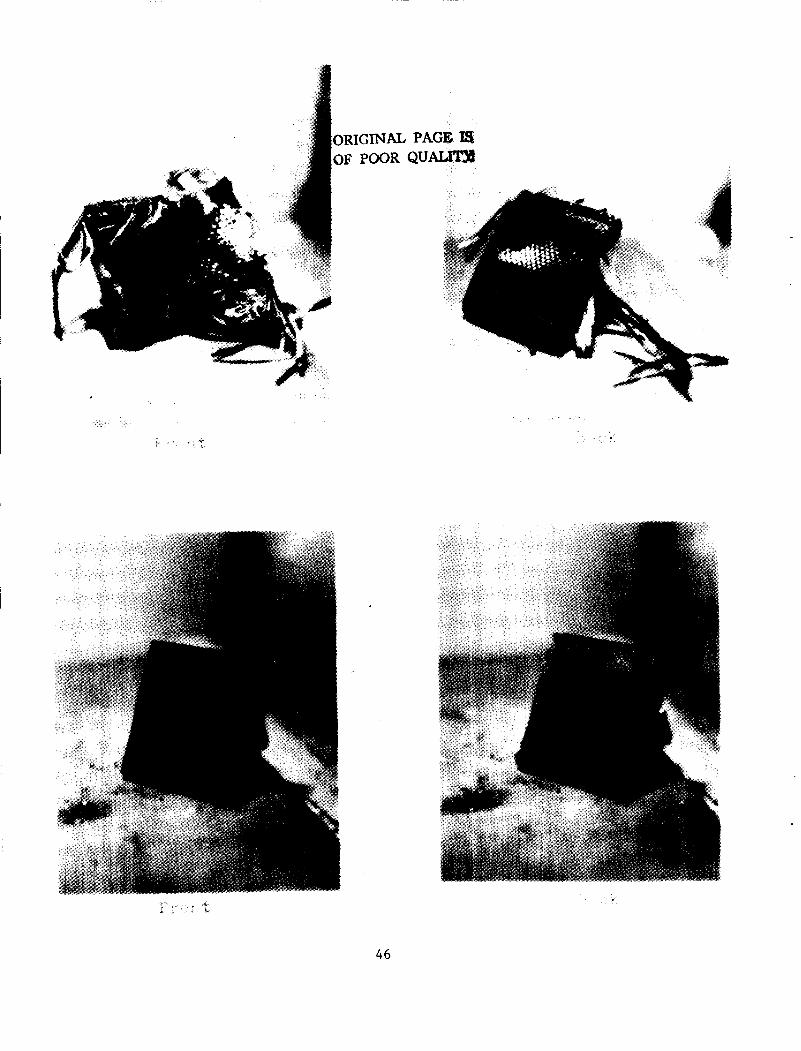
fiberglass composite and the XU71775/H795 graphite fabric composite.
heating for 5 min at 3.5-W/cm2 input heat flux, the baseline epoxy-
This was followed by the panel fabricated with the XU71775/H795
The panel with
Weight
The lower rate of weight loss corre-
In the TGA test a 6% difference was
Figure 13 shows the effect of heating the epoxy-
After
13
fiberglass composite was severely delaminated.
intact as also shown by its low weight loss.
The XU71775/H795 was almost
MECHANICAL PROPERTIES
The flexural strength and modulus, peel and tensile strength, and dens-
The prop- ity of the composite panels were determined per MIL-STD-401 (15 ) .
erties of the baseline epoxy-glass fabric panel, 2.54 cm thick, have been
reported previously (16).
0.67 cm thick.
The present panels tested were approximately
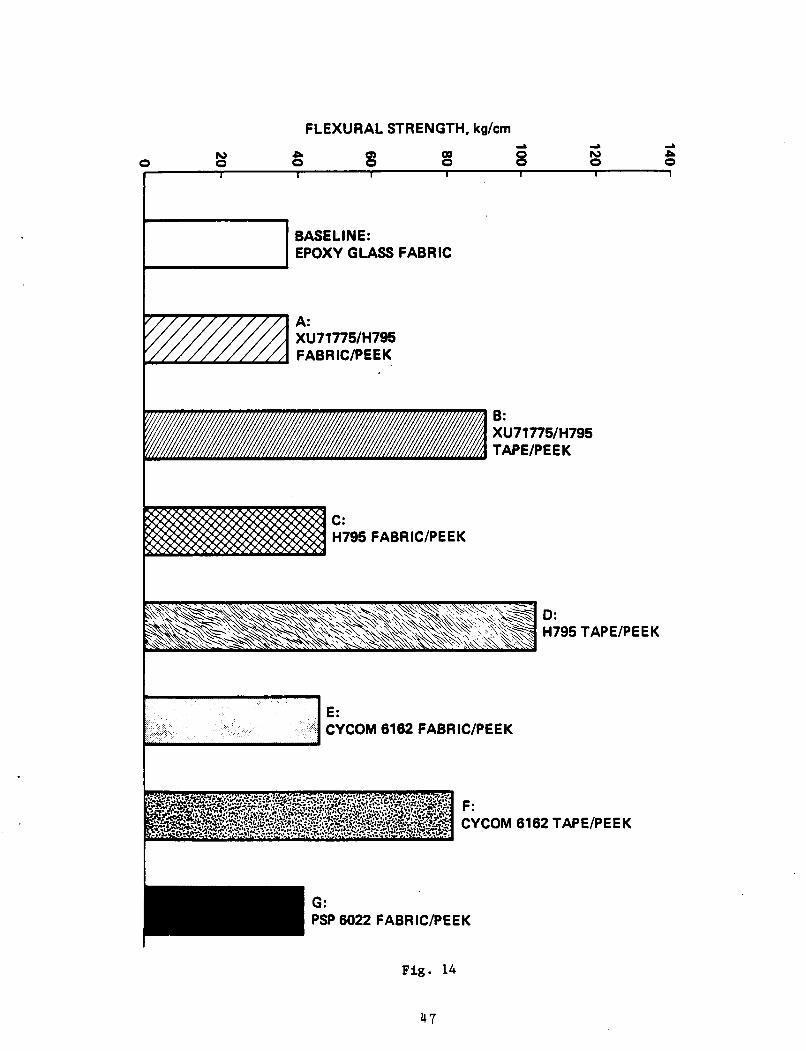
The flexural strength and modulus of the composites were measured using
the sandwich beam flexure apparatus.
span 10 cm. 'The test results are given in Fig. 14.
The bottom span was 55 cm and the top
Panels type B and D
showed the highest compressive stress.
rectional tape showed the highest flexural strength.
thickness of 0.72 cm had a compressive stress of 91.1 kg/cm2 compared to
Panels constructed with the unidi-
Panel type B in a
70.2 kg/cm 2 for a 2.54-cm-thick baseline epoxy-glass fabric panel.
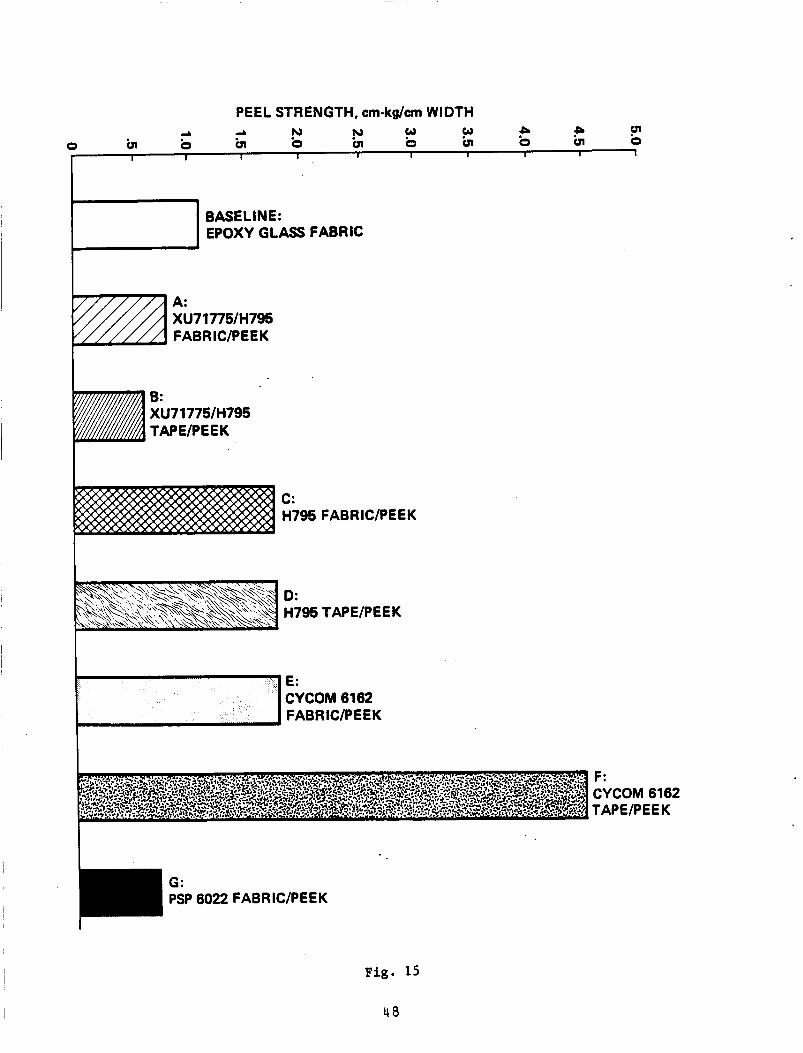
The peel strength of the composites was determined using the climbing
The rate of test was 2.5 cm/min, the drum radius was drum peel apparatus.
5.0 cm, the flange radius was 6.3 cm, and the torque arm was 1.2 cm long.
The test results are given in Fig. 15. Panel type F had the highest peel
strength.
(16).
The baseline panel has a peel strength of 1.3 cm-kg/cm width
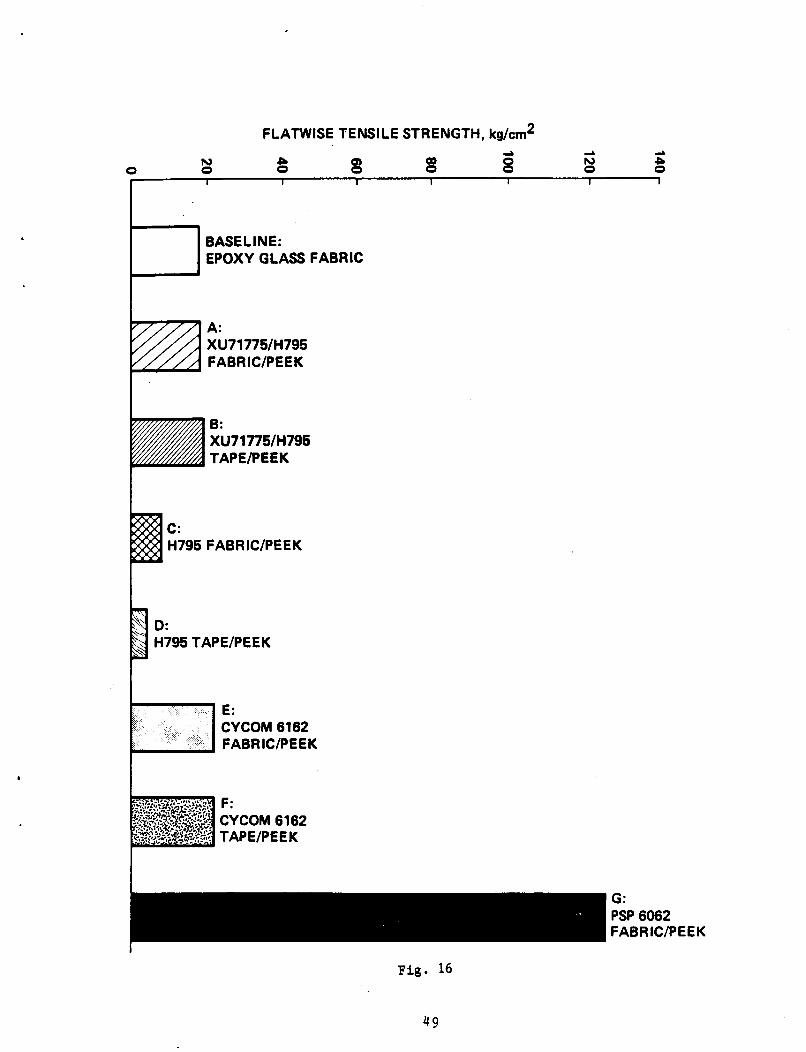
The flatwise tensile strength of the panels is given in Fig. 16. As a
comparison, the flatwise tensile strength of the baseline panel is
1 9.0 kg/cm2.
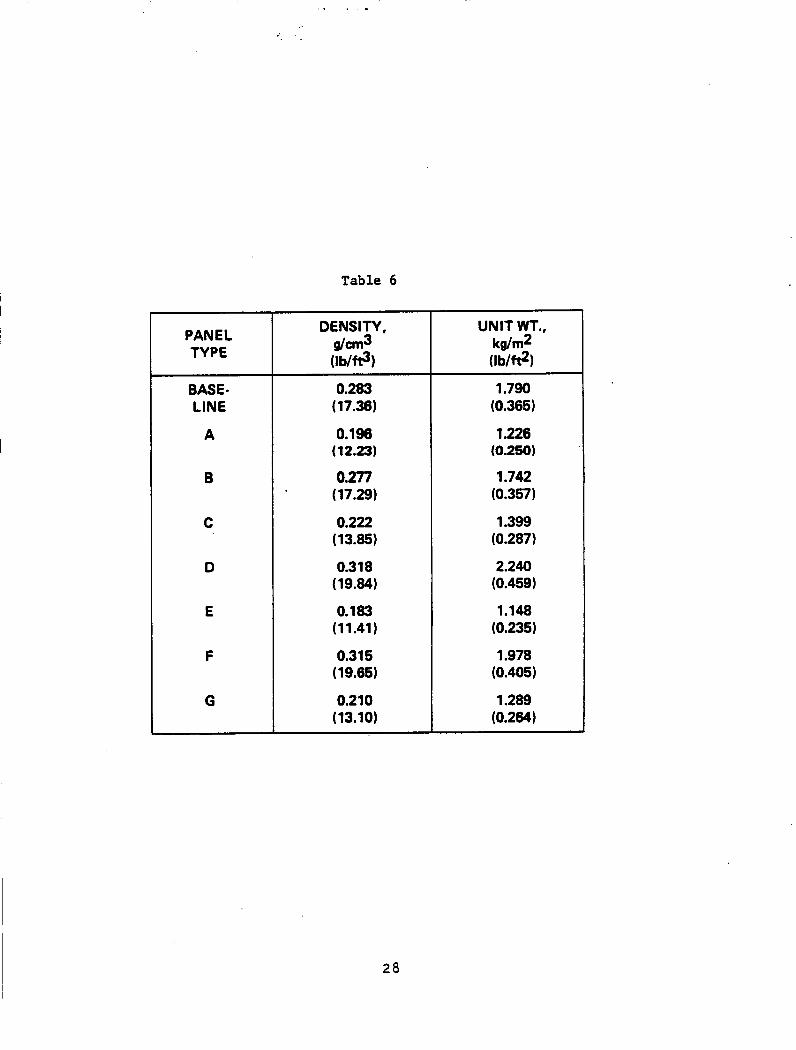
The density of the panels is given in Table 6.
approximately equivalent density to the baseline panel.
fabric panels have a lower density than the baseline panel.
Panel type B has
All of the graphite
14
CONCLUSIONS
To rank the composites, one should consider all of the materials param-
eters and assign weight to each specific parameter or measurement.
studies (10) have indicated that a low rate of heat release or fuel contri-
bution is one of the most important parameters to be considered when using
composites in critical applications such as aircraft.
vations, the following conclusions may be drawn from this review:
The highest total-heat release and heat-release rates were measured
Recent
Based on these obser-
1.
with baseline epoxy composite panel. This panel also exhibited the highest
smoke evolution, highest mass losses, highest CO evolution, and lowest oxy-
gen index of all the composites tested.
2. The type B panel (XU71775/H795 Tape/PEEK) exhibited the lowest
heat-release rate and total-heat release. It was the only panel tested
which meets the performance criteria of maximum heat-release rate of
65 kW/m2 and maximum total-heat release in 2 min of 65 kW-min/m2.
composite panel measured the highest oxygen index of all the panels.
3. The lowest smoke evolution was measured in panel type C
This
(PSP 6022M/Fabric/PEEK) and panel type D (H795 Tape/PEEK).
4 . All graphite panels in the ignition resistance test were "self
extinguishing" and panel type G exhibited the shortest burn length.
5. The panel type A (XU71775/H795/Fabric/PEEK) for the surface flamma-
bility test had the lowest flame spread index followed by panel type C (H795
Fabric/PEEK) and the baseline.
6. All the graphite composites exhibited oxygen indices significantly
higher than the baseline panel, indicating that the graphite panels will
exhibit lower relative flammability. Composite panels A , B, and D showed
the highest indices (44.3, 45.6, 45.0, respectively), compared to 34.6 for
the baseline panel.
15
7 . At approximately equivalent densities, panel type B (XU71775/H795
Tape/PEEK) has much higher flexural and tensile strength than the baseline
epoxy-fiberglass composite panel.
8. The aforementioned data indicate that composites fabricated with
the XU71775/H795 vinyl polystyrylpyridine/mismaleimide resin exhibited the
optimum combination of fire-resistant properties and processing
characteristics.
16
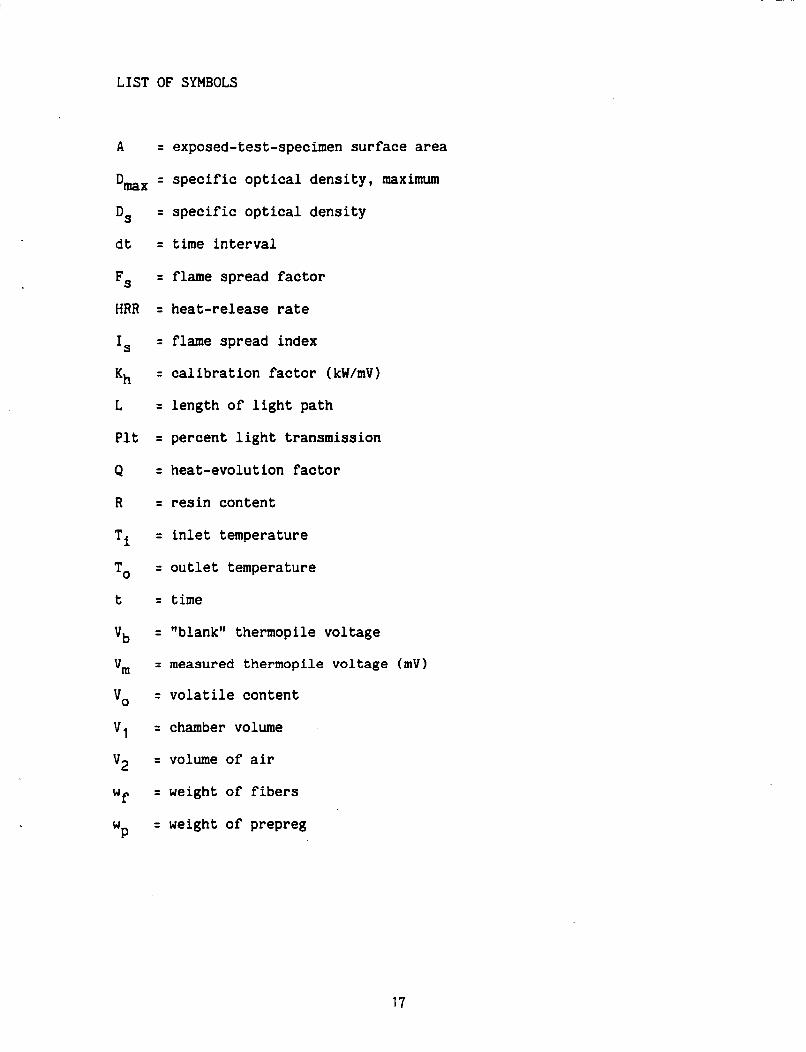
LIST OF SYMBOLS
A = exposed-test-specimen surface area
D,, = specific optical density, maximum
DS
FS
IS
dt
HRR
Kh
L
P1 t
Q R
Ti
*O
t
'b
'm
"0
'1
'2
Wf
P W
= specific optical density
= time interval
= flame spread factor
= heat-release rate
= flame spread index
= calibration factor (kW/mV)
= length of light path
= percent light transmission
= heat-evolution factor
= resin content
= inlet temperature
= outlet temperature
= time
= l'blanktl thermopile voltage
= measured thermopile voltage (mV)
= volatile content
= chamber volume
= volume of air
= weight of fibers
= weight of prepreg
17
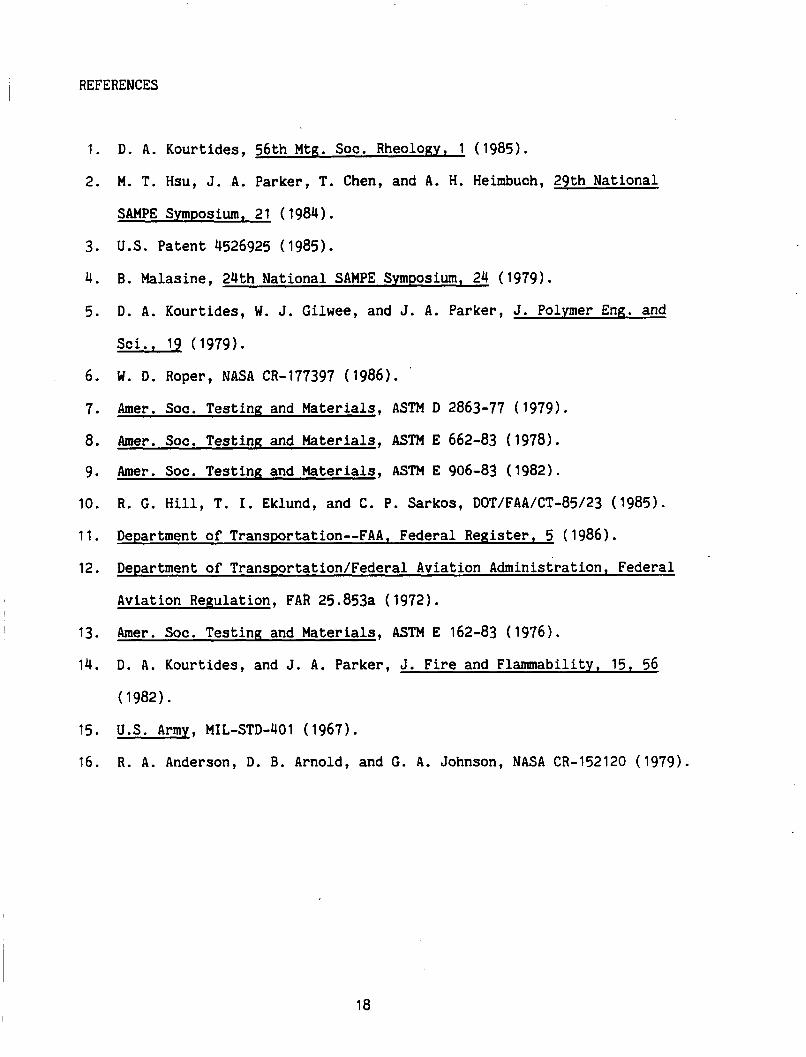
I REFERENCES
1.
2.
3.
4.
5.
6.
7.
8.
9.
10.
11.
12.
I 13.
14.
15.
16.
D. A. Kourtides, 56th Mtg. SOC. Rheology, 1 (1985).
M. T. Hsu, J. A. Parker, T. Chen, and A. H. Heimbuch, 29th National
SAMPE Symposium, 21 (1984).
U.S. Patent 4526925 (1985).
B. Malasine, 24th National SAMPE Symposium, 24 (1979).
D. A. Kourtides, W. J. Gilwee, and J. A. Parker, J. Polymer Eng. and
Sci., 19 (1979).
W. D. Roper, NASA CR-177397 ( 1986). '
Amer. SOC. TestinR and Materials, ASTM D 2863-77 (1979).
h e r . SOC. Testing and Materials, ASTM E 662-83 (1978).
Amer. SOC. Testing and Materials, ASTM E 906-83 (1982).
R. G. Hill, T. I. Eklund, and C. P. Sarkos, DOT/FAA/CT-85/23 ( 1985).
Department of Transportation--FAA, Federal Register , 5 ( 1986).
Department of Transportation/Federal Aviation Administration, Federal
Aviation Regulation, FAR 25.853a (1972).
Amer. SOC. Testing and Materials, ASTM E 162-83 ( 1976).
D. A. Kourtides, and J. A. Parker, J. Fire and Flammability, 15, 56
(1982).
U.S. Army, MIL-STD-401 (1967).
R. A. Anderson, D. B. Arnold, and G. A. Johnson, NASA CR-152120 (1979).
18
LIST OF TABLES
Table 1. Curing schedule for panels type C, D, G, and H
Table 2. Curing schedule for panels type A , B, E, and F
Table 3. Oxygen index of composite panels
Table 4. Gas analysis from the flaming combustion of composite panels
Table 5. Ignition resistance of composite panels
Table 6. Density of panels
I LIST OF FIGURES
I Figure 1. Description of resins and composites
Figure 2. Differential scanning calorimetry of XU71775/H795 resin
Figure 3. Thermogravimetric analysis of XU71775/H795 resin
, Figure 4. Graphite composite panel makeup
Figure 5. Specific optical density of composite panels (flaming)
Figure 6. Specific optical density of composite panels (nonflaming)
Figure 7.
apparatus
Specific optical density of panels in the OSU heat release
Figure 8. Total heat release of panels at 3.5 W/cm2
Figure 9. Peak heat release rate of panels
Figure 10. Flame spread index of composites
Figure 11. Thermogravimetric analysis of XU-71775/"795 and epoxy resins
I Figure 12. Mass loss of panels as a function of time
I Figure 13. Composite panels after exposure to 3.5 W/cm2
I 20
Figure 14. Flexular strength of composite panels
Figure 15. Peel strength of composite panels
Figure 16. Tensile strength of composite panels
21
BIOGRAPHY
Demetrius A. Kourtides is a research scientist in the Thermal Protec-
tion Materials Branch of NASA Ames Research Center, Moffett Field,
California.
He received his M.S. Degree in Chemical Engineering in 1959 from
Brigham Young University, Provo, Utah.
ciate Research Scientist at Varian Associates, Palo Alto, California. Since
From 1959 to 1965 he was an Asso-
1965 after joining NASA, he has done research in the area of thermally
stable thermoset and thermoplastic polymers with special emphasis in the
development of fire-resistant composites. He has authored ninety publica-
tions in this field and holds eight patents relating to composite structures
and fire-resistant polymers and fabrics.
Society of Plastics Engineers and has served as Technical Program Chair-
He is an active member of the
man. He is also a member of the American Chemical Society and SAMPE.
In addition he has written two review articles in professional jour-
nals. His awards include "Best of Issue" award issued by the Journal of
Plastics Design and Processing, the Congressional Excalibur Award in 1984
for excellence in public service, and the NASA Space Act Award in 1985 for
the development of fire-resistant fabrics.
22
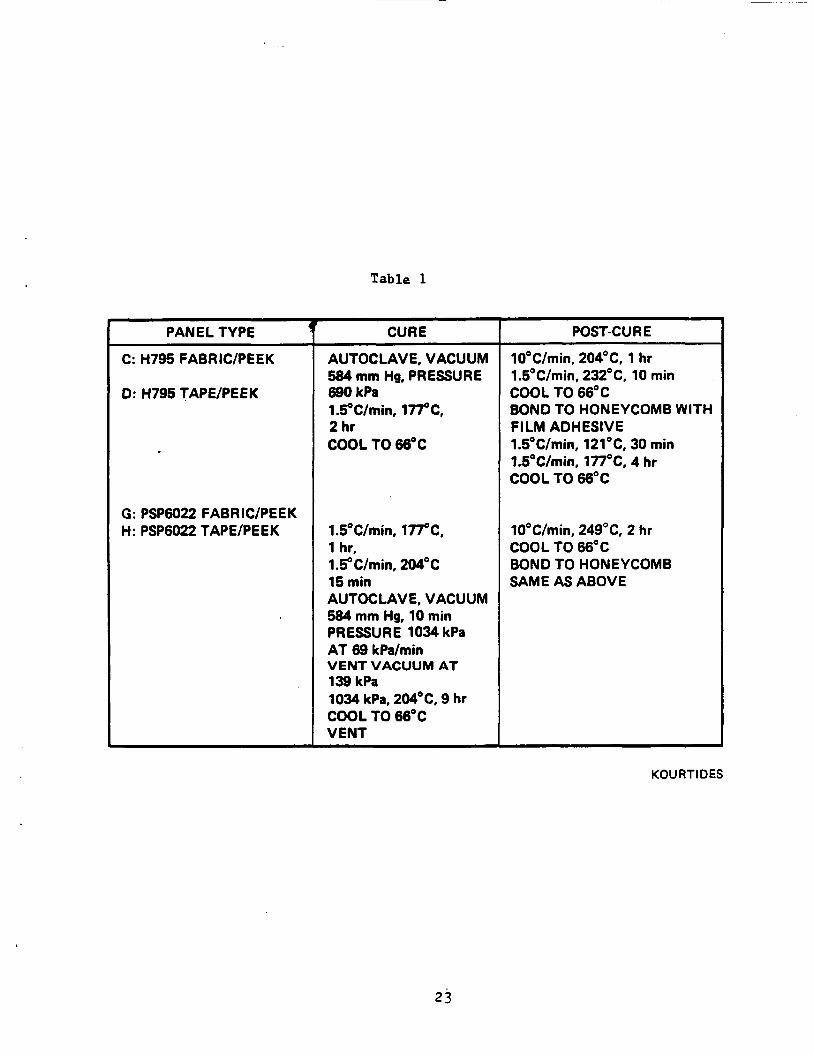
Table 1
PANEL TYPE
C: H795 FABRWPEEK
0: H795 TAPE/PEEK
G: PSP6022 FABRWPEEK H : PSP6022 TAPE/PE E K
CURE ~ ~
AUTOCLAVE, VACUUM 584 mm Hg, PRESSURE 690 kPa 1.5"C/min, In"C, 2 hr COOL TO 66°C
l.S"C/rnin, I W C , 1 hr, 1.5"C/min, 204°C 15 min AUTOCLAVE, VACUUM 584 mm Hg, 10 min PRESSURE 1034 kPa AT 69 kPa/min
139 kPa 1034 kPa, 204"C, 9 hr COOL TO 66°C VENT
VENT VACUUM AT
POST-CU R E
10°C/min, 204"C, 1 hr 1.5"C/min, 232"C, 10 min COOL TO 66°C BOND TO HONEYCOMB WITH FILM ADHESIVE l.S°C/min, 121"C, 30 min lb°C/min, 177'C, 4 hr COOL TO 66°C
lO"C/min, 249"C, 2 hr COOL TO 66°C BONDTOHONEYCOMB SAME AS ABOVE
KOURTIDES
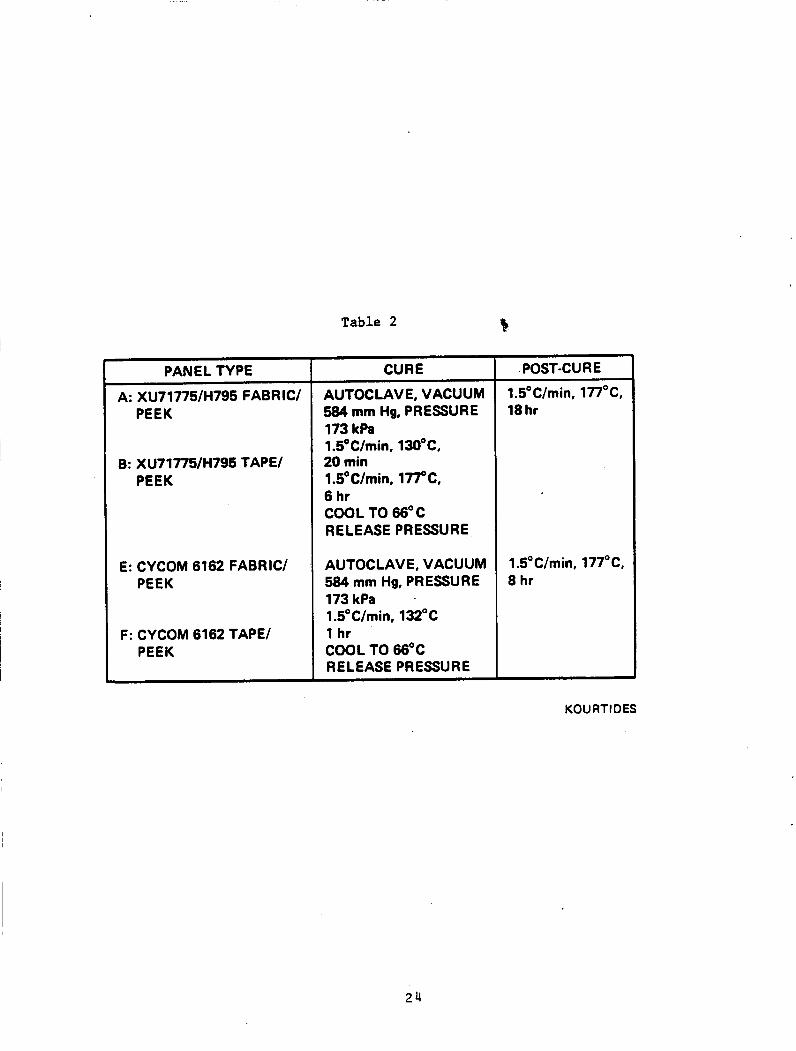
PANEL TYPE
A: XU71775/H795 FABRIC/ PEEK
B: XU71775/H795 TAPE/ PEEK
E: CYCOM 6162 FABRIC/ PEEK
F: CYCOM 6162 TAPE/ PEEK
Table 2 %
CURE
AUTOCLAVE, VACUUM 584 mrn Hg, PRESSURE 173 kPa 1.5"C/rnin, 13OoC, 20 min 1 .S0C/min, 177"C, 6 hr COOL TO 66" C RELEASE PRESSURE
AUTOCLAVE, VACUUM 584 mrn Hg, PRESSURE 173 kPa l.S"C/min, 132°C 1 hr COOL TO 66°C RELEASE PRESSURE
. POST-CU R E
1.5" Chin, 177" C, 18 hr
1.5"C/min, 177"C, 8 hr
KOU RTI DES
24
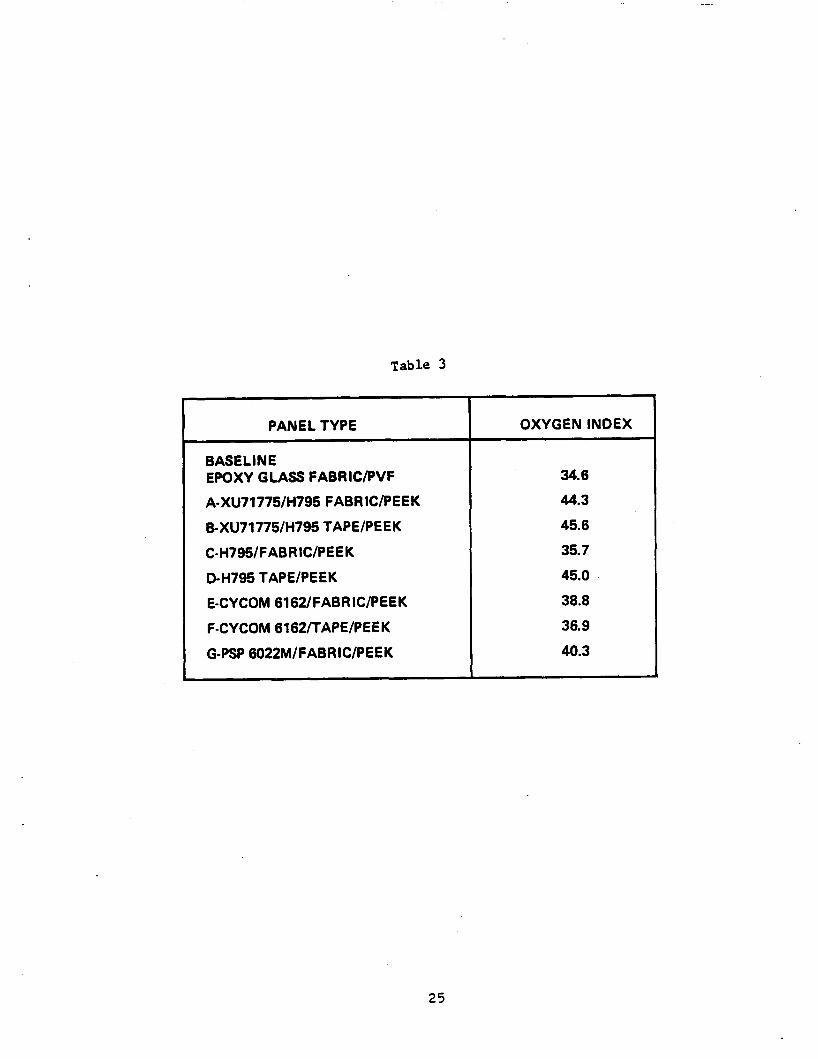
Table 3
PANEL TYPE OXYGEN INDEX ~
BASEL IN E EPOXY GLASS FABRICPVF
A-XU71775/H795 FABR IC/PEEK
&XU71775/H795 TAPE/PEEK
C-H795/FAB R IC/PE E K
0-H795 TAPE/PEEK
E-CYCOM 6162/FABRIC/PEEK
F-CYCOM 6162/TAPE/PEEK
G-PSP 6022M/FABR I C/PEE K
34.6
44.3
45.6
35.7
45.0
38.8
36.9
40.3
25
. -
Table 4
KOURTIDES
26
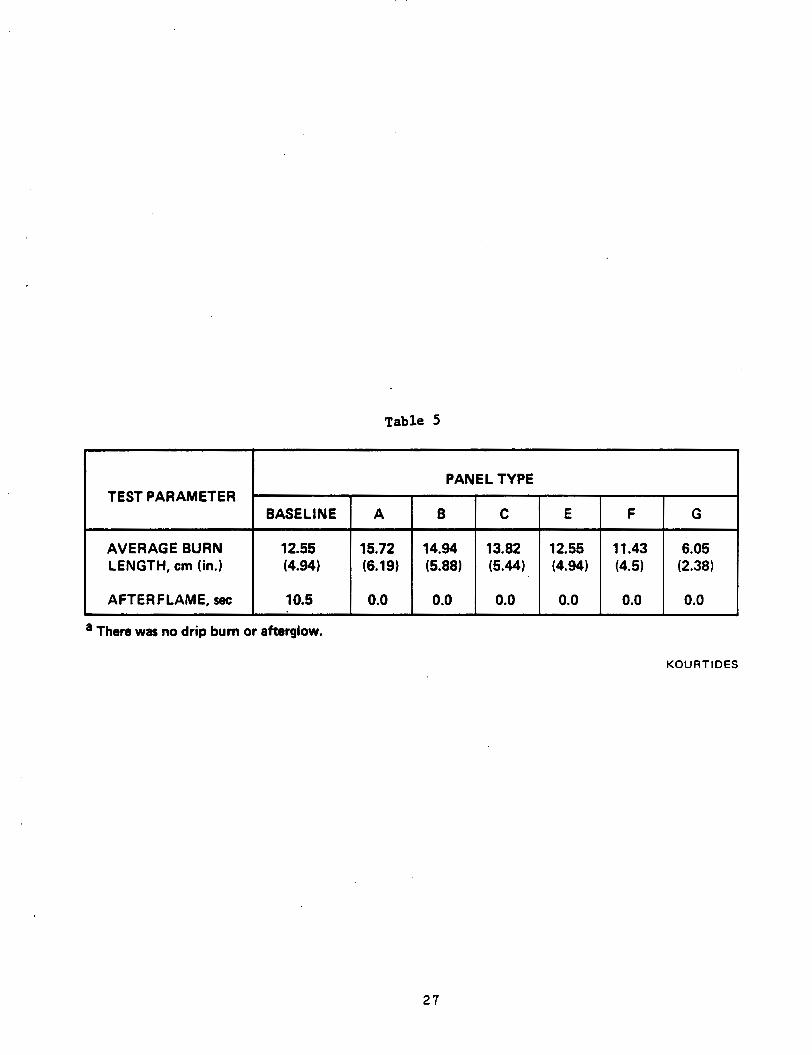
Table 5
~
TEST PARAMETER
AVERAGE BURN LENGTH, cm (in.)
AFTERFLAME, s8c
PANEL TYPE
BASE L I N E A B C E F G
12.55 15.72 14.94 13.82 12.55 11.43 6.05 (4.94) (6.19) (5.88) (5.44) (4.94) (4.5) (2.38)
10.5 0.0 0.0 0.0 0.0 0.0 0.0
a There was no drip bum or afterglow.
KOURTl DES
27
. . . . .' . . .
Table 6
PANEL TYPE
BASE- LINE
A
B
C
D
E
F
G
DENSITY,
(Ib/@) d m 3
0.283 (17.36)
0.196 (12.23)
0.277 (17.29)
0.222 (13.85)
0.318 (19.84)
0.183 (11.41)
0.315 (19.65)
0.210 (13.10)
UNIT WT., kg/m2 (Ib/ft2)
1.790 (0.365)
1.226 (0.250)
1.742 (0.357)
1.399 (0.287)
2.240 (0.459)
1.148 (0.235)
1.978 (0.405)
1.289 (0.264)
2 8
I + 2
b 1 2 IN - z I
It
3
9 1: u 1:
8
Q 3 W
I a 1
0-0-0
7 1 : c a
2 I a I
29
N I 0
N I o c 3 0
0 z
.. .. W I L
.. .. a x
60 8ol 21 1°C
-40
\ 330°C
4b i o 1;o I& 2;o 2b 2;o 310 4 0 4Ao TEMPERATURE, "C
F i g . 2
I I 1 I I I I 1 I
0 100 200 300 400 500 600 700 800 TEMPERATURE, "C
F i g . 3
32
ORIGINAL PAGE IS DE POOR QUU1:Tyi
PEEK FILM ADHESIVE
OR 3 PLY Oo90000 TAPE)
CORE PREPREG
PREPREG (AS-4 1 PLY FABR IC
33
(FLAMING)
n "9
u " I
I I I 1 I
0- 1 2 3 4 5 TIME, min
F i g . 5a
3 4
(FLAMING)
loo
90
ow 8 0 -
z c 70- z 60-
2 50-
D-H795 TAPE/PEEK 0 E-CYCOM 6162 FABRWPEEK X F-CYCOM 6162 TAPE/PEEK
- 0 G-PSP 6022 FABRIC/PEEK
Y = 3 0 - 0
4
0 1 2 3 4 5 TIME, min
35
(NON F LAM I NG 1
A BASELINE
0 B-XU71775/H795 TAPEPEEK A-XU7 1775/H795 FABR IC/PE E K
-
TIME, min
F i g . 6a
(NON FLAM I NG)
20
15 s
a 10 Y
0
' m D-H795TAPE/PEEK 0 E-CYCOM 6162 FABRIC/PEEK x F-CYCOM 6162 TAPE/PEEK o G-PSP 6022 FABRIC/PEEK
TIME, min
F i g . 6b
3 7
. . . . . .
A A BASELINE EPOXY GLASS FABRIC/PVF
loo 1 0 A-XU71775/H795 FABRIC v u - n w ~ a I
- 8 0 1 : 0 C-H795FABRlC 0 D-H795TAPE -
5 O -
!5 40-
a 20-
Y - 3 0 - U
Y
I I I I 1 I 1 I 0 30 60 90 120 150 180
TIME, sa
F i g . 7a
100
90
a" 80 s- 3 o w a Y 50 k O 4 0 Y
9 30 a
20
10
k 70 v)
LL
0
0 E-CYCOM 6162 FABRIC/PEEK x F-CYCOM 6162 TAPE/PEEK O G-PSP 6022 FABRIC/PEEK v H-PSP 6022 TAPE/PEEK
w------4
TIME, sec
F i g . 7b
39
8 0-H795 TAPEIPEEK 0 C-H795 FABAICIPEEK 0 B-XU71775lH795 TAPEIPEEK 0 A-XU71775IH795 FABAICIPEEK
140 a BASELINE EPOXV GLASS FABAICIPVF
Al
140 n
E 2 120
s
-: E 1201
Y ul d ?lWt
a * O t
TIME. YC
0
1
0 60 120 180 240 300 TIME. YC
F i g . 8
40
100
90
(v \ € 8 0 s
70 w- a a 60
w a 50
a40
30 Y
w 20
10
+ W v)
A w
t
a 0
I 0
D-H795 TAPE/PEEK 0 C-H795 FABRWPEEK 0 B-XU7177WH795 TAPE/PEEK 0 A-XU7177WH795 FABR IC/PEEK A BASELINE EPOXY GLASS FABRIC/PEEK
20 40 80 80 100 TIME, sec
F i g . 9a
41
loo[ 90 P /
w wa
J w
c d
2 50
40
ui
Y I 30 a 2 20
10
- /p' -
0 E-CYCOM 6162 FABRIC/PEEK x F-CYCOM 6162 TAPE/PEEK 0 G-PSP 6022 FABRIC/PEEK V H-PSP 6022 TAPE/PEEK
I I 1 I I I I I I 1
0 20 40 60 80 100 TIME, sec
F i g . 9b
42
18-
16
14
12 (I) -
x
z 10- a a a a 8 -
;
w
w
3 A tL
G PSP6022M
FABR IC/PEEK
FLAME SPREAD INDEX OF COMPOSITES
-
-
-
:i 0 2
FABRWPEEK
BASELINE EPOXY GLASS FABR WPVF
?
E CYCOM 6162 FABRWPEEK
F CYCOM 6162 TAPE/PE E K
F i g . 10
4 3
XU71775/H795 (IN NITROGEN) 0 BASELINE EPOXY (IN NITROGEN)
0 BASELINE EPOXY (IN AIR) o XU71775/H795 (IN AIR)
SAMPLE TEMPERATURE, "C
F i g . 11
D-H795 TAPE/PEEK O C-H795 FABRWPEEK 0 &XU71775/H795 TAPE/PEEK
A BASELINE EPOXY GLASS FABRIC/PEEK
x F-CYCOM 6162 TAPEPEEK
A-XU71775/H795 FABRIC/PEEK
0 G-PSP 6022 FABRWPEEK
TIME, sec
Fig. 12
45
JGINAI POOR
: : : t
46
FLEXURAL STRENGTH, kg/cm 4 4 N P
0 0 8 0 z 0 0 00
I I I I I I 1
P 0 h)
BASELINE: I EPOXY GLASS FABRIC
A: XU71775/H795 FABR IC/PEEK
6: XU7 1 775/H795 TAPE/PEE K
C: H795 FABRIWPEEK
I
E: CYCOM 6162 FABRIC/PEEK
G: PSP 6022 FABRWPEEK
Fig. 14
4 7
PEEL STRENGTH, cm-kg/m WIDTH
x 2 x g P ul z d d N
I I I I
0 in 0 in 0
r I I I I I
BASELINE : EPOXY GLASS FABRIC
A: XU7 1775/H795 FABR WPEEK
6: XU71 775/H795 TAP E/PE E K
C: H795 FABR IC/PE EK
H795 TAPEPEEK
E: CYCOM 6162 FABR IC/PEEK
Fig. 15
48
FLATWISE TENSILE STRENGTH, kg/cm2
I
N 0 0 0 8 0 8 0 0
QD
I I I I I I i
P 0
N
BASELINE: EPOXY GLASS FABRIC
A: XU71 775/H795 FABR WPEE K
B: XU71775/H795 TAPEPEEK
C: H795 FABRWPEEK
H795 TAPE/PEEK
E: CYCOM 6162 FABR IC/PEEK
I F i g . 16
49
Report Documentation Page 2. Government Accesrion No. 1. Report No.
NASA TM-100049 4. Title and Subtitle
3. Recipient's Catalog No.
__ ._ . -- -. - - -- 5. Report Date
December 1987 Review of Thermal Properties of Graphite Composite Materials
7. Authodst
D. A. Kourtides
~
9. Performing Organizetion Name and Address
Ames Research Center Moffett Field, CA 94035
12. Sponsoring Agency Name and Address
National Aeronautics and Space Administration Washington, DC 20546-0001
. 6. Performing Organization Code I------ .- E. Performing Organization Report No.
- - - _-- - _. A-88039 10. Work Unit No.
505-45-11 11. Contract or Grant NO.
-- 13. Type of Report and Period Covered
Technical Memorandum -
14. Sponsoring Agency Code
20. security C l a d . (of this page) 21. No. of pages 19. Security Classif. (of this report)
Unclassified Unclassified 49
1
15. Supplsmentery Notes
22. Price
A02
Point of Contact: D. A. Kourtides, Ames'Research Center, MS 234-1 Moffett Field, CA 94035 (415) 694-4784 or FTS 464-4784
16. Abstract Flammability, thermal, and selected mechanical properties of composites
fabricated with epoxy and other thermally stable resin matrices are described. smoke evolution, thermal degradation products, total-heat release, heat- release rates, mass loss, flame spread, ignition resistance, thermogravimetric analysis, and selected mechanical properties. This paper describes the prop- erties of eight different graphite composite panels fabricated using four different resin matrices and two types of graphite reinforcement. The resin matrices included: XU71775/H795, a blend of vinylpolystyrylpyridine and bismaleimide; H795, a bismaleimide; Cycom 6162, a phenolic; and PSP 6022M, a polystyrylpyridine. tape or fabric. The properties of these composites were compared with epoxy composites. It was determined that the blend of vinylpolystyrylpyridine and bismaleimide (XU71775/H795) with the graphite tape was the optimum design giving the lowest heat release rate.
Properties which were measured included limiting-oxygen index,
The graphite fiber used was AS-4 in the form of either
__ 18. Distribution Statement 17. Key Words (Suggested by AuthorW
Graphite composites Thermal properties Flammability
Unclassified-Unlimited
Subject Category - 24
NASA FORM 1626 OCT 8(1 For sale by the National Technical Information Service, Springfield, Virginia 2216 1