review of planning concepts and privatization - save the cape
TRANSCRIPT

Review of Planning Concepts and Privatization Options
June 2010
FINAL REPORT
P F Richardson AssociatesP.F. Richardson Associates

FINAL Report – Executive Summary
1 | P a g e
EXECUTIVE SUMMARY
REVIEW OF NCIT PLANNING CONCEPTS AND PRIVATIZATION OPTIONS
The North Carolina State Port Authority (The Authority) worked with several consultants to develop a
Business Plan (The Plan) for the development of the North Carolina International Terminal (NCIT).
The Plan includes a three-phase development of a semi-automated terminal on 600 acres in Brunswick
County, NC with an ultimate capacity to handle 3,000,000 TEUs per year. As planned, the waterside
approach to the terminal will be designed to allow access to a 12,500 TEU design vessel, and ultimately
the NCIT will support the loading and/or unloading of three 12,500 TEU vessels or four vessels of a
more moderate size. The Plan proposes the implementation of an Automated Rail-Mounted Gantry
(ARMG) system for container operations, which optimizes container operations on the available
footprint. The Plan includes the required dredging, proposed on-site terminal development, and
proposed off-site development of the additional infrastructure necessary for the successful development
of the terminal.
As the Authority is exploring options for obtaining private funds for terminal development, this study
was to identify cost saving options that might make the development of the NCIT more attractive to
private investors. Paul F. Richardson Associates (PFRA) and TEC Inc. were hired by the Authority to
review the planning concepts presented in the NCIT development documents and identify potential
alternate concepts for terminal development that would meet the financing criteria used by the private
investment community. The PRPA and TEC review team did not identify any major flaws in the
ultimate NCIT Development Plan., however, the review team did identify several important planning
assumptions that will be important in order to maximize the potential private investment in the project,
including:
Developing a business strategy for the terminal development that that’s advantage of its
proximate to a planned nearby distribution center;
Developing a marketing plan that will enable the terminal to achieve the forecasted cargo
projections;
Developing a phased construction plan that will allow the terminal to achieve a positive cash-
flow within the first few years of operations;
Because of the current world economic conditions and its impact on the private investment community,
it was important to identify possible cost-saving development options to the current plan that would
make the project more attractive to private investors. While reviewing the current terminal plan, the
Study identified several areas where capital and operational cost savings could be achieved, including:
FINAL Report – Executive Summary
2 | P a g e
RTGs
ARMGs
Adjusting the terminal site footprint to reduce costly grading and site preparation requirements;
Developing a terminal operating plan and equipment plan that more efficiently met planned
cargo throughputs and productivity requirements;
Developing a Container Yard Plan based on this revised equipment plan; and
Revising the layout and sizing of the proposed on-dock ICTF (Intermodal Container Transfer
facility) to better meet market projections and rail operations.
Base on this assessment of where possible capital cost savings could be achieved, especially early in
project development, an Alternate Concept that focused on cost-saving opportunities during initial
project startup (Phase 1) was developed, with Phase 2 and 3 also being developed in a financially
prudent manner as cargo and revenue grows. The review team identified two primary concepts for the
Phase 1 development that have the potential to significantly reduce the initial capital cost investment.
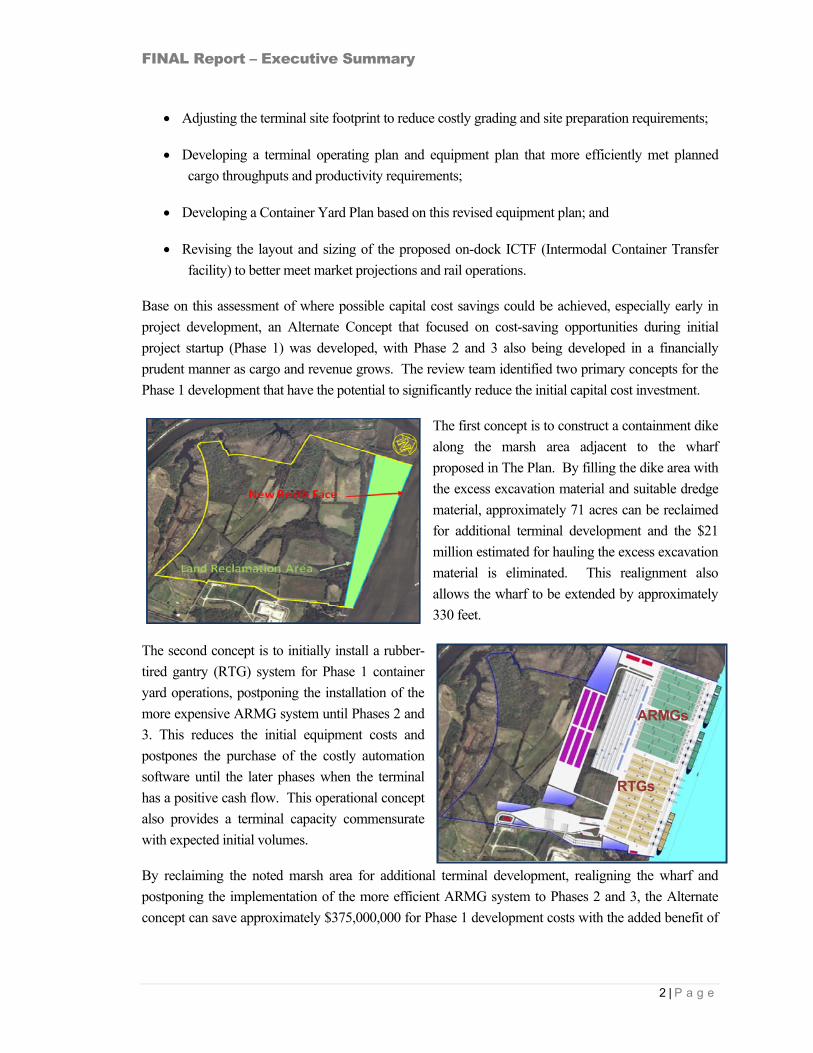
The first concept is to construct a containment dike
along the marsh area adjacent to the wharf
proposed in The Plan. By filling the dike area with
the excess excavation material and suitable dredge
material, approximately 71 acres can be reclaimed
for additional terminal development and the $21
million estimated for hauling the excess excavation
material is eliminated. This realignment also
allows the wharf to be extended by approximately
330 feet.
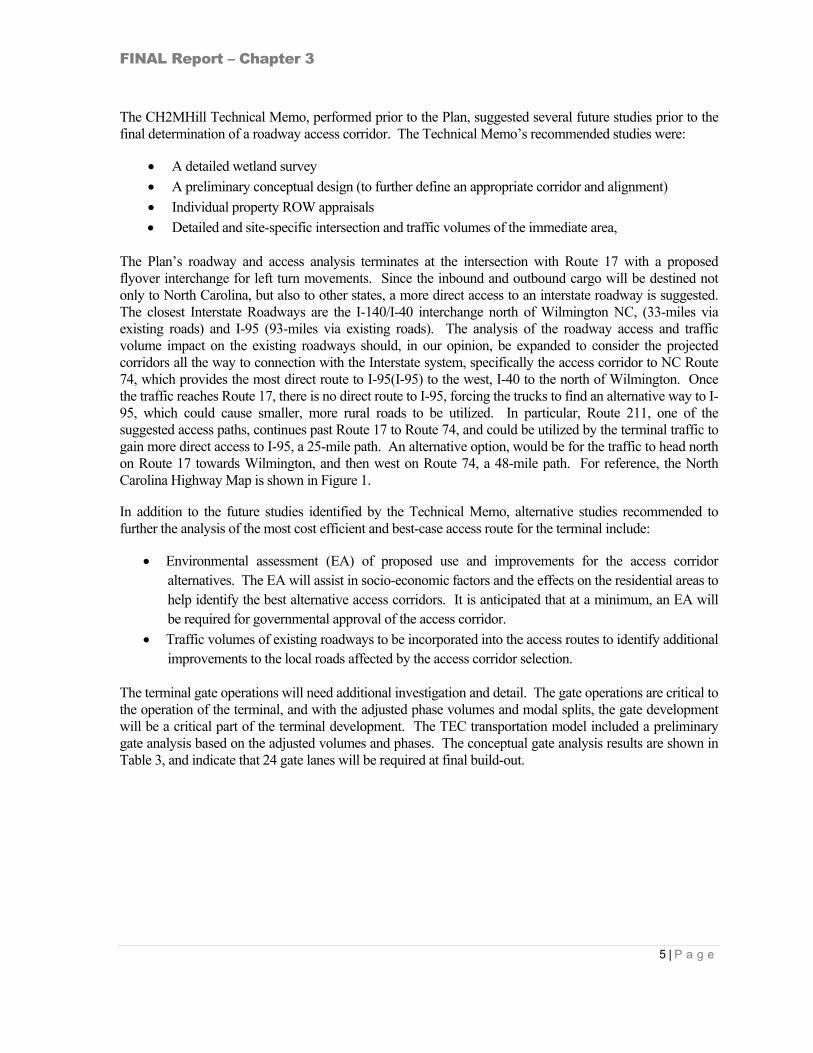
The second concept is to initially install a rubber-
tired gantry (RTG) system for Phase 1 container
yard operations, postponing the installation of the
more expensive ARMG system until Phases 2 and
3. This reduces the initial equipment costs and
postpones the purchase of the costly automation
software until the later phases when the terminal
has a positive cash flow. This operational concept
also provides a terminal capacity commensurate
with expected initial volumes.
By reclaiming the noted marsh area for additional terminal development, realigning the wharf and
postponing the implementation of the more efficient ARMG system to Phases 2 and 3, the Alternate
concept can save approximately $375,000,000 for Phase 1 development costs with the added benefit of

FINAL Report – Executive Summary
3 | P a g e
increasing the site area by approximately 70 acres. No additional savings in Phases 2 and 3 were
identified. For these subsequent Phases, the development plans and associated costs appear to be
comparable.
In order for the development of the NCIT to move forward, a strategy to accomplish the required
project development activities needs to be established. These activities will include pre-design studies,
permit acquisition, and engineering and planning efforts. For the successful and timely implementation
of this project, these activities will need to be coordinated between the Authority and other stakeholders
and jurisdictional agencies. Frequent and timely coordination will be particularly important with the
USACE. The Project Development Budget outlined in The Plan estimates $32.235 million for the
project development activities listed. It is not yet established what portion of this budget will be the
responsibility of the Authority and what portion will be the responsibility of the other agencies. Also, it
is TEC’s opinion that the ‘on-site’ components of the Engineering and Planning efforts identified in The
Plan’s Project Development Budget would in fact be the responsibility of the private developer and
should therefore not be included in the Project Development Budget. The budget estimated by TEC for
the project development activities is $24,380,000, of which, approximately $18,000,000 would be the
responsibility of the Authority. It should also be reiterated that the coordination with USACE is of the
utmost importance in order for this project to proceed on a timely schedule. An initial introduction of
the project to the proper USACE staff should be arranged as soon as practicable.
This report is a compilation of the individual interim reports prepared by TEC to address the tasks
identified in the NCIT Review of Planning Concepts and Privatization Options Scope of Work.

FINAL Report – Executive Summary
4 | P a g e
REVIEW TASKS
TABLE OF CONTENTS
CHAPTER 1 – DATA COLLECTION AND REVIEW
CHAPTER 2 – DATA ANALYSIS AND ALTERNATE DEVELOPMENT CONCEPT
CHAPTER 3 – LAND TRANSPORT CONNECTIONS ASSESSMENT
CHAPTER 4 – NAVIGATION AND DREDGING IMPROVEMENTS
CHAPTER 5 – ALTERNATE DEVELOPMENT CONCEPT COST ANALYSIS
CHAPTER 6 – PLANNED VS. ALTERNATE CONCEPT COST COMPARISON
CHAPTER 7 – WORK PLAN AND SCHEDULE EVALUATION
FINAL PRESENTATION TO The Authority

FINAL Report – Chapter 1
1 | P a g e
CHAPTER 1
DATA COLLECTION AND REVIEW
This chapter summarizes our review of data provided by the North Carolina State Ports Authority (The Authority) and their consultants CH2MHill and Moffatt & Nichol in regards to the development of the former Pfizer property in Brunswick County, NC. Access to the files was via two ftp sites, one for the Authority documentation and the other for the consultants’ data.
Documents Provided and Reviewed: The following is a list of the provided data and a brief description of the contents.
Moffatt & Nichol Analysis Report, dated 11-17-2005: The first part of the data is the analysis and justification of the Pfizer property for utilization as a port facility. The second part of the data is the trends and assumptions used in determining the required/suggested port development criteria. The final part is the concept plan of the new port development. Among the data within this document is the assumption for the rail/truck split with a range of 25-80% among east coast ports.
CH2MHILL Technical Memos – dated 02-11-2008: Technical memorandums from CH2MHILL to the Authority outlining the requirements and proposed developments for the Civil Site Design, Dredging, Cost Estimating, Railroad, roadway, security, terminal development, utility connections, and wharf development. The technical memorandums are summaries and the overall studies are not included.
DRAFT NCIT Pro Forma Business Plan CH2MHILL Phase 2A – dated 03-15-2008:
First Pro-Forma plan that deals more deeply with the economic figures and rationale behind the port development, cargo forecasting, development scenarios, and market predictions. The forecasting data includes the truck/rail throughput assumption of an eventual 50% split in cargo. The current competitive ports of Savannah and Charleston currently operate at 20% or less cargo by rail. The assumption is made that with the growing trend in gas prices, recession, and improvements to be made by the rail companies, a 50% split will be desired.
NCIT Planning Assumptions v3 – dated 03-26-2008: Planning assumptions made by CH2MHIILL for the development of the Terminal. The data is summarized in outline form listing the assumptions and planning parameters made during the development of the terminal.
NCIT Estimate of Preliminary Costs Spreadsheet – dated 07-01-2008: Detailed construction cost estimate and planning/costing assumptions.
CH2MHILL Phase 2B Infrastructure Report – dated 09-18-2008: Report derived from the Planning Assumptions, economic models, technical memos, and previous comments to the Phase 2A report.
Report Appendices – dated 09-18-2008: Phase 2B appendices.

FINAL Report – Chapter 1
2 | P a g e
2008-09-18 NCIT Infrastructure Report – dated 09-18-2008:
Detailed report on the terminal development. Information provided in this report is the same as previous reports and assumptions with more detailed figures and concept plans.
Appendix C NCIT Drawings – dated 09-19-2008:
Drawings for the Infrastructure Report.
Initial Observations Cargo Forecasting: Economic and/or cargo forecast studies supporting the development program and throughput volumes were not included in the data. Terminal Development: The terminal development was divided among three phases based on the cargo forecasting (TEU throughput), and further divided into two to three sections per phase. The phases and cargo volumes are as follows:
Phase One: Development of Berths 1 & 2 Turning Basin and berth dredging Approach Channel to accommodate Ultra Post Panamax Vessels. 415,000 TEU – 1,135,000 TEU Phase Two: Development of Berth 3 1,445,000 TEU – 2,165,000 TEU Phase Three: Development of Berth 4 2,475,000 TEU – 3,000,000 TEU
There is no detailed description of the required equipment and operating model for each phase of development. The breakdown of the planned improvements can only be derived from the figures and cost estimate. There is data on the recommended cargo handling and offloading procedures and interaction between the gate, rail yard, and cargo, but there is not a description for the method or decision making behind the recommended option. The cargo forecasting is on the incoming cargo with little to no mention of outgoing cargo and how it is processed Terminal Gate: The terminal gate (as derived from the figures) is developed as throughput grows. Details and assumptions for the gate complex are not included in the information provided. Rail Yard: The rail yard development is based on volume and standard loading rates. A detailed explanation of the cargo handling and rail yard management regarding queuing and staging is not provided within the data. As depicted in the figures, the rail yard is developed as the cargo throughput grows. In the ultimate build out conditions, the yard is divided to on dock rail (active loading of the tracks) and the staging area (where the organization of the loaded cars takes place.) In the early phases, the staging area is also utilized for the on-dock rail (active loading area). The size of the yard is based on the factors of lifts per hour, size of trains, and volume of cargo per phase. The specific phase breakdown of each rail yard development is not given. Access Roadway: Terminal roadway access and improvements of existing roadways was not included in

FINAL Report – Chapter 1
3 | P a g e
the provided data and therefore not part of the review. Rail Access: The data did not include information regarding the existing rail lines to be utilized in the terminal development and therefore were not part of the review. Offsite Utilities: The utility technical memorandum refers to conversations with the local utilities and the reference to adequate capacity within the existing infrastructure. The base map (figure) shows that the water and sewer connections are not located adjacent to the terminal. The data did not include original studies or conversation records for verification of the information. Geotechnical Studies: The data did not include a report of geotechnical investigations for the project. Navigation Improvement and Dredging: There are three main parts to the dredging program, the main channel, the turning basin, and berth dredging. The dredging is planned for a 52.5-ft depth with 2-ft over dredge to handle the Ultra Post Panamax vessel. The vessel is not expected to call on the port fully loaded. The main channel alignment needs to be improved in order to accommodate the design vessel; several options are under consideration, but a final option has not been chosen. The PPP is intended to apply only to the terminal development and does not include the work to be performed by the US Army Corps in regards to the channel straightening and turning basin. Top of the Line Options: Current development plan provides the latest technology and top of the line equipment. The following is a list of the options provided. Security: Motion sensors along the perimeter fence (Perimeter Intrusion Detection & Assessment
System (PIDS) Card readers at every access point along with guard shacks High powered dockside cameras Mooring: State of the Art Vacuum Mooring System Yard: The container yard is operated with RMG and automated shuttle carts for transport of
containers between the ship and the yard. Interviews: The following interviews held during review of the data:
07-14-2009 – Stephanie Ayers: Telephone call to discuss preliminary questions regarding data collection and clarification of the data provided. The conversation was to request detailed data on the terminal gate complex, economic dredging responsibilities, and the most recent Pro-Forma plan. 07-17-2009 – Stephanie Ayers: Telephone call to discuss receipt of the economic forecasting and background data.
Additional Data Requirements: From results of the reviews under Task 1, we are developing a list of additional data that will be needed to continue with subsequent phases of the study.

FINAL Report – Chapter 2
1 | P a g e
CHAPTER 2
DATA ANALYSIS AND ALTERNATE DEVELOPMENT CONCEPT
This chapter summarizes our analysis of data provided by the North Carolina State Ports Authority (The Authority) and their consultants CH2MHill and Moffatt & Nichol (the Planning Team) under Task 1. This task was to evaluate and “repackage” the currently proposed terminal plan and development concept for the NCIT to be more financially feasible and interesting to the private infrastructure investment groups. The output of this task is a TEC developed alternative development plan based on: 1) providing operational flexibility that produces; 2) a more commercially attractive capital investment plan and; 3) realistic phasing to meet market demand.
Our evaluation of the current terminal plan indicates that it was driven by a market analysis, operating philosophy and a marketing strategy. The market analysis and justification appears well researched with top-down and bottom-up approaches, although some of the assumptions and the conclusions on volume forecast appear optimistic for this location, given nearby competitor ports and a green field terminal. The market analysis concluded that, in order to be successful, NCIT had to offer as a business strategy (distribution center/transload delivery model), a ‘state of the art’ terminal with high level of automation (equates to high density and productivity), along with strong intermodal rail capability and draft for 12,000+ TEU vessels to attract users away from larger and more established ports such as Savannah, Charleston and Norfolk. These conclusions led to development planning concepts that provide on-terminal rail capability; high technology cranes and automation investment to increase container yard (CY) density (10,000 to 11,000 TEU/acre/year) and provide high throughput and velocity; significantly reduce labor costs when compared with more traditional designs; and berth capacity for very large vessels drawing 50 feet or more. The target CY density is virtually twice that generally realized by the best U.S. terminals today, and while it appears operationally optimistic, it is technically possible. The planning concept relies on significant rail transport to maintain a high velocity of containers through the terminal, which appears quite a challenging assumption given the current state of rail connections between this location and major rail hubs in, say, Charlotte NC for example. To facilitate our understanding of the current plan, TEC met with John Corley of CH2M HILL, during which time additional context and planning background information affecting its development was discussed along with our questions. Overall, the current planning concept seems well aligned with the conclusions of the market analysis and resulting planning assumptions. Additionally, the technical concepts and components for the terminal layout appear to be properly conceived and well integrated with the market and planning drivers, albeit with some ambiguities in the details. From the information we reviewed and questions posed, it does not appear that any other terminal siting footprints were considered during the planning process, and terminal planning was confined to within the property boundaries. This point seemed be worthy of further investigation, and we explored alternative footprints under Task 2, as will be discussed later.

FINAL Report – Chapter 2
2 | P a g e
Basic Facility Marketing Strategy Assumptions by the Planning Team are summarized as: Deepwater access and berthing facilities; -52.5 feet depth available
High rail volume throughput with on-terminal rail capability
Available “good” highway access
High productivity facility – employing automated RMG cranes
State of the art facility
Cost competitive with ports in range (Jacksonville to Norfolk)
Distribution Center/Transload delivery model with near-port logistics support facilities
Sustainability Basic Facility Development Assumptions by the Planning Team include: A high-density, automated container terminal
Capacity of 3.0 million TEUs per year at build-out
Accommodate vessels up to 12,000 TEU capacity
Initiate operation and generate revenue at earliest possible date
Terminal operations begin before completion of all construction activities
Financing method – PPP with concession agreement
Supporting access infrastructure (road, rail, navigation channel) funded by other than PPP
Significant intermodal rail utilization for inland moves; 50% of annual TEU volume at build-out While significant development challenges are noted for the off-site components of the Plan, specifically navigation, rail and roadway access, Task 2 is focused on the terminal proper, essentially ‘inside the fence’. Our review of the documents revealed the following most notable facility and infrastructure areas that appeared to require further clarification or examination to determine if cost saving alternatives can be identified. 1. Site earthwork costs are significant 2. Dredging costs are significant and current documents do not clearly establish whether costs for the
proposed Branch Channel leading to the site and the related turning basin are to be assigned to the project, or will be funded by others.
3. Equipment costs are significant. 4. Wharf cost is significant 5. The documents discuss several competing equipment strategies (Translifters, Shuttles/straddle carriers,
and Cassettes) for moving containers between the quay cranes and container stacks, and between container stacks and intermodal yard, but do not identify the selected option.
6. Number of gate lanes required at build-out (Phase 3) varies between the different documents, from 22 to 30. Neither figure seems to align well with the required gate moves and service times assumed.
7. Total length of rail trackage to be constructed by phase does not seem to be consistent between different documents and it is unclear what portion is associated with the PPP project vs. funded by other sources.

FINAL Report – Chapter 2
3 | P a g e
Similar to the facilities-related issues listed above, several business and marketing assumptions raise concerns which, we believe, merit additional examination and/or validation:
1. Market analysis with regard to NCIT potential share capture of regional container volume.
2. Assumption of 50% rail moves by build-out approximately 2035.
3. Business case for near-terminal Distribution Center/Transload model for this site and service hinterland.
4. Impact of Jasper Ocean Terminal in SC, does not appear to have been considered in the analysis. The project is well into the planning phase and is projected to open in 2019 to 2021, with build-out contemplated at 7 million TEU capacity around 2050.
5. With regard to ILA labor agreements, the relative level of labor savings that could likely be realized with the automated container yard.
We reviewed the comprehensive cost estimate, revision date of June 27, 2008, to identify and understand highest cost component areas for further evaluation. Site earthwork, dredging, wharf and equipment components appear to offer the most potential for significant cost savings. With regard to the first two of these items, we developed 6 alternative locations for the terminal to determine if relocating the footprint could offer better value over the current plan. Alternate 6 was developed from our group meeting discussions in Annapolis on August 25th. For each of these concepts, we calculated a rough-order of magnitude quantity for site fill material, and for dredging of berthing and access fairway areas to compare with the current plan. The cost tabulation and comparison for site earthwork and dredging indicates that five of the Alternates compare favorably with the current Plan and merit consideration. Alternate 6 appears to be the most promising option from technical, operational and environmental perspectives. And, with the additional land created on the waterside, this alternate provides additional landside area for future development. Our findings at this point in the Study are as follows: 1. Since market assumptions, analysis, conclusions and forecasts are driving the planning concepts,
operating strategies, and thus capital investment requirements, these need to be further vetted and discussed in order to confirm and validate the direction and parameters going forward.
2. The current terminal plan aligns well with the market analysis and assumptions (Item 1 above), and with reasonably flexible phasing for expansion to meet the 3 million TEU throughput as cargo volume warrants.
3. Several areas for potential improvement in development costs exist and merit further technical investigation and consideration.
4 If the terminal footprint can be relocated, there are several alternative locations that appear feasible and at least one of those (Alternate 6) appears superior to the current plan. Additional engineering and evaluation will be needed to refine the selected concept(s) and develop more accurate cost estimate(s).
5. Confirming a second user for the proposed access channel to serve this terminal is expected to allow the cost for that channel and the associated turning basin to be eligible for federal cost share funding, which in turn removes that cost from the terminal cost assigned to the PPP.

FINAL Report – Chapter 3
1 | P a g e
CHAPTER 3
LAND TRANSPORT CONNECTIONS ASSESSMENT
This Chapter summarizes our review of data provided by the North Carolina State Ports Authority (the Authority) and their consultants CH2MHill and Moffatt & Nichol in regards to the development of the former Pfizer property in Brunswick County.
This task was to perform a cursory review of the proposed road and railroad connections, confirm the basic details, check the assumptions made during the preliminary planning process, and review the ICTF. In addition to the cursory review, TEC’s transportation model was utilized to generate the truck and rail traffic generated from the port. The output of this task is this report presenting our assessment and observations for development of the land transport connections and recommended modifications to the current program.
OVERVIEW:
The planning analysis of the original Business Plan (the Plan) was a multi-phased development with a projected annual volume of 3 million TEU’s at ultimate build-out, year 2035, with a 50/50 modal split of road and railroad traffic.
The Plan assessed the connectivity of the roadways and railroads for their ability to accommodate the projected volume of traffic. The Plan’s roadway access analysis was divided into two sections, access from the terminal to Route 87 (the Exit Corridor) and access from Route 87 to Route 17. Section one investigated three paths from the terminal to Route 87 and section two investigated 4 paths to Route 17 with a level of service (LOS) of C used as the minimum acceptable level. The Plan does not indicate that any analysis was performed beyond the Route 17 intersection. Alternative roadway access to either of these two interstates, through either a new roadway system, upgrades to existing roadways, or a combination of the two should be investigated further.
With the new roadway alternative, consideration should be given to the option of increasing the right of way width to include railroad lines. The addition of new rail lines will provide a broader variety of rail line access and connection choices.
The railroad access and capacity was based on the corridor’s ability to handle 50% of the projected 3-million TEU throughput of the terminal at build-out. The Plan analyzed the existing rail lines and facilities, required upgrades, possible alternatives, and conceptual requirements. Railroad access to the terminal would be via CSX rail lines that run between Wilmington and Charlotte, North Carolina. From the CSX lines, access is provided via the 17-mile USA rail line operated by the US Army and serving the Military Ocean Terminal Sunny Point (MOTSU) and then through the neighboring industries’ 5.5-miles of private rail sidings owned by Progress Energy, Primary Energy, and Archer Daniels Midland Company (ADM).
The Plan’s basic road and railroad development assumptions include:
Capacity of 3.0-million TEU’s per year at build-out
Three main phases of development : o Phase One: 425,000 TEU at startup and 1.135 million TEU at year 7.

FINAL Report – Chapter 3
2 | P a g e
o Phase Two: 1.445 million TEU at year 9 and 2.175 million TEU at year 13. o Phase Three: 2.475 million at year 15 and 3-million TEU at year 16.
50% road and 50% railroad modal split
Four lane typical roadway section serving the terminal
9,000 to 10,000 foot long train
10 daily trains The Plan’s thorough analysis for the projected throughput and base assumptions appear to be valid based calculations, modeling studies, and port industry knowledge. For planning purposes, we rounded the throughput volumes to million TEU increments as shown below:
Phase One: 1-million TEU at startup
Phase Two: 2-million TEU
Phase Three: 3-million TEU
The creation of a new terminal, located at some distance from established transportation networks, affects the assumptions and calculations. A conservative analysis of the Plan’s assumptions was performed by TEC with the suggested development assumptions:
Road/railroad modal split for competitive container ports was researched for comparison. Modal splits for Savannah’s Garden City Terminal are published as 86% Truck/11% Rail, and the Virginia Port Authority is shown as 64% truck/31% rail.
We believe that the most probable modal split for this terminal at/near build-out will be in the range of 70% truck/30% rail, rather than the 50%/50% split used in the current plan.
Our alternate concept is based on the following:
Phase One: 90% truck / 10% rail (this considers that significant rail traffic may not develop during the early years of this terminal, but facilities must be in place in order to attract potential rail users.)
Phase Two: 75% truck / 25% rail
Phase Three: 70% truck / 30% rail
The terminal will have the ability to serve 10,000-foot long trains.

FINAL Report – Chapter 3
3 | P a g e
ROADWAYS: The Plan calls for an improved and multi-lane roadway access path to the terminal. As mentioned above, the access path investigated for the Plan included two sections, an access roadway from the terminal to Route 87 and access from Route 87 to Route 17. A traffic analysis of the conceptual roadway access paths was conducted using the anticipated volume, existing roadway capacity, the possible access routes, and required improvements to obtain the required capacity. In addition to the 3-million TEU volume, a 4-million TEU volume was incorporated into the Plan’s analysis.
In the Plan, the following three alternatives from the Terminal to Route 87, referred to as Exit Corridors, were assessed:
Corridor One utilized Route 1528, which traverses through the City of Southport to Route 87.
Corridor Two follows Route 1528 to Route 1527, and follows Route 1527 past the Congentrix Energy Plant. Shortly after the Congentrix Energy entrance drive, the corridor heads northeast as a newly constructed roadway. Corridor Two has an optional path to divert around an existing residential dwelling and connects to Route 87.
Corridor Three is a greenfield development of a new roadway that parallels the railroad access siding adjacent to the Progress Energy power plant and connects with Route 87.
For the access corridors, the Plan concluded that to obtain a LOS of C, the road should be a 4-lane roadway with either a physical median or two-way left turn lane, with limited access. For the three corridors, the existing roadways were to be upgraded and the proposed roads constructed according to the template. The Plan suggested Corridor Two as the preferred access route based on cost and the capacity analysis, and we agree with this conclusion. The access exit corridors are shown on the CH2MHill drawings, Appendix C, Drawing T-1.
The Plan performed separate studies for the access corridors from the end of the exit corridors mentioned above, to an access point with U.S. Route 17. The following four alternatives were assessed:
Corridor One follows Route 87 from the Exit Corridors north to Route 17, approximately 20-miles. Route 87 would be upgraded to the four-lane section described earlier.
Corridor Two follows Route 87 south to Route 211, and then follows Route 211 to Route 17, approximately 16-miles. Route 211 would be upgraded to an eight-lane roadway to accommodate the increased traffic volume.
Corridor Three follows Route 87 north to Route 133, and then follows Route 133 to Route 74 near Wilmington, approximately 23-miles. Route 133 would be upgraded to an eight-lane roadway to accommodate the increased traffic volume and includes an existing at-grade crossing of the proposed railroad access.
Corridor Four is a greenfield development of proposed road which intersects Route 87 near the intersection with Route 133 and connects to Route 17, approximately 15-miles. The proposed roadway would be constructed as a four-lane roadway section as described earlier.
For Corridors Two and Three, the Plan did not define the factors and reasoning for upgrades of the roadway section beyond the four-lane options for Corridors One and Four. According to the Plan, based on cost and

FINAL Report – Chapter 3
4 | P a g e
the results of the capacity analysis, the proposed conceptual alignment of Corridor Four was the preferred access route. This corridor appears to offer the least amount of right-of-way acquisition and impact to established residential/commercial properties, and we agree with this conclusion. The access corridors are shown on the Plan, Appendix C, Drawing T-2.
The Plan’s proposed road way cross sections were based on a daily traffic volume of 4407 trucks per day for the ultimate build out scenario of 3-million TEU throughput. As was noted earlier, TEC evaluation does not support the Plan’s road/rail modal split, and our analysis required consequent adjustments to the expected traffic volumes. The adjusted traffic volumes were computed from TEC’s transportation model and results are presented in Table 1:
Table 1
Output: Port Generated Traffic Phase 1 Phase 2 Phase 3 Average Weekday Traffic (Total) 4,095 6,196 8,544
Average Weekday Auto 1,647 2,524 3,404 Average Daily Truck 2,448 3,672 5,140
Daily Number of Train Movements 1 3 6 Total Peak Hour Directional Traffic: (15% of AWDT) 247 379 511 Peak Hourly Truck Traffic 297 445 622 Passenger Car Equivalent Conversion 1.5 1.5 1.5 Total Peak Hour Truck Volume (as passenger car equivalents) 446 668 933 Total Roadway Traffic (as passenger car equivalents) 693 1,047 1,444
The AASHTO Highway Capacity Manual (HCM) lists rural divided highways, with a LOS of C, to have the following capacities (passenger cars per hour per lane – pcphpl):
45 mph design speed: 1260 pcphpl / 2520 pcph for the roadway section
60 mph design speed: 1650 pcphpl/ 3300 pcph for the roadway section
A 4-lane divided highway section, as proposed for the preferred corridor in the Plan, can accommodate the revised traffic peak hour volumes. For the Phased development and projected traffic, the proposed four-lane highway section will have the minimum LOS ratings shown in Table 2:
Table 2
45 MPH 60 MPH Phase 1 LOS A LOS A Phase 2 LOS A LOS A Phase 3 LOS B LOS A
U.S. Route 17 is a north-south United States Highway spanning the southeastern United States. The highway’s southern terminus is in Punta Gorda, Florida and northern terminus is in Winchester Virginia. In the vicinity of the terminal, Route 17 is mainly a four lane divided highway with a grass median from Myrtle Beach, South Carolina to Wilmington, North Carolina.
FINAL Report – Chapter 3
5 | P a g e
The CH2MHill Technical Memo, performed prior to the Plan, suggested several future studies prior to the final determination of a roadway access corridor. The Technical Memo’s recommended studies were:
A detailed wetland survey
A preliminary conceptual design (to further define an appropriate corridor and alignment)
Individual property ROW appraisals
Detailed and site-specific intersection and traffic volumes of the immediate area,
The Plan’s roadway and access analysis terminates at the intersection with Route 17 with a proposed flyover interchange for left turn movements. Since the inbound and outbound cargo will be destined not only to North Carolina, but also to other states, a more direct access to an interstate roadway is suggested. The closest Interstate Roadways are the I-140/I-40 interchange north of Wilmington NC, (33-miles via existing roads) and I-95 (93-miles via existing roads). The analysis of the roadway access and traffic volume impact on the existing roadways should, in our opinion, be expanded to consider the projected corridors all the way to connection with the Interstate system, specifically the access corridor to NC Route 74, which provides the most direct route to I-95(I-95) to the west, I-40 to the north of Wilmington. Once the traffic reaches Route 17, there is no direct route to I-95, forcing the trucks to find an alternative way to I-95, which could cause smaller, more rural roads to be utilized. In particular, Route 211, one of the suggested access paths, continues past Route 17 to Route 74, and could be utilized by the terminal traffic to gain more direct access to I-95, a 25-mile path. An alternative option, would be for the traffic to head north on Route 17 towards Wilmington, and then west on Route 74, a 48-mile path. For reference, the North Carolina Highway Map is shown in Figure 1.
In addition to the future studies identified by the Technical Memo, alternative studies recommended to further the analysis of the most cost efficient and best-case access route for the terminal include:
Environmental assessment (EA) of proposed use and improvements for the access corridor alternatives. The EA will assist in socio-economic factors and the effects on the residential areas to help identify the best alternative access corridors. It is anticipated that at a minimum, an EA will be required for governmental approval of the access corridor.
Traffic volumes of existing roadways to be incorporated into the access routes to identify additional improvements to the local roads affected by the access corridor selection.
The terminal gate operations will need additional investigation and detail. The gate operations are critical to the operation of the terminal, and with the adjusted phase volumes and modal splits, the gate development will be a critical part of the terminal development. The TEC transportation model included a preliminary gate analysis based on the adjusted volumes and phases. The conceptual gate analysis results are shown in Table 3, and indicate that 24 gate lanes will be required at final build-out.

FINAL Report – Chapter 3
6 | P a g e
Table 3 Gate Operations
Year Phase 1 Phase 2 Phase 3 Boxes per year 526,316 789,474 1,105,263
Days per year of Gate operation 286 286 286 Boxes per Day 1841 2761 3865 Boxes per hour 184 276 386
Hourly peaking factor 1.5 1.5 1.5 Boxes per Peak Hour 276 414 579
Avg. Transaction Time 2.2 2.2 2.2 Avg. Lane Transactions per hour 27.27 27.27 27.27
Number of Gate Lanes 11 17 24 Number of Bypass lanes 2 2 2
Total Gate Lanes 12 17 23
The Plan’s gate analysis projected the final build-out for 20 total gate lanes. The associated cost estimate for the Plan was based on square footage of the gate and there was no discernable breakdown for a cost per gate lane. Our three additional gate lanes will cost approximately $1.5 to $2.0-million dollars.
RAILROAD:
The railroad access to the terminal could be via the existing CSX main rail line between Wilmington and Charlotte. From the CSX line, access would be across property and track owned by multiple owners. Outside of Wilmington, the CSX line ends in vicinity of its Davis Yard, which connects the main line to the industrial sidings that could provide the access to the terminal. A 4.5-mile track connects the CSX Davis Yard to the USA Rail Leland Yard, owned and operated by the United States Army (Army). The Army operates a 17-mile track which services the Military Ocean Terminal, Sunny Point (MOTSU) and other industries near the proposed development site. The Army provides service to the industrial sidings of Progress Energy, Primary Energy, and Archer Daniels Midland Company (ADM) located south of MOTSU. The existing rail alignments currently stop short of the proposed development site. Rail infrastructure will need to be constructed from the current line to reach the Terminal boundary and rail yard. The railroad access is shown on the Plan’s drawings, Appendix C, Drawing T-3. An alternative option is to provide additional right of way with the proposed road improvements to accommodate rail sidings. Rail lines to the west would provide more direct access to the major north-south rail corridors closer to the I-95 corridor. The Plan’s suggested upgrades to the alignment and rail infrastructure of the existing sidings, USA Leland Yard, and CSX Davis Yard were based on the 50/50 modal split and 9,000 to 10,000 foot long trains. The amount of rail upgrades that will be required needs to be investigated in detail, preferably with the planned rail operator, to determine the necessary upgrades to the rail lines and sidings. The upgrades to the yards are shown on the CH2MHill drawings, Appendix C, Drawing T-4. We take no particular issues with the general assumptions of the Plan concerning the rail access and improvements based on the modal split and train lengths used. However, when compared to the competitive container ports of Savannah’s Garden City Terminal (11% Rail) and the Port of Norfolk (31% rail), and in conversation with Paul F. Richardson, the following modal splits are considered more realistic for NCIT and used in the development of the terminal and traffic volumes for TEC’s alternate concept:

FINAL Report – Chapter 3
7 | P a g e
Phase One: 90% truck / 10% rail Phase Two: 75% truck / 25% rail Phase Three: 70% truck / 30% rail
The revised modal splits recognize that, while there will likely be no rail traffic at the start up of the terminal, it will be heavily marketed and could grow to be 10% of the Phase One projected volume. From the Brunswick County GIS online maps, it appears that the USA Rail rights of way are 175-feet wide with a single track in the center. The right of way appears sufficient for the construction of additional sidings and turnouts to accommodate the additional traffic and resolution of potential conflicts. To obtain further information and statistics on the railroad traffic, the following studies and investigations are recommended:
A detailed study of the rights of way, track alignments, and future sidings, based on the agreed. Detailed investigations on the existing railroad line conditions, existing rail traffic, and potential
operating conflicts. Meetings with the private owners of the existing rail lines to inform them of the potential project
and obtain cooperation. The Infrastructure Report included in the Plan presented viable options for improvements to the Leland Yard, with which we concur. The improvements would assist in the movement of cargo from the terminal that would not interfere with the CSX Davis Yard and would reduce inefficient movements created by the Leland Yard switchbacks. The Infrastructure Report also recommended the development of an offsite support yard, located just outside of the terminal limits, ”to operate as a buffer between on-terminal rail-loading and unloading activities and the arrival and departure of mainline trains.“ We agree that the offsite support yard is an important part of the terminal development. The alternate concept’s revised modal split and onsite intermodal yard configuration may affect the offsite support yard capacity requirements and should be investigated further.
In addition to adjusted truck and traffic movements through the terminal gate, the TEC transportation model also adjusted the projected train volume through the facility. The TEC projected amount of annual train cargo and daily train traffic is shown in Table 4:
Table 4 – Projected Railroad Movements
Number of Boxes Moved By: Phase 1 Phase 2 Phase 3 Truck 526,316 789,474 1,105,263 Rail 105,263 263,158 473,684 Transshipped 0 0 0 Daily Number of Train Movements 1 3 6
The adjusted train movements and cargo throughput, affects the Plan’s projected train movements of 10-15 per day at final build-out. The onsite intermodal yard consists of two main areas, the working tracks and the storage tracks. We proposed a working track to be a 2500-foot section and operated by rubber tire gantry cranes (RTG). The storage track should be capable of storing one design length train (10,000-feet) in order to accommodate the arrival of a train while the working tracks are being utilized. In addition, the adjusted terminal layout removes the Plan’s bend in working tracks and utilizes straight-line working track sections. The statistics of the phased intermodal rail yard is:

FINAL Report – Chapter 3
8 | P a g e
Phase One: 4 working track sections (10,000-feet total) & 10,000 feet storage track
Phase Two: 8 working track sections (20,000-feet total) & 10,000 feet storage track
Phase Three: 12 working track sections (30,000 feet total) & 10,000 feet storage track
The Plan’s proposed onsite intermodal yard at build-out consisted of 10 working track sections of 3,660-feet long per section, for a total of 36,600-feet of working tracks. The 6,600 feet less working tracks as proposed in the TEC plan, is a saving of $1,650,000.
The adjusted onsite intermodal rail yard is approximately 70% of the Plan’s proposed rail yard, a potential savings of 30% or $8.07 million in initial cost. The offsite support yard can also be similarly scaled back to accommodate the lower projected volume of trains and rail traffic. The Plan projects 5 arrival/departure tracks and 79,000 lf of track to support 10-15 trains per day. TEC’s adjusted volume of 5 trains per day at final build-out is 33% the size and requirement of the Plan’s off-site support yard. Phase One cost estimates, prepared by CH2MHill, projected costs for the off-site support yard at $20.9-million, so the alternate concept could offer a potential savings of $14-million.
Along with the previously recommended investigations, the following studies and alternatives are suggested:
Short Line Railroad: A short line railroad will assist the Port in the day-to-day operations of cargo movement and interactions with CSX on scheduling, track maintenance, and availability of cargo to increase the train movements if needed.
Connection to a Norfolk Southern rail service. The competitive container ports of Charleston, Norfolk, and Savannah all currently operate with dual rail services creating a more competitive situation. This objective could well be facilitated with development of a short line railroad.
Engage with the area’s current rail track owners (CSX, Army, Progressive Energy, ADM) with regard to the Plan and concepts for rail access to NCIT.
The North Carolina Railroad Map is attached for reference to locations of existing rail services. The creation of a short line railroad may also assist in the negotiations with the second rail service.
SUMMARY:
Our assessment for development of the land transport connections recommended modifications to the current program, which are summarized below.
OVERVIEW:
Three Phase Development Plan
o Phase One: 1-million TEU: Track/Rail modal split of 90/10
o Phase Two: 2-milion TEU: Track/Rail modal split of 75/25
o Phase Three: 3-million TEU: Track/Rail modal split of 70/30

FINAL Report – Chapter 3
9 | P a g e
ROADWAYS:
CH2MHill’s preferred access corridors are reasonable.
Four-lane roadway section is sufficient for all phases of development. Depending on the design speed (45mph/60mph), the LOS ranges from A in Phase One to B in Phase Three.
Environmental Assessment (EA) should be anticipated as part of the roadway access approval process.
Larger gate complex. The gate lanes per phase (Phase 1: 12 lanes, Phase 2: 17 lanes, and Phase 3: 23 lanes) correspond to the projected truck traffic due to the revised modal split.
RAILWAYS:
10,000-foot long trains
CH2MHill’s proposed modifications to the Leland Yard are reasonable.
More in-depth conversation with the Army and other owners/users of the industrial siding for track usage rights.
Creation of a short line railroad for cargo handling and communication with CSX.
In-depth review of the existing railroad access trackage and sidings and identify needed improvements.
POTENTIAL COST SAVINGS:
Onsite intermodal yard working tracks: $1,165,000
Onsite intermodal yard: $8,070,000
Offsite support yard: $14,000,000
Additional Gate Lanes -$2,000,000
Total Potential Savings: $21, 235,000
ATTACHMENTS:
TEC Transportation Model
Figure 1: North Carolina State Roadway Map
Figure 2: North Carolina State Railway Map

TEC TRANSPORTATION MODELNORTH CAROLINA INTERNATIONAL TERMINAL
CONTAINER TERMINAL TRAFFIC MODEL
Summary Sheet (Rail Split)Year Phase 1 Phase 2 Phase 3Container Capacity (TEUs per Yr.) 1,000,000 2,000,000 3,000,000Percent 40-foot 90% 90% 90%TEU per lift 1.90 1.90 1.90
Annual Boxes 526,316 1,052,632 1,578,947
Modal SplitsTruck 100% 75% 70%Rail 20% 25% 30%Transshipment 0% 0% 0%
Number of Boxes Moved By:Truck 526,316 789,474 1,105,263Rail 105,263 263,158 473,684Transshipped 0 0 0
TOTAL TERMINAL STAFF 659 1,009 1,361TOTAL YARD / EQUIPMENT WORKERS 552 824 1,096TOTAL SHIFT YARD / EQUIPMENT WORKERS 276 412 548TOTAL ADMINISTRATION STAFF 107 185 265TOTAL SHIFT VOLUME 383 597 813
Page 1 of 3

TEC TRANSPORTATION MODELNORTH CAROLINA INTERNATIONAL TERMINAL
CONTAINER TERMINAL TRAFFIC MODEL
Data SheetPhase 1 Phase 2 Phase 3
Truck Traffic:Number of Boxes by Truck 526,316 789,474 1,105,263Days per Year of Operations 286 286 286Percentage of Two Way Trucks 67% 67% 67%Percent of Empty Trucks 0% 0% 0%Peak Week Factor 1.1 1.1 1.1Peak Day Factor 1.1 1.1 1.1Peak Hour Factor 1.5 1.5 1.5Annual Truck Trips 700,000 1,050,000 1,470,000Average Daily Truck Trips 2,448 3,672 5,140 Peak Daily Truck Trips 2,962 4,443 6,220Gate Hours of Operation 10 10 10Peak Hourly Traffic 297 445 622Rail TrafficNumber of Boxes by Rail 105,263 263,158 473,684Percent Export 50% 50% 50%Percent Import 50% 50% 50%Export Boxes 52,632 131,579 236,842Import Boxes 52,632 131,579 236,842Length of Intermodal Rail Unit (5 platforms) 305 305 305TEU's Per Intermodal Rail Unit 20 20 20Boxes per Rail Unit(305 ft.) 10.5 10.5 10.5Length of Train (in feet) 8000 8000 8000Number of Units per Train 26 26 26Number of Boxes per Train 273 273 273Inbound Trains (Exports) 192 481 867Outbound Trains (Imports) 192 481 867Additional Equipment Trains 0 0 0Total Annual Trains 384 962 1734Days per Year of Operations 286 286 286Average Daily Train Trips 1.4 3.4 6.1Auto TrafficTotal number of On- Port Employees 659 1009 1361Auto Trips per Employee per day 2.5 2.5 2.5Average Weekday Traffic (AWDT) 1647 2524 3404Total Peak Hour Directional Traffic: (15% of AWDT) 247 379 511Output: Port Generated Traffic
Average Weekday Traffic (Total) 4,095 6,196 8,544Average Weekday Auto 1,647 2,524 3,404Peak Day Auto (15%) 247 379 511Average Daily Truck 2,448 3,672 5,140Percent Trucks 59.8% 59.3% 60.2% Peak Daily Truck Trips 2,962 4,443 6,220Peak Hourly Truck Traffic 297 445 622Passenger Car Equivalents (Trucks) 1.5 1.5 1.5Total Truck Trips (peak hour) 446 668 933Total Roadway Traffic (Peak hour) 693 1,046 1,444Daily Number of Train Movements 3 3 3
Page 2 of 3

Gate Complex Number of Shifts 2Statistics Total Hrs per Shift 8
Downtime per Shift (lunch, Breaks) 3Hrs of Ops per day 10
Working Days per week 5.5Total annual work days 286
Total Year Operation Hrs. 2860Avg. Transactions/Hr 27.27
Operational Utilization 90%Transaction per Year per Gate Lane 70192
Transaction per Day per Gate Lane 245
Year Phase 1 Phase 2 Phase 3Boxes per year* 526,316 789,474 1,105,263
Days per year of Gate operation 286 286 286Boxes per Day 1841 2761 3865
Boxes per hour 184 276 386Hourly peaking factor 1.5 1.5 1.5Boxes per Peak Hour 276 414 579
Avg. Transaction Time 2.2 2.2 2.2Avg. Lane Transactions per hour 27.27 27.27 27.27
Number of Gate Lanes 10 15 21Number of Bypass lanes 2 2 2
Total Gate Lanes 12 17 23
TEC TRANSPORTATION MODELNORTH CAROLINA INTERNATIONAL TERMINAL
GATE OPERATIONS
*Refer to TEC Container Terminal Traffic Model, summary sheet for daily truck trips.
Page 3 of 3

Aberdeen
Alamance
Alexander Mills
Alliance
Andrews
Angier
Ansonville
Arapahoe
Arlington
Asheboro West
Askewville
Atkinson
Atlantic Beach
Aulander
Aurora
Autryville
Badin
Bailey
Bakersville
Balfour
Banner Elk
Bannertown
Barker Heights
Bath
Battleboro
Bayboro
Beargrass
Belwood
Bethel
Beulaville
Biltmore Forest
Biscoe
Black Creek
Bladenboro
Blowing Rock
Boiling Spring Lakes
Bolivia
Bolton
Boonville
Bostic
Bridgeton
Broadway
Brookford
Brunswick
Bryson City
Buies Creek
Bunn
Burgaw
Burnsville
Calabash
Calypso
Cameron
Candor
Cape Carteret
Carthage
Casar
Cashiers
Castalia
Castle Hayne
Caswell Beach
Catawba
Centerville
Cerro Gordo Chadbourn
Chadwick Acres
China Grove Cotton Mill
Chocowinity
Claremont
Clarkton
Cleveland
Clyde
Coats
Cofield
Colerain
Columbia
Columbus
Como
Conetoe
Conway
Cooleemee
Cornelius
Cove City
Cramerton
Creedmoor
Creswell
Crossnore
Danbury
Dellview
Denton
Dillsboro
Dobson
Dortches
Dover
Drexel
Dublin
Earl
East Arcadia
East Bend
East Laurinburg
East Marion
Eastover
Elk Park
Ellenboro
Ellerbe
Elm City
Emerald Isle
Eureka
Everetts
Fair Bluff
Fairview
Faison
Faith
Falcon
Falkland
Fallston
Flat Rock
Fountain
Four Oaks
Foxfire
Franklinton
Franklinville
Fremont
Garden Creek
Garland
Garysburg
Gaston
Gatesville
Gibson
Glen Alpine
Godwin
Goldsboro Northwest
Goldston
Granite Quarry
Greenevers
Grimesland
Grover
Halifax
Hamilton
Harkers Island
Harmony
Harrells
Harrellsville
Harrisburg
Hassell
Haw River
Hayesville
Haywood
Hazelwood
Henrietta
Hertford
High Shoals
Highlands
Hildebran
Hobgood
Hoffman
Holden Beach
Holly Ridge
Holly Springs
Holly View Forest-Highland
Hollyville
Hookerton
Hot Springs
Huntersville
Indian Beach
Indian Trail
Jackson
Jamesville
Jefferson
Jenkins Heights
Jonesville
Kelford
Kenansville
Kenly
Kill Devil Hills
Kittrell
Knightdale
Kure Beach
Lake Lure
Lake Waccamaw
Lansing
Lasker
LattimoreLaurel Park
Lawndale
Leggett
Lewiston
Liberty
Lilesville
Lillington
Linden
Linville
Littleton
Locust
Long Beach
Love Valley
Lucama
Lumber Bridge
Macclesfield
Macon
Maggie Valley
Magnolia
Manteo
Marshall
Matthews
Maysville
McAdenville
McDonald
McFarlan
McLeansville
Mesic
Micro
Middleburg
Middlesex
Milton
Minnesott Beach
Montreat
Mooresboro
Moravian FallsMorgantown
Morven
Mount Gilead
Mount Pleasant
Mountain Home
Nags Head
Navassa
New London
Newland
Newport
Newton Grove
Norlina
Norman
North Henderson
Norwood
Oak City
Oakboro
Ocean Isle Beach
Old Fort
Oriental
Orrum
Pantego
Parkton
Parmele
Patterson Springs
Peachland
Penelope
Phillipsville
Pikeville
Pilot Mountain
Pine Knoll Shores
Pine Level
Pinebluff
Pinetops
Pineville
Pink Hill
Pisgah Forest
Pittsboro
Pleasant Garden
Pleasant Hill
Polkton
Polkville
Pollocksville
Powellsville
Princeton
Princeville
Proctorville
Ramseur
Ranlo
Raynham
Red Oak
Rennert
Rhodhiss
Rich Square
Richfield
Richlands
Robbins
Robbinsville
Robersonville
Rockwell
Rolesville
Ronda
Roper
Rose Hill
Roseboro
Rosemary
Rosman
Rowland
Roxobel
Rural Hall
Ruth
Rutherford College
Salem
Salemburg
Saluda
Saratoga
Seaboard
Seagrove
Seven Devils
Seven Springs
Severn
Shady Forest
Shallotte
Sharpsburg
Silver City
Simpson
Sims
Snow Hill
South Weldon
Southern Shores
Sparta
Speed
Spencer Mountain
Spring Hope
St. Pauls
Staley
Stallings
Stanfield
Stantonsburg
Star
Statesville West
Stedman
Stem
Stokesdale
Stoneville
Stonewall
Stony Point
Stovall
Summerfield
Sunset Beach
Surf City
Swansboro
Sylva
Tar Heel
Taylorsville
Teachey
Topsail Beach
Trent WoodsTrenton
Troutman
Tryon
Turkey
Vanceboro
Vandemere
Vander
Vass
Virgilina
Waco
Wade
Wagram
Walnut Cove
Walnut Creek
Walstonburg
Wanchese
Warrenton
Washington Park
Watha
Waxhaw
Weaverville
Webster
Weldon
West Jefferson
West Marion
Whispering Pines
Whitakers
White Lake
Williamsboro
Winfall
Winton
Woodland
Woodville
Yanceyville
Yaupon Beach
Youngsville
Ahoskie
Apex
Asheboro South
Ayden
Beaufort
Belhaven
Belmont
Benson
Bessemer City
Black Mountain
Boger City
Boiling Springs
Brogden
Butner
Canton
Carolina Beach
Cherryville
China Grove
Clayton
Conover
Cricket
Dallas
Davidson
East Flat Rock
East Spencer
Elizabethtown
Elkin
Elon College
Elroy
Enfield
Enochville
Erwin
Fairmont
Fairplains
Farmville
Franklin
Fuquay-Varina
GibsonvilleGlen Raven
Gorman
Granite Falls
Grifton
Half Moon
Hamlet
Hickory North
Hillsborough
Hudson
Icard
Jacksonville East
James City
Jamestown
La Grange
Landis
Laurel Hill
Lewisville
Lincolnton
Long View
Louisburg
Lowell
Madison
Maiden
Mar-Mac
Marion
Mars Hill
Marshville
Masonboro
Maxton
Mayodan
Mebane
Mocksville
Morehead City
Mount Holly
Mount Olive
Mulberry
Murfreesboro
Murphy
Myrtle Grove
Nashville
North Concord
North Wilkesboro
Ogden
Parkwood
Pembroke
Pine Valley
Pinehurst
Plymouth
Poplar Tent
Pumpkin Center
Raeford
Randleman
Red Springs
Rosewood
Rutherfordton
Salem
Scotland Neck
Seagate
Selma
Siler City
Silver Lake
South BelmontSouth Gastonia
South Goldsboro
South Henderson
Southport
Spencer
Spindale
Springdale
Spruce Pine
Stanley
Tabor City
Toast
Troy
Valdese
Valley Hill
Wadesboro
Wake Forest
Wallace
Warsaw
Welcome
Wendell
West Rockingham
Wilkesboro
Windemere
Windsor
Wingate
Winter Park
Winterville
Woodfin
Wrightsboro
Wrightsville Beach
Yadkinville
Zebulon
Archdale
Bonnie Doone
Brevard
Carrboro
Clemmons
Clinton
Dunn
East Rockingham
Edenton
Enka
Forest City
Graham
Hendersonville
Hope Mills
Kernersville
King
Kings Grant
Kings Mountain
Mint Hill
Mooresville
Mount Airy
New Hope
New Hope
New River Station
Newton
Oxford
Piney Green-White Oak
Rockingham
Roxboro
Smithfield
Southern Pines Spring Lake
Stanleyville
Swannanoa
TarboroTrinity
Washington
Waynesville
West Concord
Whiteville
Williamston
Burlington
Camp Lejeune
Chapel Hill
Fort Bragg
Gastonia
Goldsboro
Greenville
Kannapolis
Kinston
Rocky Mount
Wilmington
Wilson
Albemarle
Asheboro
Boone
Cary
Concord
Eden
Elizabeth City
Garner
Havelock
Henderson
Hickory
JacksonvilleLaurinburg
Lenoir
Lexington
Lumberton
Monroe
Morganton
New Bern
North Belmont
Reidsville
Roanoke Rapids
Salisbury
Sanford
Shelby
St. StephensStatesville
Thomasville
Durham
GreensboroWinston-Salem
Asheville
Fayetteville
High Point
Charlotte
Raleigh
105
109
109
109
11
11
12
12
12
121
130
133
16
16
16
168
172
177
18
18
18
18
194
209
209
210
211
211
211
211
211
211
218
22
24
24
24
24
24
24
24
24
242
242
251
28
28
304
305
32
32
32
33
33
403
41
41
42
43
43
43
46
49
49
49
49
49
49
50
50
50
51
53
561
561561
58
58
58
58
581
63
704
72
8
87
87
87
87
9
94
94
96
98
1
1
1
117
117
117
117
129
13
13
13
13
13
13
13
15
15
15
15
15
15
158158
158
158
158
158158
158
158
158
158
158
17
17
17
17
17
17
17
17
17
17
176
19
19
19
19
19
19E
19E
19W
21
21
21
21
220
220
221
221
221
221
221
221A
23
23
25
258
258
258
258
258
258
264
264
264
276
276
276
29
29
29
301
301
301
301
301
311
311
321
321
321
321
321
401
401
401
401
401
401
421
421
421
421
421
421
421
421
421
421
441
501
501
501
501
52
52
52
52
601
601
601
601
601
64
64
64 64
64
64
64
64
6464
64
64
64
64
64
64
64
64
64
64
70
70
70
70
70
70
70
70
70
701
701
701
701
701
701
74
74
74
74
74
74
74
74
74
76
BLUE RIDGE PKWY.
BLUE RIDGE PKWY.
BLUE RIDGE PKWY.
BLUE RIDGE PKWY.
BLUE RIDGE PKWY.
26
40
40
40
40
40
40
40
40
77
77
85
85
85
85
95
95
95
MileByMi le .comFree North Carol ina Maps &North Carol ina Road Map Travel Guides
Copyr ight 2005

CAMPLeJEUNE
FORTBRAGG
CAMPBUTNER
GREAT SMOKY MOUNTAINS
NATIONAL PARK
SEYMOURJOHNSON
AFB
STATEPORT
STATEPORT
NHV
NC
DO
T
NS
NS
NS
NS
CSX
NS
NS
NSNS
NS
NS
NS
CWCY
ARC
NS
NS
NS
NS
NS
NS
CSX
CSX
CSX CSX
CSX
CSX
NS
WSS
WSS
WSS
WSS
NS
NS
NSNS
HPTD
NS
CSX
YAN
NS
NSNCDOT
GSMR
GSMR
CSXCSX
ACWR
NC
DO
T
NCDO
TSUR
NS
VSR
R
VSR
R
NS
NS
NS
CSX
CSX
CSX
CSX
CSX
CSX
CSX
NC
VA
NCVA
CSX
NS
NS
CSXNS
CA
CA
NS
NCRR/NS
CLNACLNA
CLNA
CLNA
NS
NS
NCRR/N
S
CPLJ
NCRR/NS
NCRR/NS
NCRR/NS
NCRR/NS
NCRR/NS
NCRR/N
S
CSX
CSX
CSX
CSX
CSX
CSX
CSX
CTR
NCDOT
CSX
CSX
CSX
CSX
CSX
NS
CLNA
NCYR
NCDOT
CSX
NS
NS
YVRR
YVRR
NS
NS
NS
NS
NSHPTD
NSN
SCS
X
CSX
CSX
CSX
CSX
LRS
AR
ACWR
ACWR
CSX
PDRR
CSX
CSX
CSX
RSNR
CSX
CSX
CALA
CALA
CALA
WTRY
CSX
US
CSX
CSX
TBRY
CSX
ATW
CFR
NS
NSN
CDO
T
NS
CSX
NCDOT
NS
MHSF
to Knoxville
to Greenville
to Johnson City
to Augusta
to Petersburgto Petersburg
to Lynchburg
to Roanoke
to Columbia
to Chester
to Columbia
to Florence
to Charleston A t l a n t i c Oc e a n
Albemarle Sound
Pamlico Sound
T E N N E S S E E
G E O R G I A
S O U T H C A R O L I N A
V I R G I N I A
Clio
ShelbyBelmont
Hamlet
FarmvilleMarion
Newton
Carrboro
Glenn Joyland
SouthDurham
GrahamMebane
Hendersonville
Murphy
AndrewsBrevard
Bryson City
Dillsboro
WaynesvilleCanton
Marshall
Newport
Erwin
Micaville
Rutherfordton
ForestCity
Landrum
Gaffney
Blacksburg
KingsCreek
Tirzah
Catawba
FortMill
Bosti
cEll
enbo
roLa
ttimore
Lincolnton
Lenoir Taylorsville
Maiden
Mt.Holly
Pineville
Monroe
North WilkesboroElkin
Mount Airy
Rural Hall
Mocksville
Cheraw
Bennettsville
Dillon
Latta
Wadesboro Rockingham
Laurin-burg Maxton
Pembroke
High Rock
Badin
Mt. Gilead
Pinehurst
StarSanford
Siler City
Albemarle
Norwood
Spencer
Kernersville
Belews Creek
ReidsvilleMadison
Martinsville
Clarksville
Eden
Blanche
Hyco
Hyco Jct.
Roxboro
Timberlake
Emporia
Norlina
Boykins
Henderson
FranklintonLouisburg
Clayton
Zebulon
Oxford
Weldon
Kelford
Ahoskie
Tunis
Fremont
Tarboro
WilliamstonPlymouth
Elizabeth City
Hertford
Edenton
Mt. Olive
WarsawClinton
Wallace
CastleHayne
St. PaulDuart
Vander
Dunn
Smithfield
Selma
Spring Hope
Chocowinity Washington
Elmer
McColl
Rowland
ChadbournWhiteville
Tabor City
Mullins
Conway
Marion
Sunny Pt.
Malmo
Morehead City
RadioIsland
Lee Creek
Belhaven
Suffolk
Aberdeen
BonsalApex
Red Springs
Raeford
Burgaw
Sunny Point Jct.
Tuxedo
Kona
Spruce Pine
TerrellTroutman
Mooresville
BarberJct.
Cooleemee Jct.
PinnacleKing
Candor
SouthBoston Clover
Keysville
Lawrenceville
Mayo
NurneyFranklin
VirginiaBeach
Parmele
PhosphateJct.
Pinetown
Parkton
Capol
Manchester
Gulf
Fuquay- Varina
Lillington
Breedin
Marboro
SylvaHall’s Ferry Jct.
Whitney
Linwood
Clarkton
Johns
Wagram
SkiboClifbragg Jct.
Clifbragg
NewHill
Cumnock
Colon
Climax
Garner
RiverTerminal
Enfield
Jonesboro
Ringgold
PicksRidgeway
Warren Plains
Weeksville
Wash
burn
Hilltop
Crowder
CHERRY PT.MCAS
ASHEBORO
ASHEVILLE
WINSTON-SALEM
CHARLOTTE
DURHAM
RALEIGH
FAYETTEVILLE
HICKORY
STATESVILLE
BURLINGTON
THOMAS- VILLE
HIGH POINT
ROCKHILL
DANVILLE
PORTSMOUTHNORFOLK
KANNAPOLIS
SALISBURY
GASTONIA SOUTHERNPINES
ROCKYMOUNT
WILSON
GREENVILLE
GOLDSBORO
KINSTON
NEW BERN
HAVELOCK
LUMBERTON
ROANOKERAPIDS
LEXINGTON
MORGANTON
SPARTANBURG
WILMINGTON
GREENSBORO
MYRTLE BEACH
CARY
Legend Existing Rail Corridor
Preserved Rail Corridor/Out of Service
Military Base
State Line
North Carolina
RAILROADSYSTEM
Michael F. Easley, GovernorLyndo Tippett, Secretary
RailDivisionNC Department of Transportation1553 MSC, Raleigh, NC 27699-1553Phone: (919) 733-7245, Fax: (919) 715-6580www.bytrain.org
BurlingtonCaryCharlotteDurham
FayettevilleGastoniaGreensboroHamlet
High PointKannapolisRaleighRocky Mount
SalisburySelmaSouthern PinesWilson
StationsinNorthCarolina
Information: 1-800-BYTRAIN (1-800-298-7246)Reservations: 1-800 USA RAIL (1-800-872-7245)
Railway Association of North Carolina www.ncrailways.net
December 2007
ACWR Aberdeen Carolina & Western Railway AR Aberdeen & Rockfish Railroad ARC Alexander Railroad ATW Atlantic & Western Railway, LP CA Chesapeake & Albemarle Railroad CALA Carolina Southern Railroad CFR Cape Fear Railways CLNA Carolina Coastal Railway CPLJ Camp Lejuene Railroad CSX CSX Transportation
CTR Clinton Terminal Railroad CWCY Caldwell County Railroad HPTD High Point, Thomasville & Denton Railroad LRS Laurinburg & Southern Company, Inc. MHSF Morehead and South Fork Railroad Company NCDOT N.C. Department of Transportation NCRR North Carolina Railroad Company NCVA North Carolina & Virginia Railroad NHV New Hope Valley Railroad NS Norfolk Southern Corporation
PDRR Pee Dee River Railway RSNR Red Springs & Northern Railroad SUR State University Railroad TBRY Thermal Belt Railway US US Military VSRR Virginia Southern Railroad WSS Winston-Salem Southbound Railway WTRY Wilmington Terminal Railroad, Inc. YVRR Yadkin Valley Railroad
REPORTINGMARK RAILROADNAME
REPORTINGMARK RAILROADNAME
REPORTINGMARK RAILROADNAME

FINAL Report – Chapter 4
1 | P a g e
CHAPTER 4
NAVIGATION AND DREDGING IMPROVEMENTS
This Chapter summarizes our review of the proposed dredging plans as presented in the North Carolina International Terminal Infrastructure Report, dated September 2008. The purpose of this review is to identify any potential cost savings for the development of the proposed terminal, with respect to the dredging plans.
The dredging plans include the navigational and access channels, turning basin, and berth area for the proposed terminal site. Of the three dredging efforts, only the berth access is associated solely with the development of the proposed terminal. The navigational channel and turning basin will support multiple users and therefore dredging efforts associated with these components include cost-sharing between the Federal Government and the State of North Carolina.
Channel Dredging Plan
Design Vessel
The design vessel proposed in the Infrastructure Report is a 12,000 TEU vessel, with a length (LOA) of 1,260 ft, width of 185 ft, and draft of 50 ft. To provide adequate clearance, dredging efforts are proposed in the navigational channel to provide a minimum depth of 52.5 ft, with a two foot over dredge to a depth of 54.5 ft.
TEC has performed a number of studies, which have included research on dimensions of large container vessels. We have compiled information on the largest container vessel classes in operation or under construction. Based on our research, vessel class dimensions are listed in Table 1. As seen in Table 1, there are some differences between the “Design Vessel” dimensions assumed in the Original Business Plan and the typical dimensions used for planning purposes by TEC. While the drafts of the vessels are comparable, the length and beam of the design vessel in the Original Business Plan are larger than those used by TEC. However, the dimension differences have little impact on the assessment of the channel planning concepts proposed in the Original Business Plan.
TABLE 1. Ship Dimensions By Vessel Class Vessel Type TEU DWT Draft (ft) LOA (ft) Beam (ft)
CMA CMG Pellas Class 9,661 109,000 49.2 1148 140
CMA CMG Vela Class 10,980 109,000 49.2 1148 142
MSC Sola Class 11,312 120,000 49.2 1200 150
Samsung ULC Class 12,500 142,400 50.8 1200 158
Maersk E Class 13,000 158,000 52.5 1302 185
MSC Paloma Class 13,200 135,000 52.5 1246 167
FINAL Report – Chapter 4
2 | P a g e
Background detail from NOAA Navigational Chart 11537
Terminal Site
Cut-Thru Channel Location Used For Costing Purposes
12,000 TEU Design Vessel
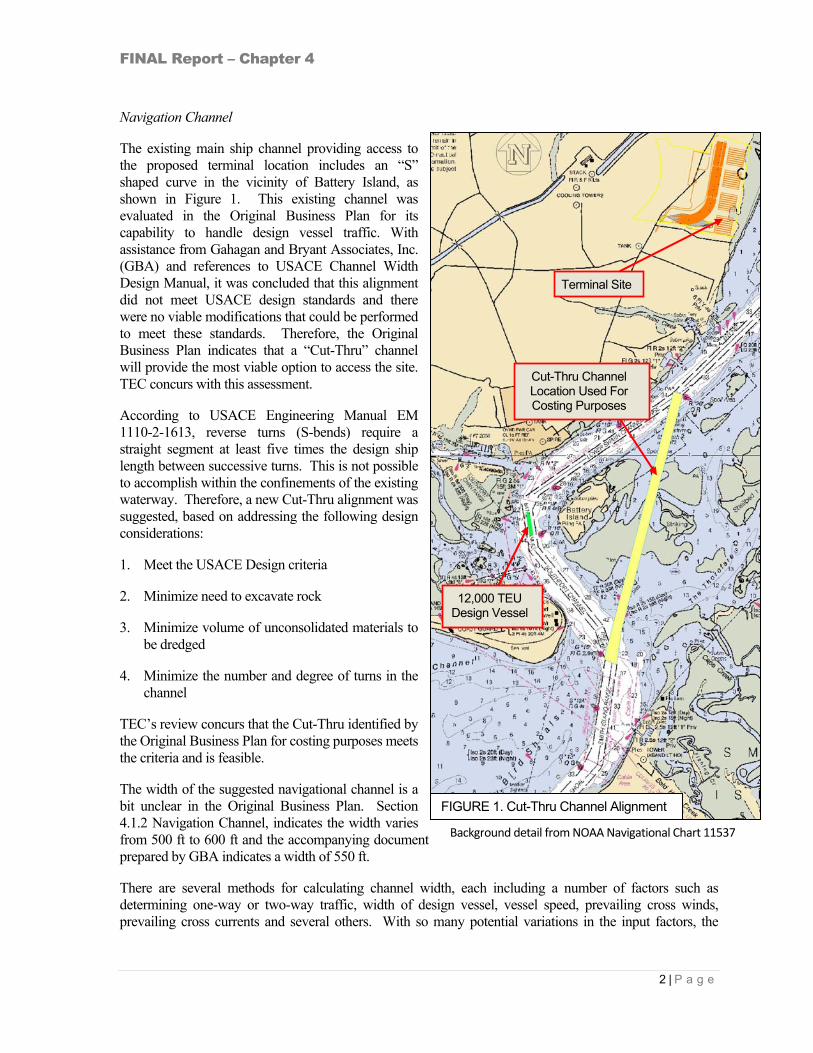
Navigation Channel
The existing main ship channel providing access to the proposed terminal location includes an “S” shaped curve in the vicinity of Battery Island, as shown in Figure 1. This existing channel was evaluated in the Original Business Plan for its capability to handle design vessel traffic. With assistance from Gahagan and Bryant Associates, Inc. (GBA) and references to USACE Channel Width Design Manual, it was concluded that this alignment did not meet USACE design standards and there were no viable modifications that could be performed to meet these standards. Therefore, the Original Business Plan indicates that a “Cut-Thru” channel will provide the most viable option to access the site. TEC concurs with this assessment.
According to USACE Engineering Manual EM 1110-2-1613, reverse turns (S-bends) require a straight segment at least five times the design ship length between successive turns. This is not possible to accomplish within the confinements of the existing waterway. Therefore, a new Cut-Thru alignment was suggested, based on addressing the following design considerations:
1. Meet the USACE Design criteria
2. Minimize need to excavate rock
3. Minimize volume of unconsolidated materials to be dredged
4. Minimize the number and degree of turns in the channel
TEC’s review concurs that the Cut-Thru identified by the Original Business Plan for costing purposes meets the criteria and is feasible.
The width of the suggested navigational channel is a bit unclear in the Original Business Plan. Section 4.1.2 Navigation Channel, indicates the width varies from 500 ft to 600 ft and the accompanying document prepared by GBA indicates a width of 550 ft.
There are several methods for calculating channel width, each including a number of factors such as determining one-way or two-way traffic, width of design vessel, vessel speed, prevailing cross winds, prevailing cross currents and several others. With so many potential variations in the input factors, the
FIGURE 1. Cut-Thru Channel Alignment

FINAL Report – Chapter 4
3 | P a g e
calculated width of a channel can vary significantly. The Original Business Plan indicates that the navigational channel is calculated based on one-way traffic. Again, using the USACE Engineering Manual, the design criteria indicates the channel width for a one-way traffic, canal-type channel should be 2.5 – 4.0 times the beam of the design ship. Calculating width, based on a vessel beam of 185 ft, requires a channel between 463 ft and 740 ft. Calculating width, based on a vessel beam of 158 ft (as listed in Table 1), requires a channel between 395 ft and 632 ft. During our review, TEC also prepared a computer model using The World Association for Waterborne Transport Infrastructure (PIANC) Design Guidelines. Based on a ship beam of 185 ft, our model calculated a channel width of 685 ft and based on a ship beam of 158 ft, our model calculated a channel width of 585 ft. Ultimately, the final design of the channel will be studied by the USACE and designed to their standards. The two key input factors to the calculation are ship beam and determination of a one-way or two-way channel. Assuming the channel design remains a one-way channel, there may be some potential cost-savings in planning for the 158 ft beam ship rather than the 185 ft beam design vessel. However, at this time, until the input factors are refined by USACE, TEC concurs that the channel alignment used in the Original Business Plan for cost estimating purposes is reasonable.
Berth Dredging Plan
The new wharf is proposed along the bluff between the lower tidal area and the upland area. The upland area is at approximately 20 ft above the National Geodetic Vertical Datum of 1929 (NGVD) and the tidal area ranges from 0 to 5 ft NGVD. The development of the wharf is proposed in three phases. The first phase proposes 2,330 LF of wharf, followed by an additional 550 LF and 1,390 LF in Phases 2 and 3, respectively for a total of 4270 linear feet of wharf. This will allow 3 design vessels to be berthed at one time. The three vessels would extend the entire length of the proposed wharf, with no berth space for any additional vessels.
FIGURE 2. Infrastructure Report – Proposed Wharf Location and Berth Area Dredging Plan
Berth Area Dredging Requirements
Background detail from CH2M HILL Infrastructure Report – Appendix C –DWG B‐1, Sheet 3
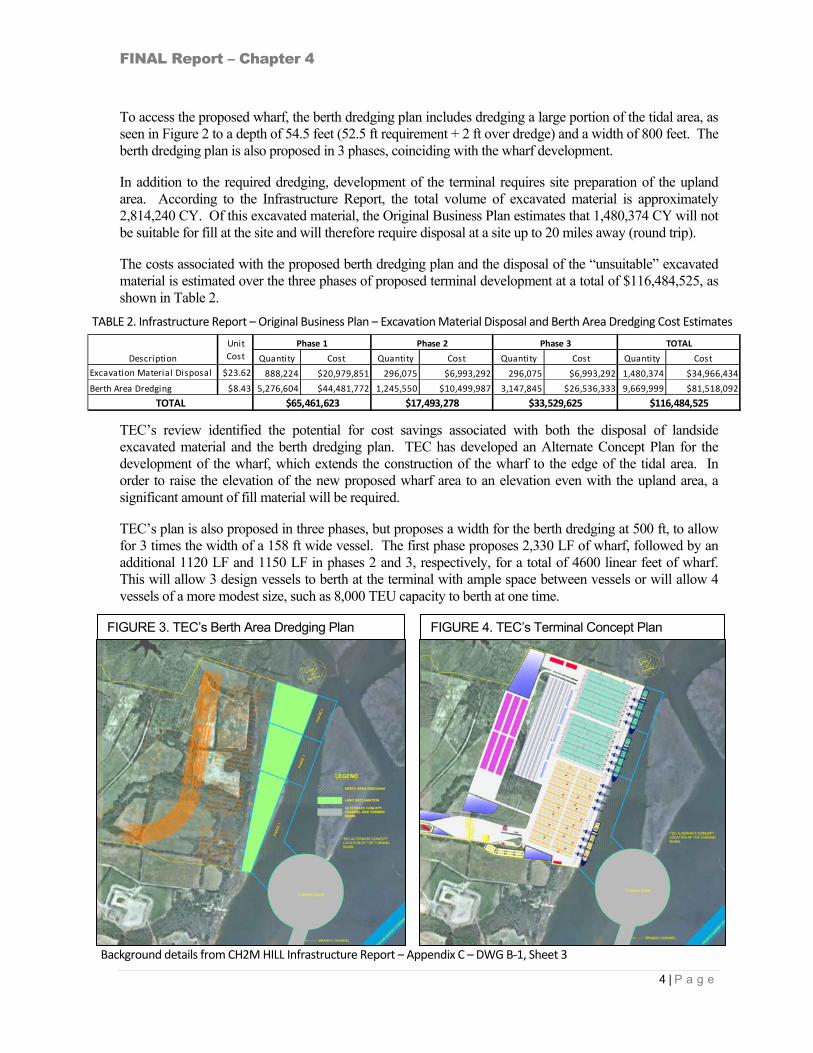
FINAL Report – Chapter 4
4 | P a g e
Quantity Cost Quantity Cost Quantity Cost Quantity Cost
Excavation Material Disposal $23.62 888,224 $20,979,851 296,075 $6,993,292 296,075 $6,993,292 1,480,374 $34,966,434
Berth Area Dredging $8.43 5,276,604 $44,481,772 1,245,550 $10,499,987 3,147,845 $26,536,333 9,669,999 $81,518,092
TOTAL
Phase 1 Phase 2 Phase 3 TOTAL
$116,484,525
Description
$65,461,623 $17,493,278 $33,529,625
Unit
Cost
FIGURE 3. TEC’s Berth Area Dredging Plan FIGURE 4. TEC’s Terminal Concept Plan
To access the proposed wharf, the berth dredging plan includes dredging a large portion of the tidal area, as seen in Figure 2 to a depth of 54.5 feet (52.5 ft requirement + 2 ft over dredge) and a width of 800 feet. The berth dredging plan is also proposed in 3 phases, coinciding with the wharf development.
In addition to the required dredging, development of the terminal requires site preparation of the upland area. According to the Infrastructure Report, the total volume of excavated material is approximately 2,814,240 CY. Of this excavated material, the Original Business Plan estimates that 1,480,374 CY will not be suitable for fill at the site and will therefore require disposal at a site up to 20 miles away (round trip).
The costs associated with the proposed berth dredging plan and the disposal of the “unsuitable” excavated material is estimated over the three phases of proposed terminal development at a total of $116,484,525, as shown in Table 2.
TEC’s review identified the potential for cost savings associated with both the disposal of landside excavated material and the berth dredging plan. TEC has developed an Alternate Concept Plan for the development of the wharf, which extends the construction of the wharf to the edge of the tidal area. In order to raise the elevation of the new proposed wharf area to an elevation even with the upland area, a significant amount of fill material will be required.
TEC’s plan is also proposed in three phases, but proposes a width for the berth dredging at 500 ft, to allow for 3 times the width of a 158 ft wide vessel. The first phase proposes 2,330 LF of wharf, followed by an additional 1120 LF and 1150 LF in phases 2 and 3, respectively, for a total of 4600 linear feet of wharf. This will allow 3 design vessels to berth at the terminal with ample space between vessels or will allow 4 vessels of a more modest size, such as 8,000 TEU capacity to berth at one time.
TABLE 2. Infrastructure Report – Original Business Plan – Excavation Material Disposal and Berth Area Dredging Cost Estimates
Background details from CH2M HILL Infrastructure Report – Appendix C –DWG B‐1, Sheet 3

FINAL Report – Chapter 4
5 | P a g e
The Alternate Concept for this proposed terminal will be presented in further detail in Chapters 5 and 6 of this report. Figures 3 and 4 illustrate the increased terminal footprint, new dredging area requirements, and the conceptual wharf development plan. As seen in these figures, the proposed berth area dredge plan in the Alternate Concept prepared by TEC is adjacent to the cooling water channel north of the proposed terminal which is the source of the power plant cooling water. As an added benefit, the Alternate Concept dredging could improve the cooling water flow through this channel. However, no assessment has been performed to evaluate if there would be any potential concerns with the relocation of the wharf adjacent to the intake canal.
This Alternate Concept provides five main benefits to project development: 1. The wharf length is extended approximately 300 feet and the terminal area is increased by
approximately 71 acres at ultimate build-out. 2. The excess excavated material from the site preparation can be used as fill for the land reclamation,
eliminating the time and expense of disposal off-site. 3. By moving the required berth dredging location, the dredge area is moved from a tidal area to
shallow water, slightly decreasing the amount of dredging required. 4. Suitable dredged material can be reused for land reclamation. 5. Although not capable of berthing 4 design vessels, the Alternate Concept can berth 4 vessels,
provided at least one is a smaller vessel In order to calculate the potential cost savings associated with the reconfiguration of the wharf, TEC made
the following assumptions: 1. Based on documents prepared for the current Plan, dredge material from the surface to
approximately -33 ft. is assumed to be unsuitable as fill material, and is transported off-site to a disposal site. Dredge material from elevation-33 to elevation -54.5 is considered to be suitable, which indicates that approximately 34% of the dredge material can be used as fill for the land reclamation area. The Alternate Concept incorporates this suitable material into the land reclamation.
2. Based on documents prepared for the current Plan, approximately half of the material excavated during the site grading process is not required as fill for site development. The documents term this material “unsuitable” and include a significant cost to haul it off-site to a remote disposal area. TEC contacted CH2M HILL staff to inquire about the characteristics of the material designated as “unsuitable”. The CH2M Hill engineer indicated that the material referred to was actually just excess material not needed for site preparation in the Plan’s configuration, and that in his opinion the material could reasonably be used for land reclamation. Therefore, TEC’s Alternate Concept, assumes that all site excavated material is used as fill for land reclamation.
3. The volume of material calculated for dike construction and land reclamation assumes five feet of settlement.
4. The entire dike and land reclamation area shown in Figure 3 will be constructed in Phase 1 of the terminal development. To be most cost-efficient, the cut and fill requirements should nearly balance. In order to balance the requirements for the construction of the dike and land reclamation area, some additional dredge material and excavation material beyond the volumes proposed in Phase 1 of the Original Business Plan are required for Phase 1 of TEC’s Alternate Concept. By increasing the dredge length by 120 feet and including 20% of the Phase 2 excavation requirements, the cut and fill requirements are relatively balanced. Table 3 lists the volumes of material available for construction of these components compared to the quantity of material available for their construction through site excavation and dredging.

FINAL Report – Chapter 4
6 | P a g e
Material Required For Land Reclamation Phase 1 Phase 2 Phase 3 Total
Dike Construction (CY) 392,610 0 0 392,610
Land Reclamation (CY) 1,762,575 0 0 1,762,575
Total Material Required 2,155,185 0 0 2,155,185
Material Available for Land Reclamation Phase 1 Phase 2 Phase 3 Total
Total Dredge Material 3,007,629 1,040,278 1,073,775 5,121,682
Dredge Material ‐ Suitable For Land Reclamation (@ 34%) 1,022,594 353,695 365,084 1,741,372
Total Excavation Material 2,215,661 82,205 516,374 2,814,240
Excavation Material ‐ Available For Land Reclamation 1,137,442 46,857 296,075 1,480,374
Total Material Available 2,160,036 400,552 661,159 3,221,746
Quantity Cost Quantity Cost Quantity Cost Quantity Cost
Excavation Material Disposal $23.62 0 $0 46,857 $1,106,762 296,075 $6,993,292 342,932 $8,100,054
Dike Construction (CY) $3.50 392,610 $1,374,135 0 $0 0 $0 392,610 $1,374,135
Containment Fil l (CY) $3.36 1,762,575 $5,922,252.00 0 $0 0 $0 1,762,575 $5,922,252
Berth Area Dredging (CY) $8.90 3,007,629 $26,767,898.10 1,040,278 $9,258,474.20 1,073,775 $9,556,597.50 5,121,682 $45,582,969.80
Unit
Cost
TOTAL
Description
Phase 1 Phase 2 Phase 3 TOTAL
$60,979,411$34,064,285 $10,365,237 $16,549,889
$10,365,237
$33,529,625
Phase 2 Phase 3 TOTAL
CH2M HILL PLAN
TEC's Alternate Concept
Cost
$116,484,525
$60,979,411
$65,461,623
$34,064,285
Cost Cost
$17,493,278
$16,979,735.85 $55,505,115
Cost
$16,549,889
Phase 1
POTENTIAL COST SAVINGS
Source
$31,397,338 $7,128,041.46
TABLE 3. TEC Concept Plan–Dike Construction, Containment Area Fill and Berth Area Dredging Cost Estimates
The balance between the required cut and fill indicates a cost-savings associated with eliminating the need to dispose of material or truck additional fill material to the site.
Based on the assumptions listed on page 5, the costs associated with dike construction, land reclamation and the Alternate Concept dredging requirements are presented in Table 4. Unit costs used in the Original Business Plan were used in TEC’s analysis, in order to maintain consistency for comparison purposes.
* Although the Unit Cost for Berth Area Dredging appears higher in the TEC Alternate Concept Plan than the Original Business Plan, the unit costs for the various dredge material types are the same. The variation in percentage of dredge material types assumed for each Plan accounts for the overall difference in unit costs.
Comparing the costs associated with the berth area dredging and disposal of excess excavation material, as proposed in the Original Business Plan to the cost estimates prepared for the TEC Alternate Concept, the potential cost savings for this portion of the project are estimated at approximately $55,500,000, as seen in Table 5.
TABLE 4. TEC Concept Plan- Dike Construction, Containment Area Fill and Berth Area Dredging Cost Estimates
TABLE 5. Berth Area Dredging Plan Potential Cost Savings
*

FINAL Report – Chapter 4
7 | P a g e
FIGURE 5. The Plan and TEC Alternate Concept Turning Basins
Access Channel and Turning Basin Dredging Plan
The PIANC model that was used to assess the proposed channel dimensions was also used to calculate the turning basin approaching the berth access. According to the model, the turning basin should have a minimum diameter of 1890 ft. The basin proposed in the Infrastructure Report has a diameter of 1900 ft and therefore meets the minimum area requirements. TEC’s Alternate Concept maintains a 1900 ft diameter turning basin, which is shifted away from the tidal area by approximately 500 feet. However, the access channel is maintained at the same location used for cost-estimating purposes in the Original Business Plan. Although a small portion of the turning basin proposed in the Alternate Concept may be in deep water, without better bathymetric data in the area, it is assumed that the dredge quantities calculated for cost estimating purposes in the Original Business Plan are comparable to the dredge quantities estimated in the Alternate Concept and therefore do not include any potential cost–savings.
Summary
For this Task of the North Carolina International Terminal Infrastructure Report review, TEC focused on the proposed dredging plans associated with the main channel, access channel, turning basin, and berth area. All costs discussed in this report are related to the areas identified by TEC for cost-savings with respect to dredging and other associated components. The overall project costs and potential cost savings will be prepared and discussed in subsequent Report review submittals. Although the dimensions of the design vessel used in the Original Business Plan to calculate the dimensions of the navigational channel are slightly different than TEC’s typical dimensions for a vessel of equivalent capacity, the differences between the assumptions in The Plan and the assumptions in the Alternate Concept do not have an impact on the assessment of the navigational channel developed in The Plan for cost-estimating purposes. As discussed in the Infrastructure Report, the bends in the existing channel do not allow for passage of a 12,000+ TEU vessel. Therefore, TEC agrees that the most viable alignment for the new navigational channel is a cut-thru from the Smith Island Range Channel to the Snows Marsh Channel. A channel width of 500 ft to 600 ft is within the design guidelines and an appropriate dimension to use for cost estimating purposes. During the final design of the channel, there could potentially be some cost savings, depending on the refinement of input factors by the USACE. For the purposes of this review, TEC did not

FINAL Report – Chapter 4
8 | P a g e
identify any definite cost savings opportunities with respect to the navigational channel. The primary cost savings identified by TEC are related to the relocation of the proposed berths. By moving the wharf development to the tidal area and reducing the width of the berth dredging area, the required dredging in the berth area is decreased, and although TEC’s Alternate Concept requires the construction of a dike and land reclamation, these components provide the benefit of creating a disposal site for all of the land excavation material and a portion of the dredge material. The costs of these components are far outweighed by the cost-savings provided by their benefits. In addition to the approximately $55,500,000 in cost-savings that potentially could be realized with TEC’s Alternate Concept for the proposed terminal, the terminal area is also increased by approximately 71 acres, creating more space for terminal operations and related activities. As a result of relocating the proposed berth area, the turning basin is also slightly relocated. The proposed size of the turning basin in the Original Business Plan meets the USACE Engineering Manual design criteria and the PIANC model, and without better bathymetric data, it is assumed that the dredging requirements are comparable and therefore there are not any appreciable cost-savings expected to be associated with the relocation of the turning basin.

FINAL Report – Chapter 5
1 | P a g e
CHAPTER 5
ALTERNATE DEVELOPMENT CONCEPT COST ANALYSIS
This Chapter summarizes TEC’s Alternate Concept for the development of the North Carolina International Terminal (NCIT) and an order of magnitude capital cost estimate for its construction. The construction of the NCIT will include various elements, both on-site and off-site. In addition to the actual terminal construction, access to the site by railway, roadway, and waterway will require modifications and additions to the existing infrastructure. As discussed in previous chapters and correspondences, it is assumed that all infrastructure upgrade costs associated with access to the terminal site will be the responsibility of various public sector organizations. The capital cost estimate prepared in this Task focuses on the elements that are assumed will be provided by private sector investors. Therefore, the transportation infrastructure costs included for terminal development are limited to the roadways and railways within the property boundary and the berth area dredging requirements up to the proposed turning basin.
The current Plan proposes a 3-phase approach to development of a new container terminal along the Cape Fear River, in Brunswick County on 600 acres for the North Carolina State Ports Authority (The Authority). The Plan includes an automated rail mounted gantry (ARMG) crane system for container yard operations. This type of system is considered state-of-the-art and offers very dense, high throughput container stacks at significantly reduced labor requirements relative to other yard systems. This type of system if very expensive and typically is most effective and economical where land area is limited and/or very expensive and where labor costs are very high. The Plan includes an ultimate wharf length of 4270 ft and a terminal capacity of 3,000,000 TEUs per year.
TEC reviewed the current Plan with the intent to discern potential project cost-savings, with a focus on ways to reduce the cost of Phase 1 (start-up) development, while providing a modern and efficient terminal capable of handling the desired throughput and very large container vessels. Our evaluation revealed a significant initial cost for equipment, mainly due to the ARMG system for container yard operation. As mentioned, while providing highly efficient operation, it is expensive and in TEC’s opinion requires investment in more capacity than needed for start-up and early years of operation. After review and assessment of this and other concepts in the current Plan, TEC began to develop an Alternate Concept for the development of the NCIT. TEC’s Alternate Concept was developed with the following objectives: Improve site layout and function
Provide terminal operation more commensurate with the low expected cargo volumes expected with initial start-up and early years of operation.
Provide for terminal capacity increases in practical phases, as volume increases
Incorporate higher-efficiency technology after cargo volume grows sufficiently to justify the expenditures
Reduce cost of equipment for Phase 1
Reduce cost of terminal sitework

FINAL Report – Chapter 5
2 | P a g e
Land Reclamation Area
Terminal Alternatives TEC developed five alternative concepts for NCIT layouts along with rough order of magnitude estimates for potential cost savings over the current Plan. These alternatives were presented to NCPSA and Paul F. Richardson Associates at our team meeting in Annapolis on August 25, 2009. After a very productive discussion and direction, one of the alternates was modified to create Alternate 6, which was selected as the best suited for development as TEC’s Alternate Concept in this task. Drawings of the Alternate Concept are attached to this report. This report presents further information on the Alternate Concept including a different approach to container handling equipment, operating parameters, facilities details and projected costs. TEC’s Alternate Concept for terminal development is also proposed in three phases. Phase 1 is projected to provide a capacity of 1,000,000 TEUs/year. Phase 2 will provide additional capacity to 2,000,000 TEUs annually, followed by an ultimate capacity of 3,000,000 TEUs per year at the completion of Phase 3.
The Alternate Concept includes some land reclamation along the tidal area, which will increase the available area for terminal development by approximately 71 acres, as seen in Figure 1. This concept reduces the amount of dredging required for the berth area and eliminates the need to haul and dispose of any site excavation material and suitable dredge material in Phase 1 of terminal development. As presented in Chapter 4 (Interim Report No. 4), this concept of reducing berth dredging requirements and eliminating excavation material disposal in Phase 1 saves approximately $60 million.
In addition to the extra area created, the repositioning of the terminal provides a configuration that increases the overall length of
the wharf from 4,270 feet in the current Plan to 4,600 feet in the Alternate Concept.
Another conceptual difference between the current Plan and TEC’s Alternate Concept involves the development of the container yard. Since the NCIT site has significant available land, and additional land in the area is inexpensive relative to other East Coast ports, it is TEC’s opinion that the ARMG systems’ high density of throughput is not required or well justified for Phase 1. Additionally, terminal labor costs for the area are relatively low compared to competing ports, which, again, would not favor the ARMG yard system, at least initially. Finally, the ARMG system’s high throughput capability is most effective when coupled with commensurate intermodal rail capabilities to move high volumes of cargo rapidly into and out of the terminal. Since the intermodal connection, competitive intermodal rail service and, moreover, demand for rail services are not likely to be firmly established at start-up, or in the early years of operation, the full benefits from an ARMG system will not be realized in Phase I. Therefore, TEC considers the following approach as most effective for accomplishing the stated objectives.
Develop Phase 1 using rubber tired gantry (RTG) equipment with container stacks oriented perpendicular to wharf. This is not the most popular layout, but many terminals use it. (GPA
Figure 1. Land Reclamation Area

FINAL Report – Chapter 5
3 | P a g e
Savannah, Yang Ming - LA and HIT – Hong Kong, for example). Disadvantages include more congestion on road behind hatch-covers due to more intersections and every truck drives a longer loop through yard, even if container required is close to the wharf. However, a typical layout for ARMG container stacks is perpendicular to wharf, and orienting the RTG yard in this same way will facilitate future conversion of the Phase 1 area to ARMG use if and when warranted.
Figure 2 is the conceptual layout of TEC’s Alternate Concept at ultimate build-out. The breakdown of development by Phase is further described and illustrated, starting on page 6 of this report. See the Attachments to this report for larger figures illustrating the overall site layout and the Phase developments.
Cost Estimate Assumptions
For the purposes of generating an order of magnitude capital cost estimate for the Alternate Concept described above, a number of assumptions were made. These assumptions and some of the differences between the two NCIT development plans are summarized below, and will be presented in greater detail in the Plan Comparison effort to be performed in Chapter 6.
1. The building types and sizes presented in the current Plan are within the size ranges typically proposed by TEC and for consistency, most of the buildings in the Alternate Concept are proposed to be the same or similar to those proposed in the current Plan.
2. TEC didn’t have access to specific topographic information of the site to develop our own calculations and therefore, the excavation volume proposed in the current Plan is used in the Alternate Concept for developing the cost estimate.
3. The current Plan includes 2.75 acres for the storage of empty containers and chassis together. According to the Throughput Analysis model prepared by TEC, ultimately the terminal will require 35 acres for the storage of empties and up to an additional 10 acres is assumed for the storage of chassis. It is unclear if the current Plan includes provisions for supplemental off-site storage for empties and chassis. The Alternate Concept and associated cost estimate assume
Figure 2. Overall Conceptual Layout

FINAL Report – Chapter 5
4 | P a g e
these areas will be included on-site and suitably sized to handle the volumes calculated in the TEC model.
4. In TEC’s Alternate Concept, the area of stormwater management ponds is assumed to require 8% of the total impervious area in the terminal. In ports, it is common to supplement stormwater management ponds with the installation of packaged stormwater treatment units in the areas adjacent to the water, to eliminate the need to pipe and pump the stormwater long distances. However, when stormwater management ponds are not supplemented by additional packaged stormwater treatment units, the pond sizes typically encompass 10% - 15% of the area. The ultimate design of the stormwater management system for the NCIT will be verified during engineering design, but for the purposes of conceptual design and cost-estimating the Alternate Concept assumes 8% of the total impervious area for stormwater management pond estimates.
5. The current Plan includes reefers concentrated in dedicated ARMG modules. TEC believes that reefer storage in homogeneous stacks creates significant inefficiencies in Container Yard (CY) operations and prefers to distribute small blocks of reefers in every ARMG stack. The percentage of reefer container throughout was not clear in the current Plan, but for the purpose of the Alternate Concept cost estimate, TEC assumes approximately 7% of the container slots will be dedicated to reefers.
6. TEC assumed that initially, 100% of the container traffic to and from the terminal will be by truck. However, in order to demonstrate rail capability to existing and potential future users, the terminal start-up includes the installation of both working and storage tracks. The working tracks proposed in the current Plan include a curved section. Since RTGs are proposed for Intermodal Yard (IY) operations, curved working tracks are not particularly efficient and therefore the Alternate Concept proposes working tracks in only straight segments. The Alternate Concept provides Phase 1 (IY) capability to handle one 10,000 ft train, which is consistent with the current Plan assumptions and its assessment of probable intermodal train operations.
7. Terminal development will include the installation of an ARMG system in Phase 2. This will require the implementation and integration of an automation software control package. This type of software package and set-up is a significant cost, at approximately $30,000,000. This cost does not appear to have been included in the current Plan, but is listed as a line item in the Alternate Concept cost estimate. Similarly, it does not appear that Terminal Operating Software (TOS) has been included in Phase 1, 2 or 3 of the current Plan. For the purposes of the Alternate Concept, it is assumed that the initial TOS implementation and integration will be on the order of $3,000,000 with additional $1,000,000 integration costs associated with the implementation of Phases 2 and 3.
8. The per acre unit costs for the CY, IY, and the Empty and Chassis Storage Areas listed in the Alternate Concept cost estimate are all-inclusive of the site preparations, drainage, electrical, utilities, fencing, paving, rail tracks and switches (when applicable), etc. and, the Reefer unit cost is all inclusive of the electrical service, plugs and racks.
As referenced in No. 3 above, TEC’s development of the Alternate Concept included the generation of a Throughput Analysis model. Input factors such as average dwell times, expected throughput distribution, and distribution of operations equipment were used to calculate annual throughput, throughput per acre, and the total yard areas required for efficient operations. The NCIT Terminal Capacity Model results are included as an attachment to this chapter. Also, the model input and output factors and the list of assumptions above are summarized in the list of Terminal Characteristics

FINAL Report – Chapter 5
5 | P a g e
in Table 1. Many of these values are utilized in the preparation of the cost estimates in the following section.
Table 1. NCSPA NCIT Alternate Concept Terminal Characteristics

FINAL Report – Chapter 5
6 | P a g e
Phase 1 Development
The Alternate Concept for Phase 1 development proposes 2330 lf of wharf, to include the installation of 8 container cranes. This will allow one 12,000 TEU vessel and one small to medium size vessel to berth at NCIT at the same time. The Phase 1 Concept is illustrated in Figure 3.
In order to make the investment in the terminal development an attractive proposition, the capital costs for Phase 1 development need to be minimized. There are a number of terminal development components which will need to be completed during Phase 1. Below is a list of some concepts that were incorporated into the cost saving plans for Phase 1.
Where possible, components such as site development, gate complex expansion, buildings, CY/IY expansions, wharf construction, berth dredging and major equipment installation are phased to expand or come on-line as capacity requirements increase.
There are 4 relatively new cranes currently in operation at the Port of Wilmington that can handle 18-wide container vessels. It is proposed that a schedule be developed to allow these 4 cranes be relocated to NCIT and modified to handle ships with 20-wide container vessels as outlined in the current Plan. Initially, it is expected that 6 container cranes will be sufficient for terminal start-up. During the project design, it can be determined whether initially all 4 existing cranes can be relocated, while only 2 new ones need to be purchased or if only 2 can be relocated initially, requiring the initial purchase of all 4 new cranes.
As previously discussed, it is proposed that the Phase 1 container yard be developed using rubber tired gantry cranes (RTGs) and reach stackers for container handling, and yard tractors and trailers for transport between the quay cranes and the CY and between the CY and the IY.
Figure 3. Alternate Concept - Phase 1

FINAL Report – Chapter 5
7 | P a g e
North Carolina State Ports Authority ‐ NCIT Concept Order of Magnitude Cost Estimate ‐ Alternate Concept
Quantity Units Unit cost Cost
Mobilization/Demobilization 1 ls $5,000,000 $5,000,000
Environmental Mitigation 1 ls $10,000,000 $10,000,000
Clearing and grubbing 211 acre $4,529 $955,691
Excavation 2,215,661 cy $8.45 $18,722,335
Excavation material disposal 0 cy $23.62 $0
Berth Dredging 3,007,629 cy $8.90 $26,767,898
Containment Dike 392,610 cy $3.50 $1,374,135
Leveling Fill Behind Dike 1,762,575 cy $0.55 $969,416
Marginal Wharf 302,900 sf $175 $53,007,500
Apron 3 acre $600,000 $1,800,000
Container Yard 74 acre $600,000 $44,400,000
Reefer Yard 1,700 plug $5,000 $8,500,000
Container Yard Gate 14 lane $250,000 $3,500,000
Intermodal Rail Yard 10 1000 ft wkg trk $550,000 $5,500,000
Rail spur/leads to IY & storage track 17,650 ft of track $155 $2,735,750
Rail switches 9 Each $25,000 $225,000
Empty Storage 20 acre $500,000 $10,000,000
Chassis Storage 5 acre $200,000 $1,000,000
Port Security & Customs 1,070 sf $150 $160,500
Maintenance ‐ General 15,000 sf $150 $2,250,000
Maintenance ‐ Cranes 6,000 sf $150 $900,000
Maintenance ‐ Shuttles 0 sf $150 $0
Maintenance ‐ Roadability 800 sf $150 $120,000
Administration Building 28,000 sf $225 $6,300,000
Gate Assistance 250 sf $150 $37,500
IY Yard Office 250 sf $150 $37,500
Roadability canopy 2,550 sf $75 $191,250
Marine Building 1,800 sf $150 $270,000
Miscellaneous Site Paving 18 acre $200,000 $3,600,000
Elect. Transformers & Switchgear 2 Each $2,000,000 $4,000,000
Subtotal Site Costs $212,324,476
Container Cranes (new) 4 each $9,500,000 $38,000,000
Container Cranes (relocated) 4 each $2,250,000 $9,000,000
RTG Yard Cranes (CY & ICTF) 25 each $1,500,000 $37,500,000
ARMG Yard Cranes (CY) ‐‐
Terminal Operating Software 1 each $3,000,000 $3,000,000
Automation Software Package ‐‐
Shuttle Carriers (ARMG CY) ‐‐
Reach Stackers 14 each $450,000 $6,300,000
Yard Hostlers and Trailers 67 each $150,000 $10,050,000
Fork Lift Trucks 6 each $260,000 $1,560,000
Subtotal Major Equipment $105,410,000
Subtotal Site + Equipment $317,734,476
Planning & Design Services 5 % Site + Equip. 5% $15,886,724
Construction Admin. & Mgmt. 5 % Site + Equip. 5% $15,886,724
Subtotal Project $349,507,923
Contingency 25 % Project 25% $87,376,981
Total Estimate (2009 $) $436,884,904
Item
SITE WORK
MAJOR EQUIPMENT
TOTAL PROJECT COST ESTIMATE
Phase 1
Table 2 presents the cost estimate prepared for Phase 1. The total estimate for Phase 1 construction is approximately $437 million.
Table 2. Alternate Concept Cost Estimate – Phase 1

FINAL Report – Chapter 5
8 | P a g e
Phase 2 Development
As the terminal begins to approach its 1,000,000 TEU Phase 1 capacity, Phase 2 will be implemented. Phase 2 development proposes an additional 1120 lf of wharf, the installation of 4 new container cranes to equip the terminal with one additional post-Panamax berth, and additional stormwater management ponds. Upon completion of Phase 2, the wharf would accommodate two 12,000 TEU vessels, plus one smaller vessel. The Phase 2 Concept is illustrated in Figure 4.
As the terminal approaches its operational capacity of Phase 1, a positive cash flow will have developed to support Phase 2 development. In order to achieve an additional 1,000,000 TEU capacity with the Phase 2 expansion and footprint, a higher capacity yard operation is required. Thus, at this time, TEC proposes the installation of an ARMG system. The implementation of the ARMG system in Phase 2 will improve terminal density, throughput velocity and reduce handling costs, all of which are required to successfully increase terminal capacity to 2,000,000 TEUS per year. The Phase 1 RTG system and the Phase 2 ARMG system will operate simultaneously. The Phase 2 operations will utilize shuttle carriers for transport between the CY and IY and between the quay cranes and the CY stacks but without intermixing of traffic on the waterside, for safety reasons. In addition to the automated equipment, the ARMG system will require the installation and setup of an automated control system. This software package and customization of the control features must be integrated with the Terminal Operating System.
Figure 4. Alternate Concept - Phase 2

FINAL Report – Chapter 5
9 | P a g e
North Carolina State Ports Authority ‐ NCIT Concept Order of Magnitude Cost Estimate ‐ Alternate Concept
Quantity Units Unit cost Cost
Mobilization/Demobilization 1 ls $5,000,000 $5,000,000
Environmental Mitigation 0 ls $10,000,000 $0
Clearing and grubbing 50 acre $5,378 $268,876
Excavation 82,205 cy $8.45 $694,632
Excavation material disposal 46,857 cy $23.62 $1,106,762
Berth Dredging 1,040,278 cy $8.90 $9,258,474
Containment Dike 0 cy $3.50 $0
Leveling Fill Behind Dike 0 cy $0.55 $0
Marginal Wharf 140,000 sf $175 $24,500,000
Apron 1.5 acre $600,000 $900,000
Container Yard 37 acre $600,000 $22,200,000
Reefer Yard 900 plug $5,000 $4,500,000
Container Yard Gate 6 lane $250,000 $1,500,000
Intermodal Rail Yard 10 1000 ft wkg trk $550,000 $5,500,000
Rail spur/leads to IY & storage track 3,250 ft of track $155 $503,750
Rail switches 3 Each $25,000 $75,000
Empty Storage 10 acre $500,000 $5,000,000
Chassis Storage 5 acre $200,000 $1,000,000
Port Security & Customs 0 sf $150 $0
Maintenance ‐ General 15,000 sf $150 $2,250,000
Maintenance ‐ Cranes 6,000 sf $150 $900,000
Maintenance ‐ Shuttles 27,600 sf $150 $4,140,000
Maintenance ‐ Roadability 0 sf $150 $0
Administration Building 0 sf $225 $0
Gate Assistance 250 sf $150 $37,500
IY Yard Office 250 sf $150 $37,500
Roadability canopy 0 sf $75 $0
Marine Building 900 sf $150 $135,000
Miscellaneous Site Paving 6 acre $200,000 $1,200,000
Elect. Transformers & Switchgear 2 Each $2,000,000 $4,000,000
Subtotal Site Costs $94,707,495
Container Cranes (new) 4 each $9,500,000 $38,000,000
Container Cranes (relocated) 0 each
RTG Yard Cranes (CY & ICTF) 4 each $1,500,000 $6,000,000
ARMG Yard Cranes (CY) 18 each $2,500,000 $45,000,000
Terminal Operating Software 1 each $1,000,000 $1,000,000
Automation Software Package 1 each $30,000,000 $30,000,000
Shuttle Carriers (ARMG CY) 39 each $830,000 $32,370,000
Reach Stackers 2 each $450,000 $900,000
Yard Hostlers and Trailers 0 each $150,000 $0
Fork Lift Trucks 4 each $260,000 $1,040,000
Subtotal Major Equipment $154,310,000
Subtotal Site + Equipment $249,017,495
Planning & Design Services 5 % Site + Equip. 5% $12,450,875
Construction Admin. & Mgmt. 5 % Site + Equip. 5% $12,450,875
Subtotal Project $273,919,244
Contingency 25 % Project 25% $68,479,811
Total Estimate (2009 $) $342,399,055
Item
SITE WORK
MAJOR EQUIPMENT
TOTAL PROJECT COST ESTIMATE
Phase 2
Table 3 summarizes the cost estimate prepared for Phase 2. The total estimate for Phase 2 is $342 million.
Table 3. Alternate Concept Cost Estimate – Phase 2

FINAL Report – Chapter 5
10 | P a g e
Phase 3 Development
As the terminal begins approaching the 2,000,000 TEU Phase 2 capacity, Phase 3 will be implemented. Phase 3 will be very similar to Phase 2 with the construction of an additional 1150 lf of wharf and the installation of 4 new container cranes. At completion of Phase 3 the terminal will be equipped to handle three 12,000 TEU vessels or four smaller post-panamax vessels simultaneously. The Phase 3 Concept is illustrated in Figure 5.
Phase 3 development will complete the site build-out, which will include the installation of 10,000 ft of additional working tracks in the ICTF, completion of the container yard and additional Empty Storage area. The construction of the wharf for a total of 4600 lf will also be complete and the remaining major equipment will be purchased and installed.
Phase 3 operations will be identical to Phase 2, in size and capacity, expanding the ARMG system for CY operations. It will require additional shuttle carriers, and some modifications to the automated control system. At the completion of Phase 3, the ultimate build-out will include the simultaneous operation of half of the container yard area with an RTG system and half with an ARMG system to provide a capacity of 3,000,000 TEUs/year.
Figure 5. Alternate Concept - Phase 3

FINAL Report – Chapter 5
11 | P a g e
North Carolina State Ports Authority ‐ NCIT Concept Order of Magnitude Cost Estimate ‐ Alternate Concept
Quantity Units Unit cost Cost
Mobilization/Demobilization 1 ls $5,000,000 $5,000,000
Environmental Mitigation 0 ls $10,000,000 $0
Clearing and grubbing 78 acre $5,750 $448,509
Excavation 516,374 cy $8.45 $4,363,360
Excavation material disposal 296,075 cy $23.62 $6,993,292
Berth Dredging 1,073,775 cy $8.90 $9,556,598
Containment Dike 0 cy $3.50 $0
Leveling Fill Behind Dike 0 cy $0.55 $0
Marginal Wharf 143,750 sf $175 $25,156,250
Apron 2 acre $600,000 $960,000
Container Yard 37 acre $600,000 $22,200,000
Reefer Yard 1,100 plug $5,000 $5,500,000
Container Yard Gate 2 lane $250,000 $500,000
Intermodal Rail Yard 10 1000 ft wkg trk $550,000 $5,500,000
Rail spur/leads to IY & storage track 2,750 ft of track $155 $426,250
Rail switches 3 Each $25,000 $75,000
Empty Storage 5 acre $500,000 $2,500,000
Chassis Storage 0 acre $320,000 $0
Port Security & Customs 0 sf $150 $0
Maintenance ‐ General 0 sf $150 $0
Maintenance ‐ Cranes 0 sf $150 $0
Maintenance ‐ Shuttles 0 sf $150 $0
Maintenance ‐ Roadability 0 sf $150 $0
Administration Building 0 sf $225 $0
Gate Assistance 0 sf $150 $0
IY Yard Office 0 sf $150 $0
Roadability canopy 0 sf $75 $0
Marine Building 900 sf $150 $135,000
Miscellaneous Site Paving 0 acre $200,000 $0
Elect. Transformers & Switchgear 2 Each $2,000,000 $4,000,000
Subtotal Site Costs $93,314,259
Container Cranes (new) 4 each $9,500,000 $38,000,000
Container Cranes (relocated) 0 each
RTG Yard Cranes (CY & ICTF) 4 each $1,500,000 $6,000,000
ARMG Yard Cranes (CY) 18 each $2,500,000 $45,000,000
Terminal Operating Software 1 each $1,000,000 $1,000,000
Automation Software Package 1 each $500,000 $500,000
Shuttle Carriers (ARMG CY) 42 each $830,000 $34,860,000
Reach Stackers 2 each $450,000 $900,000
Yard Hostlers and Trailers 3 each $150,000 $450,000
Fork Lift Trucks 2 each $260,000 $520,000
Subtotal Major Equipment $127,230,000
Subtotal Site + Equipment $220,544,259
Planning & Design Services 5 % Site + Equip. 5% $11,027,213
Construction Admin. & Mgmt. 5 % Site + Equip. 5% $11,027,213
Subtotal Project $242,598,685
Contingency 25 % Project 25% $60,649,671
Total Estimate (2009 $) $303,248,356
Item
SITE WORK
MAJOR EQUIPMENT
TOTAL PROJECT COST ESTIMATE
Phase 3
Table 4 summarizes the cost estimate prepared for Phase 3. The total estimate for Phase 3 is $303 million.
Table 4. Alternate Concept Cost Estimate – Phase 3

FINAL Report – Chapter 5
12 | P a g e
Summary
The primary goal of creating an Alternate Concept for the development of the North Carolina International Terminal was to reduce the terminal cost estimated in the current Plan, particularly for Phase 1 start-up. TEC identified three principal concepts that should provide overall project savings and more importantly, initial capital investment savings.
The first concept is to reposition the wharf along the edge of tidal marsh area rather than along the existing bluff. This concept decreases the dredging requirements adjacent to the berth area and provides the opportunity to reclaim land, thus increasing the area available for terminal development. This also allows the wharf to be extended from 4270 ft to 4600 ft, providing additional berthing area.
Concept two is to use the excavation material from the site preparation and suitable dredge material from dredging efforts to reclaim the tidal marsh area for terminal development. This eliminates the need to haul and dispose of the excavation and dredge material, providing a significant cost savings in Phase 1.
The third concept is to initially develop the terminal utilizing RTGs for terminal operations and defer the introduction of an ARMG terminal operations system until Phase 2 of the project. This strategy will allow the terminal to minimize the initial capital costs and provide a startup system that is more flexible and compatible with the expected throughput at start-up.
The order of magnitude cost estimate for the construction of this terminal proposed in the Alternate Concept Plan is $437 million for Phase 1, followed by an additional $342 million and $303 million in Phases 2 and 3, respectively, for a total of $1,082,500,000. The Alternate Concept concludes with the installation of the ARMG terminal operations system in Phase 3. At this time, the terminal would operate with a combination of RTGs and ARMGs, giving the terminal a capacity of approximately 3,000,000 TEUs. If it is decided that yet additional throughput capacity is required to meet the demands in the future, an additional phase to retrofit the RTG terminal area with ARMGs could be implemented. However, it should be noted that sufficient berthing capacity may not be available to support this increased yard capacity. The feasibility and cost for such an effort are beyond the scope of this Task.
A detailed assessment of the differences between plans and costs outlined in the current Plan and the Alternate Concept will be provided in Chapter 6.
ATTACHMENTS:
NCIT Terminal Capacity Model
Alternate Concept – Conceptual Drawings
o Overall Site Layout
o Phase 1 Development
o Phase 2 Development
o Phase 3 Development
ATTACHMENTS
NCIT Terminal Capacity Model
ALTERNATE CONCEPT – Conceptual Drawings
Overall Site Layout
Phase 1 Development
Phase 2 Development
Phase 3 Development

Throughput Analysis
Phase 1 Phase 2 Phase 3
Total Terminal Area (acres) 154.3 235.1 302.7Length of Berth(s) 2300 3500 4600
Intermodal Yard 16.7 30.8 46.5 Admin Areas (Gate, Maintenace Areas, Parking) 36.7 51.7 56.6 MT Yard 20.0 30.0 35.0 CY 71.0 108.0 145.0 Berth 9.9 14.6 19.6
Net CY 91.0 138.0 180.0
Adjusted CY Throughput (TEUs/yr) 1,015,338 1,904,358 2,826,780
Throughput Per Acre Calulations:Throughput/Net CY/Ac/Yr. 11,158 13,800 15,704Throughpuy/Gross terminal Ac./Yr. 6,580 8,100 9,339
Equipment Allocation
% of 40' equipment 70.0% % of 20' slots in Wheeled yard 10.0%
TEUs/Move
Average Dwell Time (days)
Imports 5 5 5 Exports 7 7 7 Empties 15 13 10
Throughput Distribution
Imports 40.0% 40.0% 40.0% Exports 40.0% 40.0% 40.0% Empties 20.0% 20.0% 20.0%
Storage Modes Distribution
Imports
Terminal Capacity Model - North Carolina International terminal
1.70
NCIT Planning Study
TEC IncOct. 2009

Throughput Analysis
Phase 1 Phase 2 Phase 3 Wheeled 0.0% 0.0% 0.0% RTG 100.0% 50.0% 33.0% Top Pick 0.0% 0.0% 0.0% ASC 0.0% 50.0% 67.0% Exports Wheeled 0.0% 0.0% 0.0% RTG 100.0% 50.0% 33.0% Top Pick 0.0% 0.0% 0.0% ASC 0.0% 50.0% 67.0% Empties Wheeled 0.0% 0.0% 0.0% RTG 0.0% 0.0% 0.0% Top Pick 0.0% 0.0% 0.0% Side Pick 100.0% 100.0% 100.0% ASC 0.0% 0.0% 0.0%
Average Storage Density
Wheeled (TEU/acre) 92 Grounded RTG (TEU/acre) Grounded Top Pick (TEU/acre) 350 Grounded ASC (TEU/acre) Grounded Side Pick (TEU/acre)
Model Factors
Vessel Peaking Factor 85.00% Shape Factor 90.00% Grounded Storage Sorting Factor 75.00% Seasonal Peaking Factor 115.00%
325
555750
NCIT Planning Study
TEC IncOct. 2009

Throughput Analysis
Phase 1 Phase 2 Phase 3
Adjusted CY Throughput (TEUs/yr) 1,015,337.63 1,904,358.01 2,826,780.16
Total Area RequiredRTG 71.6 67.2 65.8ASC 0.0 39.3 78.2Empties 19 32 36
Area Available:RTG 71 71 71ASC 0 37 74.0Empties 20.0 30.0 35.0
NCIT Planning Study
TEC IncOct. 2009

ByDateDescriptionNo.
Revision or Issue
Checked
Drawn
Approved
Revision
Scale
Drawing No
Project No:
Date
Designed
619 Severn Ave., Suite 202Annapolis, MD 21403410.990.0299 * 410.990.0455 Fax
NO
RTH
CA
RO
LIN
A IN
TER
NA
TIO
NA
L TE
RM
INA
LD
RA
FT A
LTER
NA
TE C
ON
CEP
TO
VER
ALL
SIT
E LA
YOU
T
0 400' 800' 1200' 1600'
10/13/2009
1 of
1 10/15/09

ByDateDescriptionNo.
Revision or Issue
Checked
Drawn
Approved
Revision
Scale
Drawing No
Project No:
Date
Designed
619 Severn Ave., Suite 202Annapolis, MD 21403410.990.0299 * 410.990.0455 Fax
NO
RTH
CA
RO
LIN
A IN
TER
NA
TIO
NA
L TE
RM
INA
LD
RA
FT A
LTER
NA
TE C
ON
CEP
T P
HA
SE 1
LA
YOU
T
0 200' 400' 600' 800'
10/13/2009
1
2
3
4
5
6
7
8
9
10
11
12
13
2 of
1 10/15/09
15
16
17
14
18
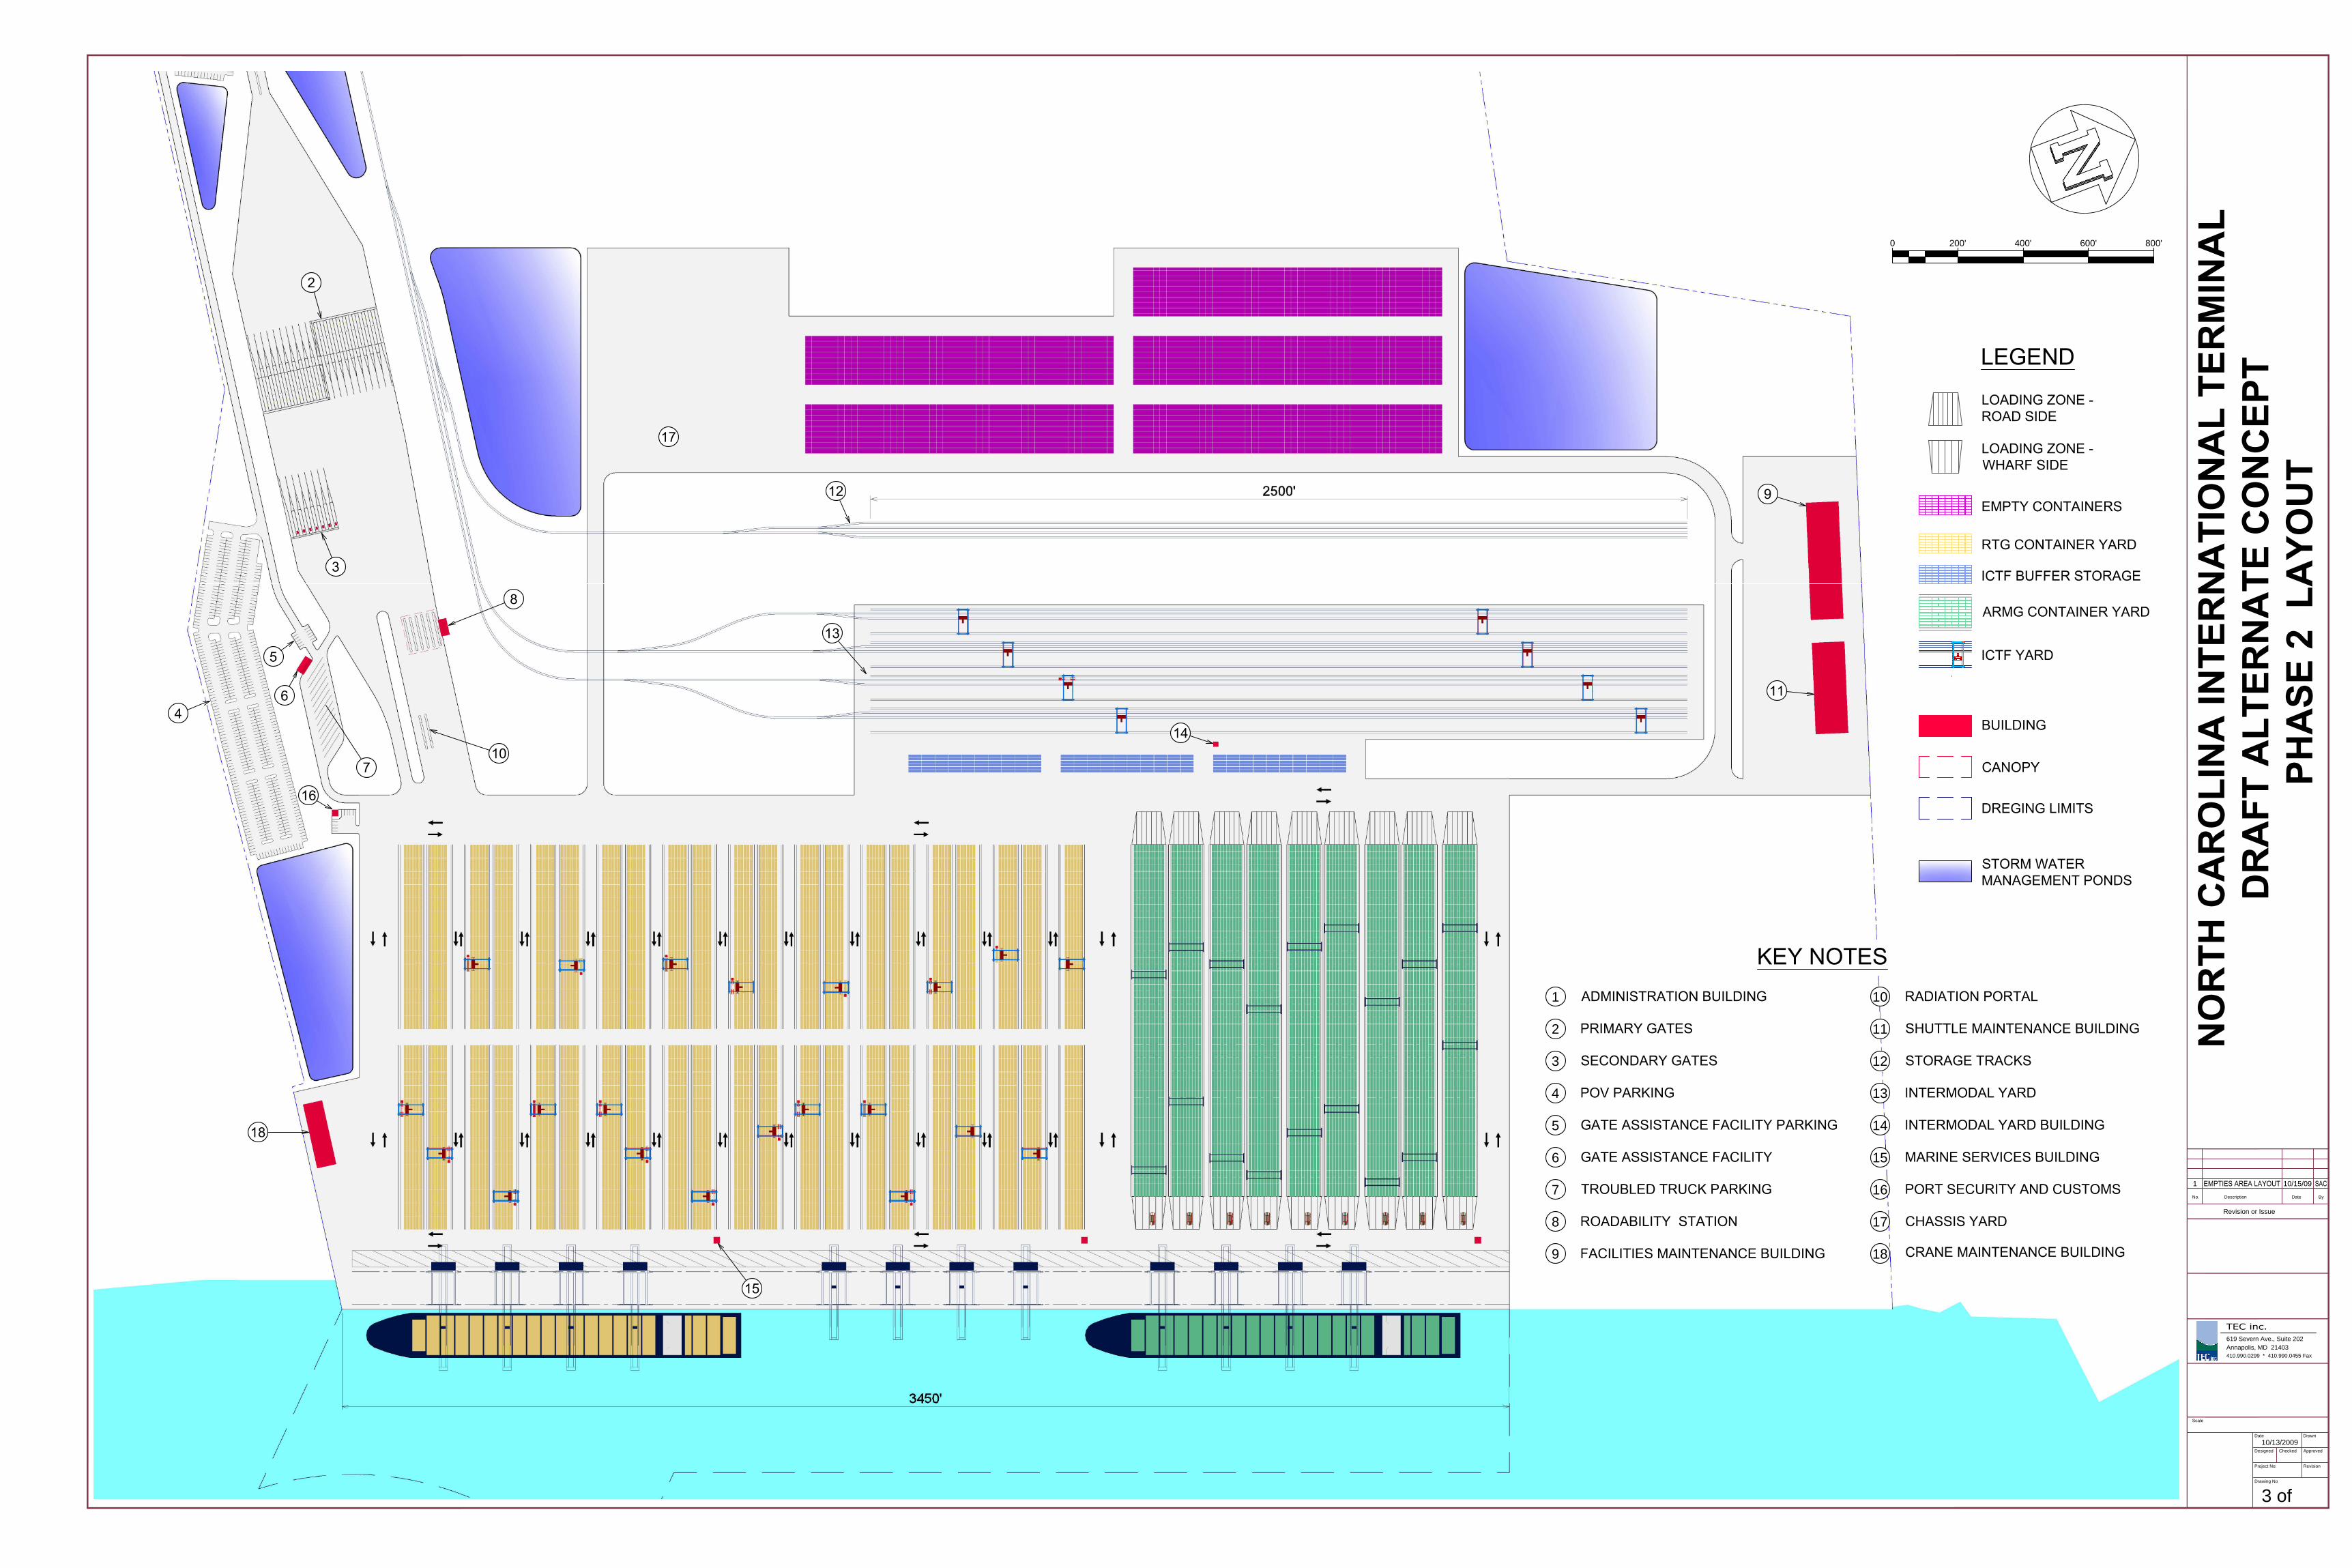
ByDateDescriptionNo.
Revision or Issue
Checked
Drawn
Approved
Revision
Scale
Drawing No
Project No:
Date
Designed
619 Severn Ave., Suite 202Annapolis, MD 21403410.990.0299 * 410.990.0455 Fax
NO
RTH
CA
RO
LIN
A IN
TER
NA
TIO
NA
L TE
RM
INA
LD
RA
FT A
LTER
NA
TE C
ON
CEP
T P
HA
SE 2
LA
YOU
T
0 200' 400' 600' 800'
1
2
3
4
5
6
7
8
9
10
11
12
13
15
16
10/13/2009
3 of
17
1 10/15/09
14
18

ByDateDescriptionNo.
Revision or Issue
Checked
Drawn
Approved
Revision
Scale
Drawing No
Project No:
Date
Designed
619 Severn Ave., Suite 202Annapolis, MD 21403410.990.0299 * 410.990.0455 Fax
NO
RTH
CA
RO
LIN
A IN
TER
NA
TIO
NA
L TE
RM
INA
LD
RA
FT A
LTER
NA
TE C
ON
CEP
TPH
ASE
3 L
AYO
UT
0 200' 400' 600' 800'
1
2
3
4
5
6
7
8
9
10
11
12
13
10/13/2009
4 of
1 10/15/09
15
16
17
14
18
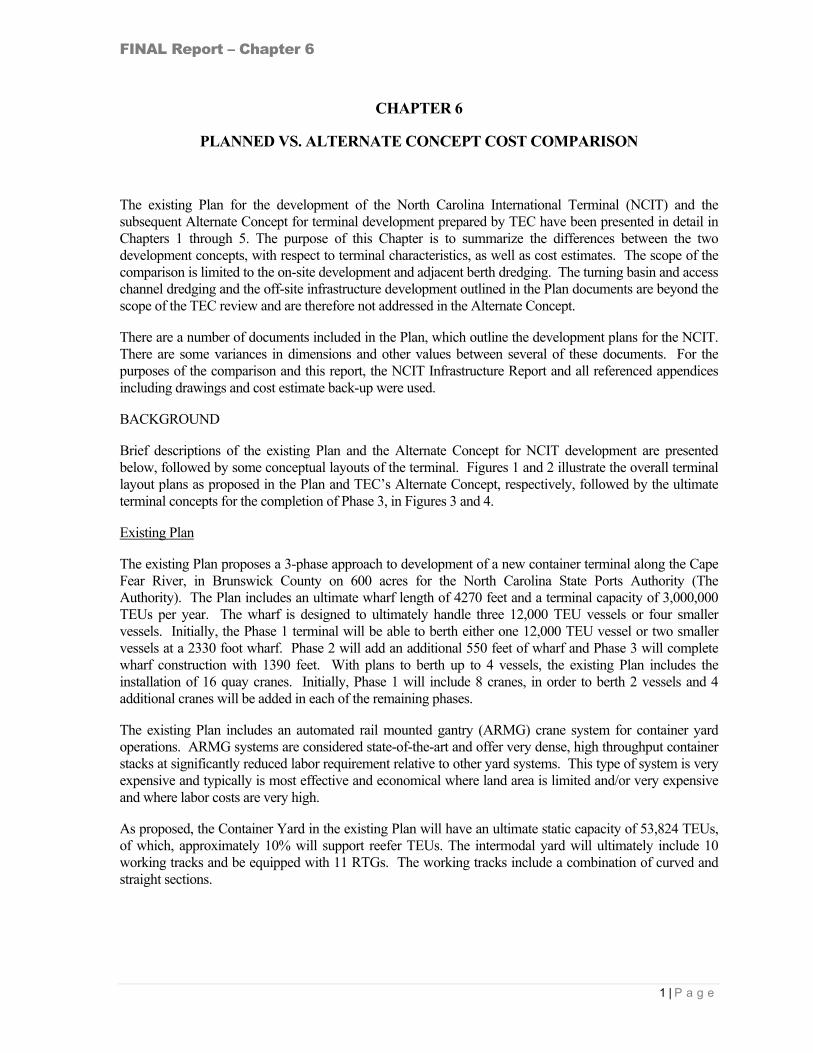
FINAL Report – Chapter 6
1 | P a g e
CHAPTER 6
PLANNED VS. ALTERNATE CONCEPT COST COMPARISON
The existing Plan for the development of the North Carolina International Terminal (NCIT) and the subsequent Alternate Concept for terminal development prepared by TEC have been presented in detail in Chapters 1 through 5. The purpose of this Chapter is to summarize the differences between the two development concepts, with respect to terminal characteristics, as well as cost estimates. The scope of the comparison is limited to the on-site development and adjacent berth dredging. The turning basin and access channel dredging and the off-site infrastructure development outlined in the Plan documents are beyond the scope of the TEC review and are therefore not addressed in the Alternate Concept.
There are a number of documents included in the Plan, which outline the development plans for the NCIT. There are some variances in dimensions and other values between several of these documents. For the purposes of the comparison and this report, the NCIT Infrastructure Report and all referenced appendices including drawings and cost estimate back-up were used.
BACKGROUND
Brief descriptions of the existing Plan and the Alternate Concept for NCIT development are presented below, followed by some conceptual layouts of the terminal. Figures 1 and 2 illustrate the overall terminal layout plans as proposed in the Plan and TEC’s Alternate Concept, respectively, followed by the ultimate terminal concepts for the completion of Phase 3, in Figures 3 and 4.
Existing Plan
The existing Plan proposes a 3-phase approach to development of a new container terminal along the Cape Fear River, in Brunswick County on 600 acres for the North Carolina State Ports Authority (The Authority). The Plan includes an ultimate wharf length of 4270 feet and a terminal capacity of 3,000,000 TEUs per year. The wharf is designed to ultimately handle three 12,000 TEU vessels or four smaller vessels. Initially, the Phase 1 terminal will be able to berth either one 12,000 TEU vessel or two smaller vessels at a 2330 foot wharf. Phase 2 will add an additional 550 feet of wharf and Phase 3 will complete wharf construction with 1390 feet. With plans to berth up to 4 vessels, the existing Plan includes the installation of 16 quay cranes. Initially, Phase 1 will include 8 cranes, in order to berth 2 vessels and 4 additional cranes will be added in each of the remaining phases.
The existing Plan includes an automated rail mounted gantry (ARMG) crane system for container yard operations. ARMG systems are considered state-of-the-art and offer very dense, high throughput container stacks at significantly reduced labor requirement relative to other yard systems. This type of system is very expensive and typically is most effective and economical where land area is limited and/or very expensive and where labor costs are very high.
As proposed, the Container Yard in the existing Plan will have an ultimate static capacity of 53,824 TEUs, of which, approximately 10% will support reefer TEUs. The intermodal yard will ultimately include 10 working tracks and be equipped with 11 RTGs. The working tracks include a combination of curved and straight sections.

FINAL Report – Chapter 6
2 | P a g e
Alternate Concept
TEC was tasked with reviewing the Plan with the intent to discern some alternate concepts that could reduce capital costs. The review focused on a number of different components, including terminal configuration, size, container yard operations, support buildings, equipment and dredging requirements. Although many of the conclusions of TEC’s assessment concurred with those developed in the Plan, there were a number of concepts identified that should offer some overall cost savings that will be particularly beneficial to the project start-up costs in Phase 1.
TEC’s Alternate Concept for terminal development is also proposed in three phases. Phase 1 is projected to provide a capacity of 1,000,000 TEUs/year. Phase 2 will provide additional capacity to 2,000,000 TEUs annually, followed by an ultimate capacity of 3,000,000 TEUs per year at the completion of Phase 3, just as the terminal proposed in The Plan.
The Alternate Concept includes land reclamation along the tidal area, which will increase the available area for terminal development by approximately 71 acres and provide on-site disposal of excess excavation material and suitable dredge material. The additional area created by repositioning the terminal provides a configuration that allows the installation of a 4600 foot wharf, a 330 foot increase over the existing Plan.
One of the other major differences outlined in the Alternate Concept is the plan for the Container Yard operations. The Alternate Concept includes the development of Phase 1 using rubber tired gantry (RTG) equipment with container stacks oriented perpendicular to the wharf and then transitioning into the installation of an ARMG system in Phases 2 and 3. It is TEC’s opinion that the ARMG type system outlined in the existing Plan requires a large investment in more capacity than is needed for start-up and in the early years of operation. As outlined in the Alternate Concept, the Container Yard will have an ultimate static capacity of 64,768 TEUs in Phase 3, of which, approximately 7% will be allotted for reefers. The intermodal yard will ultimately include 12 working tracks and be equipped with 12 RTGs. Due to the limitations of the RTGs, the proposed working tracks include only straight sections

FINAL Report – Chapter 6
3 | P a g e
FIGURE 1. NCIT EXISTING PLAN OVERALL PLAN
FIGURE 2. TEC NCIT ALTERNATE CONCEPT OVERALL PLAN

FINAL Report – Chapter 6
4 | P a g e
FIGURE 3. NCIT EXISTING PLAN PHASE 3 DEVELOPMENT
FIGURE 4. TEC NCIT ALTERNATE CONCEPT PHASE 3 DEVELOPMENT

FINAL Report – Chapter 6
5 | P a g e
Figures 1 – 4 illustrate some of the conceptual differences between the two plans, but to fully understand the implications of their differences, a number of comparisons need to be made. Table 1 focuses on the differences between the characteristics of the terminal including capacity, development area, types and numbers of equipment, types and sizes of buildings, and some of the assumptions used to establish these characterics, such as dwell time of loaded and empty containers. The primary source of The Plan numbers in Table 1 is the NCIT Infrastructure Report and associated Appendices and the source of the TEC numbers is TEC’s Chapter 5 (Interim Report 5).
THE PLAN TEC Foot notes
Phase 1 Phase 2 Phase 3 Phase 1 Phase 2 Phase 3
Total Acres 192 236 265 154 235 303 1
TEU/Year 1,135,000 2,165,000 3,000,000 1,000,000 2,000,000 3,000,000
% rail 10% 30% 50% 10% 25% 30%
% road 90% 70% 50% 90% 75% 70%
Wharf length 2,330 2,880 4,270 2,330 3,450 4,600 1
# of cranes new 8 12 16 4 8 12
# of cranes relocated 4 4 4 Container Yard
CY TEU ground slots 4,011 8,021 10,731 7,060 11,830 16,600
CY TEU's (excl. MT) 17,664 38,400 53,824 24,700 44,734 64,768 Avg. CY stacking height 4.4 4.8 5.0 3.5 3.8 3.9 2
Reefer TEU ground slots 500 1,000 1,750 567 933 1,300
Reefer TEU's 1,500 3,000 5,250 1,701 2,799 3,900 1
Avg. Reefer stacking height 3.0 3.0 3.0 3.0 3.0 3.0
Empty TEU ground slots 2,500 3,750 4,375 3
Empty TEU's 3,072 6,144 6,144 15,000 22,500 26,250 3
Avg. Empty stacking height 6 6 6 3
Empty Storage Acres 2.75 2.75 2.75 20.0 30.0 35.0 4
Density/acre 1,117 2,234 2,234 750 750 750
Total CY TEU's 20,736 44,544 59,968 39,700 67,234 91,018
Net CY TEU's excl. empty 17,664 38,400 53,824 24,700 44,734 64,768
Average dwell imports 5.0 5.2 5.0 5 5 5 5
Average dwell exports 3.3 3.6 2.7 7 7 7 5
Average dwell empty 7.0 7.0 5.0 15 13 10 5
IY Yard
# of loading tracks 2 7 10 4 8 12
Track length ft. 7,320 25,620 36,600 10,000 20,000 30,000
Gate lanes ? 20 20 14 20 26 6
Total CY acres 61.0 105.0 134.0 91 138 180 1
TEU/acre 18,607 20,619 22,388 11,158 13,800 15,704
Containers/acre 10,945 12,129 13,169 6,563 8,118 9,238
TABLE 1. NCIT Terminal Characteristics Comparison

FINAL Report – Chapter 6
6 | P a g e
THE PLAN TEC Foot
notes Phase 1 Phase 2 Phase 3 Phase 1 Phase 2 Phase 3
Equipment
Marine
RMG's 24 48 64 0 18 36
RTG's 21 21 21
Hustlers/bombcarts 53 53 53
Translifter 33 49 65
Shuttle carriers 0 31 62
Reach stackers 12 12 12
Empty handlers 2 5 5 10 20 30
IY
RTG's 5 10 11 4 8 12
Hustlers/bombcarts 14 14 17
Shuttle carriers 0 8 19 Reach stackers/tpldr's 2 4 5 2 4 6
Buildings
Administration 27,900 27,900 27,900 28,000 28,000 28,000 Maintenance
General 15,000 30,000 30,000 15,000 30,000 30,000
Straddle 13,800 27,600 27,600 27,600 27,600
Crane 6,000 12,000 12,000 6,000 12,000 12,000
Roadability 900 900 900 800 800 800
Total maint. 35,700 70,500 70,500 21,800 70,400 70,400
Roadability canopy 2,550 2,550 2,550 12,000 12,000 12,000
Marine building 3,600 3,600 3,600 3,600 3,600 3,600
Gate assistance 250 250 250 250 500 500
IY Yard Office 250 500 500 Customs & security 1,070 1,070 1,070 1,200 1,200 1,200
Total square feet 71,070 105,870 105,870 67,100 116,200 116,200
1. Some of the components in The Plan vary between a number of Plan documents. The values that are supported in the Infrastructure Report and corresponding Appendices were used for comparison purposes, since the cost estimate and backup documents appear to be based on this document.
2. The average stacking height for the Alternate Concept RTG stacks is assumed to be 3.5. The average height of the Alternate Concept ARMG stacks is assumed to be 4.2. The 3.8 and 3.9 values in average stacking height are the result of including the 3.5 average stacking height in the RTG yard in the cumulative average height calculations for Phases 2 and 3.
3. The Yard Capacity calculations included in The Plan’s Infrastructure Report Appendix 7, only include total number of empty TEUs by phase. The stacking height and ground TEUs are not included in The Plan’s Yard Calculations worksheet.
4. The Plan includes a total of 2.75 acres for the storage of empties and chassis. For the purposes of this table, it was assumed that all of the storage area would be available for the empties.
5. The Plan’s average dwell times were obtained from The Plan data interpolated by PFRA.
6. Based on the cost estimate prepared for The Plan, it appears that all gate costs will be incurred by Phase 2, but it is not clear how much will be completed in Phase 1. Note: The totals for Phases 2 and 3 are cumulative values for each line item.

FINAL Report – Chapter 6
7 | P a g e
As seen in Table 1, the estimated TEUs per year for both plans are comparable. However, some of the input factors used to determine the annual throughput capacity are quite different. Below is a discussion on the comparison of a number of the factors referenced and/or calculated in Table 1.
Total Acres - Table 1 indicates that The Plan requires more upfront development in Phase 1 than the Alternate Concept. However, at the end of completion of Phase 3, the Alternate Concept will include more developed acres. This is partially attributable to the increased terminal size associated with the relocation of the wharf in the Alternate Concept. In Phase 1, the Alternate Concept requires a larger container yard than the existing Plan, since inherently RTG systems require more space to achieve the same throughput of an ARMG system. Also, the Alternate Concept includes more on-site storage space for empties and chassis and more miscellaneous pavement for parking, gate, etc.
Wharf Length - The difference in wharf length is attributed to the relocation of the wharf in the Alternate Concept. The land reclamation effort will allow the construction of the overall wharf length to be extended by 330 feet.
Dwell times - The dwell times included in Table 1 represent assumptions made by TEC, based on their general planning practices and values interpolated by PFRA for The Plan’s averages, based on other data in the planning documents. These values have a significant impact on the calculated capacity of the storage and container yards. Shorter dwell times increase the calculated capacity. To provide an apples-to-apples comparison, both plans should be based on the same input factors, as deemed appropriate for the expected conditions.
Container Yard (CY) - In addition to dwell times, container stacking height is an important input factor when calculating terminal capacity. Typically, ARMG systems can operate efficiently with higher stacks than RTG systems, which is reflected in the difference in stacking heights in Phase 1. In Phases 2 and 3 the Alternate Concept assumes a stacking height of 4.2 for the ARMG systems compared to the average stacking height of 4.7 for the comparable ARMG systems in the existing Plan. Therefore, the calculated CY capacity is not an actual apples-to-apples comparison. There is also a difference in the plans for reefer distribution throughout the yard. Although the number of proposed reefers is comparable, the Alternate Concept includes the distribution of reefers throughout all of the stacks, whereas the existing Plan assumes two adjacent entire ARMG stacks of reefers. This configuration can be inefficient when reefers are not present.
Empties - The Plan identifies only 2.75 acres for the on-site storage of empties and chassis. It is assumed that the Plan includes additional storage off-site, but it is not clear what provisions have been made for off-site storage. For the purposes of comparison, only the on-site storage has been included in Table 1.
Equipment and Buildings - Both plans include the same number of quay cranes in each phase. The only difference between the plans is the proposal in the TEC Alternate Concept to relocate and modify the 4 existing cranes from Wilmington to the NCIT as a means of providing 8 cranes in Phase 1. The remainder of the equipment differences noted in Table 1 are predominantly related to the concept of installing RTGs in Phase 1 (Alternate Concept) vs. installing an ARMG system (The Plan) for container yard operations. This will be further discussed in the cost estimate comparison. For the purposes of comparison, the number, types and sizes of buildings included in both plans are considered comparable.
Both terminal development concepts include a cost estimate to construct the NCIT, based on the plans illustrated in Figs 1-4, and the characteristics listed in Table 1. The estimates for each concept are included in the Attachments. The line items and level of detail vary for the two development concepts and therefore Table 2 was developed to provide a cost summary comparison. It should be noted that the costs included in Table 2 are not cumulative costs for Phases 2 and 3. All listed costs will be incurred in the respective phase.
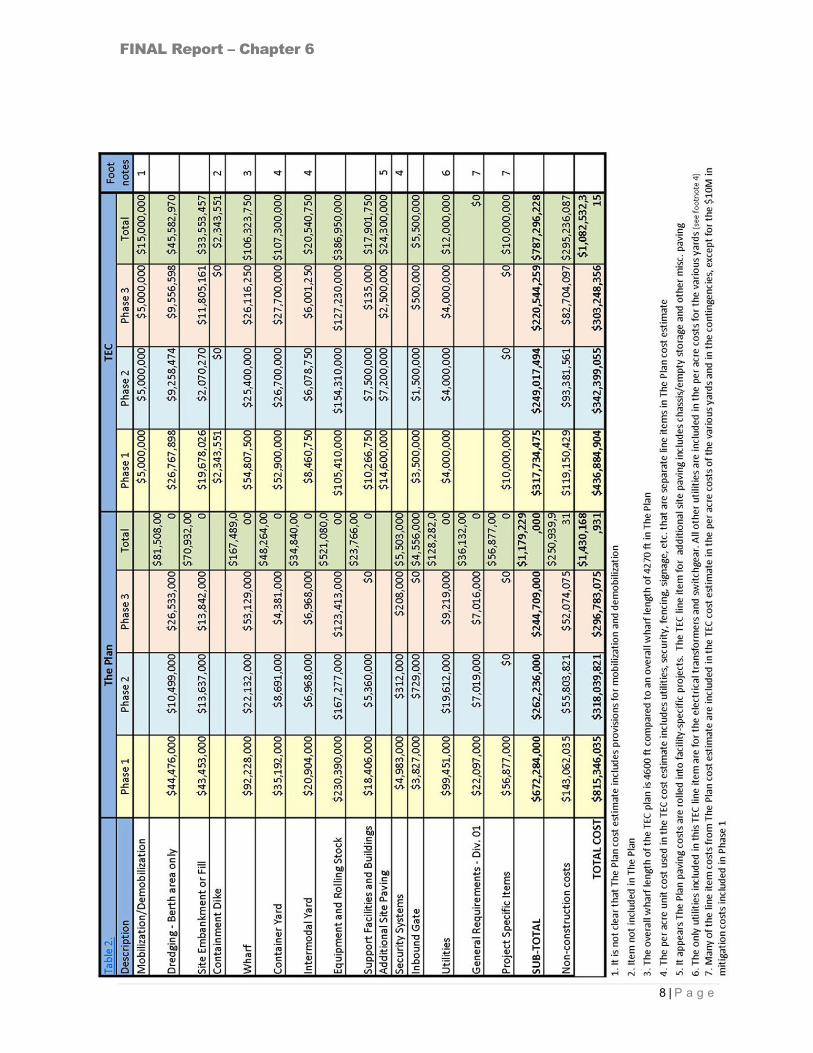
FINAL Report – Chapter 6
8 | P a g e

FINAL Report – Chapter 6
9 | P a g e
As seen in the Total Costs summarized in Table 2, the major cost difference is noted in Phase 1 development. In Phase 1, the existing Plan Total Cost is more than twice the Alternate Concept Total Cost. However, in Phases 2 and 3, the Total Cost differences are 7.6% and 2%, respectively with the Alternate Plan slightly higher in Phase 2 and slightly lower in Phase 3.
As mentioned previously, the line items in the attached cost estimates do not allow for an apples-to-apples comparison and therefore the costs are summarized in Table 2, for comparison purposes. To determine the origin of the costs included in each Table 2 line item, Table 3 was created to summarize the components used from each cost estimate in the Attachment to establish the comparison values listed in Table 2. Column 1 lists each line item from Table 2. Columns 2 and 3 list the cost estimate components from the attached Existing Plan and TEC cost estimates, respectively, used to develop the comparison estimates presented in Table 2.
Description Line Item
From Existing Plan Cost Estimate
From Alternate Concept
Cost Estimate (TEC)
Dredging – Berth Only Dredging – Berth Only Berth Dredging
Site Embankment or Fill Site Embankment or Fill
Mobilization/Demobilization Clearing and grubbing Excavation Excavation material disposal
Containment Dike N/A Containment Dike Leveling Fill Behind Dike
Wharf Wharf Marginal Wharf Apron
Container Yard Container Yard Container Yard Reefer Yard
Intermodal Yard Intermodal Yard
Intermodal Rail Yard Rail spur/leads to IY and storage tracks
Rail Switches
Equipment and rolling stock Equipment and rolling stock All Major Equipment
Support Facilities and Buildings Support Facilities and Buildings
Port Security and Customs All Maintenance facilities Gate Assistance IY Yard Office Roadability canopy Marine Building
TABLE 3. Origin of Costs Used to Develop Cost Comparison Table
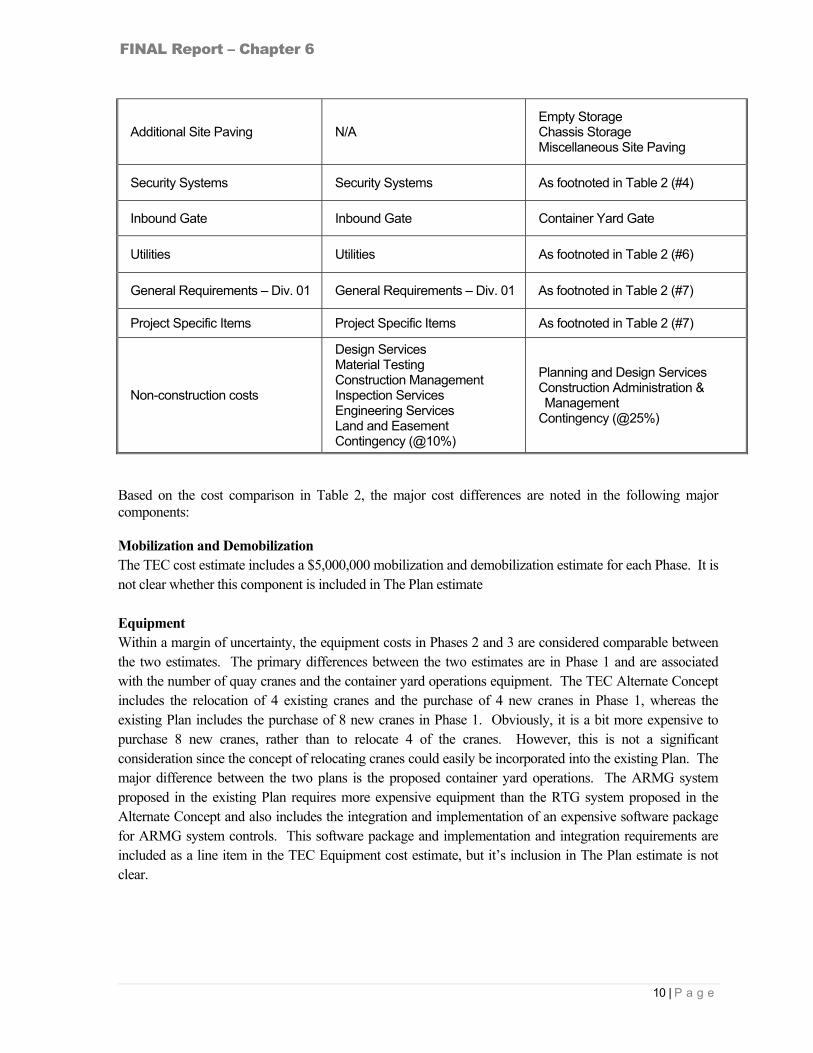
FINAL Report – Chapter 6
10 | P a g e
Additional Site Paving N/A Empty Storage Chassis Storage Miscellaneous Site Paving
Security Systems Security Systems As footnoted in Table 2 (#4)
Inbound Gate Inbound Gate Container Yard Gate
Utilities Utilities As footnoted in Table 2 (#6)
General Requirements – Div. 01 General Requirements – Div. 01 As footnoted in Table 2 (#7)
Project Specific Items Project Specific Items As footnoted in Table 2 (#7)
Non-construction costs
Design Services Material Testing Construction Management Inspection Services Engineering Services Land and Easement Contingency (@10%)
Planning and Design Services Construction Administration & Management
Contingency (@25%)
Based on the cost comparison in Table 2, the major cost differences are noted in the following major components:
Mobilization and Demobilization The TEC cost estimate includes a $5,000,000 mobilization and demobilization estimate for each Phase. It is not clear whether this component is included in The Plan estimate Equipment Within a margin of uncertainty, the equipment costs in Phases 2 and 3 are considered comparable between the two estimates. The primary differences between the two estimates are in Phase 1 and are associated with the number of quay cranes and the container yard operations equipment. The TEC Alternate Concept includes the relocation of 4 existing cranes and the purchase of 4 new cranes in Phase 1, whereas the existing Plan includes the purchase of 8 new cranes in Phase 1. Obviously, it is a bit more expensive to purchase 8 new cranes, rather than to relocate 4 of the cranes. However, this is not a significant consideration since the concept of relocating cranes could easily be incorporated into the existing Plan. The major difference between the two plans is the proposed container yard operations. The ARMG system proposed in the existing Plan requires more expensive equipment than the RTG system proposed in the Alternate Concept and also includes the integration and implementation of an expensive software package for ARMG system controls. This software package and implementation and integration requirements are included as a line item in the TEC Equipment cost estimate, but it’s inclusion in The Plan estimate is not clear.

FINAL Report – Chapter 6
11 | P a g e
Dredging The difference in dredging costs noted in Table 2 is a little more than expected. There would be some cost savings expected from the relocation of the terminal berth face from the bluff in the existing Plan to the tidal area in the Alternate Concept due to the surface elevation differences in the areas to be dredged, and some additional savings associated with a narrower dredge area in the Alternate Concept. However, some differences may also be attributed to differences in assumptions used in calculating dredge quantities. The Alternate Concept will provide some cost-savings with respect to dredging, but it may be less than projected in Table 2. Sitework The configuration of the terminal is one of the major differences between the two plans. In the Alternate Concept, the land reclamation effort requires the creation of a containment dike and placement of fill in the area to raise the reclaimed area to the required elevation. The reclaimed area creates an additional 71 acres for terminal development and an additional 330 lf of wharf. This area becomes a site for the disposal of excavation material and suitable dredge material, which eliminates the need to haul and dispose of this material. This is a savings of over $20 million dollars over the existing Plan. Container Yard As noted in Table 2, the line item comparison for the Container Yard is not an apples-to-apples comparison. The TEC unit cost estimate includes other components, such as utilities, lighting, fencing, signage, etc. that are separate line items in the existing Plan cost estimate. The major Container Yard differences are noted under the Equipment for Container Yard operations discussion, above.
Intermodal Yard There are several differences between the two plans to note in the Intermodal Yard. First, the unit cost for track is nearly $100 more per foot in The Plan estimate than in the TEC estimate. The $250 per foot estimate seems a bit excessive to TEC, especially when considering the lower labor costs associated with the Brunswick County region of North Carolina. This per unit cost difference coupled with the fact that The Plan includes 70,592 feet of New Track and the TEC concept includes a total of 27,650 feet of track in Phase 1, has created a significant disparity between the two estimates that should be further investigated. As indicated previously, the existing Plan includes working tracks with a combination of straight and curved segments. Although this Plan provides longer working tracks than those proposed in the TEC Alternate Concept, TEC does not consider the utilization of RTGs with any curved sections of track a viable option and therefore limits the working tracks to the straight sections provided by the configuration.
Non-construction items In Phases 2 and 3, the Alternate Concept cost estimate has significantly higher non-construction costs than the existing Plan. This is primarily due to the higher contingency included in the TEC cost estimate to cover some of the General Requirements and Project Specific items included in the corresponding existing Plan line items. Without all of the background data that was available to the consultants during the initial development of The Plan, TEC used a contingency of 25% to cover ancillary components, rather than the 10% used in The Plan. This difference in contingencies is applicable in Phase 1 as well, but is not obvious due to the much higher cost of The Plan’s Phase 1 estimate. By utilizing a percentage of the construction

FINAL Report – Chapter 6
12 | P a g e
cost estimate to establish an estimate for the non-construction costs, the disparity between the Phase 1 construction costs has skewed the difference between the non-construction costs.
Summary
Based on the differences utilized in the development of the cost estimates prepared in the Plan and TEC’s Alternate Concept, it is difficult to perform an actual apples-to-apples comparison on a number of the project components. However, when comparing the overall costs for the major components, the impacts of several of the conceptual differences between the terminal development plans become evident.
The results of the Phases 2 and 3 comparison indicates the conceptual development plans are comparable, as would be expected due to their similarities. Most of the differences noted in this report for Phases 2 and 3 are primarily due to margins of uncertainty in the cost estimating process and basically boil down to cost estimating accuracies. The cost estimate prepared by TEC in Task 5 was intended as an order of magnitude cost estimate in order to outline some alternate concepts for terminal development that would offer some cost-savings. There are no major concept changes in Phases 2 and 3 that need to be further addressed in this report. The only conclusion from the differences noted in the cost estimates for Phases 2 and 3 is that the preparation of the cost estimate during the design phase of terminal development should consider the cost items included in both cost estimates presented in the Attachments to ensure all major components are included, regardless of which terminal development concept proceeds to design.
The major distinctions between the existing Plan and the Alternate Concept are noted in Phase 1, where TEC has outlined a number of cost-saving concepts that allow the project to be constructed and brought on-line at a more attractive initial investment. These concepts include repositioning the wharf along the edge of the tidal marsh area, rather than along the bluff, as proposed in the existing Plan. This requires the construction of a containment dike and placement of fill material, which eliminates the costly expense of hauling excavation material and suitable dredge material away from the site. This concept creates over 70 acres of additional property for terminal development. Additionally, the terminal layout has been expanded to allow adequate space for the storage of empties and chassis on site. The realignment of the terminal in the Alternate Concept also allows for construction of a longer wharf, with 330 feet of additional wharf for the berthing of vessels. The final concept that allows Phase 1 capital costs to be minimized and more compatible with the start-up conditions is the development of container yard operations utilizing RTGs, rather than ARMGs. TEC concurs that by the time the terminal is approaching Phase 1 capacity, the development of the remainder of the terminal would be most effective as an ARMG system. Again, the cost estimate prepared by TEC in Task 5 was intended as an order of magnitude cost estimate to allow the development plans to be compared. As seen in the relative similarities in the cost estimates prepared for both development concepts in Phases 2 and 3, the cost-saving concepts proposed in the TEC Alternate Concept will offer substantial savings in Phase 1 over the existing NCIT development Plan.
ATTACHMENTS:
The Plan Cost Estimate
Alternate Concept Cost Estimate

Project: North Carolina International Terminal, Wilmington, NC Estimator: Pete BredehoeftClient: North Carolina Ports Authority Q.C Reivewer: Denny Stoddard, Lee Lindig, Rob EdgertonLocation: Wilmington, NC Estimate Rev Date: Rev 01 - May 27, 2008
Rev. 04 - June 27, 2008 PRBCapital Project Estimate
Construction Estimate USE THIS OR THIS
Category ID Description % Phase 1 - 2015 Phase 2 - 2019 Phase 3 - 2022Current Estimate
Total (2008 $)
Estimating Contingency
(2008 $)Non-Construction
$ (2008$)Total Project Cost
(2008 $)
Construction Escalation (Future
$)
Non-Construction Escalation (Future
$)Total Project Costs
(Future $)
A Container Terminal2 Dredging - Berthing Area Only 44,476,000$ 10,499,000$ 26,533,000$ 81,508,000$ 8,151,000$ 9,198,000$ 98,857,000$ 71,712,000$ 2,584,000$ 173,153,000$ 3 Site Embankment or Fill 43,453,000$ 13,637,000$ 13,842,000$ 70,932,000$ 7,093,000$ 8,005,000$ 86,030,000$ 62,407,000$ 2,248,000$ 150,685,000$ 4 Quay or Wharf 92,228,000$ 22,132,000$ 53,129,000$ 167,489,000$ 16,749,000$ 18,901,000$ 203,139,000$ 147,359,000$ 5,309,000$ 355,807,000$ 5 Container Yard 35,192,000$ 8,691,000$ 4,381,000$ 48,264,000$ 4,826,000$ 5,447,000$ 58,537,000$ 42,463,000$ 1,530,000$ 102,530,000$ 6 Intermodal Yard 20,904,000$ 6,968,000$ 6,968,000$ 34,840,000$ 3,484,000$ 3,932,000$ 42,256,000$ 30,653,000$ 1,104,000$ 74,013,000$ 11 Equipment & Rolling Stock 230,390,000$ 167,277,000$ 123,413,000$ 521,080,000$ 52,108,000$ 58,804,000$ 631,992,000$ 458,453,000$ 16,517,000$ 1,106,962,000$ 12 Support Facilities and Buildings 18,406,000$ 5,360,000$ -$ 23,766,000$ 2,377,000$ 2,682,000$ 28,825,000$ 20,910,000$ 753,000$ 50,488,000$ 13 Security Systems 4,983,000$ 312,000$ 208,000$ 5,503,000$ 550,000$ 621,000$ 6,674,000$ 4,841,000$ 174,000$ 11,689,000$ 14 Inbound Gate 3,827,000$ 729,000$ -$ 4,556,000$ 456,000$ 514,000$ 5,526,000$ 4,009,000$ 144,000$ 9,679,000$ 17 Utilities - Include Valves and Appurtenances 99,451,000$ 19,612,000$ 9,219,000$ 128,282,000$ 12,828,000$ 14,477,000$ 155,587,000$ 112,864,000$ 4,066,000$ 272,517,000$ 18 General Requirements - Div 01 22,097,000$ 7,019,000$ 7,016,000$ 36,132,000$ 3,613,000$ 4,077,000$ 43,822,000$ 31,789,000$ 1,145,000$ 76,756,000$ 20 Project Specific Items 56,877,000$ -$ -$ 56,877,000$ 5,688,000$ 6,419,000$ 68,984,000$ 50,042,000$ 1,803,000$ 120,829,000$
Total Container Terminal $ 672,284,000 $ 262,236,000 $ 244,709,000 $ 1,179,229,000 $ 117,923,000 $ 133,077,000 $ 1,430,229,000 $ 1,037,502,000 $ 37,377,000 $ 2,505,108,000
B Roadway & Bridges9 Access Roadway 194,724,000$ -$ -$ 194,724,000$ 19,472,000$ 21,975,000$ 236,171,000$ 171,321,000$ 6,172,000$ 413,664,000$ 10 Access Roadway Bridges 20,328,000$ -$ -$ 20,328,000$ 2,033,000$ 2,294,000$ 24,655,000$ 17,885,000$ 644,000$ 43,184,000$
Total Roadway & Bridges $ 215,052,000 $ - $ - $ 215,052,000 $ 21,505,000 $ 24,269,000 $ 260,826,000 $ 189,206,000 $ 6,816,000 $ 456,848,000
C Rail Line & Bridges7 Rail Line 26,897,000$ 8,966,000$ 8,966,000$ 44,829,000$ 4,483,000$ 5,059,000$ 54,371,000$ 39,441,000$ 1,421,000$ 95,233,000$ 8 Rail Bridges 15,177,000$ -$ -$ 15,177,000$ 1,518,000$ 1,713,000$ 18,408,000$ 13,353,000$ 481,000$ 32,242,000$
Total Rail Line & Bridges $ 42,074,000 $ 8,966,000 $ 8,966,000 $ 60,006,000 $ 6,001,000 $ 6,772,000 $ 72,779,000 $ 52,794,000 $ 1,902,000 $ 127,475,000
D Dredging by Others2 Access Channel and Turning Basin $ 105,804,000 105,804,000$ 10,580,000$ 11,940,000$ 128,324,000$ 93,087,000$ 3,354,000$ 224,765,000$ 2 Main Channe $ 455,952,000 455,952,000$ 45,595,000$ 51,454,000$ 553,001,000$ 401,152,000$ 14,452,000$ 968,605,000$
Dredging by Others $ 561,756,000 $ 561,756,000 $ 56,175,000 $ 63,394,000 $ 681,325,000 $ 494,239,000 $ 17,806,000 $ 1,193,370,000
E Project Development CostsEngineering and Planning Services $ 5,000,000 5,000,000$ 500,000$ 564,000$ 6,064,000$ 4,399,000$ 158,000$ 10,621,000$ Pre-Design Services $ 10,000,000 10,000,000$ 1,000,000$ 1,128,000$ 12,128,000$ 8,798,000$ 317,000$ 21,243,000$ Permitting $ 45,000,000 45,000,000$ 4,500,000$ 5,078,000$ 54,578,000$ 39,591,000$ 1,426,000$ 95,595,000$
Total Project Development Costs $ 60,000,000 $ 60,000,000 $ 6,000,000 $ 6,770,000 $ 72,770,000 $ 52,788,000 $ 1,901,000 $ 127,459,000
Total Construction Estimate (2008 $)without Contingency and Escalation 1,551,166,000$ 271,202,000$ 253,675,000$ 2,076,043,000$ 207,604,000$ 234,282,000$ 2,517,929,000$ 1,826,529,000$ 65,802,000$ 4,410,260,000$
Check Math 2,016,039,000$ Estimating Contingency - Based Upon DesignLevel - 10% 10% 155,117,000$ 27,120,000$ 25,368,000$ 207,605,000$
Total Construction Cost With Contingency (2008 $ 1,706,283,000$ 298,322,000$ 279,043,000$ 2,283,648,000$
Non-construction CostsDesign Services 2.5% 69,599,000$ 15,512,000$ 17,644,000$ 102,755,000$ Material Testing 0.2% 5,568,000$ 1,241,000$ 1,412,000$ 8,221,000$ Construction Management Serv During Const 1.0% 27,839,000$ 6,205,000$ 7,058,000$ 41,102,000$ Inspection Services During Construction 1.5% 41,759,000$ 9,307,000$ 10,586,000$ 61,652,000$ Engineering Services During Construction 0.5% 13,920,000$ 3,102,000$ 3,529,000$ 20,551,000$ Land and Easements 0.0% -$ -$ -$ -$
Total Non- Construction Cost with Escalation (2008 $ 5.7% 158,685,000$ 35,367,000$ 40,229,000$ 234,281,000$
Total Project or Capital Cost (2008 $) 1,864,968,000$ 333,689,000$ 319,272,000$ 2,517,929,000$
Escalation To Mid-Point of Construction 1,077,663,000$ 322,158,000$ 426,709,000$ 1,826,530,000$
Total Construction Cost with Escalation (Future 2,783,946,000$ 620,480,000$ 705,752,000$ 4,110,178,000$
Escalation on Non-Construction - 5% 7,934,000$ 22,242,000$ 35,629,000$ 65,805,000$ Total Non-construction Costs (Future 5.7% 166,619,000$ 57,609,000$ 75,858,000$ 300,086,000$
Total Project or Capital Cost (Future $) 2,950,565,000$ 678,089,000$ 781,610,000$ 4,410,264,000$
Current Estimate June 2008

Project: North Carolina International Terminal, Wilmington, NC Estimator: Pete BredehoeftClient: North Carolina Ports Authority Q.C Reviewer: Denny Stoddard, Lee Lindig, Rob EdgertonLocation: Wilmington, NC Estimate Rev Date: Rev 04 - June 27, 2008 - PRB
Estimate: Construction Cost Estimate
Report: Detailed Report
Item No.WBS Code Description Quantity Unit Unit Price Total Quantity Unit Unit Price Total Quantity Unit Unit Price Total Quantity Unit Unit Price Total
1. 02 Dredging2. Berthing Area3. Rock 693,543 CY 35.40$ 24,549,353$ 163,712 CY 35.40$ 5,794,912$ 413,745 CY 35.40$ 14,645,322$ 1,271,000 CY 35.40$ 44,989,587$ 4. Silt Clamshell 3,600,859 CY 4.13$ 14,866,148$ 849,988 CY 4.13$ 3,509,177$ 2,148,152 CY 4.13$ 8,868,646$ 6,599,000 CY 4.13$ 27,243,972$ 5. Clay Clamshell 982,201 CY 5.15$ 5,060,302$ 231,850 CY 5.15$ 1,194,492$ 585,948 CY 5.15$ 3,018,807$ 1,800,000 CY 5.15$ 9,273,600$ 6. Beach Fill - - - - CY -$ 7. Port Basin Subtotal 5,276,604 CY 8.43$ 44,475,803$ 10,498,580$ 3,147,845 CY -$ 26,532,775$ 9,670,000 CY 8.43$ 81,507,159$
8. Access Channel and Turning Basin9. Rock 1,580,000 CY 35.40$ 55,927,260$ -$ - CY -$ -$ 1,580,000 CY 35.40$ 55,927,260$ 10. Silt Clamshell 8,960,000 CY 4.13$ 36,991,360$ -$ - CY -$ -$ 8,960,000 CY 4.13$ 36,991,360$ 11. Clay Clamshell 2,501,000 CY 5.15$ 12,885,152$ -$ - CY -$ -$ 2,501,000 CY 5.15$ 12,885,152$ 12. Beach Fill - - - - CY -$ 13. Port Basin Subtotal 13,041,000 CY 8.11$ 105,803,772$ - -$ -$ - CY -$ -$ 13,041,000 CY 8.11$ 105,803,772$ 14.15. Main Channel16. Rock 546,000 CY 35.40$ 19,326,762$ -$ - CY -$ -$ 546,000 CY 35.40$ 19,326,762$ 17. Beach Fill Hydraulic 4,709,000 CY 8.11$ 38,178,218$ -$ - CY -$ -$ 4,709,000 CY 8.11$ 38,178,218$ 18. Beach Fill Hydraulic (Booster) 20,660,000 CY 11.56$ 238,777,950$ -$ - CY -$ -$ 20,660,000 CY 11.56$ 238,777,950$ 19. Beach Fill Hopper 8,883,000 CY 12.90$ 114,617,349$ -$ - CY -$ -$ 8,883,000 CY 12.90$ 114,617,349$ 20. Unsuitable Hopper (Nearshore) 2,771,000 CY 3.76$ 10,420,346$ -$ CY -$ 2,771,000 CY 3.76$ 10,420,346$ 21. Unsuitable Hopper (Offshore) 8,009,000 CY 4.32$ 34,630,916$ -$ - CY -$ -$ 8,009,000 CY 4.32$ 34,630,916$ 22. Main Channel Subtotal 45,578,000 CY 10.00$ 455,951,540$ -$ - CY -$ -$ 45,578,000 CY 10.00$ 455,951,540$ 23. Total 63,895,604 CY 9.49$ 606,231,115$ - - 10,498,580$ 3,147,845 CY - 26,532,775$ 68,289,000 CY 9.42$ 643,262,471$ 24.25.26. 03 Sitework Embankment or Fill
27.Studies: Light Polution, Noise Polution Plans 198 AC 678.39$ 134,321$ 44 AC 1,526.59$ 67,170$ 29 AC 2,316.07$ 67,166$ 271 AC 991.36$ 268,657$
28. Storm Water Pollution Plan 198 AC 847.99$ 167,902$ 44 AC 2,289.91$ 100,756$ 29 AC 3,474.14$ 100,750$ 271 AC 1,363.13$ 369,408$ 29. Clearing and Grubbing 198 AC 6,199.25$ 1,227,452$ 63 AC 5,377.52$ 338,784$ 78 AC 5,750.12$ 448,509$ 339 AC 5,943.20$ 2,014,745$ 30. Excavation - Cut 1,781,492 CY 8.45$ 15,053,607$ 516,374 CY 8.45$ 4,364,090$ 516,374 CY 8.45$ 4,363,839$ 2,814,240 CY 8.45$ 23,781,536$ 31. Backfill - Fill 970,723 CY 3.36$ 3,261,629$ 295,974 CY 3.58$ 1,059,183$ 295,974 CY 3.58$ 1,059,120$ 1,562,671 CY 3.44$ 5,379,932$
32.
Disposal of None-Suitable Soil - Offsite - Assumed 20 Miles Round Trip - 10 Miles One Way 888,224 CY 23.62$ 20,982,730$ 296,075 CY 23.63$ 6,995,271$ 296,075 CY 23.63$ 6,994,853$ 1,480,374 CY 23.62$ 34,972,854$
33. Sedimentation/Erosion Control 198 AC 929.38$ 184,017$ 63 AC 1,201.40$ 75,688$ 78 AC 813.82$ 63,478$ 339 AC 953.34$ 323,183$ 34. Landscaping and Mitigation 198 AC 12,329.90$ 2,441,320$ 63 AC 10,090.52$ 635,703$ 78 AC 9,543.17$ 744,367$ 339 AC 11,272.54$ 3,821,390$ 35. Total 198 AC 219,459.49$ 43,452,980$ 63 AC 216,454.67$ 13,636,645$ 78 AC 177,462.59$ 13,842,082$ 271 AC 261,740.61$ 70,931,705$ 36.37.38. 04 Quay or Wharf
39.Wharf Studies: Seismic, Wave Surge, Tide, etc. 2,330 LF 804.71$ 1,874,969$ 550 LF 1,352.51$ 743,880$ 1,390 LF 324.95$ 451,676$ 4,270 LF 804.71$ 3,070,525$
40. Piles/Beams/Slabs, Caps 2,330 LF 34,373.74$ 80,090,811$ 550 LF 34,603.62$ 19,031,989$ 1,390 LF 33,581.85$ 46,678,774$ 4,270 LF 34,373.74$ 145,801,574$ 41. Fenders/Moorings 2,330 LF 2,210.76$ 5,151,071$ 550 LF 2,161.60$ 1,188,881$ 1,390 LF 2,185.66$ 3,038,071$ 4,270 LF 2,210.76$ 9,378,023$ 42. Slope Protection 2,330 LF 2,193.66$ 5,111,228$ 550 LF 2,122.87$ 1,167,581$ 1,390 LF 2,129.55$ 2,960,076$ 4,270 LF 2,193.66$ 9,238,885$
Phase 1 (198 AC, 2,330 LF Wharf) Phase 2 (44 AC, 550 LF Wharf) Phase 3 (29 AC, 1,390 LF Wharf) Total Build Out (Current Est)
Estimate Data Date: May 2008 Page 1 of 7

Project: North Carolina International Terminal, Wilmington, NC Estimator: Pete BredehoeftClient: North Carolina Ports Authority Q.C Reviewer: Denny Stoddard, Lee Lindig, Rob EdgertonLocation: Wilmington, NC Estimate Rev Date: Rev 04 - June 27, 2008 - PRB
Estimate: Construction Cost Estimate
Report: Detailed Report
Item No.WBS Code Description Quantity Unit Unit Price Total Quantity Unit Unit Price Total Quantity Unit Unit Price Total Quantity Unit Unit Price Total
Phase 1 (198 AC, 2,330 LF Wharf) Phase 2 (44 AC, 550 LF Wharf) Phase 3 (29 AC, 1,390 LF Wharf) Total Build Out (Current Est)
43. Total 2,330 LF 39,582.87$ 92,228,078$ 550 LF 40,240.60$ 22,132,330$ 1,390 LF 38,222.01$ 53,128,596$ 4,270 LF 39,224.59$ 167,489,007$ 44.45.46. 05 Container Yard47. Pavement Asphalt 242,550 SY 83.78$ 20,320,264$ 9,100 SY 83.59$ 760,650$ - -$ 251,650 SY 83.77$ 21,080,914$ 48. Pavement Gravel/Stone 176,154 SY 20.46$ 3,604,399$ 9,100 SY 20.46$ 186,225$ - -$ 185,254 SY 20.46$ 3,790,624$ 49. Pavement Curb 5,000 LF 32.85$ 164,258$ 1,000 LF 10.01$ 10,012$ 1,000 LF 10.01$ 10,011$ 7,000 LF 26.33$ 184,281$ 50. Pavement Curb and Gutter 8,000 LF 30.53$ 244,267$ 1,000 LF 30.54$ 30,538$ 1,000 LF 30.54$ 30,536$ 10,000 LF 30.53$ 305,341$ 51. Access Roads 198,330 SY 54.75$ 10,859,030$ 141,200 SY 54.56$ 7,703,320$ 94,100 SY 46.13$ 4,340,543$ 433,630 SY 52.82$ 22,902,893$ 52. Total 617,034 SY 57.03$ 35,192,218$ 159,400 SY 54.52$ 8,690,745$ 94,100 SY 46.56$ 4,381,090$ 870,534 SY 55.44$ 48,264,053$ 53.54.55. 06 Intermodal yard56. New Track 22,990 LF 250.00$ 5,747,400$ 7,663 LF 250.00$ 1,915,800$ 7,663 LF 250.00$ 1,915,800$ 38,316 LF 250.00$ 9,579,000$ 57. New Turnouts 4 EA 140,000.00$ 504,000$ 1 EA 140,000.00$ 168,000$ 1 EA 140,000.00$ 168,000$ 6 EA 140,000.00$ 840,000$
58. New Precast Concrete Grade Crossings 1,440 TF 300.00$ 432,000$ 480 TF 300.00$ 144,000$ 480 TF 300.00$ 144,000$ 2,400 TF 300.00$ 720,000$
59. New Precast Concrete Grade Crossings 173 TF 300.00$ 51,840$ 58 TF 300.00$ 17,280$ 58 TF 300.00$ 17,280$ 288 TF 300.00$ 86,400$
60.Support Yard Paving (Roadways), 6" ACP Section 2 AC 350,000.00$ 840,000$ 1 AC 350,000.00$ 280,000$ 1 AC 350,000.00$ 280,000$ 4 AC 350,000.00$ 1,400,000$
61. New Track 47,602 LF 250.00$ 11,900,550$ 15,867 LF 250.00$ 3,966,850$ 15,867 LF 250.00$ 3,966,850$ 79,337 LF 250.00$ 19,834,250$ 62. New Turnouts 10 EA 140,000.00$ 1,428,000$ 3 EA 140,000.00$ 476,000$ 3 EA 140,000.00$ 476,000$ 17 EA 140,000.00$ 2,380,000$ 63. Total 20,903,790$ 6,967,930$ 6,967,930$ 120,341 LF 289.51$ 34,839,650$ 64.65.66. 07 Rail Yard67. New Track 63,360 LF 250.00$ 15,840,000$ 21,120 LF 250.00$ 5,280,000$ 21,120 LF 250.00$ 5,280,000$ 105,600 LF 250.00$ 26,400,000$ 68. New Turnouts 2.40 EA 140,000.00$ 336,000$ 0.80 EA 140,000.00$ 112,000$ 0.80 EA 140,000.00$ 112,000$ 4 EA 140,000.00$ 560,000$ 69. Control Siding 13,200 LF 250.00$ 3,300,000$ 4,400 LF 250.00$ 1,100,000$ 4,400 LF 250.00$ 1,100,000$ 22,000 LF 250.00$ 5,500,000$ 70. New Track 21,104 LF 250.00$ 5,276,100$ 7,035 LF 250.00$ 1,758,700$ 7,035 LF 250.00$ 1,758,700$ 35,174 LF 250.00$ 8,793,500$ 71. New Turnouts 1.20 EA 140,000.00$ 168,000$ 0.40 EA 140,000.00$ 56,000$ 0.40 EA 140,000.00$ 56,000$ 2 EA 140,000.00$ 280,000$
72. New Precast Concrete Grade Crossings 468 TF 300.00$ 140,400$ 156 TF 300.00$ 46,800$ 156 TF 300.00$ 46,800$ 780 TF 300.00$ 234,000$ 73. Grade Crossing Protection 7.80 EA 120,000.00$ 936,000$ 2.60 EA 120,000.00$ 312,000$ 2.60 EA 120,000.00$ 312,000$ 13 EA 120,000.00$ 1,560,000$ 74. Misc Yard & Rail Items 0.60 % 1,500,000.00$ 900,000$ 0.20 % 1,500,000.00$ 300,000$ 0.20 % 1,500,000.00$ 300,000$ 1 LS 1,500,000.00$ 1,500,000$ 75. Total 98,132 LF 274.08$ 26,896,500$ 32,711 LF 274.08$ 8,965,500$ 32,711 LF 274.08$ 8,965,500$ 163,554 LF 274.08$ 44,827,500$ 76.77. 08 Rail Bridges78. Rail Bridge 500 SF 30,354.00$ 15,177,000$ - SF 30,354.00$ -$ - SF 30,354.00$ -$ 500 SF 30,354.00$ 15,177,000$ 79. Total 500 SF 30,354.00$ 15,177,000$ - SF -$ -$ - SF -$ -$ 500 SF 30,354.00$ 15,177,000$ 80.81. 09 Access Roadway82. Port Bridge to Cooling Towers 1 LS 8,321,057.72$ 8,321,058$ 1 LS 8,321,057.72$ 8,321,058$ 83. Cooling Towers to NC-87 1 LS 5,532,286.39$ 5,532,286$ 1 LS 5,532,286.39$ 5,532,286$ 84. NC-87 to Exit 3 intersection 1 LS 233,583.37$ 233,583$ 1 LS 233,583.37$ 233,583$ 85. Exit 3 intersection to NC-133 1 LS 7,552,089.21$ 7,552,089$ 1 LS 7,552,089.21$ 7,552,089$
Estimate Data Date: May 2008 Page 2 of 7

Project: North Carolina International Terminal, Wilmington, NC Estimator: Pete BredehoeftClient: North Carolina Ports Authority Q.C Reviewer: Denny Stoddard, Lee Lindig, Rob EdgertonLocation: Wilmington, NC Estimate Rev Date: Rev 04 - June 27, 2008 - PRB
Estimate: Construction Cost Estimate
Report: Detailed Report
Item No.WBS Code Description Quantity Unit Unit Price Total Quantity Unit Unit Price Total Quantity Unit Unit Price Total Quantity Unit Unit Price Total
Phase 1 (198 AC, 2,330 LF Wharf) Phase 2 (44 AC, 550 LF Wharf) Phase 3 (29 AC, 1,390 LF Wharf) Total Build Out (Current Est)
86. NC-133 to 1000' south of NC-87/133 1 LS 9,313,528.72$ 9,313,529$ 1 LS 9,313,528.72$ 9,313,529$ 87. 1000' south of NC-87/133 to NC-1512 1 LS 35,855,028.99$ 35,855,029$ 1 LS 35,855,028.99$ 35,855,029$ 88. NC-1512 to US 17 1 LS 25,583,169.14$ 25,583,169$ 1 LS 25,583,169.14$ 25,583,169$ 89. Catch Basin / Inlet 50 EA 5,000.00$ 250,000$ 50 EA 5,000.00$ 250,000$ 90. Manhole 20 EA 5,000.00$ 100,000$ 20 EA 5,000.00$ 100,000$ 91. Outfall Structure 5 EA 6,000.00$ 30,000$ 5 EA 6,000.00$ 30,000$ 92. Endwall 5 EA 3,000.00$ 15,000$ 5 EA 3,000.00$ 15,000$ 93. 18" RCP 5,000 LF 26.74$ 133,700$ 5,000 LF 26.74$ 133,700$ 94. 24" RCP 5,000 LF 43.03$ 215,150$ 5,000 LF 43.03$ 215,150$ 95. 30" RCP 2,000 LF 60.85$ 121,700$ 2,000 LF 60.85$ 121,700$ 96. 36" RCP 3,000 LF 77.25$ 231,750$ 3,000 LF 77.25$ 231,750$ 97. 42" RCP 1,000 LF 100.70$ 100,700$ 1,000 LF 100.70$ 100,700$ 98. 48" RCP 1,000 LF 135.55$ 135,550$ 1,000 LF 135.55$ 135,550$ 99. Asphalt Pavement (Section 1) 325,000 SY 60.00$ 19,500,000$ 325,000 SY 60.00$ 19,500,000$ 100. Asphalt Pavement (Section 2) 720,000 SY 90.00$ 64,800,000$ 720,000 SY 90.00$ 64,800,000$ 101. Gravel / Stone 331,000 SY 30.00$ 9,930,000$ 331,000 SY 30.00$ 9,930,000$ 102. Concrete Curb 7,000 LF 10.00$ 70,000$ 7,000 LF 10.00$ 70,000$ 103. Concrete Curb and Gutter 10,000 LF 20.00$ 200,000$ 10,000 LF 20.00$ 200,000$ 104. Pavement Marking 1 LS 500,000.00$ 500,000$ 1 LS 500,000.00$ 500,000$ 105. Traffic Signals - Allowance 4 EA 250,000.00$ 1,000,000$ 4 EA 250,000.00$ 1,000,000$ 106. Missing Scope Allowance 1 LS 5,000,000.00$ 5,000,000$ 1 LS 5,000,000.00$ 5,000,000$ 107. Total 194,724,294$ 49,655 LF 3,921.54$ 194,724,294$ 108. 9.4 Miles 20,705,755.11$ 194,724,294$ 109. 10 Access Roadway Bridges
110.Additional Grade Separation over Railroad crossings, added to all alternates 1 LS 10,162,500.00$ 10,162,500$ 1 LS 10,162,500.00$ 10,162,500$
111. Fly overs on NC-87, US-17 1 LS 3,810,000.00$ 3,810,000$ 1 LS 3,810,000.00$ 3,810,000$ 112. Fly over - Rail Way - At Terminal 150 LF 42,368.49$ 6,355,273$ 150 LF 42,368.49$ 6,355,273$ 113. Total 20,327,773$ 1 LF 20,327,773.00$ 20,327,773$ 114.115.116. 11 Equipment and Rolling Stock117. Ship-to-Shore Gantry Crane 8 EA 11,670,000.00$ 93,360,000$ 4 EA 11,670,000.00$ 46,680,000$ 4 EA 11,670,000.00$ 46,680,000$ 16 EA 11,670,000.00$ 186,720,000$ 118. Spreaderbars - Spare 4 EA 235,000.00$ 940,000$ 2 EA 235,000.00$ 470,000$ 2 EA 235,000.00$ 470,000$ 8 EA 235,000.00$ 1,880,000$ 119. ARMG's-yard 24 EA 3,055,000.00$ 73,320,000$ 24 EA 3,055,000.00$ 73,320,000$ 16 EA 3,055,000.00$ 48,880,000$ 64 EA 3,055,000.00$ 195,520,000$ 120. Spreaderbar - Spare 3 EA 140,000.00$ 420,000$ 6 EA 140,000.00$ 840,000$ 2 EA 140,000.00$ 280,000$ 11 EA 140,000.00$ 1,540,000$ 121. Translifter 33 EA 605,000.00$ 19,965,000$ 16 EA 605,000.00$ 9,680,000$ 16 EA 605,000.00$ 9,680,000$ 65 EA 605,000.00$ 39,325,000$ 122. Chassis 128 EA 12,000.00$ 1,536,000$ 64 EA 12,000.00$ 768,000$ 64 EA 12,000.00$ 768,000$ 256 EA 12,000.00$ 3,072,000$ 123. RTG 5 EA 2,350,000.00$ 11,750,000$ 5 EA 2,350,000.00$ 11,750,000$ 1 EA 2,350,000.00$ 2,350,000$ 11 EA 2,350,000.00$ 25,850,000$ 124. Spreaderbar - (1 over 3) - Rail 20 EA 1,050,000.00$ 21,000,000$ 20 EA 1,050,000.00$ 21,000,000$ 10 EA 1,050,000.00$ 10,500,000$ 50 EA 1,050,000.00$ 52,500,000$ 125. Chassis 20 EA 16,000.00$ 320,000$ 20 EA 16,000.00$ 320,000$ 10 EA 16,000.00$ 160,000$ 50 EA 16,000.00$ 800,000$ 126. Reach Stacker 2 EA 495,000.00$ 990,000$ 2 EA 495,000.00$ 990,000$ 1 EA 495,000.00$ 495,000$ 5 EA 495,000.00$ 2,475,000$ 127. Empty Handler 2 EA 265,000.00$ 530,000$ 3 EA 265,000.00$ 795,000$ EA 265,000.00$ -$ 5 EA 265,000.00$ 1,325,000$ 128. Yard Tractors 2 EA 65,000.00$ 130,000$ 2 EA 65,000.00$ 130,000$ 1 EA 65,000.00$ 65,000$ 5 EA 65,000.00$ 325,000$ 129. Pick-Up Trucks 15 EA 20,000.00$ 300,000$ 10 EA 20,000.00$ 200,000$ 5 EA 20,000.00$ 100,000$ 30 EA 20,000.00$ 600,000$ 130. Fork Trucks (FT) Small - 3.5-4 ton 1 EA 22,000.00$ 22,000$ 1 EA 22,000.00$ 22,000$ EA 27,000.00$ -$ 2 EA 22,000.00$ 44,000$
Estimate Data Date: May 2008 Page 3 of 7

Project: North Carolina International Terminal, Wilmington, NC Estimator: Pete BredehoeftClient: North Carolina Ports Authority Q.C Reviewer: Denny Stoddard, Lee Lindig, Rob EdgertonLocation: Wilmington, NC Estimate Rev Date: Rev 04 - June 27, 2008 - PRB
Estimate: Construction Cost Estimate
Report: Detailed Report
Item No.WBS Code Description Quantity Unit Unit Price Total Quantity Unit Unit Price Total Quantity Unit Unit Price Total Quantity Unit Unit Price Total
Phase 1 (198 AC, 2,330 LF Wharf) Phase 2 (44 AC, 550 LF Wharf) Phase 3 (29 AC, 1,390 LF Wharf) Total Build Out (Current Est)
131. Fork Trucks (FT) Med. - 7-8 ton capacity EA -$ 1 EA 70,000.00$ 70,000$ 1 EA 70,000.00$ 70,000$ 2 EA 70,000.00$ 140,000$ 132. Fork Trucks (FT) Large - 20-25 ton 1 EA 265,000.00$ 265,000$ EA 265,000.00$ -$ 1 EA 265,000.00$ 265,000$ 2 EA 265,000.00$ 530,000$ 133. Man-Lift 1 EA 87,000.00$ 87,000$ 1 EA 87,000.00$ 87,000$ EA 110,000.00$ -$ 2 EA 87,000.00$ 174,000$ 134. Fuel Truck (10,000 gal.) 1 EA 155,000.00$ 155,000$ 1 EA 155,000.00$ 155,000$ EA 155,000.00$ -$ 2 EA 155,000.00$ 310,000$ 135. AMP 2 EA 2,650,000.00$ 5,300,000$ - EA 2,650,000.00$ -$ 1 EA 2,650,000.00$ 2,650,000$ 3 EA 2,650,000.00$ 7,950,000$ 136. Total 230,390,000$ 167,277,000$ 123,413,000$ 589 EA 884,685.91$ 521,080,000$ 137.138.139. 12 Support Facilities and Builidings140. Administration 27,900 SF 265.15$ 7,397,575$ -$ 27,900 SF 265.15$ 7,397,575$
141.Inbound Gate Canopy (shared for all lanes) - See Below SF -$ -$ - SF -$ -$ - SF -$ -$
142. OCR Canopy - See Below - SF -$ -$ -$ - SF -$ -$ 143. Customs Building - See Below - SF -$ -$ -$ - SF -$ -$ 144. Drivers Assistance 250 SF 169.84$ 42,459$ -$ 250 SF 169.84$ 42,459$ 145. Maintenance & Repair 15,000 SF 144.62$ 2,169,360$ 15,000 SF 144.62$ 2,169,360$ 30,000 SF 144.62$ 4,338,720$ 146. Reefer Receiving (canopy) 1,200 SF 90.85$ 109,018$ -$ 1,200 SF 90.85$ 109,018$ 147. Reefer Dispatch (canopy) 1,200 SF 90.85$ 109,018$ -$ 1,200 SF 90.85$ 109,018$ 148. Reefer Wash (canopy) 4,000 SF 131.79$ 527,170$ -$ 4,000 SF 131.79$ 527,170$ 149. Reefer Wash (dock) 420 SF 583.71$ 245,158$ -$ 420 SF 583.71$ 245,158$ 150. Roadability (canopy) 2,550 SF 101.85$ 259,710$ -$ 2,550 SF 101.85$ 259,710$ 151. Roadability (building) 900 SF 272.40$ 245,158$ -$ 900 SF 272.40$ 245,158$ 152. Straddle Carrier Shop 13,800 SF 151.43$ 2,089,800$ 13,800 SF 151.43$ 2,089,800$ 27,600 SF 151.43$ 4,179,600$ 153. Rail Office 2,700 SF 265.15$ 715,894$ -$ 2,700 SF 265.15$ 715,894$ 154. RTG Repair Area 9,000 SF 199.20$ 1,792,760$ -$ 9,000 SF 199.20$ 1,792,760$ 155. Marine Building 3,600 SF 183.50$ 660,587$ -$ 3,600 SF 183.50$ 660,587$ 156. Crane Maintenance Building 6,000 SF 183.50$ 1,100,978$ 6,000 SF 183.50$ 1,100,978$ 12,000 SF 183.50$ 2,201,955$ 157. Guard Building (2 locations) 70 SF 272.40$ 19,068$ -$ 70 SF 272.40$ 19,068$ 158. Bus Stop Shelter (canopy) 280 SF 85.05$ 23,815$ -$ 280 SF 85.05$ 23,815$ 159. Main Substation 6,500 SF 91.68$ 595,889$ -$ 6,500 SF 91.68$ 595,889$ 160. US Customs 1,000 SF 302.25$ 302,254$ -$ 1,000 SF 302.25$ 302,254$ 161. Labor Gate -$ -$ - SF -$ -$ 162. Abution Buildings (3 Locations) -$ -$ - SF -$ -$ 163. Total 96,370 SF 190.99$ 18,405,670$ 34,800 SF 154.03$ 5,360,138$ 131,170 SF 181.18$ 23,765,808$ 164.165.166. 13 Security Systems167. Security Trenchwork 22,000 LF 2.00$ 44,000$ 22,000 LF 2.00$ 44,000$ 168. Security Concduit 22,000 LF 15.00$ 330,000$ 22,000 LF 15.00$ 330,000$ 169. Fiber Optic - Main Runs 1 EA 177,500.00$ 177,500$ 1 EA 177,500.00$ 177,500$ 170. Cameras - Southwest Site 1 EA 80,000.00$ 80,000$ 1 EA 80,000.00$ 80,000$ 171. Cameras - West Site 1 LS 175,000.00$ 175,000$ 1 LS 175,000.00$ 175,000$ 172. Cameras - South Site 1 LS 135,000.00$ 135,000$ 1 LS 135,000.00$ 135,000$ 173. Cameras - North Site 1 LS 135,000.00$ 135,000$ 1 LS 135,000.00$ 135,000$ 174. Cameras - Southeast Site 1 LS 200,000.00$ 200,000$ 1 LS 200,000.00$ 200,000$ 175. Cameras - Northeast Site 1 LS 200,000.00$ 200,000$ 1 LS 200,000.00$ 200,000$ 176. Cameras - Central Site 1 LS 20,000.00$ 20,000$ 1 LS 20,000.00$ 20,000$
Estimate Data Date: May 2008 Page 4 of 7

Project: North Carolina International Terminal, Wilmington, NC Estimator: Pete BredehoeftClient: North Carolina Ports Authority Q.C Reviewer: Denny Stoddard, Lee Lindig, Rob EdgertonLocation: Wilmington, NC Estimate Rev Date: Rev 04 - June 27, 2008 - PRB
Estimate: Construction Cost Estimate
Report: Detailed Report
Item No.WBS Code Description Quantity Unit Unit Price Total Quantity Unit Unit Price Total Quantity Unit Unit Price Total Quantity Unit Unit Price Total
Phase 1 (198 AC, 2,330 LF Wharf) Phase 2 (44 AC, 550 LF Wharf) Phase 3 (29 AC, 1,390 LF Wharf) Total Build Out (Current Est)
177. Cameras - Guardhouse Area 1 LS 65,000.00$ 65,000$ 1 LS 65,000.00$ 65,000$ 178. Cameras - Inbound/Outbound Area 1 LS 50,000.00$ 50,000$ 1 LS 50,000.00$ 50,000$ 179. Cameras - Maintenance Area 1 LS 30,000.00$ 30,000$ 1 LS 30,000.00$ 30,000$ 180. Cameras - Maintenance Area 1 LS 40,000.00$ 40,000$ 1 LS 40,000.00$ 40,000$ 181. Card Readers - Inbound/Outbound Area 1 LS 23,000.00$ 23,000$ 1 LS 23,000.00$ 23,000$ 182. Card Readers - Main Building 1 LS 12,000.00$ 12,000$ 1 LS 12,000.00$ 12,000$ 183. Security Signage - Overall Site 1 EA 25,000.00$ 25,000$ 1 EA 25,000.00$ 25,000$ 184. Video Surveillance System - Maint Facility 1 LS 165,000.00$ 165,000$ 1 LS 165,000.00$ 165,000$ 185. Video Analysis System - Maint Facility 1 LS 100,000.00$ 100,000$ 1 LS 100,000.00$ 100,000$ 186. Access Control System - Maint Facility 1 LS 67,000.00$ 67,000$ 1 LS 67,000.00$ 67,000$ 187. Communication Room - Maint Facility 2 EA 50,000.00$ 100,000$ 2 EA 50,000.00$ 100,000$ 188. Video Surveillance System - Guardhouse 1 LS 14,000.00$ 14,000$ 1 LS 14,000.00$ 14,000$ 189. Access Control System - Guard House 1 LS 12,000.00$ 12,000$ 1 LS 12,000.00$ 12,000$ 190. Security Chainlink Fence - 12' High 22,000 LF 67.23$ 1,479,011$ 3,000 LF 67.23$ 201,683$ 2,000 LF 67.23$ 134,456$ 27,000 LF 67.23$ 1,815,149$
191.Security Chainlink Fence - Concertina Wire 22,000 LF 15.88$ 349,285$ 3,000 LF 15.88$ 47,630$ 2,000 LF 15.88$ 31,753$ 27,000 LF 15.88$ 428,668$
192.Intrusion Dection System - Passive Magnetic 22,000 LF 20.90$ 459,892$ 3,000 LF 20.90$ 62,713$ 2,000 LF 20.90$ 41,808$ 27,000 LF 20.90$ 564,413$
193. Fencing - 0 -$ 194. Fencing - 0 -$ 195. Gate Complex - 0 -$ 196. PIDAS Zones - 0 -$ 197. Security Management Systems - 0 -$ 198. a) Access control door - 0 -$ 199. b) Pedestrian gate - 0 -$ 200. c) Vehicle gate - 0 -$ 201. d) Train gate - 0 -$ 202. e) Badge printer - 0 -$ 203. f) Access control card - 0 -$ 204. Water Font Security - 0 -$
205.General Surveillance Video, Includes PTZ camera interfaced with SMS. - 0 -$
206. Security Boat 2 EA 60,000.00$ 120,000$ 2 EA 60,000.00$ 120,000$ 207. Radios and Dispacthing Equipment 1 EA 250,000.00$ 250,000$ 1 EA 250,000.00$ 250,000$ 208. Patrol Vehicles 5 EA 25,000.00$ 125,000$ 5 EA 25,000.00$ 125,000$ 209. Total 198 AC 25,165.09$ 4,982,688$ 44 AC 7,091.49$ 312,026$ 29 AC 7,173.00$ 208,017$ 271 AC 20,305.28$ 5,502,730$ 210.211.212. 14 Inbound Gate213. Inbound Gate Complex 15,750 SF 138.89$ 2,187,582$ 5,250 SF 138.89$ 729,194$ 21,000 SF 138.89$ 2,916,776$ 214. ORC Canopy 12,000 SF 131.96$ 1,583,479$ 12,000 SF 131.96$ 1,583,479$ 215. Customs Building 400 SF 139.24$ 55,695$ 400 SF 139.24$ 55,695$ 216. Total 28,150 SF 135.94$ 3,826,756$ 5,250 SF 138.89$ 729,194$ -$ 33,400 SF 136.41$ 4,555,950$ 217.218.219. 17 Utilities
Estimate Data Date: May 2008 Page 5 of 7

Project: North Carolina International Terminal, Wilmington, NC Estimator: Pete BredehoeftClient: North Carolina Ports Authority Q.C Reviewer: Denny Stoddard, Lee Lindig, Rob EdgertonLocation: Wilmington, NC Estimate Rev Date: Rev 04 - June 27, 2008 - PRB
Estimate: Construction Cost Estimate
Report: Detailed Report
Item No.WBS Code Description Quantity Unit Unit Price Total Quantity Unit Unit Price Total Quantity Unit Unit Price Total Quantity Unit Unit Price Total
Phase 1 (198 AC, 2,330 LF Wharf) Phase 2 (44 AC, 550 LF Wharf) Phase 3 (29 AC, 1,390 LF Wharf) Total Build Out (Current Est)
220.Main Substation and 69 kV Transmission Lines 1 LS 15,000,000.00$ 15,000,000$ 1 LS 15,000,000.00$ 15,000,000$
221.Electrical Distribution and Low Voltage Equipment 6 EA 1,426,843.00$ 8,561,058$ 6 EA 1,426,843.00$ 8,561,058$
222. Ductbanks and Manholes 77 EA 25,514.00$ 1,964,578$ 10 EA 25,479.67$ 254,797$ 14 EA 25,479.67$ 356,715$ 101 EA 25,505.84$ 2,576,090$
223.
Infracture Only: Includes 6 & 69 kV Ductbanks, manholes, equipment foundations and receptacle pits 27,495 LF 509.91$ 14,020,085$ 8,188 LF 476.19$ 3,899,031$ 4,370 LF 334.34$ 1,461,081$ 40,053 LF 483.86$ 19,380,197$
224. 69 kV Primary Feeders 51,700 cLF 112.44$ 5,813,054$ 34,700 cLF 111.68$ 3,875,278$ 13,200 cLF 30.04$ 396,512$ 99,600 cLF 101.25$ 10,084,844$
225.
Unit Substations w/7.5 MVA, 69kV/6kV transformers complete with primary and secondary breakers 1 LS 955,780.00$ 955,780$ 1 LS 955,780.00$ 955,780$
226. 6kV Feeders to berths - -$ 227. 6kV Receptacles (4 per berth) 16 EA 122,886.00$ 1,966,176$ 16 EA 122,886.00$ 1,966,176$ 8 EA 122,886.00$ 983,088$ 40 EA 122,886.00$ 4,915,440$ 228. Site Ductbank (2x2-4" Conduits) 125,000 LF 21.45$ 2,681,731$ 80,000 LF 21.45$ 1,716,308$ 50,000 LF 21.45$ 1,072,692$ 255,000 LF 21.45$ 5,470,731$ 229. Communications Manhole (4'x4') - -$ 230. Fiber Optic Cable (8-Strand) 11,000 LF 5.35$ 58,876$ 9,000 LF 5.35$ 48,171$ 2,000 LF 5.35$ 10,705$ 22,000 LF 5.35$ 117,752$
231. Copper Communications Cable (24-Pair) - -$ 232. Site Communications - -$ 233. High Voltage Feeders to Berths - -$ 234. High Voltage Berth Receptacles 12 EA 157,021.00$ 1,884,252$ 12 EA 157,021.00$ 1,884,252$ 8 EA 250,000.00$ 1,256,168$ 32 EA 157,021.00$ 5,024,672$ 235. Lightning Protection - 15% of SF 14,456 SF 5.00$ 72,278$ 5,220 SF 5.00$ 26,100$ 19,676 SF 5.00$ 98,378$
236.High Mast Lighting - 70' Poles - Assumed 400' on Center Spacing 35 EA 75,097.00$ 2,628,395$ 11 EA 75,097.00$ 826,067$ 6 EA 75,097.00$ 450,582$ 52 EA 75,097.00$ 3,905,044$
237.Reefer Electrical Connections - Plugs - 3% of Throughput 1,500 EA 7,800.00$ 1,848,861$ 1,500 EA 7,800.00$ 1,848,861$ 750 EA 7,800.00$ 924,430$ 3,750 EA 1,232.57$ 4,622,152$
238.Reefer Racks - 3 High - with Platform and Stairs 500 EA 32,400.00$ 16,200,000$ 500 EA 32,400.00$ 1,848,861$ 250 EA 32,400.00$ 924,430$ 1,250 EA 15,178.63$ 18,973,291$
239.Generator Set 13.2kV, 2500kVA diesel generator 1 EA 1,638,480.00$ 1,638,480$ 1 EA 1,638,480.00$ 1,638,480$
240. TRENCH EXCAVATION &BACKFILLING 65,331 CY 2.00$ 130,662$ 65,331 CY 2.00$ 130,662$ 241. SANITARY SEWER PIPE 45,795 LF 70.27$ 3,218,180$ 45,795 LF 70.27$ 3,218,180$ 242. Storm Water System 25,632 LF 441.10$ 11,306,387$ 1,231 LF 203.90$ 250,998$ 1,231 LF 185.28$ 228,081$ 28,094 LF 419.50$ 11,785,466$ 243. POTABLE WATER 19,000 LF 96.72$ 1,837,764$ 2,000 LF 157.81$ 315,610$ 2,000 LF 157.80$ 315,591$ 23,000 LF 107.35$ 2,468,965$ 244. FIRE WATER - System 198 AC 8,999.24$ 1,781,850$ 198 AC 8,999.24$ 1,781,850$ 245. FIRE WATER - Water Main 11,000 LF 111.53$ 1,226,822$ 4,900 LF 173.80$ 851,639$ 4,900 LF 171.18$ 838,792$ 20,800 LF 140.25$ 2,917,253$ 246. Industrial Wast System 5,000 LF 71.34$ 356,700$ 5,000 LF 71.34$ 356,700$ 247. STEAM PLANT 1 LS 3,377,150.00$ 3,377,150$ 1 LS 3,377,150.00$ 3,377,150$ 248. Compressed Air System 15,000 LF 61.47$ 922,065$ 15,000 LF 61.47$ 922,065$ 249. Disinfection Treatment System 198 AC 2,698.01$ 534,205$ 198 AC 2,698.01$ 534,205$ 250. Total 198 AC 502,278.71$ 99,451,184$ 44 AC 445,730.66$ 19,612,149$ 29 AC 317,892.00$ 9,218,868$ 271 AC 473,366.06$ 128,282,201$ 251.252.253. 18 General Requirements - Div 01254. Field Personnel 30 MO 85,287.33$ 2,558,620$ 18 MO 48,129.11$ 866,324$ 18 MO 48,126.28$ 866,273$ 66 MO 65,018.44$ 4,291,217$
Estimate Data Date: May 2008 Page 6 of 7

Project: North Carolina International Terminal, Wilmington, NC Estimator: Pete BredehoeftClient: North Carolina Ports Authority Q.C Reviewer: Denny Stoddard, Lee Lindig, Rob EdgertonLocation: Wilmington, NC Estimate Rev Date: Rev 04 - June 27, 2008 - PRB
Estimate: Construction Cost Estimate
Report: Detailed Report
Item No.WBS Code Description Quantity Unit Unit Price Total Quantity Unit Unit Price Total Quantity Unit Unit Price Total Quantity Unit Unit Price Total
Phase 1 (198 AC, 2,330 LF Wharf) Phase 2 (44 AC, 550 LF Wharf) Phase 3 (29 AC, 1,390 LF Wharf) Total Build Out (Current Est)
255. Office Support 30 MO 41,621.60$ 1,248,648$ 18 MO 21,090.11$ 379,622$ 18 MO 20,922.17$ 376,599$ 66 MO 30,376.80$ 2,004,869$ 256. Field Equipment 30 MO 405,658.93$ 12,169,768$ 18 MO 166,813.50$ 3,002,643$ 18 MO 166,803.56$ 3,002,464$ 66 MO 275,376.89$ 18,174,875$ 257. Temporary Utilities 30 MO 8,183.70$ 245,511$ 18 MO 5,915.44$ 106,478$ 18 MO 5,915.11$ 106,472$ 66 MO 6,946.38$ 458,461$ 258. Protection, Safety and Site Security 30 MO 628.63$ 18,859$ 18 MO 1,047.83$ 18,861$ 18 MO 1,047.78$ 18,860$ 66 MO 857.27$ 56,580$ 259. Field Testing 30 MO 79,387.73$ 2,381,632$ 18 MO 54,828.83$ 986,919$ 18 MO 54,825.56$ 986,860$ 66 MO 65,991.08$ 4,355,411$ 260. Site Support Items 30 MO 30,227.50$ 906,825$ 18 MO 28,034.94$ 504,629$ 18 MO 28,033.28$ 504,599$ 66 MO 29,031.11$ 1,916,053$ 261. Marine Equipment Rental 30 MO 75,463.27$ 2,263,898$ 18 MO 55,906.89$ 1,006,324$ 18 MO 55,903.50$ 1,006,263$ 66 MO 64,795.23$ 4,276,485$ 262. General Support Items 30 MO 10,092.10$ 302,763$ 18 MO 8,204.89$ 147,688$ 18 MO 8,204.39$ 147,679$ 66 MO 9,062.58$ 598,130$ 263. Total 30 MO 736,550.80$ 22,096,524$ 18 MO 389,971.56$ 7,019,488$ 18 MO 389,781.61$ 7,016,069$ 66 MO 547,455.77$ 36,132,081$ 264.265. 19 Other Project Cost266. Contractor's Preliminaries -$ 267. Total 1 LS 1 LS 1 LS 1 LS -$ 268.269. 20 Other Project Specific Costs270. Storm Water Retention Pond 198 AC 22,806.50$ 4,515,687$ 198 AC 22,806.50$ 4,515,687$ 271. Wetland Mitigation 1 LS 40,000,000.00$ 40,000,000$ 1 LS 40,000,000.00$ 40,000,000$ 272. All - Wetlands 1 LS 10,701,000.00$ 10,701,000$ 1 LS 10,701,000.00$ 10,701,000$ 273. Displacements 1 LS 35,000.00$ 35,000$ 1 LS 35,000.00$ 35,000$ 274. Exfiltration Chambers (Storm Tech) 1,000 EA 1,500.00$ 1,500,000$ 1,000 EA 1,500.00$ 1,500,000$ 275. Exfiltration Bedding 5,000 SY 25.00$ 125,000$ 5,000 SY 25.00$ 125,000$ 276. Total 56,876,687$ -$ 271 AC 209,877.07$ 56,876,687$ 277.278. Total Construction Costs (2008 $) 198 AC 7,531,126.26$ 1,491,163,000$ 44 AC 6,163,681.82$ 271,202,000$ 29 AC 8,747,379.31$ 253,674,000$ 271 AC 7,439,258.30$ 2,016,039,000$ 279.
280.Estimating Contingency - Based upon level of Design 10% 149,116,000$ 10% 27,120,000$ 10% 25,367,000$ 201,603,000$
281.
282.Total Construction Cost With Estimating Contingency (2008 $) 198 AC 8,284,237.37$ 1,640,279,000$ 44 AC 6,780,045.45$ 298,322,000$ 279,041,000$ 242 AC 9,163,809.92$ 2,217,642,000$
283.284.
285.Escalation To Midpoint of Construction - Escalation Factor 65.7% 1,077,663,000$ 108.0% 322,158,000$ 152.92% 426,709,000$ 1,826,530,000$
286.
287.Total Construction Cost With Escalation ( Future $) 2,717,942,000$ 620,480,000$ 705,750,000$ 4,044,172,000$
288.289.
Estimate Data Date: May 2008 Page 7 of 7

North Carolina State Ports Authority ‐ NCIT Concept Order of Magnitude Cost Estimate
Quantity Units Unit cost Cost Quantity Units Unit cost Cost Quantity Units Unit cost Cost
Mobilization/Demobilization 1 ls $5,000,000 $5,000,000 1 ls $5,000,000 $5,000,000 1 ls $5,000,000 $5,000,000
Environmental Mitigation 1 ls $10,000,000 $10,000,000 0 ls $10,000,000 $0 0 ls $10,000,000 $0
Clearing and grubbing 211 acre $4,529 $955,691 50 acre $5,378 $268,876 78 acre $5,750 $448,509
Excavation 2,215,661 cy $8.45 $18,722,335 82,205 cy $8.45 $694,632 516,374 cy $8.45 $4,363,360
Excavation material disposal 0 cy $23.62 $0 46,857 cy $23.62 $1,106,762 296,075 cy $23.62 $6,993,292
Berth Dredging 3,007,629 cy $8.90 $26,767,898 1,040,278 cy $8.90 $9,258,474 1,073,775 cy $8.90 $9,556,598
Containment Dike 392,610 cy $3.50 $1,374,135 0 cy $3.50 $0 0 cy $3.50 $0
Leveling Fill Behind Dike 1,762,575 cy $0.55 $969,416 0 cy $0.55 $0 0 cy $0.55 $0
M i l Wh f 302 900 f $175 $53 007 500 140 000 f $175 $24 500 000 143 750 f $175 $25 156 250
TEC's ALTERNATE CONCEPT
Item
SITE WORK
Phase 3Phase 2Phase 1
Marginal Wharf 302,900 sf $175 $53,007,500 140,000 sf $175 $24,500,000 143,750 sf $175 $25,156,250
Apron 3 acre $600,000 $1,800,000 1.5 acre $600,000 $900,000 2 acre $600,000 $960,000
Container Yard 74 acre $600,000 $44,400,000 37 acre $600,000 $22,200,000 37 acre $600,000 $22,200,000
Reefer Yard 1,700 plug $5,000 $8,500,000 900 plug $5,000 $4,500,000 1,100 plug $5,000 $5,500,000
Container Yard Gate 14 lane $250,000 $3,500,000 6 lane $250,000 $1,500,000 2 lane $250,000 $500,000
Intermodal Rail Yard 10 1000 ft wkg trk $550,000 $5,500,000 10 1000 ft wkg trk $550,000 $5,500,000 10 1000 ft wkg trk $550,000 $5,500,000
Rail spur/leads to IY & storage track 17,650 ft of track $155 $2,735,750 3,250 ft of track $155 $503,750 2,750 ft of track $155 $426,250
Rail switches 9 Each $25,000 $225,000 3 Each $25,000 $75,000 3 Each $25,000 $75,000
Empty Storage 20 acre $500,000 $10,000,000 10 acre $500,000 $5,000,000 5 acre $500,000 $2,500,000
Chassis Storage 5 acre $200,000 $1,000,000 5 acre $200,000 $1,000,000 0 acre $320,000 $0
Port Security & Customs 1,070 sf $150 $160,500 0 sf $150 $0 0 sf $150 $0
Maintenance ‐ General 15,000 sf $150 $2,250,000 15,000 sf $150 $2,250,000 0 sf $150 $0
Maintenance ‐ Cranes 6,000 sf $150 $900,000 6,000 sf $150 $900,000 0 sf $150 $0
Maintenance ‐ Shuttles 0 sf $150 $0 27,600 sf $150 $4,140,000 0 sf $150 $0
Maintenance ‐ Roadability 800 sf $150 $120,000 0 sf $150 $0 0 sf $150 $0
Administration Building 28,000 sf $225 $6,300,000 0 sf $225 $0 0 sf $225 $0
$ $ $ $ $ $Gate Assistance 250 sf $150 $37,500 250 sf $150 $37,500 0 sf $150 $0
IY Yard Office 250 sf $150 $37,500 250 sf $150 $37,500 0 sf $150 $0
Roadability canopy 2,550 sf $75 $191,250 0 sf $75 $0 0 sf $75 $0
Marine Building 1,800 sf $150 $270,000 900 sf $150 $135,000 900 sf $150 $135,000
Miscellaneous Site Paving 18 acre $200,000 $3,600,000 6 acre $200,000 $1,200,000 0 acre $200,000 $0
Elect. Transformers & Switchgear 2 Each $2,000,000 $4,000,000 2 Each $2,000,000 $4,000,000 2 Each $2,000,000 $4,000,000
Subtotal Site Costs $212,324,476 $94,707,495 $93,314,259
Container Cranes (new) 4 each $9,500,000 $38,000,000 4 each $9,500,000 $38,000,000 4 each $9,500,000 $38,000,000
Container Cranes (relocated) 4 each $2,250,000 $9,000,000 0 each 0 each
RTG Yard Cranes (CY & ICTF) 25 each $1,500,000 $37,500,000 4 each $1,500,000 $6,000,000 4 each $1,500,000 $6,000,000
ARMG Yard Cranes (CY) ‐‐ 18 each $2,500,000 $45,000,000 18 each $2,500,000 $45,000,000
Terminal Operating Software 1 each $3,000,000 $3,000,000 1 each $1,000,000 $1,000,000 1 each $1,000,000 $1,000,000
Automation Software Package ‐‐ 1 each $30,000,000 $30,000,000 1 each $500,000 $500,000
Shuttle Carriers (ARMG CY) ‐‐ 39 each $830,000 $32,370,000 42 each $830,000 $34,860,000
Reach Stackers 14 each $450,000 $6,300,000 2 each $450,000 $900,000 2 each $450,000 $900,000
MAJOR EQUIPMENT
Yard Hostlers and Trailers 67 each $150,000 $10,050,000 0 each $150,000 $0 3 each $150,000 $450,000
Fork Lift Trucks 6 each $260,000 $1,560,000 4 each $260,000 $1,040,000 2 each $260,000 $520,000
Subtotal Major Equipment $105,410,000 $154,310,000 $127,230,000
Subtotal Site + Equipment $317,734,476 $249,017,495 $220,544,259
Planning & Design Services 5 % Site + Equip. 5% $15,886,724 5 % Site + Equip. 5% $12,450,875 5 % Site + Equip. 5% $11,027,213
Construction Admin. & Mgmt. 5 % Site + Equip. 5% $15,886,724 5 % Site + Equip. 5% $12,450,875 5 % Site + Equip. 5% $11,027,213
Subtotal Project $349,507,923 $273,919,244 $242,598,685
Contingency 25 % Project 25% $87,376,981 25 % Project 25% $68,479,811 25 % Project 25% $60,649,671
Total Estimate (2009 $) $436,884,904 $342,399,055 $303,248,356
TOTAL PROJECT COST ESTIMATE

FINAL Report – Chapter 7
1 | P a g e
CHAPTER 7
WORK PLAN AND SCHEDULE EVALUATION
This Chapter summarizes TEC’s review of the current North Carolina International Terminal (NCIT) Work Plan and proposed schedule, to identify potential schedule improvements, cost saving measures, and phasing modifications. The development and permitting of the NCIT requires multiple phases, including the offsite roadway and railway access, upland terminal development, berth development including dredging, and the proposed shipping channel upgrade discussed previously in Chapter 4 (Interim Report No. 4). As discussed in previous chapters, it is assumed that all infrastructure upgrade costs associated with access to the terminal site will be outside of funding requirements for a private terminal developer/operator. While it is expected that the development of NCIT itself will be a joint effort by the North Carolina State Port Authority (The Authority) and the terminal developer, there are some permitting functions of the terminal area that will need to be addressed prior to the terminal development.
As previously described in Chapter 5, TEC’s Alternate Concept for terminal development is proposed in three phases. Phase 1 is projected to provide a capacity of 1,000,000 TEUs/year. Phase 2 will provide additional capacity to 2,000,000 TEUs annually, followed by an ultimate capacity of 3,000,000 TEUs per year at the completion of Phase 3.
Terminal Development
The development of NCIT will require coordination with state and federal regulatory agencies in order to obtain permits. Some of the agencies whose participation is necessary include the North Carolina State Department of Environment and Natural Resources, North Carolina State Department of Transportation (NCDOT), US Army Corp of Engineers – Wilmington District (USACOE), Brunswick County, and the Federal Government (USA). Additional organizations, which may play a pivotal role in the development of the terminal, include Military Ocean Terminal Sunny Point and CSX Corporation for the railway access and upgrades.
The Work Plan and proposed schedule provide a list of pre-design, engineering, and planning services necessary for the terminal development. The comprehensive list can be divided among different parties depending on their role and responsibilities in the terminal development. Even with a detailed and well planned terminal, the final configuration and management of the terminal will depend on the selection of a terminal developer. The following list of pre-design, engineering, and planning services and costs from the current Work Plan, as well as some additional services and costs identified by TEC, have the potential to be shared with the developer, once selected:
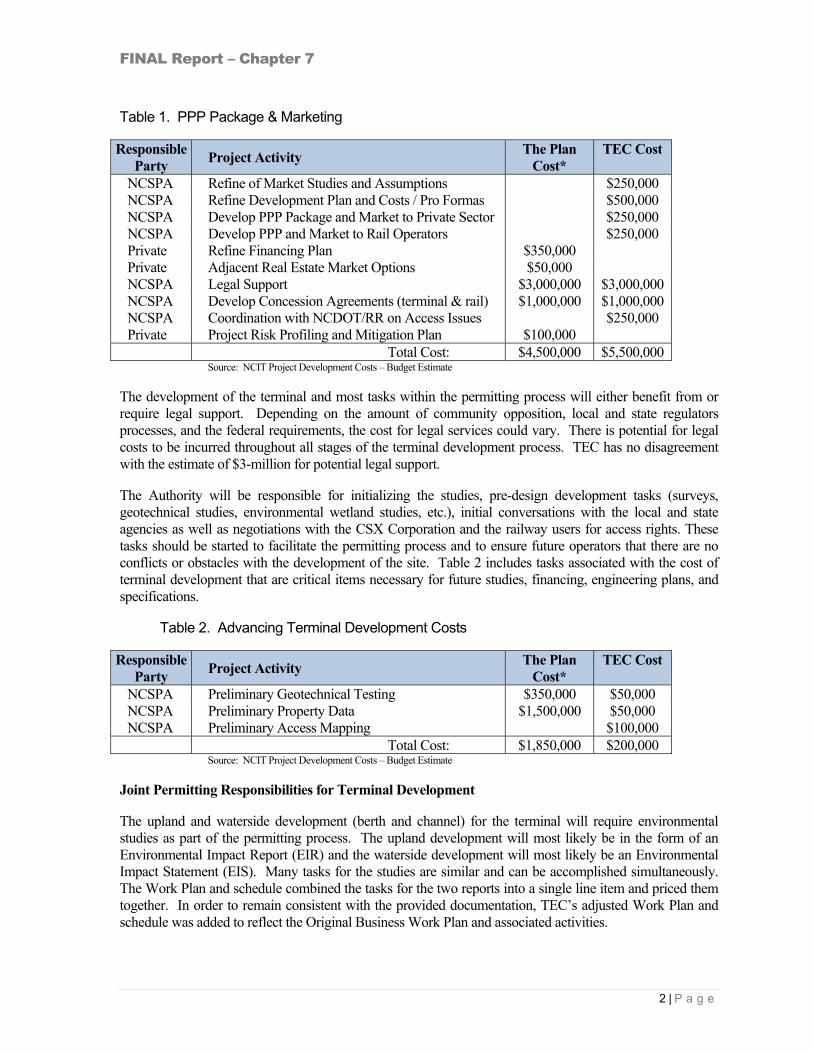
FINAL Report – Chapter 7
2 | P a g e
Table 1. PPP Package & Marketing
Responsible Party
Project Activity The Plan
Cost* TEC Cost
NCSPA Refine of Market Studies and Assumptions $250,000 NCSPA Refine Development Plan and Costs / Pro Formas $500,000 NCSPA Develop PPP Package and Market to Private Sector $250,000 NCSPA Develop PPP and Market to Rail Operators $250,000 Private Refine Financing Plan $350,000 Private Adjacent Real Estate Market Options $50,000 NCSPA Legal Support $3,000,000 $3,000,000 NCSPA Develop Concession Agreements (terminal & rail) $1,000,000 $1,000,000 NCSPA Coordination with NCDOT/RR on Access Issues $250,000 Private Project Risk Profiling and Mitigation Plan $100,000 Total Cost: $4,500,000 $5,500,000
Source: NCIT Project Development Costs – Budget Estimate
The development of the terminal and most tasks within the permitting process will either benefit from or require legal support. Depending on the amount of community opposition, local and state regulators processes, and the federal requirements, the cost for legal services could vary. There is potential for legal costs to be incurred throughout all stages of the terminal development process. TEC has no disagreement with the estimate of $3-million for potential legal support.
The Authority will be responsible for initializing the studies, pre-design development tasks (surveys, geotechnical studies, environmental wetland studies, etc.), initial conversations with the local and state agencies as well as negotiations with the CSX Corporation and the railway users for access rights. These tasks should be started to facilitate the permitting process and to ensure future operators that there are no conflicts or obstacles with the development of the site. Table 2 includes tasks associated with the cost of terminal development that are critical items necessary for future studies, financing, engineering plans, and specifications.
Table 2. Advancing Terminal Development Costs
Responsible Party
Project Activity The Plan
Cost* TEC Cost
NCSPA Preliminary Geotechnical Testing $350,000 $50,000 NCSPA Preliminary Property Data $1,500,000 $50,000 NCSPA Preliminary Access Mapping $100,000 Total Cost: $1,850,000 $200,000
Source: NCIT Project Development Costs – Budget Estimate
Joint Permitting Responsibilities for Terminal Development
The upland and waterside development (berth and channel) for the terminal will require environmental studies as part of the permitting process. The upland development will most likely be in the form of an Environmental Impact Report (EIR) and the waterside development will most likely be an Environmental Impact Statement (EIS). Many tasks for the studies are similar and can be accomplished simultaneously. The Work Plan and schedule combined the tasks for the two reports into a single line item and priced them together. In order to remain consistent with the provided documentation, TEC’s adjusted Work Plan and schedule was added to reflect the Original Business Work Plan and associated activities.
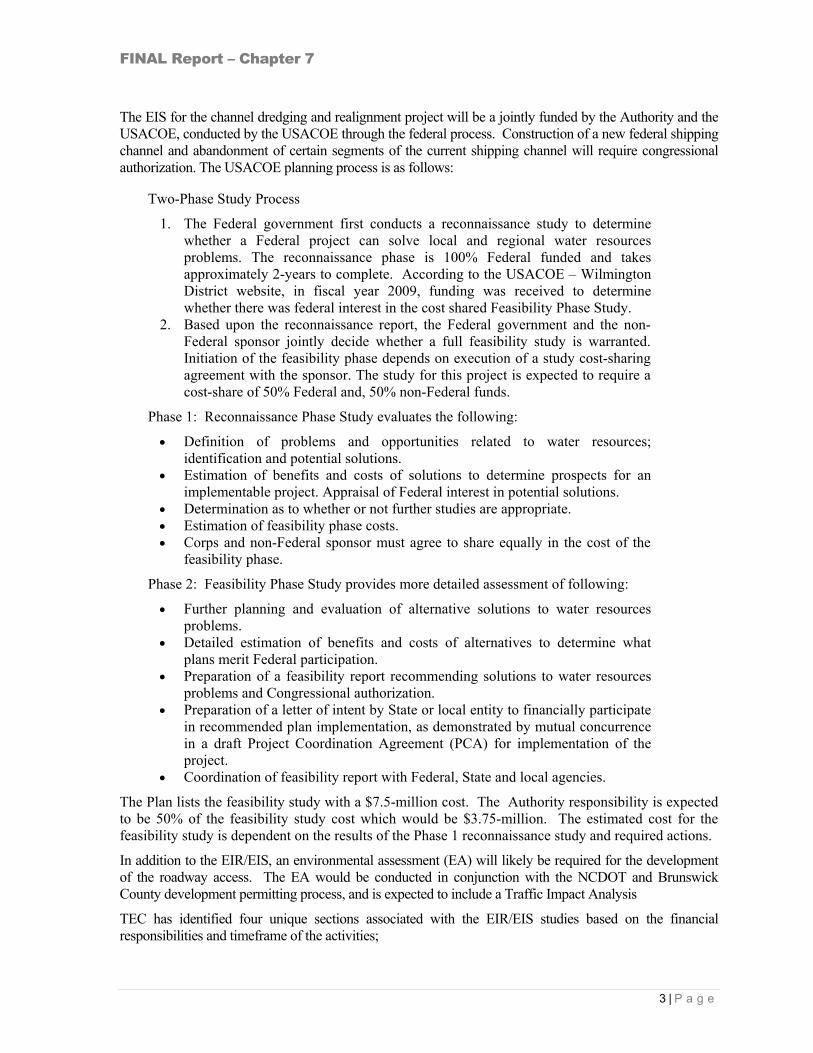
FINAL Report – Chapter 7
3 | P a g e
The EIS for the channel dredging and realignment project will be a jointly funded by the Authority and the USACOE, conducted by the USACOE through the federal process. Construction of a new federal shipping channel and abandonment of certain segments of the current shipping channel will require congressional authorization. The USACOE planning process is as follows:
Two-Phase Study Process
1. The Federal government first conducts a reconnaissance study to determine whether a Federal project can solve local and regional water resources problems. The reconnaissance phase is 100% Federal funded and takes approximately 2-years to complete. According to the USACOE – Wilmington District website, in fiscal year 2009, funding was received to determine whether there was federal interest in the cost shared Feasibility Phase Study.
2. Based upon the reconnaissance report, the Federal government and the non-Federal sponsor jointly decide whether a full feasibility study is warranted. Initiation of the feasibility phase depends on execution of a study cost-sharing agreement with the sponsor. The study for this project is expected to require a cost-share of 50% Federal and, 50% non-Federal funds.
Phase 1: Reconnaissance Phase Study evaluates the following:
Definition of problems and opportunities related to water resources; identification and potential solutions.
Estimation of benefits and costs of solutions to determine prospects for an implementable project. Appraisal of Federal interest in potential solutions.
Determination as to whether or not further studies are appropriate. Estimation of feasibility phase costs. Corps and non-Federal sponsor must agree to share equally in the cost of the
feasibility phase.
Phase 2: Feasibility Phase Study provides more detailed assessment of following:
Further planning and evaluation of alternative solutions to water resources problems.
Detailed estimation of benefits and costs of alternatives to determine what plans merit Federal participation.
Preparation of a feasibility report recommending solutions to water resources problems and Congressional authorization.
Preparation of a letter of intent by State or local entity to financially participate in recommended plan implementation, as demonstrated by mutual concurrence in a draft Project Coordination Agreement (PCA) for implementation of the project.
Coordination of feasibility report with Federal, State and local agencies.
The Plan lists the feasibility study with a $7.5-million cost. The Authority responsibility is expected to be 50% of the feasibility study cost which would be $3.75-million. The estimated cost for the feasibility study is dependent on the results of the Phase 1 reconnaissance study and required actions.
In addition to the EIR/EIS, an environmental assessment (EA) will likely be required for the development of the roadway access. The EA would be conducted in conjunction with the NCDOT and Brunswick County development permitting process, and is expected to include a Traffic Impact Analysis
TEC has identified four unique sections associated with the EIR/EIS studies based on the financial responsibilities and timeframe of the activities;

FINAL Report – Chapter 7
4 | P a g e
1. Upfront coordination and investigation studies 2. Cost shared activities with the USACOE 3. Upland Development EIS Activities 4. EIS Outcome Dependent Studies
The following table summarizes the tasks and costs associated with the environmental studies as seen by TEC:
Table 3. Joint NCSPA / USACOE Responsibilities Responsible
Party Project Activity
The Plan Cost*
TEC Cost
NCSPA Up‐front Coordination with USACE for Channel Reconnaissance / Feasibility/EIS
$250,000 $250,000
NCSPA Coordination for Scoping of Upland EIS with State Agencies
$250,000
USACOE Hydrographic and Bathymetric Surveys $500,000 USACOE USACOE Channel Reconnaissance Study1
Sub Total $750,000 $500,000

FINAL Report – Chapter 7
5 | P a g e
Cost Shared Activities (Assumed to be 50/50 Cost Share)
USACOE3 Channel Feasibility Study $7,500,000 $4,000,000 USACOE3 Channel EIS $3,500,000 $7,000,000 USACOE3 Public Draft EIR/EIS2 $500,000 USACOE3 Final EIR/EIS2 $500,000 USACOE3 Certification /Record of Decision2 $50,000 USACOE3 Permitting2 $1,000,000 USACOE3 NEPA Special Studies2 $500,000
USACOE3 Development and Permitting of Upland, near shore, and offshore dredge disposal sites2
$1,000,000
USACOE3 Beneficial Uses for Dredged Material2 $75,000 USACOE3 Dredge Management / Monitoring2 $250,000 USACOE3 Public Involvement2 USACOE3 Impact Mitigation Plan2 USACOE3 Wave and Wake Effects2 $50,000
USACOE3 Environmental and Regulatory Permitting Compliance Plan2
$100,000
USACOE3 Social Cost of Alternative Land Development Scenarios2
$35,000
USACOE3 Water Quality2 $200,000 USACOE3 Biology2 $75,000 USACOE3 Cultural Resources2 $50,000 USACOE3 Human Health Risk Assessment2 $50,000 USACOE3 Noise2 $75,000 USACOE3 Air Quality2 $125,000 USACOE3 Work Hazards2 $50,000 USACOE3 Dredged Material Management2 $500,000 USACOE3 River Waste Quality Modeling Study2 $500,000 USACOE3 Sediment Quality Evaluations2 $50,000 USACOE3 Mitigation monitoring Plan2 $75,000
Channel Feasibility Study/EIS Subtotal $16,810,000 $11,000,000
NCSPA Cost Share Subtotal $16,810,000 $5,500,000Footnote 1: 100% Federal Cost (Cost of Study $100,000) Footnote 2: Part of channel EIS Footnote 3: Cost shared with the NCSPA

FINAL Report – Chapter 7
6 | P a g e
Table 3. Joint NCSPA / USACOE Responsibilities (cont) Responsible
Party Project Activity
The Plan Cost*
TEC Cost
Upland Development EIS Activities NCSPA Upland Development EIR/EIS $4,000,000 NCDOT3 Upland Permitting and Agreements4
NCDOT3 Vehicular and Railroad Traffic and Transportation Assessment3
$250,000
NCDOT3 Corridor Alternative Analysis ‐ Rights of Ways, channel alignment, grade crossings4
$350,000
NCDOT3 Environmental Mitigation Site Survey4 $500,000 NCDOT3 Material Sourcing / Logistics Plan4 $150,000 NCDOT3 Adjacent Land Use Impact Plan4 $50,000
Upland EIS Subtotal $1,300,000 $4,000,000
EIS Outcome Dependent Studies
USACOE3 Permitting of Disposal Sites5 USACOE3 Subsurface Investigation Offshore of Site $500,000
EIS Outcome Activity Subtotal $500,000 $0
Permitting Studies Total $19,360,000 $15,500,000
NCSPA Permitting Responsibilities $19,360,000 $10,000,000 Footnote 3: Cost shared with the NCSPA Footnote 4: Part of upland EIS Footnote 5: Results of EIS will determine requirements.
A portion of the permitting task effort is typically included among the EIR/EIS tasks. Permitting support documentation consists of the approved EIR / EIS reports and background information. Dredge disposal sites, either upland, near shore, or offshore, have been previously approved and permitted for dredge disposal. A portion of the permitting effort for dredge disposal is handled during the EIR / EIS review process and coordination with the USACOE and local regulatory agencies and the cost for the task has been adjusted by TEC to reflect the anticipated permitting effort.
The Plan has line items for individual studies to be performed in addition to the EIR/EIS, these line items are listed in the Cost Shared Activities subsection of Table 3. Some of the listed additional studies are typically tasks performed during an EIR/EIS studies, such as:
Regional Road and Rail Logistics Subsurface Investigation Offshore of the Site Wave and Wake Effects Environmental and Regulatory Permitting Compliance Plan Social Cost of Alternative Land Development Scenarios Water Quality Study Biological Study Cultural Resources Human Health Risk Assessment Noise Study Air Quality Work Hazards

FINAL Report – Chapter 7
7 | P a g e
Dredged Material Management River Waste Quality Modeling Study Sediment Analysis Channel Alignment Alternative Analysis Mitigation Monitoring Plan
We believe these additional individual study costs are redundant, as they are typically already included in the EIR/EIS report line item. Using the information in Table 3, the tasks removed present a potential initial cost saving of $5,810,000.
The development of the terminal will require the terminal operator to perform some activities in order to customize the terminal for their operating and management style. These activities are the option of the terminal operator to perform. The activities and their estimated costs are listed in Table 4:
Table 4. Terminal Engineering & Planning
Responsible Party
Project Activity The Plan
Cost* TEC Cost
Private Terminal Operations Programming $500,000 Private Construction Phasing Plan $200,000 Private Detailed Program Schedule $200,000 Private Detailed Cost Estimate $200,000 Private Ongoing Evaluation of Project Economics $200,000 Private Business Plan Refinement $350,000 Private Vessel Mooring $35,000
Private Sustainable Land Development Best Practices Assessment and Incorporation Plan
$35,000
Private Project Implementation Assistance $250,000 Private Institutional Development Assistance $250,000 Private Regional Road and Rail Logistics $100,000
SECTION D Subtotal $2,220,000 $0
Summary
The development of the terminal is dependent on coordination with multiple parties. The EIS process for realignment of the channel and dredging of the current channel to accommodate the larger vessels is the most time intensive portion of the process.
The Work Plan developed in the existing NCIT Terminal Development Plan identifies costs and tasks associated with the development of the terminal, but does not associate responsibility for those tasks. Many of the tasks are cost shared between federal agencies and private entities. The Work Plan also lists tasks that are typically included as subtasks within the larger reports and studies while omitting some tasks that should be included with the cost estimate. It was not clear whether the identified costs were considered to be cost shared and if the unidentified tasks were included with the major task items. Table 5 - Comparison of Project Costs and Responsibilities identifies TEC’s alternative list of costs and cost sharing opportunities of the Work Plan.

DRAFT Report – Chapter 7
8 | P a g e
Table 5 – Comparison of Project Development Costs and Responsibilities
Responsible Party ACTIVITY ESTIMATED NCSPA
COSTS Foot Notes
Comments
NCSPA
Private Sector
USACOE NCDOT The Plan TEC
SEC
TIO
N A
- P
PP P
acka
ge a
nd M
arke
ting
X
Refine of Market Studies and Assumptions
$250,000 Current Marketing Work to be improved.
X
Refine Development Plan and Costs
$500,000
Finalize Development Plan and Cost Estimates and Pro-forms for PPP Package
X
Develop PPP Package and Market to Private Sector
$250,000
X
Develop PPP and Market to Rail Operators
$250,000
Need to privatize Rail Opportunity
X
Refine Financing Plan
$350,000
Included in development of PPP package
X
Adjacent Real Estate Market Options
$50,000
Optional Study by Private Sector
Legal Support $3,000,000 $3,000,000
X
Develop Concession Agreements (terminal and rail)
$1,000,000 $1,000,000 1
Legal support to finalize concession agreements
X
Coordination with NCDOT for Highway Access
$250,000
X
Project Risk Profiling and Mitigation Plan
$100,000
Part of PPP
SECTION A
Total $4,500,000 $5,500,000 NCSPA Costs
SE
CT
ION
B –
Adv
anci
ng T
erm
inal
D
evel
opm
ent D
ata
X Preliminary Geotechnical Testing
$350,000 $50,000 1 Only need Preliminary data on Terminal
X
Preliminary Property Data
$1,500,000 $50,000 1 Terminal Property Information
X
Preliminary Access Mapping
$100,000 1 Property information for Terminal Access
SECTION B Total
$1,850,000 $200,000

DRAFT Report – Chapter 7
9 | P a g e
SE
CT
ION
C –
P
erm
ittin
g S
tudi
es
X
Up-front Coordination with USACE for Channel Reconnaissance / Feasibility/EIS
$250,000 $250,000 1
X
Coordination for Scoping of Upland EIS with State Agencies
$250,000 1
X
Hydrographic and Bathymetric Surveys
$500,000 1 Assumed to Be USACE Cost
X
USACOE Channel Reconnaissance Study
100% Federal Cost (Cost of Study $100,000
SECTION C (Part one) Sub
Total $750,000 $500,000

DRAFT Report – Chapter 7
10 | P a g e
Responsible Party ACTIVITY ESTIMATED NCSPA
COSTS Foot Notes
Comments
NCSPA
Private Sector
USACOE NCDOT The Plan TEC
Cost Shared Activities (Assumed to be 50/50 Cost Share)
SE
CT
ION
C -
Per
mitt
ing
Stu
dies
X USACOE Channel Feasibility Study
$7,500,000 $4,000,000 All USACE Costs to be 50/50 Cost Shared
X USCOE Channel EIS $3,500,000 $7,000,000
X Public Draft EIR/EIS $500,000 Part of channel EIS
X Final EIR/EIS $500,000 Part of channel EIS
X
Certification /Record of Decision
$50,000
Part of channel EIS
X Permitting $1,000,000 Part of channel EIS
X NEPA Special Studies $500,000 Part of channel EIS
X
Development and Permitting of Upland, near shore, and offshore dredge disposal sites
$1,000,000
Part of channel EIS
X
Beneficial Uses for Dredged Material
$75,000
Part of channel EIS
X
Dredge Management / Monitoring
$250,000
Part of channel EIS
X Public Involvement 2,3 Part of channel EIS
X Impact Mitigation Plan 2 Part of channel EIS
X Wave and Wake Effects $50,000 2 Part of channel EIS
X
Environmental and Regulatory Permitting Compliance Plan
$100,000 2 Part of channel EIS
X
Social Cost of Alternative Land Development Scenarios
$35,000 2 Part of channel EIS
X Water Quality $200,000 2 Part of channel EIS
X Biology $75,000 2 Part of channel EIS
X Cultural Resources $50,000 2 Part of channel EIS
X
Human Health Risk Assessment
$50,000 2 Part of channel EIS
X Noise $75,000 2 Part of channel EIS
X Air Quality $125,000 2 Part of channel EIS
X Work Hazards $50,000 2 Part of channel EIS
X
Dredged Material Management
$500,000 2 Part of channel EIS
X
River Waste Quality Modeling Study
$500,000 2 Part of channel EIS
X
Sediment Quality Evaluations
$50,000 2 Part of channel EIS
X
Mitigation monitoring Plan
$75,000 2 Part of channel EIS
Channel Feasibility Study/EIS Subtotal
$16,810,000 $11,000,000
NCSPA Cost Share
Subtotal $16,810,000 $5,500,000

DRAFT Report – Chapter 7
11 | P a g e
Responsible Party ACTIVITY ESTIMATED NCSPA
COSTS Foot Notes
Comments
NCSPA
Private Sector
USACOE NCDOT The Plan TEC
Upland Development EIS Activities
SE
CT
ION
C -
Per
mitt
ing
Stu
dies
X
Upland Development EIR/EIS
$4,000,000
Private Sector Partner Should "reimburse" costs after completion of EIS Process (Concession Fees)
X
X Upland
Permitting and Agreements
Part of upland EIS
X
X
Vehicular and Railroad Traffic and Transportation Assessment
$250,000
Part of upland EIS
X
x
Corridor Alternative Analysis - Rights of Ways, channel alignment, grade crossings
$350,000
Part of upland EIS
X
Environmental Mitigation Site Survey
$500,000
Part of upland EIS
X
X Material Sourcing / Logistics Plan
$150,000 1 Part of upland EIS
X
X Adjacent Land Use Impact Plan
$50,000
Part of upland EIS
Upland EIS
Subtotal $1,300,000 $4,000,000
EIS Outcome Dependent Studies
X X
Permitting of Disposal Sites
Results of EIS will determine requirements.
X X
Subsurface Investigation Offshore of Site
$500,000
Results of EIS will determine requirements.
EIS Outcome
Activity Subtotal $500,000 $0
SECTION C - Permitting Studies
Total $19,360,000 $15,500,000
NCSPA Permitting Responsibilities
$19,360,000 $10,000,000

DRAFT Report – Chapter 7
12 | P a g e
Responsible Party ACTIVITY ESTIMATED NCSPA
COSTS Foot Notes
Comments
NCSPA
Private Sector
USACOE NCDOT The Plan TEC
SE
CT
ION
D -
Ter
min
al E
ngin
eeri
ng a
nd P
lann
ing
X Terminal Operations Programming
$500,000 Developer's option and responsibility.
X
Construction Phasing Plan
$200,000
Developer's option and responsibility.
X
Detailed Program Schedule
$200,000
Developer's option and responsibility.
X
Detailed Cost Estimate $200,000
Developer's option and responsibility.
X
Ongoing Evaluation of Project Economics
$200,000
Developer's option and responsibility.
X
Business Plan Refinement
$350,000
Developer's option and responsibility.
X
Vessel Mooring $35,000
Developer's option and responsibility.
X
Sustainable Land Development Best Practices Assessment and Incorporation Plan
$35,000
Developer's option and responsibility.
X
Project Implementation Assistance
$250,000
Developer's option and responsibility.
X
Institutional Development Assistance
$250,000
Developer's option and responsibility.
X
Regional Road and Rail Logistics
$100,000
Developer's option and responsibility.
SECTION D Subtotal $2,320,000 $0
PROJECT ACTIVITY
SUB-TOTAL $28,030,000 $21,200,000
CONTINGENCY (15%) $4,204,500 $3,180,000
TOTAL COST $32,234,500 $24,380,000
ANTICIPATED NCSPA COSTSECTION COST NOTES
PPP PACKAGING & MARKETING $5,500,000 Section A
ADVANCING TERMINAL DEVELOPMENT $200,000 Section B
PERMITTING STUDIES Section C
EARLY STUDIES $500,000
CHANNEL FEASIBILITY $5,500,000 Assumed 50/50 cost share
U UPLAND EIS $4,000,000
NCSPA SUB-TOTAL $15,700,000
CONTINGENCY (15%) $2,355,000
TOTAL $18,055,000
Foot Notes
1 The costs shown for these tasks are from the NCIT Work plan and TEC concurs that they are reasonable estimates.
2
These items are studies and tasks which are required actions under the EIR/EIS process and are therefore part of the EIR/EIS cost.
3
Public Involvement is the cost associated with attendance and participation in public meetings. The Plan did not appear to have a line item cost associated with this task.

North Carolina International Terminal
Project Development Costs
Budget Estimate
Project Year # # # # # # # # # # # #
DRAFT Project Phase Development Phase Development Phase Development Phase Development Phase Development Phase Development Phase Development Phase Development Phase Construction Phase Construction Phase Construction Phase Start of Ops
Key MilestoneR
e
c
R
e
c
Approp for
FeasibilityFeasbility Study Feasbility Study Feasbility Study
Concessionaire
SelectedPermits Complete Construction Start
Construction
Complete
Program Task, Work Item or Study Budget Estimate
($000's)Totals ($000's) Notes
-9 -8 -7 -6 -5 -4 -3 -2 -1 0
Adjacent real estate market analysis $50 Nominal effort assumed to be required 50$
Terminal operations programming $500 Represents a detailed evaluation & simulation of all planned
operational compnents 500$
Comprehensive community participation and outreach Assumes increasing community outreach activities over the
course of the development cycle, and into construction. X X X X X X X X X X X
Geotechnical testing and analysis $350 Subsurface investigation efforts primarily on landside assets 350$
Initial Program Management to help with scoping for
Reconn/early Feasibility
$250
83$ 83$ 83$
Project risk profiling and mitigation planning $100 Prelminary efforts required to identify unique risks, and mitigate
early in the process 100$
Sub Total $1,250
Detailed North Carolina International Terminal master
plan
Further refinement of the infrastructure report, providing detailed
development plans for the NCIT facility - tying project to financing
alternatives X X X X X
Corridor Alternatives Analyses; right of way, channel
alignment, grade crossings
$350 Detailed alternatives analyses of off-site infrastructure features
350$
Surveys (landside, terminal, roadway, and rail) $1,500 Land survey of terminal and landside access corridors 750$ 750$
Support for government funding Assumes ongoing activities to capture State and Federal funding
for key components of the project - across a seven year
development cycle X X X X X X X X 100$
Adjacent land use and impact plan $50 Recognizes some effort may be required to mitigate potential
impacts to adjacent properties - however, current industrial
zoning indicates this may be a minor effort 50$
Construction phasing plan $200 A detailed construction phasing plan will be required to integrate
the major components of the project, to be refined over time200$
Detailed program schedule $200 A detailed project schedule will be required in order to command
time commitments, detail critical paths, and focus resources200$
Detailed cost estimate $200 The concept level cost estimate will need to be further developed,
and refined against the construction phasing plan 200$
Materials Sourcing / logistics plan $150 A sourcing study will be required for each of the major project
elements - assumes terminal, roadway, and railway upgrades -
integrates with cost estimate 150$
Ongoing evaluation of project economics $200 Assumes consistent update to economic model, as cost data
continues to be refined 67$ 67$ 67$
Financing plan $350 A detailed financing strategy and plan will be required for
elements not to be included under the concession - important to
demonstrate that related infrastructrue will be committed to 175$ 175$
Business plan refinement $350 As the market continues to evolve, the concept level business
plan will continue to evolve - continuously improving the level of
detail included 117$ 117$ 117$
Integration of stakeholder and community
requirements / partnerships
Involves coordination with stakeholder and community needs,
development of a coordination plan, and future implementation of
common infrastructure opportunities X
State and local infrastructure improvements Plan for incorporation of resultant State and local infrastructure
improvements, indentified from stakeholder and community
requirements / partnerships X
Social Cost of Alternative Land Development
Scenarios (SCALDS)
$35 Study to verify highest and best use, from a social sustainability
perspective 35$
Environmental and regulatory permitting compliance
plan
$100 Development of the strategy to ensure compliance with
regulatory requirements 100$
Sustainable land development best practices
assessment and incorporation plan
$35 Study to document those land development practices that will be
implemented throughout the course of the project 35$
Memorandum of cooperation with ILWU (semi-
automated/automated terminal)
Negotiation and agreement with ILWU on terminal labor
operations, staffing, etc. X
Project labor agreement Negotitation and agreement with construction labor on
requirements during construction of the project X
Program controls A comprehensive program controls system should be developed
for monitoring progress, ensuring cost and schedule compliance,
and meeting quality standards X
Program Management, Implementation / Coordination Assumes appropriate level of program management throughout
seven year development program X X X X X X X X X X
Project implementation assistance (commissioning
plan)
$250
250$
Institutional development assistance $250 Assumes a level of coordination will be required at the
organizational level - recognizing that a portion of existing
container business would be potentially relocated 250$
Vessel mooring $35 A mooring analysis would be necessary to finalize unique
structural requirements for the wharf design 35$
Wave and wake effects $50 Necessary for both mooring analyses, and preliminary
environmental impacts 50$
Subsurface inspection offshore of the site $500 Geotechnical analysis of underwater features, data to be used in
channel design 500$
Regional road and rail logistics plan $100 100$
Sub Total $4,905
Concession marketing, RFP development, and
implementation
A detailed RFP strategy will be required to secure the concession
- this would involve development of the RFP, information
memoranda, conducting meetings, and responding to questionsX X
Contract documents and concession agreements $1,000 Concession negotiations, contract development, signing, etc. 500$ 500$
Sub Total $1,000
Pre-Design
Engineering and Planning Services
NEPA review and Permitting
Privitization
Ayers Draft_Development_Costs_with_Expenditure_Timeline 05-2009.xls **DBOFM 5/28/2009

North Carolina International Terminal
Project Development Costs
Budget Estimate
Project Year # # # # # # # # # # # #
DRAFT Project Phase Development Phase Development Phase Development Phase Development Phase Development Phase Development Phase Development Phase Development Phase Construction Phase Construction Phase Construction Phase Start of Ops
Key MilestoneR
e
c
R
e
c
Approp for
FeasibilityFeasbility Study Feasbility Study Feasbility Study
Concessionaire
SelectedPermits Complete Construction Start
Construction
Complete
Program Task, Work Item or Study Budget Estimate
($000's)Totals ($000's) Notes
-9 -8 -7 -6 -5 -4 -3 -2 -1 0
Pre-DesignSpecial Studies Required for NEPA $500 A contingency factor to cover special studies that are not
identified herein. 125$ 250$ 125$
Vehicular and Railroad Traffic and Transportation
Assessment
$250 Traffic impact analyses required for NEPA
250$
Water Quality $200 Assessment of water quality impacts associated with vessel
navigation, with focus on Nuclear Plant intake channel 200$
Biology $75 Assessment of Biological resources associated with waterside
and landside 75$
Cultural Resources $50 Assumes little to no potential findings in Native American nor
other Cultural resources at the site. 50$
Human Health Risk Assessment $50 Assumes little to no potential health risks, however must be
developed 50$
Noise $75 Noise pollution study 75$
Air Quality $125 Air Quality study 125$
Hazards $50 Other potential hazards - during construction and long-term
operation 50$
Administrative Draft EIR/EIS $3,500 The DEIS document. development, field work, and incorporation
of special studies - assumes Section 203 work is separate for the
Channel effort only. 1,750$ 1,750$
Public Draft EIR/EIS $500 The DEIS document, ready for public comment 500$
Final EIR/EIS $500 The FEIS document 500$
Mitigation Monitoring Plan (MMP) $75 Implementation of the preliminary stages of mitigation and
monitoring requirements identified within the FEIS 75$
Certification/Record of Decision $50 Efforts required to compelte the Record of Decision 50$
Permitting $1,000 Permit applications, submittal of supporting documentations, etc.
Assumes EIS and Sec. 203 efforts provide substantial support in
documentation requirements 1,000$
USACE Feasibility Study (channel) $7,500 The study effort to engage USACE, ultimately resulting in
Federal interest in the Channel development 1,875$ 1,875$ 1,875$ 1,875$
Dredged Materials Management $500 A dredged materials management plan will be required, however
it is assumed that the majority of supporting documentation
would come from the Section 203 Study 500$
Environmental Mitigation Site Survey $500 Begin to address wetland mitigation needs 500$
River Waste Quality Modeling Study $500 Begin to address the river water quality through modeling 500$
Development and permitting of upland, near shore,
and offshore dredge disposal sites
$1,000 Allowance for special permitting for dredged material disposal,
wetlands fill, etc. 500$ 500$
Sediment quality evaluations $50 Special study to investigate quality of potentially dredged
sediments 50$
Hydrographic and Bathymetric Surveys $500 Waterside surveys 500$
Beneficial uses for dredged materials $75 A special study to indepently evaluate beneficial use of dredged
materials for construction of the terminal, roadways, etc.75$
Dredge management/monitoring $250 Implementation of the preliminary stages of dredged material
management monitoring, as required by the permits 250$
Sub Total $17,875
Port Staff engagement Port staff involvement will be required across the assumed eight
year development cycle - assumed as 3 FTE's across the seven
year period X X X X X X X X
Legal Support $3,000 Assumed to be required at the contract development / negotiation
phase, however would involve some involvement across the eight
year development cycle 500$ 1,000$ 1,000$ 500$
Sub Total $3,000
Contingency for Unknowns (15%) $4,205 Contingency on all costs identified, plus port staff engagement -
contingency factor assumed at 15% 294$ 527$ 1,174$ 1,171$ 553$ 461$ -$ 15$ -$ -$
Sub Total $4,205
Total Budget Estimate (Project Development Costs) $32,235 Total Budget Estiamate for Project Development Costs
Total Budget Estimate - Project Development
Costs
$32,235
83$ 83$ 2,252$ 4,037$ 9,003$ 8,980$ 4,236$ 3,536$ -$ 115$ -$ -$
Contingencies for Unknowns
Total Budget Estimate
Port Administration Requirements
Ayers Draft_Development_Costs_with_Expenditure_Timeline 05-2009.xls **DBOFM 5/28/2009