review of exports trends and policies - chapter -2
TRANSCRIPT
13
This section begins with a review of India’s export performance by looking at India’s export growthin the last decade, at changes in the composition of the export basket, and the trends in the shareof India’s major export destinations. Next, the world trade performance for the same period andthe key factors influencing it have been examined. Then there is a brief review of the past exportstrategies. Finally a summary of this section is given at the end of this chapter.
2.1 Importance of Foreign Trade for India
The importance of Foreign Trade for India can be gauged from an analysis of certain macroeconomic indicators relating to foreign trade and the growth of the economy.
2.1.1 Foreign Trade and GDP.
Table 2.1.1 Foreign trade as a percentage of GDP
Period
1985-86
1990-91
1995-96
1999-2000
2000-01
10.99
13.32
19.28
19.15
21.8#
*GDP at market prices# GDP at factor cost
As is evident from the Table above, the contribution of external trade of India to the total GDP atmarket prices is nearly 20%. Over a period of time i.e., in the last 15 years, the contribution ofexternal trade to GDP has nearly doubled. It is further seen that the magnitude of the increase inthe contribution of foreign trade to GDP is higher during the last 10 years i.e., post reform period.By breaking the last 15 years into three time periods i.e., second half of 1980s, the first half of1990s and the second half of 1990s, it is seen than the average annual proportion of foreigntrade as a percentage of GDP is highest at 18.8% during 1995-96 to 1999-2000 followed by15.34% during 1990-91 to 1994-95. It is only 11.32% during the second half of the 80s. Thus,during the post-reforms period the contribution of foreign trade to the growth of the economy hasbeen quite significant. This has been more so in the latter half of 1990’s.
Further analysis has been made to see whether such an increased share of foreign trade to GDPhas arisen more out of the growth of exports or imports.
Chapter-2
Review of Export Trends and Policies
Percentage of GDP

14
Table 2.1.2 Exports and Imports as a percentage of GDP
*GDP at market prices# GDP at factor cost
Although value of imports as % of GDP is higher at 11% during 1999-2000 as against exports asa % of GDP at 8.15%, the increase in their respective contribution to GDP during the last 15years has been more or less the same at about 4%. In 2000-01, however exports as apercentage of GDP was 10.2% and imports was 11.6% which shows that both have becomeequally important as a percentage of the GDP.
2.1.2 Role of exports in financing country’s imports
The financing of country’s imports is increasingly made out of our export earnings throughout theperiod 1985-86 to 2000-01 which is evident from the Table given below.
Table 2.1.3 Exports as a percentage of Imports
It is thus evident that the increase in the export earnings of the country has been made use of tofinance our growing imports. It also implies that our dependence on other sources of foreignexchange to finance our imports has declined during the last 15 years. This is a vindication of thereforms undertaken on the trade front wherein not only the quantitative restrictions have beengradually removed but also the import tariffs has been gradually reduced.
Period Exports as % of GDP* Imports as % of GDP*1985-86 3.92 7.07
1990-91 5.72 7.59
1995-96 8.95 10.33
1999-2000 8.15 11
2000-01 10.1# 11.6#
Period Exports as % of Imports1985-86 55.42
1990-91 75.36
1995-96 86.69
2000-2001 88.17

15
2.1.3 Composition of India’s imports
Table 2.1.4 Major Imports of India
1994-95 2000-01Petroleum crude & products 20.69 31.53Pearls precious & semi 5.72 9.69Precious stonesMachinery 15.03 8.24Organic & Inorganic chemicals 7.46 4.91Electronic Goods 4.29 7.06Gold & Silver 2.49 8.92
It is seen that during the second half of the 1990s, there has been a shift in the commoditycomposition of major items of imports. The proportion of imports of items that are related toexport production has increased. The rise in the percentage of imports of Pearls, Precious &semi-precious stones, and Electronic goods to the total imports are pointers in this case. It isalso important to note that the share of the value of import of Petroleum crude to the total importshas gone up by nearly 10% mostly on account of the rise in oil prices.
Besides the above, there are the other usual effects like effect on Balance of Payments,employment and other linkage effects.
2.2 India’s export performance
During the last decade of reforms, India’s exports have performed well. Positive policy measurescombined with robust growth of world trade have led to this improved performance. Comparedto pre-liberalization period, India’s export to GDP ratio has increased from 5.8% in 1991-92 to10.1% in 2000-01 and the export growth rate has increased from -1.5% in 1991-92 to 21% in2000-01. The export growth rate, however, has not been steady during this decade; the rate washigh during 1993-94, 1994-95 and 1995-96 at 20%, 18.4% and 20.8% respectively, but declinedsharply in 1996-97 to 5.3% and became negative in 1998-99 on account of South East Asiancrisis and worldwide recession. It again recovered to 10.8% in 1999-00 and reached thehighest growth for the decade at 21% in 2000-01. However, the global economic slowdownand the events of September 11 have led to a steep fall in the rate of growth of exports during2001-02. Liberalisation & trade reforms have also led to a compositional change in India’sexport basket. Analysis of our export basket indicates an increase in the share of manufacturedgoods along with an overall widening and diversification of exports.
Percentage share to total imports

16
· Reduction in level of tariffs
· Removal of product-specific export incentives, coupled with a two-stage devaluationof the rupee
· Simplification of export-import policies & procedures
· Removal of quantitative restrictions on imports to remove anti-export bias
As a result of these and other measures taken by the Government and the favourable world tradeenvironment, the export sector has shown buoyant growth during this decade. Except for 1998when both the world exports and India’s exports showed a negative growth rate, India’s exportgrowth rate has been higher than world export growth rates as can be seen in the following table.
Graph 2.2.1 India’s Exports as percentage of World exports
Table 2.2.1 Export Growth Rate of India and World
Source: WTO International trade statistics 2001
2.2.1 Impact of liberalization
An important thrust of the new policy measures undertaken from 1991 was to integrate the Indianeconomy with the global economy with greater emphasis on India’s external trade. A series ofpolicy measures aimed at liberalizing the economy included the following:
Year World’s Export Growth India’s Export Growth Rate Rate
1995 19.67 22.41
1996 5.28 8.10
1997 3.55 5.75
1998 (-)1.63 (-)4.48
1999 3.95 8.61
2000 12.4 16.46

17
Further, the liberalisation of trade policy has also increased the openness of India’s economy asmay be seen from the index of openness i.e. trade as a percentage of GDP. The index initiallydeclined from 12.22 % in 1950 to 6.9% in 1970-71 as a result of various inward looking policies.However, due to the gradual opening of the economy during 1980s, the ratio increased to 13.32%in 1990-91 and after the trade liberalisation measures, it further improved to 19.15% in1999-2000. Exports as a percentage of GDP, has also increased from 5.8% in 1991-92 to10.1% in 2000-01. A comparison of India’s trade performance in 2000-01 with 1991-92 is givenbelow:
Table 2.2.2: Comparison of India’s Export Performance
1991-92 2000-01
Exports (% of GDP) 5.8% 10.1%***
Export Growth rate (%) -1.5% 21.0%
Index of Openness
(Trade as a percentage of GDP) 13.32%* 19.15**
* Pertains to 1990-91**Pertains to 1999-00***GDP is taken at factor cost
In fact, India’s share in world exports increased from 0.41% in 1992-93 to 0.6% in 1998-99 andto 0.67% in 2000
2.2.2 Export performance
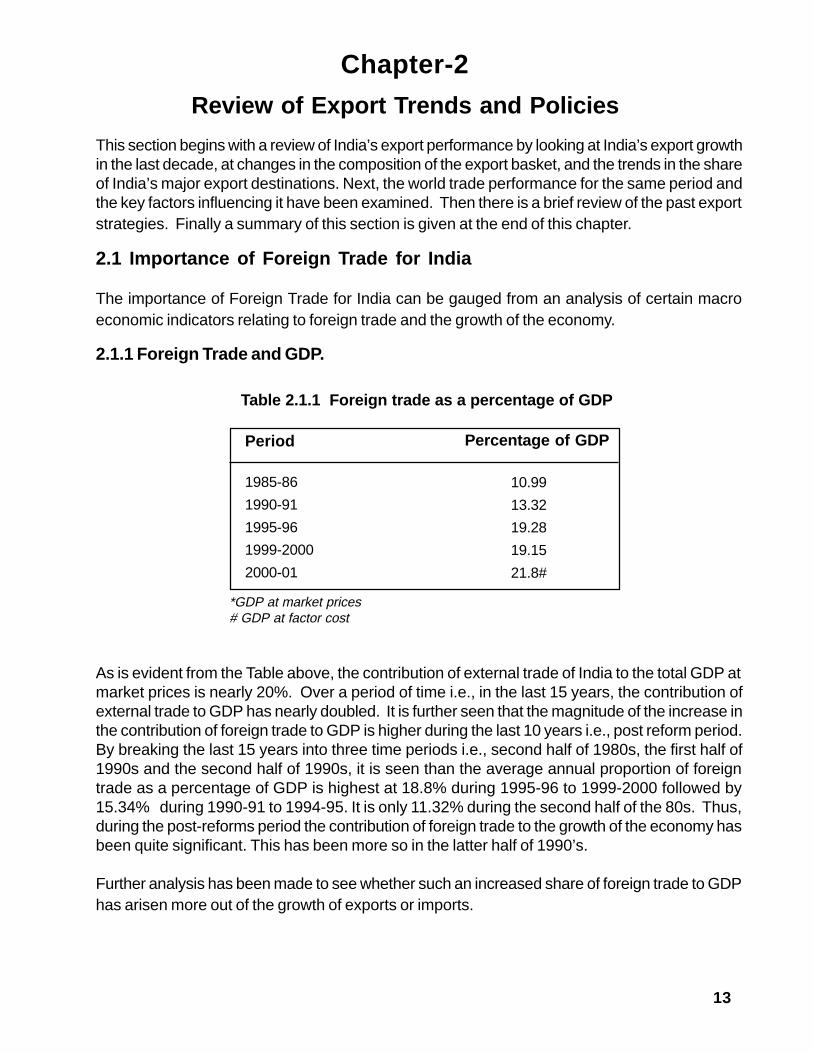
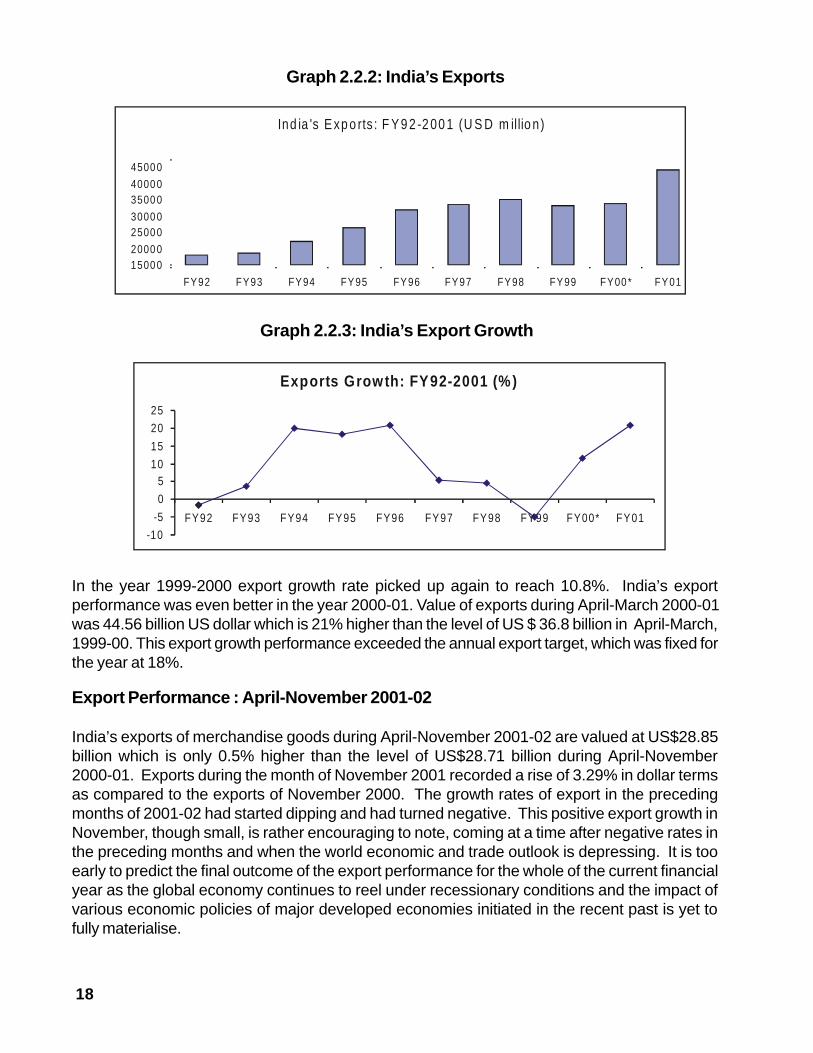
During the last decade, India’s export performance has been commendable and exports haverisen from USD 18 billion in 1991-92 to a leval of USD 44.56 billion in 2000-01. The trend startsfrom a negative export growth in 1991-92, the year when liberalisation efforts started in full swingand can be divided into 3 distinct time periods (refer Annexure table 2.1)
In the first five years i.e. 1991-92 to 1995-96, the export growth rate averaged around 12.28%with the highest of 20.8% achieved in 1995-96. The good performance could be attributed tothe favorable international economic situation and domestic reforms.
In the next three years, however, export growth rate sharply declined with growth rate at 5.3% in1996-97 and becoming negative in 1998-99 on account of the South East Asian crisis.
18
Graph 2.2.2: India’s Exports
Graph 2.2.3: India’s Export Growth
In the year 1999-2000 export growth rate picked up again to reach 10.8%. India’s exportperformance was even better in the year 2000-01. Value of exports during April-March 2000-01was 44.56 billion US dollar which is 21% higher than the level of US $ 36.8 billion in April-March,1999-00. This export growth performance exceeded the annual export target, which was fixed forthe year at 18%.
Export Performance : April-November 2001-02
India’s exports of merchandise goods during April-November 2001-02 are valued at US$28.85billion which is only 0.5% higher than the level of US$28.71 billion during April-November2000-01. Exports during the month of November 2001 recorded a rise of 3.29% in dollar termsas compared to the exports of November 2000. The growth rates of export in the precedingmonths of 2001-02 had started dipping and had turned negative. This positive export growth inNovember, though small, is rather encouraging to note, coming at a time after negative rates inthe preceding months and when the world economic and trade outlook is depressing. It is tooearly to predict the final outcome of the export performance for the whole of the current financialyear as the global economy continues to reel under recessionary conditions and the impact ofvarious economic policies of major developed economies initiated in the recent past is yet tofully materialise.
Ind ia 's E xp o rts : F Y 9 2 -2 00 1 (U S D m illio n)
1500 02000 0
2500 03000 0
3500 04000 0
4500 0
FY92 FY93 FY94 FY95 FY96 FY97 FY98 FY99 FY00 * FY01
Exports Growth: FY92-2001 (%)
-10
-5
0
510
15
20
25
FY92 FY93 FY94 FY95 FY96 FY97 FY98 FY99 FY00* FY01
19
It is worth recounting the latest international figures in this context. Preliminary figures of globaltrade for the first half of 2001 indicate that deceleration in trade growth in 2001 will be muchsharper than previously expected. Factors behind the downward revision include theunexpectedly strong slowdown in demand growth in Western Europe, the stagnation of importsinto the USA and the repercussions of the dramatic down turn in production and investment in theinformation technology industry world wide. According to preliminary data, the value of worldtrade increased by only 1% in the first half of 2001, after an increase of 12.5% in 2000. Growthin the value of North America’s trade decelerated further in the first quarter of 2001, and in thesecond quarter both imports and exports were below the levels of the previous year. West Europe’smerchandise exports and imports are estimated to have increased by only 2.5% and1.5% respectively in value during the first half. Japan and the Asian developing countriesreported double digits percentage decline in the value of their merchandise exports and importsin the second quarter of 2001. Hong Kong’s exports declined by 5.3% in HK$ terms duringJanuary - November 2001 as compared to the corresponding period of the previous year. SouthKorea’s exports registered a negative growth of 10.7% during the first three quarters of 2001 i.e.January-September as compared to the corresponding period of the previous year. Recentindicators confirm that South Korea is in the grip of global slow down which is exposing its overdependence on exports particularly of semi-conductors. Singapore’s second quarter’s resultreveals, that the city-States’ economy had slipped into a technical recession - defined as twoconsecutive quarters of contracting GDP. Non-oil domestic exports remained in the negativeterritory in November 2001 by 21% on a year-on-year basis. Electronic exports which accountsfor 2/3rd of total exports of Singapore shrunk by 32% year on year basis. Malaysia’s exports aresimilarly reported to have witnessed a negative growth of 9.8% in national currency terms duringthe first 10 months of the current year as compared to the corresponding period of the previousyear.
It has been reported that the main impact of the brake on the global economy on China has beenthe slow down of its export growth. The export growth has declined from 27.8% in 2000 to 14.6%in the first quarter of 2001 and 4.6% in the second quarter. Exports expanded only by 6.3% in thefirst 11 months of 2001 compare to the same period last year. According to the projections ofexports made by OECD for some major economies of the world, many important importingeconomies are likely to end up with negative growth of exports in 2001. They are as follows : -3.4% (8.7%) for Canada, -5.2% ( 11.3%) for USA, -10% (9.4%) for Japan and -0.3% (9.4%) fortotal OECD Countries. Figures in Parentheses give the export growth rate in the previous years.
In view of the slow down and projections indicated above, the export targets of India has beenscaled down to 3% from a level of 12% which was originally envisaged at the beginning of thecurrent financial year. This revision of export target was made after due consultations with thevarious export promotion agencies, the industry and trade. On a comparative basis, India’sexports have not faired too badly during the current year compared to the Asian economies.While world trade grew by 1% in January-June 2001, India’s exports grew by 8.6% during thecorresponding period. The slow down prompted the Government to think about some shorttermmeasures. Some of the recent measures taken to promote exports include reduction in theexport credit rate for both pre-shipment and post-shipment, special financial package tomanufacturer exporters with an export contract of Rs.100 crore or above for a period of one year
20
The lessons from the experience of the export sector in the current year are that duringthe period when our export performance is affected owing to global factors, the downslide needs to be immediately addressed by resorting to short term interventions in theform of policy measures to enable Indian exporters to remain competitive. However, theshort term interventions may alone not be sufficient to sustain the growth for which astable and strategic medium term perspective is essential.
2.2.3 India’s export basket: Commodity Composition
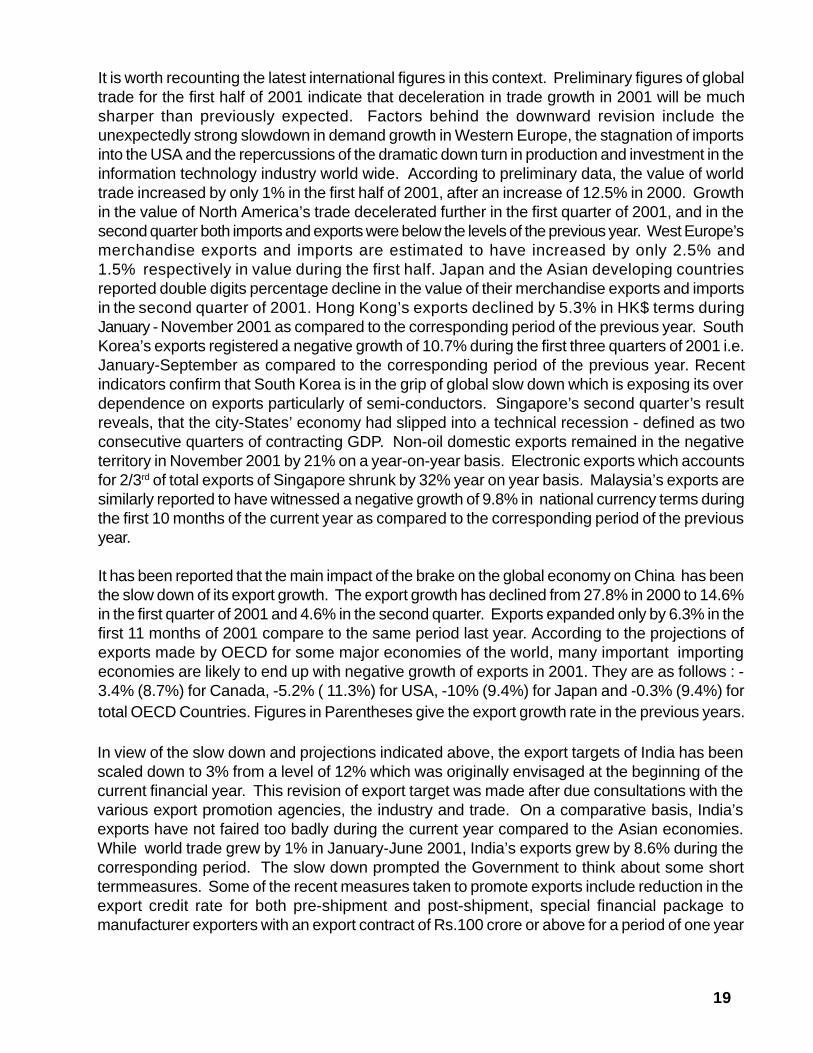
A compositional change has been witnessed in the export basket with the opening up of theeconomy. The Commodity composition of our export basket can be divided into three maincategories: Agriculture and allied products, ores and minerals and Manufactured goods (referTable 2.2 in annexure). The commodity composition in the 1990s shows that the share ofmanufactured products increased from 75% in 1991-92 to 83% in 2000-01.
Graph 2.2.4 Share of exports – Commodity wise grouping
from October 2001, extension of normal repatriation period from 180 days to 360 days forexports for a period of one year and upward revision of duty draw back rates on a number ofproduct groups. All this and other factors have helped to arrest the declining trend in exportsexperienced during the early part of the current financial year.
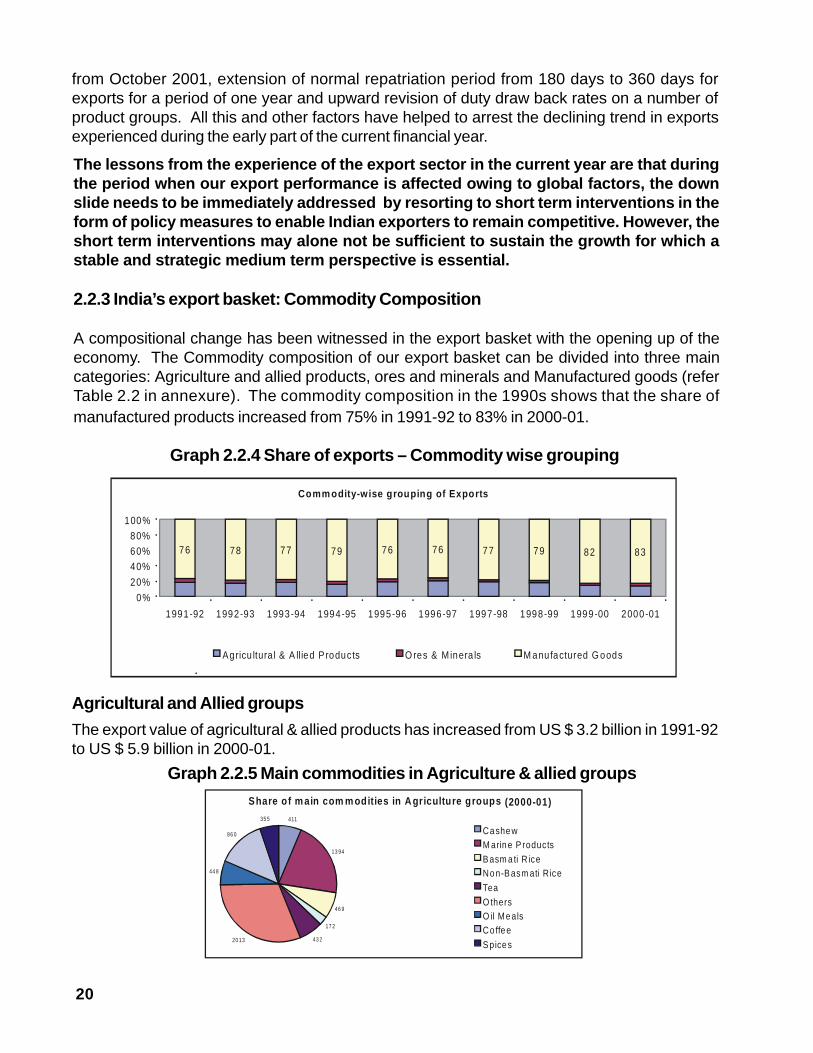
The export value of agricultural & allied products has increased from US $ 3.2 billion in 1991-92to US $ 5.9 billion in 2000-01.
Graph 2.2.5 Main commodities in Agriculture & allied groups
Agricultural and Allied groups
Comm odity-w ise grouping of Exports
76 78 77 79 76 76 77 79 82 83
0%
20%
40%
60%
80%
100%
1991-92 1992-93 1993-94 1994-95 1995-96 1996-97 1997-98 1998-99 1999-00 2000-01
Agricu ltura l & A llied Products O res & M inera ls M anufactured G oods
Share o f m ain com m odities in A g riculture g roups (2000-01)411
13 94
46 9
17 2
43 220 13
44 8
86 0
35 5
CashewM arine P roducts
B asm a ti R iceNon-B asm ati Rice
Tea
O thersO il Meals Co ffee
S pice s

21
An analysis of growth rates within the Agriculture and Allied group during the 1990’s indicatesthat the growth of individual item is varying and can be grouped into four sub-groups as givenbelow:
Steady growth items: The major items for which export values have increased over the decadeare marine products, spices, cashew and basmati rice. Others that are not indicated in the graphbut have shown high growth are pulses, sesame and niger seeds, meat preparationsand sugar & molasses.
Negative growth items: Tea, nuts and seeds are items whose export values have actuallydeclined over this period.
New high growth items: Some items of which export value was low in 1991-92 but that haveconsistently grown in strength since then are non-basmati rice, castor oil, processed fruits andjuices, floriculture products, meat and meat preparations, etc.
Other items with inconsistent growth : Exports of some items have been fluctuating during thisperiod. These are sugar and molasses, fruits and vegetables, manufactured tobacco products,groundnuts etc.
Ores & Minerals
In the group ores and minerals, Iron ore is the main constituent and comprises 30.82% of thevalue. Other items include Mica, Coal, and processed minerals. In the last decade, a substantialfall in export value (from US $ 0.58 billion in 1991-92 to US $ 0.36 billion in 2000-01) has beenwitnessed in case of iron ore. Mica is another item where exports fell sharply. However, exportsof processed minerals and other ores and minerals increased in value during the decade.
Manufactured goods
India has improved its share of manufactured goods. The export value of manufactured goodshas increased from USD 13 billion to around USD 35 billion during 2000-01.
The top ten items of exports in the manufactured goods groups are Gems & Jewellery;Ready-made Garments; Textile yarn, Fabrics & made-up; Leather & Leather manufactures; Drugs,Pharma & Fine Chemicals, Machinery & Instruments; Manufactures of Metals and Rubber manufacturedproducts. Together these constitute 58.5 % of this group in value terms during 2000-01.

22
An analysis of growth rates within the Manufactured Goods group shows that most of the items inthe manufacturing group have shown an increasing trend throughout the decade and can begrouped into four sub-groups as given below
High growth, High value items : The high value, high growth items are Gems & Jewellery,Manufactures of Metals, Drugs, Pharma & Chemicals and Textiles.
Gems & Jewellery improved its export value from USD 2.75 billion to USD 7.4 billion over thedecade. Moving from an insignificant position in the 80s, it has become the second most importantconstituent with a share of 17% in 2000-01.Drugs, Pharma & Chemicals have increasedfrom USD 0.6 billion in 1991-92 to USD 1.91 billion in 2000-01. Manufactures of metals haveincreased from USD 0.5 billion in1991-92 to USD1.6 billion in 2000-01. Machinery & Instrumentshave increased from USD 0.6 billion in 1991-92 to USD 1.6 billion in 2000-01.Transportequipments have increased from USD 0.5 billion in 1991-92 to USD 0.98 billion in 2000-01.Textiles comprising Readymade Garments and Yarn together have increased from 4.03 billion to10.4 billion in 2000-01.A comparison of the export baskets reveals that textiles improved itsshare from 22.6% in 1991-92 to 24.4% in 2000-01.
Fast growing, lower value items : Inorganic Chemicals & Agrochemicals and Handicrafts including Handmade Carpets comprise about 1.7% each of total exports and have clocked a growthof 14% and 12% respectively. Other items that have grown impressively are Rubber manufacturedproducts, Paper/Wood products and Glass/Glassware/Ceramics.
Steady growth items : Electronic goods, Machinery & Instruments, Dyes Intermediates & Coal TarChemicals and Transport Equipment are the other items whose export value increased.
Low growth items : The commodity group that has shown a low growth in exports is Leather &Manufactures. Its share of the export basket has fallen from a peak of 7% in 1991-92 to 4.38% in2000-01.
Graph 2.2.6 Share of main items in Manufactured goods Exports 2000-01
G em s and Jewe llery17%
R eadym ade G arm ents13%
Textile Yarn , Fabric & M adeups11%
Leathe r & Leathe r M anufactu re5%
D rugs, Pharm a & F ine C hem icals5%
M anufactu res of M etals 4%
M achinery & Ins trum ents4%
R ubber M anufactured P roducts3%
O the rs38%

23
The growth rate matrix of India’s exports (Graph 2.2.7) shows that 42% of India’s exports havehigh growth and high share in India’s exports.
2.2.4 Structural Changes in Indian Exports
As already noted earlier, there has been a compositional change in the export basket of India.The share of manufactured goods in the total exports of India have increased from 75% in1991-92 to 79% in 2000-01. If we include Petroleum products being exported from the country,the share of manufactured goods has risen from a level of 76% in 1991-92 to 83% in 2000-01.On the contrary, the share of Agricultural and allied products has declined from 18% in 1991-92to 13% in 2000-01. Similarly, the share of exports of Ores and Minerals has declined from 5.2%in 1991-92 to 2.60% in 2000-01. This is an evidence of India’s exports moving away fromResource based products to Technology based products in the post-liberalisationperiod.
Graph 2.2.7 Growth-Share Matrix of India’s Exports - 1996-2001
Petroleum productsPlastic & Linoleum productsOrganic/inorganic/Agro chemicalsTeaResidual chemicalsMeat preparationsPaper/Wood productsCosmetics & ToiletriesGlass/Glassware/Ceramics
Rubber manufactured productsManufactures of metalsGems & jewelleryDrugs & pharmaceuticalsReadymade garmentsMachinery & Instruments
High growth(10% and above)
Low share (>0.5%, <2%) High share ( 2% and above )
Low growth(<10% )
Electronic goodsMarine productsLeather & manufacturesTextiles, yarn, fabrics&made-upsTransport equipmentOil meals
26% of India’s exports
Paints/enamels/varnishesDyes/Intermediates/coal tarPrimary & Semi-finished Iron&SteelProcessed mineralsOther ores & minerals ,Iron oreHandicrafts ,Carpets-handmadeTobacco unmanufactured, CoffeeBasmati rice, Non-basmati riceCashew, Spices, Castor oil
16% of India’s exports
Shares are average share of each item to the total exports for 1996-2001Items having share <0.5% has not been taken into account.
9% of India’s exports 42% of India’s exports

24
A study(1) reveals that during 1980-96 the growth of Indian export earnings turned out to be abovethe world average for all the broad categories of Extended-Manufacturing (E-Mfg) exportsincluding double digit growth rates in labour and scale intensive products. However,Indonesia,Malaysia and Thailand posted much higher and more stable growth rates than India. A betterexport performance than India in technologically more sophisticated products by South Koreaand Taiwan requires to be underlined. During the period 1980-96, the highest growth has beenachieved in the export of labour-intensive exports at 12% by India which is higher than the worldexport of labour-intensive products at 9%.
As far as changes in the commodity composition of country specific export basket is concerned,India improved the share of Extended-Manufacturing significantly from 56% (1980-86) to 71%(1987-90) in total exports but only marginally further to 75% during 1993-96. The first period1980-1990 was marked by the rise in the share of scale intensive exports. Share of labourintensive exports remained constant at around 41%.The scale intensive product exportsimproved their average share from 26% in 1980-86 to 36% in 1993-96. On the other hand, theResource Intensive export items witnessed a decline in their share to the total exports from 11%during 1980-86 to about 6% in 1993-96. The other early trade liberalising and rapidly growingeconomies changed their export basket increasingly towards differentiated and science basedproducts. This diversification achieved by them helped in reducing their vulnerability to volatileworld trading environment in resource intensive exports and slower growing world exports oflabour intensive products.
The critical factor in these countries has been not the state of the international trading environmentbut the functioning of the domestic main springs of the growth process such as the incentive structurefor innovations, reliable and cost effective transport and communication facility and stable macroeconomic management - all this has been driven by a proactive approach.India had a headlongstart in industrialisation in the 1950s well ahead of these countries, but the persistently inwardlooking character of Indian industrialisation not only made it internationally non-competitive but ledto wastage of scarce capital and foreign exchange, thereby slowing down the rate of economicgrowth. Possibly realising the limited size of their domestic markets at lower levels of per capitaincomes, these East Asian countries had switched from import substitution to export-orientationfairly early in their development process. India was the first in initiating industrialisation but the lastin trade liberalisation.
Progressive export orientation of the economy would yield not only very obviousefficiency gains in resource utilisation but also two other benefits which have oftenbeen overlooked: one, because of expansion of domestic market beyond nationalborders it would enhance and maintain the rate of return on productive investment andraise the rates of domestic savings and investment essential for rapid growth. Two, itwould also impart resilience to the economy to successfully overcome external shocks.1) See: Tendulkar S.D.(2000): Indian Export and Economic Growth Performance in Asian Perspective.
25
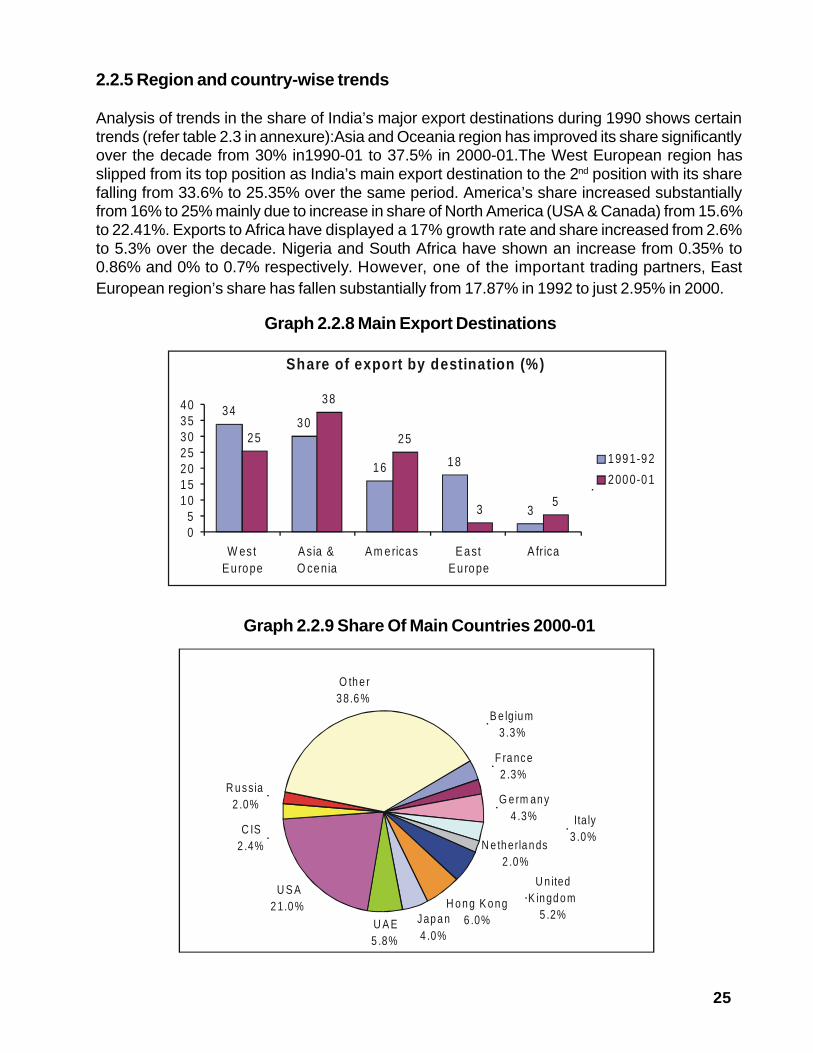
2.2.5 Region and country-wise trends
Analysis of trends in the share of India’s major export destinations during 1990 shows certaintrends (refer table 2.3 in annexure):Asia and Oceania region has improved its share significantlyover the decade from 30% in1990-01 to 37.5% in 2000-01.The West European region hasslipped from its top position as India’s main export destination to the 2nd position with its sharefalling from 33.6% to 25.35% over the same period. America’s share increased substantiallyfrom 16% to 25% mainly due to increase in share of North America (USA & Canada) from 15.6%to 22.41%. Exports to Africa have displayed a 17% growth rate and share increased from 2.6%to 5.3% over the decade. Nigeria and South Africa have shown an increase from 0.35% to0.86% and 0% to 0.7% respectively. However, one of the important trading partners, EastEuropean region’s share has fallen substantially from 17.87% in 1992 to just 2.95% in 2000.
Graph 2.2.9 Share Of Main Countries 2000-01
Graph 2.2.8 Main Export Destinations
Share of export by destination (%)
3430
16 18
3
25
38
25
35
05
10152025303540
W estE urope
A sia &O cenia
A m ericas E astE urope
A frica
1991-92
2000-01
B e lg iu m3 .3%
F ra nce2 .3%
G e rm an y4 .3%
N e th erla n ds2 .0%
H o n g K o n g6 .0%Jap a n
4 .0%U A E5 .8%
U S A2 1.0 %
C IS2 .4%
R u ssia2 .0%
O th e r3 8.6 %
U n ited K in gd o m
5 .2%
Ita ly3 .0%
26
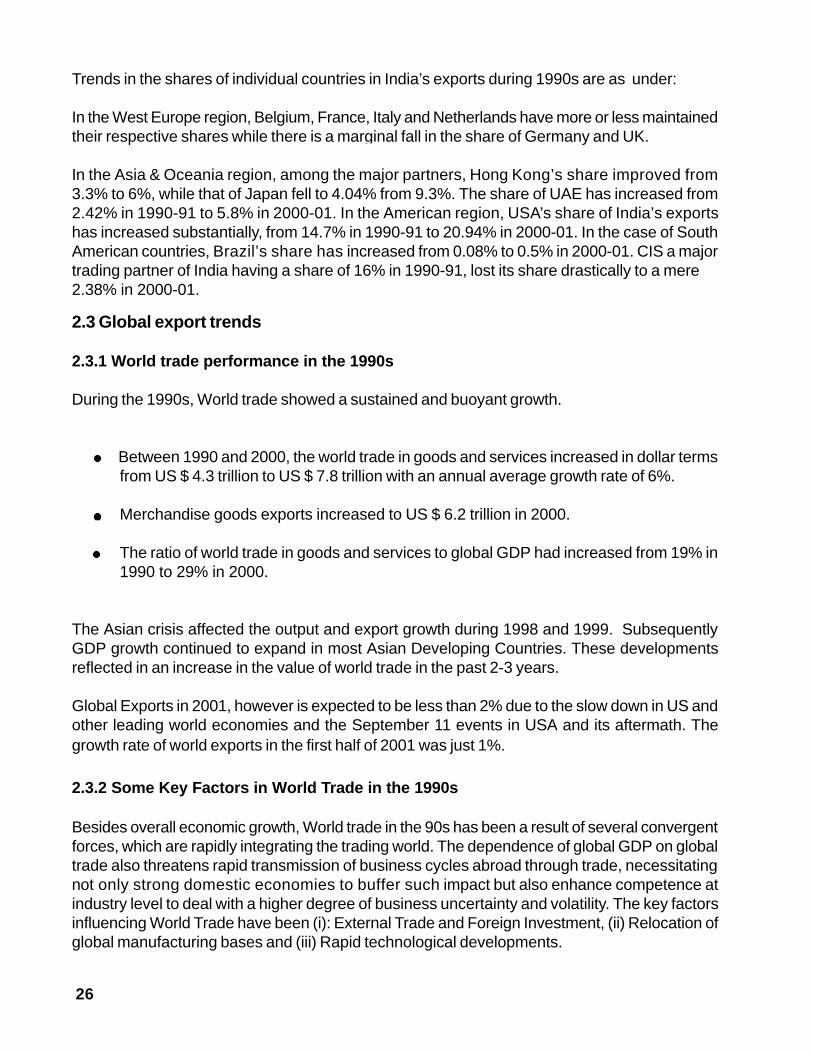
Trends in the shares of individual countries in India’s exports during 1990s are as under:
In the West Europe region, Belgium, France, Italy and Netherlands have more or less maintainedtheir respective shares while there is a marginal fall in the share of Germany and UK.
In the Asia & Oceania region, among the major partners, Hong Kong’s share improved from3.3% to 6%, while that of Japan fell to 4.04% from 9.3%. The share of UAE has increased from2.42% in 1990-91 to 5.8% in 2000-01. In the American region, USA’s share of India’s exportshas increased substantially, from 14.7% in 1990-91 to 20.94% in 2000-01. In the case of SouthAmerican countries, Brazil’s share has increased from 0.08% to 0.5% in 2000-01. CIS a majortrading partner of India having a share of 16% in 1990-91, lost its share drastically to a mere2.38% in 2000-01.
2.3 Global export trends
2.3.1 World trade performance in the 1990s
During the 1990s, World trade showed a sustained and buoyant growth.
Between 1990 and 2000, the world trade in goods and services increased in dollar termsfrom US $ 4.3 trillion to US $ 7.8 trillion with an annual average growth rate of 6%.
· Merchandise goods exports increased to US $ 6.2 trillion in 2000.
The ratio of world trade in goods and services to global GDP had increased from 19% in1990 to 29% in 2000.
The Asian crisis affected the output and export growth during 1998 and 1999. SubsequentlyGDP growth continued to expand in most Asian Developing Countries. These developmentsreflected in an increase in the value of world trade in the past 2-3 years.
Global Exports in 2001, however is expected to be less than 2% due to the slow down in US andother leading world economies and the September 11 events in USA and its aftermath. Thegrowth rate of world exports in the first half of 2001 was just 1%.
2.3.2 Some Key Factors in World Trade in the 1990s
Besides overall economic growth, World trade in the 90s has been a result of several convergentforces, which are rapidly integrating the trading world. The dependence of global GDP on globaltrade also threatens rapid transmission of business cycles abroad through trade, necessitatingnot only strong domestic economies to buffer such impact but also enhance competence atindustry level to deal with a higher degree of business uncertainty and volatility. The key factorsinfluencing World Trade have been (i): External Trade and Foreign Investment, (ii) Relocation ofglobal manufacturing bases and (iii) Rapid technological developments.

27
(i) External Trade and Foreign Investment
Global trade policy and capital flows, in the form of Foreign Direct Investments (FDIs) and ForeignInvested Enterprises (FIEs), are the major determinants of international trade flows. The impactof global trade policy changes on regional trade patterns is generally seen only over the mediumterm, while changes in capital flows often have immediate repercussions on year-to-year tradedevelopments.
Trade Policy Impact:
Now all sectors of the economy including services have been brought under the global traderules of the WTO. By 1999, the bulk of the Uruguay round tariff cuts were completed in thedeveloped countries which has provided an impetus for world exports. However, there are someexceptions, notably in textiles and agriculture which incidentally are areas where developingcountries are export competitive.
FDI Impact:
The impact of FDI to a host country’s economy is widely recognized. FDIs and FIEs grew atalmost double the rate of world merchandise trade, benefiting countries like China whichreceived substantial boost through inbound capital flow. FDI flows to developing countriesincreased more than six fold from 1990 to 1998, and their share of global FDI flows has risenfrom 25% in 1991 to an estimated 42 % in 1998.
Graph 2.3.1: FDI flows to developing countries – 1990s
Source: World Bank Debtor Reporting System and World Development Indicators
Key FDI benefits are productivity growth due to increased access to technology through jointventures and licensing, enhanced knowledge of international market conditions and access toforeign marketing networks. SE Asia and countries like China have recognized the importanceof FDI in key areas to provide an impetus to domestic economy and export competitiveness.
0
50
100
150
200
250
300
350
400
450
1991 1992 1993 1994 1995 1996 1997 19980
5
10
15
20
25
30
35
40
45
GlobalFDIFlows$ bn
FDI toDevelop ingCountries as %of G lobal FD IF lows
28
They have designed policies to create a suitable economic environment and this has resulted insignificant increases in FDI flows. India is however, a marginal recepient of FDI within Asiancountries and has thus not experienced the various benefits of large scale FDI as mentionedabove.
Economic liberalisation promotes both trade and FDI. TNCs increasingly shape trade patternsaccounting for about two-thirds of world trade. About one-third of world trade is said to be intra-firm.Thus the direction of trade is directly affected by the location strategies and decisionsof TNCs.
A comparision of the world maps for inward and outward FDI in 2000 with those prevailing in1985 shows that the number of countries receiving or investing sizeable amounts of FDI increasedsignificantly between these two points of time. Thus, by the end of 2000, 51 countries reportedinward FDI stocks of more than $ 10 billion, compared with 17 countries in 1985.Similarly, in terms of outward stock, 33 countries have invested more than $ 10 billionabroad in 2000 as compared to 10 countries in 1985.
An overview of the inward and outward FDI stocks as a percentage of GDP in various regionsand countries reveals that the outward FDI stocks as a percentage of GDP is more thanthe inward FDI stocks as a percentage of GDP for developed countries and the contraryis true of developing nations. While the inward FDI stocks forms 28% of GDP for developingnations, it is 14.5% in the case of developed countries. Among the three regions viz, Africa, LACand Asia the inward FDI stock as a percentage of GDP is the highest at 25.6% for LAC followedby Africa (21%) and Asia (13.2%). However, the outward FDI stock as a percentage of GDP isthe highest at 13.6% for Asia followed by 4.9% for Africa and 3.8% for LAC. Among some ofthe leading nations in Asia, Singapore has the highest inward FDI stock as a percentage of GDPat 97.5% followed by Malaysia (65.3%) and China (30.9%). In the case of FDI outward stock asa percentage of GDP, again Singapore leads with 57.6% in the year 1999 followed by Malaysia(22.6%) and Korea (5.5%). In the case of India it is seen that the percentage of inward FDI stockto GDP for the year 1999 is placed at 3.6% as against 0.2% for the outward FDI stock as apercentage of GDP.
Thus it is no longer the case that the developing countries are only the recepients ofFDI and outward flow of FDI should only come from developed economies. TNCs froma wide range of economies and industries are continuing with their transnationalisationpush of recent years. The analysis covering a period from 1990 to 1999 reveals thatthere is a lot of potential for outward FDI flow from countries like India to regions likeAfrica, LAC and within Asia.
There is scope for trade linked FDI, particularly in services sector for countries like India. Mostrecently, Indian TNCs began seeking investment via cross border mergers and acquisitionsparticularly in the software industry in countries such as U.K. and U.S.A. The need for localpresence to deliver services is one reason underlying the shift of the world FDI stock towardsservices in the past 20 years. The situation as regards FDI and trade in services is beginningto change under the impact of the growing transportability of services, and especially that of

29
information-intensive services due to advances in telecommunications and informationtechnologies. The technological advances that have increased tradability have also opened uppossibilities for export-oriented FDI in some services particuly in respect of functions undertakentypically in-house by various firms (e.g., data processing, accounting). Foreign affiliates in theservices sector may also have an indirect impact on trade, as they may create demand formachinery and equipment necessary and/or for information-intensive support services providedeither by headquarters personnel or services provided via communication lines.
In the recent years particularly since the mid-1990s, the environment for FDI and trade haschanged significantly. The most important changes relate to the reduction of technological andpolicy-related barriers to the movement of goods, services, capital, professional and skilledworkers, and firms. More specifically, technological developments have greatly enhanced theease with which goods, services, intangible assets and people can be transported, and tasksrelated to the organization and management of firms implemented over distances.
The liberalization of rules and regulations governing trade, investment and technology flows hasmeant that the new possibilities created by technology can actually be realized. The principaleffect of the new environment is that firms are freer to choose how to serve foreign markets:by producing at home and exporting, by producing in a foreign country for local sale, or byproducing in a foreign country for export. They also have greater freedom to obtain foreignresources and inputs for production by importing them from foreign producers or by establishingproduction facilities that enable them to access resources where they are located, for producingraw, intermediate or final products for use elsewhere or sale in national, regional or global markets.With competition driving firms to use the new possibilities to an increasing extent, more firms,especially in technologically sophisticated industries, immediately look at regional or worldmarkets.
The recent trends in China in the flow of FDI reveal that the share of FDI flows into thoseindustries in which FDI inflow traditionally concentrated (e.g footwear, and travel goods, toys,bicycles, and electrical appliance) has been declining. Driven by the excess capacity in the countryand encouraged by their competitiveness in exports, Chinese firms in those industries arenow expanding to set up processing or assembly plants overseas. The Governmentspromote those outward investments by providing such incentives as loans atpreferential terms and tax rebates. Special guarantees and financial support throughofficial development assistance are also granted to investment in those countries thatare identified as high-risk locations.
Another example is Hungary which is the largest outward investor in the Central and EasternEuropean region. Here again Government provides assistance to the country’s outwardinvestors. The Government owned Corvinus International Investment Limited established in 1997provides both finance (participation in share capital, loans and guarantees) and advisoryservices to potential outward investors. The typical clients of Corvinus are medium sizeHungarian manufacturing enterprises, although scheme is open in principle to all firms andindustry.

30
Thus, while inward FDI is very important for exports of goods and services, outward FDI is alsoimportant for India, particularly in the services sector.
(ii) Relocation of Global Manufacturing Bases
Large scale shift in global manufacturing bases to Asian countries has occurred through the1990s, with factor costs, especially labour, increasing in developed countries. Initially, low skilledlabour based manufacturing shifted to the Asian countries like China which had a natural costadvantage. However, during the course of this decade, high skilled labour based manufacturingsuch as electronics also shifted to those Asian countries that had built sufficient capability. Theconsumption centers i.e. USA, EU and Japan were now separated from the production centersi.e. China, Indonesia, and Taiwan etc. As a result, skilled labour and technology basedmanufacturing products have increased as a proportion of World trade.Relocation of Globalmanufacturing bases, especially in skilled-labor intensive manufacturing to Asian countries hasprovided a boost to growth of these industries in the concerned Asian economies.
The trend in trade composition in key Asian economies is shown in Graph 2.3.2 below. It isevident that in almost all countries, high technology based exports have displayed the fastestgrowth, thus increasing their share of trade in these countries, which is largely an outcome ofrelocation.
The following is evident from Graph 2.3.2, giving the growth rates of exports of various technologycategories of India vis-a-vis other major Asian economies for the period 1990-96 :
Growth rate of high technology product exports of India is the lowest at 14.5% among theAsian countries which have been compared.
Countries like Malaysia, Korea, Singapore have achieved higher rates of growth ofexports of medium technology products than India.
Graph 2.3.2: Composition of trade (%growth:1990–96)-SE Asia
Source: Sanjay Lall, Oxford Review of Economic Policy, Vol .14, No. 2 1998
0
10
20
30
40
Resource Based 15.2 9.3 10.7 21.7 2.8 7.7
Low Technology 18.4 11.8 31.3 1.3 8.6 14.4
Medium Technology 9.4 12.6 28 22.2 13.6 12.3
High Technology 35.4 14.5 27 21.4 22 24.8
China India Malaysia Korea Singapore Thailand
31
In the case of low technology products exports, India has registered a growth rate of 11.8%as compared to 31.3% for Malaysia, and 18.4% for China.
The growth rate of export of resource-based products during 1990-96 is the lowest forThailand at 7.7%, while it is 9.3% for India and 15.2% for China.
The inference we can draw from the above is that given the technological structure of Indianexports and that of the other major competitors, to realise the full potential of existing competitiveadvantages, it is imperative for us to move into high technology high-value products.
(iii) Rapid technological developments: Due to rapid technological developments, steepdecline in transportation and telecommunication costs have been achieved which in turn havevastly reduced the impact of physical distance for global commerce. Adoption of Internet technologieshas played a critical part in overall telecommunication cost reduction.
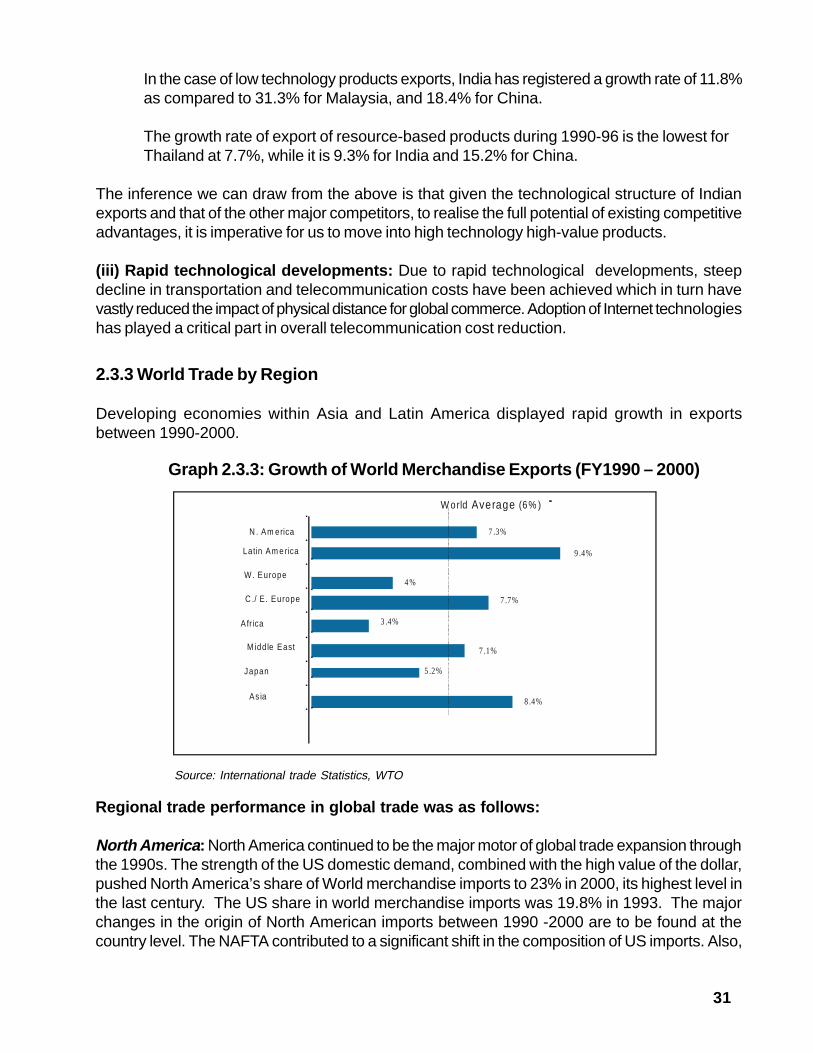
Graph 2.3.3: Growth of World Merchandise Exports (FY1990 – 2000)
Source: International trade Statistics, WTO
Regional trade performance in global trade was as follows:
North America : North America continued to be the major motor of global trade expansion throughthe 1990s. The strength of the US domestic demand, combined with the high value of the dollar,pushed North America’s share of World merchandise imports to 23% in 2000, its highest level inthe last century. The US share in world merchandise imports was 19.8% in 1993. The majorchanges in the origin of North American imports between 1990 -2000 are to be found at thecountry level. The NAFTA contributed to a significant shift in the composition of US imports. Also,
2.3.3 World Trade by Region
Developing economies within Asia and Latin America displayed rapid growth in exportsbetween 1990-2000.
-
7 .3%
9 .4%
4%
7.7%
3 .4%
7 .1%
5 .2%
8 .4%
N . Am erica
Latin Am e rica
W . Europe
C ./ E . Europe
Africa
M iddle East
Japan
As ia
W orld Average (6% )
32
Asia: In the aftermath of the financial crisis of 1997-98, Asia’s trade and output recovered strongly.The region’s GDP growth matched the global economy as a whole, while Asia’s merchandiseand commercial services trade exceeded the world average. The recovery of intra-regional trade,exchange rate developments, higher commodity prices and strong global demand forinformation technology products were the principal factors underpinning Asia’s trade expansionin the late 1990s.
· Among the leading countries in Asia, China expanded its merchandise trade at nearlytwice the rate of Asia as a group in the 1990s, while Japan’s trade growth lagged behind.
· Many of the Asian developing countries most affected by the crisis recorded a reasonableGDP growth of about 6%, twice the global income growth.
· Many Asian low income countries like Bangladesh, Cambodia, Myanmar, Nepal andVietnam with a modest share in World trade achieved outstandingly high export growththroughout the 1990-2000 period.
2.3.4 India’s export performance vs. S.E Asia & China
An analysis of share of world trade and the share of export contribution of the South East Asianeconomies and China reveals that India’s comparative position vs. these countries has declinedsteadily.
Currently China has achieved the top ranking (China’s exports increased from $ 18.19 billion in1980 to $ 62.09 billion in 1990 and further to $ 249 billion in 2000) followed by Hong Kong, SouthKorea, Singapore, Malaysia, Thailand, Indonesia and India.
China increased its share of North American imports from 4.9% in 1993 to 7.4% in 2000, whileJapan’s share decreased by 5.2% during the same period. The combined share of US importsfrom Asian economies fell by 3.4% during 1993-2000.
Latin America : Latin America’s merchandise trade is highly concentrated among a fewcountries. Mexico and Brazil alone account for 62% of the regions merchandise trade. One ofthe main features of Latin America’s trade in the 1990s was the exceptional expansion of Mexico’strade, in particular to US, obviously because of the North American Free Trade Agreement.While Latin America’s GDP expanded by 3.5 % between 1990-97, it stagnated by 1999.
Western Europe : The slowdown of Western Europe’s trade was affected by the region’s weakeningGDP growth. In the 1990-99 period, Ireland, Spain and Turkey achieved by far the highest growthfor merchandise exports and imports among the West European countries. Three out of the fourlargest West European traders - France, Germany & Italy - recorded export and import growthbelow the European average.

33
An examination of the change in exports as percentage of GDP in respect of S.E. Asiancountries and China vis-à-vis India (Table 2.3.1) is essential to benchmark India’s exportperformance in the 1990s
Source: Economic & Social Survey of ESCAP; WTO Report
Graph 2.3.4: Asia: Share of Global Trade- 2000
Table 2.3.1: Share of Exports in GDP of some Asian Countries
Country Exports as % of GDP
1980 1999
China 6 21.8S. Korea 34 36.4Thailand 24 48.2Indonesia 34 38.9Malaysia 58 109.8India 6 10.1*
Source: World Development Indicators - 2001, world Bank.*Calculated for 2000-01.
Between 1980 and 1999, the “export as a percentage of GDP measure” of China, Thailand, andMalaysia has increased significantly. While India’s share of exports to GDP has nearly doubledin this period, exports still contribute only 10% of GDP, significantly lower than its competitors inthe region.
2.3.5 World trade basket
A comparison of World trade basket between 1990 and 1999 reveals that shares of productgroups like agricultural products, mining products, Iron & Steel, had declined in 1990s.
3.9%3.2%
2.7%2.2%
1.5%1.1% 1.00%
0.65%0.67%
0.0%
1.0%
2.0%
3.0%
4.0%
5.0%
China
Hong KongKore
a
Singapore
Malays ia
Thailand
Indonesia
Phil ippines
Ind ia
34
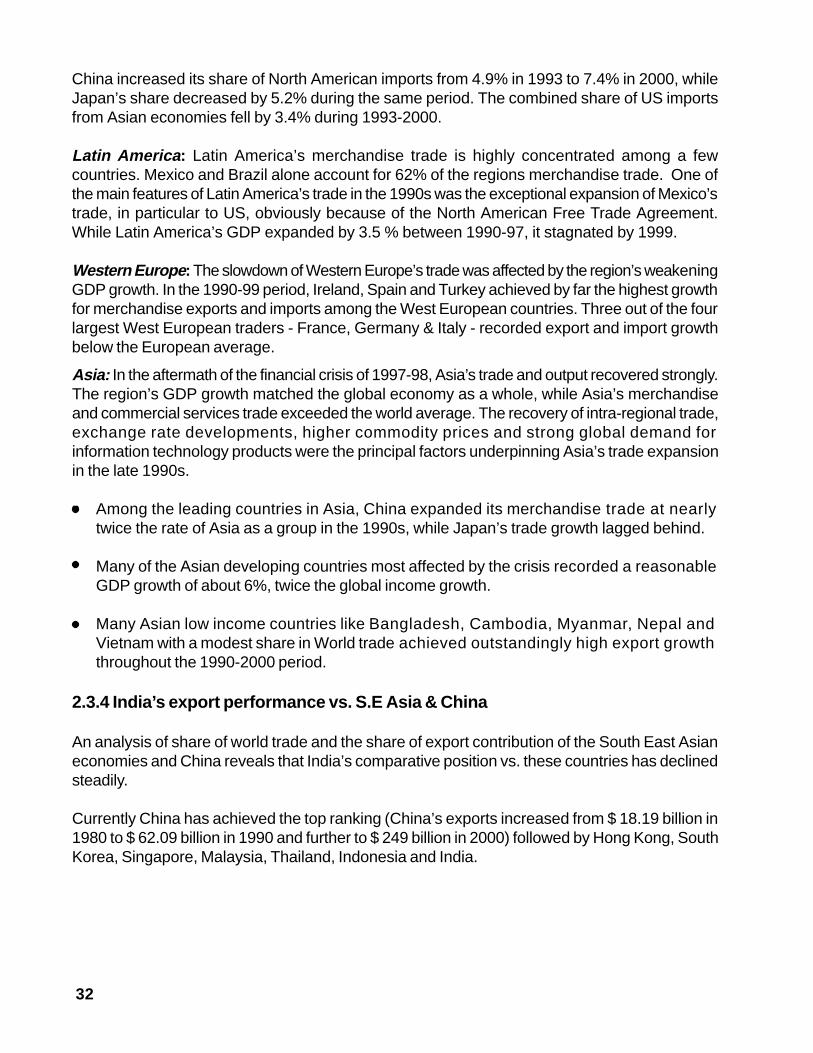
Agricultural Products : These products registered an increase of 3% in value terms during1990-2000.
Fuels : World trade of fuels in the 1990s witnessed marginal changes in shares of regions.Middle East continued to account for 30% of the world fuel exports. On the import side, however,significant changes have occurred. The share of Western Europe and Japan in World fuel importsdecreased by 7.5 % and 3% respectively while developing countries in Asia and Latin Americaincreased their shares by 7% and 1% respectively (led by their above average economic growthin this period)
Metal & Minerals : Weaker prices played a major role in depressing export values fornon-ferrous metals, ores and minerals and Iron and Steel (which saw global exports drop by 11%in 1999)
Automobiles : Exports of automotive products witnessed strong share increases with growth of4.1% in 2000. North America remained the largest net importer of automobile products whileAsia remains the largest net exporter. The most dynamic exporters of automobiles have beenthe hitherto non-traditional exporting countries such as Mexico, Korea, Brazil and Central andEastern Europe, which expanded their exports at double-digit rates.
Office & Telecom Equipment : World trade in office and telecom equipment was stimulated bystrong export growth for computers (10%), semi-conductors (15%) and mobile phones (25%).Asia has expanded to contribute to almost 50% of world exports of this category with exportsgrowth of 15%.
Individual sector performance has been as follows:
Source: WTO Trade Statistics
Graph 2.3.5: Industry share of World Trade-Comparison between 1990-1999
0
5
10
15
20
25
30
35
40
1990 12.2 14.3 3.1 8.7 9.4 8.8 6.3 34.21999 9.9 10.2 2.3 9.6 10 14.1 6.1 34.4
Agricu ltural products
Ores, Fuels & Iron and s tee l Chemica ls
Automotive products
Office and Textiles & Clothing
Others
35
2.4 Review of Past Export Strategies
In the past, the Ministry of Commerce had formulated several export strategies from time to timethat identified growth markets & products. These strategies reflected the global and domesticrealities prevailing at the time of launch of such strategies. During the past decade, the mainstrategies adopted for export promotion include the following:
· Extreme Focus Products Strategy· 15x15 Matrix Strategy· Focus: LAC Strategy
2.4.1 Extreme Focus Products Strategy
Objective of the strategy
A detailed exercise was carried out by the Ministry of Commerce in 1992 to identify export itemsfor special and focused thrust. Thirty-five items (refer annexure 2.4) were identified as ExtremeFocus Products based on production capacity available in India, Export competitiveness andWorld trade growth in these items. The target for the Focus products was to induce growthof 30% volume/ value in the medium term and stabilize growth in the subsequentperiod.
Effectiveness of the strategyThe extreme focus strategy has achieved mixed success. While the growth of these 35 items hasbeen higher than the complete basket of exports, the volatility of growth has similarly been high.Some of the salient points are:
· The value of exports of the Extreme Focus items has increased from a level of USD 8 billionin 1993-94 to USD 16.4 billion in 2000-01.
· Comparison between extreme focus items export data of 1993 and 1996 (excluding computersoftware in non-physical form) shows a CAGR growth of 11.1%. This growth is higher thangrowth of total exports (CAGR 8.4%) between these years. As a result, share of these itemsto India’s total exports has increased from 36% in 1993-94 to 37% in 2000-01.
Textiles & Clothing : The 1990s saw a steady decline in the share of textiles from 3.5% to 2.7%,while clothing in contrast remained at 3.3% level throughout. Textiles trade supply also saw ashift from Western Europe to Asia, which increased its share of World textile trade by 6%. Asiaremained the World’s largest clothing exporter with a 43% share in 1999 with North Americaleading World imports with 30% share.

36
While growth of 14 items has been equal to or higher than 30 % value i.e. the rate that wasenvisaged for all the 35 items, a majority have shown lower growth including negative growth.The Items with or exceeding 30% value growth: (CAGR in 1993-1996) are given below. Computersoftware is not given here as growth rate of computer software in physical form was low, thoughcomputer software as a service has shown high growth rate in the last few years.
Graph 2.4.2: Extreme focus Items with CAGR (1993-96) of 30% and above
Graph 2.4.1: Growth rate of exports (%)
-10%
-5%
0%
5%
10%15%
20%25%
30%35%
40%45%
94-95 95-96 96-97 97-98 98-99
Exp
orts
gro
wth
rate
(%)
E xtrem e Focus item s India 's total expo rts
136%
87%
70% 68%
41% 41% 39% 38% 36%31% 30% 30% 30% 30%
0%
20%
40%
60%
80%
100%
120%
140%
160%
MO
LAS
SE
S
SU
GA
RM
AC
HIN
ER
Y
AG
RO
CH
EM
ICA
LS
MU
SH
RO
OM
S
TO
MA
TO
PA
ST
E
MA
NM
AD
EY
AR
N,
FAB
RIC
S, e
tc RIC
E
RM
GW
OO
L
RM
GM
AN
MA
DE
FIB
RE
S
GO
LDJE
WE
LLE
RY
CA
ST
ING
&F
OR
GIN
GS
RM
GO
FO
TE
HR
TE
XT
ILE
GR
AN
ITE
S
MA
TE
RIA
L

37
Thus, the Extreme Focus items strategy have displayed mixed results. Though the overallperformance of all the items taken together did indeed show improvement over the averageexport performance of the total export basket, performance against targets was average.
2.4.2 15 X 15 Matrix strategy
Objective of strategy
The objective of the 15x15 strategy was to examine market diversification and commoditydiversification The 15 Commodities/15 Countries Matrix exercise was undertaken in 1995 usingthe data of mid nineties that indicated the restricted commodity/country basket for India’s exports.It was observed that 15 countries and 15 commodities accounted for around 75%-80% of India’sexports and a presentation was made to trade and industry to set up trade facilitators for achievingincreased exports in the 15 products and 15 markets. However, the exercise of the trade facilitationdid not get enough support and response(2). The focus on 15/15 matrix based on past performancedata was an useful exercise as it helped to focus on the importance of a few commodities and afew destinations in our export performance. Two new products appeared for the first time in1995-96 in the list of India’s top 15 export products. However, the importance oproducts andcountries continuously change and it is interesting to see the dynamics of markets and productsin India’s export when the 15/15 matrix is updated. At present, the 15 X 15 Matrix for the year2000-01 has been compared with that of 1996-97. Table 2.5 and 2.6 give India’s First 15 Prod-uct Groups and First 15 Countries Matrix of Exports for the year 2000-01.
Effectiveness of the strategy
The 15x15 Matrix taken up for analysis covers about 70% of all products exported by India andover 67% of India’s export markets in value terms in 2000-01.
· Overall, the analysis of commodities shows a trend towards diversification acrossadditional markets. The share of the total top 15 product groups exported to top 15market destinations in the total export of top 15 product groups decreased from 71% in1996-97 to 66% in 2000-01 indicating market diversification of these product groups.
However some items within the top 15 commodities have changed thus altering thecomposition of the top 15 commodities basket significantly.
Items like Oil Meals, Dyes and Intermediates, and Rice (excl. Basmati) which were in thetop 15 product groups in 1996-97 were replaced by Plastic & Linoleum products,Petroleum and other Liquefied fuel products, and RMG Manmade Fibres in 2000-01.
The top three items of India’s exports contained in the Matrix of 96-97continue to remainthe same during 2000-01 i.e. Gems and Jewellery, and RMG Cotton including Accessories,Cotton Yarn, Fabrics and Made Ups.(2) Ministry of Commerce (1997) Medium Term Export Strategy.

38
2.4.3 Focus LAC Strategy
Objective of strategy
Considering the potential of the Latin American region, an integrated programme “ Focus: LAC”was launched in November 1997 by the Commerce Ministry. This programme is aimed atsensitizing the organisations viz. Export Promotion Councils, Chambers of Commerce & Industry,EXIM Bank, ECGC etc. involved in trade promotion efforts. Various incentives and exportpromotion measures have been designed and incorporated in this programme.
The FOCUS: LAC Programme aims to focus at the Latin American region, with addedemphasis on the nine major trading partners of the region. The FOCUS: LAC Programme alsoaimed to focus on the following major product groups for enhancing India’s exports to the LatinAmerican region:
· Textiles including ready-made garments, carpets and handicrafts· Engineering products and computer software· Chemical products including drugs/pharmaceuticals
· An analysis of the composition of the top 15 markets between 1996-97 and 2000-01reveals that Indonesia which featured in the 1996-97 list, was replaced by Saudi Arabia.The rest of the countries retained their inclusion in the top 15. However the rank of thesecountries varied.
· The top three destinations changed from US, UK and Japan to US, Hong Kong and UAE.
· The share of India’s exports of top 15 products to Japan has declined from 9% in 1996-97to 6.3% in 2000-01.
Thus, there has been a market diversification for the top products though there has also been aproduct consolidation for the top markets.
The above analysis clearly brings out that the 15x15 matrix has undergone changesover the last 5 years or so and a new strategy has to necessarily factor in the currenttrends. Second, the matrix was based on a predominantly supply side analysis andthe revealed comparative advantages. What is now necessary is also to factor inrealcomparative advantages based on our potentialities. For that purpose, the presentstudy has brought in additionally a detailed demand side analysis by examining theimport baskets of our main export destinations to determine the new product & countryfocus that we should strive for.
39
Effectiveness of the strategy
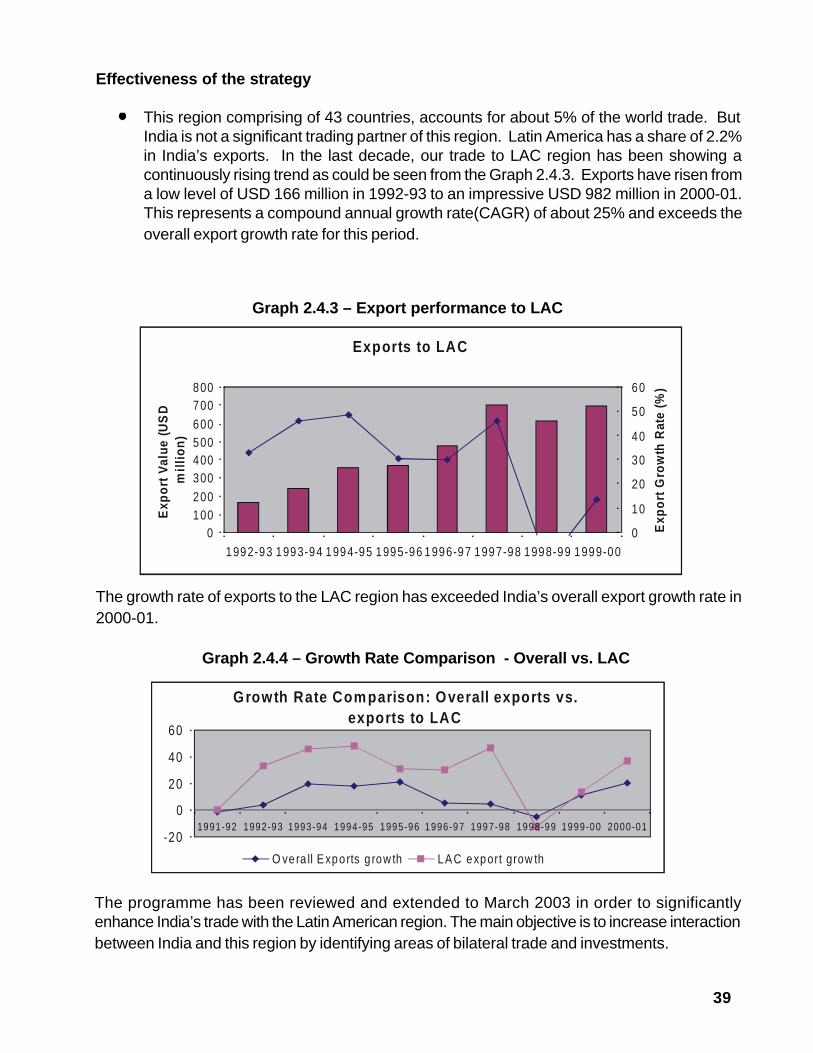
· This region comprising of 43 countries, accounts for about 5% of the world trade. ButIndia is not a significant trading partner of this region. Latin America has a share of 2.2%in India’s exports. In the last decade, our trade to LAC region has been showing acontinuously rising trend as could be seen from the Graph 2.4.3. Exports have risen froma low level of USD 166 million in 1992-93 to an impressive USD 982 million in 2000-01.This represents a compound annual growth rate(CAGR) of about 25% and exceeds theoverall export growth rate for this period.
Graph 2.4.3 – Export performance to LAC
The growth rate of exports to the LAC region has exceeded India’s overall export growth rate in2000-01.
Graph 2.4.4 – Growth Rate Comparison - Overall vs. LAC
The programme has been reviewed and extended to March 2003 in order to significantlyenhance India’s trade with the Latin American region. The main objective is to increase interactionbetween India and this region by identifying areas of bilateral trade and investments.
Exports to LAC
0100200300400500600700800
1992-93 1993-94 1994-95 1995-96 1996-97 1997-98 1998-99 1999-00
Exp
ort
Val
ue
(US
Dm
illio
n)
0
10
20
30
40
50
60
Exp
ort
Gro
wth
Rat
e(%
)
G rowth Rate Comparison: Overall exports vs. exports to LAC
-20
0
20
40
60
1991-92 1992-93 1993-94 1994-95 1995-96 1996-97 1997-98 1998-99 1999-00 2000-01
O vera ll E xpo rts g row th LA C export grow th

40
2.5 Summary & Conclusions
India’s Export Performance
During the post liberalisation period i.e., 1991-2001, India’s exports have performed much betterthan the pre reform period. From a level of (–) 1.5% growth rate during 1991-92 the value ofexports in dollar terms witnessed a growth rate of 21% in 2000-01. Consequently, India’s sharein world exports increased from 0.41% in 1992-93 to 0.67% in 2000-01. In terms of openness ofIndian economy, that is trade measured as percentage of value of GDP, the degree of openness,has almost doubled from a level of 13% in 1990-91 to 22% in 2000-01. The highest exportgrowth rate for the decade was achieved in 2000-01 at 21%. Such a commendableperformance on the export front could be attributed to the favourable international economicenvironment and the domestic reforms undertaken during the last few years. The only year inwhich negative export growth was recorded was during 1998-99 on account of the South EastAsian crisis. The slowdown in US and other countries and the September 11 events in USA andits aftermath makes it difficult to sustain this growth this year.
A compositional change has been witnessed in the export basket of India with the opening up ofthe economy. An analysis of India’s exports during the last 10 years reveals a significant shift inthe export basket composition. The commodity grouping analysis of the composition of India’sexports reveal that the share of manufactured goods has increased from 76% in 1991-92 to 83%in 2000-2001. The analysis of growth rate of major commodity groups of India’s exports revealsthat Chemicals & related products, Engineering goods, Electronic goods, Gems & jewellery,Marine products and Textiles have witnessed steady export growth barring some inter yearvariations during the period. The growth rates of Agricultural & allied products, and Leather &manufactures have lagged behind during the last 10 years. The analysis of export growth rateswithin the manufactured goods groups show that most of the items in the manufacturing grouphave shown an increasing trend throughout the decade and include items like gems & jewellery,manufactures of metals, drugs, pharmaceuticals & chemicals and textiles. Another importantsector is that of Petroleum products export in which the share has risen from a level of 2.58% to4.10%.
The analysis of trends in the share of India’s exports to major export destinations during the lastdecade shows that Asia & Oceania region has improved its share significantly over the decadefrom 30% in 1990-91 to 37.48% in 2000-01. Similarly, North America’s share has increasedsubstantially from 16% to 24.73%. and Africa’s share has more than doubled from 2.61% to5.3%. However, the West European region has slipped from its top position as India’smain export destination to the second position with its share falling from 33.64% in1990-91 to 27.7% in 2000-01. Another important trading partner of India whose share hasfallen substantially is that of East European region. India’s exports to this region have declinedfrom a level of 17.87% in 1990-91 to 2.95% at the end of the decade.

41
In terms of growth performance of our exports to various destinations/regions, high growth rateson a year-on-year basis have been recorded in the case of Asia & Oceania, Africa, America andLAC. Low growth rates have been seen in our exports to West Europe and East Europe.Country-wise exports show that in the Asia & Oceania region, India’s export share to Hong Kongin India’s total exports has shown an increase from 3.29% to 5.94%. The share of our exports toChina to the total has increased from 0.10% to 1.87%. Other countries to which our exportsduring the last decade have increased are Bangladesh, Sri Lanka, Indonesia and Malaysia. Thecountries that have declined in importance in this region are Japan, Australia and Singapore.Among countries other than ESCAP region in Asia & Oceania, the share of our exports to UAEhas more than doubled. The substantial fall in the share of Western Europe can be attributed todecline in the share of our exports to Germany, U.K., Italy, Belgium, Switzerland and Finland. TheEast European story is largely explained by the fall in the share of our exports to CIS countries.
The trends in the merchandised export growth of India when compared to that of world indicatesthat India’s exports had witnessed positive growth in all the years when the world exports alsoregistered positive growth during the late nineties. In the year 1998, when world exports hadregistered negative growth India’s exports had also registered a negative growth. Theimplication of this is that India’s export growth is highly sensitive to world’s trade.
Some Key factors influencing world trade in 1990s
Some key factors influencing world trade are trade policy, pace and pattern of capital flows,relocation of global manufacturing bases, rapid technological development besides the overalleconomic growth. The Uruguay Round has brought under global trade rules the majorcomponents of National Income including services. The tendency to relocate the globalmanufacturing bases to Asian countries occurred on a large scale through the 1990s. This hasresulted in shifting of high skilled labour-based manufacturing such as electronics to Asiancountries that had built sufficient capability. Foreign Investment also has a major role to play inenhancing exports. While inward FDI is very important for India’s exports of goods and services,outward FDI is also important in exports, particularly export of services.
Region-wise world Trade and India’s Exports vis-à-vis S.E.Asia and China
Among the regions, North America continued to be the major motor of global trade expansionthrough the 1990s. The strength of US domestic demand pushed the demand of merchandiseimports to higher levels. In the aftermath of financial crisis of 1997-98, Asia’s trade and outputrecovered strongly. The region’s GDP growth matched with global economy as a whole. Asia’smerchandise and commercial services trade exceeded the world average. The high growthrates of exports in these two regions helped India in achieving higher growth rates of exportsparticularly in the late 1990s because India’s share of exports to America and Asia & Oceaniaregion put together was more than 50% in the year 2000-01. Among the leading traders in Asia,China expanded its merchandise trade at nearly twice the rate of Asia as a group in the 1990s,

42
while Japan’s trade growth lagged behind. India’s exports to China has also been increasing ata faster rate than India’s imports from China during the last few years. Thus India has alsobenefited from the expansion of merchandise trade of China in 1990s.While benchmarking India’s export performance vis-à-vis some Asian countries it is seen thatthe degree of openness of India’s external sector is much below that of China, South Korea,Singapore, Thailand, Indonesia and Malaysia. India’s share in world exports is also low. WhileIndia has a share of 0.67% of world exports, many countries in Asia have a share of 1% andabove like China (3.9%), Hong Kong (3.2%), Korea (2.7%), Singapore (2.2%), Malaysia (1.5%),Thailand (1.1%) and Indonesia (1.0%).
The comparative performance of India’s export sector vis-à-vis global exports and some of themajor Asian economies reveal that although liberalisation efforts have helped India to reach ahigher trajectory of export growth rate, it was not found sufficient to compete with Asian tigers.
World Trade Basket
An examination of the world trade basket shows groups like agricultural products and iron andsteel had steadily declining shares in the 1990s while office & telephone equipment traderecorded large gains in share in world trade. Automobile parts and chemicals also have shownrising shares.
The impact of September 11 events has been only for the short term and is not likely to affectIndia’s exports in the medium term. India’s success at Doha can be turned into concrete resultsin areas like Agriculture exports, services, pharmaceuticals, etc by necessary policy changesand removal of market access barriers in our export markets.
Review of Past Export Strategies
In the past, the Ministry of Commerce had formulated several export strategies that identifiedgrowth markets and products. The strategic assumption behind such strategies is that sinceresources are limited, concentration on selected product, market segments would provide betterreturn in terms of incremental exports expansion compared to the strategy where the limitedresources are distributed thinly over a large spectrum of products and markets.
The Extreme Focus Product Strategy was introduced in 1992 with the objective of giving afocussed attention to products that have high production capacity in India and potential for exportcompetitiveness. The target for the Focus Products was to induce growth of 30% volume/valuein the medium term and stabilise growth in the subsequent period. This strategy has achievedmixed success. While the growth of all the items taken together covered under Extreme Focushas been higher than that of the complete basket of exports, the performance against targetswas average with only 14 items reaching the targetted value.

43
The 15X15 Matrix Strategy was first launched in the year 1995. The objective of this strategy was
to identify market diversification and commodity diversification. An examination of the
effectiveness of the strategy shows that there has been a market diversification for the top
products though there has been a product consolidation for the top markets. The top three items
of India’s exports contained in the Matrix continue to remain the same during 2000 - 01 i.e. Gems
and Jewellery, RMG Cotton including accessories and Cotton Yarn, Fabrics and Made Ups.
The top three destinations changed from US, UK and Japan to US, Hong Kong and UAE.
Focus LAC was another strategy launched in 1997 with the objective of boosting exports of
select items like Textiles including RMG, Engineering goods and Chemical products to Latin
American Region. The highest ever growth rate of exports to this region was achieved in the
year 2000-01 when the value of exports touched an all time high of USD 982 million. Although the
current volume of trade between LAC and India is still low, there is scope for enhancing two-way
trade between India and the LAC region.
Conclusions
The main lesson that we learn from the three export strategies of the last decadediscussed above is that the composition, competitiveness and complexion of worldmerchandise trade are changing very fast and a dynamic approach with a built ininstitutional mechanism for constant review is essential for any medium term exportstrategy in order to achieve a higher share of Global exports on a sustainable basis.The focus of the past strategies was on the existing export products of India; what isadditionally necessary is to review the import baskets of our current and potentialmarkets and also to examine our export competitiveness, both revealed and real basedon our potentialities.
The need for a dynamic approach and continuous review are reinforced by theexperience of 2001-02 when the slowdown in world economy witnessed from thebeginning of 2001 and aggravated by the September 11, 2001 event led to drastic fall inthe growth rate of India’s exports during April-November 2001-02. The overall mediumterm strategy, however, would have to be necessarily evolved on the basis of theperspective of a longer time frame and the present study has, therefore, been based onthe experience of the last decade.