rising farm exports and international trade policies
TRANSCRIPT

Rising Farm Exports andInternational Trade Policies
CLIFTON B. LUTTRELL
those of the 1920s and early 1930s, many farm groupshave supported such restrictive policies in the pastand continue to support them today.
FARM EXPORTS ASSOCIATEDWITH TOTAL IMPORTS
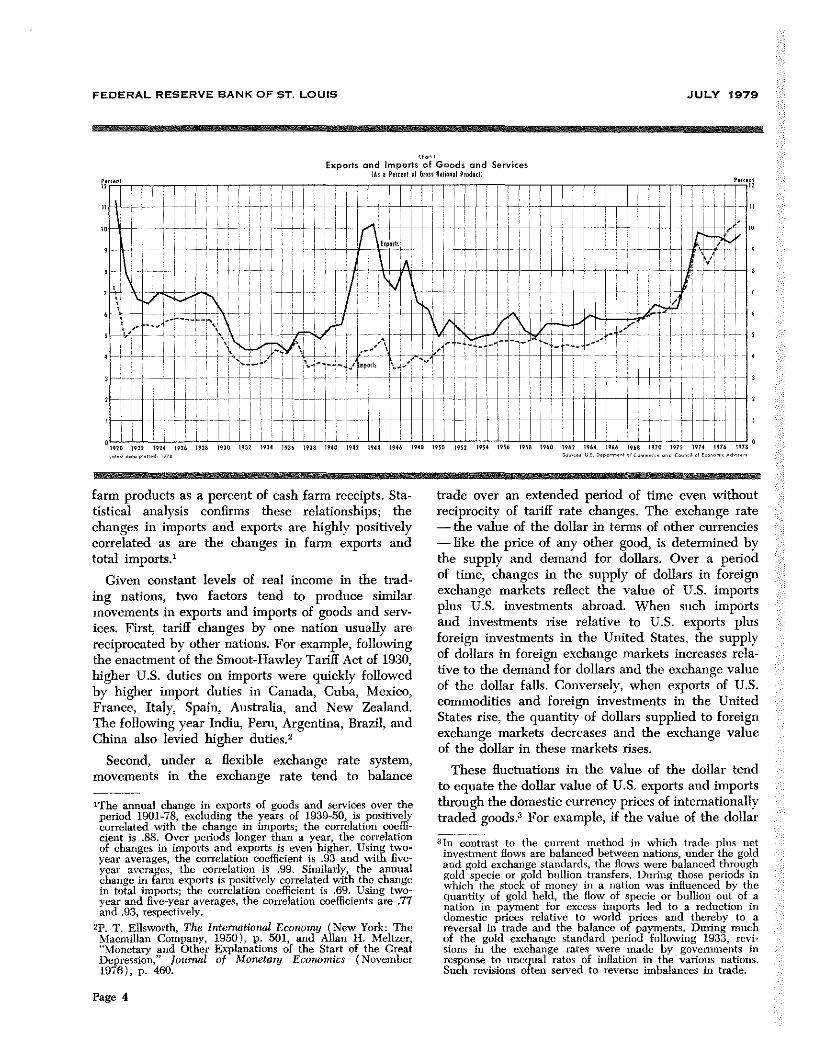
Farm exports tend to move in the same directionas total exports, and both tend to move in the samedirection as total imports. Chart 1 shows that, asidefrom World War II and the immediate post-war yearswhen foreign aid was a major portion of total ex-ports, exports and imports as a percent of GNP gen-erally have moved in the same direction. Chart 2shows the same general movements for exports of
‘] he ill pact of nsin g demand for17.S. lam e\ports oh the priceji d prod’idioi of t .5. far,
prod v Is is dcmon~trated in liii’ 5
~:~tiip] p \\ /1 ) ‘d )fl1eS1.iC pl is e’port 2d.qnai d br t. .5 farm prod’hc ts.ui,’
1D -. ) = c~~øiI Lit hOdnd p1
11 ~rlt I, and pi odm tion of
t~’~’~ D2
Dp~~ of ttii,, p~~dutRi,I’ and Q. n ~pr th tb . antI .in’ 1nic.rvase in fi it’i~ii CIt’tnai ii w diincrca%t’ U ul di iiwjid I P.10(1 pIke anti pmndru lion. i
EXPORTS of farm commodities in 1978 totaled$29.4 billion, almost 27 percent of the value of allcash farm receipts, and a further increase in farmexports is expected this year. Farm exports have in-creased rapidly and consistently during the pastdecade both in nominal value and as a percent ofcash farm receipts. The nominal value of such ex-ports last year was more than five times that of1989 and such exports, as a percent of cash farmreceipts, more than doubled over the period. Despitethis sharp increase, however, farm exports as a per-cent of cash farm receipts have only recently regainedthe levels that existed in the early 1920s.
much of the increase inThis article suggests thatthe proportion of farmproducts exported in re-cent years is a result ofmajor changes in U.S. andother nations’ foreign tradepolicies. The restrictivetrade legislation of the1920s and 1930s sharply re-duced imports which, cou-pled with retaliatory re-strictions imposed by othernations, also reduced U.S.exports. This reductionhurt the farm sector se-verely (see box). This arti-cle further demonstratesthat despite the damage tofarmers caused by restric-tive trade policies such as
Page 3
FEDERAL RESERVE BANK OF ST. LOUIS JULY 1979
Exports and imports of Goods and ServicesAs Percuss at Gross IOtisnuI Product)
9920 9922 0934 426 925 0930 9311970
0934 9936 938 0940 0942 0944 9946 0940 ‘955 0952 0954 0956 095) 0960 0961 0964 966 0965 9970 1972 974 9976 4979
farm products as a percent of cash farm receipts. Sta-tistical analysis confirms these relationships; thechanges in imports and exports are highly positivelycorrelated as are the changes in farm exports andtotal imports.1
Given constant levels of real income in the trad-ing nations, two factors tend to produce similarmovements in exports and imports of goods and sen’-ices. First, tariff changes by one nation usually arereciprocated by other nations. For example, followingthe enactment of the Smoot-Hawley Tariff Act of 1930,higher U.S. duties on imports were quickly followedby higher import duties in Canada, Cuba, Mexico,France, Italy, Spain, Australia, and New Zealand.The following year India, Peru, Argentina, Brazil, and
China also levied higher duties.2
Second, under a flexible exchange rate system,movements in the exchange rate tend to balance
1The annual change in exports of goods and services over theperiod 1901-78, excluding the years of 1939-50, is positivelycorrelated with the change in imports; the correlation coeffi-cient is .88. Over periods longer than a year, the correlationof changes in imports and exports is even higher. Using two-year averages, the correlation coefficient is .93 and with five-year averages, the correlation is .99. Similarly, the annualchange in farm exports is positively correlated with the changein total imports; the correlation coefficient is .69. Using two-year and five-year averages, the correlation coefficients are .77and .93, respectively.
21). T. Ellsworth, The Intenuitional Economy (New York: TheMacmillan Company, 1950), p. 501, and Allan H. Meltzer,“Monetary and Other Explanations of the Start of the GreatDepression,” Journal of Monetanj Economics (November1976), p. 460.
trade over an extended period of time even withoutreciprocity of tariff rate changes. The exchange rate— the value of the dollar in terms of other currencies— like the price of any other good, is determined bythe supply and demand for dollars, Over a periodof time, changes in the supply of dollars in foreignexchange markets reflect the value of U.S. importsplus U.S. investments abroad. When such importsand investments rise relative to U.S. exports plusforeign investments in the United States, the supplyof dollars in foreign exchange markets increases rela-tive to the demand for dollars and the exchange valueof the dollar falls. Conversely, when exports of U.S.commodities and foreign investments in the UnitedStates rise, the quantity of dollars supplied to foreignexchange markets decreases and the exchange valueof the dollar in these markets rises.
These fluctuations in the value of the dollar tendto equate the dollar value of U.S. exports and importsthrough the domestic currency prices of internationallytraded goods.3 For example, if the value of the dollar3In contrast to the current method in which trade plus netinvestment flows are balanced between nations, under the goldand gold exchange standards, the flows were balanced throughgold specie or gold bullion transfers. During those periods inwhich the stock of money in a nation was infinenced by thequantity of gold held, the flow of specie or bullion out of anation in payment for excess imports led to a reduction indomestic prices relative to world prices and thereby to areversal in trade and the balance ot payments. During muchof the gold exchange standard period following 1933, revi-sions in the exchange rates were made by governments inresponse to unequal rates of inflation in the various nations.Such revisions often served to reverse imbalances in trade.
Page 4
FEDERAL RESERVE BANK OF ST. LOUIS JULY 1979
a \
..5....4’
rca..1
—.
07
*.N~
-%\
~\‘.
‘~
‘.-
‘.1
as
79,711
Exports andOil t P
imports of Farm ProductstraIt at Cash Form Retorts)
::IT
~,
T~ “H ‘1
$~ ~r
L~
3i
20
F~i~
0920 0922 0924 9424 0939 0930 0932 9934 9436 9929 9945 0943107B
0960 0970 9978-J-- L
,~s\ 5’
6,~~
U-
-I
‘/
\ ft
5%,
F.
R
9906
.,
Error
Id
I
9944
7~I
U-0946
A
.9
U-9945
a.
\,
0930
oprO
~
0052~1~
9934
-I ~‘s
lose
r
0960
50d
0963
/
0944 0946
5’,r
VF.
-~
—~,,
/
9972
I
0474 0976
-,
S5ll~,. 9.5. 3,p,,o,.,,o,FAs,is,h,,,0S.
falls relative to the value of the Japanese yen, prices ofJapanese television sets to U.S. consumers will rise;consequently, fewer Japanese television sets will bepurchased. But the Japanese, finding that U.S. wheatand soybeans can be purchased for fewer yen, willimport more of these products. Similarly, if the valueof the U.S. dollar falls relative to all foreign curren-cies, foreign residents will find U.S. goods cheaperthan before, and U.S. exports will increase. Con-versely, if the value of the dollar rises relative toother currencies, U.S. citizens will find that the dollarprices of foreign goods have fallen relative to U.S.goods, and imports will increase.4 Given the tendencyfor the exchange rate mechanism to equate the dollarvalue of exports and imports, attempts to reduce im-ports will have a similar effect on the demand forexports including exports of farm products.
RESTRICTIVE IMPORT POLICIES LEDTO DECLINES IN TOTAL IMPORTS,
FARM EXPORTS, AND FARM INCOME
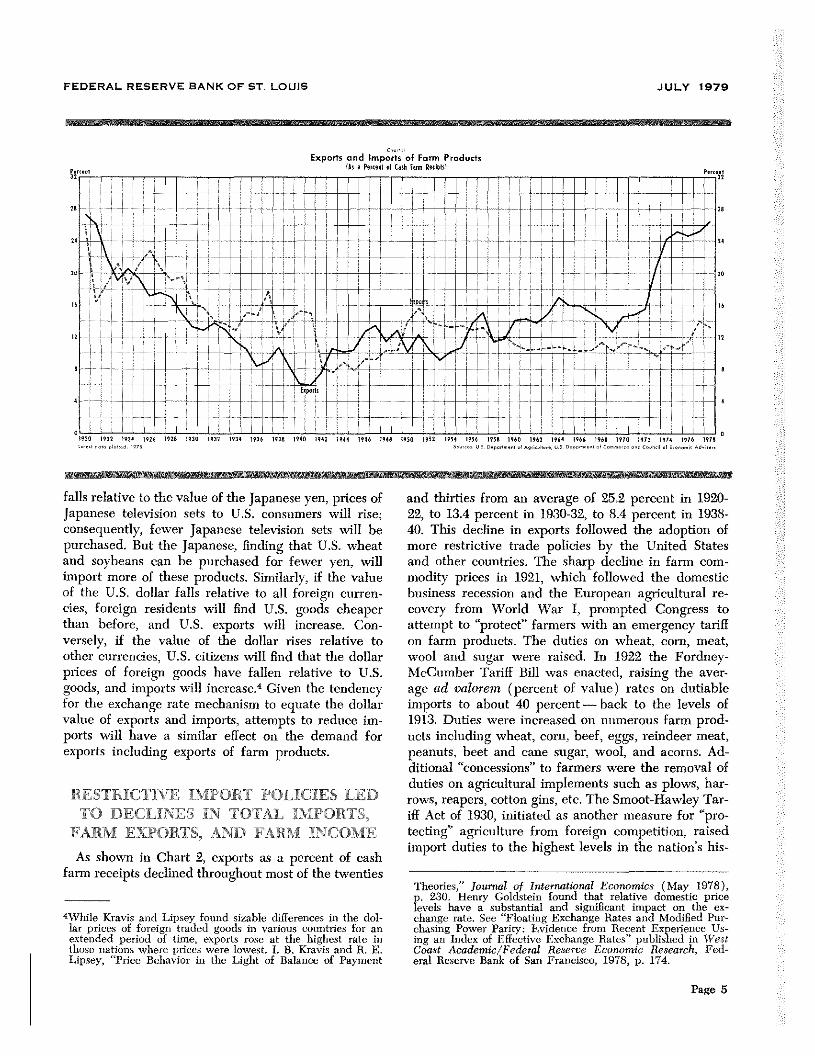
As shown in Chart 2, exports as a percent of cashfarm receipts declined throughout most of the twenties
4While Kravis and Lipsey found sizable differences in the do!-lar prices of foreign traded goods in various countries for anextended period of time, exports rose at the highest rate inthose nations where prices were lowest. I. B. Kravis and H. E.Lipsey, “Price Behavior irs the Light of Balance of Payment
and thirties from an average of 25.2 percent in 1920-22, to 13.4 percent in 1930-32, to 8.4 percent in 1938-40. This decline in exports followed the adoption ofmore restrictive trade policies by the United Statesand other countries. The sharp decline in farm com-modity prices in 1921, which followed the domesticbusiness recession and the European agricultural re-covery from World War I, prompted Congress toattempt to “protect” farmers with an emergency tariffon farm products. The duties on wheat, corn, meat,wool and sugar were raised. In 1922 the Fordney-McCumber Tariff Bill was enacted, raising the aver-age ad valorem (percent of value) rates on dutiableimports to about 40 percent — back to the levels of1913. Duties were increased on numerous farm prod-ucts including wheat, corn, beef, eggs, reindeer meat,peanuts, beet and cane sugar, wool, and acorns. Ad-ditional “concessions” to farmers were the removal ofduties on agricultural implements such as plows, har-rows, reapers, cotton gins, etc. The Smoot-Hawley Tar-iff Act of 1930, initiated as another measure for “pro-tecting” agriculture from foreign competition, raisedimport duties to the highest levels in the nation’s his-
Theories,” Journal of International Economics (May 1978),p. 230. Henry Goldstein found that relative domestic pricelevels have a substantial and significant impact on the ex-change rate. See “Floating Exchange Rates and Modified Pur-chasing Power Parity: Evidence from Recent Experience Us-ing an Index of Effective Exchange Rates” published in WestCoast Academic/Federal Reserve Economic Research, Fed-eral Reserve Bank of San Francisco, 1978, p. 174.
Page 5

FEDERAL RESERVE BANK OF ST LOUIS JULY 1979
C6oo0 000
Decline in Imports Following Tariff Acts of 1922 and 1930(Dutiable as Percent of Daty.free Imports)’)
40
70
60
SO
T r~r -:9922 0923 tt34 9925 0926 0927 928 0939 0930 0930 0932 933 0934
$9,000: j 9to~,Ado,,: ~U,0t.d $0~too 099,009,00,4 Doo0o~09,0,0,,,,, 7,,0,4 Aoo,Ooo, 009,9,000 5,,kw ij~,~’945).II Ootiobl,Ooop,,t,,o,oo.,oo 940,0,—,, o,,0990, 00,0.4. Allot 9’, 0,,p,,to 0’’ 00,0.0 9094 daty.9000,
‘93’
tory. Although already high by historical standards,rates were further increased on more than 800 items,5
The initial 1921 emergency tariff had little effect onthe volume of foreign trade or on farm commodityexports. The United States was a net exporter of mostof the commodities being protected and remained so.Hence, the protective features of the act were largelyillusory. The Fordney-McCumber Tariff Act in 1922and the Smoot-Hawley Act in 1930, however, signifi-cantly reduced import growth, thereby setting in mo-tion forces that reduced exports of farm products.
Imports as a percent of GNP declined from 7.3 per-cent in 1920 to about 5.4 percent in 1922. They re-mained near that level until 1930 when they declinedeven further as a result of the Smoot-Hawley Tariffand the Great Depression. They dropped to 3.6 percentof GNP in 1932 and remained near this level through-out the remainder of the decade (Chart 1). Totalexports followed the same general pattern. Exportsof farm products, however, declined faster than ex-ports of noafarm products as farmers in other nations
~F. W. Taussig, The Tariff History of the United States(New York: Augustus M. Kelley, 1967), pp. 452, 455, 504-11.Rates were increased on numerous farm products includingsugar, cotton, cattle, beef, sheep, mutton, swine, corn, milk,cream, eggs, live poultry, hides, leather, onions, tomatoes,cabbages, turnips, and blueberries.
demanded and generally received greaterprotection than the nonfarm sector. Farmexports declined from 22 percent of cashfarm receipts in 1922 to: 8.4 percent in1938.
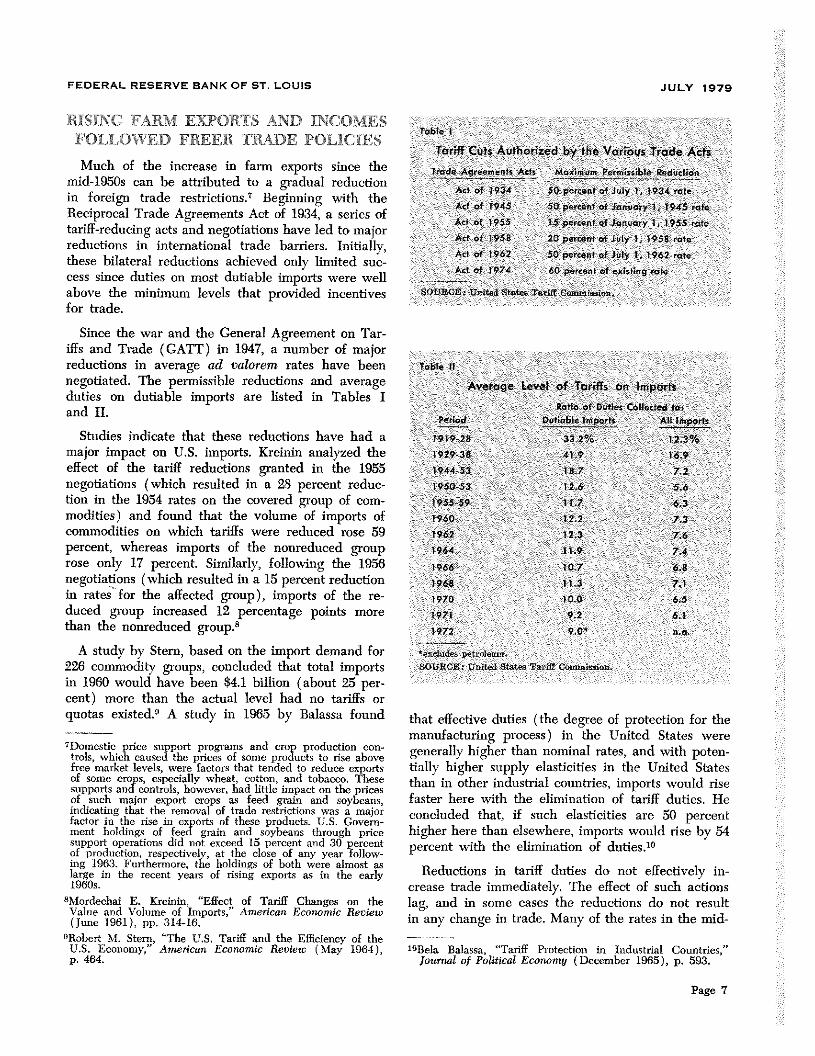
One statistical study of U.S. demandfor imports found evidence that the tar-iffs were a major factor in the decline ofimports during the 1920s and early 1930s.The study demonstrated that the tariffscaused a greater reduction in dutiableimports (imports on which tariffs werelevied) than in duty-free imports. Aftereliminating the effects of shifts in im-ports from duty-free to dutiable, andvice versa, the study found that dutiableimports as a percent of duty-free importsdeclined sharply following the higherduties in both 1922 and 1930 (Chart 3).During the three years following the1922 Act, the index of the quantity ofdutiable imports declined to 77 percentof the index of duty-free imports, andin the three years following the 1930
Act, the index of dutiable imports declined furtherto 53 percent of the duty-free imports.6 Since exportsare closely associated with imports, the tariffs wereindirectly a major factor in the decline of farmexports.
Since exports accounted for such a large portion ofU.S. farm commodity sales (15 percent in 1929), thedecline in farm exports had a greater impact on farmincome than the decline in nonfarm exports had onincome in the nonfarm sector. Hence, farm incomesdeclined more dramatically than did nonfarm income.For example, farm income declined at an average an-nual rate of 31 percent during the 1929-32 period,compared with a 17 percent rate for total personalincome.
if the tariff accounted for the difference betweenthe percentage decline in total personal income andfarm income during the period, about 40 percent ofthe decline in fann income during 1929-32 can beattributed to it. If farm income had declined only atthe rate of the national aggregates, net farm incomein 1932 would have totaled about $3.6 billion insteadof $2.0 billion.
6J. Hans Adler, “United States Import Demand During theInterwar Period,” American Economic Review (June 1945),pp. 418-30.
6
Poroect000
90
t,,,00 d,oopI,tt,4.
Page 6
FEDERAL RESERVE BANK OF ST. LOUIS JULY 1979
RISING FARM EXPORTS AND INCOMESFOLLOWED FREER TRADE POLICIES
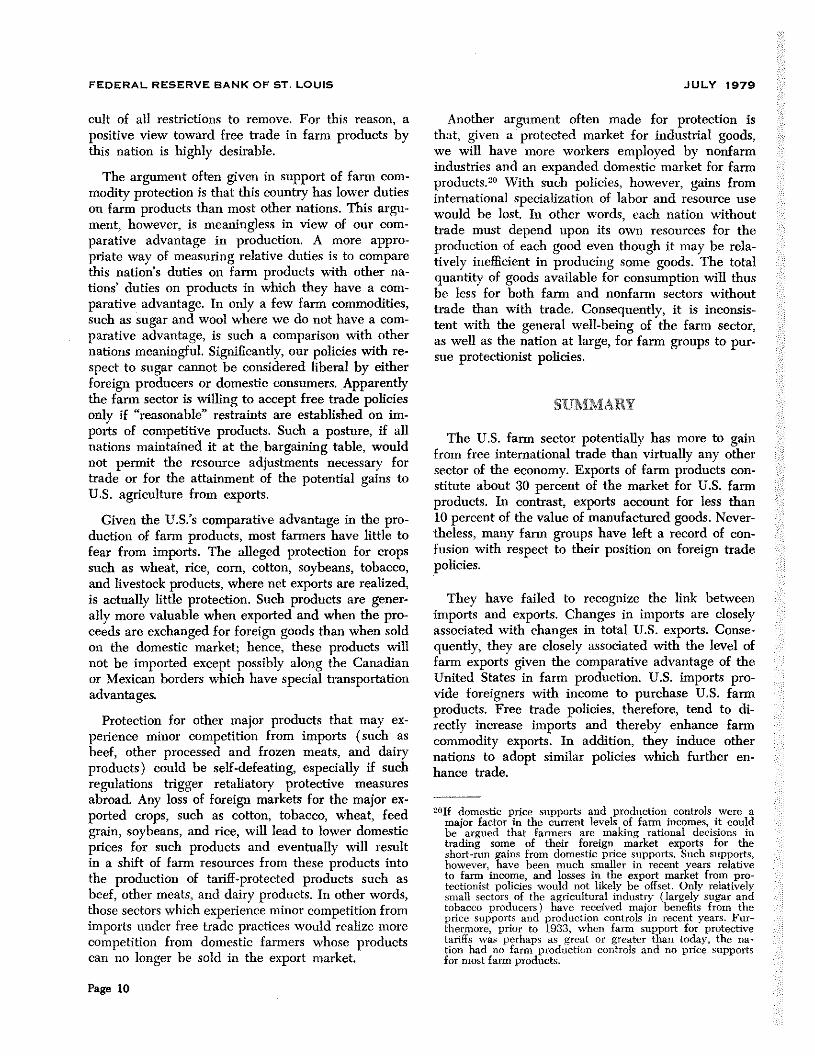
Much of the increase in farm exports since themid-1950s can be attributed to a gradual reductionin foreign trade restrictions.t Beginning with theReciprocal Trade Agreements Act of 1934, a series oftariff-reducing acts and negotiations have led to majorreductions in international trade barriers. Initially,these bilateral reductions achieved only limited suc-cess since duties on most dutiable imports were wellabove the minimum levels that provided incentivesfor trade.
Since the war and the General Agreement on Tar-iffs and Trade (GAn) in 1947, a number of majorreductions in avenge ad valorem rates have beennegotiated. The permissible reductions and averageduties on dutiable imports are listed in Tables Iand H.
Studies indicate that these reductions have had amajor impact on U.S. imports. Kreinin analyzed theeffect of the tariff reductions granted in the 1955negotiations (which resulted in a 28 percent reduc-tion in the 1954 rates on the covered group of com-modities) and found that the volume of imports ofcommodities on which tariffs were reduced rose 59percent, whereas imports of the nonreduced grouprose only 17 percent. Similarly, following the 1956negotiations (which resulted in a 15 percent reductionin rates for the affected group), imports of the re-duced group increased 12 percentage points morethan the nonreduced group-°
A study by Stern, based on the import demand for226 commodity groups, concluded that total importsin 1960 would have been $4.1 billion (about 25 per-cent) more than the actual level had no tariffs orquotas existed.9 A study in 1965 by Balassa found
tDomestic price support programs and crop production con-trols, which caused the prices of some products to rise abovefree market levels, were factors that tended to reduce exportsof some crops, especially wheat, cotton, and tobacco. Thesesupports and controls, however, had little impact on the pricesof such major export crops as feed grain and soybeans,indicating that the removal of trade restrictions was a majorfactor in the rise in exports of these products. U.S. Govern-ment holdings of feed grain and soybeans through pricesupport operations did not exceed 15 percent and 30 percentof production, respectively, at the close of any year follow-ing 1963. Furthermore, the holdings of both were almost aslarge in the recent years of rising exports as in the early1960s.
8Mordechai E. Icreinin, “Effect of Tariff Changes on theValue and Volume of Imports,” American Economic Review(June 1961), pp. 314-16.
°RobertM. Stem, “The U.S. Tariff and the Efficiency of theU.S. Economy,” American Economic Review (May 1984),p. 464.
Table I
Tariff Cuts Authorized by the Various Trade Acts
Trade Agreements Acts Maximum Permissible Reduction
Act of 1934 50 percent of July 1 • 1934 rate
Act of 1945 50 percent of January 1, 1945 rote
Ac, of 1955 IS percent of January I • 1955 rate
Act of 1958 20 percent of July 1, 1958 rate
Act of 1962 50 percent of July I, 1962 rate
Act of 1974 60 percent o~existing rate
soi;a~E United Stateo Thrift commission.
Table II
Average level of Tariffs an Imports
Ratio of Dutien Collected to:Period Dutiobte Imparts All Imparts
1919-28 332% 12.3%
1929.38 41.9 16.9
1944-53 18.7 7.2
1950.53 12.6 5.6
1955.59 11.7 6.3
1960 12.2 7.3
1962 12.3 7.6
1964 11.9 7.4
1966 10.7 6.8
1968 11.3 7.1
1970 10.0 6.5
1971 9.2 6.1
1972 9.0~ n.a-
oxelosoies petr,’~eosrn.Siit;ri Cs 1.nO tt-d Suite” Tao i if fl,rn,ro isok-n.
that effective dnA ics thc degree of protec’tiol C It if theiouwufaetunng process) in the U rated States weregene ra1i~inghcr than itocutnal ratcs. and with pu it en—tiall~ higher supply elasticities in tilt l.nth’d Slatesthan iii other industrial countries imports would riseluster here with lhe.~elilwuatetcts of tariff duties. lieconchulc -d that. if so ch elasticities are 50 pcrcci ithigher here titan elsewhere, imports would rise by S’Iperceiit WIth flu’ (‘un lii iatmn of duties.
Reductions in tariff dntLes do not effectively in-crease trade ion Ii iediattlv. The elI oct of such actionslag. arid in sortie eases thu reduct itsi us do not resi elfho Urn c-lounge’ ho trade. Main’ of the rates in the mid—
‘‘Bela Bakw,L “ILls1
hoo~t-s-t~,ro,in !o.clu,trial C .oonrctrie~.’
Jonu, rca1
of Pci/il ira! I.cone wolf Dent- sit’’ ‘r 1965 . p..593.
Page 7

FEDERAL RESERVE BANK OF ST. LOUIS JULY 1979
Table III
Congressional Vote on the Smoot-Hawley Tariff Act of 1930
Percent of WorkersIn In Representatives Senators
Section of Nation Agriculture Manuacturing For Against For Against
New England 6.2% 43.1% 27 3 ii 1
Middle Atlantic 5.3 36.3 64 27 4 2
East North Central 14.4 35.7 60 21 8 2
West North Central 33.6 19.8 33 23 3 11
South Atlantic 32.5 24.2 14 39 7 9
East South Central 47.8 16.9 8 30 1 7
West South Central 40.5 16.9 ii 3D 2 6
Mountain 30.8 18.3 ii 2 8 8
Pacific 14.5 26.1 IS 1 5 I
United States 21.4 28.9 246 176 49 47
SOURCE: u.s.. congress, Cen,srer:si’,,,ai flrcu,-d, and (1.5. Dtpartrner.t of (‘osc,mcree.
1950s were well above the minimum prohibitive trade 15 percent in the 1960s, to about 25 percent since thelevel (the tariff level at svhich no trade will occur) and mid-1970s.the reductions only reduced the excess protection.Furthermore, as lower rates provided incentives fortrade, foreign producers still needed time to arrangefor merchandising and distributing facilities in theUnited States. Exporters of goods to the United Stateshad been effectively shut out of the U.S. market forabout 25 years — in the l930s because of the Smoot-Hawley Tariff, in the 1940s because of the war, andin the early 1950s because of the time required to pre-pare for increased exports.” THE FARM SECTOR HAS NOT
CO?SISTENTLY OPPOSEDRESTRICTIVE TRADE POLICIES
Despite the fact that protective tariffs have gen-erally harmed the well-being of farmers, elected rep-resentatives from major farming states have in somecases supported highly protective tariff legislation.Such support apparently was obtained by imposingduties on imports of farm products that would nothave been imported even without tariffs and exempt-ing farm implement imports from tariffs even thoughnone were imported anyway. The Secretary of Agri-culture’s report to the President in late 1930 pointedout these “favorable” aspects of the Smoot-HawleyTariff Act. He showed that the schedule for farmproducts was increased an average of 69 percent,whereas all schedules were increased an average ofonly 20 percent. He argued that a protective tariffmust become a more integral part of our nationalagricultural policy.’2 Such arguments apparentlygained support for the Act.
12U.S. Department of Agriculture, Yearbook of Agriculture1931 (Govermnent Printing Office, 1931), p. 42-44.
The sharp increase in farm exports had a favorableeffect on farm income. Gross farm income rose at an8.4 percent rate from 1969 to 1978, about the samerate as GNP growth. In contrast, during the previous10 years when farm exports were rising more slowly,gross farm income rose only 4.0 percent per year com-pared with a 6.8 percent rate of GNP growth.
By the mid-1950s, U.S. tariff rates on a large num-ber of commodities had been reduced to a levelwhich provided incentives for trade, and severalinternational organizations were established to in-crease exports to the United States. Imports of goodsand services as a percent of GNP increased moder-ately in the early 1960s from 4,5 percent to 6 per-cent in 1970 and to 10 percent in 1978 (Chart 1).By 1978, imports as a percent of GNP were thelargest for any year since the turn of the century.
Total exports and farm commodity exports followedthe pattern of total imports. As a percent of GNPand of farm cash receipts, respectively, they startedup in the 1950s, continued moderately up throughthe 1960s, and rose at a sharply higher rate in the1970s. Exports of farm products rose from about 10percent of cash receipts in the early 1950s, to about
“Kreinin, “Effect of Tariff Changes,” p. 319; also William P.Travis in “Production, Trade and Protection When ThereAre Many Commodities and Two Factors,” American Eco-nomic Review (March 1972), pp. 100-02.
Page 8

FEDERAL RESERVE BANKOEST LOUIS JULY 1979
The voting record in Congress indicates that sizablesupport for this highly protectionist measure camefrom some of the leading farm states. The House ofRepresentatives opposed the act in only three of thenine major sections of the nation, and the Senateopposed it in only four. The vote in the Senate, how-ever, was close (Table III). Support for the act wasstrongest in New England and the Middle Atlanticstates, where the percentage of workers in agricul-ture was relatively small and the percentage in man-ufacturing relatively large. The proportion of workersin agriculture averaged 6.2 and 5.3 percent, respec-tively, in the two regions. On the other hand, amajority of representatives supported the act in suchagricultural areas as the West North Central andMountain states, and large majorities supported it inboth the House and Senate in the Pacific states.
RESTRICTIVE POLICIES STILLRECEIVE MUCH FARM SUPPORT
Despite the major shrinkage both in the market forU.S. farm products and in farm income resulting fromthe ill-advised tariff of 1930, and despite the expansionof exports following the reduced tariffs in the 1950sand 1960s, recent actions of farm groups are not un-equivocally opposed to protectionist policies. Evidenceindicates that farmers still are sensitive to possible in-creases in agricultural imports. Organized and highlyarticulate groups of farmers, while largely interestedin the protection of specific farm products, still sup-port foreign trade policies which would result in hightariffs for farm products in general.
Sugar cane and sugar beet producers, for example,still insist on legislation to maintain domestic pricesabove world prices and to protect growers from “low-price” foreign sugar.’8 The National Livestock FeedersAssociation has gone on record against the “ivorytower” free trade philosophy that has characterizedU.S. trade policy for the past several years. The ex-ecutive vice president of the association, in hearingsbefore the Senate Committee on Finance in 1974,argued that our free trade policy has brought irre-parable harm to U.S. agriculture and industry andopposed proposed legislation to “wipe out” any dutyof not more than 5 percent ad valorem, since thiswould permit the free entry of a number of meatproducts.’4 Despite his contention that the U.S. dairy
13See John Valentine, “President’s Sugar Price-Support PlanWelcomed as End to a Key Uncertainty,’ The Wall StreetJournal, February 21, 1979.
14U.5., Congress, Senate, Committee on Finance, The Tradefleform Act of 1973, 93rd Cong., 2nd sess., March 25, 1974,pp. 947-84.
industry is, as a whole, among the most efficient in-dustries in the world, the secretary of the NationalMilk Producers Federation argued strongly againstfree trade. He stated in the above hearings: “Despiteall the fine sounds of free trade and expanded inter-national cooperation we must first take stock of ourown national interests.”15 While reaffirming the Na-tional Farmers Union’s traditional position in supportof expanding foreign trade, its national secretary inthe same hearings opposed any further reduction oftariff and nontariff barriers. He contended that fur-ther reductions in trade restrictions would underminefarm prices in both the United States and the Euro-pean Economic Community.~eThe American FarmBureau Federation, although making a strong state-ment for free trade in general, recommended at thehearings that Title TI of the act be amended so thatfarmers could more readily obtain relief from injurycaused by import competition.’7
The Agricultural Adjustment Act is indicative of thestrong support for protection for specific farm prod-ucts, delegating sufficient authority to limit the im-ports of almost any product that is competitive withU.S. farm products. The act directs the Secretary ofAgriculture to advise the President when he believesthat any farm commodity or product is being im-ported in quantities that will interfere with farm pricesupport or other USDA programs. The President maythen direct the International Trade Commission toconduct an investigation, after which he may pro-claim new duties or quantitative restrictions on theimports.’8
The maintenance of such a pattern of protectionfor farm commodities places this nation in an unfav-orable bargaining position for free trade in farmcommodities. The United States has just concludedthe Tokyo Round of negotiations which will take ef-fect starting in January 1980. In these negotiations,the United States obtained a broad range of tariffand nontariff concessions that are expected to sig-nificantly increase agricultural exports over the nextdecade. Among those products on which trade bar-riers were reduced are beef, pork, poultry, tobacco,fruit, vegetables, oilseeds, and nuts.’° Nevertheless,agricultural trade barriers are perhaps the most dUll-
‘~Ibid.,pp. 964-89.‘°Ihid., pp. 1030-31.
l7Ibid., p. 1011.8united States International Trade Commission, “Operation
of the Trade Agreements Program,” 26th Report, 1974,p. 32.
‘“U.S. Department of Agriculture, Agricultural Outlook (May1979), p. 10.
Page 9
FEDERAL RESERVE BANK OF ST. LOUIS JULY 1979
cult of all restrictions to remove. For this reason, apositive view toward free trade in farm products bythis nation is highly desirable.
The argument often given in support of farm com-modity protection is that this country has lower dutieson farm products than most other nations. This argu-ment, however, is meaningless in view of our com-parative advantage in production. A more appro-priate way of measuring relative duties is to comparethis nation’s duties on farm products with other na-tions’ duties on products in which they have a com-parative advantage. In only a few farm commodities,such as sugar and wool where we do not have a com-parative advantage, is such a comparison with othernations meaningful. Significantly, our policies with re-spect to sugar cannot be considered liberal by eitherforeign producers or domestic consumers. Apparentlythe farm sector is willing to accept free trade policiesonly if “reasonable” restraints are established on im-ports of competitive products. Such a posture, if allnations maintained it at the bargaining table, wouldnot permit the resource adjustments necessary fortrade or for the attainment of the potential gains toU.S. agriculture from exports.
Given the U.S.’s comparative advantage in the pro-duction of farm products, most farmers have little tofear from imports. The alleged protection for cropssuch as wheat, rice, corn, cotton, soybeans, tobacco,and livestock products, where net exports are realized,is actually little protection. Such products are gener-ally more valuable when exported and when the pro-ceeds are exchanged for foreign goods than when soldon the domestic market; hence, these products willnot be imported except possibly along the Canadianor Mexican borders which have special transportationadvantages.
Protection for other major products that may ex-perience minor competition from imports (such asbeef, other processed and frozen meats, and dairyproducts) could be self-defeating, especially if suchregulations trigger retaliatory protective measuresabroad. Any loss of foreign markets for the major ex-ported crops, such as cotton, tobacco, wheat, feedgrain, soybeans, and rice, will lead to lower domesticprices for such products and eventually will resultin a shift of farm resources from these products intothe production of tariff-protected products such asbeef, other meats, and dairy products. In other words,those sectors which experience minor competition fromimports under free trade practices would realize morecompetition from domestic farmers whose productscan no longer be sold in the export market.
Page 10
Another argument often made for protection isthat, given a protected market for industrial goods,we will have more workers employed by nonfarmindustries and an expanded domestic market for farmproducts.2°With such policies, however, gains frominternational specialization of labor and resource usewould be lost. In other words, each nation withouttrade must depend upon its own resources for theproduction of each good even though it may be rela-tively inefficient in producing some goods. The totalquantity of goods available for consumption will thusbe less for both farm and nonfarm sectors withouttrade than with trade. Consequently, it is inconsis-tent with the general well-being of the farm sector,as well as the nation at large, for farm groups to pur-sue protectionist policies.
SUMMARY
The U.S. farm sector potentially has more to gainfrom free international trade than virtually any othersector of the economy. Exports of farm products con-stitute about 30 percent of the market for U.S. farmproducts. In contrast, exports account for less than10 percent of the value of manufactured goods. Never-theless, many farm groups have left a record of con-fusion with respect to their position on foreign tradepolicies.
They have failed to recognize the link betweenimports and exports. Changes in imports are closelyassociated with changes in total U.S. exports. Conse-quently, they are closely associated with the level offarm exports given the comparative advantage of theUnited States in farm production. U.S. imports pro-vide foreigners with income to purchase U.S. farmproducts. Free trade policies, therefore, tend to di-rectly increase imports and thereby enhance farmcommodity exports. In addition, they induce othernations to adopt similar policies which further en-hance trade.
2011 domestic price supports and production controls were amajor factor in the current levels of farm incomes, it couldbe argued that farmers are making rational decisions intrading some of their foreign market exports for theshort-run gains from domestic price supports. Such supports,however, have been much smaller in recent years relativeto farm income, and losses in the export market from pro-tectionist policies would not likely be offset. Only relativelysmall sectors of the agricultural industry (largely sugar andtobacco producers) have received major benefits from theprice supports and production controls in recent years. Fur-thermore, prior to 1933, when farm support for protectivetariffs was perhaps as great or greater than today, the na-tion had no farm production controls and no price supportsfor most farm products.