success review automotive display business for the six months ended 30 june 2016, the average...
TRANSCRIPT
Collaborating for Success
Varitronix International Limited Stock Code 710
Interim Report 2016

Chairman’s Statement
1Interim Report 2016
Financial HighlightsSix months ended Six months ended
HK$ million 30 June 2016 30 June 2015
Revenue 1,119 1,283
Profit attributable to shareholders 4 280
Basic earnings per share 0.90 HK cents 85.37 HK cents
On behalf of Varitronix International Limited (the “Company”) and its subsidiaries (collectively referred to as “Varitronix” or “the Group”), I present the Group’s results for the period ended 30 June 2016.
During the period under review, the Group recorded a revenue of HK$1,119 million, representing a 13% decrease from the HK$1,283 million reported for the first half of 2015. Profit from operations of the Group was HK$13 million, a 96% decrease year-on-year compared to HK$294 million. The Group’s profit attributable to shareholders was HK$4 million, a decrease of 99 % compared to HK$280 million for the same period in 2015.
Compared with the Group’s results for the period ended 30 June 2015, there is a significant decline in revenue, which is mainly due to the decrease in sales of monochrome automotive displays in South Korea and the People’s Republic of China (“PRC”). Moreover, during the first half of 2016, the Japanese yen appreciated, led to a higher purchase price of key materials sourced from Japan, resulted in realised and unrealised foreign exchange loss.
In the first half of 2016, there was also no one-off gain from the disposal of interest in Data Modul AG like that in the same period in 2015. These, coupled with the Group’s realised and unrealised loss from the net change in fair value of investment in listed trading securities, resulted in the Group’s profit attributable to shareholders for the first half of 2016 having significantly decreased compared with the same period in 2015.
DiviDenDSThe Board of Directors (the “Board”) resolved not to declare an interim dividend for the period ended 30 June 2016 (1H 2015: 15.0 HK cents).
Upon completion of the new shares subscription transaction between the Company and BOE Technology Group Co., Ltd. (“BOE”) at the end of April 2016, the Company declared and paid a special dividend of HK$1.35 per share to the Company’s ordinary shareholders. The Group will further consider the final dividend policy for the year ending 2016 after reviewing the financial performance in the second half of 2016.
Chairman’s Statement
2 Varitronix International Limited
BuSineSS ReviewAutomotive Display BusinessFor the six months ended 30 June 2016, the average selling price of automotive displays has been adversely affected by the market environment and changes in product mix. Thus, the revenue generated by the automotive d isp lay bus iness was HK$732 mi l l ion, representing a decrease of 19% compared to the same period last year. This business accounted for 65% of the Group’s total revenue.
During the first half year under review, there was an overcapacity of Thin Film Transistors (“TFT”) globally, which led to fierce competition and pressed down the average selling prices of TFT display and modules. The selling price of monochrome displays has also experienced a huge pressure and adjusted down accordingly. In the past, the mid-to-low end customers of the Group’s traditional automotive displays markets, such as Europe, widely adopted monochrome displays. Driven by the significant decrease in the selling price of the TFT display and modules, these customers switched to TFT modules products at an accelerated rate, which reduced the demand for the Group’s monochrome automotive displays. The price pressure of monochrome automotive displays also narrowed down the profit margin. In the meantime, the Group’s sales in automotive TFT modules has continued to increase. As the selling price of those TFT modules was usually
higher, the revenue generated by TFT modules was thus able to cover part of the losses incurred by the drop of monochrome displays business in Europe. However, since the Group did not have its own TFT panel production lines, the TFT business competitiveness was curtailed which limited the room for significant growth of TFT modules sales.
The PRC market has experienced the similar situation. As the price of TFT display and modules declined, most car manufacturers switched to TFT displays, which had adversely impacted on the Group’s sales in monochrome displays. In addition, the PRC economy slowed down, which in turn affected the business development and sales performance of automobile market.
The Korea automotive displays business faced fierce competition resulted in a continual decl ine in revenue. Customers stopped renewing certain orders of automotive monochrome displays, while new order quantities cannot cover the loss of revenue. The sales of automotive monochrome display in South Korea thus continued to be sluggish.
Fortunately, the Japanese market maintained steady growth in the first half of the year and the automotive display sales from Japan has recorded a remarkable growth on a year-on-year basis.

3Interim Report 2016
Industrial Display BusinessThe industrial display business generated a revenue of HK$387 million for the six-month period under review, similar to that of last year. This business contributed 35% to the total revenue.
The industrial display business from Europe remained steady and recorded a s l ight growth. Although the average selling price of industrial displays is relatively lower than that of automotive displays, the demand for industrial displays remained stable which provide a sustainable revenue source for the Group. Orders of European electricity meters and white goods sectors were particularly strong.
As the information displayed on industrial products is usually simpler, monochrome displays are still predominant. Industrial customers tend to favour display products that are reliable and precise, and monochrome displays can match their requirements, ensuring stable demand in this sector.
The industrial display business in the United States weakened slightly compared with last year. This was due to slow economic recovery and certain customers reduced or postponed their orders in the United States.
PRoSPectSMonochrome Display BusinessAlthough the Group’s current monochrome display business is under pressure from the expanding TFT market, monochrome display products still have room for growth in the mid-to-low automotive sectors and among industrial customers, benefited from its reliability and price competitiveness. The Group will seek to maintain steady development for its monochrome display business, while driving growth in the TFT business.
The demand for monochrome displays from Japanese cars remains steady. The Group has been increasing resources in the Japanese market to capture a larger market share. At the same time, Japanese customers have stringent product requirements and they seldom switch suppliers or product technologies. They are also relatively more willing to commit to a stable selling price to ensure product quality. As a result, the Group has ample room for growth in the monochrome automotive display business in Japan.
Due to global economic slowdown, growth in developing countries like India, Brazil and Russia was not as strong as expected. Once the economy improves, these markets will bring growth opportunities to the Group. Take India as an example, there is enormous potential for growth in its automobile market, especially for low-end cars at the early stage, presenting positive effects for our monochrome display business.

Chairman’s Statement
4 Varitronix International Limited
As for the industrial market, monochrome displays secure a leading position with steady demand in electricity meters and medical product sectors, but some white goods manufacturers have switched to adopt TFT displays.
TFT Business StrategyIn face of the ever growing TFT market, the Group will proactively seize opportunities for development. It has also formulated a series of strategies to expand the Group’s market share.
The Group completed the new shares subscription transaction at the end of April 2016, BOE as the Group’s major shareholder, currently holds approximately 54% of the Company’s issued share capital. BOE is one of the world’s major TFT display suppliers, which owns large-scale TFT panel production facilities. With BOE as the Group’s strategic shareholder, the Group enjoys a preferential and stable supply of TFT panel, favourable TFT panel prices and technology support, all of which further consolidate the Group’s TFT business.
BOE has accumulated many years’ experience in TFT panel technology which is able to support the Group’s TFT business. It includes supplying unique TFT panel designs to meet the products specifications of the Group’s customers. In terms of TFT materials sourcing, the Group will also benefit from the synergy of bulk purchase of BOE with its suppliers. BOE has also invested abundant resources in building production
lines of Active-matrix organic light-emitting diodes (“AMOLED”). This production platform buttresses the Group’s research in related technologies as well as their application to automotive products.
Varitronix is BOE’s major platform in developing automotive and industrial display businesses. BOE’s earliest automotive customers were mainly the PRC after-market car manufacturers. This customer base will be gradually migrated to the Group, which becomes a new source of revenue. BOE’s extensive market networks and human resources in the PRC and South Korea would serve to turn around the downward market trend in the PRC and South Korean markets.
Since the completion of the new shares subscription transaction, the Group’s existing automotive and industrial customers have gained confidence in the Group’s TFT module business. Besides receiving more requests for quotation of TFT projects, we have actually won certain number of new TFT projects, which will enter mass production stage in the latter half of 2017 and 2018.
Since the Group started design and production of TFT modules, we have been investing in the recruitment of expertise and equipment. With BOE as our strategic shareholder, we receive substantial resources to further expand our TFT module production facilities. The Group is now preparing to increase TFT module production lines and planning to increase its TFT module capacity by the first half of 2017, so as to accommodate the growth of TFT orders.

5Interim Report 2016
Technology DevelopmentThe Group’s technology team has been continually upgrading TFT display products’ capabilities, particularly in areas such as contrast ratio, brightness, responsiveness and colour gamut, in order to achieve the highest standards in automotive products.
In May, the Group participated in the Society of Information Display (“SID”) in the United States and presented its large, curved and fluid TFT automotive display screen. Installing such display enhanced the uniqueness of car interior design, which was widely acclaimed by the market. This innovative automotive display product will enter production in 2018.
Automotive rear-view display is another product in the pipeline. When it is not in use, the display screen will look no different from any rear-view mirror. Once it is on, it has functions like displaying videos and GPS messages. As this product has no fixed shape, it can fit all rear-view mirror designs and display a wider range of information.
In the meantime, the Group is developing an automotive grade on-cell touch panel technology, which does not require affixing the touch panel glass onto the display. Hence, the touch screen will be thinner and more competitive. The development of this technology is expected to be completed by the end of the year.
The Group is developing Head Up Display (“HUD”) system which includes not only display, but also light source, optical engine, driver board and software. An HUD demonstration unit has been successfully developed. The HUD
demonstration units can also be connected to mobile phone through our self-developed apps. With the system, the driver can watch the real time mobile navigation on the head up display. When there is incoming phone call or new message in the mobile phone, the driver can immediately read the same image on the head up display. Hence, the driver would not lose his/her attention during driving and also would not miss any phone calls and messages.
concluSion anD acKnowleDgementIn the first half of 2016, global economy was weak. In the face of an uncertain market environment, the Group’s management strove to control costs, including materials and labour costs, within the expected range. During this period, the Group stayed united, and identified stronger partnerships with strategic shareholders as a pragmatic and feasible strategy, so as to strengthen our existing TFT business. The Group’s management focused on completing the new shares subscription transaction in the first half of the year, working towards expanding its TFT business.
I would like to take this opportunity to sincerely thank the Group’s colleagues, the Board, shareholders and business partners, whose full support made possible the collaboration between BOE and Varitronix. Looking ahead, with the Group’s strong support and backup, I believe we can bring about win-win success.
Yao XiangjunChairmanHong Kong, 30 August 2016

Consolidated Financial Statements
6 Varitronix International Limited
conSoliDateD Statement oF PRoFit oR loSSfor the six months ended 30 June 2016 – unaudited(Expressed in Hong Kong dollars)
Six months ended 30 June2016 2015
Note $’000 $’000
Revenue 3 1,119,043 1,283,161
Other operating (loss)/income 4 (53,845) 164,577
Change in inventories of finished goods and work in progress (98,725) 5,731
Raw materials and consumables used (584,472) (759,228)
Staff costs (204,009) (220,353)
Depreciation (50,388) (51,326)
Other operating expenses (114,491) (128,278)
Profit from operations 13,113 294,284
Finance costs 5(a) (933) (1,938)
Share of profits less losses of associates – 4,180
Profit before taxation 5 12,180 296,526
Income tax 6 (7,921) (16,117)
Profit for the period attributable to the equity shareholders of the company 4,259 280,409
earnings per share (in HK cents) 8
Basic 0.90 cents 85.37 cents
Diluted 0.90 cents 84.45 cents
The notes on pages 11 to 19 form part of this interim financial report. Details of dividends payable to equity shareholders of the Company are set out in note 14(b).
conSoliDateD Statement oF PRoFit oR loSS anD otHeR comPReHenSive incomefor the six months ended 30 June 2016 – unaudited(Expressed in Hong Kong dollars)
Six months ended 30 June2016 2015
Note $’000 $’000
Profit for the period 4,259 280,409
other comprehensive income for the period (after tax and reclassification adjustments): 7
Items that may be reclassified subsequently to profit or loss:
– Foreign currency translation adjustments: net movement in exchange reserve (15,639) (12,142)
– Available-for-sale securities: net movement in fair value reserve (28) 430
other comprehensive income for the period (15,667) (11,712)
total comprehensive income for the period attributable to the equity shareholders of the company (11,408) 268,697
The notes on pages 11 to 19 form part of this interim financial report.

7Interim Report 2016
conSoliDateD Statement oF Financial PoSitionat 30 June 2016 – unaudited(Expressed in Hong Kong dollars)
at30 June
2016
At31 December
2015Note $’000 $’000
non-current assets
Fixed assets 9
– Property, plant and equipment 369,082 401,604
– Interest in leasehold land held for own use under operating leases 10,474 11,004
379,556 412,608
Interest in associates 4,891 4,747
Loans receivable 31,000 31,000
Other financial assets 27,998 57,353
Deferred tax assets 725 725
444,170 506,433
current assets
Trading securities 41,371 160,891
Inventories 10 383,281 472,995
Trade and other receivables 11 503,584 530,296
Other financial assets 29,323 –
Current tax recoverable 2,006 515
Fixed deposits with banks 12 201,760 –
Cash and cash equivalents 12 2,014,733 767,393
3,176,058 1,932,090
at30 June
2016
At31 December
2015Note $’000 $’000
current liabilities
Trade and other payables 13 277,272 376,288
Bank loans 26,671 136,395
Current tax payable 8,232 3,862
Dividends payable 553,258 –
865,433 516,545
net current assets 2,310,625 1,415,545
total assets less current liabilities 2,754,795 1,921,978
non-current liabilities
Bank loans – 8,879
Deferred tax liabilities 8,164 7,663
net aSSetS 2,746,631 1,905,436
caPital anD ReSeRveS 14
Share capital 183,764 82,782
Reserves 2,562,867 1,822,654
total eQuitY 2,746,631 1,905,436
The notes on pages 11 to 19 form part of this interim financial report.

Consolidated Financial Statements
8 Varitronix International Limited
conSoliDateD Statement oF cHangeS in eQuitYfor the six months ended 30 June 2016 – unaudited(Expressed in Hong Kong dollars)
Attributable to shareholders of the Company
Sharecapital
Sharepremium
Exchangereserve
Fair valuereserve
Capitalreserve
Otherreserves
Retainedprofits Total
Non-controlling
interestsTotal
equity$’000 $’000 $’000 $’000 $’000 $’000 $’000 $’000 $’000 $’000
Balance at 1 January 2015 81,979 709,652 81,273 14,944 17,748 12,466 873,795 1,791,857 244 1,792,101
changes in equity for six months ended 30 June 2015:
Profit for the period – – – – – – 280,409 280,409 – 280,409
Other comprehensive income – – (12,142) 430 – – – (11,712) – (11,712)
Total comprehensive income – – (12,142) 430 – – 280,409 268,697 – 268,697
Issuance of shares upon exercise of share options 482 6,129 – – (1,787) – – 4,824 – 4,824
Equity settled share-based transactions – – – – 216 – – 216 – 216
Dividends declared in respect of the previous year – – – – – – (98,878) (98,878) – (98,878)
Balance at 30 June 2015 82,461 715,781 69,131 15,374 16,177 12,466 1,055,326 1,966,716 244 1,966,960

9Interim Report 2016
conSoliDateD Statement oF cHangeS in eQuitY (continueD)
for the six months ended 30 June 2016 – unaudited(Expressed in Hong Kong dollars)
attributable to shareholders of the company
Sharecapital
Sharepremium
exchangereserve
Fair valuereserve
capitalreserve
otherreserves
contributedsurplus
Retainedprofits total
non-controlling
intereststotal
equity$’000 $’000 $’000 $’000 $’000 $’000 $’000 $’000 $’000 $’000 $’000
Balance at 1 January 2016 82,782 719,921 33,657 11,208 19,492 21,549 – 1,016,827 1,905,436 – 1,905,436
changes in equity for six months ended 30 June 2016:
Profit for the period – – – – – – – 4,259 4,259 – 4,259
Other comprehensive income – – (15,639) (28) – – – – (15,667) – (15,667)
Total comprehensive income – – (15,639) (28) – – – 4,259 (11,408) – (11,408)
Issuance of new shares 100,000 1,300,000 – – – – – – 1,400,000 – 1,400,000
Transfer to surplus reserve – (720,191) – – – – 720,191 – – – –
Issuance of shares upon exercise of share options 982 13,137 – – (3,715) – – – 10,404 – 10,404
Equity settled share-based transactions – – – – 1,509 – – – 1,509 – 1,509
Capitalisation of issuing expenses – (6,052) – – – – – – (6,052) – (6,052)
Dividends declared in respect of the previous year – – – – – – – (101,960) (101,960) – (101,960)
Special dividends declared during the period – – – – – – – (451,298) (451,298) – (451,298)
Balance at 30 June 2016 183,764 1,306,815 18,018 11,180 17,286 21,549 720,191 467,828 2,746,631 – 2,746,631
The notes on pages 11 to 19 form part of this interim financial report.

Consolidated Financial Statements
10 Varitronix International Limited
conDenSeD conSoliDateD caSH Flow Statementfor the six months ended 30 June 2016 – unaudited(Expressed in Hong Kong dollars)
Six months ended 30 June2016 2015$’000 $’000
cash generated from operations 112,866 142,174
Tax paid
– Hong Kong Profits Tax paid – (9,482)
– People’s Republic of China (“PRC”) income taxes paid (1,300) (5,231)
– Tax paid in respect of jurisdictions outside Hong Kong and the PRC (3,242) (2,145)
net cash generated from operating activities 108,324 125,316
Payment for the purchase of fixed assets (24,635) (17,339)
Proceeds from disposal of fixed assets 1,883 –
Proceeds from disposal of an associate – 160,258
Payment for the purchase of held-to-maturity debt securities – (31,384)
Payment for the purchase of certificates of deposits – (9,875)
Placement of fixed deposits with banks (201,760) (82,625)
Proceeds on maturity of fixed deposits with banks – 38,370
Proceeds from disposal of trading securities 81,982 2,144
Other cash flows arising from investing activities 3,348 1,684
net cash (used in)/generated from investing activities (139,182) 61,233
Six months ended 30 June2016 2015$’000 $’000
Net proceeds from issuance of new shares 1,393,948 –
Proceeds from new bank loans 41,406 90,720
Repayment of bank loans (166,001) (75,829)
Other cash flows arising from financing activities 9,472 2,886
net cash generated from financing activities 1,278,825 17,777
net increase in cash and cash equivalents 1,247,967 204,326
cash and cash equivalents at 1 January 767,393 536,501
effect of foreign exchange rates changes (627) (4,213)
cash and cash equivalents at 30 June 2,014,733 736,614
The notes on pages 11 to 19 form part of this interim financial report.

Notes to the Unaudited Interim Financial Report
11Interim Report 2016
(Expressed in Hong Kong dollars otherwise indicated)
1. BaSiS oF PRePaRationThis interim financial report has been prepared in accordance with the applicable disclosure provisions of the Rules Governing the Listing of Securities on The Stock Exchange of Hong Kong Limited, including compliance with Hong Kong Accounting Standard (“HKAS”) 34, Interim financial reporting, issued by the Hong Kong Institute of Certified Public Accountants (“HKICPA”). It was authorised for issuance on 30 August 2016.
The interim financial report has been prepared in accordance with the same accounting policies adopted in the 2015 annual financial statements, except for the accounting policy changes that are expected to be reflected in the 2016 annual financial statements. Details of any change in accounting policy are set out in note 2.
The preparation of an interim financial report in conformity with HKAS 34 requires management to make judgements, estimates and assumptions that affect the application of policies and reported amounts of assets and liabilities, income and expenses on a year to date basis. Actual results may differ from these estimates.
This interim financial report contains condensed consolidated financial statements and selected explanatory notes. The notes include an explanation of events and transactions that are significant to an understanding of the changes in financial position and performance of the Group since the 2015 annual financial statements. The condensed consolidated interim financial statements and notes thereon do not include all of the information required for full set of financial statements prepared in accordance with Hong Kong Financial Reporting Standards (“HKFRSs”).
The interim financial report is unaudited, but has been reviewed by KPMG in accordance with Hong Kong Standard on Review Engagements 2410, Review of interim financial information performed by the independent auditor of the entity, issued by the HKICPA. KPMG’s independent review report to the Board of Directors is included on page 20.
The financial information relating to the financial year ended 31 December 2015 that is included in the interim financial report as comparative information does not constitute the Company’s statutory annual consolidated financial statements for that financial year but is derived from those financial statements.
2. cHangeS in accounting PolicieS
The HK ICPA has i s sued a number o f amendments to HKFRSs that are first effective for the current accounting period of the Group. Of these, the following amendments are relevant to the Group:
– Annua l Improvement s to HKFRSs 2012-2014 Cycle
– Amendments to HKAS 1, Presentation of financial statements: Disclosure initiative
The Group has not applied any new standard or interpretation that is not yet effective for the current accounting period.

Notes to the Unaudited Interim Financial Report
12 Varitronix International Limited
(Expressed in Hong Kong dollars otherwise indicated)
2. cHangeS in accounting PolicieS (continueD)
Annual Improvements to HKFRSs 2012-2014 CycleThis cycle of annual improvements contains amendments to four standards. Among them, HKAS 34, Interim financial reporting, has been amended to clarify that if an entity discloses the information required by the standard outside the interim financial statements by a cross-reference to the information in another statement of the interim financial report. Then users of the interim financial statements should have access to the information incorporated by the cross-reference on the same terms and at the same time. The amendments do not have an impact on the Group’s interim financial report as the Group does not present the relevant required disclosures outside the interim financial statement.
Amendments to HKAS 1, Presentation of financial statements: Disclosure initiativeThe amendments to HKAS 1 introduce narrow-scope changes to various presentation requirements. The amendments do not have a material impact on the presentation and disclosure of the Group’s interim financial report.
3. Revenue anD Segment RePoRting
The principal activity of the Company is investment holding. The principal activities of the Group are the design, manufacture and sale of liquid crystal displays and related products.
(a) Operating segment resultsThe Group manages its business as a single unit and, accordingly, the design, manufacture and sale of liquid crystal displays and related products is the only reporting segment and virtually all of the revenue and operating profits is derived from this business segment. The interim financial report is already presented in a manner consistent with the way in which information is reported internally to the Group’s most senior executive management for the purposes of resource allocation and performance assessment. Accordingly, no separate business segment information is disclosed.
The chief operating decision-maker has been identified as the Board. The Board reviews the Group’s internal reporting in order to assess performance and allocate resources. Management has determined that a single operating segment exists based on this internal reporting.
The Board assesses the performance of the operating segments based on revenue which is consistent with that in the interim financial report. Other information, being the total assets excluding deferred tax assets, loans receivable, other financial assets, trading securities, current tax recoverable and the interest in associates, all of which are managed on a central basis, are provided to the Board to assess the performance of the operating segment.

13Interim Report 2016
3. Revenue anD Segment RePoRting (continueD)
(b) Geographic informationThe following table sets out information about the geographical location of (i) the Group’s revenues from external customers and (ii) the Group’s fixed assets and interest in associates (“specified non-current assets”). The geographical location of customers is based on the location at which the services were provided or the goods delivered. The geographical location of the specified non-current assets is based on the physical location of the asset, in the case of property, plant and equipment and the location of operations, in the case of interest in associates.
(i) group’s revenue from external customers
Six months ended 30 June2016 2015$’000 $’000
The PRC (place of domicile) 342,705 429,754
Europe 476,114 498,652
America 119,769 157,830
Korea 53,001 98,178
Others 127,454 98,747
776,338 853,407
Consolidated revenue 1,119,043 1,283,161
Revenue from external customers located in Europe is analysed as follows:
Six months ended 30 June2016 2015$’000 $’000
Germany 73,280 57,292
United Kingdom 66,971 63,998
France 65,901 74,902
Italy 34,491 33,603
Other European countries 235,471 268,857
476,114 498,652
(ii) group’s specified non-current assets
at30 June
2016
At31 December
2015$’000 $’000
The PRC (place of domicile) 376,141 409,013
Korea 4,891 4,747
Others 3,415 3,595
384,447 417,355
Notes to the Unaudited Interim Financial Report
14 Varitronix International Limited
(Expressed in Hong Kong dollars otherwise indicated)
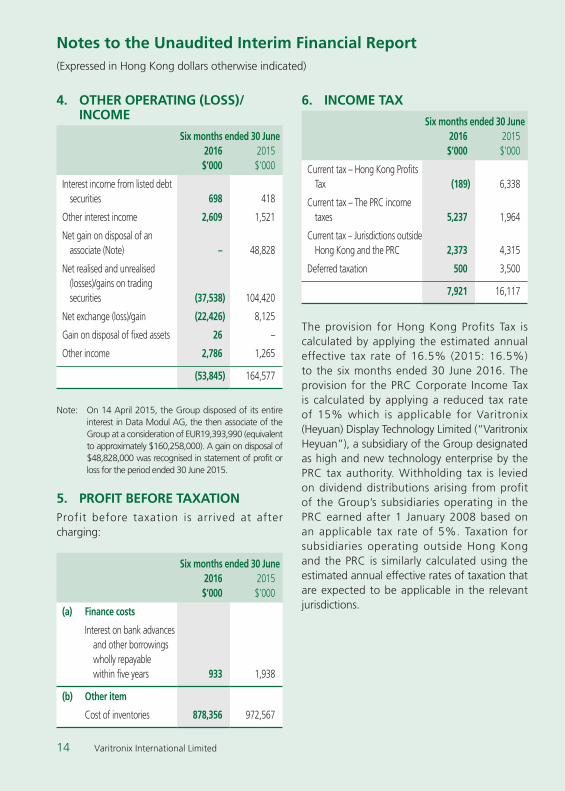
4. otHeR oPeRating (loSS)/income
Six months ended 30 June2016 2015$’000 $’000
Interest income from listed debt securities 698 418
Other interest income 2,609 1,521
Net gain on disposal of an associate (Note) – 48,828
Net realised and unrealised (losses)/gains on trading securities (37,538) 104,420
Net exchange (loss)/gain (22,426) 8,125
Gain on disposal of fixed assets 26 –
Other income 2,786 1,265
(53,845) 164,577
Note: On 14 April 2015, the Group disposed of its entire interest in Data Modul AG, the then associate of the Group at a consideration of EUR19,393,990 (equivalent to approximately $160,258,000). A gain on disposal of $48,828,000 was recognised in statement of profit or loss for the period ended 30 June 2015.
5. PRoFit BeFoRe taXationProfit before taxation is arrived at after charging:
Six months ended 30 June2016 2015$’000 $’000
(a) Finance costs
Interest on bank advances and other borrowings wholly repayable within five years 933 1,938
(b) other item
Cost of inventories 878,356 972,567
6. income taX
Six months ended 30 June2016 2015$’000 $’000
Current tax – Hong Kong Profits Tax (189) 6,338
Current tax – The PRC income taxes 5,237 1,964
Current tax – Jurisdictions outside Hong Kong and the PRC 2,373 4,315
Deferred taxation 500 3,500
7,921 16,117
The provision for Hong Kong Profits Tax is calculated by applying the estimated annual effective tax rate of 16.5% (2015: 16.5%) to the six months ended 30 June 2016. The provision for the PRC Corporate Income Tax is calculated by applying a reduced tax rate of 15% which is applicable for Varitronix (Heyuan) Display Technology Limited (“Varitronix Heyuan”), a subsidiary of the Group designated as high and new technology enterprise by the PRC tax authority. Withholding tax is levied on dividend distributions arising from profit of the Group’s subsidiaries operating in the PRC earned after 1 January 2008 based on an applicable tax rate of 5%. Taxation for subsidiaries operating outside Hong Kong and the PRC is similarly calculated using the estimated annual effective rates of taxation that are expected to be applicable in the relevant jurisdictions.
15Interim Report 2016
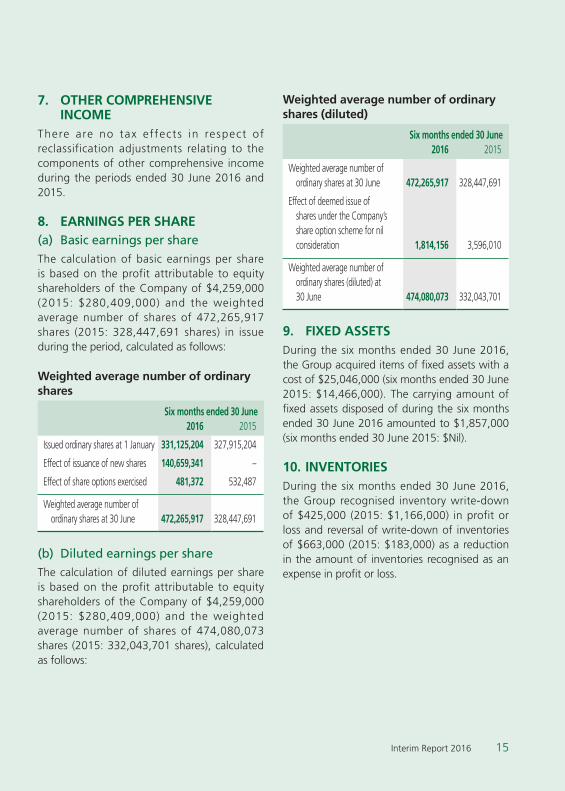
7. otHeR comPReHenSive income
There are no tax effects in respect of reclassification adjustments relating to the components of other comprehensive income during the periods ended 30 June 2016 and 2015.
8. eaRningS PeR SHaRe(a) Basic earnings per shareThe calculation of basic earnings per share is based on the profit attributable to equity shareholders of the Company of $4,259,000 (2015: $280,409,000) and the weighted average number of shares of 472,265,917 shares (2015: 328,447,691 shares) in issue during the period, calculated as follows:
weighted average number of ordinary shares
Six months ended 30 June2016 2015
Issued ordinary shares at 1 January 331,125,204 327,915,204
Effect of issuance of new shares 140,659,341 –
Effect of share options exercised 481,372 532,487
Weighted average number of ordinary shares at 30 June 472,265,917 328,447,691
(b) Diluted earnings per shareThe calculation of diluted earnings per share is based on the profit attributable to equity shareholders of the Company of $4,259,000 (2015: $280,409,000) and the weighted average number of shares of 474,080,073 shares (2015: 332,043,701 shares), calculated as follows:
weighted average number of ordinary shares (diluted)
Six months ended 30 June2016 2015
Weighted average number of ordinary shares at 30 June 472,265,917 328,447,691
Effect of deemed issue of shares under the Company’s share option scheme for nil consideration 1,814,156 3,596,010
Weighted average number of ordinary shares (diluted) at 30 June 474,080,073 332,043,701
9. FiXeD aSSetSDuring the six months ended 30 June 2016, the Group acquired items of fixed assets with a cost of $25,046,000 (six months ended 30 June 2015: $14,466,000). The carrying amount of fixed assets disposed of during the six months ended 30 June 2016 amounted to $1,857,000 (six months ended 30 June 2015: $Nil).
10. inventoRieSDuring the six months ended 30 June 2016, the Group recognised inventory write-down of $425,000 (2015: $1,166,000) in profit or loss and reversal of write-down of inventories of $663,000 (2015: $183,000) as a reduction in the amount of inventories recognised as an expense in profit or loss.

Notes to the Unaudited Interim Financial Report
16 Varitronix International Limited
(Expressed in Hong Kong dollars otherwise indicated)
11. tRaDe anD otHeR ReceivaBleSIncluded in trade and other receivables are trade debtors and bills receivable (net of impairment losses for bad and doubtful debts of $2,958,000 (31 December 2015: $3,343,000)) with the following ageing analysis as of the end of the reporting period:
at30 June
2016
At31 December
2015$’000 $’000
Within 60 days of the invoice issue date 316,726 363,767
61 to 90 days after the invoice issue date 86,799 72,944
91 to 120 days after the invoice issue date 31,576 25,510
More than 120 days but less than 12 months after the invoice issue date 19,562 16,650
454,663 478,871
Trade debtors and bills receivable are generally due within 60 to 90 days from the date of the billing.
12. caSH anD caSH eQuivalentS anD FiXeD DePoSitS witH BanKS
at30 June
2016
At31 December
2015$’000 $’000
Fixed deposits with banks with maturity over 3 months but within 1 year 201,760 –
Deposits with banks and other financial institutions with maturity up to 3 months 246,889 258,631
Cash at banks and in hand 1,767,844 508,762
Cash and cash equivalents 2,014,733 767,393
13. tRaDe anD otHeR PaYaBleSIncluded in trade and other payables are trade creditors and bills payable with the following ageing analysis as of the end of the reporting period:
at30 June
2016
At31 December
2015$’000 $’000
Within 60 days of supplier invoice date 171,336 232,976
61 to 120 days after supplier invoice date 51,099 73,023
More than 120 days but within 12 months after supplier invoice date 4,204 6,917
More than 12 months after supplier invoice date 553 427
227,192 313,343

17Interim Report 2016
14. caPital, ReSeRveS anD DiviDenDS
(a) Share capitalOn 28 April 2016, pursuant to the subscription agreement (“the Subscription”) that was entered into by the Company and BOE Technology Group Co., Ltd (“the Subscriber”) on 3 February 2016, 400,000,000 ordinary shares of the Company were allotted and issued as fully paid to the Subscriber at an issue price of $3.50 per share totalling $1,400,000,000, of which $100,000,000 was credited to share capital and the balance of $1,300,000,000 was credited to the share premium account.
(b) Dividends(i) Dividends payable to equity
shareholders of the company attributable to the period
Six months ended 30 June2016 2015$’000 $’000
Interim dividend declared after the end of the reporting period: Nil (2015: 15.0 HK cents) per share – 49,611
The interim dividend declared after the end of the reporting period has not been recognised as a liability at the end of the reporting period.
(ii) Dividends payable to equity shareholders of the company declared during the period
Six months ended 30 June2016 2015$’000 $’000
Final dividend in respect of the previous financial year declared during the period of 30.5 HK cents (2015: 30.0 HK cents) per share 101,960 98,878
Special dividend declared during the period of $1.35 (2015: Nil) per share (Note) 451,298 –
553,258 98,878
Note: Upon completion of the Subscription on 28 April 2016, a special dividend of $1.35 per share to ordinary shareholders of the Company was declared and approved at the special general meeting during the period. No special dividend was paid to the Subscriber whom has agreed to waive its entitlement. Special dividend of $451,298,000 was payable as at 30 June 2016.
(c) Equity settled share-based transactions
During the six months ended 30 June 2016, options have been exercised to subscribe for 3,930,000 ordinary shares (2015: 1,930,000 ordinary shares) in the Company at a consideration of $10,404,000 (2015: $4,824,000) of which $982,000 (2015: $482,000) was credited to share capital and the balance of $9,422,000 (2015: $4,342,000) was credited to the share premium account. $3,715,000 (2015: $1,787,000) has been transferred from the capital reserve to the share premium account.
There were no options forfeited during the period ended 30 June 2016 (2015: Nil).

Notes to the Unaudited Interim Financial Report
18 Varitronix International Limited
(Expressed in Hong Kong dollars otherwise indicated)
15. FaiR value meaSuRement oF Financial inStRumentS
The following table presents the fair value of the Group’s financial instruments measured at the end of the reporting period on a recurring basis, categorised into the three-level fair value hierarchy as defined in HKFRS 13, Fair value measurement. The level into which a fair value measurement is classified is determined with reference to the observability and significance of the inputs used in the valuation technique as follows:
– Level 1 valuations: Fair value measured using only Level 1 inputs i.e. unadjusted quoted prices in active markets for identical assets or liabilities at the measurement date
– Level 2 valuations: Fair value measured using Level 2 inputs i.e. observable inputs which fail to meet Level 1, and not using significant unobservable inputs. Unobservable inputs are inputs for which market data are not available
– Level 3 valuations: Fair value measured using significant unobservable inputs
level 1 level 2 total$’000 $’000 $’000
Recurring fair value measurement at 30 June 2016
Financial assets
Non-listed available-for-sale mutual funds – 7,329 7,329
Listed available-for-sale debt securities 9,738 – 9,738
Listed available-for-sale equity securities 10,931 – 10,931
Listed held-to-maturity debt securities 29,323 – 29,323
Trading securities 41,371 – 41,371
91,363 7,329 98,692
Level 1 Level 2 Total$’000 $’000 $’000
Recurring fair value measurement at 31 December 2015
Financial assets
Non-listed available-for-sale mutual funds – 7,195 7,195
Listed available-for-sale debt securities 9,948 – 9,948
Listed available-for-sale equity securities 10,882 – 10,882
Listed held-to-maturity debt securities 29,328 – 29,328
Trading securities 160,891 – 160,891
211,049 7,195 218,244
During the six months ended 30 June 2016 there were no significant transfers between instruments in Level 1 and Level 2.

19Interim Report 2016
15. FaiR value meaSuRement oF Financial inStRumentS (continueD)
Fair values of financial instruments carried at other than fair valueThe carrying amounts of the Group’s financial instruments carried at cost or amortised cost are not materially different from their fair values as at 30 June 2016 and 31 December 2015.
16. mateRial RelateD PaRtY tRanSactionS
(a) Transactions with related partiesThe following transactions were carried out with related parties, including BOE, the parent of the Company, and its subsidiaries other than the Group, except for disclosed elsewhere in these unaudited condensed consolidated interim financial report:
Six months ended 30 June2016 2015$’000 $’000
BOE:Purchase of goods 12,145 –
Data Modul AG:Sales of goods – 13,150
The transactions with BOE were conducted based on the terms as governed by the master purchase agreement entered into between the Group and BOE on 22 Apri l 2016. Further details are set out in the Company’s announcement dated 22 April 2016. Data Modul AG was an associate of the Group until the completion of disposal on 14 April 2015.
(b) Balances with related parties
at30 June
2016
At31 December
2015$’000 $’000
BOE:Trade payables 12,145 –
Balances with related parties are unsecured, interest-free and are repayable within one year.
17. commitmentSCapital commitments outstanding at the end of the reporting period not provided for in the Group’s financial statements were as follows:
at30 June
2016
At31 December
2015$’000 $’000
Contracted for 2,317 10,974
Authorised but not contracted for 98,861 24,351
101,178 35,325
18. contingent liaBilitieSFinancial guarantees issuedAs at the end of the reporting period, the Company has issued guarantees to banks in respect of a banking facilities granted to certain subsidiaries.
As at the end of the reporting period, the Directors do not consider it probable that a claim will be made against the Company under any of the guarantees. The maximum liability of the Company at the end of the reporting period under the guarantees issued and the facilities drawn down by the subsidiaries is $26,671,000 (31 December 2015: $145,274,000).

Review Report
20 Varitronix International Limited
Review report to the board of directors of varitronix international limited(Incorporated in Bermuda with limited liability)
intRoDuctionWe have reviewed the interim financial report set out on pages 6 to 19 which comprises the consolidated statement of financial position of Varitronix International Limited as of 30 June 2016 and the related consolidated statement of profit or loss, statement of profit or loss and other comprehensive income and statement of changes in equity and condensed consolidated cash flow statement for the six month period then ended and explanatory notes. The Rules Governing the Listing of Securities on The Stock Exchange of Hong Kong Limited require the preparation of an interim financial report to be in compliance with the relevant provisions thereof and Hong Kong Accounting Standard 34, Interim financial reporting, issued by the Hong Kong Institute of Certified Public Accountants. The directors are responsible for the preparation and presentation of the interim financial report in accordance with Hong Kong Accounting Standard 34, Interim financial reporting.
Our responsibility is to form a conclusion, based on our review, on the interim financial report and to report our conclusion solely to you, as a body, in accordance with our agreed terms of engagement, and for no other purpose. We do not assume responsibility towards or accept liability to any other person for the contents of this report.
ScoPe oF ReviewWe conducted our review in accordance with Hong Kong Standard on Review Engagements 2410, Review of interim financial information performed by the independent auditor of the entity, issued by the Hong Kong Institute of Certified Public Accountants. A review of the interim financial report consists of making enquiries, primarily of persons responsible for financial and accounting matters, and applying analytical and other review procedures. A review is substantially less in scope than an audit conducted in accordance with Hong Kong Standards on Auditing and consequently does not enable us to obtain assurance that we would become aware of all significant matters that might be identified in an audit. Accordingly we do not express an audit opinion.
concluSionBased on our review, nothing has come to our attention that causes us to believe that the interim financial report as at 30 June 2016 is not prepared, in all material respects, in accordance with Hong Kong Accounting Standard 34, Interim financial reporting.
KPmgCertified Public Accountants
8th Floor, Prince’s Building10 Chater RoadCentral, Hong Kong
Hong Kong, 30 August 2016

Other Information
21Interim Report 2016
inteRim DiviDenDThe Board resolved not to declare an interim dividend for the six months ended 30 June 2016 (2015: 15.0 HK cents).
StaFFAs at 30 June 2016, the Group employed 4,832 staff around the world, of whom 161 were in Hong Kong, 4,630 in the People’s Republic of China (the “PRC”) and 41 were in overseas. The Group remunerates its employees based on their performance, experience and prevailing industry practice. The Group operates an employee share option scheme and provides rent-free quarters to certain of its employees in Hong Kong and the PRC.
The Group adopts a performance-based remuneration policy. Salary adjustments and performance bonuses are based on the evaluation of job performance. The aim is to create an atmosphere that encourages top performers and provides incentives for general employees to improve and excel.
liQuiDitY anD Financial ReSouRceSAs at 30 June 2016, the total equity of the Group was HK$2,747 million (31 December 2015: HK$1,905 million). The Group’s current ratio, being the proportion of total current assets against total current liabilities, was 3.67 as at 30 June 2016 (31 December 2015: 3.74).
At the period end, the Group held a liquid portfolio of HK$2,315 million (31 December 2015: HK$986 million) of which HK$2,216 million (31 December 2015: HK$767 million) was in cash and fixed deposits balance and HK$99 million (31 December 2015: HK$219 million) in securities. The unsecured interest-bearing bank loans amounted to HK$27 million (31 December 2015: HK$145 million). The gearing ratio (bank loans over net assets) was 1% (31 December 2015: 8%).
The Group’s inventory turnover ratio (annualized cost of inventories over average inventories balance) for the six months ended 30 June 2016 was 4.1 times (31 December 2015: 4.4 times). Debtor turnover days (trade receivables over turnover times 182) for the six months ended 30 June 2016 was 74 days (31 December 2015: 70 days).
FoReign cuRRencY eXPoSuReThe Group is exposed to foreign currency risk primari ly through sales, purchases, loan receivables and bank loans that are denominated in a currency other than the functional currency of the operations to which they relate. The currencies giving rise to this risk are primarily United State dollars, Euros, Japanese Yen and Renminbi.
The Group is not engaged in the use of any financial instruments for hedging purposes. However, the management monitors foreign exchange exposure from time to time and will consider hedging significant foreign currency exposure when the need arises.

Other Information
22 Varitronix International Limited
DiRectoRS’ anD cHieF eXecutiveS’ inteReStS anD SHoRt PoSitionS in SHaReS, unDeRlYing SHaReS anD DeBentuReSAs at 30 June 2016, the interests and shorts positions of the Directors and chief executives of the Company and their associates in the shares, underlying shares and debentures of the Company and its associated corporations (within the meaning of Part XV of the Securities and Futures Ordinance (the “SFO”)), as required to be notified to the Company and the Stock Exchange of Hong Kong Limited (the “Stock Exchange”) pursuant to Divisions 7 and 8 of Part XV of the SFO (including interests and short positions which they are taken or deemed to have under such provisions of the SFO), as recorded in the register required to be kept by the Company under Section 352 of the SFO or as required, pursuant to the Model Code for Securities Transactions by Directors of Listed Issuers (the “Model Code”) as set out in Appendix 10 of the Listing Rules to be notified to the Company and the Stock Exchange were as follows:
(a)(i) Interests in shares of the Company
name of Director capacity
number ofshares in the
company held
approximatepercentage of
the total issuedshare capital
of the company
Ko Wing Yan, Samantha Personal Interest 247,000 0.03%
(a)(ii) Interests in shares of BOE Technology Group Co., Ltd. (“BOE”) (an associated corporation) (Note 1)
name of Director capacity
number ofa shares in
Boe held
approximatepercentage of
the total issuedshare capital
of Boe
Yao Xiangjun Personal Interest 100,000 0.00%
Dong Xue Personal Interest 100,000 0.00%
Notes:
1. BOE subscribed 400,000,000 shares, representing 54.42% of the issued share capital of the Company.
2. The above interest represented long positions.

23Interim Report 2016
DiRectoRS’ anD cHieF eXecutiveS’ inteReStS anD SHoRt PoSitionS in SHaReS, unDeRlYing SHaReS anD DeBentuReS (continueD)
(b) Interests in share options of the Company
name of Director Date of grant
number of share
options at 1 January
2016
number of share options granted
during the period
number of share options
exercised during the
period
number of share
options at 30 June
2016exercisable
period
exercise price per share
option
weighted average closing price of share options immediately
before the dates on which the share
options were exercised
Ko Chun Shun, Johnson (Note 1) 24 June 2010 1,900,000 – (1,900,000) 0 (Note 5) HK$2.50 HK$5.13
9 July 2015 2,000,000 – – 2,000,000 (Note 6) HK$5.72 N/A
Ko Wing Yan, Samantha 9 July 2015 2,000,000 – – 2,000,000 (Note 6) HK$5.72 N/A
Ho Te Hwai, Cecil (Note 2) 24 June 2010 950,000 – (950,000) 0 (Note 5) HK$2.50 HK$4.51
9 July 2015 1,000,000 – – 1,000,000 (Note 6) HK$5.72 N/A
Lo Wing Yan, William (Note 3) 24 June 2010 80,000 – (80,000) 0 (Note 5) HK$2.50 HK$4.84
9 July 2015 300,000 – – 300,000 (Note 6) HK$5.72 N/A
Chau Shing Yim, David (Note 4) 24 June 2010 160,000 – (160,000) 0 (Note 5) HK$2.50 HK$4.28
9 July 2015 300,000 – – 300,000 (Note 6) HK$5.72 N/A
Hou Ziqiang 24 June 2010 400,000 – (400,000) 0 (Note 5) HK$2.50 HK$5.13
9 July 2015 300,000 – – 300,000 (Note 6) HK$5.72 N/A
Notes:
1. Mr. Ko Chun Shun, Johnson resigned as an Executive Director of the Company on 28 April 2016.
2. Mr. Ho Te Hwai, Cecil resigned as an Executive Director of the Company on 28 April 2016.
3. Dr. Lo Wing Yan, William retired as an Independent Non-Executive Director of the Company on 3 June 2016.
4. Mr. Chau Shing Yim, David retired as an Independent Non-Executive Director of the Company on 3 June 2016.
5. Exercisable period:
(i) the first 20% of the share options shall be exercisable from 1 July 2011 to 30 June 2016;
(ii) the second 20% of the share options shall be exercisable from 1 July 2012 to 30 June 2016;
(iii) the third 20% of the share options shall be exercisable from 1 July 2013 to 30 June 2016;
(iv) the fourth 20% of the share options shall be exercisable from 1 July 2014 to 30 June 2016; and
(v) the remaining 20% of the share options shall be exercisable from 1 July 2015 to 30 June 2016.
6. Exercisable period:
(i) the first 40% of the options shall be exercisable from 1 September 2015 to 31 August 2018;
(ii) the second 30% of the options shall be exercisable from 1 September 2016 to 31 August 2018; and
(iii) the remaining 30% of the options shall be exercisable from 1 September 2017 to 31 August 2018.
7. The above interests represented long positions.
Saved as disclosed above, as at 30 June 2016, none of the Directors, chief executives or any of their associates had any interest or short position in the shares, underlying shares and debentures of the Company or any of its associated corporations as recorded in the register required to be kept under Section 352 of Part XV of the SFO or as otherwise notified to the Company and the Stock Exchange pursuant to the Model Code.

Other Information
24 Varitronix International Limited
DiRectoRS’ RigHtS to acQuiRe SHaReSSaved as disclosed under the section headed “Directors’ and Chief Executives’ Interests and Short Positions in Shares, Underlying Shares and Debentures” above, at no time during the six months ended 30 June 2016 was the Company or any of its subsidiaries a party to any arrangement to enable the Directors or their spouses or children under the age of 18 to acquire benefits by the means of the acquisition of the shares in or debentures of the Company or any other body corporate.
SuBStantial SHaReHolDeRS’ anD otHeR PeRSonS’ inteReStS anD SHoRt PoSitionS in SHaReS anD unDeRlYing SHaReSAs at 30 June 2016, other than the interests disclosed under the section headed “Directors’ and Chief Executives’ Interests and Short Positions in Shares, Underlying Shares and Debentures”, so far as is known to the Directors and chief executives of the Company, the following companies and person had interests and short positions in the shares and underlying shares of the Company as recorded in the register required to be kept under Section 336 of the SFO:
name of substantial shareholder
number of shares in the
company held
number of underlying
shares in the company held total
approximate percentage of
the total issued share capital of
the company
BOE Technology Group Co., Ltd. 400,000,000(Note 1)
– 400,000,000 54.42%
Ko Chun Shun, Johnson 56,551,000(Note 2)
2,000,000(Note 3)
58,551,000 7.97%
Rockstead Technology Limited 43,951,000(Note 2)
– 43,951,000 5.98%
Notes:
1. The subscription of the 400,000,000 shares of the Company by BOE Technology Group Co., Ltd., a joint stock company established in the PRC and the issued shares of which are listed on the Shenzhen Stock Exchange with stock code 000725 for its A shares and stock code 200725 for its B shares.
2. Rockstead Technology Limited and Omnicorp Limited, both wholly-owned by Mr. Ko Chun Shun, Johnson (a former Executive Director of the Company and the former Chairman of the Board), held 43,951,000 shares and 10,700,000 shares of the Company respectively.
3. This represents the interests in 2,000,000 share options held by Mr. Ko Chun Shun, Johnson.
4. The above interests represented long positions.
Saved as disclosed above, as at 30 June 2016, there were no other companies nor persons who had an interest or short position in the shares or underlying shares of the Company which would fall to be disclosed to the Company under Section 336 of the SFO, or which were recorded in the register to be kept by the Company under Section 336 of the SFO.

25Interim Report 2016
SHaRe oPtion ScHemeSOn 6 June 1991, the Company adopted a share option scheme. This is to provide the Group with a flexible means of giving incentive to rewarding, remunerating, compensating and/or providing benefits to the Group’s employees and business associates (the “Participants”). It was subsequently amended on 8 June 1999 and expired on 5 June 2001. A second share option scheme of the Company was adopted on 22 June 2001 and terminated on 12 May 2003.
A third share option scheme of the Company was adopted on 12 May 2003 as an incentive to the Participants. The third share option scheme limit was subsequently refreshed by a resolution passed at the annual general meeting held on 2 June 2010. The maximum number of share options that could be granted by the Company was refreshed to 32,342,220 share options. This scheme expired on 11 May 2013.
A fourth share option scheme of the Company was adopted on 3 June 2013. It shall be valid and effective for a period of 10 years and as at 30 June 2016, the fourth share option has a remaining life of up to 2 June 2023. On 9 July 2015, 8,600,000 share options were granted under the fourth share option scheme and a consideration of HK$19.00 was received. During the six months ended 30 June 2016, no share option was granted under the fourth share option scheme.
The Company can grant share options to the Participants for a consideration of HK$1.00 for each grant payable by the Participants. The maximum number of shares in respect of which share options may be granted under the fourth share option scheme and any other schemes of the Company may not exceed 10.00% of the issued share capital of the Company at the date of approval of the fourth share option scheme. The maximum entitlement of each Participant in the total number of shares issued and to be issued upon exercise of share options granted under the fourth share option scheme and any other share option schemes of the Company in any 12-month period shall not exceed 1.00% of the total number of shares in issue.
Subscription price of the shares in relation to a share option shall not be less than the higher of (i) the closing price of the shares as stated in the Stock Exchange’s daily quotation sheets on the date on which the share option is offered to the Participants, which must be a business day; (ii) the average of the closing prices of the shares as stated in the Stock Exchange’s daily quotation sheets for the 5 trading days immediately preceding the date of offer; and (iii) the nominal value of the shares. There shall be no minimum period for which the share options must be held before they are exercised but the Board may determine.
As at the date of this report, the total number of share options that can be granted was 24,411,520, representing 3.32% of the issued share capital of the Company. The total number of shares available for issue under the share option schemes as at 30 June 2016 represents 1.12% (30 June 2015: 5.16%) of the issued share capital of the Company at that date.

Other Information
26 Varitronix International Limited
SHaRe oPtion ScHemeS (continueD)
Movements in the Company’s share options during the period were as follows:
Date of grant
number of share options
at 1 January 2016
number of share options granted
during the period
number of share options
cancelled/ lapsed
during the period
number of share options
exercised during the
period
number of share
options at 30 June
2016exercisable
period
exercise price per share
option
weighted average closing price of share options immediately
before the dates on which the share options
were exercised
Directors (Note 1)
24 June 2010 3,490,000 – – (3,490,000) 0 (Note 2) HK$2.50 HK$4.92
9 July 2015 5,900,000 – – – 5,900,000 (Note 3) HK$5.72 N/A
employees
24 June 2010 260,000 – – (260,000) 0 (Note 2) HK$2.50 HK$4.41
9 July 2015 2,500,000 – – (180,000) 2,320,000 (Note 3) HK$5.72 HK$5.04
12,150,000 – – (3,930,000) 8,220,000
Notes:
1. Messrs. Ko Chun Shun, Johnson and Ho Te Hwai, Cecil resigned as Executive Directors of the Company on 28 April 2016. Dr. Lo Wing Yan, William and Mr. Chau Shing Yim, David retired as Independent Non-Executive Directors of the Company on 3 June 2016.
2. Exercisable period:
(i) the first 20% of the share options shall be exercisable from 1 July 2011 to 30 June 2016;
(ii) the second 20% of the share options shall be exercisable from 1 July 2012 to 30 June 2016;
(iii) the third 20% of the share options shall be exercisable from 1 July 2013 to 30 June 2016;
(iv) the fourth 20% of the share options shall be exercisable from 1 July 2014 to 30 June 2016; and
(v) the remaining 20% of the share options shall be exercisable from 1 July 2015 to 30 June 2016.
3. Exercisable period:
(i) the first 40% of the options shall be exercisable from 1 September 2015 to 31 August 2018;
(ii) the second 30% of the options shall be exercisable from 1 September 2016 to 31 August 2018; and
(iii) the remaining 30% of the options shall be exercisable from 1 September 2017 to 31 August 2018.
4. The consideration for the share options granted was HK$1.00.
5. The above interests represented long positions.

27Interim Report 2016
uPDate on DiRectoR’S inFoRmation unDeR Rule 13.51B(1) oF tHe liSting RuleSMr. Ko Chun Shun, Johnson resigned as an Executive Director of the Company and the Chairman of the Board, and Mr. Ho Te Hwai, Cecil resigned as an Executive Director and the Company Secretary of the Company, both with effect from 28 April 2016.
Mr. Yao Xiangjun was appointed as an Executive Director of the Company and the Chairman of the Board with effect from 28 April 2016. Mr. Yao was appointed as a director and a member of the executive committee of BOE Technology Group Co., Ltd. (“BOE”), a senior vice president, a joint chief operating officer and the chief executive officer of the smart system business group of BOE, all with effect from 20 May 2016. BOE subscribed 400,000,000 shares of the Company and is a joint stock company established in the PRC and the issued shares of which are listed on the Shenzhen Stock Exchange with stock code 000725 for its A shares and stock code 200725 for its B shares.
Mr. Su Ning was appointed as an Executive Director and a Co-chief Executive Officer of the Company, and Ms. Yang Xiaoping, Mr. Dong Xue and Mr. Yuan Feng were appointed Non-executive Directors of the Company, all with effect from 28 April 2016.
Ms. Ko Wing Yan, Samantha, an Executive Director of the Company, was redesignated from the Chief Executive Officer to a Co-chief Executive Officer of the Company with effect from 28 April 2016. Ms. Ko’s remuneration revised to HK$200,000 per month with effect from 1 April 2016.
Dr. Lo Wing Yan, William and Mr. Chau Shing Yim, David retired as Independent Non-Executive Directors of the Company on 3 June 2016.
Mr. Fung, Yuk Kan Peter was appointed as an Independent Non-Executive Director of the Company with effect from 3 June 2016.
Mr. Chu, Howard Ho Hwa was appointed as an Independent Non-Executive Director of the Company with effect from 3 June 2016. He resigned as an independent non-executive director of Directel Holdings Limited, which is listed on the Growth Enterprise Market of the Stock Exchange (stock code: 8337), with effect from 7 June 2016.
PuRcHaSe, Sale oR ReDemPtion oF tHe comPanY’S liSteD SecuRitieSNeither the Company nor any of its subsidiaries purchased, sold or redeemed any of the Company’s listed securities during the period ended 30 June 2016.
coRPoRate goveRnanceIn the opinion of the Directors, the Company has complied with the Corporate Governance Code (the “Code”) as set out in Appendix 14 of the Listing Rules throughout the period ended 30 June 2016.
All other information on the Code has been disclosed in the corporate governance report contained in the 2015 annual report of the Company issued in February 2016.
moDel coDe FoR SecuRitieS tRanSactionS BY DiRectoRSThe Company has adopted the Model Code. Following specific enquiry by the Company, all Directors confirmed that they have complied with the required standards as set out in the Model Code throughout the period under review.
Other Information
28 Varitronix International Limited
auDit committeeThe Audit Committee of the Company (the “AC”) comprises 3 Independent Non-executive Directors: Mr. Fung, Yuk Kan Peter (Chairman of the AC), Mr. Chu, Howard Ho Hwa and Mr. Hou Ziqiang. The AC is responsible for appointment of external auditors, review of the Group’s financial information and oversight of the Group’s financial reporting system, risk management and internal control systems. It is also responsible for reviewing the interim and annual results of the Group prior to recommending them to the Board for approval. It meets regularly to review financial reporting and internal control matters and to this end has unrestricted access to both the Company’s internal and external auditors. The AC has reviewed the interim results for the six months ended 30 June 2016 of the Company now reported on.
The interim financial report for the six months ended 30 June 2016 has been reviewed by the Company auditors, KPMG, Certified Public Accountants, in accordance with Hong Kong Standard on Review Engagements 2410 “Review on Interim Financial Information Performed by the Independent Auditor of the Entity” issued by the Hong Kong Institute of Certified Public Accountants.
RemuneRation committeeThe Remuneration Committee of the Company (the “RC”) is responsible for setting and monitoring the remuneration policy for all Directors and senior management of the Group. The RC comprises Mr. Fung, Yuk Kan Peter (Chairman of the RC), Mr. Yao Xiangjun, Ms. Ko Wing Yan, Samantha, Mr. Chu, Howard Ho Hwa and Mr. Hou Ziqiang. Among the 5 members of the RC, 3 members are Independent Non-executive Directors.
nomination committeeThe Nomination Committee of the Company (the “NC”) comprises Mr. Yao Xiangjun (Chairman of the NC), Mr. Su Ning, Mr. Fung, Yuk Kan Peter, Mr. Chu, Howard Ho Hwa and Mr. Hou Ziqiang. Among the 5 members of the NC, 3 members are Independent Non-executive Directors.
The roles and functions of the NC include reviewing the structure, size and composition of the Board at least annual ly, making recommendations on any proposed changes to the Board to complement the Company’s corporate strategy, identifying individuals suitably qualified to become members of the Board and selecting individuals nominated for directorship (if necessary), assessing the independence of the Independent Non-execu t i ve D i re c to r s and mak ing recommendations to the Board on the appointment or re-appointment of directors and succession planning for the Directors, in particular the Chairman of the Board and the Chief Executive Officer.
DiRectoRSAs at the date of this report, the Board comprises nine Directors, of whom Mr. Yao Xiangjun, Ms. Ko Wing Yan, Samantha and Mr. Su Ning are Executive Directors, Ms. Yang Xiaoping, Mr. Dong Xue and Mr. Yuan Feng are Non-executive Directors, and Mr. Fung, Yuk Kan Peter, Mr. Chu, Howard Ho Hwa and Mr. Hou Ziqiang are Independent Non-executive Directors.