review and analysis of financial and operating results, and risk management
TRANSCRIPT
Review and Analysis of Financial and Operating Results, and Risk Management
122
I. FinancialStatusII. OperatingResultsIII. CashFlowIV. InfluenceofMajorCapitalExpenditures
onFinancialOperationsDuringPastYearsV. ReinvestmentPolicyforthePastYearVI.RiskManagementVII.CrisisManagementMechanismVIII.OtherImportantMatters

123
Forew
ord
Co
rpo
rate G
overn
ance R
epo
rtFu
nd
-Raisin
g
Activities
Gen
eral Op
erating
C
on
ditio
ns
Finan
cial Statu
sSp
ecial No
tesD
irectory o
f Head
O
ffice an
d B
ranch
es
Review
and
An
alysis of Fin
ancial
and
Op
erating
Resu
lts‚ and
Risk
Man
agem
ent
Intro
du
ction
I.FinancialStatus
II.OperatingResults
Unit: NT$1,000
Item 2008 2007(restated) Amount Change % Change
Net cash inflow (outflow) (64,026,884) 60,007,444 (124,034,328) (206.70)
Net cash outflow in 2008 was NT$124.03 billion more than in the previous year. The main reasons for the net change
were as follows:Unit: NT$1,000
Items Amount
Decrease in net cash inflow from operating activities (77,844,867)
Decrease in placement with Central Bank (479,819,611)
Increase in loans and discounts 151,170,196
Decrease in deposits of banks (16,329,954)
Increase in deposits and remittances 328,367,720
Others (29,577,812)
Net cash outflow (124,034,328)
Unit: NT$1,000
DateItems Dec. 31, 2008 Dec. 31, 2007
(restated)
Change
Amount %
Total Assets 3,594,174,576 3,347,774,368 246,400,208 7.36
Total Liabilities 3,370,545,587 3,098,634,865 271,910,722 8.78
Total Shareholders' Equities 223,628,989 249,139,503 (25,510,514) (10.24)
Analysis of changes in increase / decrease ratios: The drop in shareholder equity in 2008 compared with 2007 was caused mainly by a reduction in unrealized losses on financial products in 2008 compared with 2007, and by the spinoff of some businesses and assets on Jan. 2, 2008 and a reduction of capital by NT$8 billion. The spun-off businesses were used to establish BankTaiwan Securities and BankTaiwan Life Insurance.
Unit: NT$1,000
YearItems 2008 2007(restated) Amount Change % Change
Net interest income 23,666,146 27,673,836 (4,007,690) (14.48)
Non-interest income (net) 4,316,754 5,574,281 (1,257,527) (22.56)
Net revenues 27,982,900 33,248,117 (5,265,217) (15.84)
Bad debt expenses 1,545,337 868,389 676,948 77.95
Operating expenses 17,935,054 18,949,456 (1,014,402) (5.35)
Net income-before tax 8,502,509 13,430,272 (4,927,763) (36.69)
Income tax expense 350,308 853,573 (503,265) (58.96)
Net income-after tax 8,152,201 12,576,699 (4,424,498) (35.18)
Analysis of changes in increase / decrease ratios:1. The reduction in net income-before tax in 2008 as compared with 2007 was caused mainly by a decline in net interest income and income from the sale of assets. 2. The reduction in net interest income in 2008 compared with 2007 was due primarily to the fact that the increase in interest costs was larger than the increase in interest
income. 3. The reduction in non-interest income ( net ) in 2008 as compared with 2007 was caused mainly by a decline in net income from the sale of assets.4. The increase in provision for loan losses in 2008 was caused mainly by additional provisions due to increases in non-performing loans because of the impact of the financial
turmoil and economic recession that year. 5. The reduction in income tax expense in 2008 as compared with 2007 was caused by a decrease in the income tax expense in the overseas branchs.
III.CashFlow1.LiquidityAnalysisforthePastYear
(1) Cash Flow Analysis
(2) Remedy for Estimated Shortage of Liquidity:Not applicable.

124
IV.InfluenceofMajorCapitalExpendituresonFinancialOperationsDuringPastYears1.UtilizationofMajorCapitalExpenditures,andSourcesofFunds
Unit: NT$1,000
Plan Items Actual or Projected Sources of Funds
Actual or Projected Date of
Completion
Needed Capital
Actual or Projected Funds Utilization
2005 2006 2007 2008 2009
Construction of Nantze Branch Premises
Fixed assets – Non-plan capital expenditures – Buildings and structures
Sep. 2008 288,154 2,741 54,208 150,686 65,597 13,821
Construction of Aanan Branch Premises
Fixed assets – Non-plan capital expenditures – Buildings and structures
Apr. 2008 176,617 5,041 1,968 70,209 92,027 6,654
Construction ofIlan Branch Premises
Fixed assets – Non-plan capital expenditures – Buildings and structures
Aug. 2010 302,000 0 0 573 10,079 133,451
Construction of Donggang Branch Premises
Fixed assets – Non-plan capital expenditures – Buildings and structures
July 2010 116,083 0 0 307 2,655 40,954
Total 611,054 7,782 56,176 221,775 170,358 194,880
2.CashFlowAnalysisfortheComingYearUnit: NT$1,000
Beginning Cash Balance
(a)
Annual Net Cash Flow from Business
Activities (b)
Annual Cash Outflow (inflow)
(c)
Cash Balance (Shortage)
(a)+(b)-(c)
Remedy for Estimated Cash Shortage
Investment Plan
Financial Management
Plan
228,004,249 25,977,147 (28,331,496) 225,649,900 - -
(1) Cash Flow Analysis
a. Business activities: Due primarily to a new cash inflow of NT$25,977,147,000 produced by business activities.
b. Investment activities: A net cash outflow of NT$39,591,886,000 from investment activities mainly due to a net
increase of loans & discounts, and current financial assets together with a decrease of the long-term investments
and intangible assets.
c. Financing activities: Primarily a net cash inflow of NT$11,278,566,000 produced by financing activities as a result
of increases in deposits and remittances, and Central Bank deposits together with a decrease in cash dividends
released and interbank deposits.
(2) Remedial action to make up for cash inadequacy, and liquidity analysis: Not applicable.
2.ProjectedPotentialBenefitPotential benefits are expected through enhancement of the Bank's corporate image and service quality, stabilization
of the Bank's business locations, and expansion of the service network. This is in addition to saving rental costs, via
increased rental income through the leasing of excess office space.
V.ReinvestmentPolicyforthePastYearThe Bank actively plans for the disposal of reinvested enterprises that are performing poorly, for which the original
purpose of investment has been achieved, or which are unrelated to the Bank's business in order to heighten the overall
performance of reinvestment. Because of the impact of the global financial turmoil in 2008, there was a general decline in
profit earned by reinvested enterprises as calculated by the equity method. This affected the investment income recognized
by the Bank; but the income from reinvestment during the year amounted to about NT$3 billion, which was satisfactory.
To assure the quality of investment and to heighten return on investment, the Bank actively implements share-release
plans to release the weak and keep the strong, and participates in meetings of the boards of directors and supervisors of
invested enterprises so as to remain aware of their business conditions and protect the Bank's investment interests. Since the
Bank's cash investment ratio is higher than the Banking Law requires, in its reinvestment the Bank will follow the instructions
in the Ministry of Finance's letter of June 20, 2001 to the effect that the vigorous adjustment of the amount of reinvestment
and shareholding ratios should be continued so as to conform to the provisions of Article 74 of the Banking Law.

12�
Forew
ord
Co
rpo
rate G
overn
ance R
epo
rtFu
nd
-Raisin
g
Activities
Gen
eral Op
erating
C
on
ditio
ns
Finan
cial Statu
sSp
ecial No
tesD
irectory o
f Head
O
ffice an
d B
ranch
es
Review
and
An
alysis of Fin
ancial
and
Op
erating
Resu
lts‚ and
Risk
Man
agem
ent
Intro
du
ction
VI.RiskManagement1.Qualitative&QuantitativeInformationonDifferentTypesofRisk
(1) Credit Risk Management and Accrued Capital
a. Credit Risk Management System
Fiscal Year 2008
Items Contents
I. Credit Risk Strategies, Goals, Policies, and Procedures
1. Credit Risk Strategies, Goals, Policies
(1) In accordance with the loan, investment, and business risk management strategies and operating directions approved by the Board of Directors, and in compliance with the Basel II Capital Accord and the regulatory provisions of the competent authority, the Bank has established a credit risk management system and policy and, in response to changes in the macroeconomic market, loan portfolio risk, and asset quality, and to coordinate with government policy, the Bank readjusts its risk management policy according to internal procedures whenever necessary.
(2) Under the stipulations of the Basel II Accord, the calculation of risk-based assets and self-owned capital for the Pillar I minimum capital requirement is carried out by the standard method to measure the allocation of capital.
2. Credit Risk Procedures
(1) Credit risk assessment and monitoring are carried out in accordance with the relevant regulations of the competent authority and the BOT, and reports are submitted to the BOT's Board of Directors and Risk Management Committee.
(2) Risk quotas and early-warning indexes are established by industry, country, conglomerate, financial institution, and trading partner in order to control the concentration of risk, and monitoring and reporting are carried out.
(3) To effectively measure the quality of loan assets, the Bank has established pre-loan investigation and screening rules and procedures; it has also strengthened post-loan management, and has adopted the following control and measurement mechanisms:a loan review and follow-up evaluation system, and loan early-warning mechanism; monitoring of asset quality; strengthened early warning and management for abnormal loans; full allocation of loss provisions, and adequate capital provision.
(4) The Bank has developed and established various risk rating models, rating systems, and management systems related to credit risk, and is gradually introducing them into the Bank's credit investigation processes to help the Bank identify and weigh credit risk so that it can comply with the provisions of the Basel II Capital Accord and strengthen its credit risk management capability.
II. Organizational Framework of Credit Risk Management
The BOT's organizational framework of credit risk management includes the Board of Directors, Risk Management Committee, Auditing Office, Department of Credit Management, units in charge of business, and other business units. The Auditing Office of the Board of Directors carries out inspections of the different credit risk management systems and procedures.
III. Scope and Characteristics of the Credit Risk Reporting and Measuring System
1. Credit Risk Reporting:
Scope: Includes the standard system-produced credit risk reports that are submitted to the competent authority, and monthly credit risk monitoring reports.
Characteristics: The Bank's Department of Risk Management produces credit risk monitoring reports and submits them to the chief executive on a monthly basis, and also makes regular reports to the Board of Directors and Risk Management Committee. The content of these reports includes risk-control conditions such as the status of bank-wide exposure to credit risk, the status of utilization of total amounts and quota limits, analysis of the management of credit risk concentration, analysis of overseas branch (including the OBU) loan asset portfolios and anonymous loan participants, and asset quality and off-book items. Dynamic monitoring of credit risk is also carried out as necessary, and if major changes are found they are reported, according to established procedure, to the relevant superior unit and then to the chief executive in order to control credit risk effectively.
2. Credit Risk Measuring System
Scope: The Bank currently uses the risk standardized approach to calculate capital allocation. The Risk Management Information System automatically produces various reports each month, including reports to the competent authority, management-related reports, and information-disclosure reports. These reports are used to compile monitoring reports for ranking executives, the Risk Management Committee, and the Board of Directors. The Bank is currently installing a risk-management mechanism with an internal ratings-based approach that is compliant with the Basel II Capital Accord. Corporate banking information is being collected bank-wide for the establishment of a credit risk databank, data mart, and credit-rating system, and models are being set up for default probability in corporate banking and consumer banking, loss given default, and exposure at default. After these systems are in place they will be introduced into the Bank's credit-investigation process, and the advance measurement approach will be used to measure and manage credit risk.
Characteristics: The risk measurement and rating systems and mechanisms are used together with consideration of credit characteristics, changes in the market and economic environment, collateral or guarantees, individual transaction risk, and investment portfolio in carrying out general business and risk cost performance consolidation so as to enhance the Bank's credit risk management capability and strengthen its credit risk management mechanism.
12�
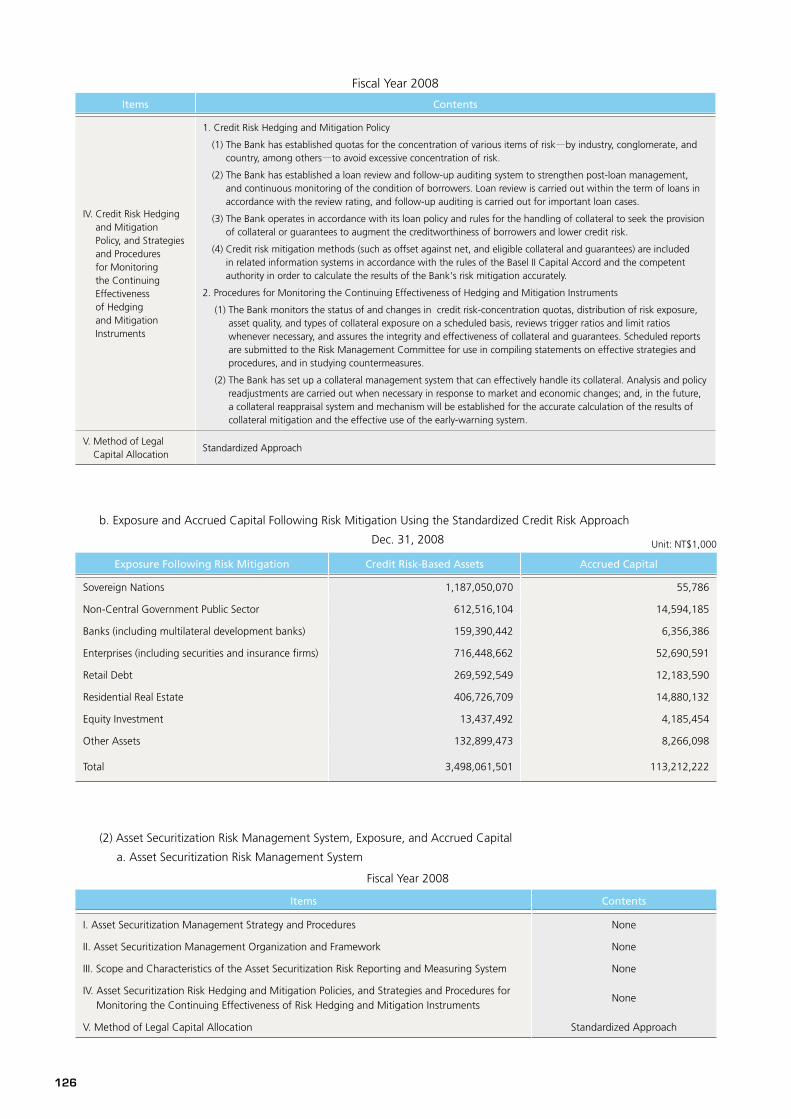
b. Exposure and Accrued Capital Following Risk Mitigation Using the Standardized Credit Risk Approach
Dec. 31, 2008 Unit: NT$1,000
Exposure Following Risk Mitigation Credit Risk-Based Assets Accrued Capital
Sovereign Nations 1,187,050,070 55,786
Non-Central Government Public Sector 612,516,104 14,594,185
Banks (including multilateral development banks) 159,390,442 6,356,386
Enterprises (including securities and insurance firms) 716,448,662 52,690,591
Retail Debt 269,592,549 12,183,590
Residential Real Estate 406,726,709 14,880,132
Equity Investment 13,437,492 4,185,454
Other Assets 132,899,473 8,266,098
Total 3,498,061,501 113,212,222
(2) Asset Securitization Risk Management System, Exposure, and Accrued Capital
a. Asset Securitization Risk Management System
Fiscal Year 2008
Items Contents
I. Asset Securitization Management Strategy and Procedures None
II. Asset Securitization Management Organization and Framework None
III. Scope and Characteristics of the Asset Securitization Risk Reporting and Measuring System None
IV. Asset Securitization Risk Hedging and Mitigation Policies, and Strategies and Procedures for Monitoring the Continuing Effectiveness of Risk Hedging and Mitigation Instruments
None
V. Method of Legal Capital Allocation Standardized Approach
Fiscal Year 2008
Items Contents
IV. Credit Risk Hedging and Mitigation Policy, and Strategies and Procedures for Monitoring the Continuing Effectiveness of Hedging and Mitigation Instruments
1. Credit Risk Hedging and Mitigation Policy
(1) The Bank has established quotas for the concentration of various items of risk—by industry, conglomerate, and country, among others—to avoid excessive concentration of risk.
(2) The Bank has established a loan review and follow-up auditing system to strengthen post-loan management, and continuous monitoring of the condition of borrowers. Loan review is carried out within the term of loans in accordance with the review rating, and follow-up auditing is carried out for important loan cases.
(3) The Bank operates in accordance with its loan policy and rules for the handling of collateral to seek the provision of collateral or guarantees to augment the creditworthiness of borrowers and lower credit risk.
(4) Credit risk mitigation methods (such as offset against net, and eligible collateral and guarantees) are included in related information systems in accordance with the rules of the Basel II Capital Accord and the competent authority in order to calculate the results of the Bank's risk mitigation accurately.
2. Procedures for Monitoring the Continuing Effectiveness of Hedging and Mitigation Instruments
(1) The Bank monitors the status of and changes in credit risk-concentration quotas, distribution of risk exposure, asset quality, and types of collateral exposure on a scheduled basis, reviews trigger ratios and limit ratios whenever necessary, and assures the integrity and effectiveness of collateral and guarantees. Scheduled reports are submitted to the Risk Management Committee for use in compiling statements on effective strategies and procedures, and in studying countermeasures.
(2) The Bank has set up a collateral management system that can effectively handle its collateral. Analysis and policy readjustments are carried out when necessary in response to market and economic changes; and, in the future, a collateral reappraisal system and mechanism will be established for the accurate calculation of the results of collateral mitigation and the effective use of the early-warning system.
V. Method of Legal Capital Allocation
Standardized Approach

12�
Forew
ord
Co
rpo
rate G
overn
ance R
epo
rtFu
nd
-Raisin
g
Activities
Gen
eral Op
erating
C
on
ditio
ns
Finan
cial Statu
sSp
ecial No
tesD
irectory o
f Head
O
ffice an
d B
ranch
es
Review
and
An
alysis of Fin
ancial
and
Op
erating
Resu
lts‚ and
Risk
Man
agem
ent
Intro
du
ction
b. Status of Risk Securitization Undertaken
(None)
c. Asset Securitization Risk Exposure and Accrued Capital
Unit: NT$1,000
Type of Exposure
Non-Originating Bank Originating Bank
Purchased or Held
Securitization Risk Exposure
Accrued Capital
Exposure
Accrued Capital Before Securitization
Non-Asset-Backed Commercial Paper
Asset-Backed Commercial
Paper
Traditional Synthetic
Hold Positions
Not Hold Positions
Hold Positions
Not Hold Positions
Beneficiary Securities – Home mortgage loans
6,416,092 102,657 - - - - - -
Beneficiary Securities – Real Estate Asset Trust
59,874 2,787 - - - - - -
Collateralized Debt Obligation
211,358 3,382 - - - - - -
Liquidity Facilities(Note 1) 2,000,000 160,000 - - - - - -
Total(Note 2) 8,687,324 268,826 - - - - -
Note 1: In the process of its participation in a securitized receivables syndicated loan the Bank served as a liquidity provider, promising to offer loan funds in the amount of NT$2 billion to the issuer to facilitate the securitization; under the definition contained in the “Methods for Calculating Banks' Regulatory Capital and Risk-Based Assets” as promulgated by the competent authority, banks that incur risk by participating in asset securitization transactions should list the risk as asset securitization exposure and allocate capital for it.
Note 2: The amount of the Bank's investment in securitized asset products that is required to be deducted in its entirety from capital was NT$8,459,000. This investment was in securitized bond products; since it was already deducted from capital, it is not listed in this chart.
d. Securitized product information—securitized product investment summary sheet
Dec. 31, 2008 Unit: NT$1,000
Items Account Name Historical Cost
Accumulated profit and loss
assessment
Accumulated impairment
lossBook Value
REATAvailable-for-sale financial assets-noncurrent
10,000 (202) 9,798
REATHeld-to-maturity financial assets-noncurrent
38,385 38,385
ABSAvailable-for-sale financial assets-noncurrent
999,445 (2,700) (988,286) 8,459
ABSHeld-to-maturity financial assets-current
25,173 (6) 25,167
ABCPFinancial assets measured at fair value through porfit or loss-currnet
1,312,942 279 1,313,221
CDOFinancial assets measured at fair value through porfit or loss-currnet
1,778,576 (1,140,982) 637,594
CDODebt investment without quoted price in active markets-noncurrent
655,480 655,480
MBSAvailable-for-sale financial assets-current
354,694 6,338 361,032
MBSDebt investment without quoted price in active markets-noncurrent
6,031,060 39,585 6,070,645

12�
Unit: NT$1,000
Name of SecurityAccount Name
CurrencyIssuer of
security and it's location
Purchase Date
Expiry Date
CouponCredit Rating
Settlement Method
Historical Cost
Accumulated valuation
gain or loss/amortization
(including mitigation of
damage)
Book Value
Attachment point
Asset Pool
KKRF 2005-1X 1A FRN (USG6267NAA57)
Financial assets
measured at fair
value through
porfit or loss-
current
USD
Morgan Stanley
Managed
ACES SPC
(Cayman
Island)
2006/2/7 2013/3/20 3ML+50BP B2/AAA
Quarterly interest payments and repayment of principal at maturity
491,610 -467,030 24,580 11.96% Table 1
RUTLAND RATED INVESTMENTS (USG77264BL54)
〃 USD
Rutland Rated
Investments
(Cayman
Island)
2006/5/24 2013/6/20 3ML+70BP Caa1/BB-/BB-
Quarterly interest payments and repayment of principal at maturity
491,610 -363,644 127,966 6.66% Table 2
GREYLOCK SYNTHETIC (USG4119QAC99)
〃 USD
Greylock
Synthetic CDO
2006(Cayman
Island)
2006/11/17 2014/3/20 3ML+0.7% Ba3/AA-
Quarterly interest payments and repayment of principal at maturity
327,740 -232,663 95,077 6.21% Table 3
CHEYNE CREDIT SPI (XS0256381319)
Debt
investment
without quoted
price in active
markets-
noncurrent
USD
Cheyne Credit
SPI(Ireland) Plc.
(Ireland)
2006/6/6 2014/6/30 AAA
Yearly interest payments and repayment of principal at maturity
327,740 0 327,740 0 None
EQUINOX (XS0282273704A)
〃 USD
Equinox Credit
Funding Plc.
(Ireland)
2006/12/15 2013/12/20 3ML+1% Aaa/AAA
No current interest and repayment of principal at maturity
327,740 0 327,740 0 None
FANNIE MAE (US31395DF463)
〃 USDFANNIE MAE
US2006/6/12 2036/6/25 1ML+40BP Aaa
Monthly payments of interest and principal
533,303 76 533,379 0Secured home loans
FANNIE MAE (US31395N3L94)
〃 USDFANNIE MAE
US2006/6/26 2036/7/25 1ML+0.4% Aaa
Monthly payments of interest and principal
304,444 378 304,822 0Secured home loans
FREDDIE MAC (US31396RKP19)
〃 USDFREDDIE MAC
US2006/6/30 2036/5/15 1ML+0.38% Aaa
Monthly payments of interest and principal
413,513 775 414,288 0Secured home loans
FREDDIE MAC (US31397BBC46)
〃 USDFREDDIE MAC
US2006/9/12 2036/9/15 1ML+0.42% Aaa
Monthly payments of interest and principal
345,672 0 345,672 0Secured home loans
FANNIE MAE (US31396PP472)
〃 USDFANNIE MAE
US2007/2/2 2037/1/25 1ML+1.5% Aaa
Monthly payments of interest and principal
337,892 0 337,892 0Secured home loans
FANNIE MAE (US31396PT680)
〃 USDFANNIE MAE
US2007/1/31 2037/3/25 1ML+0.45% Aaa
Monthly payments of interest and principal
399,738 0 399,738 0Secured home loans
FREDDIE MAC (US31397FUY68)
〃 USDFREDDIE MAC
US2007/3/14 2037/3/15 1ML+1.05% Aaa
Monthly payments of interest and principal
538,140 0 538,140 0Secured home loans
FREDDIE MAC (US31397JYL24)
〃 USDFREDDIE MAC
US2007/7/6 2037/5/15 1ML+1% Aaa
Monthly payments of interest and principal
391,406 22 391,428 0Secured home loans
FREDDIE MAC (US31397BVF56)
〃 USDFREDDIE MAC
US2008/3/6 2036/10/15 1ML+0.4% Aaa
Monthly payments of interest and principal
476,324 7,437 483,761 0Secured home loans
FREDDIE MAC (US31397BBG59)
〃 USDFREDDIE MAC
US2008/3/6 2036/9/15 1ML+0.42% Aaa
Monthly payments of interest and principal
448,252 8,465 456,717 0Secured home loans
FANNIE MAE (US31396LV982)
〃 USDFANNIE MAE
US2008/3/6 2036/12/25 1ML+0.36% Aaa
Monthly payments of interest and principal
475,048 10,126 485,174 0Secured home loans
FANNIE MAE (US31396LNF30)
〃 USDFANNIE MAE
US2008/3/6 2036/11/25 1ML+0.41% Aaa
Monthly payments of interest and principal
471,951 9,394 481,345 0Secured home loans
E. Sun Bank 2007-1 ABS B1
Available-for-
sale financial
assets-
noncurrent
NTD HSBC, Taipei 2007/5/25 2014/6/15 2.4500% C.tw
Quarterly interest payments; repayment of principal in 10 payments beginning Mar. 15, 2012
999,445 -990,976 8,459 6.67% Table 4
Beneficiary securities for securitized receivables of Chi Mei Optoelectronics
Financial assets
measured at fair
value through
porfit or loss-
current
NTDChina Trust,
Taipei2006/10/5 2011/10/5 0.4710% twA-2
Monthly issuance of commercial paper; repayment of principal and payment of interest at maturity
1,312,942 279 1,313,221 0Account
Receivables
Securitized product information –
Original cost of single investment in securitized products in excess of NT$300 million
Dec. 31, 2008

12�
Forew
ord
Co
rpo
rate G
overn
ance R
epo
rtFu
nd
-Raisin
g
Activities
Gen
eral Op
erating
C
on
ditio
ns
Finan
cial Statu
sSp
ecial No
tesD
irectory o
f Head
O
ffice an
d B
ranch
es
Review
and
An
alysis of Fin
ancial
and
Op
erating
Resu
lts‚ and
Risk
Man
agem
ent
Intro
du
ction
Table 1. KKRF 2005-1X 1A FRN(USG6267NAA57)Asset Pool:Unit: US Dollars
Reference Entity Notional Amount Seniority Country
ALTRIA GROUP INC. 100,000,000.00 Senior Unsecured U.S.
AMBAC FINANCIAL GROUP INC. 100,000,000.00 Senior Unsecured U.S.
AMERICAN AXLE & MANUFACTURING INC. 100,000,000.00 Senior Unsecured U.S.
AMERICAN EXPRESS COMPANY 100,000,000.00 Senior Unsecured U.S.
ARCELORMITTAL 100,000,000.00 Senior Unsecured Luxembourg
AUTOZONE INC. 100,000,000.00 Senior Unsecured U.S.
BANK OF AMERICA CORPORATION (SUB) 125,000,000.00 Subordinate U.S.
BEAZER HOMES USA INC. 100,000,000.00 Senior Unsecured U.S.
BELO CORP. 100,000,000.00 Senior Unsecured U.S.
BERKSHIRE HATHAWAY INC. 50,000,000.00 Senior Unsecured U.S.
BOYD GAMING CORPORATION 100,000,000.00 Subordinate U.S.
CAPITAL ONE FINANCIAL CORPORATION 100,000,000.00 Senior Unsecured U.S.
CBS CORP. 100,000,000.00 Senior Unsecured U.S.
CENTEX CORP. 100,000,000.00 Senior Unsecured U.S.
CENTURYTEL INC. 100,000,000.00 Senior Unsecured U.S.
CHESAPEAKE ENERGY CORP. 100,000,000.00 Senior Unsecured U.S.
CIBA SPECIALTY CHEMICAL HOLDING INC. 100,000,000.00 Senior Unsecured Switzerland
CITIGROUP INC. (SUB) 125,000,000.00 Subordinate U.S.
CITIZENS COMMUNICATIONS CO. 100,000,000.00 Senior Unsecured U.S
CLEAR CHANNEL COMMUNICATIONS INC. 100,000,000.00 Senior Unsecured U.S.
COMCAST CABLE COMMUNICATIONS 100,000,000.00 Senior Unsecured U.S.
CONSTELLATION BRANDS INC. 100,000,000.00 Senior Unsecured U.S.
COUNTRYWIDE HOME LOANS INC. 100,000,000.00 Subordinate U.S.
COX COMMUNICATIONS INC. 100,000,000.00 Senior Unsecured U.S.
DARDEN RESTAURANTS INC. 100,000,000.00 Senior Unsecured U.S.
DEUTSCHE TELEKOM INTERNATIONAL FINANCE BV. 100,000,000.00 Senior Unsecured Germany
DIRECTV HOLDINGS LLC/DIRECTV FINANCING CO. 100,000,000.00 Senior Unsecured U.S.
DSG INTERNATIONAL PLC. 100,000,000.00 Senior Unsecured United Kingdom
EL PASO CORP. 100,000,000.00 Senior Unsecured U.S.
FEDERATED DEPARTMENT STORES INC. 100,000,000.00 Senior Unsecured U.S.
FORD MOTOR CREDIT CO. 100,000,000.00 Senior Unsecured U.S.
FRANCE TELECOM SA. 100,000,000.00 Senior Unsecured France
GANNETT CO INC. 100,000,000.00 Senior Unsecured U.S.
GEORGIA-PACIFIC CORP. 100,000,000.00 Senior Unsecured U.S.
GLENCORE FINANCE EUROPE SA. 100,000,000.00 Senior Unsecured Switzerland
GMAC LLC 100,000,000.00 Senior Unsecured U.S.
GOLDMAN SACHS GROUP INC. 100,000,000.00 Senior Unsecured U.S.
HARRAH'S OPERATING CO INC. 100,000,000.00 Senior Unsecured U.S.
HILTON HOTELS CORP. 100,000,000.00 Senior Unsecured U.S.
HSBC FINANCE CORPORATION 100,000,000.00 Senior Unsecured U.S.
IAC/INTERACTIVE CORP. 100,000,000.00 Senior Unsecured U.S.
IKON OFFICE SOLUTIONS INC. 100,000,000.00 Senior Unsecured U.S.
ISTAR FINANCIAL INC. 100,000,000.00 Senior Unsecured U.S.
J. C. PENNEY COMPANY, INC. 100,000,000.00 Senior Unsecured U.S.
J.P. MORGAN CHASE & CO. (SUB) 100,000,000.00 Subordinate U.S.
LIBERTY MEDIA CORP. 100,000,000.00 Senior Unsecured U.S.
LIMITED BRANDS, INC. 100,000,000.00 Senior Unsecured U.S.
LOUISIANA-PACIFIC CORP. 100,000,000.00 Senior Unsecured U.S.
MARKS & SPENCER PLC. 100,000,000.00 Senior Unsecured United Kingdom
MARRIOTT INTERNATIONAL INC. 100,000,000.00 Senior Unsecured U.S.
MARSH & MCLENNAN COS INC. 100,000,000.00 Senior Unsecured U.S.

130
Reference Entity Notional Amount Seniority Country
MBIA INSURANCE CORPORATION 100,000,000.00 Senior Unsecured U.S.
MBIA INSURANCE CORPORATION 100,000,000.00 Senior Unsecured U.S.
MCDONALD'S CORP . 100,000,000.00 Senior Unsecured U.S.
MDC HOLDINGS INC . 100,000,000.00 Senior Unsecured U.S.
MEADWESTV ACO CORP. 100,000,000.00 Senior Unsecured U.S.
MERRILL LYNCH & CO INC. 150,000,000.00 Subordinate U.S.
MGM MIRAGE 100,000,000.00 Senior Unsecured U.S.
MOTOROLA, INC. 100,000,000.00 Senior Unsecured U.S.
NORBORD INC. 100,000,000.00 Senior Unsecured Canada
NOVA CHEMICALS CORP. 100,000,000.00 Senior Unsecured Canada
OFFICE DEPOT INC. 100,000,000.00 Senior Unsecured U.S.
OLIN CORP. 100,000,000.00 Senior Unsecured U.S.
OMNICARE INC. 100,000,000.00 Subordinate U.S.
RESIDENTIAL CAPITAL CORP. 100,000,000.00 Senior Unsecured U.S.
ROUSE CO LP/THE 100,000,000.00 Senior Unsecured U.S.
SBC COMMUNICATIONS INC. 100,000,000.00 Senior Unsecured U.S.
SEALED AIR CORP. 100,000,000.00 Senior Unsecured U.S.
SIMON PROPERTY GROUP LP 100,000,000.00 Senior Unsecured U.S.
SLM CORPORATION 100,000,000.00 Senior Unsecured U.S.
SOUTHWEST AIRLINES CO. 100,000,000.00 Senior Unsecured U.S.
STANDARD-PACIFIC CORP. 100,000,000.00 Senior Unsecured U.S.
STARWOOD HOTELS & RESORTS WORLDWIDE 100,000,000.00 Senior Unsecured U.S.
SWISS REINSURANCE COMPANY 100,000,000.00 Subordinate Switzerland
TARGET CORPORATION 100,000,000.00 Senior Unsecured U.S.
TEMPLE-INLAND INC. 100,000,000.00 Senior Unsecured U.S.
THE BEAR STEARNS COMPANIES INC. 100,000,000.00 Senior Unsecured U.S.
THE HOME DEPOT, INC. 100,000,000.00 Senior Unsecured U.S.
TIME WARNER INC. 100,000,000.00 Senior Unsecured U.S.
TOLL BROTHERS INC. 100,000,000.00 Senior Unsecured U.S.
TRW AUTOMOTIVE INC. 100,000,000.00 Senior Unsecured U.S.
TXU ENERGY CO LLC 100,000,000.00 Senior Unsecured U.S.
TYSON FOODS INC. 100,000,000.00 Senior Unsecured U.S.
UNITEDHEALTH GROUP INCORPORATED 100,000,000.00 Senior Unsecured U.S.
UST INC 100,000,000.00 Senior Unsecured U.S.
VODAFONE GROUP PUBLIC LIMITED COMPANY 100,000,000.00 Senior Unsecured United Kingdom
VORNADO REALTY LP 100,000,000.00 Senior Unsecured U.S.
WACHOVIA CORPORATION (SUB) 125,000,000.00 Subordinate U.S.
WELLS FARGO & COMPANY (SUB) 125,000,000.00 Subordinate U.S.
WEYERHAEUSER CO. 100,000,000.00 Senior Unsecured U.S.
XL CAPITAL LTD. 100,000,000.00 Senior Unsecured Bermuda
YUM! BRANDS INC. 8 7/8 04/15/11 100,000,000.00 Senior Unsecured U.S.
ZURICH INSURANCE COMPANY (SUB) 100,000,000.00 Subordinate Switzerlan
Total 93 9,400,000,000.00

131
Forew
ord
Co
rpo
rate G
overn
ance R
epo
rtFu
nd
-Raisin
g
Activities
Gen
eral Op
erating
C
on
ditio
ns
Finan
cial Statu
sSp
ecial No
tesD
irectory o
f Head
O
ffice an
d B
ranch
es
Review
and
An
alysis of Fin
ancial
and
Op
erating
Resu
lts‚ and
Risk
Man
agem
ent
Intro
du
ction
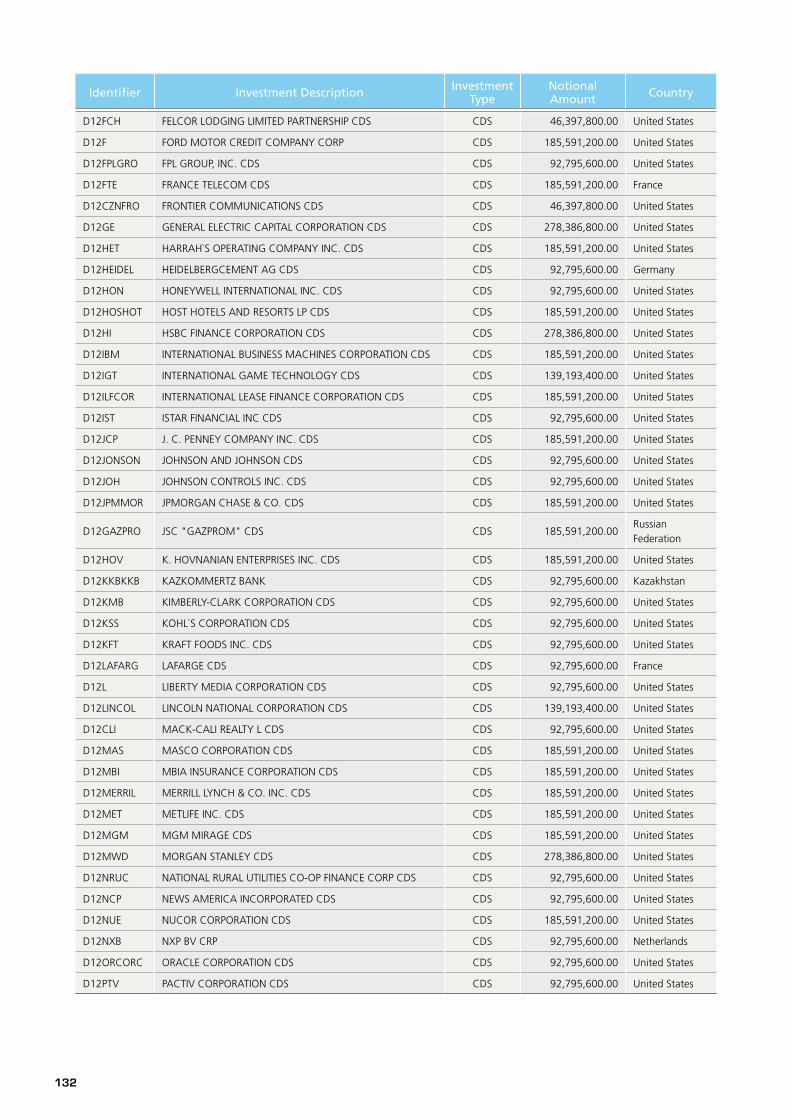
Table 2. RUTLAND RATED INVESTMENTS(USG77264BL54)Asset Pool:Unit: US Dollars
Identifier Investment Description InvestmentType
NotionalAmount Country
D12ABY ABITIBI-CONSOLIDATED INC. CDS CDS 185,591,200.00 Canada
D12AEGONN AEGON N.V. CDS CDS 185,591,200.00 Netherlands
D12AKZOF AKZO NOBEL N.V. CDS CDS 92,795,600.00 Netherlands
D12AA ALCOA INC. CDS CDS 185,591,200.00 United States
D12AMBACA AMBAC ASSURANCE CORPORATION CDS CDS 92,795,600.00 United States
D12AMERIC AMERICAN EXPRESS COMPANY CDS CDS 92,795,600.00 United States
D12AIG AMERICAN INTERNATIONAL GROUP INC. CDS CDS 278,386,800.00 United States
D12ARCMIT ARCELORMITTAL CDS CDS 185,591,200.00 Luxembourg
D12ARM ARVINMERITOR INC. CDS CDS 92,795,600.00 United States
D12SBC AT&T INC. CDS CDS 185,591,200.00 United States
D12AVALON AVALONBAY COMMUNITIES INC. CDS CDS 185,591,200.00 United States
D12AVIVAP AVIVA PLC CDS CDS 92,795,600.00 United Kingdom
D12AXS AXIS CAPITALHOLDINGS CDS CDS 92,795,600.00 Bermuda
D12BANKOF BANK OF AMERICA CDS CDS 92,795,600.00 United States
D12BY BAYER AG. INC. CDS 185,591,200.00 Germany
D12BMWAKT BAYERISCHE MOTOREN WERKE AKTIENGSELLSCHAFT CDS CDS 92,795,600.00 Germany
D12BZH BEAZER HOMES USA INC. CDS CDS 46,397,800.00 United States
D12BRKA BERKSHIRE HATHAWAY INC. CDS CDS 278,386,800.00 United States
D12BHF BHP BILLITON LIMITED CDS CDS 185,591,200.00 Australia
D12BOYGAM BOYD GAMING CORPORATION CDS CDS 46,397,800.00 United States
D12BSY BRITISH SKY BROADCASTING GROUP PLC CDS CDS 46,397,800.00 United Kingdom
D12BRITEL BRITISH TELECOMMUNICATIONS PUBLIC LTD CO CDS CDS 92,795,600.00 United Kingdom
D12BG BUNGE LIMITED FINANCE CORP. CDS CDS 92,795,600.00 United States
D12CAPONE CAPITAL ONE BANK CDS CDS 92,795,600.00 United States
D12CARGIL CARGILL INCORPORATED CDS CDS 185,591,200.00 United States
D12CCL CARNIVAL CORPORATION CDS CDS 92,795,600.00 United States
D12CHEVRO CHEVRON CORPORATION CDS CDS 92,795,600.00 United States
D12CSPCF CIBA SPECIALTY CHEMICALS HOLDING INC. CDS CDS 92,795,600.00 Switzerland
D12CIT CIT GROUP INC. CDS CDS 185,591,200.00 United States
D12CMCSA COMCAST CABLE COMMUNICATIONS LLC CDS CDS 185,591,200.00 United States
D12COP CONOCOPHILLIPS CDS CDS 185,591,200.00 United States
D12CONSOLCONSOLIDATED EDISON COMPANY OF NEW YORK, INC.CDS
CDS 92,795,600.00 United States
D12CEG CONSTELLATION ENERGY GROUP INC. CDS CDS 92,795,600.00 United States
D12COUNTR COUNTRYWIDE HOME LOANS INC. CDS CDS 185,591,200.00 United States
D12DCX DAIMLERCHRYSLER AG CDS CDS 185,591,200.00 Germany
D12DEUTSC DEUTSCHE BANK AKTIENSELLSCHAFT CDS CDS 185,591,200.00 Germany
D12DT DEUTSCHE TELEKOM AG CDS CDS 185,591,200.00 Germany
D12EMB EMBARQ CORP. CDS CDS 185,591,200.00 United States
D12ENBIDG ENBRIDGE INC. CDS CDS 92,795,600.00 Canada
D12ENELSP ENEL S.P.A. CDS CDS 139,193,400.00 Italy
D126236Z ERAC USA FINANCE COMPANY CDS CDS 185,591,200.00 United States
D12FD FEDERATED DEPARTMENT STORES INC. CDS CDS 185,591,200.00 United States
132
Identifier Investment Description InvestmentType
NotionalAmount Country
D12FCH FELCOR LODGING LIMITED PARTNERSHIP CDS CDS 46,397,800.00 United States
D12F FORD MOTOR CREDIT COMPANY CORP CDS 185,591,200.00 United States
D12FPLGRO FPL GROUP, INC. CDS CDS 92,795,600.00 United States
D12FTE FRANCE TELECOM CDS CDS 185,591,200.00 France
D12CZNFRO FRONTIER COMMUNICATIONS CDS CDS 46,397,800.00 United States
D12GE GENERAL ELECTRIC CAPITAL CORPORATION CDS CDS 278,386,800.00 United States
D12HET HARRAH`S OPERATING COMPANY INC. CDS CDS 185,591,200.00 United States
D12HEIDEL HEIDELBERGCEMENT AG CDS CDS 92,795,600.00 Germany
D12HON HONEYWELL INTERNATIONAL INC. CDS CDS 92,795,600.00 United States
D12HOSHOT HOST HOTELS AND RESORTS LP CDS CDS 185,591,200.00 United States
D12HI HSBC FINANCE CORPORATION CDS CDS 278,386,800.00 United States
D12IBM INTERNATIONAL BUSINESS MACHINES CORPORATION CDS CDS 185,591,200.00 United States
D12IGT INTERNATIONAL GAME TECHNOLOGY CDS CDS 139,193,400.00 United States
D12ILFCOR INTERNATIONAL LEASE FINANCE CORPORATION CDS CDS 185,591,200.00 United States
D12IST ISTAR FINANCIAL INC CDS CDS 92,795,600.00 United States
D12JCP J. C. PENNEY COMPANY INC. CDS CDS 185,591,200.00 United States
D12JONSON JOHNSON AND JOHNSON CDS CDS 92,795,600.00 United States
D12JOH JOHNSON CONTROLS INC. CDS CDS 92,795,600.00 United States
D12JPMMOR JPMORGAN CHASE & CO. CDS CDS 185,591,200.00 United States
D12GAZPRO JSC "GAZPROM" CDS CDS 185,591,200.00Russian Federation
D12HOV K. HOVNANIAN ENTERPRISES INC. CDS CDS 185,591,200.00 United States
D12KKBKKB KAZKOMMERTZ BANK CDS 92,795,600.00 Kazakhstan
D12KMB KIMBERLY-CLARK CORPORATION CDS CDS 92,795,600.00 United States
D12KSS KOHL`S CORPORATION CDS CDS 92,795,600.00 United States
D12KFT KRAFT FOODS INC. CDS CDS 92,795,600.00 United States
D12LAFARG LAFARGE CDS CDS 92,795,600.00 France
D12L LIBERTY MEDIA CORPORATION CDS CDS 92,795,600.00 United States
D12LINCOL LINCOLN NATIONAL CORPORATION CDS CDS 139,193,400.00 United States
D12CLI MACK-CALI REALTY L CDS CDS 92,795,600.00 United States
D12MAS MASCO CORPORATION CDS CDS 185,591,200.00 United States
D12MBI MBIA INSURANCE CORPORATION CDS CDS 185,591,200.00 United States
D12MERRIL MERRILL LYNCH & CO. INC. CDS CDS 185,591,200.00 United States
D12MET METLIFE INC. CDS CDS 185,591,200.00 United States
D12MGM MGM MIRAGE CDS CDS 185,591,200.00 United States
D12MWD MORGAN STANLEY CDS CDS 278,386,800.00 United States
D12NRUC NATIONAL RURAL UTILITIES CO-OP FINANCE CORP CDS CDS 92,795,600.00 United States
D12NCP NEWS AMERICA INCORPORATED CDS CDS 92,795,600.00 United States
D12NUE NUCOR CORPORATION CDS CDS 185,591,200.00 United States
D12NXB NXP BV CRP CDS 92,795,600.00 Netherlands
D12ORCORC ORACLE CORPORATION CDS CDS 92,795,600.00 United States
D12PTV PACTIV CORPORATION CDS CDS 92,795,600.00 United States

133
Forew
ord
Co
rpo
rate G
overn
ance R
epo
rtFu
nd
-Raisin
g
Activities
Gen
eral Op
erating
C
on
ditio
ns
Finan
cial Statu
sSp
ecial No
tesD
irectory o
f Head
O
ffice an
d B
ranch
es
Review
and
An
alysis of Fin
ancial
and
Op
erating
Resu
lts‚ and
Risk
Man
agem
ent
Intro
du
ction
Identifier Investment Description InvestmentType
NotionalAmount Country
D12BTU PEABODY ENERGY CORP. CDS 46,397,800.00 United States
D12PETR4 PETROLEO BRASILEIRO S/A PETROBRAS CDS CDS 92,795,600.00 Brazil
D12PEMEX PETROLEOS MEXICANOS CDS CDS 185,591,200.00 Mexico
D12PPGIND PPG INDUSTRIES INC. CDS CDS 92,795,600.00 United States
D12PROGAM PROCTOR AND GAMBLE COMPANY CDS CDS 185,591,200.00 United States
D12RESCAP RESIDENTIAL CAPITAL CORPORATION CDS CDS 231,989,000.00 United States
D12RCL ROYAL CARIBBEAN CRUISES CDS 185,591,200.00 United States
D12SANOFI SANOFI-AVENTIS CDS CDS 185,591,200.00 France
D12SMAWF SIEMENS AKTIENGESELLSCHAFT CDS CDS 185,591,200.00 Germany
D12SPG SIMON PROPERTY GROUP L.P. CDS CDS 92,795,600.00 United States
D12SLMMAE SLM CORPORATION CDS CDS 139,193,400.00 United States
D12LUV SOUTHWEST AIRLINES CO. CDS CDS 139,193,400.00 United States
D12HOT STARWOOD HOTELS & RESORTS WORLDWIDE INC. CDS CDS 92,795,600.00 United States
D12SUNCOR SUNCOR ENERGY INC.CDS CDS 185,591,200.00 Canada
D12SWISRE SWISS REINSURANCE COMPANY CDS 139,193,400.00 Switzerland
D12TI TELECOM ITALIA SPA CDS CDS 185,591,200.00 Italy
D12TEF TELEFONICA S.A. CDS CDS 185,591,200.00 Spain
D12TELMEX TELEFONOS DE MEXICO CDS CDS 185,591,200.00 Mexico
D12DOW THE DOW CHEMICAL COMPANY CDS CDS 92,795,600.00 United States
D12GS THE GOLDMAN SACHS GROUP INC. CDS CDS 185,591,200.00 United States
D12HARFOR THE HARFORD FINANCIAL SERVICES GROUP CDS CDS 46,397,800.00 United States
D12HD THE HOME DEPOT CDS CDS 92,795,600.00 United States
D12RBSCDS THE ROYAL BANK OF SCOTLAND CDS CDS 92,795,600.00 United Kingdom
D12TWX TIME WARNER INC CDS CDS 185,591,200.00 United States
D12UMS UNITED MEXICAN STATES CDS CDS 185,591,200.00 Mexico
D12UNITED UNITED PARCEL SERVICE, INC CDS CDS 92,795,600.00 United States
D12RENTAL UNITED RENTALS INC CDS CDS 92,795,600.00 United States
D12VEOLIA VEOLIA ENVIRONNEMENT.CDS CDS 185,591,200.00 France
D12VZ VERIZON COMMUNICATIONS INC CDS CDS 139,193,400.00 United States
D12VIA VIACOM INC CDS CDS 185,591,200.00 United States
D12VOD VODAFONE GROUP PUBLIC LIMITED COMPANY CDS CDS 185,591,200.00 United Kingdom
D12VOLKSW VOLKSWAGEN AKTIENGESELLSCHAFT CDS CDS 92,795,600.00 Germany
D12VULCAN VULCAN MATERIALS COMPANY CDS CDS 139,193,400.00 United States
D12WEL WELLPOINT INC CDS CDS 185,591,200.00 United States
D12WELLSF WELLS FARGO AND COMPANY CDS 185,591,200.00 United States
D12WU WESTERN UNION COMPANY CDS 92,795,600.00 United States
D12WY WEYERHAEUSER COMPANY CDS CDS 92,795,600.00 United States
D12WHR WHIRLPOOL CORP CDS CDS 92,795,600.00 United States
D12XRX XEROX CORPORATION CDS CDS 185,591,200.00 United States
Total 122 17,352,777,200.00

134
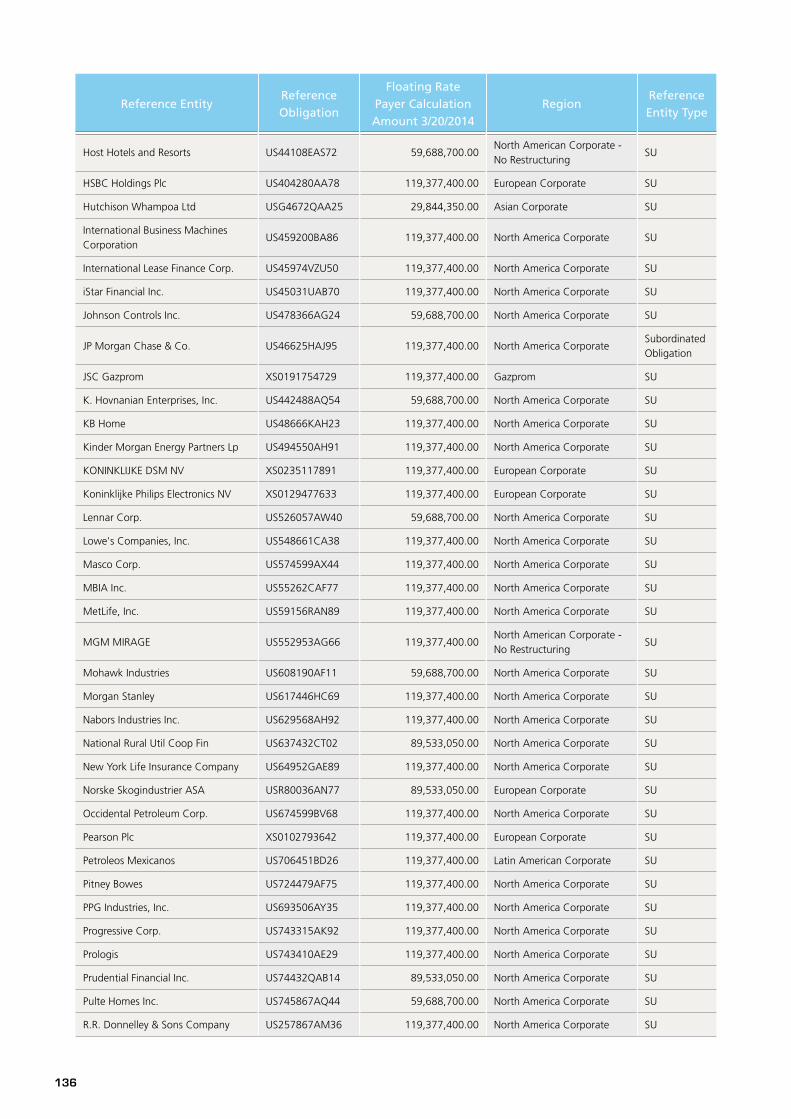
Table 3. GREYLOCK SYNTHETIC(USG4119QAC99)Asset Pool:
Unit: US Dollars
Reference EntityReference Obligation
Floating Rate Payer Calculation Amount 3/20/2014
RegionReference Entity Type
Aegon NV NL0000120889 59,688,700.00 European CorporateSubordinated Obligation
AES Corp. US00130HBC88 119,377,400.00North American Corporate - No Restructuring
SU
Allstate Corp/The US020002AH49 119,377,400.00 North America Corporate SU
Ambac Assurance Corp. XS0124212738 59,688,700.00North America Corporate - Monoline
SU
American Electric Power Co Inc. US025537AE11 59,688,700.00 North America Corporate SU
American Express Co. US025816AQ27 89,533,050.00 North America Corporate SU
Amgen Inc. US031162AJ99 29,844,350.00 North America Corporate SU
Anheuser-Busch Companies, Inc. US03522QAC96 119,377,400.00 North America Corporate SU
Assured Guaranty Corp. US04621WAA80 59,688,700.00North America Corporate - Monoline
SU
AT&T Inc. US78387GAP81 119,377,400.00 North America Corporate SU
Autozone US053332AC61 59,688,700.00 North America Corporate SU
AXA XS0122029548 119,377,400.00 European CorporateSubordinated Obligation
BAE Systems Plc GB0001272664 59,688,700.00 European Corporate SU
Banco Santander Central Hispano, SA ES0413900061 59,688,700.00 European Corporate SU
Bank of America Corp. US060505AQ79 149,221,750.00 North America Corporate SU
Barclays Bank PLC XS0187033864 89,533,050.00 European CorporateSubordinated Obligation
Bayerische Motoren Werke AG XS0162732951 59,688,700.00 European Corporate SU
Beazer Homes USA Inc. US07556QAJ40 59,688,700.00North American Corporate - No Restructuring
SU
Berkshire Hathaway Inc. US084664AD30 119,377,400.00 North America Corporate SU
Black & Decker Corp. US091797AJ96 119,377,400.00 North America Corporate SU
Boeing Capital Corp. US097014AH76 119,377,400.00 North America Corporate SU
Bombardier Inc. USC10602AG20 59,688,700.00North American Corporate - No Restructuring
SU
Capital One Financial Corp. US14040HAJ41 119,377,400.00 North America Corporate SU
Caterpillar Inc. US149123BM26 119,377,400.00 North America Corporate SU
CBS Corporation US925524AU41 59,688,700.00 North America Corporate SU
Chevron Texaco Corporation US881685AX97 89,533,050.00 North America Corporate SU
Ciba Specialty Chemicals AG XS0085895935 119,377,400.00 European Corporate SU
CIT Group Inc. US125581AB41 149,221,750.00 North America Corporate SU
Citigroup Inc. US172967BC45 119,377,400.00 North America Corporate SU
Clear Channel Communications Inc. US184502AP71 119,377,400.00 North America Corporate SU
Colgate-Palmolive Company US19416QBX79 119,377,400.00 North America Corporate SU
Comcast Cable Communication US20029PAN96 119,377,400.00 North America Corporate SU
ConocoPhillips US20825CAE49 119,377,400.00 North America Corporate SU

13�
Forew
ord
Co
rpo
rate G
overn
ance R
epo
rtFu
nd
-Raisin
g
Activities
Gen
eral Op
erating
C
on
ditio
ns
Finan
cial Statu
sSp
ecial No
tesD
irectory o
f Head
O
ffice an
d B
ranch
es
Review
and
An
alysis of Fin
ancial
and
Op
erating
Resu
lts‚ and
Risk
Man
agem
ent
Intro
du
ction
Reference EntityReference Obligation
Floating Rate Payer Calculation Amount 3/20/2014
RegionReference Entity Type
Continental AG DE000A0BB1Z6 119,377,400.00 European Corporate SU
Con-Way Inc. US12612WAA27 29,844,350.00 North America Corporate SU
Daimler AG US233835AW75 59,688,700.00 European Corporate SU
Danaher Corp US235851AB82 119,377,400.00 North America Corporate SU
Deere & Co US244199BB01 59,688,700.00 North America Corporate SU
Deutsche Bank AG DE0003933263 59,688,700.00 European CorporateSubordinated Obligation
Deutsche Telekom AG XS0148956559 119,377,400.00 European Corporate SU
Diamond Offshore Drilling US25271CAC64 89,533,050.00 North America Corporate SU
Dover Corp. US260003AC29 119,377,400.00 North America Corporate SU
DR Horton Inc. US23331AAX72 119,377,400.00 North America Corporate SU
E.W. Scripps Company US811054AC92 119,377,400.00 North America Corporate SU
Eaton Corp. US278058AW21 119,377,400.00 North America Corporate SU
Electricite de France XS0162990229 119,377,400.00 European Corporate SU
Electrolux SE0001930538 119,377,400.00 European Corporate SU
Embarq Corp. US29078EAB11 119,377,400.00 North America Corporate SU
Enbridge Inc. US29250NAA37 119,377,400.00 North America Corporate SU
Exelon Corp. US30161NAA90 59,688,700.00 North America Corporate SU
Experian Finance PLC XS0162820228 59,688,700.00 European Corporate SU
Exxon Mobil Corp. US607059AT90 119,377,400.00 North America Corporate SU
FedEx Corp. US31428XAF33 119,377,400.00 North America Corporate SU
Financial Security Assurance Inc. XS0112914907 59,688,700.00North America Corporate - Monoline
SU
First Data Corp. US319963AH75 59,688,700.00 North America Corporate SU
Fortune Brands, Inc. US349631AF84 119,377,400.00 North America Corporate SU
France Telecom FR0000471948 119,377,400.00 European Corporate SU
Freescale Semiconductor US35687MAM91 119,377,400.00North American Corporate - No Restructuring
SU
GATX Corp. US36804PAA49 119,377,400.00 North America Corporate SU
General Electric US369604AY90 119,377,400.00 North America Corporate SU
General Electric Capital Corp. US36962GYY42 119,377,400.00 North America Corporate SU
Gillette Company XS0093097219 119,377,400.00 North America Corporate SU
Glencore International AG XS0202202957 119,377,400.00 European Corporate SU
GMAC LLC US370425SE16 119,377,400.00 North America Corporate SU
Goldman Sachs Group Inc. US38141GBU76 119,377,400.00 North America Corporate SU
Harrah's Operating Co Inc. US413627AU44 59,688,700.00 North America Corporate SU
Hartford Financial Services Corp US416515AM67 119,377,400.00 North America Corporate SU
Hewlett-Packard Co. US428236AG84 119,377,400.00 North America Corporate SU
Home Depot Inc. US437076AL65 59,688,700.00 North America Corporate SU
Honeywell International Inc. US438516AR73 119,377,400.00 North America Corporate SU
13�
Reference EntityReference Obligation
Floating Rate Payer Calculation Amount 3/20/2014
RegionReference Entity Type
Host Hotels and Resorts US44108EAS72 59,688,700.00North American Corporate - No Restructuring
SU
HSBC Holdings Plc US404280AA78 119,377,400.00 European Corporate SU
Hutchison Whampoa Ltd USG4672QAA25 29,844,350.00 Asian Corporate SU
International Business Machines Corporation
US459200BA86 119,377,400.00 North America Corporate SU
International Lease Finance Corp. US45974VZU50 119,377,400.00 North America Corporate SU
iStar Financial Inc. US45031UAB70 119,377,400.00 North America Corporate SU
Johnson Controls Inc. US478366AG24 59,688,700.00 North America Corporate SU
JP Morgan Chase & Co. US46625HAJ95 119,377,400.00 North America CorporateSubordinated Obligation
JSC Gazprom XS0191754729 119,377,400.00 Gazprom SU
K. Hovnanian Enterprises, Inc. US442488AQ54 59,688,700.00 North America Corporate SU
KB Home US48666KAH23 119,377,400.00 North America Corporate SU
Kinder Morgan Energy Partners Lp US494550AH91 119,377,400.00 North America Corporate SU
KONINKLIJKE DSM NV XS0235117891 119,377,400.00 European Corporate SU
Koninklijke Philips Electronics NV XS0129477633 119,377,400.00 European Corporate SU
Lennar Corp. US526057AW40 59,688,700.00 North America Corporate SU
Lowe's Companies, Inc. US548661CA38 119,377,400.00 North America Corporate SU
Masco Corp. US574599AX44 119,377,400.00 North America Corporate SU
MBIA Inc. US55262CAF77 119,377,400.00 North America Corporate SU
MetLife, Inc. US59156RAN89 119,377,400.00 North America Corporate SU
MGM MIRAGE US552953AG66 119,377,400.00North American Corporate - No Restructuring
SU
Mohawk Industries US608190AF11 59,688,700.00 North America Corporate SU
Morgan Stanley US617446HC69 119,377,400.00 North America Corporate SU
Nabors Industries Inc. US629568AH92 119,377,400.00 North America Corporate SU
National Rural Util Coop Fin US637432CT02 89,533,050.00 North America Corporate SU
New York Life Insurance Company US64952GAE89 119,377,400.00 North America Corporate SU
Norske Skogindustrier ASA USR80036AN77 89,533,050.00 European Corporate SU
Occidental Petroleum Corp. US674599BV68 119,377,400.00 North America Corporate SU
Pearson Plc XS0102793642 119,377,400.00 European Corporate SU
Petroleos Mexicanos US706451BD26 119,377,400.00 Latin American Corporate SU
Pitney Bowes US724479AF75 119,377,400.00 North America Corporate SU
PPG Industries, Inc. US693506AY35 119,377,400.00 North America Corporate SU
Progressive Corp. US743315AK92 119,377,400.00 North America Corporate SU
Prologis US743410AE29 119,377,400.00 North America Corporate SU
Prudential Financial Inc. US74432QAB14 89,533,050.00 North America Corporate SU
Pulte Homes Inc. US745867AQ44 59,688,700.00 North America Corporate SU
R.R. Donnelley & Sons Company US257867AM36 119,377,400.00 North America Corporate SU

13�
Forew
ord
Co
rpo
rate G
overn
ance R
epo
rtFu
nd
-Raisin
g
Activities
Gen
eral Op
erating
C
on
ditio
ns
Finan
cial Statu
sSp
ecial No
tesD
irectory o
f Head
O
ffice an
d B
ranch
es
Review
and
An
alysis of Fin
ancial
and
Op
erating
Resu
lts‚ and
Risk
Man
agem
ent
Intro
du
ction
Reference EntityReference Obligation
Floating Rate Payer Calculation Amount 3/20/2014
RegionReference Entity Type
Republic of South Africa US836205AJ33 119,377,400.00 Sovereign SU
Rock-Tenn Co. US772739AC24 119,377,400.00 North America Corporate SU
Ryder System Inc. US783549AZ16 119,377,400.00 North America Corporate SU
SABMiller US78572MAA36 119,377,400.00 European Corporate SU
Samsung Electronics Co. US796050AE22 119,377,400.00 Asian Corporate SU
Siemens AG XS0131224155 119,377,400.00 European Corporate SU
Simon Property Group LP US828807BW67 119,377,400.00 North America Corporate SU
Singapore elecommunications LTD USY79985AC46 119,377,400.00 Asian Corporate SU
SLM Corp. US78442FAB40 119,377,400.00 North America Corporate SU
Southwest Airlines US844741AW80 59,688,700.00 North America Corporate SU
Sprint Nextel Corporation US852061AD21 119,377,400.00 North America Corporate SU
Stanley Works US854616AJ88 119,377,400.00 North America Corporate SU
Station Casinos Inc. US857689AV53 59,688,700.00North American Corporate - No Restructuring
SU
Swiss Reinsurance Company CH0032254705 59,688,700.00 European CorporateSubordinated Obligation
Telefonica SA XS0241946630 119,377,400.00 European Corporate SU
Telefonos De Mexico, SA US879403AS24 119,377,400.00 Latin American Corporate SU
Telenor ASA XS0158765064 119,377,400.00 European Corporate SU
Telstra Corp Ltd XS0131858838 119,377,400.00 Australia Corporate SU
Tesoro Corporation US881609AS06 119,377,400.00North American Corporate - No Restructuring
SU
Textron Financial Corp. US88319QG564 119,377,400.00 North America Corporate SU
Time Warner Inc. US887317AC95 119,377,400.00 North America Corporate SU
Toll Brothers Inc. US88947EAA82 119,377,400.00 North America Corporate SU
TransAlta Corp US89346DAB38 89,533,050.00 North America Corporate SU
TransCanada Pipelines Limited US89352HAA77 119,377,400.00 North America Corporate SU
Unilever NV US904764AG27 119,377,400.00 European Corporate SU
UPM-Kymmene Oy XS0142044824 59,688,700.00 European Corporate SU
VF Corp US918204AN83 119,377,400.00 North America Corporate SU
Vodafone Group Plc XS0169888558 119,377,400.00 European Corporate SU
Volvo AB XS0157960815 119,377,400.00 European Corporate SU
Vulcan Materials Co. US929160AF66 89,533,050.00 North America Corporate SU
Wal-Mart Stores, Inc. XS0121617517 119,377,400.00 North America Corporate SU
Wells Fargo & Company US949746CR04 119,377,400.00 North America CorporateSubordinated Obligation
Weyerhaeuser Co. US962166AS33 119,377,400.00 North America Corporate SU
Wisconsin Energy Corp. US976657AC03 119,377,400.00 North America Corporate SU
XL Capital Ltd US98372PAF53 119,377,400.00 North America Corporate SU
Total 141 14,564,042,800.00

13�
Table 4. The asset pool of the E.Sun Bank's 2007-1 special-purpose securitized bond-asset trust has remaining NT Dollar
bond principal in the amount of NT$1.5 billion and US Dollar bond capital of NT$149.375 million. Details are
covered in the following chart:
Case Details of Asset Group Assets Class Currency/Unit
Bond Principal Outstanding
1 First domestic secured ordinary corporate bonds issued by the Taiwan Mask Corp. in 2004; C tranche Senior NT$/dollar 200,000,000
2 First issuance of unsecured subordinated corporate bonds by the Chinatrust Financial Holding in 2003; E tranche Subordinated NT$/dollar 500,000,000
3 First issuance of unsecured ordinary corporate bonds by Wanhai Lines in 2004; A tranche Senior NT$/dollar 300,000,000
4 First issuance of financial bonds by Hua Nan Commercian Bank in 2004, first period; 1B tranche Senior NT$/dollar 300,000,000
5 First issuance of financial bonds by Hua Nan Commercial Bank in 2004, first period; 1F tranche Senior NT$/dollar 200,000,000
6 Triaxx Funding High Grade I, Ltd. Class C US$/dollar 149,375,000
Dec. 31, 2008 Unit: NT$1,000
Name of Instrument Currency Founding
AgencyMaturity
DateCoupon
RateCredit Rating
Role Played Amount Attachment
PointContent of Asset Pool
Beneficiary securities for securitized receivables of Chi Mei Optoelectronics
NT DollarChi Mei Optoelectronics
2011/10/5 1.6827% twA-2Liquidity financing provider
2,000,000 46.68%Chi Mei Optoelectronics receivables
(3) Operational Risk Management System and Accrued Capital
a. Operational Risk Management System
Fiscal Year 2008
Items Contents
I. Operational Risk Management Strategies and Procedures
1. The Bank has established multi-level authorization rules and reporting procedures, in its business rules and operating manuals, in regard to bank customers, products and business activities, business sources, sales channels, and transaction complexity and volume, and in consideration of potential risk. In its SOP the bank also stipulates that in their review work officers should pay attention to risk control, strengthen identification, emphasize potential risk, formulate evaluation procedures, and establish a frequency of risk monitoring on a regular basis.
2. The Auditing Office of the Board of Directors is the Bank's independent auditing unit, and it evaluates the effectiveness the design and implementation of internal controls on a regular basis in accordance with the stipulations on the risk management mechanism contained in the"Implementation Rules for Bank Internal Audit and Internal Control System."This risk management mechanism broadly encompasses business characteristics, personnel, systems, and the operating environment. The Bank has hired CPAs to audit (or review) internal control systems related to its financial statements on a regular basis.
II. Organizational Framework of Operational Risk Management
1. The BOT's organizational framework of risk management includes the Board of Directors, Risk Management Committee, Department of Credit Management, units in charge of business, other units and all levels of personnel.
2. The Bank's operational risk management rules stipulate the responsibilities of the Board of Directors, high-ranking officers, and auditors in regard to operational risk management so as to establish a complete operational risk management mechanism for the Bank.
III. Scope and Characteristics of the Operational Risk Reporting and Measurement System
The Risk Control Committee meets regularly and submits reports on bank-wide risk management monitoring.The reports encompass the compilation, filing, and analysis of operational risk losses; the establishment of a standard operating procedure (SOP) zone within the Bank's global information website for enquiry by bank staff; and risk-culture education, all designed to reduce operating risk.
IV. Operational risk hedging or risk mitigation policy, and strategies and procedures for monitoring the continuing effectiveness of risk hedging and mitigation instruments.
The Bank currently uses the basic indicator approach for operational risk capital requirement, and does not use the risk mitigation technique. The Bank hedges against operational risk by taking out insurance for its transfer in accordance to its accumulated experience and operating procedures, as well as in consideration of various types of business cost/effectiveness analysis. The Bank currently adopts the transfer of risk through employee fidelity insurance, business premises property insurance, shipping property insurance, and other insurance.At the same time, operational risk is reduced through the outsourcing of some operations under the "Rules for the Outsourcing of BOT Internal Operating Systems and Procedures."
V. Method of Legal Capital Allocation Basic Indicator Approach
Bank Secured Securitized Product Guarantee Institution or Amount of Liquidity Funding Provided

13�
Forew
ord
Co
rpo
rate G
overn
ance R
epo
rtFu
nd
-Raisin
g
Activities
Gen
eral Op
erating
C
on
ditio
ns
Finan
cial Statu
sSp
ecial No
tesD
irectory o
f Head
O
ffice an
d B
ranch
es
Review
and
An
alysis of Fin
ancial
and
Op
erating
Resu
lts‚ and
Risk
Man
agem
ent
Intro
du
ction
b. Operational Risk Management Accrued Capital
Dec. 31, 2008 Unit: NT$1,000
Fiscal Year Operating gross profit Accrued Capital
2006 20,083,018
2007 25,743,144
2008 25,862,674
Total 71,688,836 3,584,442
Note: Allowances for operational risk as of March 31, 2009 were the same as those on Dec. 31, 2008.
(4) Market Risk Management System and Accrued Capital
a. Market Risk Management System
Fiscal Year 2008
Items Contents
I. Market Risk Management Strategies and Procedures
To establish and effectively implement a healthy market risk management mechanism, lower market risk, and achieve operating and management targets, market risk management criteria and related management rules are established in accordance with the BOT's risk management policy, and the risks associated with different investment businesses are identified, evaluated, measured, monitored, communicated, and reported.
II. Organizational Framework of Market Risk Management
The BOT's organizational framework of risk management includes the Board of Directors, Risk Management Committee, Department of Credit Management, units in charge of business, trading units and their traders, risk control personnel, and back-office personnel.
III. Scope and Characteristics of Market Risk Reporting and Measurement
Market risk, also known as price risk, refers to the risk of fluctuations in the value of financial products or investment portfolios caused by future changes in market prices (market interest rates, exchange rates, prices of stocks and commodities), resulting in possible on- and off-balance-sheet losses or profit losses for the Bank. Monitoring encompasses all trading units and overall and individual trading procedures for different financial products, and includes changes in position, changes in profit and loss, trading models, and trading targets, all of which should be carried out in accordance with the Bank's quota limits, stop-loss, and over-limit disposition rules, and within authorization limits. To strengthen the Bank's risk control through quantitative systems, work is under way on the establishment of an internal-model-approach measuring system for market risk that conforms to the New Basel agreement.
IV. Market Risk Hedging and Mitigation Policy, and Strategies and Procedures for Monitoring the Continuing Effectiveness of Risk Mitigation Instruments
The Bank has established operating criteria for derivatives products, and internal control operating methods, in accordance with the"Directions for Banks Conducting Financial Derivatives Business"as promulgated by the Banking Bureau, and so as to strengthen risk control of trading units. For the market risk of derivatives packages, position is, in principle, calculated by decomposition.The Bank uses the following risk-hedging principles to hedge risk in trading in derivative financial products by trading units: (1) Reviews principal and loss quotas on a regular basis (2) Reverse-squaring trading for derivatives positions has been provided for, and can be used for the mutual offsetting of positions, which are listed as net amounts. (3) When trading units undertake trading in derivative products based on product or other profits, with the exception of credit derivatives they must, in principle, engage in pairs trading so as to transfer and reduce risk. (4) For products that do not admit of decomposition, positions should be covered in round lots, with no retained positions allowed.
V. Method of Legal Capital Allocation Standardized Approach
b. Market Risk Accrued Capital
Dec. 31, 2008
Risk Category Accrued Capital
Interest rate risk 1,006,357
Equity security risk 435,942
Foreign exchange risk 449,979
Commodity risk
Total 1,892,278
Unit: NT$1,000

140
(5) Liquidity Risk
The Bank has established an Assets and Liabilities Management Committee to maintain stable operations,
reinforce assets and liabilities management, and improve its assets and liabilities structure. The BOT president
serves as chairman of the committee, which is responsible for bank-wide liquidity position and risk-management
analysis, interest-rate risk analysis, and deposit structure review.
The Bank uses an Assets and Liabilities Management Information System under which the different items of
assets and liabilities are listed as interest rate sensitive assets or liabilities according to their nature. Changes in the
maturity gap and term structure of assets and liabilities are analyzed on a scheduled basis to provide a basis for
interest rate management and pricing, and capital utilization and structure are adjusted according to the capital
situation with the aim of lowering liquidity risk and enhancing income.
a. New Taiwan Dollars-Denominated Maturity Date Structure
Dec. 31, 2008
Items Total
Amounts by Time Remaining before Maturity
1-30 days 31-90 days 91-180 days 181 days-one year Over one year
Major inflows of matured funds
3,283,298,908 559,060,939 519,085,732 413,278,448 348,120,707 1,443,753,082
Major outflows of matured funds
3,611,239,759 410,912,286 411,965,424 424,200,921 937,159,046 1,427,002,082
Period gap (327,940,851) 148,148,653 107,120,308 (10,922,473) (589,038,339) 16,751,000
Note: The table includes only New Taiwan Dollar Amounts held in head office and the domestic branches, excluding foreign currencies.
Unit: NT$1,000
b. U.S. Dollors-Denominated Maturity Date Structure
Dec. 31, 2008
Items Total
Amounts by Time Remaining before Maturity
1-30 days 31-90 days 91-180 days 181 days -one year Over one year
Assets 12,374,295 4,817,199 3,640,140 1,491,537 1,327,151 1,098,268
Liabilities 12,342,139 5,845,428 3,288,559 1,369,376 1,540,068 298,708
Gap 32,156 (1,028,229) 351,581 122,161 (212,917) 799,560
Accumulated Gap
24,748,590 9,634,398 7,280,280 2,983,074 2,654,302 2,196,536
Note:The table includes assets and liabilities denominated in USD held in head office,the domestic branches and Offshore Banking Branch.
Unit: US $1,000
2.ImpactofChangesinMajorDomesticandOverseasPoliciesandLawsontheBank'sFinancialOperations,andCountermeasuresThe Bank will remain attentive to the influence of major government financial and economic policies, and will provide
appropriate responses in a timely fashion so as to lower the impact on its financial operations.
3.Impact ofTechnological and Industrial Changes on the Bank's Financial Operations, andCountermeasures(1) Influence of Changes in Technology, and Countermeasures
The rapid advance of information technology has changed the trading habits of customers and, in consequence, the
equipment and operating methods of banks have changed as well. The use of automated teller machines, telephone
banking, unmanned banks, Internet banks, and electronic banking allows customers to carry out all kinds of cash
withdrawals, funds transfer, and collections online and in real time. Besides enabling banks to reduce their operating
costs and improve their operating efficiency, this also enables them to use management information to achieve even
more effective management.
To strengthen loan risk management, the Bank has established quotas for the assumption of industry risk both by
industry and by business group, and for loans to the same corporate group.

141
Forew
ord
Co
rpo
rate G
overn
ance R
epo
rtFu
nd
-Raisin
g
Activities
Gen
eral Op
erating
C
on
ditio
ns
Finan
cial Statu
sSp
ecial No
tesD
irectory o
f Head
O
ffice an
d B
ranch
es
Review
and
An
alysis of Fin
ancial
and
Op
erating
Resu
lts‚ and
Risk
Man
agem
ent
Intro
du
ction
(2) Impact of Industrial Changes, and Countermeasures
The Bank holds key industry status and prospects seminars periodically, purchases industrial, economic, and
specialized databanks. In addition to these resources, employees can use the Bank's global information network to
maintain grasp of the latest industrial changes, enhance the quality of credit investigation and loans, and lower the
Bank's business risks.
4.ImpactontheBankofChangesintheBank'sImage,andCountermeasuresThe subprime mortgage crisis in the United States gave rise to huge losses in the finance industry beginning in the second half of 2007, and numerous financial institutions in the U.S. and Europe encountered a succession of financial difficulties. Stock markets crashed all over the world and market confidence wavered; and, in with the free flow of capital and large volume of mutual investment creating a highly linked international financial environment, Taiwan's financial market was also struck a heavy blow. Bank customers suffered severe losses and banks' images were sullied by suspicious.
As a state-owned bank, the Bank of Taiwan has always given full support to the government's fiscal and economic policies. It has also established a comprehensive risk-management mechanism and stable operation, and has won the long-term trust of the public. To build customers' confidence and trust in Taiwan's banking industry at a time of shrinking credit in the market, the BOT continued to play an important role in stabilizing the financial market and coordinating with the government's financial policy so as to provide strong backing for corporate and personal financing; in addition, the Bank expressed its moral courage and determination through integrity in operation, revising its operating principles as "Integrity, Care, Efficiency, Prudence" (prior to Jan. 22, 2009 the principles were "Concern, Efficiency, Innovation, Soundness") with the aim of pursuing the strongest assurance for customers' wealth and entrustment with a sincere service attitude and top priority on the Bank's commitment to protect the interests of its customers as it seeks to optimize its corporate value on the way to fulfillment of the vision of "deeply cultivating Taiwan finance while advancing into the international market."
5.ExpectedBenefitsandPotentialRisksofMergersandAcquisitions,andCountermeasures(None)
6.ExpectedBenefitsandPotentialRisksofBusinessLocationExpansionThe BOT enjoys outstanding credit, a broad and stable market base, a correspondent banking system that covers Taiwan and the world, and a fine management system. The expansion of business locations will not only increase the volume of the deposit, loan, and foreign exchange businesses, but will also offer customers more convenient services and establish a solid operating niche.
7.RisksArisingfromtheConcentrationofBusiness,andCountermeasuresThe Bank's main source of income is interest, and for this reason changes in interest rates have a relatively large
influence on the Bank's income. To reduce the risk caused by interest-rate fluctuations, the Bank will observe changes in
interest rates both continuously and closely, and will adjust its interest rates when necessary to improve the structure of
its assets and liabilities.
8.InfluenceandRisksPosedbyChangesinOperatingRightsThe BOT is currently a government-owned bank and the government is its only shareholder. The BOT became the core
member of the Taiwan Financial Holdings group on Jan. 1, 2008. Since the government holds 100% shares of Taiwan
Financial Holdings, there have been no changes in the BOT's operating rights.
9.CourtCasesPending(None)
10.OtherImportantRisks(None)
VII.CrisisManagementMechanismIn regard to latent or present crises, the Bank adopts a series of pre-event, mid-event, and post-event countermeasures.
The crisis management mechanism that has been established by the Bank includes the following:
1. A "BOT Emergency Response Manual."2. The "BOT Crisis Reporting Rules."3. A "BOT Operation Crisis Response Countermeasures."4. A "BOT Operations Non-Interruption Plan."5. Establishing an emergency reporting system for headquarters and branches.
VIII.OtherImportantMattersThe Taiwan Financial Holdings Co. was formally established on Jan. 1, 2008, with the Bank of Taiwan as its subsidiary.