retrocommissioning report building x city y, california · to serve as a standard form. ... hvac...
TRANSCRIPT

Retrocommissioning Report Building X City Y, California
Prepared with funding from
Utility By Portland Energy Conservation, Inc. 1400 SW 5th Avenue, Suite 700 Portland, OR 97201 In partnership with IMPORTANT NOTICE: This sample document is
provided for instructional purposes only. CCC is not rendering advice concerning any commission project or practices. This document is neither approved nor intended to serve as a standard form. The user of these documents should confer with qualified advisors with respect to its commissioning and other documentation.
Partner Final Report March 2002

TABLE OF CONTENTS
EXECUTIVE SUMMARY ................................................................................................ 1
Overview of Results...................................................................................................... 1 Measure Prioritization and Tracking ............................................................................... 2 Recommendations, Cost and Savings Summary Tables ................................................... 2 Findings And Implementation Plan Summary Table ........................................................ 4
INTRODUCTION .......................................................................................................... 5
METHODOLOGY........................................................................................................... 5
Investigation & Data Collection ..................................................................................... 5 Analysis of Data ........................................................................................................... 8 Implementation of Recommendations.......................................................................... 12 Verification of Energy Savings ..................................................................................... 12
BASELINE FACILITY DESCRIPTION ......................................................................... 13
General Information ................................................................................................... 13 Hvac Systems ............................................................................................................ 13 Electrical Systems....................................................................................................... 15 Operations & Maintenance Procedures......................................................................... 16 Energy Utilization ....................................................................................................... 16 End-Use Breakdown ................................................................................................... 17
FINDINGS, RECOMMENDATIONS & IMPLEMENTATION ......................................... 18
Detailed Findings........................................................................................................ 18
IMPLEMENTATION OF RECOMMENDATIONS .......................................................... 37
Implementation Plan .................................................................................................. 37
MEASUREMENT & VERIFICATION OF SAVINGS ...................................................... 38
Measurement & Verification Plan ................................................................................. 38 Measurement & Verification Results............................................................................. 39
MAINTENANCE OF SAVINGS .................................................................................... 43
Implementation Persistence ........................................................................................ 43 Benchmarking & Continuous Monitoring of Energy Use ................................................. 43 Energy Reduction Targeting........................................................................................ 43 Recommissioning ....................................................................................................... 43
APPENDICES ............................................................................................................. 44
Appendix A. Photos ................................................................................................... 45 Appendix B. Utility History Analysis Figures ................................................................. 49 Appendix C. Pre-retrofit Data Logging Trend Analysis Figures ...................................... 50 Appendix D. Pre-retrofit Monitored Average Daily Load Shapes .................................... 57 Appendix E. Post-retrofit Data Logging Trend Analysis Figures ..................................... 62 Appendix F. Retrocommissioning Plan......................................................................... 63 Appendix G. Savings and Cost Estimates..................................................................... 69
Portland Energy Conservation, Inc. (PECI) Page i

Building X – City Y, CA
Retrocommissioning Report Building X City Y, California
EXECUTIVE SUMMARY
OVERVIEW OF RESULTS
Portland Energy Conservation Incorporated (PECI) in conjunction with Partner and Utility) performed a retrocommissioning evaluation on the 125,000 SF Building X office facility in City Y, California. The retrocommissioning process involved a coordinated effort between PECI, Partner, and the building operating staff. Documents were provided for review, interviews and field investigations were conducted, building systems were monitored and analyzed, energy conservation measures were implemented by the owner, and these measures were monitored to verify savings. This report presents the results of these efforts. Retrocommissioning, or existing building commissioning, is an event in the life of a building that applies a systematic investigation process for improving and optimizing a building’s operation and maintenance. It is typically an independent process that focuses on the building’s energy using equipment such as the HVAC and other mechanical equipment, lighting equipment, and related controls. It may or may not emphasize bringing the building back to its original intended design specifications. In fact, via the process, the retrocommissioning team may find that the original specifications no longer apply. The process may result in recommendations for capital improvements, but its primary focus is to optimize the building systems via tune-up activities, improved operation and maintenance (O&M), and diagnostic testing. Details of the process used in this project are provided later in the report. The retrocommissioning process involved obtaining documentation about the facility equipment and its operation as well as making a site visit for further review of operating parameters and conditions with the maintenance staff. Selected systems were monitored with data loggers for a two-week period to trend system operation. Eight findings with associated energy savings were identified at the facility and four findings were recommended by PECI for implementation. Energy savings estimates were made for the significant findings where sufficient data was available and project scope allowed. An additional five measures were identified but not formally presented because the payback was too long, there was insufficient information, or the measure was not energy related. PECI then met with the Building X management staff to discuss and review all of the findings, and the management decided to implement three of the measures. PECI offered limited assistance during implementation, but Building X took full responsibility for contracting out the implementation or performing the work themselves. The measures and findings selected by Building X for implementation are summarized below.
Portland Energy Conservation, Inc. (PECI) Page 1 © 2005, Portland Energy Conservation, Inc. (PECI). All rights reserved.

B
Portland© 2005,
uilding X – City Y, CA
Energy Conservation, Inc. (PECI) Page 2 Portland Energy Conservation, Inc. (PECI). All rights reserved.
RECOMMENDATIONS, COST AND SAVINGS SUMMARY TABLES
Each measure was originally prioritized by PECI on a scale of 1 to 3 to assists the owner in determining the order in which to implement the findings. A ranking of “1” represents a high priority finding, “2” represents a medium priority finding, and “3” represents a low priority finding. The ranking is subjective, but based on an overall evaluation with consideration given to the criteria of energy savings, project cost, likelihood of being implemented, indoor air quality, safety, and comfort. The table was also used to track measure implementation. Refer to the following “Finding and Implementation Plan Summary” table for details.
MEASURE PRIORITIZATION AND TRACKING
Error! Not a valid link.
Other Measures Considered. Five measures were identified but not formally presented because the payback was too long, there was insufficient information, or the measure was not energy related.
Total Project Summary. The combined measures implemented by the owner result in total annual savings of 237,937 kWh and a utility cost savings of $20,062, which correspond to a 9.9% reduction in annual energy usage and 4.7% reduction in annual utility costs. The calculated savings have been reduced by 5% to account for minor interactive effects between measures that reduce the savings from one measure when another is implemented. The total cost to implement all of the measures was $14,393, resulting in an overall simple payback of 0.7 years. Refer to the following “Savings Summary Projection” table and “Energy Usage and Cost Index Comparison Projection” graph for details of the total project savings and costs.
Capital Improvement Measures. One combined O&M/Capital Improvement measure was implemented to bring the building back to its original design intent. The total estimated annual savings for this measure is 29,450 kWh and $3,800 in annual utility costs. Estimates of energy savings have been reduced by 5% to account for minor interactive effects between measures that reduce the savings from one measure when another is implemented. The total cost to implement this measure was $14,150 based on contractor invoice. This results in a simple payback of 3.7 years.
Operation and Maintenance Measures. Four operation and maintenance (O&M) measures were identified but only two measures were selected by the owner for implementation. However, since energy savings for one of these O&M measures directly impacts the savings associated with the selected capital improvement measure, overall energy savings for the combined O&M/Capital Improvement measure is presented in the section below. Therefore, the total estimated annual savings for the O&M measure implemented by the owner are 208,487 kWh and $16,262 in annual utility costs. Estimates of energy savings have been reduced by 5% to account for minor interactive effects between measures that reduce the savings from one measure when another is implemented. The total cost to implement this measure was $243 based on contractor invoice. This results in approximately a month payback.
Building X

Building X – City Y, CA
Portland Energy Conservation, Inc. (PECI) Page 3 © 2005, Portland Energy Conservation, Inc. (PECI). All rights reserved.
Error! Not a valid link.
Building X

Building
Portland Energy Conservation, Inc© 2005, Por
X – City Y, CA
. (PECI) Page 4 tland Energy Conservation, Inc. (PECI). All rights reserved.
Date:
Status
ID Finding Recommendation Name1 Package2 Priority3
(C=Complete)(P=In Process)(F=$ Needed)
(E= Need Eval.)(N=Not Doing)
Date Started
Date Complete
01 CSI scheduling and control sequences need to be optomized Scheduling and Programming Improvements 1 1 C 1-Feb-02 28-Feb-0202 Supply fans cycle on and off during unoccupied hours Rewire Heat Pump Supply Fans 1 1 N03 Single speed fans short cycle to meet cooling load Install Variable Frequency Drives on Fluid Cooler Fans* 2 3 N04 Single speed fans short cycle to meet cooling load Install Two-speed Motors on Fluid Cooler Fans* 2 3 Note 405 Water loop temperature and fan control should be optimized Reduce Condenser Water Loop Temperature* 1 1 Note 406 Water loop temperature and fan control should be optimized Reduce Condenser Water Loop Temperature and Install Two-speed Motors* 2 3 C 1-Feb-02 28-Feb-0207 Water loop temperature should be optimized Reduce Condenser Water Loop Temperature and Install VFDs* 2 3 N08 West loop pump is circulating too much water Trim West Loop Pump Impellers 1 1 N09 Heat pump have never been tuned-up Tune-up Heat Pumps 3 3 N10 East loop pump may be circulating too much water Modify East Loop Pump Flow Rate 3 2 N11 Fluid cooler chemical feed system may be malfunctioning Inspect Fluid Cooler Chemical Treatment 3 1 Note 512 Convert water loops to variable volume systems Install Automatic Two-way Control Valves on each Heat Pump 3 3 N13 Make-up water flow is unrestricted Close Water Loop Make-up Line Valve 3 1 N
1. Recommendations with an (*) in the title are mutually exclusive with other measures2. Package identification: 1 - low cost measure, 2 - capital improvement measure, 3 - other measure considered, 4 - non-energy saving measure3. Priority ratings: 1 - high priority, 2 - Medium priority, 3 - low priority4. Both two-speed motors and condenser water reset measures were implemented. Measure 06 evaluated the interaction between the two measures.5. Facility personnel were aware of the situation and fixed the problem
FINDING AND IMPLEMENTATION PLAN SUMMARY
Notes:
FINDINGS AND IMPLEMENTATION PLAN SUMMARY TABLE

Building X – City Y, CA
INTRODUCTION This report presents the final results of the retrocommissioning study performed on Building X, an office facility located in City Y, California. This retrocommissioning study was completed as part of a retrocommissioning program funded by Utility. Portland Energy Conservation Inc. (PECI) and Partner completed the retrocommissioning study. Retrocommissioning is an excellent way to obtain energy savings through low cost improvements that optimize building systems so that they operate efficiently and effectively. On average around the country, commissioning existing buildings reduces a building’s energy costs by 5% to 20%. The payback for investment in low cost opportunities typically ranges from a few months to two years. In addition, retrocommissioning can improve occupant comfort, reduce indoor air quality problems and reduce operations and maintenance costs. The retrocommissioning process also identifies potential capital intensive improvements that can be made at the facility to further reduce energy usage and utility costs. Often, the savings associated with the low cost improvements can be used to “buy down” the implementation costs associated with the capital-intensive measures and make the overall package more economically viable.
METHODOLOGY Commissioning of existing buildings, or “retrocommissioning” is a systematic process applied to existing buildings to identify and implement operational and maintenance (O&M) improvements and to ensure building system functionality. The primary goal of retrocommissioning is to optimize equipment and system operation so that they function together efficiently and effectively, although retrocommissioning may also result in recommended capital improvements. The basic process includes four fundamental procedures:
Investigation and data collection
Analysis of data
Implementation of recommendations
Verification of energy savings
Each of these procedures is discussed in detail below.
INVESTIGATION & DATA COLLECTION
The retrocommissioning process begins by collecting and evaluating data pertaining to facility equipment and current operation. The primary tasks for this project are outlined below.
Portland Energy Conservation, Inc. (PECI) Page 5 © 2005, Portland Energy Conservation, Inc. (PECI). All rights reserved.

Building X – City Y, CA
Documentation Review The investigative process consists of first obtaining as much building documentation as possible to allow PECI and Partner staff to become familiar with the building and its systems. Equipment lists, control program code, system schematic drawings and 12 months of utility billing data are generally requested. For the current project, the billing history and partial mechanical plans were available for review prior to the site visit.
Initial Site Assessment The next step was to conduct an initial site assessment. The initial site assessment consisted of spending two days in the building during November 2001 interviewing staff, reviewing control sequences and equipment operating schedules programmed into the central building automation system (BAS), inspecting and testing equipment, and performing an analysis of the site-gathered data. The assessment identified several significant findings, as well as pin pointing areas for monitoring and testing.
Manual Testing PECI executed manual test procedures during the site visit to determine system operation – for example manipulating thermostat settings during unoccupied periods. It was noticed during the site visit that one of the heat pump supply fans continued to operate even when the BAS control schedule commanded the unit to be off. This indicates that the heat pump may be wired incorrectly and will not achieve the desired control during unoccupied hours. In order to verify the pervasiveness of this control problem, the monitoring plan included trending the heat pump compressor and supply fan independently on several units.
Short-term Diagnostic Testing Through Monitoring/Data Logging Short-term diagnostic testing utilizes the application of specialized software and hardware tools to gather and analyze data for the evaluation of the performance of building energy systems. Short-term diagnostic testing results were applied to system retrocommissioning, the calibration of building simulation models, and system tune-ups. Partner’s ENFORMA® Portable Diagnostic Solutions is a set of tools used to organize and standardize the diagnostic testing process. The first step in the application of short-term diagnostic testing was the development of a monitoring plan. The plan contains goals, objectives, analysis techniques, and instrumentation requirements. The monitoring plan for this building was developed with information gleaned from the building operators and existing documentation such as operation and maintenance manuals, as-built plans, and sequences of operation. The original building walk-through performed in early November 2001 served to initially identify operation and maintenance opportunities and decide which equipment and systems will be monitored in order to ascertain actual system operation and detect additional opportunities. The building’s heating and cooling needs are served by approximately 175 water source heat pumps and the heat pumps are separated into east and west circulation loops. Each loop consists of an evaporative fluid cooler, a natural gas-fired hot water boiler, and two main loop pumps operating in a lead/lag configuration (i.e. only one pump per loop operates at a time).
Portland Energy Conservation, Inc. (PECI) Page 6 © 2005, Portland Energy Conservation, Inc. (PECI). All rights reserved.
Building X – City Y, CA
Based on utility data and building operator information, it was verified that the heating load on the building never required the boilers to operate. Therefore the boilers were not monitored. The following central plant equipment and data points were monitored:
Amperage for the east loop pump and west loop pump • • • •
Amperage for the fan and spray pump on each loop’s evaporative fluid cooler East and west loop supply and return water temperatures Ambient air temperature
There are approximately 25 heat pumps per floor. A selection of heat pumps was chosen from the 3rd, 5th, and 6th floors for monitoring. Total heat pump amperage (supply fan and compressor) was measured at the high voltage breaker panels, allowing multiple units to be easily monitored. This technique allowed operating data to be collected on approximately 35% of the building’s units. In addition, four heat pumps (one on each of the 1st, 3rd, 4th, 7th floors) were monitored in detail to provide insight into unit performance and zone load requirements. The following points were measured for each of these units: (1) supply air temperature; (2) return air temperature; (3) compressor amperage and (4) supply fan amperage. All of the pre-retrofit monitored data was used to establish existing equipment operating loads and schedules, estimating existing energy consumption, and providing insight into how each piece of equipment interacts with each other and with respect to environmental conditions. Data was collected using Partner’s MicroDataLogger, a battery powered, four-channel data logger that records time-series data using a variety of interchangeable sensors and transducers. The collection period consisted of two weeks, beginning at midnight on November 16th, 2001, and ending at midnight on November 29th, 2001. Spot measurements of amperage, voltage, power, and power factor were collected for each piece of equipment and each panel circuit monitored. These spot measurements are used to convert monitored current data (A) into power data (kW) during the analysis process, as well as calibrate the amperage values measured by the current transformers. The ENFORMA system was used to create an instrumentation plan and to initialize the data loggers. Table 1 lists the pre-retrofit monitored data points.
Portland Energy Conservation, Inc. (PECI) Page 7 © 2005, Portland Energy Conservation, Inc. (PECI). All rights reserved.
Building X – City Y, CA
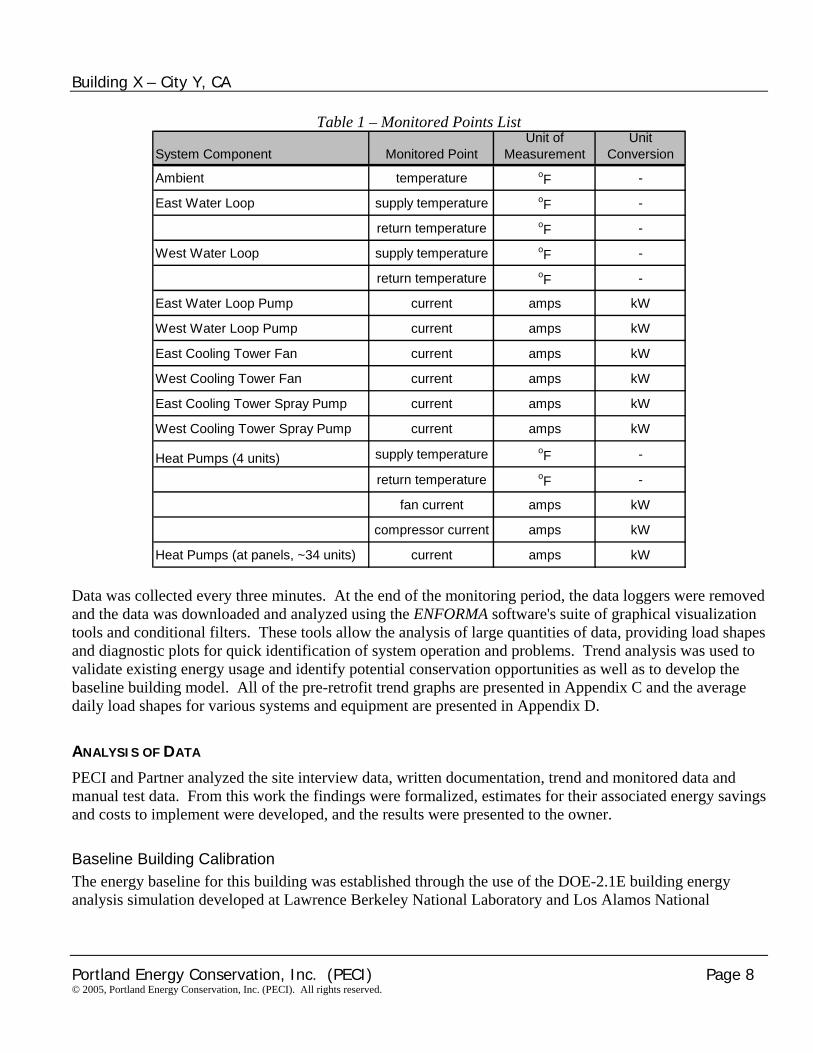
Table 1 – Monitored Points List
System Component Monitored PointUnit of
MeasurementUnit
Conversion
Ambient temperature oF -
East Water Loop supply temperature oF -
return temperature oF -
West Water Loop supply temperature oF -
return temperature oF -
East Water Loop Pump current amps kW
West Water Loop Pump current amps kW
East Cooling Tower Fan current amps kW
West Cooling Tower Fan current amps kW
East Cooling Tower Spray Pump current amps kW
West Cooling Tower Spray Pump current amps kW
Heat Pumps (4 units) supply temperature oF -
return temperature oF -
fan current amps kW
compressor current amps kW
Heat Pumps (at panels, ~34 units) current amps kW Data was collected every three minutes. At the end of the monitoring period, the data loggers were removed and the data was downloaded and analyzed using the ENFORMA software's suite of graphical visualization tools and conditional filters. These tools allow the analysis of large quantities of data, providing load shapes and diagnostic plots for quick identification of system operation and problems. Trend analysis was used to validate existing energy usage and identify potential conservation opportunities as well as to develop the baseline building model. All of the pre-retrofit trend graphs are presented in Appendix C and the average daily load shapes for various systems and equipment are presented in Appendix D.
ANALYSIS OF DATA
PECI and Partner analyzed the site interview data, written documentation, trend and monitored data and manual test data. From this work the findings were formalized, estimates for their associated energy savings and costs to implement were developed, and the results were presented to the owner.
Baseline Building Calibration The energy baseline for this building was established through the use of the DOE-2.1E building energy analysis simulation developed at Lawrence Berkeley National Laboratory and Los Alamos National
Portland Energy Conservation, Inc. (PECI) Page 8 © 2005, Portland Energy Conservation, Inc. (PECI). All rights reserved.

Building X – City Y, CA
Laboratory. It is the most accurate and well-documented energy-modeling program currently available in the United States. DOE-2.1E calculates hour-by-hour building energy consumption over an entire year (8,760 hours) using hourly climate data for the location under consideration. Input to DOE-2.1E consists of a detailed description of the building being analyzed including hourly scheduling of occupants, lighting, equipment, and thermostat settings. DOE-2.1E provides accurate simulation of such building features as shading, fenestration, interior building mass, envelope building mass, and the dynamic response of differing heating and air conditioning system types and control strategies. DOE-2.1E also contains a dynamic daylighting model to assess the influence of daylighting on thermal and electric lighting demands. The DOE-2.1E simulation process begins by developing a baseline model of the building based on building plans and specifications as well as through discussions with the building operators, occupants, and maintenance personnel. Once the set points, load shapes, and schedules are input, the model is then run with climate data corresponding to this geographic location (City Y, CA). At this point, the model results are compared to the actual monthly energy usage obtained from energy bills. Correlation of electrical consumption and demand are determined. Typically, if there are discrepancies larger than 10% for any month, further tuning of the model is performed. Plots of the monthly electrical consumption and demand predicted by the baseline model verses the actual billing data are presented in Figure 1 and Figure 2, respectively.
Building X Monthly Electric Consumption
Figure 1 - Monthly Electrical Energy Consumption, Baseline Model verses Billing Data
Portland Energy Conservation, Inc. (PECI) Page 9 © 2005, Portland Energy Conservation, Inc. (PECI). All rights reserved.

Building X – City Y, CA
Building X Monthly Electric Demand
Figure 2 - Monthly Electrical Demand, Baseline Model verses Billing Data
As we can see from the preceding graphs, the DOE-2 model reasonably tracks the actual energy and demand usage profiles for the building. Since DOE-2 uses historic weather data in its calculations, minor differences between the model and actual consumption can most likely be attributed to local weather anomalies occurring during the billing period. Once the DOE-2 baseline model is calibrated, parametric analyses are performed by making changes to the model corresponding to energy conservation measures identified during the building walk-through audit and from analysis of the monitored data. These parametric analyses result in predicted utility consumption savings, and are ultimately used to evaluate the best combination of energy conservation alternatives through further economic analysis of the individual and combined ECMs.
Energy Use Analysis The calibrated DOE-2 baseline building model was also used to determine the breakdown of existing energy usage for various pieces of equipment in the facility (end-use profile) and the overall energy usage per square foot (energy use index). The end-use profile allows the user to see where all of the energy is being used in the facility and where the greatest opportunities for energy conservation exist. The energy use index can be used to compare energy usage in the existing facility against similar building types under similar weather conditions. For example, multiple office facilities in similar climates can be compared to each other and the ones with the highest energy use per square foot may have greater opportunities for energy
Portland Energy Conservation, Inc. (PECI) Page 10 © 2005, Portland Energy Conservation, Inc. (PECI). All rights reserved.
Building X – City Y, CA
conservation. Refer to the Baseline Facility Description section for detailed discussion of existing energy usage at the facility.
Energy Savings Calculations Energy savings can be calculated in a variety of ways. For simple measures, customized spreadsheets based on standard engineering practices and rules of thumb can be used to estimate savings. For the evaluation of more complex systems and to account for equipment interactions, a simulation program calculating energy usage on an hourly basis was used. For this project, both spreadsheets and DOE2.1E were used to estimate energy savings. The calibrated building model was used to establish baseline energy consumption and information gathered during the site visit was used to validate the energy savings calculations. Cost savings are generally calculated using the average unit cost per utility. For example, the average cost of electricity is calculated by dividing the total monthly cost, which includes demand costs and taxes, by the monthly consumption. However, some measures may not achieve any demand savings or may only effect off-peak demand usage, therefore these measures cannot use the average electricity cost described above to estimate cost savings. In addition, the energy commodity charge fluctuates from month to month and varies based on time of use. The DOE-2 simulation model used the extensive time-of-use rate structure to estimate cost savings, however spreadsheet calculations utilized either an average cost $0.078/kWh when no demand savings are available, or $0.1211/kWh when demand savings could be claimed. Electricity commodity charges in California have lowered significantly over the past 6 months and appear to have stabilized. Therefore the average energy costs (both with and without demand costs) are based on the average for the past 5 months, rather than including the extremely high rates from last summer. All costs include appropriate taxes.
Project Costs Preliminary implementation costs are estimated for each measure based on a variety of methods – i.e. contractor budgetary cost estimates, R.S. Means cost estimation guidebooks, manufacturer price lists, etc. The cost projections assume that facility staff will complete the installation or be available to assist a contractor with the implementation. Costs include materials, labor and taxes, as well as contractor’s industry-standard overhead and profit mark-up, engineering design and construction-phase service fees, contingencies, and project management fees, if applicable. However, measurement and verification (M&V) costs, performance bond costs, and audit report costs have not been included, nor have costs associated with development of design documents and specifications that may be required to successfully engineer and implement some capital-intensive projects.
Measure Selection Energy and cost savings and implementation costs were first determined for each measure on an individual basis. Some measures are calculated using spreadsheets while others were calculated using the DOE-2 simulation program. Energy savings for individual measures calculated using DOE-2 were also run together as a package to account for the interaction between the measures. All measures are then entered into a summary spreadsheet and prioritized based on payback. PECI then recommends specific measures for installation at the facility and the spreadsheet totals energy savings, cost savings, and implementation cost for only these measures. The total energy and cost savings for these measures are then de-rated by a factor
Portland Energy Conservation, Inc. (PECI) Page 11 © 2005, Portland Energy Conservation, Inc. (PECI). All rights reserved.
Building X – City Y, CA
of 5% to account for minor interactive effects between measures that reduce the savings from one measure when another is implemented. There are various reasons for not recommending a measure. For example, in some cases, measures are mutually exclusive with others and a selection must be made. Spreadsheets and model simulation information for all measures with energy saving calculations can be found in Appendix G – Savings and Cost Estimates.
IMPLEMENTATION OF RECOMMENDATIONS
PECI presented an interim report to the owner describing all of the findings identified for the facility and which measures PECI recommended for implementation. The owner reviewed the report with PECI and selected which measures were to be implemented. The owner performed as much work as possible using in-house staff and hired outside contractors to complete the work when necessary. Implementation cost for each measure in the final report has been revised using actual installation costs based on contractor invoices.
VERIFICATION OF ENERGY SAVINGS
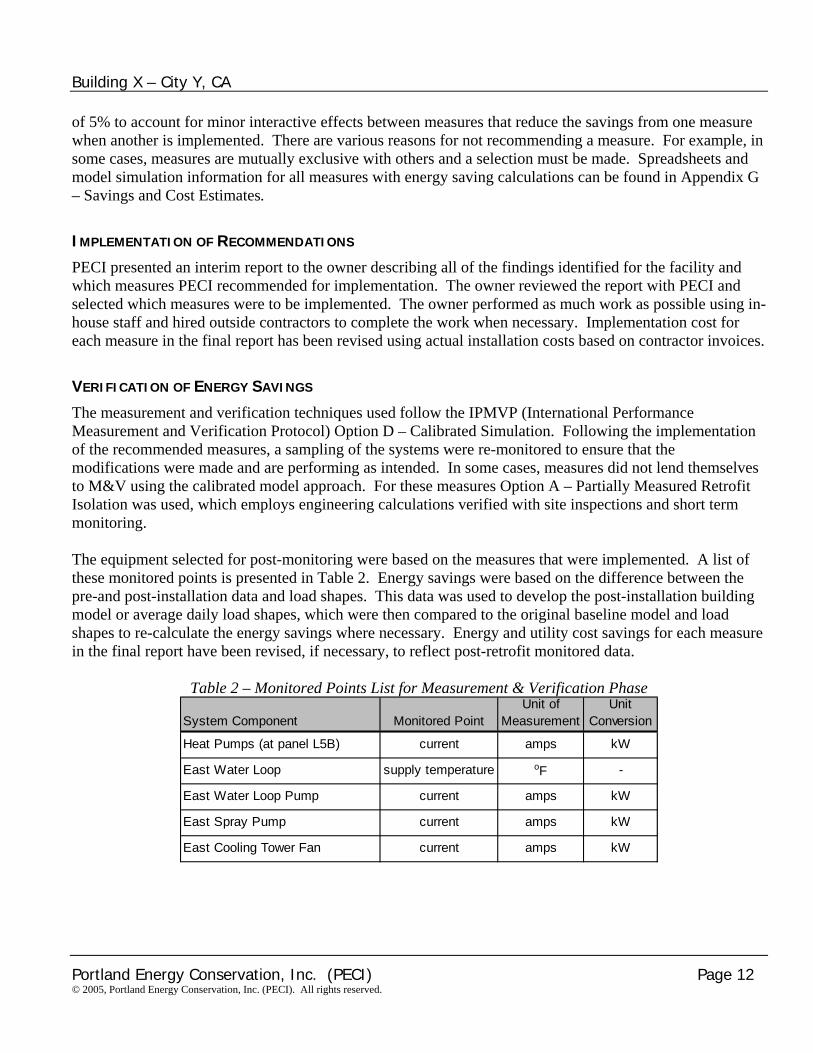
The measurement and verification techniques used follow the IPMVP (International Performance Measurement and Verification Protocol) Option D – Calibrated Simulation. Following the implementation of the recommended measures, a sampling of the systems were re-monitored to ensure that the modifications were made and are performing as intended. In some cases, measures did not lend themselves to M&V using the calibrated model approach. For these measures Option A – Partially Measured Retrofit Isolation was used, which employs engineering calculations verified with site inspections and short term monitoring. The equipment selected for post-monitoring were based on the measures that were implemented. A list of these monitored points is presented in Table 2. Energy savings were based on the difference between the pre-and post-installation data and load shapes. This data was used to develop the post-installation building model or average daily load shapes, which were then compared to the original baseline model and load shapes to re-calculate the energy savings where necessary. Energy and utility cost savings for each measure in the final report have been revised, if necessary, to reflect post-retrofit monitored data.
Table 2 – Monitored Points List for Measurement & Verification Phase
System Component Monitored PointUnit of
MeasurementUnit
Conversion
Heat Pumps (at panel L5B) current amps kW
East Water Loop supply temperature oF -
East Water Loop Pump current amps kW
East Spray Pump current amps kW
East Cooling Tower Fan current amps kW
Portland Energy Conservation, Inc. (PECI) Page 12 © 2005, Portland Energy Conservation, Inc. (PECI). All rights reserved.

Building X – City Y, CA
BASELINE FACILITY DESCRIPTION
GENERAL INFORMATION
Building X office building is a 125,000 square foot, seven-story facility. The building was constructed in 1983, and is made up of 85 different tenants, with 50 stand-alone and 35 executive office suites, and a small deli on the 4th floor. The walls are primarily curtain walls with R-11 insulation, and the roof is concrete. The windows are single-pane glass with reflective properties and non-operable aluminum frames. General occupancy for the building is 7 AM to 5 PM Monday through Friday and partial occupancy on Saturdays from 8 AM to 12 PM. Typical daily occupancy is approximately 500 people, which includes a steady and transient populace. Building occupancy is estimated to be 20% on Saturdays. Tenant occupancy has been approximately 100% for the last few years.
HVAC SYSTEMS
The facility is served by a water-source heat pump system. A water-source heat pump system generally consists of individual heat pumps, central water loop circulation pumps, fluid coolers, and boilers. The general concept behind a water-source heat pump system is that each individual unit can provide heating or cooling as needed by the space by absorbing or rejecting heat, respectively through the circulation water loop. This system allows energy to be transferred from one part of a building to another if necessary. For example under certain weather conditions, the north end of a building may require heating while the south end may have a net cooling load. The heat rejected to the water loop by the units in cooling mode can be absorbed by the units in heating mode to satisfy space requirements. A fluid cooler is generally used to dissipate excess heat from the loop and a hot-water boiler is generally used to add heat to the loop if necessary. The water-source heat pump system for Building X is separated into two independent water loops: one serving the east side of the building; and one for the west side of the building. Each water loop system consists of individual heat pumps, two circulation pumps operating in a lead/lag configuration, an evaporative fluid cooler, and a natural gas-fired hot water boiler. Each component of the system is described in detail below.
Individual Heat Pumps There are several different sizes of heat pumps installed throughout the building depending on space heating and cooling needs. Specification for each heat pump type is outlined in Table 3.
Portland Energy Conservation, Inc. (PECI) Page 13 © 2005, Portland Energy Conservation, Inc. (PECI). All rights reserved.

Building X – City Y, CA
Table 3 – Heat Pump Specifications Description HP-1 HP-2 HP-3 HP-4 HP-5 Quantity 14 7 21 119 14 Fan Power (HP) 1/20 1/6 1/6 1/6 1/3 Air Flow (CFM) 285 520 605 900 1,475 Cooling Mode
MBH 9.4 14.0 18.0 24.0 40.0 EER 8.3 7.6 8.3 8.4 9.2
Heating Mode MBH 10.6 19.3 22.9 30.7 46.9 EER 7.8 8.9 8.9 9.9 9.6
Water Flow (GPM) 2.3 3.5 4.5 6.0 10.0 Outside ventilation air is ducted to each heat pump from a common supply duct located on each floor. The supply ducts serving each floor are connected to a chase extending from the roof to the ground floor, with the outside air intake louver located on the roof.
Water Loop Circulation Pumps There are two independent water loops serving the building and each loop consists of two pumps in a lead / lag configuration (only one pump per loop operates at a time). The west loop water pump was designed for 600 GPM at 84 feet of head, with a 20 HP motor. The east loop was designed for 450 GPM at 90 feet of head, with a 15 HP motor.
Evaporative Fluid Coolers There are two independent evaporative fluid coolers serving the east and west water loops and each fluid cooler consists of a single-speed 25 HP fan motor and a 2 HP spray pump. The west loop fluid cooler is rated at 200 tons and 600 GPM water flow rate. The east loop fluid cooler is rated at 160 tons and 445 GPM water flow rate. Both fluid coolers have been recently replaced.
Boilers There are two independent natural gas-fired hot water boilers serving the east and west water loops and each unit is rated at 945 MBH and 80% efficiency. Due to the nature of the thermal characteristics of the building, neither boiler has ever operated but they are available should supplemental heat be required.
HVAC Controls The facility is controlled by a CSI energy management and control system (EMCS). The CSI system controls the building’s water loop heat pump system and exterior lighting in the following manner:
Scheduling operation of the heat pumps ♦ ♦ Maintaining water loop temperature (which in turn controls the operation of the fluid cooler fans
and spray pumps).
Portland Energy Conservation, Inc. (PECI) Page 14 © 2005, Portland Energy Conservation, Inc. (PECI). All rights reserved.

Building X – City Y, CA
Controlling operation of the water loop circulation pumps through heat pump schedules ♦ ♦ Scheduling of selected exterior lighting
The general operating schedule for the heat pumps are 6 AM to 6 PM Monday through Friday, with approximately 50% of the units scheduled from 8 AM to 12 PM on Saturdays. Note – the building occupancy and equipment operating schedule is longer on both weekdays and weekends during March and April because several tenants are accountants and this is tax season. Water loop temperature is maintained at approximately 85°F and the water loop circulation pumps are commanded off when the heat pumps are disabled. Selected exterior lighting is scheduled to turn off at midnight. Each individual heat pump is controlled by a thermostat located within the zone served. Heating and cooling setpoints are 65°F and between 70°F and 72°F, respectively. Most supply fans are in the “auto” position, which turns the fan on when the compressor is on and off when the compressor is off. However, information gathered during the site visit and through short-term equipment monitoring indicates that many building system are not being controlled as intended. For example several heat pumps operate during unoccupied hours, the water loop pumps are operating continuously, and heat pump supply fans continue to cycle on and off during unoccupied hours even when the units are disabled.
ELECTRICAL SYSTEMS
Interior Lighting The interior lighting for the facility was retrofitted in 1991 to 2-lamp and 4-lamp four-foot T-8 fluorescent fixtures with electronic ballasts as well as 2-lamp, 18-watt compact fluorescent fixtures. Lighting load is estimated at 1.06 watts per square foot.
Exterior Lighting The building has two levels of covered parking under the building itself and is lit by high-pressure sodium fixtures. The sides of the parking structure are open but the lights remain on 24 hours per day, 7 days per week for security. High-pressure sodium fixtures also light surface parking and building perimeter areas, but these fixtures are controlled by a photocell in conjunction with the CSI energy management system. The total exterior lighting load is estimated at 7 kW.
Lighting Controls All interior lights are controlled by toggle switches. The surface parking and perimeter areas are controlled by a photocell in conjunction with the CSI energy management system. It is estimated 15% of the interior lighting is on 24 hours per day for security.
Miscellaneous Electrical Systems There is a small deli located on the 4th floor. Miscellaneous electrical equipment at the facility includes cooking equipment (for example microwave oven, crock pots, coffee brewers), kitchen refrigeration units, 5-gallon electric water heaters in the bathrooms, and general office plug loads. Average connect load is
Portland Energy Conservation, Inc. (PECI) Page 15 © 2005, Portland Energy Conservation, Inc. (PECI). All rights reserved.

Building X – City Y, CA
estimated at 175W per employee during occupied hours based on observations of equipment made during the on-site visit. This plug load density accounts for all office equipment, kitchen refrigeration units, coffee makers, and task lights. Approximately 50% of the office plug loads are turned off during unoccupied hours.
OPERATIONS & MAINTENANCE PROCEDURES
Currently, in-house personnel perform most equipment operation and maintenance. This includes adjusting thermostats, replacing light bulbs, replacing filters in the heat pumps, and general repairs. Outside contractors are used if facility staff is unable to remedy the situation or to perform more complex maintenance procedures.
ENERGY UTILIZATION
Building X uses primarily electricity to meet its energy needs. Even though there are two natural gas-fired hot water boilers serving each water loop, these units have yet to be used. However, the facility is charged a monthly basic meter fee. The facility used 2,394,824 kWh of electricity at a cost of $427,608 per year (including demand charges and taxes) for the 12-month period between October 2000 and September 2001. This corresponds to an energy use index (EUI) of 65.39 kBTU/sq. ft./year and an energy cost index of $3.42/sq. ft./year. Energy consumption and utilization for the facility is summarized in Table 4.
Table 4 – Building X Utility History and Energy Utilization
Date
Electrical Energy Usage (KWH)
On-peak Demand
(KW)
Non-coincident Demand
(KW)
Total Electricity Cost - including
demand and taxes ($)
Nominal Electrical
Rate ($/KWH)
ECI($/Sq. Ft.)
EUI(kBTU/Sq.Ft.)
Oct-00 203,890 529 627 $34,864 $0.17099 $0.279 5.57Nov-00 197,428 427 583 $34,899 $0.17677 $0.279 5.39Dec-00 207,608 424 589 $62,355 $0.30035 $0.499 5.67Jan-01 186,694 436 575 $44,295 $0.23726 $0.354 5.10Feb-01 183,104 450 586 $44,250 $0.24166 $0.354 5.00Mar-01 198,406 469 595 $48,714 $0.24553 $0.390 5.42Apr-01 176,103 512 521 $32,155 $0.18259 $0.257 4.81
May-01 192,578 570 570 $23,557 $0.12233 $0.188 5.26Jun-01 197,694 578 578 $24,082 $0.12181 $0.193 5.40Jul-01 211,068 593 594 $25,307 $0.11990 $0.202 5.76
Aug-01 208,526 610 610 $25,400 $0.12181 $0.203 5.69Sep-01 231,725 636 679 $27,731 $0.11967 $0.222 6.33
Totals 2,394,824 NA NA $427,608 N/A $3.421 65.39Average 199,569 519 592 $35,634 $0.17855 $0.285 5.45
Cost savings are generally calculated using the average unit cost per utility. For example, the average cost of electricity is calculated by dividing the total monthly cost, which includes demand costs and taxes, by the monthly consumption. However, some measures may not achieve any demand savings or may only effect
Portland Energy Conservation, Inc. (PECI) Page 16 © 2005, Portland Energy Conservation, Inc. (PECI). All rights reserved.

Building X – City Y, CA
off-peak demand usage, therefore these measures cannot use the average electricity cost described above to estimate cost savings. In addition, the energy commodity charge fluctuates from month to month and varies based on time of use. The DOE-2 simulation model used the extensive time-out-use rate structure to estimate cost savings, however spreadsheet calculations utilized either an average cost $0.078/kWh when no demand savings are available, or $0.1211/kWh when demand savings could be claimed. Electricity commodity charges have lowered significantly over the past 6 months and appear to have stabilized. Therefore the average energy costs (both with and without demand costs) are based on the average for the past 5 months, rather than including the extremely high rates from last summer. All costs include appropriate taxes. The electrical energy and demand profiles for the facility appear to be normal. Electrical consumption is reasonable for the City Z metropolitan area since the climate is fairly temperate and consistent. Since City Y is a bit inland from City Z, summer time temperatures are higher, hence the cooling increase during summer months. Since winter peak demand is only between 5 PM and 8 PM on weekdays (when the building is basically unoccupied), the maximum non-coincident demand will be higher. During the summer months, both demand values coincide with each other. Refer to the “Monthly Electric Consumption and Demand” graph located in Appendix B – Utility History Analysis Figures.
END-USE BREAKDOWN
Figure 3 illustrates the energy consumption by various pieces of equipment at the facility.
Annual Energy Consumption by End-Use
Lighting24.6%
Plugs & Equipment24.5%
HP Fans5.5%
Compressor Cooling24.4%
Compressor Heating0.1%
Loop Pumps and Towers18.3%
Exterior Lights2.6%
Figure 3 – End Use Breakdown
Portland Energy Conservation, Inc. (PECI) Page 17 © 2005, Portland Energy Conservation, Inc. (PECI). All rights reserved.

Building X – City Y, CA
FINDINGS, RECOMMENDATIONS & IMPLEMENTATION
DETAILED FINDINGS
01 Scheduling and Programming Improvements Finding Description The CSI energy management system controls the water-source heat pump system by scheduling operation of the heat pumps, maintaining loop temperature, and controlling operation of the water loop circulation pumps based on heat pump status. Based on evaluation of the CSI control programming and through subsequent short-term monitoring, the following issues were identified:
Several heat pumps were commanded on when the building is unoccupied; ♦
♦
♦
Water loop circulation pumps ran continuously due to heat pump scheduling problems; and
Fluid cooler spray pumps ran during unoccupied times due to heat pump scheduling problems.
Heat Pump Scheduling Problems – Scheduling problems identified in the CSI program include:
(1) The heat pumps serving Suites 300, 303, and 311 are all scheduled to operate until midnight on Tuesdays
(2) The heat pumps serving Suite 717 are scheduled to operate until 8 PM Monday through Friday
(3) The heat pumps serving suite 602 are scheduled to operate from 7 AM to 6 PM on Sundays
(4) The heat pumps serving suite 513 are scheduled to operate until midnight on both Fridays and Saturdays.
Short-term monitoring also detected several heat pumps operating over a holiday (Thanksgiving) as well as verifying many of the scheduling anomalies outlined above. Figure 4 illustrates the average load shape for all of the heat pumps monitored during a two-week period from November 15 through November 30. The facility has a special meter that monitors electrical demand and energy consumption every 15 minutes and this data is collected and stored on the Utility web site. The following graphs were generated and downloaded to provide additional insight into the overall building load profile. Figure 5 illustrates weekend and holiday load profiles, while Figure 6 and Figure 7 both demonstrate that there is equipment operating during unoccupied hours and both profiles are indicative of HVAC equipment satisfying a cooling load.
Portland Energy Conservation, Inc. (PECI) Page 18 © 2005, Portland Energy Conservation, Inc. (PECI). All rights reserved.

Building X – City Y, CA
All Monitored Heat PumpsAverage Daily Load Shapes
0
10
20
30
40
50
60
0:00
1:00
2:00
3:00
4:00
5:00
6:00
7:00
8:00
9:00
10:00
11:00
12:00
13:00
14:00
15:00
16:00
17:00
18:00
19:00
20:00
21:00
22:00
23:00
Pow
er (k
W)
Occupied Days Saturdays Sundays Holidays
Unnecessary Saturday and Sunday operation
Thanksgiving Day operation
Figure 4 – Monitored heat pump average daily load shapes
Saturday. Note large load after 12 PM
Sunday. Note load when building should be unoccupied
Monday. Labor Day holiday . Note load when building should be unoccupied
Figure 5 – Weekend and Holiday Load Profile
Portland Energy Conservation, Inc. (PECI) Page 19 © 2005, Portland Energy Conservation, Inc. (PECI). All rights reserved.

Building X – City Y, CA
Heat pumps should be scheduled off at this time but building load indicates alot of equipment is still operating.
Figure 6 – Typical Saturday Load Profile
Portland Energy Conservation, Inc. (PECI) Page 20 © 2005, Portland Energy Conservation, Inc. (PECI). All rights reserved.

Building X – City Y, CA
Building load begins to increase at about 8 AM. The load profile is indicative of a cooling load
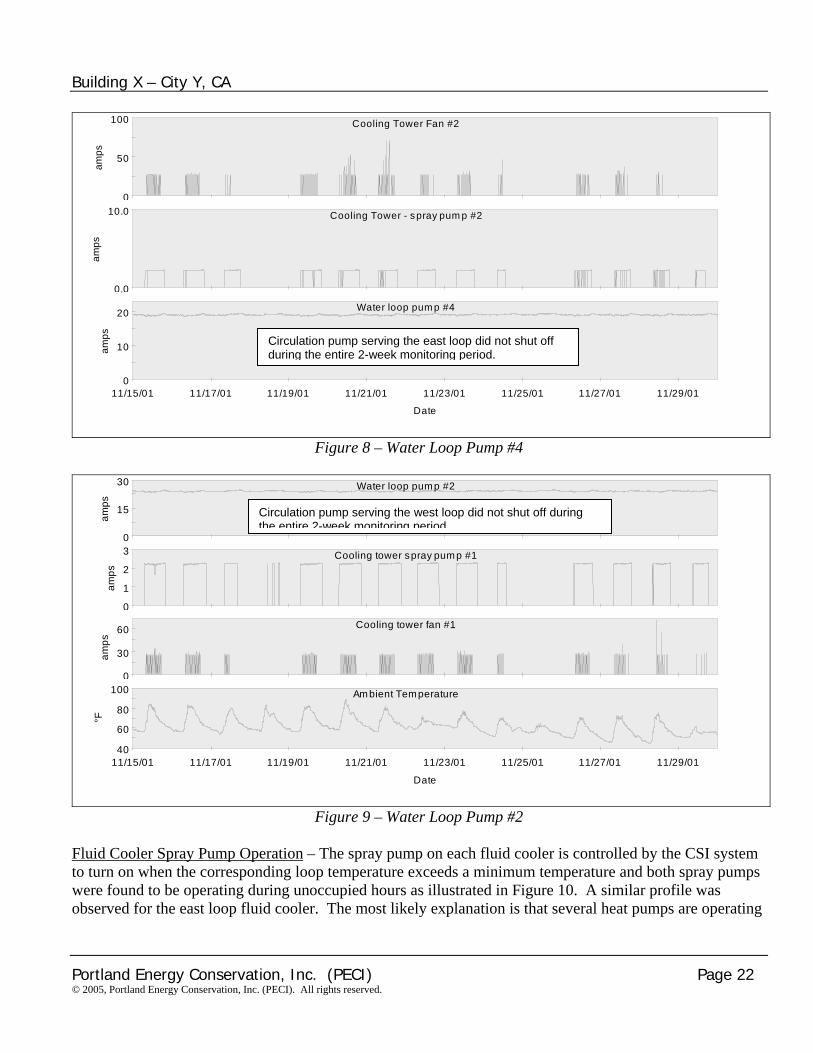
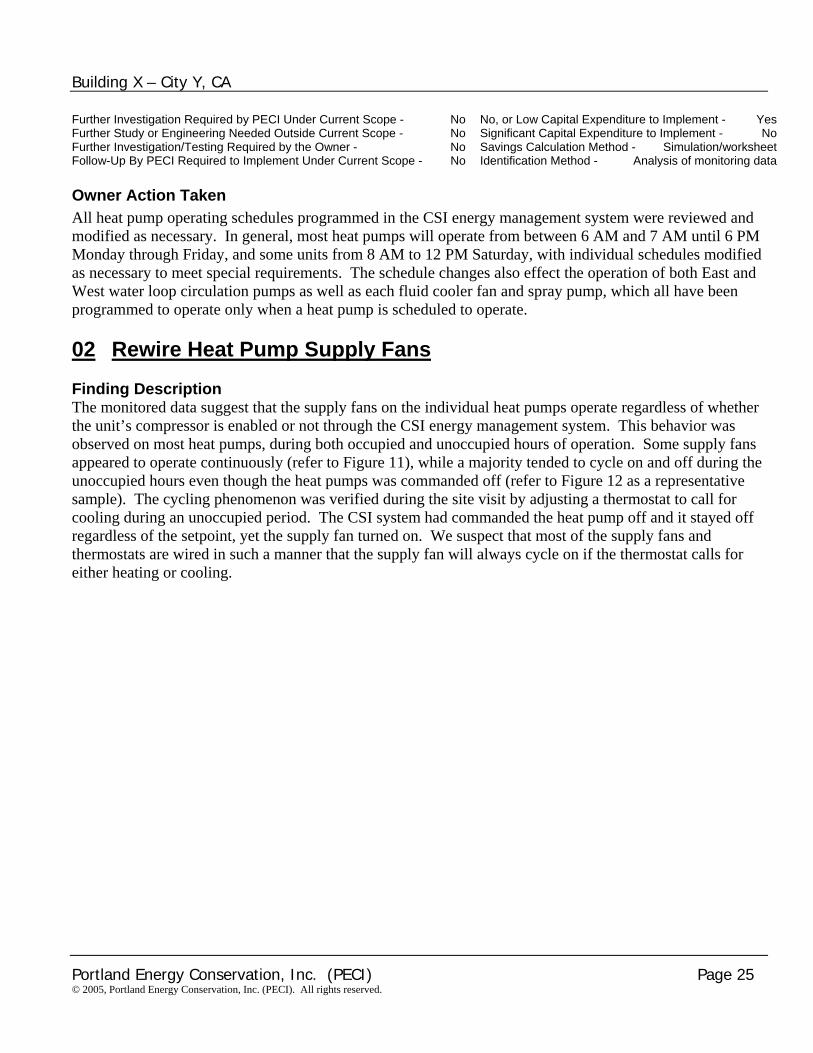
Figure 7 – Typical Sunday Load Profile Water Loop Pump Operation – The water loop pumps serving the east and west loops are supposed to be commanded off through the CSI energy management system when the heat pumps are disabled. However Figure 8 and Figure 9 both demonstrate that neither pump turned off during the entire 2-week monitoring period. One possible reason could be due to the heat pump schedule problems outlined above. Another possibility is that the CSI system is not programmed correctly to achieve the desired control.
Portland Energy Conservation, Inc. (PECI) Page 21 © 2005, Portland Energy Conservation, Inc. (PECI). All rights reserved.
Building X – City Y, CA
0
50
100
amps
Cooling Tower Fan #2
0.0
10.0
amps
Cooling Tower - spray pum p #2
0
10
20
11/15/01 11/17/01
amps
Water loop pum p #4
0
15
30
amps
0
1
2
3
amps
0
30
60
amps
40
60
80
100
11/15/01 11/17/01
°F
Fluid Cooler Spray Pump Opeto turn on when the corresponwere found to be operating duobserved for the east loop flui
Portland Energy Conservati© 2005, Portland Energy Conservation, Inc.
Circulation pump serving the east loop did not shut offduring the entire 2-week monitoring period.
11/19/01 11/21/01 11/23/01 11/25/01 11/27/01 11/29/01
Date
Figure 8 – Water Loop Pump #4
Water loop pump #2
Circulation pump serving the west loop did not shut off during the entire 2-week monitoring period
Cooling tower spray pump #1
Cooling tower fan #1
11/19/01 11/21/01 11/23/01 11/25/01 11/27/01 11/29/01
Date
Ambient Temperature
Figure 9 – Water Loop Pump #2
ration – The spray pump on each fluid cooler is controlled by the CSI system ding loop temperature exceeds a minimum temperature and both spray pumps ring unoccupied hours as illustrated in Figure 10. A similar profile was d cooler. The most likely explanation is that several heat pumps are operating
on, Inc. (PECI) Page 22 (PECI). All rights reserved.

Building X – City Y, CA
during unoccupied hours and adding heat to the loop. Hence the fluid cooler fans and spray pumps will operate to maintain loop temperature.
West Loop Fluid Cooler Fan and Spray PumpAverage Daily Load Shapes
0.0
0.5
1.0
1.5
2.0
2.5
0:00 1:00 2:00 3:00 4:00 5:00 6:00 7:00 8:00 9:0010:0011:0012:0013:0014:0015:0016:0017:0018:0019:0020:0021:0022:0023:00
Pow
er (k
W)
CT Fan, Weekdays
CT Fan, Unoccupied Days
Spray Pump, Weekdays
Spray Pump, Unoccupied Days
Note that both the cooling tower fan and spray pump operate on weekends when systems should be off
Spray pumps operate when cooling tower fans
are off and building is unoccupied
Systems should be off at 12 PM on Saturdays
Figure 10 – Fluid Cooler Fan and Spray Pump Operation Recommendation Having individual heat pumps operate during normally unoccupied hours of the day or week requires that the entire water loop system must also operate, including the fluid coolers and water loop pumps, simply to support these individual units. To eliminate this very inefficient operation, all heat pump units should be programmed with the same schedule, namely from 6 AM to 6 PM Monday through Friday, and 8 AM to 12 PM Saturday (as most of them currently are scheduled), with individual schedules modified as necessary to meet special requirements. The key is to remove any reference to Sunday operation and minimize unnecessary operation. Furthermore, only Christmas Day, the Fourth of July, and New Years Day are currently programmed into the system as holidays. This holiday schedule should be reviewed and expanded if possible to include additional days. The CSI system is equipped with “building manager,” a feature that allows occupants to call into the automated system and request cooling during normally unoccupied hours. The system documents the run time requested for cooling, and issues a monthly report that can then be used to charge the occupants based on a defined rate. This system should be reviewed and reincorporated to handle off-hour cooling and heating needs. A rate will need to be established for this off-hour service, keeping in mind that it will need to include expenses based on central plant (tower and pump) operation. The current controls are also set to run the water loop pumps whenever any of the heat pumps call for cooling. This is done by the CSI system tracking heat pump statuses, then enabling the appropriate loop
Portland Energy Conservation, Inc. (PECI) Page 23 © 2005, Portland Energy Conservation, Inc. (PECI). All rights reserved.

Building X – City Y, CA
pump based on whether any heat pump status is enabled. The control sequence should be changed so that CSI can schedule pump operation directly, rather than be based on heat pump status. This schedule should be based on the same schedule as the heat pumps, and would be accomplished by simply reprogramming CSI and should be linked so that any short-term special event schedule changes made to any heat pump will also be recognized by the loop pump schedule. The spray pumps are currently programmed to operate whenever the loop water temperature is above 79°F and the fans cycle on and off to maintain loop temperature at 85°F. We believe that this control strategy is adequate and the fans and pumps would tend to shut off if the schedule changes outlined above are implemented. However, even when all of the heat pumps are turned off, there will be residual heat in the loop, which can cause both to cycle during unoccupied hours. To eliminate this unnecessary operation, we recommend controlling the spray pumps and fans based on temperature during occupied hours and commanding them off by a schedule during unoccupied hour. Again this schedule should be linked with the heat pump and loop pump schedules so that the fluid coolers will operate correctly whenever the rest of the system is enabled. Detailed calculation for this measure is provided in the spreadsheet entitled Scheduling and Programming Improvements located in Appendix G – Savings and Cost Estimates. Note – energy and cost savings have been revised, if necessary, based on actual data gathered during post-retrofit measurement and verification (refer to Measurement & Verification of Savings section of the report for details). In addition, the implementation cost has been revised to reflect actual contractor invoices, if applicable. Estimated Economic Impact Summary Estimated Annual Electrical Energy Savings - 219,460 kWh/yr Estimated Annual Cost Savings - $17,118Estimated Electrical Peak Demand Savings - 0 kW Estimated Implementation Cost - $243
Estimated Annual Natural Gas Savings - 0 Therm/yr Simple Payback (yrs) - 0.0 Implementation Plan The schedules for each heat pump unit should be reviewed and reprogrammed to correspond to the aforementioned general schedule. Operation of the “building manager” feature should also be reviewed and reincorporated into the system. A rate will need to be established for off-hour service, which includes expenses based on both individual heat pump and central plant (tower and pump) operation. The water loop pump control logic should be reprogrammed in the CSI system so that the pumps respond to a direct scheduled start/stop command from CSI, and not from heat pump status. Coordination between the heat pump schedules and loop pump schedules should be made so that special schedule changes can be made with ease and both systems will respond accordingly. Correct wiring must be verified to insure that the CSI digital outputs for pump start/stop can be directly wired to the magstarters of the pumps for complete control of each pump. A controls contractor should perform all work. Costs are associated with reprogramming the heat pump schedules in the CSI system, as well as time to evaluate and reintroduce the “building manager” feature into the system. Implementation cost has been estimated based on 40 hours of programming at a rate of $100 per hour, including contractor overhead and profit and contingency.
Portland Energy Conservation, Inc. (PECI) Page 24 © 2005, Portland Energy Conservation, Inc. (PECI). All rights reserved.
Building X – City Y, CA
Further Investigation Required by PECI Under Current Scope - No No, or Low Capital Expenditure to Implement - Yes Further Study or Engineering Needed Outside Current Scope - No Significant Capital Expenditure to Implement - No Further Investigation/Testing Required by the Owner - No Savings Calculation Method - Simulation/worksheet Follow-Up By PECI Required to Implement Under Current Scope - No Identification Method - Analysis of monitoring data Owner Action Taken All heat pump operating schedules programmed in the CSI energy management system were reviewed and modified as necessary. In general, most heat pumps will operate from between 6 AM and 7 AM until 6 PM Monday through Friday, and some units from 8 AM to 12 PM Saturday, with individual schedules modified as necessary to meet special requirements. The schedule changes also effect the operation of both East and West water loop circulation pumps as well as each fluid cooler fan and spray pump, which all have been programmed to operate only when a heat pump is scheduled to operate. 02 Rewire Heat Pump Supply Fans Finding Description The monitored data suggest that the supply fans on the individual heat pumps operate regardless of whether the unit’s compressor is enabled or not through the CSI energy management system. This behavior was observed on most heat pumps, during both occupied and unoccupied hours of operation. Some supply fans appeared to operate continuously (refer to Figure 11), while a majority tended to cycle on and off during the unoccupied hours even though the heat pumps was commanded off (refer to Figure 12 as a representative sample). The cycling phenomenon was verified during the site visit by adjusting a thermostat to call for cooling during an unoccupied period. The CSI system had commanded the heat pump off and it stayed off regardless of the setpoint, yet the supply fan turned on. We suspect that most of the supply fans and thermostats are wired in such a manner that the supply fan will always cycle on if the thermostat calls for either heating or cooling.
Portland Energy Conservation, Inc. (PECI) Page 25 © 2005, Portland Energy Conservation, Inc. (PECI). All rights reserved.

Building X – City Y, CA
1.0
1.5
2.0
2.5
3.0
0 2 4 6 8 10 12 14 16 18 20 22 24
Uni
t Pow
er (k
W)
Hour
Heat Pum p, 1s t Floor
Supply fan and compressor on
Supply fan always on
Figure 11– Heat pump operation, 1st floor
0
50
amps
Heat Pumps, 5th Floor 38,45,?
0
10
20
amps
Heat Pumps, 5th Floor 35,36,44
0
10
20
30
11/15/01 11/17/01 11/19/01 11/21/01 11/23/01 11/25/01 11/27/01 11/29/01
amps
Date
Heat Pumps, 5th Floor 41,42,43
Note fans cycling during unoccupied hours.
Figure 12 – Heat Pump Supply Fan Cycling
Portland Energy Conservation, Inc. (PECI) Page 26 © 2005, Portland Energy Conservation, Inc. (PECI). All rights reserved.

Building X – City Y, CA
Recommendation The relays are currently wired at each heat pump such that when CSI turns the unit off according to its programmed schedule, only the compressor is disabled. Thus, signals for cooling or heating coming from the thermostat during unoccupied hours allow the supply fan to turn on. Since the water loop pumps are programmed to turn on whenever a heat pump is operating, this also causes the pumps to turn on (which is why the pumps currently operate continuously). The relays should be rewired at each heat pump so that the entire unit is disabled by the CSI signal, and not just the unit’s compressor. Detailed calculation for this measure is provided in the spreadsheet entitled Rewire Heat Pump Supply Fans located in Appendix G – Savings and Cost Estimates. Note – energy and cost savings have been revised, if necessary, based on actual data gathered during post-retrofit measurement and verification (refer to Measurement & Verification of Savings section of the report for details). In addition, the implementation cost has been revised to reflect actual contractor invoices, if applicable. Estimated Economic Impact Summary Estimated Annual Electrical Energy Savings - 66,405 kWh/yr Estimated Annual Cost Savings - $5,180Estimated Electrical Peak Demand Savings - 0 kW Estimated Implementation Cost - $8,531
Estimated Annual Natural Gas Savings - 0 Therm/yr Simple Payback (yrs) - 1.6 Implementation Plan All heat pumps within the facility should have their individual relays rewired so that the entire unit is disabled by the CSI signal, and not just the unit’s compressor. To implement this, wire the power wire (red, 24VAC+) that supplies electricity to the thermostat through a normally open relay contact. This relay is will then be energized or de-energized through the CSI system to enable and disable the heat pump. The relay contact is located between the low voltage transformer and the thermostat, and therefore will disconnect all power for the thermostat when the CSI system schedules the heat pump to be disabled. This will in-turn disable the fan, heat and cooling operation of the heat pump. The work should be performed by a controls contractor. Costs associated with rewiring the relay at each individual heat pump unit are estimated 45 minutes per unit, a total of 175 units and a labor cost of $65 per hour, which includes contractor overhead and profit (from RS Means Electrical Cost Data). Further Investigation Required by PECI Under Current Scope - No No, or Low Capital Expenditure to Implement - Yes Further Study or Engineering Needed Outside Current Scope - No Significant Capital Expenditure to Implement - No Further Investigation/Testing Required by the Owner - No Savings Calculation Method - Spreadsheet Follow-Up By PECI Required to Implement Under Current Scope - No Identification Method - Analysis of monitoring data Owner Action Taken This measure was not implemented by the owner. 03 Install Variable Frequency Drives on Fluid Cooler Fans Finding Description The original fluid coolers had 2-speed fan motors but both fluid coolers were replaced recently and came equipped with single-speed fan motors. As a result the fan motors short cycle continually to maintain water
Portland Energy Conservation, Inc. (PECI) Page 27 © 2005, Portland Energy Conservation, Inc. (PECI). All rights reserved.

Building X – City Y, CA
loop temperature. The on-cycle for each fan was measured to be shorter than one minute at times during the site visit. This kind of short cycling is extremely hard on the motors, belts, and motor starters. Recommendation Both fluid cooler fans should be equipped with variable frequency drives (VFDs). This will allow the fan motors to modulate according to heat rejection loads presented by the water loop, reducing energy consumption. This measure is mutually exclusive with Finding 04 – Install Two-speed Motors on Fluid Cooler Fans. Energy savings were calculated using DOE-2 hourly simulation program. Non-energy cost savings can be realized by installing a VFD if frequent fan cycling leads to premature belt, motor, or starter failure. Note – energy and cost savings have been revised, if necessary, based on actual data gathered during post-retrofit measurement and verification (refer to Measurement & Verification of Savings section of the report for details). In addition, the implementation cost has been revised to reflect actual contractor invoices, if applicable. Estimated Economic Impact Summary Estimated Annual Electrical Energy Savings - 28,000 kWh/yr Estimated Annual Cost Savings - $3,000Estimated Electrical Peak Demand Savings - 0 kW Estimated Implementation Cost - $10,000
Estimated Annual Natural Gas Savings - 0 Therm/yr Simple Payback (yrs) - 3.3 Implementation Plan Each fluid cooler fan should have a 25-hp variable frequency drive (VFD) installed to control each fan motor. In addition each VFD should be connected to the CSI system. This may require an additional controller if space on the existing controllers is inadequate. This work should be performed by an HVAC contractor. Costs include purchase and installation of the two drives and the associated controller, including taxes, contractor overhead and profit. Further Investigation Required by PECI Under Current Scope - No No, or Low Capital Expenditure to Implement - No Further Study or Engineering Needed Outside Current Scope - No Significant Capital Expenditure to Implement - Yes Further Investigation/Testing Required by the Owner - No Savings Calculation Method - DOE-2 model analysis Follow-Up By PECI Required to Implement Under Current Scope - No Identification Method - Analysis of monitoring data Owner Action Taken This measure was not implemented by the owner. 04 Install Two-Speed Motors on Fluid Cooler Fans Finding Description The original fluid coolers had 2-speed fan motors but both fluid coolers were replaced recently and came equipped with single-speed fan motors. As a result the fan motors short cycle continually to maintain water loop temperature. The on-cycle for each fan was measured to be shorter than one minute at times during the site visit. This kind of short cycling is extremely hard on the motors, belts, and motor starters.
Portland Energy Conservation, Inc. (PECI) Page 28 © 2005, Portland Energy Conservation, Inc. (PECI). All rights reserved.

Building X – City Y, CA
Recommendation Both fluid cooler fans should be equipped with 2-speed fan motors. This will allow the fan motors to alternate between low speed and high speed according to heat rejection loads presented by the water loop, reducing energy consumption. This measure is presented as an alternative to, and mutually exclusive with, Finding 03 – Install Variable Frequency Drives on Fluid Cooler Fans. Energy savings were calculated using DOE-2 hourly simulation program. Non-energy cost savings can be realized by installing a two-speed motor if frequent fan cycling leads to premature belt, motor, or starter failure. Note – energy and cost savings have been revised, if necessary, based on actual data gathered during post-retrofit measurement and verification (refer to Measurement & Verification of Savings section of the report for details). In addition, the implementation cost has been revised to reflect actual contractor invoices, if applicable. Estimated Economic Impact Summary Estimated Annual Electrical Energy Savings - 16,000 KWh/yr Estimated Annual Cost Savings - $1,690Estimated Electrical Peak Demand Savings - 0 KW Estimated Implementation Cost - $14,100
Estimated Annual Natural Gas Savings - 0 Therm/yr Simple Payback (yrs) - 8.3 Implementation Plan A 25 HP two-speed motor should be installed on each fluid cooler fan. In addition each motor should be connected to the CSI system. This may require an additional controller if space on the existing controllers is inadequate. This work should be performed by an HVAC contractor. Costs include purchase and installation of the new two-speed motors, including taxes, contractor overhead and profit. Further Investigation Required by PECI Under Current Scope - No No, or Low Capital Expenditure to Implement - No Further Study or Engineering Needed Outside Current Scope - No Significant Capital Expenditure to Implement - Yes Further Investigation/Testing Required by the Owner - No Savings Calculation Method - DOE-2 model analysis Follow-Up By PECI Required to Implement Under Current Scope - No Identification Method - Analysis of monitoring data Owner Action Taken This measure was implemented in conjunction with reducing the condenser water loop temperature. Refer to Finding 06 – Reduce Condenser Water Loop Temperature and Install Two-speed Motors for details. 05 Reduce Condenser Water Loop Temperature Finding Description The CSI energy management modulates the fluid cooler fan and spray pump to maintain water loop temperature leaving each fluid cooler at 85°F. Short-term monitoring verified that the outlet water temperature for both the east and west loops ranged from 83°F to 88°F when the fluid coolers are operating. Inlet water temperatures range from 87°F to 91°F. Recommendation Reducing the condenser water loop temperature set point from 85°F to 75°F will improve the individual heat pump compressor operating efficiencies. According to the heat pump manufacturer’s literature, entering condenser water temperature can range from 95°F to 60°F. The improved compressor operating
Portland Energy Conservation, Inc. (PECI) Page 29 © 2005, Portland Energy Conservation, Inc. (PECI). All rights reserved.

Building X – City Y, CA
efficiencies will result in electrical energy consumption and demand savings. As a consequence, fluid cooler fan operation will increase in order to provide the colder water, however, the efficiency improvement for all 175 heat pumps will far outweigh any fan energy increase. The measure is mutually exclusive with Finding 06 – Reduce Condenser Water Loop Temperature and Install Two-speed Motors and Finding 07 – Reduce Condenser Water Loop Temperature and Install Variable Frequency Drives. Energy and demand savings were calculated using DOE-2 hourly simulation program. Several model runs were made at 2°F increments from current setpoint of 85°F to 67°F do develop a family of curves from which energy, demand, and cost savings can be interpreted. These curves, entitled Water Loop Temperature Reset Energy Savings and Water Loop Temperature Reset Demand Savings can be found in Appendix G – Savings and Cost Estimates. Note – energy and cost savings have been revised, if necessary, based on actual data gathered during post-retrofit measurement and verification (refer to Measurement & Verification of Savings section of the report for details). In addition, the implementation cost has been revised to reflect actual contractor invoices, if applicable. Estimated Economic Impact Summary Estimated Annual Electrical Energy Savings - 20,000 KWh/yr Estimated Annual Cost Savings - $2,800Estimated Electrical Peak Demand Savings - 4 KW Estimated Implementation Cost - $50
Estimated Annual Natural Gas Savings - 0 Therm/yr Simple Payback (yrs) - 0.0 Implementation Plan The condenser water loop temperature set points should be reprogrammed from 85°F to 75°F within the CSI energy management system. The work should be performed by a controls contractor. Implementation cost has been estimated based on 4 hours of programming at a rate of $100 per hour. Further Investigation Required by PECI Under Current Scope - No No, or Low Capital Expenditure to Implement - Yes Further Study or Engineering Needed Outside Current Scope - No Significant Capital Expenditure to Implement - No Further Investigation/Testing Required by the Owner - No Savings Calculation Method - DOE-2 model analysis Follow-Up By PECI Required to Implement Under Current Scope - No Identification Method - Analysis of monitoring data Owner Action Taken This measure was implemented in conjunction with installation of two-speed fluid cooler fan motors. Refer to Finding 06 – Reduce Condenser Water Loop Temperature and Install Two-speed Motors for details. 06 Reduce Condenser Water Loop Temperature and Install Two-speed Motors Finding Description CSI energy management modulates the fluid cooler fan and spray pump to maintain water loop temperature leaving each fluid cooler at 85°F. Short-term monitoring verified that the outlet water temperature for both the east and west loops ranged from 83°F to 88°F when the fluid coolers are operating. Inlet water temperatures range from 87°F to 91°F. Recommendation This measure is presented as an alternative to Finding 05 – Reduce Condenser Water Loop Temperature. Reducing the condenser water loop temperature set point from 85°F to 75°F will improve the individual
Portland Energy Conservation, Inc. (PECI) Page 30 © 2005, Portland Energy Conservation, Inc. (PECI). All rights reserved.

Building X – City Y, CA
heat pump compressor operating efficiencies. According to the heat pump manufacturer’s literature, entering condenser water temperature can range from 95°F to 60°F. The improved compressor operating efficiencies will result in electrical energy consumption and demand savings. As a consequence, fluid cooler fan operation will increase in order to provide the colder water, however, the efficiency improvement for all 175 heat pumps will far outweigh any fan energy increase. The measure also includes installing two-speed motors for better fan modulation in order to maintain loop temperature setpoint. The measure is mutually exclusive with Finding 05 – Reduce Condenser Water Loop Temperature and Finding 07 – Reduce Condenser Water Loop Temperature and Install Variable Frequency Drives. Energy and demand savings were calculated using DOE-2 hourly simulation program. Several model runs were made at 2°F increments from current setpoint of 85°F to 67°F do develop a family of curves from which energy, demand, and cost savings can be interpreted. These curves, entitled Water Loop Temperature Reset Energy Savings and Water Loop Temperature Reset Demand Savings can be found in Appendix G – Savings and Cost Estimates. Note – energy and cost savings have been revised, if necessary, based on actual data gathered during post-retrofit measurement and verification (refer to Measurement & Verification of Savings section of the report for details). In addition, the implementation cost has been revised to reflect actual contractor invoices, if applicable. Estimated Economic Impact Summary Estimated Annual Electrical Energy Savings - 31,000 KWh/yr Estimated Annual Cost Savings - $4,000Estimated Electrical Peak Demand Savings - 9 KW Estimated Implementation Cost - $14,150
Estimated Annual Natural Gas Savings - 0 Therm/yr Simple Payback (yrs) - 3.5 Implementation Plan The condenser water loop temperature set points should be reprogrammed from 85°F to 75°F within the CSI energy management system. The work should be performed by a controls contractor. Implementation cost has been estimated based on 4 hours of programming at a rate of $100 per hour. In addition, installation of two 25 HP two-speed motors will be performed by an HVAC contractor. Costs include purchase and installation of the new two-speed motors, including taxes, contractor overhead and profit. Further Investigation Required by PECI Under Current Scope - No No, or Low Capital Expenditure to Implement - No Further Study or Engineering Needed Outside Current Scope - No Significant Capital Expenditure to Implement - Yes Further Investigation/Testing Required by the Owner - No Savings Calculation Method - DOE-2 model analysis Follow-Up By PECI Required to Implement Under Current Scope - No Identification Method - Analysis of monitoring data Owner Action Taken The owner elected to reduce the condenser water loop temperature and install two-speed fan motors on each fluid cooler. Both measures are combined into one due to the significant interaction each measure imposes on overall energy savings. The East and West fluid coolers were both retrofitted with new 25 HP, two-speed motors and motor starters and programmed to operate with the same schedule as the heat pumps. In addition, the following control strategy was programmed into the CSI energy management system to reduce the water loop temperature leaving each fluid cooler:
Each spray pump operates to maintain water temperature at 74°F •
Portland Energy Conservation, Inc. (PECI) Page 31 © 2005, Portland Energy Conservation, Inc. (PECI). All rights reserved.

Building X – City Y, CA
Each fan operates at low-speed to maintain water temperature at 75°F •
• Each fan operates at high-speed to maintain water temperature at 80°F
The reduction in condenser water temperature is not as large as originally recommended, therefore energy and cost savings for this measure have been adjusted to reflect actual temperatures programmed into the CSI energy management system. 07 Reduce Condenser Water Loop Temperature and Install Variable Frequency Drives Finding Description CSI energy management modulates the fluid cooler fan and spray pump to maintain water loop temperature leaving each fluid cooler at 85°F. Short-term monitoring verified that the outlet water temperature for both the east and west loops ranged from 83°F to 88°F when the fluid coolers are operating. Inlet water temperatures range from 87°F to 91°F. Recommendation This measure is presented as an alternative to Finding 05 – Reduce Condenser Water Loop Temperature. Reducing the condenser water loop temperature set point from 85°F to 75°F will improve the individual heat pump compressor operating efficiencies. According to the heat pump manufacturer’s literature, entering condenser water temperature can range from 95°F to 60°F. The improved compressor operating efficiencies will result in electrical energy consumption and demand savings. As a consequence, fluid cooler fan operation will increase in order to provide the colder water, however, the efficiency improvement for all 175 heat pumps will far outweigh any fan energy increase. The measure also includes installing variable frequency drives for infinite fan modulation in order to maintain loop temperature setpoint. The measure is mutually exclusive with Finding 05 – Reduce Condenser Water Loop Temperature and Finding 06 – Reduce Condenser Water Loop Temperature and Install Two-speed Motors. Energy and demand savings were calculated using DOE-2 hourly simulation program. Several model runs were made at 2°F increments from current setpoint of 85°F to 67°F do develop a family of curves from which energy, demand, and cost savings can be interpreted. These curves, entitled Water Loop Temperature Reset Energy Savings and Water Loop Temperature Reset Demand Savings, can be found in Appendix G – Savings and Cost Estimates. Note – energy and cost savings have been revised, if necessary, based on actual data gathered during post-retrofit measurement and verification (refer to Measurement & Verification of Savings section of the report for details). In addition, the implementation cost has been revised to reflect actual contractor invoices, if applicable. Estimated Economic Impact Summary Estimated Annual Electrical Energy Savings - 46,000 KWh/yr Estimated Annual Cost Savings - $6,000Estimated Electrical Peak Demand Savings - 9 KW Estimated Implementation Cost - $10,400
Estimated Annual Natural Gas Savings - 0 Therm/yr Simple Payback (yrs) - 1.7 Implementation Plan The condenser water loop temperature set points should be reprogrammed from 85°F to 75°F within the CSI energy management system. The work should be performed by a controls contractor. Implementation cost
Portland Energy Conservation, Inc. (PECI) Page 32 © 2005, Portland Energy Conservation, Inc. (PECI). All rights reserved.

Building X – City Y, CA
has been estimated based on 4 hours of programming at a rate of $100 per hour. In addition, installation of two 25 HP variable frequency drives will be performed by an HVAC contractor. Costs include purchase and installation of the new VFDs, including taxes, contractor overhead and profit. Further Investigation Required by PECI Under Current Scope - No No, or Low Capital Expenditure to Implement - No Further Study or Engineering Needed Outside Current Scope - No Significant Capital Expenditure to Implement - Yes Further Investigation/Testing Required by the Owner - No Savings Calculation Method - DOE-2 model analysis Follow-Up By PECI Required to Implement Under Current Scope - No Identification Method - Analysis of monitoring data Owner Action Taken This measure was not implemented by the owner. 08 Trim West Loop Pump Impeller Finding Description The west end water loop is served by a 20 HP pump and design for the loop is 600 GPM at 84 feet of head. During the site visit, pump discharge and suction pressures were measured and determined to be operating at 75 feet of head. Based on the pump curve for the nameplate impeller size, it is estimated that the pump is currently delivering approximately 750 GPM through the loop. A significant amount of energy is wasted by circulating more water through the system than is required by the heat pumps since pipe friction losses are a function of the square of the velocity ( hl α V2). A 50% reduction in velocity reduces friction loss to 25% of their original values. Recommendation The recommendation is made to trim the impeller to a size that will deliver design flow rate with the main balancing valve wide open. A “no-flow” test was performed by facility maintenance personnel. This test verified the impeller size listed on the nameplate is correct at 9.5 inches. Therefore, the system evaluation is based on the nameplate impeller size. Currently the balancing valve is wide open and net head developed by the pump was measured at 75 feet. This corresponds to approximately 750 GPM or water flow. Pump curve analysis predicts that design flow could be achieved with a 7.6 inch impeller, but the smallest impeller than can be used in the pump is 8 inch. Therefore energy savings are based on using an 8-inch impeller. Detailed calculation for this measure is provided in the spreadsheet entitled Trim West Loop Pump Impeller located in Appendix G – Savings and Cost Estimates. Since both demand and energy savings will occur, the average energy cost of $0.1211/kWh, which includes all taxes and demand costs, was used to estimate cost savings. Note – energy and cost savings have been revised, if necessary, based on actual data gathered during post-retrofit measurement and verification (refer to Measurement & Verification of Savings section of the report for details). In addition, the implementation cost has been revised to reflect actual contractor invoices, if applicable. Estimated Economic Impact Summary Estimated Annual Electrical Energy Savings - 19,890 KWh/yr Estimated Annual Cost Savings - $2,409Estimated Electrical Peak Demand Savings - 6.0 KW Estimated Implementation Cost - $2,426
Estimated Annual Natural Gas Savings - 0 Therm/yr Simple Payback (yrs) - 1.0
Portland Energy Conservation, Inc. (PECI) Page 33 © 2005, Portland Energy Conservation, Inc. (PECI). All rights reserved.

Building X – City Y, CA
Implementation Plan Implementation of this measure consists of labor to remove, trim the impeller from 9.5 inches to 8 inches, and reinstall the impeller, as well as new gaskets for the pump. Since there are two pumps operating in a lead/lag configuration, both pump impellers must be modified. Further Investigation Required by PECI Under Current Scope - Yes No, or Low Capital Expenditure to Implement - Yes Further Study or Engineering Needed Outside Current Scope - No Significant Capital Expenditure to Implement - No Further Investigation/Testing Required by the Owner - No Savings Calculation Method - Spreadsheet Follow-Up By PECI Required to Implement Under Current Scope - No Identification Method - Analysis of site data Owner Action Taken This measure was not implemented by the owner. 09 Tune-up Heat pumps Finding Description A majority of the heat pumps installed at the facility are original equipment and have not had a tune-up subsequent to installation. A system tune-up includes checking for correct refrigerant charge, proper adjustment of thermal expansion valve, and maintaining the lowest possible condensing pressure. Recent studies indicate that up to 70% of all HVAC system are improperly charged, or have other system deficiencies, which results in reduced efficiency and system capacity. Energy savings associated with an overall system tune-ups can be 5% or greater. Recommendation The recommendation is made to tune-up each heat pump to ensure optimum operation. Existing cooling and heating energy usage is estimated to be 460,378 kWh/yr based on the DOE-2 hourly simulation. Energy savings have been estimated to be 5%, which corresponds to approximately 23,000 kWh/yr energy savings and a cost savings of approximately $2,800 per year. However since there are 175 heat pumps located up in the ceiling spaces, tune-up cost was estimated at $20,700, including 1.5 hour per heat pump at $65 per hour, contractor overhead and profit, contingency, and refrigerant material costs. This results in over a 7-year payback, which is cost prohibitive. The majority of the labor involves accessing the heat pumps in the ceiling space. However, if more than routine maintenance is performed on any of the heat pumps (by a qualified contractor), or if a heat pump is being moved or otherwise exposed, that particular units should be tuned-up at that time. This will minimize the bulk of the labor cost outlined above, and be reduced to labor to test refrigerant charge and replace refrigerant as necessary. Owner Action Taken This measure was not implemented by the owner, but the owner stated that each heat pump will be tuned in the future whenever more than routine maintenance is performed on any of the heat pumps or if a heat pump is being moved or otherwise exposed.
Portland Energy Conservation, Inc. (PECI) Page 34 © 2005, Portland Energy Conservation, Inc. (PECI). All rights reserved.

Building X – City Y, CA
10 Modify the East Loop Pump Flow Rate Finding Description The east end water loop is served by a 15 HP pump and design for the loop is 450 GPM at 90 feet of head. During the site visit, pump discharge and suction pressures were measured and determined to be operating at 83 feet of head. Depending on the size of the impeller installed in this pump, the pump may be delivering more water through the loop than necessary. A significant amount of energy is wasted by circulating more water through the system than is required by the heat pumps due to pipe friction losses being a function of the square of the velocity ( hl α V2). A 50% reduction in velocity reduces friction loss to 25% of their original values. Recommendation Nameplate states that a 10.6 inch impeller is installed. Facility maintenance personnel performed a “no-flow” test that verified the nameplate impeller size is correct. An evaluation based on this impeller size indicates there is more water is flowing through the loop than design flow rate. Therefore the recommendation is to throttle the balancing valve until the head developed by the pump corresponds to design flow rate. The reason that we would not recommend trimming the impeller is because the smallest size available for this particular pump is only 10 inches and nameplate is 10.6 inches. It is more economical to throttle the balancing valve than trim the impeller. However, persistence for this improvement is at risk unless there is good documentation stating why the valve is placed in the throttled position and signage at the valve that clearly states not to change the position of the valve. Owner Action Taken This measure was not implemented by the owner. 11 Inspect Fluid Cooler Chemical Treatment Finding Description Chemical concentration is maintained in an evaporative cooler by adding fresh water and chemicals into the unit, more commonly know as “bleed”. Generally the amount of water bled from the unit occurs intermittently depending of the concentration levels of total dissolved solids being maintained. The concentration increases as water is evaporated from the cooler and the bleed adds water back into the system to stabilize the concentration. Under extreme operating conditions where the evaporation rate is very high, the water bleed and chemical infusion can be large in order to maintain the desired concentration level. However during the site visit, it was noted that a large amount of water was bled from the east loop fluid cooler and this occurred several times within the course of a few hours. The outdoor dry bulb and wet bulb temperatures at the time the successive bleed sequences occurred were approximately 64°F Tdb and 60°F Twb, respectively, which would not impose a large evaporation load on the system. In addition during the same time frame, the west loop fluid cooler did not bleed any water at all, yet it appeared to be operating and cycling in a similar fashion to the east loop cooler. Therefore, based on the amount of water discharged, the frequency of the bleed, and the fact that the west cooler did not act similarly indicates that there may be a problem with the chemical monitoring system serving the east loop fluid cooler.
Portland Energy Conservation, Inc. (PECI) Page 35 © 2005, Portland Energy Conservation, Inc. (PECI). All rights reserved.

Building X – City Y, CA
Recommendation The recommendation is to contact the chemical treatment company and ask to have both fluid cooler chemical systems inspected. Excessive bleed from the cooler wastes not only water but also chemicals. Owner Action Taken The owner was already aware of the chemical treatment system problem observed by the audit team and the system has been repaired. 12 Install Automatic Two-way Control Valves on each Heat Pump Finding Description It was noted that all of the heat pumps have manual ball valves installed in both the supply and return lines. Based on original design data, these valves were supposed to have a memory stop so that they could act as both isolation valves and balancing valves. However, all of the valves are wide open and allow water to flow through the heat pump whether the compressor is operating or not. Recommendation The recommendation is made to install automatic two-way control valves at each heat pump. When the compressor is operating the valves will be open but will automatically shut when the compressor turns off because water only needs to flow through each unit when the compressor is running. This modification would change the water loop from being a constant volume system to a variable volume system, which would save pumping energy. Current design flow rates through the west and east loops are 600 GPM and 450 GPM, respectively, and this amount of water is moved whether a heat pump requires it or not. Energy savings can be achieved by only moving the amount of water needed by the heat pumps that are operating at any given time. Pump power is proportional to the cube of the flow (BHP α GPM3). A system operating at 75% flow reduces pump brake horsepower requirements to 42% of the original value. It is not unreasonable to assume that the annual average flow through the system could be 75% of design due to the cycling of compressors to meet varying loads. Based on this assumption, estimated energy savings for both loop systems could be: Existing energy usage = 20.2 kW x 3,315 hr/yr = 66,963 kWh/yr (scheduling changes and impeller trim completed) Proposed energy usage = 20.2 kW x 42% x 3,315 = 28,125 kWh/yr Energy savings = 38,838 kWh/yr Cost savings = $3,030 per year (based on $0.078/kWh, includes taxes but no demand) As the control valves closed, water pressure would build up in the loop that would push the operating point of pumps higher up their performance curve. Both pumps have very flat performance curves. This means that a small change in system pressure has a large impact on the flow delivered by the pump. This performance characteristic would allow the pumps to accommodate a variable load efficiently without the need for additional controls like a variable frequency drive in order to maximize energy savings.
Portland Energy Conservation, Inc. (PECI) Page 36 © 2005, Portland Energy Conservation, Inc. (PECI). All rights reserved.

Building X – City Y, CA
A material cost of $100 per control valve multiplied by 175 units equates to $17,500, which puts the simple payback at over 5 years. The most expensive part of this measured would be installation since each heat pump would have to be accessed and worked on. Therefore the measure is not cost effective if implemented as a stand-alone measure. However if a heat pump needs to be replaced, or is moved, or if more than routine maintenance is performed by an HVAC contractor on any unit, consider installing an automatic control valve at that time. Basically the only cost would be material and labor would be minimal since the unit is already exposed. Owner Action Taken The owner will consider implementing this measure on an individual basis when a heat pump is being moved or replaced. 13 Close Water Loop Make-up Line Valve Finding Description It was noted during the site inspection that the valves on the make-up water line serving each heat pump water loop are open continually, which allows water to enter the loop if needed. This may seem like a good idea but it can also be an accident waiting to happen. With the valve wide open, water would continue to flow into the loop even if there was a catastrophic leak in the system. Recommendation The recommendation is made to close the make-up valves and install a pressure transmitter in each water loop. The pressure transmitter should be connected to the CSI energy management system to alert the system operator of a loss of pressure and shut down the heat pumps and main circulation pumps. Water could then be manually added to the system once the cause for the pressure loss is identified and repaired. To put this issue in perspective, we know of a multi-story office building with a water loop heat pump system that did experience a rupture in one of the flex lines connected to a heat pump. The line ruptured on a Friday night on one of the upper floors and the make-up line continued to supply water to the loop until Sunday when maintenance personnel noticed water flooding the first floor of the building. Needless to say all of the floors below the rupture experienced heavy water damage because the make-up line tried to keep the loop full of water. Owner Action Taken This measure was not implemented by the owner.
IMPLEMENTATION OF RECOMMENDATIONS
IMPLEMENTATION PLAN
PECI presented the owner with an interim report outlining all findings and a list of measures recommended for implementation. Facility management reviewed the report and decided on which measures they wanted
Portland Energy Conservation, Inc. (PECI) Page 37 © 2005, Portland Energy Conservation, Inc. (PECI). All rights reserved.

Building X – City Y, CA
to implement. PECI offered limited assistance during implementation, but the owner took full responsibility for contracting out the implementation or performing the work themselves. Due to the project timeline, all measures had to be completed by the end of February 2002.
MEASUREMENT & VERIFICATION OF SAVINGS
MEASUREMENT & VERIFICATION PLAN
The measurement and verification (M&V) plan uses the International Performance Measurement and Verification Protocol (IPMVP) as a guide. The IPMVP was sponsored by the Department of Energy and created by hundreds of experts from over 25 countries. It provides an overview of current best practice techniques available for verifying the results of energy efficiency projects. North America’s utilities and energy service companies have adopted the IPMVP as the industry standard approach to M&V. The IPMVP contains four major approaches to performing M&V. For this project we have selected two options. The first, Option D – Calibrated Simulation, deals with the following project goals: a rigorous level of investigation; the implementation of operation, maintenance, and control optimization measures; whole building savings analysis; and quick verification as opposed to long term data monitoring. Option D is more rigorous, more accurate, and quicker than methods utilizing actual pre- and post-installation utility billing data. The basic M&V equation for Option D is:
Energy Savings = Calibrated baseline building model – Post monitoring building model The baseline building model was developed using DOE-2.1E, an hourly building energy simulation program. The development and calibration of the baseline model was discussed in detail previously in the report. The base year energy usage for the facility was defined as the twelve months billing history preceding the initial site inspection (October 2000 through September 2001). Annual energy savings were identified for each ECM as well as for the whole building, including all interactions between measures. The process for verification of the individual ECM was to first implement the measures, then perform post implementation monitoring. The post monitoring data was used to verify changes made and adjust the ECM model accordingly. The total energy savings are the difference between the results of the calibrated baseline model and the calibrated ECM model. Separate runs of the model were made for each ECM as well as groups of ECMs, where appropriate. The second option used for this project, Option A – Partially Measured Retrofit Isolation, was used for the measures that did not lend themselves to M&V using the calibrated model approach. This option employs engineering calculations verified with site inspections and short term monitoring. Energy savings were based on the difference between the pre-and post-installation engineering calculations.
Portland Energy Conservation, Inc. (PECI) Page 38 © 2005, Portland Energy Conservation, Inc. (PECI). All rights reserved.
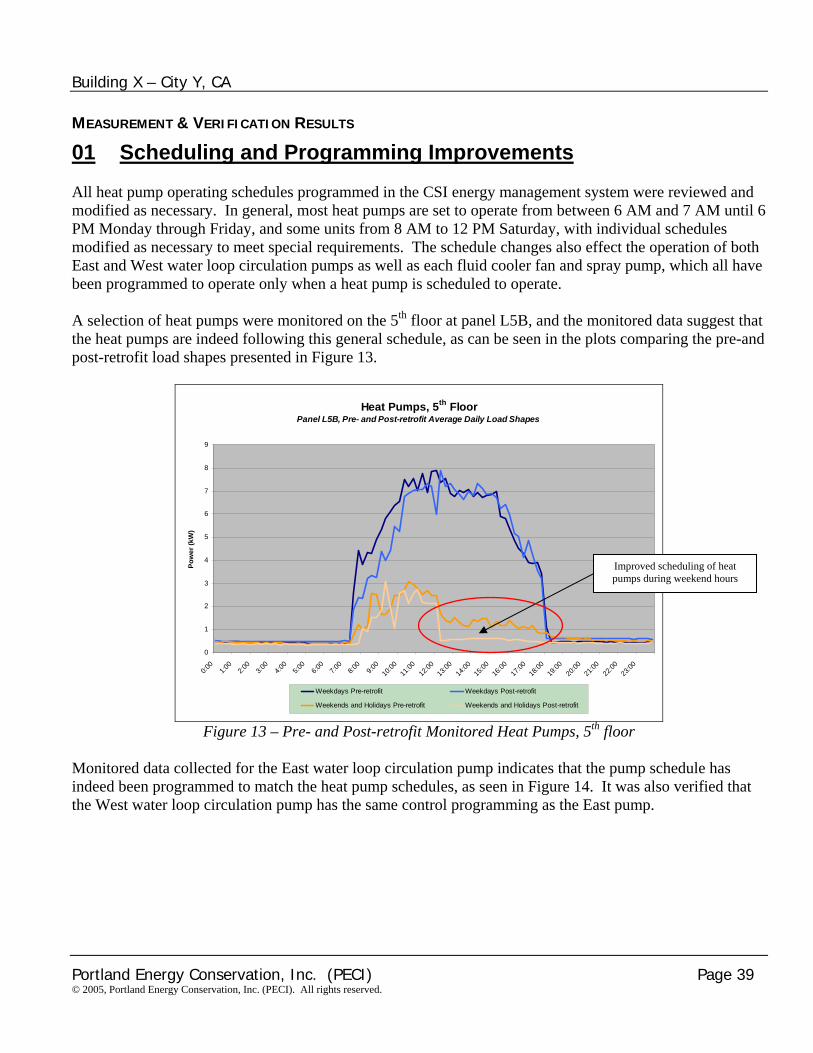
Building X – City Y, CA
MEASUREMENT & VERIFICATION RESULTS
01 Scheduling and Programming Improvements All heat pump operating schedules programmed in the CSI energy management system were reviewed and modified as necessary. In general, most heat pumps are set to operate from between 6 AM and 7 AM until 6 PM Monday through Friday, and some units from 8 AM to 12 PM Saturday, with individual schedules modified as necessary to meet special requirements. The schedule changes also effect the operation of both East and West water loop circulation pumps as well as each fluid cooler fan and spray pump, which all have been programmed to operate only when a heat pump is scheduled to operate. A selection of heat pumps were monitored on the 5th floor at panel L5B, and the monitored data suggest that the heat pumps are indeed following this general schedule, as can be seen in the plots comparing the pre-and post-retrofit load shapes presented in Figure 13.
Heat Pumps, 5th FloorPanel L5B, Pre- and Post-retrofit Average Daily Load Shapes
0
1
2
3
4
5
6
7
8
9
0:00
1:00
2:00
3:00
4:00
5:00
6:00
7:00
8:00
9:00
10:00
11:00
12:00
13:00
14:00
15:00
16:00
17:00
18:00
19:00
20:00
21:00
22:00
23:00
Pow
er (k
W)
Weekdays Pre-retrofit Weekdays Post-retrofit
Weekends and Holidays Pre-retrofit Weekends and Holidays Post-retrofit
Improved scheduling of heat pumps during weekend hours
Figure 13 – Pre- and Post-retrofit Monitored Heat Pumps, 5th floor Monitored data collected for the East water loop circulation pump indicates that the pump schedule has indeed been programmed to match the heat pump schedules, as seen in Figure 14. It was also verified that the West water loop circulation pump has the same control programming as the East pump.
Portland Energy Conservation, Inc. (PECI) Page 39 © 2005, Portland Energy Conservation, Inc. (PECI). All rights reserved.

Building X – City Y, CA
Water Loop Pump 4 (Cooling Tower 2)Pre- and Post-retrofit Average Daily Load Shapes
0
6
8
10
12
14
16
0:00
1:00
2:00
3:00
4:00
5:00
6:00
7:00
8:00
9:00
10:00
11:00
12:00
13:00
14:00
15:00
16:00
17:00
18:00
19:00
20:00
21:00
22:00
23:00
Pow
er (k
W)
2
4
Weekdays Pre-retrofit Saturdays Pre-retrofit Sundays & Holidays Pre-retrofit
Weekdays Post-retrofit Saturdays Post-retrofit Sundays & Holidays Post-retrofit
Water loop pump scheduled off at 6:30PM weekdays and Saturdays
Water loop pump is off on Sundays and holidays
Water loop pump scheduled on at 6AM weekdays, and
7AM on Saturdays
Figure 14 – Pre- and Post-retrofit Monitored Water Loop Pump #4
The fluid cooler spray pump control logic was adjusted so that both spray pumps are scheduled to turn on and off according to the heat pump schedule, but pump operation during occupied hours is based on satisfying loop temperatures. The monitored data suggest that this is indeed the case, as seen in Figure 15.
Portland Energy Conservation, Inc. (PECI) Page 40 © 2005, Portland Energy Conservation, Inc. (PECI). All rights reserved.

Building X – City Y, CA
Fluid Cooler Spray PumpsPre- and Post-retrofit Average Daily Load Shapes
0
0.5
1
1.5
2
2.5
3
3.5
4
0:00 1:00 2:00 3:00 4:00 5:00 6:00 7:00 8:00 9:0010:0011:0012:0013:0014:0015:0016:0017:0018:0019:0020:0021:0022:0023:00
Pow
er (k
W)
Weekdays - Pre-retrofit Weekends and Holidays - Pre-retrofit
Weekdays - Post-retrofit Weekends and Holidays - Post-retrofit
Spray pumps shut off when heat pumps shut
off on weekdays
Spray pump operation on weekends significantly
reduced due to reduced heat pump operation
Figure 15 – Pre- and Post-retrofit Monitored Spray Pumps (#1 and #2)
The preceding graphs verify that the recommended schedules used in the DOE-2 model to estimate energy savings have been programmed into the CSI energy management system and the equipment is operating as intended. Therefore the original energy savings estimated for this measure are acceptable and do not need to be modified. 06 Reduce Condenser Water Loop Temperature and Install Two-speed Motors This measure is a combination of Finding 04 – Install Two-speed Motors on Fluid Cooler Fans and Finding 05 – Reduce Condenser Water Loop Temperature due to the significant interaction each measure imposes on overall energy savings. The measure involved installing new 25 HP, two-speed motors on each fluid cooler fan and adjusting the cut in and cut out setpoints for the spray pump, low-speed fan stage, and high-speed fan stage to maintain water loop temperatures at 74°F, 75°F, and 80°F, respectively. Nameplate data for the new motors state: 25 HP/6.25 HP; 30.7 amps/11.5 amps; 1765 rpm/880 rpm at high speed/low speed, respectively. Based on these values, the input power for the motor at low-speed is estimated at 5.8 kW, assuming a motor efficiency of 80% at low speed ([6.25 HP x 0.746 kW/HP] / 80%). Figure 16 compares pre- and post-retrofit fan power consumption, which demonstrates that the new fan is operating at low-speed (6 kW vs. 20 kW). In addition Figure 17 indicates that the new fluid cooler fan was operating at low-speed throughout the monitoring period to satisfy loop temperature setpoints (measured amperage corresponds to nameplate 11.5 amps at low-speed).
Portland Energy Conservation, Inc. (PECI) Page 41 © 2005, Portland Energy Conservation, Inc. (PECI). All rights reserved.

Building X – City Y, CA
5
10
15
20
15 16 17 18 19
Pow
er (k
W)
Hour of the Day
S 14 Clg Twr: pre Fan+ Power S 34 Clg Twr: post Fan+ PowerFluid Cooler #1, Pre- and Post-retrofit
Pre-retrofit fluid cooler fan operation (single speed, 25 HP motor)
Post-retrofit fluid cooler fan operation (2-speed), operating
at its lower speed
Figure 16 – Pre- and post-retrofit monitored fluid cooler #1 fan
No equipment ran on Sunday
Fan operated at low-speed throughout the weekday monitoring period
Only the spray pump ran on Saturday to meet the load
Sun Sat Fri
Figure 17 Post-retrofit Monitored East Fluid Cooler Data There is a discrepancy between the water loop temperature measured during the post-retrofit monitoring period (88°F – refer to “East Loop Supply Temperature” graph in Figure 17) and what facility personnel witnessed in the field and monitored through the CSI energy management system (80°F). Since the CSI monitoring results are comparable to what has been programmed and it is possible that the wrong temperature was measured during the post-retrofit monitoring period, we have accepted the CSI monitoring results provided by the facility personnel. However, energy and cost savings have been revised to reflect an 80°F water loop temperature compared to the recommended setpoint of 75°F.
Portland Energy Conservation, Inc. (PECI) Page 42 © 2005, Portland Energy Conservation, Inc. (PECI). All rights reserved.

Building X – City Y, CA
MAINTENANCE OF SAVINGS
IMPLEMENTATION PERSISTENCE
Continued maintenance of savings is an essential factor in insuring the success over time of a particular project and of retrocommissioning in general. Retrocommissioning often involves the implementation of measures that can degrade over time if not maintained or managed properly, reducing the net positive cash flow the owner can realize.
BENCHMARKING & CONTINUOUS MONITORING OF ENERGY USE
In order to insure measure persistence over time and the overall success of the project, the building can be "benchmarked", then have the utility use tracked over time (normalized for weather data or other operating conditions). This continuous monitoring can be configured to notify the owner of any deviation from the savings plan in order to allow for active changes in the building's operation to stay within the savings plan. Options available include third party remote monitoring, building automation system monitoring, dedicated monitoring systems, and low-cost self-monitoring. Additional information on benchmarking can be found at the Environmental Protection Agency web site: www.epa.gov/buildings/label/html/introduction.html, and information on utility tracking can be found at the California Energy Commission web site: www.energy.ca.gov/reports/efficiency_handbooks/index.html.
ENERGY REDUCTION TARGETING
Once the building is benchmarked, a target can be set to encourage further building operations improvements and energy awareness efforts. Many times building owners are unaware of the energy use of their own buildings. Having the tools to track and reduce energy usage is the first step toward being able to optimize a building's operations.
RECOMMISSIONING
Periodically the facility should be recommissioned to verify and ensure that changes made to the building's operations and equipment during the original retrocommissioning process are still applicable and maintained over time. Recommissioning helps to guard against degradation of savings and helps to ensure the net positive cash flow throughout the life of the project that result from the owner's investment. The optimum frequency of recommissioning may vary from every quarter to every five years depending on the size and nature of the project. For this project, annual recommissioning is recommended.
Portland Energy Conservation, Inc. (PECI) Page 43 © 2005, Portland Energy Conservation, Inc. (PECI). All rights reserved.
Building X – City Y, CA
APPENDICES A. Photos B. Utility History Analysis Figures C. Pre-retrofit Data Logging Trend Analysis Figures D. Pre-retrofit Monitoring Average Daily Load Shapes E. Retrocommissioning Plan F. Savings and Cost Estimates G. Post-retrofit Data Logging Trend Analysis Figures
Portland Energy Conservation, Inc. (PECI) Page 44 © 2005, Portland Energy Conservation, Inc. (PECI). All rights reserved.

Building X – City Y, CA
APPENDIX A. PHOTOS
Typical Evaporative Fluid Cooler
West end Water Loop Pumps
Portland Energy Conservation, Inc. (PECI) Page 45 © 2005, Portland Energy Conservation, Inc. (PECI). All rights reserved.

Building X – City Y, CA
Portland Energy Conservation, Inc. (PECI) Page 46 © 2005, Portland Energy Conservation, Inc. (PECI). All rights reserved.

Building X – City Y, CA
Typical Isolation / Balancing Ball Valves on each Heat Pump
CSI Energy Management Controller Panel
Portland Energy Conservation, Inc. (PECI) Page 47 © 2005, Portland Energy Conservation, Inc. (PECI). All rights reserved.

Building X – City Y, CA
Typical Return Air and Outside Air Connections
Fluid Cooler CSI Control Panel
Portland Energy Conservation, Inc. (PECI) Page 48 © 2005, Portland Energy Conservation, Inc. (PECI). All rights reserved.

Building X – City Y, CA
APPENDIX B. UTILITY HISTORY ANALYSIS FIGURES
Portland Energy Conservation, Inc. (PECI) Page 49 © 2005, Portland Energy Conservation, Inc. (PECI). All rights reserved.

Building X – City Y, CA
APPENDIX C. PRE-RETROFIT DATA LOGGING TREND ANALYSIS FIGURES
0
10
20
amps
Heat Pumps, 6th Floor 21,25,29
0
20
40
amps
Heat Pumps, 6th Floor 21,23,28
0
5
10
15
20
11/15/01 11/17/01 11/19/01 11/21/01 11/23/01 11/25/01 11/27/01 11/29/01
amps
Date
Heat Pumps, 6th Floor 21,27
50
100
°F
Heat Pump, 4th floor - SAT
70
80
°F
Heat Pump, 4th floor - RAT
0
10
amps
Heat Pump, 4th floor - Compressor & Fan
0
2
4
6
11/15/01 11/17/01 11/19/01 11/21/01 11/23/01 11/25/01 11/27/01 11/29/01
amps
Date
Heat Pump, 4th floor - Compressor Only
Portland Energy Conservation, Inc. (PECI) Page 50 © 2005, Portland Energy Conservation, Inc. (PECI). All rights reserved.

Building X – City Y, CA
0
50
amps
Heat Pumps, 5th Floor 38,45,?
0
10
20
amps
Heat Pumps, 5th Floor 35,36,44
0
10
20
30
11/15/01 11/17/01 11/19/01 11/21/01 11/23/01 11/25/01 11/27/01 11/29/01
amps
Date
Heat Pumps, 5th Floor 41,42,43
60
70
80
°F
Heat Pump, 1st Floor - RAT
50607080
°F
Heat Pump, 1st Floor - SAT
0
10
20
amps
Heat Pump, 1st Floor - Compressor & Fan
0
5
10
11/15/01 11/17/01 11/19/01 11/21/01 11/23/01 11/25/01 11/27/01 11/29/01
amps
Date
Heat Pump, 1st Floor - Compressor Only
Portland Energy Conservation, Inc. (PECI) Page 51 © 2005, Portland Energy Conservation, Inc. (PECI). All rights reserved.

Building X – City Y, CA
0
10
20am
ps
Heat Pumps, 3rd Floor 21,39
0
10
20
amps
Heat Pumps, 3rd Floor 27,30
0
50
amps
Heat Pumps, 3rd Floor 23,24,31
0
20
40
60
11/15/01 11/17/01 11/19/01 11/21/01 11/23/01 11/25/01 11/27/01 11/29/01
amps
Date
Heat Pumps, 3rd Floor 25,29
70
80
90
°F
Loop - east supply temperature
70
80
90
100
°F
Loop - east return temperature
50
100
°F
Loop - west supply temperature
60
80
100
11/15/01 11/17/01 11/19/01 11/21/01 11/23/01 11/25/01 11/27/01 11/29/01
°F
Date
Loop - west return temperature
Portland Energy Conservation, Inc. (PECI) Page 52 © 2005, Portland Energy Conservation, Inc. (PECI). All rights reserved.

Building X – City Y, CA
0
50
100
amps
Cooling Tower Fan #2
0.0
10.0
amps
Cooling Tower - spray pump #2
0
10
20
11/15/01 11/17/01 11/19/01 11/21/01 11/23/01 11/25/01 11/27/01 11/29/01
amps
Date
Water loop pump #4
0
15
30
amps
Water loop pump #2
0
1
2
3
amps
Cooling tower spray pump #1
0
30
60
amps
Cooling tower fan #1
40
60
80
100
11/15/01 11/17/01 11/19/01 11/21/01 11/23/01 11/25/01 11/27/01 11/29/01
°F
Date
Ambient Temperature
Portland Energy Conservation, Inc. (PECI) Page 53 © 2005, Portland Energy Conservation, Inc. (PECI). All rights reserved.

Building X – City Y, CA
0
20
40am
ps
Heat Pumps, 5th Floor 23,24,28
0
5
10
15
20
amps
Heat Pumps, 5th Floor 20,21,22
0
5
10
15
20
11/15/01 11/17/01 11/19/01 11/21/01 11/23/01 11/25/01 11/27/01 11/29/01
amps
Date
Heat Pumps, 5th Floor 26,27,30
45
60
75
90
°F
Heat Pump, 3rd Floor - SAT
65
70
75
80
°F
Heat Pump, 3rd Floor - RAT
0
10
20
amps
Heat Pump, 3rd Floor - Compressor & Fan
0
2
4
6
11/15/01 11/17/01 11/19/01 11/21/01 11/23/01 11/25/01 11/27/01 11/29/01
amps
Date
Heat Pump, 3rd Floor - Fan Only
Portland Energy Conservation, Inc. (PECI) Page 54 © 2005, Portland Energy Conservation, Inc. (PECI). All rights reserved.

Building X – City Y, CA
0
20
40am
ps
Heat Pumps, 6th Floor 44,40,36,42
0
10
20
30
amps
Heat Pumps, 6th Floor 45,43,35
0
10
20
30
amps
Heat Pumps, 6th Floor 39,37,42
0
5
10
15
11/15/01 11/17/01 11/19/01 11/21/01 11/23/01 11/25/01 11/27/01 11/29/01
amps
Date
Heat Pumps, 6th Floor 38 (602)
60
75
90
°F
Heat Pump, 7th Floor - RAT
50607080
°F
Heat Pump, 7th Floor - SAT
0
5
10
amps
Heat Pump, 7th Floor - Compressor & Fan
0
1
2
11/15/01 11/17/01 11/19/01 11/21/01 11/23/01 11/25/01 11/27/01 11/29/01
amps
Date
Heat Pump, 7th Floor - Fan Only
Portland Energy Conservation, Inc. (PECI) Page 55 © 2005, Portland Energy Conservation, Inc. (PECI). All rights reserved.

Building X – City Y, CA
0
20
40am
ps
Heat Pumps, 3rd Floor 43,45
0
10
20
30
amps
Heat Pumps, 3rd Floor 10,41
01020304050
11/15/01 11/17/01 11/19/01 11/21/01 11/23/01 11/25/01 11/27/01 11/29/01
amps
Date
Heat Pumps, 3rd Floor 40,44
Portland Energy Conservation, Inc. (PECI) Page 56 © 2005, Portland Energy Conservation, Inc. (PECI). All rights reserved.
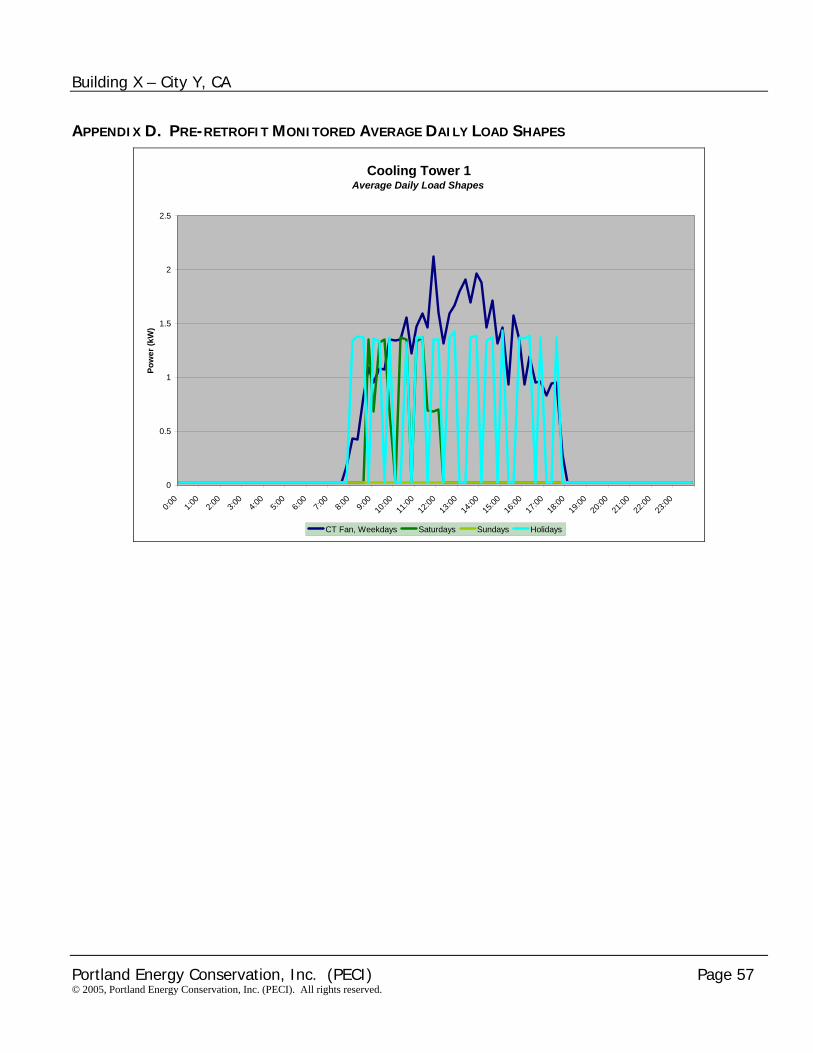
Building X – City Y, CA
APPENDIX D. PRE-RETROFIT MONITORED AVERAGE DAILY LOAD SHAPES
Cooling Tower 1Average Daily Load Shapes
0
0.5
1
1.5
2
2.5
0:00
1:00
2:00
3:00
4:00
5:00
6:00
7:00
8:00
9:00
10:00
11:00
12:00
13:00
14:00
15:00
16:00
17:00
18:00
19:00
20:00
21:00
22:00
23:00
Pow
er (k
W)
CT Fan, Weekdays Saturdays Sundays Holidays
Portland Energy Conservation, Inc. (PECI) Page 57 © 2005, Portland Energy Conservation, Inc. (PECI). All rights reserved.

Building X – City Y, CA
Cooling Tower 1 and Spray PumpAverage Daily Load Shapes
0.0
0.5
1.0
1.5
2.0
2.5
0:00
1:00
2:00
3:00
4:00
5:00
6:00
7:00
8:00
9:00
10:00
11:00
12:00
13:00
14:00
15:00
16:00
17:00
18:00
19:00
20:00
21:00
22:00
23:00
Pow
er (k
W)
CT Fan, Weekdays
CT Fan, Unoccupied Days
Spray Pump, Weekdays
Spray Pump, Unoccupied Days
Cooling Tower 2 and Spray PumpAverage Daily Load Shapes
0.0
0.5
1.0
1.5
2.0
2.5
3.0
0:00
1:00
2:00
3:00
4:00
5:00
6:00
7:00
8:00
9:00
10:00
11:00
12:00
13:00
14:00
15:00
16:00
17:00
18:00
19:00
20:00
21:00
22:00
23:00
Pow
er (k
W)
CT Fan, Weekdays
CT Fan, Unoccupied Days
Spray Pump, Weekdays
Spray Pump, Unoccupied Days
Portland Energy Conservation, Inc. (PECI) Page 58 © 2005, Portland Energy Conservation, Inc. (PECI). All rights reserved.

Building X – City Y, CA
Cooling Tower 2Average Daily Load Shapes
0
0.5
1
1.5
2
2.5
3
0:00
1:00
2:00
3:00
4:00
5:00
6:00
7:00
8:00
9:00
10:00
11:00
12:00
13:00
14:00
15:00
16:00
17:00
18:00
19:00
20:00
21:00
22:00
23:00
Pow
er (k
W)
CT Fan, Weekdays Saturdays Sundays Holidays
Portland Energy Conservation, Inc. (PECI) Page 59 © 2005, Portland Energy Conservation, Inc. (PECI). All rights reserved.

Building X – City Y, CA
Heat Pumps, 3rd FloorAverage Daily Load Shapes
0
2
4
6
8
10
12
14
16
18
0:00
1:00
2:00
3:00
4:00
5:00
6:00
7:00
8:00
9:00
10:00
11:00
12:00
13:00
14:00
15:00
16:00
17:00
18:00
19:00
20:00
21:00
22:00
23:00
Pow
er (k
W)
Weekdays Saturdays Sundays Holidays
Heat Pumps, 5th FloorAverage Daily Load Shapes
0
2
4
6
8
10
12
14
16
18
0:00
1:00
2:00
3:00
4:00
5:00
6:00
7:00
8:00
9:00
10:00
11:00
12:00
13:00
14:00
15:00
16:00
17:00
18:00
19:00
20:00
21:00
22:00
23:00
Pow
er (k
W)
Weekdays Saturdays Sundays Holidays
Portland Energy Conservation, Inc. (PECI) Page 60 © 2005, Portland Energy Conservation, Inc. (PECI). All rights reserved.

Building X – City Y, CA
Heat Pumps, 6th FloorAverage Daily Load Shapes
0
5
10
15
20
25
0:00
1:00
2:00
3:00
4:00
5:00
6:00
7:00
8:00
9:00
10:00
11:00
12:00
13:00
14:00
15:00
16:00
17:00
18:00
19:00
20:00
21:00
22:00
23:00
Pow
er (k
W)
Weekdays Saturdays Sundays Holidays
All Monitored Heat PumpsAverage Daily Load Shapes
0
10
20
30
40
50
60
0:00
1:00
2:00
3:00
4:00
5:00
6:00
7:00
8:00
9:00
10:00
11:00
12:00
13:00
14:00
15:00
16:00
17:00
18:00
19:00
20:00
21:00
22:00
23:00
Pow
er (k
W)
Occupied Days Saturdays Sundays Holidays
Portland Energy Conservation, Inc. (PECI) Page 61 © 2005, Portland Energy Conservation, Inc. (PECI). All rights reserved.

Building X – City Y, CA
APPENDIX E. POST-RETROFIT DATA LOGGING TREND ANALYSIS FIGURES
Portland Energy Conservation, Inc. (PECI) Page 62 © 2005, Portland Energy Conservation, Inc. (PECI). All rights reserved.

Building X – City Y, CA
APPENDIX F. RETROCOMMISSIONING PLAN
Retrocommissioning Plan
Building Name: Building X Address: City/State/Zip: Main Contact: Address: Phone: Building Sq. Ft. 125,000 SF Commissioning Provider: Firm: PECI Address: City/State/Zip: Phone: Primary Project Objectives There are three primary objectives for performing retrocommissioning at Building X: 1. Obtain cost effective energy savings from optimizing how the building’s energy using systems are operated and
maintained.
2. Identify and recommend improvements to operations and maintenance procedures focusing on those activities that sustain optimal energy performance and reduce operating costs.
3. Identify HVAC related health and safety issues as they present themselves during the normal course of the commissioning work and report them to the facility manager.
Building Description Building X office building is a seven story, 125,000 square foot building with two floors of underground parking. The building was constructed in 1983. Primary heating and cooling is provided by a water-source heat pump system. The heat pumps are located in each suite and are 6 months to 15 years old. Each heat pump is controlled by a zone thermostat. The building also has two Baltimore Air Coil evaporative fluid coolers that are less than a year old. One evaporative cooler serves the east heat pump water loop and the other serves the west loop. A back up boiler is available but has never been needed. The building is equipped with a CSI energy management control system (EMCS), with the following control capabilities:
Schedule control over HVAC equipment operation (start/stop). • • •
Heat pump operation is controlled by local zone thermostats (not connected to EMCS). Heat pump water loop temperature and evaporative cooler staging is controlled by the EMCS.
Portland Energy Conservation, Inc. (PECI) Page 63 © 2005, Portland Energy Conservation, Inc. (PECI). All rights reserved.
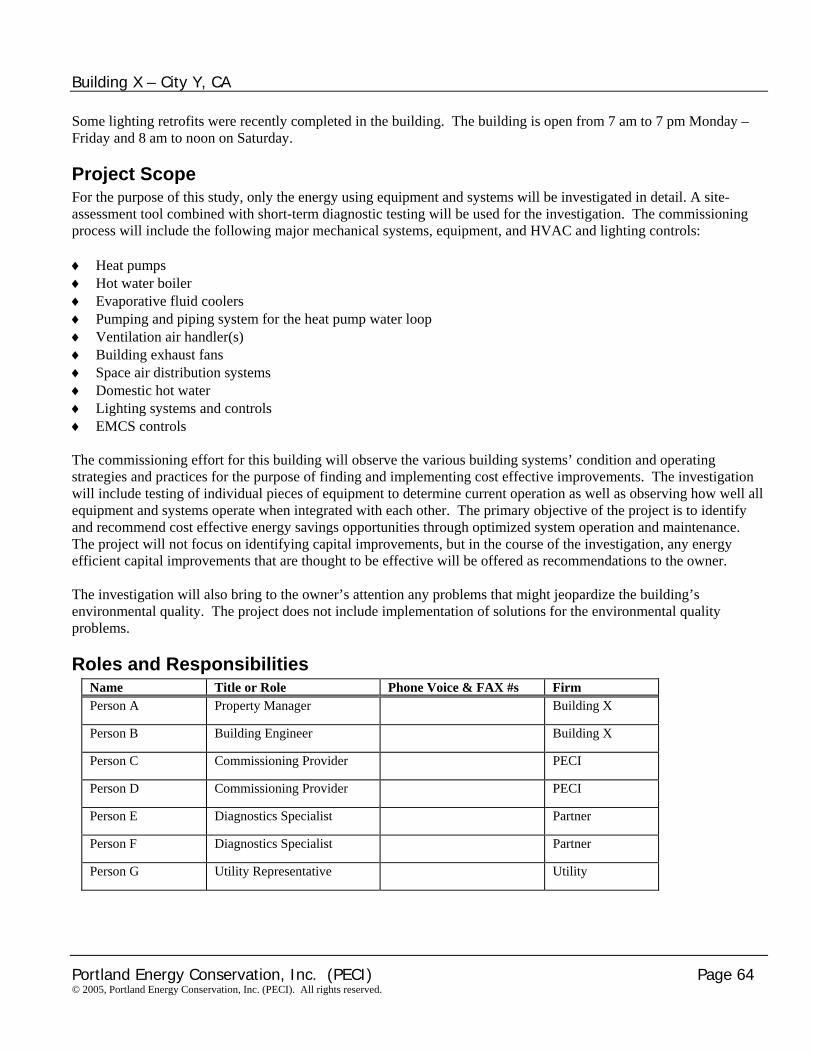
Building X – City Y, CA
Some lighting retrofits were recently completed in the building. The building is open from 7 am to 7 pm Monday – Friday and 8 am to noon on Saturday. Project Scope For the purpose of this study, only the energy using equipment and systems will be investigated in detail. A site-assessment tool combined with short-term diagnostic testing will be used for the investigation. The commissioning process will include the following major mechanical systems, equipment, and HVAC and lighting controls: ♦ Heat pumps ♦ Hot water boiler ♦ Evaporative fluid coolers ♦ Pumping and piping system for the heat pump water loop ♦ Ventilation air handler(s) ♦ Building exhaust fans ♦ Space air distribution systems ♦ Domestic hot water ♦ Lighting systems and controls ♦ EMCS controls The commissioning effort for this building will observe the various building systems’ condition and operating strategies and practices for the purpose of finding and implementing cost effective improvements. The investigation will include testing of individual pieces of equipment to determine current operation as well as observing how well all equipment and systems operate when integrated with each other. The primary objective of the project is to identify and recommend cost effective energy savings opportunities through optimized system operation and maintenance. The project will not focus on identifying capital improvements, but in the course of the investigation, any energy efficient capital improvements that are thought to be effective will be offered as recommendations to the owner. The investigation will also bring to the owner’s attention any problems that might jeopardize the building’s environmental quality. The project does not include implementation of solutions for the environmental quality problems. Roles and Responsibilities
Name Title or Role Phone Voice & FAX #s Firm Person A Property Manager Building X
Person B Building Engineer Building X
Person C Commissioning Provider PECI
Person D Commissioning Provider PECI
Person E Diagnostics Specialist Partner
Person F Diagnostics Specialist Partner
Person G Utility Representative Utility
Portland Energy Conservation, Inc. (PECI) Page 64 © 2005, Portland Energy Conservation, Inc. (PECI). All rights reserved.

Building X – City Y, CA
Owner’s Staff Person A, Property Manager, will be responsible for overseeing the project for Building X. She will facilitate participation of building personnel and service contractors as needed, obtain building documentation as needed, provide input into the investigation process, facilitate the implementation of improvements, and attend meetings as necessary. Person B, the Building Engineer, will provide extensive input into the investigation process, assist with the installation and removal of diagnostic equipment and implementation of the identified commissioning improvements (as needed), and attend meetings when necessary. Contractors Persons C & D, the Commissioning Providers, will develop and write the retrocommissioning plan, develop and administer the site investigation process, oversee the testing and datalogging diagnostic process, develop the deficiency/improvements list (Findings Log), recommend the improvements based on findings, and write the final report. C is the technical lead. D is managing the project. Persons E & F, the Diagnostic Specialists, will develop the diagnostic plan, install the short-term monitoring equipment, analyze and provide diagnostic results for the commissioning process and provide savings analysis for improvements found during monitoring. Utility Personnel Person G is responsible for overseeing the project for Utility and providing support for the project as needed. Schedule for Primary Tasks A draft schedule is given here. The dates and tasks may change as the project progresses. The task list gives a good indication of the general tasks and the order in which they will be undertaken. Table 1: Schedule of Primary Tasks
Task Estimated Completion Date Develop retrocommissioning plan November 2, 2001 Review documentation and develop site-specific assessment tool and checklists
November 2, 2001
Hold scoping meeting November 5, 2001 Perform site investigation and staff interviews November 5-6, 2001 Develop monitoring and trending plans and draft functional performance tests (as needed)
November 9, 2001
Install data loggers for first round of diagnostic monitoring November 16, 2001 Remove data loggers November 30, 2001 Analyze data from trending, logging, and assessment. Finalize the master list of findings (Findings Log).
December 7, 2001
Develop recommendations based on findings and energy calculations, finish preliminary report
December 14, 2001
Present preliminary report to owner and decide on improvements to implement from site investigation and diagnostic monitoring.
December 21, 2001
Implement improvements February 28, 2002
Portland Energy Conservation, Inc. (PECI) Page 65 © 2005, Portland Energy Conservation, Inc. (PECI). All rights reserved.

Building X – City Y, CA
Develop a measurement and verification plan February 28, 2002 Complete measurement and verification March 20, 2002 Submit final report March 31, 2002
As work progresses, the team will be notified of any schedule changes that may affect their specific tasks. Documentation Building staff have provided as much up-to-date and complete documentation as currently available. The EMCS has been set up to collect system operating data on the evaporative coolers and heat pump loops, which will be reviewed during the site visit. Investigation Scope and Methods This section of the plan briefly summarizes which systems, equipment, components, and functions will be investigated through the retrocommissioning process (see Table 2), including the maintenance conditions and operating strategies. The investigation phase begins with an in-depth interview of building staff members in order to gain a thorough understanding of how and why the building is currently operated. Diagnostic methods are also discussed as part of this plan section. Some functional testing may be warranted during the datalogging (short-term monitoring and trending) period to better understand problems uncovered by the process. Table 2: Investigation Summary
Equipment or System Component Function EMCS Lighting Control Schedule (TOD)
Overrides Staging
EMCS HVAC Control • Schedules (TOD) • Night setup and setback • Duct and building static control
• All energy-efficiency and cost related control strategies such as optimum start, resets, load control, etc. Space temperature setpoints
• Heating/cooling control logic, plant and system setpoints and reset schedules
• Lockouts and overrides • Heating and cooling change over
strategies Ventilation Air Handler(s) and/or ductwork
Fan motors and dampers • Damper action and seal • Schedules (TOD) • Minimum air requirements
HVAC Fan Terminal Units • Local thermostat control • Interface with EMCS • Damper operation (return and OSA) • Fan operation
HVAC Heat Pumps • Control Logic • Start/Stop (TOD schedules) • Supply air temperature control • Staging • Lockouts
Portland Energy Conservation, Inc. (PECI) Page 66 © 2005, Portland Energy Conservation, Inc. (PECI). All rights reserved.

Building X – City Y, CA
Equipment or System Component Function HVAC Cooling Tower • Capacity as time and conditions permit
• Fan control – stop/start • Control logic (staging of fan and pump) • Pump control – stop/start • Pump flows
HVAC Boiler • Integral controls • Reset capabilities • Lockouts • Interface with EMCS control logic
• Efficiency and capacity as conditions permit
• Staging • Pump control – stop/start • Pump flows
Domestic Hot Water Control • Temperatures • Pumps • Schedule (TOD)
A sample of EMCS sensors related to the plant and system will be checked for calibration, for example humidity sensors and outside air sensors, as part of the investigation activities. Investigation Phase - Diagnostic Testing Methods Short Term Diagnostics Short term diagnostics for this project will use both portable data loggers to measure temperature, pressures, current, and flows over time and the EMCS trend capabilities. The data loggers will be installed for one to two weeks. The information gathered during this time frame will be analyzed to determine which systems, equipment, and controls are not functioning properly or can be optimized. The diagnostic plan will be developed after completion of the site-assessment. The necessary improvements (operation adjustments, maintenance work, and repairs) will be based on the site investigation and the diagnostic findings (see below, “Prioritizing Improvements for Implementation”). Prioritizing Improvements for Implementation Once the site-assessment interview and diagnostic testing is completed, the Commissioning Provider will summarize all of the findings identified at the site in a master Findings Log. However for this project, the main focus is to obtain cost effective energy savings from optimizing how the building’s energy using systems are operated and maintained. Therefore, the Commissioning Provider will analyze and perform detailed engineering calculations to estimate the energy savings for only the findings that meet this objective. The remaining findings will be discussed but detailed engineering calculations will not be performed. All of the findings will be included in a preliminary report outlining specific recommendations for implementation. The master Finding Log contain the following information categories: Finding number Equipment name and/or ID number effected Finding type (“O” operation, “M” maintenance, “D” design) Detailed description of the finding Detailed recommended solution and action Energy and economic assessment (if applicable to the individual finding)
Portland Energy Conservation, Inc. (PECI) Page 67 © 2005, Portland Energy Conservation, Inc. (PECI). All rights reserved.

Building X – City Y, CA
Status of implementation The Commissioning Provider will present the preliminary report to the owner and discuss all of the findings identified at the facility. The Commissioning Provider will also provide guidance to the owner in selecting the most cost-effective improvements that meet the project’s objectives. The owner will make the final decision on which improvements to implement. Implementation Phase The Commissioning Provider will assist the owner in planning and coordinating the implementation process. Implementation of the selected improvements will be completed by the building engineers, outside consultants, and contractors as necessary. The measurement and verification plan will be developed during the implementation phase of the project. Measurement & Verification of Savings Once the recommendations have been implemented, a sampling of the systems will be remonitored to ensure that the equipment is operating correctly and to verify energy savings for the facility. Approximately half of the original data loggers will be reinstalled to remonitor system operation over a one to two week post-implementation period. The monitored data will then be compared to the original data (pre-implementation data) in order to confirm that the improvements are functioning correctly and that the energy savings will be realized. Project Hand-Off Project completion includes submission of a final report outlining each finding, the actions taken, and results from the monitoring phase after implementation. The final report will also contain information relating to operation and maintenance steps that will help the owner maintain system performance over time.
Portland Energy Conservation, Inc. (PECI) Page 68 © 2005, Portland Energy Conservation, Inc. (PECI). All rights reserved.

Building X – City Y, CA
APPENDIX G. SAVINGS AND COST ESTIMATES
Portland Energy Conservation, Inc. (PECI) Page 69 © 2005, Portland Energy Conservation, Inc. (PECI). All rights reserved.