retirement and investment webinar series - risk - … · 2015-10-13 · aon hewitt retirement and...
TRANSCRIPT

Aon HewittRetirement and Investment
Retirement and Investment Webinar SeriesOctober 14, 2015

Aon HewittRetirement and Investment
Year-End Retirement Planning—Financial Issues and Opportunities• Joan Boughton• Eric Keener• Dan McFall• Alan Parikh• Brian Walker
Aon HewittRetirement and Investment 3
Agenda Slide
Section 1 Spot Rate Approach to Measuring Benefit CostSection 2 Case Study: AT&TSection 3 Retirement Age TrendsSection 4 Longevity Trends and Other Assumptions
Aon HewittRetirement and Investment 4
Spot Rate Approach to Measuring Benefit Cost
Aon HewittRetirement and Investment 5
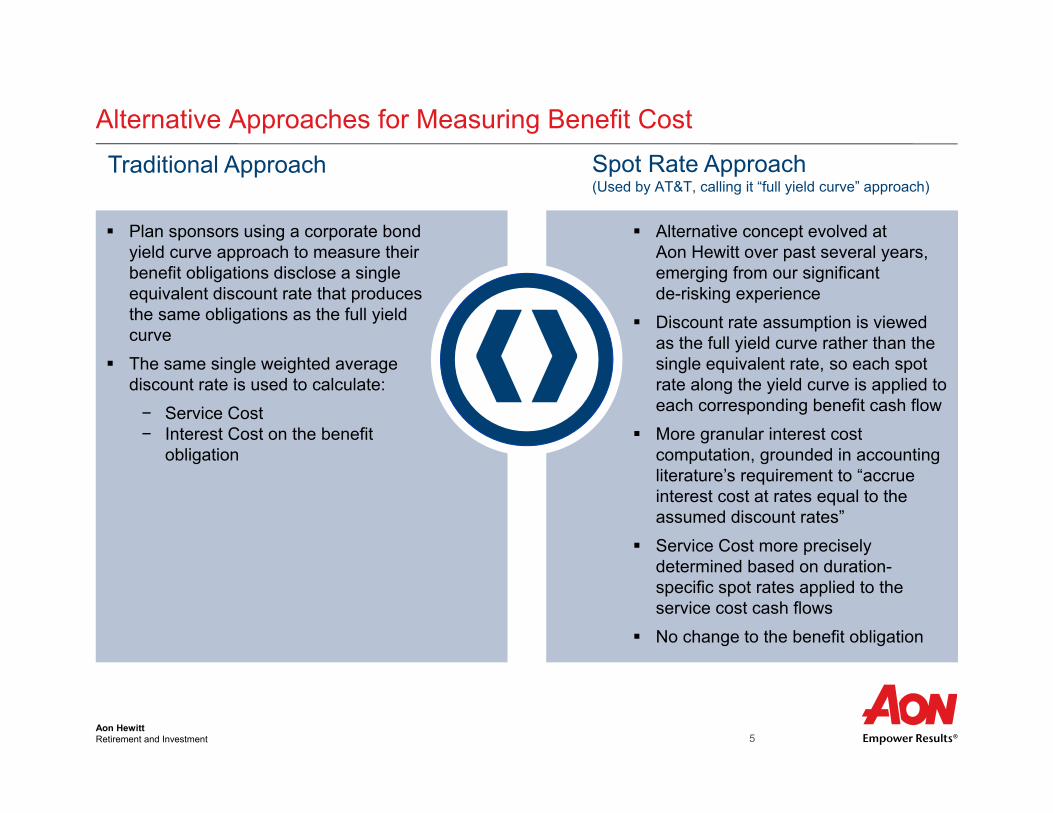
Alternative Approaches for Measuring Benefit Cost
❰❱ Plan sponsors using a corporate bond
yield curve approach to measure their benefit obligations disclose a single equivalent discount rate that produces the same obligations as the full yield curve
The same single weighted average discount rate is used to calculate:− Service Cost− Interest Cost on the benefit
obligation
Alternative concept evolved at Aon Hewitt over past several years, emerging from our significant de-risking experience
Discount rate assumption is viewed as the full yield curve rather than the single equivalent rate, so each spot rate along the yield curve is applied to each corresponding benefit cash flow
More granular interest cost computation, grounded in accounting literature’s requirement to “accrue interest cost at rates equal to the assumed discount rates”
Service Cost more precisely determined based on duration-specific spot rates applied to the service cost cash flows
No change to the benefit obligation
Traditional Approach Spot Rate Approach(Used by AT&T, calling it “full yield curve” approach)
Aon HewittRetirement and Investment 6
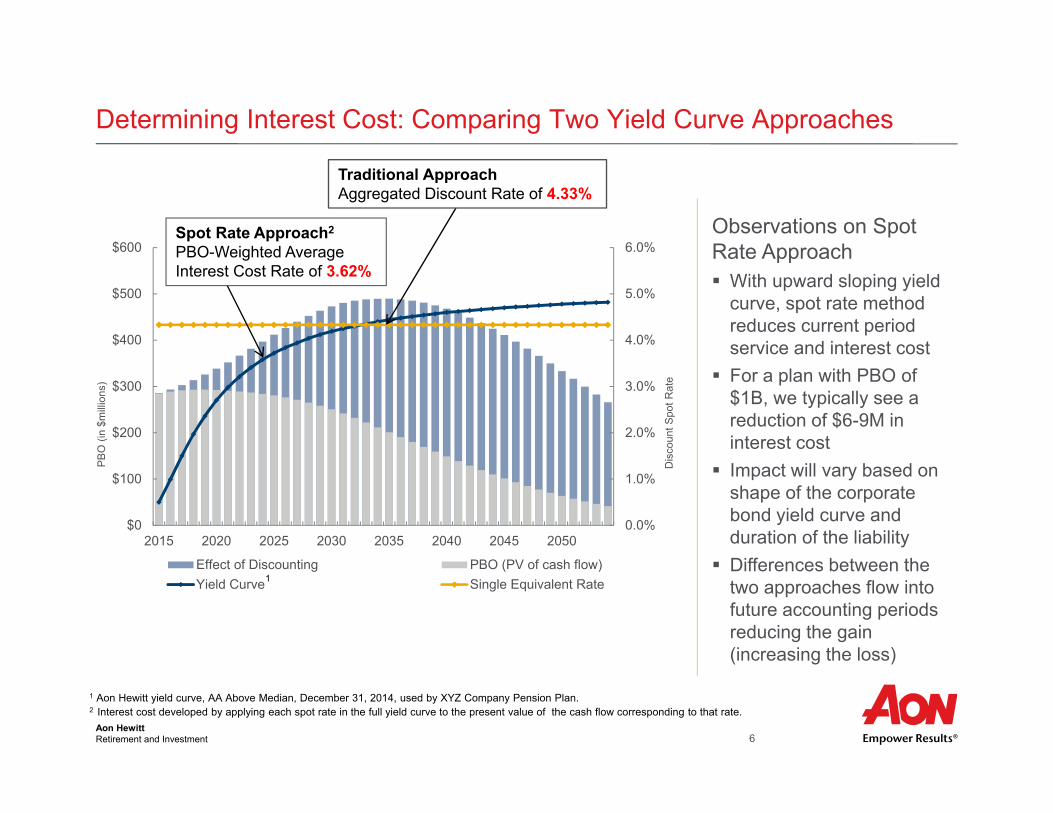
Determining Interest Cost: Comparing Two Yield Curve Approaches
0.0%
1.0%
2.0%
3.0%
4.0%
5.0%
6.0%
$0
$100
$200
$300
$400
$500
$600
2015 2020 2025 2030 2035 2040 2045 2050
Effect of Discounting PBO (PV of cash flow)Yield Curve Single Equivalent Rate
1 Aon Hewitt yield curve, AA Above Median, December 31, 2014, used by XYZ Company Pension Plan.2 Interest cost developed by applying each spot rate in the full yield curve to the present value of the cash flow corresponding to that rate.
Spot Rate Approach2
PBO-Weighted AverageInterest Cost Rate of 3.62%
Dis
coun
t Spo
t Rat
e
PB
O (i
n $m
illio
ns)
Traditional ApproachAggregated Discount Rate of 4.33%
Observations on Spot Rate Approach With upward sloping yield
curve, spot rate method reduces current period service and interest cost
For a plan with PBO of $1B, we typically see a reduction of $6-9M in interest cost
Impact will vary based on shape of the corporate bond yield curve and duration of the liability
Differences between the two approaches flow into future accounting periods reducing the gain (increasing the loss)
1
Aon HewittRetirement and Investment 7
Plan Sponsor Considerations
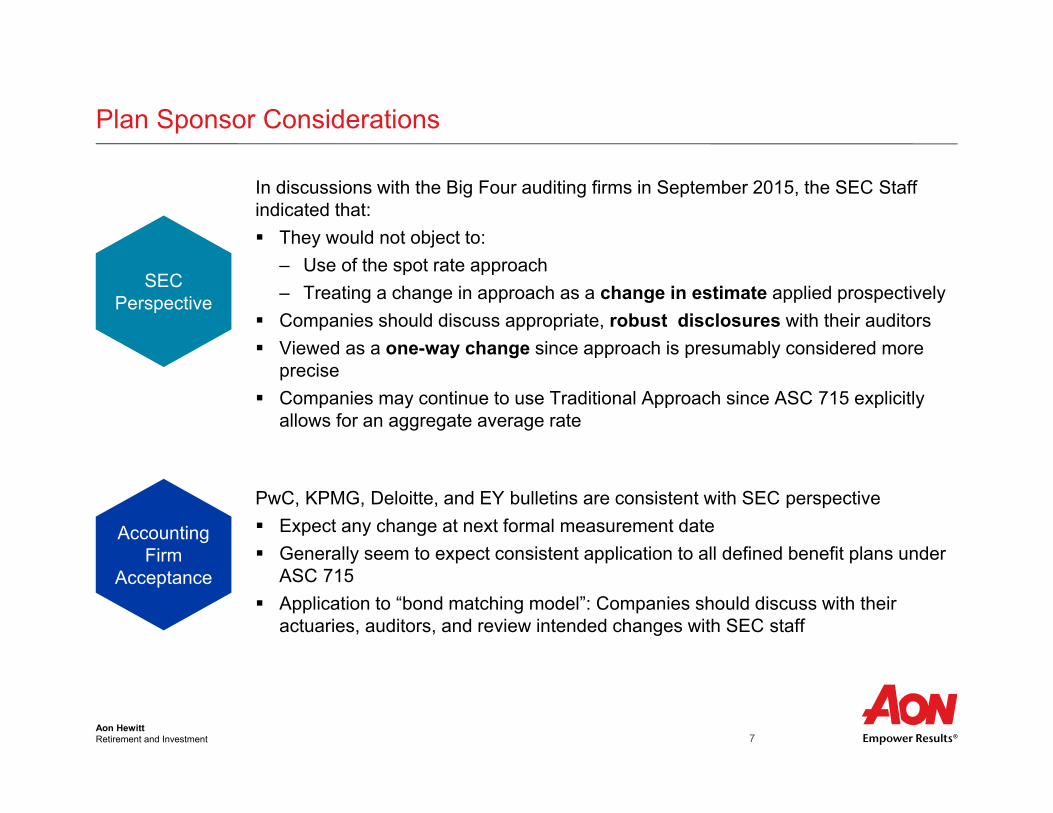
In discussions with the Big Four auditing firms in September 2015, the SEC Staff indicated that: They would not object to:
– Use of the spot rate approach– Treating a change in approach as a change in estimate applied prospectively
Companies should discuss appropriate, robust disclosures with their auditors Viewed as a one-way change since approach is presumably considered more
precise Companies may continue to use Traditional Approach since ASC 715 explicitly
allows for an aggregate average rate
PwC, KPMG, Deloitte, and EY bulletins are consistent with SEC perspective Expect any change at next formal measurement date Generally seem to expect consistent application to all defined benefit plans under
ASC 715 Application to “bond matching model”: Companies should discuss with their
actuaries, auditors, and review intended changes with SEC staff
SEC Perspective
Accounting Firm
Acceptance
Aon HewittRetirement and Investment 8
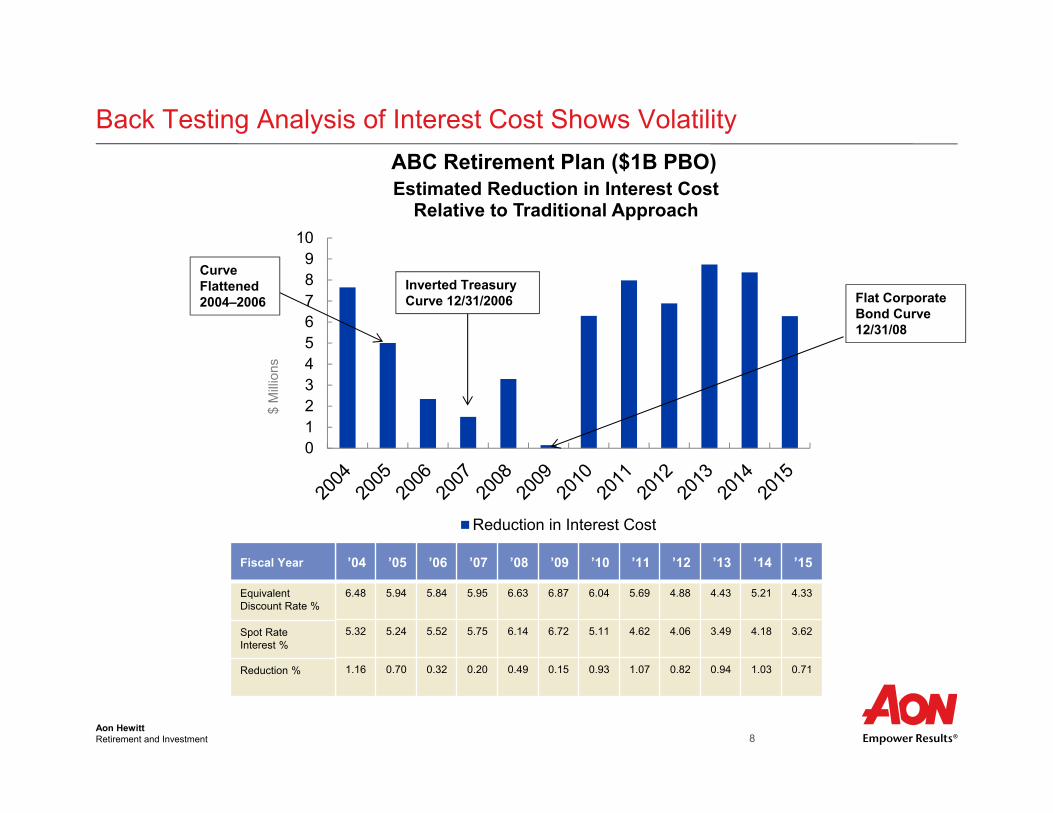
Back Testing Analysis of Interest Cost Shows Volatility
0123456789
10
Estimated Reduction in Interest CostRelative to Traditional Approach
Reduction in Interest Cost
’04 ’05 ’06 ’07 ’08 ’09 ’10 ’11 ’12 ’13 ’14 ’15
6.48 5.94 5.84 5.95 6.63 6.87 6.04 5.69 4.88 4.43 5.21 4.33
5.32 5.24 5.52 5.75 6.14 6.72 5.11 4.62 4.06 3.49 4.18 3.62
1.16 0.70 0.32 0.20 0.49 0.15 0.93 1.07 0.82 0.94 1.03 0.71
Fiscal Year
EquivalentDiscount Rate %
Spot Rate Interest %
Reduction %
Inverted Treasury Curve 12/31/2006
CurveFlattened2004–2006
ABC Retirement Plan ($1B PBO)
$ M
illio
ns
Flat Corporate Bond Curve 12/31/08
Aon HewittRetirement and Investment 9
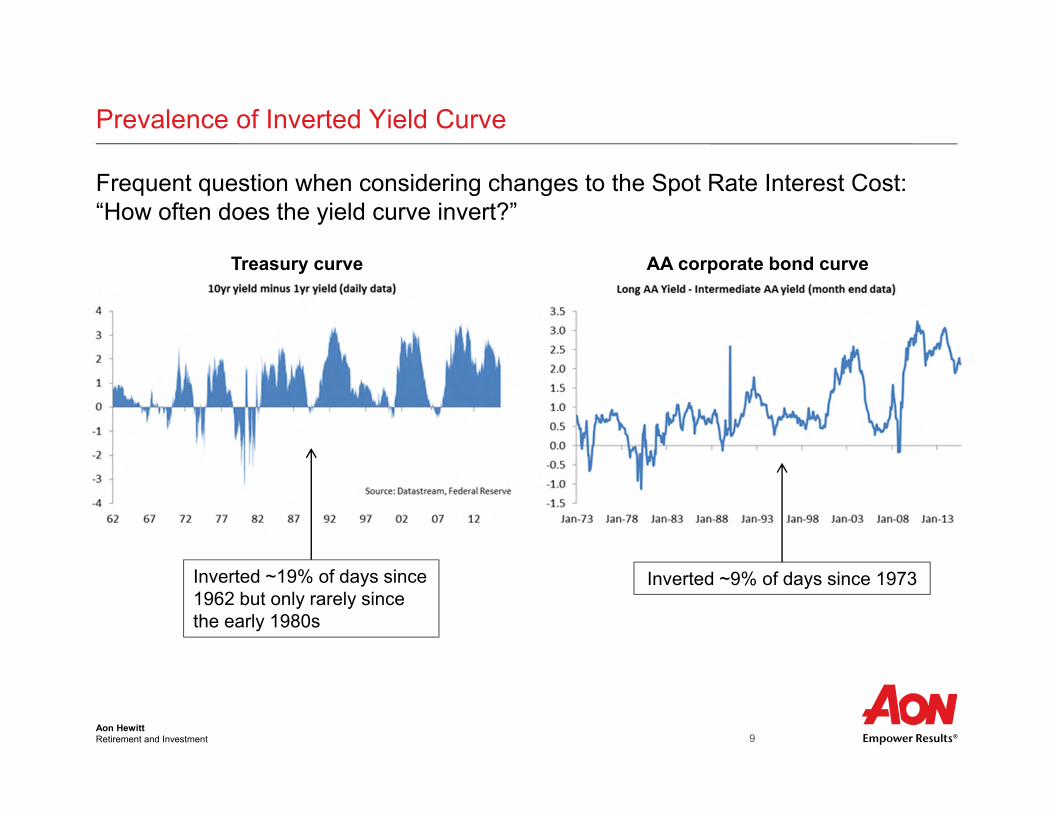
Prevalence of Inverted Yield Curve
Frequent question when considering changes to the Spot Rate Interest Cost: “How often does the yield curve invert?”
Treasury curve AA corporate bond curve
Inverted ~19% of days since 1962 but only rarely since the early 1980s
Inverted ~9% of days since 1973
Aon HewittRetirement and Investment 10
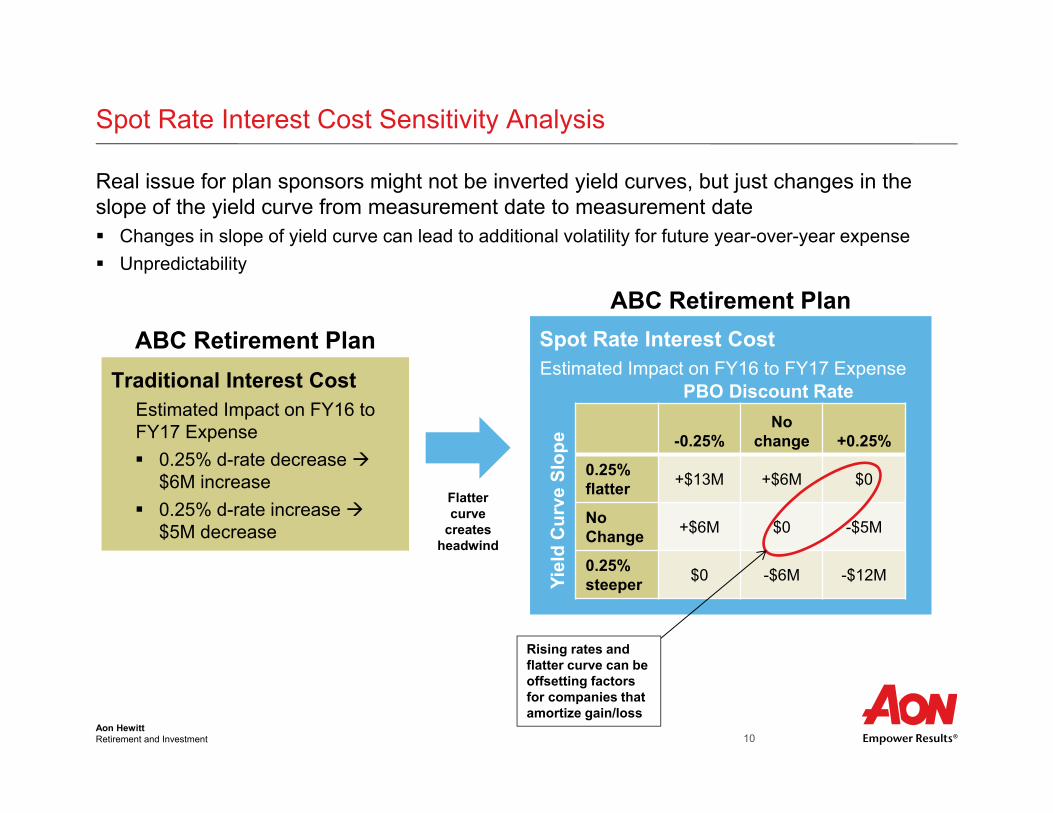
Spot Rate Interest Cost Sensitivity Analysis
Real issue for plan sponsors might not be inverted yield curves, but just changes in the slope of the yield curve from measurement date to measurement date Changes in slope of yield curve can lead to additional volatility for future year-over-year expense Unpredictability
Traditional Interest CostEstimated Impact on FY16 to FY17 Expense 0.25% d-rate decrease
$6M increase 0.25% d-rate increase
$5M decrease
Spot Rate Interest CostEstimated Impact on FY16 to FY17 Expense
-0.25%No
change +0.25%
0.25% flatter +$13M +$6M $0
NoChange +$6M $0 -$5M
0.25% steeper $0 -$6M -$12M
PBO Discount Rate
Yiel
d C
urve
Slo
pe
Rising rates and flatter curve can be offsetting factors for companies that amortize gain/loss
Flatter curve
creates headwind
ABC Retirement PlanABC Retirement Plan
Aon HewittRetirement and Investment 11
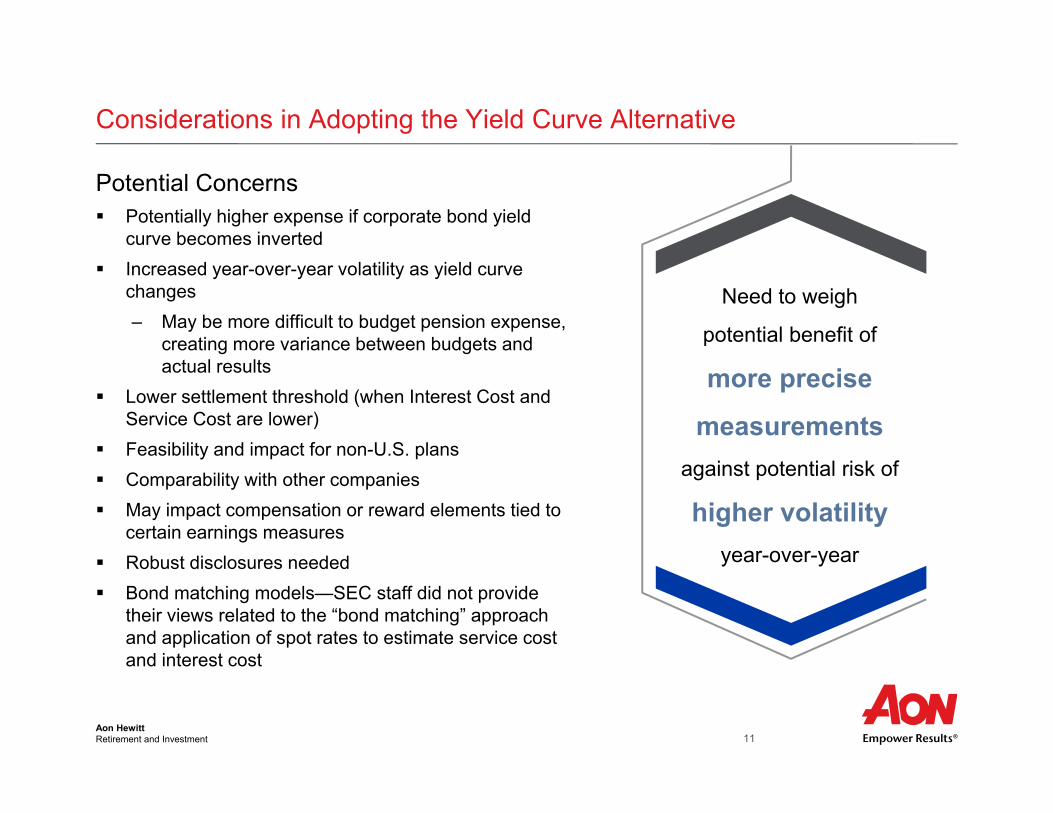
Considerations in Adopting the Yield Curve Alternative
Need to weigh
potential benefit of
more precise
measurements against potential risk of
higher volatility year-over-year
Potential Concerns Potentially higher expense if corporate bond yield
curve becomes inverted Increased year-over-year volatility as yield curve
changes– May be more difficult to budget pension expense,
creating more variance between budgets and actual results
Lower settlement threshold (when Interest Cost and Service Cost are lower)
Feasibility and impact for non-U.S. plans Comparability with other companies May impact compensation or reward elements tied to
certain earnings measures Robust disclosures needed Bond matching models—SEC staff did not provide
their views related to the “bond matching” approach and application of spot rates to estimate service cost and interest cost
Aon HewittRetirement and Investment 12
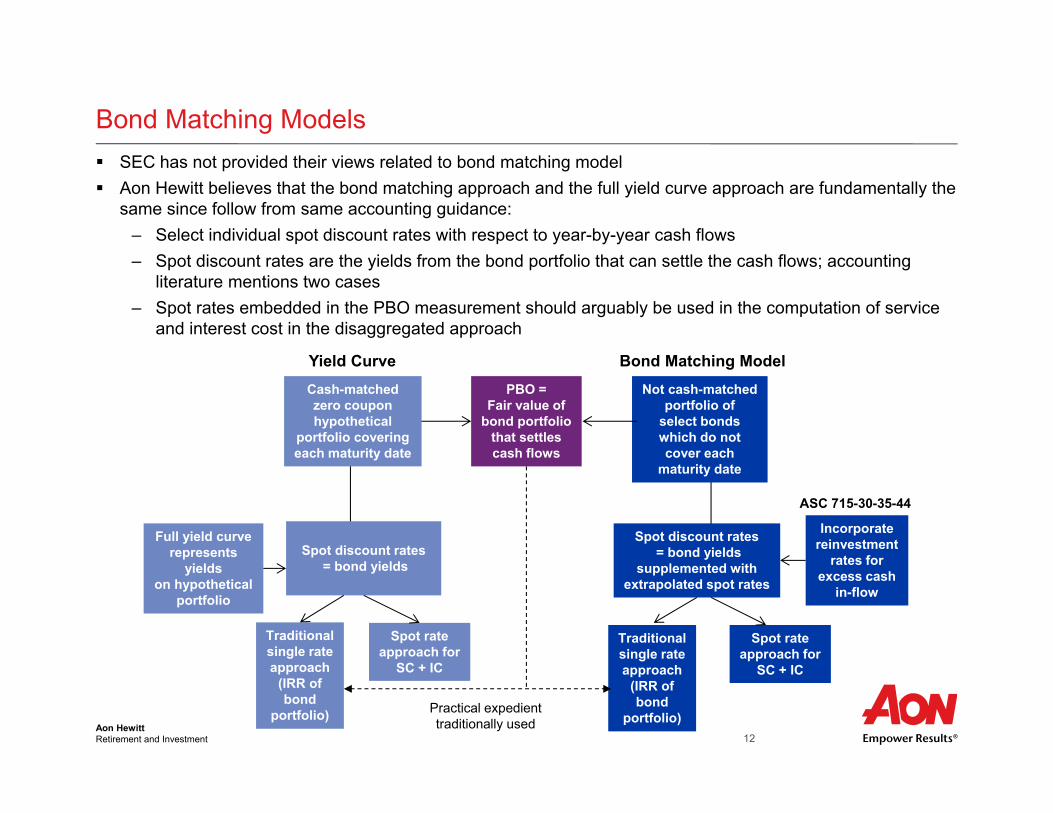
Bond Matching Models SEC has not provided their views related to bond matching model Aon Hewitt believes that the bond matching approach and the full yield curve approach are fundamentally the
same since follow from same accounting guidance:– Select individual spot discount rates with respect to year-by-year cash flows– Spot discount rates are the yields from the bond portfolio that can settle the cash flows; accounting
literature mentions two cases– Spot rates embedded in the PBO measurement should arguably be used in the computation of service
and interest cost in the disaggregated approach
Yield CurveCash-matchedzero couponhypothetical
portfolio coveringeach maturity date
Spot discount rates= bond yields
Full yield curverepresents
yieldson hypothetical
portfolio
Traditionalsingle rateapproach
(IRR of bond
portfolio)
Spot rateapproach for
SC + IC
Bond Matching ModelNot cash-matched
portfolio ofselect bondswhich do notcover each
maturity date
Spot discount rates= bond yields
supplemented withextrapolated spot rates
Incorporatereinvestment
rates forexcess cash
in-flow
Traditionalsingle rateapproach
(IRR ofbond
portfolio)
Spot rateapproach for
SC + IC
ASC 715-30-35-44
PBO =Fair value of
bond portfoliothat settlescash flows
Practical expedienttraditionally used

Aon HewittRetirement and Investment 13
Case Study: AT&T
Aon HewittRetirement and Investment 14
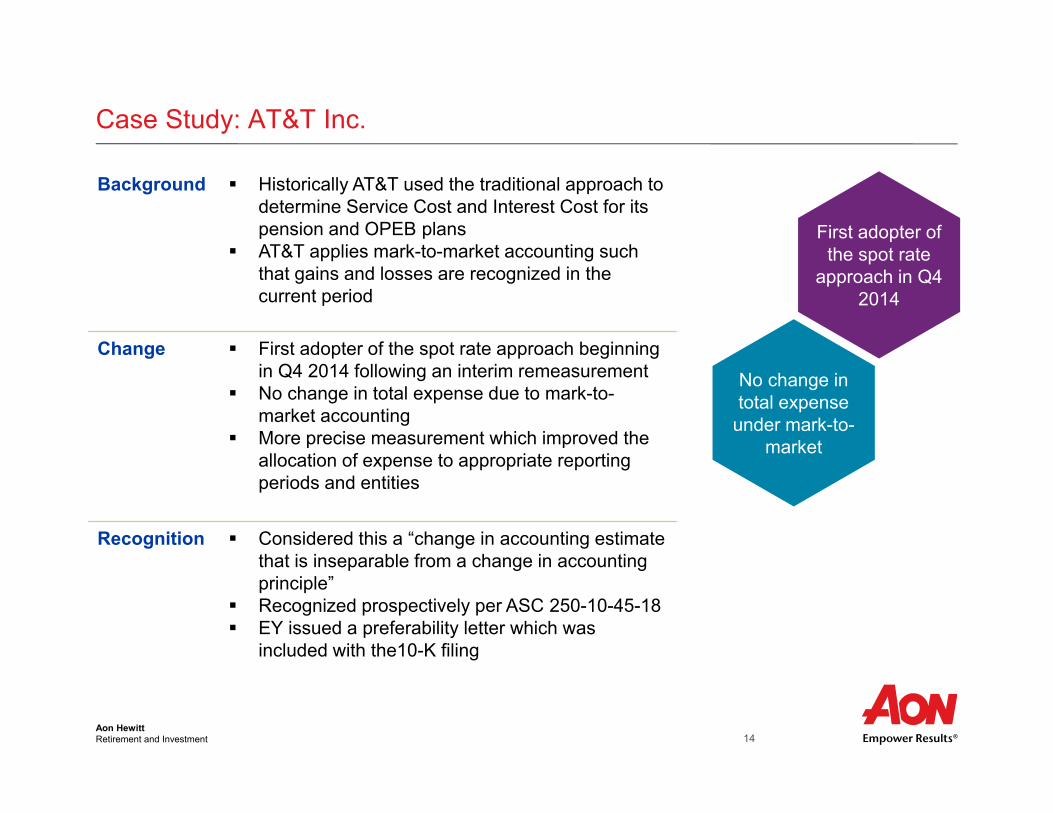
Case Study: AT&T Inc.
Background Historically AT&T used the traditional approach to determine Service Cost and Interest Cost for its pension and OPEB plans
AT&T applies mark-to-market accounting such that gains and losses are recognized in the current period
Change First adopter of the spot rate approach beginningin Q4 2014 following an interim remeasurement
No change in total expense due to mark-to-market accounting
More precise measurement which improved the allocation of expense to appropriate reporting periods and entities
Recognition Considered this a “change in accounting estimate that is inseparable from a change in accounting principle”
Recognized prospectively per ASC 250-10-45-18 EY issued a preferability letter which was
included with the10-K filing
First adopter of the spot rate
approach in Q4 2014
No change in total expense
under mark-to-market

Aon HewittRetirement and Investment 15
Retirement Age Trends
Aon HewittRetirement and Investment 16
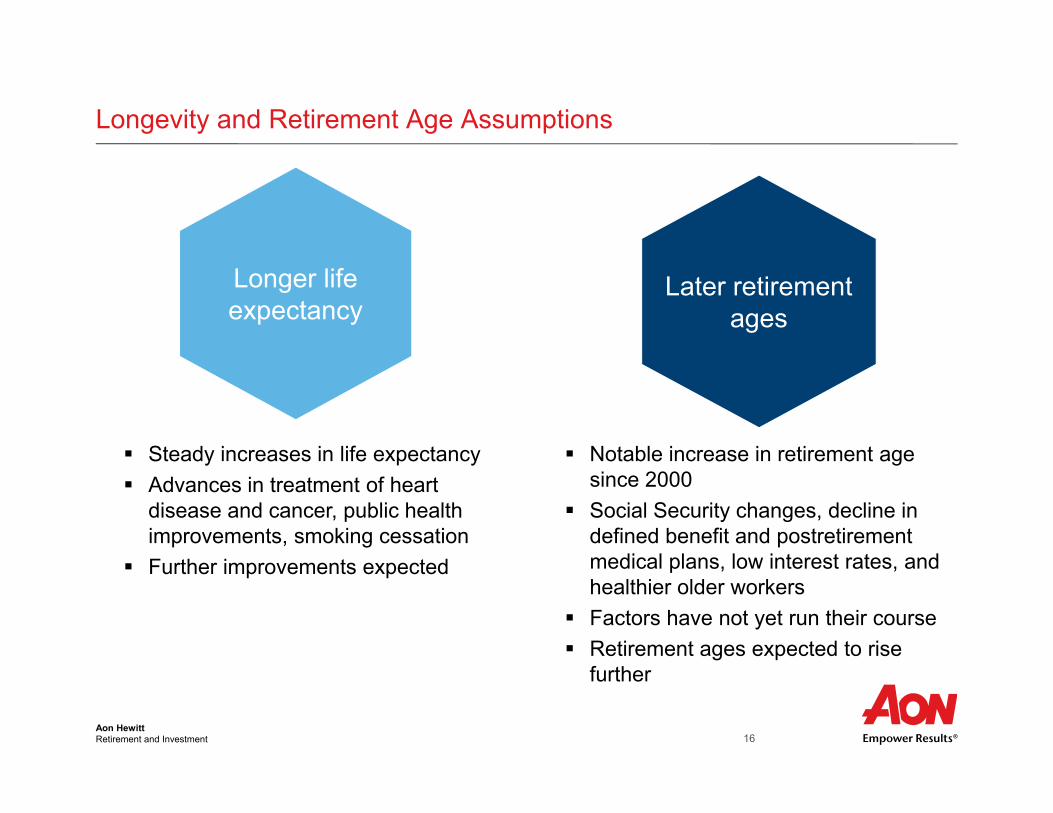
Longevity and Retirement Age Assumptions
Longer life expectancy
Steady increases in life expectancy Advances in treatment of heart
disease and cancer, public health improvements, smoking cessation
Further improvements expected
Later retirement ages
Notable increase in retirement age since 2000
Social Security changes, decline in defined benefit and postretirement medical plans, low interest rates, and healthier older workers
Factors have not yet run their course Retirement ages expected to rise
further
Aon HewittRetirement and Investment 17
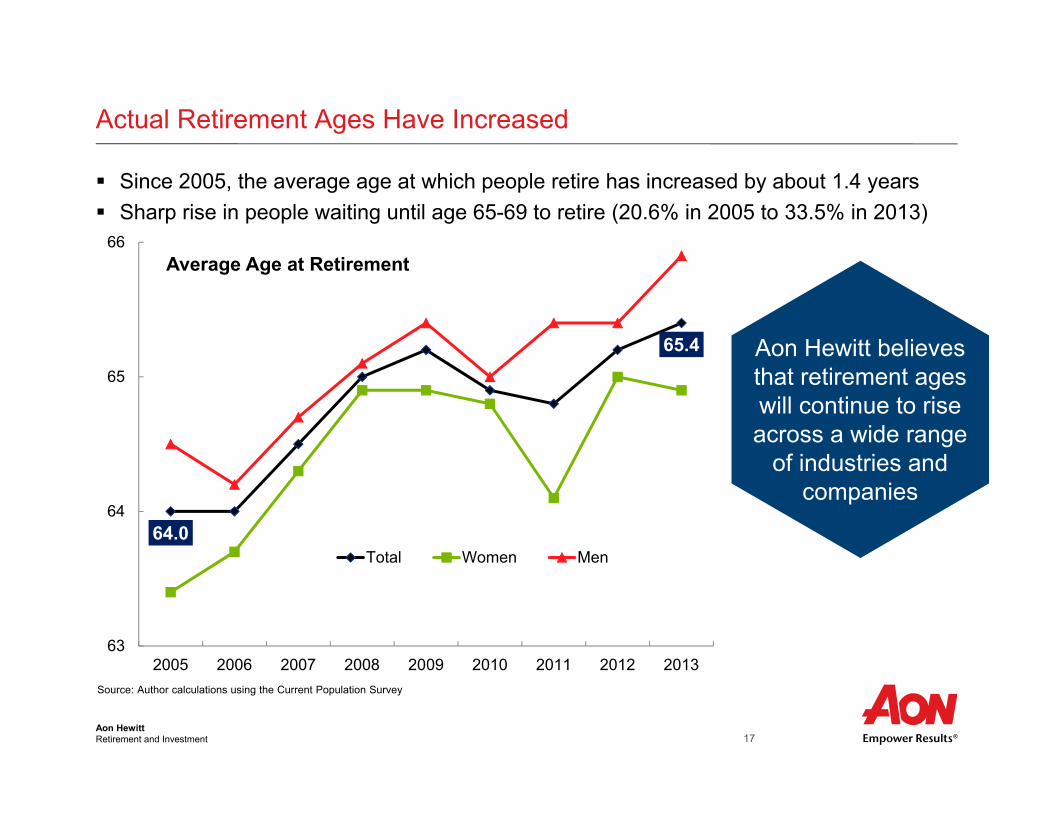
Actual Retirement Ages Have Increased
Since 2005, the average age at which people retire has increased by about 1.4 years Sharp rise in people waiting until age 65-69 to retire (20.6% in 2005 to 33.5% in 2013)
64.0
65.4
63
64
65
66
2005 2006 2007 2008 2009 2010 2011 2012 2013
Average Age at Retirement
Total Women Men
Source: Author calculations using the Current Population Survey
Aon Hewitt believes that retirement ages will continue to rise across a wide range
of industries and companies
Aon HewittRetirement and Investment 18
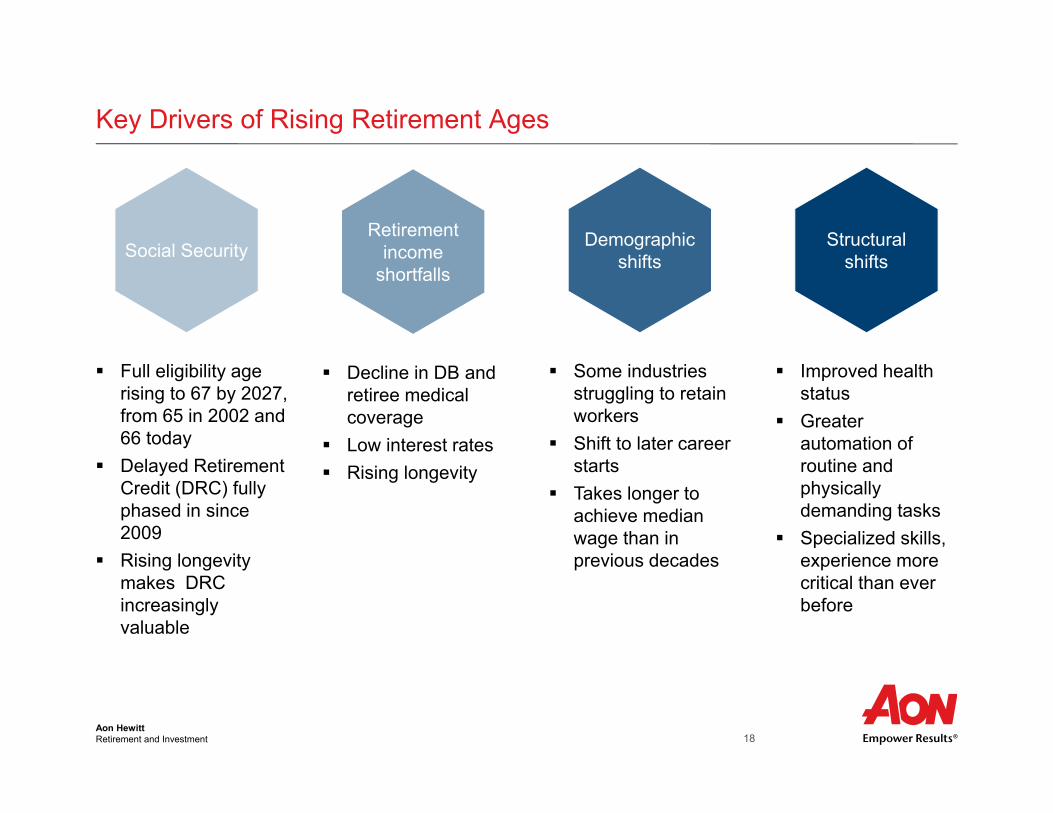
Key Drivers of Rising Retirement Ages
Retirement income
shortfalls
Decline in DB and retiree medical coverage
Low interest rates Rising longevity
Demographic shifts
Some industries struggling to retain workers
Shift to later career starts
Takes longer to achieve median wage than in previous decades
Structural shifts
Improved health status
Greater automation of routine and physically demanding tasks
Specialized skills, experience more critical than ever before
Social Security
Full eligibility age rising to 67 by 2027, from 65 in 2002 and 66 today
Delayed Retirement Credit (DRC) fully phased in since 2009
Rising longevity makes DRC increasingly valuable
Aon HewittRetirement and Investment 19
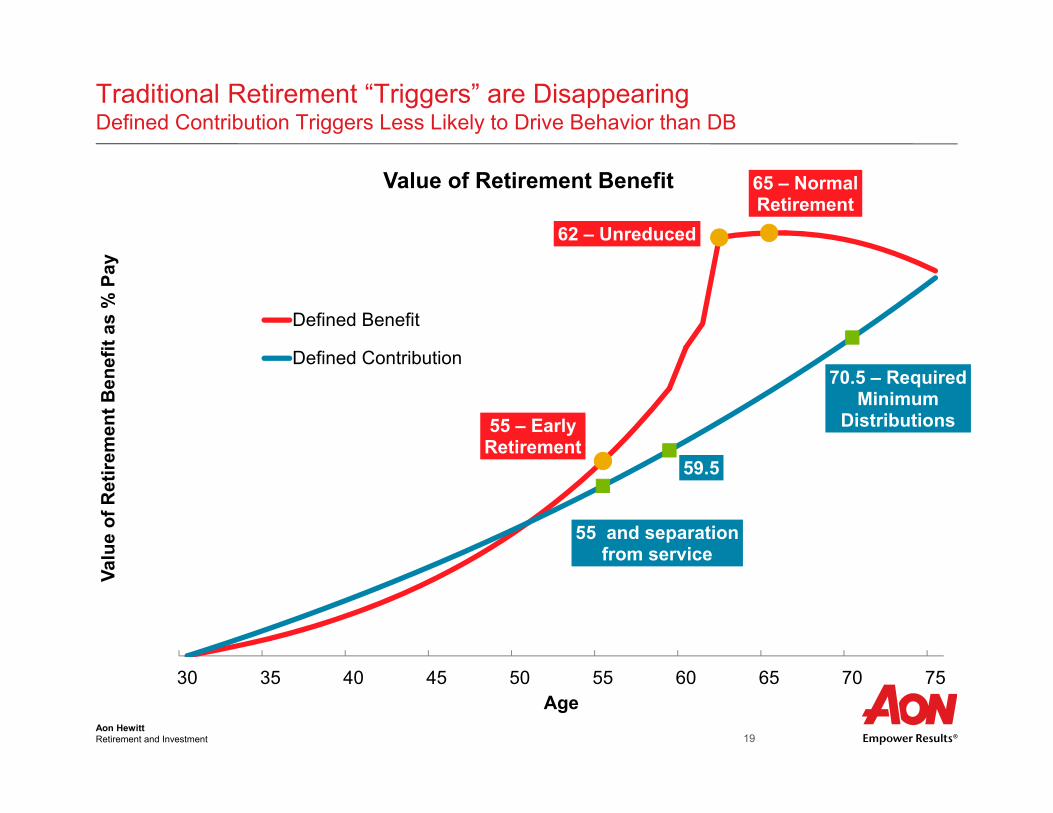
Traditional Retirement “Triggers” are DisappearingDefined Contribution Triggers Less Likely to Drive Behavior than DB
55 – Early Retirement
62 – Unreduced
65 – Normal Retirement
55 and separation from service
59.5
70.5 – Required Minimum
Distributions
30 35 40 45 50 55 60 65 70 75
Valu
e of
Ret
irem
ent B
enef
it as
% P
ay
Age
Value of Retirement Benefit
Defined Benefit
Defined Contribution
Aon HewittRetirement and Investment 20
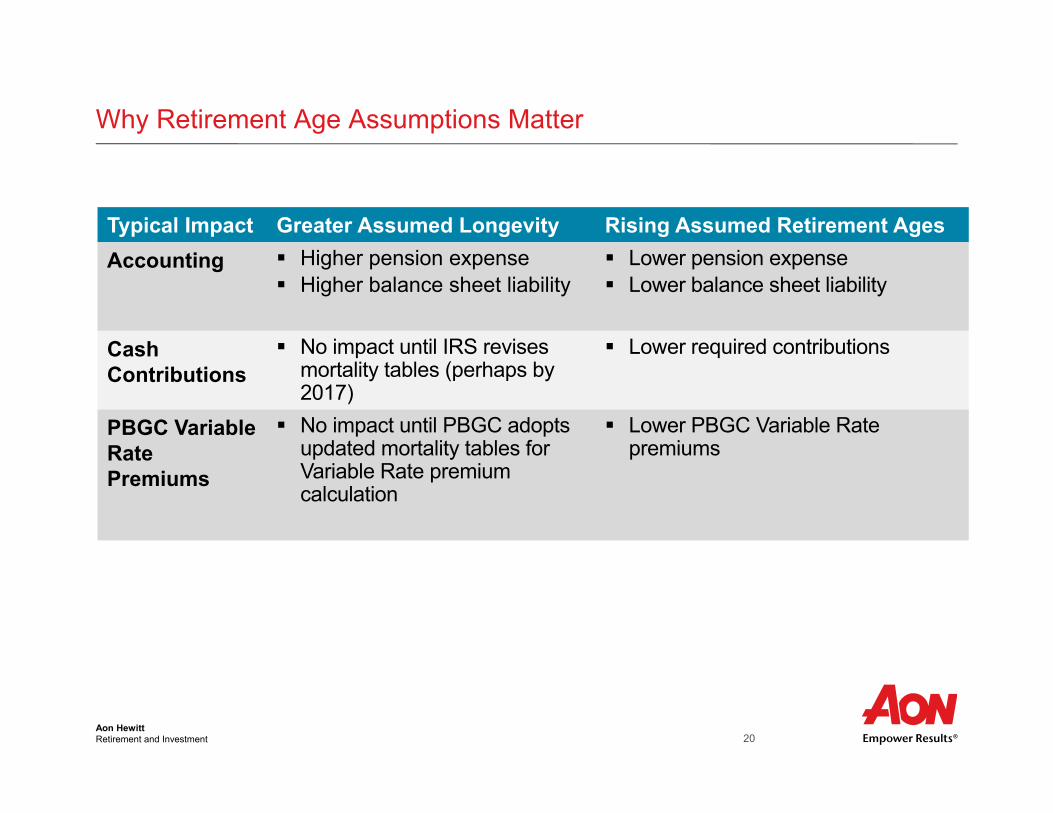
Why Retirement Age Assumptions Matter
Typical Impact Greater Assumed Longevity Rising Assumed Retirement AgesAccounting Higher pension expense
Higher balance sheet liability Lower pension expense Lower balance sheet liability
CashContributions
No impact until IRS revisesmortality tables (perhaps by 2017)
Lower required contributions
PBGC Variable Rate Premiums
No impact until PBGC adopts updated mortality tables for Variable Rate premium calculation
Lower PBGC Variable Rate premiums

Aon HewittRetirement and Investment 21
Will Retirement Ages Continue to Rise?Questions for Plan Sponsors
Are a greater proportion of employees working to 65 or even later?
Has this trend continued or even accelerated in the past few years?
Are your defined benefit plans closed or frozen?
Have you cut back your postretirement medical plans?
Are you experiencing labor shortages in key functions as the boomer retirement wave hits?
Are you escalating efforts to retain workers with key skill sets?
Do projections show a rising number of retirements over the next five to ten years?
Plan Design
Retirement Experience
Study
Workforce Dynamics
Aon HewittRetirement and Investment 22
Longevity Trends and Other Assumptions
Aon HewittRetirement and Investment 23
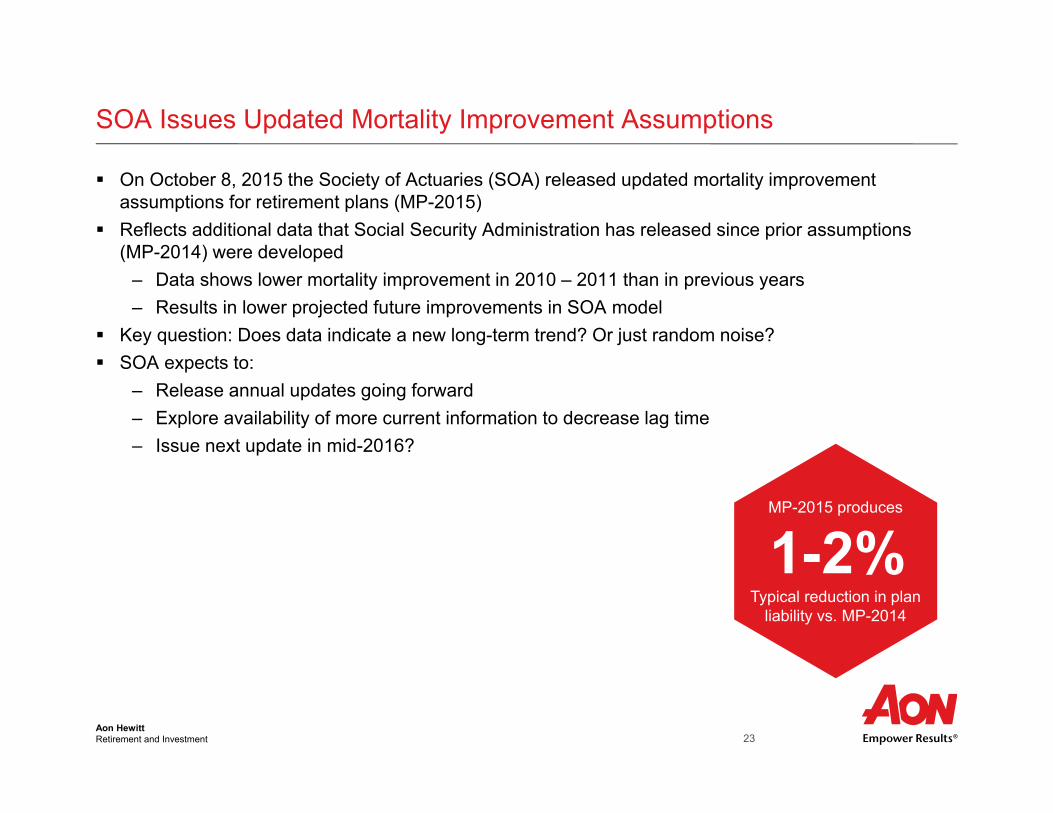
SOA Issues Updated Mortality Improvement Assumptions
On October 8, 2015 the Society of Actuaries (SOA) released updated mortality improvement assumptions for retirement plans (MP-2015)
Reflects additional data that Social Security Administration has released since prior assumptions (MP-2014) were developed
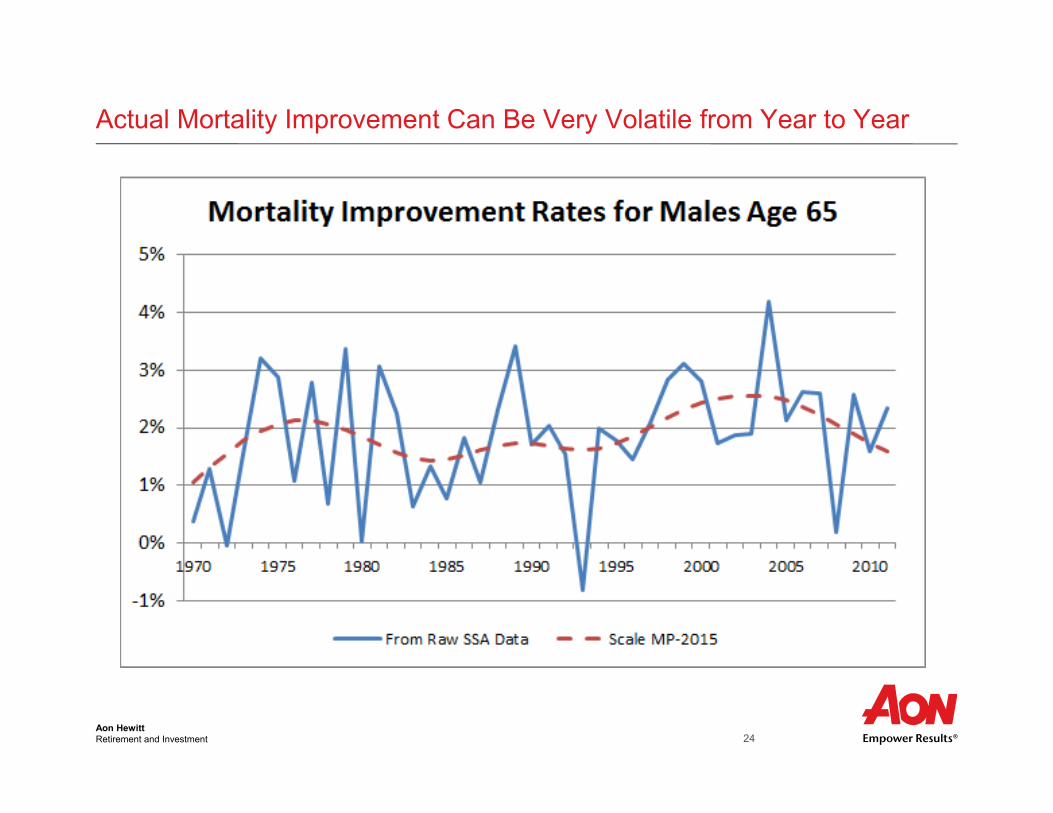
– Data shows lower mortality improvement in 2010 – 2011 than in previous years– Results in lower projected future improvements in SOA model
Key question: Does data indicate a new long-term trend? Or just random noise? SOA expects to:
– Release annual updates going forward– Explore availability of more current information to decrease lag time– Issue next update in mid-2016?
MP-2015 produces
1-2%Typical reduction in plan
liability vs. MP-2014
Aon HewittRetirement and Investment 24
Actual Mortality Improvement Can Be Very Volatile from Year to Year
Aon HewittRetirement and Investment 25
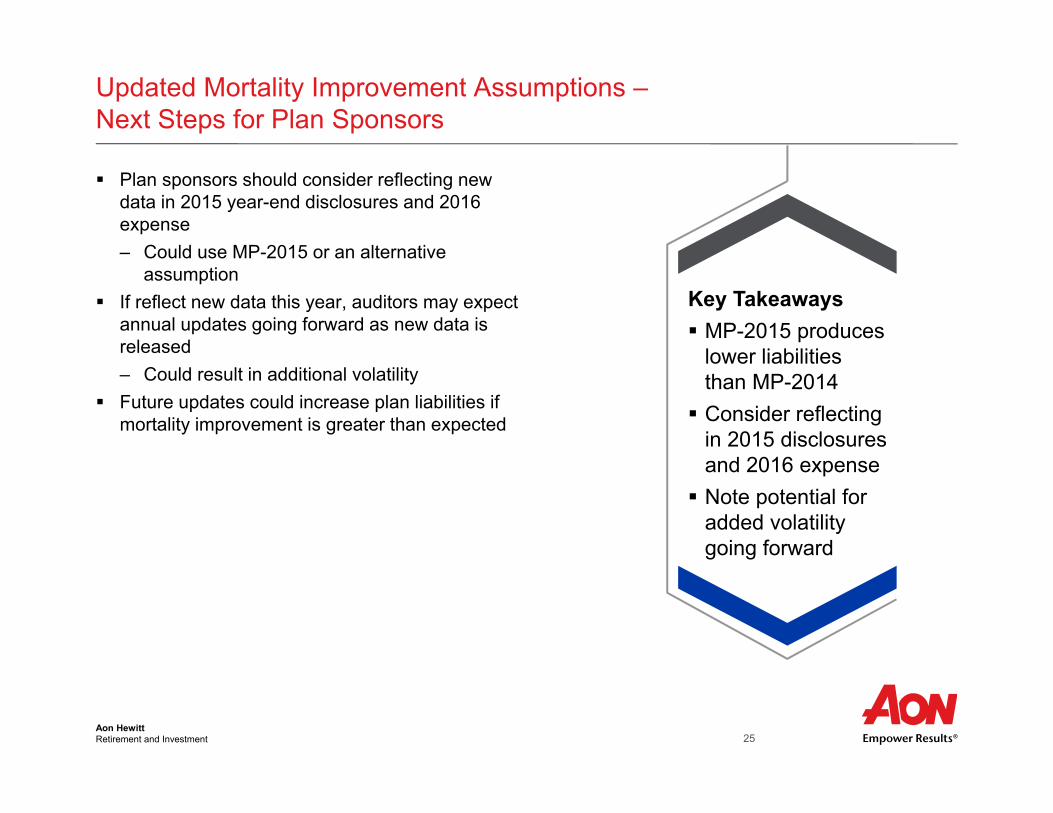
Updated Mortality Improvement Assumptions –Next Steps for Plan Sponsors
Plan sponsors should consider reflecting new data in 2015 year-end disclosures and 2016 expense– Could use MP-2015 or an alternative
assumption If reflect new data this year, auditors may expect
annual updates going forward as new data is released– Could result in additional volatility
Future updates could increase plan liabilities if mortality improvement is greater than expected
Key Takeaways MP-2015 produces
lower liabilities than MP-2014 Consider reflecting
in 2015 disclosures and 2016 expense Note potential for
added volatility going forward
Aon HewittRetirement and Investment 26
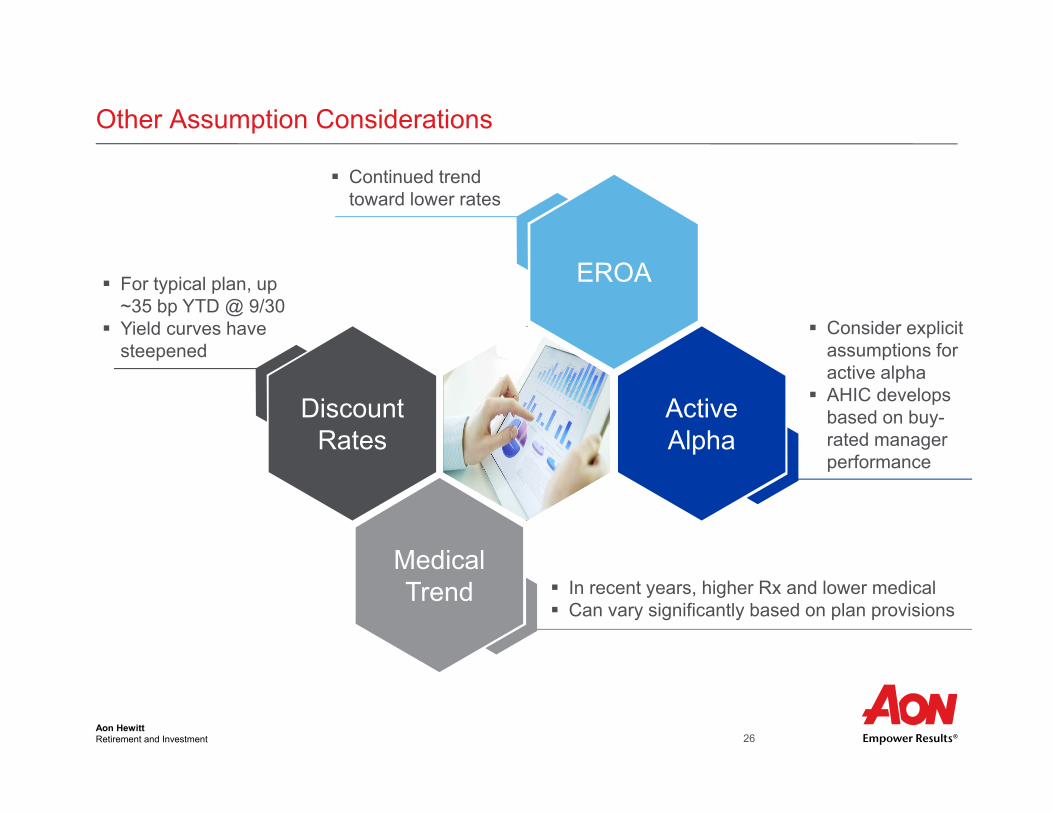
Other Assumption Considerations
Discount Rates
ActiveAlpha
EROA
Medical Trend
For typical plan, up ~35 bp YTD @ 9/30
Yield curves have steepened
Consider explicit assumptions for active alpha
AHIC develops based on buy-rated manager performance
Continued trend toward lower rates
In recent years, higher Rx and lower medical Can vary significantly based on plan provisions

Aon HewittRetirement and Investment 27
Questions and AnswersEmail [email protected] with questions for our speakers.

Aon HewittRetirement and Investment 28
Speaker Biographies
Joan BoughtonJoan is an actuary and Partner at the firm, co-leading Aon Hewitt’s national Retirement Strategy and Design / IDEA team. She consults on HR and retirement strategy, design, implementation, administration, communication, financing, and ongoing plan management.
Eric KeenerEric is a Partner and Chief Actuary of Aon Hewitt's U.S. Retirement Practice. He leads our National Actuarial Resource Team and is responsible for delivering training, thought leadership, technical guidance, and day-to-day assistance to our consultants as they serve our clients. He also consults with several large clients on a broad range of retirement plan issues.
Dan McFallDan is an actuary and Partner with Aon Hewitt. He is one of Aon Hewitt’s thought leaders and consults with some of our largest retirement clients on retirement strategy, design, financing, and ongoing plan management.
Alan ParikhAlan is a member of Aon Hewitt’s National Actuarial Resource Team, helping Aon Hewitt consultants deliver quality work and value-added consulting across the United States. He is also a member of Pension Committee of the Actuarial Standards Board, a CFA charterholder, and CAIA charterholder.
Brian WalkerBrian is an actuary and Associate Partner in Aon Hewitt’s Retirement and Investment practice. He advises clients on funding and accounting requirements for their retirement programs, and provides strategic advice on retirement plan design, executive retirement benefits, postretirement benefits, and plan administration.
Aon HewittRetirement and Investment 29
About Aon Hewitt
Aon Hewitt empowers organizations and individuals to secure a better future through innovative talent, retirement and health solutions. We advise, design and execute a wide range of solutions that enable clients to cultivate talent to drive organizational and personal performance and growth, navigate retirement risk while providing new levels of financial security, and redefine health solutions for greater choice, affordability and wellness. Aon Hewitt is the global leader in human resource solutions, with over 30,000 professionals in 90 countries serving more than 20,000 clients worldwide. For more information, please visit aonhewitt.com.
© Aon plc 2015. All rights reserved.