retirement system investment commission
TRANSCRIPT

Annual Investment ReportSouth Carolina Retirement System Investment Commission 2008-2009

South Carolina Retirement SystemInvestment Commission
Front and Back Cover Image By: Anne Hornyak
Annual Investment ReportFiscal Year Ended June 30, 2009
Fontaine Business Center200 Arbor Lake Drive, Suite 120
Columbia, SC 29223
Robert L. Borden, CFA, CAIAChief Executive Officer
Chief Investment Officer

Table of Contents Chairman & CEO/CIO Report ....................................................................................................................... 1
Consultant’s Report ...................................................................................................................................... 4
Overview ....................................................................................................................................................... 6
Commission .................................................................................................................................................. 7
Roles & Responsibilities ............................................................................................................................. 10
CEO/CIO................................................................................................................................................... 10
Staff ......................................................................................................................................................... 10
Custodian ................................................................................................................................................ 10
Consultant ............................................................................................................................................... 11
Disclosure of Material Interest ............................................................................................................... 11
Investment Plan, Policies, & Objectives .................................................................................................. 11
Commission Staff ........................................................................................................................................ 12
Strategic Plan .............................................................................................................................................. 13
Total Fund Review ...................................................................................................................................... 14
Market Overview .................................................................................................................................... 14
Performance............................................................................................................................................ 15
Policy & Strategy Benchmarks ................................................................................................................ 15
Performance vs. Peers ............................................................................................................................ 15
Performance vs. Actuarial Return ........................................................................................................... 16
Asset Allocation Overview ...................................................................................................................... 16
Beta Overlay ............................................................................................................................................ 17
Manager Returns (Net of Fees) .................................................................................................................. 18
Public Equity Review .................................................................................................................................. 21
Fixed Income Review ................................................................................................................................. 23
Private Equity Review ................................................................................................................................ 26
Hedge Funds Review .................................................................................................................................. 30
Global Asset Allocation Review ................................................................................................................. 32
Opportunistic Credit Review ...................................................................................................................... 34
Strategic Partnership Review ..................................................................................................................... 36

Real Asset Review ...................................................................................................................................... 39
Securities Lending....................................................................................................................................... 41
Expenses ..................................................................................................................................................... 42
Appendices
Appendix A: Summary Schedule of Assets and Derivatives .................................................................... 43
Appendix B: Short-Term Holdings ........................................................................................................... 44
Appendix C: Fixed Income Holdings ........................................................................................................ 46
Appendix D: Equity Holdings ................................................................................................................... 54
Appendix E: Alternative Investments ...................................................................................................... 79
Appendix F: Swap Holdings ..................................................................................................................... 81
Appendix G: Futures Holdings ................................................................................................................. 83
Appendix H: Explanation of Statistical Concepts .................................................................................... 84
Table of Contents

South Carolina Retirement System Investment Commission
1
Chairman & CEO/CIO Report
State of South CarolinaRetirement System Investment Commission
Post Office Box 11960COLUMBIA, SOUTH CAROLINA 29211
Fontaine Business Center, 200 Arbor Lake Drive, Suite 120, Columbia, South Carolina 29223803-737-6937 (phone) 800-868-9002 (toll-free) 803-737-7070 (fax)
James R. PowersChairman
Allen P. Gillespie, CFAVice Chairman
Converse A. Chellis, III, CPAState Treasurer
Robert L. Borden, CFA, CAIAChief Executive Officer Chief Investment Officer
Blaine Ewing, III
S. Travis Pritchett
Reynolds WilliamsChairman Emeritus
Nancy E. ShealyGeneral Counsel
October 15, 2009
The Honorable Mark Sanford, Governor Budget and Control Board State of South Carolina Members of the General Assembly of South Carolina Dear Ladies and Gentlemen: We are honored to present, on behalf of the South Carolina Retirement System Investment Commission (RSIC) Staff and Commission, the RSIC’s Annual Investment Report for the fiscal year ending (FYE) June 30, 2009. In 2005 the RSIC was created as a fiduciary for the South Carolina Retirement Systems (Retirement System) to assume full responsibility of investing and managing all assets of the Retirement System. We are very proud that, in only its fourth year, the RSIC has been named “Large Public Plan of the Year” by Money Management Letter, Institutional Investor Magazine, and Information Management Network. The RSIC provides the Annual Investment Report to comply with South Carolina Code, Ann. §9-16-90, which requires detailed investment reports on a quarterly and annual basis. Capital Market Summary Fiscal Year 2009 saw remarkable volatility in nearly all global capital markets as the financial system reached the brink of total collapse in late 2008. The market dislocation slowed the flow of capital throughout the economy, resulting in massive central bank intervention, a steep recession, and five of the eight largest bankruptcies in U.S. history. The decline in stock markets was so severe that one had to look back to the Great Depression to find its equal. Fortunately, fears of a worldwide depression abated, and since early March, many equity markets have seen the steepest rallies in their history. Fixed income assets, which historically have provided investors with stability and liquidity, ceased to do either during the crisis. Prices on these investments declined sharply in late 2008 before recovering large portions of these losses in 2009. These colossal market swings created a complex backdrop against which to pursue the reallocation of assets that began in July 2007. In late 2008, the RSIC made the decision to reduce the portfolio risk by decreasing the equity allocation and aggressively managing the liquidity of the Retirement System’s Investment Portfolio (Portfolio) to fund benefits and opportunities created by the market dislocation mentioned above. We are proud of the work of the RSIC Staff as we navigated the extraordinary volatility during the fall of 2008 with discipline and without resorting to the sale of illiquid assets at distressed prices, as several major institutional investors were forced to do.

2008 - 2009 Annual Investment Report
2
* The percentile rankings represent the RSIC’s mean ranking taken from five separate peer group universes in which 100 is best and 1 is worst.
FYE 2009 Investment Performance Review As of June 30, 2009, the Portfolio value was $21.0 billion. This was down from $27.0 billion a year earlier. Of this change, $822 million (3%) was due to net cash flows for retiree obligations. The Portfolio’s performance for the fiscal year ending June 30, 2009 was -19.3% net of fees. Core Fixed Income portfolios were the best performers (up 4.3% in aggregate), while the Public Equity portfolios were the worst performers (-28.0%). Alternative asset classes outpaced equities, but were down (-15.4%) for the year. When compared to other large pension plans, the Portfolio’s return for the year was in the 38th percentile, down from the prior year, but much improved over previous periods. It is important to understand that the Portfolio has substantially less equity risk than the average public pension fund (source: Callan Associates).
RSIC Rolling 1-Year Percentile Rank as of June 30, 2009*
The Portfolio’s negative performance relative to the Policy and Strategy benchmarks occurred almost entirely during late 2008, and was mainly due to poor manager performance during the unprecedented decline in the major capital markets. In several cases, the Commission terminated or reduced exposure to managers and strategies where performance concerns arose. Additionally, the RSIC has approached several managers to discuss fee reductions or alternative fee arrangements. It should be noted that, while it would be easy to be discouraged by the past 12 months, we have been pleased to have the opportunity to invest assets at the depressed levels seen during the past year. It is our belief that these timely investments will provide an engine of growth for the Portfolio over the next several years. Revised Asset Allocation Targets Late in the year, the RSIC approved changes to the asset allocation target weights for the Portfolio. The need for these modifications was underscored by the very real risk of a total global economic and financial market meltdown reminiscent of the Great Depression.
0%
20%
40%
60%
80%
100%
Began Implementing New Asset Allocation
Strategy
Credit Crisis

South Carolina Retirement System Investment Commission
3
The new asset allocation approved by the RSIC (shown below) includes investments in new asset classes (see page 16), modifies target allocations to others, and affords the CIO greater flexibility to react to changes in market conditions such as those seen in late 2008. This flexibility is expressed by broadening the acceptable allocation ranges and allowing the CIO to move a majority of the assets to cash in the event of a market meltdown. Prior to this change, these ranges did not permit the CIO to direct the portfolio into a risk-averse asset allocation. Portfolio Exposure as of June 30, 2008 Portfolio Exposure as of June 30, 2009
Strategic Planning Another important milestone for the RSIC during the year was the development and approval of a three-year strategic plan. As the diversification of the Portfolio’s assets neared completion, the Commission and Staff identified a series of goals that are critical elements in building a best-in-class investment management organization. These goals are detailed on page 13 of the 2008-2009 Annual Investment Report, along with the RSIC’s mission, vision, and values. Looking Ahead While Fiscal Year 2009 produced dismal returns for most financial markets, we believe that these declines have provided astute investors with the opportunity to acquire undervalued assets. As the fears of market participants subside, we expect markets to continue to recover. We are committed to the interests of the members of the Retirement System, and we will continue to manage the assets of the Portfolio in a prudent and transparent manner, seeking superior returns at acceptable levels of risk. It is a tremendous responsibility and opportunity for us to serve as the Commission’s Chairman and CEO/CIO. Sincerely, James R. Powers Robert L. Borden, CFA, CAIA Chairman Chief Executive Officer
Chief Investment Officer
US Equity, 28.3%
Non-US Equity, 19.6%
Private Equity, 1.0%Real Estate,
0.3%GTAA / Risk Parity, 8.2%
Absolute Return, Net,
0.2%
Core Fixed Income, 24.2%
Opportunistic Credit, 0.5%
Cash, 0.3%
Global Opp. Fixed Income,
17.4%US Equity,
16.6%
Non-US Equity, 16.3%
Private Equity, 2.5%
Real Estate, 0.6%
GTAA / Risk Parity, 6.3%Absolute
Return, Net, 4.6%
Core Fixed Income,
20.5%
Opportunistic Credit, 5.1%
Cash, 13.1%
Int'l Fixed Income,
10.7%
High Yield, 3.5%

2008 - 2009 Annual Investment Report
4
Consultant’s Report
NEPC, LLC5113 PIPER STATION DRIVE, SUITE 205, CHARLOTTE, NC 28277 TEL: 617-374-1300 FAX: 617-374-1313 www.nepc.com
C A M B R I D G E I C H A R L O T T E | D E T R O I T I L A S V E G A S I S A N F R A N C I S C O
September 23, 2009
The Honorable Mark Sanford, Governor Budget and Control Board Members of the General Assembly of South Carolina
RE: FYE 2009 Report
Dear Governor and Members:
As investment consultant for the South Carolina Retirement System (SCRS), NEPC, LLC (NEPC) is pleased to submit this summary outlining the structure and performance of the SCRS investment portfolio for Fiscal Year ended June 30, 2009.
This letter marks nearly three years that NEPC has been working with the SCRS. It also marks a period of significant market turmoil and volatility. As the fiscal year came to an end, the stock market showed signs of recovery with a 35% rally for calendar year 2009 through June 30. The credit markets began to show signs of improvement, and consumer confidence started to rebound as well.
During the fiscal year, NEPC worked with the Investment Commission, the Chief Investment Officer, and staff to implement the 2009 asset allocation targets. The approved allocations were derived using the latest technologies in total plan risk and return modeling, including risk budgeting and scenario analyses. The result is a strategy that remains on the cutting edge of asset allocation approaches. Year over year changes in the strategy included reductions to US Small Cap Equity, International Equity, and Core Fixed Income, an increased target to Cash, and the introduction of Liquid Real Assets for inflation protection purposes (consisting of a blend of US TIPS and Commodities).
Based on NEPC’s belief that the significant dislocation in the credit markets has created investment opportunities, the 2009 target also included an increased allocation to Opportunistic Credit. As the credit markets rebounded in the first half of calendar year 2009, opportunistic investments have already begun to add value to the SCRS portfolio.
For Fiscal Year ended June 30, 2009, the SCRS portfolio returned -19.3%. This was slightly behind the typical, large public fund in our universe which lost 17.5%.

South Carolina Retirement System Investment Commission
5
As of June 30, 2009, the SCRS investment portfolio totaled $21.0 billion and had an asset allocation consisting of 2.3% Cash, 36.2% Fixed Income, 10.9% Domestic Equity, 6.3% Global Asset Allocation, 19.8% Hedge Funds, 1.7% Private Equity, 3.0% Opportunistic Credit, and 10.6% invested in Strategic Partnerships. There was also a 9.5% investment in the Beta Overlay mandate, a strategy that allows for the quick implementation of portions of the target asset allocation.
This allocation was consistent with the targets and ranges set forth in the Annual Investment Plan and was within statutory limits. NEPC will continue to work with the SCRS to monitor the structure and portfolio in an effort to optimize the portfolio’s risk/return profile.
It is NEPC’s honor to serve as the investment consultant to the Investment Commission. We are excited to continue to work with the SCRS to position the portfolio in this challenging environment and to further take advantage of opportunities that the market has presented.
Sincerely,
Rhett Humphreys, CFA Partner

2008 - 2009 Annual Investment Report
6
The South Carolina Retirement System Investment Commission (“RSIC” or “Commission”) is responsible for investing and managing all assets held in trust for the participants and beneficiaries of five governmental defined benefit plans: South Carolina Retirement System, South Carolina Police Officers Retirement System, Retirement System for Judges and Solicitors of the State of South Carolina, Retirement System for Members of the General Assembly of the State of South Carolina, and the National Guard Retirement System, collectively referred to hereinafter as the “Retirement System” or “Systems.”
The RSIC’s primary investment objective is to provide, over the long-term, an adequate pool of assets to support the benefit obligations to participants and beneficiaries of the Retirement System. A secondary objective is to reduce, over time, the unfunded liability of the Retirement System. In pursuing these objectives, the RSIC seeks to achieve a high level of investment return consistent with a prudent level of portfolio risk. The assets of the Retirement System will be invested in conformity with the requirements of South Carolina law and will be designed to increase the probability of achieving those long-term objectives.
As of June 30, 2009, members of the Commission are: James R. Powers, Chairman; Allen R. Gillespie, CFA, Vice Chair-man; Converse A. Chellis, III, CPA, State Treasurer; Reynolds Williams, Chairman Emeritus; Blaine Ewing, III; and S. Travis Pritchett. The CEO/CIO for the Commission is Robert L. Borden, CFA, CAIA, and General Counsel for the Commission is Nancy E. Shealy.
OverviewPurpose & Duties
HistoryEffective October 1, 2005, the State Retirement System Preservation and Investment Reform Act (Act 153) established the Commission and devolved fiduciary responsibility for all investments of the Retirement System upon the RSIC, which is a six-member commission made up of financial experts, including the State Treasurer and a nonvoting retired member of the Systems. Act 153 also provided that equity investments cannot exceed 70 percent of the total investment portfo-lio (formerly 40 percent) and created the position of Chief Investment Officer.
The assets of the Retirement System had historically been invested only in fixed income investments until a constitu-tional amendment was ratified in 1997. The amendment allowed the Retirement System to invest in “equity securities of a corporation within the United States that is registered on a national securities exchange as provided in the Securi-ties Exchange Act, 1934, or a successor act, or quoted through the National Association of Securities Dealers Automatic Quotation System, or a similar service.” S.C. Const. art. X, §16. The Retirement System began investing in equities in June 1999, although full diversification of the portfolio remained constrained by the state constitution. In November 2006, a constitutional amendment allowing for full diversification of the Retirement System’s Portfolio was approved in a statewide referendum and subsequently ratified by the Legislature in February 2007. Since ratification, the Com-mission has taken steps to transition to a more diversified asset allocation, allotting approximately 30% percent of the target allocation to alternative asset classes, including international market exposure, private equity, strategic partner-ships, opportunistic credit, absolute return strategies, etc.

South Carolina Retirement System Investment Commission
7
Reynolds Williams was born in Mullins, S.C. He gradu-ated cum laude from the Baylor School for Boys in Chat-tanooga, Tennessee and received his bachelor’s degree from the University of Virginia, where he was an Echols Scholar. After serving in Vietnam, where he was award-ed the Bronze Star and the Combat Infantry Badge, Mr. Williams received his Juris Doctor from the University of South Carolina (USC) School of Law in 1973. While in law school, Mr. Williams received the American Jurisprudence Award in Contract Law.
Mr. Williams is admitted to all state and federal courts in South Carolina, the United States Court of Appeals for the Fourth Circuit, and the U.S. Supreme Court. He has been chairman of many Arbitration Panels of the National As-sociation of Securities Dealers, the American Arbitration Association, and the Duke Private Adjudication Center.
Mr. Williams is a former chairman of the Greater Florence Chamber of Commerce and President of the Florence Ro-
James R. Powers, of Chapin and Isle of Palms, S.C., retired in 1998 from a distinguished career as an investment banker. Most recently, Mr. Powers acted as Co-President and Chief Executive Officer of Sanwa Securities in New York. Prior to Sanwa Securities, Mr. Powers enjoyed a 15-year career with CS First Boston Group Inc., where he held several international positions including Chief Operating Officer of First Boston Australia and Chief Operating Of-ficer of CS First Boston Pacific in Tokyo. Mr. Powers began his banking career in 1972 with South Carolina National Bank. He is an eagle scout and actively involved in scout-ing as a member of the local council executive board. Mr. Powers is responsible for council administration for the council executive committees.
Mr. Powers received his bachelor’s degree in Finance from the University of Georgia where he was a member of Phi Gamma Delta, Beta Gamma Sigma, and Phi Eta Sigma fra-ternities.
Mr. Gillespie, of Anderson, S.C., is a Principal of GNI Capi-tal, responsible for portfolio management and investment research for all of the company’s managed assets. Mr. Gil-lespie also contributes commentary to StreetInsight.com, a member of TheStreet.com’s family of financial websites that is dedicated to the institutional investor.
Previously, Mr. Gillespie was a Registered Representative at Robinson-Humphrey and Smith Barney from 1995–1997. In 1997, he began managing private client portfolios and founded the Blue Ridge Total Return Fund, which was sold to the Colonial Trust Company in 1999. In addition to his advisory work, Mr. Gillespie provided independent research to a New York-based hedge fund.
Mr. Gillespie graduated cum laude from Washington & Lee University with a bachelor’s degree in Economics, and has been granted the Chartered Financial Analyst (CFA) designation. He is a member of the CFA Institute, the CFA Society of South Carolina, and the New York Society of Se-curity Analysts.
Reynolds Williams, Chairman Emeritus
Allen R. Gillespie, CFA, Vice Chairman
James R. Powers, Chairman
Commission
Members of the Commission are (pictured above from left to right, bottom to top): Blaine Ewing, III; Reynolds Williams, Chairman Emeritus; Converse A. Chellis, III, CPA, State Treasur-er; S. Travis Pritchett, DBA; Allen R. Gillespie, CFA, Vice Chair-man; and James R. Powers, Chairman

2008 - 2009 Annual Investment Report
8
S. Travis Pritchett, Distinguished Professor Emeritus at USC, held the W. Frank Hipp Chair of Insurance in the Moore School of Business from 1982 until his retirement in 2000. He was Chair of the Banking, Finance, Insurance, and Real Estate Department for seven years. Dr. Pritch-ett served as the Academic Director of the USC MBA and PMBA programs in the mid-1990s. In the 1980s, he was Director of a master’s degree program in health care fi-nance. At USC, he received the Alfred G. Smith Teaching Excellence Award, a Mortar Board Teaching Excellence Award, the Moore School Faculty Service Award, and the Moore School Distinguished Service Award. He worked with the Pension Trust and Employee Benefits Seminar for over 30 years.
Dr. Pritchett is a former editor of The Journal of Risk and Insurance (the world’s leading academic journal in its field) and was an associate editor of Benefits Quarterly, Jour-nal of Financial Service Professionals, Financial Services Review, Journal of Financial Planning, Journal of Business Research, and the America Journal of Small Business. He is author or coauthor of a dozen books and monographs and over 50 journal articles. In 1988, the Professional In-surance Agents’ Insurance Foundation chose him as the first recipient of their national Insurance Educator of the Year Award based on excellence in teaching, scholarship, and service.
Dr. Pritchett’s service work included being a Governor’s Appointee to the Joint Insurance Study Committee of the S.C. Legislature and a member of the Treasurer’s Task Force on COLAs. He has been President of the American
S. Travis Pritchett, D.B.A.
tary Club. He has served on the School Board at All Saints and St. Anthony’s, as Chairman of the Florence County Election Commission, and on the Board of Directors of Florence County Progress. Mr. Williams was a Faculty Seminar Participant at the 1991 U.S. Army War College.
Mr. Williams served on the Board of Directors of Commu-nity Bankshares and is a Director of IRIX Pharmaceuticals. He was Chairman of the Board of Florence National Bank. Williams was the President of the S.C. Chapter of the Fed-eralist Society and is a member of the Defense Research Institute, American Board of Trial Advocates, and South Carolina Defense Trial Attorneys Association. He has served as Vice-Chairman of the State Board for Technical and Comprehensive Education. Mr. Williams is recognized in the following books: Leading Lawyers in America, Super Lawyers, and The Best Lawyers in America.
In 1999, Governor Beasley awarded Mr. Williams the Or-der of the Palmetto, South Carolina’s highest honor, for his public service, civic responsibility, and friendship to the State. In 2001, Williams was named Business Person of the Year by the Greater Florence Chamber of Commerce. The USC School of Law recognized Williams as a Compleat Lawyer, for his 30+ years of “exemplary service” to the bar and the public. A Certified Financial Planner (CFP®), Mr. Williams was recognized in a Concurrent Resolution of the S.C. House and Senate for his leadership during the Invest-ment Commission’s formative years.
Converse A. Chellis, III, CPA, State TreasurerConverse A. Chellis, III was elected State Treasurer on Au-gust 3, 2007, by the South Carolina General Assembly.
Mr. Chellis was first elected to the General Assembly in 1996 and served as Representative from District 94 for ten years. District 94 is comprised of portions of Charleston and Dorchester counties. During his tenure in the legisla-ture, Mr. Chellis was a member of the Labor, Commerce and Industry Committee, where he served as Chairman of the Banking and Consumer Affairs Sub-Committee and as Chairman of the Business and Commerce Sub-Committee. Mr. Chellis also served as Chairman of the House Rules Committee.
Mr. Chellis is a Certified Public Accountant (CPA) and served as an officer with the firm Dixon Hughes PLC. He served as Chairman of the State Board of Accountancy from 1990-93, and as President of the South Carolina As-sociation of CPAs in 1985. Mr. Chellis was also a recipi-ent of the “Outstanding Service to the Profession” award given to a CPA by the Association for Professional Service.
Mr. Chellis received a bachelor’s degree from the Citadel in 1965. He served as a Captain in the U.S. Air Force and now lives in Summerville with his wife Sharon and two children.

South Carolina Retirement System Investment Commission
9
Risk and Insurance Association, the Risk Theory Society, the Academy of Financial Services, and the Southern Risk and Insurance Association.
Dr. Pritchett resides in Charleston, S.C. He is a consultant and expert witness on pensions and insurance issues and has been the retiree representative with the Commission since 2005.
Blaine Ewing, III, Certified Investment Management Analyst (CIMA), of Sullivan’s Island, S.C., is Senior Vice President of Investments at the Charleston offices of Morgan Stanley Smith Barney, LLC. His position entails strategy formulation, setting objectives and asset allocation guidelines, manager searches, and performance reviews for retirement plans, endowments, foundations, hospitals, corporations, and individuals.
Prior to joining Smith Barney, Mr. Ewing served as the Corporate Development and Marketing Service Manager for J.P. Stevens, Vice President for Strategic Planning Institute, and Investment Manager for BMI Capital.
Mr. Ewing received his bachelor’s degree in Economics from Washington & Lee University and his master’s degree in Marketing and Finance from New York University.
Blaine Ewing, III

2008 - 2009 Annual Investment Report
10
The Chief Executive Officer/Chief Investment Officer (CEO/CIO) is the agency head of the RSIC and serves as the executive for administrative functions as well as the chief officer of investment functions. The CEO/CIO is a fiduciary of the Retirement System and serves at the plea-sure of the Commission. The CEO/CIO’s general respon-sibilities include providing executive leadership in setting and achieving the Commission’s goals, mission, and ob-jectives and in setting and achieving strategic directions and goals; managing the RSIC in accordance with the guidelines established by the Commission and in compli-ance with state and federal laws and soliciting advice and counsel from the Commission as necessary; and develop-ing and maintaining communications and relationships with other state agencies, public retirement systems, and organizations involved with or having an impact on public retirement issues that may affect the Retirement System. Information on the Commission’s Roles and Responsibili-ties are more thoroughly addressed in the Commission’s Governance Policies.
CEO/CIO
Roles & Responsibilities
The Commission hired Robert L. Bor-den, former Executive Director and Chief Investment Officer of the Loui-siana State Employees’ Retirement System (LASERS), as its CIO in March 2006. As CIO, Mr. Borden has over-sight for the complete restructuring of the investment program for the Retirement Systems.
Mr. Borden graduated from the University of Texas at Aus-tin with a bachelor of business administration with a ma-jor in Finance and earned a master of science degree in Finance from Louisiana State University. Mr. Borden holds both the CFA and Chartered Alternative Investment Ana-lyst (CAIA) professional designations.
In Mr. Borden’s former position of Executive Director and CIO, he managed LASERS’ $7 billion pension fund. Dur-ing his tenure, the LASERS trust fund more than doubled in size and as of March 31, 2006 LASERS realized 1-year,
Robert L. Borden, CFA, CAIA, CEO/CIO
3-year, and 5-year returns of 14.6 percent, 17.6 percent, and 8.4 percent, respectively. This performance ranked LASERS’ portfolio among the top pension fund performers in the country.
Mr. Borden also served as Vice Chairman and Chairman of the Fund Evaluation Committee for the Louisiana Deferred Compensation Commission. Prior to joining LASERS, Mr. Borden held distinguished positions at the Texas Workers’ Compensation Insurance Fund, Franklin Federal Bancorp, the Texas State Treasury and Randy Morine Properties.
StaffThe Staff, as delegated and approved by the Commission, is responsible for developing and implementing an annual investment plan consistent with statutory requirements and the investment guidelines and objectives given by the Commission. Staff executes investment decisions, com-pletes administrative functions, performs risk manage-ment and compliance, and prepares investment reports.
CustodianBank of New York Mellon (BNY Mellon, or Custodian) serves as the RSIC’s custodian of the Retirement System’s assets, except in cases where investments are held in part-nerships, commingled accounts, or unique asset classes where it is prohibitive for them to do so. The Custodian is responsible for maintaining the official book of records, providing performance reports, and serving as an addi-tional layer of risk control in the safekeeping of Retirement System assets. Other functions the Custodian is respon-sible for include advising designated Staff daily of changes in cash equivalent balances; immediately advising Staff of additions or withdrawals from account assets; resolving any problems that Staff may have relating to the custodial account; safekeeping of securities; interest and dividend collections; daily sweep of idle principle and income cash balances; collections of proceeds from maturing securi-ties; disbursement of all income or principal cash balances as directed; providing monthly statements by investment managers’ accounts and a consolidated statement of all assets; providing a dedicated account representative and back up to assist in all needs relating to the custody and accountability of the Portfolio’s assets; reconciling returns with the Portfolio’s investment managers; and filing for recovery in security class action litigation settlements.

South Carolina Retirement System Investment Commission
11
Disclosure of Material InterestAs of June 30, 2009 there was no material interest noted by a member of the Commission or an employee who is a fiduciary with respect to investment and management of assets of the Retirement System, or by a related person, in a material transaction with the Retirement System within the last three years or proposed to be effected.
Investment Plan, Policies, & ObjectivesFor information regarding the RSIC’s investment plan, policies, and objectives please reference the Commission’s Annual Investment Plan (AIP), Statement of Investment Policies (SIP), and Statement of Investment Objectives (SIO).
ConsultantNew England Pension Consultants, LLC (NEPC, or Consultant) of Cambridge, Massachusetts, serves as the RSIC’s general investment consultant. As a fiduciary, the Consultant’s primary duties are to advise the Commission on matters related to the investment program and to provide a third party perspective and level of oversight to the RSIC’s investment pro-gram. Additionally, the Consultant assists the RSIC in developing, modifying, and reviewing investment policy objectives and guidelines, including the development of an asset allocation strategy and recommendations on the appropriate mix of investment manager styles and strategies. The Consultant provides assistance in manager searches, investment performance calculation, evaluation, and any other relevant analyses. The Consultant must provide timely information, written and/or oral, on investment strategies, instruments, managers and other related issues, as requested by the Staff or the Commission. The Consultant also provides advice and input to the CEO/CIO and Staff on a variety of investment-related issues.

2008 - 2009 Annual Investment Report
12
Commission Staff
Front row, left to right:
Brian Wheeler, Administrative Coordinator
Dori Ditty, JD, Policy Analyst
Robert L. Borden, CFA, CAIA, CEO/CIO
Brenda Gadson, Operations Manager
Heather Muller, Assistant to CEO/CIO
Nancy Shealy, General Counsel
Kathy Rast, Administrative Manager
Nicole Waites, Fixed Income Officer
Hilary Wiek, CFA, CAIA, Director of Public/Private Equity
Douglas W. Lybrand, CFA, CTP, FRM, Compliance/Risk Mgmt. Officer
Back row, left to right:
Donald Brock Jr., Performance Analytics Officer
Jonathan Boyd, Intern
Hershel Harper, CFA, Deputy CIO
Dunkin Allison, Alternative Investment Officer
Geoffrey Berg, CFA, Director of Research/Analytics
Jared O’Connor, Research Officer
Greg Putnam, CFA, Sr. Economic Research Analyst (resigned April 2009)
Rick Patsy, CFA, Sr. Fixed Income Officer (resigned July 2009)

South Carolina Retirement System Investment Commission
13
Strategic Plan
MissionThe South Carolina Retirement System Investment Commission will fulfill its fiduciary responsibility by prudently managing all assets held in trust for the sole benefit of the participants and beneficiaries of the South Carolina
Retirement Systems. It will seek superior long-term investment results at a reasonable level of risk.
VisionThe vision of the Commission is to be a world class investment organization that pursues strategies that contribute
positively to the financial health of the South Carolina Retirement Systems.
Values• Integrity •
The Commission will conduct itself with integrity by upholding the highest standards of fiduciary responsibility on behalf of the Retirement Systems, participants and beneficiaries.
• Accountability • The Commission will be accountable to the Retirement Systems, participants, and beneficiaries for its ethical conduct
and for compliance with its fiduciary responsibilities through a commitment to industry best practices of credibility, stewardship, and transparency.
• Empowerment • The Commission will encourage constituents at all levels to make decisions consistent with the organization’s policies,
goals, and objectives.
• Innovative • The Commission will use creative and independent thinking in its analyses, engagement processes, and decision
making to develop evolving investment practices and strategies that integrate the values, goals, and mission of the organization.
• Collaborative •The Commission will pursue the goals of openness, teamwork, equality, and relationship building to formulate
strategies, increase performance, and maximize knowledge transfer for the benefit of the plan.
GoalsI: Develop and Execute Major Investment Portfolio Initiatives
II: Develop and Implement Specific Governance Policies III: Improve and Standardize Due Diligence Processes
IV: Improve Reporting ProcessesV: Develop Efficient and Effective Workforce
VI: Create Efficient and Effective FacilitiesVII: Perform Feasibility Study and Prepare Recommendations for Long-term Organizational Structure
During the course of Fiscal Year ending (FYE) 2009 the Staff and Commission developed and implemented a strategic plan in order to create the foundation for the Commission’s future. The RSIC’s new mission, vision, values, and goals that were developed during this process are included below.

2008 - 2009 Annual Investment Report
14
Q1 Q2 Q3 Q4 1 year 3 year 5 yearS&P 500 (8.4%) (21.9%) (11.0%) 15.9% (26.2%) (8.2%) (2.2%)Russell 2500 (6.7%) (26.3%) (11.4%) 20.3% (26.7%) (9.3%) (0.9%)Russell 2000 (1.1%) (26.1%) (15.0%) 20.7% (25.0%) (9.9%) (1.7%)MSCI EAFE (20.6%) (20.0%) (13.9%) 25.4% (31.4%) (8.0%) 2.3%MSCI EME (27.0%) (27.6%) 0.9% 34.7% (28.1%) 3.0% 14.7%
Barclays US Agg (0.5%) 4.6% 0.1% 1.8% 6.1% 6.4% 5.0%Barclays Global Agg (3.8%) 5.2% (3.3%) 4.9% 2.8% 6.7% 5.5%Barclays US HY (8.9%) (17.9%) 6.0% 23.1% (2.4%) 2.1% 4.3%JP Morgan EMBI Div (5.0%) (7.1%) 3.8% 11.4% 2.1% 6.1% 8.2%3 Month LIBOR 0.8% 0.6% 0.3% 0.3% 2.0% 3.9% 3.8%3 Month Treasury Bills 0.6% 0.2% 0.1% 0.1% 1.0% 3.3% 3.2%
50% MSCI World; 50% Citi WGBI (9.1%) (7.2%) (8.3%) 12.0% (13.5%) 0.1% 3.4%NCREIF (0.2%) (8.3%) (7.3%) (5.2%) (19.6%) 1.0% 7.6%Venture Economics - All Private Equity* (5.7%) (14.9%) (3.3%) (5.4%) (26.6%) (1.0%) 7.3%HFRX Global Hedge Fund (10.7%) (13.2%) 0.7% 4.8% (18.1%) (3.6%) (0.5%)50% GSCI; 50% Barclays Inflation-Linked (16.0%) (26.4%) (4.5%) 10.6% (34.7%) (4.4%) 1.7%*Q4 data unavailable; internal portfolio actual return used in lieu of Venture Economics data
$0
$5,000
$10,000
$15,000
$20,000
$25,000
$30,000
Total Fund Growth (in millions)
Total Fund ReviewAs of June 30, 2009, the Retirement System’s investment portfolios had a combined market value of $21.0 billion. The Portfolio’s net return for FYE June 30, 2009, was -19.3%, while the three- and five-year annualized returns were -3.8% and -0.1%, respectively. The chart featured to the right depicts the growth of the Portfolio since FYE 1994.
Market OverviewThe Fiscal Year ending June 30, 2009 witnessed the great-est stock market decline since the Great Depression. By March, domestic equities had lost more than half of their value over the prior 18 months. During the same period, international stocks lost more than 60% of their value.
As the global financial system buckled under the dual stresses of the housing collapse and a weakening economy, the fear of mass bankruptcies gripped the equity and bond markets. This caused a sharp rise in the yields of many non-government bonds. As fears abated, these markets rallied, giving investors the sharpest stock market rally in the mod-ern era.
The collapse of the credit markets had far-reaching implications for other asset classes, particularly those requiring functional credit markets. In calendar year 2008, commercial real estate suffered its first year of losses since 1992, and only its third annual loss since the data has been collected (1978). Hedge funds also suffered from the lack of inexpen-sive credit as well as from the unprecedented step taken by the Securities and Exchange Commission of imposing a ban on short-selling the stocks of financial institutions. As the markets recovered and the ban expired, the performance of hedge funds improved.
The market turmoil caused liquidity issues for many pension plans and endowments in late 2008, forcing distressed sales of illiquid assets such as private equity and real estate. The diversification and liquidity of the Equity and Fixed Income portfolios allowed the Portfolio to endure the storm without resorting to distressed asset sales.
Total Fund Growth (Millions)
Index Returns for FYE 2009

South Carolina Retirement System Investment Commission
15
The Investment Commission compares the Portfolio’s performance to two customized benchmarks: the Poli-cy Benchmark and the Strategy Benchmark. The Policy Benchmark represents a hypothetical return that would occur if the Portfolio’s assets were invested passively (in-dexed) with the weights of each asset class consistent with the Policy Asset Allocation.
Whereas the Policy Benchmark uses predetermined pol-icy weights, the Strategy Benchmark uses the Portfolio’s actual weights. The difference between the returns of the Policy and Strategy Benchmarks represents the val-ue added from the strategic decisions to deviate from the Policy Asset Allocation. For example, if International Equity is the worst performing asset class, and the CEO/CIO has chosen to invest less in this asset class than pro-scribed by the Policy Asset Allocation, the Strategy bench-mark would be better than the Policy benchmark, indicat-ing that this decision added value to the Portfolio.
Likewise, the difference between the Strategy Benchmark and the actual return represents the value added from manager selection. To continue the example above, if the actual investments in the International Equity asset class outperform the passive index, the selection of these man-agers adds value to the Portfolio.
-19.
3%
-3.8
% -0.1
%
-18.
4%
-3.5
% -0.1
%
-17.
3%
-3.1
%
0.3%
-25%
-20%
-15%
-10%
-5%
0%
5%
One Year Three Year Five Year
RSIC Total Fund Return Policy Benchmark Strategy Benchmark
ActualReturn
Strategy Benchmark
Policy Benchmark
Value From Manager Selection
Value From Asset Allocation
Decision
Total Value Added
Policy & Strategy Benchmarks
PerformanceFor the Fiscal Year ending June 30, 2009, the RSIC’s total investment return was -19.3%. During the same period, the RSIC’s actively-managed Equity portfolios returned -28.0% while the actively-managed Fixed Income port-folios returned 4.0%. Alternative asset classes returned -15.4% for the year. The Portfolio’s return of -19.3% for the fiscal year lagged both the Policy benchmark return (-18.4%) and Strategy benchmark (-17.3%). Whereas as-set allocation decisions added value, manager selection hurt performance. It should be noted that the majority of this underperformance occurred in the fall of 2008 as the credit crisis shook the capital markets. As the markets have rebounded, the Portfolio has outperformed both the Policy and Strategy benchmarks.
Annualized ReturnsAs of June 30, 2009
Understanding the Benchmarks
Performance vs. PeersWhile the Portfolio’s performance was down 19.3%, this was slightly lower than the median return for the Large Plan Universe1, which was down 18.4% for the same period. It is important to note that the Portfolio’s performance relative to this peer group was worst during the first half of the fiscal year, but this improved dramatically after this period as the portfolio transition had been completed.
1 Source: NEPC
Quarterly ReturnsFor FYE 2009
-10.
9%
-16.
3%
-3.0
%
11.6
%
-10.
4%
-13.
1%
-5.1
%
10.4
%
-10.
8%
-13.
4%
-3.7
%
11.1
%
-25%
-20%
-15%
-10%
-5%
0%
5%
10%
15%
Sep-08 Dec-08 Mar-09 Jun-09RSIC Total Fund Return Policy Benchmark Strategy Benchmark

2008 - 2009 Annual Investment Report
16
A belief in the long-term benefits of diversification is the cornerstone of the Portfolio’s asset allocation strategy. In mid-2007, the Commission began the process of migrating from a simple mix of Equities and Fixed Income to a more broadly diversified asset allocation. Rather than attempt-ing a rapid diversification, the Commission recognized the importance of a gradual diversification of plan assets. This afforded the Commission and Staff the opportunity to complete due diligence for each of the investments. In addition, this method helped mitigate the risk associated with market timing as the process was spread out over nearly two years.
For the period between June 30, 2007 and December 31, 2008, consistent with the transition plan detailed in the 2008 - 2009 AIP, the Policy asset allocation targets changed on a monthly basis to facilitate a gradual diversi-fication process. The Commission determined that, as of January 1, 2009, this transition period was complete.
Effective March 31, 2009, the Commission approved a new Policy asset allocation, which includes revised target weights and ranges. In addition, as detailed to the right, the new Policy targets introduce new asset classes (liquid real assets and real estate) to the Portfolio. The charts at the top of the following page detail the policy asset allo-cation weights for FYE 2009.
The changes to the Policy target allocations were made in an effort to improve the risk-adjusted returns of the Port-folio. In addition, whereas the former target allocation was designed to deliver superior returns in an environ-ment of steady economic growth, the new allocation is less dependent upon such an environment.
RSIC Policy Allocation As of June 30, 2009
Asset Class
Policy Benchmark
WeightAllocation
Range Policy Benchmark
Domestic Large Cap
10% 0% - 25% S&P 5001
Domestic Small/Mid Cap
5% 0% - 20% Russell 2500
International Large Cap
10% 0% - 25% MSCI EAFE
Emerging Markets
5% 0% - 15% MSCI EME
Public Equity 30% 0% - 70%Cash 10% 0% - 100% 90 Day T-BillsCore Fixed Income
10% 0% - 40% Barclays U.S. Aggregate
Global Fixed Income
4% 0% - 40% Barclays Global Aggregate
High Yield Fixed Income
3% 0% - 40% Barclays U.S. High Yield
Emerging Markets Debt
3% 0% - 40% JP Morgan EMBI Diversified
Public Debt 30% 30% - 100%GAA 10% 0% - 20% 50% MSCI World;
50% Citi WGBIHedge Funds 5% 0% - 25% HFRX Global Hedge
FundPrivate Equity 7% 0% - 15% Venture Economics
Opportunistic Credit
8% 0% - 15% Blended
Benchmark2
Real Estate 5% 0% - 40% NCREIFLiquid Real Assets
5% 0% - 40% 50% DJ/UBS; 50% Barclays WGIL
Alternatives 40% 0% - 50%1Russell 1000 implemented from 6/30/08 - 3/31/09. S&P 500 implemented 3/31/09 - present.2Opportunistic Credit Policy Benchmark is comprised of 33.3% S&P/LSTA Leveraged Loan Index, 33.3% Barclays U.S. High Yield and 33.3% Barclays MBS Index.
-19.
3%
-3.8
% -0.1
%
8.0% 7.5%
7.4%
-25%
-20%
-15%
-10%
-5%
0%
5%
10%
One Year Three Year Five Year
RSIC Total Fund Return Actuarial Rate of Return
Performance vs. Actuarial ReturnGiven that the Portfolio’s performance was negative for the fiscal year, it underperformed the actuarial return, which was 8.0% for the year. Due to the volatility inher-ent in the capital markets, it is not appropriate to expect the portfolio to always beat this target rate of return over short periods of time.
RSIC Actual vs. Actuarial Return As of June 30, 2009
Asset Allocation Overview

South Carolina Retirement System Investment Commission
17
Statistics 1 Year 3 Year 5 YearAnnualized Return -19.3% -3.8% -0.1%Annualized Standard Deviation n/a 14.6% 11.6%Sharpe Ratio n/a -0.5 -0.3
R2* 97.2% 97.1% 97.0%Annualized Alpha* -0.9% -0.3% 0.0%Correlation* 98.3% 98.6% 98.5%* As compared to Policy Index
Beta OverlayThe RSIC employs a Beta Overlay manager, Russell Implementation Services, Inc. (Russell), to facilitate the management of the asset allocation of the portfolio. Russell utilizes derivative instruments such as futures contracts and swap agree-ments to achieve the desired asset allocation exposures. Derivatives are efficient investment vehicles that allow the Portfolio to quickly and cost-effectively gain or reduce exposures to certain asset classes. As managers are hired in these asset classes, derivative positions can be reduced to maintain the appropriate net exposures. The table below shows the aggregate derivative exposures at June 30, 2008 and June 30, 2009.
Summary Beta Overlay Exposures Statistics1
The table below illustrates the statistical performance data for the Portfolio as of June 30, 2009.
US Equity, 28.3%
Non-US Equity, 19.6%
Private Equity, 1.0%
Real Estate, 0.3%
GTAA / Risk Parity, 8.2%
Hedge Funds (Net), 0.2%
Core Fixed Income, 24.2%
Opportunistic Credit, 0.5%
Cash, 0.3%
Global Opp. Fixed Income, 17.4%
US Equity, 16.6%
Non-US Equity, 16.3%
Private Equity, 2.5%
Real Estate, 0.6%
GTAA / Risk Parity,6.3%Hedge Funds (Net),
4.6%
Core Fixed Income, 20.5%
Int'l Fixed Income, 10.7%
High Yield, 3.5%
Opportunistic Credit, 5.1%
Cash, 13.1%
RSIC Portfolio Exposure FYE 2008
RSIC Portfolio ExposureFYE 2009
1 See Appendix H on page 84 for more detail regarding the statistical concepts and methodology.
Source: NEPC
Managers % of Portfolio $'s of Portfolio % of Portfolio $'s of PortfolioLarge Cap 1.1 282.4 0.8 162.7Small Cap 0.8 209.3 1.7 355.3International 13.4 3,556.4 10.6 2,237.4Emerging 4.8 1,285.5 5.7 1,189.3Net Equity 20.0% $5,333.6 18.8% $3,944.7
Core Fixed (6.6) (1,754.1) (0.4) (82.5)International 5.1 1,362.1 0.0 0.0High Yield 0.4 97.6 0.0 0.0Emerging 2.6 687.1 2.1 448.8Net Fixed Income 1.5% $392.6 1.7% $366.3
Total 21.5% $5,726.3 20.5% $4,311.0All figures shown are in millions
June 30, 2008 June 30, 2009
Commentary by: Geoff Berg

2008 - 2009 Annual Investment Report
18
Manager Returns (Net of Fees)Fiscal Year Ending June 30, 2009 Market Value % of Fund 3 Month YTD 1 Year 3 Year 5 Year 10 YearPENSION COMPOSITE GROSS $21,019,143,418 11.7% 8.4% -19.0% -3.6% 0.2% 3.1%PENSION COMPOSITE NET 21,019,143,418 11.6% 8.2% -19.3% -3.8% -0.1% 2.9%FINANCIAL COMPOSITE 12,033,522,102 10.5% 6.5% -19.2% -3.8% 0.0% 2.9%
STRATEGY INDEX 11.1% 7.0% -17.3% -3.1% 0.3% 3.2%POLICY INDEX 10.4% 4.8% -18.4% -3.5% -0.1% 3.0%
TOTAL DOMESTIC EQUITY $2,298,788,784 10.9% 18.9% 7.8% -28.0% -10.2% -3.1% -1.5%RUSSELL 3000 16.8% 4.2% -26.6% -8.3% -1.8% -1.5%
TOTAL LARGE CAP COMPOSITE 714,160,152 3.4% 15.1% 5.3% -31.7% -11.8% -4.6% n/aTOTAL LARGE CAP ACTIVE COMPOSITE 714,160,152 3.4% 15.1% 5.3% -32.0% -13.4% -5.7% n/a
RUSSELL 1000 16.5% 4.3% -26.7% -8.2% -1.9% -1.8%LARGE CAP GROWTH COMPOSITE 401,899,807 1.9% 16.0% 12.7% -35.3% -14.7% -7.1% n/a
Legg Mason 96,967,864 0.5% 19.7% 13.0% -49.6% -19.5% n/a n/aWCM 304,931,943 1.5% 14.8% 12.6% -25.7% -12.6% n/a n/a
RUSSELL 1000 GROWTH 16.3% 11.5% -24.5% -5.4% -1.8% -4.2%LARGE CAP VALUE COMPOSITE 312,260,345 1.5% 14.1% -2.8% -27.5% -12.7% -4.1% n/a
Aronson, Johnson, Ortiz 312,260,345 1.5% 14.1% -2.8% -28.0% -10.6% n/a n/aRUSSELL 1000 VALUE 16.7% -2.9% -29.0% -11.1% -2.1% -0.2%
TOTAL SMID CAP COMPOSITE 451,536,136 2.1% 16.2% 8.4% -25.2% -6.9% 1.0% n/aRUSSELL 2500 20.3% 6.5% -26.7% -9.3% -0.9% 3.7%
SMID CAP GROWTH COMPOSITE 288,214,010 1.4% 17.3% 12.1% -22.3% -4.6% 2.9% n/aTimesSquare Capital 288,214,010 1.4% 17.3% 12.1% -22.3% -4.6% 2.9% n/a
RUSSELL 2500 GROWTH 21.8% 14.5% -27.3% -7.7% -0.7% 0.7%SMID CAP VALUE COMPOSITE 163,322,126 0.8% 14.4% 2.4% -29.8% -10.4% n/a n/a
TSW 163,322,126 0.8% 14.4% 2.4% -29.8% -10.4% n/a n/aRUSSELL 2500 VALUE 18.8% -0.6% -26.2% -11.2% -1.6% 5.0%
TOTAL SMALL CAP COMPOSITE 1,584,628,632 7.5% 20.6% 9.0% -26.2% -10.3% -1.1% n/aRUSSELL 2000 20.7% 2.6% -25.0% -9.9% -1.7% 2.4%
SMALL CAP CORE COMPOSITE 298,207,886 1.4% 24.9% 17.7% -24.5% -8.7% 0.6% n/aPyramis 298,207,886 1.4% 24.9% 17.7% -24.5% -8.8% 0.6% n/a
RUSSELL 2000 20.7% 2.6% -25.0% -9.9% -1.7% 2.4%SMALL CAP GROWTH COMPOSITE 472,166,396 2.2% 17.3% 4.4% -31.9% -13.1% -3.3% n/a
BatteryMarch 124,576,555 0.6% 16.0% 3.8% -32.6% -15.4% n/a n/aTurner Investments 165,964,130 0.8% 18.1% 10.8% -33.5% -9.9% n/a n/aClarivest 181,625,711 0.9% 17.5% -0.4% -33.4% -15.0% n/a n/a
RUSSELL 2000 GROWTH 23.4% 11.4% -24.8% -7.8% -1.3% -0.9%SMALL CAP VALUE COMPOSITE 362,718,214 1.7% 27.7% 9.3% -17.5% -11.2% -1.9% n/a
Wells (Benson) 252,167,396 1.2% 29.2% 11.3% -18.4% -11.6% -2.2% n/aIntegrity 110,550,818 0.5% 24.3% 5.1% -15.3% -9.7% n/a n/a
RUSSELL 2000 VALUE 18.0% -5.2% -25.2% -12.1% -2.3% 5.0%
FIXED INCOME COMPOSITE $7,604,638,942 36.2% 8.5% 7.8% 4.0% 5.7% 4.9% 6.1%CORE FIXED INCOME 4,121,126,696 19.6% 4.7% 3.9% 4.3% 5.6% 4.8% 5.9%
Internal Core Fixed Income 2,074,592,696 9.9% 4.0% 3.2% 3.6% 5.3% 4.7% 5.9%PIMCO 840,222,111 4.0% n/a n/a n/a n/a n/a n/aPIMCO Transition 188,211,875 0.9% n/a n/a n/a n/a n/a n/aBlackrock 1,018,100,014 4.8% n/a n/a n/a n/a n/a n/a
BARCLAYS CAPITAL U.S. AGGREGATE 1.8% 1.9% 6.1% 6.4% 5.0% 6.0%GLOBAL FIXED INCOME 2,773,357,927 13.2% 12.7% 11.4% 1.9% n/a n/a n/a
Credit Agricole 730,731,084 3.5% 8.2% 11.7% 9.8% n/a n/a n/aLoomis Sayles 597,528,259 2.8% 20.2% 20.6% -3.8% n/a n/a n/aMondrian 822,221,050 3.9% 9.2% 3.6% 5.8% n/a n/a n/aWestern Asset Management 622,877,534 3.0% 16.6% 14.3% -3.8% n/a n/a n/a
BARCLAYS CAPITAL GLOBAL AGGREGATE 4.9% 1.5% 2.8% 6.7% 5.5% n/aHIGH YIELD FIXED INCOME 561,504,319 2.7% 19.0% 25.7% -1.8% n/a n/a n/a
Loomis Sayles NHIT 509,245,383 2.4% 19.5% 26.2% -1.4% n/a n/a n/aPenn Capital 52,258,936 0.2% n/a n/a n/a n/a n/a n/a
BARCLAYS CAPITAL U.S. HIGH YIELD 23.1% 30.4% -2.4% 2.1% 4.3% 4.7%EMERGING MARKET DEBT
Annualized Returns
FIXED INCOME
PHYSICAL PUBLIC EQUITY

South Carolina Retirement System Investment Commission
19
Manager Returns (Net of Fees)Fiscal Year Ending June 30, 2009 Market Value % of Fund 3 Month YTD 1 Year 3 Year 5 Year 10 Year
Annualized Returns
Cap Guardian 148,650,000 0.7% n/a n/a n/a n/a n/a n/aJP MORGAN EMR'G BOND GLOBAL DIVERSIFIED 11.4% 15.7% 2.1% 6.1% 8.3%
TOTAL PHYSICAL CASH 476,880,118 2.3% 0.1% 0.2% 1.3% 3.5% n/a n/a3M LIBOR 0.3% 0.6% 2.0% 3.9% 3.8%3M T-BILLS 0.1% 0.1% 1.0% 3.2% 3.2%
TOTAL PRIVATE EQUITY COMPOSITE $347,404,953 1.7% 0.6% -0.3% -4.4% n/a n/a n/aTOTAL BUYOUTS
Apax Europe 13,009,393 0.1% n/a n/a n/a n/a n/a n/aBridgepoint Europe 2,675,807 0.0% n/a n/a n/a n/a n/a n/aCarousel Capital 25,150,708 0.1% n/a n/a n/a n/a n/a n/aCrestview Partners (538,516) 0.0% n/a n/a n/a n/a n/a n/aClayton, Dubilier, & Rice 568,822 0.0% n/a n/a n/a n/a n/a n/aWelsh, Carson, Anderson & Stowe (204,717) 0.0% n/a n/a n/a n/a n/a n/a
TOTAL VENTURE GROWTHSquare 1 Ventures 4,488,794 0.0% n/a n/a n/a n/a n/a n/aTruebridge Capital 8,847,496 0.0% n/a n/a n/a n/a n/a n/aWarburg Pincus 23,000,367 0.1% n/a n/a n/a n/a n/a n/aVenture Investment Managers 2,543,923 0.0% n/a n/a n/a n/a n/a n/a
TOTAL SECONDARIESNeuberger Berman 8,156,694 0.0% n/a n/a n/a n/a n/a n/aIndustry Ventures 11,470,565 0.1% n/a n/a n/a n/a n/a n/aLexington Partners 4,095,336 0.0% n/a n/a n/a n/a n/a n/aPaul Capital 31,505,923 0.1% n/a n/a n/a n/a n/a n/a
TOTAL MEZZANINEGoldman Sachs 24,345,126 0.1% n/a n/a n/a n/a n/a n/aNorthstar Capital 12,305,297 0.1% n/a n/a n/a n/a n/a n/a
TOTAL DIVERSIFIED FUND OF FUNDSPantheon Europe 20,578,773 0.1% n/a n/a n/a n/a n/a n/aPantheon USA 29,223,675 0.1% n/a n/a n/a n/a n/a n/a
OTHERAquiline 47,984,752 0.2% n/a n/a n/a n/a n/a n/a
TOTAL STRATEGIC PARTNERSHIPSGoldman Sachs Partnership $997,899,928 4.7% -0.8% -0.7% n/a n/a n/a n/aMorgan Stanley Partnership 801,125,772 3.8% 0.0% -1.9% -19.7% n/a n/a n/aTCW Partnership 351,438,626 1.7% n/a n/a n/a n/a n/a n/aApollo Partnership 75,949,238 0.4% 11.3% n/a n/a n/a n/a n/a
TOTAL HEDGE FUNDS $4,158,599,296 19.8% 3.9% 5.4% -12.8% n/a n/a n/aHFRX GLOBAL HEDGE FUND INDEX 2.9% 8.6% -18.1% -3.6% -0.5% 4.9%
TOTAL DIRECT HEDGE FUNDSBridgewater 298,464,575 1.4% -5.1% -4.7% -9.1% n/a n/a n/aD.E. Shaw 343,919,358 1.6% 6.5% 11.1% -8.4% n/a n/a n/aFrontpoint 359,803,500 1.7% 6.4% 8.2% -4.4% n/a n/a n/aW.L.Ross 210,281,175 1.0% -2.1% -3.2% n/a n/a n/a n/aMariner - Hedge Funds 296,397,918 1.4% 11.1% 14.7% -11.7% n/a n/a n/a
TOTAL HEDGE FUND OF FUNDSMorgan Stanley Completion 612,008,234 2.9% 3.8% 5.1% -19.8% n/a n/a n/aEntrust 256,136,271 1.2% 9.9% 10.7% -15.5% n/a n/a n/aGAM 570,318,545 2.7% 0.7% 1.6% -11.1% n/a n/a n/aGottex 665,625,000 3.2% 5.0% 6.6% -12.8% n/a n/a n/aGrosvenor 545,644,720 2.6% 4.0% 4.7% -15.2% n/a n/a n/aMorgan Stanley/SCLP Hedge Funds*
CREDIT ORIENTED HEDGE FUNDSGoldman Sachs - Hedge Funds*
TOTAL GLOBAL ASSET ALLOCATION $1,323,693,403 6.3% 6.4% 2.7% -20.5% n/a n/a n/a50% MSCI WORLD, 50% CITI WGBI 12.8% 4.2% -13.0% 1.0% 4.2% 3.7%
PRIVATE EQUITY
HEDGE FUNDS
GTAA/RISK PARITY
STRATEGIC PARTNERSHIPS

2008 - 2009 Annual Investment Report
20
Manager Returns (Net of Fees)Fiscal Year Ending June 30, 2009 Market Value % of Fund 3 Month YTD 1 Year 3 Year 5 Year 10 Year
Annualized Returns
TOTAL RISK PARITYBridgewater 594,549,967 2.8% -0.3% 1.1% -21.7% n/a n/a n/aPutnam Investments 399,293,113 1.9% 12.7% 6.1% -16.9% n/a n/a n/a
90D T-Bills + 5% 1.3% 2.5% 6.0% 8.3% 8.3% 8.4%TOTAL GLOBAL TACTICAL ASSET ALLOCATION
GMO 329,850,323 1.6% 5.8% 1.7% -7.1% n/a n/a n/a50% MSCI WORLD, 50% CITI WGBI 12.8% 4.2% -13.0% 1.0% 4.2% 3.7%
TOTAL OPPORTUNISTIC CREDIT $639,194,037 3.0% 14.4% 17.0% 1.2% n/a n/a n/aBLENDED OPPORTUNISTIC CREDIT BENCHMARK 1 14.5% 21.3% -9.2% -0.3% 2.9% 4.0%
TOTAL DIRECT INVESTMENTSAngelo Gordon 34,812,324 0.2% 18.3% 25.4% -11.8% n/a n/a n/aD.E. Shaw Opp Credit 33,848,368 0.2% 9.6% 8.1% -4.5% n/a n/a n/aSankaty Advisors 133,408,256 0.6% 12.4% 15.7% 10.0% n/a n/a n/aSelene Partners 40,114,289 0.2% -1.5% 6.8% 5.3% n/a n/a n/aAvenue Capital 108,090,916 0.5% 21.2% n/a n/a n/a n/a n/aING Clarion 20,000,000 0.1% n/a n/a n/a n/a n/a n/a
TOTAL STRATEGIC PARTNERSHIPSMariner - Opp Credit 268,919,884 1.3% 10.0% 12.7% n/a n/a n/a n/aTCW - Opp Credit*Apollo - Opp Credit*Goldman Sachs - Opp Credit*
TOTAL REAL ASSETSTOTAL STRATEGIC PARTNERSHIPS
Morgan Stanley - Real Assets*Goldman Sachs - Real Assets*
NCREIF PROPERTY INDEX -5.2% -12.1% -19.6% 1.0% 7.6% 8.5%
TOTAL RUSSELL OVERLAYRussell Overlay** $1,690,595,646 8.0% 5.0% 3.3% -10.7% n/a n/a n/aRussell Swaps 305,918,065 1.5% n/a n/a n/a n/a n/a n/a
Mariner Cash $6,421,272 0.0% -3.7% n/a n/a n/a n/a n/aTCW Cash and Other 20,863,903 0.1% n/a n/a n/a n/a n/a n/a
Notes:
REAL ASSETS
OVERLAY
OPPORTUNISTIC CREDIT
*Market value included as part of Strategic Partnerships**Returns provided by Russell1 Blended Opportunistic Credit Benchmark comprised of 1/3 BarCap High Yield, 1/3 S&P/LSTA Leveraged Loan Index, and 1/3 BarCap MBS Index
Other
Source: NEPC

South Carolina Retirement System Investment Commission
21
Public Equity ReviewAs of June 30, 2009, the physical Public Equity portfolio had a market value of $2,298.8 million, representing 10.9% of the Portfolio. Performance of this portion of the Portfolio for the fiscal year was -28.0%. Synthetic positions provided exposures that made up the remainder of the Public Equity portfolio, bringing the allocation to 32.9% at the end of the fiscal year.
Portfolio Developments • At the beginning of the fiscal year, the physical Public Equity portfolio consisted of 16 externally managed ac-counts valued at $6,769.6 million. Five portfolios were discontinued during the fiscal year in conjunction with a decision to reduce equity exposure.• The Commission approved a search for emerging mar-ket managers which will commence in fiscal year 2009-2010. The portfolio currently achieves exposure to devel-oped international and emerging market equities through the Beta Overlay program.
Portfolio StructureThe Public Equity portfolio has a target allocation of 30% of the Portfolio. This target is achieved both through physi-cal securities portfolios managed by external managers as well as through synthetic exposures in the Beta Overlay program. This affords the Commission the ability to pursue excess returns from active management while precisely managing the asset allocation. See page 17 for further discussion of the Beta Overlay program, including a breakdown of the program by asset classes.
At fiscal year end, the total public equity exposure was 32.9%, 2.9% above the target allocation. The majority of this overweight was to the small cap space, which was serving as a proxy for the Portfolio’s Private Equity allocation, which was underweight due to commitments not yet fully funded.
Market OverviewGlobal equity performance was influenced by the sub-prime mortgage crisis and the subsequent global financial crisis, a problem that was exacerbated by the failure of Lehman Brothers. In total, the crisis produced five of the eight largest bankruptcies in history. The turmoil in the global markets contributed to an atmosphere of intense fear, leading to a rush of investors selling risky assets. De-clining prices in stocks and bonds, rising economic uncer-tainty, and fear of a collapse of the banking system led to unprecedented volatility in equities. U.S. equity markets, which peaked in late 2007, lost nearly half of their value from late August to November, followed by a brief rally in December. The markets again moved sharply lower in early 2009, before beginning a steep rally in early March that continued into June. Although the major market in-
30.0%
10.0%
5.0%
10.0%
5.0%
32.9%
7.3%9.2%
10.7%
5.7%
0%
10%
20%
30%
40%
Total Public Equity Dom. Large Cap Dom. Small/Mid Cap Int'l Large Cap Emr'g Markets
Policy Target Weight Actual Weight
Public Equity Exposure1
as of June 30, 2009
1 Differences between asset class exposure and asset allocation are attributed to managers’ ability to invest in multiple asset classes.
Equity Index Cumulative Return
-70%
-60%
-50%
-40%
-30%
-20%
-10%
0%
10%
Russell 1000 Total Return MSCI EAFE Net Total Return
MSCI EME Net Total Return Russell 2500 Total Return

2008 - 2009 Annual Investment Report
22
PerformanceThe portion of the Public Equity portfolio that resided with external active managers returned -28.0% in FYE 2009. This subset of the Public Equity portfolio only con-tained U.S. equities. The corresponding Policy Benchmark returned -26.0% while the strategy benchmark return was -25.5%. As detailed below, the equity managers did not add value in aggregate, although five of the eleven man-agers remaining at fiscal year-end outperformed their benchmarks in varying degrees.
dices all climbed significantly in this rally, many of the better performing stocks were those of lower quality companies which had been considered potential candidates for bankruptcy restructuring. Many active managers found this envi-ronment to be particularly difficult to navigate, as few had anticipated that these low quality firms would provide the most attractive returns.
There was an uncommonly small dispersion of returns for the major market indices during the Fiscal Year ending June 30, 2009. Small stock returns were slightly superior to those of large stocks, with a -25.0% return for the Russell 2000 Index versus a -26.7% return for the Russell 1000 Index. Large cap growth performed significantly better than large cap value. The Russell 1000 Growth Index returned -24.5% whereas the Russell 1000 Value Index returned -29.0%. There was little difference between the -24.8% return for the Russell 2000 Small Cap Growth Index and the -25.2% return for the Russell 2000 Small Cap Value Index. International equities fared poorly during the year, due to both the global na-ture of the economic slowdown and the appreciation of the U.S. dollar. The Morgan Stanley Capital International (MSCI) Europe, Australia, and Far East (EAFE) Index fell 31.4%, of which approximately 6% was due to the appreciation of the U.S. dollar against foreign currencies, while the MSCI Emerging Markets Equity (EME) Index declined 28.1%, of which 8% was due to the dollar appreciation.
StatisticsThe table below displays select statistics of the Public Eq-uity portfolio as of June 30, 2009.
Managers Market Value % of Fund 1 Year 3 Year 5 YearTotal Physical Public Equity Composite $2,298,788,784 10.9% -28.0% -10.2% -3.1%
Russell 3000 -26.6% -8.3% -1.8%Legg Mason 96,967,864 0.5% -49.6% -19.5% n/aWCM 304,931,943 1.5% -25.7% -12.6% n/a
Russell 1000 Growth -24.5% -5.4% -1.8%Aronson, Johnson, Ortiz 312,260,345 1.5% -28.0% -10.6% n/a
Russell 1000 Value -29.0% -11.1% -2.1%TimesSquare Capital 288,214,010 1.4% -22.3% -4.6% 2.9%
Russell 2500 Growth -27.3% -7.7% -0.7%TSW 163,322,126 0.8% -29.8% -10.4% n/a
Russell 2500 Value -26.2% -11.2% -1.6%Pyramis 298,207,886 1.4% -24.5% -8.8% 0.6%
Russell 2000 -25.0% -9.9% -1.7%BatteryMarch 124,576,555 0.6% -32.6% -15.4% n/aTurner Investments 165,964,130 0.8% -33.5% -9.9% n/aClarivest 181,625,711 0.9% -33.4% -15.0% n/a
Russell 2000 Growth -24.8% -7.8% -1.3%Benson 252,167,396 1.2% -18.4% -11.6% -2.2%Integrity 110,550,818 0.5% -15.3% -9.7% n/a
Russell 2000 Value -25.2% -12.1% -2.3%
Annualized Returns
Manager Performance as of June 30, 2009
Statistics 1 Year 3 Year 5 YearAnnualized Return -28.0% -10.2% -3.1%Annualized Standard Deviation n/a 22.4% 18.4%Sharpe Ratio n/a -0.6 -0.3
R2* 95.7% 95.8% 96.0%Annualized Alpha* -1.3% -1.7% -0.6%Correlation* 94.6% 94.6% 93.7%* As compared to S&P 500 Index
Source: NEPC
Source: NEPC
Commentary by: Hilary Wiek

South Carolina Retirement System Investment Commission
23
Fixed Income Index Cumulative ReturnDuring the fiscal year the economy was rocked by nu-merous events of historical significance—the collapse of Lehman Brothers, the nationalization of Fannie Mae and Freddie Mac, various government bailouts and stimulus programs, continued instability in the housing market, and the bankruptcy of General Motors. Most of these events preceded the December 2008 announcement from the National Bureau of Economic Research (NBER) that the U.S. had officially been in a recession since December 2007. Also during that month, the Federal Reserve Board (Fed) lowered the Fed Funds Rate to nearly zero. By FYE 2009, unemployment had risen to 9.5% from 5.5% at the start of the fiscal year. GDP growth was negative through-out the fiscal year and CPI was negative compared to the prior year. The yield curve continued to steepen during the year, particularly on the short end of the curve. This steepening resulted primarily from the Fed’s monetary actions, lowering the federal funds rate to basically zero. Short-term rates started the year at 1.87% and ended the year at .18%. Long-term rates started the year at 4.55% and ended the year at 4.33%.
The broad debt markets, excluding high yield, had positive returns for FYE 2009. The Barclay’s Capital (BarCap) U.S. Ag-gregate Index was up 6.1%, the BarCap Global Index was up 2.8%, and the BarCap U.S. High Yield Index was down 2.4%. Investment grade and high yield spreads widened to historic levels during the fiscal year, particularly in November 2008,
-40%
-30%
-20%
-10%
0%
10%
Jun-08 Aug-08 Oct-08 Dec-08 Feb-09 Apr-09 Jun-09
3 Month LIBOR JP Morgan US Aggregate JP Morgan Global Aggregate
Merrill Lynch High Yield JP Morgan EMBI Diversified
The Fixed Income portfolio has a target allocation of 20% of the Portfolio, and is comprised of four distinct asset classes. These asset classes, all managed externally, in-clude Core Fixed Income, High Yield, Global Fixed Income, and Emerging Market Debt. Differences between the target allocation versus the actual allocation are due to strategic decisions made by the CIO and the Commission.
30.0%
10.0%
4.0%3.0% 3.0%
10.0%
47.9%
20.5%
6.5%3.5% 4.2%
13.1%
0%
10%
20%
30%
40%
50%
60%
Total Fixed Income
Core FI Global FI High Yield FI Emr'g Markets Debt
Cash
Policy Target Weight Actual Weight
Fixed Income ReviewAs of June 30, 2009, the total physical Fixed Income portfolio market value was $7,604.6 million, representing 36.2% of the Portfolio. The Fixed Income portfolio’s performance for the fiscal year was 4.0%.
Portfolio Structure
Market Overview
• During the Fiscal Year ending 2009 the Commission de-cided to outsource the internal Core Fixed Income port-folio. Three external managers were hired: Pacific Invest-ment Management Company (PIMCO), BlackRock, and Jamison, Eaton and Wood (Jamison).• Portions of the Global Fixed Income portfolio were re-deemed in October 2008 to meet funding requirements. In total, $550 million was harvested from the four Global Fixed Income managers.
Fixed Income Exposure1
as of June 30, 2009Portfolio Developments
1 Differences between asset class exposure and asset allocation are attributed to managers’ ability to invest in multiple asset classes.

2008 - 2009 Annual Investment Report
24
The market value of the Global Fixed Income portfolio as of June 30, 2009 was $2,773.4 million, or 13.2% of the Portfolio versus the policy target of 4%. The FYE 2009 performance for Global Fixed Income was 1.9% versus a return of 2.8% for the BarCap Global Aggregate Index. Much of the underperformance for the year was due to the managers’ exposure to corporate credit, particularly in the Fall of 2008. Some positive drivers for performance included country and currency allocation bets, as well as the tightening of investment grade and high yield spreads in the second half of the year.
The Global Fixed Income portfolio is structured to provide exposure to developed international and emerging market debt instruments, and to allow managers the discretion to tactically allocate between all fixed income markets. This feature of the portfolio provides a high degree of diversification especially from U.S. equities. The portfolio should pro-
Statistics 1 Year 3 Year 5 YearAnnualized Return 1.9% n/a n/aAnnualized Standard Deviation n/a n/a n/aSharpe Ratio n/a n/a n/a
R2* 69.8% n/a n/aAnnualized Alpha* -0.5% n/a n/aCorrelation* 95.4% n/a n/a* As compared to BarCap Global Aggregate Bond Index
Source: NEPC
The market value of the Core Fixed Income portfolio as of June 30, 2009 was $4,121.1 million, or 19.6% of the Port-folio versus the policy target of 10%. The FYE 2009 per-formance for Core Fixed Income was 4.3% versus a return of 6.1% for the BarCap U.S Aggregate Index. The portfo-lio’s exposure to corporate credit hurt the performance in the first half of the fiscal year; however performance rebounded nicely with the tightening of investment grade spreads in the second half of the fiscal year.
The Core Fixed Income asset class provided stable cash flows and liquidity to the Portfolio by investing in investment grade fixed income instruments including: U.S. Treasuries, agency securities, investment grade corporate bonds, and mortgage-backed securities. The Core Fixed Income portfolio also served as a funding source for new investment strate-gies within the Portfolio. During the year approximately $3.0 billion was liquidated and reallocated to fund other man-dates and capital calls.
As of June 30, 2009, the Portfolio had residual bonds remaining in the internal Core Fixed Income portfolio as well as contracts with three external investment managers to manage the Core Fixed Income allocation of the Portfolio. PIMCO was hired to manage a core plus portfolio, which allows the manager the latitude to invest in high quality fixed income investments, emerging market securities, and high yield bonds. BlackRock and Jamison were hired to manage core fixed income portfolios. The residual bonds remaining in the internal Core Fixed Income portfolio will be transferred to the external Core Fixed Income managers to conduct a managed liquidation of the bonds.
Statistics
Core Fixed Income StatisticsStatistics 1 Year 3 Year 5 YearAnnualized Return 4.3% 5.6% 4.8%Annualized Standard Deviation n/a 3.4% 3.0%Sharpe Ratio n/a 0.6 0.5
R2* 81.8% 79.6% 77.6%Annualized Alpha* -2.6% -1.2% -0.4%Correlation* 67.8% 55.1% 51.5%* As compared to BarCap U.S. Aggregate Bond Index
* Jamison had yet to be funded as of June 30, 2009.
when investment grade spreads widened 354 basis points and high yield spreads widened 1,222 basis points. By June, investment grade and high yield spreads had tightened considerably. Over the course of the fiscal year, investment grade spreads widened only 38 basis points and high yield spreads widened 271 basis points.
The fixed income market experienced historic volatility during the fiscal year, however by June 2009 some stability had entered the market. Inflation had not been a major concern of the Fed as prices have generally fallen. The Fed is an-ticipated to maintain exceptionally low short-term rates for some time. This will be reevaluated as the markets stabilize and the economy’s fundamentals become clearer.
Global Fixed Income
Source: NEPC

South Carolina Retirement System Investment Commission
25
vide returns slightly higher than a U.S.-only portfolio over a full market cycle in return for accepting increased country and currency risk.
High Yield Fixed IncomeThe market value of the High Yield Fixed Income portfolio as of June 30, 2009 was $561.5 million, or 2.7% of the Portfolio versus the Policy target of 3%. The FYE 2009 per-formance for the High Yield portfolio was -1.8% versus a return of -2.4% for the BarCap U.S. High Yield Bond Index. The overall positive performance for the year versus the benchmark was due to the defensive posture of the port-folio with a heavy overweight to investment grade corpo-rate debt and higher quality high yield bonds.
The High Yield Fixed Income portfolio invests primarily in securities with credit ratings below investment grade qual-ity. This particular asset class typically offers higher returns versus investment grade bonds. This portfolio attempts to maximize total return through tactical allocation within the high yield market, and is expected to outperform over a full market cycle with less volatility relative to the broad high yield market.
StatisticsStatistics 1 Year 3 Year 5 YearAnnualized Return -1.8% n/a n/aAnnualized Standard Deviation n/a n/a n/aSharpe Ratio n/a n/a n/a
R2* 96.7% n/a n/aAnnualized Alpha* 1.1% n/a n/aCorrelation* 87.8% n/a n/a* As compared to BarCap U.S. High Yield Bond Index
Manager Performanceas of June 30, 2009
Source: NEPC
Managers Market Value % of Fund 1 Year 3 Year 5 YearFIXED INCOME COMPOSITE $7,604,638,942 36.2% 4.0% 5.7% 4.9%CORE FIXED INCOME 4,121,126,696 19.6% 4.3% 5.6% 4.8%
Internal Core Fixed Income 2,074,592,696 9.9% 3.6% 5.3% 4.7%PIMCO 840,222,111 4.0% n/a n/a n/aPIMCO Transition 188,211,875 0.9% n/a n/a n/aBlackrock 1,018,100,014 4.8% n/a n/a n/a
BARCLAYS CAPITAL U.S. AGGREGATE 6.1% 6.4% 5.0%GLOBAL FIXED INCOME 2,773,357,927 13.2% 1.9% n/a n/a
Credit Agricole 730,731,084 3.5% 9.8% n/a n/aLoomis Sayles 597,528,259 2.8% -3.8% n/a n/aMondrian 822,221,050 3.9% 5.8% n/a n/aWestern Asset Management 622,877,534 3.0% -3.8% n/a n/a
BARCLAYS CAPITAL GLOBAL AGGREGATE 2.8% 6.7% 5.5%HIGH YIELD FIXED INCOME 561,504,319 2.7% -1.8% n/a n/a
Loomis Sayles NHIT 509,245,383 2.4% -1.4% n/a n/aPenn Capital 52,258,936 0.2% n/a n/a n/a
BARCLAYS CAPITAL U.S. HIGH YIELD -2.4% 2.1% 4.3%
Annualized Returns
Source: NEPC
Commentary by: Mike Addy & Nicole Waites

2008 - 2009 Annual Investment Report
26
Private Equity Review
Portfolio StructureAt the end of the fiscal year, the Private Equity portfolio had a target allocation of 7.0% of the Portfolio. The nature of Private Equity is such that investors make commitments to fund certain amounts, although the money is not drawn until private investments are contracted for purchase. This process can mean it is several years before the commitment is fully called down. Several years after the investments are made, they will be sold, resulting in a return of capital to in-vestors, which results in a decrease in the investor’s exposure to Private Equity. This process explains why the Commis-sion’s commitment of roughly 10.0% of the portfolio’s assets have only translated to 2.5% invested with Private Equity managers, which is well below the target allocation.
The Portfolio has exposures to Private Equity both through direct commitments and also through investments made within strategic partnerships. Nineteen direct funds represent approximately 60.0% of the commitments made to date, with the remaining 40.0% housed within the strategic partnerships. Given that co-investment opportunities tend to fund immediately and have been emphasized within the strategic partnerships, approximately 50.0% of the value of the Private Equity program is currently found within the strategic partnerships.
A variety of strategies are represented within the Private Equity portfolio. There are general fund of funds, which invest in a variety of other partnerships, as well as some fund of funds tasked with investing solely in venture capital. Commit-ments have been made to domestic, European, and global buyout funds targeting different size companies and sectors of the economy. Managers have been selected for mezzanine debt covering small, middle market, and large-scale deals. Finally, several commitments have been made to a strategy called secondaries, which buy private equity interests held by other limited partners.
Market OverviewPrivate equity is a long-term asset class where valuations are difficult to determine until an investment may be liqui-dated and the subsequent cash returned. Although new accounting rules governing valuation of illiquid assets became mandatory as of calendar year-end 2008, the clarity and uniformity in valuations that was expected by many did not necessarily develop. Mark-to-market, or fair value, rules were meant to result in some recognition that a public market
Portfolio DevelopmentsDuring the fiscal year, several new commitments were made to Private Equity. The Commission approved three direct fund commitments. The first fund, which received a $50 million commitment, is an operationally-focused buyout fund targeting the information/business services and healthcare sectors. A $40 million commitment was made to a fund that is focused on purchasing secondary interests in venture capital companies and funds. The third was a fund of funds that invests in early stage ven-ture capital funds. This last fund received a $50 million commitment from the Commission. The remaining new commitments, addressed later in this report, were invest-ments through RSIC’s Strategic Partnerships.
As of June 30, 2009, the Private Equity portfolio’s direct investments had a market value of $347.4 million, representing 1.7% of the Portfolio, and the fiscal year performance was -4.4%.
40.0%
7.0%
19.2%
2.5%
0%
10%
20%
30%
40%
50%
Total Alternatives Private Equity*
Policy Target Weight Actual Weight
* Private Equity Actual Weight represents market value of total capital called.
Private Equity Exposureas of June 30, 2009
South Carolina Retirement System Investment Commission
27
decline was likely to hurt the value of private investments should they need to exit in such an environment. The imple-mentation of the rules varied widely, resulting in some Private Equity portfolios being marked down by large amounts similar to the public markets, with others experiencing little change at all. Of those in the latter category, many manag-ers indicated that their underlying portfolio companies were doing well despite the recession, and thus did not deserve to fall as dramatically as their public peers. Auditors approved the resulting valuations, looking mainly for consistency, not insisting upon one method over another.
The fiscal year was characterized by a lack of liquidity in the financial markets, which had deep impacts on the already illiquid world of Private Equity. With limited access to debt, few Private Equity deals closed during the year, leading to much lower call downs of capital from the Private Equity portfolio than would be expected in a typical year. Venture capital, which depends much less on debt for deal flow, was not as affected by this phenomenon. Mezzanine capital, whose deals usually result from being invited to invest in the subordinated debt portion of Private Equity deals, was left with few quality deals to support. On the plus side for mezzanine, interest rates and debt covenants were much im-proved from the leveraged buyout boom of 2006-2007, but there were very few deals closed at these rates and terms.
Historically, severe market declines such those seen in late 2008 and early 2009 have created tremendous stress on the portfolios of institutional investors. These investors are forced to sell illiquid assets in order to raise cash and reduce ex-isting commitments to fund future investments. Typically, these types of distressed transactions occur at discounts that create value for the secondary private equity buyer. For a variety of reasons, the volume of these transactions failed to reach the levels that had been expected.
The Retirement System’s Private Equity portfolio, newly instigated in February 2007, is well positioned going forward, as only about 30% of the commitments made to date have been used to purchase investments. This means that much of the money will be called down after the lessons about leverage and liquidity have been absorbed and put into practice. The Commission anticipates smaller deals with less leverage and more focus on operating strategies to prevail in the coming years.
PerformancePrivate Equity performance information is limited in this report for the primary reason that on average this is a young portfolio and the investments are so new that the value drivers have only just begun to be implemented. The Retire-ment System’s Portfolio is still deeply in the J-Curve, that point in the Private Equity lifecycle where fees and expenses put the portfolio in negative territory, but few of the expected improvements in value creation have been booked. The market values shown on the following page include fees paid to the Private Equity firms as well as fair market valua-tions that the firms have been required to post, completely disconnected to what the exit value of these investments may ever be. The skillful Private Equity firm will add value by: arranging a favorable purchase price, making operational and management changes to improve the company, and engineering an exit that will provide the most favorable value to investors. Every asset is unique, and the value of that asset is not truly known until the exit is complete. In general, Staff feels very positive about the Portfolio being young, given that there is a large amount of undrawn capital at a time when prices have deflated and tremendous opportunities are being discovered.
Commentary by: Hilary Wiek
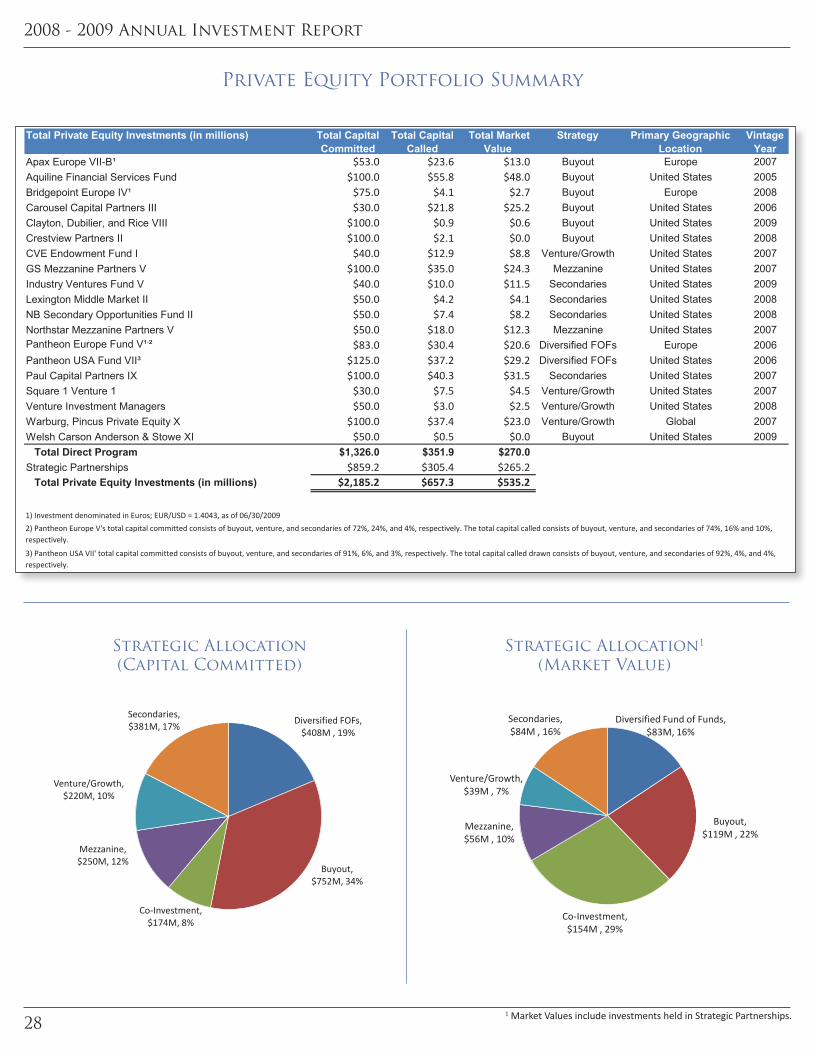
2008 - 2009 Annual Investment Report
28
Private Equity Portfolio Summary
Total Private Equity Investments (in millions) Total Capital Committed
Total Capital Called
Total Market Value
Strategy Primary Geographic Location
Vintage Year
Apax Europe VII-B¹ $53.0 $23.6 $13.0 Buyout Europe 2007Aquiline Financial Services Fund $100.0 $55.8 $48.0 Buyout United States 2005Bridgepoint Europe IV¹ $75.0 $4.1 $2.7 Buyout Europe 2008Carousel Capital Partners III $30.0 $21.8 $25.2 Buyout United States 2006Clayton, Dubilier, and Rice VIII $100.0 $0.9 $0.6 Buyout United States 2009Crestview Partners II $100.0 $2.1 $0.0 Buyout United States 2008CVE Endowment Fund I $40.0 $12.9 $8.8 Venture/Growth United States 2007GS Mezzanine Partners V $100.0 $35.0 $24.3 Mezzanine United States 2007Industry Ventures Fund V $40.0 $10.0 $11.5 Secondaries United States 2009Lexington Middle Market II $50.0 $4.2 $4.1 Secondaries United States 2008NB Secondary Opportunities Fund II $50.0 $7.4 $8.2 Secondaries United States 2008Northstar Mezzanine Partners V $50.0 $18.0 $12.3 Mezzanine United States 2007Pantheon Europe Fund V¹,² $83.0 $30.4 $20.6 Diversified FOFs Europe 2006Pantheon USA Fund VII³ $125.0 $37.2 $29.2 Diversified FOFs United States 2006Paul Capital Partners IX $100.0 $40.3 $31.5 Secondaries United States 2007Square 1 Venture 1 $30.0 $7.5 $4.5 Venture/Growth United States 2007Venture Investment Managers $50.0 $3.0 $2.5 Venture/Growth United States 2008Warburg, Pincus Private Equity X $100.0 $37.4 $23.0 Venture/Growth Global 2007Welsh Carson Anderson & Stowe XI $50.0 $0.5 $0.0 Buyout United States 2009
Total Direct Program $1,326.0 $351.9 $270.0Strategic Partnerships $859.2 $305.4 $265.2
Total Private Equity Investments (in millions) $2,185.2 $657.3 $535.2
1) Investment denominated in Euros; EUR/USD = 1.4043, as of 06/30/2009
2) Pantheon Europe V's total capital committed consists of buyout, venture, and secondaries of 72%, 24%, and 4%, respectively. The total capital called consists of buyout, venture, and secondaries of 74%, 16% and 10%, respectively.
3) Pantheon USA VII' total capital committed consists of buyout, venture, and secondaries of 91%, 6%, and 3%, respectively. The total capital called drawn consists of buyout, venture, and secondaries of 92%, 4%, and 4%, respectively.
Diversified FOFs, $408M , 19%
Buyout, $752M, 34%
Co-Investment, $174M, 8%
Mezzanine, $250M, 12%
Venture/Growth, $220M, 10%
Secondaries, $381M, 17%
Strategic Allocation (Capital Committed) FYE 2009
Strategic Allocation (Capital Committed)
Diversified Fund of Funds, $83M, 16%
Buyout, $119M , 22%
Co-Investment, $154M , 29%
Mezzanine, $56M , 10%
Venture/Growth, $39M , 7%
Secondaries, $84M , 16%
Strategic Allocation (Market Value) FYE 2009
Strategic Allocation1 (Market Value)
1 Market Values include investments held in Strategic Partnerships.
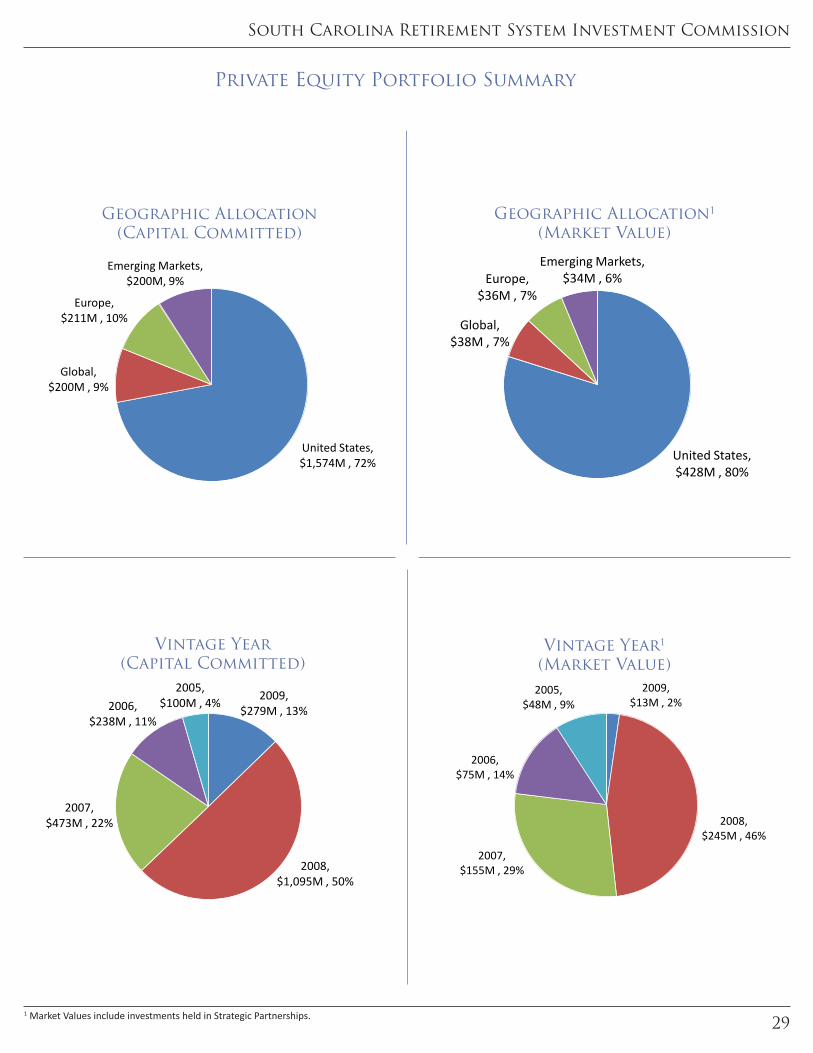
South Carolina Retirement System Investment Commission
29
Emerging Markets, $200M, 9%
Europe, $211M , 10%
Global, $200M , 9%
United States, $1,574M , 72%
Geographic Allocation (Capital Committed) FYE 2009
Geographic Allocation (Capital Committed)
United States, $428M , 80%
Global, $38M , 7%
Europe, $36M , 7%
Emerging Markets, $34M , 6%
Geographic Allocation (Market Value) FYE 2009
Geographic Allocation1 (Market Value)
2005, $100M , 4%2006,
$238M , 11%
2007, $473M , 22%
2008, $1,095M , 50%
2009, $279M , 13%
Vintage Year Allocation (Capital Committed)FYE 2009
Vintage Year (Capital Committed)
Vintage Year1 (Market Value)
2009, $13M , 2%
2008, $245M , 46%
2007, $155M , 29%
2006, $75M , 14%
2005, $48M , 9%
Vintage Year Allocation (Market Value) FYE 2009
Private Equity Portfolio Summary
1 Market Values include investments held in Strategic Partnerships.

2008 - 2009 Annual Investment Report
30
The Composite consists of two types of investment strategies: Absolute Return and Opportunistic. The distinction be-tween Opportunistic and Absolute Return is based on whether the strategy is generally market-neutral or directional. The Absolute Return strategy is intended to provide persistent positive returns, lower volatility, and minimal net market exposure. In theory, the performance of an Absolute Return investment is unrelated to the performance of any asset class in most market environments. The Opportunistic (the residual hedge funds) strategy consists of those hedge fund investments that are typically directional and do not neccessarily seek to be market-neutral. The Absolute Return and Opportunistic strategies are managed as a single portfolio. The Absolute Return strategy is substantially larger than the Opportunistic strategy. From an asset allocation perspective, the Absolute Return strategy is not considered to be a separate asset class, but rather a complement to the synthetic exposures in the Beta Overlay program. The Opportunistic strategy is treated as a distinct asset class, with a 5.0% target allocation.
The Composite invests in both direct hedge funds and hedge fund of funds. These allocations use three main strategies to generate returns: relative value, event driven, and directional. Each of the three main strategies can be further bro-ken out into sub-strategies:
• Relative Value - relative value credit, other arbitrage, equity L/S high hedge, mortgage arbitrage, fixed income arbitrage, convertible arbitrage, statistical arbitrage, vola-tility arbitrage, and closed end fund;• Event Driven - event-driven credit, distressed, restruc-turings and value, private placements, and merger/risk arbitrage; and• Directional - macro, equity long/short opportunistic, CTA/managed futures, other directional, and Emerging Markets
Geographically, the Composite is diversified across many regions. The Composite has regional allocations to North America, developed Europe, Emerging Markets, and de-veloped Asia.
40.0%
5.0%
19.2%
4.6%
0%
10%
20%
30%
40%
50%
Total Alternatives Hedge FundsPolicy Target Weight Actual Weight
Hedge Fund Exposureas of June 30, 2009
Hedge Funds ReviewAs of June 30, 2009, the Portfolio’s Hedge Fund Composite (“Composite”) comprised 19.8% of the total Portfolio, with a market value of $4,158.6 million. The Composite’s performance for the fiscal year ending June 2009 was -12.8%, com-pared to -18.1% for the HFRX Global Hedge Fund Index.
Portfolio Developments• In October 2008, the RSIC submitted a redemption request to Gottex (a fund of hedge funds manager). In late Novem-ber 2008, the RSIC received notice that the Gottex Market Neutral Plus fund was suspending all redemptions. Gottex restructured the fund into two share classes—liquidating and continuing. The RSIC elected the continuing class, subject to Gottex honoring the October 2008 redemption request.• During the first quarter of 2009, RSIC reduced the target exposure for Absolute Return investments to 15% from 20% as a result of the reduction in synthetic exposures in the Beta Overlay program.• W.L. Ross was added to the Composite in fiscal year ended 2009. No managers were terminated in FYE 2009.
Portfolio Structure

South Carolina Retirement System Investment Commission
31
Managers Market Value % of Fund 1 Year 3 Year 5 YearTotal Hedge Fund Composite $4,158,599,296 19.8% -12.8% n/a n/a
HFRX Global Hedge Fund Index -18.1% -3.6% -0.5%Bridgewater 298,464,575 1.4% -9.1% n/a n/aD.E. Shaw 343,919,358 1.6% -8.4% n/a n/aFrontpoint 359,803,500 1.7% -4.4% n/a n/aW.L.Ross 210,281,175 1.0% n/a n/a n/aMariner - Hedge Funds 296,397,918 1.4% -11.7% n/a n/aMorgan Stanley Completion 612,008,234 2.9% -19.8% n/a n/aEntrust 256,136,271 1.2% -15.5% n/a n/aGAM 570,318,545 2.7% -11.1% n/a n/aGottex 665,625,000 3.2% -12.8% n/a n/aGrosvenor 545,644,720 2.6% -15.2% n/a n/a
Annualized Returns
The Composite’s policy benchmark (the HFRX Global Hedge Fund Index) had a negative performance of -18.1%, while the Composite returned a negative performance of -12.8%. The major detractors of the Composite’s perfor-mance were credit, convertibles and mortgage related strategies in the latter half of 2008. In the first half of 2009, a rebound and a higher allocation to credit related strategies was the major contributor to performance.
As a result of financial market deleveraging, hedge fund managers suffered from significant market risk (beta) in the latter half of 2008. In search of liquidity, many manag-ers were forced to liquidate their highest quality securi-ties, as these were the most liquid. Since beta risk could not be effectively eliminated, managers of absolute return strategies were unable to generate positive returns due to excessive market headwinds. During the first quarter of 2009, market volatility began to subside, creating a favorable environment for manag-ers to achieve strong returns. In early March, the rally in equities markets began to improve overall investor confi-dence, easing fears of an unprecedented collapse. Bullish directional strategies benefitted the most from the sharp recovery in financial markets, a rally that continued through the end of the second quarter of 2009 and provided manag-ers with an environment of lower volatility and diminishing liquidity constraints. The index for direct hedge funds (the HFRX Absolute Return Index) outperformed the hedge fund of funds index (HFRI Fund of Funds Composite) for FYE 2009 with each index returning approximately -14.3% and -15.2%, respectively. The credit oriented hedge funds index (Barclays Capital U.S. High Yield) outperformed both the HFRX Absolute Return Index and the HFRI Fund of Funds Composite for fiscal year ended 2009 with a return of approximately -2.4%.
Performance
Market Overview
-40%
-35%
-30%
-25%
-20%
-15%
-10%
-5%
0%
5%
Jun-08 Jul-08 Aug-08 Sep-08 Oct-08 Nov-08 Dec-08 Jan-09 Feb-09 Mar-09 Apr-09 May-09 Jun-09
HFRX Global Index 50% MSCI World / 50% Citi WGBI 50% GS Commodity / 50% BarCap World Gov't Inflation
Alternative Index Cumulative Return
Statistics 1 Year 3 Year 5 YearAnnualized Return -12.8% n/a n/aAnnualized Standard Deviation n/a n/a n/aSharpe Ratio n/a n/a n/a
R2* 87.7% n/a n/aAnnualized Alpha* 5.3% n/a n/aCorrelation* 63.0% n/a n/a* As compared to HFRX Global Hedge Fund Index
Statistics
Source: NEPC
Manager Performance as of June 30, 2009
Source: NEPC
Commentary by: J.P. Boyd & Hershel Harper

2008 - 2009 Annual Investment Report
32
40.0%
10.0%
19.2%
6.3%
0%
10%
20%
30%
40%
50%
Total Alternatives GAA
Policy Target Weight Actual Weight
The GAA portfolio has a target policy allocation of 10% with an approved range of 0% – 20%. The portfolio’s policy benchmark is an equal blend of the MSCI World Net Index and Citi World Government Bond Index (WGBI). The GAA portfolio is comprised of two strategies including GTAA and Risk Parity. GTAA strategies attempt to add value over full market cycles by exploiting asset allocation opportunities through tactical exposure across multiple asset classes and geographic regions. The GTAA strategy benchmark is the same as the GAA policy benchmark. Risk Parity strategies attempt to generate consistent re-turns over time by balancing the risks from each asset class. In doing so, the performance of a Risk Parity port-folio is less dependent upon any specific economic envi-ronment. RSIC’s Risk Parity investments are measured against the strategy benchmark which is 90 Day T-Bills + 5%.
Global Asset Allocation Review
Market Overview
Portfolio Developments• The GAA portfolio’s policy benchmark had negative per-formance of -13.0% while the portfolio returned -20.5%. The major cause of the portfolio’s disappoitning returns is the tactical decision made by some managers to maintain a defensive portfolio allocation. When the markets rallied sharply in March, these portfolios lagged. Furthermore, fixed income strategies within the manager’s portfolios suffered due to the poor performance of credit versus sovereign debt.• Mellon Capital Management (MCM) was terminated at the end of April 2009 as one of RSIC’s Global Tactical Asset Allocation (GTAA) managers. The capital received from MCM was reallocated to an internal cash account and to Bridgewater’s All-Weather portfolio due to the expecta-tion of better risk-adjusted returns from Bridgewater.
For the Fiscal Year ending 2009, the Global Asset Allocation (GAA) portfolio was underweight its target allocation by 3.7% with a market value of $1,323.7 million. The portfolio’s net performance for the fiscal year was -20.5%.
Portfolio Structure
GAA Exposureas of June 30, 2009
The tumultuous markets posed numerous challenges to GTAA and Risk Parity strategies during the fiscal year. Managers were punished for taking any equity and cred-it risk during the first eight months of the year and for avoiding these risks during the balance of the year. This required GTAA managers to make two timely, draconian shifts in their asset allocation in order to avoid losses.
-70%
-60%
-50%
-40%
-30%
-20%
-10%
0%
10%
20%
Jun-08 Jul-08 Aug-08 Sep-08 Oct-08 Nov-08 Dec-08 Jan-09 Feb-09 Mar-09 Apr-09 May-09 Jun-
Russell 3000 Total Return MSCI EAFE Net Total Return MSCI EME Net Total Return
JP Morgan US Aggregate JP Morgan Global Aggregate JP Morgan EMBI Diversified
Equity & Fixed Income Index Cumulative Return

South Carolina Retirement System Investment Commission
33
Statistics 1 Year 3 Year 5 YearAnnualized Return -20.5% n/a n/aAnnualized Standard Deviation n/a n/a n/aSharpe Ratio n/a n/a n/a
R2* 81.4% n/a n/aAnnualized Alpha* -6.0% n/a n/aCorrelation* 96.3% n/a n/a* As compared to 50% MSCI World/50% Citi WGBI
The Portfolio’s GTAA and Risk Parity strategies generated negative returns during the year as nearly all global as-set classes declined. The group’s performance as a whole was -20.5% for the year, which was lower than the pol-icy index. The degree to which managers’ returns were negative was highly correlated to the amount of equity exposure in their portfolios as these investments declined sharply in late 2008. During the year, the Commission voted to terminate the Mellon Capital portfolio both as a means by which to reduce equity risk to the Portfolio and for performance reasons.
Managers Market Value % of Fund 1 Year 3 Year 5 YearTotal GAA Composite $1,323,693,403 6.3% -20.5% n/a n/aBridgewater 594,549,967 2.8% -21.7% n/a n/aPutnam Investments 399,293,113 1.9% -16.9% n/a n/a
90D T-Bills + 5% 6.0% 8.3% 8.3%GMO 329,850,323 1.6% -7.1% n/a n/a
50% MSCI WORLD/50% CITI WGBI -13.0% 1.0% 4.2%
Annualized Returns
Further challenges arose when the returns of many asset classes suddenly became highly correlated, which temporarily negated the benefits of diversification.
In late 2008, global equity markets began a precipitous decline that continued until early March. One notable exception was the emerging markets equity index, which had moved down so sharply during 2008 that it bottomed in December. At the nadir, most major broad equity market indices had lost at least 50.0% of their value.
During this time, the prices of bonds moved along one of two paths. Bonds that were perceived as safe investments saw their prices rise (driving the yields down), while the prices of those bonds with credit risks moved substantially lower. The currency markets reacted in similar fashion as investors bought the U.S. dollar because it was perceived to be a safe alternative to many other currencies.
In early 2009, many of these trends began to reverse, with emerging market equities and high yield debt securities leading the recovery. In early March, domestic and developed international markets began a furious rally that lasted through the end of the fiscal year. Bond yields declined as investors recognized the opportunity to earn attractive re-turns on undervalued assets.
Performance Statistics
Manager Performanceas of June 30, 2009
Source: NEPC
Source: NEPC
Commentary by: Geoff Berg

2008 - 2009 Annual Investment Report
34
40.0%
8.0%
19.2%
5.1%
0%
10%
20%
30%
40%
50%
Total Alternatives Opportunistic Credit
Policy Target Weight Actual Weight
Opportunistic Credit ReviewAs of June 30, 2009, the total Opportunistic Credit portfolio market value was $639.2 million, representing 3.0% of the Portfolio versus the policy target of 8%.
Portfolio StructureThe Opportunistic Credit portfolio seeks to capitalize on dislocations in the credit markets. This asset class allows the RSIC to broadly diversify among the credit markets, invest in undervalued asset classes, and rebalance out of over-valued asset classes. In particular, this allocation allows the RSIC the flexibility to take advantage of timely opportunities. Investments in this portfolio include distressed debt, distressed residential mortgage securities, commercial mortgage-backed securities (CMBS), bank loans, debtor in position securi-ties (DIPS), and non-performing loans (NPLs). The portfolio is comprised of direct investments with Opportunistic Credit managers and investments within the Strategic Partnerships. Differences in the target allocation versus the actual al-location are due to the call down structure of these investments and the opportunities the managers are seeing in the market.
Market OverviewOver the past year, the RSIC has aggressively increased the allocation to credit in opportunistic and non-traditional ways. This allocation allows the RSIC to pursue a more tactical approach to the credit markets by taking advantage of the inefficiencies in the market. With this allocation, the RSIC further diversifies the portfolio, reducing exposure to, and thereby risk from, a single asset class.
Early in the fiscal year, widespread deleveraging occurred across the entire financial system. This caused high yield and bank loan spreads to widen to historic levels. By the end of the fiscal year, the default rate was approximately 11%, a significant increase from the previous year. The events that caused the panic in the financial markets – bank failures, government bailouts, and continued instability in the residential and commercial mortgage markets – later gave rise to some of the most attractive Opportunistic Credit opportunities in years. Companies with weakened balance sheets and very limited access to capital became distressed, forcing many to default and file for bankruptcy. The ability of Oppor-tunistic Credit managers to perform detailed company level analysis aids the firms in assessing the likelihood and the timing of recovery. Mortgage-focused managers had numerous opportunities due to fears of the recession, continuing high unemployment, and falling home prices. Overall, the extreme volatility experienced by the broad credit markets has lead to steeply discounted securities, which offer strong risk-adjusted return opportunities.
Portfolio Developments• RSIC decided to aggressively increase its allocation to Opportunistic Credit during the fiscal year due to the dis-locations in the market and as a means to earn equity-like returns without taking equity risk. All but one of the dedicated opportunistic managers had an initial funding during the fiscal year.• Spreads within the credit markets widened to historic levels in the fall of 2008. For example, one bond that yield ed 9.6% on June 30, 2008 was yielding over 17% in No-vember. By June 30, 2009, the yield was back down to 11.2%.
Opportunistic Credit Exposureas of June 30, 2009

South Carolina Retirement System Investment Commission
35
StatisticsStatistics 1 Year 3 Year 5 YearAnnualized Return 1.2% n/a n/aAnnualized Standard Deviation n/a n/a n/aSharpe Ratio n/a n/a n/a
R2* 47.7% n/a n/aAnnualized Alpha* 10.4% n/a n/aCorrelation* 44.7% n/a n/a* As compared to Blended Opportunistic Credit Benchmark1
PerformanceThe FYE 2009 performance for the Opportunistic Credit portfolio was 1.2% versus a return of -9.2% for the Blend-ed Opportunistic Credit Benchmark. The positive perfor-mance was due to the managers taking advantage of the volatility and dislocations in the credit markets and their ability to move tactically within those markets. Under-performance of individual managers was often due to the downward pressures on pricing in the Fall and the mark-to-market write-downs the managers made because of those pricing pressures.
Managers Market Value % of Fund 1 Year 3 Year 5 YearTotal Opportunistic Credit Composite $639,194,037 3.0% 1.2% n/a n/a
BLENDED OPPORTUNISTIC CREDIT BENCHMARK 1 -9.2% -0.3% 2.9%Angelo Gordon 34,812,324 0.2% -11.8% n/a n/aD.E. Shaw Opp Credit 33,848,368 0.2% -4.5% n/a n/aSankaty Advisors 133,408,256 0.6% 10.0% n/a n/aSelene Partners 40,114,289 0.2% 5.3% n/a n/aAvenue Capital 108,090,916 0.5% n/a n/a n/aING Clarion 20,000,000 0.1% n/a n/a n/aMariner - Opp Credit 268,919,884 1.3% n/a n/a n/a
Annualized Returns
Manager Performanceas of June 30, 2009
Source: NEPC
Source: NEPC
1 Blended Opportunistic Credit Benchmark comprised of 1/3 BarCap High Yield, 1/3 S&P/LSTA Leveraged Loan Index, and 1/3 BarCap MBS Index.
Commentary by: Mike Addy & Nicole Waites

2008 - 2009 Annual Investment Report
36
Strategic Partnerships Review*
OverviewStrategic Partnerships (“Partnerships”) are designed to take advantage of opportunistic strategies that represent the best ideas of the general partner/investment manager (“Manager”) and the RSIC. Based on the manager’s specific ex-pertise in each of the Partnership, the Partnerships seek to obtain superior long term risk-adjusted returns by making opportunistic allocations to liquid and illiquid investments such as: (i) opportunistic credit, (ii) hedge funds, (iii) private equity funds, (iv) real estate funds, (v) real asset funds, and (vi) direct co-investments in public and private securities.
Each Partnership has its own Investment Committee (“Committee”) that governs the investment and decision-making processes. Each Committee is made up of senior investment professionals from the Manager and a representative ap-pointed by the RSIC, who is Robert Borden, CFA, CAIA, the CEO/CIO of the RSIC. The Managers are required to invest a meaningful amount of capital into the Partnership in order to align interests with the Retirement System/RSIC.
Morgan Stanley SCRSIC Strategic Partnership Fund LP (“MSSCLP”)The MSSCLP began in February 2008 and was funded with $1 billion. MSSCLP’s focus is on a variety of alternative strate-gies due to the bandwidth of Morgan Stanley’s expertise and global presence in institutional asset management. The Committee invested the majority of assets into hedge funds/fund of funds, which are used as a source of liquidity to fund private investments. Other investments include private equity and real estate funds as well as five co-investments currently. As of June 30, 2009 the MSSCLP’s asset allocation was as follows: 61% to absolute return strategies, 17% to private investments, and 22% to cash. The MSSCLP is holding a large allocation to cash due to the uncertainty in the capital markets and to be positioned to take advantage of attractive opportunities with asymmetric risk/return profiles
*The comments above are solely those of the RSIC
Strategy Allocationas of June 30, 2009
Morgan Stanley, $801M , 29%
Goldman Sachs, $998M , 35%
TCW, $372M , 13%
Apollo, $76M , 3%
Mariner, $570M , 20%
Strategic Partnership Allocationas of June 30, 2009
Strategic Partnership Summaryas of June 30, 2009
PartnershipCommitted to Fund ($mm)
Initial Funding Value ($mm)
Contributions($mm)
Withdrawals($mm)
Invested Capital($mm)
UnfundedCommitment ($mm)
6/30/09Market Value ($mm)
Morgan Stanley $1,000 $1,000 $0 $0 $1,000 $0 $801
Goldman Sachs $1,500 $1,500 $0 ($500) $1,000 $500 $998
TCW $750 $200 $390 $0 $590 $160 $372
Apollo $200 $0 $79 $0 $79 $121 $76
Mariner $750 $350 $336 $0 $686 $64 $570Total $4,200 $3,050 $805 ($500) $3,355 $845 $2,817
Real Estate, $133M, 5% Private Equity,
$222M, 8%
Opportunistic Credit, $95M, 3%
Hedge Funds, $841M, 30%
Distressed Debt, $223M,8%
Energy, $37M, 1%
RMBS, $286M, 10%
Corporate Credit, $55M, 2%
Cash, Other, $929M, 33%

South Carolina Retirement System Investment Commission
37
TCW/Palmetto State Partners, LLC (“TCW Partnership”) The TCW Partnership agreement was finalized in September 2008 with a commitment not to exceed $750 million. RSIC transferred the Retirement System’s prior interests in TCW related investments into the TCW Partnership and will fund the remaining commitments in cash or in-kind transfers. Given the nature of TCW and the Committee’s expertise, the TCW Partnership’s allocation is focused towards a variety of credit related strategies. The Committee approved and began funding the TCW Credit Opportunities Fund for a $100 million allocation. The Committee continues to focus on finding investment ideas in bank loan, high yield, distressed, and opportunistic credit areas. The Committee is discussing a separate account structure for a high yield and special situation bank loan allocation of $50 million each. In addition, the Committee is in deep discussions regarding a possible allocation to the U.S Department of the Treasury’s Public-Private Investment Program (“PPIP”). As of June 30, 2009, the asset allocation was as follows: 5% in mezzanine debt, 10% in energy, 15% in corporate credit, 64% in mortgages, and 6% in cash.
Mariner/Palmetto State Partners, L.P. (“Mariner SP”)The Mariner SP agreement was finalized in October 2008 for a commitment up to $750 million. Mariner Investment Group’s unique investment platform provides RSIC with access to a variety of credit related strategies. The Mariner SP’s funding will be derived from $400 million of additional assets and by transferring the Retirement System’s interest in Mariner Partners, L.P., into the Mariner SP. Given the bandwidth of Mariner Investment Group’s investment platform, this strategic partnership is focused on distressed debt, corporate credit, and mortgages. In December 2008, a transi-tion trading account was established in order for Mariner Partners, L.P., to liquidate corporate bonds at an opportune time based on market conditions. During the third quarter of FY09, funding began for two different strategies approved in the previous quarter: the Galton Higher Return Vehicle, which is a residential mortgage-backed securities (“RMBS”) strategy, and the Caspian Select Fund, which is a distressed debt strategy. As of June 30th, 2009 the asset allocation was as follows: 53% to absolute return strategies, 39% to distressed debt, and 8% to RMBS.
Goldman Sachs Palmetto State Fund A, L.P.Goldman Sachs Palmetto State Fund B, L.P. (“Goldman Sachs SP”)The Goldman Sachs SP was funded in late August 2008 with $1.5 billion. At that time the Goldman Sachs SP invested in two direct co-investments: a private equity buyout and a non-US multi-family real estate transaction. The Commit-tee decided to hold the remainder of the assets in cash rather than investing in a diversified pool of hedge funds. This decision proved wise as the HFRX Global Hedge Fund Index declined 13% during the second quarter of FY09, and the hedge fund industry continued to experience significant deleveraging and redemptions. The Committee’s decision to maintain a large cash position was upheld during the third and fourth quarters of FY09. During the third quarter of FY09, the Committee approved an investment in the GS Palmetto State Credit Fund L.P. for $280 million, in which the Retire-ment System is the only Limited Partner. The Partnership has continued to fund its investments in the GS Loan Partners, GS Vintage Fund V, and GS Real Estate Mezzanine Partners. RSIC and Goldman Sachs have begun discussions concern-ing risk management at the total plan level, restructuring of Retirement System’s hedge fund portfolio, and real asset investments. In the current market environment, the Committee believes that the portfolio is well positioned to access senior credit, secondary private equity, distressed credit, and private real asset opportunities. As of June 30, 2009 the asset allocation was as follows: 8% to real assets, 8% to private equity, 7% to opportunistic credit, 7% to absolute return strategies and 70% to cash.
and limited downside risk. In addition, the MSSCLP is seeking investments with idiosyncratic risk through co-investment opportunities that offer favorable economics.
Apollo Palmetto Strategic Partnership, L.P. (“Apollo SP”) The Apollo SP closed in December 2008, although funding did not begin until the third quarter of FY09. The RSIC initially committed up to $750 million to the Apollo SP, but due to market conditions during the first and second quarters of

2008 - 2009 Annual Investment Report
38
FY09, the RSIC temporarily reduced the commitment to $200 million. At the August 2009 Commission meeting, how-ever, the RSIC ratified the initial commitment, which increased the total commitment to the Apollo SP to an amount not to exceed $750 million. Currently, the Apollo SP has committed $75 million to Apollo’s private equity Fund VII and $150 million to Apollo’s European Principle Finance Fund, which takes advantage of discounted non-performing loans. The Apollo SP has aggressively been reviewing co-investment opportunities in both the private equity and non-performing loan space. In addition, the Apollo SP has begun discussing how to construct mechanisms to take advantage of real estate and real asset opportunities as they become more attractive. As of June 30th, 2009 the asset allocation was as follows: 45% to private equity, 30% to opportunistic credit, and 25% to cash.
Commentary by: Dunkin Allison

South Carolina Retirement System Investment Commission
39
The RSIC made the decision to delay investment in real assets when it began diversifying the plans assets due to high valuations in real assets and commodities. Real As-sets encompass an array of investment strategies whose values are sensitive to inflation, including TIPS, commodi-ties, commodity oriented hedge funds, real estate, en-ergy, and infrastructure. Real assets provide significant diversification due the relatively low correlation of most real asset strategies to traditional economic growth sen-sitive assets, and low correlation among real asset sectors (please see the charts below). Furthermore, real assets can provide protection against high inflation and can ben-efit from rising input prices and therefore offer purchas-ing power protection to investors with inflation-sensitive liabilities. Global fiscal and monetary policy makers are implementing robust simulative policies to protect against potential deflation and foster economic growth, which could potentially lead to high inflation if the two scenarios are not managed effectively.
40.0%
5.0% 5.0%
19.2%
0.6% 0.0%0%
10%
20%
30%
40%
50%
Total Alternatives Real Estate Liquid Real Assets
Policy Target Weight Actual Weight
Real Asset Review
The dislocation and deleveraging in the markets that has occurred over the past year have resulted in discounted valu-ations to a variety of real asset strategies. As central banks around the world increase the money supply to create liquidity and confidence in their markets, there is the potential of a meaningful devaluation of paper currency relative to real assets. In addition, with lower commodity prices comes a decrease in capital spending by commodity producers and low inventories, which can cause supply destruction. On the other hand, longer term demand for commodities is likely to rise as credit and liquidity return to the capital markets followed by earnings growth and capital expenditures. Higher future global demand for commodities will likely meet with low inventories, potentially leading to a spike in the price of real assets.
The RSIC is exploring a variety of strategies to access liquid and illiquid real assets through our current strategic partner-ships and new managers to create diversified real assets portfolio. These strategies can be implemented through a vari-ety of different structures including commingled funds and co-investments. For example, in liquid real assets, RSIC has explored commodity focused long/short absolute return strategies focused on curve, relative value, and volatility trades that are designed to generate returns regardless of the direction of the commodities markets, and will be positioned to benefit during a rising inflationary environment while maintaining adequate liquidity. Due to the volatility inherent in the commodity markets, capturing commodity exposure through a long/short strategy offers a prudent approach to capturing momentum while protecting downside risk. The RSIC is exploring opportunities in illiquid real assets (e.g. energy transportation and storage) whose characteristics provide attractive returns on a risk-adjusted basis, and are less dependent upon any particular scenario for commodity price movements or inflation. Many of these opportunities possess inexpensive and long-dated right-tail optionality that is linked to increases in commodity prices and inflation.
Market Overview
Investment Opportunities
Real Asset Overview
For the Fiscal Year ending 2009, the Real Asset portfolio was underweight its target by 9.4% (under the Real Estate target allocation by 4.4%, and the Liquid Real Assets target allocation by 5.0%). During FYE 2009, the RSIC achieved exposure to Real Estate through fund investments and co-investments with the MSSCLP and the Goldman Sachs SP.
Real Asset Exposure1
as of June 30, 2009
Commentary by: Dunkin Allison

2008 - 2009 Annual Investment Report
40
This chart is a correlation matrix illustrating the strength and direction of the relationship among several major asset classes. The correlations are derived from quarterly historical returns (1991 to 2009).
Importance: The relatively low correlation between real assets and the other asset classes illustrates the diversification benefits to Real Assets in a portfolio.
Correlation Matrix Equi
ties
D
omes
tic
Equi
ties
Intl
D
evel
oped
Equi
ties
Intl
Em
ergi
ng
Gov
t Bon
ds
IL B
onds
Corp
/Mrg
Sp
read
Com
mod
itie
s
Priv
ate
Equi
ty
Hig
h Yi
eld/
D
ist D
ebt
Tim
ber
Real
Est
ate
REIT
s
Abs
olut
e Re
turn
Equities Domestic 1.00 Equities Intl Developed 0.81 1.00 Equities Intl Emerging 0.69 0.68 1.00 Govt Bonds (0.23) (0.27) (0.36) 1.00 IL Bonds (0.01) (0.01) (0.07) 0.51 1.00 Corp/Mrg Spread 0.65 0.60 0.62 (0.61) (0.15) 1.00 Commodities 0.14 0.24 0.17 (0.29) 0.16 0.31 1.00 Private Equity 0.74 0.69 0.56 (0.24) 0.01 0.57 0.23 1.00 High Yield/Dist Debt 0.66 0.59 0.69 (0.53) (0.12) 0.92 0.29 0.54 1.00 Timber 0.06 0.08 0.02 0.09 0.15 0.03 (0.10) 0.30 0.02 1.00 Real Estate 0.31 0.38 0.16 (0.20) 0.22 0.28 0.34 0.35 0.25 (0.19) 1.00 REITs 0.57 0.50 0.38 (0.05) 0.16 0.42 0.30 0.36 0.47 (0.03) 0.48 1.00 Absolute Return 0.83 0.72 0.80 (0.21) 0.04 0.61 0.24 0.73 0.67 0.13 0.11 0.46 1.00
The categories above and the historic correlations relate to the proxy assets and their actual returns generally over the period of 1991 to 2009. The correlations calculations are based on the historical returns. The actual correlations in the future of each of the asset classes may differ substantially from the historic correlations of these assets. The use of historic correlations is to demonstrate the relative market movements of distinct asset classes.
Correlation MatrixStandard Deviation Energy
Industrial Metals
Precious Metals Agriculture Livestock
Energy 30.90% 1.00Industrial Metals 20.50% 0.19 1.00Precious Metals 17.90% 0.21 0.35 1.00Agriculture 17.00% 0.21 0.25 0.25 1.00Livestock 14.00% 0.09 0.11 0.06 0.11 1.001/1/1991 to 3/31/2009; Source: S&P/GSCI; DJ/UBS
Real Asset Correlation Matrix1
Real Asset Sector Correlation Matrix1
1 Source: NEPC
Much like the previous chart, this chart shows the strength and direction of the relationship of sectors within Real As-sets. This chart also shows the standard deviation of the returns of each sector, which is used as a proxy for volatility/risk.
Importance: The chart illustrates the relatively low correlation among the sectors included in real assets. This further illustrates the diversifying benefits of real assets. The standard deviation illustrates the volatility of each sector as com-pared to the others.

South Carolina Retirement System Investment Commission
41
Asset ClassAverage Lendable
Securities (MV)Average Utilization
(MV)Average
UtilizationAverage Spread
U.S. Agency Debt $70,787,676 $41,406,293 58.5% 103bpsU.S. Corporate Bonds 2,469,311,019 542,160,367 22.0 42U.S. Equities 2,426,302,520 820,100,604 33.8 67U.S. Mortgage Backed Securities 1,340,485,981 1,221,076,217 91.1 46U.S. Treasuries 74,798,090 70,822,085 94.7 119
Securities LendingSummaryThrough the Retirement System’s Custodian, the RSIC participates in a securities lending program whereby securities (domestic equities and fixed income only) are loaned for the purpose of generating additional income. The Custodian is responsible for making loans of securities to various broker-dealers and collecting cash collateral. The cash collateral is invested in short duration securities and monitored on an ongoing basis. The cash collateral offered must initially be at least 102 percent of the market value of the securities loaned, which provides a buffer against a decline in the market value of the collateral. If the collateral value falls below 100 percent, the borrower must post additional collateral. BNY Mellon is the custodial agent managing the securities lending program. The equity and fixed income collateral pools were combined in December 2008 in order to add liquidity to both pools, as well as to provide greater lending flexibility between the two asset classes.
In conjunction with generating revenue, the collateral pool seeks to maintain a net asset value (NAV) of $1.00. Unfortu-nately with the bankruptcy of Lehman Brothers and the sell-off in asset backed securities, the NAV as of June 30, 2009 was $0.89. At the end of June the market value of the collateral pool was approximately $1.85 billion, with an amortized cost of approximately $2.07 billion, which represents an unrealized loss of $222 million. BNY Mellon plans to indemnify the Retirement System for a portion of the losses due to the Lehman Brother’s bankruptcy. The RSIC is also taking steps to minimize the risks in the securities lending program. Specifically, the re-investment of the cash collateral is restricted to short-term, low risk securities. Also the RSIC, in conjunction with the State Treasurer’s Office, is in the process of revising the investment guidelines of the program.
For FYE 2009, the gross securities lending revenue was $24,032,000, down from $31,214,000 in the prior year. This decline is due primarily to sharply lower availability of lendable securities, and to a lesser extent lower interest rates.
The table below contains the statistics for the securities lending program for FYE 2009.
Source: BNY/Mellon
Commentary by: Hershel Harper & Nicole Waites

2008 - 2009 Annual Investment Report
42
ExpensesAfter rising sharply during FY 2008, gross investment management expenses for FY 2009 increased an additional $32.6 million, or 25.9%, to $158.4 million. These sharp increases were expected as the portfolio diversified into alternative asset classes, such as absolute return and private equity strategies, which traditionally charge higher investment man-agement fees. Investment service, or bank fees, declined by 42% due to a one-time favorable earnings adjustment as-sociated with the Fund’s securities lending program. Overall, total investment management expenses increased from .47% to .75% as a percentage of total assets.
Securities lending income and expenses declined sharply in FY 2009 due primarily to sharply lower availability of lend-able securities, and to a lesser extent lower interest rates. Lendable fixed income securities declined as large portions of the internally managed Core Fixed Income portfolio were liquidated to fund the acquisition of externally managed funds of various asset classes. Lendable equity securities declined as investments in index funds were replaced with equivalent futures’ exposures.
Looking forward, total investment expenses are expected to increase for several reasons: Fees based upon the assets under management, and performance based fees, should increase as asset values recover from their sharp declines. Fees should increase as internally managed fixed income funds are replaced with external managers. They will also rise as the Portfolio is further diversified into asset classes, such as international equities, private equity and real estate, which traditionally maintain higher expense ratios. Finally, investment management fees should increase as low-cost synthetic exposures are replaced with actively managed accounts. In each of these cases, superior returns are expected to more than pay for the higher fees to be incurred.
Overview
South Carolina Investment CommissionSchedule of Investment Expenses
Fiscal Year Ended June 30, 2009(Amounts expressed in 000's)
I:\Investment_Commission\Research\Annual Report\2009\Doug Lybrand\Schedule of Investment Expenses FY2009 FY08-09 OldPage 1 of 111/11/2009 10:17 AM
Investment & Administrative Expenses 2007 2008 2009Total Plan Assets $28,048,780 $26,633,045 $21,004,996
Investment Management ExpensesInvestment Managers' Fees 34,565 117,289 151,690 Investment Service Fees 1,582 4,949 2,891
Administrative ExpensesA 2,407 3,570 3,850 Gross Expenses 38,554 125,808 158,431
Total Expenses as a Percentage of Total Assets 0.14% 0.47% 0.75%A Includes Investment Consultant Fees
Securities Lending ActivitiesSecurities Lending Income $293,125 $209,364 $58,465Securities Lending Expenses 281,435 178,150 34,433
Net Securities Lending Income 11,690 31,214 24,032
Brokerage Fees $7,942 $7,271 $6,620Brokerage Fees as a Percentage of Total Assets 0.03% 0.03% 0.03%
RSIC Schedule of Investment ExpensesFiscal Year Ending June 30, 2009
(Amounts expressed in 000’s)
Commentary by: Doug Lybrand

South Carolina Retirement System Investment Commission
43
Appendix A
South Carolina Retirement SystemsSummary Schedule of Assets and Derivatives (000's)
As of June 30, 2009
Balance Sheet ValueOff Balance Sheet
Notional ValueCash Equivalents and S-T Investments:
Cash and Equivalents 2,700,651$ Cash Collateral at Broker 1,282 Total Short-Term Investments 1,377,289 Total Interest Receivables 47,446 Total Miscellaneous Receivables 52,599 Total Miscellaneous Payables (70,815) Unrealized P/L on Forward Contracts 34,674
Total Cash and S-T Investments 4,143,126
Fixed Income Investments:U.S. Core Fixed Income 3,331,926 U.S. Core Fixed Income Futures - Global Fixed Income 2,773,339 Global Fixed Income Futures - High Yield Bonds 579,687 Emerging Market Debt 148,650
Total Fixed Income Investments 6,833,602
Equity Investments:Domestic Equity 2,246,449 Domestic Convertible Preferred Equity 1,949
Total Equity 2,248,399
Alternative Investments:GTAA 1,323,693 Opportunistic Credit 1,007,939 Private Equity 538,214 Hedge Funds 4,477,409 Real Estate 126,696
Total Alternative Investments 7,473,951
Swaps:Domestic Equity 13,767 275,450 International Equity 175,848 1,445,825 Emerging Equity 177,196 1,189,267 Emerging Debt 28,316 448,756 Realized Gains (89,209) -
Total Swaps 305,918 3,359,298
Futures:U.S. Large Cap - 30,898 U.S. Small/Mid Cap - 211,689 International Equity - 791,565 U.S. Fixed Income - (82,483)
Total Futures - 951,669
Total Investments: 21,004,996$ 4,310,967$
Appendix A
South Carolina Retirement SystemsSummary Schedule of Assets and Derivatives (000’s)
As of June 30, 2009

2008 - 2009 Annual Investment Report
44
Appendix B
South Carolina Retirement SystemsShort-Term Holdings (000's)
As of June 30, 2009
Description Base CostBase Market
ValueCASH - NON CUSTODIED 80,924$ 80,924$ SC STRATEGIC PARTNERSHIP CASH 929,104 929,104 RUSSELL OVERLAY CASH 1,690,596 1,690,596 MISC CASH EQUIVALENTS 23 27 Total Cash and Equivalents 2,700,647 2,700,651
CASH COLLATERRAL AT BNP PARIBAS (310) (310) CASH COLLATERAL AT GREENWICH 889 889 CASH COLLATERAL AT GOLDMAN 703 703 Cash Collaterral at Brokers 1,282 1,282
UNITED STATES TREAS BILLS 546 546 Total T-Bills 546 546
FEDERAL HOME LN BK CONS DISC 15,661 15,684 FEDERAL HOME LN MTG CORP DISC 22,881 22,881 FEDERAL HOME LN MTG CORP DISC 32,231 32,231 Total Federal Home Loan Disc Nts 70,773 70,796
BRIDGEWATER STIF II FD 97,752 98,795 Total STIF Accounts 97,752 98,795
DREYFUS GOVT CASH MGMT FUND 1,099,978 1,099,978 Total Money Market Funds 1,099,978 1,099,978
SOUTH CAROLINA EQUITY CASH 49,475 49,475 MORGAN J P & CO REPO 57,700 57,700 Total Repurchase Agreements 107,175 107,175
Total Short Term Investments 1,376,223 1,377,289
DIVIDENDS RECEIVABLE 1,445 1,445 INTEREST RECEIVABLE 43,118 43,119 INTEREST PAYABLE-SHORT SELL (3) (3) INCOME DREYFUS GOVT CASH MGMT 2,885 2,885 Total Interest Receivable 47,445 47,446
RECEIVABLE FOR INVESTMENTS SOLD 52,871 52,871 VARIATION MARGIN ON EQUITY FUTURES (271) (271) Total Misc Receivables 52,599 52,599
Appendix B
South Carolina Retirement SystemsShort-Term Holdings (000’s)
As of June 30, 2009

South Carolina Retirement System Investment Commission
45
Appendix B
South Carolina Retirement SystemsShort-Term Holdings (000's)
As of June 30, 2009
Description Base CostBase Market
ValueCASH (488) (488) PAYABLE FOR INVESTMENTS PURCHASED (36,139) (36,129) PAYABLE FOR FORWARD FX CONTRACTS (33,372) (33,389) TBA CASH COLL MSC (810) (810) Total Misc Payables (70,810) (70,815)
FFX CONTRACTS RECEIVABLE 33,372 33,290 NON-BASE CURRENCY 1,373 1,384 Total U/R P/L on Forward Contracts 34,746 34,674
Total Cash and Short-Term Investments 4,142,133$ 4,143,126$
Appendix B
South Carolina Retirement SystemsShort-Term Holdings (000’s)
As of June 30, 2009

2008 - 2009 Annual Investment Report
46
Appendix C
South Carolina Retirement SystemsFixed Income Holdings (000's)
As of June 30, 2009
Issuer PriceMaturity
DateFace Value /
Contracts Book ValueMarketValue
ALLEGHENY GENERATING CO DEBS 92.0 9/1/2023 17,240$ 15,485$ 15,856$ AOL TIME WARNER INC NT 107.0 5/1/2012 5,000 5,264 5,349APPALACHIAN PWR CO SR NT SER H 89.9 5/15/2033 23,000 18,990 20,674APPALACHIAN PWR CO SR NT SER H 89.9 5/15/2033 5,334 5,169 4,794ARROW ELECTRONICS INC SR DEBS 90.5 1/15/2027 34,000 35,999 30,757AT&T BROADBAND CORP NT 116.9 11/15/2022 21,300 23,062 24,903AVISTA CORP 1ST MTG BD 94.3 12/1/2035 10,000 7,394 9,430BAXTER INTL INC SHELF 9 105.7 2/15/2028 5,000 5,273 5,284BECTON DICKINSON & CO SR DEBS 111.4 8/1/2028 4,700 5,054 5,236BECTON DICKINSON & CO SR DEBS 111.4 8/1/2028 5,000 5,081 5,570BLUE CROSS BLUE SHIELD 144A 108.5 11/15/2011 20,000 21,257 21,710BRITISH TELECOMMUNICATIONS NT 106.2 12/15/2010 10,000 10,450 10,621CARGILL INC MTN #TR 00016 144A 97.4 7/29/2027 20,000 18,416 19,483CDS BP LENNAR CORP SNR S* 0.0 6/20/2015 (2,500) 0 0CDS BP LENNAR CORP SNR S* 0.0 9/20/2014 (4,000) 0 0CDS BP RYLAND GROUP NEGB SNR S 0.0 6/20/2017 (1,100) 0 0CDS BP RYLAND GROUP NEGB SNR S 0.0 9/20/2017 (1,700) 0 0CDS BP TOLL BORTHERS FIN CORP 0.0 12/20/2017 (3,700) 0 0CDS_BP LENNAR CORP SNR S* 12.4 6/20/2015 2,500 263 310CDS_BP LENNAR CORP SNR S* 11.6 9/20/2014 4,000 420 466CDS_BP RYLAND GROUP NEGB SNR S 6.8 6/20/2017 1,100 79 75CDS_BP RYLAND GROUP NEGB SNR S 6.8 6/20/2017 1,700 127 115CDS_BP TOLL BORTHERS FIN CORP 1.8 12/20/2017 3,700 62 65CENTRAL ILL PUB MTN #TR 00013 97.7 6/1/2017 18,000 19,403 17,581CENTRAL ME PWR CO MTN 144A 73.2 6/10/2035 5,000 4,617 3,659CINCINNATI FINL CORP DEB 76.6 5/15/2028 23,712 24,981 18,153CINCINNATI FINL CORP SR NT 69.5 11/1/2034 16,185 16,484 11,253CINTAS CORP NO 2 SR NT 77.6 8/15/2036 15,000 11,979 11,633CINTAS CORP NO 2 SR NT 77.6 8/15/2036 5,000 4,968 3,878CITIGROUP BANKING INST 101.7 5/22/2019 13,400 13,622 13,631CITIGROUP INC FDIC GTD TGLP GT 100.4 4/30/2012 2,100 2,117 2,109CITIZENS UTILS CO DEL DEBS 71.0 7/1/2035 27,500 29,650 19,525CLECO PWR LLC SR NT 83.0 12/1/2035 17,000 14,127 14,116COCA COLA ENTERPRISES INC 123.0 9/15/2022 20,000 24,200 24,602COCA COLA ENTERPRISES INC 123.0 9/15/2022 10,000 9,866 12,301COMMONWEALTH BK MTN 144A 100.4 1/12/2012 400 403 402COMMONWEALTH EDISON CO 1ST MTG 95.9 3/15/2036 27,300 22,681 26,191COMMONWEALTH EDISON CO 1ST MTG 95.9 3/15/2036 5,000 4,249 4,797CONSOLIDATED EDISON CO NY INC 99.8 3/15/2036 20,000 18,118 19,963CONSOLIDATED EDISON CO NY INC 99.8 3/15/2036 5,000 4,750 4,991CONTINENTAL AIRLS 01-1 CL A 2 93.0 6/15/2011 10,000 9,917 9,300COOK CNTY ILL 110.9 11/15/2019 2,000 2,131 2,218CSX TRANSN INC EQUIP 00 SER B 104.1 5/15/2015 2,100 2,197 2,186DAYTON HUDSON CORP CDT MTN D 110.8 6/10/2015 250 338 277DEUTSCHE TELEKOM INTL FIN B V 122.7 6/1/2032 30,075 35,059 36,888DISNEY WALT CO DEB 104.2 7/15/2093 20,000 20,017 20,832DISNEY WALT CO DEB 104.2 7/15/2093 10,800 10,738 11,249DUKE ENERGY FIELD SVCS 144A 80.0 11/3/2036 5,000 3,435 4,000EMPIRE DIST ELEC CO SR NT 78.9 11/15/2033 36,000 35,860 28,419EMPIRE DIST ELEC CO SR NT 69.4 7/1/2035 20,000 19,890 13,889
Appendix C
South Carolina Retirement SystemsFixed Income Holdings (000’s)
As of June 30, 2009

South Carolina Retirement System Investment Commission
47
Appendix C
South Carolina Retirement SystemsFixed Income Holdings (000's)
As of June 30, 2009
Issuer PriceMaturity
DateFace Value /
Contracts Book ValueMarketValue
ENTERGY ARK INC 1ST MTG BD 95.3 5/1/2018 3,500 3,354 3,334ENTERGY GULF STS INC 1ST MTG 99.5 12/1/2009 40,000 39,182 39,785ENTERGY LA LLC 1ST MTG BD 89.8 10/1/2034 10,000 8,084 8,975ENTERGY LA LLC 1ST MTG BD 88.5 9/1/2035 9,000 7,101 7,964EQUIFAX INC DEB 93.0 7/1/2028 25,000 24,750 23,255EQUITABLE LIFE ASSURANCE NTS 94.4 12/1/2015 6,000 6,488 5,662EQUITABLE RES INC DEB 96.2 7/15/2026 15,000 12,516 14,435EVEREST REINS HLDGS INC SR NT 102.0 3/15/2010 10,000 10,163 10,199EXPRESS PIPELINE LTD 144A 114.5 12/31/2019 4,678 5,041 5,356FBL FINL GROUP SR NT 73.4 4/15/2014 24,500 24,436 17,972FEDERAL HOME LN BKS CONS BD 103.8 6/24/2011 600 627 623FEDERAL HOME LN MTG CORP 99.6 6/1/2011 3,700 3,696 3,683FEDERAL HOME LN MTG CORP NTS 107.0 4/18/2011 400 430 428FEDERAL HOME LN MTG CORP NTS 107.9 7/18/2011 400 434 432FEDERAL HOME LN MTG CORP REF 100.8 4/26/2011 2,600 2,626 2,621FEDERAL NATL MTG ASSN 98.4 5/15/2014 50,000 48,973 49,211FEDERAL NATL MTG ASSN DEBS 107.1 4/15/2011 900 967 964FEDERAL NATL MTG ASSN MTN 100.9 3/23/2011 2,100 2,123 2,119FNMA POOL #0073814 107.6 12/1/2016 4,155 4,096 4,472FNMA POOL #0104592 109.5 7/1/2020 55 55 60FNMA POOL #0111049 110.2 11/1/2020 113 113 125FNMA POOL #0111050 109.3 11/1/2020 64 64 70FNMA POOL #0111051 109.7 12/1/2020 86 86 95FNMA POOL #0111052 110.0 12/1/2020 60 60 67FNMA GTD REMIC P/T 92-143 M 111.4 9/25/2022 7 8 8FNMA GTD REMIC P/T 92-31 L 108.6 3/25/2022 36 40 40FNMA GTD REMIC P/T 92-36 PN 108.6 3/25/2022 7 7 7FNMA GTD REMIC P/T CTF 92-112G 111.4 7/25/2022 13 14 14FNMA GTD REMIC P/T CTF 92-150M 111.4 9/25/2022 7 7 8FNMA GTD REMIC P/T CTF 92-84 L 107.2 5/25/2022 661 699 708FORTIS BANK NED HOLDING 141.1 6/10/2011 1,900 2,666 2,680GENERAL AMERN LIFE INS CO 112.0 1/15/2024 37,500 36,539 41,991GENERAL ELECTRIC CAPITAL CORP 100.3 12/21/2012 4,100 4,110 4,114GENERAL MLS INC NT 107.7 2/15/2012 5,000 5,371 5,383GNMA POOL #0395483 106.3 1/15/2031 9,062 9,373 9,637GNMA POOL #0400631 108.0 5/15/2030 8,212 8,813 8,871GNMA POOL #0427475 107.5 6/15/2029 6,981 7,126 7,505GNMA POOL #0550561 103.7 7/15/2035 13,886 14,451 14,395GNMA POOL #0550614 103.7 8/15/2035 14,304 14,885 14,828GNMA POOL #0550657 103.7 9/15/2035 85,246 85,006 88,370GNMA POOL #0550728 103.7 11/15/2035 46,014 47,873 47,700GNMA POOL #0553520 107.5 3/15/2032 1,440 1,435 1,548GNMA POOL #0569159 107.5 3/15/2032 2,479 2,611 2,665GNMA POOL #0569684 105.4 2/15/2032 2,144 2,263 2,259GNMA POOL #0569704 105.4 2/15/2032 4,482 4,730 4,722GNMA POOL #0570518 105.4 1/15/2032 3,403 3,592 3,586GNMA POOL #0574466 107.5 3/15/2032 2,097 2,208 2,254GNMA POOL #0587074 105.1 5/15/2032 5,843 6,112 6,142GNMA POOL #0602533 103.6 2/15/2036 20,474 21,296 21,205GNMA POOL #0602553 103.6 3/15/2036 22,951 23,871 23,770
Appendix C
South Carolina Retirement SystemsFixed Income Holdings (000’s)
As of June 30, 2009

2008 - 2009 Annual Investment Report
48
Appendix C
South Carolina Retirement SystemsFixed Income Holdings (000's)
As of June 30, 2009
Issuer PriceMaturity
DateFace Value /
Contracts Book ValueMarketValue
GNMA POOL #0604436 104.3 7/15/2018 159 159 166GNMA POOL #0606252 103.6 4/15/2036 36,291 37,743 37,587GNMA POOL #0616997 103.6 2/15/2036 16,332 16,988 16,915GNMA POOL #0617027 103.6 3/15/2036 16,421 17,078 17,007GNMA POOL #0617057 103.6 4/15/2036 20,368 21,182 21,095GNMA POOL #0617087 103.6 5/15/2036 29,934 31,129 31,003GNMA POOL #0633488 103.6 3/15/2036 42,176 43,863 43,682GNMA POOL #0645908 103.6 4/15/2036 11,819 12,291 12,241GNMA POOL #0648372 103.7 11/15/2035 13,445 13,988 13,938GNMA POOL #0650043 103.6 4/15/2036 7,513 7,813 7,781GNMA POOL #0650111 103.6 1/15/2036 22,336 23,235 23,133GNMA POOL #0650958 103.7 12/15/2035 12,219 12,711 12,667GNMA POOL #0651719 103.6 2/15/2036 15,709 16,340 16,270GNMA POOL #0651742 103.6 3/15/2036 15,000 15,580 15,535GNMA POOL #0651788 103.6 4/15/2036 65,789 64,607 68,137GNMA POOL #0651789 103.6 4/15/2036 66,138 64,981 68,499GNMA POOL #0651913 103.6 4/15/2036 17,227 17,894 17,842GNMA POOL #0651940 103.6 5/15/2036 54,322 53,090 56,261GNMA POOL #0651965 103.6 6/15/2036 27,301 28,357 28,276GNMA POOL #0652540 103.6 5/15/2036 21,978 22,829 22,763GNMA POOL #0654834 103.6 6/15/2036 15,395 15,991 15,945GNMA POOL #0658257 103.5 1/15/2037 41,759 43,368 43,211GNMA POOL #0658709 103.5 5/15/2037 52,166 54,176 53,979GNMA POOL #0662118 103.5 2/15/2037 35,968 37,354 37,219GNMA POOL #0662396 103.5 5/15/2037 52,817 54,852 54,654GNMA POOL #0668405 104.3 4/15/2037 33,069 34,611 34,494GNMA POOL #0782055 103.4 2/15/2036 63,395 65,949 65,566GNMA POOL #0782076 103.4 3/15/2036 30,699 31,936 31,750GNMA POOL #0782131 103.4 12/15/2036 17,306 18,033 17,896HANCOCK JOHN MUT LIFE INS 144A 93.7 2/15/2024 50,000 48,640 46,869HASBRO INC BNDS 82.0 7/15/2028 25,000 20,246 20,497HASBRO INC BNDS 82.0 7/15/2028 5,000 4,990 4,099HORACE MANN EDUCATORS CORP NEW 84.2 4/15/2016 25,000 21,521 21,058HORACE MANN EDUCATORS CORP NEW 84.2 4/15/2016 5,000 4,985 4,212HVIDE VAN OMMEREN TANKERS LLC 120.3 12/14/2023 3,498 3,498 4,207HVIDE VAN OMMEREN TANKERS LLC 120.3 12/14/2023 3,518 3,518 4,231INDIANA ST FIN AUTH REV 101.3 2/1/2039 900 900 912IRS P US0003M R 4.00% 0.0 12/16/2019 (11,700) (158) 0IRS_P US0003M R 4.00% 0.4 12/16/2019 11,700 0 44JACKSON NTAL LIFE INS CO 144A 83.2 3/15/2027 42,500 43,573 35,379JEFFERIES GROUP INC NEW SR DEB 69.0 1/15/2036 24,040 23,691 16,584JOHNSON & JOHNSON NT 107.2 7/15/2038 7,925 8,447 8,493JOHNSON S C & CON SR NTS 144A 94.2 2/15/2028 17,450 17,323 16,429KINDER MORGAN ENERGY PARTNERS 105.7 3/15/2032 29,406 29,245 31,094LACLEDE GAS CO 1ST MTG BD 105.7 10/15/2012 100 109 106LENNAR CORP SR NT 80.0 9/1/2014 4,000 3,240 3,200LENNAR CORP SR NT SER B 78.8 5/31/2015 2,500 2,000 1,969LIBERTY MUTUAL 144A 67.5 5/15/2025 10,000 9,979 6,750LIBERTY MUTUAL INS CO 144A 66.6 10/15/2026 10,000 10,077 6,656LINCOLN NATL CORP IND SR NT 69.7 4/7/2036 20,000 14,352 13,934
Appendix C
South Carolina Retirement SystemsFixed Income Holdings (000’s)
As of June 30, 2009

South Carolina Retirement System Investment Commission
49
Appendix C
South Carolina Retirement SystemsFixed Income Holdings (000's)
As of June 30, 2009
Issuer PriceMaturity
DateFace Value /
Contracts Book ValueMarketValue
LINCOLN NATL CORP SR NTS 90.0 3/15/2018 13,000 10,034 11,698LINCOLN NATL CORP SR NTS 90.0 3/15/2018 5,000 4,988 4,499LLOYDS TSB BANK PLC 140.0 6/9/2011 1,500 2,100 2,100LUBRIZOL CORP DEB 94.2 6/15/2025 6,005 5,712 5,657MADISON GAS & ELECTRIC CO 102.9 2/15/2028 717 698 738MARSH & MCLENNAN COS INC 95.3 9/15/2015 5,000 4,938 4,764MARTIN MARIETTA MATLS INC NT 104.2 4/1/2011 7,895 8,322 8,227MASSACHUSETTS MUT LIFE INS CO 92.0 3/1/2024 30,000 29,902 27,602MATTEL INC MTN TR 00022 99.5 7/9/2012 13,500 13,649 13,438MAY DEPT STORES 54.4 8/15/2035 19,000 18,988 10,335MAY DEPT STORES CO DEB 66.4 8/15/2036 25,000 24,688 16,612MCKESSON CORP NEW REORG DEB 99.9 3/1/2027 29,750 29,507 29,717METROPOLITAN LIFE INS NT 144A 84.5 11/1/2025 24,435 26,069 20,641MICHIGAN CONS GAS CO 1ST MTG 113.5 5/1/2014 11,500 12,961 13,051MICHIGAN CONS GAS CO 1ST MTG 113.5 5/1/2014 5,000 4,958 5,675MUTUAL OMAHA INS CO NT 144A 68.5 6/15/2036 36,200 36,415 24,813NATIONAL ARCHIVES FAC TR CTF 119.6 9/1/2019 2,980 2,846 3,565NATIONAL FUEL GAS # 00016 95.0 6/13/2025 5,000 4,436 4,752NATIONWIDE MUT INS CO 144A 60.1 4/15/2034 25,250 25,193 15,173NEW YORK ST DORM AUTH REVS 100.0 2/15/2031 20,000 20,000 20,000NIBC BANK NV 144.7 12/19/2011 $1,300 $1,827 $1,882NLV FINL CORP SR NT 60.1 3/15/2035 9,000 8,914 5,405NLV FINL CORP SR NT 144A 75.2 8/15/2033 15,000 14,993 11,281OLD DOMINION ELEC COOP 1ST MTG 103.9 12/1/2023 405 393 421ONEOK INC NEW NT 83.8 6/15/2035 33,990 26,048 28,490ORANGE & ROCKLAND UTILS SER G 103.3 3/1/2029 10,000 9,997 10,328PACIFIC MUT LIFE INS CO 144A 99.0 12/30/2023 50,000 50,179 49,520PATRONS LEGACY 03 144A 106.6 7/10/2049 15,500 15,500 16,520PATRONS LEGACY 03 III 144A 73.3 7/10/2049 13,925 13,925 10,203PEDERNALES ELEC COOP INC 144A 114.1 11/15/2020 25,000 26,043 28,532PENN MUT LIFE INS CO 144A 76.3 6/15/2034 38,056 41,313 29,037PENNEY J C INC DEB 97.5 8/15/2016 6,000 5,876 5,847PHOENIX LIFE INS SURPLUS 144A 27.7 12/15/2034 20,000 20,317 5,539PIEDMONT NAT GAS INC NT SER E 96.2 12/19/2033 1,000 844 962PIEDMONT NATL GAS MTN TR00004 111.0 10/3/2025 1,500 1,498 1,664PLAINS ALL AMERN PIPELINE L P 90.2 5/15/2036 14,500 12,456 13,073PLAINS ALL AMERN PIPELINE L P 90.2 5/15/2036 5,000 4,939 4,508PORT AUTH N Y & N J 102.4 12/1/2024 6,600 6,600 6,757PRUDENTIAL FUND NT 144A 93.0 9/15/2023 20,000 17,316 18,602PRUDENTIAL INS 144A 90.9 7/1/2025 10,000 9,965 9,089PUBLIC SVC CO N C INC SR DEB 113.1 12/15/2026 10,000 10,000 11,306PUGET SOUND ENERGY INC SR NT 97.1 6/15/2036 17,000 14,690 16,508RABOBANK NEDERLAND 111.3 12/29/2049 6,900 6,900 7,676ROYAL BK OF SCOTLAND PLC 99.9 4/8/2011 100 100 100ROYAL BK SCOTLAND GRP PLC 144A 100.7 5/11/2012 400 403 403RYLAND GROUP 96.0 5/15/2017 2,700 2,592 2,592SELECTIVE INS GROUP INC SR NT 67.5 11/1/2035 29,500 29,249 19,898SEMCO ENERGY INC SR NT 100.3 10/1/2009 16,000 16,000 16,053SLM CORP MTN # TR 00087 99.6 7/27/2009 24,575 22,879 24,470SMALL BUSINESS ADMIN 03-20E 1 103.1 5/1/2023 143 143 148
Appendix C
South Carolina Retirement SystemsFixed Income Holdings (000’s)
As of June 30, 2009

2008 - 2009 Annual Investment Report
50
Appendix C
South Carolina Retirement SystemsFixed Income Holdings (000's)
As of June 30, 2009
Issuer PriceMaturity
DateFace Value /
Contracts Book ValueMarketValue
SONOCO PRODS CO NT 96.2 11/15/2013 10,000 9,281 9,616SONOCO PRODS CO NT 96.2 11/15/2013 5,000 4,971 4,808SOUTH CAROLINA ELEC & GAS 108.8 7/1/2036 16,000 16,036 17,408SOUTH CAROLINA STUDENT A-1 99.8 12/3/2018 31,400 31,322 31,322SOUTH CAROLINA STUDENT LN A1 94.6 12/2/2019 30,000 27,572 28,378SOUTHERN CALIF WTR CO MEDIUM 94.8 3/23/2028 15,000 15,000 14,217SOUTHERN STAR CENT GAS 144A 90.1 6/1/2016 9,500 9,468 8,562SOUTHWESTERN BELL TEL CO NT 100.5 10/15/2026 15,000 14,754 15,079SOUTHWESTERN BELL TEL CO NT 100.5 10/15/2026 5,000 4,994 5,026SOUTHWESTERN ELEC PWR CO NT 97.8 4/15/2015 6,750 6,395 6,603SQUARE BUTTE ELEC CORP 144A 114.6 1/1/2024 14,678 14,678 16,815TEXAS EASTN TRANSMISSION CORP 105.2 7/15/2032 5,000 5,309 5,259TEXAS ST 110.0 8/1/2019 3,000 3,312 3,299TEXAS ST UNIV SYS FING REV 111.4 3/15/2018 3,755 4,043 4,183TEXAS ST UNIV SYS FING REV 110.7 3/15/2019 2,305 2,473 2,551TOLL BROTHERS FINANCE CORP 102.3 10/15/2017 3,700 3,793 3,784TRANSCANADA PIPELINES LTD 96.6 3/15/2036 10,590 8,969 10,225TRI-STATE GENERATION A 144A 93.9 1/31/2018 4,954 4,976 4,654U S TREASURY BOND 144.2 2/15/2015 8,600 12,548 12,398U S TREASURY BOND 136.9 2/15/2016 10,000 13,856 13,694U S TREASURY BOND 125.4 5/15/2016 5,000 6,319 6,268U S TREASURY BOND 143.3 5/15/2018 49,600 71,347 71,064U S TREASURY BOND 143.3 11/15/2018 14,650 21,078 21,000U S TREASURY NOTE 103.4 1/31/2013 5,000 5,213 5,171U S TREASURY NOTE 99.7 4/30/2011 60,000 60,000 59,843U S WEST COMMUNICATIONS INC 73.0 9/15/2033 26,990 18,893 19,703UNION LT HEAT & PWR CO 144A 97.9 3/10/2036 10,800 9,464 10,574UNION PAC RR CO 03 1 03-1 94.2 1/2/2024 231 224 218UNITED STATES94-3 CL 2-F 106.0 9/15/2024 5,353 5,796 5,676UNITED TEL CO FLA 1ST MTG 88.4 7/15/2023 9,869 7,395 8,723UNITED TEL CO FLA 1ST SER HH 98.4 1/15/2025 19,700 16,991 19,384US TREAS-CPI INFLAT 102.5 7/15/2014 4,298 4,376 4,405VULCAN MATLS CO NT 99.5 12/15/2010 25,000 25,000 24,877WASHINGTON ST SER C-VAR PURP 108.0 1/1/2021 2,000 2,148 2,159WELLS FARGO & CO NEW NT 99.7 3/23/2010 15,000 14,789 14,953WESTAR ENERGY INC 85.8 7/15/2036 14,500 11,036 12,434WESTAR ENERGY INC 1ST MTG BD 86.9 1/1/2035 7,000 5,681 6,085WESTVACO CORP DEB 88.8 3/15/2027 22,478 22,362 19,965WEYERHAEUSER CO DEB DTD 01/15/ 86.1 1/15/2025 20,000 16,654 17,218WEYERHAEUSER CO SHELF 9 82.8 3/15/2025 5,000 3,988 4,141WEYERHAEUSER CO SHELF 9 82.8 3/15/2025 5,000 5,096 4,141WISCONSIN GAS LLC DEB 88.9 12/1/2035 10,000 8,868 8,891Total Domestic Fixed Income 3,437,974 3,437,285 3,331,926
US TREAS BOND (CBT) 118.4 9/21/2009 (1,256) 0 0US 10 YR TREAS NTS FUTURE(CBT) 116.3 9/21/2009 221 0 0US 5YR TREAS NTS FUTURE (CBT) 114.7 9/30/2009 766 0 0US 2YR TREAS NTS FUT (CBT) 108.1 9/30/2009 700 0 0Total Domestic Fixed Income Futures 431 - -
Appendix C
South Carolina Retirement SystemsFixed Income Holdings (000’s)
As of June 30, 2009

South Carolina Retirement System Investment Commission
51
Appendix C
South Carolina Retirement SystemsFixed Income Holdings (000's)
As of June 30, 2009
Issuer PriceMaturity
DateFace Value /
Contracts Book ValueMarketValue
LOOMIS COLLECTIVE INVESTMENT 0.9 630,000 630,000 597,529MONDRIAN GLOBAL FIXED INCOME 12.0 68,607 802,964 822,221WESTERN ASSET GLOBAL MULTI 10.1 61,641 616,405 622,878CREDIT AGRICOLE GLOBAL FIXED 472.6 1,546 621,355 730,712Total Global Fixed Income 761,794 2,670,724 2,773,339
90DAY STERLING LIBOR FUT (LIF) 161.2 6/16/2010 589 0 090DAY STERLING LIBOR FUT (LIF) 160.4 9/15/2010 289 0 03MO EURO EURIBOR FUTURE (LIF) 138.0 6/14/2010 110 0 03MO EURO EURIBOR FUTURE (LIF) 137.6 9/13/2010 129 0 090DAY EURODOLLAR FUTURE CME 99.1 12/14/2009 397 0 0Total Global Fixed Income Futures 1,514 - -
LOOMIS SAYLES INVT TR HIGH 7.3 69,737 500,000 509,245MORGAN STANLEY - HIGH YIELD 1.0 20,603 20,603 20,603CARRIZO OIL & GAS INC SR NT 72.8 6/1/2028 1,145 820 833CENTRAL EUROPEAN DISTR CORP 68.1 3/15/2013 1,220 731 831CENTURY ALUM CO SR NT CONV 72.1 8/1/2024 520 354 375GLOBAL CROSSING LTD SR NT CONV 87.3 5/15/2011 375 275 327GMX RESOURCES INC 67.6 2/1/2013 255 192 172HOLOGIC INC SR NT CONV 71.0 12/15/2037 570 388 405HORIZON LINES INC SR NT CONV 70.1 8/15/2012 960 598 673KANSAS CITY SOUTHN PERP PFD 735.0 0 161 154L 1 IDENTITY SOLUTIONS INC SR 79.0 5/15/2027 330 255 261LODGENET INTERACTIVE CONV PFD 1,000.0 1 550 550NII HLDGS INC NT CONV 76.9 6/15/2012 1,350 1,002 1,038OMNICARE INC SR DEB CONV 69.3 12/15/2035 470 333 325POWERWAVE TECHNOLOGIES INC 46.3 10/1/2027 885 295 409SAVVIS INC SR NT CONV 75.1 5/15/2012 635 462 477WELLS FARGO & CO NEW PERP PFD 785.0 1 824 930WHITING PETROLEUM CORP PFD 98.6 2 190 187AES CORP SR NT 144A 101.3 4/15/2016 495 497 501ACE CASH EXPRESS INC 144A 45.0 10/1/2014 850 423 383ANIXTER INC GTD SR NT 99.5 3/15/2014 260 253 259ARAMARK CORP SR NT 97.0 2/1/2015 400 385 388BAUSCH & LOMB INC SR NT 95.5 11/1/2015 385 348 368BELDEN INC NEW SR SUB NT 88.5 3/15/2017 335 300 296BIOMET INC SR NT 101.8 10/15/2017 255 265 259BOYD GAMING CORP 81.0 4/15/2014 570 439 462BRANDYWINE OPER PARTNERSHIP LP 77.6 11/1/2014 165 118 128BRANDYWINE OPER PARTNERSHIP LP 73.8 4/1/2016 145 101 107BRIGHAM EXPL CO SR NT 68.5 5/1/2014 1,210 600 829BROADVIEW NETWORKS HLDGS INC 79.0 9/1/2012 490 348 387CHS/CMNTY HEALTH SYS INC SR NT 98.0 7/15/2015 730 723 715CIT GROUP INC NEW SR NT 58.9 9/30/2014 460 304 271CIT GROUP INC NEW SR NT 75.0 7/28/2011 350 250 262CIT GROUP INC NEW SR NT 56.5 9/15/2016 150 100 85CALPINE CONSTRUCTION FINANCE C 95.8 6/1/2016 790 754 756CARDTRONICS INC SR SUB NT 89.5 8/15/2013 290 265 260CENTURY ALUM CO SR NT 68.3 8/15/2014 400 251 273
Appendix C
South Carolina Retirement SystemsFixed Income Holdings (000’s)
As of June 30, 2009

2008 - 2009 Annual Investment Report
52
Appendix C
South Carolina Retirement SystemsFixed Income Holdings (000's)
As of June 30, 2009
Issuer PriceMaturity
DateFace Value /
Contracts Book ValueMarketValue
CENVEO CORP SR SUB NT 70.0 12/1/2013 300 211 210CHESAPEAKE ENERGY CORP SR NT 87.0 12/15/2018 540 473 470CINCINNATI BELL INC SR SUB NTS 92.5 1/15/2014 930 925 860CITIZENS COMMUNICATIONS CORP 92.0 1/15/2013 215 205 198COMPLETE PRODTN SVCS INC SR NT 85.5 12/15/2016 190 147 162CRICKET COMMUNICATIONS INC SR 98.5 11/1/2014 640 637 630CROWN CASTLE INTL CORP SR NT 101.8 1/15/2015 250 251 254DELTA PETE CORP SR NT 54.0 4/1/2015 380 211 205DENBURY RES INC SR SUB NT 102.8 3/1/2016 245 251 252DOMTAR CORP NT 83.5 8/15/2015 650 535 543ENERGY FUTURE HLDGS CORP SR NT 73.0 11/1/2017 1,140 806 832EXIDE TECHNOLOGIES SR SEC NT 81.5 3/15/2013 1,105 892 901FEDERATED RETAIL HLDGS INC NT 81.5 12/1/2016 245 204 200FELCOR LODGING LTD PARTN SR NT 88.0 6/1/2011 470 405 414FIRST DATA CORP SR NT 71.0 9/24/2015 290 206 206FORD MTR CR CO GBL LANDMARK 86.5 10/25/2011 810 682 701GMAC LLC 83.5 5/15/2012 480 401 401GAYLORD ENTMT CO NEW SR NT 85.3 11/15/2013 755 596 644GLOBAL CROSSING UK FIN 79.8 12/15/2014 495 391 395GLOBAL CASH 92.5 3/15/2012 500 444 463HCA INC SR SECD NT 98.5 11/15/2016 1,010 992 995HSN INC DEL SR NT 144A 92.1 8/1/2016 345 319 318HELIX ENERGY SOLUTIONS 144A 91.3 1/15/2016 490 417 447HUB INTL HLDGS INC SR SUB 144A 73.6 6/15/2015 320 232 236HUNTSMAN INTL INC SR SUB NT 79.3 11/15/2014 255 204 202ITT CORP DEBS 92.0 11/15/2015 280 255 258INTERFACE ACE INC SR SUB NT 92.0 2/1/2014 315 286 290INTERNATIONAL LEASE FIN CORP 76.1 3/25/2013 340 271 259ISLE CAPRI CASINOS INC SR SUB 80.5 3/1/2014 250 201 201KAR HLDGS INC SR NT 85.8 5/1/2014 455 358 390KANSAS CITY SOUTHN DE MEXICO 86.0 12/1/2013 595 500 512KANSAS CITY SOUTHN DE MEX 144A 101.5 4/1/2016 1,575 1,489 1,599KEY ENERGY SVCS INC SR NT 88.3 12/1/2014 285 252 252LEVEL 3 FING INC SR GTD NT 82.0 11/1/2014 330 262 271LIBBEY GLASS INC GTD SR NT 62.0 6/1/2011 790 479 490LUCENT TECHNOLOGIES INC DEBS 56.0 1/15/2028 370 199 207MGM MIRAGE SR SECD NT 144A 109.5 11/15/2013 105 115 115MGM MIRAGE INC 106.0 11/15/2017 210 211 223MARINER ENERGY INC SR NT 91.0 4/15/2013 530 457 482MARKWEST ENERGY PART/FIN CORP 83.5 11/1/2014 150 128 125MARKWEST ENERGY PARTNERS/LP 86.5 4/15/2018 120 97 104MARKWEST ENERGY PART/FIN 82.5 11/1/2014 555 438 458MARQUEE HLDGS INC SR DISC NT 77.0 8/15/2014 435 344 335MEDIACOM LLC/MEDIACOM CAP 95.3 1/15/2013 510 502 486METROPCS WIRELESS INC SR NT 99.4 11/1/2014 580 584 576MOBILE SVCS GROUP INC/MOBILE 95.8 8/1/2014 270 242 259NRG ENERGY INC SR NT 94.6 2/1/2016 1,030 999 975NTL CABLE PLC SR NT 97.5 4/15/2014 400 401 390NEXTEL COMMUNICATIONS INC SR 82.8 10/31/2013 605 498 501NORSKE SKOG CDA LTD 42.5 3/1/2014 465 200 198
Appendix C
South Carolina Retirement SystemsFixed Income Holdings (000’s)
As of June 30, 2009

South Carolina Retirement System Investment Commission
53
Appendix C
South Carolina Retirement SystemsFixed Income Holdings (000's)
As of June 30, 2009
Issuer PriceMaturity
DateFace Value /
Contracts Book ValueMarketValue
OED CORP 89.5 4/15/2012 220 190 197NUVEEN INVTS INC SR NT 50.5 9/15/2015 160 58 81NUVEEN INVTS INC SR NT 144A 69.0 11/15/2015 835 445 576OWENS CORNING NEW SR NT 70.9 12/1/2036 275 197 195PAETEC HOLDING CORP 86.8 7/15/2015 905 778 785PAETEC HOLDING CORP 94.0 6/30/2017 330 318 310PETROHAWK ENERGY CORP SR NT 99.5 7/15/2013 780 768 776PLAINS EXPL & PRODTN CO SR NT 93.5 6/15/2015 545 501 510PLAINS EXPL & PRODTN CO SR NT 102.8 3/1/2016 200 200 206QUIKSILVER INC ST NT 53.0 4/15/2015 1,145 702 607QUICKSILVER RES INC SR NT 89.0 8/1/2015 115 100 102QUICKSILVER RESOURCES IN 103.5 1/1/2016 140 137 145QWEST COMMUNICATIONS INTL 91.3 2/15/2014 295 277 269ROSETON DANSKAMMER 2001 SER B 87.0 11/8/2016 725 634 631ROYAL CARIBBEAN LTD SR NT 87.4 6/15/2013 195 163 170SANMINA SCI CORP SR SUB NT 72.9 3/1/2016 900 479 656SANMINA SCI CORP SR NT 144A 82.0 6/15/2014 130 99 107SEAGATE TECHNOLOGY HDD HLDGS 85.8 10/1/2016 1,475 1,080 1,265SELECT MED CORP SR SUB NT 81.3 2/1/2015 920 741 748SPRINT NEXTEL CORP NT 81.8 12/1/2016 1,245 1,040 1,018SUN HEALTHCARE GROUP INC SR 99.0 4/15/2015 250 246 248SUNGARD DATA SYS INC SR NT 94.5 8/15/2013 280 270 265TEAM FIN LLC/HEALTH FIN CORP 102.3 12/1/2013 190 190 194TERREMARK WORLDWIDE INC 96.0 6/15/2017 725 694 696TEXAS COMPETITIVE ELECTRIC HOL 62.3 11/1/2015 710 479 442TIME WARNER TELECOM HLDGS INC 99.3 2/15/2014 245 245 243TRAVELPORT LLC/TRAVELPORT HLDG 66.5 9/1/2014 140 94 93VANGENT INC SR SUB NT 83.0 2/15/2015 505 402 419VOUGHT AIRCRAFT INDS INC SR NT 62.5 7/15/2011 1,030 609 644WALLACE THEATER HOLDINGS INC 96.5 6/15/2013 0 162 164WENDY'S/ARBY'S GROUP INC 95.6 7/15/2016 175 171 167WINDSTREAM CORP SR NT 96.8 8/1/2013 205 204 198WYNDHAM WORLDWIDE CORP 99.7 5/1/2014 320 308 319XM EXCROW LLC SR NT 144A 81.4 8/1/2013 115 90 94XM SATELLITE RADIO INC 99.3 6/15/2013 275 270 273Total High Yield Bonds and Investments 149,090 568,903 579,687
CAPITAL GUARDIAN EMERGING MARKET 9.9 15,000 150,000 148,650Total Emerging Markets Debt 15,000 150,000 148,650
Total Fixed Income 4,363,857 6,826,912$ 6,833,602$
Appendix C
South Carolina Retirement SystemsFixed Income Holdings (000’s)
As of June 30, 2009

2008 - 2009 Annual Investment Report
54
Appendix D
South Carolina Retirement SystemsEquity Holdings (000's)
As of June 30, 2009
Issuer Shares Book Value Market Value3COM CORP COM 489,900 1,776$ 2,317$ A C MOORE ARTS & CRAFTS INC 204,800 3,170 770 AARON'S INC 86,100 2,375 2,568 ABB LTD SPONSORED ADR 869,260 22,869 13,717 ABERCROMBIE & FITCH CO CL A 41,840 998 1,062 ABINGTON BANCORP INC PENN COM 27,650 200 220 ABIOMED INC 33,870 297 299 ACCURIDE CORP 206,010 1,940 68 ACI WORLDWIDE INC COM 92,900 1,505 1,297 ACME PACKET INC COM 108,500 467 1,098 ACORDA THERAPEUTICS INC COM 59,320 1,306 1,672 ACTEL CORP COM 24,800 277 266 ACTUANT CORP CL A NEW 111,620 1,258 1,362 ACTUATE CORP COM 101,365 439 487 ACXIOM CORP COM 128,388 1,338 1,134 ADAPTEC INC COM 332,400 1,087 881 ADC TELECOMMUNICATIONS INC 336,457 3,342 2,678 ADMINISTAFF INC COM 26,320 573 612 ADOBE SYS INC DEL COM 481,672 14,245 13,631 ADTRAN INC 126,861 2,855 2,724 ADVANCED ANALOGIC TECHNOLOGIES 116,400 572 534 ADVANCED ENERGY INDS INC 95,260 1,273 856 ADVISORY BOARD CO 85,000 3,456 2,185 AECOM TECHNOLOGY CORP DELAWARE 183,400 5,180 5,869 AEGEAN MARINE PETROLEUM 151,400 1,809 2,286 AERCAP HOLDINGS N V SHS 280,100 5,016 2,022 AEROPOSTALE INC 200,320 5,469 6,865 AES CORP COM 189,700 2,019 2,202 AETNA INC COM NEW 155,700 4,969 3,900 AFFILIATED MANAGERS GROUP INC 45,180 1,709 2,629 AFLAC INC COM 121,000 3,387 3,762 AGCO CORP COM 114,770 3,763 3,336 AGNICO EAGLE MINES LTD COM 29,700 784 1,559 AGREE REALTY CORP 126,000 3,646 2,310 AIRGAS INC 125,620 5,610 5,091 AIRTRAN HLDGS INC 50,000 216 310 AIRVANA INC COM 176,392 1,034 1,117 ALBEMARLE CORP 127,244 4,737 3,254 ALBERTO CULVER CO NEW COM 227,590 5,716 5,788 ALEXANDRIA REAL ESTATE 81,675 3,868 2,923 ALEXION PHARMACEUTICALS INC 55,710 1,544 2,290 ALKERMES INC COM 117,650 1,321 1,273 ALLEGIANT TRAVEL CO COM 8,800 343 349 ALLERGAN INC COM 70,600 2,589 3,359 ALLETE INC 18,447 793 530
Appendix D
South Carolina Retirement SystemsEquity Holdings (000’s)
As of June 30, 2009

South Carolina Retirement System Investment Commission
55
Appendix D
South Carolina Retirement SystemsEquity Holdings (000's)
As of June 30, 2009
Issuer Shares Book Value Market ValueALLIANCE DATA SYS CORP COM 112,000 5,799 4,613 ALLIANCE ONE INTL INC 68,000 253 258 ALLIANT ENERGY CORP COM 193,100 6,504 5,046 ALLIED HEALTHCARE INTL INC 622,100 2,404 1,350 ALLOS THERAPEUTICS INC COM 121,686 753 1,009 ALLSCRIPTS-MISYS HEALTHCARE 106,700 1,021 1,692 ALLSTATE CORP COM 137,100 7,974 3,345 ALTERA CORP COM 129,700 2,135 2,113 AMAG PHARMACEUTICAL INC COM 16,642 616 910 AMAZON.COM INC COM 216,042 13,484 18,074 AMBAC FINANCIAL GROUP INC 48,137 392 44 AMDOCS LTD COM 140,000 2,669 3,003 AMEDISYS INC 151,291 5,976 4,996 AMERICA SVC GROUP INC 32,900 506 529 AMERICAN CAMPUS CMNTYS INC 44,302 903 983 AMERICAN DENTAL PARTNERS INC 320,784 3,118 2,910 AMERICAN ECOLOGY CORP COM NEW 145,300 2,593 2,604 AMERICAN EQUITY INVT LIFE 358,041 3,093 1,998 AMERICAN EXPRESS CO COM 139,500 4,811 3,242 AMERICAN FINL GROUP INC OHIO 116,900 3,233 2,523 AMERICAN ITALIAN PASTA CO CL A 21,002 605 612 AMERICAN PHYSCIANS SVC GROUP 68,650 1,214 1,558 AMERICAN PHYSICIANS CAP INC 42,500 1,913 1,664 AMERICAN PUB ED INC COM 43,240 1,613 1,710 AMERICAN REPOGRAPHICS CO 200,600 2,791 1,669 AMERICAN SAFETY INS HLDGS LTD 180,600 3,139 2,458 AMERICAN SCIENCE & ENGR INC 19,600 1,252 1,355 AMERICAN SOFTWARE INC 344,300 2,958 1,983 AMERICAN SUPERCONDUCTOR CORP 38,930 1,005 1,022 AMERICAN WOODMARK CORP 2,000 31 48 AMERICAN WTR WKS CO INC NEW 62,520 1,319 1,195 AMERICAS CAR MART INC 52,510 948 1,076 AMERIGROUP CORP 109,409 3,246 2,938 AMERIPRISE FINL INC 122,600 5,986 2,976 AMERISAFE INC JONES DAY COM 173,100 1,998 2,693 AMERISOURCEBERGEN CORP COM 257,580 4,819 4,569 AMERISTAR CASINOS INC 32,280 255 614 AMETEK INC 48,150 1,359 1,665 AMGEN INC 62,300 2,758 3,298 AMN HEALTHCARE SVCS INC 63,600 1,056 406 AMPHENOL CORP NEW CL A 105,000 2,798 3,322 AMSURG CORP COM 104,913 2,768 2,249 AMTRUST FINL SVCS INC COM 56,154 761 640 ANALOG DEVICES INC COM 199,000 4,050 4,931 ANDERSONS INC COM 45,300 1,228 1,356
Appendix D
South Carolina Retirement SystemsEquity Holdings (000’s)
As of June 30, 2009

2008 - 2009 Annual Investment Report
56
Appendix D
South Carolina Retirement SystemsEquity Holdings (000's)
As of June 30, 2009
Issuer Shares Book Value Market ValueANNTAYLOR STORES CORP COM 220,900 1,139 1,763 ANWORTH MTG ASSET CORP COM 1,129,533 9,664 8,144 APAC TELESERVICES INC COM 1,590,300 4,020 8,158 APACHE CORP COM 25,500 1,825 1,840 APOLLO GROUP INC CL A 21,900 1,892 1,558 APPLE INC 96,879 11,786 13,798 APPLIED MICRO CIRCUITS CORP 326,020 1,825 2,651 ARCH CAPITAL GROUP LTD SHS 41,700 2,923 2,443 ARCHER DANIELS MIDLAND CO COM 45,400 1,496 1,215 ARCSIGHT INC COM 88,721 741 1,577 ARENA RES INC 43,480 2,117 1,385 ARGO GROUP INTERNATIONAL 4,700 141 133 ARGON ST INC 56,900 1,357 1,170 ARIBA INC 328,470 3,512 3,232 ARRIS GROUP INC COM 315,086 3,076 3,835 ARROW ELECTRS INC COM 10,830 177 230 ART TECHNOLOGY GRP INC OC-COM 779,895 2,715 2,964 ARVINMERITOR INC COM 187,940 570 825 ASBURY AUTOMOTIVE GROUP INC 254,332 1,486 2,604 ASCENT MEDIA GROUP CORP COM 22,600 611 601 ASHLAND INC NEW 31,690 536 889 ASIANFO HLDGS INC COM 83,300 1,408 1,434 ASPEN INSURANCE HOLDINGS 157,921 3,855 3,528 ASSOCIATED BANC CORP COM 199,960 3,472 2,500 ASSOCIATED ESTATES RLTY CORP 54,800 435 327 ASSURED GUARANTY LTD SHS 152,921 2,382 1,893 ASTORIA FINL CORP COM 194,350 1,308 1,668 AT & T INC COM 477,200 16,376 11,854 ATC TECHNOLOGY CORP COM 161,400 3,112 2,340 ATHEROS COMMUNICATIONS INC 277,110 7,233 5,332 ATLAS AIR WORLDWIDE HLDGS INC 99,090 2,810 2,298 ATMEL CORP COM 352,981 1,461 1,317 ATS MED INC 60,270 196 199 ATWOOD OCEANIC INC 7,500 126 187 AUXILIUM PHARMACEUTICALS INC 34,580 824 1,085 AVNET INC COM 42,550 597 895 AXIS CAPITAL HLDGS LTD SHS 81,200 2,169 2,126 BAKER MICHAEL CORP 24,205 943 1,025 BALDOR ELEC CO 29,910 426 712 BALL CORP COM 33,600 1,105 1,517 BALLY TECHNOLOGIES INC COM 22,903 869 685 BANK NEW YORK MELLON CORP COM 46,500 1,230 1,363 BANK OF HAWAII CORP 26,450 1,355 948 BANK OF THE OZARKS INC COM 60,400 1,317 1,306 BANKRATE INC COM 27,730 684 700
Appendix D
South Carolina Retirement SystemsEquity Holdings (000’s)
As of June 30, 2009

South Carolina Retirement System Investment Commission
57
Appendix D
South Carolina Retirement SystemsEquity Holdings (000's)
As of June 30, 2009
Issuer Shares Book Value Market ValueBANNER CORP COM 111,300 1,752 425 BARRETT BILL CORP 49,085 1,422 1,348 BARRETT BUS SVCS INC 111,100 1,358 1,167 BB&T CORP COM 121,200 2,268 2,664 BE AEROSPACE INC 61,555 973 884 BEACON ROOFING SUPPLY INC 56,660 877 819 BEBE STORES INC COM 287,600 1,692 1,979 BECKMAN COULTER INC COM 25,080 1,651 1,433 BELDEN INC 35,116 1,124 586 BELL MICROPRODUCTS INC COM 703,900 4,324 781 BEMIS INC COM 102,200 2,411 2,575 BENCHMARK ELECTRS INC 59,607 934 858 BERKLEY W R CORP COM 169,640 4,743 3,642 BERKSHIRE HATHAWAY INC DEL B 4,298 14,675 12,446 BERRY PETE CO CL A 8,950 123 166 BIG 5 SPORTING GOODS CORP 49,200 607 544 BIG LOTS INC COM 59,800 1,835 1,258 BIGBAND NETWORKS INC COM 48,020 316 248 BIO RAD LABS INC CL A 67,400 4,660 5,087 BIOSCRIP INC 564,336 2,661 3,341 BIOVAIL CORP COM 111,200 1,020 1,496 BLACKBOARD INC 81,500 3,292 2,352 BLOUNT INTL INC NEW COM 211,260 2,270 1,819 BOEING CO COM 85,000 3,934 3,613 BORDERS GROUP INC COM 145,600 616 536 BORG WARNER INC COM 40,000 749 1,366 BORLAND SOFTWARE CORP COM 891,100 5,501 1,150 BOSTON PRIVATE FINL HLDGS INC 463,480 5,400 2,076 BOTTOMLINE TECHNOLOGIES DEL 600 5 5 BRIDGEPOINT ED INC COM 78,290 820 1,331 BRIGHAM EXPL CO COM 370,820 1,778 1,298 BRINKER INTL INC COM 76,800 1,119 1,308 BRINKS CO 84,500 3,026 2,453 BRINKS HOME SEC HLDGS INC COM 88,300 2,246 2,500 BRISTOW GROUP INC COM 68,200 2,215 2,021 BROCADE COMMUNICATIONS SYS INC 153,800 646 1,206 BROWN & BROWN INC COM 43,710 874 871 BROWN SHOE INC NEW COM 97,961 2,087 709 BRUKER CORPORATION 231,888 1,397 2,147 BUCYRUS INTERNATIONAL INC 30,310 854 866 BWAY HLDG CO COM 45,000 737 789 CABELAS INC 46,800 537 576 CABOT OIL & GAS CORP COM 95,880 3,181 2,938 CACI INTL INC CL A 12,900 468 551 CAI INTL INC COM 270,400 3,861 1,379
Appendix D
South Carolina Retirement SystemsEquity Holdings (000’s)
As of June 30, 2009

2008 - 2009 Annual Investment Report
58
Appendix D
South Carolina Retirement SystemsEquity Holdings (000's)
As of June 30, 2009
Issuer Shares Book Value Market ValueCAL DIVE INTL INC DEL COM 84,900 782 733 CALAMOS ASSET MGMT INC CL A 35,003 581 494 CALIFORNIA PIZZA KITCHEN INC 139,000 1,967 1,847 CALLAWAY GOLF CO COM 89,968 974 456 CAMERON INTL CORP COM 135,000 4,410 3,821 CANTELL MEDICAL CORP 355,500 4,841 5,770 CAPELLA ED CO COM 21,220 1,081 1,272 CAPITAL SR LIVING CORP COM 258,250 2,132 1,175 CAPSTEAD MTG CORP 333,100 3,765 4,234 CARDIAC SCIENCE CORP NEW 356,004 3,200 1,431 CARDINAL FINL CORP COM 115,479 847 904 CARDINAL HEALTH INC COM 35,200 2,231 1,075 CARE INVT TR INC COM 218,700 3,054 1,137 CAREER ED CORP COM 68,600 1,351 1,707 CARLISLE COS INC COM 146,300 4,338 3,517 CARMAX INC 36,700 501 539 CARRIZO OIL & GAS INC COM 35,320 957 606 CARROLS REST GROUP INC COM 19,700 127 131 CARTER HLDGS INC 152,940 3,263 3,764 CASEYS GEN STORES INC 78,800 2,271 2,024 CATERPILLAR INC 86,600 5,399 2,861 CATO CORP CL A 265,800 4,371 4,636 CB RICHARD ELLIS GROUP INC 228,460 1,398 2,138 CBEYOND INC 71,290 984 1,023 CBIZ INC 136,893 1,130 975 CEC ENTMT INC COM 62,113 1,640 1,831 CELANESE CORP DEL COM SER A 73,804 794 1,753 CELERA CORP COM 121,556 1,261 926 CELGENE CORP 332,848 14,761 15,923 CENTENE CORP DEL 48,570 1,025 970 CENTERPOINT ENERGY INC 197,100 2,852 2,184 CENTEX CORP COM 65,110 734 551 CENTRAL PAC FINL CORP 58,639 1,063 220 CENVEO INC 153,600 464 650 CEPHALON INC COM 52,000 3,339 2,946 CF INDS HLDGS INC 13,930 898 1,033 CHARLES RIV LABORATORIES INTL 31,696 846 1,070 CHARLOTTE RUSSE HLDG INC 288,348 4,053 3,685 CHARMING SHOPPES INC PA COM 1,194,500 3,730 4,444 CHART INDS INC COM PAR $0.01 195,995 4,848 3,563 CHATTEM INC COM 29,490 1,900 2,008 CHEESECAKE FACTORY (THE) 36,500 454 631 CHEVRON CORPORATION COM 189,600 12,771 12,561 CHIPOTLE MEXICAN GRILL INC CL 15,900 1,232 1,272 CHIQUITA BRANDS INTL INC 294,515 2,407 3,022
Appendix D
South Carolina Retirement SystemsEquity Holdings (000’s)
As of June 30, 2009

South Carolina Retirement System Investment Commission
59
Appendix D
South Carolina Retirement SystemsEquity Holdings (000's)
As of June 30, 2009
Issuer Shares Book Value Market ValueCHRISTOPHER & BANKS CORP COM 278,600 1,968 1,869 CHUBB CORP COM 85,800 4,413 3,422 CHURCHILL DOWNS INC 12,100 462 407 CIENA CORP COM NEW 83,160 848 861 CINCINNATI BELL INC 452,002 1,608 1,284 CINCINNATI FINL CORP COM 53,600 1,164 1,198 CINEMARK HLDGS INC COM 54,726 890 619 CIRCOR INTL INC COM 22,700 545 536 CISCO SYS INC COM 230,300 4,949 4,295 CITI TRENDS INC 168,500 3,381 4,361 CITRIX SYS INC COM 55,000 1,270 1,754 CITY NATL CORP COM 75,050 3,754 2,764 CLARCOR INC 79,200 2,569 2,312 CLECO CORP NEW COM 47,228 1,112 1,059 CLIFFS NAT RES INC COM 43,950 1,007 1,075 CMS ENERGY CORP COM 86,300 947 1,043 COACH INC COM 118,700 3,546 3,191 COCA COLA BOTTLING CO CONS 3,400 191 187 COGDELL SPENCER INC 100,467 352 431 COGENT COMMUNICATIONS GROUP 64,720 443 527 COLDWATER CREEK INC 454,000 2,193 2,769 COLE KENNETH PRODTNS INC CL A 79,900 1,941 562 COLLECTIVE BRANDS INC COM 137,700 1,271 2,006 COLUMBUS MCKINNON CORP N Y COM 182,600 3,991 2,310 COMCAST CORP NEW CL A 97,300 1,604 1,407 COMFORT SYSTEMS USA INC 24,500 341 251 COMMERCIAL METALS CO 112,260 1,197 1,800 COMMERCIAL VEHICLE GROUP INC 73,700 857 106 COMMONWEALTH BANKSHARES INC 89,500 1,427 458 COMMSCOPE INC COM 40,744 454 1,070 COMMUNITY HEALTH SYS INC NEW 129,060 3,100 3,259 COMPASS MINERALS INTL INC 67,720 2,721 3,719 COMPUTER PROGRAMS & SYSTEMS 25,760 911 987 COMPUWARE CORP 521,025 5,018 3,574 COMSTOCK RES INC NEW 103,921 5,192 3,435 COMSYS IT PARTNERS INC 222,100 1,902 1,299 COMTECH TELECOMMUNICATIONS 58,781 1,888 1,874 CONAGRA FOODS INC COM 191,500 3,222 3,650 CONCHO RES INC COM 36,570 1,169 1,049 CONCUR TECHNOLOGIES INC 31,691 681 985 CONOCOPHILLIPS 188,500 12,947 7,928 CONSOLIDATED GRAPHICS INC 73,599 2,465 1,282 CONTINENTAL AIRLS INC CL B 131,397 2,013 1,164 CONVERGYS CORP COM 67,300 513 625 CON-WAY INC 39,800 1,809 1,405
Appendix D
South Carolina Retirement SystemsEquity Holdings (000’s)
As of June 30, 2009

2008 - 2009 Annual Investment Report
60
Appendix D
South Carolina Retirement SystemsEquity Holdings (000's)
As of June 30, 2009
Issuer Shares Book Value Market ValueCOOPER COS INC COM NEW 50,400 1,029 1,246 COOPER TIRE & RUBR CO 39,073 182 388 COPA HOLDINGS S A CL A 33,600 1,330 1,372 COPART INC 58,610 1,635 2,032 CORE LABORATORIES N V 14,670 1,529 1,278 CORE MARK HLDG CO INC 20,800 539 542 CORINTHIAN COLLEGES INC COM 229,310 3,754 3,882 CORPORATE EXECUTIVE BD CO COM 80,000 4,106 1,661 COSTAR GROUP INC COM 85,000 3,734 3,389 COSTCO WHSL CORP NEW COM 350,698 14,638 16,055 COVANTA HLDG CORP 164,750 4,031 2,794 CRACKER BARREL OLD CTRY STORE 37,305 1,312 1,041 CRAY INC COM NEW 55,820 354 440 CREDICORP LTD 51,100 2,777 2,974 CRM HOLDINGS LTD COM 819,450 4,843 983 CROWN HOLDINGS INC 182,550 4,349 4,407 CSG SYS INTL INC 99,630 1,764 1,319 CTS CORP 209,800 2,731 1,374 CUBIC CORP COM 17,800 412 637 CUBIST PHARMACEUTICALS INC 77,800 1,671 1,426 CUMMINS INC COM 50,000 2,316 1,761 CVR ENERGY INC COM 75,286 424 552 CVS CAREMARK CORP 118,400 3,535 3,773 CYBERONICS INC 104,640 2,293 1,740 CYBERSOURCE CORP DEL COM 78,880 1,078 1,207 CYPRESS BIOSCIENCES INC 112,540 1,003 1,060 CYPRESS SEMICONDUCTOR CORP 339,000 2,489 3,119 D R HORTON INC 100,600 700 942 DAVITA INC COM 237,000 12,940 11,722 DECKERS OUTDOOR CORP COM 41,790 3,297 2,937 DEL MONTE FOODS CO COM 337,500 2,200 3,166 DELPHI FINL GROUP INC CL A COM 132,900 1,805 2,582 DELUXE CORP COM 59,600 854 763 DEMANDTEC INC COM NEW 120,103 1,037 1,057 DENBURY RES INC COM NEW 255,900 2,881 3,769 DENDREON CORPORATION COM 11,800 260 295 DESTINATION MATERNITY CORP COM 302,000 5,781 5,037 DEVELOPERS DIVERSIFIED RLTY 86,784 3,079 424 DEVRY INC DEL COM 65,000 3,019 3,253 DIAMOND FOODS INC 27,800 751 776 DICE HLDGS INC COM 121,649 392 566 DIGITAL RIV INC COM 22,900 528 832 DIODES INC 81,966 1,795 1,282 DIRECTTV GROUP INC 57,100 1,388 1,411 DISCOVERY COMMUNICATIONS INC 260,000 6,327 5,556
Appendix D
South Carolina Retirement SystemsEquity Holdings (000’s)
As of June 30, 2009

South Carolina Retirement System Investment Commission
61
Appendix D
South Carolina Retirement SystemsEquity Holdings (000's)
As of June 30, 2009
Issuer Shares Book Value Market ValueDOLBY LABORATORIES INC CL A 60,000 2,086 2,237 DOLLAR FINL CORP 193,540 1,987 2,669 DOLLAR THRIFTY AUTOMOTIVE 74,900 513 1,045 DOMINOS PIZZA INC 90,500 597 678 DONEGAL GROUP INC CL A 237,721 3,158 3,616 DOUBLE TAKE SOFTWARE COM 53,370 401 462 DOVER CORP COM 33,100 957 1,095 DRESS BARN INC COM 138,580 2,076 1,982 DRESSER RAND GROUP INC 21,100 408 551 DRIL-QUIP INC COM 85,000 4,251 3,239 DTE ENERGY CO COM 83,400 3,301 2,669 DUPONT FABROS TECHNOLOGY INC 214,700 1,160 2,022 DXP ENTERPRISES INC COM NEW 156,327 1,917 1,793 DYCOM INDS INC 204,859 1,884 2,268 DYNAMEX INC 160,000 3,172 2,462 DYNCORP INTL INC COM CL A 87,200 1,371 1,464 DYNEGY INC DEL CL A 141,770 279 322 EARTHLINK INC COM 59,424 370 440 EATON VANCE CORP NON VTG COM 91,160 1,866 2,439 ECHOSTAR CORPORATION 92,000 2,792 1,466 EDISON INTL COM 102,100 4,692 3,212 EDWARDS LIFE SCIENCES CORP COM 15,400 757 1,048 ELECTRONICS FOR IMAGING INC 22,908 216 244 ELIZABETH ARDEN INC COM 255,000 3,460 2,226 EMC CORP MASS 342,000 5,404 4,480 EMC INS GROUP 60,675 1,310 1,263 EMCOR GROUP INC COM 10,800 275 217 EMERGENCY MED SVCS CORP CL A 28,720 1,175 1,057 EMERGENT BIOSOLUTIONS INC COM 41,981 968 602 EMERITUS CORP 90,900 680 1,201 EMS TECHNOLOGIES INC COM 40,617 869 849 ENCORE ACQUISITION CO COM 22,226 787 686 ENDO PHARMACEUTICALS HLDGS INC 121,900 2,358 2,184 ENDURANCE SPECIALTY HLDGS LTD 94,100 3,760 2,757 ENERGEN CORP 171,950 7,513 6,861 ENERGY CONVERSION DEVICES INC 77,970 2,221 1,103 ENGLOBAL CORP 7,000 40 34 ENNIS INC COM 178,300 3,629 2,222 ENPRO INDS INC 85,300 2,529 1,536 ENSIGN GROUP INC COM 237,050 3,348 3,373 ENTEGRIS INC COM 405,933 904 1,104 ENTERCOM COMMUNICATIONS CORP 89,596 2,148 137 EPIQ SYS INC COM 36,600 473 563 EQUIFAX INC COM 111,660 4,136 2,914 ERESEARCH TECHNOLOGY INC 96,500 994 598
Appendix D
South Carolina Retirement SystemsEquity Holdings (000’s)
As of June 30, 2009

2008 - 2009 Annual Investment Report
62
Appendix D
South Carolina Retirement SystemsEquity Holdings (000's)
As of June 30, 2009
Issuer Shares Book Value Market ValueETHAN ALLEN INTERIORS INC COM 37,586 1,010 389 EURONET WORLDWIDE INC COM 125,084 2,006 2,425 EV3 INC COM 77,400 746 832 EVEREST RE GROUP INC COM 7,600 561 544 EXCO RES INC COM 334,630 3,576 4,323 EXIDE TECHNOLOGIES 105,747 642 394 EXPEDIA INC DEL 546,862 8,894 8,263 EXPEDITORS INTL WASH INC COM 469,085 11,282 15,639 EXTERRAN HLDGS INC COM 83,200 3,809 1,335 EXXON MOBIL CORP 305,400 20,827 21,351 EZCORP INC CL A NON VTG 278,933 3,177 3,007 F5 NETWORK INC COM 18,280 390 633 FAIRCHILD SEMICONDUCTOR INTL 552,604 3,986 3,863 FEDERAL MOGUL CORP CL A 111,310 772 1,052 FEDERATED INVS INC PA CL B 64,800 2,192 1,561 FGX INTERNATIONAL HOLDINGS 80,100 960 912 FIDELITY NATL INFORMATION SVCS 116,220 2,589 2,320 FIFTH ST FIN CORP COM 26,200 212 263 FIRS CASH FINANCIAL SERVICES 14,700 269 258 FIRST FINL BANCORP 92,839 851 699 FIRST FINL CORP IND COM 31,200 1,018 985 FIRST HORIZON NATIONAL CORP 173,036 1,612 2,076 FIRST MIDWEST BANCORP INC DEL 44,875 1,171 328 FIRST NIAGARA FINL GROUP INC 123,260 1,589 1,408 FIRST POTOMAC RLTY TR 62,343 826 608 FIRST REGL BANCORP 187,300 1,663 238 FIRSTENERGY CORP COM 54,700 2,948 2,120 FIRSTMERIT CORP 73,136 1,448 1,243 FIVE STAR QUALITY CARE INC 685,400 3,138 1,309 FLANDERS CORP 304,600 2,381 1,861 FLOW INTL INC 42,840 384 101 FLOWERS FOOD INC COM 112,300 2,372 2,453 FMC TECHNOLOGIES INC COM 27,000 794 1,015 FOOT LOCKER INC COM 45,626 276 478 FORCE PROTN INC 479,500 2,970 4,239 FOREST LABS INC CL A COM 68,000 2,287 1,707 FOREST OIL CORP 77,450 2,147 1,156 FORMFACTOR INC 47,046 1,138 813 FOSTER L B CO CL A 14,736 715 443 FOSTER WHEELER AG COM 35,300 1,142 838 FOUNDATION COAL HLDGS INC 36,160 592 1,016 FPIC INS GROUP INC COM 22,062 1,014 676 FRANKLIN RES INC COM 51,800 4,895 3,730 FREDS INC CL A 85,600 1,084 1,082 FTI CONSULTING INC COM 23,820 1,095 1,208
Appendix D
South Carolina Retirement SystemsEquity Holdings (000’s)
As of June 30, 2009
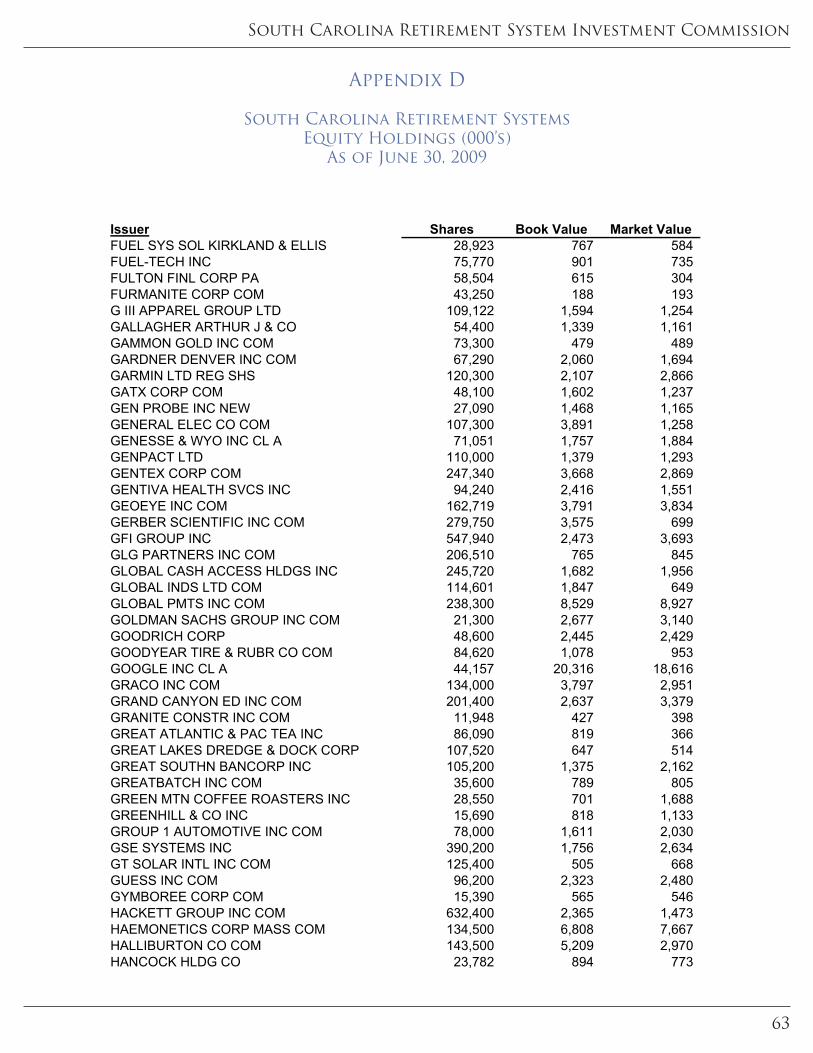
South Carolina Retirement System Investment Commission
63
Appendix D
South Carolina Retirement SystemsEquity Holdings (000's)
As of June 30, 2009
Issuer Shares Book Value Market ValueFUEL SYS SOL KIRKLAND & ELLIS 28,923 767 584 FUEL-TECH INC 75,770 901 735 FULTON FINL CORP PA 58,504 615 304 FURMANITE CORP COM 43,250 188 193 G III APPAREL GROUP LTD 109,122 1,594 1,254 GALLAGHER ARTHUR J & CO 54,400 1,339 1,161 GAMMON GOLD INC COM 73,300 479 489 GARDNER DENVER INC COM 67,290 2,060 1,694 GARMIN LTD REG SHS 120,300 2,107 2,866 GATX CORP COM 48,100 1,602 1,237 GEN PROBE INC NEW 27,090 1,468 1,165 GENERAL ELEC CO COM 107,300 3,891 1,258 GENESSE & WYO INC CL A 71,051 1,757 1,884 GENPACT LTD 110,000 1,379 1,293 GENTEX CORP COM 247,340 3,668 2,869 GENTIVA HEALTH SVCS INC 94,240 2,416 1,551 GEOEYE INC COM 162,719 3,791 3,834 GERBER SCIENTIFIC INC COM 279,750 3,575 699 GFI GROUP INC 547,940 2,473 3,693 GLG PARTNERS INC COM 206,510 765 845 GLOBAL CASH ACCESS HLDGS INC 245,720 1,682 1,956 GLOBAL INDS LTD COM 114,601 1,847 649 GLOBAL PMTS INC COM 238,300 8,529 8,927 GOLDMAN SACHS GROUP INC COM 21,300 2,677 3,140 GOODRICH CORP 48,600 2,445 2,429 GOODYEAR TIRE & RUBR CO COM 84,620 1,078 953 GOOGLE INC CL A 44,157 20,316 18,616 GRACO INC COM 134,000 3,797 2,951 GRAND CANYON ED INC COM 201,400 2,637 3,379 GRANITE CONSTR INC COM 11,948 427 398 GREAT ATLANTIC & PAC TEA INC 86,090 819 366 GREAT LAKES DREDGE & DOCK CORP 107,520 647 514 GREAT SOUTHN BANCORP INC 105,200 1,375 2,162 GREATBATCH INC COM 35,600 789 805 GREEN MTN COFFEE ROASTERS INC 28,550 701 1,688 GREENHILL & CO INC 15,690 818 1,133 GROUP 1 AUTOMOTIVE INC COM 78,000 1,611 2,030 GSE SYSTEMS INC 390,200 1,756 2,634 GT SOLAR INTL INC COM 125,400 505 668 GUESS INC COM 96,200 2,323 2,480 GYMBOREE CORP COM 15,390 565 546 HACKETT GROUP INC COM 632,400 2,365 1,473 HAEMONETICS CORP MASS COM 134,500 6,808 7,667 HALLIBURTON CO COM 143,500 5,209 2,970 HANCOCK HLDG CO 23,782 894 773
Appendix D
South Carolina Retirement SystemsEquity Holdings (000’s)
As of June 30, 2009

2008 - 2009 Annual Investment Report
64
Appendix D
South Carolina Retirement SystemsEquity Holdings (000's)
As of June 30, 2009
Issuer Shares Book Value Market ValueHANGER ORTHOPEDIC GROUP INC 244,800 3,291 3,327 HANOVER INS GROUP INC COM 122,706 5,112 4,676 HARRIS STRATEX NETWORKS INC 329,679 2,337 2,136 HARSCO CORP 91,600 2,496 2,592 HARVARD BIOSCIENCE INC 190,340 790 752 HAWAIIAN HLDGS INC 142,420 1,240 857 HCC INS HLDGS INC COM 101,500 2,529 2,437 HEALTH MGMT ASSOC INC NEW CL A 328,500 1,808 1,623 HEALTHCARE SVCS GROUP INC 256,038 2,259 4,578 HEALTHSOUTH CORP COM NEW 179,430 2,268 2,591 HEALTHSPRING INC COM 31,623 585 343 HEALTHTRONICS INC 895,100 4,453 1,799 HEARTLAND PMT SYS INC 21,200 181 203 HELEN OF TROY LTD NEW 61,500 1,173 1,033 HELIX ENERGY SOLUTIONS GROUP 55,838 600 607 HENRY JACK & ASSOC INC COM 210,000 3,450 4,358 HERBALIFE LTD USD COM SHS 158,300 6,076 4,993 HERCULES TECHNOLOGY GROWTH CAP 71,200 595 598 HEWITT ASSOCS INC 82,500 3,224 2,457 HEXCEL CORP NEW 118,866 1,225 1,133 HHGREGG INC COM 83,010 818 1,258 HIGHWOODS PPTYS INC COM 34,150 1,131 764 HIMAX TECHNOLOGIES INC 206,400 731 774 HITTITE MICROWAVE CORP 8,000 213 278 HOME DEPOT INC COM 66,600 1,813 1,574 HOME DIAGNOSTICS INC DEL COM 271,200 1,890 1,665 HOME FED BANCORP INC MD COM 66,940 668 682 HOME PROPERITIES INC 27,540 1,489 939 HOOPER HOLMES INC COM 1,241,700 3,889 546 HORIZON LINES INC CL A 325,820 3,699 1,258 HORNBECK OFFSHORE SVCS INC 33,072 1,604 707 HOUSTON WIRE & CABLE CO COM 117,900 1,640 1,404 HUB GROUP INC CL A 30,540 687 630 HUDSON CITY BANCORP INC COM 245,500 4,107 3,263 HUMAN GENOME SCIENCES INC COM 890,445 1,519 2,556 HUNT J B TRANS SVCS INC 23,950 714 732 HUNTINGTON BANCSHARES INC 301,929 2,407 1,262 HUNTSMAN CORP 89,082 234 448 I2 TECHNOLOGIES INC 306,750 4,987 3,850 IBERIABANK CORP COM 9,720 469 383 ICO HLDGS INC COM 472,000 3,163 1,284 ICONIX BRAND GROUP INC COM 103,190 1,544 1,587 ICU MED INC 62,300 1,713 2,564 IDACORP INC COM 84,706 2,615 2,214 IDENIX PHARMACEUTICALS INC 203,676 1,229 750
Appendix D
South Carolina Retirement SystemsEquity Holdings (000’s)
As of June 30, 2009

South Carolina Retirement System Investment Commission
65
Appendix D
South Carolina Retirement SystemsEquity Holdings (000's)
As of June 30, 2009
Issuer Shares Book Value Market ValueIESI-BFC LTD 29,300 301 341 IHS INC CL A 57,000 3,170 2,843 IMMUNOGEN INC 206,600 1,516 1,781 IMPAX LABORATORIES INC COM 137,950 829 1,015 INCYTE CORPORATION 173,480 385 571 INFINITY PPTY & CAS CORP 37,270 1,586 1,359 INFOGROUP INC COM 462,600 3,772 2,641 INFORMATICA CORP COM 252,270 3,626 4,337 INGLES MKTS INC CL A 80,100 1,227 1,221 INGRAM MICRO INC CL A COM 178,500 2,983 3,124 INLAND REAL ESTATE CORP 45,529 296 319 INNOPHOS HLDGS INC COM 94,113 2,105 1,590 INSIGHT ENTERPRISES INC COM 101,500 606 980 INSITUFORM TECHNOLOGIES INC 128,100 2,132 2,174 INSPIRE PHARMACEUTICALS INC 178,550 620 993 INTEGRA LIFESCIENCES HLDG CORP 54,614 2,288 1,448 INTEGRATED DEVICE TECH INC 170,426 1,414 1,029 INTERACTIVE BROKERS GROUP INC 318,089 8,511 4,940 INTERACTIVE DATA CORP COM 195,920 5,541 4,534 INTERCONTINENTAL EXCHANGE INC 159,670 15,075 18,241 INTERDIGITAL INC PA COM 55,700 1,619 1,361 INTERLINE BRANDS INC 190,080 2,941 2,600 INTERNATIONAL COAL GROUP INC 187,400 427 536 INTERNATIONAL GAME TECHNOLOGY 21,200 283 337 INTERNET CAP GROUP INC 27,410 165 184 INTERVAL LEISURE GROUP INC COM 106,733 756 995 INTEVAC INC COM 164,000 2,279 1,428 INTREPID POTASH INC COM 19,375 424 544 INVACARE CORP 152,750 3,838 2,696 INVERNESS MEDICAL INNOVATIONS 22,380 458 796 INVESCO LTD SHS 200,000 2,320 3,564 INVESTMENT TECH GRP COM NEW 36,507 948 744 IPC HOLDINGS LTD COM 89,000 2,447 2,433 IPC THE HOSPITALIST CO INC COM 46,344 898 1,237 IRON MTN INC PA COM 64,000 1,283 1,840 ISIS PHARMACEUTICALS 109,291 1,530 1,803 ISLE OF CAPRIS CASINOS INC 70,600 938 940 ITC HLDGS CORP 37,180 1,649 1,686 IXYS CORP DEL COM 97,000 1,062 982 J & J SNACK FOODS CORP 24,300 880 872 J2 GLOBAL COMMUNICATIONS INC 139,573 2,267 3,149 JABIL CIRCUIT INC COM 67,494 496 501 JACK IN THE BOX INC COM 73,900 1,705 1,659 JACKSON HEWITT TAX SVC INC 156,354 1,167 979 JANUS CAP GROUP INC 41,630 877 475
Appendix D
South Carolina Retirement SystemsEquity Holdings (000’s)
As of June 30, 2009

2008 - 2009 Annual Investment Report
66
Appendix D
South Carolina Retirement SystemsEquity Holdings (000's)
As of June 30, 2009
Issuer Shares Book Value Market ValueJARDEN CORP 96,000 2,324 1,800 JDA SOFTWARE GROUP INC 357,400 4,985 5,347 JM SMUCKER COMPANY 20,820 921 1,013 JOHNSON & JOHNSON COM 53,400 3,432 3,033 JONES APPAREL GROUP INC COM 291,450 2,550 3,127 JONES LANG LASALLE INC COM 101,180 5,033 3,312 JOS A BANK CLOTHIERS INC 81,560 2,582 2,811 JOY GLOBAL INC 81,900 3,489 2,925 JPMORGAN CHASE & CO COM 80,100 2,766 2,732 K12 INC COM 68,418 1,222 1,474 KAMAN CORP COMMON 203,700 3,189 3,392 KANSAS CITY SOUTHERN COM NEW 290,290 7,973 4,677 KB HOME COM 56,757 1,287 776 KBR INC COM 84,890 1,479 1,565 KBW INC COM 27,288 668 785 KENDLE INTL INC 177,414 3,854 2,172 KENEXA CORP 165,380 2,188 1,913 KENSEY NASH CORP 77,710 2,656 2,037 KEYCORP NEW COM 191,260 916 1,002 KEYNOTE SYS INC COM 55,200 468 422 KFORCE INC COM 75,100 699 621 KINDRED HEALTHCARE INC COM 47,200 699 584 KINETIC CONCEPTS INC 12,900 318 352 KING PHARMACEUTICALS INC COM 279,095 2,500 2,688 KINGSWAY FINL SVCS INC 262,700 1,874 754 KIRBY CORP COM 70,900 1,653 2,254 KIRKLANDS INC 53,010 445 637 KNIGHT CAP GROUP INC 127,940 2,010 2,181 KNIGHT TRANSN INC COM 49,180 743 814 KNOLOGY INC 22,839 186 197 KROGER CO COM 62,100 1,262 1,369 L-3 COMMUNICATIONS HLDGS INC 30,100 3,188 2,088 LABRANCHE & CO INC COM 35 0 0 LAM RESH CORP COM 98,610 2,829 2,564 LANCASTER COLONY CORP COM 57,500 1,954 2,534 LANCE INC 37,403 854 865 LANDEC CORP 261,200 1,391 1,774 LASALLE HOTEL PPTYS CUM SH BEN 46,200 554 570 LAWSON SOFTWARE INC NEW COM 165,900 825 931 LAZARD LTD SHS -A- 54,290 1,885 1,461 LEAP WIRELESS INTL INC 55,500 1,804 1,828 LEAPFROG ENTERPRISES INC CL A 263,160 1,646 603 LEARNING TREE INTL INC 229,600 3,038 2,365 LEGGETT & PLATT INC COM 61,992 1,229 944 LENNAR CORP CL A 102,660 932 995
Appendix D
South Carolina Retirement SystemsEquity Holdings (000’s)
As of June 30, 2009

South Carolina Retirement System Investment Commission
67
Appendix D
South Carolina Retirement SystemsEquity Holdings (000's)
As of June 30, 2009
Issuer Shares Book Value Market ValueLEXINGTON REALTY TRUST 124,604 2,172 424 LHC GROUP INC COM 77,710 1,953 1,726 LIFEPOINT HOSPS INC COM 44,956 1,501 1,180 LIMELIGHT NETWORKS INC COM 36,020 135 158 LINCARE HLDGS INC COM 14,300 367 336 LINCOLN EDL SVCS CORP 46,900 887 982 LINCOLN NATL CORP IND COM 70,300 2,362 1,210 LINEAR TECHNOLOGY CORP COM 124,200 2,796 2,900 LIONBRIDGE TECHNOLOGIES INC 881,700 5,707 1,622 LOGMEIN INC 4,560 73 73 LONGTOP FINL TECHNOLOGIES LTD 31,000 825 761 LSI INDS INC OHIO COM 281,000 4,479 1,531 LUBRIZOL CORP 75,530 3,193 3,573 LUMINEX CORP DEL COM 54,900 1,175 1,018 MAGELLAN HEALTH SVCS INC 171,097 6,443 5,615 MAIDEN HOLDINGS LTD SHS 89,670 428 588 MAIDENFORM BRANDS INC 240,000 2,933 2,753 MANITOWOC INC COM 89,222 578 469 MANTECH INTERNATIONAL CORP 137,230 5,921 5,906 MARATHON OIL CORP 153,200 4,218 4,616 MARINER ENERGY INC COM 181,452 3,552 2,132 MARKEL HOLDINGS 4,200 1,246 1,183 MARKETAXESS HLDGS INC 57,470 339 548 MARTEK BIOSCIENCES CORP 56,001 1,748 1,184 MARTEN TRANS LTD COM 32,437 554 673 MARTIN MARIETTA MATLS INC COM 28,000 2,878 2,209 MARVEL ENTMT INC 10,100 282 359 MASIMO CORP COM 3,540 95 85 MASTEC INC 131,712 1,737 1,544 MATRIX SVC CO 61,750 574 709 MATRIXX INITIATIVES INC 14,400 242 80 MAX CAPITAL GROUP LTD 229,100 4,561 4,229 MAXIMUS INC COM 11,790 467 486 MAXYGEN INC COM 219,420 1,505 1,475 MCAFEE INC 39,220 1,451 1,655 MCCORMICK & SCHMICKS SEAFOOD 211,800 1,717 1,612 MCG CAPITAL CORP 447,412 5,347 1,087 MCKESSON CORP COM 64,500 3,683 2,838 MCMORAN EXPLORATION CO 238,400 2,446 1,421 MDU RESOURCES GROUP INC 124,475 2,329 2,361 MEADOWBROOK INS GROUP INC 580,185 3,827 3,789 MEDIA GEN INC CL A 34,352 1,295 72 MEDIACOM COMMUNICATIONS CORP 58,338 315 298 MEDICAL ACTION INDS INC 260,700 3,284 2,985 MEDICAL PPTYS TR INC 326,450 3,783 1,982
Appendix D
South Carolina Retirement SystemsEquity Holdings (000’s)
As of June 30, 2009
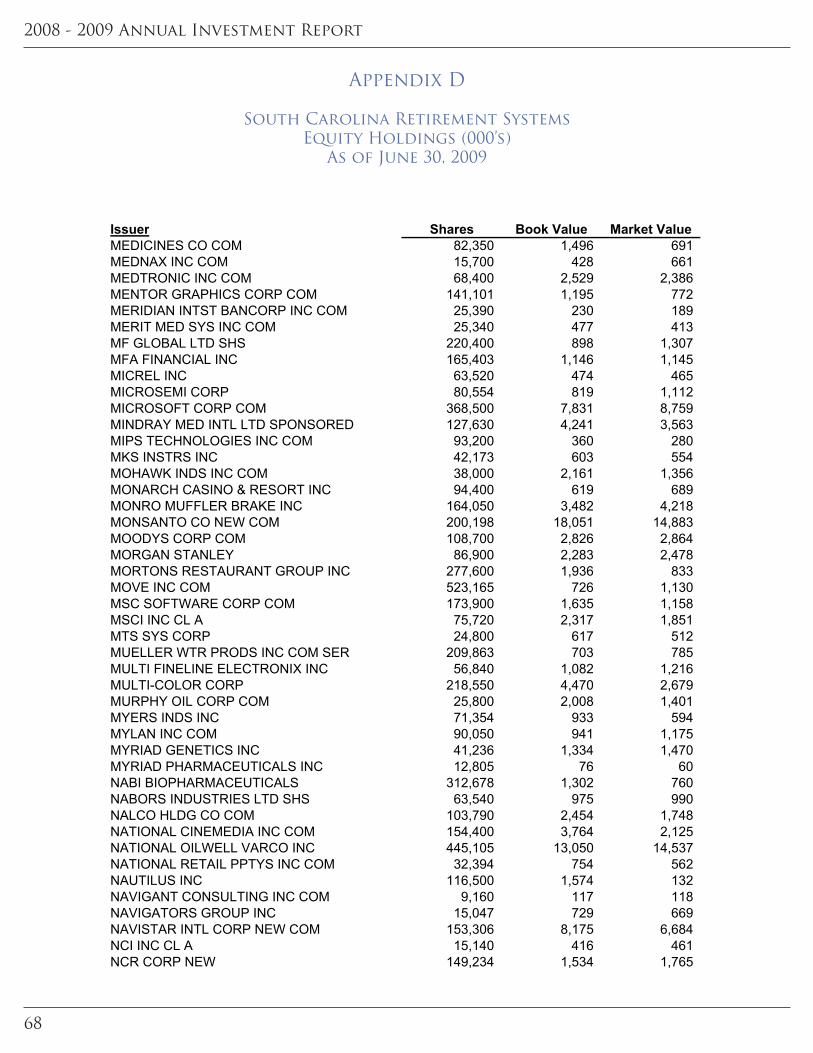
2008 - 2009 Annual Investment Report
68
Appendix D
South Carolina Retirement SystemsEquity Holdings (000's)
As of June 30, 2009
Issuer Shares Book Value Market ValueMEDICINES CO COM 82,350 1,496 691 MEDNAX INC COM 15,700 428 661 MEDTRONIC INC COM 68,400 2,529 2,386 MENTOR GRAPHICS CORP COM 141,101 1,195 772 MERIDIAN INTST BANCORP INC COM 25,390 230 189 MERIT MED SYS INC COM 25,340 477 413 MF GLOBAL LTD SHS 220,400 898 1,307 MFA FINANCIAL INC 165,403 1,146 1,145 MICREL INC 63,520 474 465 MICROSEMI CORP 80,554 819 1,112 MICROSOFT CORP COM 368,500 7,831 8,759 MINDRAY MED INTL LTD SPONSORED 127,630 4,241 3,563 MIPS TECHNOLOGIES INC COM 93,200 360 280 MKS INSTRS INC 42,173 603 554 MOHAWK INDS INC COM 38,000 2,161 1,356 MONARCH CASINO & RESORT INC 94,400 619 689 MONRO MUFFLER BRAKE INC 164,050 3,482 4,218 MONSANTO CO NEW COM 200,198 18,051 14,883 MOODYS CORP COM 108,700 2,826 2,864 MORGAN STANLEY 86,900 2,283 2,478 MORTONS RESTAURANT GROUP INC 277,600 1,936 833 MOVE INC COM 523,165 726 1,130 MSC SOFTWARE CORP COM 173,900 1,635 1,158 MSCI INC CL A 75,720 2,317 1,851 MTS SYS CORP 24,800 617 512 MUELLER WTR PRODS INC COM SER 209,863 703 785 MULTI FINELINE ELECTRONIX INC 56,840 1,082 1,216 MULTI-COLOR CORP 218,550 4,470 2,679 MURPHY OIL CORP COM 25,800 2,008 1,401 MYERS INDS INC 71,354 933 594 MYLAN INC COM 90,050 941 1,175 MYRIAD GENETICS INC 41,236 1,334 1,470 MYRIAD PHARMACEUTICALS INC 12,805 76 60 NABI BIOPHARMACEUTICALS 312,678 1,302 760 NABORS INDUSTRIES LTD SHS 63,540 975 990 NALCO HLDG CO COM 103,790 2,454 1,748 NATIONAL CINEMEDIA INC COM 154,400 3,764 2,125 NATIONAL OILWELL VARCO INC 445,105 13,050 14,537 NATIONAL RETAIL PPTYS INC COM 32,394 754 562 NAUTILUS INC 116,500 1,574 132 NAVIGANT CONSULTING INC COM 9,160 117 118 NAVIGATORS GROUP INC 15,047 729 669 NAVISTAR INTL CORP NEW COM 153,306 8,175 6,684 NCI INC CL A 15,140 416 461 NCR CORP NEW 149,234 1,534 1,765
Appendix D
South Carolina Retirement SystemsEquity Holdings (000’s)
As of June 30, 2009

South Carolina Retirement System Investment Commission
69
Appendix D
South Carolina Retirement SystemsEquity Holdings (000's)
As of June 30, 2009
Issuer Shares Book Value Market ValueNELNET INC CL A 60,205 853 818 NESS TECHNOLOGIES INC 229,661 1,912 898 NET 1 UEPS TECHNOLOGIES INC 341,950 6,522 4,647 NETAPP INC COM 155,100 2,121 3,059 NETEZZA CORP 247,876 2,165 2,062 NETFLIX COM INC 72,500 2,439 2,997 NETLOGIC MICROSYSTEMS INC 38,030 1,053 1,387 NETSCOUT SYS INC COM 60,100 873 564 NEUSTAR INC CL A 335,100 9,345 7,426 NEW JERSEY RES CORP 25,444 784 942 NEW YORK & CO INC 1,001,700 3,763 3,095 NEWBRIDGE BANCORP COM 255,000 2,436 528 NEWELL RUBBERMAID INC 108,470 1,186 1,129 NEWMARKET CORP 14,300 988 963 NEWPARK RES INC PAR $0.01 NEW 327,700 1,807 934 NICE SYSTEMS LTD SPONSORED ADR 130,100 4,311 3,001 NIKE INC CL B COM 42,800 1,957 2,216 NN INC COM 343,200 2,797 577 NOKIA CORP SPON ADR SER A COM 220,100 4,216 3,209 NORTHGATE MINERALS CORP 575,900 1,308 1,232 NORTHRIM BANCORP INC 86,600 1,225 1,205 NORTHROP GRUMMAN CORP COM 82,100 4,690 3,750 NORTHWEST NAT GAS CO COM 27,237 1,062 1,207 NORTHWESTERN CORP 42,400 759 965 NOVAMED INC COM 651,850 2,338 2,575 NOVATEL WIRELESS INC COM NEW 332,900 2,066 3,003 NOVELL INC 227,700 844 1,031 NOVEN PHARMACEUTICALS INC COM 113,320 1,208 1,620 NOVO NORDISK A S ADR 255,831 16,559 13,933 NPS PHARMACEUTICALS INC 97,171 618 453 NRG ENERGY INC 91,300 2,114 2,370 NU SKIN ENTERPRISES INC CL A 72,482 1,032 1,109 NUANCE COMMUNICATIONS INC 123,110 1,942 1,490 NUTRI SYSTEMS INC COM NEW 52,215 614 757 NUVASIVE INC 36,290 1,536 1,619 NV ENERGY INC COM 276,400 4,738 2,982 NVE CORP 13,800 531 671 NYSE EURONEXT COM 197,800 5,215 5,390 O CHARLEYS INC 219,100 2,995 2,027 OCEANEERING INTL INC COM 56,500 2,591 2,554 OCH ZIFF CAP MGMT GROUP CL A 108,880 965 970 OCWEN FINL CORP COM NEW 61,300 559 795 ODYSSEY HEALTHCARE INC COM 281,750 2,703 2,896 ODYSSEY RE HLDGS CORP COM 72,200 3,138 2,887 OGE ENERGY CORP COM 94,300 3,093 2,671
Appendix D
South Carolina Retirement SystemsEquity Holdings (000’s)
As of June 30, 2009

2008 - 2009 Annual Investment Report
70
Appendix D
South Carolina Retirement SystemsEquity Holdings (000's)
As of June 30, 2009
Issuer Shares Book Value Market ValueOIL STS INTL INC COM 49,070 1,333 1,188 OLD DOMINION FGHT LINES INC 42,885 1,184 1,440 OLD NATIONAL BANCORP IND 63,699 1,027 626 OMEGA HEALTHCARE INVS INC 30,500 382 473 OMNICARE INC COM 100,500 2,499 2,589 OMNITURE INC COM 109,680 2,636 1,378 OMNIVISION TECHNOLOGIES INC 49,300 530 512 OMNOVA SOLUTIONS INC COM 4,200 13 14 ONEOK INC NEW COM 94,560 4,315 2,789 OPLINK COMMUNICATIONS INC 30,000 359 342 OPTIONSXPRESS HLDGS INC 211,000 4,692 3,277 ORBITAL SCIENCES CORP COM 254,000 3,775 3,853 ORIENTAL FINL GROUP INC COM 103,700 1,525 1,006 ORION MARINE GROUP INC COM 46,820 523 890 ORITANI FINL CORP COM 8,900 128 122 ORTHOFIX INTERNATIONAL N V 85,040 2,124 2,127 OSI PHARMACEUTICALS INC COM 89,240 3,205 2,519 OSI SYSTEMS INC COM 32,000 538 667 OSIRIS THERAPEUTICS INC NEW 23,500 420 315 OUTDOOR CHANNEL HLDGS INC 210,350 1,851 1,241 OWENS & MINOR INC NEW 33,170 1,209 1,454 OWENS CORNING NEW COM 77,200 1,170 987 OWENS ILL INC NEW 91,600 3,693 2,566 PACIFIC CONTL CORP COM 67,400 777 818 PACWEST BANCORP DEL COM 148,958 3,194 1,960 PALL CORP COM 46,100 1,792 1,224 PALM INC NEW 133,360 1,126 2,211 PALOMAR MED TECH INC NEW COM 43,200 598 636 PANERA BREAD CO CL A COM 24,300 1,057 1,212 PANTRY INC 98,800 1,984 1,640 PAPA JOHNS INTL INC COM 80,500 1,987 1,996 PAR PHARMACEUTICAL COS INC 165,600 1,879 2,509 PARAMETRIC TECHNOLOGY CORP COM 93,590 1,450 1,094 PAREXEL INTL CORP 40,920 601 588 PARK NATL CORP COM 6,080 375 343 PARKER DRILLING CO COM 242,100 1,241 1,051 PARKER HANNIFIN CORP COM 32,700 1,914 1,405 PARTNERRE HLDGS LTD BERMUDA 87,900 6,343 5,709 PATTERSON UTI ENERGY INC COM 158,000 1,970 2,032 PAYCHEX INC COM 83,200 2,089 2,097 PC MALL INC COM 196,700 1,553 1,330 PC-TEL INC COM 15,272 95 82 PDL BIOPHARMA INC COM 279,900 2,282 2,211 PEGASYSTEM INC 166,600 2,347 4,395 PENN NATL GAMING INC COM 111,330 2,678 3,241
Appendix D
South Carolina Retirement SystemsEquity Holdings (000’s)
As of June 30, 2009
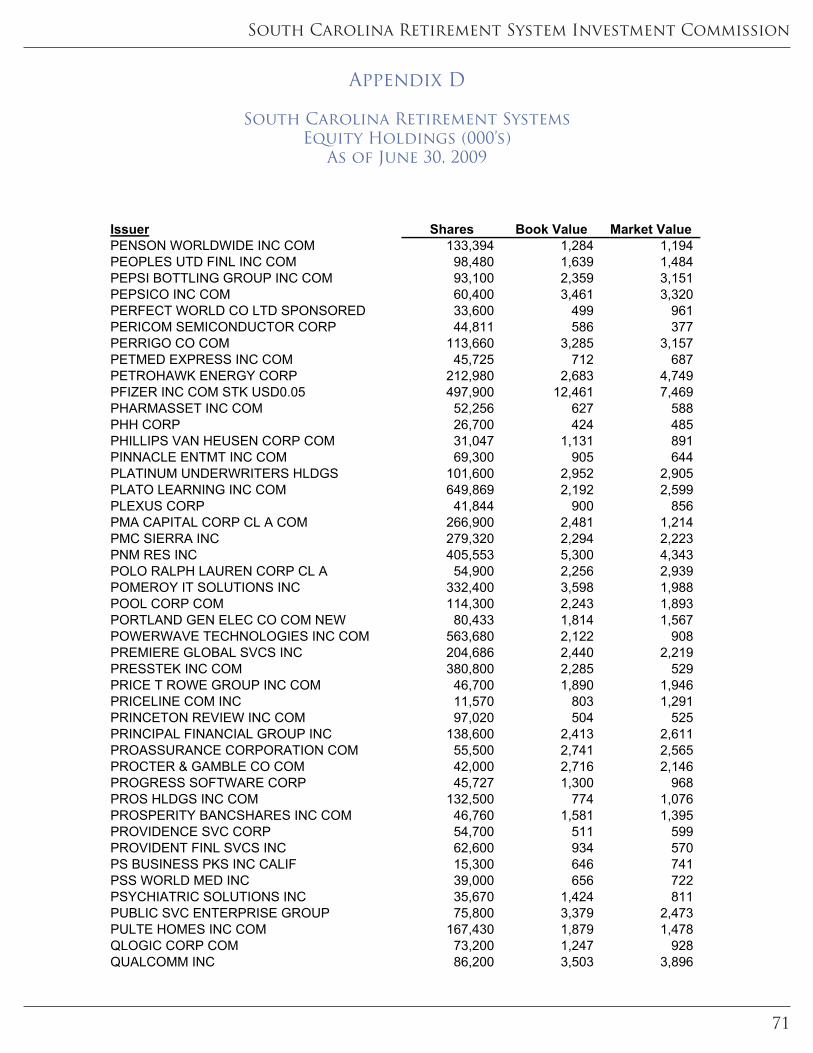
South Carolina Retirement System Investment Commission
71
Appendix D
South Carolina Retirement SystemsEquity Holdings (000's)
As of June 30, 2009
Issuer Shares Book Value Market ValuePENSON WORLDWIDE INC COM 133,394 1,284 1,194 PEOPLES UTD FINL INC COM 98,480 1,639 1,484 PEPSI BOTTLING GROUP INC COM 93,100 2,359 3,151 PEPSICO INC COM 60,400 3,461 3,320 PERFECT WORLD CO LTD SPONSORED 33,600 499 961 PERICOM SEMICONDUCTOR CORP 44,811 586 377 PERRIGO CO COM 113,660 3,285 3,157 PETMED EXPRESS INC COM 45,725 712 687 PETROHAWK ENERGY CORP 212,980 2,683 4,749 PFIZER INC COM STK USD0.05 497,900 12,461 7,469 PHARMASSET INC COM 52,256 627 588 PHH CORP 26,700 424 485 PHILLIPS VAN HEUSEN CORP COM 31,047 1,131 891 PINNACLE ENTMT INC COM 69,300 905 644 PLATINUM UNDERWRITERS HLDGS 101,600 2,952 2,905 PLATO LEARNING INC COM 649,869 2,192 2,599 PLEXUS CORP 41,844 900 856 PMA CAPITAL CORP CL A COM 266,900 2,481 1,214 PMC SIERRA INC 279,320 2,294 2,223 PNM RES INC 405,553 5,300 4,343 POLO RALPH LAUREN CORP CL A 54,900 2,256 2,939 POMEROY IT SOLUTIONS INC 332,400 3,598 1,988 POOL CORP COM 114,300 2,243 1,893 PORTLAND GEN ELEC CO COM NEW 80,433 1,814 1,567 POWERWAVE TECHNOLOGIES INC COM 563,680 2,122 908 PREMIERE GLOBAL SVCS INC 204,686 2,440 2,219 PRESSTEK INC COM 380,800 2,285 529 PRICE T ROWE GROUP INC COM 46,700 1,890 1,946 PRICELINE COM INC 11,570 803 1,291 PRINCETON REVIEW INC COM 97,020 504 525 PRINCIPAL FINANCIAL GROUP INC 138,600 2,413 2,611 PROASSURANCE CORPORATION COM 55,500 2,741 2,565 PROCTER & GAMBLE CO COM 42,000 2,716 2,146 PROGRESS SOFTWARE CORP 45,727 1,300 968 PROS HLDGS INC COM 132,500 774 1,076 PROSPERITY BANCSHARES INC COM 46,760 1,581 1,395 PROVIDENCE SVC CORP 54,700 511 599 PROVIDENT FINL SVCS INC 62,600 934 570 PS BUSINESS PKS INC CALIF 15,300 646 741 PSS WORLD MED INC 39,000 656 722 PSYCHIATRIC SOLUTIONS INC 35,670 1,424 811 PUBLIC SVC ENTERPRISE GROUP 75,800 3,379 2,473 PULTE HOMES INC COM 167,430 1,879 1,478 QLOGIC CORP COM 73,200 1,247 928 QUALCOMM INC 86,200 3,503 3,896
Appendix D
South Carolina Retirement SystemsEquity Holdings (000’s)
As of June 30, 2009

2008 - 2009 Annual Investment Report
72
Appendix D
South Carolina Retirement SystemsEquity Holdings (000's)
As of June 30, 2009
Issuer Shares Book Value Market ValueQUANTA SVCS INC COM 911,026 26,179 21,072 QUEST SOFTWARE INC COM 74,000 1,142 1,032 QUESTAR CORP 35,720 1,042 1,109 QUESTCOR PHARMACEUTICALS INC 699,116 4,581 3,496 QUICKSILVER RES INC COM 193,100 2,528 1,794 RADIANT SYS INC COM 72,300 581 600 RALCORP HLDGS INC NEW COM 266,493 15,083 16,235 RANGE RES CORP COM 141,830 5,684 5,873 RAYONIER INC COM 50,700 2,167 1,843 RAYTHEON CO COM NEW 62,500 2,849 2,777 RC2 CORP 53,004 1,500 701 REALTY INCOME CORP MD COM 48,024 1,235 1,053 RED BACK MNG INC COM 106,800 617 932 REGAL BELOIT CORP 10,270 323 408 REGIS CORP MINN 40,200 511 700 REHABCARE GROUP INC COM 259,410 5,063 6,208 REINSURANCE GROUP AMER INC COM 36,750 1,508 1,283 RELIANCE STL & ALUM CO 52,700 2,398 2,023 RENAISSANCE RE HOLDINGS LTD 145,500 6,994 6,772 RENT A CTR INC NEW COM 97,856 1,932 1,745 RES CARE INC COM 33,700 793 482 RESEARCH IN MOTION LTD COM 181,500 11,601 12,903 RESMED INC 150,000 6,210 6,110 RESOURCES CONNECTION INC COM 205,000 4,002 3,520 RF MICRO DEVICES INC COM 362,800 903 1,364 RIGEL PHARM INC 55,644 444 674 RITCHIE BROS AUCTIONEERS INC 60,970 1,136 1,430 RLI CORP 17,437 884 781 ROBBINS & MYERS INC COM 29,170 544 562 ROBERT HALF INTL INC COM 63,840 1,216 1,508 ROCK-TENN CO CL A 63,220 2,357 2,412 ROCKWOOD HLDGS INC 69,273 514 1,014 RPC INC 58,400 667 488 RTI BIOLOGICS INC COM 232,375 621 997 RUBY TUESDAY INC 95,600 538 637 RUDDICK CORP COM 52,609 1,792 1,233 RUDOLPH TECHNOLOGIES INC COM 187,008 929 1,032 RUSH ENTERPRISES INC CL A 186,263 2,509 2,170 RUSH ENTERPRISES INC CL B 10,685 178 106 RUSS BERRIE & CO INC COM 145,600 2,208 569 RYDER SYS INC COM 64,020 1,845 1,787 RYLAND GROUP INC 186,967 4,677 3,134 S1 CORP COM 180,100 1,401 1,246 SAFEWAY INC NEW COM 77,900 2,458 1,587 SAIA INC COM 35,982 465 648
Appendix D
South Carolina Retirement SystemsEquity Holdings (000’s)
As of June 30, 2009

South Carolina Retirement System Investment Commission
73
Appendix D
South Carolina Retirement SystemsEquity Holdings (000's)
As of June 30, 2009
Issuer Shares Book Value Market ValueSALESFORCE COM INC 28,820 846 1,100 SANDERSON FARMS INC 94,611 3,902 4,257 SANDISK CORP 39,870 580 586 SAPIENT CORP 380,570 2,506 2,394 SBA COMMUNICATIONS CORP COM 417,890 12,252 10,255 SCHOOL SPECIALTY INC-COM 180,200 5,494 3,642 SCIENTIFIC GAMES CORP CL A 108,520 1,715 1,710 SEABRIGHT INS HLDGS INC 438,805 5,569 4,445 SEACOR HOLDINGS INC COM 9,100 670 685 SEAGATE TECHNOLOGY 108,400 497 1,134 SEATTLE GENETICS INC COM 106,748 1,286 1,038 SEI INVESTMENT CO COM 83,200 2,332 1,501 SEMPRA ENERGY COM 63,300 2,646 3,142 SEMTECH CORP 27,200 293 433 SENIOR HSG PPTYS TR SH BEN INT 36,481 813 595 SENSIENT TECHNOLOGIES CORP COM 82,300 2,370 1,858 SEPRACOR INC 309,281 5,428 5,363 SERACARE LIFE SCIENCES INC DEL 300,335 2,103 342 SHAW COMMUNICATIONS INC CL B 137,600 1,435 2,320 SHAW GROUP INC COM 54,100 1,696 1,483 SHOE CARNIVAL INC 147,200 3,014 1,756 SIGNATURE BK NEW YORK N Y 16,500 476 450 SILGAN HLDGS INC COM 24,044 1,330 1,179 SIRONA DENTAL SYS INC COM 18,970 505 379 SKECHERS U S A INC CL A COM 85,624 553 837 SKILLSOFT PUB LTD CO SPON ADR 78,334 567 611 SKYWEST INC COM 27,719 468 283 SKYWORKS SOLUTIONS INC 391,213 3,056 3,830 SL GREEN REALTY CORP 20,460 1,770 469 SMART BALANCE INC COM 133,680 921 910 SMITH A O CORP 16,110 599 525 SMITHFIELD FOODS INC COM 57,080 673 797 SOLERA HLDGS INC COM 90,400 2,060 2,296 SOLUTIA INC COM NEW 128,073 456 738 SONIC AUTOMATIC INC COM 60,600 549 616 SOURCEFIRE INC COM 69,291 432 859 SOUTHSIDE BANCSHARES INC 11,700 263 268 SOUTHWEST BANCORP INC OKLA 108,300 1,956 1,057 SPARTAN MTRS INC 151,300 809 1,714 SPARTAN STORES INC CO 29,500 671 366 SPARTECH CORP NEW 366,233 3,527 3,366 SPSS INC 177,200 4,261 5,913 SRA INTERNATIONAL INC CL A 218,930 4,480 3,844 STAGE STORES INC COM NEW 219,414 2,895 2,435 STANCORP FINL GROUP INC COM 51,200 1,508 1,468
Appendix D
South Carolina Retirement SystemsEquity Holdings (000’s)
As of June 30, 2009

2008 - 2009 Annual Investment Report
74
Appendix D
South Carolina Retirement SystemsEquity Holdings (000's)
As of June 30, 2009
Issuer Shares Book Value Market ValueSTANDARD MICROSYSTEMS CORP 36,872 1,004 754 STANDARD PAC CORP NEW COM 102,735 665 209 STANDARD REGISTER CO COM 194,700 2,525 635 STANDEX INTL CORP COM 110,050 2,908 1,277 STANLEY INC COM 23,000 686 756 STARWOOD HOTELS & RESORTS COM 63,060 1,129 1,400 STEEL DYNAMICS INC COM 187,048 3,779 2,768 STEINER LEISURE LTD 20,300 568 620 STELLARONE CORP COM 108,842 1,801 1,410 STERICYCLE INC COM 82,000 3,576 4,225 STERIS CORP COM 78,027 2,293 2,035 STERLING BANCSHARES INC 237,888 1,613 1,506 STERLING CONSTR INC 132,850 2,404 2,027 STEWART INFORMATION SVCS CORP 53,081 931 756 STIFEL FINL CORP 33,860 1,396 1,628 STONE ENERGY CORP COM 133,100 926 988 STRAYER ED INC 15,000 2,639 3,272 STRYKER CORP 55,800 2,259 2,217 SUNOCO INC COM 115,900 3,853 2,689 SUNRISE SENIOR LIVING INC 176,690 420 292 SUNSTONE HOTEL INVS INC NEW 110,969 492 594 SUPERIOR ENERGY SERVICES INC 91,500 3,331 1,580 SUPERVALU INC COM 112,800 2,955 1,461 SUPPORT.COM INC 410,200 1,982 894 SUSQUEHANNA BANCSHARES INC PA 55,186 697 270 SVB FINL GROUP 100,000 2,478 2,722 SYBASE INC COM 197,440 5,063 6,188 SYMANTEC CORP COM 196,900 3,592 3,068 SYMMETRY MEDICAL INC 75,351 504 702 SYNAPTICS INC 78,100 1,873 3,019 SYNIVERSE HLDGS INC 188,181 2,927 3,017 SYNNEX CORP 14,500 360 362 SYNOVIS LIFE TECHNOLOGIES INC 26,300 539 546 SYSCO CORP COM 104,500 3,517 2,349 T-3 ENERGY SERVICES INC 32,381 1,088 386 TAKE-TWO INTERACTIVE SOFTWARE 161,100 1,401 1,526 TALEO CORP 112,425 1,848 2,054 TANGER FACTORY OUTLET CTR INC 34,690 1,162 1,125 TEAM INC 84,400 2,113 1,323 TECH DATA CORP COM 47,000 1,489 1,537 TEKELEC COM 238,050 3,535 4,006 TELECOMMUNICATION SYS INC CL A 88,480 587 629 TELEFLEX INC COM 34,200 1,766 1,533 TELEPHONE & DATA SYS INC COM 41,100 1,319 1,163 TELETECH HLDGS INC 41,890 343 635
Appendix D
South Carolina Retirement SystemsEquity Holdings (000’s)
As of June 30, 2009

South Carolina Retirement System Investment Commission
75
Appendix D
South Carolina Retirement SystemsEquity Holdings (000's)
As of June 30, 2009
Issuer Shares Book Value Market ValueTELLABS INC COM 301,260 1,202 1,726 TEMPLE INLAND INC COM 45,100 547 592 TEMPUR PEDIC INTL INC 163,060 1,511 2,131 TENNANT CO 51,300 1,463 943 TENNECO INC COM 58,328 539 618 TERADYNE INC COM 293,630 1,487 2,014 TERRA INDS INC 171,840 4,091 4,162 TESSERA TECHNOLOGIES INC 191,621 3,274 4,846 TETRA TECH INC NEW 43,902 1,028 1,258 TEVA PHARMACEUTICAL INDS ADR 357,035 11,940 17,616 TEXAS CAP BANCSHARES INC 118,800 1,964 1,838 TEXAS INSTRS INC COM 144,700 3,720 3,082 TEXAS ROADHOUSE INC 162,430 1,296 1,772 THERAVANCE INC 108,910 1,630 1,594 THOMAS PPTYS GROUP INC 370,900 1,787 582 THOMPSON CREEK METALS CO INC 227,200 1,983 2,322 TIBCO SOFTWARE INC COM 504,315 3,015 3,616 TICKETMASTER ENTERTAINMENT INC 117,650 896 755 TIFFANY & CO NEW COM 85,000 2,082 2,156 TIME WARNER CABLE INC COM 11,245 623 356 TIME WARNER INC NEW COM NEW 44,800 1,823 1,129 TIVO INC COM 65,760 651 689 TJX COS INC NEW COM 92,700 2,088 2,916 TNS INC 72,800 727 1,365 TOTAL SYS SVCS INC 150,900 3,423 2,021 TOWER GROUP INC 22,400 553 555 TRADESTATION GROUP INC COM 456,857 5,287 3,865 TRANSDIGM GROUP INC 153,100 5,258 5,542 TRANSOCEAN LTD ZUG NAMEN-AKT 43,000 3,001 3,194 TRAVELERS COS INC COM 112,800 6,005 4,629 TREEHOUSE FOODS INC 23,777 675 684 TRIQUINT SEMICONDUCTOR INC COM 59,200 239 314 TRIUMPH GROUP INC COM NEW 25,500 1,507 1,020 TRUE RELIGION APPAREL INC 87,648 1,470 1,955 TRUSTMARK CORP 18,760 438 362 TYCO INTERNATIONAL LTD SHS 104,400 2,224 2,712 TYLER TECHNOLOGIES INC 8,100 107 127 TYSON FOODS INC CL A 45,250 271 571 UCBH HLDGS INC COM 519,400 1,698 654 ULTRATECH INC COM 28,800 426 355 UNIFIRST CORP 26,100 790 970 UNION PAC CORP COM 60,000 3,252 3,124 UNITED FINL BANCORP INC MD COM 14,300 188 198 UNITED NATURAL FOODS INC 29,576 622 776 UNITED ONLINE INC COM 101,600 1,242 661
Appendix D
South Carolina Retirement SystemsEquity Holdings (000’s)
As of June 30, 2009

2008 - 2009 Annual Investment Report
76
Appendix D
South Carolina Retirement SystemsEquity Holdings (000's)
As of June 30, 2009
Issuer Shares Book Value Market ValueUNITED PARCEL SVC INC CL B 51,500 2,704 2,574 UNITED STATES STEEL CORP 44,200 1,142 1,580 UNITED STATIONERS INC COM 47,470 1,547 1,656 UNITED THERAPEUTICS CORP DEL 27,950 2,583 2,329 UNITEDHEALTH GROUP INC COM 109,500 3,140 2,735 UNITIL CORP 12,600 255 260 UNIVERSAL AMERICAN CORP 176,750 1,657 1,541 UNIVERSAL ELECTRS INC 108,400 1,603 2,186 UNIVERSAL HEALTH SVCS INC CL B 24,010 1,316 1,173 UNIVERSAL TECHNICAL INST INC 78,370 1,055 1,170 UNIVEST CORP PA 25,900 670 525 URBAN OUTFITTERS INC COM 108,460 2,807 2,266 URS CORP NEW 42,400 1,679 2,100 US BANCORP DEL COM NEW 682,326 15,537 12,227 USA MOBILITY INC 33,800 391 431 UTI WORLDWIDE INC SHS 377,000 6,722 4,298 VALASSIS COMMUNICATIONS INC 105,870 628 647 VALEANT PHARMACEUTICALS INTL 121,985 2,147 3,137 VALERO ENERGY CORP COM NEW 206,500 3,965 3,488 VALMONT INDS INC COM 13,900 1,416 1,002 VALUECLICK INC COM 143,100 950 1,505 VARIAN INC COM 25,501 1,269 1,006 VARIAN SEMICONDUCTOR EQUIPMENT 262,797 7,070 6,305 VCA ANTECH INC 66,470 1,451 1,775 VECTREN CORP COM 151,198 4,195 3,543 VEECO INSTRS INC DEL COM 98,624 1,705 1,143 VERIFONE HLDGS INC 194,205 1,805 1,458 VERISIGN INC COM 86,000 1,683 1,593 VERIZON COMMUNICATIONS COM 195,200 6,493 5,998 VIASAT INC COM 35,230 744 903 VIRGIN MEDIA INC 162,500 1,256 1,519 VIRGIN MOBILE USA INC CL A 131,040 523 527 VIROPHARMA INC COM 38,900 442 231 VISA INC COM CL A 250,610 14,359 15,603 VISHAY INTERTECHNOLOGY INC 156,000 866 1,059 VISTAPRINT LIMITED 71,560 2,007 3,052 VOLCANO CORP COM 69,120 1,022 966 WABCO HLDGS INC COM 112,000 3,839 1,982 WADDELL & REED FINL INC CL A 65,740 841 1,734 WALGREEN CO 387,445 16,569 11,391 WARREN RES INC 138,800 1,399 340 WASHINGTON FEDERAL INC 47,836 1,002 622 WASHINGTON REAL ESTATE INVT TR 46,292 1,418 1,036 WATSCO INC CL A 31,780 1,389 1,555 WD 40 CO 102,300 3,147 2,967
Appendix D
South Carolina Retirement SystemsEquity Holdings (000’s)
As of June 30, 2009

South Carolina Retirement System Investment Commission
77
Appendix D
South Carolina Retirement SystemsEquity Holdings (000's)
As of June 30, 2009
Issuer Shares Book Value Market ValueWEB COM GROUP INC COM 280,800 2,021 1,581 WEBSTER FINL CORP WATERBURY CT 62,131 322 500 WEIS MKTS INC 24,700 801 828 WELLCARE HEALTH PLANS INC 135,000 5,558 2,496 WELLPOINT INC 103,200 4,472 5,252 WELLS FARGO & CO NEW COM 268,500 5,849 6,514 WERNER ENTERPRISES INC COM 33,826 731 613 WEST COAST BANCORP ORE NEW 109,500 1,508 223 WESTAMERICA BANCORPORATION COM 19,150 1,037 950 WESTAR ENERGY INC 139,700 3,148 2,622 WESTERN ALLIANCE 154,032 932 1,054 WESTERN DIGITAL CORP DEL COM 53,500 1,176 1,418 WESTERN REFNG INC COM 111,900 811 790 WESTERN UN CO COM 713,731 15,793 11,705 WET SEAL INC CL A COM 471,600 2,506 1,448 WEYCO GROUP INC 70,875 1,952 1,637 WHITING PETE CORP NEW 52,949 2,399 1,862 WHITNEY HLDG CO 48,520 624 444 WHOLE FOODS MKT INC 71,520 889 1,357 WILEY JOHN & SONS INC CL A 72,500 2,512 2,411 WILLBROS GROUP INC DEL COM 86,550 1,819 1,083 WILLIAMS SONOMA INC COM 102,900 1,157 1,221 WILLIS GROUP HOLDINGS LTD SHS 93,400 2,852 2,403 WILLIS LEASE FIN CORP 255,500 2,036 3,352 WIND RIV SYS INC 110,700 1,253 1,269 WINTRUST FINL CORP COM 16,850 339 271 WMS INDS INC COM 142,355 3,504 4,486 WORLD ACCEP CORP 81,184 1,699 1,616 WORTHINGTON INDS INC COM 35,700 490 457 WRIGHT EXPRESS CORP 291,140 6,616 7,415 WYNN RESORTS LTD 27,210 647 961 XENOPORT INC 49,320 2,065 1,143 XTO ENERGY INC COM 74,800 4,501 2,853 YAHOO INC 224,600 6,559 3,517 YAMANA GOLD INC 110,600 597 978 YINGLI GREEN ENERGY HLDG CO 78,180 485 1,059 YUM BRANDS INC 70,300 2,000 2,344 ZALE CORP NEW COM 239,100 1,021 823 ZIONS BANCORPORATION 27,685 400 320 ZORAN CORP 146,100 1,431 1,592 Total Domestic Equity 2,494,441 2,246,449
Appendix D
South Carolina Retirement SystemsEquity Holdings (000’s)
As of June 30, 2009

2008 - 2009 Annual Investment Report
78
Appendix D
South Carolina Retirement SystemsEquity Holdings (000's)
As of June 30, 2009
Issuer Shares Book Value Market Value
ANWORTH MTG ASSET CORP PFD SER 63,600 1,505 1,361 CARRIAGE SVCS CAP TR TERM INC 19,600 522 588 Total Convertible Preferred 2,027 1,949
Total Physical Equity 2,496,467$ 2,248,399$
Appendix D
South Carolina Retirement SystemsEquity Holdings (000’s)
As of June 30, 2009

South Carolina Retirement System Investment Commission
79
Appendix E
South Carolina Retirement SystemsAlternative Investments (000's)
As of June 30, 2009
Shares/Par Base Cost Base PriceBase Market
ValuePrivate EquityAQUILINE FINANCIAL SERVICES 45,987 54,609$ 1.00$ 45,987$PANTHEON USA FUND VII LP 29,224 36,875 1.00 29,224PANTHEON EUROPE FUND V'A'L P 15,571 30,358 1.40 21,841APAX EUROPE VII A LP 9,850 23,433 1.40 13,816BRIDGEPOINT EUROPE IV A 2,026 4,267 1.40 2,842CAROUSEL CAPITAL PARTNERS III LP 26,342 19,273 1.00 26,342CRESTVIEW CAPITAL PARTNERS LP 2,135 2,135 1.00 (539)PAUL CAPITAL PARTNERS IX LP 31,152 39,355 1.00 31,152WARBURG PINCUS PRIVATE EQUITY 25,250 37,250 1.00 25,250CVE-KAUFFMAN ENDOWMENT FUND I LP 8,847 10,600 1.00 8,847CLAYTON DUBILIER & RICE VIII 569 900 1.00 569LEXINGTON CAPITAL PARTNERS LP 4,095 3,922 1.00 4,095GS MEZZANINE PARTNERS V 24,472 28,989 1.00 24,472SQUARE 1 VENTURES LP 5,990 7,500 1.00 5,990NORTHSTAR MEZZANINE PARTNERS V 12,366 15,556 1.00 12,366NB SECONDARY OPPORTUNITIES 8,157 7,394 1.00 8,157WELSH CARSON ANDERSON & STOWE XI 472 472 1.00 (397)VENTURE INVESTMENT MANAGERS LP 2,544 3,000 1.00 2,544INDUSTRY VENTURES FUND V, LP 11,471 10,000 1.00 11,471MORGAN STANLEY - PRIVATE MARKETS 97,969 97,969 1.00 97,969TCW - PRIVATE MARKETS 56,973 56,973 1.00 56,973APOLLO - PRIVATE MARKETS 33,879 33,879 1.00 33,879GOLDMAN SACHS - PRIVATE MARKETS 75,363 75,363 1.00 75,363Total Private Equity 530,705 600,073 538,214
Hedge FundsPURE ALPHA FUND II SERIES CXLI 158 196,447 1,242.71 196,237FRONTPOINT MULTI-STRATEGY FUND 350,000 350,000 1.03 359,804MORGAN STANLEY COMPLETION 608,709 608,709 0.88 509,750GAM USA INC 5,843 644,840 97.61 570,319DUETSCHE BANK (CAYMAN) LIMITED 3,026 302,595 84.61 256,021GROSVENOR PURE ALPHA STRATEGY 650,000 650,000 83.93 545,534GOTTEX MARKET NEUTRAL PLUS SC 7,500 750,000 88.75 665,625ABSOLUTE RECOVERY HEDGE FD LP 225,000 225,000 0.93 210,281MORGAN STANLEY - HEDGE FUND 464,865 464,865 1.00 464,865MARINER - HEDGE FUND 295,078 295,078 1.00 295,078GOLDMAN SACHS - HEDGE FUND 58,996 58,996 1.00 58,996DE SHAW - HEDGE FUND 333,510 375,544 1.03 344,901Total Hedge Funds 3,002,685 4,922,073 4,477,409
Appendix E
South Carolina Retirement SystemsAlternative Investments (000’s)
As of June 30, 2009

2008 - 2009 Annual Investment Report
80
Appendix E
South Carolina Retirement SystemsAlternative Investments (000's)
As of June 30, 2009
Shares/Par Base Cost Base PriceBase Market
ValueGlobal Asset AllocationGMO STRATEGIC OPPURTUNITY 13,975 315,546 16.96 237,015PUTNAM GLOBAL TACTICAL ASSET 8,618 466,809 46.33 399,293BRIDGEWATER ALL WEATHER 670 667,296 888.02 594,550GMO MULTI-STRATEGY FUND 78,120 78,120 1.19 92,835Total Global Asset Allocation 101,383 1,527,771 1,323,693
Opportunistic CreditING CLARION DEBT OPP FUND III 21,108 20,000 1.00 21,108AVENUE EUROPE SPECIAL SITUATIONS 66,678 89,041 1.40 93,526AG CAPITAL RECOVERY PARTNERS VI LP 29,987 36,000 1.00 29,987SANKATY CREDIT OPP IV 132,887 120,000 1.00 132,887SELENE RES MORTGAGE OPP FUND, LP 38,323 36,550 1.00 38,323TCW - OPP CREDIT 294,466 294,466 1.00 294,466MARINER - OPP CREDIT 268,920 268,920 1.00 268,920APOLLO - OPP CREDIT 22,811 22,811 1.00 22,811GOLDMAN SACHS - OPP CREDIT 71,974 71,974 1.00 71,974DE SHAW - OPP CREDIT 35,000 35,000 0.97 33,937Total Opportunistic Credit 982,154 994,761 1,007,939
Real EstateMORGAN STANLEY - REAL ASSETS 41,533 41,533 1.00 41,533GOLDMAN SACHS - REAL ASSETS 85,163 85,163 1.00 85,163Total Real Estate 126,696 126,696 126,696
Total Alternatives 4,743,623 8,171,374$ 7,473,951$
Appendix E
South Carolina Retirement SystemsAlternative Investments (000’s)
As of June 30, 2009

South Carolina Retirement System Investment Commission
81
Appendix F
South Carolina Retirement SystemsSwap Holdings (000's)
As of June 30, 2009
Asset Class Counterparty BenchmarkOriginal Trade
Notional Current NotionalUnrealized Gain / Loss Since Trade
Domestic Equity Barclays S&P 500 Index 111,682$ 131,823$ 20,140$ Morgan Stanley Russell 2000 150,000 143,627 (6,373)
261,682 275,450 13,767
International Equity UBS MSCI EAFE + Canada Index 250,000 272,104 22,104 Morgan Stanley MSCI EAFE + Canada Index 250,000 271,034 21,034 Morgan Stanley MSCI EAFE + Canada Index 250,000 299,294 49,294 UBS MSCI EAFE + Canada Index 100,000 121,101 21,101 BNP Paribas MSCI EAFE + Canada Index 119,408 126,637 7,229 Deutsche Bank MSCI EAFE + Canada Index 178,168 191,453 13,285 Deutsche Bank MSCI EAFE + Canada Index 122,401 164,201 41,800
1,269,977 1,445,825 175,848
Emerging Equity Morgan Stanley MSCI Emerging Markets Index 250,000 180,988 (69,012) Credit Suisse MSCI Emerging Markets Index 225,000 223,540 (1,460) BNP Paribas MSCI Emerging Markets Index 61,813 95,173 33,360 J.P. Morgan MSCI Emerging Markets Index 173,565 258,377 84,813 Morgan Stanley MSCI Emerging Markets Index 77,199 115,073 37,874 J.P. Morgan MSCI Emerging Markets Index 42,934 66,159 23,224 J.P. Morgan MSCI Emerging Markets Index 49,235 71,673 22,438 Deutsche Bank MSCI Emerging Markets Index 132,325 178,284 45,958
1,012,071 1,189,267 177,196
Emerging Debt J.P. Morgan J.P. Morgan EMBI Plus 103,860 116,323 12,463 J.P. Morgan J.P. Morgan EMBI Plus 151,860 166,231 14,371 J.P. Morgan J.P. Morgan EMBI Plus 164,720 166,202 1,482
420,440 448,756 28,316
Gain / Loss realized during Period1 - - (89,209)
Grand Totals 2,964,170$ 3,359,298$ 305,918$
Appendix F
South Carolina Retirement SystemsSwap Holdings (000’s)
As of June 30, 2009

2008 - 2009 Annual Investment Report
82
Appendix F
South Carolina Retirement SystemsSwap Holdings (000's)
As of June 30, 2009
Asset Class Counterparty BenchmarkOriginal Trade
Notional Current NotionalUnrealized Gain / Loss Since Trade
Collateral held at Broker2
Morgan Stanley 64,210,000 Credit Suisse 57,330,000 UBS 15,230,000 Deutsche Bank 62,729,000 J.P. Morgan 57,245,000 BNP Paribas 14,140,000
1Realized gains from 03/31/09 through 06/30/09 are removed from unrealized gaines2Negative amounts indicate collateral held at broker on our behalf; amounts not in thousands
Appendix F
South Carolina Retirement SystemsSwap Holdings (000’s)
As of June 30, 2009
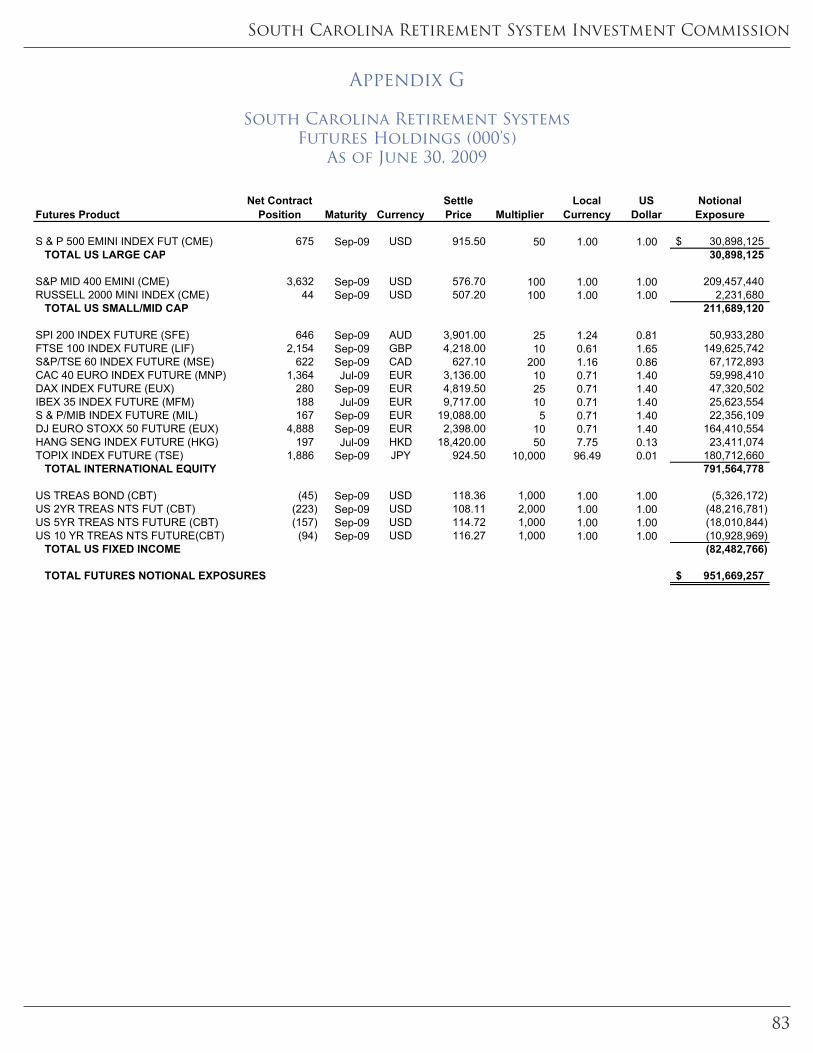
South Carolina Retirement System Investment Commission
83
Appendix G
South Carolina Retirement SystemsFutures HoldingsAs of June 30, 2009
Futures Product Maturity Currency Multiplier
S & P 500 EMINI INDEX FUT (CME) 675 Sep-09 USD 915.50 50 1.00 1.00 30,898,125$ TOTAL US LARGE CAP 30,898,125
S&P MID 400 EMINI (CME) 3,632 Sep-09 USD 576.70 100 1.00 1.00 209,457,440 RUSSELL 2000 MINI INDEX (CME) 44 Sep-09 USD 507.20 100 1.00 1.00 2,231,680 TOTAL US SMALL/MID CAP 211,689,120
SPI 200 INDEX FUTURE (SFE) 646 Sep-09 AUD 3,901.00 25 1.24 0.81 50,933,280 FTSE 100 INDEX FUTURE (LIF) 2,154 Sep-09 GBP 4,218.00 10 0.61 1.65 149,625,742 S&P/TSE 60 INDEX FUTURE (MSE) 622 Sep-09 CAD 627.10 200 1.16 0.86 67,172,893 CAC 40 EURO INDEX FUTURE (MNP) 1,364 Jul-09 EUR 3,136.00 10 0.71 1.40 59,998,410 DAX INDEX FUTURE (EUX) 280 Sep-09 EUR 4,819.50 25 0.71 1.40 47,320,502 IBEX 35 INDEX FUTURE (MFM) 188 Jul-09 EUR 9,717.00 10 0.71 1.40 25,623,554 S & P/MIB INDEX FUTURE (MIL) 167 Sep-09 EUR 19,088.00 5 0.71 1.40 22,356,109 DJ EURO STOXX 50 FUTURE (EUX) 4,888 Sep-09 EUR 2,398.00 10 0.71 1.40 164,410,554 HANG SENG INDEX FUTURE (HKG) 197 Jul-09 HKD 18,420.00 50 7.75 0.13 23,411,074 TOPIX INDEX FUTURE (TSE) 1,886 Sep-09 JPY 924.50 10,000 96.49 0.01 180,712,660 TOTAL INTERNATIONAL EQUITY 791,564,778
US TREAS BOND (CBT) (45) Sep-09 USD 118.36 1,000 1.00 1.00 (5,326,172) US 2YR TREAS NTS FUT (CBT) (223) Sep-09 USD 108.11 2,000 1.00 1.00 (48,216,781) US 5YR TREAS NTS FUTURE (CBT) (157) Sep-09 USD 114.72 1,000 1.00 1.00 (18,010,844) US 10 YR TREAS NTS FUTURE(CBT) (94) Sep-09 USD 116.27 1,000 1.00 1.00 (10,928,969) TOTAL US FIXED INCOME (82,482,766)
TOTAL FUTURES NOTIONAL EXPOSURES 951,669,257$
Net Contract Position
SettlePrice
LocalCurrency
USDollar
NotionalExposure
Appendix G
South Carolina Retirement SystemsFutures Holdings (000’s)
As of June 30, 2009

2008 - 2009 Annual Investment Report
84
Annualized ReturnMethodology: The Modified Dietz method is used when analyzing monthly returns. This calculation method is used to determine the performance of an investment portfolio based on time-weighted cash flows. In the absence of daily port-folio valuations, the Modified Dietz method weights individual cash flows by the amount of time that those cash flows are held, or absent, from the portfolio. The returns are annualized by taking the nth root of the product of the individual monthly returns where n is the length of the measurement period.
Meaning: The annualized rate of return for an investment is the multi-period geometric average return for a period greater than 1 year, which is calculated to determine a comparable annual return. Importance: Annualized returns allows for the performance of investments to be compared for time periods other than one year. The result is an approximation of a time-weighted return. Annual returns are calculated by rolling up indi-vidual monthly returns. Returns for periods greater than one year.
Annualized Standard DeviationMethodology: Typically standard deviation is calculated using quarterly returns. The square of all of the deviations from the mean in a data set are summed up, and then divided by the total number of points in that data set to get the vari-ance. The square root of the variance is then taken to arrive at the standard deviation. For periods greater than 1 year, the formula is annualized by multiplying the formula by 2.
Meaning: Standard deviation is a statistical measure of the movement around an average.
Importance: Standard deviation is used as a proxy for the level of risk or volatility of an investment or portfolio. The higher the standard deviation the riskier or more volatile the investment, and vice versa.
Sharpe RatioMethodology: The Sharpe Ratio takes portfolio return for measurement period, subtracts the risk-free rate (90 day T-Bill Return) for that same time period, and divides the result by the portfolio standard deviation for that time period.
Meaning: The Sharpe Ratio illustrates an investment’s risk-adjusted return, and is used to assess the relative perfor-mance of investments per unit of risk taken. The Sharpe Ratio indicates the unit of excess return generated per unit of risk taken. A Sharpe Ratio above 1 is favorable, because it indicates that the manager is generating more return for every one unit of risk taken. A Sharpe Ratio less than 1 indicates that returns are coming at a relatively high level of risk. A negative Sharpe Ratio indicates that a risk-free asset would perform better than the security being analyzed, relative to the amount of risk taken.
Importance: The Sharpe Ratio indicates whether an investment’s returns can be attributed to good investment deci-sions or result from taking on excess risk.
* Source: NEPC
Appendix H
Explanation of Statistical Concepts*

South Carolina Retirement System Investment Commission
85
R-SquaredMethodology: Calculate R-Squared by taking the square-root of the correlation coefficient since there is only one inde-pendent variable. Meaning: A statistical measure that represents the percentage that the movements of an investment can be explained by the movements of its respective index. Importance: Values for R-Squared range from 0 to 1. 0 indicates that 0% of the movement in the investment can be explained by movements in the benchmark (no correlation). 1 means that 100% of the movement in the investment can be explained by movements in the benchmark (perfect correlation).
Annualized AlphaMethodology: Manager/Portfolio return for a given time period minus manager/portfolio benchmark return for that same time period.
Meaning: Alpha is the excess return of an investment as compared to its respective index.
Importance: Alpha allows one to determine whether or not active investment decisions have been beneficial. Positive Alpha indicates that active investment decisions have yielded a return greater than what at passive investment would yield, and vice versa.
CorrelationMethodology: Covariance is calculated by multiplying the deviations of two data sets from their respective means, sum-ming the multiples, and dividing by the total number of data points.
The covariance is then divided by the standard deviations of both data sets.
Meaning: Correlation measures the degree to which two investments tend to move in tandem with one another. This number is always between -1 and 1. A correlation of 1 indicates that the investments are perfectly correlated and move in lock-step with one another. A correlation of -1 indicates that the investments are perfectly negatively correlated and that the investments move exactly opposite to one another.
Importance: Correlation among assets in a portfolio affects the level of diversification in that portfolio. A portfolio that holds investments that are not highly correlated is considered more diversified than one that holds investments that are highly correlated.
=


Total Printing Cost: $1,732Total Number Printed: 100
Cost Per Unit: $17.32

SOUTH CAROLINA RETIREMENT SYSTEM INVESTMENT COMMISSION
PO BOX 11960COLUMBIA, SC 29211