retailing - vietnamantconsult.vn/wp-content/uploads/branchreport_04042011_retailing...retailing...
TRANSCRIPT
Retailing - Vietnam
Euromonitor International : Country Market Insight
January 2011

Retailing Vietnam
Euromonitor International Page i
List of Contents and Tables
Executive Summary ..................................................................................................................................................... 1 Retailing Is Still One of the Most Attractive Industries ................................................................................................ 1 Economic Recovery Boosts the Overall Growth ........................................................................................................... 1 Nongrocery Retailing Gains Share ............................................................................................................................... 1 Modern Trade Channels Are the Key Driving Force .................................................................................................... 1 A Positive Outlook Is on the Horizon ............................................................................................................................ 1
Key Trends and Developments ................................................................................................................................... 1 Vietnam’s Retail Industry Grows Thanks To Positive Economic Outlook ................................................................... 1 Internet Retailing Still Negligible But Gaining Popularity .......................................................................................... 2 Local Products Get A Boost From the Government ..................................................................................................... 3 Private Label Driven by Grocery Retailers .................................................................................................................. 4 Retailers Focus on Improving Shopping Environment and Convenience .................................................................... 5 Environmental Issues Raise Higher Concerns From Retailers .................................................................................... 6
Market Indicators ........................................................................................................................................................ 6 Table 1 Employment in Retailing 2005-2010 .................................................................................... 7
Market Data ................................................................................................................................................................. 7 Table 2 Sales in Retailing by Category: Value 2005-2010 ............................................................... 7 Table 3 Sales in Retailing by Category: % Value Growth 2005-2010 .............................................. 7 Table 4 Sales in Retailing by Grocery vs Non-Grocery 2005-2010 .................................................. 7 Table 5 Sales in Store-Based Retailing by Category: Value 2005-2010 ........................................... 7 Table 6 Sales in Store-Based Retailing by Category: % Value Growth 2005-2010 ......................... 8 Table 7 Sales in Non-Grocery Retailing by Category: Value 2005-2010 ......................................... 8 Table 8 Sales in Non-Grocery Retailing by Category: % Value Growth 2005-2010 ....................... 8 Table 9 Sales in Non-store Retailing by Category: Value 2005-2010 .............................................. 8 Table 10 Sales in Non-store Retailing by Category: % Value Growth 2005-2010 ............................ 9 Table 11 Retailing Company Shares: % Value 2006-2010 ................................................................. 9 Table 12 Retailing Brand Shares: % Value 2007-2010 ..................................................................... 10 Table 13 Store-Based Retailing Company Shares: % Value 2006-2010 .......................................... 10 Table 14 Store-Based Retailing Brand Shares: % Value 2007-2010 ................................................ 11 Table 15 Non-Grocery Retailers Company Shares: % Value 2006-2010 ......................................... 11 Table 16 Non-Grocery Retailers Brand Shares: % Value 2007-2010 ............................................... 12 Table 17 Non-store Retailing Company Shares: % Value 2006-2010 .............................................. 13 Table 18 Non-store Retailing Brand Shares: % Value 2007-2010 .................................................... 13 Table 19 Forecast Sales in Retailing by Category: Value 2010-2015 ............................................... 13 Table 20 Forecast Sales in Retailing by Category: % Value Growth 2010-2015 ............................. 13 Table 21 Forecast Sales in Store-Based Retailing by Category: Value 2010-2015 .......................... 14 Table 22 Forecast Sales in Store-Based Retailing by Category: % Value Growth 2010-
2015 ..................................................................................................................................... 14 Table 23 Forecast Sales in Non-Grocery Retailing by Category: Value 2010-2015 ........................ 14 Table 24 Forecast Sales in Non-Grocery Retailing by Category: % Value Growth
2010-2015 ............................................................................................................................ 14 Table 25 Forecast Sales in Non-store Retailing by Category: Value 2010-2015 ............................. 15 Table 26 Forecast Sales in Non-store Retailing by Category: % Value Growth 2010-
2015 ..................................................................................................................................... 15
Appendix ..................................................................................................................................................................... 15 Operating Environment ............................................................................................................................................... 15 Cash-and-carry ............................................................................................................................................................ 17

Retailing Vietnam
Euromonitor International Page ii
Table 27 Cash-and-carry: Sales Value 2004-2010 ............................................................................ 17 Table 28 Cash-and-carry: Sales by National Brand Owner: Sales Value 2006-2010 ....................... 17 Table 29 Cash-and-carry: Number of Outlets by National Brand Owner: 2006-2010 ..................... 18
Definitions ................................................................................................................................................................... 18 Summary 1 Research Sources ................................................................................................................. 19

Retailing Vietnam
Euromonitor International Page 1
RETAILING IN VIETNAM
EXECUTIVE SUMMARY Retailing Is Still One of the Most Attractive Industries According to the Global Retail Development Index 2010 by American consulting company AT Kearney, Vietnam was ranked in 14th position out of 30 countries in having the most attractive retailing industry worldwide. Although Vietnam fell from sixth position in the previous year due to economic difficulties, the retailing industry remained one of its most attractive industries. The country has a young population, which was the main reason for the robust growth of the industry. Furthermore, the Vietnamese government continued to encourage local players to participate in the retailing industry to stimulate growth. Economic Recovery Boosts the Overall Growth The economy started to recover in 2010. As a result, most channels in the industry enjoyed faster growth in terms of retail sales, selling space and number of outlets. Consumers seemed to be more willing to make purchases compared to the previous year. Moreover, many retailers launched various promotions and marketing activities to stimulate demand as well as to boost sales. In the meantime, some big retailing brands such as Big C or Nguyen Kim focused on enhancing the ambience in their stores and improving customer service to increase their reputation and competitive position in the market. Nongrocery Retailing Gains Share During 2010, nongrocery retailing continued to experience faster expansion as consumers had more sophisticated demands and lifestyles. Higher living standards and rising disposable income allowed consumers to have additional budgets for nongrocery products to improve their quality of life. Clothes, electronics and home appliances, and jewellery were some of the nongrocery products that gained much attention from consumers in the review period. Modern Trade Channels Are the Key Driving Force During the review period, modern retail channels continued to emerge despite the dominance of traditional channels. Consumers became more used to shopping at modern grocery channels such as supermarkets, hypermarkets and convenience stores thanks to their pleasant environment as well as their diversified product portfolios. In addition, modern grocery channels tried their best efforts to offer consumers fresh food and to lower their prices to compete with traditional channels. Consumers also preferred to come to modern nongrocery stores such as clothes and beauty specialists, rather than traditional stores located in the wet markets, because they could freely look or try on products that they wanted. A Positive Outlook Is on the Horizon The retailing industry will experience a better outlook over the forecast period compared to the review period. This is owing to the continuous urbanisation as well as rising consumer living standards. Moreover, given the intense competitive environment, retailers will exploit marketing and public relations activities to generate growth as well as to strengthen their brand image. Modern grocery retailing channels are likely to enjoy the most robust growth in the forecast period.
KEY TRENDS AND DEVELOPMENTS Vietnam’s Retail Industry Grows Thanks To Positive Economic Outlook As the economy started to recover in 2010, the retailing industry also recorded stronger growth than in the previous two years as consumers’ confidence rose again and people were more willing to spend. Real GDP growth in 2010 was over 6%, which was nearly one percentage point higher than in the previous year. This

Retailing Vietnam
Euromonitor International Page 2
could be attributed to many efforts of the Vietnamese government to boost growth, which were already started in 2009. For example, in May 2009, the government announced a stimulus package of nearly VND143 billion, which included a lower tax rate for some retailers and manufacturers, especially the new entrants, and a lower lending interest rate for the majority of companies. Moreover, several government offices also cooperated with retailers such as Saigon Union of Trading Cooperatives and Vissan Co Ltd to control the price of important grocery products to avoid too large price increases. Current Impact Thanks to the better economic outlook and the government’s stimulus package and its efforts in keeping prices of essential grocery products stable in the country, the retailing industry recorded a stronger current value growth in 2010 compared to 2009. In 2010, retailing logged 11% growth to reach VND548 trillion. In 2009, some categories were more negatively affected by the economic crisis than others, such as other grocery retailers, mixed retailers, health and beauty specialist retailers and home and garden specialist retailers. As such, they were also the ones that recorded much stronger current value growth in 2010 compared to the previous year. Some categories even saw their growth spring back to the level of 2008, such as other grocery retailers. Outlook The economy is expected to improve further over the forecast period, which will also be an important factor to bolster the growth of the retailing industry. The middle-class consumers, who were most affected by the economic crisis in 2009, will also gain back confidence and are expected to spend more as they recover from the financial difficulties over 2010. Aside from the better economic prospect, consumers are worried about the high inflation, which will affect prices of many consumer goods. Inflation was expected to be about 12% for 2010, and to remain high in 2011. Thus, many government actions to stabilise the prices are expected to be carried out. Retailers will also participate to give consumers more discounts and promotions to help them cope with the rising prices. Future Impact With the bright economic outlook, the retailing industry is expected to see stronger growth, which will get even stronger towards the end of the forecast period, when the inflation rate is expected to decrease. Constant government efforts to reduce inflation and stabilise market prices, together with the retailers’ discounts and promotional programmes, will bring up consumers’ confidence level and urge them to buy more. Moreover, the rise of the middle-income and wealthy consumers will be another factor contributing to the strong growth of the industry, especially in value terms. Internet Retailing Still Negligible But Gaining Popularity For online shopping, 2009 and 2010 were flourishing years, at least in terms of number of websites. The most common ones were based on consumer-to-consumer platforms, such as vatgia.com, rongbay.com and www.raovat.net. Although they were initially set up for consumer-to-consumer transactions, many small- to medium-sized companies used them to set up virtual shops as a cheap way to advertise their products to consumers. Besides these consumer-to-consumer platform websites, some big companies also spent big budgets to revamp their websites to contain an online shopping section. The most notable examples were the electronics and appliances specialist retailers, one of which was Nguyen Kim Shopping Centre. Current Impact The rising number of online shopping websites definitely raised consumer awareness towards internet retailing. However, there were also many factors hindering the growth of this channel. Firstly, the underdeveloped consumer finance system and strong habit of using cash still made many people hesitate from buying goods online. Secondly, many people still strongly preferred the ability to touch and feel the products before purchasing, in which online stores could not compete with physical stores. And lastly, although the young generation was already very internet savvy, young people were not the main spenders in a family, but rather

Retailing Vietnam
Euromonitor International Page 3
their parents, who were usually much less internet savvy and less open to the online shopping concept. Because of these reasons, internet retailing remained negligible in 2010. Outlook Despite many factors negatively affecting internet retailing’s performance in 2010, it was undeniable that consumer awareness was rising rapidly thanks to the dynamic promotional activities of these retailers and the spreading word of mouth amongst the young population. As such, the channel is expected to see more dynamic activities and development over the forecast period as retailers try to attract consumers’ interest and capture the first phase of internet retailing development in the country. Having said this, the growth of internet retailing is still dependent on how fast the consumer finance industry develops, and whether consumers’ mindset regarding internet retailing becomes more open in the forecast period. Future Impact There will be more new players in the field of internet retailing, thanks to the higher interest of consumers in this retailing channel. Some retailers in other retailing channels such as supermarkets/hypermarkets or bookstores might diversify their business into internet retailing to strengthen their position in the retail industry. coIn the meantime, internet retailers might focus on expanding their product portfolios to appeal to consumers’ attention and to educate consumers to purchase over the internet. They will try to look for new products which have unique characteristics or benefits. Therefore, consumers will have to purchase these products from internet retailers, as they cannot find the same products in other retailing channels. As a result, consumers will be familiar with internet retailing because they appreciate its benefits. Nevertheless, internet retailing will not pose a potential threat to other retailing channels such as supermarkets/hypermarkets, department stores or independent small grocers due to its small size. The faster growth of internet retailing will not cause consumers to shun store-based retailing because they will not change immediately their traditional habit of shopping at stores in the forecast years. Unless internet retailers improve the security of their websites, internet retailing will have no chance to compete with other retailing channels. Local Products Get A Boost From the Government Typically, consumers have a stereotype that foreign brands are better in quality than Vietnamese brands. Thus, to change this mindset, the government launched the campaign “Vietnamese use Vietnamese products” at the end of 2009, and extended it to the whole year of 2010. Besides constant media attention and advertising activities, a major activity of the campaign was the trade exhibitions. These events, organised by the government bodies, moved across the country, from big cities like Ha Noi and Ho Chi Minh to small towns and rural areas to promote and raise awareness of local products. Many local manufacturers participated in these trade shows as they were a great opportunity for them to showcase their products on a wide scale. Many retailers also launched their own discounts and promotional programmes for local brands to take advantage when these brands were in the limelight. Current Impact At the end of 2010, the government announced that the “Vietnamese use Vietnamese products” campaign was a success. Thanks to the campaign’s programme, consumers paid more attention to the local brands and products. The success of the campaign was reflected even more clearly in the major retailers, including supermarkets and hypermarkets. For instance, Big C hypermarkets reported that in 2010, local brands accounted for about 90% of the brands it offered, compared to just over 50% in 2009. Outlook With the positive results, Vietnam’s government is predicted to continue carry on the “Vietnamese use Vietnamese products” campaign over the forecast period. The government will organise more trade fairs, so that local retailers and manufacturers can advertise their brands and expose their products to consumers. Through these events, consumers are able to witness the improvement and development of Vietnamese products. More importantly, they can compare product quality between local products and foreign products more easily to have better understanding of Vietnamese products.

Retailing Vietnam
Euromonitor International Page 4
Furthermore, the government will provide financial assistance, such as lower interest rates or tax rates, to help local retailers and manufacturers to have additional budgets for their advertising and marketing activities as well as to encourage new local players to participate in the retail industry. Future Impact As a result of the “Vietnamese use Vietnamese products” campaign, local brands and products will continue to grow their presence in the country’s retailing landscape. Many retailers will continue to give more promotions and discounts to local products to gain favour from the government and the consumers alike. Big retailers, such as Saigon Union of Trading Cooperatives and Casino Guichard-Perrachon SA, will be the leaders of this trend. Local specialist retailers, such as Viet Tien Garment Co (VTEC), Phu Nhuan Jewelry JSC and Viet Fashion Co Ltd, will also benefit from this trend, as they are some amongst the famous local companies that captured the consumers’ attention in 2010. Private Label Driven by Grocery Retailers During the review period, private label only accounted for a very small share of value sales. As private label was still a new concept amongst consumers, the number of private label products remained small in both grocery and nongrocery retailing channels. However, towards the end of the review period, there were more private label products in the market, especially in the supermarket and hypermarket channels, as these retailers started to use them as a tool to differentiate themselves to attract consumers to visit their outlets. The Big C hypermarkets, owned by Casino Guichard-Perrachon SA, provided a good example. In 2010, Big C marketed several private label ranges, such as Wow! Gia Hap Dan, eBon, and Casino. Wow! Gia Hap Dan from Big C could be considered the most developed private label in the grocery retail industry, which covered products ranging from household care to packaged food. Casino Guichard-Perrachon’s main competitor, Saigon Union of Trading Cooperatives, also launched its own private label, Co.opMart, in 2009-2010. Although Co.opMart was not as developed as Big C’s private label products, it showed another development to the private label landscape of retailing. Current Impact New private label products from Casino Guichard-Perrachon and Saigon Union of Trading Cooperatives launched in 2009-2010 received generally good response from the consumers, which showed that consumers accepted the lower prices despite the economy image these brands portrayed. The key purchasers of private label products were low-income and middle-income consumers, as most private label products were positioned in the economy segment, except for some such as Casino Bio, which was a range of organic packaged food products imported from Europe. Bakery by Big C and eBon, with products such as freshly baked Vietnamese baguettes and Vietnamese ham, were some examples of economy private label products that were highly successful thanks to their good quality. Despite its success, private label still represented a negligible part within the retailing landscape, especially in the grocery channels, and did not pose any serious threats to the major players in their categories due to its small value. In addition, in grocery, private label products were only available in the modern channels, whilst traditional channels, such as independent small grocers, still represented the biggest part of grocery retailing in 2010. Outlook Over the forecast period, private label is expected to grow even stronger than it was in 2009 and 2010. Existing brands will see more expansion in terms of product categories thanks to the increasing awareness of consumers towards private label products. After the success of the private label products of Casino Guichard-Perrachon and Saigon Union of Trading Cooperatives, other retailers are also expected to follow and launch their own such products in the forecast period. Private label will also see more development in terms of price and positioning. There is potential in both the economy and premium segments, as they will target the different consumer trends. Economy brands will appeal to the bulk of consumers, who like to look for more value-for-money products, especially in categories where

Retailing Vietnam
Euromonitor International Page 5
there is low brand loyalty like tissues and some packaged food products. On the other hand, premium brands would tap the growing niche of the wealthy consumers in the country. Future Impact Private label will create another competition venue between the retailers, especially between the major grocery retailers, such as Saigon Union of Trading Cooperatives, Hanoi Trade Corp, TCT Group and Casino Guichard-Perrachon. Besides good prices, strong customer service and pleasant shopping environment, good private label products will also be a strong motivation for consumers to choose a particular retailer instead of its competitors. In the long term, private label will also affect the retail landscape of Vietnam in terms of competition and brands available in the market. As private label grows and become more important, it will compete directly with other brands in the market, which will also be a motivation for the existing brands to develop themselves. However, as the value of private label was still very small in 2010, this is not expected to happen in the early forecast period. Retailers Focus on Improving Shopping Environment and Convenience In 2010, the shopping environment became a focused topic for many retailers. As the consumers, especially those in the urban areas, became more educated and more sophisticated, they also demanded better shopping environments, such as spacious aisles and attractive in-store displays. Increasingly busier lifestyles in big cities like Ha Noi and Ho Chi Minh also introduced the need for retail therapy, as shopping became one of the ways for people to relax after a stressful day. Thus, places with better shopping environments would attract more customers than their competitors. Besides, as shopping centres also became new gathering places for the teenagers and young population, those with nicer store designs and displays attracted more customers as well. Convenience was also a focus in 2009-2010, as it also contributed to a better shopping experience. Many retailers, such as Saigon Union of Trading, offered free delivery service for customers who made a purchase of a minimum amount. This minimum amount was usually low, such as only VND200,000 required by Saigon Union of Trading, so that more customers could leverage on the convenient delivery services and have less worry about the burden of carrying their groceries home. Current Impact The year 2010 saw many efforts by retailers trying to give consumers a better shopping environment to answer their need for a better place for shopping and gathering and to take advantage of the rising trend towards retail therapy. For instant, Big C, the leading hypermarket chain, replaced its usual in-store shopping basket with new baskets that had wheels and extendable handles attached, so that shoppers could drag the baskets along instead of carrying them. The new baskets received good feedback, as consumers could use much less force and they could shop more with ease. Besides, Big C also carried out several special events, such as the Fruit Festival in 2010, when it decorated the stores lavishly to attract more customers. Many other retailers, such as Mobile World Co Ltd, also paid more attention to their store layout and design than before. Mobile World, especially, rearranged its store layout for more additional space for customer service and more attractive and intuitive product arrangement. Thus, consumers felt more appreciated and relaxed when they shopped at these retail stores. Outlook As consumers are expected to be more demanding and sophisticated, together with the rise of middle- and high-income consumers, the trend towards improved shopping experience is expected to be carried forwards in the forecast period. Consumers will constantly expect to receive better customer service, a nicer shopping environment and more convenient and enjoyable ways to shop. Thus, the retailers will have to constantly look to keep up with the trend and maintain themselves amongst consumers’ favourite shopping destinations. Future Impact As this trend is expected to continue growing in the forecast period, retailers will incorporate new strategies to give consumers better shopping places if they want to grow and achieve the leading positions. Training for front-line staff will probably be one of the focus areas for many retailers, as customer service largely affects
Retailing Vietnam
Euromonitor International Page 6
consumers’ mood and their purchases. Big companies might have the advantage in terms of financial capability to hire good training specialists, but small companies will also have an advantage as they have fewer employees and thus the ability to train them more easily. Besides upgrading customer service standards, store design will also be looked at by many retailers to enhance consumers’ shopping experience. All of these activities will incur costs, which will be passed down to the consumers. Thus, companies are expected to be careful with how much they are willing to spend for these activities, as consumers, no matter what, are still quite price conscious. Environmental Issues Raise Higher Concerns From Retailers In 2008 and 2009, the scandal of Vedan (Vietnam) emitting its untreated product waste into the Thi Vai river in Dong Nai province, which caused serious damage to the environment and negatively affected hundreds of households living near the river, raised consumers’ concern for environmental issues. Consumers started to pay more attention to environmental problems, and many of them started to shift to purchase from manufacturers and retailers who showed their responsibility for nature. Besides the fact that consumers were becoming more educated and sophisticated, constant government educational programmes on saving the environment also helped to raise consumers’ awareness for environmental issues on a wide scale. Current Impact Rising consumer awareness for environmental issues urged the retailers to play their part to show their corporate social responsibility. This trend was started by the big retailers, especially in the grocery channels. Following the Vedan (Vietnam) scandal, many supermarkets and hypermarkets stopped selling the manufacturer’s products to show that they did not support companies with bad responsibility for the environment. Some retailers, such as Big C, Co.opMart and Lotte Mart, also encouraged consumers to use recyclable bags instead of plastic bags by having in-store banners and posters to explain how plastic bags negatively affected the environment. Some retailers even carried out special programmes to show their care for the environment and to attract consumers’ attention. For instance, Big C ran a campaign to collect people’s used batteries, and through it, educated consumers the importance of disposing used batteries the correct way, which is less harmful to the environment. It is difficult to measure how much these efforts helped the retailers with their sales and revenue, but they definitely helped the retailers to obtain a positive image in the consumers’ minds. Outlook Over the forecast period, retailing players will continue to increase their environmental activity thanks to their successful activities in 2010. Moreover, consumers are more aware about the significant affects of the environment on their daily life when the global warming showed its detrimental consequences such as higher temperature or pollution. The higher number of environmental activities is also in line with the higher number of corporate responsibility activities in manufacturing areas. Together with the environmental campaign executed by government offices, the contribution of retailing players will enhance the attention of Vietnamese to Vietnam’s environment. More importantly, the Vietnamese are also beginning to see environmental protection as one of their responsibilities thanks to the effort of retailers. Future Impact In 2010, most of the environmental activities received good responses from consumers. Especially, most of the retailing players who showed their concern for the environment gained a good reputation and image in consumers’ perception. As a result, retailers, including nongrocery and grocery retailers, will expand their activity in environmental protection as the marketing tool to enhance their reputation and brand image. More sophisticated activities are expected to take place in the forecast period, such as using more energy-saving appliances and encouraging people to use more recyclable bags instead of plastic bags.
MARKET INDICATORS

Retailing Vietnam
Euromonitor International Page 7
Table 1 Employment in Retailing 2005-2010
2005 2006 2007 2008 2009 2010 Total employment ('000 41,817.4 42,781.5 43,670.6 44,626.7 45,156.2 45,466.9 people) Employment in retailing 3,800.0 4,200.0 4,409.0 4,900.0 5,000.0 5,075.0 ('000 people) Employment in retailing 9.1 9.8 10.1 11.0 11.1 11.2 (%) (% of total employment) Source: Euromonitor International from official statistics, trade associations, trade press, company research, trade
interviews
MARKET DATA
Table 2 Sales in Retailing by Category: Value 2005-2010
VND billion 2005 2006 2007 2008 2009 2010 Store-based Retailing 315,754.8 341,490.6 373,962.8 408,030.6 451,390.0 499,733.7 Non-Store Retailing 717.4 903.5 1,128.3 1,442.0 2,287.2 3,313.6 Retailing 316,472.2 342,394.1 375,091.0 409,472.6 453,677.2 503,047.3 Source: Euromonitor International from official statistics, trade associations, trade press, company research, trade
interviews, trade sources
Table 3 Sales in Retailing by Category: % Value Growth 2005-2010
% current value growth 2009/10 2005-10 CAGR 2005/10 TOTAL Store-based Retailing 10.7 9.6 58.3 Non-Store Retailing 44.9 35.8 361.9 Retailing 10.9 9.7 59.0 Source: Euromonitor International from official statistics, trade associations, trade press, company research, trade
interviews, trade sources
Table 4 Sales in Retailing by Grocery vs Non-Grocery 2005-2010
% retail value rsp excl sales tax 2005 2006 2007 2008 2009 2010 Grocery 62.0 61.0 59.5 58.0 56.5 54.5 Non-Grocery 38.0 39.0 40.5 42.0 43.5 45.5 Total 100.0 100.0 100.0 100.0 100.0 100.0 Source: Euromonitor International from official statistics, trade associations, trade press, company research, trade
interviews, trade sources
Table 5 Sales in Store-Based Retailing by Category: Value 2005-2010
VND billion 2005 2006 2007 2008 2009 2010 Grocery Retailers 167,336.9 177,755.4 189,397.6 201,559.6 214,208.0 228,005.3 Non-Grocery Retailers 148,417.9 163,735.2 184,565.2 206,471.0 237,182.0 271,728.4

Retailing Vietnam
Euromonitor International Page 8
Store-based Retailing 315,754.8 341,490.6 373,962.8 408,030.6 451,390.0 499,733.7 Source: Euromonitor International from official statistics, trade associations, trade press, company research, trade
interviews, trade sources
Table 6 Sales in Store-Based Retailing by Category: % Value Growth 2005-2010
% current value growth 2009/10 2005-10 CAGR 2005/10 TOTAL Grocery Retailers 6.4 6.4 36.3 Non-Grocery Retailers 14.6 12.9 83.1 Store-based Retailing 10.7 9.6 58.3 Source: Euromonitor International from official statistics, trade associations, trade press, company research, trade
interviews, trade sources
Table 7 Sales in Non-Grocery Retailing by Category: Value 2005-2010
VND billion 2005 2006 2007 2008 2009 2010 Clothing and Footwear 10,326.9 11,772.7 13,538.6 15,366.3 17,287.1 19,361.5 Specialist Retailers Electronics and 11,944.8 12,900.4 14,448.5 15,893.3 17,641.6 22,934.1 Appliance Specialist Retailers Health and Beauty 23,574.0 27,506.1 31,356.9 35,233.3 39,203.8 43,855.1 Specialist Retailers Home and Garden 51,695.4 56,647.0 63,444.7 71,659.8 81,913.9 96,870.0 Specialist Retailers Leisure and Personal 8,181.1 9,552.5 12,674.2 16,491.5 26,881.3 31,626.4 Goods Specialist Retailers Mixed Retailers 2,630.2 3,287.7 4,088.8 5,012.7 5,801.6 6,884.4 Other Non-Grocery 40,065.5 42,068.8 45,013.6 46,814.1 48,452.6 50,196.9 Retailers Non-Grocery Retailers 148,417.9 163,735.2 184,565.2 206,471.0 237,182.0 271,728.4 Source: Euromonitor International from official statistics, trade associations, trade press, company research, trade
interviews, trade sources
Table 8 Sales in Non-Grocery Retailing by Category: % Value Growth 2005-2010
% current value growth 2009/10 2005-10 CAGR 2005/10 TOTAL Clothing and Footwear Specialist 12.0 13.4 87.5 Retailers Electronics and Appliance Specialist 30.0 13.9 92.0 Retailers Health and Beauty Specialist Retailers 11.9 13.2 86.0 Home and Garden Specialist Retailers 18.3 13.4 87.4 Leisure and Personal Goods Specialist 17.7 31.1 286.6 Retailers Mixed Retailers 18.7 21.2 161.7 Other Non-Grocery Retailers 3.6 4.6 25.3 Non-Grocery Retailers 14.6 12.9 83.1 Source: Euromonitor International from official statistics, trade associations, trade press, company research, trade
interviews, trade sources
Table 9 Sales in Non-store Retailing by Category: Value 2005-2010
Retailing Vietnam
Euromonitor International Page 9
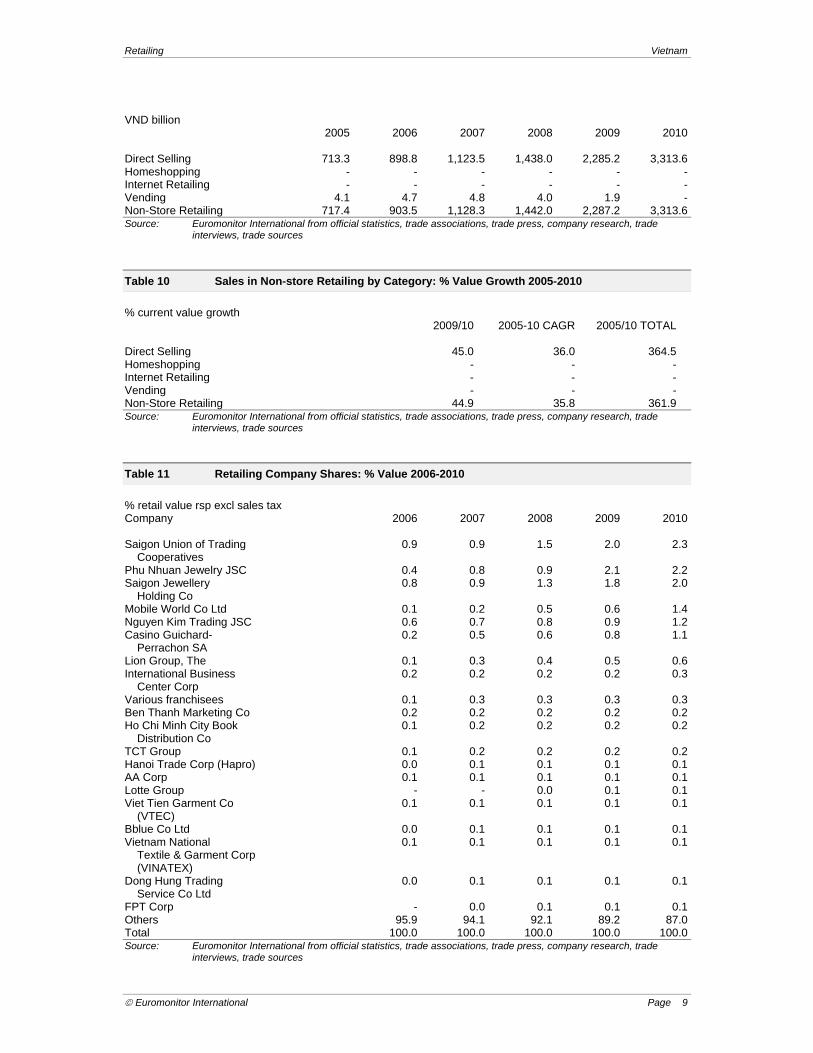
VND billion 2005 2006 2007 2008 2009 2010 Direct Selling 713.3 898.8 1,123.5 1,438.0 2,285.2 3,313.6 Homeshopping - - - - - - Internet Retailing - - - - - - Vending 4.1 4.7 4.8 4.0 1.9 - Non-Store Retailing 717.4 903.5 1,128.3 1,442.0 2,287.2 3,313.6 Source: Euromonitor International from official statistics, trade associations, trade press, company research, trade
interviews, trade sources
Table 10 Sales in Non-store Retailing by Category: % Value Growth 2005-2010
% current value growth 2009/10 2005-10 CAGR 2005/10 TOTAL Direct Selling 45.0 36.0 364.5 Homeshopping - - - Internet Retailing - - - Vending - - - Non-Store Retailing 44.9 35.8 361.9 Source: Euromonitor International from official statistics, trade associations, trade press, company research, trade
interviews, trade sources
Table 11 Retailing Company Shares: % Value 2006-2010
% retail value rsp excl sales tax Company 2006 2007 2008 2009 2010 Saigon Union of Trading 0.9 0.9 1.5 2.0 2.3 Cooperatives Phu Nhuan Jewelry JSC 0.4 0.8 0.9 2.1 2.2 Saigon Jewellery 0.8 0.9 1.3 1.8 2.0 Holding Co Mobile World Co Ltd 0.1 0.2 0.5 0.6 1.4 Nguyen Kim Trading JSC 0.6 0.7 0.8 0.9 1.2 Casino Guichard- 0.2 0.5 0.6 0.8 1.1 Perrachon SA Lion Group, The 0.1 0.3 0.4 0.5 0.6 International Business 0.2 0.2 0.2 0.2 0.3 Center Corp Various franchisees 0.1 0.3 0.3 0.3 0.3 Ben Thanh Marketing Co 0.2 0.2 0.2 0.2 0.2 Ho Chi Minh City Book 0.1 0.2 0.2 0.2 0.2 Distribution Co TCT Group 0.1 0.2 0.2 0.2 0.2 Hanoi Trade Corp (Hapro) 0.0 0.1 0.1 0.1 0.1 AA Corp 0.1 0.1 0.1 0.1 0.1 Lotte Group - - 0.0 0.1 0.1 Viet Tien Garment Co 0.1 0.1 0.1 0.1 0.1 (VTEC) Bblue Co Ltd 0.0 0.1 0.1 0.1 0.1 Vietnam National 0.1 0.1 0.1 0.1 0.1 Textile & Garment Corp (VINATEX) Dong Hung Trading 0.0 0.1 0.1 0.1 0.1 Service Co Ltd FPT Corp - 0.0 0.1 0.1 0.1 Others 95.9 94.1 92.1 89.2 87.0 Total 100.0 100.0 100.0 100.0 100.0 Source: Euromonitor International from official statistics, trade associations, trade press, company research, trade
interviews, trade sources

Retailing Vietnam
Euromonitor International Page 10
Table 12 Retailing Brand Shares: % Value 2007-2010
% retail value rsp excl sales tax Brand Company 2007 2008 2009 2010 Saigon Coop Saigon Union of Trading 0.9 1.5 1.9 2.2 Cooperatives PNJ Phu Nhuan Jewelry JSC 0.8 0.9 2.1 2.2 SJC Saigon Jewellery 0.9 1.3 1.8 2.0 Holding Co Mobile world Mobile World Co Ltd 0.2 0.5 0.6 1.4 Nguyenkim - Saigon Nguyen Kim Trading JSC 0.7 0.8 0.9 1.2 Shopping Center Big C Casino Guichard- 0.5 0.6 0.8 1.1 Perrachon SA Parkson Lion Group, The 0.3 0.4 0.5 0.6 Diamond Plaza International Business 0.2 0.2 0.2 0.3 Center Corp G7mart Various franchisees 0.3 0.3 0.3 0.3 Best Denki Ben Thanh Marketing Co 0.2 0.2 0.2 0.2 Fahasa Ho Chi Minh City Book 0.2 0.2 0.2 0.2 Distribution Co Fivimart TCT Group 0.1 0.1 0.2 0.2 Hapro Mart Hanoi Trade Corp (Hapro) 0.1 0.1 0.1 0.1 Lotte Mart Lotte Group - 0.0 0.1 0.1 Viet Tien Viet Tien Garment Co 0.1 0.1 0.1 0.1 (VTEC) Blue Exchange Bblue Co Ltd 0.1 0.1 0.1 0.1 Vinatex Vietnam National 0.1 0.1 0.1 0.1 Textile & Garment Corp (VINATEX) Citimart Dong Hung Trading 0.1 0.1 0.1 0.1 Service Co Ltd FPT FPT Corp 0.0 0.1 - - Big C Bourbon Groupe - - - - Others 94.3 92.3 89.5 87.3 Total 100.0 100.0 100.0 100.0 Source: Euromonitor International from official statistics, trade associations, trade press, company research, trade
interviews, trade sources
Table 13 Store-Based Retailing Company Shares: % Value 2006-2010
% retail value rsp excl sales tax Company 2006 2007 2008 2009 2010 Saigon Union of Trading 0.9 0.9 1.5 2.0 2.3 Cooperatives Phu Nhuan Jewelry JSC 0.4 0.8 0.9 2.1 2.2 Saigon Jewellery 0.8 0.9 1.3 1.8 2.0 Holding Co Mobile World Co Ltd 0.1 0.2 0.5 0.6 1.4 Nguyen Kim Trading JSC 0.6 0.7 0.8 0.9 1.3 Casino Guichard- 0.2 0.5 0.6 0.8 1.1 Perrachon SA Lion Group, The 0.1 0.3 0.4 0.5 0.6 International Business 0.2 0.2 0.2 0.3 0.3 Center Corp Various franchisees 0.1 0.3 0.3 0.3 0.3 Ben Thanh Marketing Co 0.2 0.2 0.2 0.2 0.2 Ho Chi Minh City Book 0.1 0.2 0.2 0.2 0.2 Distribution Co
Retailing Vietnam
Euromonitor International Page 11
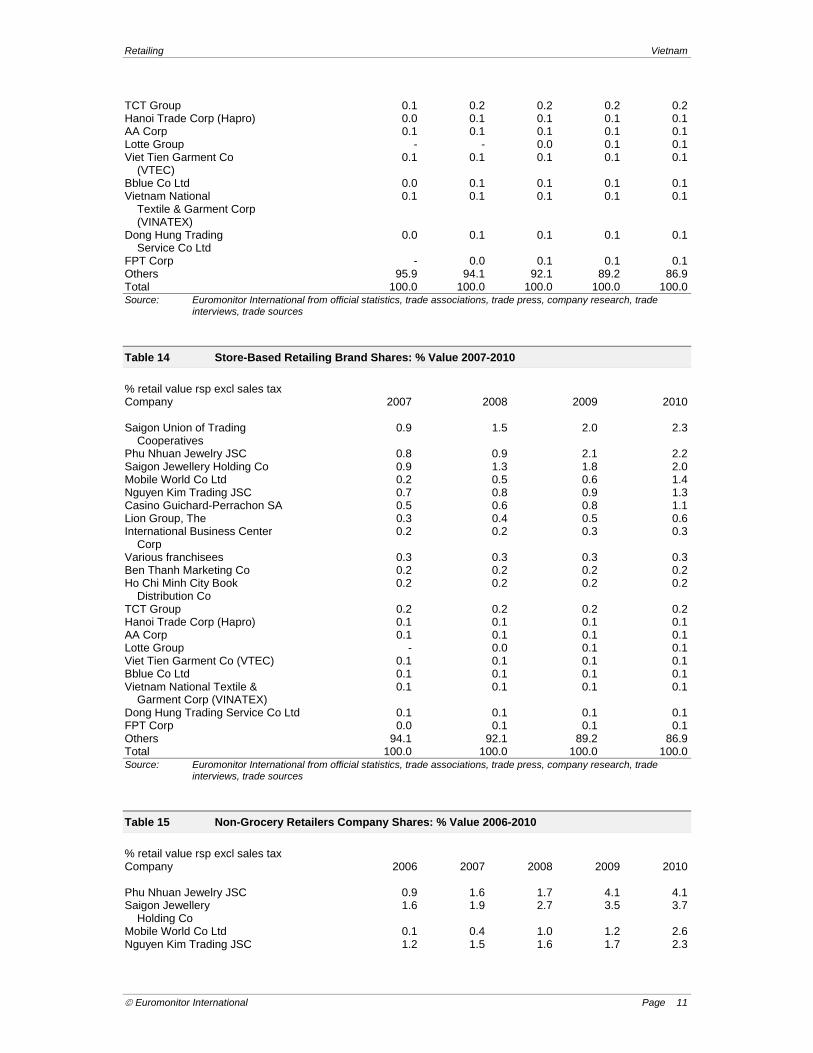
TCT Group 0.1 0.2 0.2 0.2 0.2 Hanoi Trade Corp (Hapro) 0.0 0.1 0.1 0.1 0.1 AA Corp 0.1 0.1 0.1 0.1 0.1 Lotte Group - - 0.0 0.1 0.1 Viet Tien Garment Co 0.1 0.1 0.1 0.1 0.1 (VTEC) Bblue Co Ltd 0.0 0.1 0.1 0.1 0.1 Vietnam National 0.1 0.1 0.1 0.1 0.1 Textile & Garment Corp (VINATEX) Dong Hung Trading 0.0 0.1 0.1 0.1 0.1 Service Co Ltd FPT Corp - 0.0 0.1 0.1 0.1 Others 95.9 94.1 92.1 89.2 86.9 Total 100.0 100.0 100.0 100.0 100.0 Source: Euromonitor International from official statistics, trade associations, trade press, company research, trade
interviews, trade sources
Table 14 Store-Based Retailing Brand Shares: % Value 2007-2010
% retail value rsp excl sales tax Company 2007 2008 2009 2010 Saigon Union of Trading 0.9 1.5 2.0 2.3 Cooperatives Phu Nhuan Jewelry JSC 0.8 0.9 2.1 2.2 Saigon Jewellery Holding Co 0.9 1.3 1.8 2.0 Mobile World Co Ltd 0.2 0.5 0.6 1.4 Nguyen Kim Trading JSC 0.7 0.8 0.9 1.3 Casino Guichard-Perrachon SA 0.5 0.6 0.8 1.1 Lion Group, The 0.3 0.4 0.5 0.6 International Business Center 0.2 0.2 0.3 0.3 Corp Various franchisees 0.3 0.3 0.3 0.3 Ben Thanh Marketing Co 0.2 0.2 0.2 0.2 Ho Chi Minh City Book 0.2 0.2 0.2 0.2 Distribution Co TCT Group 0.2 0.2 0.2 0.2 Hanoi Trade Corp (Hapro) 0.1 0.1 0.1 0.1 AA Corp 0.1 0.1 0.1 0.1 Lotte Group - 0.0 0.1 0.1 Viet Tien Garment Co (VTEC) 0.1 0.1 0.1 0.1 Bblue Co Ltd 0.1 0.1 0.1 0.1 Vietnam National Textile & 0.1 0.1 0.1 0.1 Garment Corp (VINATEX) Dong Hung Trading Service Co Ltd 0.1 0.1 0.1 0.1 FPT Corp 0.0 0.1 0.1 0.1 Others 94.1 92.1 89.2 86.9 Total 100.0 100.0 100.0 100.0 Source: Euromonitor International from official statistics, trade associations, trade press, company research, trade
interviews, trade sources
Table 15 Non-Grocery Retailers Company Shares: % Value 2006-2010
% retail value rsp excl sales tax Company 2006 2007 2008 2009 2010 Phu Nhuan Jewelry JSC 0.9 1.6 1.7 4.1 4.1 Saigon Jewellery 1.6 1.9 2.7 3.5 3.7 Holding Co Mobile World Co Ltd 0.1 0.4 1.0 1.2 2.6 Nguyen Kim Trading JSC 1.2 1.5 1.6 1.7 2.3

Retailing Vietnam
Euromonitor International Page 12
Lion Group, The 0.3 0.7 0.9 1.0 1.1 International Business 0.4 0.4 0.5 0.5 0.5 Center Corp Ben Thanh Marketing Co 0.4 0.4 0.4 0.5 0.4 Ho Chi Minh City Book 0.2 0.3 0.4 0.4 0.4 Distribution Co AA Corp 0.2 0.2 0.2 0.2 0.2 Viet Tien Garment Co 0.2 0.2 0.2 0.2 0.2 (VTEC) Bblue Co Ltd 0.1 0.1 0.1 0.1 0.2 Vietnam National 0.1 0.2 0.2 0.2 0.2 Textile & Garment Corp (VINATEX) FPT Corp - 0.0 0.2 0.2 0.2 Hasegawa Vietnam Co 0.1 0.1 0.1 0.1 0.1 Medicare Co Ltd 0.2 0.2 0.2 0.2 0.1 LG Vina Cosmetics Co Ltd 0.2 0.2 0.1 0.1 0.1 G T Co Ltd 0.0 0.1 0.1 0.1 0.1 Viet Fashion Co Ltd 0.1 0.1 0.1 0.1 0.1 An Phuoc Garment Co Ltd 0.1 0.1 0.1 0.1 0.1 Trang Tien Plaza Co Ltd 0.1 0.1 0.1 0.1 0.1 Others 93.4 91.2 89.1 85.4 83.0 Total 100.0 100.0 100.0 100.0 100.0 Source: Euromonitor International from official statistics, trade associations, trade press, company research, trade
interviews, trade sources
Table 16 Non-Grocery Retailers Brand Shares: % Value 2007-2010
% retail value rsp excl sales tax Brand Company 2007 2008 2009 2010 PNJ Phu Nhuan Jewelry JSC 1.6 1.7 4.1 4.1 SJC Saigon Jewellery 1.9 2.7 3.5 3.7 Holding Co Mobile world Mobile World Co Ltd 0.4 1.0 1.2 2.6 Nguyenkim - Saigon Nguyen Kim Trading JSC 1.5 1.6 1.7 2.3 Shopping Center Parkson Lion Group, The 0.7 0.9 1.0 1.1 Diamond Plaza International Business 0.4 0.5 0.5 0.5 Center Corp Best Denki Ben Thanh Marketing Co 0.4 0.4 0.5 0.4 Fahasa Ho Chi Minh City Book 0.3 0.4 0.4 0.4 Distribution Co Viet Tien Viet Tien Garment Co 0.2 0.2 0.2 0.2 (VTEC) Blue Exchange Bblue Co Ltd 0.1 0.1 0.1 0.2 Vinatex Vietnam National 0.2 0.2 0.2 0.2 Textile & Garment Corp (VINATEX) FPT Shop FPT Corp - - 0.2 0.2 Nha Xinh AA Corp 0.2 0.2 0.2 0.2 Zen plaza Hasegawa Vietnam Co 0.1 0.1 0.1 0.1 Medicare Medicare Co Ltd 0.2 0.2 0.2 0.1 LG Vina LG Vina Cosmetics Co Ltd 0.2 0.1 0.1 0.1 Gia Thanh Trading G T Co Ltd 0.1 0.1 0.1 0.1 Pierre Cardin An Phuoc Garment Co Ltd 0.1 0.1 0.1 0.1 Ninomaxx Viet Fashion Co Ltd 0.1 0.1 0.1 0.1 Trang Tien Plaza Trang Tien Plaza Co Ltd 0.1 0.1 0.1 0.1 Others 91.3 89.3 85.5 83.1 Total 100.0 100.0 100.0 100.0 Source: Euromonitor International from official statistics, trade associations, trade press, company research, trade
interviews, trade sources

Retailing Vietnam
Euromonitor International Page 13
Table 17 Non-store Retailing Company Shares: % Value 2006-2010
% retail value rsp excl sales tax Company 2006 2007 2008 2009 2010 Aloe Trading Co Ltd 13.5 18.5 16.1 13.3 12.4 Oriflame Vietnam Ltd 14.4 16.2 13.7 12.9 12.2 Tiens Vietnam Co Ltd - - 11.3 9.0 7.4 Amway Vietnam Ltd - - 4.7 6.2 7.0 Avon Cosmetics Vietnam 11.7 8.1 7.5 5.8 4.1 Ltd Tahitian Noni 2.0 1.7 1.5 1.0 0.7 International Inc Savico Automatic Retail 0.2 0.2 0.2 0.0 - & Service Co Ltd ESQ Co Ltd 0.1 0.1 0.1 0.0 - Tianshi Group Co Ltd 11.3 11.0 - - - Others 46.7 44.2 45.0 51.7 56.2 Total 100.0 100.0 100.0 100.0 100.0 Source: Euromonitor International from official statistics, trade associations, trade press, company research, trade
interviews, trade sources
Table 18 Non-store Retailing Brand Shares: % Value 2007-2010
% retail value rsp excl sales tax Brand Company 2007 2008 2009 2010 Forever Living Aloe Trading Co Ltd 18.5 16.1 13.3 12.4 Oriflame Oriflame Vietnam Ltd 16.2 13.7 12.9 12.2 Tiens Tiens Vietnam Co Ltd - 11.3 9.0 7.4 Amway Amway Vietnam Ltd - 4.7 6.2 7.0 Avon Avon Cosmetics Vietnam Ltd 8.1 7.5 5.8 4.1 Tahitian Noni Tahitian Noni 1.7 1.5 1.0 0.7 International Inc Savico Savico Automatic Retail 0.2 0.2 0.0 - & Service Co Ltd ESQ ESQ Co Ltd 0.1 0.1 0.0 - Tiens Tianshi Group Co Ltd 11.0 - - - Others 44.2 45.0 51.7 56.2 Total 100.0 100.0 100.0 100.0 Source: Euromonitor International from official statistics, trade associations, trade press, company research, trade
interviews, trade sources
Table 19 Forecast Sales in Retailing by Category: Value 2010-2015
VND billion 2010 2011 2012 2013 2014 2015 Store-based Retailing 499,733.7 501,567.7 509,390.1 519,907.7 531,890.1 545,102.1 Non-Store Retailing 3,313.6 4,208.3 5,134.1 6,058.2 6,906.4 7,597.0 Retailing 503,047.3 505,775.9 514,524.2 525,966.0 538,796.5 552,699.1 Source: Euromonitor International from trade associations, trade press, company research, trade interviews, trade
sources
Table 20 Forecast Sales in Retailing by Category: % Value Growth 2010-2015
% constant value growth 2010-15 CAGR 2010/15 TOTAL Store-based Retailing 1.8 9.1
Retailing Vietnam
Euromonitor International Page 14
Non-Store Retailing 18.1 129.3 Retailing 1.9 9.9 Source: Euromonitor International from trade associations, trade press, company research, trade interviews, trade
sources
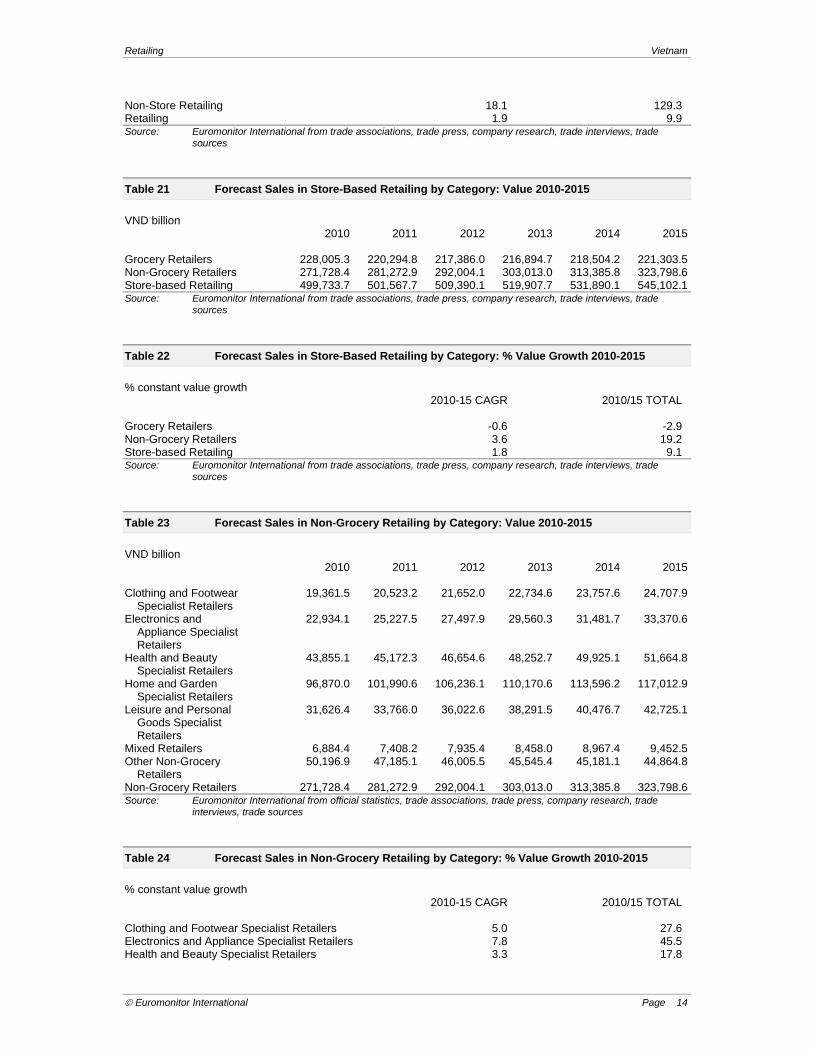
Table 21 Forecast Sales in Store-Based Retailing by Category: Value 2010-2015
VND billion 2010 2011 2012 2013 2014 2015 Grocery Retailers 228,005.3 220,294.8 217,386.0 216,894.7 218,504.2 221,303.5 Non-Grocery Retailers 271,728.4 281,272.9 292,004.1 303,013.0 313,385.8 323,798.6 Store-based Retailing 499,733.7 501,567.7 509,390.1 519,907.7 531,890.1 545,102.1 Source: Euromonitor International from trade associations, trade press, company research, trade interviews, trade
sources
Table 22 Forecast Sales in Store-Based Retailing by Category: % Value Growth 2010-2015
% constant value growth 2010-15 CAGR 2010/15 TOTAL Grocery Retailers -0.6 -2.9 Non-Grocery Retailers 3.6 19.2 Store-based Retailing 1.8 9.1 Source: Euromonitor International from trade associations, trade press, company research, trade interviews, trade
sources
Table 23 Forecast Sales in Non-Grocery Retailing by Category: Value 2010-2015
VND billion 2010 2011 2012 2013 2014 2015 Clothing and Footwear 19,361.5 20,523.2 21,652.0 22,734.6 23,757.6 24,707.9 Specialist Retailers Electronics and 22,934.1 25,227.5 27,497.9 29,560.3 31,481.7 33,370.6 Appliance Specialist Retailers Health and Beauty 43,855.1 45,172.3 46,654.6 48,252.7 49,925.1 51,664.8 Specialist Retailers Home and Garden 96,870.0 101,990.6 106,236.1 110,170.6 113,596.2 117,012.9 Specialist Retailers Leisure and Personal 31,626.4 33,766.0 36,022.6 38,291.5 40,476.7 42,725.1 Goods Specialist Retailers Mixed Retailers 6,884.4 7,408.2 7,935.4 8,458.0 8,967.4 9,452.5 Other Non-Grocery 50,196.9 47,185.1 46,005.5 45,545.4 45,181.1 44,864.8 Retailers Non-Grocery Retailers 271,728.4 281,272.9 292,004.1 303,013.0 313,385.8 323,798.6 Source: Euromonitor International from official statistics, trade associations, trade press, company research, trade
interviews, trade sources
Table 24 Forecast Sales in Non-Grocery Retailing by Category: % Value Growth 2010-2015
% constant value growth 2010-15 CAGR 2010/15 TOTAL Clothing and Footwear Specialist Retailers 5.0 27.6 Electronics and Appliance Specialist Retailers 7.8 45.5 Health and Beauty Specialist Retailers 3.3 17.8

Retailing Vietnam
Euromonitor International Page 15
Home and Garden Specialist Retailers 3.9 20.8 Leisure and Personal Goods Specialist Retailers 6.2 35.1 Mixed Retailers 6.5 37.3 Other Non-Grocery Retailers -2.2 -10.6 Non-Grocery Retailers 3.6 19.2 Source: Euromonitor International from official statistics, trade associations, trade press, company research, trade
interviews, trade sources
Table 25 Forecast Sales in Non-store Retailing by Category: Value 2010-2015
VND billion 2010 2011 2012 2013 2014 2015 Direct Selling 3,313.6 4,208.3 5,134.1 6,058.2 6,906.4 7,597.0 Homeshopping - - - - - - Internet Retailing - - - - - - Vending - - - - - - Non-Store Retailing 3,313.6 4,208.3 5,134.1 6,058.2 6,906.4 7,597.0 Source: Euromonitor International from trade associations, trade press, company research, trade interviews, trade
sources
Table 26 Forecast Sales in Non-store Retailing by Category: % Value Growth 2010-2015
% constant value growth 2010-15 CAGR 2010/15 TOTAL Direct Selling 18.1 129.3 Homeshopping - - Internet Retailing - - Vending - - Non-Store Retailing 18.1 129.3 Source: Euromonitor International from trade associations, trade press, company research, trade interviews, trade
sources
APPENDIX Operating Environment Foreign Direct Investment in Retail
Foreign companies can invest in Vietnam by many ways, such as establishing subsidiaries, joint ventures with local companies or 100% foreign invested companies. Specifically for the retailing industry, the law used to limit the amount of capital foreign partners could contribute in the local business to 49%. From 1 January 2008, the law was lifted and companies could have bigger capital contributions, yet they still needed partnerships with local players. From 1 January 2009, the new law allowed foreign companies in the retailing industry to establish 100% foreign invested companies in Vietnam. This implementation aimed to make it easier for foreign companies to enter Vietnam, which was in line with the agreement made by the government when the country joined the World Trade Organisation (WTO) in 2007. Nevertheless, the entrance of multinational companies in 2009 and 2010 was not very dynamic due to various reasons, such as the global economic crisis, complicated administration procedures and underdeveloped infrastructure.
Vietnam continues to embrace an open door policy towards foreign investors as direct foreign investment can boost jobs and consumer income, which could improve the microeconomic situation.
The government has improved infrastructure as rapidly as possible to support domestic and foreign retailers. Although the market is open and international retailers are welcomed, the companies also face strict supervision regarding currency transactions and 25% income tax on profits.
Retailing Vietnam
Euromonitor International Page 16
In the review period, the government put its effort and resources to improve its services such as shortening the time of its document process, but the document process remains complicated and time consuming in the opinion of both local and international retailers.
Informal Retailing
Informal retailing only accounts for a small part of the total market. Informal retailers are typically in the form of street vendors or websites. Street vendors can be found easily throughout the country, from urban to rural areas, and they form a part of Vietnamese culture. On the other hand, websites, which were mostly consumer-to-consumer, mushroomed over less than five years during the review period thanks to the rapid development of internet service and the modernisation of the urban population in the country.
Due to its unorganised and fragmented nature, informal retailing is usually operated by individuals. A wide range of products can be found from informal retailing, such as fresh produce from neighbouring countries like China, Cambodia and Thailand, to hand-carried luxury items from Europe and the US. The quality of these products is usually unguaranteed, and their prices are also not fixed, and subject to the negotiation and bargaining between sellers and buyers.
Whilst the traditional channel of street vendors was stagnant, websites saw rapid development over the review period. Many consumer-to-consumer websites were set up, which led to the entrance of eBay in Vietnam in 2008. However, because the consumer finance market in the country was still underdeveloped, and many consumers were still worried about the internet security system of these websites, most of the activities online were limited to advertising and product ordering.
By 2010, Vietnam’s law on intellectual property protection was still in draft despite the fact it had taken a long time to develop. Thus, informal retailing still faced not much of a threat. Moreover, the government has been known to be not very strict in terms of enforcing regulations when it comes to controlling these informal channels. Thus, consumers still had to find ways to protect themselves from potential issues when they purchased from these channels, such as counterfeit products, low-quality products or cheating.
Opening Hours
The standard opening hours of retailers are from 08:00hrs to 22:00hrs.
There are no restrictions on the number of days a store can open each year.
Due to increasing consumer need, 24-hour retailing is growing in the country. Shops that open 24 hours are usually within the grocery channels, as they cater to the late-night workers or partygoers. New modern retailers, such as the convenience stores like Circle K, Shop & Go and Family Mart, are all open 24 hours as they are located in the city centre areas and near to nightclubs and pubs.
Most retailers open on Sunday so that they can attract more shoppers. There are no restrictions for the number of hours shops can open on Sunday.
The trend towards extending shopping hours is more prominent in grocery channels due to rising consumer demand. For instant, in 2010, Big C hypermarkets extended their daily closing time from 21:30hrs to 22:30hrs. Many independent small grocers also are usually open until 23:00hrs.
Opening hours tend to be shorter in rural areas compared to urban areas, due to differences in lifestyle. As consumers in rural areas usually start and end their day earlier than in big cities, retailers also follow by opening their shops early, sometimes from 5:30hrs, and closing early.
Retail Landscape
Location is regarded as one of the most significant factors for retailers. A good location brings higher possibility of success for most retailers, including grocery and nongrocery retailing. The ideal locations are located at the central areas of big cities such as Ho Chi Minh City, Ha Noi and Da Nang. These places typically have high traffic and good infrastructure. Constantly rising leasing and rental fees in the review period made choosing a good location a difficulty for many new retailers.
Growth of rental fees in the big cities is expected to slow down in the forecast period, thanks to the rapid development of new shopping centres in 2009-2010. In addition, many retailers are finding new opportunities in suburban and rural areas to avoid the high rental fees in the major cities, and also because the majority of the market lives in these places.

Retailing Vietnam
Euromonitor International Page 17
Retailers of luxury brands are usually located in new and modern shopping centres or department stores. Some notable shopping places for luxury brands are The Opera Business Centre, Luxury Mall, Vincom and Saigon Paragon. They are well-known shopping centres where consumers and tourists can enjoy shopping for many international luxurious brands of clothing, cosmetics or jewellery.
As traditional retailers still contribute a major portion of the Vietnam retailing industry, shopping malls did not any major effects on these retailers over the review period. Moreover, as the target markets of the shopping malls and traditional retailers are very distinct, these channels are not directly competing with each other.
Cash-and-carry
Cash-and-carry still does not play an important role in the retail industry. At the end of the review period, there was only one player operating in this environment – Metro Cash & Carry by Metro AG.
Cash-and-carry outlets offer diversified product portfolios, and target mostly small retailers or companies. The key purchasers in cash-and-carry are companies, restaurants and hotels, which usually purchase in large quantities. The core concept of cash-and-carry is wholesaling. Consequently, individual consumers are not encouraged in this channel.
Consumers who want to go to Metro Cash & Carry have to obtain a membership card. Each company is allowed to register up to three membership cards. In addition, the procedure of getting a membership of Metro Cash & Carry is quite complicated. It requires several legal documents, including the company’s licence, VAT code registration and letter of introduction, and a list of the company’s staff. Self-employed individuals need to show their tax receipt or the VAT registration of their business. Despite these difficulties, there were still many consumers trying to get Metro Cash & Carry membership, as they believed the goods there were cheaper than in other channels.
In 2010, cash-and-carry faced strong competition from other grocery channels such as supermarkets and hypermarkets. Earlier, Metro was considered the only place that could offer consumers a wide range of products at the cheapest price in a pleasant atmosphere. However, in the review period, players such as Big C and Co.opMart constantly tried to reduce their prices and enhance their shopping environment, which made them more directly competitive with Metro. As a result, although cash-and-carry still achieved growth over the review period, its performance was not as significant as other channels such as supermarkets and hypermarkets.
By the end of 2010, there were 12 outlets of Metro Cash & Carry in Vietnam, located mostly in big cities and provinces, such as Ho Chi Minh City, Ha Noi, Can Tho, Hai Phong, Da Nang and Binh Duong. The company is expected to continue increasing its number of outlets over the forecast period.
In the cash-and-carry environment in 2010, Metro Cash & Carry still enjoyed its monopoly position. Metro has been trying to provide its customers a wide range of products at the lowest prices, along with a high standard of service. This is achieved through professional management methodology, an efficient supply chain and well-trained staff.
Table 27 Cash-and-carry: Sales Value 2004-2010
Sales value VND billion, current prices 2008 2009 2010 Cash-and-carry 8,088 8,678 10,848 % growth – 7.3 25.0 Source: Official statistics, trade associations, trade press, company research, trade interviews, Euromonitor International
estimates Note: Sales value excludes VAT, sales tax
Table 28 Cash-and-carry: Sales by National Brand Owner: Sales Value 2006-2010
VND billion, current prices Company (NBO) Brand(s) 2008 2009 2010 Metro Cash & Carry Metro Cash & Carry 8,088 8,678 10,848
Retailing Vietnam
Euromonitor International Page 18
Vietnam Co Ltd Source: Trade associations, trade press, company research, trade interviews, Euromonitor International estimates Note: Sales value excludes VAT, sales tax
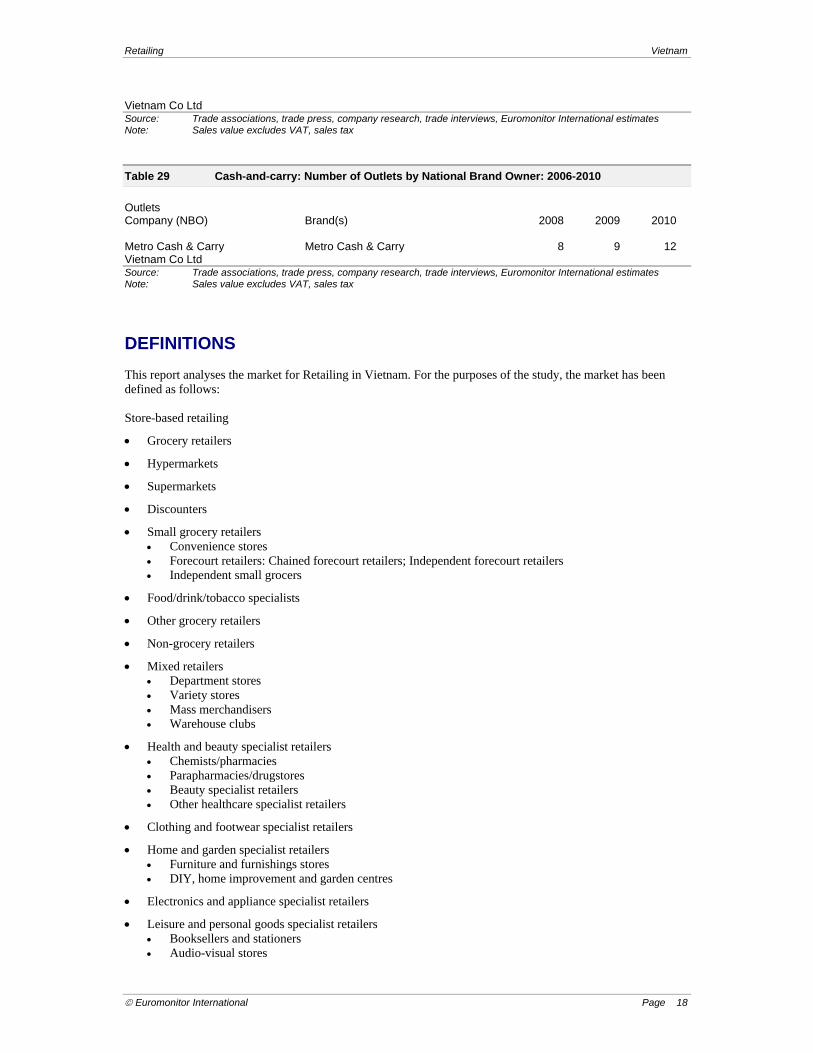
Table 29 Cash-and-carry: Number of Outlets by National Brand Owner: 2006-2010
Outlets Company (NBO) Brand(s) 2008 2009 2010 Metro Cash & Carry Metro Cash & Carry 8 9 12 Vietnam Co Ltd Source: Trade associations, trade press, company research, trade interviews, Euromonitor International estimates Note: Sales value excludes VAT, sales tax
DEFINITIONS This report analyses the market for Retailing in Vietnam. For the purposes of the study, the market has been defined as follows: Store-based retailing
Grocery retailers
Hypermarkets
Supermarkets
Discounters
Small grocery retailers Convenience stores Forecourt retailers: Chained forecourt retailers; Independent forecourt retailers Independent small grocers
Food/drink/tobacco specialists
Other grocery retailers
Non-grocery retailers
Mixed retailers Department stores Variety stores Mass merchandisers Warehouse clubs
Health and beauty specialist retailers Chemists/pharmacies Parapharmacies/drugstores Beauty specialist retailers Other healthcare specialist retailers
Clothing and footwear specialist retailers
Home and garden specialist retailers Furniture and furnishings stores DIY, home improvement and garden centres
Electronics and appliance specialist retailers
Leisure and personal goods specialist retailers Booksellers and stationers Audio-visual stores

Retailing Vietnam
Euromonitor International Page 19
Toys and games stores Sports goods stores Pet shops and superstores Other leisure and personal goods specialist retailers
Other non-grocery retailers Non-store retailing
Vending
Homeshopping
Internet retailing
Direct selling Explanations of words and/or terminology used in this report are as follows:
Enter local word/terminology and explanation Other terminology:
GBO refers to Global Brand Owner, which is the ultimate owner of a brand.
NBO refers to National Brand Owner, which is the company licensed to distribute a brand on behalf of a GBO. The NBO may be a subsidiary of a GBO or it may be a completely separate company. Share tables at both GBO and at NBO level are provided in the report. Reference to shares in the report analysis is at NBO level.
Sources used during research include the following:
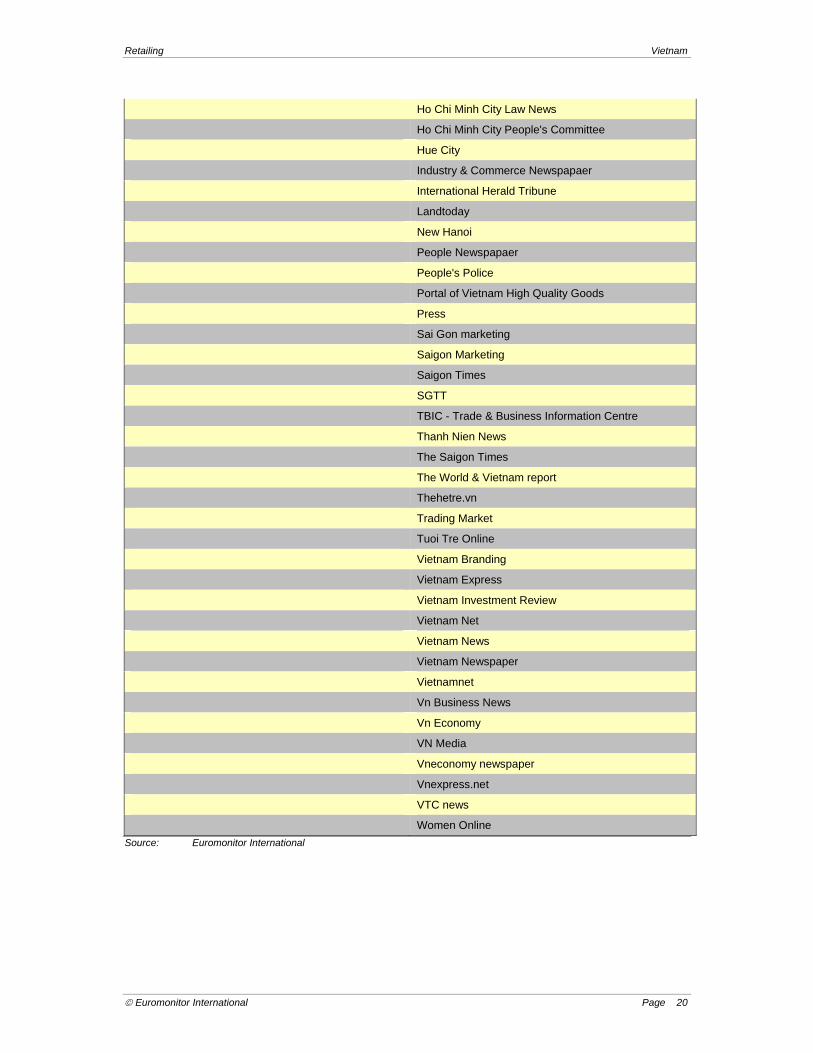
Summary 1 Research Sources
Official Sources Agro Info
American Chamber of Commerce in Vietnam
Department of Animal Health of Vietnam
General Department of Vietnam Custom
General Statistics Office of Vietnam
Hanoi Department of Trade
Ho Chi Minh Department of Trade
Investment & Trade Promotion Centre (ITPC)
Ministry of Health of Vietnam (MOH)
Ministry of Trade (MOT)
Trade Associations Association of Vietnam Retailers
Hanoi Supermarket Association
Vietnam Agriculture Portal
Trade Press Binh Duong Newspaper
Dan Tri Newspaper
Doanh Nghiep
Economics & Development
Embassy of Denmark, Vietnam
Enterprise Forum newspaper
Hanoi Trade
Retailing Vietnam
Euromonitor International Page 20
Ho Chi Minh City Law News
Ho Chi Minh City People's Committee
Hue City
Industry & Commerce Newspapaer
International Herald Tribune
Landtoday
New Hanoi
People Newspapaer
People's Police
Portal of Vietnam High Quality Goods
Press
Sai Gon marketing
Saigon Marketing
Saigon Times
SGTT
TBIC - Trade & Business Information Centre
Thanh Nien News
The Saigon Times
The World & Vietnam report
Thehetre.vn
Trading Market
Tuoi Tre Online
Vietnam Branding
Vietnam Express
Vietnam Investment Review
Vietnam Net
Vietnam News
Vietnam Newspaper
Vietnamnet
Vn Business News
Vn Economy
VN Media
Vneconomy newspaper
Vnexpress.net
VTC news
Women Online
Source: Euromonitor International