retail: uk christmas seasonality 2017
TRANSCRIPT

Retail: Christmas
2017UK Bing Network 2017
List of Contents:
1. What’s the Industry saying?
2. Bing Ads Trends & KPIs
3. Ad Copy Analysis
4. Festive Go Dos

According to IMRG Capgemini that’s £18bn or 16% more than spent online in 2015
+47%Sales made via smartphones during Dec were up 47% YoY
-3%Sales made on tablets for the same period were down 3% YoY
£25bn*Spent online over 42 day 2016 Christmas period, which was a 16% increase on 2015
* Christmas period defined as 13 Nov – 24 Dec, 2016
Source: 1. IMRG Capgemini - 16 Jan, 2017
2. IMRG SimilarWeb – Black Friday online sales performance update. 29 Nov, 2016
£1.23bnSpent on Black Friday saw a 12% increase for same day in 2015
1
1 1 1
2
UK online sales exceeded £130 billion in 2016, fuelled by sales growth on Smartphones
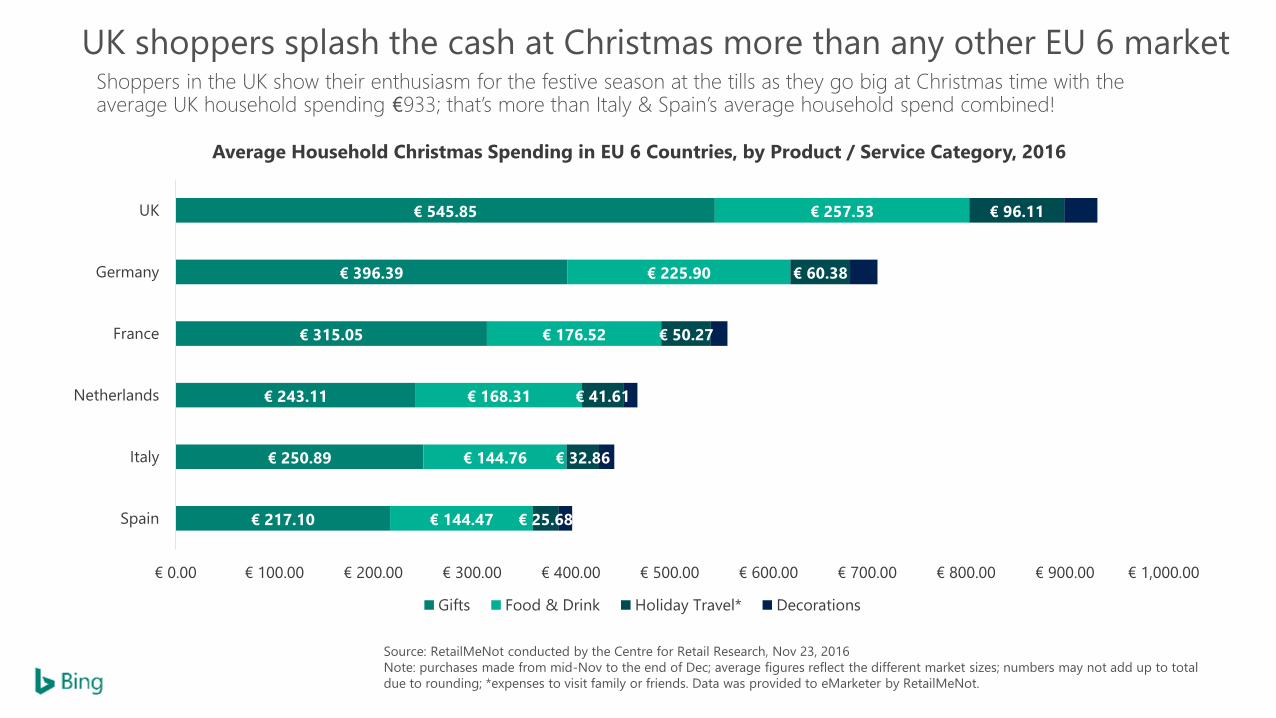
UK shoppers splash the cash at Christmas more than any other EU 6 market
€ 217.10
€ 250.89
€ 243.11
€ 315.05
€ 396.39
€ 545.85
€ 144.47
€ 144.76
€ 168.31
€ 176.52
€ 225.90
€ 257.53
€ 25.68
€ 32.86
€ 41.61
€ 50.27
€ 60.38
€ 96.11
€ 0.00 € 100.00 € 200.00 € 300.00 € 400.00 € 500.00 € 600.00 € 700.00 € 800.00 € 900.00 € 1,000.00
Spain
Italy
Netherlands
France
Germany
UK
Average Household Christmas Spending in EU 6 Countries, by Product / Service Category, 2016
Gifts Food & Drink Holiday Travel* Decorations
Shoppers in the UK show their enthusiasm for the festive season at the tills as they go big at Christmas time with the average UK household spending €933; that’s more than Italy & Spain’s average household spend combined!
Source: RetailMeNot conducted by the Centre for Retail Research, Nov 23, 2016
Note: purchases made from mid-Nov to the end of Dec; average figures reflect the different market sizes; numbers may not add up to total
due to rounding; *expenses to visit family or friends. Data was provided to eMarketer by RetailMeNot.
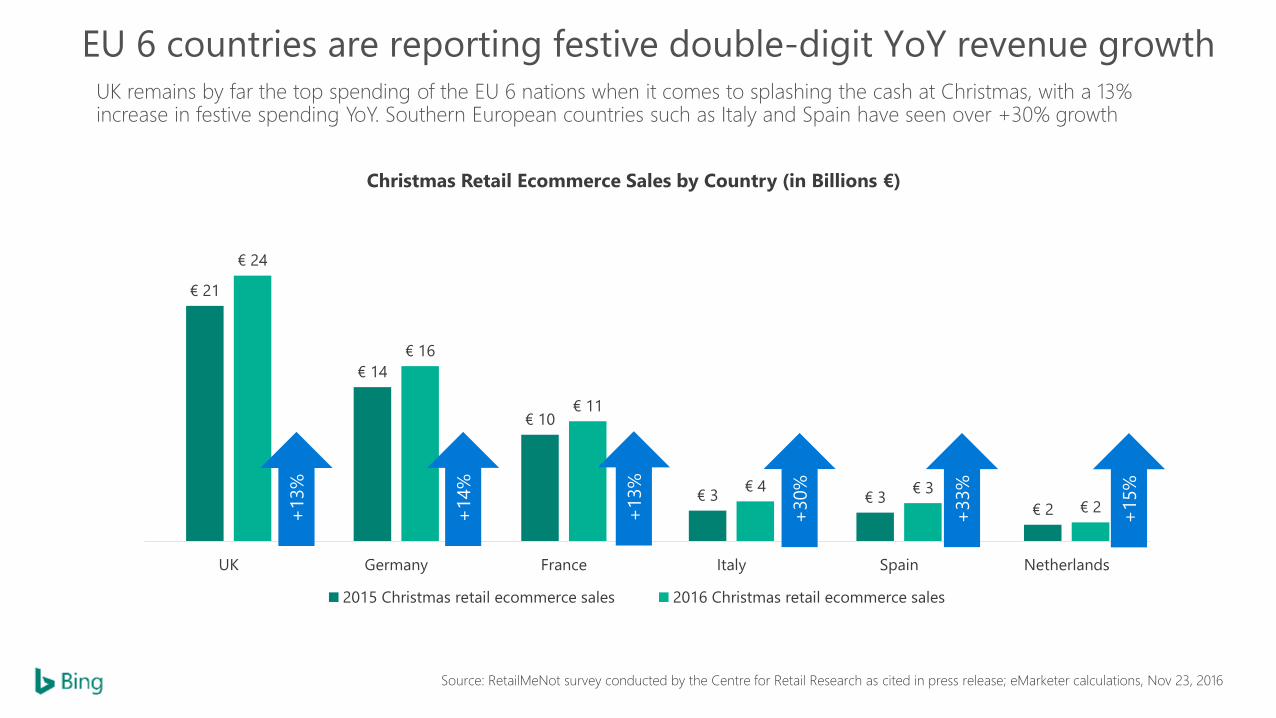
EU 6 countries are reporting festive double-digit YoY revenue growthUK remains by far the top spending of the EU 6 nations when it comes to splashing the cash at Christmas, with a 13% increase in festive spending YoY. Southern European countries such as Italy and Spain have seen over +30% growth
€ 21
€ 14
€ 10
€ 3 € 3€ 2
€ 24
€ 16
€ 11
€ 4 € 3
€ 2
0
5
10
15
20
25
30
UK Germany France Italy Spain Netherlands
Christmas Retail Ecommerce Sales by Country (in Billions €)
2015 Christmas retail ecommerce sales 2016 Christmas retail ecommerce sales
Source: RetailMeNot survey conducted by the Centre for Retail Research as cited in press release; eMarketer calculations, Nov 23, 2016
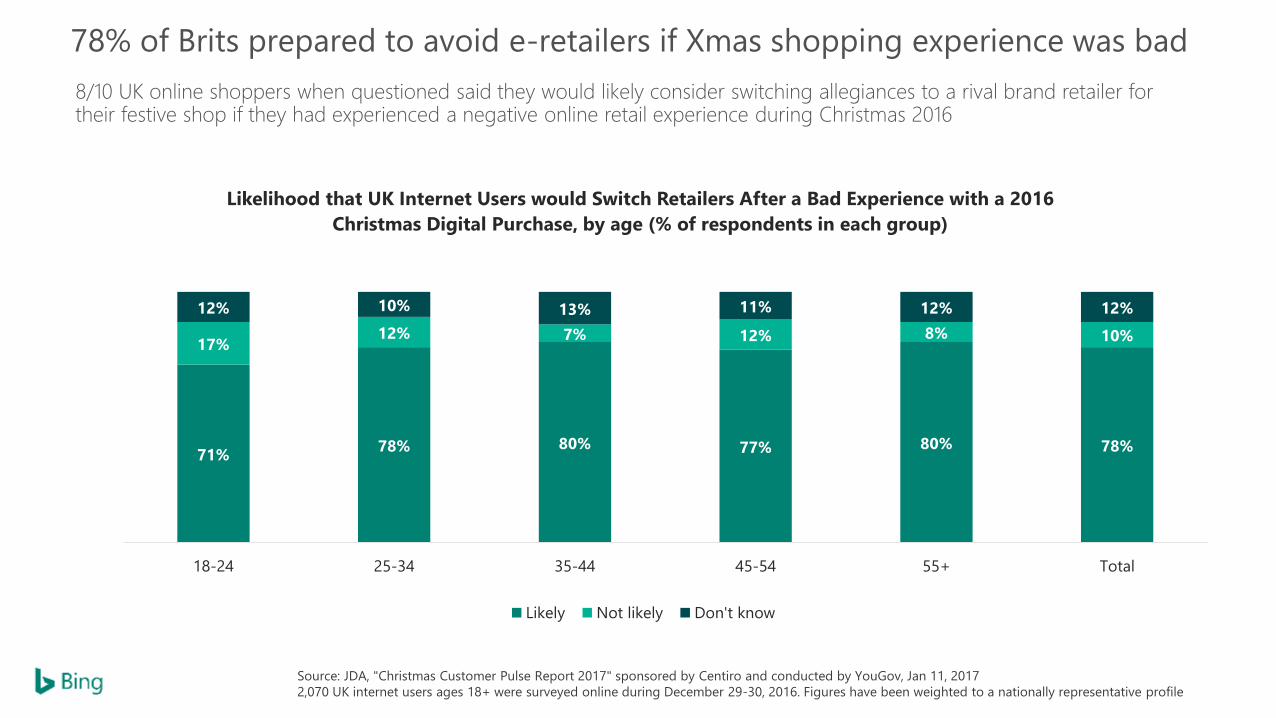
78% of Brits prepared to avoid e-retailers if Xmas shopping experience was bad
8/10 UK online shoppers when questioned said they would likely consider switching allegiances to a rival brand retailer for their festive shop if they had experienced a negative online retail experience during Christmas 2016
71%78% 80% 77% 80% 78%
17%12% 7% 12% 8% 10%
12% 10% 13% 11% 12% 12%
0%
10%
20%
30%
40%
50%
60%
70%
80%
90%
100%
18-24 25-34 35-44 45-54 55+ Total
Likelihood that UK Internet Users would Switch Retailers After a Bad Experience with a 2016
Christmas Digital Purchase, by age (% of respondents in each group)
Likely Not likely Don't know
Source: JDA, "Christmas Customer Pulse Report 2017" sponsored by Centiro and conducted by YouGov, Jan 11, 2017
2,070 UK internet users ages 18+ were surveyed online during December 29-30, 2016. Figures have been weighted to a nationally representative profile
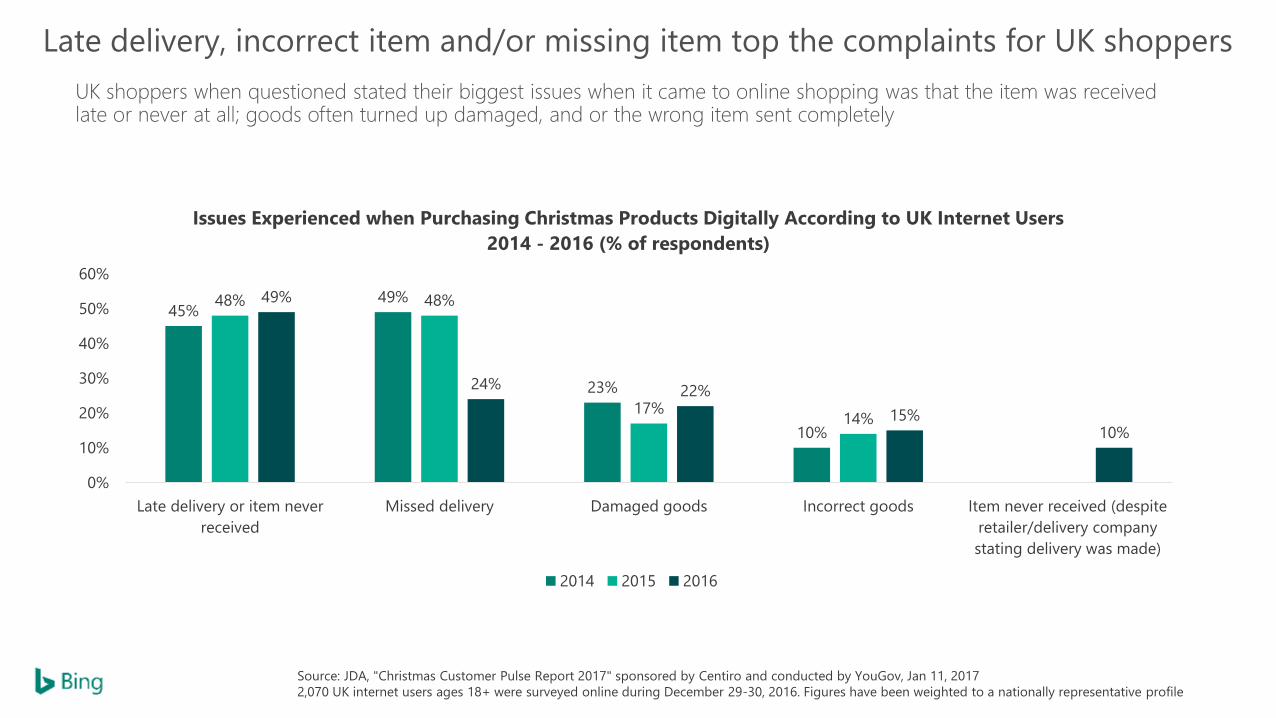
Late delivery, incorrect item and/or missing item top the complaints for UK shoppers
UK shoppers when questioned stated their biggest issues when it came to online shopping was that the item was received late or never at all; goods often turned up damaged, and or the wrong item sent completely
Source: JDA, "Christmas Customer Pulse Report 2017" sponsored by Centiro and conducted by YouGov, Jan 11, 2017
2,070 UK internet users ages 18+ were surveyed online during December 29-30, 2016. Figures have been weighted to a nationally representative profile
45%49%
23%
10%
48% 48%
17%14%
49%
24% 22%
15%10%
0%
10%
20%
30%
40%
50%
60%
Late delivery or item never
received
Missed delivery Damaged goods Incorrect goods Item never received (despite
retailer/delivery company
stating delivery was made)
Issues Experienced when Purchasing Christmas Products Digitally According to UK Internet Users
2014 - 2016 (% of respondents)
2014 2015 2016
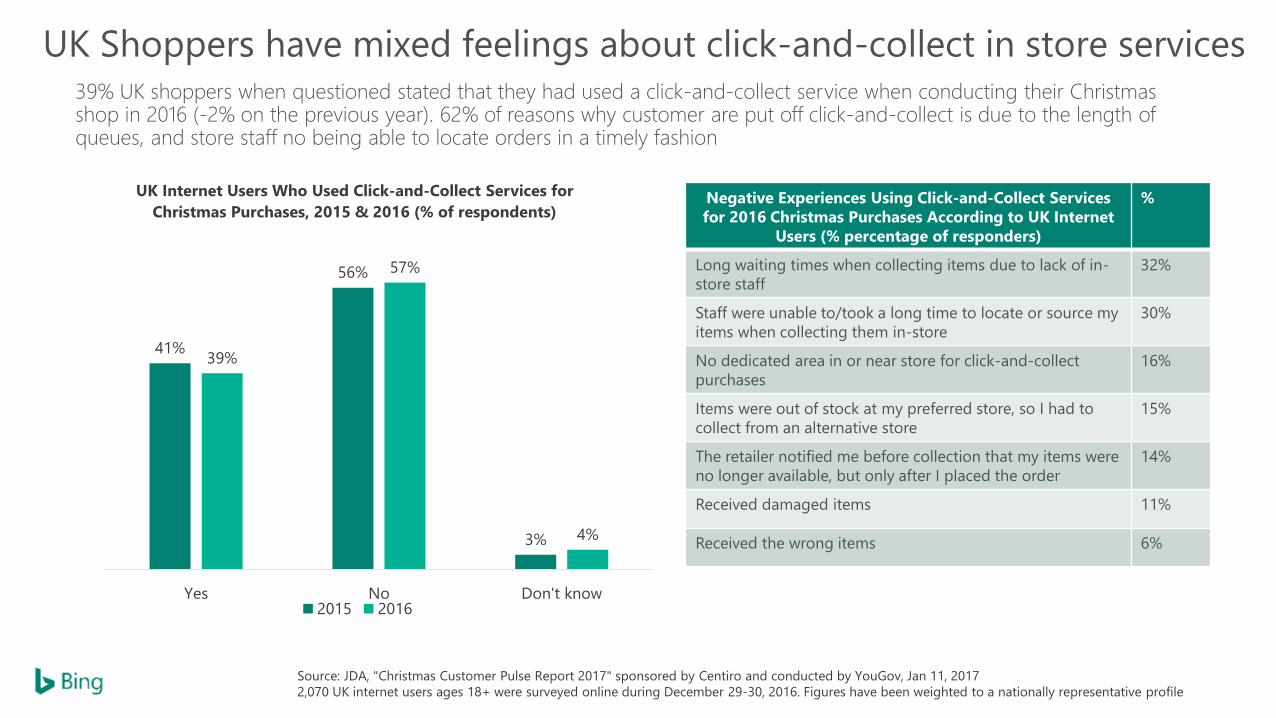
UK Shoppers have mixed feelings about click-and-collect in store services39% UK shoppers when questioned stated that they had used a click-and-collect service when conducting their Christmas shop in 2016 (-2% on the previous year). 62% of reasons why customer are put off click-and-collect is due to the length of queues, and store staff no being able to locate orders in a timely fashion
Source: JDA, "Christmas Customer Pulse Report 2017" sponsored by Centiro and conducted by YouGov, Jan 11, 2017
2,070 UK internet users ages 18+ were surveyed online during December 29-30, 2016. Figures have been weighted to a nationally representative profile
41%
56%
3%
39%
57%
4%
0%
10%
20%
30%
40%
50%
60%
Yes No Don't know
UK Internet Users Who Used Click-and-Collect Services for
Christmas Purchases, 2015 & 2016 (% of respondents)
2015 2016
Negative Experiences Using Click-and-Collect Services
for 2016 Christmas Purchases According to UK Internet
Users (% percentage of responders)
%
Long waiting times when collecting items due to lack of in-
store staff
32%
Staff were unable to/took a long time to locate or source my
items when collecting them in-store
30%
No dedicated area in or near store for click-and-collect
purchases
16%
Items were out of stock at my preferred store, so I had to
collect from an alternative store
15%
The retailer notified me before collection that my items were
no longer available, but only after I placed the order
14%
Received damaged items 11%
Received the wrong items 6%


Age
are
male and
female
UK Online Shopper Demographic
What does the Bing Audience look like?
of
Bing users are under the age of 45
61%
Gender
51% | 49%
Income
are
in their country’s top earning
24%
Education
of
the audience are degree educated
42%
Children
have at least one child in the household
54%
Age
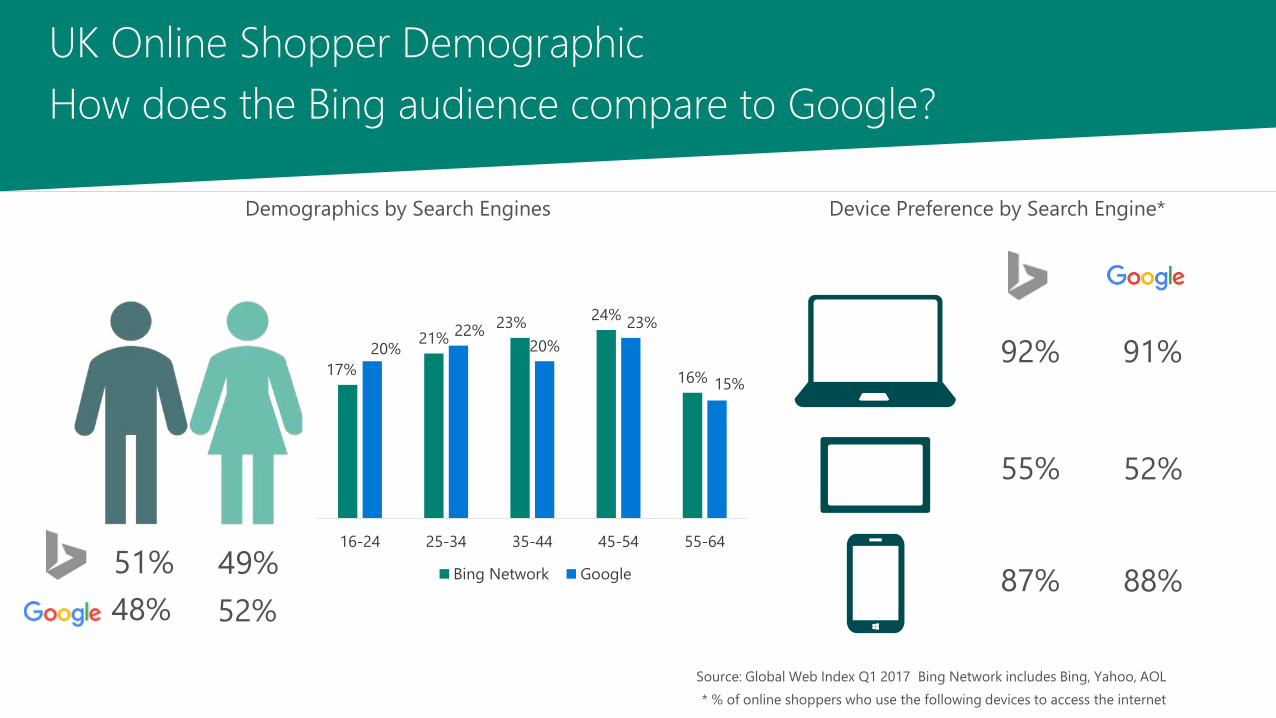
Age
17%
21%23%
24%
16%
20%22%
20%
23%
15%
16-24 25-34 35-44 45-54 55-64
Bing Network Google
UK Online Shopper Demographic
How does the Bing audience compare to Google?
What are we seeing on Bing Ads?Search patterns in 2016-2017

MethodologyMethodology
• UK Market
• Top 311,559 Retail search queries based on
volume
• Analysis period: Sept 2016 – Jan 2017 (inclusive)
Objectives
• Identify Retail related Christmas shopping trends
• What does the Bing searcher look like?
• What are their behaviours?
• Advertiser opportunities

111% 189% 163%
113% 108% 128% 116% 111% 100%
108% 137% 123%
105% 125% 122% 118% 101% 117% 100%
106% 156% 155% 104%
92% 89% 89% 83% 95% 105% 131% 126% 104% 92% 104% 90%
0
1
2
3
4
5
6
7
8Apr May
Clothing &
Accessories
All Up
Retail
Beauty &
Personal Care
Books, Film,
Games & Music
Consumer
Electronics
Source: Search volume data indexed to average monthly volume in 2016 - 2017 on UK Bing & Yahoo sites, all devices
Daily Deals &
Coupons
Annual search query peaks for Retail sub-verticals on Bing Ads in the UK
2016Aug Sept
2017May June July Oct Nov Dec Jan Feb Mar Apr
20172016
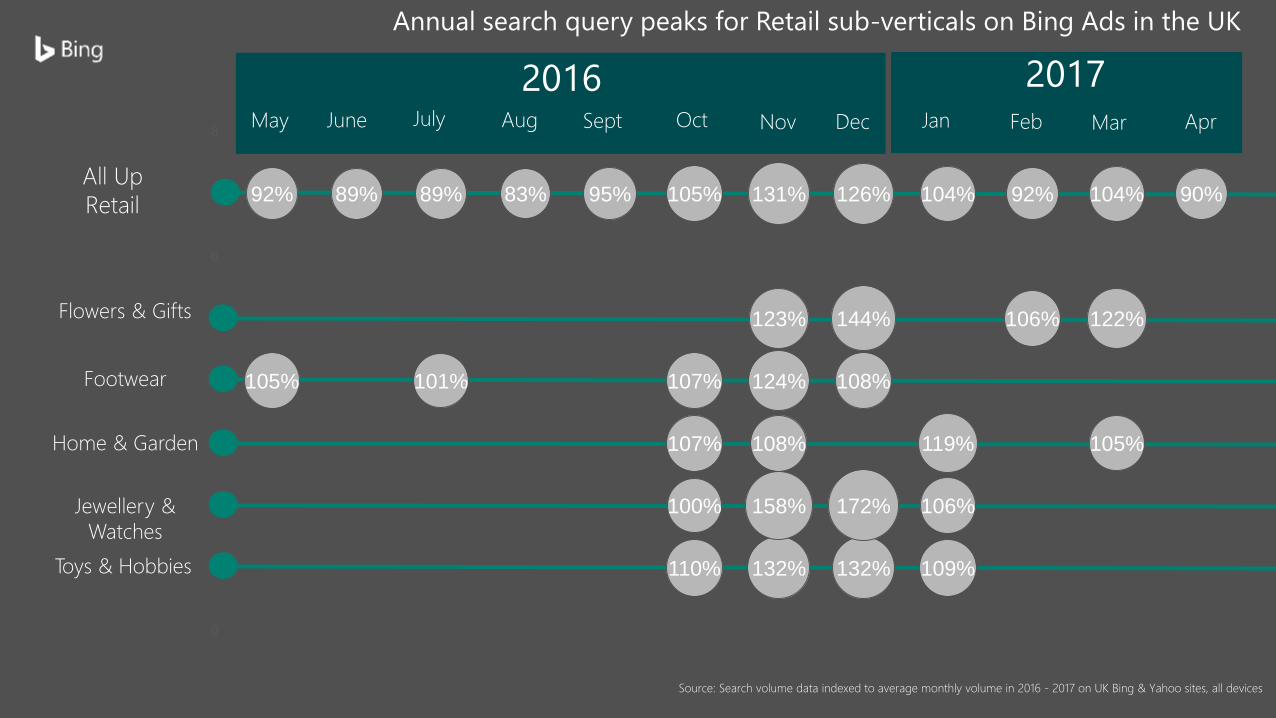
110% 132% 132% 109%
100% 158% 172% 106%
107% 108% 119% 105%
105% 101% 107% 124% 108%
123% 144% 106% 122%
92% 89% 89% 83% 95% 105% 131% 126% 104% 92% 104% 90%
0
1
2
3
4
5
6
7
8May June July Aug Sept Oct Nov Dec Jan Feb Mar Apr
Home & Garden
All Up
Retail
Flowers & Gifts
Footwear
Jewellery &
Watches
Toys & Hobbies
Annual search query peaks for Retail sub-verticals on Bing Ads in the UK
Source: Search volume data indexed to average monthly volume in 2016 - 2017 on UK Bing & Yahoo sites, all devices

0%
20%
40%
60%
80%
100%
120%
140%
Impressions Clicks
* UK Bing and Yahoo sites, all devices, 01 Sept, 2016 – 31 Jan, 2017
Retail Christmas searches start to ramp from end of October
Christmas Retail Impressions and Clicks indexed to the average daily volume*
Black Friday
Boxing DayManic Monday
Cyber Monday
Halloween
Yet, Christmas Retail is really made in a window of opportunity spanning 42 day (13 Nov – 24 Dec)
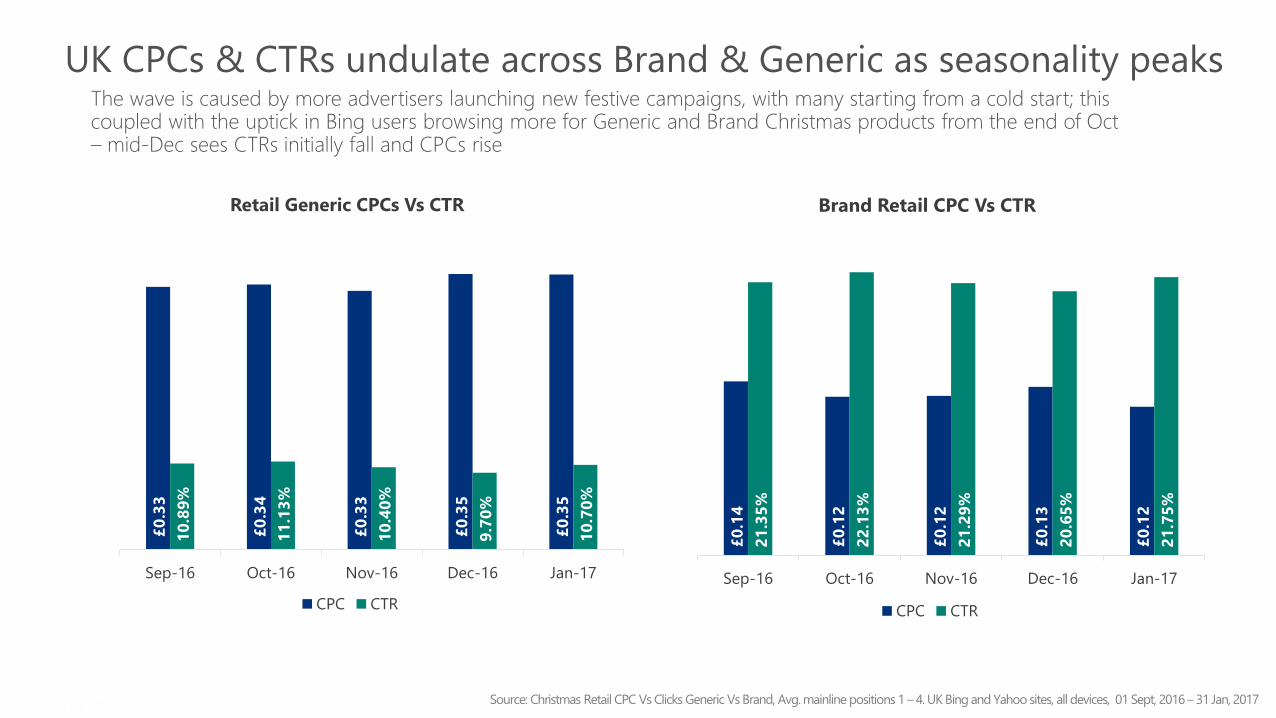
Source: Christmas Retail CPC Vs Clicks Generic Vs Brand, Avg. mainline positions 1 – 4. UK Bing and Yahoo sites, all devices, 01 Sept, 2016 – 31 Jan, 2017
UK CPCs & CTRs undulate across Brand & Generic as seasonality peaksThe wave is caused by more advertisers launching new festive campaigns, with many starting from a cold start; this coupled with the uptick in Bing users browsing more for Generic and Brand Christmas products from the end of Oct – mid-Dec sees CTRs initially fall and CPCs rise
£0
.33
£0
.34
£0
.33
£0
.35
£0
.35
10
.89
%
11
.13
%
10
.40
%
9.7
0%
10
.70
%
£-
£0.05
£0.10
£0.15
£0.20
£0.25
£0.30
£0.35
£0.40
Sep-16 Oct-16 Nov-16 Dec-16 Jan-17
Retail Generic CPCs Vs CTR
CPC CTR
£0
.14
£0
.12
£0
.12
£0
.13
£0
.12
21
.35
%
22
.13
%
21
.29
%
20
.65
%
21
.75
%
£0.00
£0.05
£0.10
£0.15
£0.20
£0.25
Sep-16 Oct-16 Nov-16 Dec-16 Jan-17
Brand Retail CPC Vs CTR
CPC CTR
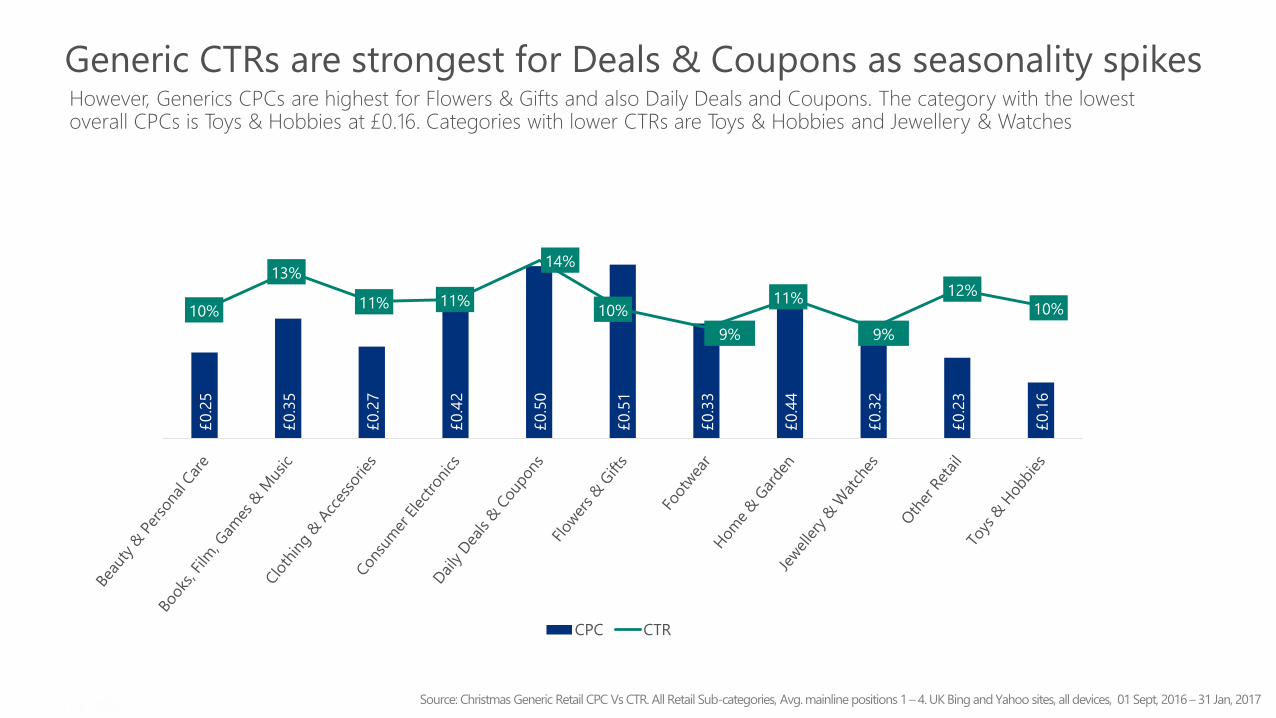
Source: Christmas Generic Retail CPC Vs CTR. All Retail Sub-categories, Avg. mainline positions 1 – 4. UK Bing and Yahoo sites, all devices, 01 Sept, 2016 – 31 Jan, 2017
Generic CTRs are strongest for Deals & Coupons as seasonality spikesHowever, Generics CPCs are highest for Flowers & Gifts and also Daily Deals and Coupons. The category with the lowest overall CPCs is Toys & Hobbies at £0.16. Categories with lower CTRs are Toys & Hobbies and Jewellery & Watches
£0.2
5
£0.3
5
£0.2
7
£0.4
2
£0.5
0
£0.5
1
£0.3
3
£0.4
4
£0.3
2
£0.2
3
£0.1
6
10%
13%
11% 11%
14%
10%
9%
11%
9%
12%10%
0.00%
2.00%
4.00%
6.00%
8.00%
10.00%
12.00%
14.00%
16.00%
£0.00
£0.10
£0.20
£0.30
£0.40
£0.50
£0.60
CPC CTR

Source: Christmas Retail CPC Vs CTR analysis, Generic Vs Brand, Avg by device type. mainline positions 1 – 4. UK Bing and Yahoo sites, 01 Sept, 2016 – 31 Jan, 2017
CPCs are cheaper on Mobile, but bang for buck PC & Tablet are betterDue to the relationship that Bing shares with Windows 10, overall search volume share for Retail on PC remains on avg. 65%. Despite the increasing volume of Smartphone and Tablet devices, Bing Ads customers get greater bang for buck when bidding on brand keywords on PC; whilst some Retail generics work better on Tablet and/or Mobile
£0.3
6
£0.2
4
£0.3
6
10%
11%
12%
£-
£0.05
£0.10
£0.15
£0.20
£0.25
£0.30
£0.35
£0.40
PC Smartphone Tablet
Retail Generic CPC Vs CTR by Device
CPC CTR
£0.1
3
£0.1
1
£0.1
3
23%
17%
19%
£-
£0.05
£0.10
£0.15
£0.20
£0.25
PC Smartphone Tablet
Retail Brand CPCs Vs CTR by Device
CPC CTR
* UK Bing and Yahoo sites, all devices, 01 Oct, 2016 – 31 Jan, 2017
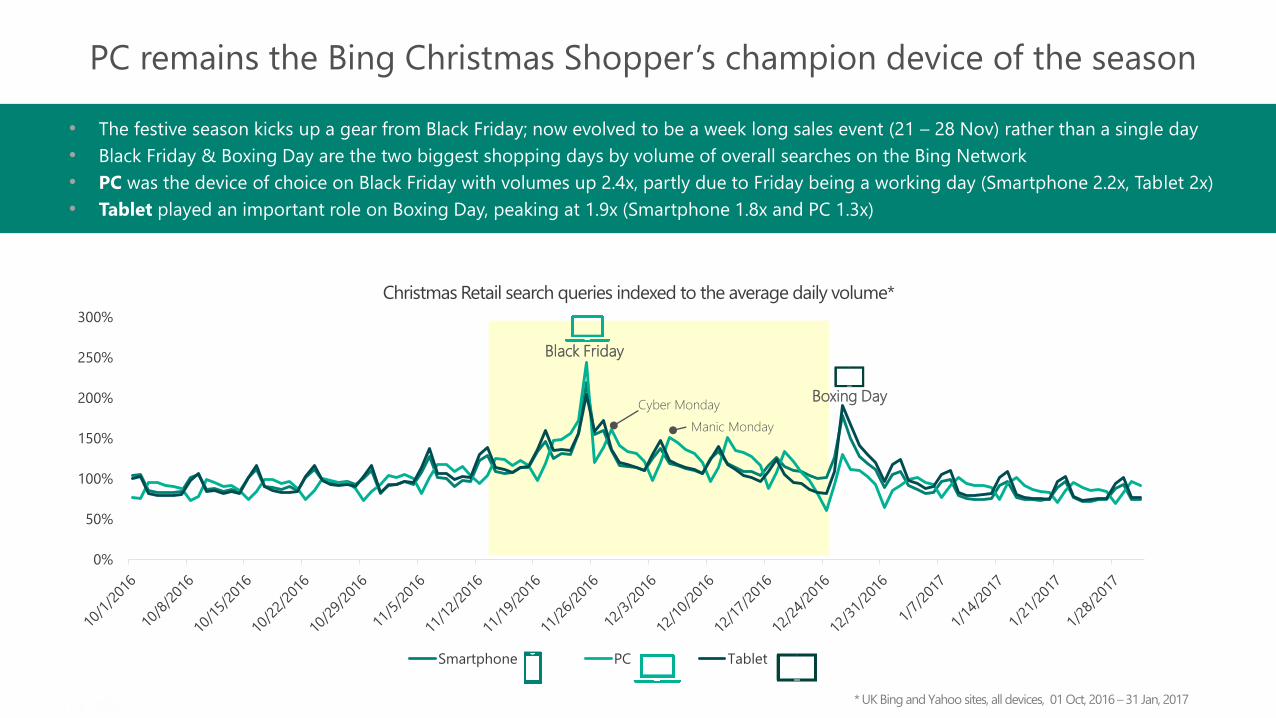
• The festive season kicks up a gear from Black Friday; now evolved to be a week long sales event (21 – 28 Nov) rather than a single day
• Black Friday & Boxing Day are the two biggest shopping days by volume of overall searches on the Bing Network
• PC was the device of choice on Black Friday with volumes up 2.4x, partly due to Friday being a working day (Smartphone 2.2x, Tablet 2x)
• Tablet played an important role on Boxing Day, peaking at 1.9x (Smartphone 1.8x and PC 1.3x)
PC remains the Bing Christmas Shopper’s champion device of the season
Christmas Retail search queries indexed to the average daily volume*
0%
50%
100%
150%
200%
250%
300%
Smartphone PC Tablet
Black Friday
Boxing Day
Manic Monday
Cyber Monday

Top 10 UK retail shopping days that made Christmas
Nov DecNov 2016
M Tu W Th F Sa Su
1 2 3 4 5 6
7 8 9 10 11 12 13
14 15 16 17 18 19 20
21 22 23 24 25 26 27
28 29 30
- All Devices -1. 25-Nov (Black Friday)
2. 24-Nov
3. 28-Nov (Cyber Monday)
4. 26-Dec (Boxing Day)
5. 27-Nov
6. 23-Nov
7. 22-Nov
8. 21-Nov
9. 05-Dec (Manic Monday)
10. 12-Dec
Top 10 days by retail search volume during the Christmas Period on Bing Network, split by device
Top retail search volume days by daily volume for Nov-Dec 2016, all devices. The Bing Network includes Microsoft and Yahoo sites in the United Kingdom
7/10 of the top retail activity days took place on the last
week of November in 2016
Black Friday in 2017 falls on 24 November
Nov Nov NovDec Dec Dec
Dec 2016
M Tu W Th F Sa Su
1 2 3 4
5 6 7 8 9 10 11
12 13 14 15 16 17 18
19 20 21 22 23 24 25
26 27 28 29 30 31
Dec
Nov 2016
M Tu W Th F Sa Su
1 2 3 4 5 6
7 8 9 10 11 12 13
14 15 16 17 18 19 20
21 22 23 24 25 26 27
28 29 30
Nov 2016
M Tu W Th F Sa Su
1 2 3 4 5 6
7 8 9 10 11 12 13
14 15 16 17 18 19 20
21 22 23 24 25 26 27
28 29 30
Nov 2016
M Tu W Th F Sa Su
1 2 3 4 5 6
7 8 9 10 11 12 13
14 15 16 17 18 19 20
21 22 23 24 25 26 27
28 29 30
Dec 2016
M Tu W Th F Sa Su
1 2 3 4
5 6 7 8 9 10 11
12 13 14 15 16 17 18
19 20 21 22 23 24 25
26 27 28 29 30 31
Dec 2016
M Tu W Th F Sa Su
1 2 3 4
5 6 7 8 9 10 11
12 13 14 15 16 17 18
19 20 21 22 23 24 25
26 27 28 29 30 31
Dec 2016
M Tu W Th F Sa Su
1 2 3 4
5 6 7 8 9 10 11
12 13 14 15 16 17 18
19 20 21 22 23 24 25
26 27 28 29 30 31
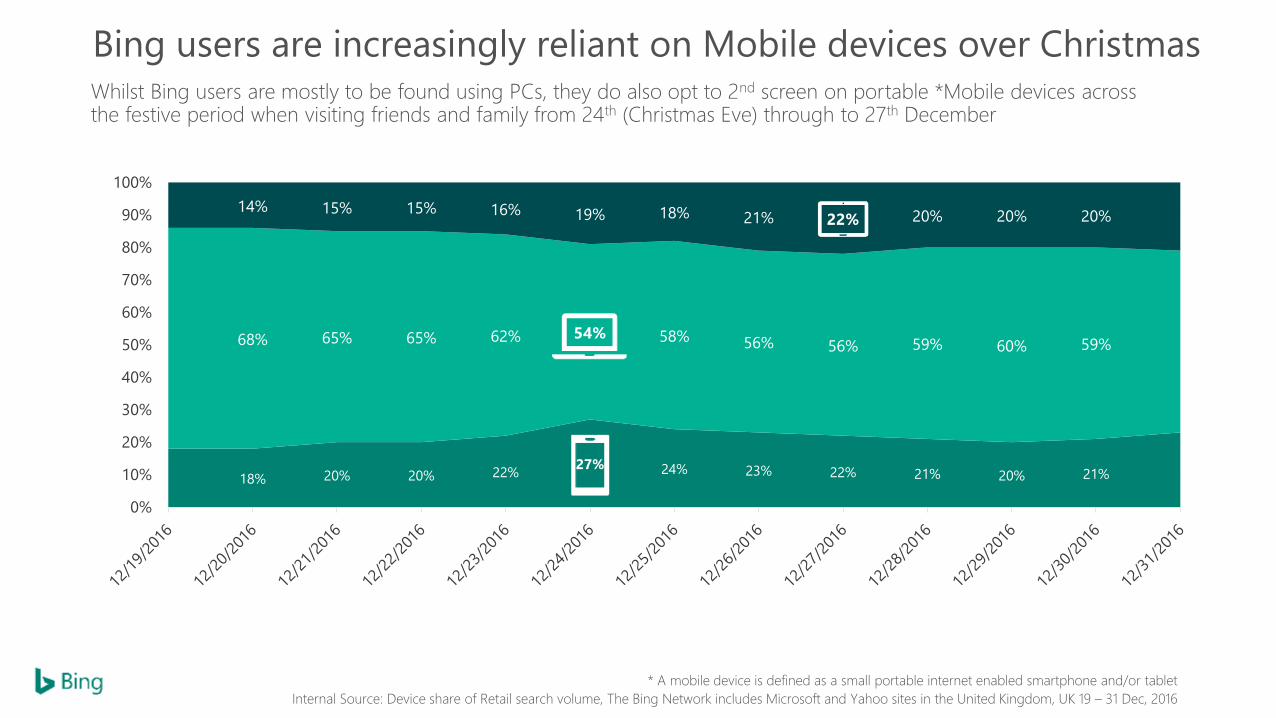
18% 20% 20% 22%27% 24% 23% 22% 21% 20% 21%
68% 65% 65% 62% 54% 58% 56% 56% 59% 60% 59%
14% 15% 15% 16% 19% 18% 21% 22% 20% 20% 20%
0%
10%
20%
30%
40%
50%
60%
70%
80%
90%
100%
* A mobile device is defined as a small portable internet enabled smartphone and/or tablet
Internal Source: Device share of Retail search volume, The Bing Network includes Microsoft and Yahoo sites in the United Kingdom, UK 19 – 31 Dec, 2016
Bing users are increasingly reliant on Mobile devices over ChristmasWhilst Bing users are mostly to be found using PCs, they do also opt to 2nd screen on portable *Mobile devices across the festive period when visiting friends and family from 24th (Christmas Eve) through to 27th December

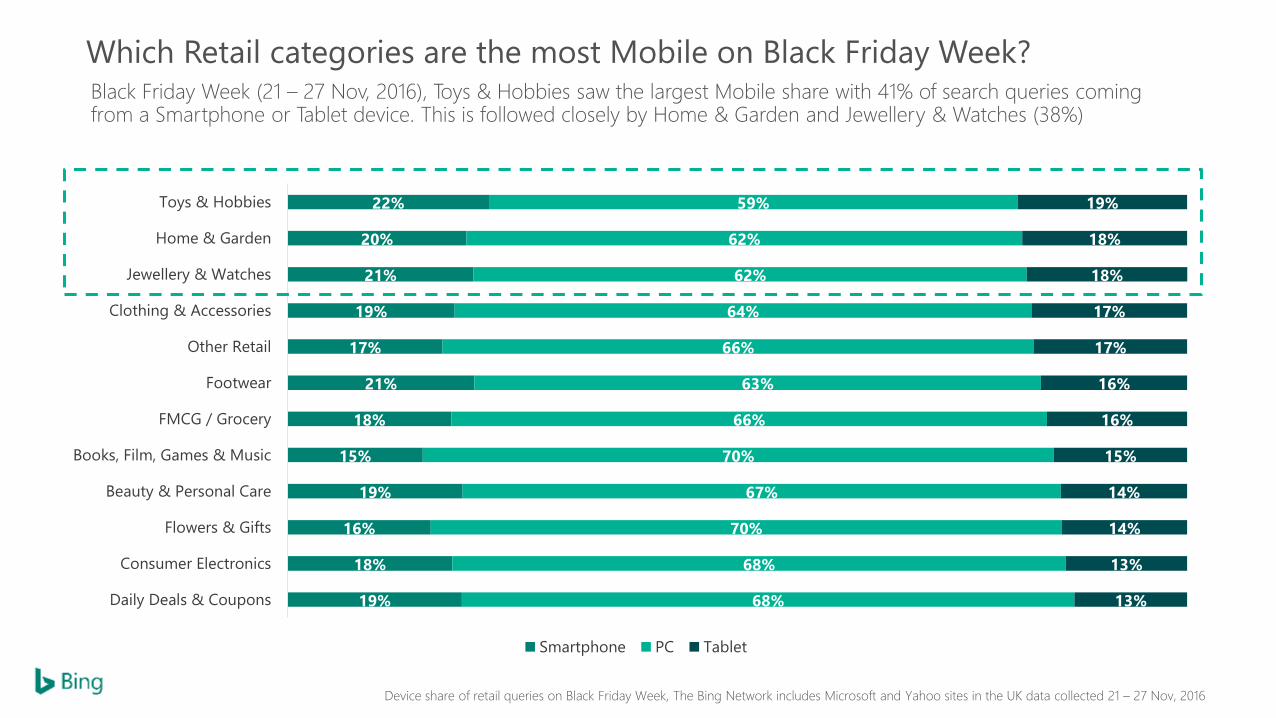
22% 22% 22% 20% 20% 19% 19% 19% 19% 18% 16% 16%
58% 61% 61% 66% 64% 62% 63% 69% 69%65% 69% 70%
21% 17% 17% 14% 15% 19% 18% 12% 12% 17% 15% 14%
Toys &
Hobbies
Footwear Jewellery &
Watches
Beauty &
Personal
Care
FMCG /
Grocery
Home &
Garden
Clothing &
Accessories
Daily Deals
& Coupons
Consumer
Electronics
Other Retail Books, Film,
Games &
Music
Flowers &
Gifts
Smartphone PC Tablet
Internal Source: Device share of Retail search volume, The Bing Network includes Microsoft and Yahoo sites in the UK, Sept 2016 - Jan 2017
* A mobile device is defined as a small portable internet enabled smartphone and/or tablet
Which Retail categories have the highest Mobile device share?
• PC is still the #1 device of choice for many seasonal shoppers on Bing with search volumes avg. 65%, whilst Mobile devices* account on avg. 35% of all searches
• Toys & Hobbies is the category that sees the largest Mobile share, whereas Flowers & Gifts remains firmly with PC
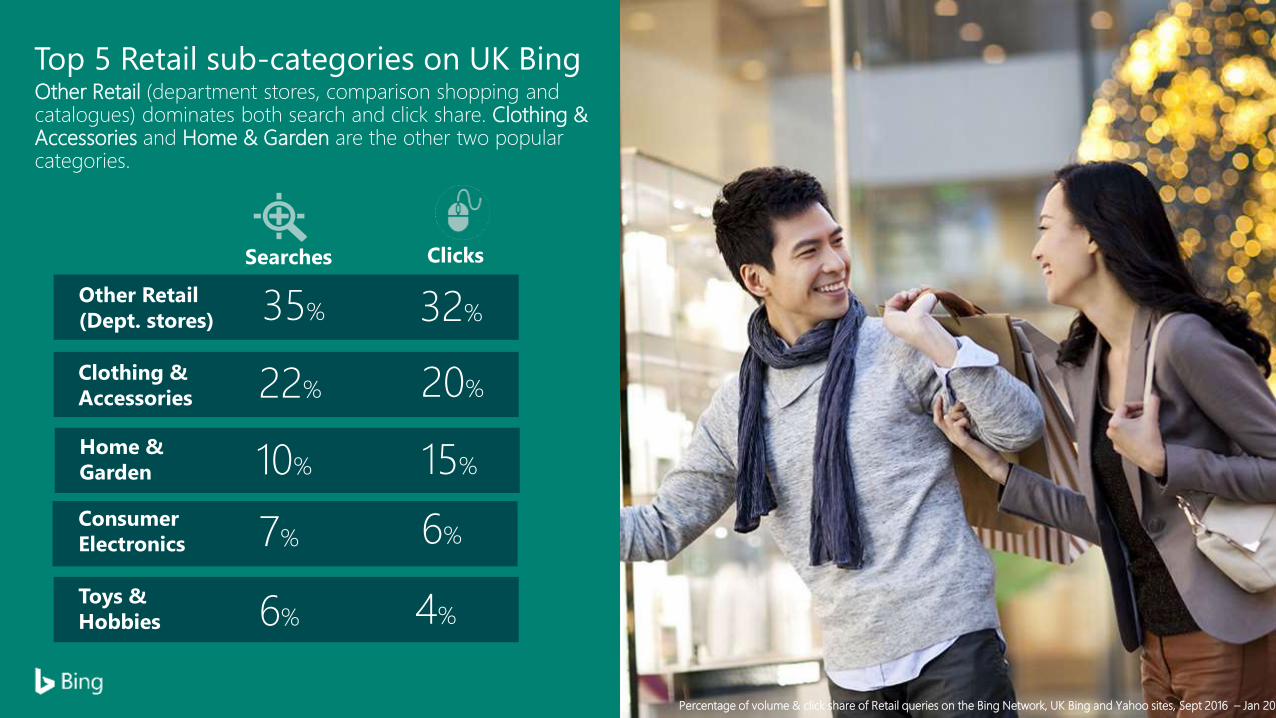
Percentage of volume & click share of Retail queries on the Bing Network, UK Bing and Yahoo sites, Sept 2016 – Jan 2017
Top 5 Retail sub-categories on UK BingOther Retail (department stores, comparison shopping and catalogues) dominates both search and click share. Clothing & Accessories and Home & Garden are the other two popular categories.
ClicksSearches
Other Retail
(Dept. stores)
Clothing &
Accessories
Home &
Garden
35% 32%
22% 20%
10% 15%
Consumer
Electronics 7% 6%
4%Toys &
Hobbies 6%

Source: Top sub-categories split by demographics, Retail search volume on Bing & Yahoo sites, Sept 2016 – Jan 2017
What is the age & demographic mix across the various retail sub-categories?
More than 63% of all up Retail search queries made on the UK Bing Network are coming from 35-64 year olds,
with females making 65% of those searches
9%
10%
14%
7%
13%
12%
12%
10%
12%
15%
15%
18%
12%
20%
14%
16%
13%
16%
17%
18%
20%
15%
16%
15%
18%
15%
39%
28%
25%
25%
28%
27%
28%
32%
29%
26%
26%
27%
27%
26%
37%
37%
43%
35%
35%
33%
31%
33%
35%
32%
30%
36%
6%
11%
8%
12%
8%
9%
9%
7%
11%
8%
12%
7%
10%
Toys & Hobbies
Other Retail
Jewellery & Watches
Home & Garden
Footwear
FMCG / Grocery
Flowers & Gifts
Daily Deals & Coupons
Consumer Electronics
Clothing & Accessories
Books, Film, Games & Music
Beauty & Personal Care
All
<24 25-34 35-49 50-64 65+
63%
64%
65%
63%
67%
66%
68%
69%
45%
72%
58%
72%
65%
37%
36%
35%
37%
33%
34%
32%
31%
55%
28%
42%
28%
35%

Retail
Black Friday & beyond
26
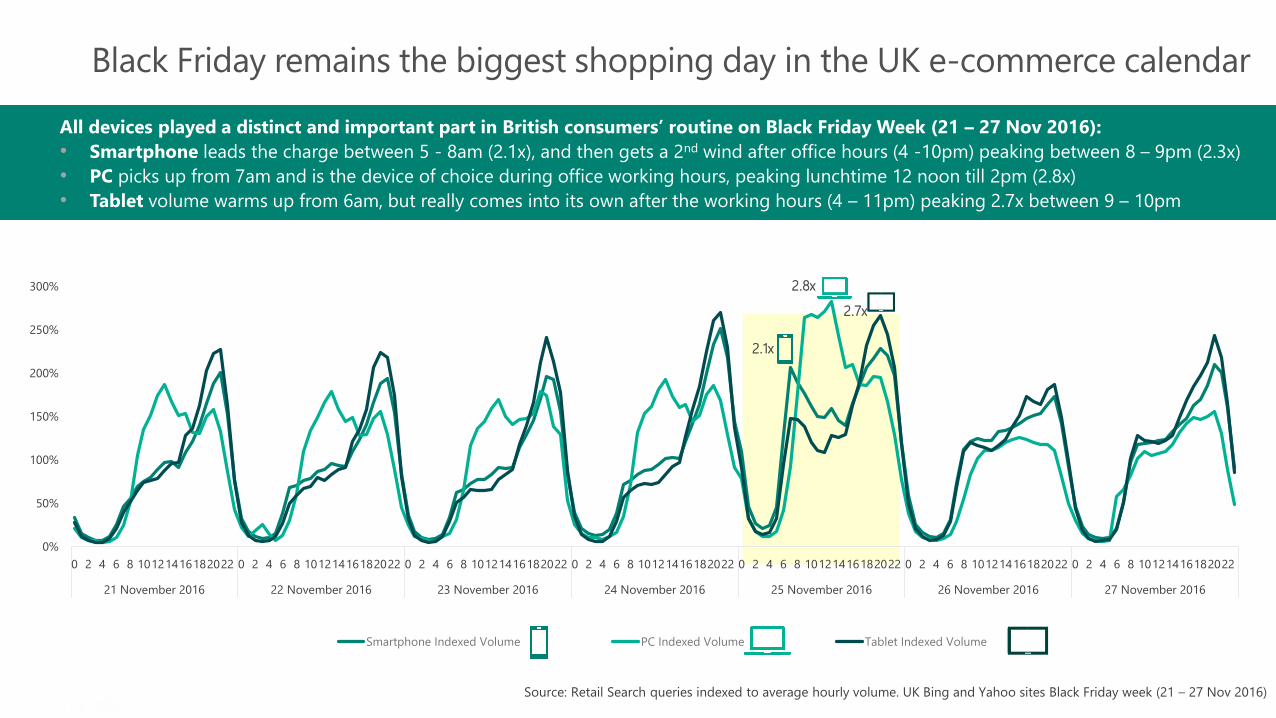
All devices played a distinct and important part in British consumers’ routine on Black Friday Week (21 – 27 Nov 2016):
• Smartphone leads the charge between 5 - 8am (2.1x), and then gets a 2nd wind after office hours (4 -10pm) peaking between 8 – 9pm (2.3x)
• PC picks up from 7am and is the device of choice during office working hours, peaking lunchtime 12 noon till 2pm (2.8x)
• Tablet volume warms up from 6am, but really comes into its own after the working hours (4 – 11pm) peaking 2.7x between 9 – 10pm
Black Friday remains the biggest shopping day in the UK e-commerce calendar
Source: Retail Search queries indexed to average hourly volume. UK Bing and Yahoo sites Black Friday week (21 – 27 Nov 2016)
2.1x
2.7x
0%
50%
100%
150%
200%
250%
300%
0 2 4 6 8 10121416182022 0 2 4 6 8 10121416182022 0 2 4 6 8 10121416182022 0 2 4 6 8 10121416182022 0 2 4 6 8 10121416182022 0 2 4 6 8 10121416182022 0 2 4 6 8 10121416182022
21 November 2016 22 November 2016 23 November 2016 24 November 2016 25 November 2016 26 November 2016 27 November 2016
Smartphone Indexed Volume PC Indexed Volume Tablet Indexed Volume
2.8x
19%
18%
16%
19%
15%
18%
21%
17%
19%
21%
20%
22%
68%
68%
70%
67%
70%
66%
63%
66%
64%
62%
62%
59%
13%
13%
14%
14%
15%
16%
16%
17%
17%
18%
18%
19%
Daily Deals & Coupons
Consumer Electronics
Flowers & Gifts
Beauty & Personal Care
Books, Film, Games & Music
FMCG / Grocery
Footwear
Other Retail
Clothing & Accessories
Jewellery & Watches
Home & Garden
Toys & Hobbies
Smartphone PC Tablet
Which Retail categories are the most Mobile on Black Friday Week?Black Friday Week (21 – 27 Nov, 2016), Toys & Hobbies saw the largest Mobile share with 41% of search queries coming from a Smartphone or Tablet device. This is followed closely by Home & Garden and Jewellery & Watches (38%)
Device share of retail queries on Black Friday Week, The Bing Network includes Microsoft and Yahoo sites in the UK data collected 21 – 27 Nov, 2016
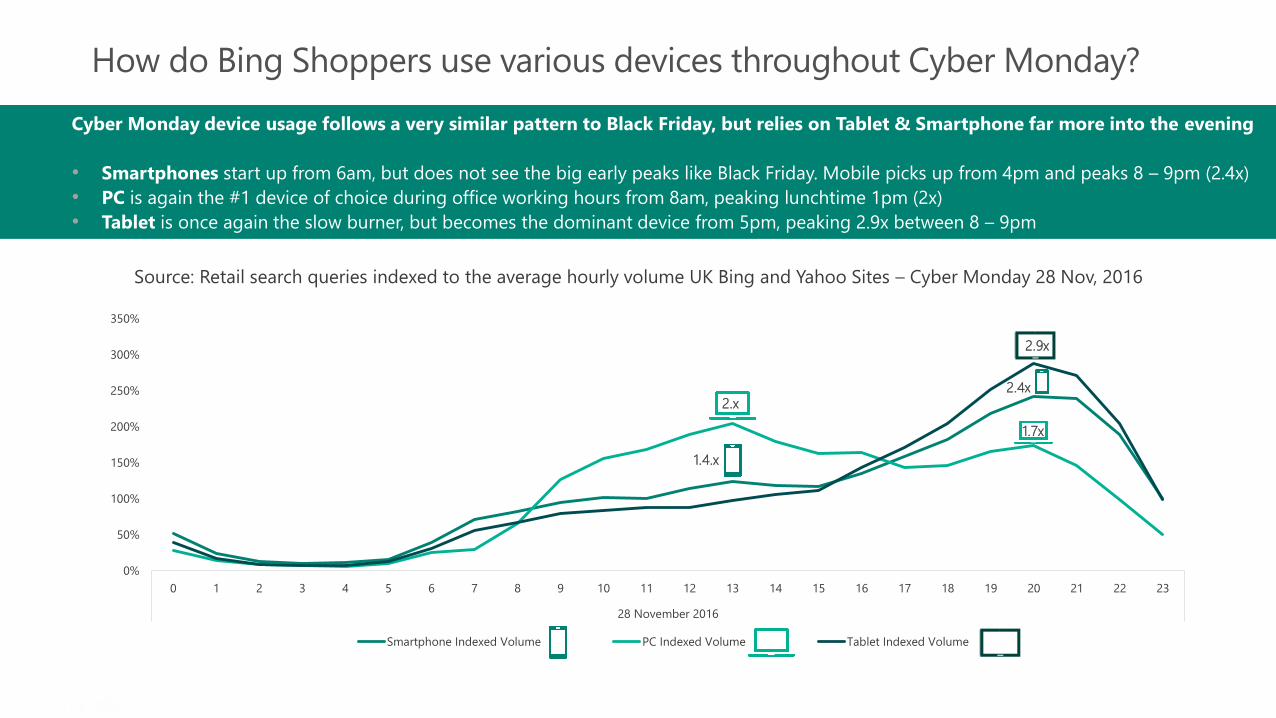
Cyber Monday device usage follows a very similar pattern to Black Friday, but relies on Tablet & Smartphone far more into the evening
• Smartphones start up from 6am, but does not see the big early peaks like Black Friday. Mobile picks up from 4pm and peaks 8 – 9pm (2.4x)
• PC is again the #1 device of choice during office working hours from 8am, peaking lunchtime 1pm (2x)
• Tablet is once again the slow burner, but becomes the dominant device from 5pm, peaking 2.9x between 8 – 9pm
How do Bing Shoppers use various devices throughout Cyber Monday?
Source: Retail search queries indexed to the average hourly volume UK Bing and Yahoo Sites – Cyber Monday 28 Nov, 2016
0%
50%
100%
150%
200%
250%
300%
350%
0 1 2 3 4 5 6 7 8 9 10 11 12 13 14 15 16 17 18 19 20 21 22 23
28 November 2016
Smartphone Indexed Volume PC Indexed Volume Tablet Indexed Volume
2.x
2.9x
1.4.x
2.4x
1.7x

How does Black Friday differ to Cyber Monday by Retail category?
Toys & Hobbies
Footwear
Jewellery & Watches
27%
31%
36%
Change from
Black Friday
Source: Device share change of Retail queries on Cyber Monday, The Bing Network includes Microsoft and Yahoo sites in the UK, 28 Nov 2016
Flowers & Gifts
Daily Deals & Coupons
6%
35%
2%
Change from
Black Friday
Toys & Hobbies
Home & Garden
Jewellery & Watches
19%
Change from
Black Friday
19%
33%
Books, Films & Games
Retail categories with the highest Smartphone & Tablet activity on Black Friday saw significant drops in volume as shoppers change tack and move into gift buying mode.
Cyber Monday sees an increase in PC activity with a 2% share increase for Flowers & Gifts, and a 6% increase for Books, Films & Games
0%
50%
100%
150%
200%
250%
300%
0 1 2 3 4 5 6 7 8 9 10 11 12 13 14 15 16 17 18 19 20 21 22 23
05 December 2016
Smartphone Indexed Volume PC Indexed Volume Tablet Indexed Volume
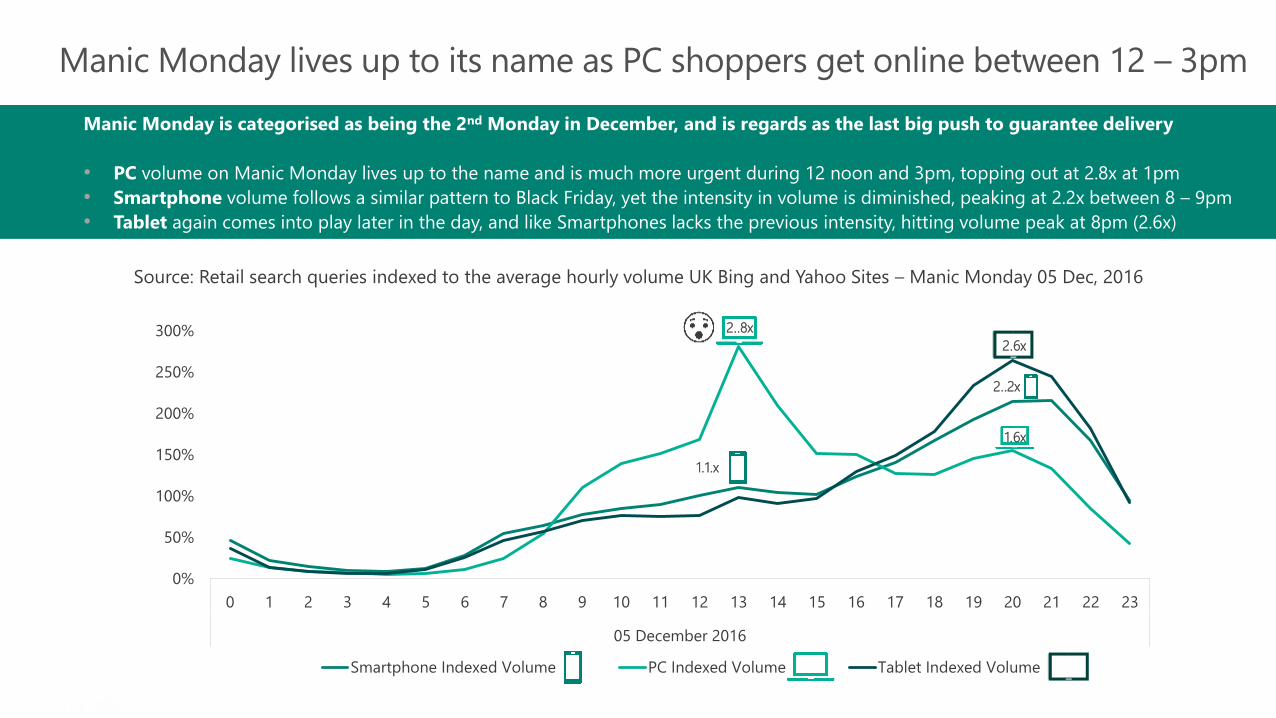
Manic Monday is categorised as being the 2nd Monday in December, and is regards as the last big push to guarantee delivery
• PC volume on Manic Monday lives up to the name and is much more urgent during 12 noon and 3pm, topping out at 2.8x at 1pm
• Smartphone volume follows a similar pattern to Black Friday, yet the intensity in volume is diminished, peaking at 2.2x between 8 – 9pm
• Tablet again comes into play later in the day, and like Smartphones lacks the previous intensity, hitting volume peak at 8pm (2.6x)
Manic Monday lives up to its name as PC shoppers get online between 12 – 3pm
Source: Retail search queries indexed to the average hourly volume UK Bing and Yahoo Sites – Manic Monday 05 Dec, 2016
2..8x
2.6x
1.1.x
2..2x
1.6x
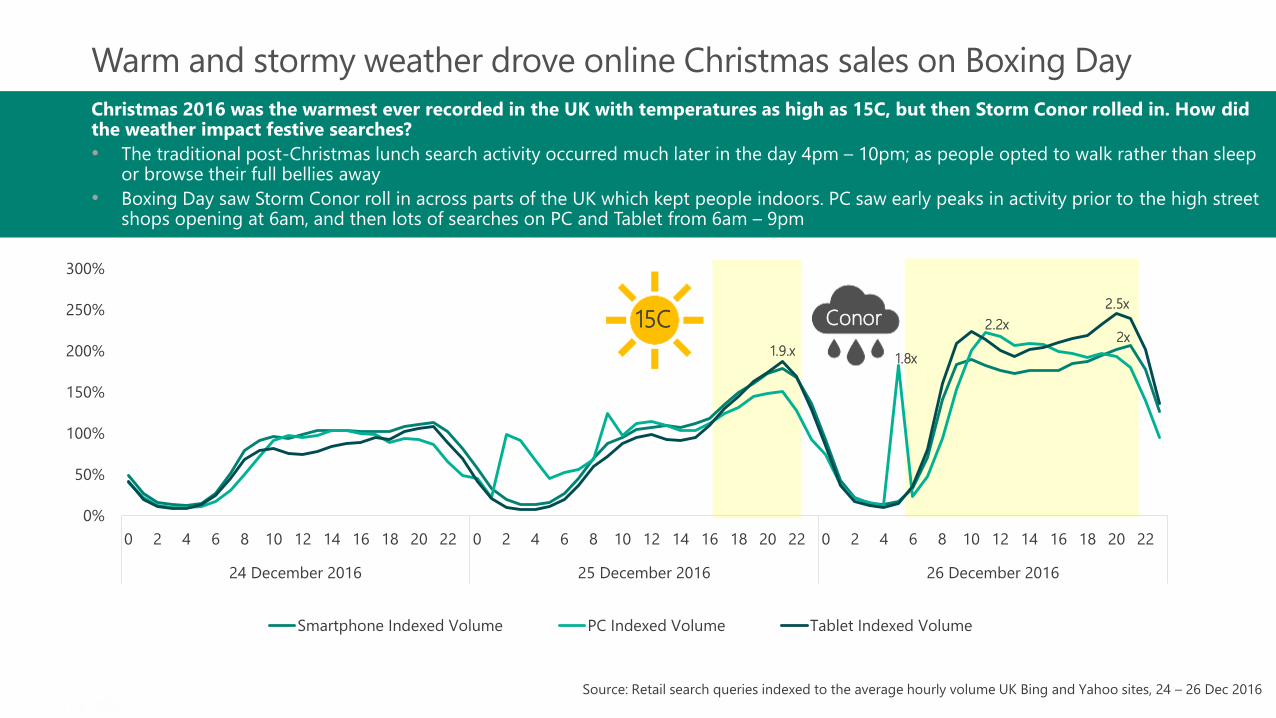
Christmas 2016 was the warmest ever recorded in the UK with temperatures as high as 15C, but then Storm Conor rolled in. How didthe weather impact festive searches?
• The traditional post-Christmas lunch search activity occurred much later in the day 4pm – 10pm; as people opted to walk rather than sleep or browse their full bellies away
• Boxing Day saw Storm Conor roll in across parts of the UK which kept people indoors. PC saw early peaks in activity prior to the high street shops opening at 6am, and then lots of searches on PC and Tablet from 6am – 9pm
Warm and stormy weather drove online Christmas sales on Boxing Day
Source: Retail search queries indexed to the average hourly volume UK Bing and Yahoo sites, 24 – 26 Dec 2016
0%
50%
100%
150%
200%
250%
300%
0 2 4 6 8 10 12 14 16 18 20 22 0 2 4 6 8 10 12 14 16 18 20 22 0 2 4 6 8 10 12 14 16 18 20 22
24 December 2016 25 December 2016 26 December 2016
Smartphone Indexed Volume PC Indexed Volume Tablet Indexed Volume
2.5x
1.8x
2x2.2x15C Conor
1.9.x

Make your ads stand out from the Retail crowdWith 2016 Retail Ad Copy Learnings
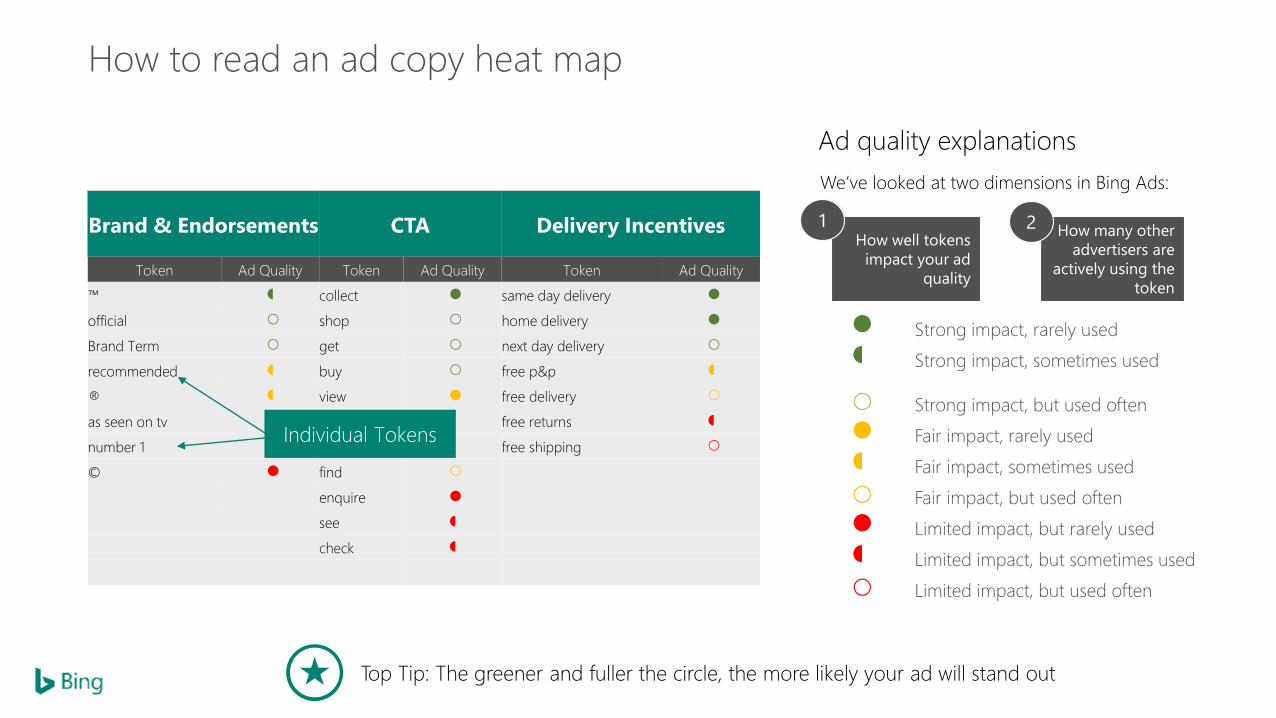
Brand & Endorsements CTA Delivery Incentives
Token Ad Quality Token Ad Quality Token Ad Quality
™ collect same day delivery
official shop home delivery
Brand Term get next day delivery
recommended buy free p&p
® view free delivery
as seen on tv compare free returns
number 1 call free shipping
© find
enquire
see
check
How to read an ad copy heat map
Strong impact, rarely used
Strong impact, sometimes used
Strong impact, but used often
Fair impact, rarely used
Fair impact, sometimes used
Fair impact, but used often
Limited impact, but rarely used
Limited impact, but sometimes used
Limited impact, but used often
Individual Tokens
Ad quality explanations
Top Tip: The greener and fuller the circle, the more likely your ad will stand out
We’ve looked at two dimensions in Bing Ads:

2016 Christmas Retail – Other Retail (Department Stores)Ad Copy Analysis
Token Ad Quality Token Ad Quality Token Ad Quality Token Ad Quality Token Ad Quality Token Ad Quality Token Ad Quality Token Ad Quality
official store buy today order and collect luxe + buy now pay later cake / cakes aw 16
official site comparison order & collect freshest & price comparison console / consoles autumn winter
official check free postage inspiration ! bargain cosmetic / cosmetics aw16
as seen on tv collect free returns classic {param2: reductions electrical / electricals festive
© shop free delivery fresh ? low cost present / presents cyber monday
™ order click & collect luxurious {param1: extra grooming black friday
[Brand Term] enquire same day delivery designer {keyword: free stocking / stockings christmas
number 1 / number one buy online now click and collect exclusive [%] off scarf / scarves christmas eve
recommended compare next day delivery beautiful savings onesie / onesies christmas day
buy free shipping latest [£] wrap / wrapping boxing day
get free p&p luxury offer rose / roses new year
view next day shipping new low prices laptop / laptops 2016
see 48hr delivery funny upto [%] handbag / handbags winter
buy now home delivery limited edition buy one get one free makeup / make-up autumn
call 24hr delivery personalized extra [%] off trousers nye
find gorgeous save [%] boots january
personalised unbeatable coat / coats jan
party save jeans xmas
original sale jackets
quality cheap mobile / mobiles
unique deal chair / chairs
best discount glove / gloves
joke free credit clothing / clothes
indulgent 1/2 price / half price gift / gifts
comedy [£] off hob / hobs
newest save upto [%] chocolate / chocolates
secret bogof tablet / tablets
finest value bouquet / bouquets
special affordable scooter / scooters
stylish [%] discount lingerie
Idea / Ideas guarantee fragrance / fragrances
voucher / vouchers
underwear
electronic / electronics
bike / bikes
pc / pcs
footwear
dress / dresses
toy / toys
hat / hats
watch / watches
Products / Range SeasonalDynamic Pricing and value Brand Endorsements CTA Delivery Incentives Descriptive
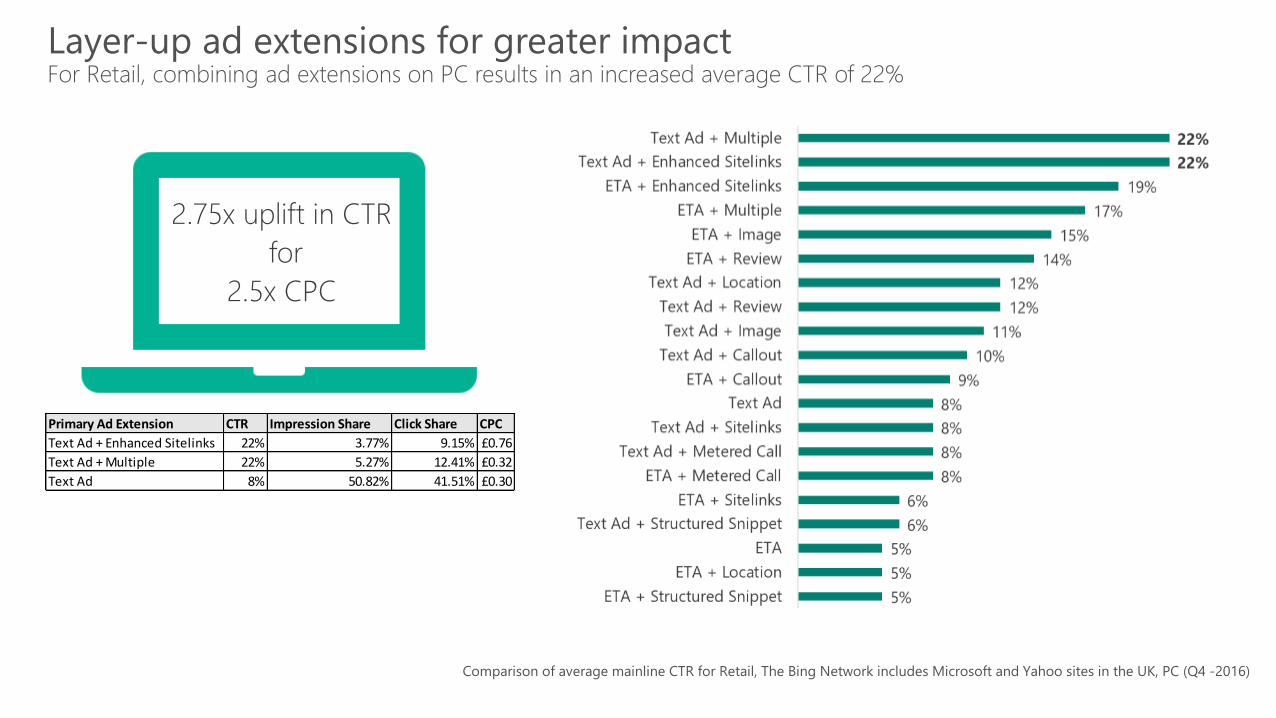
Layer-up ad extensions for greater impactFor Retail, combining ad extensions on PC results in an increased average CTR of 22%
Primary Ad Extension CTR Impression Share Click Share CPC
Text Ad + Enhanced Sitelinks 22% 3.77% 9.15% £0.76
Text Ad + Multiple 22% 5.27% 12.41% £0.32
Text Ad 8% 50.82% 41.51% £0.30
2.75x uplift in CTR
for
2.5x CPC
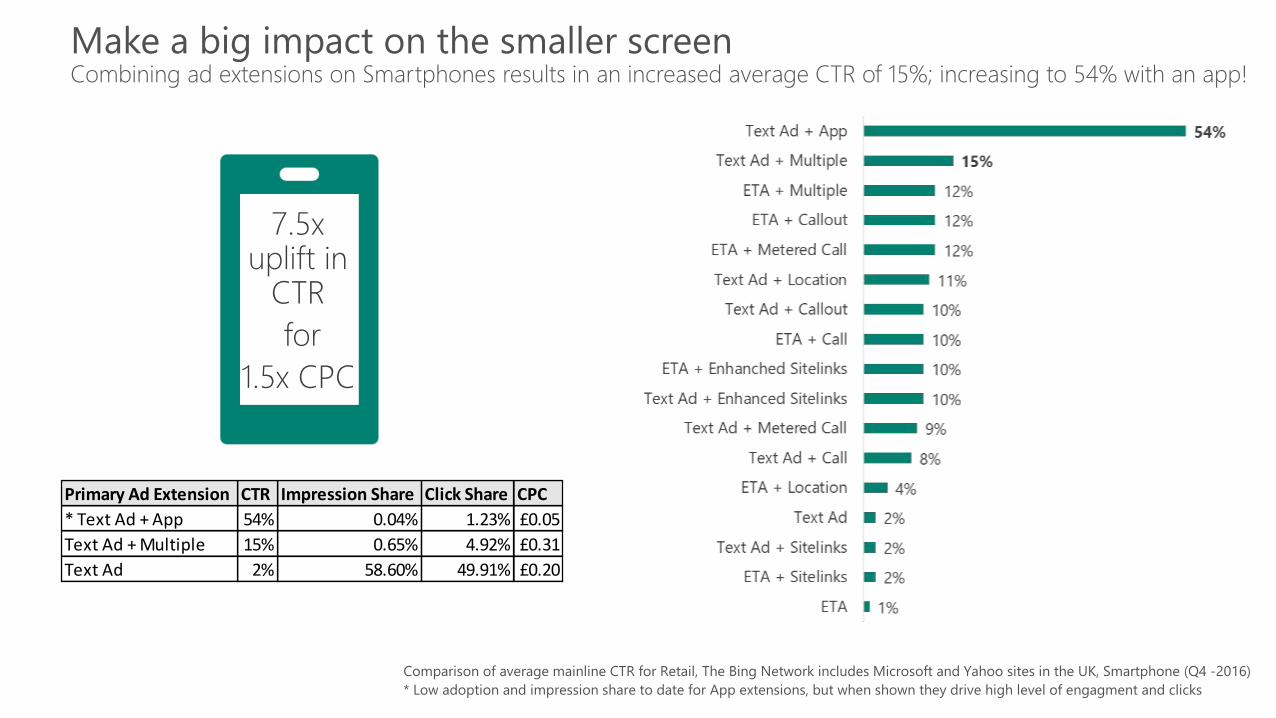
Make a big impact on the smaller screen Combining ad extensions on Smartphones results in an increased average CTR of 15%; increasing to 54% with an app!
Primary Ad Extension CTR Impression Share Click Share CPC
* Text Ad + App 54% 0.04% 1.23% £0.05
Text Ad + Multiple 15% 0.65% 4.92% £0.31
Text Ad 2% 58.60% 49.91% £0.20
7.5x uplift in
CTR
for
1.5x CPC

Layer-up ad extensions for greater impactFor Retail, combining ad extensions on Tablets results in an increased average CTR of 37%
Primary Ad Extension CTR Impression Share Click Share CPC
Text Ad + Enhanced Sitelinks 37% 0.34% 2.85% $0.41
Text Ad 4% 41.60% 39.08% $0.20
Over
9x uplift in CTR
for
2x CPC
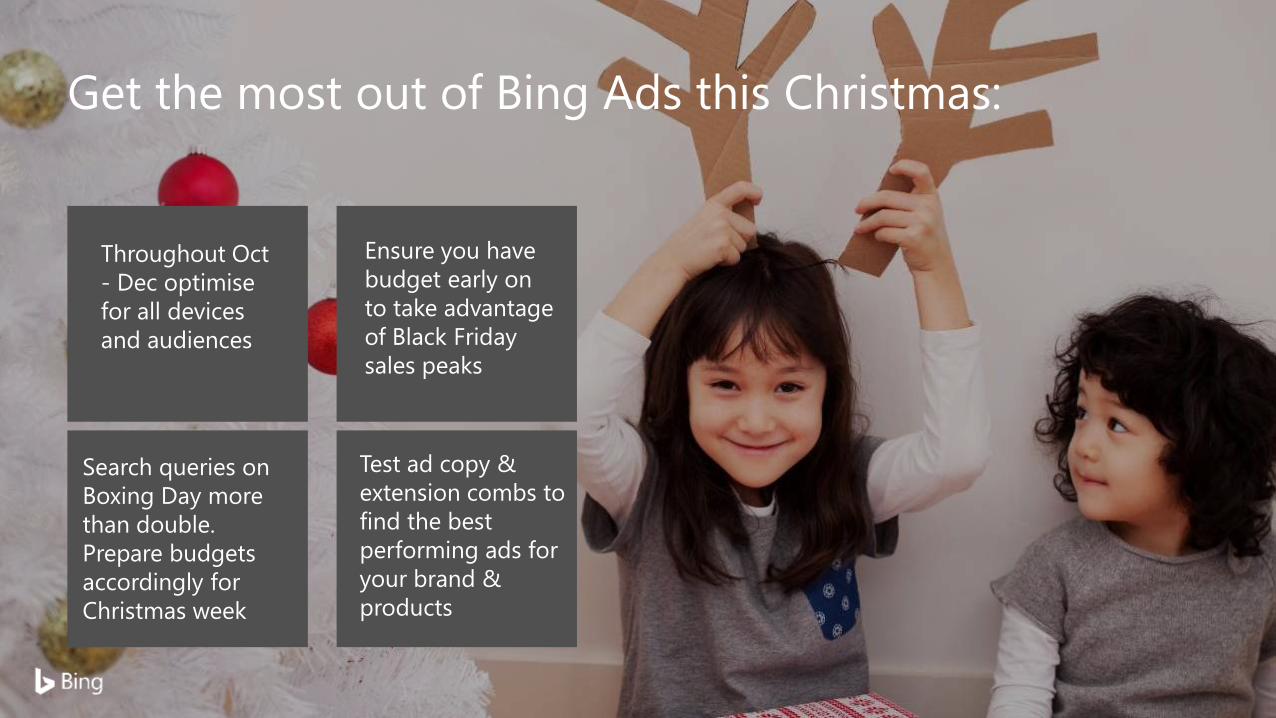
Throughout Oct
- Dec optimise
for all devices
and audiences
Test ad copy &
extension combs to
find the best
performing ads for
your brand &
products
Ensure you have
budget early on
to take advantage
of Black Friday
sales peaks
Search queries on
Boxing Day more
than double.
Prepare budgets
accordingly for
Christmas week
Get the most out of Bing Ads this Christmas: