results presentation q1 2014 - talanx/media/files/t/talanx/reports-and-presentations/... · german...
TRANSCRIPT

Herbert K. Haas, CEO Dr. Immo Querner, CFO
Results Presentation Q1 2014 15 May 2014

Results Presentation Q1 2014, 15 May 20142
Agenda
Group HighlightsI
Investments / CapitalIII
SegmentsII
Essentials Risk Management Reports 2013IV
OutlookV
Appendix
Mid-term Target Matrix
Q1 2014 Additional Information
Risk Management Reports 2013

Results Presentation Q1 2014, 15 May 20143
Q1 2014 – On track to reach FY2014 targets I
Talanx had a good start into FY2014. When adjusting for the SwissLife effect of €22m (after tax) in Q1 2013, the Net Income of €192m even exceeds last year’s level
GWP marginally lower (-0.5% vs. Q1 2013) mainly due to currency effects (+1.6% currency-adj.), the decline in traditional German life business and more selective Reinsurance underwriting
Moderate large loss burden does not boost Q1 2014 results - treatment of unused large loss budget in Primary Insurance in correspondence with established Reinsurance practice
End of March 2014, shareholders’ equity stood at €7,538m (FY2013: €7,214m), or €29.82 per share. Solvency I ratio at 220% (FY2013: 210%)
Talanx confirms its FY2014 target to achieve Net Income of at least €700m
Results Presentation Q1 2014, 15 May 20144
Summary of Q1 2014
Good results, even when compared to the strong Q1 2 013 figures
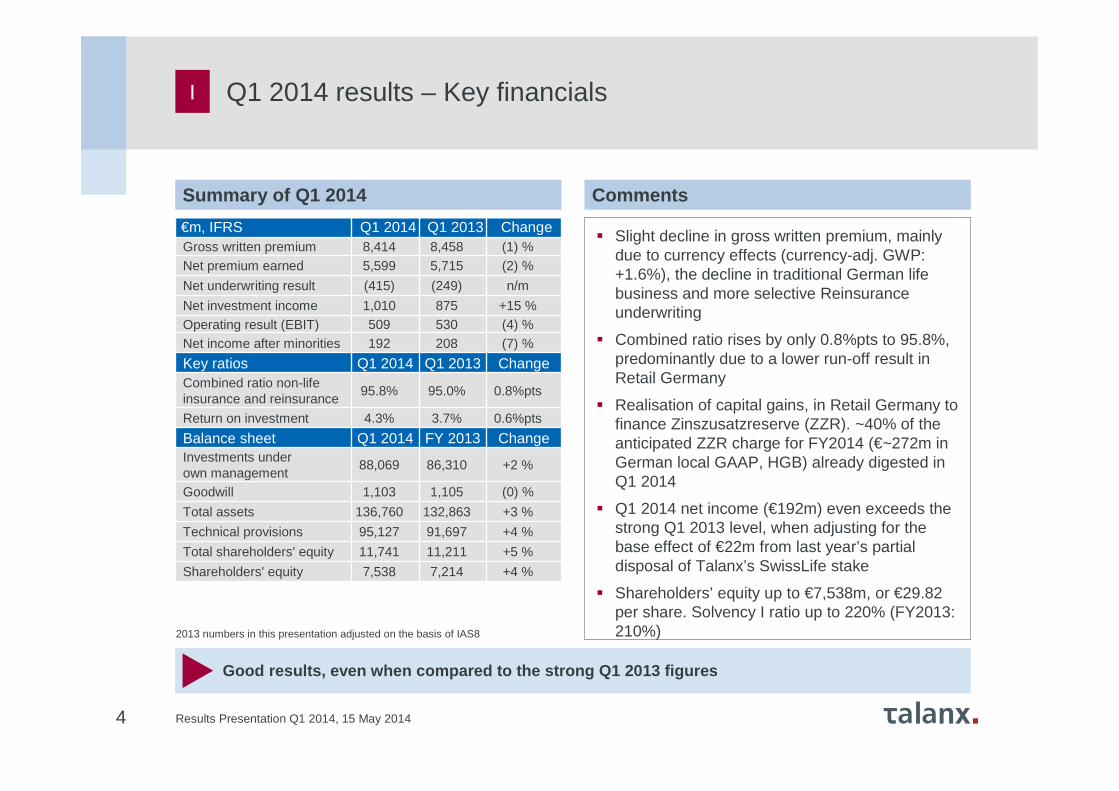
€m, IFRS Q1 2014 Q1 2013 ChangeGross written premium 8,414 8,458 (1) %Net premium earned 5,599 5,715 (2) %
Net underwriting result (415) (249) n/m
Net investment income 1,010 875 +15 %Operating result (EBIT) 509 530 (4) %Net income after minorities 192 208 (7) %
Key ratios Q1 2014 Q1 2013 ChangeCombined ratio non-lifeinsurance and reinsurance
95.8% 95.0% 0.8%pts
Return on investment 4.3% 3.7% 0.6%pts
Balance sheet Q1 2014 FY 2013 ChangeInvestments underown management
88,069 86,310 +2 %
Goodwill 1,103 1,105 (0) %
Total assets 136,760 132,863 +3 %
Technical provisions 95,127 91,697 +4 %
Total shareholders' equity 11,741 11,211 +5 %
Shareholders' equity 7,538 7,214 +4 %
I
Comments
� Slight decline in gross written premium, mainly due to currency effects (currency-adj. GWP: +1.6%), the decline in traditional German life business and more selective Reinsurance underwriting
� Combined ratio rises by only 0.8%pts to 95.8%, predominantly due to a lower run-off result in Retail Germany
� Realisation of capital gains, in Retail Germany to finance Zinszusatzreserve (ZZR). ~40% of the anticipated ZZR charge for FY2014 (€~272m in German local GAAP, HGB) already digested in Q1 2014
� Q1 2014 net income (€192m) even exceeds the strong Q1 2013 level, when adjusting for the base effect of €22m from last year’s partial disposal of Talanx’s SwissLife stake
� Shareholders’ equity up to €7,538m, or €29.82 per share. Solvency I ratio up to 220% (FY2013: 210%)2013 numbers in this presentation adjusted on the basis of IAS8
Q1 2014 results – Key financials
Results Presentation Q1 2014, 15 May 2014
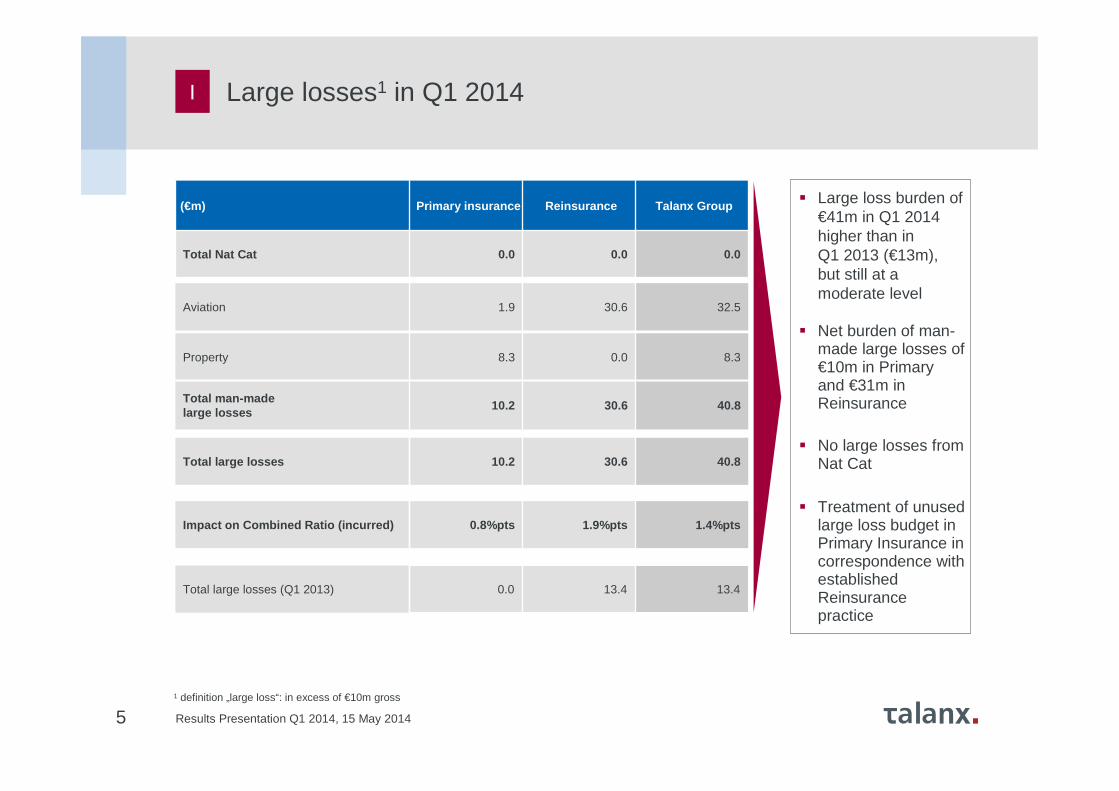
13.413.40.0
5
I
� Large loss burden of €41m in Q1 2014 higher than in Q1 2013 (€13m), but still at a moderate level
� Net burden of man-made large losses of €10m in Primary and €31m in Reinsurance
� No large losses from Nat Cat
� Treatment of unused large loss budget in Primary Insurance in correspondence with established Reinsurance practice
Large losses1 in Q1 2014
1 definition „large loss“: in excess of €10m gross
(€m) Primary insurance Reinsurance Talanx Group
Total Nat Cat 0.0 0.0 0.0
Aviation 1.9 30.6 32.5
Total man-made large losses
10.2 30.6 40.8
Property 8.3 0.0 8.3
Total large losses 10.2 30.6 40.8
Impact on Combined Ratio (incurred) 0.8%pts 1.9%pts 1.4%pts
Total large losses (Q1 2013)
Results Presentation Q1 2014, 15 May 20146
Combined ratios
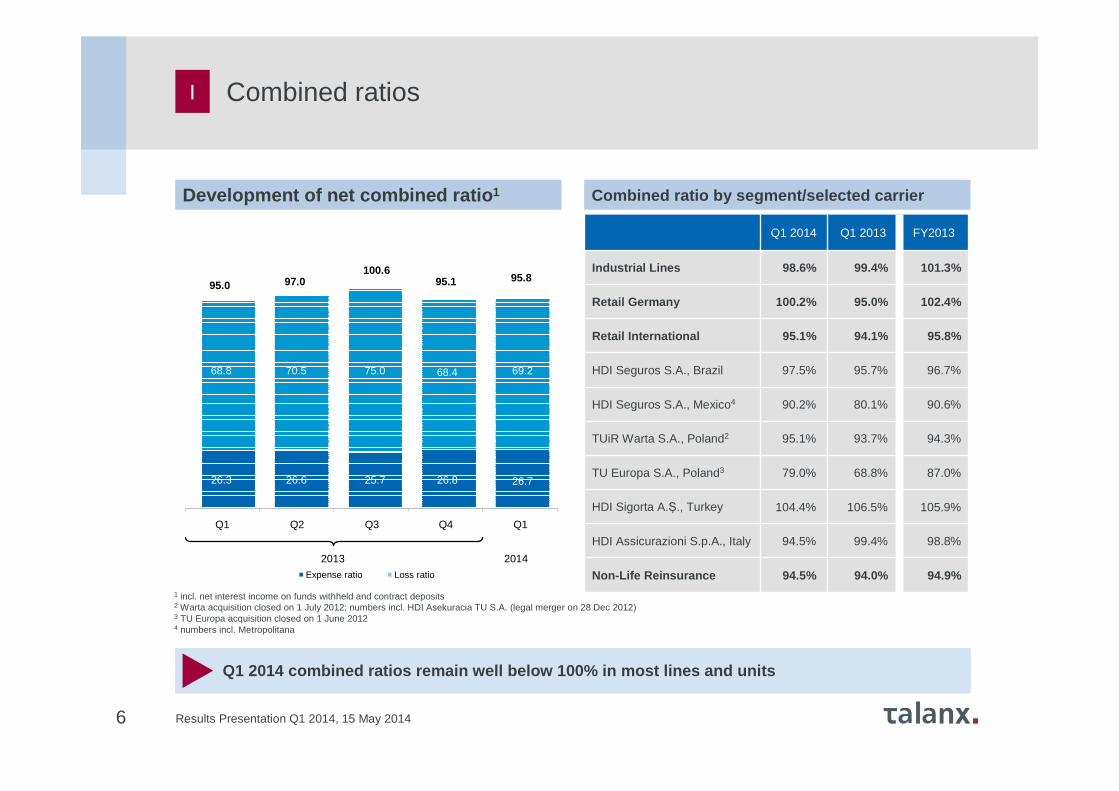
Development of net combined ratio 1 Combined ratio by segment/selected carrier
Q1 2014 combined ratios remain well below 100% in m ost lines and units
I
Q1 2014 Q1 2013 FY2013
Industrial Lines 98.6% 99.4% 101.3%
Retail Germany 100.2% 95.0% 102.4%
Retail International 95.1% 94.1% 95.8%
HDI Seguros S.A., Brazil 97.5% 95.7% 96.7%
HDI Seguros S.A., Mexico4 90.2% 80.1% 90.6%
TUiR Warta S.A., Poland2 95.1% 93.7% 94.3%
TU Europa S.A., Poland3 79.0% 68.8% 87.0%
HDI Sigorta A.Ş., Turkey 104.4% 106.5% 105.9%
HDI Assicurazioni S.p.A., Italy 94.5% 99.4% 98.8%
Non-Life Reinsurance 94.5% 94.0% 94.9%Expense ratio Loss ratio
1 incl. net interest income on funds withheld and contract deposits2 Warta acquisition closed on 1 July 2012; numbers incl. HDI Asekuracia TU S.A. (legal merger on 28 Dec 2012)3 TU Europa acquisition closed on 1 June 20124 numbers incl. Metropolitana
Q1 Q2 Q3 Q4 Q1
2013 2014
95.0
68.8
26.3
97.0
70.5
26.6
100.6
75.0
25.7
95.1
68.4
26.8
95.8
69.2
26.7
Results Presentation Q1 2014, 15 May 20147
GWP trend
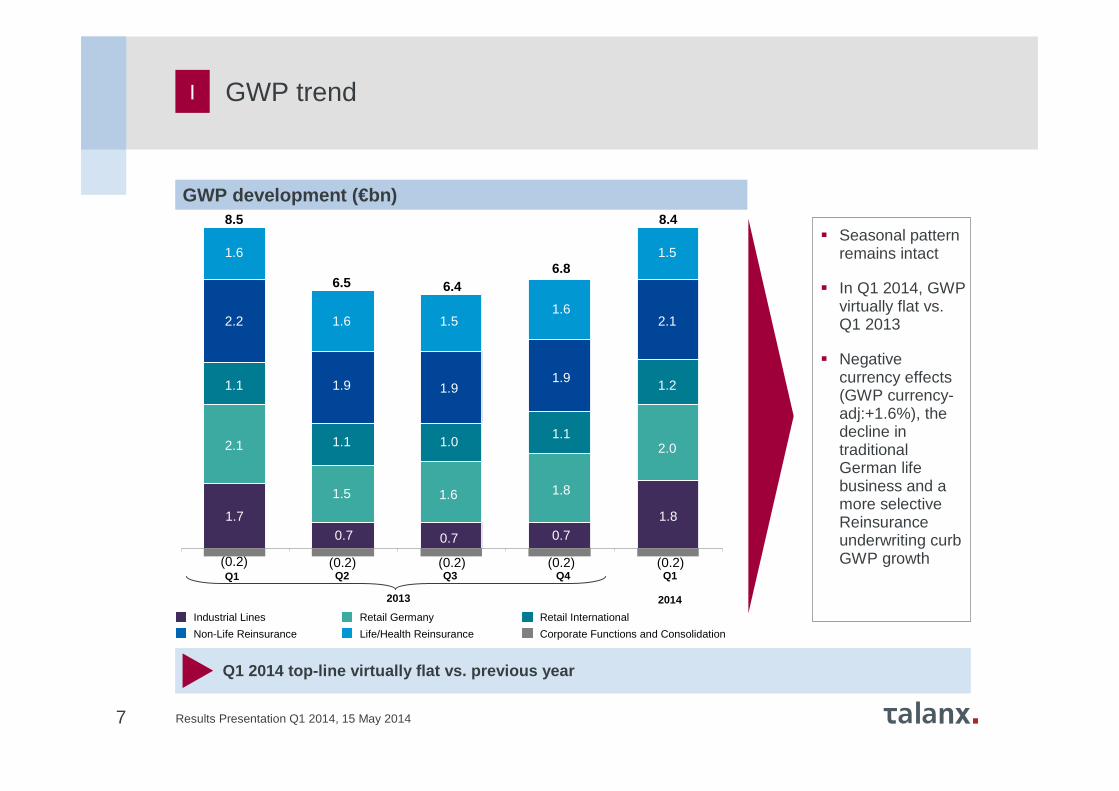
GWP development (€bn)
� Seasonal pattern remains intact
� In Q1 2014, GWP virtually flat vs. Q1 2013
� Negative currency effects (GWP currency-adj:+1.6%), the decline in traditional German life business and a more selective Reinsurance underwriting curb GWP growth
Q1 2014 top-line virtually flat vs. previous year
I
Industrial Lines
Non-Life Reinsurance
Retail Germany
Life/Health Reinsurance
Retail International
Corporate Functions and Consolidation
2012 2013
8.5
Q1 Q2 Q3 Q4 Q1
2013 2014
6.5 6.46.8
8.4
1.6
1.6 1.51.6
1.5
2.2
1.9 1.91.9
2.1
1.1
1.1 1.01.1
1.2
2.1
1.5 1.6 1.8
2.0
1.70.7 0.7 0.7
1.8
(0.2) (0.2) (0.2) (0.2) (0.2)

Results Presentation Q1 2014, 15 May 20148
Agenda
Group HighlightsI
Investments / CapitalIII
SegmentsII
Essentials Risk Management Reports 2013IV
OutlookV
Appendix
Mid-term Target Matrix
Q1 2014 Additional Information
Risk Management Reports 2013

Results Presentation Q1 2014, 15 May 2014
83% 98% 59% 80%80%
9
P&L for Industrial Lines Comments
II
High level of residual large loss budget – EBIT benef its from higher investment result
� GWP grew 1.6% in Q1 2014 (currency-adj.:+2.2%), increase mainly from international business
� On track to reach self-retention level of ~50% in FY2014. Q1 2014 retention level affected by transfer of business to Talanx Re and typical quarterly time shift in reinsurance accounting
� Slight improvement in Q1 2014 combined ratio although unused large loss budget has not improved the technical result
� Increase in investment income and positive forexcontribution lead to higher EBIT result
� Higher tax rate of 40.5% (Q1 2013: 34.7%) resulting from tax surcharge on large corporatesin France
Segments – Industrial Lines
€m, IFRS Q1 2014 Q1 2013 Change
Gross written premium 1,763 1,735 +2%
Net premium earned 407 439 (7%)
Net underwriting result 6 2 +205%
Net investment income 72 55 +30%
Operating result (EBIT) 60 33 +84%
Group net income 35 19 +81%
Return on investment (annualised) 4.2% 3.2% +1.0%pts
Combined ratio*
Expense ratio Loss ratio
FY2013: 101%
99% 103%116%
85%99%
Q1 2013 Q2 2013 Q3 2013 Q4 2013 Q1 201419% 20% 18% 26% 19%
*incl. net interest income on funds withheld and contract deposits

Results Presentation Q1 2014, 15 May 2014
36% 35% 29% 41% 34%
59% 69% 76% 64% 67%
FY2013: 102%
10
II
CommentsP&L for Retail Germany
Q1 2014 compares to strong Q1 2013 with positive bas e effect from one-time reserve releases
� GWP decline by 4% due to reduction in traditional German life business and focus on profitability in motor. Premiums in liability and property lines increased
� Increase in combined ratio from lower (one-time) run-off results than in Q1 2013. On adjusted level, Q1 2014 EBIT would improve by €4m vs. Q1 2013
� Realisation of capital gains to finance ZZR (€126m) leads to ROI of 4.7% (Q1 2013: 3.8%); neutral on EBIT level
� ~40% of anticipated 2014 ZZR allocation already digested (forecast of ~€272m for FY2014; FY 2013: €313m; both according to HGB). Total ZZR stock expected to rise close to €1bn until year-end 2014
� Higher tax rate (Q1 2014: 38.6% vs. Q1 2013: 29.7%) due to loss making start-up of Talanx Re’s Retail Germany-related cell
Segments – Retail Germany
€m, IFRS Q1 2014 Q1 2013 ChangeGross written premium 2,027 2,113 (4%)
Of which Life 1,219 1,277 (5%)Of which Non-Life 808 835 (3%)
Net premium earned 1,287 1,323 (3%)Net underwriting result (430) (296) n/m
Of which Life (430) (313) n/mOf which Non-Life (0) 18 (100%)
Net investment income 501 387 +29%Operating result (EBIT) 54 66 (18%)Group net income 29 43 (32%)
Return on investment (annualised) 4.7% 3.8% +0.9%pts
Combined ratio*
Expense ratio Loss ratio*incl. net interest income on funds withheld and contract deposits
Q1 2013 Q2 2013 Q3 2013 Q4 2013 Q1 2014
95%104% 105% 105% 100%

Results Presentation Q1 2014, 15 May 2014
29% 30% 32% 30%
67% 67% 67% 64% 65%
27%
11
II
P&L for Retail International Comments
Turkey delivered targeted turnaround – all entities profitable
� Q1 2014 top-line growth of 10.2% is burdened by currency effects (currency-adj. +18.4%)
� Strong P&C business in Poland, at the same time decline in life insurance business against single premium. Strong motor business in Brasil, effect dampened by depreciation in currency
� Combined ratio rises by 1%pt impacted by initial consolidation effects. The adjusted combined ratio improves by 0.9%pt
� Investment income benefits from higher interest rates in Brasil and realised capital gains (Q1 2014: €11m; Q1 2013: €12m)
� Adj. for realised capital gains and a positive valuation effect in Italy (€~3m), the normalisedEBIT would be slightly below €50m, in line with plan
� Turkey contributed €1m to EBIT – making all entities in Retail International profitable
Segments – Retail International
Combined ratio*
€m, IFRS Q1 2014 Q1 2013 ChangeGross written premium 1,164 1,056 +10%
Of which Life 456 343 +33%Of which Non-Life 708 713 (1%)
Net premium earned 983 877 +12%Net underwriting result 8 17 (53%)
Of which Life (19) (17) n/mOf which Non-Life 28 34 (19%)
Net investment income 74 74 (0%)Operating result (EBIT) 62 66 (6%)Group net income 39 38 +1%
Return on investment (annualised)
4.7% 5.1% (0.4%)pts
*incl. net interest income on funds withheld and contract depositsExpense ratio Loss ratio
FY2013: 96%
Q1 2013 Q2 2013 Q3 2013 Q4 2013 Q1 2014
94% 96% 98% 96% 95%
Results Presentation Q1 2014, 15 May 2014
26% 26% 25% 23% 26%
68% 68% 72% 72% 69%
FY2013: 95%
12
Segments – Non-Life Reinsurance
Underwriting and investment income contributed posi tively
II
P&L for Non-Life Reinsurance Comments
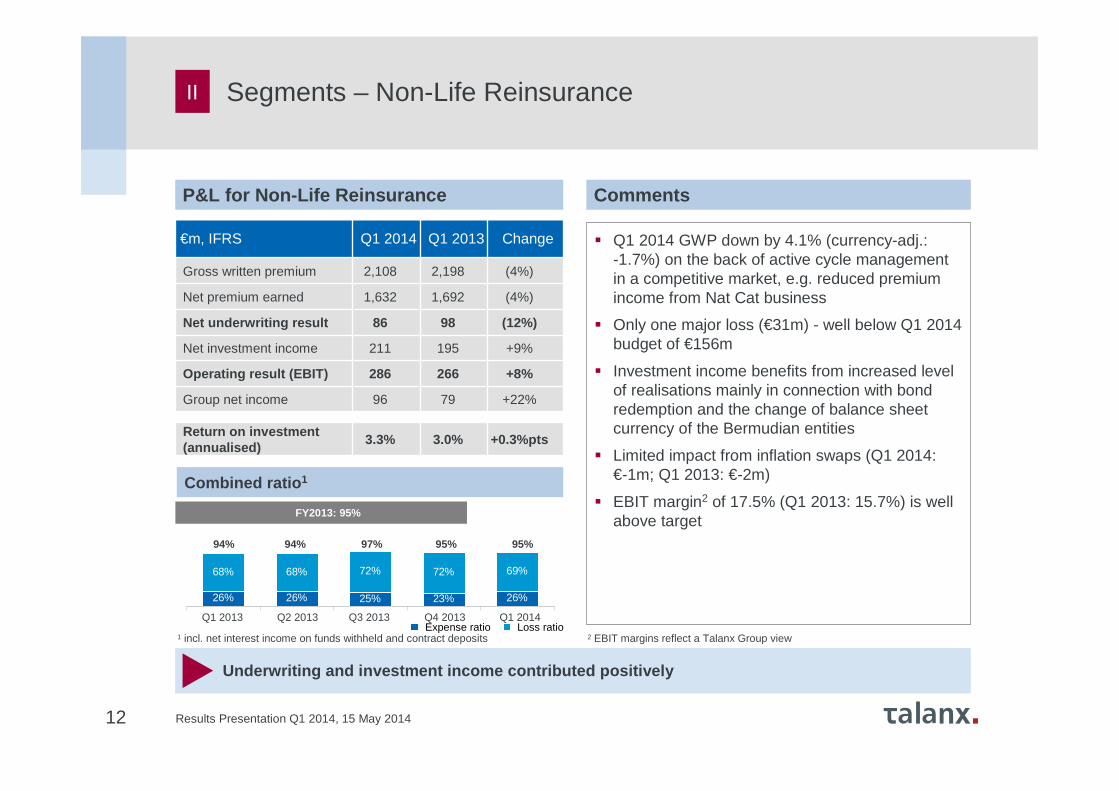
� Q1 2014 GWP down by 4.1% (currency-adj.: -1.7%) on the back of active cycle management in a competitive market, e.g. reduced premium income from Nat Cat business
� Only one major loss (€31m) - well below Q1 2014 budget of €156m
� Investment income benefits from increased level of realisations mainly in connection with bond redemption and the change of balance sheet currency of the Bermudian entities
� Limited impact from inflation swaps (Q1 2014: €-1m; Q1 2013: €-2m)
� EBIT margin2 of 17.5% (Q1 2013: 15.7%) is well above target
€m, IFRS Q1 2014 Q1 2013 Change
Gross written premium 2,108 2,198 (4%)
Net premium earned 1,632 1,692 (4%)
Net underwriting result 86 98 (12%)
Net investment income 211 195 +9%
Operating result (EBIT) 286 266 +8%
Group net income 96 79 +22%
Return on investment (annualised)
3.3% 3.0% +0.3%pts
Combined ratio 1
1 incl. net interest income on funds withheld and contract deposits 2 EBIT margins reflect a Talanx Group viewExpense ratio Loss ratio
Q1 2013 Q2 2013 Q3 2013 Q4 2013 Q1 2014
94% 94% 97% 95% 95%
Results Presentation Q1 2014, 15 May 201413
Segments – Life/Health Reinsurance
Heading for a normalised result in FY2014
II
P&L for Life/Health Reinsurance Comments
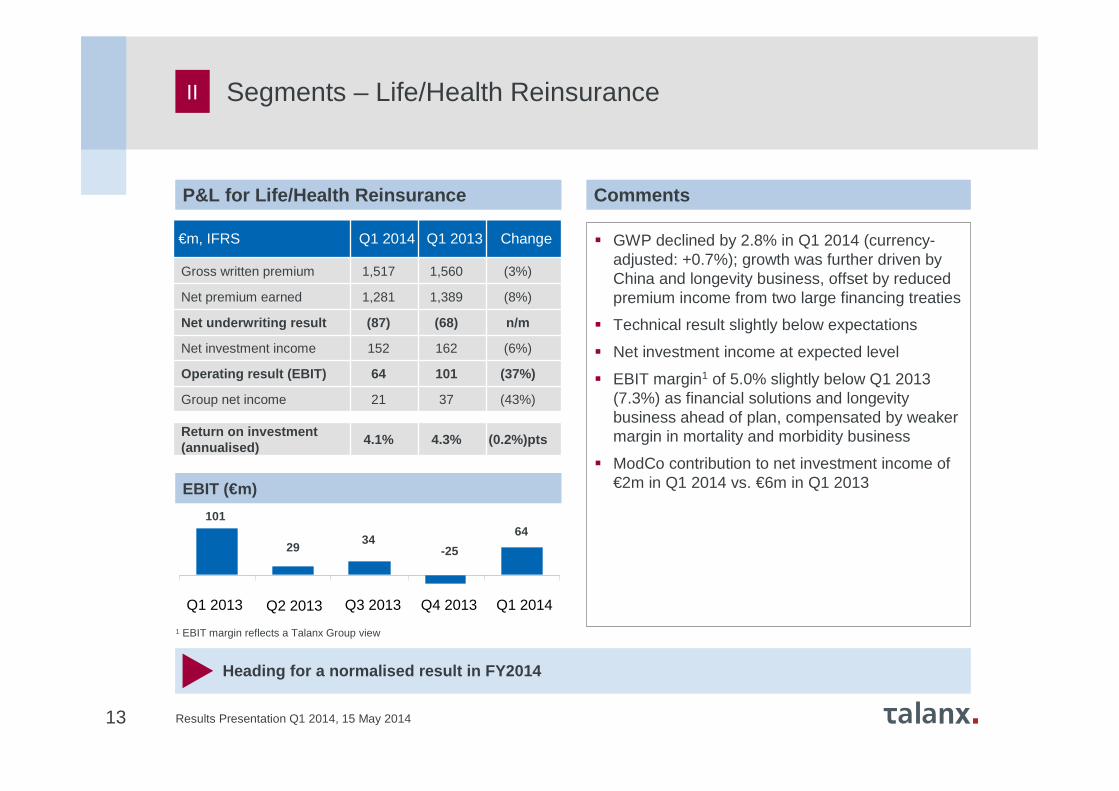
� GWP declined by 2.8% in Q1 2014 (currency-adjusted: +0.7%); growth was further driven by China and longevity business, offset by reduced premium income from two large financing treaties
� Technical result slightly below expectations
� Net investment income at expected level
� EBIT margin1 of 5.0% slightly below Q1 2013 (7.3%) as financial solutions and longevity business ahead of plan, compensated by weaker margin in mortality and morbidity business
� ModCo contribution to net investment income of €2m in Q1 2014 vs. €6m in Q1 2013EBIT (€m)
€m, IFRS Q1 2014 Q1 2013 Change
Gross written premium 1,517 1,560 (3%)
Net premium earned 1,281 1,389 (8%)
Net underwriting result (87) (68) n/m
Net investment income 152 162 (6%)
Operating result (EBIT) 64 101 (37%)
Group net income 21 37 (43%)
Return on investment (annualised)
4.1% 4.3% (0.2%)pts
1 EBIT margin reflects a Talanx Group view
101
2934
-25
64
Q1 2013 Q2 2013 Q3 2013 Q4 2013 Q1 2014

Results Presentation Q1 2014, 15 May 201414
Agenda
Group HighlightsI
Investments / CapitalIII
SegmentsII
Essentials Risk Management Reports 2013IV
OutlookV
Appendix
Mid-term Target Matrix
Q1 2014 Additional Information
Risk Management Reports 2013

Results Presentation Q1 2014, 15 May 201415
Fixed-income-portfolio split Comments
� Investment portfolio remains strongly dominated by fixed-income securities (Q1 2014: 90% portfolio share)
� 80% (Q1 2013: 83%) of fixed-income portfolio invested in A or higher-rated bonds
� 16% of “investments under own management” are held in USD, 27% overall in non-euro currencies
� Moderate increase in GIIPS sovereign exposure to 1.7% of total assets (FY2013:1.2%)
� Investments under own management up by +1.7% y/yand +2.0% vs. 31 Dec. 2013
� Share of equity investments remains at around 1%
Asset allocation as of 31 March 2014
Investments – Breakdown of investment portfolioIII
Conservative investment style remains broadly uncha nged
Breakdown by rating
Breakdown by type
Total: €88.1bn Total: €79.5bn
90%
9%
Other
Equities
Fixed income securities
1%
Other
Covered bonds
Corporate bonds
Government bonds
2%
28%
31%
21%
20%
BBB and below
A
AA
AAA
29%
32%
37%

Results Presentation Q1 2014, 15 May 201416
III
Investment yield up to 4.3% (Q1 2013: 3.7%)
Net investment income Talanx Group Comments
� “Ordinary investment income” in line with Q1 2013 level
� On the back of the increase in asset base, the “current investment income from interest” has also slightly increased compared to Q1 2013
� Higher realised net gains on investments due to:
� Retail Germany’s ambition to finance a major part of this year’s assumed ZZR charge early in the year,
� the selective de-risking in Industrial Lines,
� the change of balance sheet currency of the Bermudian entities in Non-Life Re
� Contribution from unrealised results in reinsurance derivatives vs. Q1 2013: delta inModCo €-4m and inflation swaps €+1m
� Return on investment of 4.3% (Q1 2013: 3.7%)
Net investment income
€m, IFRS Q1 2014 Q1 2013 Change
Ordinary investment income 765 763 +0%
Thereof current investment income from interest 716 712 +1%
Thereof profit/loss from shares in associated companies 4 1 +471%
Realised net gains on investments 210 76 +177%
Write-ups/write-downs on investments (10) (13) (27%)
Unrealised net gains/losses on investments 16 1 +1298%
Investment expenses (55) (42) +30%
Income from investments under own management 926 784 (18%)
Income from investment contracts 0 2 (87%)
Interest income on funds withheld and contract deposits 84 88 (5%)
Total 1,010 875 +15%

Results Presentation Q1 2014, 15 May 201417
Optimized capital structure
� Shareholders’ equity is up by 2.4% vs. Q1 2013 and even 4.5% vs. FY2013. The recent increase q/q is mainly due to net earnings as well as OCI effects from rates and currencies of €131m
� Goodwill stands at €1,103m. When deducting non-controlling interests, the amount reduces to €1,095m
� Book value per share stands at €29.82, while NAV2 per share is €25.49 at the end of March 2014
� Both per share figures do not contain off-balance sheet reserves. After the recent decline in interest rates, these amount to €~3.5bn (see next page), or roughly €1.30 per share (shareholder share only)
� Subordinated liabilities decline following the call of the 2004 issued €750m Hannover Finance bond in February
III
1 adjusted due to IAS82 NAV calculated as shareholders‘ equity minus shareholder share in goodwill
Shareholders’ equity up by ~€320m vs. FY2013 helped by net income and positive OCI effects
Capital breakdown (€bn)
Shareholders‘ equity Minorities Subordinated liabilities
Equity and capitalization – Solid equity base
7.26.8 7.0
4.23.9 3.9
3.13.1
7.2
3.1 3.1
4.0
31 Mar 2013 30 June 13 30 Sep 13 31 Dec 13 31 Mar 13
3.1
4.2
7.4
14.4
3.1
3.9
6.8
13.8
3.1
3.9
7.0
14.0
3.1
4.0
7.2
14.3
2.4
4.2
7.5
14.1
31 Mar 13 30 June 13 30 Sep 13 31 Dec 13 31 Mar 14

Results Presentation Q1 2014, 15 May 201418
∆ market value vs. book value
III
Talanx’s off-balance sheet up to €3.5bn end of March 2014 (end Dec 2013: €2.9bn)
Unrealised gains and losses (off and on balance she et) as of 31 March 2014 (€m)
31 Dec 13 2,779 150139 49 (250) 2,867 1,619 321 1,940 4,808
Equity and capitalization – Unrealised gains
Total
3,464133 140 59 (298)
3,498
2,404345 2,749 6,247
Loans andreceivables
Held to maturity
Investmentproperty
Real estateown use
Subordinatedloans
Off balancesheet reserves
Availablefor sale
Other assets On balancesheet reserves
Total unreal-ised gains(losses)

Results Presentation Q1 2014, 15 May 201419
Agenda
Group HighlightsI
Investments / CapitalIII
SegmentsII
Essentials Risk Management Reports 2013IV
OutlookV
Appendix
Mid-term Target Matrix
Q1 2014 Additional Information
Risk Management Reports 2013

Results Presentation Q1 2014, 15 May 201420
TERM (Talanx Enterprise Risk Model) run 2013 overal l confirms reliability of the internal model. Capital Adequacy Ratio of 333% close to 2012 level of 351% for 99.5% confidence level
At the 99.97% confidence level – which reflects Tala nx’s own strategic targets -, the Capital Adequacy Ratio stands at 186% (2012: 196%)
Market risks at 37% remain well below the 50% thres hold. Non-life risks representing 38% of risk capital consumption making it the largest single ri sk category
Increase in MCEV to €3.5bn, with the MCEV roughly e qually split between Primary Insurance and Reinsurance. 2013 improvement in Primary Insurance largely driven by capital market development (incl. duration management) , in Reinsu rance positive new business contribution
Significant reduction in duration gap in Life and t he more favourable yield and spread environment trigger the material decline in yield s ensitivity of the MCEV
First-time presentation of separate MCEV values for the cumulated German and foreign entities of Primary Insurance
Essentials – Risk Management Reports 2013IV

Results Presentation Q1 2014, 15 May 201421
Agenda
Group HighlightsI
Investments / CapitalIII
SegmentsII
Essentials Risk Management Reports 2013IV
OutlookV
Appendix
Mid-term Target Matrix
Q1 2014 Additional Information
Risk Management Reports 2013
Results Presentation Q1 2014, 15 May 201422
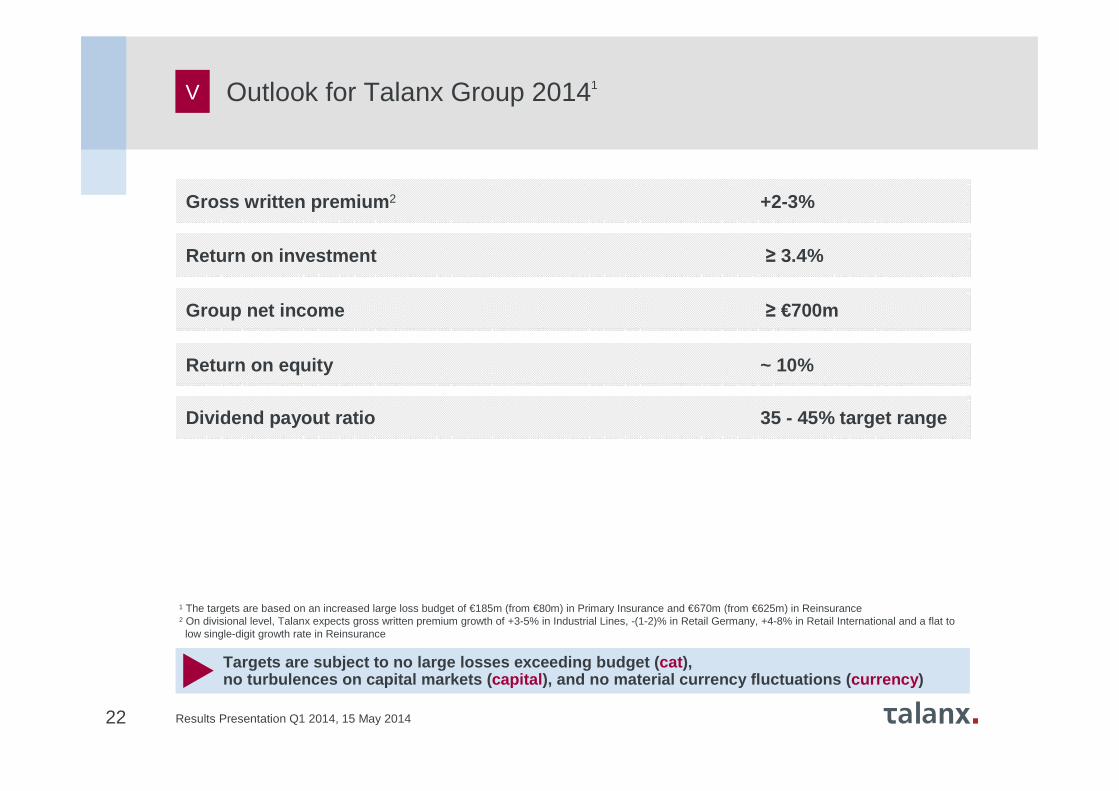
Targets are subject to no large losses exceeding bu dget ( cat ), no turbulences on capital markets ( capital ), and no material currency fluctuations ( currency )
Gross written premium 2 +2-3%
Return on investment ≥ 3.4%
Group net income ≥ €700m
Return on equity ~ 10%
Dividend payout ratio 35 - 45% target range
V Outlook for Talanx Group 20141
1 The targets are based on an increased large loss budget of €185m (from €80m) in Primary Insurance and €670m (from €625m) in Reinsurance2 On divisional level, Talanx expects gross written premium growth of +3-5% in Industrial Lines, -(1-2)% in Retail Germany, +4-8% in Retail International and a flat to
low single-digit growth rate in Reinsurance

Results Presentation Q1 2014, 15 May 201423
Agenda
Group HighlightsI
Investments / CapitalIII
SegmentsII
Essentials Risk Management Reports 2013IV
OutlookV
Appendix
Mid-term Target Matrix
Q1 2014 Additional Information
Risk Management Reports 2013

Results Presentation Q1 2014, 15 May 2014
1 Risk-free rate is defined as the 5-year rolling average of the 10-year German government bond yield
2 Derived from actual asset duration. Currently ~ 6.5 years, therefore the minimum return is the 13-year average of 13-year German government bond yield. Annually rolling
Segments Key figures Strategic targets
GroupReturn on equity ≥ 750 bps above risk free1
Group net income growth ~ 10%
Dividend payout ratio 35 - 45%
Return on investment2 ≥ 3.5%
Industrial LinesGross premium growth3 3 - 5%
Combined ratio ≤ 96%
EBIT margin4 ≥ 10%
Retention rate 60 - 65%
Retail GermanyGross premium growth ≥ 0%
Combined ratio (non-life) ≤ 97%
New business margin (life) ≥ 2%
EBIT margin4 ≥ 4.5%
Retail InternationalGross premium growth3 ≥ 10%
Combined ratio (non-life) ≤ 96%
Value of New Business (VNB) growth 5 - 10%
EBIT margin4 ≥ 5%
Non-life reinsuranceGross premium growth 3 - 5%
Combined ratio ≤ 96%
EBIT margin4 ≥ 10%
Life & health reinsuranceGross premium growth3 5 - 7%
Value of New Business (VNB) growth ≥ 10%
EBIT margin4 financing and longevity business ≥ 2%
EBIT margin4 mortality and health business ≥ 6%
3 Organic growth only; currency neutral4 EBIT/net premium earned
Note: growth targets are on p.a. basis. They are based on 2012 results.
Mid-term Target MatrixA
24

Results Presentation Q1 2014, 15 May 201425
€m, IFRS Q1 2014 Q1 2013 Change
P&L
Gross written premium 1,763 1,735 +2%
Net premium earned 407 439 (7%)
Net underwriting result 6 2 +205%
Net investment income 72 55 +30%
Operating result (EBIT) 60 33 +84%
Net income after minorities 35 19 +81%
Key ratios
Combined ratio non-life insurance and reinsurance
98.6% 99.4% -0.8%pts
Return on investment 4.2% 3.2% 1.0%pts
Industrial Lines
Q1 2014 Q1 2013 Change
2,027 2,113 (4%)
1,287 1,323 (3%)
(430) (296) n/m
501 387 +29%
54 66 (18%)
29 43 (32%)
100.2% 95.0% 5.2%pts
4.7% 3.8% 0.9%pts
Q1 2014 Q1 2013 Change
1,164 1,056 +10%
983 877 +12%
8 17 (53%)
74 74 (0%)
62 66 (6%)
39 38 +1%
95.1% 94.1% 1.0%pts
4.7% 5.1% -0.4%pts
Retail Germany Retail International
Note: Differences due to rounding may occur.
Q1 2014 Additional Information - SegmentsA

Results Presentation Q1 2014, 15 May 201426
€m, IFRS Q1 2014 Q1 2013 Change
P&L
Gross written premium 2,108 2,198 (4%)
Net premium earned 1,632 1,692 (4%)
Net underwriting result 86 98 (12%)
Net investment income 211 195 +9%
Operating result (EBIT) 286 266 +8%
Net income after minorities 96 79 +22%
Key ratios
Combined ratio non-life insurance and reinsurance
94.5% 94.0% 0.5%pts
Return on investment 3.3% 3.0% 0.3%pts
Note: Differences due to rounding may occur.
Q1 2014 Q1 2013 Change
1,517 1,560 (3%)
1,281 1,389 (8%)
(87) (68) n/m
152 162 (6%)
64 101 (37%)
21 37 (43%)
--- --- ---
4.1% 4.3% -0.2%pts
Q1 2014 Q1 2013 Change
8,414 8,458 (1%)
5,599 5,715 (2%)
(415) (249) n/m
1,010 875 +15%
509 530 (4%)
193 208 (7%)
95.8% 95.0% 0.8%pts
4.3% 3.7% 0.6%pts
Non-Life Reinsurance Life and Health Reinsurance
Group
Q1 2014 Additional Information - Segments (continued)A

Results Presentation Q1 2014, 15 May 201427
Retail Germany Retail International
1 Entity results from Sept 2012 merger of HDI Direkt Versicherung AG and HDI-Gerling Firmen und Privat Versicherung AG
2 Talanx ownership 67.5%3 includes HDI Asekuracja TU S.A., Poland; Talanx ownership of 75.74%4 Talanx ownership 50% + 1 share; closed on 1 June 2012 5 includes Metropolitana6 includes HDI-Gerling Zycie, Poland; Talanx ownership of 75.74%
Numbers for main carriers represent data entry values, fully consolidated
GWP, €m, IFRS Q1 2014 Q1 2013 Change
Non-life Insurance 808 835 (3%)
HDI Versicherung AG1 772 799 (3%)
Life Insurance 1,219 1,277 (5%)
HDI Lebensversicherung AG 500 561 (11%)
neue leben Lebensversicherung AG2 243 249 (3%)
TARGO Lebensversicherung AG 251 245 +2%
PB Lebensversicherung AG 175 176 (0%)
Total 2,027 2,113 (4%)
GWP, €m, IFRS Q1 2014 Q1 2013 Change
Non-life Insurance 708 713 (1%)
HDI Seguros S.A., Brazil 189 212 (11%)
TUiR Warta S.A.3, Poland 229 222 +3%
TU Europa S.A.4, Poland 45 29 +54%
HDI Assicurazioni S. p. A., Italy (P&C) 81 84 (4%)
HDI Seguros S.A. De C.V., Mexico5 43 42 +2%
HDI Sigorta A.Ş., Turkey 50 51 (2%)
Life Insurance 456 343 +33%
TU Warta Zycie S.A., Poland6 39 57 (32%)
TU Europa Zycie4, Poland 55 97 (43%)
Open Life4 6 4 +47%
HDI Assicurazioni S. p. A., Italy (Life) 249 68 +267%
Total 1,164 1,056 +10%
Q1 2014 Additional Information – GWP of main risk carriersA

Results Presentation Q1 2014, 15 May 201428
Q1 2014 Additional Information – Details on GIIPS exposure
Total GIIPS exposure (31 March 2014)
� Total GIIPS exposure incl. private sector assets at ~4.2% of total assets
� GIIPS sovereign exposure at 1.7% of total assets (Q1 2013: 0.7%, FY2013: 1.2%) – Talanx may top up its sovereign exposure to selected GIIPS government issuers to up to 3% of total assets in the course of 2014
� Talanx over time has slightly raised its exposure to Italian and Spanish issuers very selectively, following the investment strategy already communicated to the capital markets
� Additional investments of ca. €1.2bn since 31 Dec. 2013 mainly in sovereign (€~0.8bn) and semi-sovereign (€~0.3bn) issue issuers
A
Comments
Slight increase in GIIPS investments – increase in u nrealised gains
Details on sovereign exposure in €m
Total: €2,149m (amortized cost), €2,291m (fair value)
Total unrealised gain: €142m
€m Government bonds Corporate bonds
GIIPS exposure SovereignSemi-
SovereignFinancial Corporate Covered Other Total
Greece 7 - - - - - 7
Ireland 228 - 10 50 130 237 656
Italy 1,347 - 410 482 848 19 3,106
Portugal 26 - 5 3 - - 35
Spain 682 574 131 233 367 - 1,987
Total 2,291 574 557 769 1,344 256 5,790
670
25
1,250
2013
682
26
1,347
228
7
Greece Ireland Italy Portugal Spain
Amortized cost Fair value

Results Presentation Q1 2014, 15 May 2014
MCEV 2013 - Overview
MCEV of €3.5bn reflects life business of primary i nsurance and reinsurance
� Split of primary insurance business into German domestic (Primary D) and international (Primary INT) business shown to acknowledge the increase of international business
� MCEV explicitly calculated for the major primary life insurance carriers in Germany, Italy, and Poland, namely HDI-, neue leben-, PB and TARGO Lebensversicherung AG, HDI Pensionskasse AG, HDI Assicurazioni S.p.A. Life and Towarzystwo Ubezpieczen na Zycie WARTA S.A., and for the active life and health reinsurance businesses of Hannover Re L&H
� Covered businesses contribute more than 93% of the total IFRS net premiums written by life insurance and life and health reinsurance businesses of the Group
29
A
29.72,727.13,538.31,534.51,807.61,192.61,730.7393.61,337.1MCEV after minorities
46.71,151.51,688.91,030.9986.5120.6702.475.8626.6Value in-force (VIF)
-54.334.915.9-39.4-38.074.353.9-12.866.7Look through and other adjustments
-46.2-85.2-124.6-51.6-67.2-33.7-57.4-5.4-51.9Cost of required capital (CoRC)
12.1-338.9-297.8-214.9-215.0-124.0-82.8-10.0-72.9Cost of residual non-hedgeable risks (CoRNHR)
60.8-713.7-279.4-7.9-2.0-705.7-277.5-13.8-263.7Financial options and guarantees (FOGs)
5.32,254.42,374.81,344.71,308.7909.71,066.1117.7948.3Present value of future profits (certainty equivalent)
17.41,575.61,849.4503.6821.11,072.11,028.3317.8710.5Net asset value (NAV)
%€ m€ m€ m€ m€ m€ m€ m€ m
Change20122013201220132012201320132013
TotalINTD
TalanxReinsurancePrimary insurance

Results Presentation Q1 2014, 15 May 2014
2727.1 36.4 2763.5
233.1164.1 12.4
423.0 807.8 33.0 3538.3
OpeningMCEV
Initialadjustments
Adjustedopening MCEV
New businessvalue
Roll forward Operatingassumptionsand variances(incl. modelchanges)
Economic andother non-operatingvariance
Total MCEVearnings
Closingadjustments
Closing MCEV
MCEV 2013 - Movement of Embedded Value
Movement of Embedded Value (€m)
Increase of MCEV for primary business mainly due to higher yields and lower credit spreads
30
A
2,727 36 2,763
233
423
164 12
807 33 3,538
Results Presentation Q1 2014, 15 May 2014
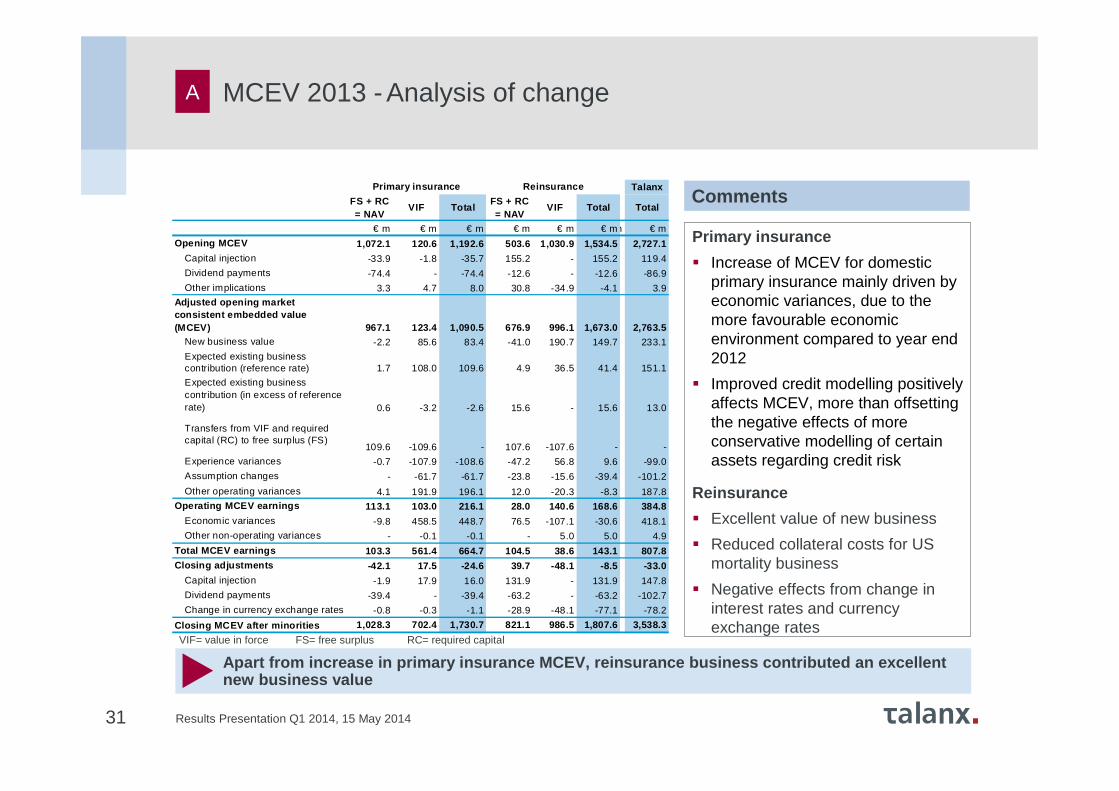
Primary insurance
� Increase of MCEV for domestic primary insurance mainly driven by economic variances, due to the more favourable economic environment compared to year end 2012
� Improved credit modelling positively affects MCEV, more than offsetting the negative effects of more conservative modelling of certain assets regarding credit risk
Reinsurance
� Excellent value of new business
� Reduced collateral costs for US mortality business
� Negative effects from change in interest rates and currency exchange rates
Comments
31
Apart from increase in primary insurance MCEV, rein surance business contributed an excellent new business value
A
VIF= value in force FS= free surplus RC= required capital
MCEV 2013 - Analysis of change
TalanxFS + RC= NAV
VIF TotalFS + RC= NAV
VIF Total Total
€ m € m € m € m € m € m€ m € m
Opening MCEV 1,072.1 120.6 1,192.6 503.6 1,030.9 1,534.5 2,727.1
Capital injection -33.9 -1.8 -35.7 155.2 - 155.2 119.4
Dividend payments -74.4 - -74.4 -12.6 - -12.6 -86.9
Other implications 3.3 4.7 8.0 30.8 -34.9 -4.1 3.9
Adjusted opening market consistent embedded value (MCEV) 967.1 123.4 1,090.5 676.9 996.1 1,673.0 2,763.5
New business value -2.2 85.6 83.4 -41.0 190.7 149.7 233.1
Expected existing business contribution (reference rate) 1.7 108.0 109.6 4.9 36.5 41.4 151.1
Expected existing business contribution (in excess of reference rate) 0.6 -3.2 -2.6 15.6 - 15.6 13.0
Transfers from VIF and required capital (RC) to free surplus (FS)
109.6 -109.6 - 107.6 -107.6 - -
Experience variances -0.7 -107.9 -108.6 -47.2 56.8 9.6 -99.0
Assumption changes - -61.7 -61.7 -23.8 -15.6 -39.4 -101.2
Other operating variances 4.1 191.9 196.1 12.0 -20.3 -8.3 187.8Operating MCEV earnings 113.1 103.0 216.1 28.0 140.6 168.6 384.8
Economic variances -9.8 458.5 448.7 76.5 -107.1 -30.6 418.1
Other non-operating variances - -0.1 -0.1 - 5.0 5.0 4.9
Total MCEV earnings 103.3 561.4 664.7 104.5 38.6 143.1 807.8Closing adjustments -42.1 17.5 -24.6 39.7 -48.1 -8.5 -33.0
Capital injection -1.9 17.9 16.0 131.9 - 131.9 147.8
Dividend payments -39.4 - -39.4 -63.2 - -63.2 -102.7
Change in currency exchange rates -0.8 -0.3 -1.1 -28.9 -48.1 -77.1 -78.2
Closing MCEV after minorities 1,028.3 702.4 1,730.7 821.1 986.5 1,807.6 3,538.3
ReinsurancePrimary insurance

Results Presentation Q1 2014, 15 May 2014
Increase of Talanx’s new business value by 6.3%
32
A
Primary segment� Increase in new business
value� Increase of profitability due to:� Decrease of FOGs for
domestic primary insurance due to lower guaranteed interest rates
� Decrease of CoRNHR due to lower necessary internal risk capital
Reinsurance segment� New business value on the
same excellent level as last year
� Lower contribution of treaties by the subsidiaries in Ireland, Bermuda and the US where the premiums are set equal to the fees leads to lower new business margin
*The values for 2012 exclude the NBV of WARTA because WARTA was included in the 2012 MCEV results only as a closing adjustment. **The values for 2013 exclude the new business written by HDI-Gerling Zycie since the merger of WARTA with HDI-Gerling Zycie is included in the 2013 MCEV only in the closing adjustments.
MCEV 2013 – New Business
-8.3%3.4%3.1%5.8%4.0%1.7%2.2%0.8%2.5%New businessmargin
6.3219.2233.1153.8149.765.483.45.478.0New business valueafter minorities
-71.0-4.7-8.0-3.7-5.2-1.0-2.8-1.4-1.3Look through and other adjustments
-15.7-7.7-8.9-5.5-7.7-2.2-1.2-1.1-0.1Cost of requiredcapital (CoRC)
3.4-30.5-29.5-18.8-22.7-11.7-6.8-1.8-5.0
Cost of residual non-hedgeable risks(CoRNHR)
90.8-18.1-1.7---18.1-1.7-4.32.6
Financial optionsand guarantees(FOGs)
-6.4346.6324.4246.0226.3100.798.116.281.8
Present value of future profits(certaintyequivalent)
34.9-66.4-43.2-64.1-41.0-2.2-2.2-2.20.0Profit/Loss on newbusiness
%€ m€ m€ m€ m€ m€ m€ m€ m
Change2012*2013**201220132012*2013**2013**2013
TotalINTD
TalanxReinsurancePrimary insurance Comments

Results Presentation Q1 2014, 15 May 2014
Reduced impact of changes in interest rates due to more favourable economic situationHigher diversification effect between German/intern ational Primary Insurance and Reinsurance
� Decrease of sensitivities with respect to economic data
� Asymmetrical and non-linear impact from embedded options and guarantees on shareholders’ cash flows
� Impact on MCEV thus lower in 2013 due to more favourable economic environment
� Increased asset duration for primary business also positively affects interest sensitivity
33
A MCEV 2013 - Sensitivity analysis
D INT
2013 2013 2013 2012 2013 2012 2013 2012
€ m € m € m € m € m € m € m € m
MCEV after minorities 1,337.1 393.6 1,730.7 1,192.6 1,80 7.6 1,534.5 3,538.3 2,727.1
% % % % % % % %
Mortality/Morbidity + 5% (non-annuity) -1.5 -2.2 -1.7 -3.5 -25.4 -33.4 -13.8 -20.3
Mortality/Morbidity -5% (non-annuity) 1.7 2.2 1.8 3.3 25.3 36.0 13.8 21.7
Mortality +5% (annuity) 1.8 0.0 1.4 3.1 4.5 3.6 2.9 3.4
Mortality -5% (annuity) -1.9 0.0 -1.5 -3.3 -4.8 -3.8 -3.1 -3.6
Lapse rate +10% -2.4 -0.9 -2.1 -1.3 -8.9 -12.3 -5.5 -7.5
Lapse rate -10% 2.8 1.0 2.4 1.4 5.7 8.3 4.1 5.3
Maintenance expenses +10% -5.1 -2.3 -4.4 -9.2 -2.7 -3.2 -3.5 -5.8
Maintenance expenses -10% 5.1 2.3 4.5 8.9 2.5 2.9 3.5 5.5
Yield curve +1% 7.9 -1.8 5.7 32.4 -8.8 -7.5 -1.7 10.0
Yield curve -1% -13.7 1.4 -10.3 -75.3 8.2 9.0 -0.8 -27.8
Swaption implied volatilities +25% -3.5 -1.1 -2.9 -16.5 -0.2 -0.3 -1.5 -7.4
Equity and property value +10% 2.6 2.1 2.5 4.9 0.1 0.1 1.2 2.2
Equity and property value -10% -2.8 -2.1 -2.6 -5.2 -0.1 -0.1 -1.3 -2.3
Equity option volatilities +25% -0.7 -0.1 -0.6 3.8 0.0 0.0 -0.3 1.6
Talanx
Total
Primary insurance Reinsurance

Results Presentation Q1 2014, 15 May 2014
MCEV 2013 -New Business Value sensitivity analysis
Diversification for economic sensitivities between domestic and international primary business
34
A
*The values for 2012 exclude the NBV of WARTA because WARTA was included in the 2012 MCEV results only as a closing adjustment. **The values for 2013 exclude the new business written by HDI-Gerling Zycie since the merger of WARTA with HDI-Gerling Zycie is included in the 2013 MCEV only in the closing adjustments.
D INT
2013 2013** 2013** 2012* 2013 2012 2013** 2012*
€ m € m € m € m € m € m € m € m
NBV after minorities 78.0 5.4 83.4 65.4 149.7 153.8 233.1 2 19.2
% % % % % % % %
Mortality/Morbidity + 5% (non-annuity) -1.5 -24.4 -3.0 -9.0 -19.9 -27.5 -13.9 -22.0
Mortality/Morbidity -5% (non-annuity) 4.1 24.4 5.4 6.5 19.2 26.7 14.3 20.7
Mortality +5% (annuity) 0.8 -0.1 0.7 2.5 12.3 1.1 8.2 1.5
Mortality -5% (annuity) -0.9 0.1 -0.8 -3.0 -13.0 -1.2 -8.6 -1.7
Lapse rate +10% -4.8 -10.2 -5.1 -6.7 -5.8 -7.4 -5.6 -7.2
Lapse rate -10% 8.2 13.2 8.5 5.0 5.6 6.0 6.6 5.7
Maintenance expenses +10% -3.2 -20.3 -4.3 -16.7 -5.1 -3.2 -4.8 -7.3
Maintenance expenses -10% 4.6 20.2 5.6 12.7 5.0 3.6 5.2 6.3
Yield curve +1% 0.4 -41.6 -2.3 43.1 -9.6 -9.2 -7.0 6.4
Yield curve -1% -0.1 39.7 2.5 -96.9 10.1 9.7 7.4 -20.0
Swaption implied volatilities +25% 0.2 -24.0 -1.4 -17.6 0.0 0.0 -0.5 -5.3
Equity and property value +10% 0.8 5.0 1.1 4.4 0.0 0.0 0.4 1.3
Equity and property value -10% -1.2 -5.9 -1.5 -5.2 0.0 0.0 -0.5 -1.6
Equity option volatilities +25% -0.9 -2.2 -0.9 4.1 0.0 0.0 -0.3 1.2
Talanx
Total
Primary insurance Reinsurance

Results Presentation Q1 2014, 15 May 2014
MCEV 2013 - Duration concepts
Duration of bond portfolio increased for life insur ance because of portfolio adjustments Active and significant reduction of asset-liability-missma tch in life insurance
Durations of technical reserves and bond portfolio, 2013 and 2012
35
13.1 13.1
5.95.1
9.9 9.610.4
11.7
5.95.1
8.3 8.5
6.87.2
3.94.0
9.210.0
Primary insurance(life) 2013
Primary insurance(life) 2012
Primary insurance(non-life) 2013
Primary insurance(non-life) 2012
Talanx Group 2013 Talanx Group 2012
Technical reserves (Macaulay) Technical reserves (effective) Bond portfolio (Macaulay incl. derivatives)
∆ < 1.0 ∆ =2.5
∆ =1.9∆ =1.2
∆ =1.1∆ =1.7
20122013 approx.for slightly lower modified duration
A

Results Presentation Q1 2014, 15 May 2014
SCR 2013 - Result History (Economic View)
CAR almost unchanged compared to 2012 which is refl ected by the simultaneous change of own funds and SCR
Comments
� Own funds (after minorities) increase significantly from €6.6bn (31 Dec 2012) to €7.8bn 31 Dec 2013
� Change in own funds from 2012 to 2013 largely due to
� the increase of the own funds for the primary life insurance companies, which is mainly driven by higher yields and lower credit spreads end 2013
� the increase of the own funds for the Hannover Re Group, which is mainly driven by the best estimate revaluation of the reserves, the discount effects on claim reserves due to an increase of interest rates
Own Funds (€bn)
5.6 5.6 6.6
2010 2011 2013year
Solvency Capital Required (€bn)
Capital Adequacy Ratio (CAR)
36
2012
7.8
1.7 2.0 1.9
2010 2011 2013year
2012
2.4
322%277%
351%
2010 2011 2013year
2012
333%
A

Results Presentation Q1 2014, 15 May 2014
(As of 31 December 2013, €bn)
Talanx Group features a well-diversified portfolio
1 Solvency capital requirement; determined according to 99.5% security level, economic view, after minorities
� Diversification effect of 25% among primary divisions
� The Group benefits from a diversification effect of 15% between primary insurance and reinsurance
� This corresponds to an absolute amount of €0.4bn
SCR1 by Division Comments
Diversifi-cation
betweenprimary
divisions and corporatefunctions
37
0.5
1.3
27%
48%
52%
2.4
1.4
(0.4)
(0.4)
(25%)
(15%)
0.5
30%
0.4
0.4
23%
CorporateOperations
PrimaryInsurance
Re-insurance
Diversifi-cation
betweenprimary
and reinsurance
Talanx Group
21%
RetailGermany
RetailInternational
IndustrialLines
SCR 2013 – Split by division
31 Dec 12
0.6 0.3 0.5 0.4 0.7 1.1 1.3 0.5 1.9
A
35% 18% 25% 22% 40% 45% 55% 22%

Results Presentation Q1 2014, 15 May 2014
(as of 31 December 2013, €bn)
Material rise in Own Funds in comparison to year-en d 2012
1 economic view, after minorities
Own funds 1 by Division
38
SCR 2013 - Own Funds by division
7.8
(1.9)
4.1
2.0
1.3
2.4
Retail Germany RetailInternational
Industrial Lines Reinsurance Corporate Functions
Talanx Group
31 Dec 12 1.8 1.1 1.9 3.7 (1.9) 6.6
A

39 Results Presentation Q1 2014, 15 May 2014
Solvency capital requirement split into components
High diversification between risk categories
Risk components of Talanx Group 1
(as of 31 December 2013, €m)
Mar
ket
risk
nonl
ife a
nd
rein
sura
nce
Mar
ket
risk
prim
ary
life
Pen
sion
ris
k
Div
ersi
ficat
ion
Tot
al
mar
ket
risk
Pre
miu
m
and
rese
rve
risk
(non
life)
Nat
Cat
(n
et)
Cou
nter
part
y de
faul
t ris
k
Div
ersi
ficat
ion
Non
life
risk
Fur
ther
ris
k (li
fe)
Ope
ratio
nal
risk
Oth
er r
isk
Tot
al r
isk
befo
re ta
x an
d be
fore
di
vers
ifica
tion
Tax
effe
ct
(non
life
and
smal
l en
titie
s)
Div
ersi
ficat
ion
Tot
al r
isk
1.81,632
33.6% 433
8.9% 390
8.0%
653
13.4%
1,802
37.1%
1,388
28.6%
1,409
29.0%
259
5.3%
1,200
24.7%1,856
38.2%
781
16.1% 389
8.0%
29
0.6%
4,857
100.0%
651
1,850
2,356
1 Figures show risk categorisation of the Talanx Group after minorities, tax effects and diversification effects as of 2013. Solvency capital requirement determined according to 99.5% security level, economic view, after minorities
A

Results Presentation Q1 2014, 15 May 2014
SCR 2013 - Sensitivity of Solvency Capital Ratios
Conservatism of Talanx´s economic view underlined by not including subordinated liabilitesinto Own Funds
Inclusion of subordinated liabilities
7.8
2.4333%
Own Funds SCR CAR
Own funds incl.subordinatedliabilities
9.7
2.4
412%
SCR CAR
Economic view Comments
� In the Economic View, subordinated liablitiesare not included in Own Funds
� Subordinated liabilities would lead to an increase in own funds of roughly €1.9bn
� Inclusion of subordinated liabilities leads to an increase in the capital adequacy ratio to 412%
� Consideration of subordinated liabilities has no influence on solvency capital requirements
40
A

Results Presentation Q1 2014, 15 May 2014
SCR 2013 - Sensitivity of Solvency Capital Ratios „Haircut Effect”
Talanx´s CAR would be at a comfortable level even af ter a haircut
1 Solvency capital requirement; determined according to 99.5% security level, Regulatory View (including subordinated liabilities 267%)
Effect of availability constraints on CAR
333%233%
CAR Economic View at
Talanx level
Capital Adequacy Ratio Comments
� Regulatory framework under Solvency II relates minorities to the availability of capital, respectively Own Funds. This places restrictions on regulatory Own Funds on Group level (e.g. minority interest)
� The amount, however, depends on the risk capital allocated to solo entities
� Capital allocation is determined by an appropriate allocation method
� The main impact on availability of Own Funds stems from minority interest in Hannover Re
41
Internal Model basedallocation after haircut at
HDI VaG level1
A

Results Presentation Q1 2014, 15 May 201442
This presentation contains forward-looking statements which are based on certain assumptions, expectations and opinions of the management of Talanx AG (the "Company") or cited from third-party sources. These statements are, therefore, subject to certain known or unknown risks and uncertainties. A variety of factors, many of which are beyond the Company’s control, affect the Company’s business activities, business strategy, results, performance and achievements. Should one or more of these factors or risks or uncertainties materialize, actual results, performance or achievements of the Company may vary materially from those expressed or implied as being expected, anticipated, intended, planned, believed, sought, estimated or projected.in the relevant forward-looking statement.
The Company does not guarantee that the assumptions underlying such forward-looking statements are free from errors nor does the Company accept any responsibility for the the actual occurrence of the forecasted developments. The Company neither intends, nor assumes any obligation, to update or revise these forward-looking statements in light of developments which differ from those anticipated.
Where any information and statistics are quoted from any external source, such information or statistics should not be interpreted as having been adopted or endorsed by the Company as being accurate.Presentations of the company usually contain supplemental financial measures (e.g., return on investment, return on equity, gross/net combined ratios, solvency ratios) which the Company believes to be useful performance measures but which are not recognised as measures under International Financial Reporting Standards, as adopted by the European Union ("IFRS"). Therefore, such measures should be viewed as supplemental to, but not as substitute for, balance sheet, statement of income or cash flow statement data determined in accordance with IFRS. Since not allcompanies define such measures in the same way, the respective measures may not be comparable to similarly-titled measures used by other companies. This presentation is dated as of 15 May 2014. Neither the delivery of this presentation nor any further discussions of the Company with any of the recipients shall, under any circumstances, create any implication that there has been no change in the affairs of the Company since such date. This material is being delivered in conjunction with an oral presentation by the Company and should not be taken out of context.
Disclaimer