results 12 months of 2015 - galp.com · sales of electricityvendas de eletricidade gwh 1.219 996...
TRANSCRIPT

1
12 months 2015 results
08 February, 2016
RESULTS12 MONTHS OF 2015
Integrated energy operator focusedon exploration and production

2
12 months 2015 results
DISCLAIMER
This presentation contains forward-looking statements about the activities and results of Galp Energia as well as some Company plans and
objectives. The terms “anticipates”, “believes”, “estimates”, “expects”, “predicts”, “aims”, “plans” and other similar ones aim to identify such forward-
looking statements. As a result of their nature, forward-looking statements involve risks and uncertainties as they are associated with events and
circumstances that may occur in the future. Real outcomes and developments may as a result of several factors differ significantly from outcomes,
either express or implicit, in the statements. These include but are not limited to changes in costs, economic conditions or regulatory framework.
Forward-looking statements only refer to the date when they were made and Galp Energia has no obligation to update them in the light of new data
or future developments or otherwise explain the reasons actual outcomes are possibly different.
3
12 months 2015 results
MARKET
OPERATIONAL DATA
RESULTS
AGENDA
4
12 months 2015 results
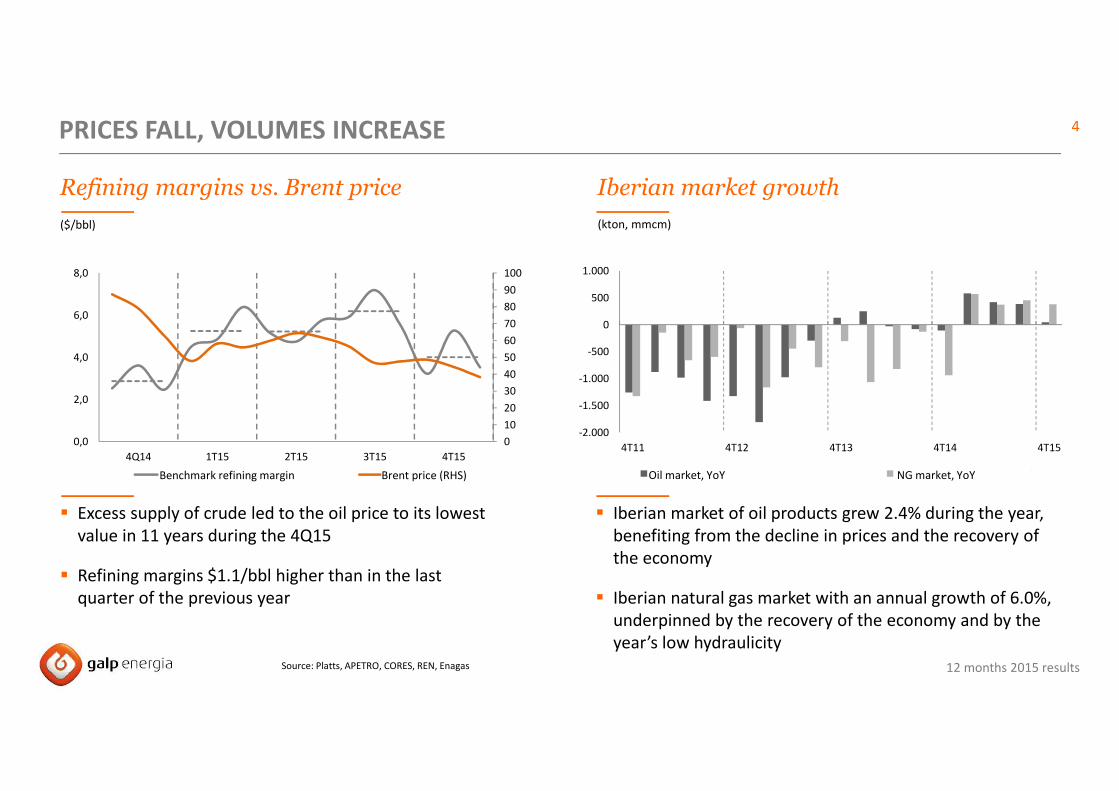
Refining margins vs. Brent price
($/bbl)
PRICES FALL, VOLUMES INCREASE
Iberian market growth
(kton, mmcm)
Source: Platts, APETRO, CORES, REN, Enagas
0
10
20
30
40
50
60
70
80
90
100
0,0
2,0
4,0
6,0
8,0
4Q14 1T15 2T15 3T15 4T15
Margem de refinação benchmark Preço Brent (RHS)
-2.000
-1.500
-1.000
-500
0
500
1.000
4T11 4T12 4T13 4T14 4T15
Mercado de produtos petrolíferos, YoY Mercado de gás natural, YoY
� Excess supply of crude led to the oil price to its lowest
value in 11 years during the 4Q15
� Refining margins $1.1/bbl higher than in the last
quarter of the previous year
� Iberian market of oil products grew 2.4% during the year,
benefiting from the decline in prices and the recovery of
the economy
� Iberian natural gas market with an annual growth of 6.0%,
underpinned by the recovery of the economy and by the
year’s low hydraulicity
NG market, YoYOil market, YoYBrent price (RHS)Benchmark refining margin

12 months 2015 results
5
� Diesel consumption maintains growth initiated
two years ago
� Portuguese oil market with higher consumption
of bitumen, industrial and maritime fuel and jets
� Consumption of natural gas increased more
in Portugal than in Spain due to greater use
of gas power stations for electricity production
PORTUGUESE MARKET EXPANDS FOR THE FIRST TIME SINCE 2005
Iberian Peninsula energy market
Portugal Spain
(1) Source: DGEG based on the Apetro and Cores market(2) Source: Galp Energia; Enagas
(3) Source: REN; REE (Coal, 28%; Wind, 23%; Hydroelectric, 18%; Natural Gas, 13%; Other, 12%)
12M2014 12M2015 Variação 12M2014 12M2015 Variação
8.581 8.882 3,5%Produtos petroliferos(1)
(mton)50.087 51.219 2,3%
541 524 (3,1%) GPL (mton) 1.664 1.853 11,4%
1.459 1.437 (1,5%) Gasolina (mm3) 6.141 6.178 0,6%
1.388 1.459 +5,1% Jets (mm3) 6.582 6.868 4,3%
5.397 5.514 +2,2% Gasóleo (mm3) 32.010 33.222 3,8%
45 45 (,9%) Lubrificantes (mton) 366 379 3,5%
281 338 +20,4% Fuelóleo industrial (mton) 2.201 2.256 2,5%
784 846 +7,9% Fuelóleo marítimo (mton) 8.008 7.576 (5,4%)
144 204 +42,2% Betumes (mton) 885 909 2,7%
3.883 4.477 15,3% Gás natural(2) (Mm3) 25.835 27.019 4,6%
270 947 250,1% Elétrico (Mm3) 4.436 5.243 18,2%
3.612 3.530 (2,3%) Convencional (Mm3) 21.399 21.776 1,8%
48.814 48.968 0% Eletricidade(3) (GWh) 243.544 247.983 1,8%
LPG (mton)
Gasoline (mm3)
Conventional (Mm3)
VariationVariation
Oil products(1)
(mton)
Electrical (Mm3)
Natural gas(2) (Mm3)
Bitumen (mton)
Maritime fuel oil (mton)
Industrial fuel oil (mton)
Lubricants (mton)
Diesel (mm3)
Electricity (3) (GWh)
6
12 months 2015 results
MARKET
OPERATIONAL DATA
RESULTS
AGENDA

12 months 2015 results
7
� Increased production of FPSO Cidade de Paraty
and FPSO Cidade de Mangaratiba underpin higher
production in Brazil
� Crude utilisation rate supported by high availability
and European refining margins
� Sales of oil products increase, benefiting from the
recovery of the Iberian market and, in particular,
from exports
� Eletric production sustains increase in gas sales
PRODUCTION AND REFINING HIT RECORD
Operational data
3T15 4T14 4T15 12M14 12M15
Produção média working interest mboepd 45,7 36,3 52,1 30,5 45,8
Angola mboepd 7,9 11,0 10,4 10,7 9,8
Brasil mboepd 37,8 25,3 41,6 19,8 36,0
Produção média net entitlement mboepd 43,9 33,4 49,2 27,1 43,2
Angola mboepd 6,1 8,1 7,6 7,2 7,2
Brasil mboepd 37,8 25,3 41,6 19,8 36,0
Margem de refinação Galp Energia $/bbl 6,7 4,7 4,1 2,8 6,0
Vendas oil clientes diretos Mton 2,4 2,3 2,2 9,1 9,1
Vendas de gás natural Mm3 1.909 1.885 1.692 7.472 7.665
Vendas clientes diretos Mm3 933 968 992 3.759 3.843
Trading / Outros Mm3 976 917 700 3.713 3.822
Vendas de eletricidade GWh 1.219 996 1.170 3.792 4.636Sales of electricity
Sales to direct clients
Sales of natural gas
Sales of oil to direct clients
Galp Energia refining margin
Trading/Other
Average net entitlement production
Brazil
Average working interest production
Brazil
12 months 2015 results
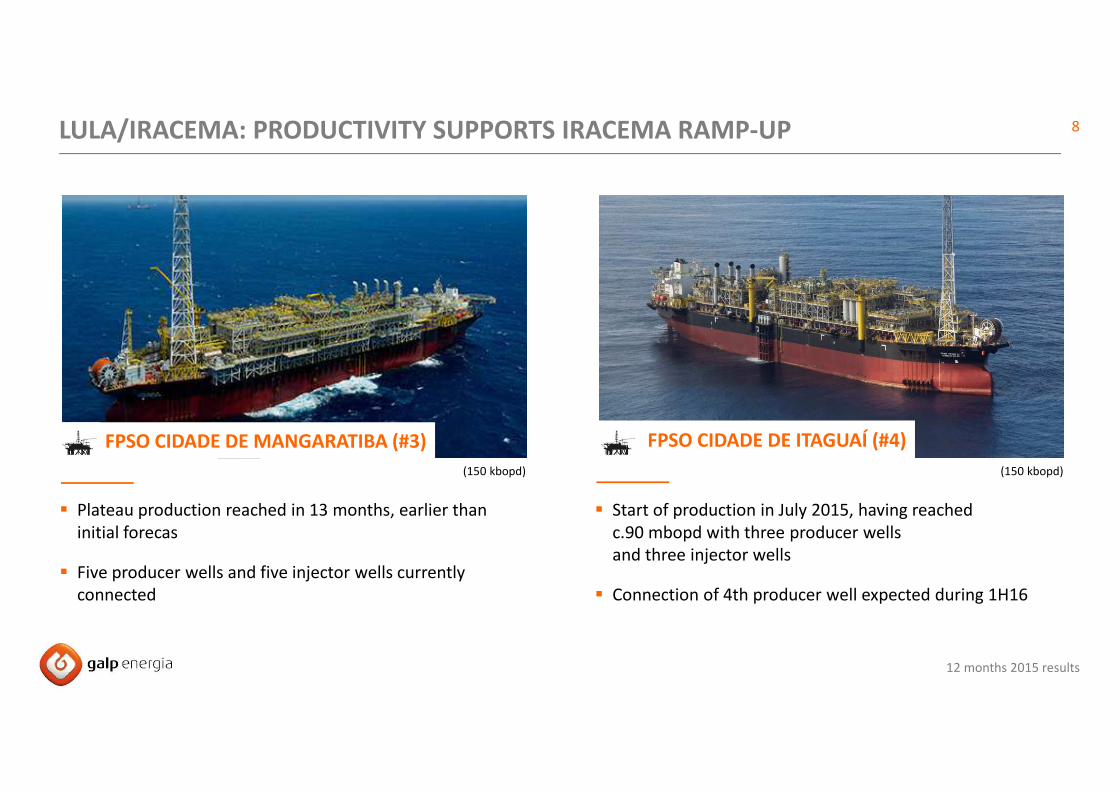
8LULA/IRACEMA: PRODUCTIVITY SUPPORTS IRACEMA RAMP-UP
FPSO CIDADE DE MANGARATIBA (#3) FPSO CIDADE DE ITAGUAÍ (#4)
(150 kbopd) (150 kbopd)
� Plateau production reached in 13 months, earlier than
initial forecas
� Five producer wells and five injector wells currently
connected
� Start of production in July 2015, having reached
c.90 mbopd with three producer wells
and three injector wells
� Connection of 4th producer well expected during 1H16

12 months 2015 results
9
FPSO CIDADE DE MARICÁ (#5)
� 10 wells already drilled in the Lula Alto area
� Connection of the first producer well underway
LULA/IRACEMA: IMMINENT ENTRY OF FPSO #5 INTO PRODUCTION
(150 kbopd)
� Unit expected to reach plateau production in 2017

12 months 2015 results
10
FPSO CIDADE DE SAQUAREMA (#6)
� Final integration works of FPSO underway at the Brasa
shipyard, in Brazil
LULA/IRACEMA: EXECUTION OF FPSO #6 ACCORDING TO PLAN
(150 kbopd)
� Start of production in the Lula Central area is expected to
take place in the middle of the year

12 months 2015 results
11DE-RISKING ACTIVITIES IN OTHER PROJECTS IN BRAZIL
CARCARÁ BM-S-8 BM-S-24 POTIGUAR
� Carcará North and NW confirmed
discovery of light oil and extension
of discovery
� DST in Carcará North confirmed
excellent productivity and high
quality of the reservoir
� DoC1 of Sépia East submitted
in November 2015
� Sépia Leste subject to unitisation
with Sépia
� Pitú North well confirms extension
of discovery of Pitú
� 3D seismic acquisition expected in 2016
Declaration of Commerciality
12 months 2015 results
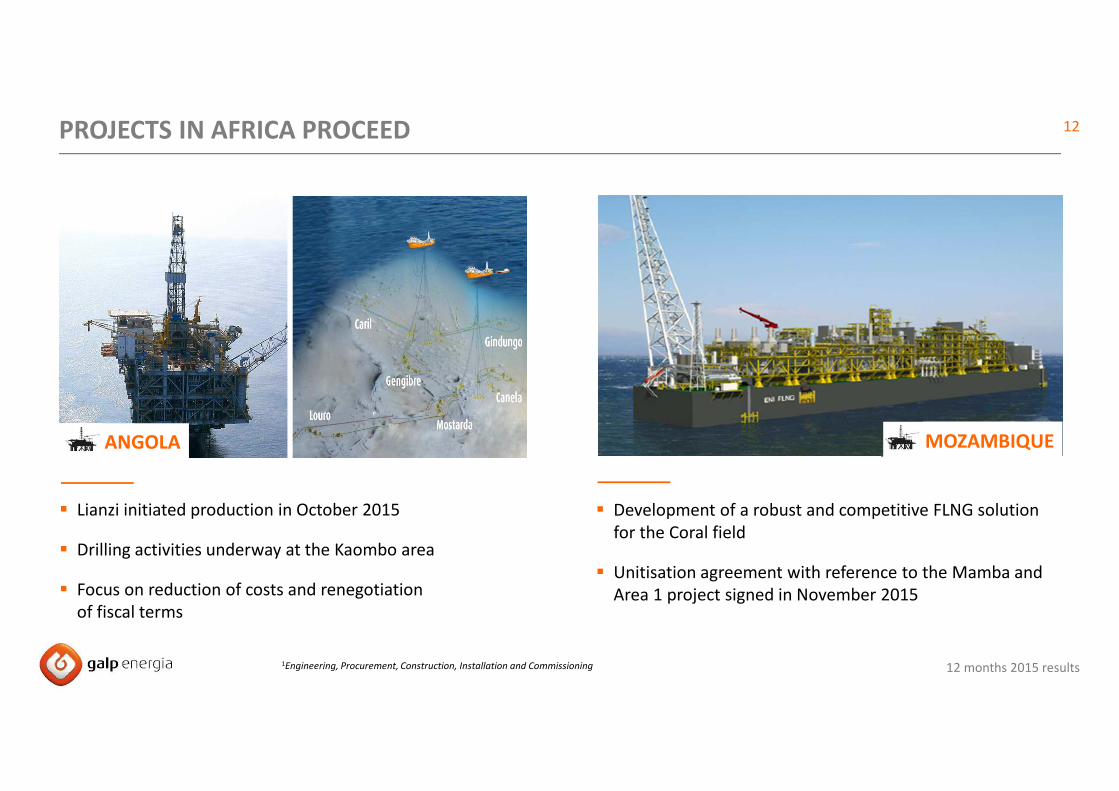
12
� Lianzi initiated production in October 2015
� Drilling activities underway at the Kaombo area
� Focus on reduction of costs and renegotiation
of fiscal terms
PROJECTS IN AFRICA PROCEED
� Development of a robust and competitive FLNG solution
for the Coral field
� Unitisation agreement with reference to the Mamba and
Area 1 project signed in November 2015
ANGOLA MOZAMBIQUE
1Engineering, Procurement, Construction, Installation and Commissioning

12 months 2015 results
13
� Refining base with high availability and reliability
during 2015
� Business performance benefited from market
dynamics and reduction cost
DOWNSTREAM AND GAS: SOLID PERFORMANCE
G&P
� Sales to direct clients stable, benefiting from higher
demand from the electricity sector
� Robust trading activity, supported by structured GNL 1
contracts and by network operations in Europe
R&M
1Previously established LNG sales contracts

14
12 months 2015 results
MARKET
OPERATIONAL INFORMATION
RESULTS
AGENDA

12 months 2015 results
15
� Operating results benefited from improved European
refining margins and distribution activity and from
the growth of refined products exports
� Increased production of diesel cushioned impact of
the fall in Brent on Ebitda
� Net income of €639 million, a marked improvement
from the previous year, which had been affected
by low refining margins and the programmed
outage of the Sines Refinery
INTEGRATED BUSINESS AND EXPORTS SUPPORT EBITDA OF €1,564 MILLION
Income Statement
(€ Million)
Results RCA
3T15 4T14 4T15 12M14 12M15
Volume de Negócios 3.906 4.470 3.435 17.904 15.517
Ebitda 411 399 309 1.314 1.564
E&P 89 102 53 444 356
R&D 245 191 166 412 800
G&P 72 101 88 438 382
Ebit 263 258 180 774 996
E&P 33 65 12 295 145
R&D 173 105 94 99 516
G&P 54 84 71 363 313
Resultado Líquido 180 137 149 373 639Net Income
Turnover

12 months 2015 results
16
� More than half of Ebitda generated outside of Iberia
� Oil production is the main source of international
growth
INTERNATIONAL ACTIVITY ACCOUNTS FOR MORE THAN HALF OF THE RESULTS
Ebitda generated abroad
12M2015
InternationalIberia
53%
47%

12 months 2015 results
17
� Exports increase 37% in volume
� Exports of oil products
represent 7% of national total
� Diesel, gasoline and fuel were the most exported
products
� USA, Spain, France and the Netherlands: main
destinations of exports
EXPORTS DRIVE RESULTS
Evolution of exports
(€ Million)
* Calculated based on the value of national exports of February 2015
1.253 1.867 2.415 3.238
4.153 3.230 3.198
4%
5%6%
7%
9%
7% 7%
0%
2%
4%
6%
8%
10%
-
500
1.000
1.500
2.000
2.500
3.000
3.500
4.000
4.500
2009 2010 2011 2012 2013 2014 2015
Exportações Galp Energia % exportações Galp Energia no total nacionalGalp Energia exports % Galp Energia exports in national total
12 months 2015 results
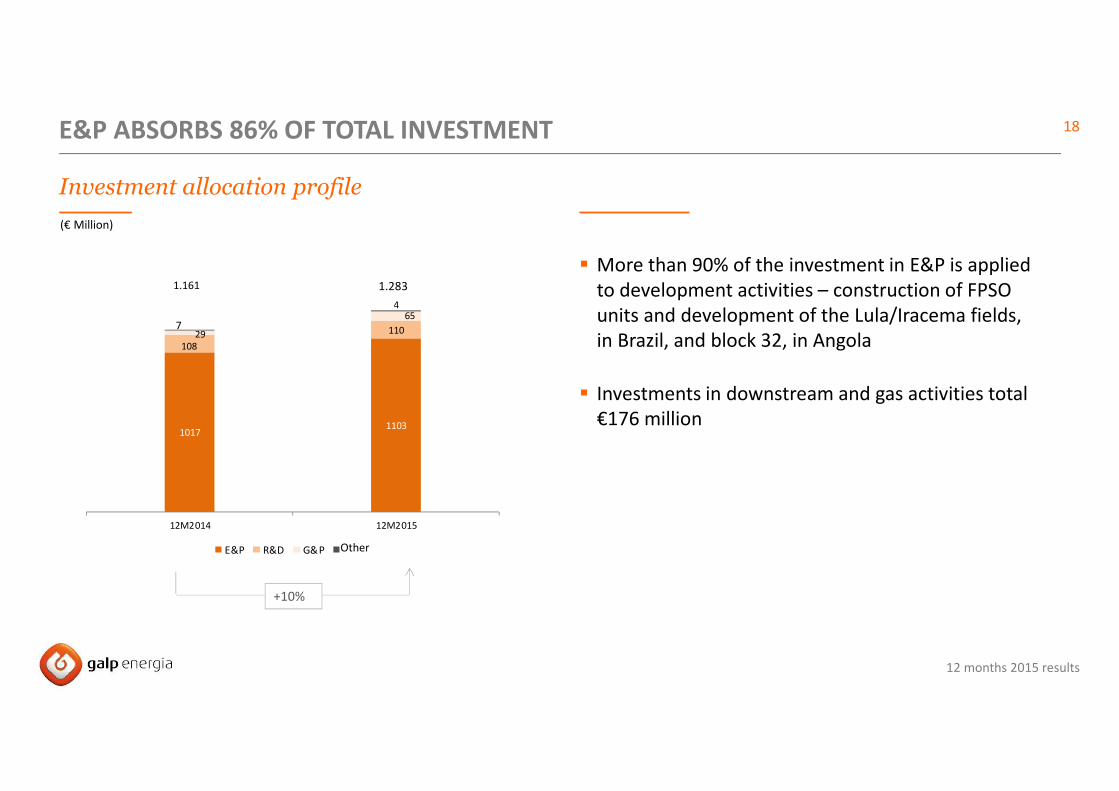
18
10171103
108
11029
654
12M2014 12M2015
E&P R&D G&P Outros
� More than 90% of the investment in E&P is applied
to development activities – construction of FPSO
units and development of the Lula/Iracema fields,
in Brazil, and block 32, in Angola
� Investments in downstream and gas activities total
€176 million
E&P ABSORBS 86% OF TOTAL INVESTMENT
Investment allocation profile
(€ Million)
1.2831.161
+10%
7
Other

12 months 2015 results
19
� Investments underway responsible for more
than 20% of fixed assets
� The net debt to Ebitda ratio came
to approximately 1.2x1
FINANCIAL STRUCTURE SUITED TO GROWTH PROGRAMME
Balance Sheet
(€ Million)
1) Ratio considers net debt including loan to Sinopec
Dez 2014 Set 2015 Dez 2015 vs dez 14 vs set 15
Ativo fixo 7.599 7.638 7.877 278 239
Imobilizado em curso 1.768 2.093 2.077 309 (16)
Outros ativos (passivos) (512) (536) (517) (5) 19
Empréstimo à Sinopec 890 781 723 (167) (58)
Fundo de maneio 968 577 527 (442) (50)
Dívida líquida 2.520 2.387 2.422 (98) 35
Total do capital próprio 6.425 6.072 6.187 (238) 115
Capital empregue 8.945 8.459 8.609 (336) 150
Rácio dívida líquida para Ebitda (1)1,2x 1,1x 1,2x - -
Capital employed
Total equity
Net debt
Working capital
Loan to Sinopec
Other assets (liabilities)
Fixed assets in progress
Fixed assets
Net debt to Ebitda ratio (1)

20
12 months 2015 results
Brand Repositioning
Campaign

21
12 months 2015 results
Objectives
To align brand strategy with the company's strategy
Ensure change in brand perceptions :
• Integrated energy operator from Upstream to Lifestream
• From a national origin, to a global brand
• Close to its consumers and the communities where it is present
Align the company's communication: single concept adapted to the discourse and specificities of each country
Catalyst and element of internal union: pride and identification with the company's culture and values
REVEALING A NEW GALP

22
12 months 2015 results
VISUAL IDENTITY AND POSITIONING
� Respect the past and launch the future
� Add innovation, contemporaneity, enthusiasm and dynamics to the brand
� Further develop a visual discourse on the exploration of new thematic universes
A new brand image

23
12 months 2015 results
VISUAL IDENTITY AND POSITIONING
A new positioning
energy creates energy

24
12 months 2015 results
Media Relations
+351 217 242 680
+351 961 773 444 (24 hours)
http://press.galpenergia.com