restoring growth and financial stability · introduction the greek sovereign crisis that began in...
TRANSCRIPT
Restoring growth and financial stability: how Greek banks contributed
The European Stability Mechanism (ESM) is evaluating the Greek financial assistance programmes to learn lessons that could enhance its ability to address possible future crises. This discussion paper provides input for this exercise by focusing on banking sector reforms within European Financial Stability Facility (EFSF) and ESM programmes. It examines how the banking sector performed, problems in implementing some reforms, and how banks contributed to Greek economic growth, performance, and the financial system’s resilience to counter potential future shocks.
Srichander Ramaswamy, Senior Consultant
June 2020

Disclaimer: This Discussion Paper was drawn up by the author(s) as part of the evaluation of financial assistance
to Greece. To fully protect the independent nature of the evaluation and in line with its Terms of Reference,
this Discussion Paper has not been subject to scrutiny or review by ESM management. The views expressed in
this paper do not necessarily reflect the views of the ESM or its management.
Acknowledgement: The author would like to thank the following persons: Kari Karhonen, Dóra Siklós, and David
Goldsbrough for valuable feedback during various stages of the drafting process; Keith Stafford for the excellent
editorial assistance; and Sharman Esarey and Raquel Calero for additional help with editing and for oversight of the
publication process.
PDF ISBN 978-92-95085-86-2 ISSN 2467-2025 doi:10.2852/538601 DW-AC-20-002-EN-N
More information on the European Union is available on the Internet (http://europa.eu). Luxembourg: Publications
Office of the European Union, 2020
© European Stability Mechanism, 2020
All rights reserved. Any reproduction, publication and reprint in the form of a different publication, whether printed
or produced electronically, in whole or in part, is permitted only with the explicit written authorisation of the
European Stability Mechanism.
R E S T O R I N G G R O W T H A N D F I N A N C I A L S T A B I L I T Y
| 3
Table of contents
Foreword 4
Executive summary 5
Introduction 7
1. Contagion from Greek sovereign crisis 9
2. Banking crises and economic activity 13
Fiscal costs 15
Output losses 15
Unemployment 16
Peak non-performing loans 17
Non-performing loans – the Achilles heel 17
3. Financial sector reform programme 19
Box 1. Summary of banking sector reform initiatives 21
4. State of health of Greek banks 23
Insights from aggregate bank data 25
5. Options for non-performing loan resolution 29
Asset protection scheme 30
Bank of Greece scheme 30
Devil in the details 30
Box 2. NPL resolution: issues at stake 32
6. Impact of reforms on the economy 33
7. Contribution of Greek programmes to financial stability 38
8. Conclusion 42
References 44
Acronyms 46
4 | D I S C U S S I O N P A P E R S E R I E S | J U N E 2 0 2 0
Foreword
JOAQUÍN ALMUNIA
High Level Independent Evaluator
11 June 2020
This special series of ESM Discussion Papers gathers analyses that inform the independent evaluation exercise. The objective of these Discussion Papers is to feed into the inference process, help generate debate on the evaluation themes, and provide a broader background to the evaluation mandate. The choice of themes for these studies was guided by the terms of reference of the evaluation.
The authors are external experts to the evaluation exercise. It is important to note that they have not served as members of the evaluation team, nor participated in the Institutions’ country teams for Greece. As these Discussion Papers’ analyses represent only the views of the authors, the input further strengthens the independence of the exercise. As such, these Discussion Papers represent the third formal element of independence in the evaluation, beyond my role as the High-Level Independent Evaluator, reporting to the Chairperson of the ESM Board of Governors, and of the Evaluation Reference Group.
I am grateful for the detailed work conducted, and would like to thank the authors for their valuable contributions.

R E S T O R I N G G R O W T H A N D F I N A N C I A L S T A B I L I T Y
| 5
Executive summary
The Greek financial crisis preoccupied international and European institutions for years and, despite extraordinary financial assistance and support, left scars that still need to heal. The shock that started in 2010 originated as a sovereign debt crisis and left the banking system some €40 billion undercapitalised, even after a voluntary private sector debt exchange. A deep recession after the debt crisis shrank real gross domestic product (GDP) by 25% between 2010 and 2013, damaging private sector balance sheets and leading to a large accumulation of non-performing loans (NPLs) on bank balance sheets. However, in October 2019 Greece raised €1.5 billion in a 10-year bond at 1.5% yield and a further €0.5 billion in a three-month Treasury bill at negative interest rates, suggesting investor sentiment towards the country has improved.
Greek debt crisis left banking
system undercapitalised and
damaged private sector
balance sheets.
Initial expectations for an early resolution to the Greek crisis proved to be mistaken. This led to the negotiation of an EFSF assistance programme of about €142 billion, with the first disbursement in March 2012. Following this, negotiators expected Greece to return to market funding within three years after implementing numerous labour and product markets reforms. Private sector investment would address required banking capital replenishments once their capital requirements, after debt exchanges, were met by a specific EFSF programme funding tranche earmarked for bank recapitalisation.
Greece was expected to return
to market funding in three years
after implementing reforms.
In early 2015, these expectations proved wrong. Greece clearly needed another large bailout to counter market speculation of a Greek exit from the euro. The ESM programme emphasised restoring banking system health because problems there were being compounded by the large and growing NPL stock that topped €100 billion in 2015’s second quarter, forming an economic recovery bottleneck. To address this, private sector solutions were preferred, establishing NPL reduction targets with timeline targets.
ESM programme focused on
resolving banking health by
reducing NPL stock
accumulation.

6 | D I S C U S S I O N P A P E R S E R I E S | J U N E 2 0 2 0
But private sector solutions to
help offload NPLs and
recapitalise banks failed to
materialise.
This time, to achieve the NPL reduction targets and accelerate collateral recovery, it was expected that the Greek authorities would only have to align corporate insolvency law to international practice, supported by changes to household insolvency law and the creation of a regulated profession of insolvency administrators. The prevailing view of European authorities appears to have been that Greek reforms would unleash market forces that would help to reduce the NPLs, which would enable Greek banks to progressively re-intermediate credit across the economy.
Large NPL stock reduced loan
supply and higher loan rates
dampened economic activity.
Banks were able to reduce their NPL stock to about €71 billion by September 2019, but not at the pace expected when programme targets were set. Private sector solutions to reduce NPLs have not proved particularly successful so far and this continued burden on the banks pushed their cumulative return on equity to –44% between 2014 and 2018. Some of the costs of carrying these NPLs are shifting to the private sector, with business and consumer loan interest rates remaining quite high relative to the euro area. This hurts business profitability, consumer spending, and the pace of economic recovery.
EFSF and ESM programmes
stabilised Greek financial system
and halted Grexit speculation.
The main EFSF and ESM programme successes have been to stabilise the Greek financial system and spread the message to market participants that euro area integrity would not be compromised. Containing risk spillovers towards other euro area member states played an important role, particularly in the EFSF programme’s initial phase. But European Central Bank (ECB) then-President Mario Draghi’s July 2012 commitment “to do whatever it takes” and the beginning of the asset purchase programme in 2015 sent an even stronger signal and helped decouple developments in Greece from other euro area countries. However, ECB interventions might not have had the same risk-mitigating impact had Greece not received the EFSF and ESM financing that terminated market speculation about a Greek exit from the euro area.
Greece’s economic prospects
rest on how quickly NPL stocks
fall and banks recapitalise to
extend new credit.
Prospects for resilient, strong economic growth in Greece will depend largely on how heavy NPL stocks on bank balance sheets are handled and how banks recapitalise afterwards. Better capital positions would allow banks to provide better credit terms and conditions, which would then raise credit demand to boost investment and accelerate the pace of economic recovery.

R E S T O R I N G G R O W T H A N D F I N A N C I A L S T A B I L I T Y
| 7
Introduction
The Greek sovereign crisis that began in late 2009 was rooted in major macroeconomic imbalances that accumulated over a number of years (Galenianos, 2015). In 2009, the country’s budget deficit exceeded 15% of GDP, with pension payments absorbing about 17.5% of GDP. So when Greece lost access to financial markets to raise government debt at reasonable cost, other euro area member states and the IMF needed to intervene with assistance to avoid a financial system collapse. Austerity measures required to address the imbalances raised the unemployment rate above 25%, and the economy contracted by a similar percentage from 2009 to 2014. This economic contraction caused significant damage to bank balance sheets, with NPLs rising to alarming heights.
The EFSF became the main financial assistance provider to Greece following a March 2012 agreement to restructure Greek debt under a private sector involvement (PSI). Assistance took the form of loans at very competitive interest rates, cutting funding costs. Nevertheless, the newly elected Syriza party in January 2015 still wanted to renegotiate the bailout agreement terms. On 27 June 2015 it announced a referendum on whether the government should accept the bailout conditions. The following day the ECB announced a freeze on the level of its emergency funding for Greek banks, which forced the government to restrict cross-border fund transfers. And when the electorate voted to reject the austerity measures, markets questioned whether Greece could remain in the euro area.
Severe restrictions on financial transactions introduced by the capital controls forced the Syriza party to change course and the Greek Parliament passed the agreed austerity measures despite the referendum outcome. This paved the way for additional ESM loans up to €86 billion from August 2015. Loan disbursement conditionalities required the Greek government to commit to reforms in areas such as restoring fiscal sustainability; safeguarding financial stability; boosting growth, competitiveness and investments; and reforming public administration.
This discussion paper seeks to assess how banking reforms related to the EFSF and ESM programmes contributed to Greek economic growth, performance and outlook, including enhanced resilience to future shocks. The assessment is intended to help the ESM evaluation team draw lessons from the Greek programme contributions to euro area financial stability, and implications concerning resilience to economic and financial shocks. To this end, this paper draws information from existing literature on how banking crises spread contagion risk and depress economic outcomes long term if not addressed effectively. This would help explain the context in which the EFSF and ESM designed programmes to limit banking sector risks from adversely affecting other euro area markets.
The rest of the paper is organised as follows:
Section 1 begins with a brief discussion on how the Greek sovereign crisis amplified risks to the financial system and why coordinated intervention by other euro area member states was needed to safeguard financial stability.
Section 2 reviews economic literature findings that assess the impact of banking crises on growth and employment, then highlights the advantages and disadvantages of various tools that could reduce NPL stocks.
8 | D I S C U S S I O N P A P E R S E R I E S | J U N E 2 0 2 0
Section 3 looks at the circumstances that led to the mid-2015 rise in risks to the Greek banking system and reform measures agreed to enhance financial system resilience, especially reforms within the banking sector.
Section 4 examines numerous bank balance sheet variables to assess the resilience and state of health of the Greek banking system following reform initiatives.
Section 5 reviews policy options under debate for NPL resolution, to highlight their strengths and weaknesses.
Section 6 analyses EFSF and ESM programmes, looking at the impact financial sector reforms had on growth, performance, and outlook.
Section 7 takes a closer look at variables that capture financial conditions and financial stability risks, including those in the euro area, to examine any impact the programme had on mitigating contagion risks and promoting a more resilient financial system.
Section 8 draws some conclusions on any remaining banking sector challenges that could constrain banks’ capacity to increase loans and boost growth. These are based on assessments in other report sections.

R E S T O R I N G G R O W T H A N D F I N A N C I A L S T A B I L I T Y
| 9
1. Contagion from Greek sovereign crisis

1 0 | D I S C U S S I O N P A P E R S E R I E S | J U N E 2 0 2 0
Banks hold large amounts of sovereign debt for liquidity management, hedging interest rate risk, market-making, and for other purposes which establish them as an important captive source for sovereign government financing. This reliance exposes the sovereign to funding risks when an adverse shock hits the banking system (Acharya et al, 2011). However, shocks to bank capital positions tend not to exacerbate a sovereign risk profile unduly when a government enjoys flexibility to determine fiscal rules and depends less on foreign investors. Japan’s 1990s banking crisis experience is a good case study for this. Yet, less flexible fiscal rules, combined with inadequate backstop mechanisms to address temporary government funding stress – with a lack of exchange rate flexibility – might well adversely affect sovereign credit risk when a country faces a banking crisis. Ireland and Spain demonstrated how this adverse feedback mechanism amplified sovereign credit risk when banking crises emerged after real estate bubbles burst.
Risk propagation in the Greek sovereign crisis operated the other way round after the government announced in 2010 that budget deficits were higher than initially reported. Greek government bondholders, including several euro area banks, became vulnerable to market panic because Greece had no fiscal space left and markets were quite uncertain how the problem could be resolved within EU rules. An additional risk driver was large on-balance sheet exposures to other Greek assets held by euro area banks. Exposures to the private and public sectors had doubled to USD 170 billion in the fourth quarter (Q4) of 2009 from USD 85 billion in Q4 2005 (Figure 1, left panel), and additional non-banking sector exposures would have shifted exposures far higher.
Interest rate spreads between Greek and German government debt stayed narrow before the sovereign crisis erupted. This cheaper funding allowed Greece to issue more debt to finance a rising budget deficit without having to worry about higher debt service costs (Figure 1, right panel). Accordingly, general Greek government debt outstanding doubled to USD 400 billion in Q1 2010 from USD 200 billion in Q1 2005.
Figure 1 Bank exposures to Greece and 10-year interest rate spread
Bank exposures and Greek debt, in USD billion General government deficit and interest spread
050
100150200250300350400450
Bank exposures Greek debt
0102030405060708090
-18-16-14-12-10
-8-6-4-20
Deficit, in % of GDP, left axis Spread, right axis
Notes: Consolidated exposures of banks in the euro area excluding Greece towards public and private Greek debt on an ultimate risk basis; Greek debt refers to debt securities outstanding in general government sector. Spread is the 10-year maturity yield spread between Greek and German government bonds in basis points.
Sources: Bank for International Settlements (BIS), Bank of Greece, OECD
Numerous factors supported the adverse market dynamics that allowed Greece to increase its debt level significantly while risk spreads for holding Greek sovereign debt changed little before the US subprime crisis. One was the inclusion of Greek debt in widely held euro denominated government bond benchmarks that many institutional investors and central bank reserve managers passively replicated. This triggered more Greek government debt purchases when issuance volumes rose. A second factor was the discretion Basel II gave banking supervisors to treat government debt issued in domestic currency as a risk-free asset requiring no capital charges. Banks were happy to use this rule and substitute Greek debt for German or French

R E S T O R I N G G R O W T H A N D F I N A N C I A L S T A B I L I T Y
| 1 1
government debt to improve their net interest income. A third factor was the way relatively stable yield spreads between Greek and German government bonds prompted attractive carry trades for active asset managers and hedge funds.
Given the reliance on external funding, a negative shock was poised to render Greek debt unsustainable, and it arrived in October 2009 when the newly elected government revealed the previous administration had misreported budget deficits. As Greek bond yields rose above 8% in May 2010, it was clear the Greek government would not be able to roll over its outstanding debt and default was imminent. Since euro area banks and institutional investors held large claims on Greece, that threatened financial meltdown across those euro area banks coping with already stressed balance sheets from the US subprime crisis.
In contrast, the US subprime crisis amplified risks to euro area banks through a very different risk propagation channel. The adverse feedback loop at that time worked through the triggering of funding liquidity risk because many euro area banks establishing exposures to US dollar-denominated subprime assets had relied on markets for US dollar short-term funding and on foreign exchange swap transactions to hedge euro denominated liabilities. To keep the funding liquidity risk from evolving into a solvency risk, the Federal Reserve extended US dollar swap lines to numerous central banks, including the ECB (BIS, 2008), which then extended US dollar funding to euro area banks to meet their liquidity requirements.
The Greek sovereign crisis threatened to unleash a very different risk amplification mechanism across the euro area, a vicious sovereign–bank adverse feedback loop. This was because a default on Greek government debt payments could increase insolvency risks at euro area banks holding large exposures to Greece, with detrimental consequences for the economy if not addressed. Forestalling this risk became the high-priority policy agenda that gave birth to the rescue funds.
But initial support came through a bilateral €52.9 billion loan from the other euro area member states under the Greek Loan Facility arrangement, to reassure markets and mitigate contagion risk. Following the first rescue programme, numerous factors complicated the adjustment needed for Greece to return to market funding. They included: rigidities in product and labour markets; a fixed exchange rate regime as a euro area member state; and weakness in revenue administration. The economic downturn, therefore, turned out to be considerably more severe than projected, with real GDP in 2012 17% lower than in 2009 as unemployment rose to 25% (IMF, 2013a). With domestic demand sharply collapsing, export growth did little to cushion the impact, and public debt overshot IMF programme projections by a large margin, reaching 172% of GDP at the end of 2011.
Markets realised a government debt restructuring was inevitable, with low potential recovery values. In response, bond prices fell to 30% of face value in February 2012. Under a PSI in March 2012, involving many EU banks, about €197 billion of Greek government bonds took a 53.5% cut in face value, corresponding to €107 billion reduction in the Greek debt stock (ESM, 2018). Before the debt restructuring, typical Greek banks’ Tier 1 capital ratios under Basel II stood between 10% and 12%. In 2009, NPLs across the banking system accounted for 7.7% of total loans, but rose to 10.4% in December 2010. During the global financial crisis, these ratios encouraged a perception of reasonably healthy banking sector, but the PSI changed this because it imposed large losses on Greek banks.
In 2012, the Greek banking system held a total €48.8 billion face value of Greek debt and state-related loans. The impairment after the debt exchange – based on the nominal 53.5% of face value haircut and the marked-to-market loss – amounted to €37.7 billion. This was a net present value loss of 77% of face value of debt held, so most banks then failed regulatory minimum capital requirements (Table 1). The Bank of Greece estimated the recapitalisation needs of

1 2 | D I S C U S S I O N P A P E R S E R I E S | J U N E 2 0 2 0
domestic banks in May 2012 at €40.5 billion (Bank of Greece, 2012). To reassure markets, the authorities decided to provide a second financial assistance programme in March 2012, with the EFSF extending total loans of €141.8 billion until July 2015. Of this, €48.8 billion was set aside to recapitalise and restructure banks to ensure the PSI did not cause a banking crisis that would cause heavy negative spillover into the economy.
Table 1 Balance sheet data of Greek banks as of May 2012
(in € million)
Category Core Tier 1
capital
Government
debt held
Gross PSI loss Capital needs
Core banks 17,944 35,471 28,213 27,501
National Bank of Greece 7,287 14,749 11,733 9,756
Eurobank Ergasias 3,515 7,336 5,781 5,839
Alpha Bank 4,526 6,043 4,786 4,571
Piraeus Bank 2,615 7,343 5,911 7,335
Other banks 4,175 13,138 9,520 13,041
Total 22,119 48,609 37,733 40,542
Notes: Core Tier 1 capital held as of December 2011. Government debt held is the total face value of Greek government bonds and state-related loans. Total assets of the banking system as of December 2011 amounted to €476.9 billion.
Source: Bank of Greece
The next section discusses findings in economic literature that link the impact of banking crises to growth and unemployment, requiring both a swift policy response and a crisis resolution mechanism to safeguard financial stability.

R E S T O R I N G G R O W T H A N D F I N A N C I A L S T A B I L I T Y
| 1 3
2. Banking crises and economic activity
1 4 | D I S C U S S I O N P A P E R S E R I E S | J U N E 2 0 2 0
Evidence in the previous section suggests Greek banks failed to meet minimum capital requirements after the PSI, pointing to a systemic banking crisis following the sovereign default and debt restructuring. Systemic banking crises are highly disruptive events that lead to sustained declines in economic activity, financial intermediation, and ultimately welfare (Laeven and Valencia, 2018). Output loss after a banking crisis tends to be large and persistent, and more severe for high-income countries (Cerra and Saxena, 2008), but flexible exchange rates and supportive fiscal and monetary policies do help soften the adverse output impact (Furceri and Zdzienicka, 2010). However, the structure of the economy and private sector balance sheet exposures can lead to different outcomes. For example, during an early-1990s banking crisis in Finland, unhedged private sector foreign exchange exposures led to large losses when the fixed exchange rate regime was dismantled in late 1992. Around the same time, Sweden experienced the opposite outcome, when its export sector became more competitive thanks to its currency devaluation.
In general, most banking crises in developed economies tend to follow a bursting real estate bubble. When there is room for fiscal spending, sovereign-backed recapitalisation of banks helps to dampen the severity of the crisis impact on output. In contrast, the Greek banking crisis stemmed from a sovereign debt crisis within a currency union, triggering very different dynamics that affected output and employment. Given the diversity of past crises and the large divergence of its effects on output, Cecchetti et al (2009) suggest exercising great caution when trying to assess how a particular banking crisis might affect macroeconomic variables. The authors report that banking crises are diverse and tend to display unique characteristics as they evolve, so there is no such thing as a typical crisis. Strong evidence shows rules and supervision practices that govern a banking system are important determinants when examining the causes of, and propensity for, banking crises (Calomoris, 2009). Evidence in the economic literature covering systemic banking crises suggests the initial policy response is to employ broad-based liquidity support to the banking sector. Governments also resort to limited or full guarantees on various bank liabilities to buy policymakers time to develop more comprehensive resolution and restructuring plans. But they tend to leave such guarantees in effect for several years; for example, Mexico introduced blanket guarantees in 1993 that were removed only in 2003, while guarantees for bank liabilities established after the subprime crisis by some euro area member states still remain in force.1
When liquidity support for banks persists, bank capital positions decline alongside forced asset sales and rising NPLs as the economy weakens in the crisis aftermath. This often leads to public recapitalisation of banks, employing preferred and common equity or even nationalisation to mitigate any contagion. In such cases, agreed rules restrict loan disbursements, dividend payments, and management compensation until the state sells the holdings to private investors. Some studies show that recapitalising banks with public funds during a severe or systemic banking crisis can increase welfare (Philippon and Schnabl, 2009). But public displeasure with bank bailouts during the global financial crisis prompted legislation to establish common bank resolution frameworks in many countries that do not involve taxpayers’ funds. The EU implemented this framework under the Bank Recovery and Resolution Directive (BRRD) that entered into force in 2016.
To document academic evidence on how banking crises affect outcomes for government budget, output, unemployment, and bank’s NPLs, we will use the evidence presented in Laeven and Valencia (2018), which is based on a database of systemic banking crises worldwide between 1970 and 2017.
1 In September 2019, the European Commission approved the extension of the Belgian and French state guarantees for the senior debt of bailed-out bank Dexia beyond 2021.

R E S T O R I N G G R O W T H A N D F I N A N C I A L S T A B I L I T Y
| 1 5
Fiscal costs
Fiscal costs arise from government interventions in financial institutions to absorb the costs of operating asset disposal companies and banking sector rescues. The estimate of the median gross fiscal cost is 6.7% of GDP in high-income countries and 10% of GDP for low- and middle-income countries. But the dispersion of these costs is significant across countries shown in Figure 2. In Greece, the estimated net fiscal cost of the crisis from 2008 to 2014 was 22% of GDP (ECB, 2015).2 Across a sample covering all countries, the fiscal cost of systemic banking crises in one out of four cases exceeds 16% of GDP, and when measured against total financial assets for banks and non-banks at the start of the crisis it exceeds 34% in one out of four cases. The median increase in public debt three years after the start of the crisis reaches 21% of GDP for high-income countries.
Figure 2 Gross fiscal costs of banking crises around the world*
(in %)
0
4
8
12
16
20
24
28
0 8 16 24 32 40 48
Ba
nk
ing
cri
ses
ep
iso
de
s
Fiscal cost as share of GDP
0
5
10
15
20
25
30
35
0 16 32 48 64 80 96
Ba
nk
ing
cri
ses
ep
iso
de
s
Fiscal cost as share of financial assets
Note: *Fiscal costs refer to outlays directly associated with the restructuring of the financial sector.
Source: Laeven and Valencia (2018)
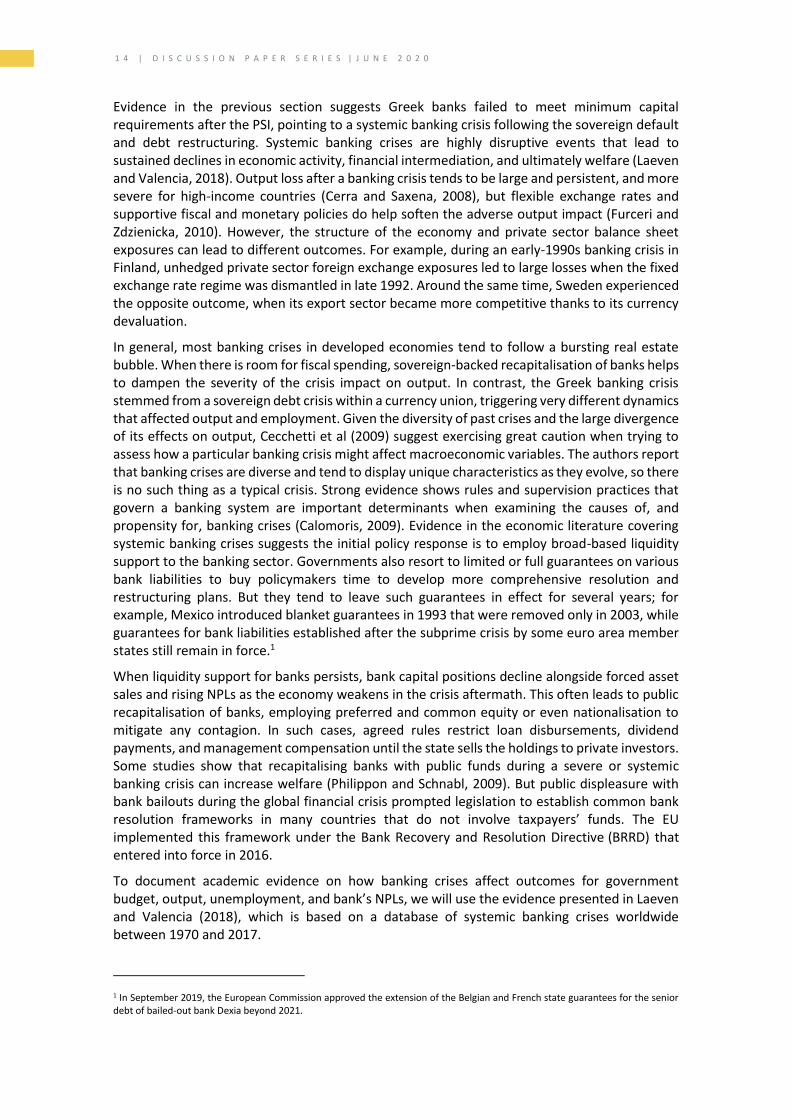
Output losses
The systemic banking crises database confirms evidence in other empirical studies that report large and persistent declines in real output. The left panel of Figure 3 shows the cumulative output losses over three years after the start of a systemic banking crisis for the entire sample.3 For one in four cases, the cumulative output losses over a three-year period after a systemic banking crisis exceeded 45% of GDP. Because output losses are also likely to stem partly from other shocks in the same period, such as a currency and/or a sovereign debt crisis, one must interpret these losses as capturing what happened to output after the onset of a systemic banking crisis.
In Greece, the actual cumulative output loss from 2010 to 2013 was 25% of GDP, and if computed versus trend GDP, it would have been significantly higher. Compared to historical output loss evidence, this GDP contraction in Greece was not an outlier. Still, an ex post IMF internal evaluation of the first programme financing arrangement concludes that the severity of
2 The gross fiscal cost was 40% over this period. The substantial difference between gross and net fiscal costs is because loans extended by Hellenic Financial Stability Fund (HFSF) were used to bridge the time until recapitalisations in the form of equity acquisitions could take place. The net fiscal costs are adjusted for the loans cancelled after recapitalisations.
3 Output losses are computed as the cumulative sum of the differences between actual and trend GDP over a three-year period and expressed as a percentage of trend real GDP. No output losses are reported in the database for banking crises in transition economies that took place during the period of transition to market economies.
1 6 | D I S C U S S I O N P A P E R S E R I E S | J U N E 2 0 2 0
the output contraction could have been avoided, noting that, “not tackling the public debt problem decisively at the outset or early in the programme created uncertainty about the euro area’s capacity to resolve the crisis and likely aggravated the contraction in output. An upfront debt restructuring would have been better for Greece although this was not acceptable to the euro partners” (IMF, 2013b).
The database also provides evidence to show export volumes shrink in high-income countries after banking crises, but this slowdown appeared mainly in the period immediately following the US subprime crisis, when trade finance volumes fell sharply. This was because many large European banks active in the trade-finance business felt overburdened by the crisis fallout, forcing them to cut back (BIS, 2014). Any exchange rate adjustment becomes an important channel through which export competiveness returns after a systemic banking crisis, as demonstrated in Sweden after its 1991 banking crisis, when buoyant export growth in 1993 began to support an output recovery that reflected strong global growth and a domestic currency depreciation against trading partners. This also was one of the adjustment mechanisms for many South East Asian economies, boosting export volumes after the Asian financial crisis.
Figure 3 Output losses and peak NPLs of banking crises around the world
(in %)
Cumulative output loss Peak NPLs
0
5
10
15
20
25
30
35
0 20 40 60 80 100 120 140
Ba
nki
ng c
rise
s e
piso
des
Cumulative output loss as share of GDP
0
3
6
9
12
15
18
21
0 10 20 30 40 50 60 70 80
Ba
nk
ing
cri
ses
ep
iso
de
s
Peak NPLs in total bank assets
Source: Laeven and Valencia (2018)
Unemployment
The database reported in Laeven and Valencia (2018) does not include information on unemployment, so evidence from other studies is used here to assess how banking crises affect unemployment. Using a sample of 97 countries spanning 1980–2008, Bernal-Verdugo et al (2013) estimate that banking crises have, on average, a large negative impact on employment whose actual severity depends largely on the flexibility of labour market institutions. In countries with more flexible labour markets, the banking crises impact tends to be sharper but short-lived, whereas in countries with more rigid labour markets the effect is initially more subdued but highly persistent and the impact is greater on youth unemployment in the short term. Comprehensive labour market reforms have a positive impact on unemployment, although only in the medium term.
Rheinhart and Rogoff (2009) observe a narrower sample of countries that faced systemic banking crises in Asia, Europe, and South America.4 For this sample, unemployment rises for almost five years, with an average unemployment rate increase of about seven percentage
4 The sample includes the following countries: Spain (1977), Norway (1987), Finland (1991), Sweden (1991), Japan (1992), Colombia (1998), and Argentina (2001); and the 1997–1998 Asian financial crisis in Hong Kong, Indonesia, Korea, Malaysia, the Philippines, and Thailand.

R E S T O R I N G G R O W T H A N D F I N A N C I A L S T A B I L I T Y
| 1 7
points. Peak unemployment rose to 13% in Finland and to 12% in Sweden after they faced a banking crisis. In comparison, the Greek unemployment rate rose by nearly 19 percentage points over the five years from 2009 to 2013, with peak unemployment exceeding 27%. The authors report that Asian emerging market countries seem to handle unemployment better than advanced economies. They attribute this to the possibility that greater downward wage flexibility in emerging markets might help cushion employment during severe economic distress, while social safety net gaps in emerging market economies compared to industrial ones could foster anxiety among workers about becoming unemployed.
Peak non-performing loans
As with fiscal costs and output losses, peak NPLs also exhibit a strong dispersion across countries and banking crises (Figure 3, right panel). In about 70% of crises in high-income countries, peak NPLs never rise above 20% of total loans outstanding and the 11% median-value of peak NPLs for high-income countries is much lower than the 30% for low- and middle-income countries. In one out of every four banking crises worldwide, peak NPLs exceed 37% of total bank loans outstanding. In Greece, NPLs reached a 49% peak of total loans outstanding, which has now dropped to 45%.
An important bottleneck hampering higher output and employment after a banking crisis is the large increase in banking system NPLs that forces banks to restrict loans as they start to repair balance sheets and conserve capital. Countries that rely more on bank credit to support investment and consumer spending experience a stronger negative impact on output and employment when a large increase in NPLs appears in the banking system. Therefore, policy initiatives to reduce the NPL backlog on bank balance sheets take centre stage once liquidity support and other measures have helped restore financial stability (Kaskarelis and Siklós, 2019).
Non-performing loans – the Achilles heel
Evidence presented so far suggests that as output and employment fall after a banking crisis, banks get overburdened with a rising stock of NPLs. Because banks are an important conduit to transmit monetary policy, strong bank balance sheets are essential for this channel to function smoothly. Excessive NPL stocks inhibit the capacity of banks to increase the loan supply even if monetary policy is very accommodative. Numerous reasons explain this, including:
• A large NPL stock demands substantial bank capital to support loans in non-productive firms and resources, imposing a supply-side bank credit constraint. • Collateral assets backing NPLs, usually real estate assets for small business loans and for mortgage loans, reduce the available collateral for new loans, in turn imposing a demand-side constraint on accessing bank credit. • A pre-occupation within the banks with defaulted borrowers and complex judiciary processes to recover collateral and write down NPLs tends to divert scarce bank resources away from identifying viable businesses suitable for credit allocations.
Many countries faced with a banking crisis recognised these problems and took action to allocate public funds to boost growth and employment by fostering a swift resolution to the NPL overhang. The success of these initiatives depends on legal constructs and the way NPLs are addressed (Baudino and Yun, 2017).
In the case of homogeneous NPLs or those backed by easier-to-value collateral – such as real estate – resolutions such as direct sales, sales to asset management companies (AMCs) or

1 8 | D I S C U S S I O N P A P E R S E R I E S | J U N E 2 0 2 0
securitisation are suitable. The challenge with direct sales is to find an investor base willing to acquire loans with the long maturities typical in real estate lending because, in a crisis, market participants tend to shy away from longer-dated exposures. This can tend to push real estate backed assets sales towards public AMCs, yet these asset managers face an operational hurdle in setting the right transfer price – and in deciding whether those asset transfers should be voluntary or mandatory. Once the transfer has happened, economies of scale can flow from the pooling and securitisation of such loans, with guarantees improving ratings and the appeal of some tranches, raising their appeal to more investors; guarantees by state or publicly owned institutions have proved to be a common feature to help promote such products.
When a large stock of NPLs comprise harder-to-value non-standardised assets, authorities need to create more tailored solutions, where specific resolution policies such as corporate restructuring or direct sales are more effective. If small- and medium-sized enterprise loans predominate, options tend to be even more restricted because economies of scale for such assets are limited. The heterogeneity of these loans and the private nature of the lending relationships means dealing with such loans in bulk is generally not feasible or, if feasible, more costly for AMCs. More suitable approaches for such NPLs are debt securitisation and write-offs, as well as debt restructurings when the legal framework supports this.
For specialised assets such as individual loans to large corporates, targeted resolution options could be more appropriate than the AMC route. The unique features of such loans make it difficult to pool the assets and typical loans to large corporates are sizeable, with the likely economic impact of any restructuring possibly quite substantial. Therefore, tailored solutions such as individual direct sales, workouts for single-name corporate debt, or debt-to-equity swaps might well be the preferred disposal method (Jassaud and Kang, 2015).
The feasibility of various NPL resolution options also depends on the legal and judicial framework. Loans and their collateral tend to lose value during protracted debt workouts and related judicial proceedings, increasing net losses. However, several countries reformed their legal frameworks after the global financial crisis to simplify the insolvency process, introduce complementary instruments such as pre-insolvency procedures, or establish guidelines for out-of-court debt workouts.
The next section briefly examines the circumstances leading to the third financial assistance programme and then summarises the key reform initiatives that set out conditions for restoring financial stability, repairing bank balance sheets and fostering the supply of credit to support economic activity.

R E S T O R I N G G R O W T H A N D F I N A N C I A L S T A B I L I T Y
| 1 9
3. Financial sector reform programme

2 0 | D I S C U S S I O N P A P E R S E R I E S | J U N E 2 0 2 0
Banking sector problems during the Greek crisis evolved in two stages. The first, starting in March 2012, was a solvency crisis that followed the Greek debt restructuring under the PSI. Access to EFSF loans in the second financial assistance programme, including a tranche allocated for bank recapitalisation, helped stabilise the financial system. (This is highlighted in Section 1.)
But the protracted recession that started in 2009 exacerbated NPLs at the banks, which constrained credit supply and undermined bank profitability. Increased policy and political uncertainty after the Greek elections in December 2014 worsened both the economic environment and sovereign creditworthiness. In February 2015, the ECB announced it would not accept Greek bonds as collateral in monetary policy operations, saying it was not possible to assume a successful completion of the programme review. This in turn affected confidence in the financial system, leading to the second stage of the banking crisis that manifested itself as a liquidity crisis. Given the political uncertainty, Greek banks experienced deposit withdrawals during the first half of 2015, amounting to about one quarter of total bank deposits. This posed risks to the financial system, leading to bank holidays and the introduction of capital controls in late June 2015.
Against this background, Greece received the third financial assistance programme, with the ESM providing most of the funding. Key conditionalities within both the second and third programmes were a need to implement reforms to build a more resilient and healthy banking system to support economic recovery. (Summarised in Box 1.) This section discusses in greater detail the third programme’s financial sector conditionalities that formed part of the Memorandum of Understanding (MoU) between the European Commission acting on behalf of the ESM, the Hellenic Republic, and the Bank of Greece (European Commission, 2015).
With the financial sector at the centre of the turmoil, a clearer focus on restoring the health of banks emerged in the third programme – to safeguard financial stability, foster the supply of credit, and spur economic activity. This stood in stark contrast to the second programme, whose design implicitly assumed Greek banks could raise private capital to bolster their capital adequacy ratios, despite having faced a systemic banking crisis following the PSI. Targets were set for minimum capital adequacy ratios banks needed to meet; banks failing to raise the required capital in private markets within a specified deadline were to be resolved.
The programme presumed systemic bank problems could be resolved in an orderly way without adversely affecting financial stability, reflecting early-draft Financial Stability Board language that described the key attributes of effective resolution regimes for financial institutions. However, preconditions needed to implement such a regime did not exist in Greece. The EU BRRD explicitly recognises that it may be difficult to implement resolution options when a member state faces a systemic banking crisis, which was the case in Greece. In such circumstances, state intervention is regarded as unavoidable, although this requires an initial bail-in of a certain level of bank liabilities, but such liabilities did not exist for Greek banks after the PSI – except for retail deposits.
The second programme was silent on how to deal with NPLs should a bank be restructured or resolved, or indeed on whether reducing NPLs was a desirable strategy to repair bank balance sheets. To meet capital adequacy requirements, banks could always in practice reduce their loan supply to conserve capital but keep their NPLs, but this would be detrimental for the economy. That second programme NPL silence meant guidance was absent on how to implement legal reform to accelerate the recovery of collateral should banks want to reduce their NPL stock. These shortcomings were addressed in the third programme’s MoU under actions to be taken to safeguard financial stability. The main focus was on: (a) normalising liquidity and payment conditions and strengthening bank capital; (b) enhancing governance; and (c) addressing NPLs.
Under the list of actions to be taken to restore banking system liquidity, the medium-term emphasis rested on achieving a sustainable bank-funding model. To strengthen bank capital, an

R E S T O R I N G G R O W T H A N D F I N A N C I A L S T A B I L I T Y
| 2 1
earmarked buffer of up to €25 billion would address the potential bank recapitalisation needs of viable banks and the resolution costs of non-viable banks. To meet the Basel III recommendations, the law covering government guarantees on deferred tax assets was amended to reduce programme funding and avoid activating links between the banks and the state. And bank recapitalisation schemes were to be developed to preserve the private management of recapitalised banks and to facilitate private investments.
On governance issues, programme conditionality required the Hellenic Financial Stability Fund (HFSF) to change its processes for selecting and appointing executive board members, including the powers, criteria, and procedures used to review and, if necessary, change the boards and committees of banks under its control. The HFSF was also entrusted with the task of transposing the EU BRRD into national law and ensuring bank governance aligned to international best practice. For its part, the government had to ensure it did not interfere in bank decision-making and commercial operations.
The programme accorded substantial emphasis to addressing the rising stock of banking system NPLs, recognising this remained a critical bottleneck hindering progress towards objectives in the banking sector and other areas. The plans included these deliverables for the Greek authorities:
(a) Amend corporate insolvency law to correspond with international best practice; (b) Develop more efficient liquidation processes for non-viable debtors and reduce the discharge period for entrepreneurs to three years; (c) Amend household insolvency law by introducing a time-limited stay on enforcement similar to other countries; and (d) Adopt legislation to establish a regulated insolvency-administration profession.
Also, the programme tasked the HFSF to present and implement an NPL resolution plan that would enhance coordination among banks and accelerate large corporate restructurings. And the Bank of Greece had to report on the segmentation of NPLs on bank balance sheets and assess banks’ capacity to deal with each segment.
The next section examines aggregate and individual bank balance sheet variables to gauge the state of banking system health to assess their capacity to intermediate credit to support economic recovery. It also looks at how successful banks have been in reducing the NPL stock, which was a key third programme deliverable.
Box 1. Summary of banking sector reform initiatives
The main elements of the EFSF/ESM programmes’ banking sector reforms:
Second programme (2012–2015)
The banking sector reform initiatives aimed to establish a viable, well-capitalised private banking sector to support economic recovery and sustainable growth. The programme was intended to implement reform in these areas:
Recapitalising banks: To attract private sector capital, banks submitting capital-raising plans secured preferential access to HFSF capital through common shares and contingent convertible bonds, with voting rights on the shares contingent on specified strategic decisions. Banks that did not submit viable capital-raising plans to meet the regulatory capital requirement targets were to be resolved in an orderly way.
Bank resolution framework: Separate responsibilities were established for the banking supervision, resolution, and restructuring functions. The programme assigned supervision and
2 2 | D I S C U S S I O N P A P E R S E R I E S | J U N E 2 0 2 0
resolution responsibilities to the Bank of Greece, managed in separated departments, while the HFSF handled restructuring responsibilities. Additionally, legislative changes were necessary to remove impediments to bank resolution.
Liquidity arrangements: To reduce banking sector reliance on exceptional liquidity support arrangements, banks had to submit medium-term funding plans after completing the recapitalisation and restructuring exercise.
NPL management: The programme established changes to the legal framework for resolving NPLs to maximise asset recovery value, guided by principles that included preserving the payment culture, avoiding strategic defaults, and ensuring the effective exit of non-viable borrowers from the economy.
Third programme (2015–2018)
The main focus of financial sector reform in the third programme aimed to safeguard financial stability and strengthen banking system viability by enacting legislative changes to accelerate NPL resolution. These actions were to be undertaken:
Restoring funding liquidity: To achieve a sustainable medium-term funding model, banks had to submit quarterly funding plans to the Bank of Greece. Greek authorities were required to monitor and manage the process of easing capital controls, taking into consideration bank liquidity conditions.
Strengthening capital positions: The programme earmarked a buffer of up to €25 billion to recapitalise viable banks and to progress the resolution of non-viable banks. The recapitalisation framework aimed to comply with state-aid rules and tried to preserve the private management of the recapitalised banks, while facilitating private sector strategic investments. In addition, the law on government guarantees on deferred tax assets needed amendment to limit links between banks and the state.
Resolution of NPLs: Emphasis focused on strengthening the institutional framework for NPL resolution, including amendments to corporate and household insolvency laws to foster the efficient liquidation of non-viable debtors and introduce stricter screening to deter filing from strategic defaulters. In addition, the HFSF was tasked to present and implement an NPL resolution plan for loans to large corporates and enhance coordination among banks when restructuring such lending.
Strengthening governance arrangements: The programme required bank senior managers to be appointed without government interference to steer the bank practices towards prudent international standards and foster independence in decision-making. In parallel, the independence of the HFSF governance structure needed to be reinforced and respected to avert any political interference.

R E S T O R I N G G R O W T H A N D F I N A N C I A L S T A B I L I T Y
| 2 3
4. State of health of Greek banks
2 4 | D I S C U S S I O N P A P E R S E R I E S | J U N E 2 0 2 0
Systemic banking crises are highly disruptive events that lead to sustained declines in economic activity when constraints limit a banking system’s capacity to intermediate credit for investment and consumer spending. These lending expansion limitations usually stem from insufficient bank capital, an inability to generate any extra capital from retained earnings, and difficulties in accessing market funding at competitive rates. This triggers an adverse feedback loop as depressed economic activity strains private sector balance sheets, which shrinks debt-servicing capacities and so expands the amount of NPLs on bank balance sheets.
This section examines bank balance sheet variables to assess to what extent this negative feedback loop moderated after the advent of the financial assistance programme and reforms in Greece to restore banking system health.
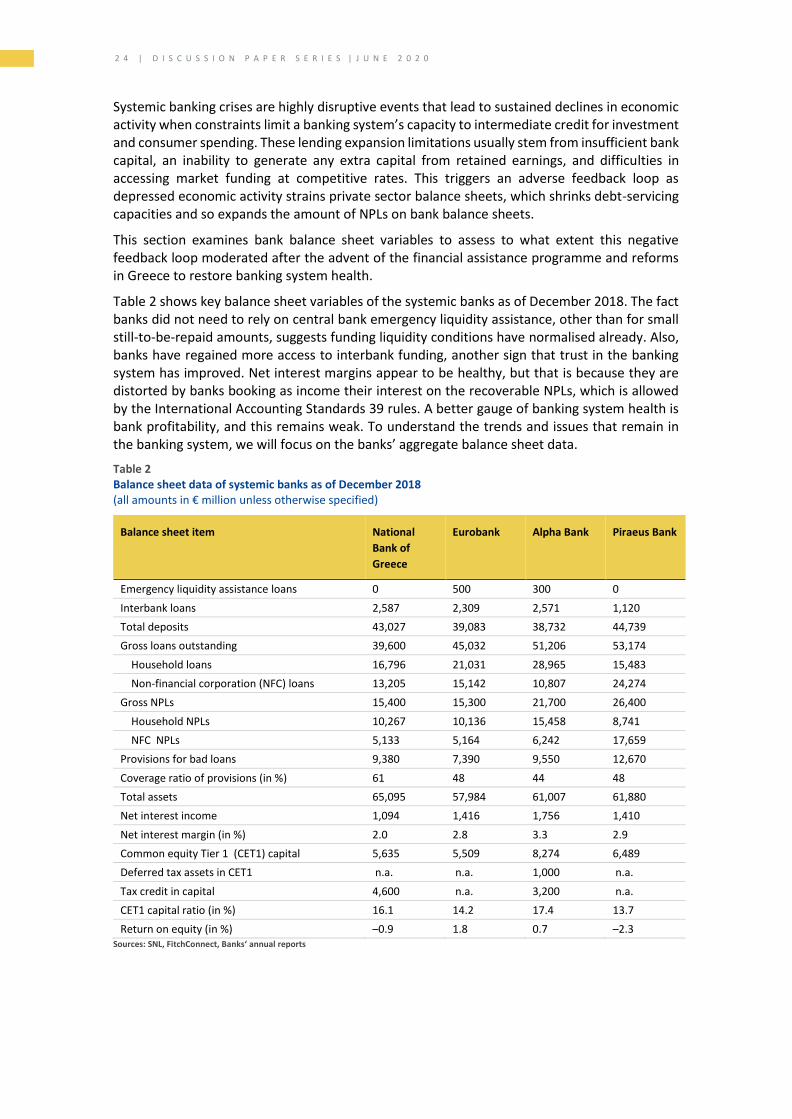
Table 2 shows key balance sheet variables of the systemic banks as of December 2018. The fact banks did not need to rely on central bank emergency liquidity assistance, other than for small still-to-be-repaid amounts, suggests funding liquidity conditions have normalised already. Also, banks have regained more access to interbank funding, another sign that trust in the banking system has improved. Net interest margins appear to be healthy, but that is because they are distorted by banks booking as income their interest on the recoverable NPLs, which is allowed by the International Accounting Standards 39 rules. A better gauge of banking system health is bank profitability, and this remains weak. To understand the trends and issues that remain in the banking system, we will focus on the banks’ aggregate balance sheet data.
Table 2 Balance sheet data of systemic banks as of December 2018 (all amounts in € million unless otherwise specified)
Balance sheet item National
Bank of
Greece
Eurobank Alpha Bank Piraeus Bank
Emergency liquidity assistance loans 0 500 300 0
Interbank loans 2,587 2,309 2,571 1,120
Total deposits 43,027 39,083 38,732 44,739
Gross loans outstanding 39,600 45,032 51,206 53,174
Household loans 16,796 21,031 28,965 15,483
Non-financial corporation (NFC) loans 13,205 15,142 10,807 24,274
Gross NPLs 15,400 15,300 21,700 26,400
Household NPLs 10,267 10,136 15,458 8,741
NFC NPLs 5,133 5,164 6,242 17,659
Provisions for bad loans 9,380 7,390 9,550 12,670
Coverage ratio of provisions (in %) 61 48 44 48
Total assets 65,095 57,984 61,007 61,880
Net interest income 1,094 1,416 1,756 1,410
Net interest margin (in %) 2.0 2.8 3.3 2.9
Common equity Tier 1 (CET1) capital 5,635 5,509 8,274 6,489
Deferred tax assets in CET1 n.a. n.a. 1,000 n.a.
Tax credit in capital 4,600 n.a. 3,200 n.a.
CET1 capital ratio (in %) 16.1 14.2 17.4 13.7
Return on equity (in %) –0.9 1.8 0.7 –2.3 Sources: SNL, FitchConnect, Banks‘ annual reports

R E S T O R I N G G R O W T H A N D F I N A N C I A L S T A B I L I T Y
| 2 5
Insights from aggregate bank data
Bank access to market funding is an important determinant of their capacity to expand balance sheet size. This did not exist from 2015 to 2017 because Greek banks’ reliance on central bank funding was excessive, while market funding through debt securities issuance remained very low (Figure 4, left panel). At the same time, retail deposit funding declined substantially (Figure 4, right panel). Also, balance sheet capacity was constrained by a need for large provisions to back NPLs. However, since 2018 the retail deposit share has increased considerably, while reliance on central bank funding has returned to a more normal position. So funding stress is now low for Greek banks, even though liquidity conditions – assessed by the liquidity coverage ratio – are low at 74% compared to the euro area average of around 150% in Q1 2019.5
Figure 4 Composition of banking sector liabilities
(as share of total liabilities, in %)
Monetary and financial institution liabilities Domestic deposits and provisions and debt securities
0
5
10
15
20
25
30
35
Jan 14 Jan 15 Jan 16 Jan 17 Jan 18 Jan 19
Bank of Greece Credit institutions Debt securities
0
10
20
30
40
50
60
70
Jan 14 Jan 15 Jan 16 Jan 17 Jan 18 Jan 19
Central govt Private sector Provisions
Source: Bank of Greece
To assess solvency, supervisory standards set a minimum capital requirements under Pillar 1 to meet existing balance sheet exposures and an additional capital conservation buffer of 2.5% to absorb losses during financial and economic stress. Under Basel III, that requirement translates to a total capital ratio of 10.5% (including Tier 1 and Tier 2 capital instruments). Even with an added discretionary countercyclical capital buffer of 2.5%, the Pillar 1 capital requirements will be met if banks have a capital ratio above 13%. By Pillar 1 standards, the Greek banking system remains adequately capitalised, with the common equity Tier 1 (CET1) ratio at the banking system level above 15% most of the time since December 2015 (Figure 5, left panel). This is above the euro area average of 14.4% for significant institutions in Q3 2019. Yet, the capital adequacy headline number masks underlying weakness in the banking sector’s ability to deal with the risks from holding a large NPL stock. Such risks are covered under the Pillar 2 capital requirements, which translate to additional capital buffers needed to address them following supervisory assessment. However, it is difficult to assess whether the Greek banking system does have adequate capital because the capital buffers needed under Pillar 2 for Greek banks are not publicly available.
One risk that stems from a large NPL stock is continuing low bank profits, or even losses, because scarce bank capital becomes locked in unproductive resources, which might gradually deplete overall bank capital over time – and lower capital constrains bank capacity to expand credit. Indeed, CET1 capital in the Greek banking system fell nearly 25% to just above €26 billion in
5 The liquidity coverage ratio figures for Greece are affected by the monetisation of the liquidity buffer after the PSI and other external factors. Consequently, the ECB does not rely on the liquidity coverage ratio as the appropriate liquidity indicator for Greece.

2 6 | D I S C U S S I O N P A P E R S E R I E S | J U N E 2 0 2 0
March 2019 from about €35 billion in December 2015. However, banks that exceed capital requirement standards, including the necessary capital buffers, are considered healthy because investors and the financial press focus on bank-reported capital ratios and not on the actual capital banks hold.
Figure 5 Bank profitability and capital adequacy
Common equity Tier 1 capital Return on equity (in %)
8
12
16
20
24
28
32
36
40
Dec 14 Dec 15 Dec 16 Dec 17 Dec 18
CET1 capital, in € billion CET1 ratio, in %
-10.6
-24.2
-7.5
-1.3 -0.4
2.12.64.4 3.2
5.7 5.84.5
-30
-25
-20
-15
-10
-5
0
5
10
2014 2015 2016 2017 2018 2019
Greece Euro area
Note: Return on equity for the year 2019 is based on the first three quarters of data only and is not annualised. Source: ECB
A healthy banking system is one with the capacity to increase credit intermediation when demand for it arises to fund the investment and consumer spending that boosts growth. That bank credit growth demands additional capital to support increased lending, so banks need to generate it internally through retained earnings or raise equity capital. Greek banks have struggled to undertake this private capital raising since 2015, and their return on equity has been negative in the period 2014 to 2018 (Figure 5, right panel). From 2016 to 2018, the Greek banking system delivered an annualised eight percentage points lower return on equity compared to euro area banks. Even if supervisory capital requirement ratios turn out to be adequate to consider banks safe, other measures will be needed to assess whether the banking system is healthy enough to spur economic activity.
Continuing the review of indicators to assess bank soundness, consider the quality of bank capital as another important determinant of banking system safety. High-quality capital ensures that in an adverse scenario where a systemically important bank or a large part of the banking system has to be restructured or resolved, writing down equity capital under the EU BRRD does not activate the bank-sovereign risk nexus to trigger sharply higher funding costs for the sovereign. Under Basel III standards (BIS, 2017), this objective is met by not recognising deferred tax assets that rely on future profitability in CET1 capital, because this form of capital establishes the direct bank-sovereign link. Some euro area member states have passed legislation to convert deferred tax assets into deferred tax credits (DTCs) to qualify as CET1 capital under Capital Requirements Regulation Article 39. This conversion not only fails to break the bank-sovereign link, it actually strengthens it. A European Commission document (European Commission, 2014a) offers guidance on how to treat deferred tax assets and conversions to DTCs.
The share of DTCs in Greek banks’ capital has increased in recent years as total capital shrank. It amounted to 60% of the CET1 capital for the Greek banking system at the end of 2018. The European Commission surveillance report notes, “The high level of DTCs in CET1 raises concerns regarding capital quality and contributes to the strong sovereign–bank nexus in Greece” (European Commission, 2019). That is because a large share of deferred tax credits in CET1 makes bank resolutions difficult under the BRRD, because the directive’s objective is to “protect public funds by minimising reliance on extraordinary public financial support” (European Commission, 2014b).
As noted earlier, healthy banking systems must be able to increase equity capital to support

R E S T O R I N G G R O W T H A N D F I N A N C I A L S T A B I L I T Y
| 2 7
credit demand when it arises. But the CET1 capital of the Greek banking system has declined 25% since December 2015, which should translate into a widespread credit supply contraction. Indeed, loans outstanding to NFCs fell 24% to June 2019 from January 2015, and to individuals it dropped 28% over the same period (Figure 6, left panel).
Figure 6 Private sector domestic credit outstanding
(in € billion)
Private sector credit Housing and consumer loans
60
70
80
90
100
110
Jan 14 Jan 15 Jan 16 Jan 17 Jan 18 Jan 19
Loans to NFC* Loans to individuals
5
20
35
50
65
80
Jan 14 Jan 15 Jan 16 Jan 17 Jan 18 Jan 19
Housing loans Consumer loans
Note: *As of March 2019, loans to shipping companies which have their registered office abroad are no longer included in credit to the domestic economy. Source: Bank of Greece
Among the loans to individuals, consumer loans have fallen more dramatically – by 30% – compared to housing loans (Figure 6, right panel). Demand side constraints may well have contributed to some of the outstanding loans decline – for example insufficient eligible collateral or weak private sector balance sheets – but the steep fall in banking capital suggests supply side constraints also must have played a large role. Any considerable contraction in outstanding loans would in turn reduce net interest income, and cut profits. This has been the case; net banking system interest income fell to €5.8 billion in 2018 from €8.7 billion in 2014. And this captures one of the drivers of negative returns on equity over a number of years.
Bank deleveraging does not in itself presage a poor medium-term economic outlook. In some cases, deleveraging might be desirable were private sector balance sheets overburdened and banks were repairing balance sheets by tightening credit conditions. Under such a scenario, banks would face a temporary increase in NPLs that they could reduce through loan restructurings, collateral recovery, and loan write-offs. A key policy objective within Greece’s third financial assistance programme was to shrink the stock of NPLs in the banking system.
Just how successful have Greek banks been in delivering on this programme objective? This is an area where progress has been very slow and many vulnerabilities surround resolutions to the large share of NPLs. Since June 2015, the NPL share within the total loans outstanding across the banking system remained above 45%, of which business loans represented 55% (Figure 7, left panel). This puts the peak NPLs in the Greek banking crisis among the worst 20% of banking crises worldwide, based on data compiled by Laeven and Valencia (2018).
To their credit, Greek banks have expended considerable effort to shrink their NPL stock in a difficult macroeconomic environment. But now banks will be less willing to embark on loan sales in the absence of an NPL market, or where access to such a market would demand deep discounts; they do not want to assume additional losses beyond provisions already set aside for NPLs. This dynamic seems to have played out in 2014 and 2015, when NPLs in the banking system rose to €106.5 billion in December 2015 from €90.8 billion in December 2013. That total has fallen since, by €35.3 billion to reach €71.2 billion in September 2019, but €22 billion of loan write-offs explain much of this reduction. Over the longer period from December 2013 to March
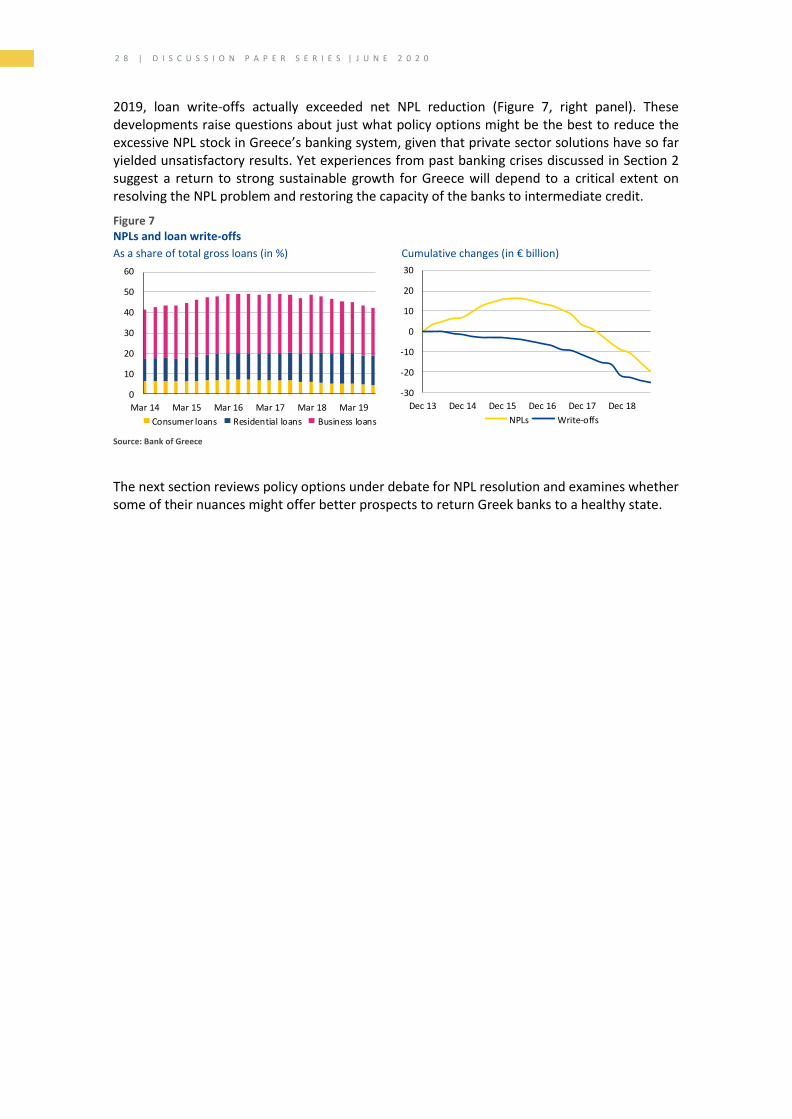
2 8 | D I S C U S S I O N P A P E R S E R I E S | J U N E 2 0 2 0
2019, loan write-offs actually exceeded net NPL reduction (Figure 7, right panel). These developments raise questions about just what policy options might be the best to reduce the excessive NPL stock in Greece’s banking system, given that private sector solutions have so far yielded unsatisfactory results. Yet experiences from past banking crises discussed in Section 2 suggest a return to strong sustainable growth for Greece will depend to a critical extent on resolving the NPL problem and restoring the capacity of the banks to intermediate credit.
Figure 7 NPLs and loan write-offs
As a share of total gross loans (in %) Cumulative changes (in € billion)
0
10
20
30
40
50
60
Mar 14 Mar 15 Mar 16 Mar 17 Mar 18 Mar 19
Consumer loans Residential loans Business loans
-30
-20
-10
0
10
20
30
Dec 13 Dec 14 Dec 15 Dec 16 Dec 17 Dec 18
NPLs Write-offs
Source: Bank of Greece
The next section reviews policy options under debate for NPL resolution and examines whether some of their nuances might offer better prospects to return Greek banks to a healthy state.

R E S T O R I N G G R O W T H A N D F I N A N C I A L S T A B I L I T Y
| 2 9
5. Options for non-performing loan resolution

3 0 | D I S C U S S I O N P A P E R S E R I E S | J U N E 2 0 2 0
Ambitious targets have been set for the banking system to reduce NPLs to around 19% by end-2021. That would require banks to off-load NPLs worth at least €50 billion in face value from their balance sheets, which corresponds to gross loans worth more than 25% of GDP. A private sector solution is unlikely to solve a problem of this magnitude, but two proposals are under discussion, both requiring some state intervention.
Asset protection scheme
An asset protection scheme has emerged, based on a HFSF concept that involves establishing a series of special purpose vehicles (SPVs) for each of four systemic banks, which will buy the NPLs from other banks. Given the challenges involved in establishing this scheme, specific details are not publicly available at this time. But the general idea is to fund these purchases by selling asset-backed securities to private investors, handled by independent servicers. The government would guarantee senior tranches of these securities – provided a large amount of the riskier securities is sold to private investors. But the mechanics of this guarantee are complex. For example, the single supervisor must verify that sufficient loss-absorption capacity exists in the junior and mezzanine tranches to protect the senior tranche. And the pricing methodology needs to be negotiated with the Commission’s Competition Directorate. Given Greece’s non-investment grade rating, the costs involved to provide any guarantee could be high and it is not clear if each SPV must hold an equity share and, if so, who will undertake that investment. For banks to enjoy capital relief from the NPL transfer under Basel III, they may not be retaining exposures to the riskier tranches, that is, the NPLs should be transferred under a true sale agreement to the SPV.
Bank of Greece scheme
A complementary scheme proposed by the Bank of Greece envisages the transfer of NPLs worth about €40 billion along with a part of the deferred tax credits on bank balance sheets worth around €8 billion to a SPV (Mourmouras, 2019). Because the NPL management is centralised under this proposal, the SPV will be equivalent to a bad bank or AMC. To take this proposal forward, legislation will be needed to turn the transferred deferred tax credits into an irrevocable claim of the AMC on the Greek State with a predetermined repayment schedule. Because the AMC holds equity capital through the deferred tax credit transfer, additional state guarantees for the securitisation notes will not be required. For funding the AMC, the Bank of Greece proposal envisages the sale of senior, mezzanine, and junior securitised notes backed by the NPL pool. The centralised pooling of NPLs would also facilitate the sale of securitised notes backed by homogenous assets, such as mortgage loans, consumer loans and business loans.
Devil in the details
Details about just how the large NPL stock will be resolved must be negotiated between the European institutions and the Greek authorities. Given that Greek banks are reporting adequate CET1 ratios, questions could arise if resolution preconditions are met – that is, to rule that banks are failing or likely to fail. But additional capital buffers needed under Pillar 2 following a supervisor stress test could lead to that determination. A particular resolution challenge to Greek banks employing EU BRRD tools would be a lack of adequate bail-in debt instruments. This could shift the loss-bearing burden onto uninsured retail depositors and the deposit guarantee fund, which means the bail-in burden ultimately would fall on the sovereign because the deposit guarantee fund is underfunded. Even if resolution tools are not employed, state aid

R E S T O R I N G G R O W T H A N D F I N A N C I A L S T A B I L I T Y
| 3 1
rules may apply should it be deemed that NPL transfers or government guarantees on securitised debt sold by the SPVs were not executed at market prices – which in turn would trigger bail-in requirements for bank liabilities.
Against this background, perhaps the most important challenge for any NPL management scheme would be to agree a fair price for any asset transfer. Banks tend to overprice the recovery value of any transferred NPLs, whereas private investors seek deep discounts to compensate for what is usually expected to be an illiquid market. Ultimately, equity holders in the AMC or SPV will have to bear the risk of this divergence in expectations. To provide some estimates of how large the price divergence might be, this paper examines typical recent NPL sale prices in a euro area member state compared to recovery values banks expect. This recovery expectation can be derived from the face value of NPLs less the provisions coverage ratio banks have set aside. In the first quarter of 2019, the coverage ratio for Greek banks was about 48%, so the recovery value on NPLs that banks expect is 52 cents to one euro exposure. Assuming the transfer price of NPLs to the AMC is executed at that price, the AMC equity holder would take a loss if the securitised pool of NPLs sold to third parties fetches a lower price. As a proxy for typical recovery values on the sale of NPLs to third parties, data compiled by the Bank of Italy on actual transactions can be used (see, Fischetto et al, 2018). This is shown in Table 3.
Table 3 Total recovery rates for positions sold to third parties
(in % of face value)
Sale year Household NPLs
(secured)
Household NPLs
(unsecured)
NFC NPLs
(secured)
NFC NPLs
(unsecured)
2014 33.3 14.6 30.5 16.9
2015 38.1 13.7 29.0 15.6
2016 38.3 15.3 36.3 15.1
2017 36.2 19.6 33.0 17.9
Average 36.5 15.8 32.2 16.4
Source: Bank of Italy
For Greek banks, the NPL composition in September 2019 was roughly 10% consumer loans, 35% mortgage loans, and 55% NFC loans. The share of secured loans compared with unsecured is not available. Suppose the average recovery rate on secured NFC loans in Table 3 is taken as a proxy for the price at which the AMC sells NPLs to third parties, a loss of 20 cents will arise on one euro of exposure sold. The AMC equity holder will have to bear this loss when the bank NPLs are transferred at 52 cents for one euro exposure. Under the Bank of Greece proposal, a transfer of €40 billion of NPLs to the AMC would result in an €8 billion loss. That is the equity capital that would be transferred to the AMC through deferred tax credits – a direct loss to the state.
Considering that recovery rates for unsecured consumer loans and unsecured NFC loans are much lower than 32 cents to a euro (see Table 3), a more conservative recovery value estimate might be 27 cents to a euro. That would result in a 25 cents to one euro loss on transferred NPLs, assuming the transfer price to the AMC is one minus the provisions coverage ratio, which is 52 cents for one euro exposure. To achieve the targeted aim of reducing NPLs in the Greek banking system to 19% by 2021, the stock of NPLs to be transferred would have to be €50 billion. In this case, the loss to the equity holder in the AMC will correspond to €12.5 billion. Alternatively, if the transfer price to the AMC on €50 billion of NPLs is agreed at 32 cents to a euro, the Greek banking system would have to record an immediate €10 billion loss to CET1 capital. Such an estimate is broadly similar to an IMF assessment in its Article IV consultation, which said Greek banks needed an additional €10 billion in capital (IMF, 2017). These numbers

3 2 | D I S C U S S I O N P A P E R S E R I E S | J U N E 2 0 2 0
are only representative; they are designed to illustrate issues to debate and resolve when establishing SPVs or AMCs to help banks remove NPLs from their balance sheets and turn their attention to supplying credit needed to revive the economy. Box 2 provides some nuances to the debate that could arise on undertaking NPL transfers to an AMC.
Box 2. NPL resolution: issues at stake
Centralising the management of NPLs through an AMC is a key feature of the Bank of Greece proposal and has advantages. It addresses creditor coordination problems and facilitates the pooling of homogenous assets for securitisation. At the same time, NPLs of large corporations can be dealt with on a stand-alone basis. If sufficient equity capital exists to back the issued securitised notes, the state will not need to provide additional guarantees. A major proposal weakness is not exercising the principle of proportionality across the various equity stakeholders, because it implicitly treats private shareholders in the Greek banking system as preferred shareholders should only DTCs owned by the state be transferred to the AMC along with the NPLs. Note that Greek banks use two types of DTCs, one linked to the PSI losses and the other associated with specific NPLs. Laws dictate that DTCs must convert to cover any losses in proportion to its share in CET1 capital, which would require a certain proportion of losses stemming from NPL transfers to be shared by other shareholders. As of September 2019, the CET1 capital in the Greek banking system amounted to €28.4 billion, of which €16 billion comprised DTCs. Part of the DTCs are associated with PSI-related losses so do not have to bear NPL-related losses.
To highlight issues that surround NPL transfers, suppose the scheme targets cutting the Greek banking system NPL ratio to below 10%. In this scenario, the face value of NPLs worth about €70 billion would have to be transferred to the AMC, reducing the amount of cherry-picking banks might otherwise undertake when transferring the NPLs. At this point, the market price of the NPLs needs to be determined to see if such transfers would trigger state-aid clauses. Were the recovery rates in Table 3 used as guidance, one could assume the market-determined price of the average recovery values for NPLs to be 30 cents for one euro of exposure. Considering that the provisions coverage ratio was only 48 cents for one euro of exposure, this would force a loss of 22 cents on banks for each euro of NPL transferred. These losses need to be shared proportionately between DTCs linked to NPLs and private shareholders, which could include shares held by the HFSF. Establishing the AMC with adequate capital would mean leaving the banking system short of capital to foster lending growth and spur economic activity – a shortfall likely to be above the €10 billion the IMF estimated, using end-2016 data. One option to meet this shortfall would be a Greek state capital injection, but that would add to state debt and raise the debt-to-GDP ratio. Alternatively, a liability-holders bail-in could recapitalise banks; however, those liability-holders are likely to be retail depositors, so bailing-in such liabilities could risk financial stability through a run on bank deposits. Then sovereign risk could re-emerge, because some of the burden would fall on an underfunded deposit guarantee fund. But unless extra capital is injected into Greek banks to promote lending growth, the speed of the country’s economic recovery will remain sluggish, with the risk increasing of growth becoming less durable.

R E S T O R I N G G R O W T H A N D F I N A N C I A L S T A B I L I T Y
| 3 3
6. Impact of reforms on the economy

3 4 | D I S C U S S I O N P A P E R S E R I E S | J U N E 2 0 2 0
In all economies that rely predominantly on bank credit to finance investment and consumption, banking sector health is an important determinant of economic activity. Healthy bank balance sheets foster better terms and conditions for private sector access to credit, which then raises credit demand and output. The monetary policy stance also affects economic activity, but accommodative monetary policies aimed at boosting growth become less effective when the banking system is overburdened with NPLs and so fails to generate adequate returns or increase capital through retained earnings. Also, ECB quantitative easing has not directly benefited Greece because Greek bonds did not meet the minimum ratings requirement for asset purchases.
A Bank of Greece empirical study identified the interaction between bank balance sheet variables and economic activity (Louri and Migiakis, 2019). The authors’ main findings are: (a) the deterioration in the quality of Greek banks’ balance sheets negatively affected the provision of credit to the economy; (b) central bank liquidity and recapitalisations of Greek banks only provided a partial remedy; (c) the rise in NPLs dampened the provision of bank credit; and (d) the decline in bank credit deeply weakened economic activity because it depressed private demand – with investment spending even more undermined.
When the third financial assistance programme conditionalities were drawn up, the existence of this adverse feedback loop appears to have been recognised, because the programme placed more emphasis on restoring health in the financial sector and implementing an NPL resolution plan. These programme intervention and support objectives were relevant and did meet the country’s needs, but their effectiveness in achieving a steep NPL reduction across the banking system has been unsuccessful, and this has restrained growth. Nevertheless, the programme did help stabilise the financial system and improve the government budget balance.
It is difficult to disentangle the drivers of growth when far-reaching reforms in various sectors accompanied a very accommodative monetary policy. Still, a sound resilient financial sector is an essential precondition for improving growth prospects and the economic outlook, so banking proved to be a key reform focus. To assess how the EFSF and ESM programmes – with their emphasis on banking reform – affected growth and the economic outlook, this paper first examines financial sector variables that drive economic activity, followed by measures of macroeconomic performance.
Net new credit flows to support investment and consumption are an important driver of economic activity, but banks’ capacity to extend new credits after the PSI was severely constrained. EFSF programme funding aimed to help the banks restore their capital shortfalls, but raising additional bank capital to increase loan supplies to fund economic recovery was left to market forces. When economic contraction intensified, it adversely affected borrowers’ balance sheet capacities. One leading indicator of borrower balance sheet strength is price developments in real estate markets, because residential and commercial properties serve as collateral for most forms of secured bank lending. From 2011 to 2014, house prices across the country dropped 30% and rent prices fell 22% (Figure 8, left panel). Stressed borrower balance sheets force banks to cut back lending as a prudent risk management measure. And bank credit did indeed contract sharply in this period (Figure 8, right panel), which in turn further depressed economic activity.
Considering policy, questions arise about whether weakened borrower balance sheets tightened the credit supply or whether a lack of bank capital was the main constraint. Supply constraints on banks must have played a role because banks suffered funding liquidity shortages during this period. This identification problem is, however, difficult to address, but probably a combination of both supply and demand constraints contributed to the sharp credit supply decline.
R E S T O R I N G G R O W T H A N D F I N A N C I A L S T A B I L I T Y
| 3 5
Figure 8 Housing market developments and credit flows to private sector
Housing market indicators Cumulative net new loans (in € billion)
75
90
105
120
135
150
165
Nominal house price HPIR* Rent price
-25
-20
-15
-10
-5
0
5
NFC loans Residential loans Consumer loans
Notes: *Ratio of nominal house price to disposal income per head. Sources: Bank of Greece, OECD
A credit standards survey confirms that banks tightened the supply of credit to the economy significantly from 2011 to 2013 and from 2015 to 2017 (Figure 9, left panel). During these years consumer and business confidence indicators deteriorated (Figure 9, right panel), providing some justification for bank prudence and a tightening of credit supplies. It indicates that demand constraints were also important. As the composite leading indicator recovered towards end-2015 to forecast an improving business climate, no further contraction in lending to NFCs and consumers arose – a testament to the success of ESM programme financing.
Figure 9 Survey of credit standards and sentiment indicators
Survey of credit standards on loans Economic sentiment indicators
2.0
2.2
2.4
2.6
2.8
3.0
3.2
3.4
SME Residential Consumer
94
96
98
100
102
104
Consumer Business Leading*
Notes: Survey of bank credit standards denote changes over past three months for approving loans. A number below three implies tightening and a number above three implies easing of credit standards. *Composite leading indicator provides early signals of turning points in business cycles showing fluctuations of the economic activity around its long-term potential level. Sentiment indicator values above 100 signals increased confidence.
Sources: Bank of Greece, OECD
When borrower balance sheet qualities deteriorate, compounded by a lack of adequate collateral to back loans, then banks raise interest rates on loans to compensate for the increased credit risk. This adds to the stress of borrower balance sheets, leading to delayed interest payments or even defaults. Interest rates on consumer loans, for example, have remained between 8% and 10% since 2011 (Figure 10, left panel), or about three percentage points above the euro area average for consumer loans (Figure 10, right panel). Those very high real consumer-loan interest rates would have had a significant contractionary effect on consumer spending when growth and inflation remained close to zero – or negative – for much of this period.

3 6 | D I S C U S S I O N P A P E R S E R I E S | J U N E 2 0 2 0
Figure 10 Interest rates on loans outstanding
(in %)
Greece Euro area
0
2
4
6
8
10
12
NFC Residential Consumer
0
2
4
6
8
10
12
NFC Residential Consumer
Note: For loan maturities from one-to-five years. Source: ECB
In Greece, loan rates for non-financial corporate borrowing also ran high relative to the euro area average. For example, loan rates to Greek NFCs were consistently about two percentage points higher than similar euro area loans (Figure 10), which trimmed their business profitability. One explanation for such high lending margins could be the weak borrower balance sheets, although some lending margins could have been covering the operating costs associated with holding high levels of NPLs on the bank balance sheets. The high lending margin on loans to the private sector is likely to have dampened credit demand, which would have negatively affected business and consumer confidence indicators. It does appear some of the banking sector burden has been shifting to private sector balance sheets.
Given this background, evidence is mounting to suggest banking sector reforms have not been very successful in resolving the NPL problem by placing emphasis on private sector solutions. Such solutions tend to be more forthcoming when only part of the banking system is faced with bad debts, so that other, more-healthy, banks might have an incentive to gain market share through acquisitions and asset disposals. The United States Federal Reserve successfully managed such an outcome after the subprime crisis, although systemic institutions like Citigroup and AIG still needed state support.
In Greece’s case, the systemic banking crisis needed a reduction in the large NPL stock, which became an important objective in the ESM financial assistance programme, as it tried to expand the supply of credit to the economy. But the underlying assumption that the NPL problem could be resolved by private sector solutions was unrealistic. Even after the challenges involved in finding a private sector solution became evident, state-aid considerations prevented European institutions from responding quickly and efficiently to find alternative solutions to the tight bottleneck to growth.
An examination of macroeconomic indicators identifies widespread challenges that still face the Greek economy. Banking sector recapitalisation after the PSI and other reforms helped Greece overcome a deep recession and return to growth in early 2014 (Figure 11, left panel). The annual investment spending growth rate improved to register positive values in 2016 and 2017, which suggests banks started supplying the credit needed to support the economic recovery. But that trend faltered in 2018 and the domestic demand forecast remained subdued at below 2% in 2019 (Figure 11, left panel). However, the EFSF and ESM programmes were instrumental in restoring GDP growth, even if the rate remained low. But across the euro area low growth and low inflation are broad phenomena, so structural impediments to achieving higher growth rates for Greece might remain a challenge in the near term.
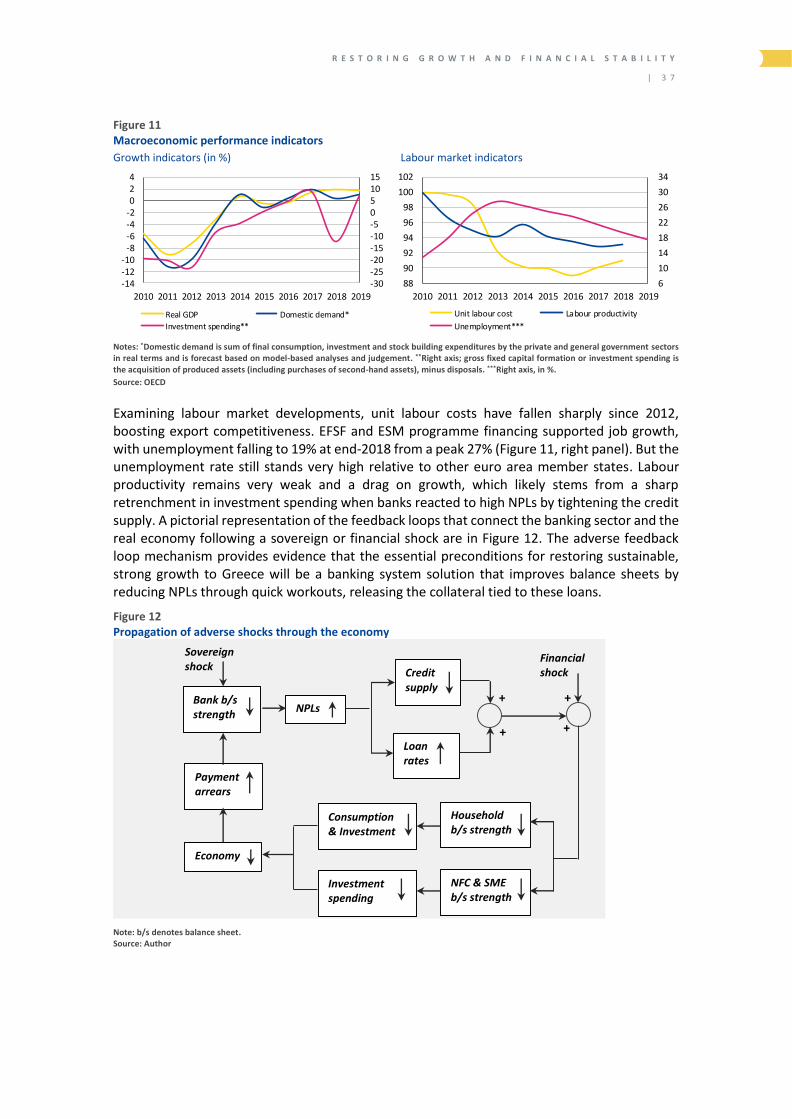
R E S T O R I N G G R O W T H A N D F I N A N C I A L S T A B I L I T Y
| 3 7
Figure 11 Macroeconomic performance indicators
Growth indicators (in %) Labour market indicators
-30-25-20-15-10-5051015
-14-12-10
-8-6-4-2024
2010 2011 2012 2013 2014 2015 2016 2017 2018 2019
Real GDP Domestic demand*
Investment spending**
6
10
14
18
22
26
30
34
88
90
92
94
96
98
100
102
2010 2011 2012 2013 2014 2015 2016 2017 2018 2019
Unit labour cost Labour productivity
Unemployment***
Notes: *Domestic demand is sum of final consumption, investment and stock building expenditures by the private and general government sectors in real terms and is forecast based on model-based analyses and judgement. **Right axis; gross fixed capital formation or investment spending is the acquisition of produced assets (including purchases of second-hand assets), minus disposals. ***Right axis, in %. Source: OECD
Examining labour market developments, unit labour costs have fallen sharply since 2012, boosting export competitiveness. EFSF and ESM programme financing supported job growth, with unemployment falling to 19% at end-2018 from a peak 27% (Figure 11, right panel). But the unemployment rate still stands very high relative to other euro area member states. Labour productivity remains very weak and a drag on growth, which likely stems from a sharp retrenchment in investment spending when banks reacted to high NPLs by tightening the credit supply. A pictorial representation of the feedback loops that connect the banking sector and the real economy following a sovereign or financial shock are in Figure 12. The adverse feedback loop mechanism provides evidence that the essential preconditions for restoring sustainable, strong growth to Greece will be a banking system solution that improves balance sheets by reducing NPLs through quick workouts, releasing the collateral tied to these loans.
Figure 12 Propagation of adverse shocks through the economy
Sovereign shock
Bank b/s strength NPLs
Credit supply
Loan rates
Financial shock
Household b/s strength
NFC & SME b/s strength
Consumption & Investment
Investment spending
Payment arrears
Economy
+
+
+
+
Note: b/s denotes balance sheet. Source: Author

3 8 | D I S C U S S I O N P A P E R S E R I E S | J U N E 2 0 2 0
7. Contribution of Greek programmes to financial stability

R E S T O R I N G G R O W T H A N D F I N A N C I A L S T A B I L I T Y
| 3 9
Without external financial support, the Greek crisis could have created an existential threat to euro area integrity. As noted in Section 1, euro area banks carried large exposures to both Greek sovereign debt and private sector debt. Markets, therefore, started charging much higher premiums to hedge the default risk for major euro area banks when PSI negotiations gained traction in late 2011 (Figure 13, left panel). Speculation about a potential Greek exit from the euro area, and implications for other member states facing fiscal stress, spread contagion to the sovereign bond markets from mid-2011 (Figure 13, right panel). It is difficult to imagine how contagion risks across the euro area could have been addressed without a swift agreement on EFSF financial assistance following the voluntary PSI debt exchange. The EFSF programme announcement had a powerful impact in stemming contagion risks, as can be seen from the sharp falls in bank credit default swap spreads and sovereign bond yields in Figure 13. But an equally powerful risk mitigant flowed from the July 2012 commitment of the ECB’s then-President Mario Draghi, “to do whatever it takes to preserve the euro, within the mandate”. This statement, followed a week later by an announcement of outright monetary transactions, decoupled the risks in Greece – being addressed by the EFSF financial assistance programme – from other euro area member states.
Figure 13 Bank credit default swap spreads and government bond yields
(in %)
Bank senior five-year credit default swap spreads Government 10-year bond yields
0
1
2
3
4
5
6
7
8
Jan 11 Jan 12 Jan 13 Jan 14 Jan 15 Jan 16 Jan 17
Santander Société Générale Uni Credit
0
2
4
6
8
10
12
14
16
0
1
2
3
4
5
6
7
8
Jan 11 Jan 12 Jan 13 Jan 14 Jan 15 Jan 16 Jan 17ES, left axis IT, left axis PT, right axis
Sources: Bloomberg, OECD
It is reasonable to argue that the EFSF programme announced in March 2012 brought stability to euro area financial markets, but extinguishing the euro area contagion risk should be attributed to the outright money transaction commitment, even if never employed. The EFSF programme had a powerful impact on stabilising the Greek financial system and preventing a run on bank deposits through a recapitalisation of the banking system following the PSI. More importantly, the EFSF debt could be used by Greek banks as collateral for liquidity operations with the ECB to meet their payment obligations.
One EFSF programme weakness was a lack of clear conditionalities on how to address non-viable banks, given NPLs had risen considerably at many banks after a deep recession. A presumption developed to suggest weak banks could be resolved or liquidated without any adverse impact on financial stability. And so it was expected that viable banks could raise equity from private investors to strengthen their capital adequacy ratios. But the programme design seems to have overlooked the fact that around the time the global financial crisis ended, regulators were finalising a much higher Basel capital requirements ratio. That would demand the raising of much more capital. A lack of clear conditionality and guidance on how the banking sector problems needed to be addressed allowed banks to continue accumulating NPLs. Across the Greek banking system, the NPL stock rose to €104 billion in June 2015 from €58 billion in March 2012, while domestic deposits fell to €130 billion from €174 billion in the same period.

4 0 | D I S C U S S I O N P A P E R S E R I E S | J U N E 2 0 2 0
The accumulation of financial stability risks in the first half of 2015 is best captured by Figure 4 in Section 4. Between December 2014 and June 2015, the share of bank funding raised from credit institutions and domestic deposits fell by more than 20% in total liabilities. To prevent further outflows of retail deposits to other euro area member states, capital controls were introduced in June 2015. The amplification of financial stability risks to Greece can be attributed to two developments. One was the impending July 2015 EFSF programme expiration and an expectation that the newly elected government under Alexis Tsipras was unlikely to negotiate another financial assistance programme without major changes to conditionalities and austerity measures. The other was an ECB decision in February 2015 that it would not accept Greek government bonds as collateral in monetary policy operations because the ECB could not assume a successful completion of the financial assistance programme. This meant Greek central bank emergency liquidity assistance would be the only way to counter liquidity shortfalls and prevent the bank-funding crisis from becoming a solvency crisis.
Despite the heightened financial stability peril in the first half of 2015, the spillover risk to the financial system of other euro area states was limited. Bank credit default swap spreads hardly responded to developments in Greece because euro area bank exposures to the country by that time were almost unwound. However, bond yields in a number of euro area countries spiked during the first quarter of 2015 due to investor risk aversion. Nevertheless, the ECB’s public sector purchase programme, starting in March 2015, bought euro area government bonds and unleashed a powerful force that dented the risk aversion. Consequently, the intensity of financial stability risk was confined to Greece for most of the first half of June 2015.
Into this environment the third financial assistance programme arrived, with the ESM providing the funding. The first loan disbursement took place in August 2015. Under this programme, €25 billion was earmarked for bank recapitalisation needs because banking sector health remained fragile. The ESM programme was instrumental in stabilising the Greek financial system, leading to the return of both domestic retail deposits and deposits from credit institutions, which helped ease funding problems. This gradually reduced the funding requirement for emergency liquidity assistance from the fourth quarter of 2015 onwards, and the better financial conditions halted euro area speculation about the possibility of a Greek exit. That threat would have been very real without the ESM financial assistance programme, because Greece had lost access to funding in capital markets.
The success of the reforms undertaken under the ESM programme, which ended in August 2018, has ensured the normal, albeit still fragile, functioning of the Greek financial system. This hard-won financial stability has reassured investors and helped Greece raise €1.5 billion through a 10-year government bond issue in October 2019 at a 1.5% yield. But to continue to safeguard financial stability and accelerate economic recovery, large stocks of NPLs still need to be resolved. How this is done will determine whether financial stability risks diminish further or whether the risks could become more threatening. For example, a run on bank deposits could reignite the stability risk should it be decided to enforce strict rules demanding a bank liability-holders bail-in were NPL transfers considered to be executed at below-market prices. It therefore becomes vital that authorities’ deliberations assess any financial-stability implications that might flow from different NPL resolution proposals.

R E S T O R I N G G R O W T H A N D F I N A N C I A L S T A B I L I T Y
| 4 1

4 2 | D I S C U S S I O N P A P E R S E R I E S | J U N E 2 0 2 0
8. Conclusion

R E S T O R I N G G R O W T H A N D F I N A N C I A L S T A B I L I T Y
| 4 3
Since the Greek sovereign debt crisis hit in 2010, the country has progressed to the point where it has secured financial stability and can now raise debt in the capital markets, but the road to recovery has been bumpy. When the crisis emerged, mechanisms did not exist to mitigate risk propagation within Greece and across other member states. The lessons learned helped create the ESM as a rescue mechanism to forestall such risk propagation channels and restore investor confidence in euro area integrity.
In any financial crisis the banking system of the affected country comes under severe stress, whether the initial shock spreads from sovereign debt or the financial sector. So fixing banks would take centre stage in any crisis fighting that implemented reforms to institute greater financial system resilience. In almost every major financial crisis, a key policy question becomes how to resolve a large accumulated stock of NPLs in the banking system. Such a large stock of NPL constrains the capacity of banks to raise capital and supply the credit needed for an economic revival, and public sector solutions often become the preferred choice to repair bank balance sheets quickly.
Much of this script played out in Greece, where banks accumulated a large stock of NPLs, which affected both the supply of credit and credit demand, contributing to a weak economic recovery.
Finding private sector solutions to tackle NPL resolution after a systemic banking crisis is hard – when the macroeconomic environment has deteriorated substantially. Greece’s economic recovery has been muted because state-aid rules have so far constrained the Greek authorities’ ability to design workable solutions to address the NPL problem without triggering financial stability risks. A large amount of deferred tax assets converted into deferred tax credits has also created its own problems along the way to finding ways to restore bank health.
In responding to future crises, enforcing state aid conditionalities may be appropriate in ESM programme design to avoid moral hazard. But Greek banks simply did not have bail-in liabilities when the crisis hit in 2012, so it was very difficult to raise such liabilities until the NPL problem was resolved. This has obstructed NPL resolution progress and unless a workaround is found the country’s economic recovery will be weak and less resilient to potential shocks.
Overall, the EFSF and ESM programmes have achieved their main objectives in safeguarding financial stability, buying time for implementing reforms, and mitigating the risk of spillovers to other member states. However, more analysis is needed to determine to what extent the EU’s BRRD rules will be strictly followed during any NPL resolution process aimed at restoring Greek banks to health over time, without activating financial stability risks.

4 4 | D I S C U S S I O N P A P E R S E R I E S | J U N E 2 0 2 0
References
Acharya, V., I. Drechsler and P. Schnabl (2011), “A pyrrhic victory? Bank bailouts and sovereign credit risk”,
NBER Working Paper No 17136.
Bank of Greece (2012), “Report on the recapitalisation and restructuring of the Greek banking sector”.
Baudino, P. and H. Yun (2017), “Resolution of non-performing loans – policy options”, FSI Insights on policy
implementation, No 3.
Bernal-Verdugo, L., D. Furceri and D. Guillaume (2012), “Crises, labor market policy and unemployment”, IMF
Working Paper WP/12/65.
BIS (2008), “Central bank operations in response to the financial turmoil”, CGFS Papers No 31.
BIS (2014), “Trade finance: developments and issues”, CGFS Papers No 50.
BIS (2017), “Basel III definition of capital – frequently asked questions”, Basel Committee on Banking
Supervision.
Calomiris, C. (2009), “Banking crises and the rules of the game”, NBER Working Paper No 15403.
Cecchetti, S., M. Kohler and C. Upper (2009), “Financial crises and economic activity”, NBER Working Paper No
15379.
Cerra, V. and S. Saxena (2008), “Growth dynamics: The myth of economic recovery”, American Economic
Review, 98:1, pp 439–457.
ECB (2015), “The fiscal impact of financial sector support during the crisis”, Economic Bulletin, Issue 6.
ESM (2018), “Explainer on ESM and EFSF financial assistance for Greece”, 20/08/2018.
ESM (2019), “Safeguarding the euro in times of crisis: The inside story of the ESM”.
European Commission (2012), “The second economic adjustment programme for Greece”, Occasional Papers
94.
European Commission (2014a), “Treatment of deferred tax assets (DTAs) and recording of tax credits related
to DTAs in ESA2010”, Eurostat Guidance Note.
European Commission (2014b), “Directive 2014/59/EU of the European Parliament and of the Council”.
European Commission (2015), “Memorandum of Understanding between the European Commission acting on
behalf of the ESM and the Hellenic Republic and the Bank of Greece”, 30 July 2015.
European Commission (2019), “Enhanced surveillance report: Greece”, Institutional Paper 103.

R E S T O R I N G G R O W T H A N D F I N A N C I A L S T A B I L I T Y
| 4 5
Financial Stability Board (2011), “Key attributes of effective resolution regimes for financial institutions”,
October.
Fischetto, A., I, Guida, A. Rendina, G. Santini, and M. Scotto di Carlo (2018); “Bad loan recovery rates in 2017”,
Notes on Financial Stability and Supervision, No. 13, Bank of Italy.
Furceri, D. and A. Zdzienicka-Durand (2010), “Banking crises and short and medium term output losses in
developing countries: The role of structural policy variables”, Working Paper GATE 2010–14.
Galenianos, M. (2015), “The Greek crisis: Origins and implications”, Hellenic Foundation for European Foreign
Policy, Research Paper No 16/2015.
IMF (2012), “Greece: Memorandum of Understanding on specific economic policy conditionality”, in IMF
Country Report No. 12/57, p. 152–194.
IMF (2013a), “Greece: Selected issues”, IMF Country Report No. 13/155.
IMF (2013b), “Greece: Ex post evaluation of exceptional access under the 2010 Stand-By Arrangement,” IMF
Country Report No. 13/156.
IMF (2019), “Greece: First post-program monitoring discussions”, IMF Country Report No. 19/73.
Jassaud, N. and K. Kang (2015), “A strategy for developing a market for nonperforming loans”, IMF Working
Paper 15/24.
Kaskarelis, L. and D. Siklós (2019), “Completing NPL reduction in Europe”, ESM Discussion Paper Series 6.
Laeven, L. and F. Valencia (2018), “Systemic banking crises revisited”, IMF Working Paper WP/18/206.
Louri, H. and P. Migiakis (2019), “Financing economic growth in Greece: Lessons from the crisis”, Working Paper
262, Bank of Greece.
Mourmouras, I. (2019), “Recent developments in tackling the Greek non-performing loans problem”, Keynote
speech at IMN’s 2nd Annual Investors’ Conference on Greek & Cypriot NPLs, 8 February.
Philippon, T. and P. Schnabl (2009), “Efficient recapitalisation”, NBER Working Paper No 14929.

4 6 | D I S C U S S I O N P A P E R S E R I E S | J U N E 2 0 2 0
Acronyms
AMC Asset management company
BIS Bank for International Settlements
BRRD Bank Recovery and Resolution Directive
CET1 Common equity Tier 1
DTC Deferred Tax Credit
ECB European Central Bank
EFSF European Financial Stability Fund
ELA Emergency Lending Assistance
ESM European Stability Mechanism
GDP Gross Domestic Product
HFSF Hellenic Financial Stability Fund
IMF International Monetary Fund
MoU Memorandum of Understanding
NFC Non-financial corporation
NPL Non-performing loan
PSI Private sector involvement
SPV Special purpose vehicle