restaurant brands international limited partnership
TRANSCRIPT
Table of Contents
UNITED STATESSECURITIES AND EXCHANGE COMMISSION
Washington, D.C. 20549
Form 10-K
(Mark One)
☒ ANNUAL REPORT PURSUANT TO SECTION 13 or 15(d) OF THE SECURITIES EXCHANGE ACT OF 1934
For the fiscal year ended December 31, 2020
or
☐ TRANSITION REPORT PURSUANT TO SECTION 13 OR 15(d) OF THE SECURITIES EXCHANGE ACT OF 1934
For the transition period from to
Commission file number: 001-36787
RESTAURANT BRANDS INTERNATIONAL LIMITEDPARTNERSHIP
(Exact name of Registrant as Specified in Its Charter)
Canada 98-1206431(State or Other Jurisdiction of Incorporation or Organization)
(I.R.S. Employer Identification No.)
130 King Street West, Suite 300 M5X 1E1Toronto, Ontario
(Address of Principal Executive Offices) (Zip Code)
(905) 339-6011Registrant’s telephone number, including area code
Securities registered pursuant to Section 12(b) of the Act:None
Securities registered pursuant to Section 12(g) of the Act:
Title of each class Trading Symbols Name of each exchange on which registeredClass B Exchangeable Limited Partnership Units QSP Toronto Stock Exchange
Indicate by check mark if the Registrant is a well-known seasoned issuer, as defined in Rule 405 of the Securities Act. Yes ☒ No ☐
Indicate by check mark if the Registrant is not required to file reports pursuant to Section 13 or Section 15(d) of the Act. Yes ☐ No ☒
Indicate by check mark whether the Registrant (1) has filed all reports required to be filed by Section 13 or 15(d) of the Securities Exchange Act of 1934during the preceding 12 months (or for such shorter period that the registrant was required to file such reports), and (2) has been subject to such filing requirementsfor the past 90 days. Yes ☒ No ☐
Indicate by check mark whether the registrant has submitted electronically every Interactive Data File required to be submitted pursuant to Rule 405 ofRegulation S-T (§ 232.405 of this chapter) during the preceding 12 months (or for such shorter period that the registrant was required to submit suchfiles). Yes ☒ No ☐
Indicate by check mark whether the registrant is a large accelerated filer, an accelerated filer, a non-accelerated filer, a smaller reporting company, or anemerging growth company. See the definitions of “large accelerated filer,” “accelerated filer,” “smaller reporting company” and “emerging growth company” inRule 12b-2 of the Exchange Act.
Large accelerated filer ☒ Accelerated filer ☐

Non-accelerated filer ☐ Smaller reporting company ☐
Emerging growth company ☐
If an emerging growth company, indicate by checkmark if the registrant has elected not to use the extended transition period for complying with any new orrevised financial accounting standards provided pursuant to Section 13(a) of the Exchange Act. ☐
Indicate by check mark whether the registrant has filed a report on and attestation to its management’s assessment of the effectiveness of its internal controlover financial reporting under Section 404(b) of the Sarbanes-Oxley Act (15 U.S.C. 7262(b)) by the registered public accounting firm that prepared or issued itsaudit report. ☒
Indicate by check mark whether the Registrant is a shell company (as defined in Rule 12b-2 of the Exchange Act). Yes ☐ No ☒The aggregate market value of Class B exchangeable limited partnership units held by non-affiliates of the registrant on June 30, 2020, computed by
reference to the closing price for such units on the Toronto Stock Exchange on such date, was C$902,302,015.
The number of the registrant’s Class B exchangeable limited partnership units and Class A common units outstanding as of February 15, 2021 was155,113,338 units and 202,006,067 units, respectively.
DOCUMENTS INCORPORATED BY REFERENCE:
Portions of the definitive proxy statement of Restaurant Brands International Inc., the registrant’s general partner, for the 2021 Annual General Meeting ofShareholders of Restaurant Brands International Inc., which is to be filed no later than 120 days after December 31, 2020, are incorporated by reference into Part
III of this Form 10-K.

Table of Contents
RESTAURANT BRANDS INTERNATIONAL LIMITED PARTNERSHIP
2020 FORM 10-K ANNUAL REPORT
TABLE OF CONTENTS
Page
PART IItem 1. Business 4Item 1A. Risk Factors 11Item 1B. Unresolved Staff Comments 22Item 2. Properties 24Item 3. Legal Proceedings 24Item 4. Mine Safety Disclosure 24
PART IIItem 5. Market for Registrant’s Common Equity, Related Stockholder Matters and Issuer Purchases of Equity Securities 25Item 6. Selected Financial Data 27Item 7. Management’s Discussion and Analysis of Financial Condition and Results of Operations 30Item 7A. Quantitative and Qualitative Disclosures About Market Risk 46Item 8. Financial Statements and Supplementary Data 53Item 9. Changes in and Disagreements with Accountants on Accounting and Financial Disclosure 107Item 9A. Controls and Procedures 107Item 9B. Other Items 107
PART IIIItem 10. Directors, Executive Officers and Corporate Governance 108Item 11. Executive Compensation 108Item 12. Security Ownership of Certain Beneficial Owners and Management and Related Stockholder Matters 108Item 13. Certain Relationships and Related Transactions, and Director Independence 109Item 14. Principal Accounting Fees and Services 109
PART IVItem 15. Exhibits and Financial Statement Schedules 110Item 16. Form 10-K Summary 117
Tim Hortons® and Timbits® are trademarks of Tim Hortons Canadian IP Holdings Corporation. Burger King® and BK® are trademarks of BurgerKing Corporation. Popeyes®, Popeyes Louisiana Kitchen® and Popeyes Chicken & Biscuits® are trademarks of Popeyes Louisiana Kitchen, Inc. Unless thecontext otherwise requires, all references to “we”, “us”, “our” and “Partnership” refer to Restaurant Brands International Limited Partnership and itssubsidiaries.
2

Table of Contents
Explanatory Note
We are a subsidiary of Restaurant Brands International Inc. (“RBI”) and the indirect parent of The TDL Group Corp. (“Tim Hortons”), Burger KingCorporation (“Burger King”) and Popeyes Louisiana Kitchen, Inc. (“Popeyes”). RBI is our sole general partner and owns all of our outstanding Class A commonunits (“Class A common units”). RBI has the exclusive right, power and authority to manage, control, administer and operate the business and affairs and to makedecisions regarding the undertaking and business of Restaurant Brands International Limited Partnership (“Partnership”) in accordance with the partnershipagreement of Partnership (the “partnership agreement”) and applicable laws. There is no board of directors of Partnership. RBI has established a conflictscommittee composed entirely of “independent directors” (as such term is defined in the partnership agreement) in order to consent to, approve or direct variousenumerated actions on behalf of RBI (in its capacity as our general partner) in accordance with the terms of the partnership agreement.
Pursuant to Rule 12g-3(a) under the Securities Exchange Act of 1934, as amended (the “Exchange Act”), Partnership is a successor issuer to Burger KingWorldwide, Inc. The Class B exchangeable limited partnership units of Partnership (the “Partnership exchangeable units”) are deemed to be registered underSection 12(g) of the Exchange Act, and we are subject to the informational requirements of the Exchange Act and the rules and regulations promulgatedthereunder. The Partnership exchangeable units trade on the Toronto Stock Exchange under the ticker symbol “QSP”. RBI’s common shares trade on the NewYork Stock Exchange and the Toronto Stock Exchange under the ticker symbol “QSR”.
We are a reporting issuer in each of the provinces and territories of Canada and, as a result, are subject to Canadian continuous disclosure and otherreporting obligations under applicable Canadian securities laws. Pursuant to an application for exemptive relief made in accordance with National Policy 11-203– Process for Exemptive Relief Applications in Multiple Jurisdictions, we have received exemptive relief dated October 31, 2014 from the Canadian securitiesregulators. This exemptive relief exempts us from the continuous disclosure requirements of NI 51-102, effectively allowing us to satisfy our Canadian continuousdisclosure obligations by relying on the Canadian continuous disclosure documents filed by RBI, for so long as certain conditions are satisfied. Among theseconditions is a requirement that we concurrently send to all holders of Partnership exchangeable units all disclosure materials that RBI sends to its shareholdersand a requirement that we separately report all material changes in respect of Partnership that are not also material changes in respect of RBI.
All references to “$” or “dollars” in this report are to the currency of the United States unless otherwise indicated. All references to “Canadian dollars” or“C$” are to the currency of Canada unless otherwise indicated.
3
Table of Contents
Part I
Item 1. Business
Company Overview
We are a Canadian limited partnership that serves as the indirect holding company for Tim Hortons, Burger King and Popeyes and their consolidatedsubsidiaries. We are a subsidiary of RBI, our sole general partner. We are one of the world’s largest quick service restaurant (“QSR”) companies withapproximately $31 billion in system-wide sales and approximately 27,000 restaurants in more than 100 countries as of December 31, 2020. Our Tim Hortons®,Burger King® and Popeyes® brands have similar franchise business models with complementary daypart mixes and product platforms. Our three iconic brands aremanaged independently while benefiting from global scale and sharing of best practices. As of December 31, 2020, approximately 100% of total restaurants foreach of our brands was franchised and references to "our restaurants" or "system-wide restaurants" include franchised restaurants and those owned by us("Company restaurants").
Our business generates revenue from the following sources: (i) franchise revenues, consisting primarily of royalties based on a percentage of sales reportedby franchise restaurants and franchise fees paid by franchisees; (ii) property revenues from properties we lease or sublease to franchisees; and (iii) sales atCompany restaurants. In addition, our Tim Hortons business generates revenue from sales to franchisees related to our supply chain operations, includingmanufacturing, procurement, warehousing and distribution, as well as sales to retailers.
Our Tim Hortons® Brand
Founded in 1964, Tim Hortons (“TH”) is one of the largest donut/coffee/tea restaurant chains in North America and the largest in Canada as measured bytotal number of restaurants. As of December 31, 2020, we owned or franchised a total of 4,949 TH restaurants. TH restaurants are quick service restaurants with amenu that includes premium blend coffee, tea, espresso-based hot and cold specialty drinks, fresh baked goods, including donuts, Timbits®, bagels, muffins,cookies and pastries, grilled paninis, classic sandwiches, wraps, soups and more.
Our Burger King® Brand
Founded in 1954, Burger King (“BK”) is the world’s second largest fast food hamburger restaurant (“FFHR”) chain as measured by total number ofrestaurants. As of December 31, 2020, we owned or franchised a total of 18,625 BK restaurants in more than 100 countries. BK restaurants are quick servicerestaurants that feature flame-grilled hamburgers, chicken and other specialty sandwiches, french fries, soft drinks and other food items.
Our Popeyes® Brand
Founded in 1972, Popeyes (“PLK”) is the world’s second largest quick service chicken concept as measured by total number of restaurants. As ofDecember 31, 2020, we owned or franchised a total of 3,451 PLK restaurants. PLK restaurants are quick service restaurants that distinguish themselves with aunique “Louisiana” style menu featuring fried chicken, chicken tenders, fried shrimp and other seafood, red beans and rice and other regional items.
COVID-19 Response
The global crisis resulting from the spread of coronavirus (“COVID-19”) has had a substantial impact on our global restaurant operations for 2020. During2020, some TH, BK and PLK restaurants were temporarily closed in certain countries and many of the restaurants that remained open had limited operations, suchas drive-thru, takeout and delivery (where applicable). As a result of the COVID-19 pandemic, we have enhanced our standards regarding hand washing,sanitization, health and hygiene, and contact-less procedures. Additionally, changes in consumer behavior due to the pandemic increased our focus on the use oftechnology to meet our guests’ rapidly-evolving needs through the expansion of the number of restaurants offering delivery, the improvement of our mobile appguest experience, and the evolution of the Tims Rewards program to increase digital registration and begin extending personalized offers. Our operating resultssubstantially depend upon our franchisees’ sales volumes, restaurant profitability, and financial stability. The financial impact of COVID-19 has had an adverseeffect on many of our franchisees’ liquidity and we have worked closely with our franchisees to monitor and assist them with access to appropriate sources ofliquidity in order to sustain their businesses throughout this crisis, such as offering rent relief programs for eligible franchisees who lease property from us. We alsoprovided cash flow support in 2020 by extending loans to eligible BK franchisees in the U.S. and by advancing certain cash payments to eligible TH franchisees inCanada.
4

Table of Contents
Our Business Strategy
We believe that we have created a financially strong company built upon a foundation of three thriving, independent brands with significant global growthpotential and the opportunity to be one of the most efficient franchised QSR operators in the world through our focus on the following strategies:
• accelerating net restaurant growth;• enhancing guest service and experience at our restaurants through comprehensive training, improved restaurant operations, reimaged restaurants
and appealing menu options;• increasing restaurant sales and profitability which are critical to the success of our franchise partners and our ability to grow our brands around
the world;• strengthening drive thru and delivery channels to provide guests convenient access to our product offerings;• utilizing technological and digital initiatives, including loyalty programs, to interact with our guests and modernize the operations of our
restaurants;• efficiently managing costs and sharing best practices; and• preserving the rich heritage of each of our brands by managing them and their respective franchisee relationships independently and continuing
to play a prominent role in local communities.Operating Segments
Our business consists of three operating segments, which are also our reportable segments: (1) TH; (2) BK; and (3) PLK. Additional financial informationabout our reportable segments can be found in “Management’s Discussion and Analysis of Financial Condition and Results of Operations.”
Restaurant Development
As part of our development approach for our brands in the U.S., we have granted limited development rights in specific areas to franchisees in connectionwith area development agreements. We expect to enter into similar arrangements in 2021 and beyond. In Canada, we have not granted exclusive or protected areasto BK or TH franchisees, with limited exceptions.
As part of our international growth strategy for all of our brands, we have established master franchise and development agreements in a number of markets.We have also created strategic master franchise joint ventures in which we received a meaningful minority equity stake in each joint venture. We will continue toevaluate opportunities to accelerate international development of all three of our brands, including through the establishment of master franchises with exclusivedevelopment rights and joint ventures with new and existing franchisees.
Advertising and Promotions
In general, franchisees fund substantially all of the marketing programs for each of our brands by making contributions ranging from 2.0% to 5.0% of grosssales to advertising funds managed by us or by the franchisees. Advertising contributions are used to pay for expenses relating to marketing, advertising andpromotion, including market research, production, advertising costs, sales promotions, social media campaigns, technology initiatives and other support functionsfor the respective brands.
We manage the advertising funds for each of our brands in the U.S. and Canada, as well as in certain other markets for BK. However, in many internationalmarkets, including the markets managed by master franchisees, franchisees make contributions into franchisee-managed advertising funds. As part of our globalmarketing strategy, we provide franchisees with advertising support and guidance in order to deliver a consistent global brand message.
Product Development
New product development is a key driver of the long-term success of our brands. We believe the development of new products can drive traffic byexpanding our customer base, allowing restaurants to expand into new dayparts, and continuing to build brand leadership in food quality and taste. Based on guestfeedback, we drive product innovation in order to satisfy the needs of our guests around the world. This strategy will continue to be a focus in 2021 and beyond.
Operations Support
Our operations strategy is designed to deliver best-in-class restaurant operations by our franchisees and to improve friendliness, cleanliness, speed of serviceand overall guest satisfaction. Each of our brands has uniform operating standards and specifications relating to product quality, cleanliness and maintenance of thepremises. In addition, our restaurants are required to be operated in accordance with quality assurance and health standards that each brand has established, as wellas standards set by applicable governmental laws and regulations, including new local, provincial and state laws regarding COVID-19 and Center for Disease
5

Table of Contents
Control and similar health authority guidelines. Each franchisee typically participates in initial and ongoing training programs to learn all aspects of operating arestaurant in accordance with each brand’s operating standards.
Manufacturing, Supply and Distribution
In general, we approve the manufacturers of the food, packaging, equipment and other products used in restaurants for each of our brands. We have acomprehensive supplier approval process, which requires all food and packaging products to pass our quality standards and the suppliers’ manufacturing processand facilities to pass on-site food safety inspections. Our franchisees are required to purchase substantially all food and other products from approved suppliers anddistributors.
TH products are sourced from a combination of third-party suppliers and our own manufacturing facilities. To protect our proprietary blends, we operate twocoffee roasting facilities in Ancaster, Ontario and Rochester, New York, where we blend all of the coffee for our TH restaurants and, where practical, for our takehome, packaged coffee. Our fondant and fills manufacturing facility in Oakville, Ontario produces, and is the primary supplier of, the ready-to-use glaze, fondants,fills and syrups which are used in a number of TH products. As of December 31, 2020, we have only one or a few suppliers to service each category of productssold at our restaurants.
We sell most raw materials and supplies, including coffee, sugar, paper goods and other restaurant supplies, to TH restaurants in Canada and the U.S. Wepurchase those raw materials from multiple suppliers and generally have alternative sources of supply for each. While we have multiple suppliers for coffee fromvarious coffee-producing regions, the available supply and price for high-quality coffee beans can fluctuate dramatically. Accordingly, we monitor world marketconditions for green (unroasted) coffee and contract for future supply volumes to obtain expected requirements of high-quality coffee beans at acceptable prices.
Our TH business has significant supply chain operations, including procurement, warehousing and distribution, to supply paper, dry goods, frozen goods andrefrigerated products to a substantial majority of our Canadian restaurants. We act as a distributor to TH restaurants in Canada through nine distribution centerslocated in Canada, of which five are company-owned, including three warehouses that were newly built or renovated and opened in 2020, and cover approximately90% of the volume. We own or lease a significant number of trucks and trailers that regularly deliver to most of our Canadian restaurants. In the U.S., we supplysimilar products to restaurants through third-party distributors.
All of the products used in our BK and PLK restaurants are sourced from third-party suppliers. In the U.S. and Canada, there is a purchasing cooperative foreach brand that negotiates the purchase terms for most equipment, food, beverages (other than branded soft drinks which we negotiate separately under long-termagreements) and other products used in BK and PLK restaurants. The purchasing agent is also authorized to purchase and manage distribution services on behalf ofmost of the BK and PLK restaurants in the U.S. and Canada. PLK also utilizes exclusive suppliers for certain of its proprietary products. As of December 31, 2020,four distributors serviced approximately 92% of BK restaurants in the U.S. and five distributors serviced approximately 92% of PLK restaurants in the U.S.
In 2000, Burger King Corporation entered into long-term exclusive contracts with The Coca-Cola Company and Dr Pepper/Snapple, Inc. to supply BKrestaurants with their products and which obligate restaurants in the U.S. to purchase a specified number of gallons of soft drink syrup. These volume commitmentsare not subject to any time limit. As of December 31, 2020, we estimate that it will take approximately 6.6 years to complete the Coca-Cola purchase commitmentand approximately 9.9 years to complete the Dr Pepper/Snapple, Inc. purchase commitment. If these agreements were terminated, we would be obligated to pay anaggregate amount equal to approximately $343 million as of December 31, 2020 based on an amount per gallon for each gallon of soft drink syrup remaining in thepurchase commitments, interest and certain other costs. We have also entered into long-term beverage supply arrangements with certain major beverage vendorsfor the TH and PLK brands in the U.S. and Canada.
Franchise Agreements and Other Arrangements
General. We grant franchisees the right to operate restaurants using our trademarks, trade dress and other intellectual property, uniform operatingprocedures, consistent quality of products and services and standard procedures for inventory control and management. For each franchise restaurant, we generallyenter into a franchise agreement covering a standard set of terms and conditions. Recurring fees consist of periodic royalty and advertising payments. Franchiseesreport gross sales on a monthly or weekly basis and pay royalties based on gross sales.
Franchise agreements are generally not assignable without our consent. In Canada and the U.S., our TH franchise agreements grant us the right to reacquire arestaurant under certain circumstances, and our BK and PLK franchise agreements generally provide us a right of first refusal if a franchisee proposes to sell arestaurant. Defaults (including non-payment of royalties or advertising contributions, or failure to operate in compliance with our standards) can lead to terminationof the franchise agreement.
U.S. and Canada. TH franchisees in the U.S. and Canada operate under several types of license agreements, with a typical term for a standard restaurant of10 years plus renewal period(s) of 10 years in the aggregate for Canada and a typical term of 20 years for
6
Table of Contents
the U.S. TH franchisees who lease land and/or buildings from us typically pay a royalty of 3.0% to 4.5% of weekly restaurant gross sales. Our license agreementscontemplate a one-time franchise fee which must be paid in full before the restaurant opens for business and upon the grant of an additional term. Under a separatelease or sublease, TH franchisees typically pay monthly rent based on the greater of a fixed monthly payment and contingent rental payments based on apercentage (usually 8.5% to 10.0%) of monthly gross sales or flow through monthly rent based on the terms of an underlying lease. Where the franchisee owns thepremises, leases it from a third party or enters into a flow through lease with TH, the royalty is typically increased. In addition, the royalty rates under licenseagreements entered into in connection with non-standard restaurants, including self-serve kiosks and strategic alliances with third parties, may vary from thosedescribed above and are negotiated on a case-by-case basis.
The typical BK and PLK franchise agreement in the U.S. and Canada has a 20-year term and contemplates a one-time franchise fee plus an additional feeupon renewal. Subject to the incentive programs described below, most new BK franchise restaurants in the U.S. and Canada pay a royalty on gross sales of 4.5%and most PLK restaurants in the U.S. and Canada pay a royalty on gross sales of 5.0%. BK franchise agreements typically provide for a 20-year renewal term, andPLK franchise agreements typically provide for two 10-year renewal terms. In addition, PLK franchisees pay a technology fee on all digital sales through ourproprietary technology.
In an effort to improve the image of our BK restaurants in the U.S., we offered U.S. franchisees reduced up-front franchise fees and limited-term royalty andadvertising fund rate reductions to remodel restaurants to our modern image during the past several years and we plan to continue to offer remodel incentives toU.S. franchisees during 2021. These limited-term incentive programs are expected to negatively impact our effective royalty rate until 2027. However, we expectthis impact to be partially mitigated as incentive programs granted in prior years will expire and we will also be entering into new franchise agreements for BKrestaurants in the U.S. with a 4.5% royalty rate. For PLK, we offer development incentive programs pursuant to which we encourage veterans, women orminorities to become PLK franchisees and develop and open new restaurants.
International. As part of the international growth strategy for each of our brands, we have entered into master franchise agreements or developmentagreements that grant franchisees exclusive or non-exclusive development rights and, in some cases, allow them to sub-franchise or require them to providesupport services to other franchisees in their markets. In 2020, we entered into master franchise agreements for the TH brand in the Middle East, including UnitedArab Emirates, Qatar, Kuwait, Bahrain, Oman and Saudi Arabia, and for the BK brand in Switzerland and in Scandinavia, including Norway, Sweden andDenmark. The franchise fees, royalty rate and advertising contributions, if applicable, paid by master franchisees or developers vary from country to country,depending on the facts and circumstances of each market. We expect to continue implementing similar arrangements for our brands in 2021 and beyond.
Franchise Restaurant Leases. We leased or subleased 3,586 properties to TH franchisees, 1,449 properties to BK franchisees, and 81 properties to PLKfranchisees as of December 31, 2020 pursuant to separate lease agreements with these franchisees. For properties that we lease from third-party landlords andsublease to franchisees, our leases generally provide for fixed rental payments and may provide for contingent rental payments based on a restaurant’s annual grosssales. Franchisees who lease land only or land and building from us do so on a “triple net” basis. Under these triple net leases, the franchisee is obligated to pay allcosts and expenses, including all real property taxes and assessments, repairs and maintenance and insurance.
Intellectual Property
We own valuable intellectual property relating to our brands, including trademarks, service marks, patents, industrial designs, copyrights, trade secrets andother proprietary information, some of which are of material importance to our TH, BK and PLK businesses. The duration of trademarks and service marks variesby country, however, trademarks and service marks generally are valid and may be renewed as long as they are in use and/or properly registered. We haveestablished the standards and specifications for most of the goods and services used in the development, improvement and operation of our restaurants. Theseproprietary standards, specifications and restaurant operating procedures are our trade secrets. Additionally, we own certain patents and industrial designs ofvarying duration relating to equipment and packaging used in BK and TH restaurants.
Information Systems and Digital Technology
Our corporate financial, human resources and similar systems are fully integrated across our brands and provide a solid foundation for our business. Ourrestaurant information systems are provided by a set of approved third-party vendors that provide point of sale software. Depending on the region, these vendorsmay also provide labor scheduling, inventory, production management, and cash control services. We have an architecture that enables us to build customcustomer-facing applications and integrate them with our third-party providers, to support mobile ordering, web ordering, and kiosks. As of the end of 2020, wehave deployed this architecture in the U.S., Canada and the U.K., and we plan to deploy it to additional markets in the future.
During 2020, the use of our mobile apps and digital technologies expanded significantly and we were able to provide our guests added convenience byincreasing the number of home market restaurants offering third party and white label delivery. Further, we are modernizing the drive-thru experience with therollout of outdoor digital menu boards for all three brands in their home markets. We plan to leverage our technology capabilities to continue to expand the choicesfor how customers order, pay and receive their food.
7
Table of Contents
Although many of our systems are provided through third parties, we have the ability to obtain transaction-level data from most of our franchised restaurantsand from Company restaurants. This allows us to assess how our new and existing products are performing around the world. Additionally, we have beeninvesting to upgrade our supply chain systems and improve efficiency. We expect to continue to invest in technology capabilities to support and drive our business.
Competition
Each of our brands competes in the U.S., Canada and internationally with many well-established food service companies on the basis of product choice,quality, affordability, service and location. With few barriers to entry to the restaurant industry, our competitors include a variety of independent local operators, inaddition to well-capitalized regional, national and international restaurant chains and franchises, and new competitors may emerge at any time. We also competefor consumer dining dollars with national, regional and local (i) quick service restaurants that offer alternative menus, (ii) casual and “fast casual” restaurant chains(iii) convenience stores and grocery stores, and (iv) new concepts, such as virtual brands and dark kitchens. Furthermore, delivery aggregators and other fooddelivery services provide consumers with convenient access to a broad range of competing restaurant chains and food retailers, particularly in urban areas.
Government Regulations and Affairs
General. We and our franchisees are subject to various laws and regulations including (i) licensing and regulation relating to health, food preparation,sanitation and safety standards and, for our distribution business, traffic and transportation regulations; (ii) information security, privacy and consumer protectionlaws; and (iii) other laws regulating the design, accessibility and operation of facilities, such as the Americans with Disabilities Act of 1990, the Accessibility forOntarians with Disabilities Act and similar Canadian federal and provincial legislation that can have a significant impact on our franchisees and our performance.These regulations include food safety regulations, including supervision by the U.S. Food and Drug Administration and its international equivalents, which governthe manufacture, labeling, packaging and safety of food. In addition, we are or may become subject to legislation or regulation seeking to tax and/or regulate high-fat, high-calorie and high-sodium foods, particularly in Canada, the U.S., the United Kingdom and Spain. Certain countries, provinces, states and municipalitieshave approved menu labeling legislation that requires restaurant chains to provide caloric information on menu boards, and menu labeling legislation has also beenadopted on the U.S. federal level as well as in Ontario.
U.S. and Canada. Our restaurants must comply with licensing requirements and regulations by a number of governmental authorities, which include zoning,health, safety, sanitation, building and fire agencies in the jurisdiction in which the restaurant is located. We and our franchisees are also subject to variousemployment laws, including laws governing union organizing, working conditions, work authorization requirements, health insurance, overtime and wages. Inaddition, we and our U.S. franchisees are subject to the Patient Protection and Affordable Care Act.
We are subject to federal franchising laws adopted by the U.S. Federal Trade Commission (the “FTC”) and state and provincial franchising laws. Much ofthe legislation and rules adopted have been aimed at providing detailed disclosure to a prospective franchisee, duties of good faith as between the franchisor andthe franchisee, and/or periodic registration by the franchisor with applicable regulatory agencies. Additionally, some U.S. states have enacted or are consideringenacting legislation that governs the termination or non-renewal of a franchise agreement and other aspects of the franchise relationship.
International. Internationally, we and our franchisees are subject to national and local laws and regulations that often are similar in nature to those affectingus and our franchisees in the U.S. and Canada. We and our franchisees are also subject to a variety of tariffs and regulations on imported commodities andequipment, and laws regulating foreign investment.
Environmental. Various laws concerning the handling, storage and disposal of hazardous materials and restaurant waste and the operation of restaurants inenvironmentally sensitive locations may impact aspects of our operations and the operations of our franchisees; however, we do not believe that compliance withapplicable environmental regulations will have a material effect on our capital expenditures, financial condition, results of operations, or competitive position.Increased focus by U.S., Canadian and international governmental authorities on environmental matters is likely to lead to new governmental initiatives,particularly in the area of climate change. While we cannot predict the precise nature of these initiatives, we expect that they may impact our business both directlyand indirectly. There is a possibility that government initiatives, or actual or perceived effect of changes in weather patterns, climate or water resources could havea direct impact on the operations of our brands in ways that we cannot predict at this time.
Sustainability
We are committed to the simple principle of doing what’s right. Our “Restaurant Brands for Good” plan provides a framework for serving our guests the foodand drinks they love while contributing to a sustainable future and having a positive social impact in the communities we serve. Our ongoing efforts will focus onthree key pillars:
8

Table of Contents
• Food - serving high quality and great tasting food every day with a focus on food safety, improving choice, nutrition, transparency, andingredients;
• Planet - continuing to reduce our environmental footprint, with a focus on packaging and recycling, green buildings, and responsible sourcing;and
• People & Communities - supporting communities and enhancing livelihoods, with a focus on supporting communities, talent development,diversity and inclusion, ethics and human rights, and improving supplier livelihoods.
The sustainability section of our corporate website sets forth our initiatives with respect to these pillars and will be updated periodically.
Seasonal Operations
Our restaurant sales are typically higher in the spring and summer months when the weather is warmer and typically lowest during the winter months.Furthermore, adverse weather conditions can have material adverse effects on restaurant sales. The timing of holidays may also impact restaurant sales. Becauseour businesses are moderately seasonal, results for any one quarter are not necessarily indicative of the results that may be achieved for any other quarter or for thefull fiscal year.
Human Capital
As of December 31, 2020, we had approximately 5,200 employees, including approximately 1,400 corporate employees in our restaurant support centers andserving our franchisees from the field, approximately 1,100 employees in our distribution centers and manufacturing facilities, and approximately 2,700 employeesin Company restaurants. Our franchisees are independent business owners that separately employ more than 500,000 team members in their restaurants.
At RBI, we strive to create a workplace environment where our employees love coming to work each day; a place that is committed to inclusion, respect,accountability and doing what is right. While our board regularly receives updates from our People team, the compensation committee has oversight of ourcompensation program and the audit committee has been tasked with oversight of workforce management risks. Our People team is organized into four pillars thatfocus on attracting, retaining, developing and rewarding top talent.
The cycle starts with attracting talent from campus and professional sources, leveraging technology to identify and assess candidates who best fit our roles.As part of our hiring process, we committed in June 2020 that at least half of all final-round candidates interviewing for roles with our four RBI restaurant supportcenters will be from groups that are demonstrably diverse, including gender, race and sexual orientation, based on the composition and requirements of theapplicable jurisdiction. Since our commitment, we have meaningfully exceeded that target, leading to an increase in diverse hires. In 2020, RBI hiredapproximately 330 new corporate employees, 3,600 new restaurant employees, and 380 new distribution and manufacturing employees. Our distribution teamworked diligently to open three new or renovated facilities to serve Tim Hortons restaurants in 2020, contributing to the hiring increase amongst that population.Each population segment has a dedicated onboarding program designed to get employees up to speed quickly, and foster a smooth transition into the workplace.
The retention efforts focus on the work environment, employee engagement and our diversity and inclusion initiatives. We regularly conduct anonymoussurveys to seek feedback from our restaurant support center employees on a variety of topics, including our sustainability and diversity initiatives, implicit biastraining globally, how they are coping working from home during the COVID-19 pandemic, the support they receive from their managers, and what types oflearning and development opportunities they would like to have offered. In 2019, we created a diversity and inclusion steering committee that is creating strategiesfor promoting diversity and inclusion. To ensure that the work of the Steering Committee is fully integrated, we have dedicated team members within the peopleand legal teams to implement initiatives in this space.
Developing talent includes evaluation, training, career planning and leadership development. We have a rigorous talent assessment process for restaurantsupport center employees built on specific competencies that we assess at both the employee and job level. This data allows us to more easily identify potentialsuccessors and illuminate potential opportunities for our employees in a more objective and unbiased way. Additionally, to help our employees and franchisee’steam members succeed in their roles, we emphasize continuous training and development opportunities. These include, but are not limited to, safety and securityprotocols, updates on new products and service offerings and deployment of technologies. In 2020, we piloted a new coaching program for women in ourrestaurant support centers to be paired with senior leaders to work on goal setting and building paths to achieve those goals and we expect to continue theseinitiatives.
Our approach to rewarding talent is through a combination of compensation, recognition, wellness and benefits. We are committed to providing market-competitive pay and benefits, affirming our pay for performance philosophy while balancing retention risk. Restaurant support center and distribution employeesare eligible for performance-based cash incentive programs. Each incentive
9
Table of Contents
plan reinforces and rewards individuals for achievement of specific business goals. All employees are also able to access telemedicine with no copay, as well as a24/7 Employee Assistance Program. For corporate office and field-based employees, we offer a leading parental leave policy.
Underpinning all of these initiatives is a strong reliance on data. We leverage a people analytics team and a newly implemented human capital managementsystem to assess our achievements in each of our four pillars to identify areas for improvement. A team of experienced People Business Partners work closely withtheir client groups to provide counsel on people issues and help roll out people initiatives directly to employees.
While much of the work mentioned above relates to our corporate workforce, we also have adopted employee guidelines and policies applicable to ourrestaurant employees and encourage our franchisees to adopt similar guidelines and policies.
Available Information
We make available free of charge on or through the Investor Relations section of our internet website at www.rbi.com, all materials that we fileelectronically with the Securities and Exchange Commission (the “SEC”), including this annual report on Form 10-K, quarterly reports on Form 10-Q, currentreports on Form 8-K and any amendments to those reports as soon as reasonably practicable after electronically filing or furnishing such material with the SEC andwith the Canadian Securities Administrators. This information is also available at www.sec.gov, an internet site maintained by the SEC that contains reports, proxyand information statements and other information regarding issuers that file electronically with the SEC, and on the System for Electronic Document Analysis andRetrieval (“SEDAR”) at www.sedar.com, a website maintained by the Canadian Securities Administrators. The references to our website address, the SEC’swebsite address and the website maintained by the Canadian Securities Administrators do not constitute incorporation by reference of the information contained inthese websites and should be not considered part of this document.
A copy of our Corporate Governance Guidelines, Code of Business Ethics and Conduct for Non-Restaurant Employees, Code of Ethics for ExecutiveOfficers, Code of Conduct for Directors and the Charters of the Audit Committee, Compensation Committee, Nominating and Corporate Governance Committee,Conflicts Committee and Operations and Strategy Committee of the board of directors of RBI are posted in the Investor Relations section of RBI’s website atwww.rbi.com.
Our principal executive offices are located at 130 King Street West, Suite 300, Toronto, Ontario M5X 1E1, Canada. Our telephone number is (905) 339-6011.
10
Table of Contents
Item 1A. Risk Factors
Risks Related to Our Business Operations
We face intense competition in our markets, which could negatively impact our business.
The restaurant industry is intensely competitive and we compete with many well-established food service companies on the basis of product choice, quality,affordability, service and location. With few barriers to entry, our competitors include a variety of independent local operators, in addition to well-capitalizedregional, national and international restaurant chains and franchises, and new competitors, such as virtual brands and dark kitchens, may emerge at any time.Furthermore, delivery aggregators and food delivery services provide consumers with convenient access to a broad range of competing restaurant chains and foodretailers, particularly in urbanized areas, and may form a closer relationship with our customers and increase costs. Each of our brands also competes for qualifiedfranchisees, suitable restaurant locations and management and personnel.
Our ability to compete will depend on the success of our plans to effectively respond to consumer preferences, improve existing products, develop and roll-out new products, and manage the complexity of restaurant operations as well as the impact of our competitors’ actions. In addition, our long-term success willdepend on our ability to strengthen our customers' digital experience through mobile ordering, delivery, loyalty programs, and social interaction. Some of ourcompetitors have substantially greater financial resources, higher revenues and greater economies of scale than we do. These advantages may allow them toimplement their operational strategies more quickly or effectively than we can or benefit from changes in technologies, which could harm our competitive position.These competitive advantages may be exacerbated in a difficult economy, thereby permitting our competitors to gain market share. We may be unable tosuccessfully respond to changing consumer preferences, including with respect to new technologies and alternative methods of delivery. In addition, onlineplatforms and aggregators may direct potential customers to other options based on paid placements, online reviews or other factors. If we are unable to maintainour competitive position, we could experience lower demand for products, downward pressure on prices, reduced margins, an inability to take advantage of newbusiness opportunities, a loss of market share, reduced franchisee profitability and an inability to attract qualified franchisees in the future.
Failure to preserve the value and relevance of our brands could negatively impact our financial results.
We depend in large part on the value of the TH, BK and PLK brands. To be successful in the future, we must preserve, enhance and leverage the value of ourbrands. Brand value is based in part on consumer tastes, preferences and perceptions on a variety of factors, including the nutritional content, methods ofproduction and preparation of our products and our business practices, including with respect to animal welfare, sustainability and other environmental or socialconcerns. Consumer acceptance of our products may be influenced by or subject to change for a variety of reasons. For example, adverse publicity associated withnutritional, health and other scientific studies and conclusions, which constantly evolve and often have contradictory implications, may drive popular opinionagainst quick service restaurants in general, which may impact the demand for our products. Moreover, health campaigns against products we offer in favor offoods that are perceived as healthier may affect consumer perception of our product offerings and impact the value of our brands.
In addition, adverse publicity related to litigation, regulation (including initiatives intended to drive consumer behavior) or incidents involving us, ourfranchisees, competitors or suppliers may impact the value of our brands by discouraging customers from buying our products. Perceptions may also be affected byactivist campaigns to promote adverse perceptions of the quick service restaurant industry or our brands and/or our operations, suppliers, franchisees or otherpartners such as campaigns aimed at sustainability or living-wage opinions. Consumer demand for our products and our brand equity could diminish if we, ouremployees or our franchisees or other business partners fail to preserve the quality of our products, act or are perceived to act as unethical, illegal, racially-biasedor in a socially irresponsible manner, including with respect to the sourcing, content or sale of our products or the use of consumer data for general or directmarketing or other purposes, fail to comply with laws and regulations, publicly take controversial positions or actions or fail to deliver a consistently positiveconsumer experience in each of our markets. If we are unsuccessful in addressing consumer adverse perceptions, our brands and our financial results may suffer.
Economic conditions have and may continue to adversely affect consumer discretionary spending which could negatively impact our business andoperating results.
We believe that our restaurant sales, guest traffic and profitability are strongly correlated to consumer discretionary spending, which is influenced by generaleconomic conditions, unemployment levels, the availability of discretionary income and, ultimately, consumer confidence. For example, the COVID-19 pandemichas resulted in significant increases in unemployment and a reduction in discretionary spending. A protracted economic slowdown, increased unemployment andunderemployment of our customer base, decreased salaries and wage rates, inflation, rising interest rates or other industry-wide cost pressures adversely affectconsumer behavior by weakening consumer confidence and decreasing consumer spending for restaurant dining occasions. Governmental or other responses toeconomic challenges may be unable to restore or maintain consumer confidence. As a result of these factors, during
11

Table of Contents
recessionary periods we and our franchisees may experience reduced sales and profitability, which may cause our business and operating results to suffer.
Our results can be adversely affected by unforeseen events, such as adverse weather conditions, natural disasters, terrorist attacks or threats, pandemics,such as the COVID-19 pandemic, or other catastrophic events.
Unforeseen events, such as adverse weather conditions, natural disasters or catastrophic events, can adversely impact restaurant sales. Natural disasters suchas earthquakes, hurricanes, and severe adverse weather conditions and health pandemics whether occurring in Canada, the United States or abroad, can keepcustomers in the affected area from dining out, cause damage to or closure of restaurants and result in lost opportunities for our restaurants.
For example, measures implemented to reduce the spread of COVID-19 have adversely affected workforces, customers, consumer sentiment, economies andfinancial markets, and, along with decreased consumer spending, have led to an economic downturn in many of our markets. As a result of COVID-19, we and ourfranchisees have experienced significant store closures and instances of reduced store-level operations, including reduced operating hours and dining-roomclosures. While many markets have reopened for dine-in guests, the capacity may be limited, and local conditions may lead again to closures or increasedlimitations. As a result of COVID-19, restaurant traffic and system-wide sales have been significantly negatively impacted.
We cannot predict the duration or scope of the COVID-19 pandemic or when operations will cease to be affected by it. Furthermore, we cannot predict theeffects that actual or threatened armed conflicts, terrorist attacks, efforts to combat terrorism, or heightened security requirements will have on our futureoperations. Because a significant portion of our restaurant operating costs are fixed or semi-fixed in nature, the loss of sales during these periods hurts our and ourfranchisees’ operating margins and can result in restaurant operating losses and our loss of royalties. We expect the COVID-19 pandemic to continue to negativelyimpact our financial results and based on the duration and scope, such impact could be material.
Our results depend on effective marketing and advertising and the successful development and launch of new products.
Our revenues are heavily influenced by brand marketing and advertising and by our ability to develop and launch new and innovative products. Ourmarketing and advertising programs may not be successful, or we may fail to develop commercially successful new products, which may adversely affect ourability to attract new guests and retain existing guests, and could materially and adversely affect our results of operations. Moreover, because franchisees contributeto advertising funds based on a percentage of gross sales at their franchise restaurants, advertising fund expenditures are dependent upon sales volumes at system-wide restaurants. If system-wide sales decline, the amount available for our marketing and advertising programs will be reduced. Also, to the extent that we usevalue offerings in our marketing and advertising programs to drive traffic, the low price offerings may condition our guests to resist higher prices in a morefavorable economic environment.
In addition, we continue to focus on transforming the restaurant experience through technology and digital engagement to improve our service model andstrengthen relationships with customers, digital channels, loyalty initiatives, mobile ordering and payment systems and delivery initiatives. These initiatives maynot have the anticipated impact on our franchise sales and therefore we may not fully realize the intended benefits of these significant investments.
The global scope of our business subjects us to risks and costs and may cause our profitability to decline.
Our global operations expose us to risks in managing the differing cultural, regulatory, geopolitical and economic environments in the countries where ourrestaurants operate. These risks, which can vary substantially by market and may increase in importance as our franchisees expand operations in internationalmarkets, are described in many of the risk factors discussed in this section and include the following:
• governmental laws, regulations and policies adopted to manage national economic conditions, such as increases in taxes, austerity measures that impactconsumer spending, monetary policies that may impact inflation rates and currency fluctuations;
• the imposition of import restrictions or controls;• the effects of legal and regulatory changes and the burdens and costs of our compliance with a variety of foreign laws;• changes in the laws and policies that govern foreign investment and trade in the countries in which we operate;• compliance with U.S., Canadian and other anti-corruption and anti-bribery laws, including compliance by our employees, contractors, licensees or agents
and those of our strategic partners and joint ventures;• risks and costs associated with political and economic instability, corruption, anti-American or anti-Canadian sentiment and social and ethnic unrest in the
countries in which we operate;
12
Table of Contents
• the risks of operating in developing or emerging markets in which there are significant uncertainties regarding the interpretation, application andenforceability of laws and regulations and the enforceability of contract rights and intellectual property rights;
• risks arising from the significant and rapid fluctuations in currency exchange markets and the decisions and positions that we take to hedge such volatility;• changing labor conditions and difficulties experienced by our franchisees in staffing their international operations;• the impact of labor costs on our franchisees’ margins given their labor-intensive business model and the long-term trend toward higher wages in both
mature and developing markets and the potential impact of union organizing efforts on day-to-day operations of our franchisees’ restaurants; and• the effects of increases in the taxes we pay and other changes in applicable tax laws.
Our operations are subject to fluctuations in foreign currency exchange and interest rates.
We report our results in U.S. dollars, which is our reporting currency. The operations of TH, BK, and PLK that are denominated in currencies other than theU.S. dollar are translated to U.S. dollars for our financial reporting purposes and are therefore impacted by fluctuations in currency exchange rates and changes incurrency regulations. In addition, fluctuations in interest rates may affect our business. Although we attempt to minimize these risks through geographicdiversification and the utilization of derivative financial instruments, our risk management strategies may not be effective and our results of operations could beadversely affected.
Increases in food and commodity costs or shortages or interruptions in the supply or delivery of our food could harm our operating results and theresults of our franchisees.
Our profitability and the profitability of our franchisees will depend in part on our ability to anticipate and react to changes in food and commodity andsupply costs. With respect to our TH business, volatility in connection with certain key commodities that we purchase in the ordinary course of business can impactour revenues, costs and margins. If commodity prices rise, franchisees may experience reduced sales due to decreased consumer demand at retail prices that havebeen raised to offset increased commodity prices, which may reduce franchisee profitability. In addition, the markets for beef and chicken are subject to significantprice fluctuations due to seasonal shifts, climate conditions, the cost of grain, disease, industry demand, international commodity markets, food safety concerns,product recalls, government regulation and other factors, all of which are beyond our control and, in many instances unpredictable. Such increases in commoditycosts may materially and adversely affect our business and operating results.
We and our franchisees are dependent on frequent deliveries of fresh food products that meet our specifications. Shortages or interruptions in the supply offresh food products caused by unanticipated demand, natural disasters or unforeseen events, such as the COVID-19 pandemic, problems in production ordistribution, inclement weather, delays or restrictions on shipping and/or manufacturing, closures of supplier or distributor facilities or financial distress orinsolvency of suppliers or distributors or other conditions could adversely affect the availability, quality and cost of ingredients, which would adversely affect ouroperating results. As of December 31, 2020, we have only a few distributors that service the most of our BK and PLK operations in the U.S., and our operationscould be adversely affected if any of these distributors were unable to fulfill their responsibilities and we were unable to locate a substitute distributor in a timelymanner.
Our supply chain operations subject us to additional risks and may cause our profitability to decline.
We operate a vertically integrated supply chain for our TH business in which we manufacture, warehouse, and distribute certain food and restaurant suppliesto TH restaurants. Risks associated with this vertical integration growth strategy include:
• delays and/or difficulties associated with, or liabilities arising from, owning a manufacturing, warehouse and distribution business;• maintenance, operations and/or management of the facilities, equipment, employees and inventories;• limitations on the flexibility of controlling capital expenditures and overhead;• the need for skills and techniques that are outside our traditional core expertise;• increased transportation, shipping, food and other supply costs;• inclement weather or extreme weather events;• shortages or interruptions in the availability or supply of high-quality coffee beans, perishable food products and/or their ingredients;• variations in the quality of food and beverage products and/or their ingredients; and• political, physical, environmental, labor, or technological disruptions in our or our suppliers’ manufacturing and/or warehousing plants, facilities, or
equipment.
13

Table of Contents
If we do not adequately address the challenges related to these vertically integrated operations or the overall level of utilization or production decreases forany reason, our results of operations and financial condition may be adversely impacted. Decreased sales from the COVID-19 pandemic may continue to affectsupply chain revenue and profitability. Moreover, interruptions in the availability and delivery of food, beverages and other supplies to our restaurants arising fromshortages or greater than expected demand, may increase costs or reduce revenues. As of December 31, 2020, we have only one or a few suppliers to service eachcategory of products sold at our TH restaurants, and the loss of any one of these suppliers would likely adversely affect our business.
We and our franchisees may be unable to secure desirable restaurant locations to maintain and effectively grow our restaurant portfolios.
The success of any restaurant depends in substantial part on its location. The current locations of our restaurants may not continue to be attractive asdemographic patterns change. Neighborhood or economic conditions where restaurants are located could decline in the future, thus resulting in potentially reducedsales in those locations. Competition for restaurant locations can also be intense and there may be delay or cancellation of new site developments by developersand landlords, which may be exacerbated by factors related to the commercial real estate or credit markets. If franchisees cannot obtain desirable locations for theirrestaurants at reasonable prices due to, among other things, higher than anticipated acquisition, construction and/or development costs of new restaurants, difficultynegotiating leases with acceptable terms, onerous land use or zoning restrictions, or challenges in securing required governmental permits, then their ability toexecute their respective growth strategies may be adversely affected.
The market for retail real estate is highly competitive. Based on their size advantage and/or their greater financial resources, some of our competitors mayhave the ability to negotiate more favorable lease terms than we can and some landlords and developers may offer priority or grant exclusivity to some of ourcompetitors for desirable locations. As a result, we or our franchisees may not be able to obtain new leases or renew existing leases on acceptable terms, if at all,which could adversely affect our sales and brand-building initiatives.
Our ownership and leasing of significant amounts of real estate exposes us to possible liabilities, losses, and risks.
Many of our Company and franchised restaurants are located on leased premises. As leases underlying these restaurants expire, we or our franchisees may beunable to negotiate a new lease or lease extension, either on commercially acceptable terms or at all, which could cause us or our franchisees to close restaurants indesirable locations. As a result, our revenues and our brand-building initiatives could be adversely affected. In general, we cannot cancel existing leases; therefore,if an existing or future restaurant is not profitable, and we decide to close it, we may still be committed to perform under the applicable lease. In addition, the valueof our owned real estate assets could decrease, and/or our costs could increase, because of changes in the investment climate for real estate, demographic trends,demand for restaurant sites and other retail properties, and exposure to or liability associated with environmental contamination and reclamation.
Typically, the costs of insurance, taxes, maintenance, utilities, and other property-related costs due under a prime lease with a third-party landlord are passedthrough to the franchisee under our sublease. If a franchisee fails to perform the obligations passed through under the sublease, we will be required to perform theseobligations resulting in an increase in our leasing and operational costs and expenses. In addition, the rent a franchisee pays us under the sublease may be based ona percentage of gross sales. If gross sales at a certain restaurant are less than we project we may pay more rent to a third-party landlord under the prime lease thanwe receive from the franchisee under the sublease. These events could result in increased leasing and operational costs to us.
Food safety concerns and concerns about the health risk of fast food may have an adverse effect on our business.
Food safety is a top priority for us and we dedicate substantial resources to ensure that our customers enjoy safe, high-quality food products. However, food-borne illnesses and other food safety issues have occurred in the food industry in the past and could occur in the future. Also, our reliance on third-party foodsuppliers, distributors and food delivery aggregators increases the risk that food-borne illness incidents could be caused by factors outside of our control and thatmultiple locations would be affected rather than a single restaurant. Any report or publicity, including through social media, linking us or one of our franchisees orsuppliers to instances of food-borne illness or other food safety issues, including food tampering, adulteration or contamination, could adversely affect our brandsand reputation as well as our sales and profits. Such occurrence at restaurants of competitors could adversely affect sales as a result of negative publicity about theindustry generally. The occurrence of food-borne illnesses or food safety issues could also adversely affect the price and availability of affected ingredients, whichcould result in disruptions in our supply chain, significantly increase costs and/or lower margins for us and our franchisees.
Some of our products contain caffeine, dairy products, fats, sugar and other compounds and allergens, the health effects of which are the subject of publicscrutiny, including suggesting that excessive consumption of caffeine, beef, sugar and other compounds can lead to a variety of adverse health effects. Anunfavorable report on the health effects of caffeine or other compounds present in our products, or negative publicity or litigation arising from other health riskssuch as obesity, could significantly reduce the
14
Table of Contents
demand for our beverages and food products. A decrease in customer traffic as a result of these health concerns or negative publicity could materially andadversely affect our brands and our business.
If we are unable to adequately protect our intellectual property, the value of our brands and our business may be harmed.
Our brands, which represent approximately 45% of the total assets on our balance sheet as of December 31, 2020, are very important to our success and ourcompetitive position. We rely on a combination of trademarks, copyrights, service marks, trade secrets, patents, industrial designs, and other intellectual propertyrights to protect our brands and the respective branded products. While we have registered certain trademarks in Canada, the U.S. and foreign jurisdictions, not allof the trademarks that our brands currently use have been registered in all of the countries in which we do business, and they may never be registered in all of thesecountries. We may not be able to adequately protect our trademarks, and our use of these trademarks may result in liability for trademark infringement, trademarkdilution or unfair competition. The steps we have taken to protect our intellectual property in Canada, the U.S. and in foreign countries may not be adequate and wemay, from time to time, be required to institute litigation to enforce our trademarks or other intellectual property rights or to protect our trade secrets. Further, thirdparties may assert or prosecute infringement claims against us. In these cases, our proprietary rights could be challenged, circumvented, infringed or invalidated.Any such litigation could result in substantial costs and diversion of resources and could negatively affect our revenue, profitability and prospects regardless ofwhether we are able to successfully enforce our rights. In addition, the laws of some foreign countries do not protect intellectual property rights to the same extentas the laws of Canada and the U.S.
Changes in regulations may adversely affect restaurant operations and our financial results.
Our restaurants are subject to licensing and regulation by health, sanitation, safety and other agencies in the state, province and/or municipality in which therestaurant is located. Federal, state, provincial and local government authorities have enacted and may enact laws, rules or regulations that impact restaurantoperations and may increase the cost of doing business. In developing markets, we face the risks associated with new and untested laws and judicial systems. If wefail to comply with existing or future laws, we may be subject to governmental fines and sanctions.
We are subject to various provincial, state and foreign laws that govern the offer and sale of a franchise, including in the U.S., to an FTC rule. Variousprovincial, state and foreign laws regulate certain aspects of the franchise relationship, including terminations and the refusal to renew franchises. The failure tocomply with these laws and regulations in any jurisdiction or to obtain required government approvals could result in a ban or temporary suspension on futurefranchise sales, fines and penalties or require us to make offers of rescission or restitution, any of which could adversely affect our business and operating results.We could also face lawsuits by franchisees based upon alleged violations of these laws.
Additionally, we, our franchisees and our supply chain are subject to risks and costs arising from the effects of climate change, greenhouse gases, anddiminishing energy and water resources. These risks include the increased public focus, including by governmental and nongovernmental organizations, on theseand other environmental sustainability matters, such as packaging and waste, animal health and welfare, deforestation and land use. Also, we face increasedpressure to make commitments, set targets or establish additional goals and take actions to meet them which could expose us to market, operational and executioncosts or risks. If we are unable to effectively manage the risks associated with our complex regulatory environment, it could have a material adverse effect on ourbusiness and financial condition.
We outsource certain aspects of our business to third-party vendors which subjects us to risks, including disruptions in our business and increased costs.
We have outsourced certain administrative functions for our business, certain information technology support services and benefit plan administration tothird-party service providers. In the future, we may outsource other functions to achieve cost savings and efficiencies. If the service providers to which weoutsource these functions do not perform effectively, we may not be able to achieve the expected cost savings and may have to incur additional costs in connectionwith such failure to perform. Depending on the function involved, such failures may also lead to business disruption, transaction errors, processing inefficiencies,the loss of sales and customers, the loss of or damage to intellectual property through security breach, and the loss of sensitive data through security breach orotherwise. Any such damage or interruption could have a material adverse effect on our business, cause us to face significant fines, customer notice obligations orcostly litigation, harm our reputation with our customers or prevent us from paying our collective suppliers or employees or receiving payments on a timely basis.
15
Table of Contents
Risks Related to Our Fully Franchised Business Model
Our fully franchised business model presents a number of disadvantages and risks.
Substantially all of our restaurants are owned and operated by franchisees. Under our fully franchised business model, our future prospects depend on (i) ourability to attract new franchisees for each of our brands that meet our criteria and (ii) the willingness and ability of franchisees to open restaurants in existing andnew markets. We may be unable to identify franchisees who meet our criteria, or if we identify such franchisees, they may not successfully implement theirexpansion plans.
Our fully franchised business model presents a number of other drawbacks, such as limited influence over franchisees, limited ability to facilitate changes inrestaurant ownership, limitations on enforcement of franchise obligations due to bankruptcy or insolvency proceedings and reliance on franchisees to participate inour strategic initiatives. While we can mandate certain strategic initiatives through enforcement of our franchise agreements, we will need the active support of ourfranchisees if the implementation of these initiatives is to be successful. The failure of these franchisees to support our marketing programs and strategic initiativescould adversely affect our ability to implement our business strategy and could materially harm our business, results of operations and financial condition. Onoccasion we have encountered, and may in the future encounter, challenges in receiving specific financial and operational results from our franchisees in aconsistent and timely manner, which can negatively impact our business and operating results.
Our principal competitors that have a significantly higher percentage of company-operated restaurants than we do may have greater influence over theirrespective restaurant systems and greater ability to implement operational initiatives and business strategies, including their marketing and advertising programs.
The ability of our franchisees and prospective franchisees to obtain financing for development of new restaurants or reinvestment in existing restaurantsdepends in part upon financial and economic conditions which are beyond their control. If our franchisees are unable to obtain financing on acceptable terms todevelop new restaurants or reinvest in existing restaurants, our business and financial results could be adversely affected.
Our franchisees are also dependent upon their ability to attract and retain qualified employees in an intensely competitive employee market. The inability ofour franchisees to recruit and retain qualified individuals or increased costs to do so, including due to increases in legally required wages, may delay the plannedopenings of new restaurants by our franchisees and could adversely impact existing franchise restaurants and franchisee profitability, which could slow our growth.In addition, the risk or perceived risk of contracting COVID-19 could adversely affect the ability, or the cost, of staffing restaurants, which could be exacerbated tothe extent that we or our franchisees have employees who test positive for the virus. Moreover, we may also face liability for employment-related claims of ourfranchisees’ employees based on theories of joint employer liability with our franchisees or other theories of vicarious liability, which could materially harm ourresults of operations and financial condition.
Our results are closely tied to the success of independent franchisees, and we have limited influence over their operations.
We generate revenues in the form of royalties, fees and other amounts from our franchisees. As a result, our operating results are closely tied to the successof our franchisees. However, our franchisees are independent operators and we cannot control many factors that impact the profitability of their restaurants. Theimpact of COVID-19 has, and is expected to continue to have, an adverse effect on our franchisees’ liquidity. As a result, we provided, where appropriate, cashflow support to franchisees in the U.S. and Canada by extending loans, advancing cash payments and providing rent relief where we have property control, some ofwhich is continuing in 2021. These actions have and may continue to adversely affect our cash flow and financial results. In addition to these actions, we maydecide to take additional steps to assist in the financial stabilization of our franchisees, which could impact our liquidity and our financial results. In addition, wedelayed certain capital expenditure obligations of our franchisees relating to new restaurants, remodels and significant equipment deployments, which couldadversely affect our growth once the COVID-19 pandemic has passed.
If sales trends or economic conditions worsen for franchisees, their financial results may deteriorate, which could result in, among other things, restaurantclosures; delayed or reduced payments to us of royalties, advertising contributions, rents and, delayed or reduced payments for TH products and supplies; and aninability for such franchisees to obtain financing to fund development, restaurant remodels or equipment initiatives on acceptable terms or at all. Also, franchiseesmay not be willing or able to renew their franchise agreements with us due to low sales volumes, high real estate costs, or the failure to secure lease renewals. Ifour franchisees fail to renew their franchise agreements, our royalty revenues may decrease which in turn could materially and adversely affect our business andoperating results.
Franchisees and sub-franchisees may not successfully operate restaurants in a manner consistent with our established procedures, standards and requirementsor standards set by applicable law, including sanitation and pest control standards. Any operational shortcoming of a franchise or sub-franchise restaurant is likelyto be attributed by guests to the entire brand and may be
16

Table of Contents
shared widely through social media, thus damaging the brand’s reputation and potentially affecting our revenues and profitability. We may not be able to identifyproblems and take effective action quickly enough and, as a result, our image and reputation may suffer, and our franchise revenues and results of operations coulddecline.
Our future growth and profitability will depend on our ability to successfully accelerate international development with strategic partners and jointventures.
We believe that the future growth and profitability of each of our brands will depend on our ability to successfully accelerate international development withstrategic partners and joint ventures in new and existing international markets. New markets may have different competitive conditions, consumer tastes anddiscretionary spending patterns than our existing markets. As a result, new restaurants in those markets may have lower average restaurant sales than restaurants inexisting markets and may take longer than expected to reach target sales and profit levels (or may never do so). We will need to build brand awareness in thosenew markets we enter through advertising and promotional activity, and those activities may not promote our brands as effectively as intended, if at all.
We have adopted a master franchise development model for all of our brands, which in markets with strong growth potential may include participating instrategic joint ventures, to accelerate international growth. These new arrangements may give our joint venture and/or master franchise partners the exclusive rightto develop and manage our restaurants in a specific country or countries, including, in some cases, the right to sub-franchise. A joint venture partnership involvesspecial risks, including the following: our joint venture partners may have economic, business or legal interests or goals that are inconsistent with those of the jointventure or us, or our joint venture partners may be unable to meet their economic or other obligations and we may be required to fulfill those obligations alone. Ourmaster franchise arrangements present similar risks and uncertainties. We cannot control the actions of our joint venture partners or master franchisees, includingany nonperformance, default or bankruptcy of joint venture partners or master franchisees. While sub-franchisees are required to operate their restaurants inaccordance with specified operations, safety and health standards, we are not party to the agreements with the sub-franchisees and are dependent upon our masterfranchisees to enforce these standards with respect to sub-franchised restaurants. As a result, the ultimate success and quality of any sub-franchised restaurant restswith the master franchisee and the sub-franchisee. In addition, the termination of an arrangement with a master franchisee or a lack of expansion by certain masterfranchisees has and may in the future result in the delay or discontinuation of the development of franchise restaurants, or an interruption in the operation of ourbrand in a particular market or markets. We may not be able to find another operator to resume development activities in such market or markets. Any such delay,discontinuation or interruption could materially and adversely affect our business and operating results.
Risks Related to our Indebtedness
Our substantial leverage and obligations to service our debt could adversely affect our business.
As of December 31, 2020, we had aggregate outstanding indebtedness of $12,631 million, including senior secured term loan facilities in an aggregateprincipal amount of $6,028 million, senior secured first lien notes in an aggregate principal amount of $2,775 million and senior secured second lien notes in anaggregate principal amount of $3,650 million. Subject to restrictions set forth in these instruments, we may also incur significant additional indebtedness in thefuture, some of which may be secured debt. This may have the effect of increasing our total leverage.
Our substantial leverage could have important potential consequences, including, but not limited to:
• increasing our vulnerability to, and reducing our flexibility to respond to, changes in our business and general adverse economic and industry conditions;• requiring the dedication of a substantial portion of our cash flow from operations to our debt service, thereby reducing the availability of such cash flow to
fund working capital, capital expenditures, acquisitions, joint ventures, product research, dividends and distributions, unit and RBI share repurchases orother corporate purposes;
• increasing our vulnerability to a downgrade of our credit rating, which could adversely affect our cost of funds, liquidity and access to capital markets;• placing us at a competitive disadvantage as compared to certain of our competitors who are not as highly leveraged;• restricting us from making strategic acquisitions or causing us to make non-strategic divestitures;• exposing us to the risk of increased interest rates as borrowings under our credit facilities are subject to variable rates of interest;• the discontinuation of the London Interbank Offered Rate (“LIBOR”) after June 2023 and the replacement with an alternative reference rate may
adversely impact interest rates and our interest rate hedging strategy;• making it more difficult for us to repay, refinance or satisfy our obligations with respect to our debt;• limiting our ability to borrow additional funds in the future and increasing the cost of any such borrowing; and
17

Table of Contents
• exposing us to risks related to fluctuations in foreign currency as we earn profits in a variety of currencies around the world and substantially all of ourdebt is denominated in U.S. dollars.
If we are unable to generate sufficient cash flow to pay indebtedness and other funding needs or refinance our indebtedness on favorable terms, or at all, ourfinancial condition may be materially adversely affected.
Our indebtedness limits our ability to take certain actions and could delay or prevent a future change of control.
The terms of our indebtedness include a number of restrictive covenants that, among other things, limit our ability to incur additional indebtedness orguarantee or prepay indebtedness; pay dividends on, repurchase or make distributions in respect of capital stock; make investments or acquisitions; create liens oruse assets as security in other transactions; consolidate, merge, sell or otherwise dispose of substantially all of our or our subsidiaries’ assets; make intercompanytransactions; and enter into transactions with affiliates. These limitations may hinder our ability to finance future operations and capital needs and our ability topursue business opportunities and activities that may be in our interest. In addition, our ability to comply with these covenants and restrictions may be affected byevents beyond our control.
A breach of the covenants under our indebtedness could result in an event of default under the applicable agreement allowing the debt holders to acceleraterepayment of such debt as well as any other debt to which a cross-acceleration or cross-default provision applies. In addition, default under our senior securedcredit facilities would also permit the lenders thereunder to terminate all other commitments to extend additional credit thereunder, including under the revolver.Similarly, in the event of a change of control, pursuant to the terms of our indebtedness, we may be required to repay our credit facilities, or offer to repurchase thesenior secured first lien and second lien notes as well as future indebtedness. Such current and future terms could have the effect of delaying or preventing a futurechange of control or may discourage a potential acquirer from proposing or completing a transaction that may otherwise have presented a premium to our equityholders.
Following the occurrence of either an event of default or change of control, we may not have sufficient resources to repurchase, repay or redeem ourobligations, as applicable, and we may not be able to obtain additional financing to satisfy these obligations on terms favorable to us or at all. Also, if we wereunable to repay the amounts due under our secured indebtedness, the holders of such indebtedness could proceed against the collateral that secures suchindebtedness. In the event our creditors accelerate the repayment of our secured indebtedness, we and our subsidiaries may not have sufficient assets to repay thatindebtedness.
Risks Related to Taxation
Unanticipated tax liabilities could adversely affect the taxes we pay and our profitability.
We are subject to income and other taxes in Canada, the United States, and numerous foreign jurisdictions. A taxation authority may disagree with certain ofour views, including, for example, the allocation of profits by tax jurisdiction, and the deductibility of our interest expense, and may take the position that materialincome tax liabilities, interest, penalties, or other amounts are payable by us, in which case, we expect to contest such assessment. Contesting such an assessmentmay be lengthy and costly and if we were unsuccessful, the implications could be materially adverse to us and affect our effective income tax rate or operatingincome.
From time to time, we are subject to additional state and local income tax audits, international income tax audits and sales, franchise and value-added taxaudits. Although we believe our tax estimates are reasonable, the final determination of tax audits and any related litigation could be materially different from ourhistorical income tax provisions and accruals. There can be no assurance that the Canada Revenue Agency (the “CRA”), the U.S. Internal Revenue Service (the“IRS”) and/or foreign tax authorities will agree with our interpretation of the tax aspects of reorganizations, initiatives, transactions, or any related mattersassociated therewith that we have undertaken.
The results of a tax audit or related litigation could result in us not being in a position to take advantage of the effective income tax rates and the level ofbenefits that we anticipated to achieve as a result of corporate reorganizations, initiatives and transactions, and the implications could have a material adverse effecton our effective income tax rate, income tax provision, net income (loss) or cash flows in the period or periods for which that determination is made.
RBI and Partnership may be treated as U.S. corporations for U.S. federal income tax purposes, which could subject us and Partnership to substantialadditional U.S. taxes.
As Canadian entities, RBI and Partnership generally would be classified as foreign entities (and, therefore, non-U.S. tax residents) under general rules ofU.S. federal income taxation. Section 7874 of the Code, however, contains rules that result in a non-U.S. corporation being taxed as a U.S. corporation for U.S.federal income tax purposes, unless certain tests, applied at the time of the
18
Table of Contents
acquisition, regarding ownership of such entities (as relevant here, ownership by former Burger King shareholders) or level of business activities (as relevant here,business activities in Canada by us and our affiliates, including Partnership), were satisfied at such time. The U.S. Treasury Regulations apply these same rules tonon-U.S. publicly traded partnerships, such as Partnership. These statutory and regulatory rules are relatively new, their application is complex and there is littleguidance regarding their application.
If it were determined that we and/or Partnership should be taxed as U.S. corporations for U.S. federal income tax purposes, we and Partnership could beliable for substantial additional U.S. federal income tax. For Canadian tax purposes, we and Partnership are expected, regardless of any application of Section 7874of the Code, to be treated as a Canadian resident company and partnership, respectively. Consequently, if we and/or Partnership did not satisfy either of theapplicable tests, we might be liable for both Canadian and U.S. taxes, which could have a material adverse effect on our financial condition and results ofoperations.
Future changes to U.S. and non-U.S. tax laws including future regulations and other interpretive guidance of U.S. and Non-U.S. tax laws couldmaterially affect RBI and/or Partnership, including their status as foreign entities for U.S. federal income tax purposes, and adversely affect their anticipatedfinancial positions and results.
Changes to the rules in sections 385 and 7874 of the Code or the Treasury Regulations promulgated thereunder, or other changes in law, could adverselyaffect our and/or Partnership’s status as a non-U.S. entity for U.S. federal income tax purposes, our effective income tax rate or future planning based on currentlaw, and any such changes could have prospective or retroactive application to us and/or Partnership. It is presently uncertain whether any such legislativeproposals will be enacted into law and, if so, what impact such legislation would have on us. The timing and substance of any such further action is presentlyuncertain. Any such change of law or regulatory action which could apply retroactively or prospectively, could adversely impact our tax position as well as ourfinancial position and results in a material manner. The precise scope and application of any such regulatory proposals will not be clear until proposed TreasuryRegulations are issued, and, accordingly, until such regulations are promulgated and fully understood, we cannot be certain that there will be no such impact. Inaddition, we would be impacted by any changes in tax law in response to corporate tax reforms and other policy initiatives in the U.S. and elsewhere.
Moreover, the U.S. Congress, the Organization for Economic Co-operation and Development ("OECD") and other government agencies in jurisdictionswhere RBI and its affiliates do business have had an extended focus on issues related to the taxation of multinational corporations. Specific attention has been paidto “base erosion and profit shifting” ("BEPS"), where payments are made between affiliates from a jurisdiction with high tax rates to a jurisdiction with lower taxrates. As a result, the tax laws in the countries in which we do business could change on a prospective or retroactive basis, and any such change could adverselyaffect us.
On December 22, 2017, the U.S. government enacted comprehensive tax legislation commonly referred to as the Tax Cuts and Jobs Act (the “Tax Act”). Theprovisions of the Tax Act are complex and continue to be the subject of further regulatory and administrative guidance, which may adversely affect our effectivetax rate and results of operations. Additionally, other jurisdictions have and are considering various tax reform initiatives as well as initiatives related to COVID-19that may adversely impact us if enacted.
Risks related to Information Technology
The personal information that we collect may be vulnerable to breach, theft, or loss that could adversely affect our reputation, results of operations, andfinancial condition.
In the ordinary course of our business, we collect, process, transmit, and retain personal information regarding our employees and their families, ourfranchisees, vendors, contractors, and consumers, which can include social security numbers, social insurance numbers, banking and tax identification information,health care information, and credit card information and our franchisees collect similar information. For example, in 2019 and 2020, we expanded our developmentand management of our brands’ mobile apps, online ordering platforms, and in-restaurant kiosks. While our deployment of such technology facilitates our primarygoals of generating both incremental sales at our franchisees’ restaurants as well as additional customer awareness and interest in our brands, such deployment alsomeans that we are collecting and responsible for additional personal information about our customers. Canadian privacy officials are investigating the use ofcertain geolocation data for TH mobile app users and we have been served with several purported class action lawsuits in Canada alleging we violated mobile appusers' privacy rights. While we are fully cooperating with the investigation and vigorously defending the lawsuits, negative publicity regarding these matters couldadversely affect our reputation and our brands. Some of this personal information is also held and managed by our franchisees and certain of our vendors. A third-party may be able to circumvent the security and business controls we and/or our vendors use to limit access and use of personal information, which could result ina breach of employee, consumer, or franchisee privacy.
A major breach, theft, or loss of the personal information described above that is held by us or our vendors could adversely affect our reputation andrestaurant operations as well as result in substantial fines, penalties, indemnification claims, and potential litigation against us which could negatively impact ourresults of operations and financial condition. For example, under the European
19

Table of Contents
Union's General Data Protection Regulation (“GDPR”), companies must meet certain requirements regarding the handling of personal data or face penalties of upto 4% of worldwide revenue. Furthermore, the collection and safeguarding of personal information has increasingly attracted enhanced scrutiny from the generalpublic in the United States and Canada, which has resulted in additional actual and proposed legislative and regulatory rules at the federal, provincial and statelevels (e.g., the California Consumer Privacy Act of 2018, California's Proposition 24 of 2020, and Canada's Bill C-11). These regulations have been subject tofrequent change, and there may be other jurisdictions that propose or enact new or emerging data privacy requirements in the future. As a result of such legislativeand regulatory rules, we may be required to notify the owners of the personal information of any data breaches, which could harm our reputation and financialresults, as well as subject us to litigation or actions by regulatory authorities. Furthermore, media or other reports of existing or perceived security vulnerabilities inour systems or those of our franchisees or vendors, or misuse of personal data, even if no breach has been attempted or has occurred, has and in the future may leadto investigations and litigation and may adversely impact our brand, reputation, and business.
Significant capital investments and other expenditures could be required to remedy a breach and prevent future problems, including costs associated withadditional security technologies, personnel, experts, and credit monitoring services for those whose data has been breached. These costs, which could be material,could adversely impact our results of operations during the period in which they are incurred. The techniques and sophistication used to conduct cyber-attacks andbreaches, as well as the sources and targets of these attacks, change frequently and are often not recognized until such attacks are launched or have been in placefor a period of time. Accordingly, our expenditures to prevent future cyber-attacks or breaches may not be successful.
Information technology system failures or interruptions or breaches of our network security may interrupt our operations, cause reputational harm,subject us to increased operating costs and expose us to litigation.
We rely heavily on our computer systems and network infrastructure across operations including, but not limited to, point-of-sale processing at ourrestaurants, as well as the systems of our third-party vendors to whom we outsource certain administrative functions. Despite our implementation of securitymeasures, all of our technology systems are vulnerable to damage, disruption or failures due to physical theft, fire, power loss, telecommunications failure, or othercatastrophic events, as well as from problems with transitioning to upgraded or replacement systems, internal and external security breaches, denial of serviceattacks, viruses, worms, and other disruptive problems caused by hackers. If any of our technology systems were to fail and we were unable to recover in a timelyway, we could experience an interruption in our operations. Furthermore, if unauthorized access to or use of our systems were to occur, data related to ourproprietary information could be compromised. The occurrence of any of these incidents could have a material adverse effect on our future financial condition andresults of operations. To the extent that some of our worldwide reporting systems require or rely on manual processes, it could increase the risk of a breach due tohuman error.
Further, the standards for systems currently used for transmission and approval of electronic payment transactions, and the technology utilized in electronicpayment themselves, all of which can put electronic payment data at risk, are determined and controlled by the payment card industry, not by us. If someone is ableto circumvent our data security measures or those of third parties with whom we do business, including our franchisees, he or she could destroy or steal valuableinformation or disrupt our operations. Any security breach could expose us to risks of data loss, litigation, liability, and could seriously disrupt our operations. Anyresulting negative publicity could significantly harm our reputation and could materially and adversely affect our business and operating results.
Finally, we have expended and may need to continue to expend substantial financial and managerial resources to enhance our existing restaurantmanagement systems, financial and management controls, information systems and personnel to accurately capture and reflect the financial and operationalactivities at our franchise restaurants. On occasion we have encountered, and may in the future encounter, challenges in receiving these results from our franchiseesin a consistent and timely manner as a number of our systems and processes are not fully integrated worldwide. To the extent that we are not able to obtaintransparency into our operations from our systems and manual estimations and effectively manage the information demands associated with significant growth, itcould impair the ability of our management to react quickly to changes in the business or economic environment and our business and operating results could benegatively impacted.
Risks Related to our Partnership Exchangeable Units
3G RBH owns approximately 31% of the combined voting power with respect to RBI, and its interests may conflict with or differ from the interests of theother equity holders.
3G Restaurant Brands Holdings LP (“3G RBH”) currently owns approximately 92% of the Partnership exchangeable units and approximately 31% of thecombined voting power with respect to RBI. The interests of 3G RBH and its principals may not always be aligned with the interests of the other holders ofPartnership exchangeable units. So long as 3G RBH continues to directly or indirectly own a significant amount of the voting power of RBI, it will continue to beable to strongly influence or effectively control the business decisions of RBI and Partnership. 3G RBH and its principals may have interests that are different fromthose of the other
20
Table of Contents
holders of Partnership exchangeable units, and 3G RBH may exercise its voting and other rights in a manner that may be adverse to the interests of the otherholders of Partnership exchangeable units.
In addition, this concentration of ownership could have the effect of delaying or preventing a change in control or otherwise discouraging a potential acquirerfrom attempting to obtain control of RBI or Partnership, which could cause the market price of RBI’s common shares or Partnership exchangeable units to declineor prevent the shareholders or unitholders from realizing a premium over the market price for their RBI common shares or Partnership exchangeable units.
3G RBH is affiliated with 3G Capital Partners, Ltd. a global investment firm (“3G Capital”). 3G Capital is in the business of making investments incompanies and may from time to time in the future pursue opportunities, acquire or develop controlling interests in businesses engaged in the QSR industry thatcomplement or directly or indirectly compete with certain portions of our business. As a result, those acquisition opportunities may not be available to us.
A unitholder’s percentage ownership in us may be diluted by future issuances of RBI common shares or Partnership exchangeable units, which couldreduce the influence of our unitholders over matters on which they are entitled to vote.
The board of directors of RBI has the authority, without action or vote of RBI’s shareholders or our unitholders, to issue an unlimited number of additionalRBI common shares or Partnership exchangeable units, including in connection with investments and acquisitions. The number of RBI common shares orPartnership exchangeable units issued in connection with an investment or acquisition could constitute a material portion of the then-outstanding RBI commonshares or Partnership exchangeable units, and could materially dilute the ownership of our unitholders. Issuances of RBI common shares or Partnershipexchangeable units would reduce the influence of holders of Partnership exchangeable units over matters on which they are entitled to vote.
An active trading market for Partnership exchangeable units may not be sustained and they may not trade equally with RBI common shares.
Partnership exchangeable units are not listed on a national exchange in the United States. Although Partnership exchangeable units are listed on the TorontoStock Exchange, an active public market for Partnership exchangeable units may not be sustained, and such market is not as liquid as for RBI common shares. If anactive public market is not sustained, it may be difficult for investors who hold Partnership exchangeable units to sell their exchangeable units at a price that isattractive to them, or at all.
Although exchangeable, the Partnership exchangeable units and the RBI common shares are distinct securities. The Partnership exchangeable units and RBIcommon shares will at all times trade separately, and the public market for Partnership exchangeable units is not as liquid as for the RBI common shares. Inaddition, if a holder of Partnership exchangeable units exercises its exchange right, RBI, in its capacity as the general partner of Partnership and in its solediscretion, may cause Partnership to repurchase each Partnership exchangeable unit submitted for exchange in consideration for cash (in an amount determined inaccordance with the terms of the partnership agreement) in lieu of exchanging for common shares. As such, Partnership exchangeable units may not trade equallywith RBI common shares, and could trade at a discount to the market price of RBI common shares, which discount could possibly be material.
The exchange of Partnership exchangeable units into RBI common shares is subject to certain restrictions and the value of RBI common sharesreceived in any exchange may fluctuate.
Holders of Partnership exchangeable units are entitled to require Partnership to exchange all or any portion of such holder’s Partnership exchangeable unitsfor RBI common shares either on a one-for-one basis or for cash (in an amount determined in accordance with the terms of the partnership agreement) at the soleelection of RBI, in its capacity as the general partner of Partnership.
The RBI common shares for which Partnership exchangeable units may be exchanged may be subject to significant fluctuations in value for many reasons,including our operating and financial performance and prospects; general market conditions; the risks described in this report; changes to the competitive landscapein the industries or markets in which we operate; the arrival or departure of key personnel; and speculation in the press or the investment community.
If a holder of Partnership exchangeable units elects to exchange his or her Partnership exchangeable units for RBI common shares, the exchange generallywill be taxable for Canadian and U.S. federal income tax purposes.
In certain circumstances, a Limited Partner may lose its limited liability status.
The Limited Partnerships Act (Ontario) (the “Ontario Limited Partnerships Act”) provides that a limited partner benefits from limited liability unless, inaddition to exercising rights and powers as a limited partner, such limited partner takes part in the control of
21

Table of Contents
the business of a limited partnership of which such limited partner is a partner. Subject to the provisions of the Ontario Limited Partnerships Act and of similarlegislation in other jurisdictions of Canada, the liability of each limited partner for the debts, liabilities and obligations of Partnership will be limited to the limitedpartner’s capital contribution, plus the limited partner’s share of any undistributed income of Partnership. However, pursuant to the Ontario Limited PartnershipsAct, where a limited partner has received the return of all or part of that limited partner’s capital contribution, the limited partner would be liable to Partnership or,where Partnership is dissolved, to its creditors, for any amount, not in excess of the amount of capital contribution returned with interest, necessary to discharge theliabilities of Partnership to all creditors who extended credit or whose claims otherwise arose before the return of the capital contribution. A limited partner holdsas trustee for the limited partnership any money or other property that is paid or conveyed to the limited partner as a return of the limited partner’s contribution thatis made contrary to the Ontario Limited Partnerships Act.
The limitation of liability conferred under the Ontario Limited Partnerships Act may be ineffective outside Ontario except to the extent it is given extra-territorial recognition or effect by the laws of other jurisdictions. There may also be requirements to be satisfied in each jurisdiction to maintain limited liability. Iflimited liability is lost, limited partners may be considered to be general partners (and therefore be subject to unlimited liability) in such jurisdiction by creditorsand others having claims against Partnership.
General Risks
The loss of key management personnel or our inability to attract and retain new qualified personnel could hurt our business.
We are dependent on the efforts and abilities of our senior management, including the executives managing each of our brands, and our success will alsodepend on our ability to attract and retain additional qualified employees. Failure to attract personnel sufficiently qualified to execute our strategy, or to retainexisting key personnel, could have a material adverse effect on our business.
We have been, and in the future may be, subject to litigation that could have an adverse effect on our business.
We may from time to time, in the ordinary course of business, be subject to litigation relating to matters including, but not limited to, disputes withfranchisees, suppliers, employees, team members, and customers, as well as disputes over our advertising claims about our food and over our intellectual property.For example, there have been multiple purported class action lawsuits filed against us regarding the no-poaching provision our franchise agreements for BK in theU.S. and TH in Canada, regarding certain purported privacy-related concerns with respect to geo-location data and our mobile application in Canada and regardingcertain disclosures to the market, including in connection with secondary offerings of RBI's shares. Active and potential disputes with franchisees could damageour brand reputation and our relationships with our broader franchise base. Such litigation may be expensive to defend, harm our reputation and divert resourcesaway from our operations and negatively impact our reported earnings. Also, legal proceedings against a franchisee or its affiliates by third parties, whether in theordinary course of business or otherwise, may include claims against us by virtue of our relationship with the franchisee. We, or our business partners, may becomesubject to claims for infringement of intellectual property rights and we may be required to indemnify or defend our business partners from such claims. Shouldmanagement’s evaluation of our current exposure to legal matters pending against us prove incorrect and such claims are successful, our exposure could exceedexpectations and have a material adverse effect on our business, financial condition and results of operations. Although some losses may be covered by insurance,if there are significant losses that are not covered, or there is a delay in receiving insurance proceeds, or the proceeds are insufficient to offset our losses fully, ourfinancial condition or results of operations may be adversely affected.
Item 1B. Unresolved Staff Comments
None.
22
Table of Contents
Executive Officers of Restaurant Brands International Inc., General Partner of Registrant
Set forth below is certain information about our executive officers. Ages are as of the date hereof.
Name Age PositionJosé E. Cil 51 Chief Executive OfficerMatthew Dunnigan 37 Chief Financial OfficerJoshua Kobza 34 Chief Operating OfficerAxel Schwan 47 President, Tim Hortons AmericasChristopher Finazzo 39 President, Burger King AmericasSami Siddiqui 36 President, Popeyes AmericasDavid Shear 37 President, InternationalFernando Machado 46 Chief Marketing OfficerJill Granat 55 General Counsel and Corporate SecretaryJacqueline Friesner 48 Controller and Chief Accounting Officer
José E. Cil. Mr. Cil was appointed Chief Executive Officer of RBI in January 2019, and previously served as President, Burger King since December 2014.Mr. Cil served as Executive Vice President and President of Europe, the Middle East and Africa for Burger King Worldwide and its predecessor from November2010 until December 2014. Prior to this role, Mr. Cil was Vice President and Regional General Manager for Wal-Mart Stores, Inc. in Florida from February 2010to November 2010. From September 2008 to January 2010, Mr. Cil served as Vice President of Company Operations of Burger King Corporation and fromSeptember 2005 to September 2008, he served as Division Vice President, Mediterranean and NW Europe Divisions, EMEA of a subsidiary of Burger KingCorporation.
Matthew Dunnigan. Mr. Dunnigan was appointed Chief Financial Officer of RBI in January 2018. From October 2014 until January 2018, Mr. Dunniganheld the position of Treasurer, where he took on increasing responsibilities and successfully led all of RBI's capital markets activities. Before he joined RBI, Mr.Dunnigan served as Vice President of Crescent Capital Group LP, from September 2013 through October 2014, where he evaluated investments across the creditmarkets. Prior to that, Mr. Dunnigan spent three years as a private equity investment professional for H.I.G. Capital.
Joshua Kobza. Mr. Kobza was appointed Chief Operating Officer of RBI in January 2019. Prior to that, Mr. Kobza served as Chief Technology Officer andDevelopment Officer of RBI from January 2018 to January 2019, and as Chief Financial Officer of RBI from December 2014 to January 2018. From April 2013 toDecember 2014, Mr. Kobza served as Executive Vice President and Chief Financial Officer of Burger King Worldwide. Mr. Kobza joined Burger King Worldwidein June 2012 as Director, Investor Relations, and was promoted to Senior Vice President, Global Finance in December 2012. From January 2011 until June 2012,Mr. Kobza worked at SIP Capital, a Sao Paulo based private investment firm, where he evaluated investments across a number of industries and geographies. FromJuly 2008 until December 2010, Mr. Kobza served as an analyst in the corporate private equity area of the Blackstone Group in New York City.
Axel Schwan. Mr. Schwan was appointed President of Tim Hortons, Americas in October 2019. Mr. Schwan served as Global Chief Marketing Officer ofTim Hortons from October 2017 to October 2019 and prior to that served as the Chief Marketing Officer of Burger King from January 2014 to October 2017.
Christopher Finazzo. Mr. Finazzo was appointed President of Burger King, Americas in December 2017. Mr. Finazzo served as Head of Marketing, NorthAmerica for Burger King from January 2017 to December 2017 and was Head of Development for Burger King from January 2016 to January 2017. Since joiningBurger King in May 2014, he has held various roles in marketing and development. Prior to joining Burger King, Mr. Finazzo was on the strategy team at Macy’s.
Sami Siddiqui. Mr. Siddiqui was appointed President of Popeyes, Americas in September 2020. Prior to that Mr. Siddiqui served as President of Asia Pacificfor RBI from February 2019 to September 2020 and as Chief Financial Officer for Burger King Corporation from October 2018 to February 2019. FromSeptember 2016 to September 2018, he was President of Tim Hortons and from April 2015 to September 2016, he was Executive Vice President, Finance for TimHortons. Mr. Siddiqui joined Burger King Corporation in 2013 and served various capacities within the Global Finance groups of Burger King Corporation prior tojoining the Tim Hortons team.
David Shear. Mr. Shear was appointed President International of Restaurant Brands International in January 2021. Mr. Shear previously served as PresidentEMEA beginning in September 2016. Mr. Shear joined the predecessor of the company in 2011, holding roles of increasing responsibility within the USmarketing. He then held various roles in Asia Pacific, including serving as President of Burger King APAC from 2014 to 2016. Prior to joining Burger KingCorporation, David worked at strategy consulting firm Charles River Associates.
23
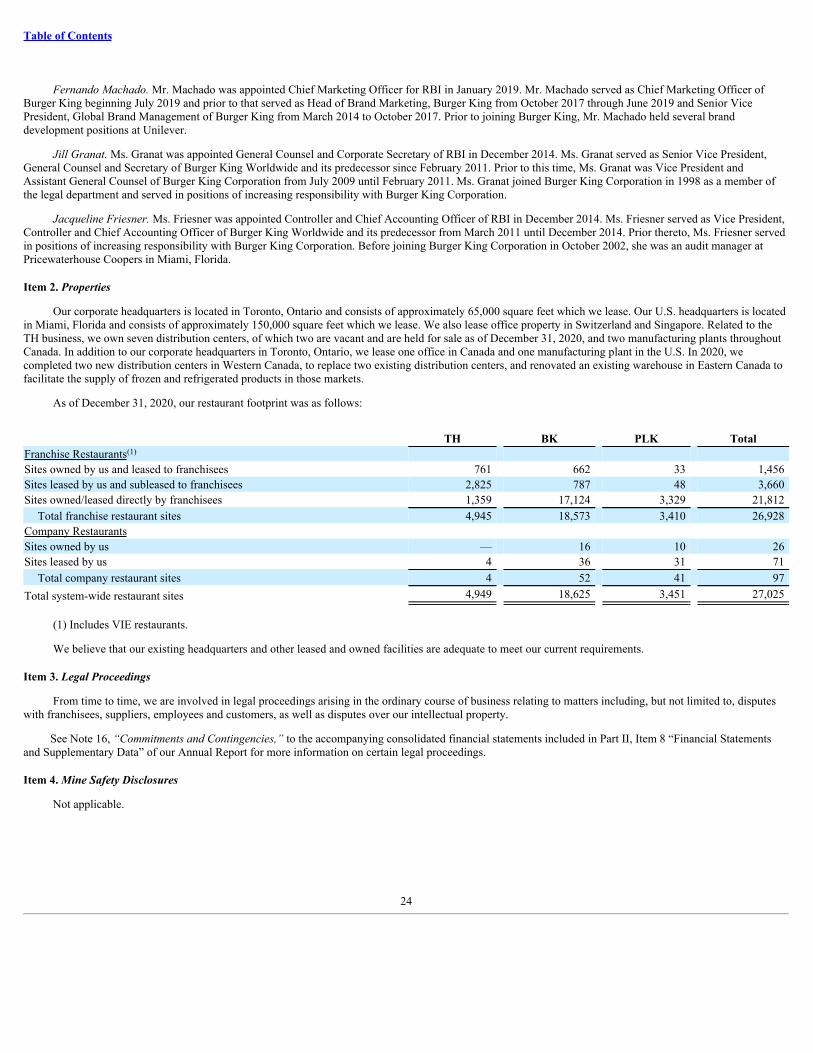
Table of Contents
Fernando Machado. Mr. Machado was appointed Chief Marketing Officer for RBI in January 2019. Mr. Machado served as Chief Marketing Officer ofBurger King beginning July 2019 and prior to that served as Head of Brand Marketing, Burger King from October 2017 through June 2019 and Senior VicePresident, Global Brand Management of Burger King from March 2014 to October 2017. Prior to joining Burger King, Mr. Machado held several branddevelopment positions at Unilever.
Jill Granat. Ms. Granat was appointed General Counsel and Corporate Secretary of RBI in December 2014. Ms. Granat served as Senior Vice President,General Counsel and Secretary of Burger King Worldwide and its predecessor since February 2011. Prior to this time, Ms. Granat was Vice President andAssistant General Counsel of Burger King Corporation from July 2009 until February 2011. Ms. Granat joined Burger King Corporation in 1998 as a member ofthe legal department and served in positions of increasing responsibility with Burger King Corporation.
Jacqueline Friesner. Ms. Friesner was appointed Controller and Chief Accounting Officer of RBI in December 2014. Ms. Friesner served as Vice President,Controller and Chief Accounting Officer of Burger King Worldwide and its predecessor from March 2011 until December 2014. Prior thereto, Ms. Friesner servedin positions of increasing responsibility with Burger King Corporation. Before joining Burger King Corporation in October 2002, she was an audit manager atPricewaterhouse Coopers in Miami, Florida.
Item 2. Properties
Our corporate headquarters is located in Toronto, Ontario and consists of approximately 65,000 square feet which we lease. Our U.S. headquarters is locatedin Miami, Florida and consists of approximately 150,000 square feet which we lease. We also lease office property in Switzerland and Singapore. Related to theTH business, we own seven distribution centers, of which two are vacant and are held for sale as of December 31, 2020, and two manufacturing plants throughoutCanada. In addition to our corporate headquarters in Toronto, Ontario, we lease one office in Canada and one manufacturing plant in the U.S. In 2020, wecompleted two new distribution centers in Western Canada, to replace two existing distribution centers, and renovated an existing warehouse in Eastern Canada tofacilitate the supply of frozen and refrigerated products in those markets.
As of December 31, 2020, our restaurant footprint was as follows:
TH BK PLK TotalFranchise RestaurantsSites owned by us and leased to franchisees 761 662 33 1,456 Sites leased by us and subleased to franchisees 2,825 787 48 3,660 Sites owned/leased directly by franchisees 1,359 17,124 3,329 21,812
Total franchise restaurant sites 4,945 18,573 3,410 26,928 Company RestaurantsSites owned by us — 16 10 26 Sites leased by us 4 36 31 71
Total company restaurant sites 4 52 41 97 Total system-wide restaurant sites 4,949 18,625 3,451 27,025
(1) Includes VIE restaurants.
We believe that our existing headquarters and other leased and owned facilities are adequate to meet our current requirements.
Item 3. Legal Proceedings
From time to time, we are involved in legal proceedings arising in the ordinary course of business relating to matters including, but not limited to, disputeswith franchisees, suppliers, employees and customers, as well as disputes over our intellectual property.
See Note 16, “Commitments and Contingencies,” to the accompanying consolidated financial statements included in Part II, Item 8 “Financial Statementsand Supplementary Data” of our Annual Report for more information on certain legal proceedings.
Item 4. Mine Safety Disclosures
Not applicable.
(1)
24

Table of Contents
Part II
Item 5. Market for Registrant’s Common Equity, Related Stockholder Matters and Issuer Purchases of Equity Securities
Market for Our Partnership Exchangeable Units
The Partnership exchangeable units trade on the Toronto Stock Exchange (“TSX”) under the ticker symbol “QSP”. RBI’s common shares trade on the NewYork Stock Exchange (“NYSE”) and the TSX under the ticker symbol “QSR”. As of February 15, 2021, there were 47 holders of record of Partnershipexchangeable units.
Distribution Policy
On February 11, 2021, we announced that the RBI board of directors had declared a cash dividend of $0.53 per RBI common share for the first quarter of2021. The dividend will be paid on April 6, 2021 to common shareholders of record on March 23, 2021. Partnership will also make a distribution in respect of eachPartnership exchangeable unit in the amount of $0.53 per Partnership exchangeable unit, and the record date and payment date for distributions on Partnershipexchangeable units are the same as the record date and payment date set forth above. To fund the RBI common share dividend, Partnership will also make acorresponding distribution in respect of the Class A common units (all of which are held by RBI) in an amount equal to the aggregate amount of dividends payablein respect of the RBI common shares.
RBI is targeting a total of $2.12 in declared dividends per common share and distributions in respect of each Partnership exchangeable unit for 2021.
We do not have a formal distribution policy. However, pursuant to the partnership agreement, RBI, as our general partner, must cause us to makedistributions on our Class A common units and Partnership exchangeable units, when a dividend has been declared and is payable in respect of RBI commonshares.
Although RBI’s board of directors declared a cash distribution on Partnership exchangeable units for each quarter of 2020 and for the first quarter of 2021,any future distributions on Partnership exchangeable units will be determined at the discretion of RBI’s board of directors and will depend upon results ofoperations, financial condition, contractual restrictions, including the terms of the agreements governing our debt and any future indebtedness we may incur,restrictions imposed by applicable law and other factors that RBI’s board of directors deems relevant. Although we are targeting a total of $2.12 in declareddistributions per Partnership exchangeable unit for 2021, there is no assurance that we will achieve our target total dividend for 2021 and satisfy our debt serviceand other obligations.
Issuer Purchases of Equity Securities
During 2020, we received exchange notices representing 10,393,861 Partnership exchangeable units, including 7,098,893 during the fourth quarter of 2020.Pursuant to the terms of the partnership agreement, we satisfied the exchange notices by repurchasing 6,757,692 Partnership exchangeable units for approximately$380 million in cash and exchanging the remaining Partnership exchangeable units for the same number of newly issued RBI common shares. During 2019, wereceived exchange notices representing 42,016,392 Partnership exchangeable units and satisfied the exchange notices by exchanging the Partnership exchangeableunits for the same number of newly issued RBI common shares. During 2018, we received exchange notices representing 10,185,333 Partnership exchangeableunits. We satisfied the exchange notices by repurchasing 10,000,000 Partnership exchangeable units for approximately $561 million in cash and exchanging theremaining Partnership exchangeable units for the same number of our newly issued RBI common shares. Pursuant to the terms of the partnership agreement, thepurchase price for the Partnership exchangeable units was based on the weighted average trading price of RBI's common shares on the NYSE for the 20consecutive trading days ending on the last business day prior to the exchange date. Upon the exchange of Partnership exchangeable units, each such Partnershipexchangeable unit was automatically deemed cancelled concurrently with such exchange.
25

Table of Contents
Stock Performance Graph
The following graph depicts the total return to the holders of Partnership exchangeable units from December 31, 2015 through December 31, 2020, relativeto the performance of the Standard & Poor’s/TSX Composite Index and the Standard & Poor’s/TSX Capped Consumer Discretionary Index, a peer group. Thegraph assumes an investment of $100 in Partnership exchangeable units and each index on December 31, 2015 and the reinvestment of distributions paid since thatdate. The price performance shown in the graph is not necessarily indicative of future price performance.
12/31/2015 12/31/2016 12/31/2017 12/31/2018 12/31/2019 12/31/2020Restaurant Brands International Limited Partnership(TSX) $ 100 $ 126 $ 153 $ 147 $ 178 $ 171 S&P/TSX Composite Index (C$) $ 100 $ 121 $ 132 $ 120 $ 148 $ 156 S&P/TSX Capped Consumer Discretionary Index(C$) $ 100 $ 111 $ 136 $ 114 $ 132 $ 157
26
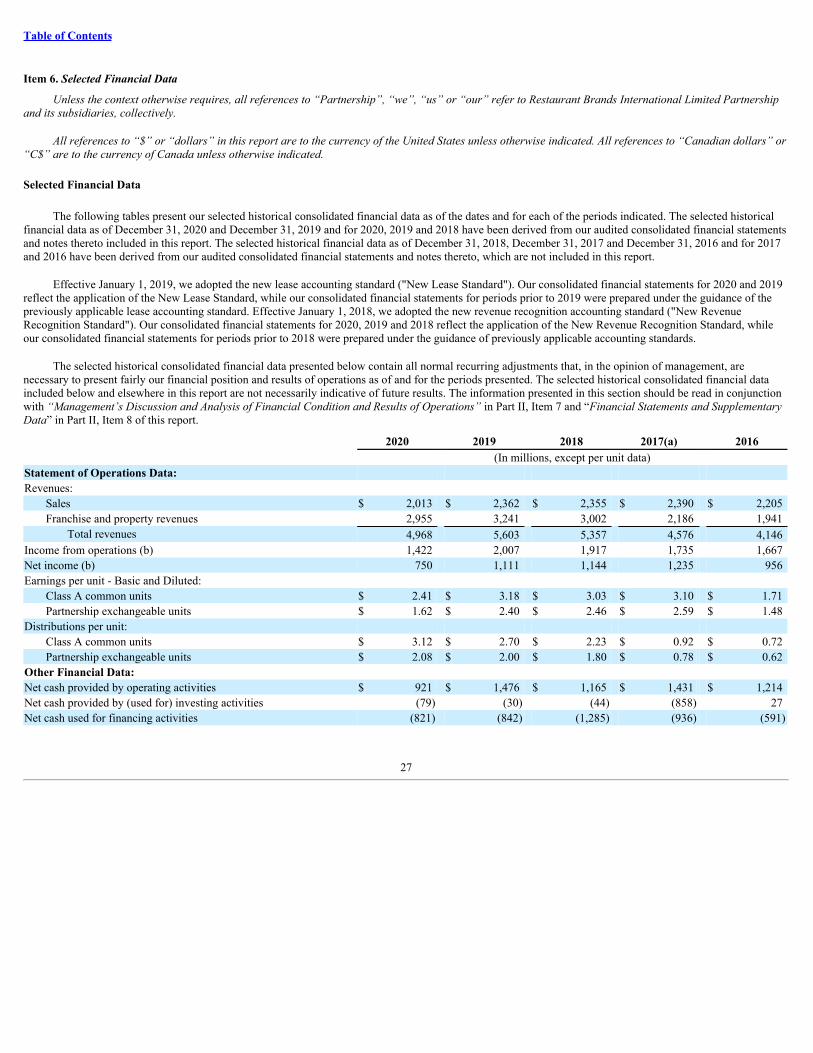
Table of Contents
Item 6. Selected Financial Data
Unless the context otherwise requires, all references to “Partnership”, “we”, “us” or “our” refer to Restaurant Brands International Limited Partnershipand its subsidiaries, collectively.
All references to “$” or “dollars” in this report are to the currency of the United States unless otherwise indicated. All references to “Canadian dollars” or“C$” are to the currency of Canada unless otherwise indicated.
Selected Financial Data
The following tables present our selected historical consolidated financial data as of the dates and for each of the periods indicated. The selected historicalfinancial data as of December 31, 2020 and December 31, 2019 and for 2020, 2019 and 2018 have been derived from our audited consolidated financial statementsand notes thereto included in this report. The selected historical financial data as of December 31, 2018, December 31, 2017 and December 31, 2016 and for 2017and 2016 have been derived from our audited consolidated financial statements and notes thereto, which are not included in this report.
Effective January 1, 2019, we adopted the new lease accounting standard ("New Lease Standard"). Our consolidated financial statements for 2020 and 2019reflect the application of the New Lease Standard, while our consolidated financial statements for periods prior to 2019 were prepared under the guidance of thepreviously applicable lease accounting standard. Effective January 1, 2018, we adopted the new revenue recognition accounting standard ("New RevenueRecognition Standard"). Our consolidated financial statements for 2020, 2019 and 2018 reflect the application of the New Revenue Recognition Standard, whileour consolidated financial statements for periods prior to 2018 were prepared under the guidance of previously applicable accounting standards.
The selected historical consolidated financial data presented below contain all normal recurring adjustments that, in the opinion of management, arenecessary to present fairly our financial position and results of operations as of and for the periods presented. The selected historical consolidated financial dataincluded below and elsewhere in this report are not necessarily indicative of future results. The information presented in this section should be read in conjunctionwith “Management’s Discussion and Analysis of Financial Condition and Results of Operations” in Part II, Item 7 and “Financial Statements and SupplementaryData” in Part II, Item 8 of this report.
2020 2019 2018 2017(a) 2016 (In millions, except per unit data)Statement of Operations Data:Revenues:
Sales $ 2,013 $ 2,362 $ 2,355 $ 2,390 $ 2,205 Franchise and property revenues 2,955 3,241 3,002 2,186 1,941
Total revenues 4,968 5,603 5,357 4,576 4,146 Income from operations (b) 1,422 2,007 1,917 1,735 1,667 Net income (b) 750 1,111 1,144 1,235 956 Earnings per unit - Basic and Diluted:
Class A common units $ 2.41 $ 3.18 $ 3.03 $ 3.10 $ 1.71 Partnership exchangeable units $ 1.62 $ 2.40 $ 2.46 $ 2.59 $ 1.48
Distributions per unit:Class A common units $ 3.12 $ 2.70 $ 2.23 $ 0.92 $ 0.72 Partnership exchangeable units $ 2.08 $ 2.00 $ 1.80 $ 0.78 $ 0.62
Other Financial Data:Net cash provided by operating activities $ 921 $ 1,476 $ 1,165 $ 1,431 $ 1,214 Net cash provided by (used for) investing activities (79) (30) (44) (858) 27 Net cash used for financing activities (821) (842) (1,285) (936) (591)
27
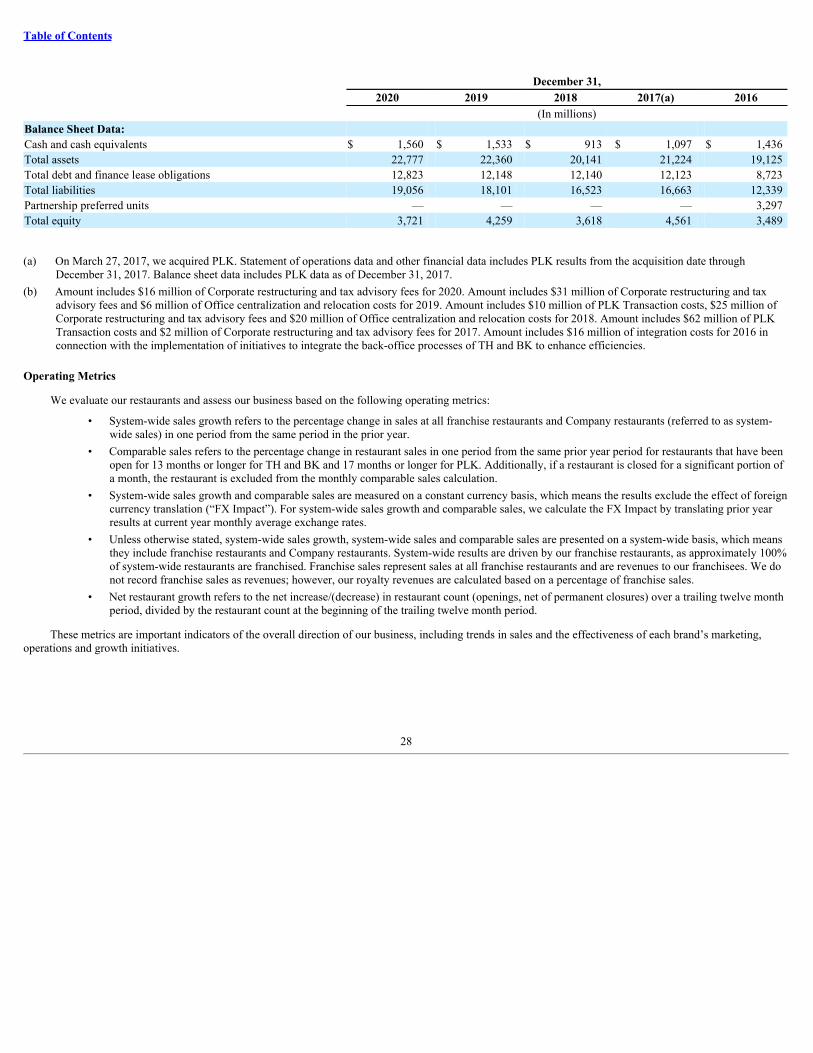
Table of Contents
December 31, 2020 2019 2018 2017(a) 2016 (In millions)Balance Sheet Data:Cash and cash equivalents $ 1,560 $ 1,533 $ 913 $ 1,097 $ 1,436 Total assets 22,777 22,360 20,141 21,224 19,125 Total debt and finance lease obligations 12,823 12,148 12,140 12,123 8,723 Total liabilities 19,056 18,101 16,523 16,663 12,339 Partnership preferred units — — — — 3,297 Total equity 3,721 4,259 3,618 4,561 3,489
(a) On March 27, 2017, we acquired PLK. Statement of operations data and other financial data includes PLK results from the acquisition date through
December 31, 2017. Balance sheet data includes PLK data as of December 31, 2017.(b) Amount includes $16 million of Corporate restructuring and tax advisory fees for 2020. Amount includes $31 million of Corporate restructuring and tax
advisory fees and $6 million of Office centralization and relocation costs for 2019. Amount includes $10 million of PLK Transaction costs, $25 million ofCorporate restructuring and tax advisory fees and $20 million of Office centralization and relocation costs for 2018. Amount includes $62 million of PLKTransaction costs and $2 million of Corporate restructuring and tax advisory fees for 2017. Amount includes $16 million of integration costs for 2016 inconnection with the implementation of initiatives to integrate the back-office processes of TH and BK to enhance efficiencies.
Operating Metrics
We evaluate our restaurants and assess our business based on the following operating metrics:
• System-wide sales growth refers to the percentage change in sales at all franchise restaurants and Company restaurants (referred to as system-wide sales) in one period from the same period in the prior year.
• Comparable sales refers to the percentage change in restaurant sales in one period from the same prior year period for restaurants that have beenopen for 13 months or longer for TH and BK and 17 months or longer for PLK. Additionally, if a restaurant is closed for a significant portion ofa month, the restaurant is excluded from the monthly comparable sales calculation.
• System-wide sales growth and comparable sales are measured on a constant currency basis, which means the results exclude the effect of foreigncurrency translation (“FX Impact”). For system-wide sales growth and comparable sales, we calculate the FX Impact by translating prior yearresults at current year monthly average exchange rates.
• Unless otherwise stated, system-wide sales growth, system-wide sales and comparable sales are presented on a system-wide basis, which meansthey include franchise restaurants and Company restaurants. System-wide results are driven by our franchise restaurants, as approximately 100%of system-wide restaurants are franchised. Franchise sales represent sales at all franchise restaurants and are revenues to our franchisees. We donot record franchise sales as revenues; however, our royalty revenues are calculated based on a percentage of franchise sales.
• Net restaurant growth refers to the net increase/(decrease) in restaurant count (openings, net of permanent closures) over a trailing twelve monthperiod, divided by the restaurant count at the beginning of the trailing twelve month period.
These metrics are important indicators of the overall direction of our business, including trends in sales and the effectiveness of each brand’s marketing,operations and growth initiatives.
28

Table of Contents
The following table presents our operating metrics for each of the periods indicated, which have been derived from our internal records. We evaluate ourrestaurants and assess our business based on these operating metrics. These metrics may differ from those used by other companies in our industry who may definethese metrics differently.
2020 2019 2018System-wide sales growth
Tim Hortons (17.5)% (0.3)% 2.4 %Burger King (11.1)% 9.3 % 8.9 %Popeyes 17.7 % 18.5 % 8.9 %Consolidated (8.6)% 8.3 % 7.4 %
System-wide sales ($ in millions)Tim Hortons $ 5,488 $ 6,716 $ 6,869 Burger King $ 20,038 $ 22,921 $ 21,624 Popeyes $ 5,143 $ 4,397 $ 3,732 Consolidated $ 30,669 $ 34,034 $ 32,225
Comparable salesTim Hortons (15.7)% (1.5)% 0.6 %Burger King (7.9)% 3.4 % 2.0 %Popeyes 13.8 % 12.1 % 1.6 %
Net restaurant growthTim Hortons 0.3 % 1.8 % 2.1 %Burger King (1.1)% 5.9 % 6.1 %Popeyes 4.1 % 6.9 % 7.3 %Consolidated (0.2)% 5.2 % 5.5 %
System Restaurant countTim Hortons 4,949 4,932 4,846 Burger King 18,625 18,838 17,796 Popeyes 3,451 3,316 3,102 Consolidated 27,025 27,086 25,744
29

Table of Contents
Item 7. Management’s Discussion and Analysis of Financial Condition and Results of Operations
You should read the following discussion together with Part II, Item 6 “Selected Financial Data” of this Annual Report for the year ended December 31,2020 (our “Annual Report”) and our audited Consolidated Financial Statements and the related notes thereto included in Part II, Item 8 “Financial Statementsand Supplementary Data” of our Annual Report.
The following discussion includes information regarding future financial performance and plans, targets, aspirations, expectations, and objectives ofmanagement, which constitute forward-looking statements within the meaning of the Private Securities Litigation Reform Act of 1995 and forward-lookinginformation within the meaning of the Canadian securities laws as described in further detail under “Special Note Regarding Forward-Looking Statements” thatis set forth below. Actual results may differ materially from the results discussed in the forward-looking statements because of a number of risks and uncertainties,including the matters discussed in the “Special Note Regarding Forward-Looking Statements” below. In addition, please refer to the risks set forth under thecaption “Risk Factors” included in this Annual Report for a further description of risks and uncertainties affecting our business and financial results. Historicaltrends should not be taken as indicative of future operations and financial results. Other than as required under the U.S. Federal securities laws or the Canadiansecurities laws, we do not assume a duty to update these forward-looking statements, whether as a result of new information, subsequent events or circumstances,changes in expectations or otherwise.
We prepare our financial statements in accordance with accounting principles generally accepted in the United States (“U.S. GAAP” or “GAAP”).However, this Management’s Discussion and Analysis of Financial Condition and Results of Operations also contains certain non-GAAP financial measures toassist readers in understanding our performance. Non-GAAP financial measures either exclude or include amounts that are not reflected in the most directlycomparable measure calculated and presented in accordance with GAAP. Where non-GAAP financial measures are used, we have provided the most directlycomparable measures calculated and presented in accordance with U.S. GAAP, a reconciliation to GAAP measures and a discussion of the reasons whymanagement believes this information is useful to it and may be useful to investors.
Unless the context otherwise requires, all references in this section to “Partnership,” “we,” “us,” or “our” are to Restaurant Brands International LimitedPartnership and its subsidiaries, collectively.
Overview
We are an Ontario limited partnership that serves as the indirect holding company for Tim Hortons, Burger King and Popeyes and their consolidatedsubsidiaries. We are one of the world’s largest quick service restaurant (“QSR”) companies with approximately $31 billion in system-wide sales and approximately27,000 restaurants in more than 100 countries as of December 31, 2020. Our Tim Hortons®, Burger King®, and Popeyes® brands have similar franchise businessmodels with complementary daypart mixes and product platforms. Our three iconic brands are managed independently while benefiting from global scale andsharing of best practices.
Tim Hortons restaurants are quick service restaurants with a menu that includes premium blend coffee, tea, espresso-based hot and cold specialty drinks,fresh baked goods, including donuts, Timbits®, bagels, muffins, cookies and pastries, grilled paninis, classic sandwiches, wraps, soups and more. Burger Kingrestaurants are quick service restaurants that feature flame-grilled hamburgers, chicken and other specialty sandwiches, french fries, soft drinks and otheraffordably-priced food items. Popeyes restaurants are quick service restaurants featuring a unique “Louisiana” style menu that includes fried chicken, chickentenders, fried shrimp and other seafood, red beans and rice, and other regional items.
We have three operating and reportable segments: (1) Tim Hortons (“TH”); (2) Burger King (“BK”); and (3) Popeyes Louisiana Kitchen (“PLK”). Ourbusiness generates revenue from the following sources: (i) franchise revenues, consisting primarily of royalties based on a percentage of sales reported by franchiserestaurants and franchise fees paid by franchisees; (ii) property revenues from properties we lease or sublease to franchisees; and (iii) sales at restaurants owned byus (“Company restaurants”). In addition, our Tim Hortons business generates revenue from sales to franchisees related to our supply chain operations, includingmanufacturing, procurement, warehousing and distribution, as well as sales to retailers.
COVID-19
The global crisis resulting from the spread of coronavirus (“COVID-19”) had a substantial impact on our global restaurant operations in 2020. System-widesales growth, system-wide sales, comparable sales and net restaurant growth were also negatively impacted for 2020 as a result of the impact of COVID-19.During 2020, substantially all TH, BK and PLK restaurants remained open in North America with limited operations, such as drive-thru, takeout and delivery(where applicable) and that currently remains the case. While certain markets have opened for dine-in guests, the capacity may be limited, and local conditionsmay lead to closures or increased limitations. Some international markets temporarily closed most or all restaurants and the restaurants that remained open or
30

Table of Contents
have reopened may have limited operations. As of the end of December 2020, over 96% of our restaurants were open worldwide, including substantially all of ourrestaurants in North America and Asia Pacific and approximately 94% of our restaurants were open in Europe, Middle East and Africa.
Our operating results substantially depend upon our franchisees’ sales volumes, restaurant profitability, and financial stability. The financial impact ofCOVID-19 has had, and is expected to continue to have, an adverse effect on many of our franchisees’ liquidity and we have worked closely with our franchiseesaround the world to monitor and assist them with access to appropriate sources of liquidity in order to sustain their businesses throughout this crisis. During 2020,we offered rent relief programs to eligible TH franchisees in Canada and eligible BK franchisees in the U.S. and Canada who lease property from us. The rentrelief program offered to eligible BK franchisees concluded during the third quarter of 2020 and the rent relief program offered to eligible TH franchisees wasextended through the end of 2021. While in effect, these programs provided working capital support to franchisees and resulted in a reduction in our propertyrevenues. See Note 9, Leases, to the accompanying audited consolidated financial statements.
We also provided cash flow support by extending loans to eligible BK franchisees in the U.S. during the second and third quarters of 2020, and by advancingcertain cash payments to eligible TH franchisees in Canada during the second quarter of 2020. Additionally, we temporarily deferred franchisee capital investmentcommitments for restaurant renovations and new restaurant development globally, based on the individual circumstances of relevant markets and restaurantowners.
During 2020, we recorded higher bad debt expense than 2019 and 2018. While these receivables remain contractually due and payable to us, the certainty ofthe amount and timing of payments has been impacted by the COVID-19 pandemic. Therefore, our bad debt expense during 2020 reflects an adjustment to ourhistorical collections experience to incorporate an estimate of the impact of current economic conditions resulting from the COVID-19 pandemic. Actualcollections may be materially higher or lower than this estimate reflects since it is reasonably possible the duration and future impact of the COVID-19 pandemicon our business or our franchisees may differ from our assumptions.
With the pandemic affecting consumer behavior, the importance of digital sales, including delivery, has grown. We expect to continue to supportenhancements of our digital and marketing capabilities. While we do not know the full future impact COVID-19 will have on our business, we expect to see acontinued impact from COVID-19 on our results in 2021.
Recent Events and Factors Affecting Comparability
Transition to New Lease Accounting Standard
We transitioned to Accounting Standards Codification Topic 842, Leases (“ASC 842”), effective January 1, 2019 on a modified retrospective basis using theeffective date transition method. Our consolidated financial statements reflect the application of ASC 842 guidance beginning in 2019, while our consolidatedfinancial statements for prior periods were prepared under the guidance of a previously applicable accounting standard.
The most significant effect of this transition that affects comparability of our results of operations between 2019 and 2018 includes the recognition of leaseincome and lease cost on a gross basis for lessee reimbursements of costs such as property taxes and maintenance when we are the lessor in the lease. Althoughthere was no net impact to our consolidated statement of operations from this change, the presentation resulted in total increases to both franchise and propertyrevenues and franchise and property expenses of $130 million ($85 million related to our TH segment, $43 million related to our BK segment and $2 millionrelated to our PLK segment) during 2019 compared to 2018, when such amounts were recorded on a net basis.
Corporate Restructuring and Tax Advisory Costs
We recorded $16 million, $31 million and $25 million of costs during 2020, 2019 and 2018, respectively, which are classified as selling, general andadministrative expenses in our consolidated statements of operations, arising primarily from professional advisory and consulting services associated with certaintransformational corporate restructuring initiatives that rationalize our structure and optimize cash movement within our structure, including consulting servicesrelated to the interpretation of final and proposed regulations and guidance issued by the U.S. Treasury, the IRS and state tax authorities in their ongoing efforts tointerpret and implement comprehensive tax legislation, commonly referred to as the Tax Cuts and Jobs Act (the “Tax Act”) and related state and local taximplications (“Corporate restructuring and tax advisory fees”).
Popeyes Acquisition and PLK Transaction Costs
On March 27, 2017, we completed the acquisition of Popeyes Louisiana Kitchen, Inc. (the "Popeyes Acquisition"). In connection with the PopeyesAcquisition, we incurred certain non-recurring fees and expenses (“PLK Transaction costs”) totaling $10 million during 2018 consisting primarily of professionalfees and compensation related expenses, all of which are classified as selling, general and administrative expenses in the consolidated statements of operations. Wedid not incur any PLK Transaction costs during 2020
31

Table of Contents
and 2019.
Office Centralization and Relocation Costs
In connection with the centralization and relocation of our Canadian and U.S. restaurant support centers to new offices in Toronto, Ontario, and Miami,Florida, respectively, we incurred certain non-operational expenses (“Office centralization and relocation costs”) totaling $6 million during 2019 and $20 millionduring 2018 consisting primarily of moving costs, relocation-driven compensation expenses, and duplicate rent expenses during 2018, which are classified asselling, general and administrative expenses in the consolidated statement of operations. We did not incur any Office centralization and relocation costs during2020.
Results of Operations
Tabular amounts in millions of U.S. dollars unless noted otherwise. Segment income may not calculate exactly due to rounding.
2020 vs. 2019 2019 vs. 2018
Consolidated 2020 2019 2018 VarianceFX
Impact (a)
Variance Excluding FX Impact Variance
FX Impact
Variance Excluding FX Impact
Favorable / (Unfavorable)Revenues:
Sales $ 2,013 $ 2,362 $ 2,355 $ (349) $ (20) $ (329) $ 7 $ (44) $ 51 Franchise and property revenues 2,955 3,241 3,002 (286) (29) (257) 239 (52) 291
Total revenues 4,968 5,603 5,357 (635) (49) (586) 246 (96) 342 Operating costs and expenses:
Cost of sales 1,610 1,813 1,818 203 15 188 5 34 (29)Franchise and property expenses 528 540 422 12 3 9 (118) 7 (125)Selling, general and administrativeexpenses 1,264 1,264 1,214 — 3 (3) (50) 10 (60)(Income) loss from equity methodinvestments 39 (11) (22) (50) — (50) (11) (3) (8)Other operating expenses (income), net 105 (10) 8 (115) (1) (114) 18 (3) 21
Total operating costs and expenses 3,546 3,596 3,440 50 20 30 (156) 45 (201)Income from operations 1,422 2,007 1,917 (585) (29) (556) 90 (51) 141 Interest expense, net 508 532 535 24 — 24 3 — 3 Loss on early extinguishment of debt 98 23 — (75) — (75) (23) — (23)Income before income taxes 816 1,452 1,382 (636) (29) (607) 70 (51) 121
Income tax expense 66 341 238 275 (3) 278 (103) 12 (115)Net income $ 750 $ 1,111 $ 1,144 $ (361) $ (32) $ (329) $ (33) $ (39) $ 6
(a) We calculate the FX Impact by translating prior year results at current year monthly average exchange rates. We analyze these results on a constant currency basis asthis helps identify underlying business trends, without distortion from the effects of currency movements.
2020 vs. 2019 2019 vs. 2018
TH Segment 2020 2019 2018 VarianceFX
Impact (a)
Variance Excluding FX Impact Variance
FX Impact
Variance Excluding FX Impact
Favorable / (Unfavorable)Revenues:
Sales $ 1,876 $ 2,204 $ 2,201 $ (328) $ (20) $ (308) $ 3 $ (44) $ 47 Franchise and property revenues 934 1,140 1,091 (206) (10) (196) 49 (22) 71
Total revenues 2,810 3,344 3,292 (534) (30) (504) 52 (66) 118 Cost of sales 1,484 1,677 1,688 193 15 178 11 34 (23)Franchise and property expenses 341 358 279 17 3 14 (79) 6 (85)Segment SG&A 284 309 314 25 3 22 5 6 (1)Segment depreciation and amortization (b) 113 106 102 (7) 1 (8) (4) 2 (6)Segment income (c) 823 1,122 1,127 (299) (10) (289) (5) (22) 17
32

Table of Contents
(b) Segment depreciation and amortization consists of depreciation and amortization included in cost of sales and franchise and property expenses.(c) TH segment income includes $9 million, $16 million and $15 million of cash distributions received from equity method investments for 2020, 2019 and 2018,
respectively.
2020 vs. 2019 2019 vs. 2018
BK Segment 2020 2019 2018 VarianceFX
Impact (a)
Variance Excluding FX Impact Variance
FX Impact
Variance Excluding FX Impact
Favorable / (Unfavorable)Revenues:
Sales $ 64 $ 76 $ 75 $ (12) $ — $ (12) $ 1 $ — $ 1 Franchise and property revenues 1,538 1,701 1,576 (163) (18) (145) 125 (30) 155
Total revenues 1,602 1,777 1,651 (175) (18) (157) 126 (30) 156 Cost of sales 65 71 67 6 — 6 (4) — (4)Franchise and property expenses 176 168 131 (8) — (8) (37) 1 (38)Segment SG&A 588 600 577 12 1 11 (23) 3 (26)Segment depreciation and amortization (b) 49 49 48 — — — (1) — (1)Segment income (d) 823 994 928 (171) (17) (154) 66 (26) 92
(d) BK segment income includes $6 million and $5 million of cash distributions received from equity method investments for 2019 and 2018, respectively. No significantcash distributions were received from equity method investments in 2020.
2020 vs. 2019 2019 vs. 2018
PLK Segment 2020 2019 2018 VarianceFX
Impact (a)
Variance Excluding FX Impact Variance
FX Impact
Variance Excluding FX Impact
Favorable / (Unfavorable)Revenues:
Sales $ 73 $ 82 $ 79 $ (9) $ — $ (9) $ 3 $ — $ 3 Franchise and property revenues 483 400 335 83 (1) 84 65 (1) 66
Total revenues 556 482 414 74 (1) 75 68 (1) 69 Cost of sales 61 65 63 4 — 4 (2) — (2)Franchise and property expenses 11 14 12 3 — 3 (2) — (2)Segment SG&A 273 225 193 (48) — (48) (32) — (32)Segment depreciation and amortization (b) 8 11 10 3 — 3 (1) — (1)Segment income 218 188 157 30 (1) 31 31 (1) 32
Comparable Sales
TH comparable sales were (15.7)% during 2020, including Canada comparable sales of (16.5)%.
BK comparable sales were (7.9)% during 2020, including U.S. comparable sales of (5.6)%.
PLK comparable sales were 13.8% during 2020, including U.S. comparable sales of 15.7%.
33
Table of Contents
Sales and Cost of Sales
Sales include TH supply chain sales and sales from Company restaurants. TH supply chain sales represent sales of products, supplies and restaurantequipment, as well as sales to retailers. Sales from Company restaurants, including sales by our consolidated TH Restaurant VIEs, represent restaurant-level salesto our guests.
Cost of sales includes costs associated with the management of our TH supply chain, including cost of goods, direct labor and depreciation, as well as thecost of products sold to retailers. Cost of sales also includes food, paper and labor costs of Company restaurants.
During 2020, the decrease in sales was driven primarily by a decrease of $308 million in our TH segment, a decrease of $12 million in our BK segment, adecrease of $9 million in our PLK segment, and an unfavorable FX impact of $20 million. The decrease in our TH segment was driven by a $312 million decreasein supply chain sales due to the decrease in system-wide sales, net of an increase in sales to retailers. The decrease in supply chain sales was partially offset by anincrease of $4 million in Company restaurant revenue due to an increase in the number of Company restaurants.
During 2019, the increase in sales was driven by an increase of $47 million in our TH segment, primarily as a result of an increase in supply chain sales, anincrease of $3 million in our PLK segment and an increase of $1 million in our BK segment, partially offset by an unfavorable FX Impact of $44 million.
During 2020, the decrease in cost of sales was driven primarily by a decrease of $178 million in our TH segment, a decrease of $6 million in our BKsegment, a decrease of $4 million in our PLK segment and a $15 million favorable FX Impact. The decrease in our TH segment was driven primarily by a decreaseof $185 million in supply chain cost of sales due to the decrease in system-wide sales, net of an increase in sales to retailers. The decrease in supply chain cost ofsales was partially offset by a $7 million increase in Company restaurant cost of sales due to an increase in the number of Company restaurants.
During 2019, the decrease in cost of sales was driven primarily by a $34 million favorable FX Impact, partially offset by an increase of $23 million in ourTH segment, an increase of $4 million in our BK segment and an increase of $2 million in our PLK segment. The increase in our TH segment was driven primarilyby an increase in supply chain cost of sales due to the increase in supply chain sales.
Franchise and Property
Franchise and property revenues consist primarily of royalties earned on franchise sales, rents from real estate leased or subleased to franchisees, franchisefees, and other revenue. Franchise and property expenses consist primarily of depreciation of properties leased to franchisees, rental expense associated withproperties subleased to franchisees, amortization of franchise agreements, and bad debt expense (recoveries).
During 2020, the decrease in franchise and property revenues was driven by a decrease of $196 million in our TH segment, a decrease of $145 million in ourBK segment, and a $29 million unfavorable FX Impact, partially offset by an increase of $84 million in our PLK segment. The decrease in our TH segment wasprimarily driven by decreases in royalties and rent from decreases in system-wide sales and rent relief provided to eligible franchisees during the current period.The decrease in our BK segment was primarily driven by a decrease in royalties as a result of a decrease in system-wide sales. The increase in our PLK segmentwas primarily driven by an increase in royalties as a result of an increase in system-wide sales.
During 2019, the increase in franchise and property revenues was driven by an increase of $155 million in our BK segment, an increase of $71 million in ourTH segment, and an increase of $66 million in our PLK segment, partially offset by a $52 million unfavorable FX Impact. The increases in our BK and PLKsegments were primarily driven by increases in royalties as a result of system-wide sales growth. Additionally, the increase in franchise and property revenues inall of our segments during 2019 reflected the gross recognition of property income from lessee reimbursements of costs such as property taxes and maintenancewhen we are the lessor in the lease as a result of the application of ASC 842 beginning January 1, 2019.
During 2020, the decrease in franchise and property expenses was driven by a decrease of $14 million in our TH segment, a decrease of $3 million in ourPLK segment and a $3 million favorable FX Impact, partially offset by an increase of $8 million in our BK segment. Overall, the decrease was driven by adecrease in property expenses partially offset by an increase in bad debt expense.
During 2019, the increase in franchise and property expenses was driven by an increase of $85 million in our TH segment, an increase of $38 million in ourBK segment, and an increase of $2 million in our PLK segment, partially offset by a $7 million favorable FX Impact. The increase in all of our segments during2019 was driven by the gross recognition of property expenses for
34

Table of Contents
costs such as property taxes and maintenance paid by us and reimbursed by lessees when we are the lessor in the lease as a result of the application of ASC 842beginning January 1, 2019.
Selling, General and Administrative Expenses
Our selling, general and administrative expenses were comprised of the following:
2020 vs. 2019 2019 vs. 2018 2020 2019 2018 $ % $ % Favorable / (Unfavorable)TH Segment SG&A $ 284 $ 309 $ 314 $ 25 8.1 % $ 5 1.6 %BK Segment SG&A 588 600 577 12 2.0 % (23) (4.0)%PLK Segment SG&A 273 225 193 (48) (21.3)% (32) (16.6)%Share-based compensation and non-cashincentive compensation expense 84 74 55 (10) (13.5)% (19) (34.5)%Depreciation and amortization 19 19 20 — — % 1 5.0 %PLK Transaction costs — — 10 — — % 10 100.0 %Corporate restructuring and tax advisory fees 16 31 25 15 48.4 % (6) (24.0)%Office centralization and relocation costs — 6 20 6 100.0 % 14 70.0 %Selling, general and administrative expenses $ 1,264 $ 1,264 $ 1,214 $ — — % $ (50) (4.1)%
Segment selling, general and administrative expenses (“Segment SG&A”) include segment selling expenses, which consist primarily of advertising fundexpenses, and segment general and administrative expenses, which are comprised primarily of salary and employee-related costs for non-restaurant employees,professional fees, information technology systems, and general overhead for our corporate offices. Segment SG&A excludes share-based compensation and non-cash incentive compensation expense, depreciation and amortization, PLK Transaction costs, Corporate restructuring and tax advisory fees, and Officecentralization and relocation costs.
During 2020, the decrease in Segment SG&A in our TH and BK segments was primarily due to a decrease in advertising fund expenses. During 2020, theincrease in Segment SG&A in our PLK segment was primarily due to an increase in advertising fund expenses resulting from an increase in advertising fundrevenue.
During 2019, the increase in Segment SG&A in our BK and PLK segments is primarily due to an increase in advertising fund expenses.
During 2020 and 2019, the increases in share-based compensation and non-cash incentive compensation expense was primarily due to increases in thenumber of equity awards granted during 2020 and 2019, respectively.
(Income) Loss from Equity Method Investments
(Income) loss from equity method investments reflects our share of investee net income or loss, non-cash dilution gains or losses from changes in ourownership interests in equity method investees, and basis difference amortization.
The change in (income) loss from equity method investments during 2020 was primarily driven by an increase in equity method investment net losses thatwe recognized during the current year, driven by the negative impact of the COVID-19 pandemic, and the non-recurrence of an $11 million non-cash dilution gainduring 2019 from the issuance of additional shares in connection with a merger by one of our equity method investees.
The change in (income) loss from equity method investments during 2019 was primarily driven by the recognition of a $20 million non-cash dilution gainduring 2018 on the initial public offering by one of our equity method investees, partially offset by an $11 million non-cash dilution gain during 2019 from theissuance of additional shares in connection with a merger by one of our equity method investees.
35
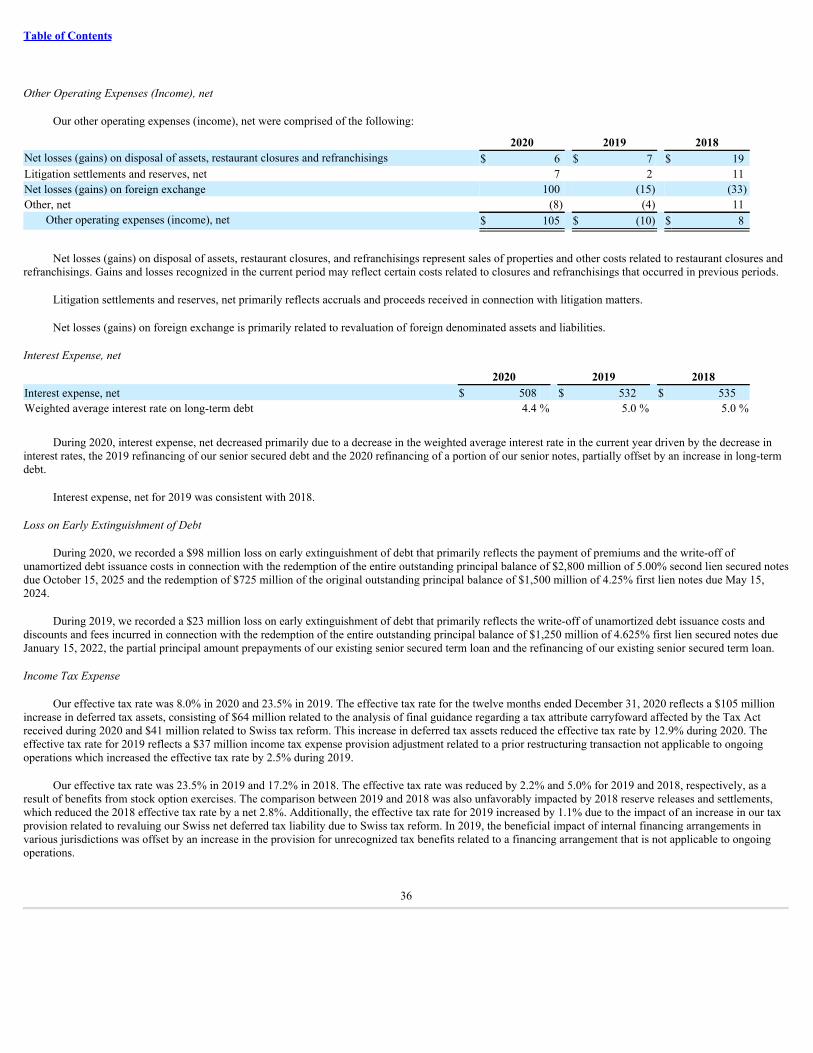
Table of Contents
Other Operating Expenses (Income), net
Our other operating expenses (income), net were comprised of the following:
2020 2019 2018Net losses (gains) on disposal of assets, restaurant closures and refranchisings $ 6 $ 7 $ 19 Litigation settlements and reserves, net 7 2 11 Net losses (gains) on foreign exchange 100 (15) (33)Other, net (8) (4) 11
Other operating expenses (income), net $ 105 $ (10) $ 8
Net losses (gains) on disposal of assets, restaurant closures, and refranchisings represent sales of properties and other costs related to restaurant closures andrefranchisings. Gains and losses recognized in the current period may reflect certain costs related to closures and refranchisings that occurred in previous periods.
Litigation settlements and reserves, net primarily reflects accruals and proceeds received in connection with litigation matters.
Net losses (gains) on foreign exchange is primarily related to revaluation of foreign denominated assets and liabilities.
Interest Expense, net
2020 2019 2018Interest expense, net $ 508 $ 532 $ 535 Weighted average interest rate on long-term debt 4.4 % 5.0 % 5.0 %
During 2020, interest expense, net decreased primarily due to a decrease in the weighted average interest rate in the current year driven by the decrease ininterest rates, the 2019 refinancing of our senior secured debt and the 2020 refinancing of a portion of our senior notes, partially offset by an increase in long-termdebt.
Interest expense, net for 2019 was consistent with 2018.
Loss on Early Extinguishment of Debt
During 2020, we recorded a $98 million loss on early extinguishment of debt that primarily reflects the payment of premiums and the write-off ofunamortized debt issuance costs in connection with the redemption of the entire outstanding principal balance of $2,800 million of 5.00% second lien secured notesdue October 15, 2025 and the redemption of $725 million of the original outstanding principal balance of $1,500 million of 4.25% first lien notes due May 15,2024.
During 2019, we recorded a $23 million loss on early extinguishment of debt that primarily reflects the write-off of unamortized debt issuance costs anddiscounts and fees incurred in connection with the redemption of the entire outstanding principal balance of $1,250 million of 4.625% first lien secured notes dueJanuary 15, 2022, the partial principal amount prepayments of our existing senior secured term loan and the refinancing of our existing senior secured term loan.
Income Tax Expense
Our effective tax rate was 8.0% in 2020 and 23.5% in 2019. The effective tax rate for the twelve months ended December 31, 2020 reflects a $105 millionincrease in deferred tax assets, consisting of $64 million related to the analysis of final guidance regarding a tax attribute carryfoward affected by the Tax Actreceived during 2020 and $41 million related to Swiss tax reform. This increase in deferred tax assets reduced the effective tax rate by 12.9% during 2020. Theeffective tax rate for 2019 reflects a $37 million income tax expense provision adjustment related to a prior restructuring transaction not applicable to ongoingoperations which increased the effective tax rate by 2.5% during 2019.
Our effective tax rate was 23.5% in 2019 and 17.2% in 2018. The effective tax rate was reduced by 2.2% and 5.0% for 2019 and 2018, respectively, as aresult of benefits from stock option exercises. The comparison between 2019 and 2018 was also unfavorably impacted by 2018 reserve releases and settlements,which reduced the 2018 effective tax rate by a net 2.8%. Additionally, the effective tax rate for 2019 increased by 1.1% due to the impact of an increase in our taxprovision related to revaluing our Swiss net deferred tax liability due to Swiss tax reform. In 2019, the beneficial impact of internal financing arrangements invarious jurisdictions was offset by an increase in the provision for unrecognized tax benefits related to a financing arrangement that is not applicable to ongoingoperations.
36

Table of Contents
Net Income
We reported net income of $750 million for 2020 compared to net income of $1,111 million for 2019. The decrease in net income is primarily due to a $299million decrease in TH segment income, a $171 million decrease in BK segment income, a $115 million unfavorable change in the results from other operatingexpenses (income), net, a $75 million increase in the loss on early extinguishment of debt, a $37 million unfavorable change from the impact of equity methodinvestments, a $10 million increase in share-based compensation and non-cash incentive compensation expense, and a $4 million increase in depreciation andamortization. These factors were partially offset by a $275 million decrease in income tax expense, a $30 million increase in PLK segment income, a $24 milliondecrease in interest expense, net, a $15 million decrease in Corporate restructuring and tax advisory fees, and the non-recurrence of $6 million of Officecentralization and relocation costs. Amounts above include a total unfavorable FX Impact to net income of $32 million.
We reported net income of $1,111 million for 2019 compared to net income of $1,144 million for 2018. The decrease in net income is primarily due to a$103 million increase in income tax expense, a $23 million loss on early extinguishment of debt in 2019, a $19 million increase in share-based compensation andnon-cash incentive compensation expense, a $14 million unfavorable change from the impact of equity method investments, a $6 million increase in Corporaterestructuring and tax advisory fees, and a $5 million decrease in TH segment income. These factors were partially offset by a $66 million increase in BK segmentincome, a $31 million increase in PLK segment income, an $18 million favorable change in the results from other operating expenses (income), net, a $14 milliondecrease in Office centralization and relocation costs and the non-recurrence of $10 million of PLK Transaction costs incurred in the prior period. Amounts aboveinclude a total unfavorable FX Impact to net income of $39 million.
Non-GAAP Reconciliations
The table below contains information regarding EBITDA and Adjusted EBITDA, which are non-GAAP measures. These non-GAAP measures do not have astandardized meaning under U.S. GAAP and may differ from similar captioned measures of other companies in our industry. We believe that these non-GAAPmeasures are useful to investors in assessing our operating performance, as they provide them with the same tools that management uses to evaluate ourperformance and are responsive to questions we receive from both investors and analysts. By disclosing these non-GAAP measures, we intend to provide investorswith a consistent comparison of our operating results and trends for the periods presented. EBITDA is defined as earnings (net income or loss) before interestexpense, net, loss on early extinguishment of debt, income tax expense, and depreciation and amortization and is used by management to measure operatingperformance of the business. Adjusted EBITDA is defined as EBITDA excluding (i) the non-cash impact of share-based compensation and non-cash incentivecompensation expense, (ii) (income) loss from equity method investments, net of cash distributions received from equity method investments, (iii) other operatingexpenses (income), net and, (iv) income/expenses from non-recurring projects and non-operating activities. For the periods referenced, this included costs incurredin connection with the centralization and relocation of our Canadian and U.S. restaurant support centers to new offices in Toronto, Ontario, and Miami, Florida,respectively, professional advisory and consulting services associated with certain transformational corporate restructuring initiatives that rationalize our structureand optimize cash movements, including consulting services related to the interpretation of final and proposed regulations and guidance under the Tax Act andprofessional fees and compensation related expenses in connection with the Popeyes Acquisition. Management believes that these types of expenses are either notrelated to our underlying profitability drivers or not likely to re-occur in the foreseeable future and the varied timing, size and nature of these projects may causevolatility in our results unrelated to the performance of our core business that does not reflect trends of our core operations.
37
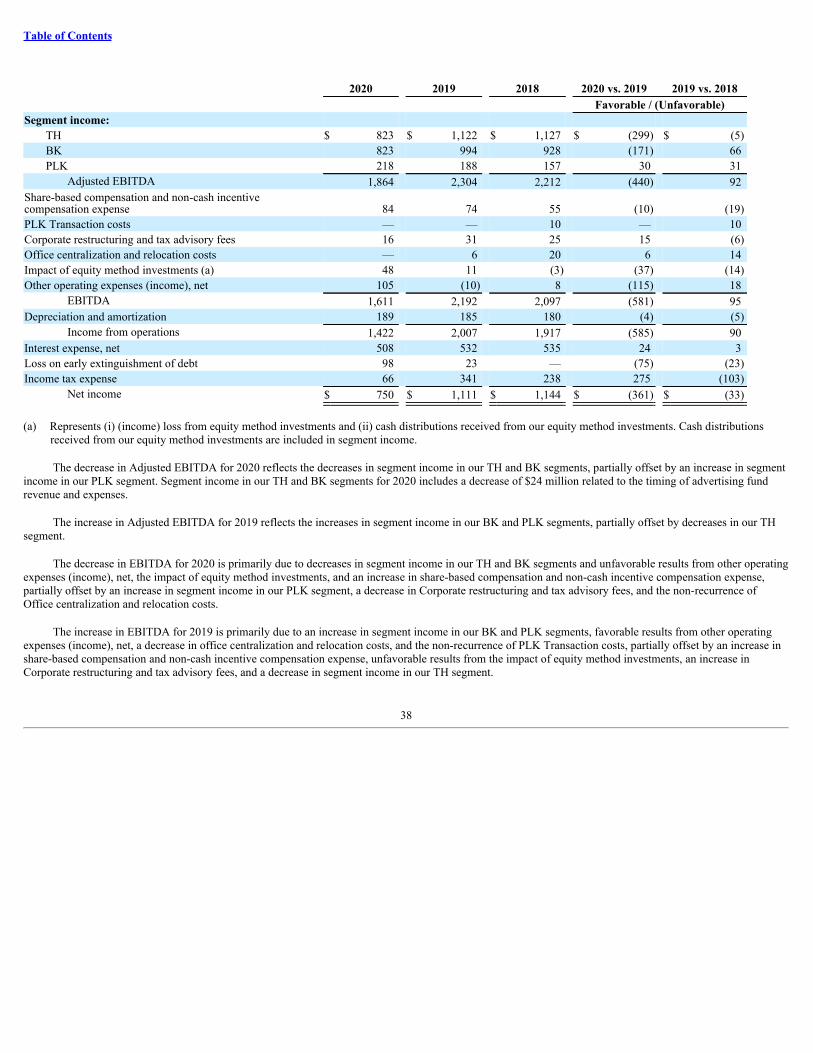
Table of Contents
2020 2019 2018 2020 vs. 2019 2019 vs. 2018 Favorable / (Unfavorable)Segment income:
TH $ 823 $ 1,122 $ 1,127 $ (299) $ (5)BK 823 994 928 (171) 66 PLK 218 188 157 30 31
Adjusted EBITDA 1,864 2,304 2,212 (440) 92 Share-based compensation and non-cash incentivecompensation expense 84 74 55 (10) (19)PLK Transaction costs — — 10 — 10 Corporate restructuring and tax advisory fees 16 31 25 15 (6)Office centralization and relocation costs — 6 20 6 14 Impact of equity method investments (a) 48 11 (3) (37) (14)Other operating expenses (income), net 105 (10) 8 (115) 18
EBITDA 1,611 2,192 2,097 (581) 95 Depreciation and amortization 189 185 180 (4) (5)
Income from operations 1,422 2,007 1,917 (585) 90 Interest expense, net 508 532 535 24 3 Loss on early extinguishment of debt 98 23 — (75) (23)Income tax expense 66 341 238 275 (103)
Net income $ 750 $ 1,111 $ 1,144 $ (361) $ (33)
(a) Represents (i) (income) loss from equity method investments and (ii) cash distributions received from our equity method investments. Cash distributionsreceived from our equity method investments are included in segment income.
The decrease in Adjusted EBITDA for 2020 reflects the decreases in segment income in our TH and BK segments, partially offset by an increase in segmentincome in our PLK segment. Segment income in our TH and BK segments for 2020 includes a decrease of $24 million related to the timing of advertising fundrevenue and expenses.
The increase in Adjusted EBITDA for 2019 reflects the increases in segment income in our BK and PLK segments, partially offset by decreases in our THsegment.
The decrease in EBITDA for 2020 is primarily due to decreases in segment income in our TH and BK segments and unfavorable results from other operatingexpenses (income), net, the impact of equity method investments, and an increase in share-based compensation and non-cash incentive compensation expense,partially offset by an increase in segment income in our PLK segment, a decrease in Corporate restructuring and tax advisory fees, and the non-recurrence ofOffice centralization and relocation costs.
The increase in EBITDA for 2019 is primarily due to an increase in segment income in our BK and PLK segments, favorable results from other operatingexpenses (income), net, a decrease in office centralization and relocation costs, and the non-recurrence of PLK Transaction costs, partially offset by an increase inshare-based compensation and non-cash incentive compensation expense, unfavorable results from the impact of equity method investments, an increase inCorporate restructuring and tax advisory fees, and a decrease in segment income in our TH segment.
38

Table of Contents
Liquidity and Capital Resources
Our primary sources of liquidity are cash on hand, cash generated by operations and borrowings available under our Revolving Credit Facility (as definedbelow). We have used, and may in the future use, our liquidity to make required interest and/or principal payments, to make distributions to RBI for RBI torepurchase its common shares, to repurchase Class B exchangeable limited partnership units (“Partnership exchangeable units”), to voluntarily prepay andrepurchase our or one of our affiliate’s outstanding debt, to fund our investing activities, and to make distributions on Class A common units and distributions onthe Partnership exchangeable units. As a result of our borrowings, we are highly leveraged. Our liquidity requirements are significant, primarily due to debt servicerequirements.
At December 31, 2020, we had cash and cash equivalents of $1,560 million and working capital of $663 million. In addition, at December 31, 2020, we hadborrowing availability of $998 million under our Revolving Credit Facility (defined below).
During 2020, we received exchange notices representing 10,393,861 Partnership exchangeable units, including 7,098,893 received during the fourth quarterof 2020. Pursuant to the terms of the partnership agreement, we satisfied the exchange notices by repurchasing 6,757,692 Partnership exchangeable units onOctober 2, 2020 for approximately $380 million in cash and exchanging the remaining Partnership exchangeable units for the same number of our newly issuedRBI common shares.
On April 7, 2020, two of our subsidiaries (the “Borrowers”) entered into an indenture (the “2020 5.75% Senior Notes Indenture”) in connection with theissuance of $500 million of 5.75% first lien notes due April 15, 2025 (the “2020 5.75% Senior Notes”). No principal payments are due until maturity and interest ispaid semi-annually. The net proceeds from the offering of the 2020 5.75% Senior Notes were used for general corporate purposes.
On October 5, 2020, the Borrowers entered into an indenture (the “2020 4.00% Senior Notes Indenture”) in connection with the issuance of $1,400 millionof 4.00% second lien notes due October 15, 2030 (the “October 2020 4.00% Senior Notes”). No principal payments are due until maturity and interest is paid semi-annually. The net proceeds from the offering of the October 2020 4.00% Senior Notes were used to redeem $1,350 million of our existing $2,800 million 20175.00% Senior Notes (due October 15, 2025) and pay related redemption premiums, fees and expenses.
On November 2, 2020, the Borrowers issued $1,500 million in aggregate principal amount of 4.00% second lien notes due October 15, 2030 (the "November2020 4.00% Senior Notes" and together with the October 2020 4.00% Senior Notes, the "2020 4.00% Senior Notes"), which were issued as additional notes underthe 2020 4.00% Senior Notes Indenture. The November 2020 4.00% Senior Notes are treated as a single series with the October 2020 4.00% Senior Notes andhave the same terms for all purposes under the 2020 4.00% Senior Notes Indenture, including waivers, amendments, redemptions and offers to purchase. The netproceeds from the offering of the November 2020 4.00% Senior Notes were used to redeem the remaining $1,450 million principal amount outstanding of the 20175.00% Senior Notes and pay related redemption premiums, fees and expenses.
On November 9, 2020, the Borrowers entered into an indenture (the “2020 3.50% Senior Notes Indenture”) in connection with the issuance of $750 millionin aggregate principal amount of 3.50% first lien notes due February 15, 2029 (the “2020 3.50% Senior Notes”). No principal payments are due until maturity andinterest is paid semi-annually. The net proceeds from the offering of the 2020 3.50% Senior Notes were used to redeem $725 million of our 4.25% first lien notesdue 2024 and pay related redemption premiums, fees and expenses.
Based on our current level of operations and available cash, we believe our cash flow from operations, combined with our availability under our RevolvingCredit Facility, will provide sufficient liquidity to fund our current obligations, debt service requirements and capital spending over the next twelve months.
Our operating results substantially depend upon our franchisees’ sales volumes, restaurant profitability, and financial stability. The financial impact ofCOVID-19 has had, and is expected to continue for an uncertain period to have, an adverse effect on our franchisees’ liquidity and we have worked closely withour franchisees around the world to monitor and assist them with access to appropriate sources of liquidity in order to sustain their businesses throughout thiscrisis. We provided cash flow support by extending loans to eligible BK franchisees in the U.S. during the second and third quarters of 2020 and by advancingcertain cash payments to eligible TH franchisees in Canada during the second quarter of 2020. Also, during 2020, we offered a rent relief program for eligible THfranchisees in Canada and BK franchisees in the U.S. and Canada and temporarily extended payment terms for eligible TH and BK franchisees in Canada and theU.S. who lease property from us. The rent relief program offered to eligible BK franchisees concluded during the third quarter of 2020 and the rent relief programoffered to eligible TH franchisees was extended through the end of 2021. We also temporarily deferred franchisee capital investment commitments for restaurantrenovations and new restaurant
39

Table of Contents
development globally, based on individual circumstances of relevant markets and restaurant owners. These actions are expected to adversely affect our cash flowand financial results at least through the end of 2021. In addition to these actions, we may decide to take additional steps to assist in the financial stabilization ofour franchisees, which could impact our liquidity and our financial results.
On August 2, 2016, the RBI board of directors approved a share repurchase authorization that allows RBI to purchase up to $300 million of RBI commonshares through July 2021. Repurchases under this authorization will be made in the open market or through privately negotiated transactions. On August 6, 2020,RBI announced that the Toronto Stock Exchange (the “TSX”) had accepted the notice of RBI's intention to renew the normal course issuer bid. Under this normalcourse issuer bid, RBI is permitted to repurchase up to 30,000,015 RBI common shares for the one-year period commencing on August 8, 2020 and ending onAugust 7, 2021, or earlier if RBI completes the repurchases prior to such date. Share repurchases under the normal course issuer bid will be made through thefacilities of the TSX, the New York Stock Exchange (the “NYSE”) and/or other exchanges and alternative Canadian or foreign trading systems, if eligible, or bysuch other means as may be permitted by the TSX and/or the NYSE under applicable law. Partnership unitholders and RBI shareholders may obtain a copy of theprior notice, free of charge, by contacting us. If RBI repurchases any RBI common shares, pursuant to the partnership agreement, Partnership will, immediatelyprior to such repurchase, make a distribution to RBI on its Class A common units in an amount sufficient for RBI to fund such repurchase. As of the date of thisreport, there have been no RBI common share repurchases under the normal course issuer bid.
We provide applicable deferred taxes based on the tax liability or withholding taxes that would be due upon repatriation of unremitted earnings. We willcontinue to monitor our plans for foreign earnings but our expectation is to continue to provide taxes on unremitted earnings.
Debt Instruments and Debt Service Requirements
As of December 31, 2020, our long-term debt consists primarily of borrowings under our Credit Facilities, amounts outstanding under our 2017 4.25%Senior Notes, 2019 3.875% Senior Notes, 2020 5.75% Senior Notes, 2020 3.50% Senior Notes, 2019 4.375% Senior Notes, 2020 4.00% Senior Notes and THFacility (each as defined herein), and obligations under finance leases. For further information about our long-term debt, see Note 8 to the accompanyingconsolidated financial statements included in Part II, Item 8 "Financial Statements and Supplementary Data” of our Annual Report.
Credit Facilities
As of December 31, 2020, there was $6,028 million outstanding principal amount under our senior secured term loan facilities (the “Term Loan Facilities”)with a weighted average interest rate of 1.84%. Based on the amounts outstanding under the Term Loan Facilities and LIBOR as of December 31, 2020, subject toa floor of 0.00%, required debt service for the next twelve months is estimated to be approximately $112 million in interest payments and $72 million in principalpayments. In addition, based on LIBOR as of December 31, 2020, net cash settlements that we expect to pay on our $4,000 million interest rate swaps areestimated to be approximately $90 million for the next twelve months. The Term Loan A matures on October 7, 2024 and the Term Loan B matures onNovember 19, 2026, and we may prepay the Term Loan Facilities in whole or in part at any time. Additionally, subject to certain exceptions, the Term LoanFacilities may be subject to mandatory prepayments using (i) proceeds from non-ordinary course asset dispositions, (ii) proceeds from certain incurrences of debtor (iii) a portion of our annual excess cash flows based upon certain leverage ratios.
As of December 31, 2020, we had no amounts outstanding under our secured revolving credit facility (including revolving loans, swingline loans and lettersof credit) (the “Revolving Credit Facility” and together with the Term Loan Facilities, the “Credit Facilities”), had $2 million of letters of credit issued against theRevolving Credit Facility, and our borrowing availability was $998 million. Funds available under the Revolving Credit Facility may be used to repay other debt,finance debt or RBI share repurchases, fund acquisitions or capital expenditures, and for other general corporate purposes. We have a $125 million letter of creditsublimit as part of the Revolving Credit Facility, which reduces our borrowing availability thereunder by the cumulative amount of outstanding letters of credit.We are also required to pay (i) letters of credit fees on the aggregate face amounts of outstanding letters of credit plus a fronting fee to the issuing bank and (ii)administration fees. The interest rate applicable to amounts drawn under each letter of credit ranges from 0.75% to 1.50%, depending on our net first lien leverageratio.
On April 2, 2020, the Borrowers entered into a fifth amendment (the “Fifth Amendment”) to the credit agreement (the “Credit Agreement”) governing ourTerm Loan Facilities and Revolving Credit Facility. The Fifth Amendment provides the Borrowers with the option to comply with a $1,000 million minimumliquidity covenant in lieu of the 6.50:1.00 net first lien senior secured leverage ratio financial maintenance covenant for the period after June 30, 2020 and prior toSeptember 30, 2021. Additionally, for the periods ending September 30, 2021 and December 31, 2021, to determine compliance with the net first lien seniorsecured leverage ratio, we are permitted to annualize the Adjusted EBITDA (as defined in the Credit Agreement) for the three months ending September 30,
40

Table of Contents
2021 and six months ending December 31, 2021, respectively, in lieu of calculating the ratio based on Adjusted EBITDA for the prior four quarters. There were noother material changes to the terms of the Credit Agreement.
The interest rate applicable to borrowings under our Term Loan A and Revolving Credit Facility is, at our option, either (i) a base rate, subject to a floor of1.00%, plus an applicable margin varying from 0.00% to 0.50%, or (ii) a Eurocurrency rate, subject to a floor of 0.00%, plus an applicable margin varying between0.75% to 1.50%, in each case, determined by reference to a net first lien leverage based pricing grid. The interest rate applicable to borrowings under our TermLoan B is, at our option, either (i) a base rate, subject to a floor of 1.00%, plus an applicable margin of 0.75% or (ii) a Eurocurrency rate, subject to a floor of0.00%, plus an applicable margin of 1.75%.
Obligations under the Credit Facilities are guaranteed on a senior secured basis, jointly and severally, by the direct parent company of one of the Borrowersand substantially all of its Canadian and U.S. subsidiaries, including The TDL Group Corp., Burger King Corporation, Popeyes Louisiana Kitchen, Inc. andsubstantially all of their respective Canadian and U.S. subsidiaries (the “Credit Guarantors”). Amounts borrowed under the Credit Facilities are secured on a firstpriority basis by a perfected security interest in substantially all of the present and future property (subject to certain exceptions) of each Borrower and CreditGuarantor.
Senior Notes
In May 2017, the Borrowers entered into an indenture (the “2017 4.25% Senior Notes Indenture”) in connection with the issuance of $1,500 million of4.25% first lien senior secured notes due May 15, 2024 (the “2017 4.25% Senior Notes”). No principal payments are due until maturity and interest is paid semi-annually. The net proceeds from the offering of the 2020 3.50% Senior Notes were used to redeem $725 million of our 4.25% first lien notes due 2024 and payrelated redemption premiums, fees and expenses.
On September 24, 2019, the Borrowers entered into an indenture (the "2019 3.875% Senior Notes Indenture") in connection with the issuance of $750million of 3.875% first lien senior notes due January 15, 2028 (the "2019 3.875% Senior Notes"). No principal payments are due until maturity and interest is paidsemi-annually.
On November 19, 2019, the Borrowers entered into an indenture (the "2019 4.375% Senior Notes Indenture" and together with the above indentures,including the indentures entered into during 2020, the "Senior Notes Indentures") in connection with the issuance of $750 million of 4.375% second lien seniornotes due January 15, 2028 (the "2019 4.375% Senior Notes"). No principal payments are due until maturity and interest is paid semi-annually.
The Borrowers may redeem a series of senior notes, in whole or in part, at any time prior to May 15, 2020 for the 2017 4.25% Senior Notes, April 15, 2022for the 2020 5.75% Senior Notes, September 15, 2022 for the 2019 3.875% Senior Notes, November 15, 2022 for the 2019 4.375% Senior Notes, February 15,2024 for the 2020 3.50% Senior Notes, and October 15, 2025 for the 2020 4.00% Senior Notes at a price equal to 100% of the principal amount redeemed plus a“make-whole” premium, plus accrued and unpaid interest, if any, to, but excluding, the redemption date. In addition, the Borrowers may redeem, in whole or inpart, the 2017 4.25% Senior Notes, 2020 5.75% Senior Notes, 2019 3.875% Senior Notes, 2019 4.375% Senior Notes, 2020 3.50% Senior Notes and 2020 4.00%Senior Notes on or after the applicable date noted above, at the redemption prices set forth in the applicable Senior Notes Indenture. The Senior Notes Indenturesalso contain redemption provisions related to tender offers, change of control and equity offerings, among others.
Based on the amounts outstanding at December 31, 2020, required debt service for the next twelve months on all of the Senior Notes outstanding isapproximately $266 million in interest payments.
TH Facility
One of our subsidiaries entered into a non-revolving delayed drawdown term credit facility in a total aggregate principal amount of C$225 million with amaturity date of October 4, 2025 (the “TH Facility”). The interest rate applicable to the TH Facility is the Canadian Bankers’ Acceptance rate plus an applicablemargin equal to 1.40% or the Prime Rate plus an applicable margin equal to 0.40%, at our option. Obligations under the TH Facility are guaranteed by four of oursubsidiaries, and amounts borrowed under the TH Facility are secured by certain parcels of real estate. As of December 31, 2020, we had outstanding C$222million under the TH Facility with a weighted average interest rate of 1.86%.
Based on the amounts outstanding under the TH Facility as of December 31, 2020, required debt service for the next twelve months is estimated to beapproximately $3 million in interest payments and $7 million in principal payments.
41
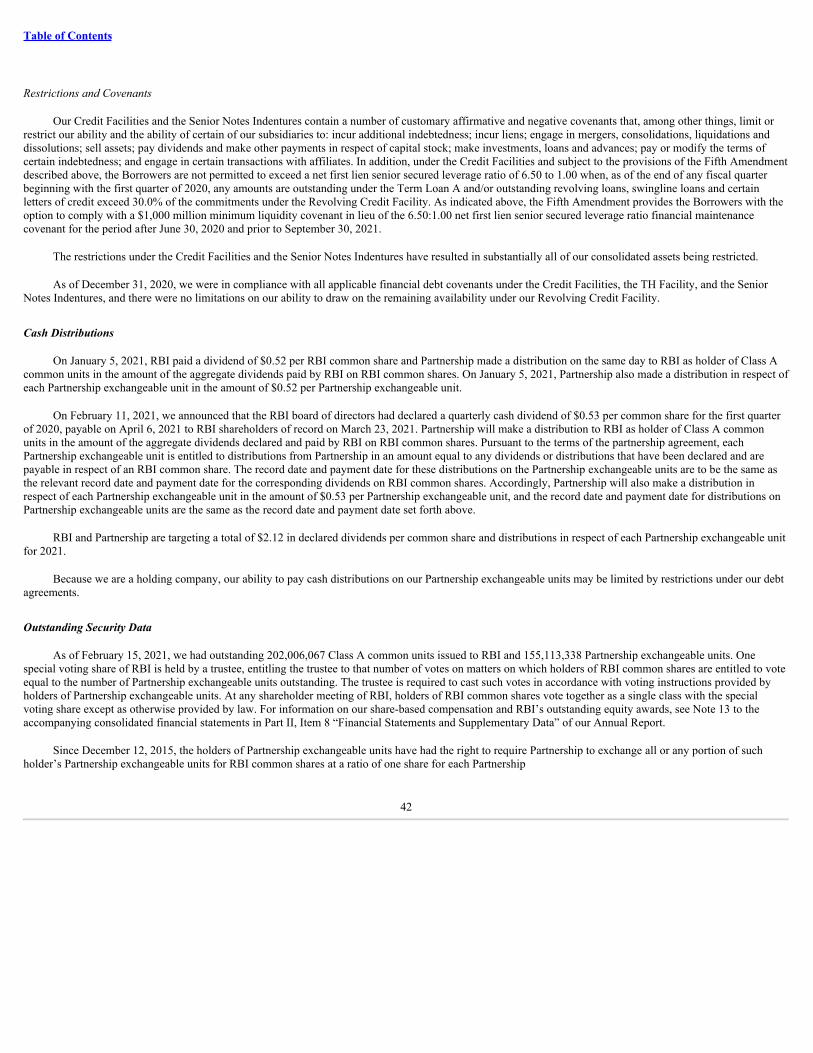
Table of Contents
Restrictions and Covenants
Our Credit Facilities and the Senior Notes Indentures contain a number of customary affirmative and negative covenants that, among other things, limit orrestrict our ability and the ability of certain of our subsidiaries to: incur additional indebtedness; incur liens; engage in mergers, consolidations, liquidations anddissolutions; sell assets; pay dividends and make other payments in respect of capital stock; make investments, loans and advances; pay or modify the terms ofcertain indebtedness; and engage in certain transactions with affiliates. In addition, under the Credit Facilities and subject to the provisions of the Fifth Amendmentdescribed above, the Borrowers are not permitted to exceed a net first lien senior secured leverage ratio of 6.50 to 1.00 when, as of the end of any fiscal quarterbeginning with the first quarter of 2020, any amounts are outstanding under the Term Loan A and/or outstanding revolving loans, swingline loans and certainletters of credit exceed 30.0% of the commitments under the Revolving Credit Facility. As indicated above, the Fifth Amendment provides the Borrowers with theoption to comply with a $1,000 million minimum liquidity covenant in lieu of the 6.50:1.00 net first lien senior secured leverage ratio financial maintenancecovenant for the period after June 30, 2020 and prior to September 30, 2021.
The restrictions under the Credit Facilities and the Senior Notes Indentures have resulted in substantially all of our consolidated assets being restricted.
As of December 31, 2020, we were in compliance with all applicable financial debt covenants under the Credit Facilities, the TH Facility, and the SeniorNotes Indentures, and there were no limitations on our ability to draw on the remaining availability under our Revolving Credit Facility.
Cash Distributions
On January 5, 2021, RBI paid a dividend of $0.52 per RBI common share and Partnership made a distribution on the same day to RBI as holder of Class Acommon units in the amount of the aggregate dividends paid by RBI on RBI common shares. On January 5, 2021, Partnership also made a distribution in respect ofeach Partnership exchangeable unit in the amount of $0.52 per Partnership exchangeable unit.
On February 11, 2021, we announced that the RBI board of directors had declared a quarterly cash dividend of $0.53 per common share for the first quarterof 2020, payable on April 6, 2021 to RBI shareholders of record on March 23, 2021. Partnership will make a distribution to RBI as holder of Class A commonunits in the amount of the aggregate dividends declared and paid by RBI on RBI common shares. Pursuant to the terms of the partnership agreement, eachPartnership exchangeable unit is entitled to distributions from Partnership in an amount equal to any dividends or distributions that have been declared and arepayable in respect of an RBI common share. The record date and payment date for these distributions on the Partnership exchangeable units are to be the same asthe relevant record date and payment date for the corresponding dividends on RBI common shares. Accordingly, Partnership will also make a distribution inrespect of each Partnership exchangeable unit in the amount of $0.53 per Partnership exchangeable unit, and the record date and payment date for distributions onPartnership exchangeable units are the same as the record date and payment date set forth above.
RBI and Partnership are targeting a total of $2.12 in declared dividends per common share and distributions in respect of each Partnership exchangeable unitfor 2021.
Because we are a holding company, our ability to pay cash distributions on our Partnership exchangeable units may be limited by restrictions under our debtagreements.
Outstanding Security Data
As of February 15, 2021, we had outstanding 202,006,067 Class A common units issued to RBI and 155,113,338 Partnership exchangeable units. Onespecial voting share of RBI is held by a trustee, entitling the trustee to that number of votes on matters on which holders of RBI common shares are entitled to voteequal to the number of Partnership exchangeable units outstanding. The trustee is required to cast such votes in accordance with voting instructions provided byholders of Partnership exchangeable units. At any shareholder meeting of RBI, holders of RBI common shares vote together as a single class with the specialvoting share except as otherwise provided by law. For information on our share-based compensation and RBI’s outstanding equity awards, see Note 13 to theaccompanying consolidated financial statements in Part II, Item 8 “Financial Statements and Supplementary Data” of our Annual Report.
Since December 12, 2015, the holders of Partnership exchangeable units have had the right to require Partnership to exchange all or any portion of suchholder’s Partnership exchangeable units for RBI common shares at a ratio of one share for each Partnership
42

Table of Contents
exchangeable unit, subject to RBI’s right as the general partner of Partnership to determine to settle any such exchange for a cash payment in lieu of RBI commonshares.
Comparative Cash Flows
Operating Activities
Cash provided by operating activities was $921 million in 2020, compared to $1,476 million in 2019. The decrease in cash provided by operating activitieswas driven by a decrease in TH segment income, a decrease in BK segment income, an increase in cash used for working capital and an increase in income taxpayments. These factors were partially offset by a decrease in interest payments, a decrease in tenant inducements paid to franchisees and an increase in PLKsegment income.
Cash provided by operating activities was $1,476 million in 2019, compared to $1,165 million in 2018. The increase in cash provided by operating activitieswas driven by a decrease in income tax payments, primarily due to the 2018 payment of accrued income taxes related to the December 2017 redemption of RBIpreferred shares, an increase in BK and PLK segment income and a decrease in cash used for working capital. These factors were partially offset by an increase ininterest payments and a decrease in TH segment income.
Investing Activities
Cash used for investing activities was $79 million in 2020, compared to $30 million in 2019. The change in investing activities was driven by an increase incapital expenditures during the current period.
Cash used for investing activities was $30 million in 2019, compared to $44 million in 2018. The change in investing activities was driven primarily by adecrease in capital expenditures.
Financing Activities
Cash used for financing activities was $821 million in 2020, compared to $842 million in 2019. The decrease in cash used for financing activities was drivenprimarily by an increase in proceeds from issuance of long-term debt, partially offset by an increase in repayments of long-term debt and finance leases, therepurchase of Partnership exchangeable units in 2020, payments from derivatives in 2020 compared to proceeds from derivatives in 2019, an increase in RBIcommon share dividends and distributions on Partnership exchangeable units, and a decrease in proceeds from stock option exercises.
Cash used for financing activities was $842 million in 2019, compared to $1,285 million in 2018. The change in financing activities was driven primarily byproceeds from the Term Loan A and the issuances of the 2019 3.875% Senior Notes and the 2019 4.375% Senior Notes during 2019, an increase in proceeds fromstock option exercises, proceeds from derivatives and the non-recurrence of the 2018 payments in connection with the December 2017 redemption of preferredshares. These factors were partially offset by the redemption of the 2015 4.625% Senior Notes during 2019, Term Loan B prepayments and refinancing during2019, an increase in RBI common share dividends and distributions on Partnership exchangeable units and payment of financing costs.
Contractual Obligations and Commitments
Our significant contractual obligations and commitments as of December 31, 2020 are shown in the following table.
Payment Due by Period
Contractual Obligations TotalLess Than
1 Year 1-3 Years 3-5 YearsMore Than
5 Years (In millions)Credit Facilities, including interest (a) $ 6,654 $ 186 $ 390 $ 964 $ 5,114 Senior Notes, including interest 8,445 266 532 1,733 5,914 Other long-term debt 190 10 26 154 — Operating lease obligations (b) 1,677 198 361 303 815 Purchase commitments (c) 539 507 30 2 — Finance lease obligations 488 50 95 86 257
Total $ 17,993 $ 1,217 $ 1,434 $ 3,242 $ 12,100
43
Table of Contents
(a) We have estimated our interest payments through the maturity of our Credit Facilities based on LIBOR as of December 31, 2020.(b) Operating lease payment obligations have not been reduced by the amount of payments due in the future under subleases.(c) Includes open purchase orders, as well as commitments to purchase certain food ingredients and advertising expenditures, and obligations related to
information technology and service agreements.
We have not included in the contractual obligations table approximately $620 million of gross liabilities for unrecognized tax benefits relating to various taxpositions we have taken. These liabilities may increase or decrease over time primarily as a result of tax examinations, and given the status of the examinations, wecannot reliably estimate the period of any cash settlement with the respective taxing authorities. For additional information on unrecognized tax benefits, see Note10 to the accompanying consolidated financial statements included in Part II, Item 8 “Financial Statements and Supplementary Data” of our Annual Report.
Other Commercial Commitments and Off-Balance Sheet Arrangements
From time to time, we enter into agreements under which we guarantee loans made by third parties to qualified franchisees. As of December 31, 2020, nomaterial amounts are outstanding under these guarantees.
Critical Accounting Policies and Estimates
This discussion and analysis of financial condition and results of operations is based on our audited consolidated financial statements, which have beenprepared in accordance with U.S. GAAP. The preparation of these financial statements requires our management to make estimates and judgments that affect thereported amounts of assets, liabilities, revenues, and expenses, as well as related disclosures of contingent assets and liabilities. We evaluate our estimates on anongoing basis and we base our estimates on historical experience and various other assumptions we deem reasonable to the situation. These estimates andassumptions form the basis for making judgments about the carrying values of assets and liabilities that are not readily apparent from other sources. As futureevents and their effects cannot be determined with precision, actual results could differ significantly from these estimates. Changes in our estimates couldmaterially impact our results of operations and financial condition in any particular period.
We consider our critical accounting policies and estimates to be as follows based on the high degree of judgment or complexity in their application:
Goodwill and Intangible Assets Not Subject to Amortization
Goodwill represents the excess of the purchase price over the fair value of assets acquired and liabilities assumed in acquisitions. Our indefinite-livedintangible assets consist of the Tim Hortons brand, the Burger King brand, and the Popeyes brand (each a “Brand” and together, the “Brands”). Goodwill and theBrands are tested for impairment at least annually as of October 1 of each year and more often if an event occurs or circumstances change, which indicateimpairment might exist. Our annual impairment tests of goodwill and the Brands may be completed through qualitative assessments. We may elect to bypass thequalitative assessment and proceed directly to a quantitative impairment test, for any reporting unit or Brand, in any period. We can resume the qualitativeassessment for any reporting unit or Brand in any subsequent period.
Under a qualitative approach, our impairment review for goodwill consists of an assessment of whether it is more-likely-than-not that a reporting unit’s fairvalue is less than its carrying amount. If we elect to bypass the qualitative assessment for any reporting units, or if a qualitative assessment indicates it is more-likely-than-not that the estimated carrying value of a reporting unit exceeds its fair value, we perform a quantitative goodwill impairment test that requires us toestimate the fair value of the reporting unit. If the fair value of the reporting unit is less than its carrying amount, we will measure any goodwill impairment loss asthe amount by which the carrying amount of a reporting unit exceeds its fair value, not to exceed the total amount of goodwill allocated to that reporting unit. Weuse an income approach and a market approach, when available, to estimate a reporting unit’s fair value, which discounts the reporting unit’s projected cash flowsusing a discount rate we determine from a market participant's perspective under the income approach or utilizing similar publicly traded companies as guidelinesfor determining fair value under the market approach. We make significant assumptions when estimating a reporting unit’s projected cash flows, includingrevenue, driven primarily by net restaurant growth, comparable sales growth and average royalty rates, general and administrative expenses, capital expendituresand income tax rates.
Under a qualitative approach, our impairment review for the Brands consists of an assessment of whether it is more-likely-than-not that a Brand’s fair valueis less than its carrying amount. If we elect to bypass the qualitative assessment for any of our Brands, or if a qualitative assessment indicates it is more-likely-than-not that the estimated carrying value of a Brand exceeds its fair value, we estimate the fair value of the Brand and compare it to its carrying amount. If the carryingamount exceeds fair value, an impairment loss is recognized in an amount equal to that excess. We use an income approach to estimate a Brand’s fair value, whichdiscounts the
44

Table of Contents
projected Brand-related cash flows using a discount rate we determine from a market participant's perspective. We make significant assumptions when estimatingBrand-related cash flows, including system-wide sales, driven by net restaurant growth and comparable sales growth, average royalty rates, brand maintenancecosts and income tax rates.
We completed our impairment reviews for goodwill and the Brands as of October 1, 2020, 2019 and 2018 and no impairment resulted. The estimates andassumptions we use to estimate fair values when performing quantitative assessments are highly subjective judgments based on our experience and knowledge ofour operations. Significant changes in the assumptions used in our analysis could result in an impairment charge related to goodwill or the Brands. Circumstancesthat could result in changes to future estimates and assumptions include, but are not limited to, expectations of lower system-wide sales growth, which can becaused by a variety of factors, increases in income tax rates and increases in discount rates. Based on the annual impairment tests performed in 2020, the fair valuesof all of our reporting units and Brands were substantially in excess of their carrying amounts.
Long-lived Assets
Long-lived assets (including intangible assets subject to amortization and lease right-of-use assets) are tested for impairment whenever events or changes incircumstances indicate that the carrying amount of an asset may not be recoverable. Long-lived assets are grouped for recognition and measurement of impairmentat the lowest level for which identifiable cash flows are largely independent of the cash flows of other assets.
The impairment test for long-lived assets requires us to assess the recoverability of our long-lived assets by comparing their net carrying value to the sum ofundiscounted estimated future cash flows directly associated with and arising from our use and eventual disposition of the assets. If the net carrying value of agroup of long-lived assets exceeds the sum of related undiscounted estimated future cash flows, we would be required to record an impairment charge equal to theexcess, if any, of net carrying value over fair value.
When assessing the recoverability of our long-lived assets, we make assumptions regarding estimated future cash flows and other factors. Some of theseassumptions involve a high degree of judgment and also bear a significant impact on the assessment conclusions. Included among these assumptions are estimatingundiscounted future cash flows, including the projection of rental income, capital requirements for maintaining property and residual values of asset groups. Weformulate estimates from historical experience and assumptions of future performance, based on business plans and forecasts, recent economic and business trends,and competitive conditions. In the event that our estimates or related assumptions change in the future, we may be required to record an impairment charge.
Accounting for Income Taxes
We record income tax liabilities utilizing known obligations and estimates of potential obligations. A deferred tax asset or liability is recognized wheneverthere are future tax effects from existing temporary differences and operating loss and tax credit carry-forwards. When considered necessary, we record a valuationallowance to reduce deferred tax assets to the balance that is more-likely-than-not to be realized. We must make estimates and judgments on future taxable income,considering feasible tax planning strategies and taking into account existing facts and circumstances, to determine the proper valuation allowance. When wedetermine that deferred tax assets could be realized in greater or lesser amounts than recorded, the asset balance and income statement reflect the change in theperiod such determination is made. Due to changes in facts and circumstances and the estimates and judgments that are involved in determining the propervaluation allowance, differences between actual future events and prior estimates and judgments could result in adjustments to this valuation allowance.
We file income tax returns, including returns for our subsidiaries, with federal, provincial, state, local and foreign jurisdictions. We are subject to routineexamination by taxing authorities in these jurisdictions. We apply a two-step approach to recognizing and measuring uncertain tax positions. The first step is toevaluate available evidence to determine if it appears more-likely-than-not that an uncertain tax position will be sustained on an audit by a taxing authority, basedsolely on the technical merits of the tax position. The second step is to measure the tax benefit as the largest amount that is more than 50% likely of being realizedupon settling the uncertain tax position.
Although we believe we have adequately accounted for our uncertain tax positions, from time to time, audits result in proposed assessments where theultimate resolution may result in us owing additional taxes. We adjust our uncertain tax positions in light of changing facts and circumstances, such as thecompletion of a tax audit, expiration of a statute of limitations, the refinement of an estimate, and interest accruals associated with uncertain tax positions until theyare resolved. We believe that our tax positions comply with applicable tax law and that we have adequately provided for these matters. However, to the extent thatthe final tax outcome of these matters is different than the amounts recorded, such differences will impact the provision for income taxes in the period in whichsuch determination is made.
45
Table of Contents
In prior periods, we provided deferred taxes on certain undistributed foreign earnings. Under our transition to a modified territorial tax system whereby allpreviously untaxed undistributed foreign earnings are subject to a transition tax charge at reduced rates and future repatriations of foreign earnings will generallybe exempt from U.S. tax, we wrote off the existing deferred tax liability on undistributed foreign earnings and recorded the impact of the new transition tax chargeon foreign earnings. We will continue to monitor available evidence and our plans for foreign earnings and expect to continue to provide any applicable deferredtaxes based on the tax liability or withholding taxes that would be due upon repatriation of amounts not considered permanently reinvested.
We use an estimate of the annual effective income tax rate at each interim period based on the facts and circumstances available at that time, while the actualeffective income tax rate is calculated at year-end.
See Note 10 to the accompanying consolidated financial statements included in Part II, Item 8 “Financial Statements and Supplementary Data” of ourAnnual Report for additional information about accounting for income taxes.
New Accounting Pronouncements
See Note 2, “Significant Accounting Policies – New Accounting Pronouncements,” to the accompanying consolidated financial statements included in PartII, Item 8 “Financial Statements and Supplementary Data” of our Annual Report for a discussion of new accounting pronouncements.
Item 7A. Quantitative and Qualitative Disclosures About Market Risk
Market Risk
We are exposed to market risks associated with currency exchange rates, interest rates, commodity prices and inflation. In the normal course of business andin accordance with our policies, we manage these risks through a variety of strategies, which may include the use of derivative financial instruments to hedge ourunderlying exposures. Our policies prohibit the use of derivative instruments for speculative purposes, and we have procedures in place to monitor and control theiruse.
Currency Exchange Risk
We report our results in U.S. dollars, which is our reporting currency. The operations of each of TH, BK, and PLK that are denominated in currencies otherthan the U.S. dollar are impacted by fluctuations in currency exchange rates and changes in currency regulations. The majority of TH’s operations, income,revenues, expenses and cash flows are denominated in Canadian dollars, which we translate to U.S. dollars for financial reporting purposes. Royalty paymentsfrom BK franchisees in our European markets and in certain other countries are denominated in currencies other than U.S. dollars. Furthermore, franchise royaltiesfrom each of TH’s, BK’s, and PLK's international franchisees are calculated based on local currency sales; consequently franchise revenues are still impacted byfluctuations in currency exchange rates. Each of their respective revenues and expenses are translated using the average rates during the period in which they arerecognized and are impacted by changes in currency exchange rates.
We have numerous investments in our foreign subsidiaries, the net assets of which are exposed to volatility in foreign currency exchange rates. We haveentered into cross-currency rate swaps to hedge a portion of our net investment in such foreign operations against adverse movements in foreign currency exchangerates. We designated cross-currency rate swaps with a notional value of $5,000 million between Canadian dollar and U.S. dollar and cross-currency rate swapswith a notional value of $2,100 million between the Euro and U.S. dollar, as net investment hedges of a portion of our equity in foreign operations in thosecurrencies. The fair value of the cross-currency rate swaps is calculated each period with changes in the fair value of these instruments reported in accumulatedother comprehensive income (loss) (“AOCI”) to economically offset the change in the value of the net investment in these designated foreign operations driven bychanges in foreign currency exchange rates. The net fair value of these derivative instruments was a liability of $434 million as of December 31, 2020. The netunrealized losses, net of tax, related to these derivative instruments included in AOCI totaled $365 million as of December 31, 2020. Such amounts will remain inAOCI until the complete or substantially complete liquidation of our investment in the underlying foreign operations.
We use forward currency contracts to manage the impact of foreign exchange fluctuations on U.S. dollar purchases and payments, such as coffee and certainintercompany purchases, made by our TH Canadian operations. However, for a variety of reasons, we do not hedge our revenue exposure in other currencies.Therefore, we are exposed to volatility in those other currencies, and this volatility may differ from period to period. As a result, the foreign currency impact on ouroperating results for one period may not be indicative of future results.
46

Table of Contents
During 2020, income from operations would have decreased or increased approximately $73 million if all foreign currencies uniformly weakened orstrengthened 10% relative to the U.S. dollar, holding other variables constant, including sales volumes. The effect of a uniform movement of all currencies by 10%is provided to illustrate a hypothetical scenario and related effect on operating income. Actual results will differ as foreign currencies may move in uniform ordifferent directions and in different magnitudes.
Interest Rate Risk
We are exposed to changes in interest rates related to our Term Loan Facilities and Revolving Credit Facility, which bear interest at LIBOR plus a spread,subject to a LIBOR floor. Generally, interest rate changes could impact the amount of our interest paid and, therefore, our future earnings and cash flows, assumingother factors are held constant. To mitigate the impact of changes in LIBOR on interest expense for a portion of our variable rate debt, we have entered into interestrate swaps. We account for these derivatives as cash flow hedges, and as such, the unrealized changes in market value are recorded in AOCI and reclassified intoearnings during the period in which the hedged forecasted transaction affects earnings. At December 31, 2020, we had a series of receive-variable, pay-fixedinterest rate swaps to hedge the variability in the interest payments on $4,000 million of our Term Loan Facilities. The total notional value of these interest rateswaps is $4,000 million, of which $3,500 million expire on November 19, 2026 and $500 million expire on September 30, 2026.
Based on the portion of our variable rate debt balance in excess of the notional amount of the interest rate swaps and LIBOR as of December 31, 2020, ahypothetical 1.00% increase in LIBOR would increase our annual interest expense by approximately $20 million.
The discontinuation of LIBOR after June 2023 and the replacement with an alternative reference rate may adversely impact interest rates and our interestexpense could increase.
Commodity Price Risk
We purchase certain products, which are subject to price volatility that is caused by weather, market conditions and other factors that are not consideredpredictable or within our control. However, in our TH business, we employ various purchasing and pricing contract techniques, such as setting fixed prices forperiods of up to one year with suppliers, in an effort to minimize volatility of certain of these commodities. Given that we purchase a significant amount of greencoffee, we typically have purchase commitments fixing the price for a minimum of six to twelve months depending upon prevailing market conditions. We alsotypically hedge against the risk of foreign exchange on green coffee prices.
We occasionally take forward pricing positions through our suppliers to manage commodity prices. As a result, we purchase commodities and other productsat market prices, which fluctuate on a daily basis and may differ between different geographic regions, where local regulations may affect the volatility ofcommodity prices.
We do not make use of financial instruments to hedge commodity prices. As we make purchases beyond our current commitments, we may be subject tohigher commodity prices depending upon prevailing market conditions at such time. Generally, increases and decreases in commodity costs are largely passedthrough to franchisee owners, resulting in higher or lower revenues and higher or lower costs of sales from our business. These changes may impact margins asmany of these products are typically priced based on a fixed-dollar mark-up. We and our franchisees have some ability to increase product pricing to offset a rise incommodity prices, subject to acceptance by franchisees and guests.
Impact of Inflation
We believe that our results of operations are not materially impacted by moderate changes in the inflation rate. Inflation did not have a material impact onour operations in 2020, 2019 or 2018. However, severe increases in inflation could affect the global, Canadian and U.S. economies and could have an adverseimpact on our business, financial condition and results of operations. If several of the various costs in our business experience inflation at the same time, such ascommodity price increases beyond our ability to control and increased labor costs, we and our franchisees may not be able to adjust prices to sufficiently offset theeffect of the various cost increases without negatively impacting consumer demand.
47

Table of Contents
Disclosures Regarding Partnership Pursuant to Canadian Exemptive Relief
RBI is the sole general partner of Partnership. To address certain disclosure conditions to the exemptive relief that Partnership received from the Canadiansecurities regulatory authorities, RBI provides a summary of certain terms of the Partnership exchangeable units in its annual report on Form 10-K. The samesummary is provided below. This summary is not complete and is qualified in its entirety by the complete text of the Amended and Restated Limited PartnershipAgreement, dated December 11, 2014, between RBI, 8997896 Canada Inc. and each person who is admitted as a Limited Partner in accordance with the terms ofthe agreement (the “partnership agreement”) and the Voting Trust Agreement, dated December 12, 2014, between RBI, Partnership and Computershare TrustCompany of Canada (the “voting trust agreement”), copies of which are available on SEDAR at www.sedar.com and at www.sec.gov.
The Partnership Exchangeable Units
The capital of Partnership consists of three classes of units: the Partnership Class A common units, the Partnership preferred units and the Partnershipexchangeable units. The interest of RBI, as the sole general partner of Partnership, is represented by Class A common units and preferred units. The interests of thelimited partners is represented by the Partnership exchangeable units.
Summary of Economic and Voting Rights
The Partnership exchangeable units are intended to provide economic rights that are substantially equivalent, and voting rights with respect to RBI that areequivalent, to the corresponding rights afforded to holders of RBI common shares. Under the terms of the partnership agreement, the rights, privileges, restrictionsand conditions attaching to the Partnership exchangeable units include the following:
• The Partnership exchangeable units are exchangeable at any time, at the option of the holder (the “exchange right”), on a one-for-one basis forcommon shares of RBI (the “exchanged shares”), subject to RBI’s right as the general partner (subject to the approval of the conflicts committee incertain circumstances) to determine to settle any such exchange for a cash payment in lieu of RBI common shares. If RBI elects to make a cashpayment in lieu of issuing common shares, the amount of the cash payment will be the weighted average trading price of the common shares on theNYSE for the 20 consecutive trading days ending on the last business day prior to the exchange date (the “exchangeable units cash amount”).Written notice of the determination of the form of consideration shall be given to the holder of the Partnership exchangeable units exercising theexchange right no later than ten business days prior to the exchange date.
• If a dividend or distribution has been declared and is payable in respect of a common share of RBI, Partnership will make a distribution in respect ofeach Partnership exchangeable unit in an amount equal to the dividend or distribution in respect of a common share. The record date and paymentdate for distributions on the Partnership exchangeable units will be the same as the relevant record date and payment date for the dividends ordistributions on RBI common shares.
• If RBI issues any common shares in the form of a dividend or distribution on the RBI common shares, Partnership will issue to each holder ofPartnership exchangeable units, in respect of each exchangeable unit held by such holder, a number of Partnership exchangeable units equal to thenumber of common shares issued in respect of each common share.
• If RBI issues or distributes rights, options or warrants or other securities or assets of RBI to all or substantially all of the holders of its commonshares, Partnership is required to make a corresponding distribution to holders of the Partnership exchangeable units.
• No subdivision or combination of RBI’s outstanding common shares is permitted unless a corresponding subdivision or combination of Partnershipexchangeable units is made.
• RBI and its board of directors are prohibited from proposing or recommending an offer for its common shares or for the Partnership exchangeableunits unless the holders of the Partnership exchangeable units and the holders of common shares are entitled to participate to the same extent and onan equitably equivalent basis.
• Upon a dissolution and liquidation of Partnership, if Partnership exchangeable units remain outstanding and have not been exchanged for RBIcommon shares, then the distribution of the assets of Partnership between holders of RBI common shares and holders of Partnership exchangeableunits will be made on a pro rata basis based on the numbers of common shares and Partnership exchangeable units outstanding. Assets distributableto holders of Partnership exchangeable units will be distributed directly to such holders. Assets distributable in respect of RBI common shares willbe distributed to RBI. Prior to this pro rata distribution, Partnership is required to pay to RBI sufficient amounts to fund RBI’s expenses or otherobligations (to the extent related to RBI’s role as the general partner or its business and affairs that are conducted through Partnership or itssubsidiaries) to ensure that any property and cash distributed to RBI in respect of the common shares will be available for distribution to holders ofcommon shares in an amount per share equal to distributions in respect of each Partnership exchangeable unit. The terms of the Partnershipexchangeable units do not provide for an automatic exchange of Partnership exchangeable units into common shares upon a dissolution orliquidation of Partnership or RBI.
48

Table of Contents
• Approval of holders of the Partnership exchangeable units is required for an action (such as an amendment to the partnership agreement) that wouldaffect the economic rights of a Partnership exchangeable unit relative to a common share of RBI.
• The holders of Partnership exchangeable units are indirectly entitled to vote in respect of matters on which holders of RBI common shares areentitled to vote, including in respect of the election of RBI’s directors, through a special voting share of RBI. The special voting share is held by atrustee, entitling the trustee to that number of votes on matters on which holders of common shares are entitled to vote equal to the number ofPartnership exchangeable units outstanding. The trustee is required to cast such votes in accordance with voting instructions provided by holders ofPartnership exchangeable units. The trustee will exercise each vote attached to the special voting share only as directed by the relevant holder ofPartnership exchangeable units and, in the absence of instructions from a holder of an exchangeable unit as to voting, will not exercise those votes.Except as otherwise required by the partnership agreement, voting trust agreement or applicable law, the holders of the Partnership exchangeableunits are not directly entitled to receive notice of or to attend any meeting of the unitholders of Partnership or to vote at any such meeting.
Exercise of Optional Exchange Right
In order to exercise the exchange right referred to above, a holder of Partnership exchangeable units must deliver to Partnership’s transfer agent a dulyexecuted exchange notice together with such additional documents and instruments as the transfer agent and Partnership may reasonably require. The exchangenotice must (i) specify the number of Partnership exchangeable units in respect of which the holder is exercising the exchange right and (ii) state the business dayon which the holder desires to have Partnership exchange the subject units, provided that the exchange date must not be less than 15 business days nor more than30 business days after the date on which the exchange notice is received by Partnership. If no exchange date is specified in an exchange notice, the exchange datewill be deemed to be the 15th business day after the date on which the exchange notice is received by Partnership. An exercise of the exchange right may berevoked by the exercising holder by notice in writing given to Partnership before the close of business on the fifth business day immediately preceding theexchange date. On the exchange date, Partnership will deliver or cause the transfer agent to deliver to the relevant holder, as applicable (i) the applicable number ofexchanged shares, or (ii) a cheque representing the applicable exchangeable units cash amount, in each case, less any amounts withheld on account of tax.
Offers for Units or Shares
The partnership agreement contains provisions to the effect that if a take-over bid is made for all of the outstanding Partnership exchangeable units and notless than 90% of the Partnership exchangeable units (other than units of Partnership held at the date of the take-over bid by or on behalf of the offeror or itsassociates, affiliates or persons acting jointly or in concert with the offeror) are taken up and paid for by the offeror, the offeror will be entitled to acquire thePartnership exchangeable units held by unitholders who did not accept the offer on the terms offered by the offeror. The partnership agreement further providesthat for so long as Partnership exchangeable units remain outstanding, (i) RBI will not propose or recommend a formal bid for RBI common shares, and no suchbid will be effected with the consent or approval of RBI’s board of directors, unless holders of Partnership exchangeable units are entitled to participate in the bidto the same extent and on an equitably equivalent basis as the holders of RBI’s common shares, and (ii) RBI will not propose or recommend a formal bid forPartnership exchangeable units, and no such bid will be effected with the consent or approval of RBI’s board of directors, unless holders of the RBI commonshares are entitled to participate in the bid to the same extent and on an equitably equivalent basis as the holders of Partnership exchangeable units. Canadiansecurities regulatory authorities may intervene in the public interest (either on application by an interested party or by staff of a Canadian securities regulatoryauthority) to prevent an offer to holders of RBI common shares, Preferred Shares or Partnership exchangeable units being made or completed where such offer isabusive of the holders of one of those security classes that are not subject to that offer.
Merger, Sale or Other Disposition of Assets
As long as any Partnership exchangeable units are outstanding, RBI cannot consummate a transaction in which all or substantially all of its assets wouldbecome the property of any other person or entity. This does not apply to a transaction if such other person or entity becomes bound by the partnership agreementand assumes RBI’s obligations, as long as the transaction does not impair in any material respect the rights, duties, powers and authorities of other parties to thepartnership agreement.
Mandatory Exchange
Partnership may cause a mandatory exchange of the outstanding Partnership exchangeable units into RBI common shares in the event that (1) at any timethere remain outstanding fewer than 5% of the number of Partnership exchangeable units outstanding as of the effective time of the Merger (other than Partnershipexchangeable units held by RBI and its subsidiaries and as such number of Partnership exchangeable units may be adjusted in accordance with the partnershipagreement); (2) any one of the following occurs: (i) any person, firm or corporation acquires directly or indirectly any voting security of RBI and immediately aftersuch acquisition, the acquirer has voting securities representing more than 50% of the total voting power of all the then outstanding voting securities of RBI on afully diluted basis, (ii) the shareholders of RBI shall approve a merger, consolidation, recapitalization or reorganization of
49

Table of Contents
RBI, other than any transaction which would result in the holders of outstanding voting securities of RBI immediately prior to such transaction having at least amajority of the total voting power represented by the voting securities of the surviving entity outstanding immediately after such transaction, with the voting powerof each such continuing holder relative to other continuing holders not being altered substantially in the transaction; or (iii) the shareholders of RBI shall approve aplan of complete liquidation of RBI or an agreement for the sale or disposition of RBI of all or substantially all of RBI’s assets, provided that, in each case, RBI, inits capacity as the general partner of Partnership, determines, in good faith and in its sole discretion, that such transaction involves a bona fide third party and is notfor the primary purpose of causing the exchange of the Partnership exchangeable units in connection with such transaction; or (3) a matter arises in respect ofwhich applicable law provides holders of Partnership exchangeable units with a vote as holders of units of Partnership in order to approve or disapprove, asapplicable, any change to, or in the rights of the holders of, the Partnership exchangeable units, where the approval or disapproval, as applicable, of such changewould be required to maintain the economic equivalence of the Partnership exchangeable units and the RBI common shares, and the holders of the Partnershipexchangeable units fail to take the necessary action at a meeting or other vote of holders of Partnership exchangeable units to approve or disapprove, as applicable,such matter in order to maintain economic equivalence of the Partnership exchangeable units and the RBI common shares.
50

Table of Contents
Special Note Regarding Forward-Looking Statements
Certain information contained in our Annual Report, including information regarding future financial performance and plans, targets, aspirations,expectations, and objectives of management, constitute forward-looking statements within the meaning of the Private Securities Litigation Reform Act of 1995 andforward-looking information within the meaning of the Canadian securities laws. We refer to all of these as forward-looking statements. Forward-lookingstatements are forward-looking in nature and, accordingly, are subject to risks and uncertainties. These forward-looking statements can generally be identified bythe use of words such as “believe”, “anticipate”, “expect”, “intend”, “estimate”, “plan”, “continue”, “will”, “may”, “could”, “would”, “target”, “potential”and other similar expressions and include, without limitation, statements regarding our expectations or beliefs regarding (i) our ability to become one of the mostefficient franchised QSR operators in the world; (ii) the benefits of our fully franchised business model; (iii) the domestic and international growth opportunitiesfor the Tim Hortons, Burger King and Popeyes brands, both in existing and new markets; (iv) our ability to accelerate international development through jointventure structures and master franchise and development agreements and the impact on future growth and profitability of our brands; (v) our continued use ofjoint ventures structures and master franchise and development agreements in connection with our domestic and international expansion; (vi) the impact of ourstrategies on the growth of our Tim Hortons, Burger King and Popeyes brands and our profitability; (vii) our commitment to technology and innovation and ourplans and strategies with respect to digital sales, our information systems and technology offerings and investments; (viii) the correlation between our sales, guesttraffic and profitability to consumer discretionary spending and the factors that influence spending; (ix) our ability to drive traffic, expand our customer base andallow restaurants to expand into new dayparts through new product innovation; (x) the benefits accrued from sharing and leveraging best practices among ourTim Hortons, Burger King and Popeyes brands; (xi) the drivers of the long-term success for and competitive position of each of our brands as well as increasedsales and profitability of our franchisees; (xii) the impact of our cost management initiatives at each of our brands; (xiii) the continued use of certain franchiseincentives and their impact on our financial results; (xiv) the impact of our modern image remodel initiative and our ability to mitigate the negative impact of suchinitiative on royalty rates through entry into new BK franchise agreements; (xv) the effects of the COVID-19 pandemic on our results of operations, business,liquidity and prospects and those of our franchisees; (xvi) our future financial obligations, including annual debt service requirements, capital expenditures anddistribution payments, our ability to meet such obligations and the source of liquidity used to satisfy such obligations; (xvii) our future uses of liquidity, includingdistribution payments and share repurchases; (xviii) our efforts to assist restaurant owners in maintaining liquidity and the impact of these programs on our futurecash flow and financial results; (xix) the amount and timing of future Corporate restructuring and tax advisory fees and office centralization and relocation costs;(xx) our exposure to changes in interest rates and foreign currency exchange rates and the impact of changes in interest rates and foreign currency exchange rateson the amount of our interest payments, future earnings and cash flows; (xxi) the amount of net cash settlements we expect to pay on our derivative instruments;(xxii) our tax positions and their compliance with applicable tax laws; (xxiii) certain accounting matters, including the impact of changes in accounting standards;(xxiv) certain tax matters, including our estimates with respect to tax matters and their impact on future periods; (xxv) the impact of inflation on our results ofoperations; (xxvi) the impact of governmental regulation, both domestically and internationally, on our business and financial and operational results; (xxvii) theadequacy of our facilities to meet our current requirements; (xxviii) our future financial and operational results; (xxix) certain litigation matters; (xxx) our targettotal distribution for 2021; and (xxxi) our sustainability initiatives and the impact of government sustainability regulation and initiatives.
These forward looking statements represent management’s expectations as of the date hereof. These forward-looking statements are based on certainassumptions and analyses that we made in light of our experience and our perception of historical trends, current conditions and expected future developments, aswell as other factors we believe are appropriate in the circumstances. However, these forward-looking statements are subject to a number of risks anduncertainties and actual results may differ materially from those expressed or implied in such statements. Important factors that could cause actual results, level ofactivity, performance or achievements to differ materially from those expressed or implied by these forward-looking statements include, among other things, risksrelated to: (1) our substantial indebtedness, which could adversely affect our financial condition and prevent us from fulfilling our obligations; (2) globaleconomic or other business conditions that may affect the desire or ability of our customers to purchase our products such as the effects of the COVID-19pandemic, inflationary pressures, high unemployment levels, declines in median income growth, consumer confidence and consumer discretionary spending andchanges in consumer perceptions of dietary health and food safety; (3) our relationship with, and the success of, our franchisees and risks related to our fullyfranchised business model; (4) our franchisees' financial stability and their ability to access and maintain the liquidity necessary to operate their businesses; (5)our supply chain operations; (6) our ownership and leasing of real estate; (7) the effectiveness of our marketing, advertising and digital programs and franchiseesupport of these programs; (8) significant and rapid fluctuations in interest rates and in the currency exchange markets and the effectiveness of our hedgingactivity; (9) our ability to successfully implement our domestic and international growth strategy for each of our brands and risks related to our internationaloperations; (10) our reliance on master franchisees and subfranchisees to accelerate restaurant growth; (11) the ability of the counterparties to our creditfacilities’ and derivatives’ to fulfill their commitments and/or obligations; (12) changes in applicable tax laws or interpretations thereof; and our ability toaccurately interpret and predict the impact of such changes or interpretations on our financial condition and results.
51

Table of Contents
Finally, our future results will depend upon various other risks and uncertainties, including, but not limited to, those detailed in the section entitled “Item 1A- Risk Factors” of our Annual Report as well as other materials that we from time to time file with, or furnish to, the SEC or file with Canadian securitiesregulatory authorities on SEDAR. All forward-looking statements attributable to us or persons acting on our behalf are expressly qualified in their entirety by thecautionary statements in this section and elsewhere in this Annual Report. Other than as required under securities laws, we do not assume a duty to update theseforward-looking statements, whether as a result of new information, subsequent events or circumstances, changes in expectations or otherwise.
52

Table of Contents
Item 8. Financial Statements and Supplementary Data
RESTAURANT BRANDS INTERNATIONAL LIMITED PARTNERSHIP AND SUBSIDIARIES
INDEX TO CONSOLIDATED FINANCIAL STATEMENTS PageManagement’s Report on Internal Control Over Financial Reporting 54Reports of Independent Registered Public Accounting Firm 55Consolidated Balance Sheets 58Consolidated Statements of Operations 59Consolidated Statements of Comprehensive Income (Loss) 60Consolidated Statements of Equity 61Consolidated Statements of Cash Flows 62Notes to Consolidated Financial Statements 63
53
Table of Contents
Management’s Report on Internal Control Over Financial Reporting
Management of Restaurant Brands International Inc. (“RBI”), the sole general partner of Restaurant Brands International Limited Partnership (the “Partnership”),is responsible for the preparation, integrity and fair presentation of the consolidated financial statements, related notes and other information included in this annualreport. The consolidated financial statements were prepared in accordance with accounting principles generally accepted in the United States of America andinclude certain amounts based on management’s estimates and assumptions. Other financial information presented in the annual report is derived from theconsolidated financial statements.
Management is also responsible for establishing and maintaining adequate internal control over financial reporting, and for performing an assessment of theeffectiveness of internal control over financial reporting as of December 31, 2020. Internal control over financial reporting is a process designed to providereasonable assurance regarding the reliability of financial reporting and the preparation of financial statements for external purposes in accordance with generallyaccepted accounting principles. Our system of internal control over financial reporting includes those policies and procedures that (i) pertain to the maintenance ofrecords that, in reasonable detail, accurately and fairly reflect the transactions and dispositions of the assets of Partnership; (ii) provide reasonable assurance thattransactions are recorded as necessary to permit preparation of financial statements in accordance with generally accepted accounting principles, and that receiptsand expenditures of Partnership are being made only in accordance with authorizations of management and directors of RBI; and (iii) provide reasonable assuranceregarding prevention or timely detection of unauthorized acquisition, use or disposition of Partnership’s assets that could have a material effect on the consolidatedfinancial statements.
Management performed an assessment of the effectiveness of Partnership’s internal control over financial reporting as of December 31, 2020 based on criteriaestablished in Internal Control — Integrated Framework (2013) issued by the Committee of Sponsoring Organizations of the Treadway Commission (COSO).Based on our assessment and those criteria, management determined that Partnership’s internal control over financial reporting was effective as of December 31,2020.
Because of its inherent limitations, internal control over financial reporting may not prevent or detect misstatements. Also, projections of any evaluation ofeffectiveness to future periods are subject to the risk that controls may become inadequate because of changes in conditions, or that the degree of compliance withthe policies or procedures may deteriorate.
The effectiveness of Partnership’s internal control over financial reporting as of December 31, 2020 has been audited by KPMG LLP, Partnership’s independentregistered public accounting firm, as stated in its report which is included herein.
54

Table of Contents
Report of Independent Registered Public Accounting Firm
To the Partners, Restaurant Brands International Limited Partnership, and Board of Directors,Restaurant Brands International Inc., the sole general partner of Restaurant Brands International Limited Partnership:
Opinion on the Consolidated Financial Statements
We have audited the accompanying consolidated balance sheets of Restaurant Brands International Limited Partnership and subsidiaries (the “Partnership”) as ofDecember 31, 2020 and 2019, the related consolidated statements of operations, comprehensive income (loss), equity, and cash flows for each of the years in thethree-year period ended December 31, 2020, and the related notes (collectively, the “consolidated financial statements”). In our opinion, the consolidated financialstatements present fairly, in all material respects, the financial position of the Partnership as of December 31, 2020 and 2019, and the results of its operations andits cash flows for each of the years in the three-year period ended December 31, 2020, in conformity with U.S. generally accepted accounting principles.
We also have audited, in accordance with the standards of the Public Company Accounting Oversight Board (United States) (“PCAOB”), the Partnership’s internalcontrol over financial reporting as of December 31, 2020, based on criteria established in Internal Control - Integrated Framework (2013) issued by the Committeeof Sponsoring Organizations of the Treadway Commission, and our report dated February 23, 2021 expressed an unqualified opinion on the effectiveness of thePartnership’s internal control over financial reporting.
Changes in Accounting Principle
As discussed in Note 2 to the consolidated financial statements, the Partnership has changed its method of accounting for leases as of January 1, 2019, due to theadoption of Accounting Standards Codification Topic 842, Leases.
Basis for Opinion
These consolidated financial statements are the responsibility of the Partnership’s management. Our responsibility is to express an opinion on these consolidatedfinancial statements based on our audits. We are a public accounting firm registered with the PCAOB and are required to be independent with respect to thePartnership in accordance with the U.S. federal securities laws and the applicable rules and regulations of the Securities and Exchange Commission and thePCAOB.
We conducted our audits in accordance with the standards of the PCAOB. Those standards require that we plan and perform the audit to obtain reasonableassurance about whether the consolidated financial statements are free of material misstatement, whether due to error or fraud. Our audits included performingprocedures to assess the risks of material misstatement of the consolidated financial statements, whether due to error or fraud, and performing procedures thatrespond to those risks. Such procedures included examining, on a test basis, evidence regarding the amounts and disclosures in the consolidated financialstatements. Our audits also included evaluating the accounting principles used and significant estimates made by management, as well as evaluating the overallpresentation of the consolidated financial statements. We believe that our audits provide a reasonable basis for our opinion.
Critical Audit Matter
The critical audit matter communicated below is a matter arising from the current period audit of the consolidated financial statements that was communicated orrequired to be communicated to the audit committee and that: (1) relates to accounts or disclosures that are material to the consolidated financial statements and (2)involved our especially challenging, subjective, or complex judgments. The communication of a critical audit matter does not alter in any way our opinion on theconsolidated financial statements, taken as a whole, and we are not, by communicating the critical audit matter below, providing a separate opinion on the criticalaudit matter or on the accounts or disclosures to which it relates.
Gross unrecognized tax benefits
As discussed in Notes 2 and 10 to the consolidated financial statements, the Partnership records a liability for unrecognized tax benefits associated withuncertain tax positions. The Partnership recognizes tax benefits from tax positions only if there is more than a 50% likelihood that the tax positions will besustained upon examination by the taxing authorities, based on the technical merits of the positions. As of December 31, 2020, the Partnership hasrecorded gross unrecognized tax benefits, excluding associated interest and penalties, of $497 million.
55

Table of Contents
We identified the assessment of gross unrecognized tax benefits resulting from the implementation of certain tax planning strategies as a critical auditmatter. Identifying and determining uncertain tax positions arising from implementing tax planning strategies involved a number of judgments andassumptions, which included complex considerations of tax law. As a result, subjective and complex auditor judgment, including the involvement of taxprofessionals with specialized skills and knowledge, was required to evaluate the Partnership’s interpretation of tax law and its determination of which taxpositions have more than a 50% likelihood of being sustained upon examination.
The following are the primary procedures we performed to address this critical audit matter. We evaluated the design and tested the operatingeffectiveness of certain internal controls over the Partnership’s gross unrecognized tax benefit process, including controls related to 1) interpreting taxlaw, 2) identifying significant uncertain tax positions arising from tax planning strategies that were implemented during the year, 3) evaluating the taxconsequences of the related strategies, and 4) evaluating which of the Partnership’s tax positions may not be sustained upon examination. In addition, weinvolved tax professionals with specialized skills and knowledge, who assisted in:
• obtaining an understanding of the Partnership’s tax planning strategies• evaluating the Partnership’s interpretation of the relevant tax laws by developing an independent assessment• evaluating the Partnership’s identification of uncertain tax positions to assess the tax consequences of these related tax positions• performing an independent assessment of the Partnership’s tax positions and comparing our assessment to the Partnership’s assessment.
(signed) KPMG LLP
We have served as the Partnership's auditor since 1989.
Miami, FloridaFebruary 23, 2021
56
Table of Contents
Report of Independent Registered Public Accounting Firm
To the Partners, Restaurant Brands International Limited Partnership, and Board of Directors,Restaurant Brands International Inc., the sole general partner of Restaurant Brands International Limited Partnership:
Opinion on Internal Control over Financial Reporting
We have audited Restaurant Brands International Limited Partnership and subsidiaries’ (the “Partnership”) internal control over financial reporting as ofDecember 31, 2020, based on criteria established in Internal Control – Integrated Framework (2013) issued by the Committee of Sponsoring Organizations of theTreadway Commission. In our opinion, the Partnership maintained, in all material respects, effective internal control over financial reporting as of December 31,2020, based on criteria established in Internal Control – Integrated Framework (2013) issued by the Committee of Sponsoring Organizations of the TreadwayCommission.
We also have audited, in accordance with the standards of the Public Company Accounting Oversight Board (United States) (“PCAOB”), the consolidated balancesheets of the Partnership as of December 31, 2020 and 2019, the related consolidated statements of operations, comprehensive income (loss), equity, and cashflows for each of the years in the three-year period ended December 31, 2020, and the related notes (collectively, the “consolidated financial statements”), and ourreport dated February 23, 2021 expressed an unqualified opinion on those consolidated financial statements.
Basis for Opinion
The Partnership’s management is responsible for maintaining effective internal control over financial reporting and for its assessment of the effectiveness ofinternal control over financial reporting, included in the accompanying Management's Report on Internal Control over Financial Reporting. Our responsibility is toexpress an opinion on the Partnership’s internal control over financial reporting based on our audit. We are a public accounting firm registered with the PCAOBand are required to be independent with respect to the Partnership in accordance with the U.S. federal securities laws and the applicable rules and regulations of theSecurities and Exchange Commission and the PCAOB.
We conducted our audit in accordance with the standards of the PCAOB. Those standards require that we plan and perform the audit to obtain reasonable assuranceabout whether effective internal control over financial reporting was maintained in all material respects. Our audit of internal control over financial reportingincluded obtaining an understanding of internal control over financial reporting, assessing the risk that a material weakness exists, and testing and evaluating thedesign and operating effectiveness of internal control based on the assessed risk. Our audit also included performing such other procedures as we considerednecessary in the circumstances. We believe that our audit provides a reasonable basis for our opinion.
Definition and Limitations of Internal Control over Financial Reporting
A company’s internal control over financial reporting is a process designed to provide reasonable assurance regarding the reliability of financial reporting and thepreparation of financial statements for external purposes in accordance with generally accepted accounting principles. A company’s internal control over financialreporting includes those policies and procedures that (1) pertain to the maintenance of records that, in reasonable detail, accurately and fairly reflect thetransactions and dispositions of the assets of the company; (2) provide reasonable assurance that transactions are recorded as necessary to permit preparation offinancial statements in accordance with generally accepted accounting principles, and that receipts and expenditures of the company are being made only inaccordance with authorizations of management and directors of the company; and (3) provide reasonable assurance regarding prevention or timely detection ofunauthorized acquisition, use, or disposition of the company’s assets that could have a material effect on the financial statements.
Because of its inherent limitations, internal control over financial reporting may not prevent or detect misstatements. Also, projections of any evaluation ofeffectiveness to future periods are subject to the risk that controls may become inadequate because of changes in conditions, or that the degree of compliance withthe policies or procedures may deteriorate.
(signed) KPMG LLP
Miami, FloridaFebruary 23, 2021
57

Table of Contents
RESTAURANT BRANDS INTERNATIONAL LIMITED PARTNERSHIP AND SUBSIDIARIESConsolidated Balance Sheets
(In millions of U.S. dollars, except unit data)
As of December 31, 2020 2019
ASSETS Current assets:
Cash and cash equivalents $ 1,560 $ 1,533 Accounts and notes receivable, net of allowance of $42 and $13, respectively 536 527 Inventories, net 96 84 Prepaids and other current assets 72 52
Total current assets 2,264 2,196 Property and equipment, net of accumulated depreciation and amortization of $879 and $746, respectively 2,031 2,007 Operating lease assets, net 1,152 1,176 Intangible assets, net 10,701 10,563 Goodwill 5,739 5,651 Net investment in property leased to franchisees 66 48 Other assets, net 824 719
Total assets $ 22,777 $ 22,360 LIABILITIES AND EQUITY
Current liabilities:Accounts and drafts payable $ 464 $ 644 Other accrued liabilities 835 790 Gift card liability 191 168 Current portion of long-term debt and finance leases 111 101
Total current liabilities 1,601 1,703 Long-term debt, net of current portion 12,397 11,759 Finance leases, net of current portion 315 288 Operating lease liabilities, net of current portion 1,082 1,089 Other liabilities, net 2,236 1,698 Deferred income taxes, net 1,425 1,564
Total liabilities 19,056 18,101 Commitments and contingencies (Note 18)Partners’ capital:
Class A common units - 202,006,067 units issued and outstanding at December 31, 2020 and December 31, 2019 7,994 7,786 Partnership exchangeable units - 155,113,338 units issued and outstanding at December 31, 2020; 165,507,199 unitsissued and outstanding at December 31, 2019 (3,002) (2,353)Accumulated other comprehensive income (loss) (1,275) (1,178)
Total Partners’ capital 3,717 4,255 Noncontrolling interests 4 4
Total equity 3,721 4,259 Total liabilities and equity $ 22,777 $ 22,360
See accompanying notes to consolidated financial statements.
Approved on behalf of the Board of Directors of Restaurant Brands International Inc., as general partner of Restaurant Brands International Limited Partnership:
By: /s/ Daniel Schwartz By: /s/ Ali Hedayat
Daniel Schwartz, Co-Chairman of Restaurant Brands International Inc.
Ali Hedayat, Director of Restaurant Brands InternationalInc.
58
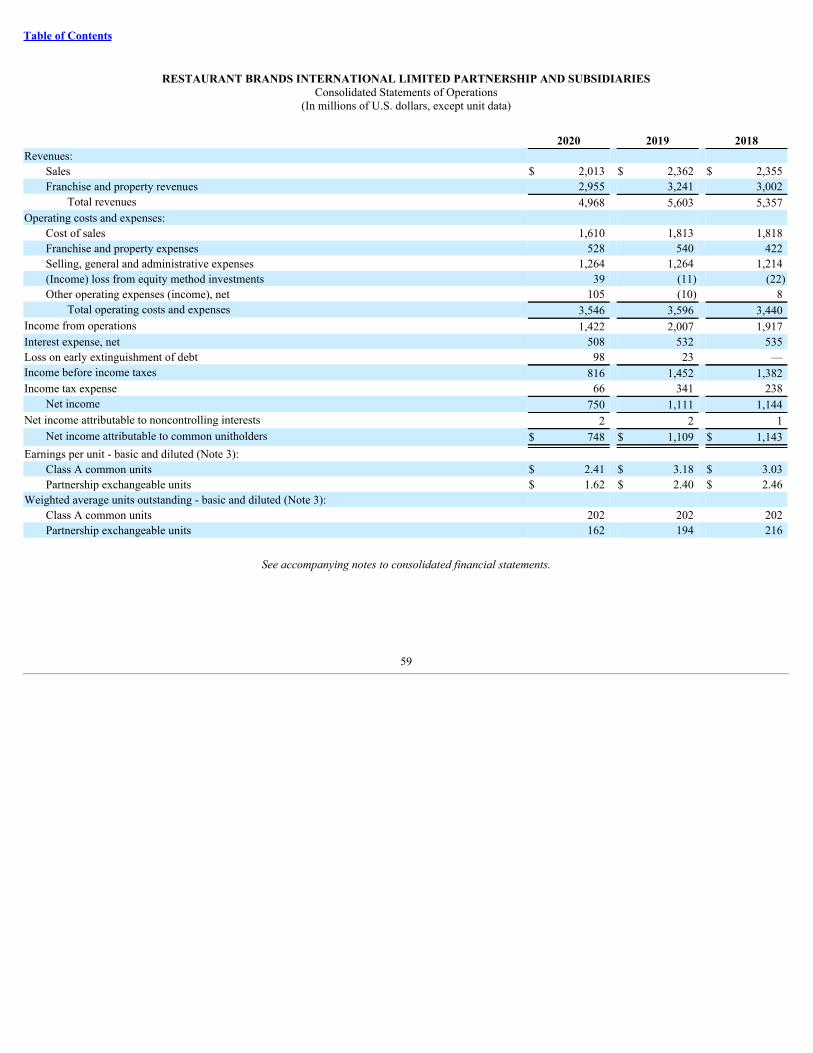
Table of Contents
RESTAURANT BRANDS INTERNATIONAL LIMITED PARTNERSHIP AND SUBSIDIARIESConsolidated Statements of Operations
(In millions of U.S. dollars, except unit data)
2020 2019 2018Revenues:
Sales $ 2,013 $ 2,362 $ 2,355 Franchise and property revenues 2,955 3,241 3,002
Total revenues 4,968 5,603 5,357 Operating costs and expenses:
Cost of sales 1,610 1,813 1,818 Franchise and property expenses 528 540 422 Selling, general and administrative expenses 1,264 1,264 1,214 (Income) loss from equity method investments 39 (11) (22)Other operating expenses (income), net 105 (10) 8
Total operating costs and expenses 3,546 3,596 3,440 Income from operations 1,422 2,007 1,917 Interest expense, net 508 532 535 Loss on early extinguishment of debt 98 23 — Income before income taxes 816 1,452 1,382 Income tax expense 66 341 238
Net income 750 1,111 1,144 Net income attributable to noncontrolling interests 2 2 1
Net income attributable to common unitholders $ 748 $ 1,109 $ 1,143 Earnings per unit - basic and diluted (Note 3):
Class A common units $ 2.41 $ 3.18 $ 3.03 Partnership exchangeable units $ 1.62 $ 2.40 $ 2.46
Weighted average units outstanding - basic and diluted (Note 3):Class A common units 202 202 202 Partnership exchangeable units 162 194 216
See accompanying notes to consolidated financial statements.
59
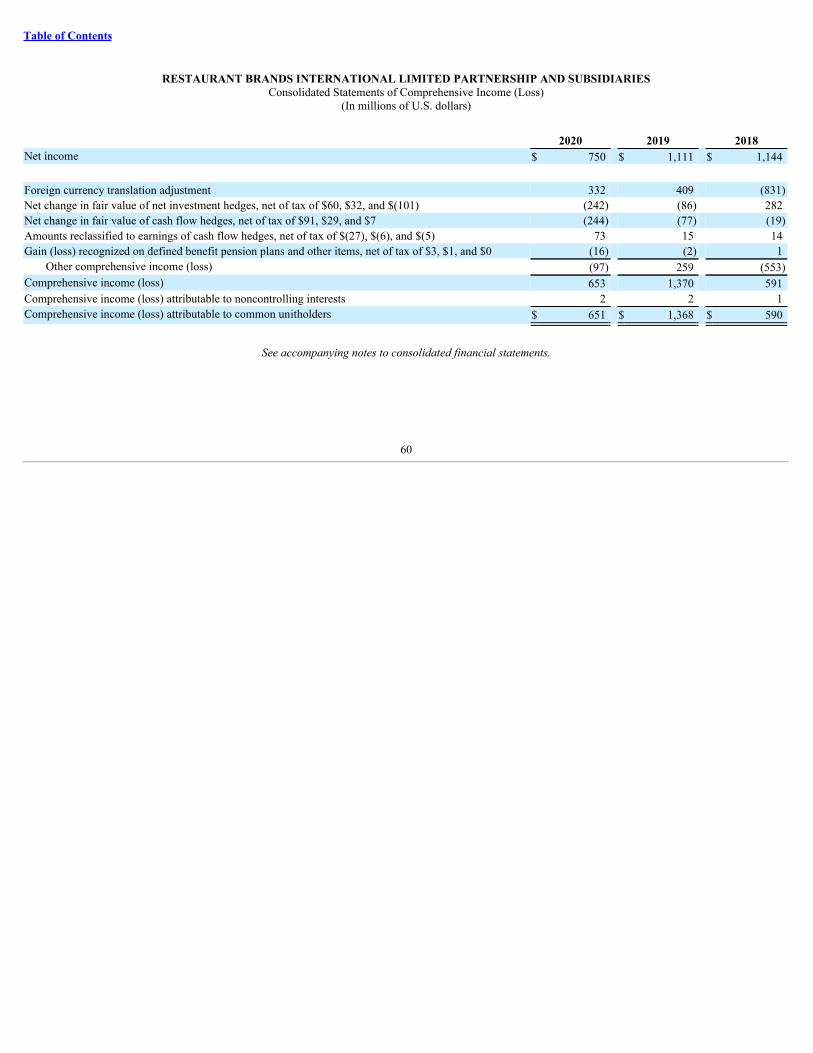
Table of Contents
RESTAURANT BRANDS INTERNATIONAL LIMITED PARTNERSHIP AND SUBSIDIARIESConsolidated Statements of Comprehensive Income (Loss)
(In millions of U.S. dollars)
2020 2019 2018Net income $ 750 $ 1,111 $ 1,144
Foreign currency translation adjustment 332 409 (831)Net change in fair value of net investment hedges, net of tax of $60, $32, and $(101) (242) (86) 282 Net change in fair value of cash flow hedges, net of tax of $91, $29, and $7 (244) (77) (19)Amounts reclassified to earnings of cash flow hedges, net of tax of $(27), $(6), and $(5) 73 15 14 Gain (loss) recognized on defined benefit pension plans and other items, net of tax of $3, $1, and $0 (16) (2) 1
Other comprehensive income (loss) (97) 259 (553)Comprehensive income (loss) 653 1,370 591 Comprehensive income (loss) attributable to noncontrolling interests 2 2 1 Comprehensive income (loss) attributable to common unitholders $ 651 $ 1,368 $ 590
See accompanying notes to consolidated financial statements.
60

Table of Contents
RESTAURANT BRANDS INTERNATIONAL LIMITED PARTNERSHIP AND SUBSIDIARIESConsolidated Statements of Equity
(In millions of U.S. dollars, except unit data)
Class A
Common UnitsPartnership
Exchangeable unitsAccumulated
Other Comprehensive Income (Loss)
Noncontrolling Interests Total Units Amount Units Amount
Balances at December 31, 2017 202,006,067 $ 4,168 217,708,924 $ 1,276 $ (884) $ 1 $ 4,561 Cumulative effect adjustment (Note 14) — (132) — (118) — — (250)Distributions declared on Class A common units ($2.23 per unit) — (452) — — — — (452)Distributions declared on partnership exchangeable units ($1.80 perunit) — — — (387) — — (387)Exchange of Partnership exchangeable units for RBI common shares — 11 (185,333) (11) — — — Repurchase of Partnership exchangeable units — — (10,000,000) (561) — — (561)Capital contribution from RBI Inc. — 116 — — — — 116 Restaurant VIE distributions — — — — — — — Net income — 612 — 531 — 1 1,144 Other comprehensive income (loss) — — — — (553) — (553)
Balances at December 31, 2018 202,006,067 $ 4,323 207,523,591 $ 730 $ (1,437) $ 2 $ 3,618 Cumulative effect adjustment (Note 9) — 12 — 9 — — 21 Distributions declared on Class A common units ($2.70 per unit) — (545) — — — — (545)Distributions declared on partnership exchangeable units ($2.00 perunit) — — — (382) — — (382)Exchange of Partnership exchangeable units for RBI common shares — 3,176 (42,016,392) (3,176) — — — Capital contribution from RBI Inc. — 177 — — — — 177 Restaurant VIE distributions — — — — — — — Net income — 643 — 466 — 2 1,111 Other comprehensive income (loss) — — — — 259 — 259
Balances at December 31, 2019 202,006,067 $ 7,786 165,507,199 $ (2,353) $ (1,178) $ 4 $ 4,259 Distributions declared on Class A common units ($3.12 per unit) — (631) — — — — (631)Distributions declared on partnership exchangeable units ($2.08 perunit) — — — (336) — — (336)Exchange of Partnership exchangeable units for RBI common shares — 195 (3,636,169) (195) — — — Repurchase of Partnership exchangeable units — — (6,757,692) (380) — — (380)Capital contribution from RBI Inc. — 158 — — — — 158 Restaurant VIE distributions — — — — — (2) (2)Net income — 486 — 262 — 2 750 Other comprehensive income (loss) — — — — (97) — (97)
Balances at December 31, 2020 202,006,067 $ 7,994 155,113,338 $ (3,002) $ (1,275) $ 4 $ 3,721
See accompanying notes to consolidated financial statements.
61
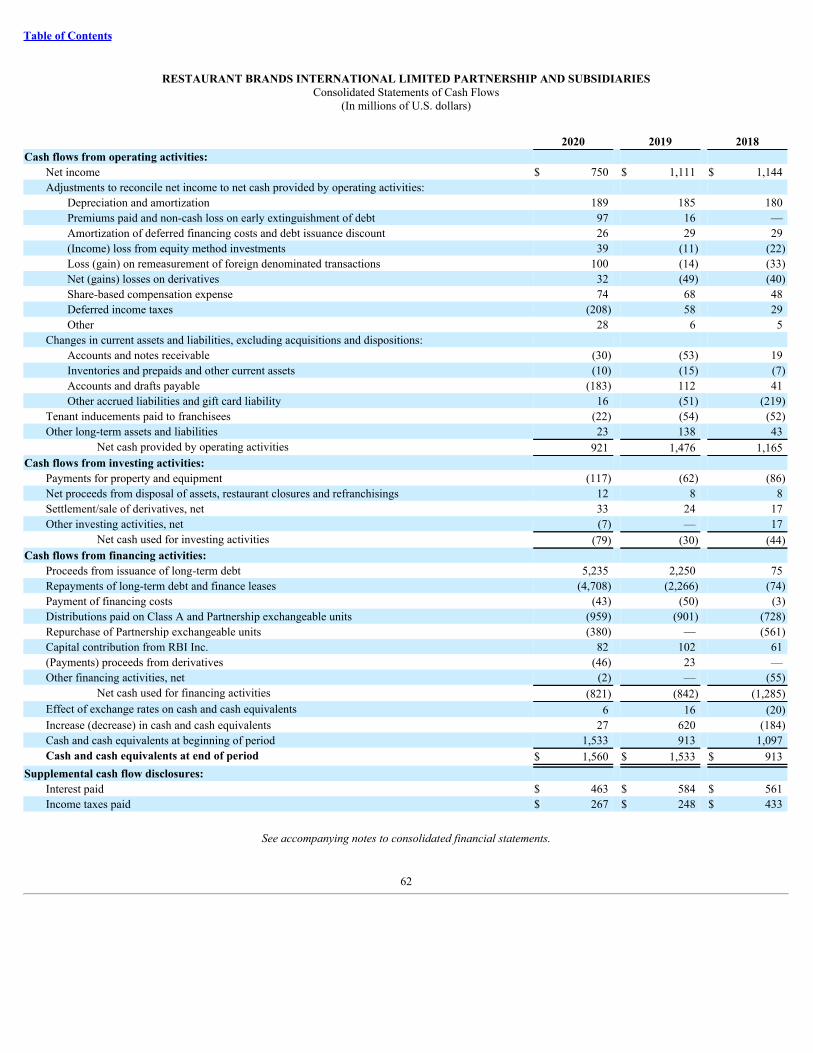
Table of Contents
RESTAURANT BRANDS INTERNATIONAL LIMITED PARTNERSHIP AND SUBSIDIARIESConsolidated Statements of Cash Flows
(In millions of U.S. dollars)
2020 2019 2018Cash flows from operating activities:
Net income $ 750 $ 1,111 $ 1,144 Adjustments to reconcile net income to net cash provided by operating activities:
Depreciation and amortization 189 185 180 Premiums paid and non-cash loss on early extinguishment of debt 97 16 — Amortization of deferred financing costs and debt issuance discount 26 29 29 (Income) loss from equity method investments 39 (11) (22)Loss (gain) on remeasurement of foreign denominated transactions 100 (14) (33)Net (gains) losses on derivatives 32 (49) (40)Share-based compensation expense 74 68 48 Deferred income taxes (208) 58 29 Other 28 6 5
Changes in current assets and liabilities, excluding acquisitions and dispositions:Accounts and notes receivable (30) (53) 19 Inventories and prepaids and other current assets (10) (15) (7)Accounts and drafts payable (183) 112 41 Other accrued liabilities and gift card liability 16 (51) (219)
Tenant inducements paid to franchisees (22) (54) (52)Other long-term assets and liabilities 23 138 43
Net cash provided by operating activities 921 1,476 1,165 Cash flows from investing activities:
Payments for property and equipment (117) (62) (86)Net proceeds from disposal of assets, restaurant closures and refranchisings 12 8 8 Settlement/sale of derivatives, net 33 24 17 Other investing activities, net (7) — 17
Net cash used for investing activities (79) (30) (44)Cash flows from financing activities:
Proceeds from issuance of long-term debt 5,235 2,250 75 Repayments of long-term debt and finance leases (4,708) (2,266) (74)Payment of financing costs (43) (50) (3)Distributions paid on Class A and Partnership exchangeable units (959) (901) (728)Repurchase of Partnership exchangeable units (380) — (561)Capital contribution from RBI Inc. 82 102 61 (Payments) proceeds from derivatives (46) 23 — Other financing activities, net (2) — (55)
Net cash used for financing activities (821) (842) (1,285)Effect of exchange rates on cash and cash equivalents 6 16 (20)Increase (decrease) in cash and cash equivalents 27 620 (184)Cash and cash equivalents at beginning of period 1,533 913 1,097 Cash and cash equivalents at end of period $ 1,560 $ 1,533 $ 913
Supplemental cash flow disclosures:Interest paid $ 463 $ 584 $ 561 Income taxes paid $ 267 $ 248 $ 433
See accompanying notes to consolidated financial statements.
62
Table of Contents
RESTAURANT BRANDS INTERNATIONAL LIMITED PARTNERSHIP AND SUBSIDIARIES
Notes to Consolidated Financial Statements
Note 1. Description of Business and Organization
Description of Business
Restaurant Brands International Limited Partnership (“Partnership”, “we”, “us” or “our”) is a Canadian limited partnership. We franchise and operate quickservice restaurants serving premium coffee and other beverage and food products under the Tim Hortons® brand (“Tim Hortons” or “TH”), fast food hamburgersprincipally under the Burger King® brand (“Burger King” or “BK”), and chicken under the Popeyes® brand (“Popeyes” or “PLK”). We are one of the world’slargest quick service restaurant, or QSR, companies as measured by total number of restaurants. As of December 31, 2020, we franchised or owned 4,949 TimHortons restaurants, 18,625 Burger King restaurants, and 3,451 Popeyes restaurants, for a total of 27,025 restaurants, and operate in more than 100 countries.Approximately 100% of current system-wide restaurants are franchised.
We are a subsidiary of Restaurant Brands International Inc. (“RBI”). RBI is our sole general partner, and as such, RBI has the exclusive right, power andauthority to manage, control, administer and operate the business and affairs and to make decisions regarding the undertaking and business of Partnership inaccordance with the partnership agreement of Partnership (“partnership agreement”) and applicable laws.
All references to “$” or “dollars” are to the currency of the United States unless otherwise indicated. All references to “Canadian dollars” or “C$” are to thecurrency of Canada unless otherwise indicated.
COVID-19
The global crisis resulting from the spread of coronavirus (“COVID-19”) has had a substantial impact on our global restaurant operations during 2020.During 2020, some TH, BK and PLK restaurants were temporarily closed in certain countries and many of the restaurants that remained open had limitedoperations, such as drive-thru, takeout and delivery (where applicable) and that currently remains the case.
Our operating results substantially depend upon our franchisees’ sales volumes, restaurant profitability, and financial stability. The financial impact ofCOVID-19 has had, and is expected to continue for an uncertain period to have, an adverse effect on many of our franchisees’ liquidity and we have workedclosely with our franchisees to monitor and assist them with access to appropriate sources of liquidity in order to sustain their businesses throughout this crisis,such as offering rent relief programs for eligible franchisees who lease property from us. See Note 9, Leases, for further information about the rent relief programs.Additionally, we provided cash flow support by extending loans to eligible BK franchisees in the U.S. during the second and third quarters of 2020, and byadvancing certain cash payments to eligible TH franchisees in Canada during the second quarter of 2020.
During 2020, we recorded bad debt expense of $33 million compared to insignificant bad debt expense during 2019 and 2018. While these receivablesremain contractually due and payable to us, the certainty of the amount and timing of payments has been impacted by the COVID-19 pandemic. Therefore, our baddebt expense during 2020 reflects an adjustment to our historical collections experience to incorporate an estimate of the impact of current economic conditionsresulting from the COVID-19 pandemic. Actual collections may be materially higher or lower than this estimate reflects since it is reasonably possible the durationand future impact of the COVID-19 pandemic on our business or our franchisees may differ from our assumptions. Ongoing material adverse effects of theCOVID-19 pandemic on our franchisees for an extended period could negatively affect our operating results, including reductions in revenue and cash flow andcould impact our impairment assessments of accounts receivable, long-lived assets, intangible assets or goodwill.
Note 2. Significant Accounting Policies
Basis of Presentation
The preparation of consolidated financial statements in conformity with accounting principles generally accepted in the United States (“GAAP”) and relatedrules and regulations of the U.S. Securities and Exchange Commission requires our management to make estimates and assumptions that affect the reportedamounts of assets, liabilities, revenues and expenses, and the related disclosure of contingent assets and liabilities. Actual results could differ from these estimates.
Principles of Consolidation
The consolidated financial statements (the "Financial Statements") include our accounts and the accounts of entities in which we have a controlling financialinterest, the usual condition of which is ownership of a majority voting interest. All material intercompany
63
Table of Contents
balances and transactions have been eliminated in consolidation. Investments in other affiliates that are owned 50% or less where we have significant influence areaccounted for by the equity method.
We also consider for consolidation entities in which we have certain interests, where the controlling financial interest may be achieved through arrangementsthat do not involve voting interests. Such an entity, known as a variable interest entity (“VIE”), is required to be consolidated by its primary beneficiary. Theprimary beneficiary is the entity that possesses the power to direct the activities of the VIE that most significantly impact its economic performance and has theobligation to absorb losses or the right to receive benefits from the VIE that are significant to it. Our maximum exposure to loss resulting from involvement withVIEs is attributable to accounts and notes receivable balances, outstanding loan guarantees and future lease payments, where applicable.
As our franchise and master franchise arrangements provide the franchise and master franchise entities the power to direct the activities that mostsignificantly impact their economic performance, we do not consider ourselves the primary beneficiary of any such entity that might be a VIE.
Tim Hortons has historically entered into certain arrangements in which an operator acquires the right to operate a restaurant, but Tim Hortons owns therestaurant’s assets. In these arrangements, Tim Hortons has the ability to determine which operators manage the restaurants and for what duration. We perform ananalysis to determine if the legal entity in which operations are conducted is a VIE and consolidate a VIE entity if we also determine Tim Hortons is the entity’sprimary beneficiary (“Restaurant VIEs”). As of December 31, 2020 and 2019, we determined that we are the primary beneficiary of 38 and 35 Restaurant VIEs,respectively, and accordingly, have consolidated the results of operations, assets and liabilities, and cash flows of these Restaurant VIEs in our FinancialStatements.
Assets and liabilities related to consolidated VIEs are not significant to our total consolidated assets and liabilities. Liabilities recognized as a result ofconsolidating these VIEs do not necessarily represent additional claims on our general assets; rather, they represent claims against the specific assets of theconsolidated VIEs. Conversely, assets recognized as a result of consolidating these VIEs do not represent additional assets that could be used to satisfy claims byour creditors as they are not legally included within our general assets.
Reclassifications
Certain prior year amounts in the accompanying consolidated financial statements and notes to the consolidated financial statements have been reclassifiedin order to be comparable with the current year classifications.
Foreign Currency Translation and Transaction Gains and Losses
Our functional currency is the U.S. dollar, since our term loans and senior secured notes are denominated in U.S. dollars. The functional currency of each ofour operating subsidiaries is generally the currency of the economic environment in which the subsidiary primarily does business. Our foreign subsidiaries’financial statements are translated into U.S. dollars using the foreign exchange rates applicable to the dates of the financial statements. Assets and liabilities aretranslated using the end-of-period spot foreign exchange rates. Income, expenses and cash flows are translated at the average foreign exchange rates for eachperiod. Equity accounts are translated at historical foreign exchange rates. The effects of these translation adjustments are reported as a component of accumulatedother comprehensive income (loss) (“AOCI”) in the consolidated statements of equity.
For any transaction that is denominated in a currency different from the entity’s functional currency, we record a gain or loss based on the differencebetween the foreign exchange rate at the transaction date and the foreign exchange rate at the transaction settlement date (or rate at period end, if unsettled) whichis included within other operating expenses (income), net in the consolidated statements of operations.
Cash and Cash Equivalents
All highly liquid investments with original maturities of three months or less and credit card receivables are considered cash equivalents.
Inventories
Inventories are carried at the lower of cost or net realizable value and consist primarily of raw materials such as green coffee beans and finished goods suchas new equipment, parts, paper supplies and restaurant food items. The moving average method is used to determine the cost of raw materials and finished goodsinventories held for sale to Tim Hortons franchisees.
Property and Equipment, net
We record property and equipment at historical cost less accumulated depreciation and amortization, which is recognized using the straight-line method overthe following estimated useful lives: (i) buildings and improvements – up to 40 years; (ii) restaurant
64
Table of Contents
equipment – up to 17 years; (iii) furniture, fixtures and other – up to 10 years; and (iv) manufacturing equipment – up to 25 years. Leasehold improvements toproperties where we are the lessee are amortized over the lesser of the remaining term of the lease or the estimated useful life of the improvement.
Major improvements are capitalized, while maintenance and repairs are expensed when incurred.
Leases
We transitioned to Financial Accounting Standards Board (“FASB”) Accounting Standards Codification (“ASC”) Topic 842, Leases (“ASC 842”), fromASC Topic 840, Leases (the “Previous Standard”) on January 1, 2019. Our Financial Statements reflect the application of ASC 842 guidance beginning in 2019,while our Financial Statements for prior periods were prepared under the guidance of the Previous Standard.
In all leases, whether we are the lessor or lessee, we define lease term as the noncancellable term of the lease plus any renewals covered by renewal optionsthat are reasonably certain of exercise based on our assessment of the economic factors relevant to the lessee. The noncancellable term of the lease commences onthe date the lessor makes the underlying property in the lease available to the lessee, irrespective of when lease payments begin under the contract.
Lessor Accounting
We recognize lease payments for operating leases as property revenue on a straight-line basis over the lease term, and property revenue is presented net ofany related sales tax. Lease incentive payments we make to lessees are amortized as a reduction in property revenue over the lease term. In accordance with ASC842, we account for reimbursements of maintenance and property tax costs paid to us by lessees as property revenue. These expenses and reimbursements werepresented on a net basis under the Previous Standard.
We also have net investments in properties leased to franchisees, which meet the criteria of sales-type leases under ASC 842 or met the criteria of directfinancing leases under the Previous Standard. Investments in sales-type leases and direct financing leases are recorded on a net basis. Profit or loss on sales-typeleases is recognized at lease commencement and recorded in other operating expenses (income), net. Unearned income on direct financing leases is deferred,included in the net investment in the lease, and recognized over the lease term yielding a constant periodic rate of return on the net investment in the lease.
We recognize variable lease payment income in the period when changes in facts and circumstances on which the variable lease payments are based occur.
Lessee Accounting
In accordance with ASC 842, in leases where we are the lessee, we recognize a right-of-use (“ROU”) asset and lease liability at lease commencement, whichare measured by discounting lease payments using our incremental borrowing rate as the discount rate. We determine the incremental borrowing rate applicable toeach lease by reference to our outstanding secured borrowings and implied spreads over the risk-free discount rates that correspond to the term of each lease, asadjusted for the currency of the lease. Subsequent amortization of the ROU asset and accretion of the lease liability for an operating lease is recognized as a singlelease cost, on a straight-line basis, over the lease term. Reductions of the ROU asset and the change in the lease liability are included in changes in Other long-termassets and liabilities in the Consolidated Statement of Cash Flows.
Under the Previous Standard, we did not recognize assets and liabilities for the rights and obligations created by operating leases and recorded rental expensefor operating leases on a straight-line basis over the lease term, net of any applicable lease incentive amortization.
A finance lease ROU asset is depreciated on a straight-line basis over the lesser of the useful life of the leased asset or lease term. Interest on each financelease liability is determined as the amount that results in a constant periodic discount rate on the remaining balance of the liability. Operating lease and financelease ROU assets are assessed for impairment in accordance with our long-lived asset impairment policy.
We reassess lease classification and remeasure ROU assets and lease liabilities when a lease is modified and that modification is not accounted for as aseparate contract or upon certain other events that require reassessment in accordance with ASC 842. Maintenance and property tax expenses are accounted for onan accrual basis as variable lease cost.
We recognize variable lease cost in the period when changes in facts and circumstances on which the variable lease payments are based occur.
Goodwill and Intangible Assets Not Subject to Amortization
Goodwill represents the excess of the purchase price over the fair value of assets acquired and liabilities assumed in connection with the acquisition of Popeyesin 2017, the acquisition of Tim Hortons in 2014 and the acquisition of Burger King Holdings, Inc. by
65

Table of Contents
3G Capital Partners Ltd. in 2010. Our indefinite-lived intangible assets consist of the Tim Hortons brand, the Burger King brand, and the Popeyes brand (each a“Brand” and together, the “Brands”). Goodwill and the Brands are tested for impairment at least annually as of October 1 of each year and more often if an eventoccurs or circumstances change which indicate impairment might exist. Our annual impairment tests of goodwill and the Brands may be completed throughqualitative assessments. We may elect to bypass the qualitative assessment and proceed directly to a quantitative impairment test for any reporting unit or Brand inany period. We can resume the qualitative assessment for any reporting unit or Brand in any subsequent period.
Under a qualitative approach, our impairment review for goodwill consists of an assessment of whether it is more-likely-than-not that a reporting unit’s fairvalue is less than its carrying amount. If we elect to bypass the qualitative assessment for any reporting unit, or if a qualitative assessment indicates it is more-likely-than-not that the estimated carrying value of a reporting unit exceeds its fair value, we perform a quantitative goodwill impairment test that requires us toestimate the fair value of the reporting unit. If the fair value of the reporting unit is less than its carrying amount, we will measure any goodwill impairment loss asthe amount by which the carrying amount of a reporting unit exceeds its fair value, not to exceed the total amount of goodwill allocated to that reporting unit.
Under a qualitative approach, our impairment review for the Brands consists of an assessment of whether it is more-likely-than-not that a Brand’s fair valueis less than its carrying amount. If we elect to bypass the qualitative assessment for a Brand, or if a qualitative assessment indicates it is more-likely-than-not thatthe estimated carrying value of a Brand exceeds its fair value, we estimate the fair value of the Brand and compare it to its carrying amount. If the carrying amountexceeds fair value, an impairment loss is recognized in an amount equal to that excess.
We completed our impairment tests for goodwill and the Brands as of October 1, 2020, 2019 and 2018 and no impairment resulted.
Long-Lived Assets
Long-lived assets, such as property and equipment, intangible assets subject to amortization and lease right-of-use assets, are tested for impairment wheneverevents or changes in circumstances indicate that the carrying amount of the asset or asset group may not be recoverable. Some of the events or changes incircumstances that would trigger an impairment review include, but are not limited to, bankruptcy proceedings or other significant financial distress of a lessee;significant negative industry or economic trends; knowledge of transactions involving the sale of similar property at amounts below the carrying value; or ourexpectation to dispose of long-lived assets before the end of their estimated useful lives. The impairment test for long-lived assets requires us to assess therecoverability of long-lived assets by comparing their net carrying value to the sum of undiscounted estimated future cash flows directly associated with andarising from use and eventual disposition of the assets or asset group. Long-lived assets are grouped for recognition and measurement of impairment at the lowestlevel for which identifiable cash flows are largely independent of the cash flows of other assets. If the net carrying value of a group of long-lived assets exceeds thesum of related undiscounted estimated future cash flows, we record an impairment charge equal to the excess, if any, of the net carrying value over fair value.
Other Comprehensive Income (Loss)
Other comprehensive income (loss) (“OCI”) refers to revenues, expenses, gains and losses that are included in comprehensive income (loss), but areexcluded from net income (loss) as these amounts are recorded directly as an adjustment to equity, net of tax. Our other comprehensive income (loss) is primarilycomprised of unrealized gains and losses on foreign currency translation adjustments and unrealized gains and losses on hedging activity, net of tax.
Derivative Financial Instruments
We recognize and measure all derivative instruments as either assets or liabilities at fair value in the consolidated balance sheets. We may enter intoderivatives that are not designated as hedging instruments for accounting purposes, but which largely offset the economic impact of certain transactions.
Gains or losses resulting from changes in the fair value of derivatives are recognized in earnings or recorded in other comprehensive income (loss) andrecognized in the consolidated statements of operations when the hedged item affects earnings, depending on the purpose of the derivatives and whether theyqualify for, and we have applied, hedge accounting treatment.
When applying hedge accounting, we designate at a derivative’s inception, the specific assets, liabilities or future commitments being hedged, and assess thehedge’s effectiveness at inception and on an ongoing basis. We discontinue hedge accounting when: (i) we determine that the cash flow derivative is no longereffective in offsetting changes in the cash flows of a hedged item; (ii) the derivative expires or is sold, terminated or exercised; (iii) it is no longer probable that theforecasted transaction will occur; or (iv) management determines that designation of the derivatives as a hedge instrument is no longer appropriate. We do not enterinto or hold derivatives for speculative purposes.
66

Table of Contents
Disclosures about Fair Value
Fair value is defined as the price that would be received to sell an asset or paid to transfer a liability in an orderly transaction between market participants inthe principal market, or if none exists, the most advantageous market, for the specific asset or liability at the measurement date (the exit price). The fair value isbased on assumptions that market participants would use when pricing the asset or liability. The fair values are assigned a level within the fair value hierarchy,depending on the source of the inputs into the calculation, as follows:
Level 1 Observable inputs that reflect quoted prices (unadjusted) for identical assets or liabilities in active markets.
Level 2 Inputs other than quoted prices included in Level 1 that are observable for the asset or liability either directly or indirectly.
Level 3 Unobservable inputs reflecting management’s own assumptions about the inputs used in pricing the asset or liability.
The carrying amounts for cash and cash equivalents, accounts and notes receivable and accounts and drafts payable approximate fair value based on theshort-term nature of these amounts.
We carry all of our derivatives at fair value and value them using various pricing models or discounted cash flow analysis that incorporate observable marketparameters, such as interest rate yield curves and currency rates, which are Level 2 inputs. Derivative valuations incorporate credit risk adjustments that arenecessary to reflect the probability of default by the counterparty or us. For disclosures about the fair value measurements of our derivative instruments, see Note11, Derivative Instruments.
The following table presents the fair value of our variable rate term debt and senior notes, estimated using inputs based on bid and offer prices that areLevel 2 inputs, and principal carrying amount (in millions):
As of December 31,2020 2019
Fair value of our variable term debt and senior notes $ 12,477 $ 12,075 Principal carrying amount of our variable term debt and senior notes 12,453 11,900
The determination of fair values of our reporting units and the determination of the fair value of the Brands for impairment testing using a quantitativeapproach during 2020, 2019 and 2018 were based upon Level 3 inputs.
Revenue Recognition
Sales
Sales consist primarily of supply chain sales, which represent sales of products, supplies and restaurant equipment to franchisees, as well as sales to retailersand are presented net of any related sales tax. Orders placed by customers specify the goods to be delivered and transaction prices for supply chain sales. Revenueis recognized upon transfer of control over ordered items, generally upon delivery to the customer, which is when the customer obtains physical possession of thegoods, legal title is transferred, the customer has all risks and rewards of ownership and an obligation to pay for the goods is created. Shipping and handling costsassociated with outbound freight for supply chain sales are accounted for as fulfillment costs and classified as cost of sales.
To a much lesser extent, sales also include Company restaurant sales (including Restaurant VIEs), which consist of sales to restaurant guests. Revenue fromCompany restaurant sales is recognized at the point of sale. Taxes assessed by a governmental authority that we collect are excluded from revenue.
Franchise revenues
Franchise revenues consist primarily of royalties, advertising fund contributions, initial and renewal franchise fees and upfront fees from developmentagreements and master franchise and development agreements (“MFDAs”). Under franchise agreements, we provide franchisees with (i) a franchise license, whichincludes a license to use our intellectual property and, in those markets where our subsidiaries manage an advertising fund, advertising and promotionmanagement, (ii) pre-opening services, such as training and inspections, and (iii) ongoing services, such as development of training materials and menu items andrestaurant monitoring and inspections. The services we provide under franchise agreements are highly interrelated and dependent upon the franchise license and weconcluded the services do not represent individually distinct performance obligations. Consequently, we bundle the franchise license performance obligation andpromises to provide services into a single performance obligation, which we satisfy by providing a right to use our intellectual property over the term of eachfranchise agreement.
67

Table of Contents
Royalties, including franchisee contributions to advertising funds managed by our subsidiaries, are calculated as a percentage of franchise restaurant salesover the term of the franchise agreement. Under our franchise agreements, advertising contributions paid by franchisees must be spent on advertising, productdevelopment, marketing and related activities. Initial and renewal franchise fees are payable by the franchisee upon a new restaurant opening or renewal of anexisting franchise agreement. Our franchise agreement royalties, inclusive of advertising fund contributions, represent sales-based royalties that are related entirelyto our performance obligation under the franchise agreement and are recognized as franchise sales occur. Additionally, initial and renewal franchise fees arerecognized as revenue on a straight-line basis over the term of the respective agreement. Our performance obligation under development agreements other thanMFDAs generally consists of an obligation to grant exclusive development rights over a stated term. These development rights are not distinct from franchiseagreements, so upfront fees paid by franchisees for exclusive development rights are deferred and apportioned to each franchise restaurant opened by thefranchisee. The pro rata amount apportioned to each restaurant is accounted for as an initial franchise fee.
We have a distinct performance obligation under our MFDAs to grant subfranchising rights over a stated term. Under the terms of MFDAs, we typicallyeither receive an upfront fee paid in cash and/or receive noncash consideration in the form of an equity interest in the master franchisee or an affiliate of the masterfranchisee. We account for noncash consideration as investments in the applicable equity method investee and recognize revenue in an amount equal to the fairvalue of the equity interest received. Upfront fees from master franchisees, including the fair value of noncash consideration, are deferred and amortized over theMFDA term on a straight-line basis. We may recognize unamortized upfront fees when a contract with a franchisee or master franchisee is modified and isaccounted for as a termination of the existing contract.
The portion of gift cards sold to customers which are never redeemed is commonly referred to as gift card breakage. We recognize gift card breakage incomeproportionately as each gift card is redeemed using an estimated breakage rate based on our historical experience.
Property revenues
Property revenues consists of rental income from properties we lease or sublease to franchisees. Property revenues are accounted for in accordance withapplicable accounting guidance for leases and are excluded from the scope of revenue recognition guidance.
Advertising and Promotional Costs
Company restaurants and franchise restaurants contribute to advertising funds that our subsidiaries manage in the United States and Canada and certain otherinternational markets. The advertising funds expense the production costs of advertising when the advertisements are first aired or displayed. All other advertisingand promotional costs are expensed in the period incurred. Under our franchise agreements, advertising contributions received from franchisees must be spent onadvertising, product development, marketing and related activities. Advertising contributions received from franchisees are included in franchise and propertyrevenues and advertising expenses are included as selling, general and administrative expenses. Advertising expenses included in selling, general andadministrative expenses totaled $857 million for 2020, $858 million for 2019 and $793 million for 2018. The advertising contributions by Company restaurants(including Restaurant VIEs) are eliminated in consolidation.
Deferred Financing Costs
Deferred financing costs are amortized over the term of the related debt agreement into interest expense using the effective interest method.
Income Taxes
Amounts in the Financial Statements related to income taxes are calculated using the principles of ASC Topic 740, Income Taxes. Under these principles,deferred tax assets and liabilities reflect the impact of temporary differences between the amounts of assets and liabilities recognized for financial reportingpurposes and the amounts recognized for tax purposes, as well as tax credit carry-forwards and loss carry-forwards. These deferred taxes are measured by applyingcurrently enacted tax rates. A deferred tax asset is recognized when it is considered more-likely-than-not to be realized. The effects of changes in tax rates ondeferred tax assets and liabilities are recognized in income in the year in which the law is enacted. A valuation allowance reduces deferred tax assets when it ismore-likely-than-not that some portion or all of the deferred tax assets will not be realized.
We recognize positions taken or expected to be taken in a tax return in the Financial Statements when it is more-likely-than-not (i.e., a likelihood of morethan 50%) that the position would be sustained upon examination by tax authorities. A recognized tax position is then measured at the largest amount of benefitwith greater than 50% likelihood of being realized upon ultimate settlement.
Translation gains and losses resulting from the remeasurement of foreign deferred tax assets or liabilities denominated in a currency other than the functionalcurrency are classified as other operating expenses (income), net in the consolidated statements of operations.
68

Table of Contents
Share-based Compensation
Compensation expense related to the issuance of share-based awards to our employees is measured at fair value on the grant date. We use the Black-Scholesoption pricing model to value stock options. The compensation expense for awards that vest over a future service period is recognized over the requisite serviceperiod on a straight-line basis, adjusted for estimated forfeitures of awards that are not expected to vest. We use historical data to estimate forfeitures for share-based awards. Upon the end of the service period, compensation expense is adjusted to account for the actual forfeiture rate. The compensation expense for awardsthat contain performance conditions is recognized when it is probable that the performance conditions will be achieved.
New Accounting Pronouncements
Credit Losses – In June 2016, the FASB issued guidance that requires companies to measure and recognize lifetime expected credit losses for certainfinancial instruments, including trade accounts receivable and net investments in direct financing and sales-type leases. Expected credit losses are estimated usingrelevant information about past events, including historical experience, current conditions, and reasonable and supportable forecasts that affect the collectability ofthe reported amount. This amendment was effective commencing in 2020, using a modified retrospective approach. The adoption of this new guidance did nothave a material impact on our Financial Statements.
Simplifying the Accounting for Income Taxes – In December 2019, the FASB issued guidance which simplifies the accounting for income taxes by removingcertain exceptions and by clarifying and amending existing guidance applicable to accounting for income taxes. The amendment is effective commencing in 2021with early adoption permitted. We do not anticipate the adoption of this new guidance will have a material impact on our Financial Statements.
Accounting Relief for the Transition Away from LIBOR and Certain other Reference Rates – In March 2020 and as clarified in January 2021, the FASBissued guidance which provides optional expedients and exceptions for applying U.S. GAAP to contracts, hedging relationships, and other transactions thatreference LIBOR or another reference rate expected to be discontinued because of reference rate reform. This amendment is effective as of March 12, 2020through December 31, 2022. The expedients and exceptions provided by this new guidance do not apply to contract modifications made and hedging relationshipsentered into or evaluated after December 31, 2022, except for hedging relationships existing as of December 31, 2022, that an entity has elected certain optionalexpedients for and that are retained through the end of the hedging relationships. We are currently evaluating the impact that the adoption of this new guidance willhave on our Financial Statements and have not adopted any of the transition relief available under the new guidance as of December 31, 2020.
Note 3. Earnings Per Unit
Partnership uses the two-class method in the computation of earnings per unit. Pursuant to the terms of the partnership agreement, RBI, as the holder of theClass A common units, is entitled to receive distributions from Partnership in an amount equal to the aggregate dividends payable by RBI to holders of RBIcommon shares, and the holders of Class B exchangeable limited partnership units (the “Partnership exchangeable units”) are entitled to receive distributions fromPartnership in an amount per unit equal to the dividends payable by RBI on each RBI common share. Partnership’s net income available to common unitholders isallocated between the Class A common units and Partnership exchangeable units on a fully-distributed basis and reflects residual net income after noncontrollinginterests. Basic and diluted earnings per Class A common unit is determined by dividing net income allocated to Class A common unitholders by the weightedaverage number of Class A common units outstanding for the period. Basic and diluted earnings per Partnership exchangeable unit is determined by dividing netincome allocated to the Partnership exchangeable units by the weighted average number of Partnership exchangeable units outstanding during the period.
There are no dilutive securities for Partnership as the exercise of stock options will not affect the numbers of Class A common units or Partnershipexchangeable units outstanding. However, the issuance of shares by RBI in future periods will affect the allocation of net income attributable to commonunitholders between Partnership’s Class A common units and Partnership exchangeable units.
69
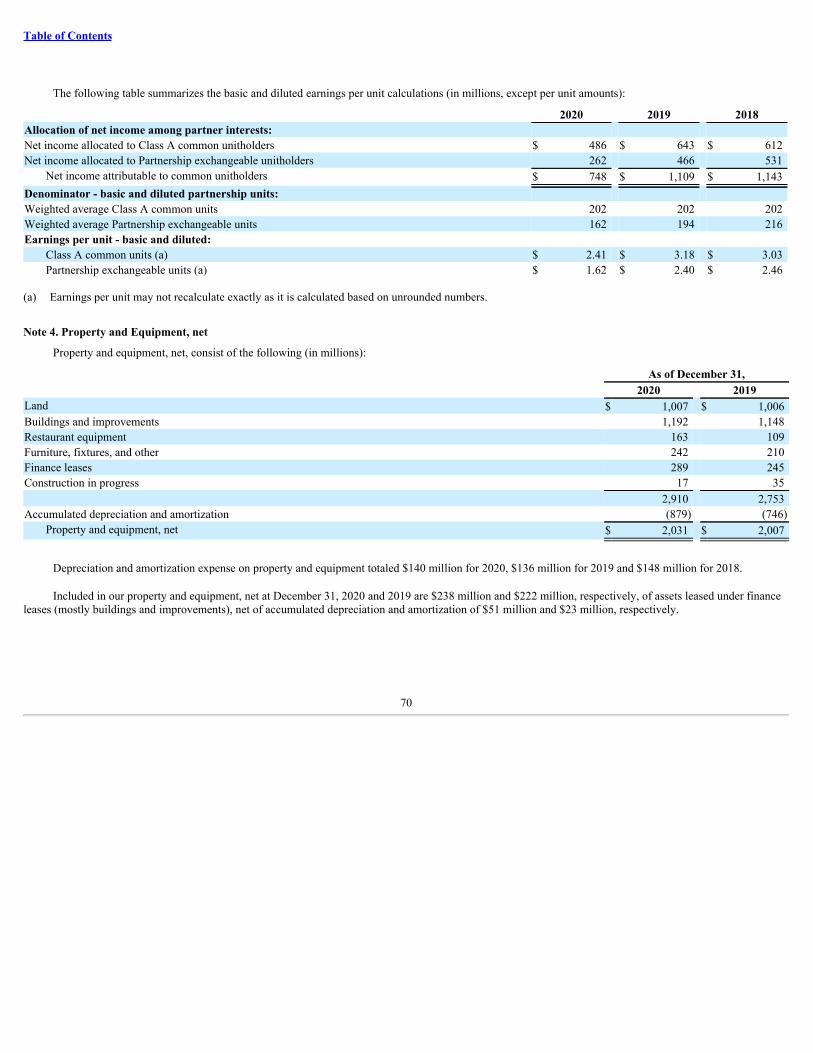
Table of Contents
The following table summarizes the basic and diluted earnings per unit calculations (in millions, except per unit amounts):
2020 2019 2018Allocation of net income among partner interests:Net income allocated to Class A common unitholders $ 486 $ 643 $ 612 Net income allocated to Partnership exchangeable unitholders 262 466 531
Net income attributable to common unitholders $ 748 $ 1,109 $ 1,143 Denominator - basic and diluted partnership units:Weighted average Class A common units 202 202 202 Weighted average Partnership exchangeable units 162 194 216 Earnings per unit - basic and diluted:
Class A common units (a) $ 2.41 $ 3.18 $ 3.03 Partnership exchangeable units (a) $ 1.62 $ 2.40 $ 2.46
(a) Earnings per unit may not recalculate exactly as it is calculated based on unrounded numbers.
Note 4. Property and Equipment, net
Property and equipment, net, consist of the following (in millions):
As of December 31, 2020 2019Land $ 1,007 $ 1,006 Buildings and improvements 1,192 1,148 Restaurant equipment 163 109 Furniture, fixtures, and other 242 210 Finance leases 289 245 Construction in progress 17 35
2,910 2,753 Accumulated depreciation and amortization (879) (746)
Property and equipment, net $ 2,031 $ 2,007
Depreciation and amortization expense on property and equipment totaled $140 million for 2020, $136 million for 2019 and $148 million for 2018.
Included in our property and equipment, net at December 31, 2020 and 2019 are $238 million and $222 million, respectively, of assets leased under financeleases (mostly buildings and improvements), net of accumulated depreciation and amortization of $51 million and $23 million, respectively.
70

Table of Contents
Note 5. Intangible Assets, net and Goodwill
Intangible assets, net and goodwill consist of the following (in millions):
As of December 31,2020 2019
GrossAccumulatedAmortization Net Gross
AccumulatedAmortization Net
Identifiable assets subject to amortization: Franchise agreements $ 735 $ (264) $ 471 $ 720 $ (225) $ 495 Favorable leases 117 (66) 51 127 (65) 62 Subtotal 852 (330) 522 847 (290) 557 Indefinite-lived intangible assets: Tim Hortons brand $ 6,650 $ — $ 6,650 $ 6,534 $ — $ 6,534 Burger King brand 2,174 — 2,174 2,117 — 2,117 Popeyes brand 1,355 — 1,355 1,355 — 1,355 Subtotal 10,179 — 10,179 10,006 — 10,006 Intangible assets, net $ 10,701 $ 10,563
Goodwill Tim Hortons segment $ 4,279 $ 4,207 Burger King segment 614 598 Popeyes segment 846 846 Total $ 5,739 $ 5,651
Amortization expense on intangible assets totaled $43 million for 2020, $44 million for 2019, and $70 million for 2018. The change in the brands andgoodwill balances during 2020 was due to the impact of foreign currency translation.
As of December 31, 2020, the estimated future amortization expense on identifiable assets subject to amortization is as follows (in millions):
Twelve-months ended December 31, Amount2021 $ 41 2022 40 2023 38 2024 37 2025 35 Thereafter 331
Total $ 522
71

Table of Contents
Note 6. Equity Method Investments
The aggregate carrying amount of our equity method investments was $205 million and $266 million as of December 31, 2020 and 2019, respectively, and isincluded as a component of Other assets, net in our consolidated balance sheets. TH and BK both have equity method investments. PLK did not have any equitymethod investments as of December 31, 2020 and 2019.
With respect to our TH business, the most significant equity method investment is our 50.0% joint venture interest with The Wendy’s Company (the“TIMWEN Partnership”), which jointly holds real estate underlying Canadian combination restaurants. Distributions received from this joint venture were $8million, $13 million and $13 million during 2020, 2019 and 2018, respectively.
Except for the following equity method investments, no quoted market prices are available for our other equity method investments. The aggregate marketvalue of our 15.3% equity interest in Carrols Restaurant Group, Inc. (“Carrols”) based on the quoted market price on December 31, 2020 is approximately $59million. The aggregate market value of our 9.4% equity interest in BK Brasil Operação e Assessoria a Restaurantes S.A. based on the quoted market price onDecember 31, 2020 is approximately $47 million. As of December 31, 2020, the fair value of these equity method investments exceeds the carrying amount.
We have equity interests in entities that own or franchise Tim Hortons or Burger King restaurants. Franchise and property revenue recognized fromfranchisees that are owned or franchised by entities in which we have an equity interest consist of the following (in millions):
2020 2019 2018Revenues from affiliates:
Royalties $ 289 $ 345 $ 310 Property revenues 32 33 36 Franchise fees and other revenue 14 10 11 Total $ 335 $ 388 $ 357
We recognized rent expense associated with the TIMWEN Partnership of $15 million, $19 million, and $20 million during 2020, 2019 and 2018,respectively.
At December 31, 2020 and 2019, we had $52 million and $47 million, respectively, of accounts receivable, net from our equity method investments whichwere recorded in accounts and notes receivable, net in our consolidated balance sheets.
(Income) loss from equity method investments reflects our share of investee net income or loss, non-cash dilution gains or losses from changes in ourownership interests in equity method investees and basis difference amortization. We recorded increases to the carrying value of our equity method investmentbalances and non-cash dilution gains in the amounts of $11 million and $20 million during 2019 and 2018, respectively. No non-cash dilution gains were recordedduring 2020. The dilution gains resulted from the issuance of capital stock by our equity method investees, which reduced our ownership interests in these equitymethod investments. The dilution gains we recorded in connection with the issuance of capital stock reflect adjustments to the differences between the amount ofunderlying equity in the net assets of equity method investees before and after their issuance of capital stock.
72

Table of Contents
Note 7. Other Accrued Liabilities and Other Liabilities
Other accrued liabilities (current) and other liabilities, net (non-current) consist of the following (in millions):
As of December 31, 2020 2019Current:
Dividend payable $ 239 $ 232 Interest payable 66 71 Accrued compensation and benefits 78 57 Taxes payable 122 126 Deferred income 42 35 Accrued advertising expenses 59 40 Restructuring and other provisions 12 8 Current portion of operating lease liabilities 137 126 Other 80 95
Other accrued liabilities $ 835 $ 790 Non-current:
Taxes payable $ 626 $ 579 Contract liabilities (see Note 14) 528 541 Derivatives liabilities 865 341 Unfavorable leases 81 103 Accrued pension 70 65 Deferred income 28 25 Other 38 44
Other liabilities, net $ 2,236 $ 1,698
Note 8. Long-Term Debt
Long-term debt consist of the following (in millions):
As of December 31, 2020 2019Term Loan B (due November 19, 2026) $ 5,297 $ 5,350 Term Loan A (due October 7, 2024) 731 750 2017 4.25% Senior Notes (due May 15, 2024) 775 1,500 2019 3.875% Senior Notes (due January 15, 2028) 750 750 2020 5.75% Senior Notes (due April 15, 2025) 500 — 2020 3.50% Senior Notes (due February 15, 2029) 750 — 2017 5.00% Senior Notes (due October 15, 2025) — 2,800 2019 4.375% Senior Notes (due January 15, 2028) 750 750 2020 4.00% Senior Notes (due October 15, 2030) 2,900 — TH Facility and other 178 81 Less: unamortized deferred financing costs and deferred issuance discount (155) (148)Total debt, net 12,476 11,833
Less: current maturities of debt (79) (74)Total long-term debt $ 12,397 $ 11,759
73

Table of Contents
Credit Facilities
On September 6, 2019, two of our subsidiaries (the "Borrowers") entered into a fourth incremental facility amendment (the "Fourth IncrementalAmendment") to the credit agreement governing our senior secured term loan facilities (the "Term Loan Facilities") and our senior secured revolving credit facility(including revolving loans, swingline loans and letters of credit) (the "Revolving Credit Facility" and together with the Term Loan Facilities, the "CreditFacilities"). Under the Fourth Incremental Amendment, (i) we obtained a new term loan in the aggregate principal amount of $750 million (the "Term Loan A")with a maturity date of October 7, 2024 (subject to earlier maturity in specified circumstances), (ii) the interest rate applicable to the Term Loan A and RevolvingCredit Facility is, at our option, either (a) a base rate, subject to a floor of 1.00%, plus an applicable margin varying from 0.00% to 0.50%, or (b) a Eurocurrencyrate, subject to a floor of 0.00%, plus an applicable margin varying between 0.75% and 1.50%, in each case, determined by reference to a net first lien leveragebased pricing grid, (iii) the aggregate principal amount of the commitments under our Revolving Credit Facility was increased to $1,000 million, (iv) the maturitydate of the Revolving Credit Facility was extended from October 13, 2022 to October 7, 2024 (subject to earlier maturity in specified circumstances), and (v) thecommitment fee on the unused portion of the Revolving Credit Facility was decreased from 0.25% to 0.15%. At December 31, 2020, the interest rate on the TermLoan A was 1.40%. The principal amount of the Term Loan A amortizes in quarterly installments equal to $5 million until October 7, 2022 and thereafter inquarterly installments equal to $9 million until maturity, with the balance payable at maturity. The Term Loan A will require compliance with a net first lienleverage ratio (described below). Except as described herein, the Fourth Incremental Amendment did not materially change the terms of the Credit Facilities. Inconnection with the Fourth Incremental Amendment, we capitalized approximately $7 million in debt issuance costs.
Our Credit Facilities also include a senior secured term loan B facility (the "Term Loan B"). In September 2019, we voluntarily prepaid $235 millionprincipal amount of our Term Loan B and, in connection with this prepayment, we recorded a loss on early extinguishment of debt of $4 million that primarilyreflects the write-off of related unamortized debt issuance costs and discounts.
On November 19, 2019, the Borrowers entered into a fourth amendment (the "Fourth Amendment") to the credit agreement governing our Credit Facilities.Under the Fourth Amendment, (i) the outstanding aggregate principal amount under our Term Loan B was decreased to $5,350 million as a result of a repaymentof $720 million from a portion of the net proceeds of the 2019 4.375% Senior Notes (defined below), (ii) the interest rate applicable to our Term Loan B wasreduced to, at our option, either (a) a base rate, subject to a floor of 1.00%, plus an applicable margin of 0.75%, or (b) a Eurocurrency rate, subject to a floor of0.00%, plus an applicable margin of 1.75%, and (iii) the maturity date of our Term Loan B was extended from February 17, 2024 to November 19, 2026. AtDecember 31, 2020, the interest rate on the Term Loan B was 1.90%. The principal amount of the Term Loan B amortizes in quarterly installments equal to $13million until maturity, with the balance payable at maturity. Except as described herein, the Fourth Amendment did not materially change the terms of the CreditFacilities.
In connection with the Fourth Amendment, we capitalized approximately $24 million in debt issuance costs and original issue discount and recorded a losson early extinguishment of debt of $16 million that primarily reflects the write-off of related unamortized debt issuance costs and discounts and fees incurred.
On April 2, 2020, the Borrowers entered into a fifth amendment (the “Fifth Amendment”) to the credit agreement governing our Credit Facilities. The FifthAmendment provides the Borrowers with the option to comply with a $1,000 million minimum liquidity covenant in lieu of the 6.50:1.00 net first lien seniorsecured leverage ratio financial maintenance covenant for the period after June 30, 2020 and prior to September 30, 2021. Additionally, for the periods endingSeptember 30, 2021 and December 31, 2021, to determine compliance with the net first lien senior secured leverage ratio, we are permitted to annualize theAdjusted EBITDA (as defined in the Credit Agreement) for the three months ending September 30, 2021 and six months ending December 31, 2021, respectively,in lieu of calculating the ratio based on Adjusted EBITDA for the prior four quarters. There were no other material changes to the terms of the Credit Agreement.
Revolving Credit Facility
As of December 31, 2020, we had no amounts outstanding under our Revolving Credit Facility. Funds available under the Revolving Credit Facility may beused to repay other debt, finance debt or RBI share repurchases, to fund acquisitions or capital expenditures and for other general corporate purposes. We have a$125 million letter of credit sublimit as part of the Revolving Credit Facility, which reduces our borrowing availability thereunder by the cumulative amount ofoutstanding letters of credit. Under the Fourth Incremental Amendment, the interest rate applicable to amounts drawn under each letter of credit decreased from arange of 1.25% to 2.00% to a range of 0.75% to 1.50%, depending on our net first lien leverage ratio. As of December 31, 2020, we had $2 million of letters ofcredit issued against the Revolving Credit Facility, and our borrowing availability was $998 million.
Obligations under the Credit Facilities are guaranteed on a senior secured basis, jointly and severally, by the direct parent company of one of the Borrowersand substantially all of its Canadian and U.S. subsidiaries, including The TDL Group Corp., Burger King Corporation, Popeyes Louisiana Kitchen, Inc. andsubstantially all of their respective Canadian and U.S. subsidiaries (the “Credit Guarantors”). Amounts borrowed under the Credit Facilities are secured on a firstpriority basis by a perfected security interest in substantially all of the present and future property (subject to certain exceptions) of each Borrower and CreditGuarantor.
74

Table of Contents
2017 4.25% First Lien Senior Notes
During 2017, the Borrowers entered into an indenture (the “2017 4.25% Senior Notes Indenture”) in connection with the issuance of $1,500 million of4.25% first lien senior notes due May 15, 2024 (the “2017 4.25% Senior Notes”). No principal payments are due until maturity and interest is paid semi-annually.The net proceeds from the offering of the 2017 4.25% Senior Notes, together with other sources of liquidity, were used to redeem all of the outstanding RBI ClassA 9.0% cumulative compounding perpetual voting preferred shares and for other general corporate purposes. In connection with the issuance of the 2017 4.25%Senior Notes, we capitalized approximately $13 million in debt issuance costs. As detailed below, during 2020 we redeemed $725 million of the 2017 4.25%Senior Notes.
Obligations under the 2017 4.25% Senior Notes are guaranteed on a senior secured basis, jointly and severally, by the Borrowers and substantially all of theBorrowers' Canadian and U.S. subsidiaries, including The TDL Group Corp., Burger King Corporation, Popeyes Louisiana Kitchen, Inc. and substantially all oftheir respective Canadian and U.S. subsidiaries (the “Note Guarantors”). The 2017 4.25% Senior Notes are first lien senior secured obligations and rank equal inright of payment with all of the existing and future senior debt of the Borrowers and Note Guarantors, including borrowings and guarantees of the Credit Facilities.
Our 2017 4.25% Senior Notes may be redeemed in whole or in part, on or after May 15, 2020 at the redemption prices set forth in the 2017 4.25% SeniorNotes Indenture, plus accrued and unpaid interest, if any, at the date of redemption. The 2017 4.25% Senior Notes Indenture also contains redemption provisionsrelated to tender offers, change of control and equity offerings, among others.
2019 3.875% First Lien Senior Notes
On September 24, 2019, the Borrowers entered into an indenture (the "2019 3.875% Senior Notes Indenture") in connection with the issuance of $750million of 3.875% first lien senior notes due January 15, 2028 (the "2019 3.875% Senior Notes"). No principal payments are due until maturity and interest is paidsemi-annually. The net proceeds from the offering of the 2019 3.875% Senior Notes and a portion of the net proceeds from the Term Loan A were used to redeemthe entire outstanding principal balance of $1,250 million of 4.625% first lien secured notes due January 15, 2022 (the "2015 4.625% Senior Notes") and to payrelated fees and expenses. In connection with the issuance of the 2019 3.875% Senior Notes, we capitalized approximately $10 million in debt issuance costs. Inconnection with the redemption of the entire outstanding principal balance of the 2015 4.625% Senior Notes, we recorded a loss on early extinguishment of debt of$3 million that primarily reflects the write-off of related unamortized debt issuance costs.
Obligations under the 2019 3.875% Senior Notes are guaranteed on a senior secured basis, jointly and severally, by the Note Guarantors. The 2019 3.875%Senior Notes are first lien senior secured obligations and rank equal in right of payment with all of the existing and future first lien senior debt of the Borrowersand Note Guarantors, including borrowings and guarantees of the Credit Facilities.
Our 2019 3.875% Senior Notes may be redeemed in whole or in part, on or after September 15, 2022 at the redemption prices set forth in the 2019 3.875%Senior Notes Indenture, plus accrued and unpaid interest, if any, at the date of redemption. The 2019 3.875% Senior Notes Indenture also contains redemptionprovisions related to tender offers, change of control and equity offerings, among others.
2020 5.75% First Lien Senior Notes
On April 7, 2020, the Borrowers entered into an indenture (the “2020 5.75% Senior Notes Indenture”) in connection with the issuance of $500 million of5.75% first lien notes due April 15, 2025 (the “2020 5.75% Senior Notes”). No principal payments are due until maturity and interest is paid semi-annually. Thenet proceeds from the offering of the 2020 5.75% Senior Notes were used for general corporate purposes. In connection with the issuance of the 2020 5.75%Senior Notes, we capitalized approximately $10 million in debt issuance costs.
Obligations under the 2020 5.75% Senior Notes are guaranteed on a senior secured basis, jointly and severally, by the Note Guarantors. The 2020 5.75%Senior Notes are first lien senior secured obligations and rank equal in right of payment with all of the existing and future first lien senior debt of the Borrowersand Note Guarantors, including borrowings and guarantees of the Credit Facilities.
Our 2020 5.75% Senior Notes may be redeemed in whole or in part, on or after April 15, 2022 at the redemption prices set forth in the 2020 5.75% SeniorNotes Indenture, plus accrued and unpaid interest, if any, at the date of redemption. The 2020 5.75% Senior Notes Indenture also contains optional redemptionprovisions related to tender offers, change of control and equity offerings, among others.
75

Table of Contents
2020 3.50% First Lien Senior Notes
On November 9, 2020, the Borrowers entered into an indenture (the “2020 3.50% Senior Notes Indenture”) in connection with the issuance of $750 millionof 3.50% first lien notes due February 15, 2029 (the “2020 3.50% Senior Notes”). No principal payments are due until maturity and interest is paid semi-annually.The proceeds from the offering of the 2020 3.50% Senior Notes, together with cash on hand, were used to redeem $725 million of the 2017 4.25% Senior Notesand pay related redemption premiums, fees and expenses. In connection with the issuance of the 2020 3.50% Senior Notes, we capitalized approximately $7million in debt issuance costs. In connection with the redemption of the 2017 4.25% Senior Notes, we recorded a loss on early extinguishment of debt of $19million that primarily reflects the payment of premiums to redeem the notes and the write-off of unamortized debt issuance costs.
Obligations under the 2020 3.50% Senior Notes are guaranteed on a senior secured basis, jointly and severally, by the Note Guarantors. The 2020 3.50%Senior Notes are first lien senior secured obligations and rank equal in right of payment with all of the existing and future first lien senior debt of the Borrowersand Note Guarantors, including borrowings and guarantees of the Credit Facilities.
Our 2020 3.50% Senior Notes may be redeemed in whole or in part, on or after February 15, 2024 at the redemption prices set forth in the 2020 3.50%Senior Notes Indenture, plus accrued and unpaid interest, if any, at the date of redemption. The 2020 3.50% Senior Notes Indenture also contains optionalredemption provisions related to tender offers, change of control and equity offerings, among others.
2017 5.00% Second Lien Senior Notes
During 2017, the Borrowers entered into an indenture (the “2017 5.00% Senior Notes Indenture”) in connection with the issuance of $2,800 million of5.00% second lien senior notes due October 15, 2025 (the “2017 5.00% Senior Notes”). During 2020, we redeemed the entire outstanding principal balance of$2,800 million of the 2017 5.00% Senior Notes using proceeds from the offering of the 2020 4.00% Senior Notes (defined below).
2019 4.375% Second Lien Senior Notes
On November 19, 2019, the Borrowers entered into an indenture (the “2019 4.375% Senior Notes Indenture”) in connection with the issuance of $750million of 4.375% second lien senior notes due January 15, 2028 (the “2019 4.375% Senior Notes”). No principal payments are due until maturity and interest ispaid semi-annually. The net proceeds from the offering of the 2019 4.375% Senior Notes, together with cash on hand, were used to repay $720 million of the TermLoan B outstanding aggregate principal balance and to pay related fees and expenses in connection with the Fourth Amendment. In connection with the issuance ofthe 2019 4.375% Senior Notes, we capitalized approximately $6 million in debt issuance costs.
Obligations under the 2019 4.375% Senior Notes are guaranteed on a second priority senior secured basis, jointly and severally, by the Note Guarantors. The2019 4.375% Senior Notes are second lien senior secured obligations and rank equal in right of payment with all of the existing and future senior debt of theBorrowers and Note Guarantors, including borrowings and guarantees of the Credit Facilities, and effectively subordinated to all of the existing and future first liensenior debt of the Borrowers and Note Guarantors.
Our 2019 4.375% Senior Notes may be redeemed in whole or in part, on or after November 15, 2022 at the redemption prices set forth in the 2019 4.375%Senior Notes Indenture, plus accrued and unpaid interest, if any, at the date of redemption. The 2019 4.375% Senior Notes Indenture also contains redemptionprovisions related to tender offers, change of control and equity offerings, among others.
2020 4.00% Second Lien Senior Notes
During 2020, the Borrowers entered into an indenture (the “2020 4.00% Senior Notes Indenture”) in connection with the issuance of $2,900 million of4.00% second lien notes due October 15, 2030 (the “2020 4.00% Senior Notes”). No principal payments are due until maturity and interest is paid semi-annually.The proceeds from the offering of the 2020 4.00% Senior Notes were used to redeem the entire outstanding principal balance of $2,800 million of the 2017 5.00%Senior Notes, pay related redemption premiums, fees and expenses. In connection with the issuance of the 2020 4.00% Senior Notes, we capitalized approximately$26 million in debt issuance costs. In connection with the full redemption of the 2017 5.00% Senior Notes, we recorded a loss on early extinguishment of debt of$79 million that primarily reflects the payment of premiums to redeem the notes and the write-off of unamortized debt issuance costs.
Obligations under the 2020 4.00% Senior Notes are guaranteed on a second priority senior secured basis, jointly and severally, by the Note Guarantors. The2020 4.00% Senior Notes are second lien senior secured obligations and rank equal in right of payment will all of the existing and future senior debt of theBorrowers and Note Guarantors and effectively subordinated to all of the existing and future first lien senior debt of the Borrowers and Note Guarantors.
76
Table of Contents
Our 2020 4.00% Senior Notes may be redeemed in whole or in part, on or after October 15, 2025 at the redemption prices set forth in the 2020 4.00% SeniorNotes Indenture, plus accrued and unpaid interest, if any, at the date of redemption. The 2020 4.00% Senior Notes Indenture also contains optional redemptionprovisions related to tender offers, change of control and equity offerings, among others.
Restrictions and Covenants
Our Credit Facilities, as well as the 2017 4.25% Senior Notes Indenture, 2019 3.875% Senior Notes Indenture, 2020 5.75% Senior Notes Indenture, 20203.50% Senior Notes Indenture, 2019 4.375% Senior Notes Indenture and 2020 4.00% Senior Notes Indenture (all together the “Senior Notes Indentures”) contain anumber of customary affirmative and negative covenants that, among other things, limit or restrict our ability and the ability of certain of our subsidiaries to: incuradditional indebtedness; incur liens; engage in mergers, consolidations, liquidations and dissolutions; sell assets; pay dividends and make other payments in respectof capital stock; make investments, loans and advances; pay or modify the terms of certain indebtedness; and engage in certain transactions with affiliates. Inaddition, under the Credit Facilities, the Borrowers are not permitted to exceed a first lien senior secured leverage ratio of 6.50 to 1.00 when, as of the end of anyfiscal quarter beginning with the first fiscal quarter of 2020, (1) any amounts are outstanding under the Term Loan A and/or (2) the sum of (i) the amount of lettersof credit outstanding exceeding $50 million (other than those that are cash collateralized); (ii) outstanding amounts under the Revolving Credit Facility and(iii) outstanding amounts of swing line loans, exceeds 30.0% of the commitments under the Revolving Credit Facility. As indicated above, the Fifth Amendmentprovides the Borrowers with the option to comply with a $1,000 million minimum liquidity covenant in lieu of the 6.50:1.00 net first lien senior secured leverageratio financial maintenance covenant for the period after June 30, 2020 and prior to September 30, 2021.
The restrictions under the Credit Facilities and the Senior Notes Indentures have resulted in substantially all of our consolidated assets being restricted.
As of December 31, 2020, we were in compliance with applicable financial debt covenants under the Credit Facilities and the Senior Notes Indentures andthere were no limitations on our ability to draw on the remaining availability under our Revolving Credit Facility.
TH Facility
One of our subsidiaries entered into a non-revolving delayed drawdown term credit facility in a total aggregate principal amount of C$225 million with amaturity date of October 4, 2025 (the “TH Facility”). The interest rate applicable to the TH Facility is the Canadian Bankers’ Acceptance rate plus an applicablemargin equal to 1.40% or the Prime Rate plus an applicable margin equal to 0.40%, at our option. Obligations under the TH Facility are guaranteed by four of oursubsidiaries, and amounts borrowed under the TH Facility are secured by certain parcels of real estate. During 2020, we drew down the remaining availability ofC$125 million under the TH Facility and, as of December 31, 2020, we had outstanding C$222 million under the TH Facility with a weighted average interest rateof 1.86%.
Debt Issuance Costs
During 2020 and 2019, we incurred aggregate deferred financing costs of $43 million and $50 million, respectively. No significant deferred financing costswere incurred in 2018.
Loss on Early Extinguishment of Debt
During 2020, we recorded a $98 million loss on early extinguishment of debt that primarily reflects the payment of premiums and the write-off ofunamortized debt issuance costs in connection with the full redemption of the 2017 5.00% Senior Notes and the partial redemption of the 2017 4.25% SeniorNotes. During 2019, we recorded a $23 million loss on early extinguishment of debt, which primarily reflects the write-off of unamortized debt issuance costs anddiscounts in connection with the prepayment and refinancing of the Term Loan B and the redemption of our 2015 4.625% Senior Notes.
77

Table of Contents
Maturities
The aggregate maturities of our long-term debt as of December 31, 2020 are as follows (in millions):
Year Ended December 31, Principal Amount2021 $ 79 2022 86 2023 102 2024 1,499 2025 686 Thereafter 10,179 Total $ 12,631
Interest Expense, net
Interest expense, net consists of the following (in millions):
2020 2019 2018Debt (a) $ 471 $ 503 $ 498 Finance lease obligations 20 20 23 Amortization of deferred financing costs and debt issuance discount 26 29 29 Interest income (9) (20) (15)
Interest expense, net $ 508 $ 532 $ 535
(a) Amount includes $69 million, $70 million and $60 million benefit during 2020, 2019 and 2018, respectively, related to the amortization of the ExcludedComponent as defined in Note 11, Derivatives.
Note 9. Leases
As of December 31, 2020, we leased or subleased 5,116 restaurant properties to franchisees and 171 non-restaurant properties to third parties under operatingleases, direct financing leases and sales-type leases where we are the lessor. Initial lease terms generally range from 10 to 20 years. Most leases to franchiseesprovide for fixed monthly payments and many provide for future rent escalations and renewal options. Certain leases also include provisions for variable rent,determined as a percentage of sales, generally when annual sales exceed specific levels. Lessees typically bear the cost of maintenance, insurance and propertytaxes.
We lease land, buildings, equipment, office space and warehouse space from third parties. Land and building leases generally have an initial term of 10 to 20years, while land-only lease terms can extend longer, and most leases provide for fixed monthly payments. Many of these leases provide for future rent escalationsand renewal options. Certain leases also include provisions for variable rent payments, determined as a percentage of sales, generally when annual sales exceedspecified levels. Most leases also obligate us to pay, as lessee, variable lease cost related to maintenance, insurance and property taxes.
We transitioned to ASC 842 on January 1, 2019 on a modified retrospective basis using the effective date transition method. Our transition to ASC 842represents a change in accounting principle. The $21 million cumulative effect of our transition to ASC 842 is reflected as an adjustment to January 1, 2019Partners' capital.
78

Table of Contents
Partnership as Lessor
Assets leased to franchisees and others under operating leases where we are the lessor and which are included within our property and equipment, net are asfollows (in millions):
As of December 31, 2020 2019Land $ 892 $ 905 Buildings and improvements 1,146 1,142 Restaurant equipment 19 18
2,057 2,065 Accumulated depreciation and amortization (534) (472)
Property and equipment leased, net $ 1,523 $ 1,593
Our net investment in direct financing and sales-type leases is as follows (in millions):
As of December 31, 2020 2019Future rents to be received:
Future minimum lease receipts $ 87 $ 49 Contingent rents (a) 12 19
Estimated unguaranteed residual value 7 15 Unearned income (34) (26)
72 57 Current portion included within accounts receivables (6) (9)
Net investment in property leased to franchisees $ 66 $ 48
(a) Amounts represent estimated contingent rents recorded in connection with the acquisition method of accounting.
During 2020, we offered rent relief programs for eligible TH and BK franchisees who lease property from us, under which we temporarily converted the rentstructure from a combination of fixed plus variable rent to 100% variable rent (the “rent relief programs”). The rent relief program concluded for BK franchiseesduring the three months ended September 30, 2020 and the rent relief program was extended through the end of 2021 for eligible TH franchisees.
In April 2020, the FASB staff issued interpretive guidance that permits entities to make an election to account for lease concessions related to the effects ofthe COVID-19 pandemic consistent with how those concessions would be accounted for under ASC 842, as though enforceable rights and obligations for thoseconcessions existed. We elected to apply this interpretive guidance to the rent relief programs while in effect. As such, reductions in rents arising from the rentrelief programs are recognized as reductions in variable lease payments.
Property revenues are comprised primarily of rental income from operating leases and earned income on direct financing leases with franchisees as follows(in millions):
2020 2019 2018ASC 842 ASC 842 Previous Standard
Rental income:Minimum lease payments $ 445 $ 448 $ 454 Variable lease payments 262 370 273 Amortization of favorable and unfavorable income lease contracts, net 6 7 8 Subtotal - lease income from operating leases 713 825 735
Earned income on direct financing and sales-type leases 5 8 9 Total property revenues $ 718 $ 833 $ 744
79
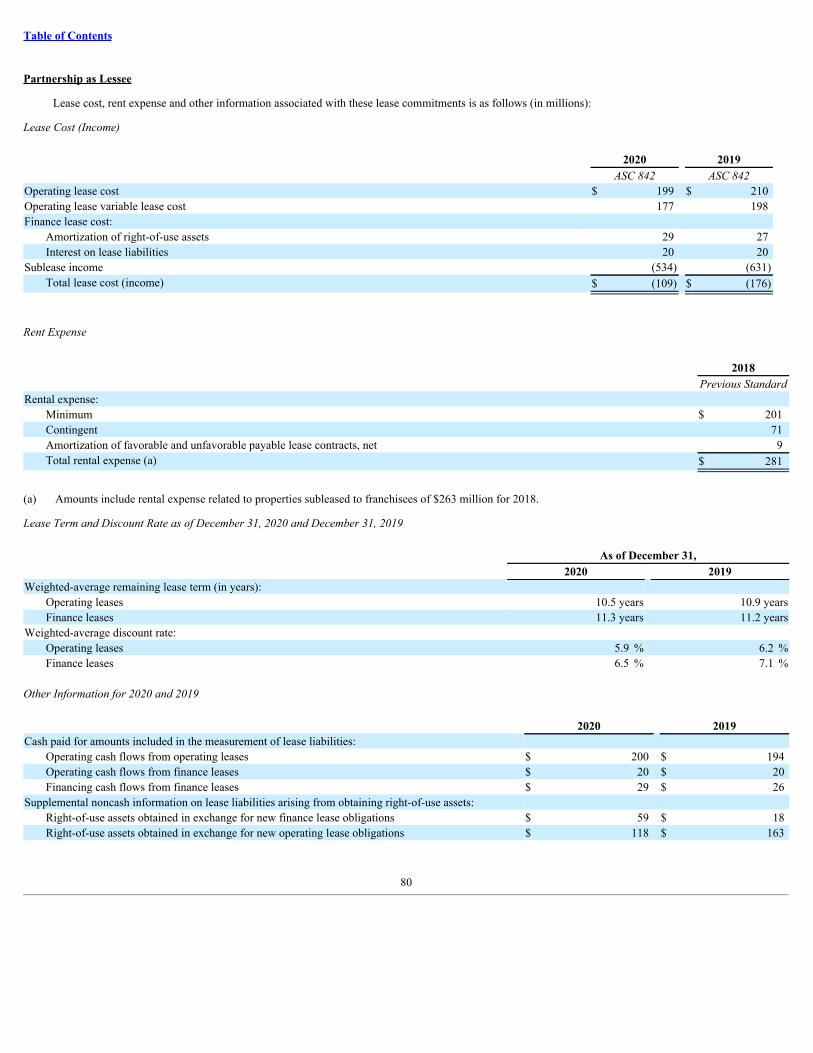
Table of Contents
Partnership as Lessee
Lease cost, rent expense and other information associated with these lease commitments is as follows (in millions):
Lease Cost (Income)
2020 2019ASC 842 ASC 842
Operating lease cost $ 199 $ 210 Operating lease variable lease cost 177 198 Finance lease cost:
Amortization of right-of-use assets 29 27 Interest on lease liabilities 20 20
Sublease income (534) (631)Total lease cost (income) $ (109) $ (176)
Rent Expense
2018Previous Standard
Rental expense:Minimum $ 201 Contingent 71 Amortization of favorable and unfavorable payable lease contracts, net 9 Total rental expense (a) $ 281
(a) Amounts include rental expense related to properties subleased to franchisees of $263 million for 2018.
Lease Term and Discount Rate as of December 31, 2020 and December 31, 2019
As of December 31,2020 2019
Weighted-average remaining lease term (in years):Operating leases 10.5 years 10.9 yearsFinance leases 11.3 years 11.2 years
Weighted-average discount rate:Operating leases 5.9 % 6.2 %Finance leases 6.5 % 7.1 %
Other Information for 2020 and 2019
2020 2019Cash paid for amounts included in the measurement of lease liabilities:
Operating cash flows from operating leases $ 200 $ 194 Operating cash flows from finance leases $ 20 $ 20 Financing cash flows from finance leases $ 29 $ 26
Supplemental noncash information on lease liabilities arising from obtaining right-of-use assets:Right-of-use assets obtained in exchange for new finance lease obligations $ 59 $ 18 Right-of-use assets obtained in exchange for new operating lease obligations $ 118 $ 163
80
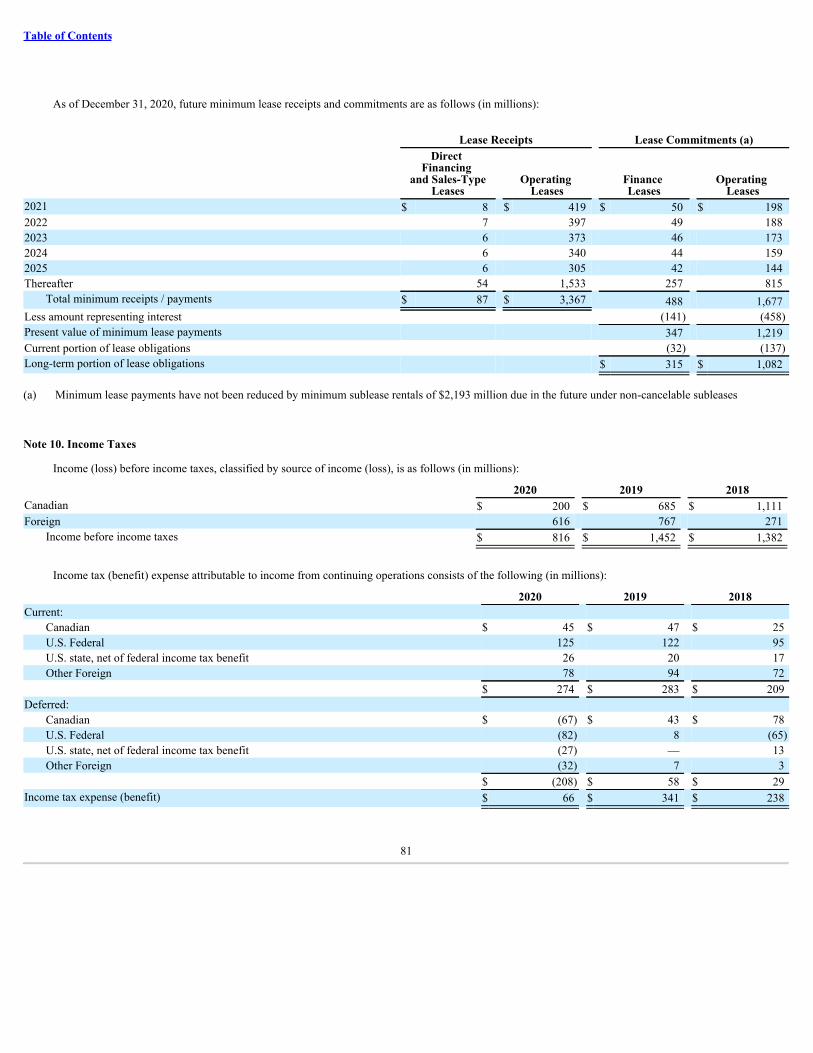
Table of Contents
As of December 31, 2020, future minimum lease receipts and commitments are as follows (in millions):
Lease Receipts Lease Commitments (a)Direct
Financing and Sales-Type
LeasesOperating
LeasesFinance Leases
Operating Leases
2021 $ 8 $ 419 $ 50 $ 198 2022 7 397 49 188 2023 6 373 46 173 2024 6 340 44 159 2025 6 305 42 144 Thereafter 54 1,533 257 815
Total minimum receipts / payments $ 87 $ 3,367 488 1,677 Less amount representing interest (141) (458)Present value of minimum lease payments 347 1,219 Current portion of lease obligations (32) (137)Long-term portion of lease obligations $ 315 $ 1,082
(a) Minimum lease payments have not been reduced by minimum sublease rentals of $2,193 million due in the future under non-cancelable subleases
Note 10. Income Taxes
Income (loss) before income taxes, classified by source of income (loss), is as follows (in millions):
2020 2019 2018Canadian $ 200 $ 685 $ 1,111 Foreign 616 767 271
Income before income taxes $ 816 $ 1,452 $ 1,382
Income tax (benefit) expense attributable to income from continuing operations consists of the following (in millions):
2020 2019 2018Current:
Canadian $ 45 $ 47 $ 25 U.S. Federal 125 122 95 U.S. state, net of federal income tax benefit 26 20 17 Other Foreign 78 94 72
$ 274 $ 283 $ 209 Deferred:
Canadian $ (67) $ 43 $ 78 U.S. Federal (82) 8 (65)U.S. state, net of federal income tax benefit (27) — 13 Other Foreign (32) 7 3
$ (208) $ 58 $ 29 Income tax expense (benefit) $ 66 $ 341 $ 238
81
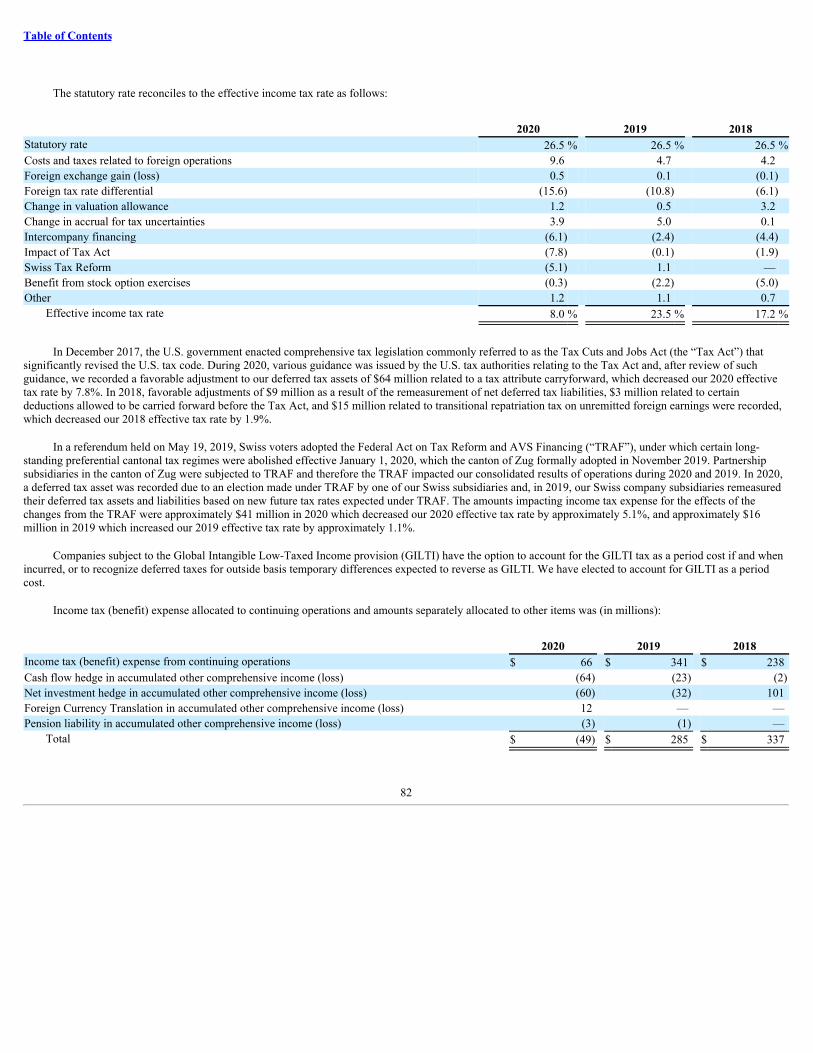
Table of Contents
The statutory rate reconciles to the effective income tax rate as follows:
2020 2019 2018Statutory rate 26.5 % 26.5 % 26.5 %Costs and taxes related to foreign operations 9.6 4.7 4.2 Foreign exchange gain (loss) 0.5 0.1 (0.1)Foreign tax rate differential (15.6) (10.8) (6.1)Change in valuation allowance 1.2 0.5 3.2 Change in accrual for tax uncertainties 3.9 5.0 0.1 Intercompany financing (6.1) (2.4) (4.4)Impact of Tax Act (7.8) (0.1) (1.9)Swiss Tax Reform (5.1) 1.1 — Benefit from stock option exercises (0.3) (2.2) (5.0)Other 1.2 1.1 0.7
Effective income tax rate 8.0 % 23.5 % 17.2 %
In December 2017, the U.S. government enacted comprehensive tax legislation commonly referred to as the Tax Cuts and Jobs Act (the “Tax Act”) thatsignificantly revised the U.S. tax code. During 2020, various guidance was issued by the U.S. tax authorities relating to the Tax Act and, after review of suchguidance, we recorded a favorable adjustment to our deferred tax assets of $64 million related to a tax attribute carryforward, which decreased our 2020 effectivetax rate by 7.8%. In 2018, favorable adjustments of $9 million as a result of the remeasurement of net deferred tax liabilities, $3 million related to certaindeductions allowed to be carried forward before the Tax Act, and $15 million related to transitional repatriation tax on unremitted foreign earnings were recorded,which decreased our 2018 effective tax rate by 1.9%.
In a referendum held on May 19, 2019, Swiss voters adopted the Federal Act on Tax Reform and AVS Financing (“TRAF”), under which certain long-standing preferential cantonal tax regimes were abolished effective January 1, 2020, which the canton of Zug formally adopted in November 2019. Partnershipsubsidiaries in the canton of Zug were subjected to TRAF and therefore the TRAF impacted our consolidated results of operations during 2020 and 2019. In 2020,a deferred tax asset was recorded due to an election made under TRAF by one of our Swiss subsidiaries and, in 2019, our Swiss company subsidiaries remeasuredtheir deferred tax assets and liabilities based on new future tax rates expected under TRAF. The amounts impacting income tax expense for the effects of thechanges from the TRAF were approximately $41 million in 2020 which decreased our 2020 effective tax rate by approximately 5.1%, and approximately $16million in 2019 which increased our 2019 effective tax rate by approximately 1.1%.
Companies subject to the Global Intangible Low-Taxed Income provision (GILTI) have the option to account for the GILTI tax as a period cost if and whenincurred, or to recognize deferred taxes for outside basis temporary differences expected to reverse as GILTI. We have elected to account for GILTI as a periodcost.
Income tax (benefit) expense allocated to continuing operations and amounts separately allocated to other items was (in millions):
2020 2019 2018Income tax (benefit) expense from continuing operations $ 66 $ 341 $ 238 Cash flow hedge in accumulated other comprehensive income (loss) (64) (23) (2)Net investment hedge in accumulated other comprehensive income (loss) (60) (32) 101 Foreign Currency Translation in accumulated other comprehensive income (loss) 12 — — Pension liability in accumulated other comprehensive income (loss) (3) (1) —
Total $ (49) $ 285 $ 337
82
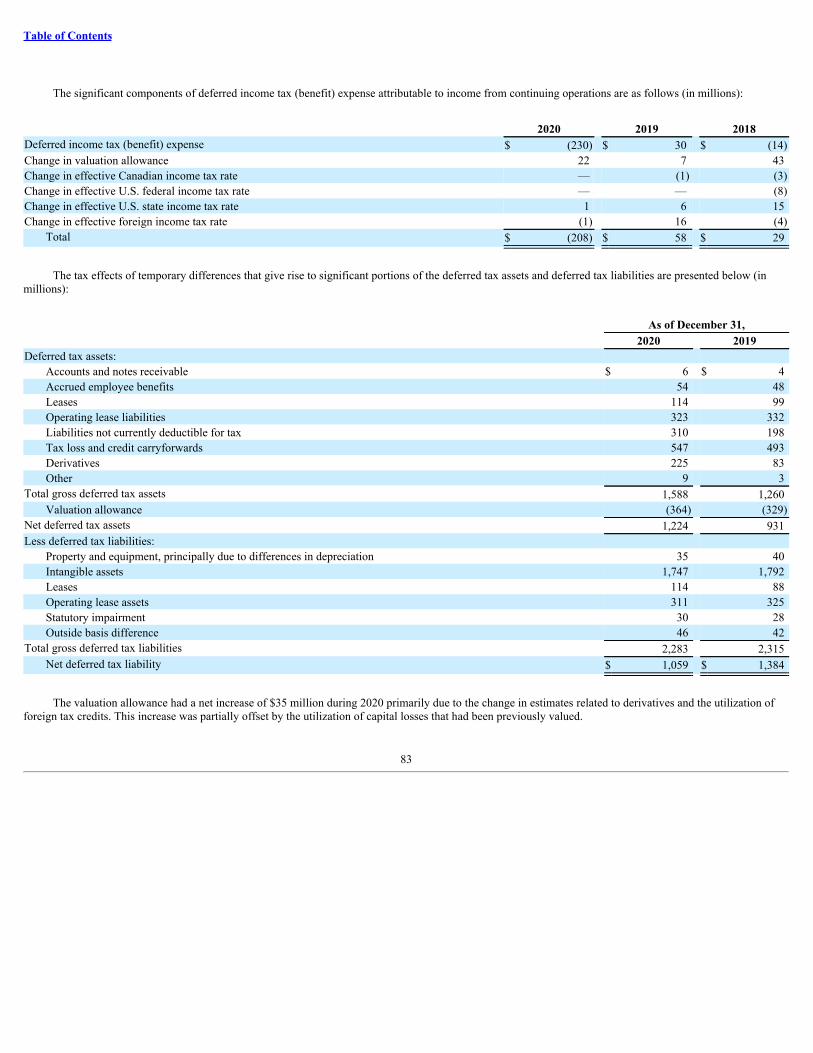
Table of Contents
The significant components of deferred income tax (benefit) expense attributable to income from continuing operations are as follows (in millions):
2020 2019 2018Deferred income tax (benefit) expense $ (230) $ 30 $ (14)Change in valuation allowance 22 7 43 Change in effective Canadian income tax rate — (1) (3)Change in effective U.S. federal income tax rate — — (8)Change in effective U.S. state income tax rate 1 6 15 Change in effective foreign income tax rate (1) 16 (4)
Total $ (208) $ 58 $ 29
The tax effects of temporary differences that give rise to significant portions of the deferred tax assets and deferred tax liabilities are presented below (inmillions):
As of December 31, 2020 2019Deferred tax assets:
Accounts and notes receivable $ 6 $ 4 Accrued employee benefits 54 48 Leases 114 99 Operating lease liabilities 323 332 Liabilities not currently deductible for tax 310 198 Tax loss and credit carryforwards 547 493 Derivatives 225 83 Other 9 3
Total gross deferred tax assets 1,588 1,260 Valuation allowance (364) (329)
Net deferred tax assets 1,224 931 Less deferred tax liabilities:
Property and equipment, principally due to differences in depreciation 35 40 Intangible assets 1,747 1,792 Leases 114 88 Operating lease assets 311 325 Statutory impairment 30 28 Outside basis difference 46 42
Total gross deferred tax liabilities 2,283 2,315 Net deferred tax liability $ 1,059 $ 1,384
The valuation allowance had a net increase of $35 million during 2020 primarily due to the change in estimates related to derivatives and the utilization offoreign tax credits. This increase was partially offset by the utilization of capital losses that had been previously valued.
83

Table of Contents
Changes in the valuation allowance are as follows (in millions):
2020 2019 2018Beginning balance $ 329 $ 325 $ 282
Change in estimates recorded to deferred income tax expense 19 8 43 Changes in losses and credits 3 (2) — Additions related to other comprehensive income 13 (2) —
Ending balance $ 364 $ 329 $ 325
The gross amount and expiration dates of operating loss and tax credit carry-forwards as of December 31, 2020 are as follows (in millions):
Amount Expiration DateCanadian net operating loss carryforwards $ 866 2036-2040Canadian capital loss carryforwards 930 IndefiniteU.S. state net operating loss carryforwards 639 2021-2043U.S. state net operating loss carryforwards 1 IndefiniteU.S. foreign tax credits 100 2021-2030Other foreign net operating loss carryforwards 212 IndefiniteOther foreign net operating loss carryforwards 70 2021-2039Other foreign capital loss carryforward 31 IndefiniteForeign credits 5 2023-2039Total $ 2,854
We are generally permanently reinvested on any potential outside basis differences except for unremitted earnings and profits. A determination of thedeferred tax liability on this amount is not practicable due to the complexities, variables and assumptions inherent in the hypothetical calculations. Thus we havenot provided taxes, including U.S. federal and state income, foreign income, or foreign withholding taxes, for any outside basis differences that we believe arepermanently invested. We will continue to monitor available evidence and our plans for foreign earnings and expect to continue to provide any applicable deferredtaxes based on the tax liability or withholding taxes that would be due upon repatriation of amounts not considered permanently reinvested.
We had $497 million and $506 million of unrecognized tax benefits at December 31, 2020 and December 31, 2019, respectively, which if recognized, wouldfavorably affect the effective income tax rate. A reconciliation of the beginning and ending amounts of unrecognized tax benefits is as follows (in millions):
2020 2019 2018Beginning balance $ 506 $ 441 $ 461
Additions for tax positions related to the current year 9 9 1 Additions for tax positions of prior years 7 56 18 Reductions for tax positions of prior year (25) — (18)Reductions for settlement — — (18)Reductions due to statute expiration — — (3)
Ending balance $ 497 $ 506 $ 441
During the twelve months beginning January 1, 2021, it is reasonably possible we will reduce unrecognized tax benefits by approximately $90 million,primarily as a result of the expiration of certain statutes of limitations and the resolution of audits in multiple taxing jurisdictions.
84

Table of Contents
We recognize interest and penalties related to unrecognized tax benefits in income tax expense. The total amount of accrued interest and penalties was $123million and $92 million at December 31, 2020 and 2019, respectively. Potential interest and penalties associated with uncertain tax positions in variousjurisdictions recognized was $31 million during 2020, $41 million during 2019 and $14 million during 2018. To the extent interest and penalties are not assessedwith respect to uncertain tax positions, amounts accrued will be reduced and reflected as a reduction of the overall income tax provision.
We file income tax returns with Canada and its provinces and territories. Generally we are subject to routine examinations by the Canada Revenue Agency(“CRA”). The CRA is conducting examinations of the 2014 through 2016 taxation years. Additionally, income tax returns filed with various provincialjurisdictions are generally open to examination for periods up to six years subsequent to the filing of the respective return.
We also file income tax returns, including returns for our subsidiaries, with U.S. federal, U.S. state, and other foreign jurisdictions. We are subject to routineexamination by taxing authorities in the U.S. jurisdictions, as well as other foreign tax jurisdictions. None of the other foreign jurisdictions have been individuallymaterial. We expect the taxable years 2014, 2015 and 2016 for our U.S. companies for U.S. federal income tax purposes to close in 2021 without materialadjustments. Prior taxable years of such U.S. companies are closed for U.S. federal income tax purposes. We have various U.S. state and other foreign income taxreturns in the process of examination. From time to time, these audits result in proposed assessments where the ultimate resolution may result in owing additionaltaxes. We believe that our tax positions comply with applicable tax law and that we have adequately provided for these matters.
Note 11. Derivative Instruments
Disclosures about Derivative Instruments and Hedging Activities
We enter into derivative instruments for risk management purposes, including derivatives designated as cash flow hedges, derivatives designated as netinvestment hedges and those utilized as economic hedges. We use derivatives to manage our exposure to fluctuations in interest rates and currency exchange rates.
Interest Rate Swaps
At December 31, 2020, we had outstanding receive-variable, pay-fixed interest rate swaps with a total notional value of $3,500 million to hedge thevariability in the interest payments on a portion of our Term Loan Facilities beginning October 31, 2019 through the termination date of November 19, 2026.Additionally, at December 31, 2020, we also had outstanding receive-variable, pay-fixed interest rate swaps with a total notional value of $500 million to hedge thevariability in the interest payments on a portion of our Term Loan Facilities effective September 30, 2019 through the termination date of September 30, 2026. Atinception, all of these interest rate swaps were designated as cash flow hedges for hedge accounting. The unrealized changes in market value are recorded in AOCIand reclassified into earnings during the period in which the hedged forecasted transaction affects earnings.
During 2019, we extended the term of our previous $3,500 million receive-variable, pay-fixed interest rate swaps to align the maturity date of the newinterest rate swaps with the maturity date of our Term Loan B under the Fourth Amendment. The extension of the term resulted in a de-designation and re-designation of the interest rate swaps and the swaps continue to be accounted for as a cash flow hedge for hedge accounting. In connection with the de-designation,we recognized a net unrealized loss of $213 million in AOCI and this amount gets reclassified into Interest expense, net as the original hedged forecastedtransaction affects earnings. The amount of pre-tax losses in AOCI as of December 31, 2020 that we expect to be reclassified into interest expense within the next12 months is $50 million.
During 2015, we entered into a series of receive-variable, pay-fixed interest rate swaps with a notional value of $2,500 million to hedge the variability in theinterest payments on a portion of our Term Loan Facilities beginning May 28, 2015. All of these interest rate swaps were settled on April 26, 2018 for aninsignificant cash receipt. At inception, these interest rate swaps were designated as cash flow hedges for hedge accounting. The unrealized changes in marketvalue were recorded in AOCI and reclassified into earnings during the period in which the hedged forecasted transaction affects earnings.
During 2015, we settled certain interest rate swaps and recognized a net unrealized loss of $85 million in AOCI at the date of settlement. This amount getsreclassified into Interest expense, net as the original hedged forecasted transaction affects earnings. The amount of pre-tax losses in AOCI as of December 31, 2020that we expect to be reclassified into interest expense within the next 12 months is $11 million.
85

Table of Contents
Cross-Currency Rate Swaps
To protect the value of our investments in our foreign operations against adverse changes in foreign currency exchange rates, we hedge a portion of our netinvestment in one or more of our foreign subsidiaries by using cross-currency rate swaps. At December 31, 2020, we had outstanding cross-currency rate swapcontracts between the Canadian dollar and U.S. dollar and the Euro and U.S. dollar that have been designated as net investment hedges of a portion of our equity inforeign operations in those currencies. The component of the gains and losses on our net investment in these designated foreign operations driven by changes inforeign exchange rates are economically partly offset by movements in the fair value of our cross-currency swap contracts. The fair value of the swaps is calculatedeach period with changes in fair value reported in AOCI, net of tax. Such amounts will remain in AOCI until the complete or substantially complete liquidation ofour investment in the underlying foreign operations.
At December 31, 2020, we had outstanding fixed-to-fixed cross-currency rate swaps to partially hedge the net investment in our Canadian subsidiaries. Atinception, these cross-currency rate swaps were designated as a hedge and are accounted for as net investment hedges. These swaps are contracts to exchangequarterly fixed-rate interest payments we make on the Canadian dollar notional amount of C$6,754 million for quarterly fixed-rate interest payments we receive onthe U.S. dollar notional amount of $5,000 million through the maturity date of June 30, 2023.
At December 31, 2020, we had outstanding cross-currency rate swaps in which we pay quarterly fixed-rate interest payments on the Euro notional amount of€1,108 million and receive quarterly fixed-rate interest payments on the U.S. dollar notional amount of $1,200 million. At inception, these cross-currency rateswaps were designated as a hedge and are accounted for as a net investment hedge. During 2018, we extended the term of the swaps from March 31, 2021 to thematurity date of February 17, 2024. The extension of the term resulted in a re-designation of the hedge and the swaps continue to be accounted for as a netinvestment hedge. Additionally, at December 31, 2020, we also had outstanding cross-currency rate swaps in which we receive quarterly fixed-rate interestpayments on the U.S. dollar notional value of $400 million, entered during 2018, and $500 million, entered during 2019, through the maturity date of February 17,2024. At inception, these cross-currency rate swaps were designated as a hedge and are accounted for as a net investment hedge.
The fixed to fixed cross-currency rate swaps hedging Canadian dollar and Euro net investments utilized the forward method of effectiveness assessmentprior to March 15, 2018. On March 15, 2018, we de-designated and subsequently re-designated the outstanding fixed to fixed cross-currency rate swaps toprospectively use the spot method of hedge effectiveness assessment. Additionally, as a result of adopting new hedge accounting guidance during 2018, we electedto exclude the interest component (the "Excluded Component") from the accounting hedge without affecting net investment hedge accounting and elected toamortize the Excluded Component over the life of the derivative instrument. The amortization of the Excluded Component is recognized in Interest expense, net inthe consolidated statement of operations. The change in fair value that is not related to the Excluded Component is recorded in AOCI and will be reclassified toearnings when the foreign subsidiaries are sold or substantially liquidated.
Foreign Currency Exchange Contracts
We use foreign exchange derivative instruments to manage the impact of foreign exchange fluctuations on U.S. dollar purchases and payments, such ascoffee purchases made by our Canadian Tim Hortons operations. At December 31, 2020, we had outstanding forward currency contracts to manage this risk inwhich we sell Canadian dollars and buy U.S. dollars with a notional value of $122 million with maturities to January 2022. We have designated these instrumentsas cash flow hedges, and as such, the unrealized changes in market value of effective hedges are recorded in AOCI and are reclassified into earnings during theperiod in which the hedged forecasted transaction affects earnings.
Credit Risk
By entering into derivative contracts, we are exposed to counterparty credit risk. Counterparty credit risk is the failure of the counterparty to perform underthe terms of the derivative contract. When the fair value of a derivative contract is in an asset position, the counterparty has a liability to us, which creates creditrisk for us. We attempt to minimize this risk by selecting counterparties with investment grade credit ratings and regularly monitoring our market position witheach counterparty.
Credit-Risk Related Contingent Features
Our derivative instruments do not contain any credit-risk related contingent features.
86

Table of Contents
Quantitative Disclosures about Derivative Instruments and Fair Value Measurements
The following tables present the required quantitative disclosures for our derivative instruments, including their estimated fair values (all estimated usingLevel 2 inputs) and their location on our consolidated balance sheets (in millions):
Gain or (Loss) Recognized in
Other Comprehensive Income (Loss) 2020 2019 2018Derivatives designated as cash flow hedges
Interest rate swaps $ (333) $ (102) $ (37)Forward-currency contracts $ (2) $ (4) $ 11
Derivatives designated as net investment hedgesCross-currency rate swaps $ (302) $ (118) $ 383
(1) We did not exclude any components from the cash flow hedge relationships presented in this table.
Location of Gain or (Loss)Reclassified from AOCI into
EarningsGain or (Loss) Reclassified from AOCI into
Earnings 2020 2019 2018Derivatives designated as cash flow hedges
Interest rate swaps Interest expense, net $ (102) $ (26) $ (19)Forward-currency contracts Cost of sales $ 2 $ 5 $ (1)
Location of Gain or (Loss)
Recognized in EarningsGain or (Loss) Recognized in Earnings (Amount
Excluded from Effectiveness Testing) 2020 2019 2018Derivatives designated as net investment hedges
Cross-currency rate swaps Interest expense, net $ 69 $ 70 $ 60
Fair Value as of
December 31, 2020 2019 Balance Sheet LocationAssets:Derivatives designated as cash flow hedges
Interest rate $ — $ 7 Other assets, netDerivatives designated as net investment hedges
Foreign currency — 22 Other assets, netTotal assets at fair value $ — $ 29
Liabilities:Derivatives designated as cash flow hedges
Interest rate $ 430 $ 175 Other liabilities, netForeign currency 5 2 Other accrued liabilities
Derivatives designated as net investment hedgesForeign currency 434 166 Other liabilities, net
Total liabilities at fair value $ 869 $ 343
(1)
87

Table of Contents
Note 12. Equity
Pursuant to the terms of the partnership agreement, RBI, as the holder of Class A common units, is entitled to distributions from Partnership in an amountequal to the aggregate dividends payable by RBI to holders of RBI common shares, and the holders of Partnership exchangeable units are entitled to receivedistributions from Partnership in an amount per unit equal to the dividend payable by RBI on each RBI common share. Additionally, if RBI proposes to redeem,repurchase or otherwise acquire any RBI common shares, the partnership agreement requires that Partnership, immediately prior to such redemption, repurchase oracquisition, make a distribution to RBI on the Class A common units in an amount sufficient for RBI to fund such redemption, repurchase or acquisition, as thecase may be. Each holder of a Partnership exchangeable unit is entitled to vote in respect of matters on which holders of RBI common shares are entitled to votethrough one special voting share of RBI. Since December 12, 2015, a holder of a Partnership exchangeable unit may require Partnership to exchange all or anyportion of such holder’s Partnership exchangeable units for RBI common shares at a ratio of one common share for each Partnership exchangeable unit, subject toRBI’s right as the general partner of Partnership, in its sole discretion, to deliver a cash payment in lieu of RBI common shares. If RBI elects to make a cashpayment in lieu of issuing common shares, the amount of the payment will be the weighted average trading price of the RBI common shares on the New YorkStock Exchange for the 20 consecutive trading days ending on the last business day prior to the exchange date.
During 2020, Partnership exchanged 10,393,861 Partnership exchangeable units, pursuant to exchange notices received. In accordance with the terms of thepartnership agreement, Partnership satisfied the exchange notices by repurchasing 6,757,692 Partnership exchangeable units for approximately $380 million incash and exchanging 3,636,169 Partnership exchangeable units for the same number of newly issued RBI common shares. During 2019, Partnership exchanged42,016,392 Partnership exchangeable units, pursuant to exchange notices received. In accordance with the terms of the partnership agreement, Partnership satisfiedthe exchange notices by exchanging 42,016,392 Partnership exchangeable units for the same number of newly issued RBI common shares. During 2018,Partnership exchanged 10,185,333 Partnership exchangeable units, pursuant to exchange notices received. In accordance with the terms of the partnershipagreement, Partnership satisfied the exchange notices by repurchasing 10,000,000 Partnership exchangeable units for approximately $561 million in cash andexchanging 185,333 Partnership exchangeable units for the same number of newly issued RBI common shares. The exchanges of Partnership exchangeable unitswere recorded as increases to the Class A common units balance within partner’s capital in our consolidated balance sheets in an amount equal to the market valueof the newly issued RBI common shares and a reduction to the Partnership exchangeable units balance within partner’s capital of our consolidated balance sheetsin an amount equal to the cash paid by Partnership and the market value of the newly issued RBI common shares. Pursuant to the terms of the partnershipagreement, upon the exchange of Partnership exchangeable units, each such Partnership exchangeable unit was cancelled concurrently with the exchange.
88

Table of Contents
Accumulated Other Comprehensive Income (Loss)
The following table displays the change in the components of AOCI (in millions):
Derivatives Pensions
Foreign Currency
Translation
Accumulated Other
Comprehensive Income (Loss)
Balances at December 31, 2017 $ 177 $ (28) $ (1,033) $ (884)Foreign currency translation adjustment — — (831) (831)Net change in fair value of derivatives, net of tax 263 — — 263 Amounts reclassified to earnings of cash flow hedges, net of tax 14 — — 14 Pension and post-retirement benefit plans, net of tax — 1 — 1
Balances at December 31, 2018 $ 454 $ (27) $ (1,864) $ (1,437)Foreign currency translation adjustment — — 409 409 Net change in fair value of derivatives, net of tax (163) — — (163)Amounts reclassified to earnings of cash flow hedges, net of tax 15 — — 15 Pension and post-retirement benefit plans, net of tax — (2) — (2)
Balances at December 31, 2019 $ 306 $ (29) $ (1,455) $ (1,178)Foreign currency translation adjustment — — 332 332 Net change in fair value of derivatives, net of tax (486) — — (486)Amounts reclassified to earnings of cash flow hedges, net of tax 73 — — 73 Pension and post-retirement benefit plans, net of tax — (16) — (16)
Balances at December 31, 2020 $ (107) $ (45) $ (1,123) $ (1,275)
Note 13. Share-based Compensation
Share-based compensation expense associated with the participation of Partnership and its subsidiaries in RBI’s share-based compensation plans isrecognized in Partnership’s Financial Statements.
RBI's Amended and Restated 2014 Omnibus Incentive Plan (the “Omnibus Plan”) provides for the grant of awards to employees, directors, consultants andother persons who provide services to RBI and its affiliates. RBI also has some outstanding awards under legacy plans for BK and TH, that were assumed inconnection with the merger and amalgamation of those entities within the RBI group. No new awards may be granted under these legacy BK plans or legacy THplans.
RBI is currently issuing awards under the Omnibus Plan and the number of shares available for issuance under such plan as of December 31, 2020 was11,591,247. The Omnibus Plan permits the grant of several types of awards with respect to RBI common shares, including stock options, time-vested RSUs, andperformance-based RSUs, which may include RBI and/or individual performance based-vesting conditions. Under the terms of the Omnibus Plan, RSUs areentitled to dividend equivalents, unless otherwise noted. Dividend equivalents are not distributed unless the related awards vest. Upon vesting, the amount of thedividend equivalent, which is distributed in additional RSUs, except in the case of RSUs awarded to non-management members of RBI's board of directors, isequal to the equivalent of the aggregate dividends declared on common shares during the period from the date of grant of the award compounded until the date theshares underlying the award are delivered.
Stock option awards are granted with an exercise price or market value equal to the closing price of RBI's common shares on the trading day preceding thedate of grant. RBI satisfies stock option exercises through the issuance of authorized but previously unissued common shares. New stock option grants generallycliff vest 5 years from the original grant date, provided the employee is continuously employed by RBI or one of our affiliates, and the stock options expire 10years following the grant date. Additionally, if RBI terminates the employment of a stock option holder without cause prior to the vesting date, or if the employeeretires or becomes disabled, the employee will become vested in the number of stock options as if the stock options vested 20% on each anniversary of the grantdate. If the employee dies, the employee will become vested in the number of stock options as if the stock options vested 20% on the first anniversary of the grantdate, 40% on the second anniversary of the grant date and 100% on the third anniversary of the grant date. If an employee is terminated with cause or resignsbefore vesting, all stock options are forfeited. If there is an event such as a return of capital or dividend that is determined to be dilutive, the exercise price of theawards will be adjusted accordingly.
89
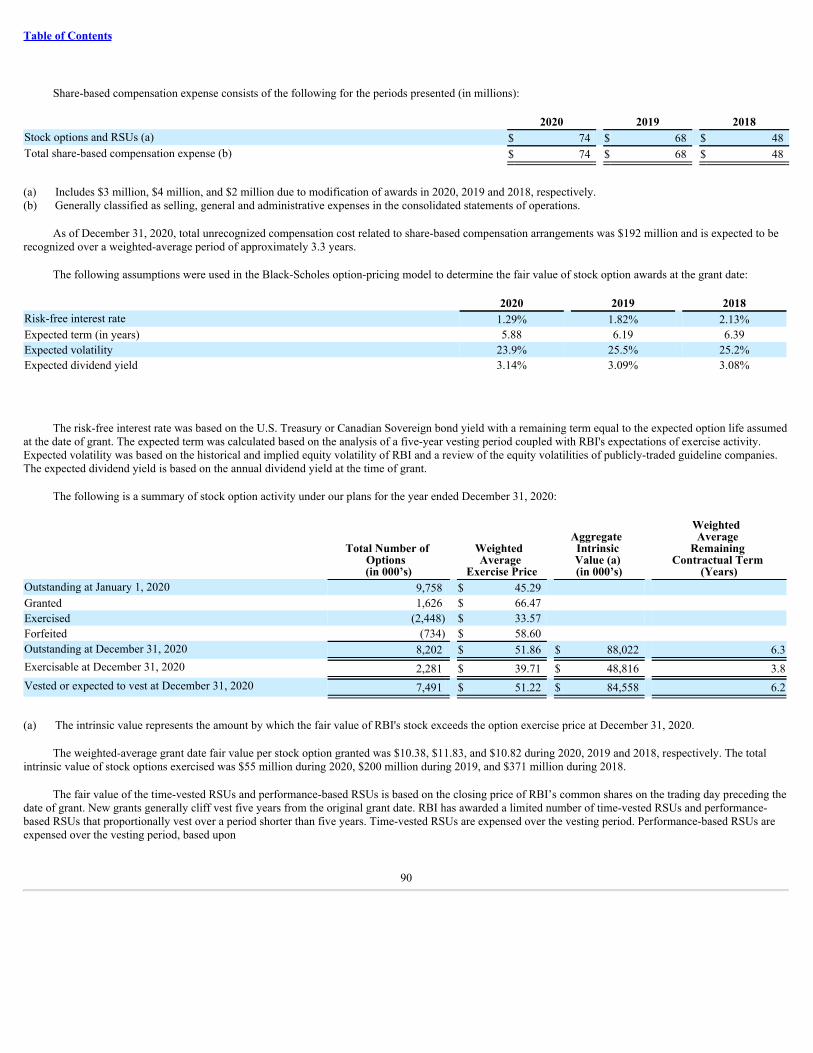
Table of Contents
Share-based compensation expense consists of the following for the periods presented (in millions):
2020 2019 2018Stock options and RSUs (a) $ 74 $ 68 $ 48 Total share-based compensation expense (b) $ 74 $ 68 $ 48
(a) Includes $3 million, $4 million, and $2 million due to modification of awards in 2020, 2019 and 2018, respectively.(b) Generally classified as selling, general and administrative expenses in the consolidated statements of operations.
As of December 31, 2020, total unrecognized compensation cost related to share-based compensation arrangements was $192 million and is expected to berecognized over a weighted-average period of approximately 3.3 years.
The following assumptions were used in the Black-Scholes option-pricing model to determine the fair value of stock option awards at the grant date:
2020 2019 2018Risk-free interest rate 1.29% 1.82% 2.13%Expected term (in years) 5.88 6.19 6.39Expected volatility 23.9% 25.5% 25.2%Expected dividend yield 3.14% 3.09% 3.08%
The risk-free interest rate was based on the U.S. Treasury or Canadian Sovereign bond yield with a remaining term equal to the expected option life assumedat the date of grant. The expected term was calculated based on the analysis of a five-year vesting period coupled with RBI's expectations of exercise activity.Expected volatility was based on the historical and implied equity volatility of RBI and a review of the equity volatilities of publicly-traded guideline companies.The expected dividend yield is based on the annual dividend yield at the time of grant.
The following is a summary of stock option activity under our plans for the year ended December 31, 2020:
Total Number of Options (in 000’s)
Weighted Average
Exercise Price
Aggregate Intrinsic Value (a) (in 000’s)
Weighted Average
Remaining Contractual Term
(Years)Outstanding at January 1, 2020 9,758 $ 45.29 Granted 1,626 $ 66.47 Exercised (2,448) $ 33.57 Forfeited (734) $ 58.60 Outstanding at December 31, 2020 8,202 $ 51.86 $ 88,022 6.3Exercisable at December 31, 2020 2,281 $ 39.71 $ 48,816 3.8Vested or expected to vest at December 31, 2020 7,491 $ 51.22 $ 84,558 6.2
(a) The intrinsic value represents the amount by which the fair value of RBI's stock exceeds the option exercise price at December 31, 2020.
The weighted-average grant date fair value per stock option granted was $10.38, $11.83, and $10.82 during 2020, 2019 and 2018, respectively. The totalintrinsic value of stock options exercised was $55 million during 2020, $200 million during 2019, and $371 million during 2018.
The fair value of the time-vested RSUs and performance-based RSUs is based on the closing price of RBI’s common shares on the trading day preceding thedate of grant. New grants generally cliff vest five years from the original grant date. RBI has awarded a limited number of time-vested RSUs and performance-based RSUs that proportionally vest over a period shorter than five years. Time-vested RSUs are expensed over the vesting period. Performance-based RSUs areexpensed over the vesting period, based upon
90

Table of Contents
the probability that the performance target will be met. RBI grants fully vested RSUs, with dividend equivalent rights that accrue in cash, to non-employeemembers of RBI's board of directors in lieu of a cash retainer and committee fees. All such RSUs will settle and common shares of RBI will be issued upontermination of service by the board member.
The time-vested RSUs generally cliff vest five years from December 31 of the year preceding the grant date and performance-based RSUs generally cliffvest five years from the grant date (the starting date for the applicable five year vesting period is referred to as the “Anniversary Date”). If the employee isterminated for any reason within the first two years of the Anniversary Date, 100% of the time-vested RSUs granted will be forfeited. If RBI terminates theemployment of a time-vested RSU holder without cause two years after the Anniversary Date, or if the employee retires, the employee will become vested in thenumber of time-vested RSUs as if the time-vested RSUs vested 20% for each year after the Anniversary Date. If the employee is terminated for any reason withinthe first three years of the Anniversary Date, 100% of the performance-based RSUs granted will be forfeited. If RBI terminates the employment of a performance-based RSU holder without cause between three and five years after the Anniversary Date, or if the employee retires, the employee will become vested in 50% ofthe performance-based RSUs. An alternate ratable vesting schedule applies to the extent the participant ends employment by reason of death or disability.
The following is a summary of time-vested RSUs and performance-based RSUs activity for the year ended December 31, 2020:
Time-vested RSUs Performance-based RSUs
Total Number of Shares
(in 000’s)
Weighted Average Grant Date Fair
Value
Total Number of Shares
(in 000’s)
Weighted Average Grant Date Fair
ValueOutstanding at January 1, 2020 1,752 $ 46.50 4,066 $ 53.78 Granted 337 $ 65.20 1,291 $ 62.69 Vested and settled (217) $ 40.42 (164) $ 47.32 Dividend equivalents granted 56 $ — 182 $ — Forfeited (167) $ 47.69 (506) $ 32.91 Outstanding at December 31, 2020 1,761 $ 49.99 4,869 $ 56.96
The weighted-average grant date fair value of time-vested RSUs granted was $64.82 and $57.68 during 2019 and 2018, respectively. The weighted-averagegrant date fair value of performance-based RSUs granted was $65.54 and $58.49 during 2019 and 2018, respectively. The total fair value, determined as of the dateof vesting, of RSUs vested and converted to common shares of RBI during 2020, 2019 and 2018 was $21 million, $8 million and $7 million, respectively.
Note 14. Revenue Recognition
Revenue from Contracts with Customers
We transitioned to ASC 606 on January 1, 2018 using the modified retrospective transition method. Our transition to ASC 606 represented a change inaccounting principle. The $250 million cumulative effect of our transition to ASC 606 is reflected as an adjustment to January 1, 2018 Partners' capital, and relatesprimarily to changes in accounting for franchise fees, advertising funds, gift card breakage and related tax effects under ASC 606.
st
91

Table of Contents
Contract Liabilities
Contract liabilities consist of deferred revenue resulting from initial and renewal franchise fees paid by franchisees, as well as upfront fees paid by masterfranchisees, which are generally recognized on a straight-line basis over the term of the underlying agreement. We classify these contract liabilities as Otherliabilities, net in our consolidated balance sheets. The following table reflects the change in contract liabilities by segment and on a consolidated basis betweenDecember 31, 2019 and December 31, 2020 (in millions):
Contract Liabilities TH BK PLK ConsolidatedBalance at December 31, 2019 $ 64 $ 449 $ 28 $ 541 Recognized during period and included in the contract liabilitybalance at the beginning of the year (10) (62) (2) (74)Increase, excluding amounts recognized as revenue during the period 7 25 13 45 Impact of foreign currency translation 1 15 — 16 Balance at December 31, 2020 $ 62 $ 427 $ 39 $ 528
The following table illustrates estimated revenues expected to be recognized in the future related to performance obligations that are unsatisfied (or partiallyunsatisfied) by segment and on a consolidated basis as of December 31, 2020 (in millions):
Contract liabilities expected to be recognized in TH BK PLK Consolidated2021 $ 9 $ 35 $ 3 $ 47 2022 8 34 3 45 2023 8 33 3 44 2024 7 32 2 41 2025 6 31 2 39 Thereafter 24 262 26 312 Total $ 62 $ 427 $ 39 $ 528
Disaggregation of Total Revenues
Total revenues consist of the following (in millions):
2020 2019 2018Sales $ 2,013 $ 2,362 $ 2,355 Royalties 2,161 2,319 2,165 Property revenues 718 833 744 Franchise fees and other revenue 76 89 93 Total revenues $ 4,968 $ 5,603 $ 5,357
Note 15. Other Operating Expenses (Income), net
Other operating expenses (income), net, consist of the following (in millions):
2020 2019 2018Net losses (gains) on disposal of assets, restaurant closures and refranchisings $ 6 $ 7 $ 19 Litigation settlements and reserves, net 7 2 11 Net losses (gains) on foreign exchange 100 (15) (33)Other, net (8) (4) 11
Other operating expenses (income), net $ 105 $ (10) $ 8
92
Table of Contents
Net losses (gains) on disposal of assets, restaurant closures, and refranchisings represent sales of properties and other costs related to restaurant closures andrefranchisings. Gains and losses recognized in the current period may reflect certain costs related to closures and refranchisings that occurred in previous periods.
Litigation settlements and reserves, net primarily reflects accruals and payments made and proceeds received in connection with litigation matters.
Net losses (gains) on foreign exchange is primarily related to revaluation of foreign denominated assets and liabilities.
Note 16. Commitments and Contingencies
Letters of Credit
As of December 31, 2020, we had $13 million in irrevocable standby letters of credit outstanding, which were issued primarily to certain insurance carriersto guarantee payments of deductibles for various insurance programs, such as health and commercial liability insurance. Of these letters of credit outstanding, $2million are secured by the collateral under our Revolving Credit Facility and the remainder are secured by cash collateral. As of December 31, 2020, no amountshad been drawn on any of these irrevocable standby letters of credit.
Purchase Commitments
We have arrangements for information technology and telecommunication services with an aggregate contractual obligation of $43 million over the nextthree years, some of which have early termination fees. We also enter into commitments to purchase advertising. As of December 31, 2020, these commitmentstotaled $186 million and run through 2024.
Litigation
From time to time, we are involved in legal proceedings arising in the ordinary course of business relating to matters including, but not limited to, disputeswith franchisees, suppliers, employees and customers, as well as disputes over our intellectual property.
On October 5, 2018, a class action complaint was filed against Burger King Worldwide, Inc. (“BKW”) and Burger King Corporation (“BKC”) in the U.S.District Court for the Southern District of Florida by Jarvis Arrington, individually and on behalf of all others similarly situated. On October 18, 2018, a secondclass action complaint was filed against RBI, BKW and BKC in the U.S. District Court for the Southern District of Florida by Monique Michel, individually andon behalf of all others similarly situated. On October 31, 2018, a third class action complaint was filed against BKC and BKW in the U.S. District Court for theSouthern District of Florida by Geneva Blanchard and Tiffany Miller, individually and on behalf of all others similarly situated. On November 2, 2018, a fourthclass action complaint was filed against RBI, BKW and BKC in the U.S. District Court for the Southern District of Florida by Sandra Muster, individually and onbehalf of all others similarly situated. These complaints have been consolidated and allege that the defendants violated Section 1 of the Sherman Act byincorporating an employee no-solicitation and no-hiring clause in the standard form franchise agreement all Burger King franchisees are required to sign. Eachplaintiff seeks injunctive relief and damages for himself or herself and other members of the class. On March 24, 2020, the Court granted BKC’s motion to dismissfor failure to state a claim and on April 20, 2020 the plaintiffs filed a motion for leave to amend their complaint. On April 27, 2020, BKC filed a motion opposingthe motion for leave to amend. The court denied the plaintiffs motion for leave to amend their complaint in August 2020 and the plaintiffs are appealing this ruling.While we currently believe these claims are without merit, we are unable to predict the ultimate outcome of this case or estimate the range of possible loss, if any.
In July 2019, a class action complaint was filed against The TDL Group Corp. (“TDL”) in the Supreme Court of British Columbia by Samir Latifi,individually and on behalf of all others similarly situated. The complaint alleges that TDL violated the Canadian Competition Act by incorporating an employeeno-solicitation and no-hiring clause in the standard form franchise agreement all Tim Hortons franchisees are required to sign. The plaintiff seeks damages andrestitution, on behalf of himself and other members of the class. While we currently believe this claim is without merit, we are unable to predict the ultimateoutcome of this case or estimate the range of possible loss, if any.
On June 30, 2020, a class action complaint was filed against Restaurant Brands International Inc., Restaurant Brands International Limited Partnership andThe TDL Group Corp. in the Quebec Superior Court by Steve Holcman, individually and on behalf of all Quebec residents who downloaded the Tim Hortonsmobile application. On July 2, 2020, a Notice of Action related to a second class action complaint was filed against Restaurant Brands International Inc., in theOntario Superior Court by Ashley Sitko and Ashley Cadeau, individually and on behalf of all Canadian residents who downloaded the Tim Hortons mobileapplication. On August 31, 2020, a notice of claim was filed against Restaurant Brands International Inc. in the Supreme Court of British Columbia by Wai LamJacky Law on behalf of all persons in Canada who downloaded the Tim Hortons mobile application or the Burger King
93

Table of Contents
mobile application. On September 30, 2020, a notice of action was filed against Restaurant Brands International Inc., Restaurant Brands International LimitedPartnership, The TDL Group Corp., Burger King Worldwide, Inc. and Popeyes Louisiana Kitchen, Inc. in the Ontario Superior Court of Justice by William Jung onbehalf of a to be determined class. All of the complaints allege that the defendants violated the plaintiff’s privacy rights, the Personal Information Protection andElectronic Documents Act, consumer protection and competition laws or app-based undertakings to users, in each case in connection with the collection ofgeolocation data through the Tim Hortons mobile application, and in certain cases, the Burger King and Popeyes mobile applications. Each plaintiff seeksinjunctive relief and monetary damages for himself or herself and other members of the class. These cases are in preliminary stages and we intend to vigorouslydefend against these lawsuits, but we are unable to predict the ultimate outcome of any of these cases or estimate the range of possible loss, if any.
On October 26, 2020, City of Warwick Municipal Employees Pension Fund, a purported stockholder of Restaurant Brands International Inc., individuallyand putatively on behalf of all other stockholders similarly situated, filed a lawsuit in the Supreme Court of the State of New York County of New York namingRBI and certain of its officers, directors and shareholders as defendants alleging violations of Sections 11, 12(a)(2) and 15 of the Securities Act of 1933, asamended, in connection with certain offerings of securities by an affiliate in August and September 2019. The complaint alleges that the shelf registrationstatement used in connection with such offering contained certain false and/or misleading statements or omissions. The complaint seeks, among other relief, classcertification of the lawsuit, unspecified compensatory damages, rescission, pre-judgement and post-judgement interest, costs and expenses. On December 18, 2020the plaintiffs filed an amended complaint and on February 16, 2021 RBI filed a motion to dismiss the complaint. RBI intends to vigorously defend. While webelieve these claims are without merit, we are unable to predict the ultimate outcome of this case or estimate the range of possible loss, if any.
On February 5, 2021, Paul J. Graney, a purported shareholder of Restaurant Brands International, individually and putatively on behalf of all otherstockholders similarly situated, filed a lawsuit in the U.S. District Court for the Southern District of Florida naming the Company and certain of its current orformer officers as defendants. This lawsuit alleges violation of Sections 10 and 20(a) of the Securities Exchange Act of 1934, as amended, in connection withcertain statements made beginning in April 2019. The complaint seeks, among other relief, class certification of the lawsuit, unspecified compensatory damages,costs, and expenses. The Company intends to vigorously defend. While we believe these claims are without merit, we are unable to predict the ultimate outcome ofthis case or estimate the range of possible loss, if any.
Note 17. Segment Reporting and Geographical Information
As stated in Note 1, Description of Business and Organization, we manage three brands. Under the Tim Hortons brand, we operate in the donut/coffee/teacategory of the quick service segment of the restaurant industry. Under the Burger King brand, we operate in the fast food hamburger restaurant category of thequick service segment of the restaurant industry. Under the Popeyes brand, we operate in the chicken category of the quick service segment of the restaurantindustry. Our business generates revenue from the following sources: (i) franchise revenues, consisting primarily of royalties based on a percentage of salesreported by franchise restaurants and franchise fees paid by franchisees; (ii) property revenues from properties we lease or sublease to franchisees; and (iii) sales atrestaurants owned by us (“Company restaurants”). In addition, our TH business generates revenue from sales to franchisees related to our supply chain operations,including manufacturing, procurement, warehousing and distribution, as well as sales to retailers.
Our management structure and financial reporting is organized around our three brands, including the information regularly reviewed by our Chief ExecutiveOfficer, who is our Chief Operating Decision Maker. Therefore, we have three operating segments: (1) TH, which includes all operations of our Tim Hortonsbrand, (2) BK, which includes all operations of our Burger King brand, and (3) PLK, which includes all operations of our Popeyes brand. Our three operatingsegments represent our reportable segments.
As stated in Note 9, Leases, we transitioned to ASC 842 from the Previous Standard on January 1, 2019. Our Financial Statements reflect the application ofASC 842 guidance beginning in 2019, while our Financial Statements for prior periods were prepared under the guidance of the Previous Standard.
94

Table of Contents
The following tables present revenues, by segment and by country, depreciation and amortization, (income) loss from equity method investments, and capitalexpenditures by segment (in millions):
2020 2019 2018Revenues by operating segment:
TH $ 2,810 $ 3,344 $ 3,292 BK 1,602 1,777 1,651 PLK 556 482 414
Total $ 4,968 $ 5,603 $ 5,357
Revenues by country (a):Canada $ 2,546 $ 3,037 $ 2,984 United States 1,889 1,930 1,785 Other 533 636 588
Total $ 4,968 $ 5,603 $ 5,357
Depreciation and amortization:TH $ 119 $ 112 $ 108 BK 62 62 61 PLK 8 11 11
Total $ 189 $ 185 $ 180
(Income) loss from equity method investments:TH $ (4) $ (7) $ (6)BK 43 (4) (16)
Total $ 39 $ (11) $ (22)
Capital expenditures:TH $ 92 $ 37 $ 59 BK 18 20 25 PLK 7 5 2
Total $ 117 $ 62 $ 86
(a) Only Canada and the United States represented 10% or more of our total revenues in each period presented.
Total assets by segment, and long-lived assets by segment and country are as follows (in millions):
Assets Long-Lived Assets As of December 31, As of December 31, 2020 2019 2020 2019By operating segment:TH $ 13,963 $ 13,894 $ 1,990 $ 1,972 BK 5,334 5,149 1,128 1,130 PLK 2,525 2,490 131 129 Unallocated 955 827 — —
Total $ 22,777 $ 22,360 $ 3,249 $ 3,231 By country:Canada $ 1,685 $ 1,665 United States 1,539 1,542 Other 25 24
Total $ 3,249 $ 3,231
95

Table of Contents
Long-lived assets include property and equipment, net, finance and operating lease right of use assets, net and net investment in property leased tofranchisees. Only Canada and the United States represented 10% or more of our total long-lived assets as of December 31, 2020 and December 31, 2019.
Our measure of segment income is Adjusted EBITDA. Adjusted EBITDA represents earnings (net income or loss) before interest expense, net, loss on earlyextinguishment of debt, income tax expense, and depreciation and amortization, adjusted to exclude (i) the non-cash impact of share-based compensation and non-cash incentive compensation expense, (ii) (income) loss from equity method investments, net of cash distributions received from equity method investments, (iii)other operating expenses (income), net and, (iv) income/expenses from non-recurring projects and non-operating activities. For the periods referenced, thisincluded costs incurred in connection with the centralization and relocation of our Canadian and U.S. restaurant support centers to new offices in Toronto, Ontario,and Miami, Florida, respectively, (“Office centralization and relocation cost”) professional advisory and consulting services associated with certaintransformational corporate restructuring initiatives that rationalize our structure and optimize cash movements, including consulting services related to theinterpretation of final and proposed regulations and guidance under the Tax Cuts and Jobs Act (“Corporate restructuring and tax advisory fees”) and professionalfees and compensation related expenses in connection with the Popeyes Acquisition (“PLK Transaction costs”).
2020 2019 2018Segment income:
TH $ 823 $ 1,122 $ 1,127 BK 823 994 928 PLK 218 188 157
Adjusted EBITDA 1,864 2,304 2,212 Share-based compensation and non-cash incentive compensation expense 84 74 55 PLK Transaction costs — — 10 Corporate restructuring and tax advisory fees 16 31 25 Office centralization and relocation costs — 6 20 Impact of equity method investments (a) 48 11 (3)Other operating expenses (income), net 105 (10) 8
EBITDA 1,611 2,192 2,097 Depreciation and amortization 189 185 180
Income from operations 1,422 2,007 1,917 Interest expense, net 508 532 535 Loss on early extinguishment of debt 98 23 — Income tax expense 66 341 238
Net income $ 750 $ 1,111 $ 1,144
(a) Represents (i) (income) loss from equity method investments and (ii) cash distributions received from our equity method investments. Cash distributionsreceived from our equity method investments are included in segment income.
Note 18. Quarterly Financial Data (Unaudited)
Summarized unaudited quarterly financial data (in millions, except per unit data) was as follows:
Quarters Ended March 31, June 30, September 30, December 31, 2020 2019 2020 2019 2020 2019 2020 2019Total revenues $ 1,225 $ 1,266 $ 1,048 $ 1,400 $ 1,337 $ 1,458 $ 1,358 $ 1,479 Income from operations $ 389 $ 434 $ 243 $ 491 $ 417 $ 571 $ 373 $ 511 Net income $ 224 $ 246 $ 164 $ 257 $ 223 $ 351 $ 139 $ 257 Basic and diluted earnings per unit
Class A common units $ 0.71 $ 0.67 $ 0.52 $ 0.70 $ 0.72 $ 1.00 $ 0.45 $ 0.81 Partnership exchangeable units $ 0.48 $ 0.53 $ 0.35 $ 0.55 $ 0.48 $ 0.76 $ 0.30 $ 0.55
96

Table of Contents
Note 19. Supplemental Financial Information
On February 17, 2017, 1011778 B.C. Unlimited Liability Company (the “Parent Issuer”) and New Red Finance Inc. (the “Co-Issuer” and together with theParent Issuer, the “Issuers”) entered into an amended credit agreement, as amended from time to time, that provides for obligations under the Credit Facilities. OnNovember 9, 2020 the Issuers entered into the 2020 3.50% Senior Notes Indenture with respect to the 2020 3.50% Senior Notes. On October 5, 2020, the Issuersentered into the 2020 4.00% Senior Notes Indenture with respect to the 2020 4.00% Senior Notes. On April 7, 2020, the Issuers entered into the 2020 5.75% SeniorNotes Indenture with respect to the 2020 5.75% Senior Notes. On November 19, 2019, the Issuers entered into the 2019 4.375% Senior Notes Indenture withrespect to the 2019 4.375% Senior Notes. On September 24, 2019, the Issuers entered into the 2019 3.875% Senior Notes Indenture with respect to the 20193.875% Senior Notes. On May 17, 2017, the Issuers entered into the 2017 4.25% Senior Notes Indenture with respect to the 2017 4.25% Senior Notes.
The agreement governing our Credit Facilities, the 2020 3.50% the Senior Notes Indenture, the 2020 4.00% Senior Notes Indenture, the 2020 5.75% SeniorNotes Indenture, the 2019 4.375% Senior Notes Indenture, the 2019 3.875% Senior Notes Indenture, and the 2017 4.25% Senior Notes Indenture allow thefinancial reporting obligation of the Parent Issuer to be satisfied through the reporting of Partnership’s consolidated financial information, provided that theconsolidated financial information of the Parent Issuer and its restricted subsidiaries is presented on a standalone basis.
The following represents the condensed consolidating financial information for the Parent Issuer and its restricted subsidiaries (“Consolidated Borrowers”)on a consolidated basis, together with eliminations, as of and for the periods indicated. The condensed consolidating financial information of Partnership iscombined with the financial information of its wholly-owned subsidiaries that are also parent entities of the Parent Issuer and presented in a single column underthe heading “RBILP”. The consolidating financial information may not necessarily be indicative of the financial position, results of operations or cash flows hadthe Issuers and Partnership operated as independent entities.

Table of Contents
RESTAURANT BRANDS INTERNATIONAL LIMITED PARTNERSHIP AND SUBSIDIARIESCondensed Consolidating Balance Sheets
(In millions of U.S. dollars)As of December 31, 2020
Consolidated Borrowers RBILP Eliminations Consolidated
ASSETSCurrent assets:
Cash and cash equivalents $ 1,560 $ — $ — $ 1,560 Accounts and notes receivable, net 536 — — 536 Inventories, net 96 — — 96 Prepaids and other current assets 72 — — 72
Total current assets 2,264 — — 2,264 Property and equipment, net 2,031 — — 2,031 Operating lease assets, net 1,152 — — 1,152 Intangible assets, net 10,701 — — 10,701 Goodwill 5,739 — — 5,739 Net investment in property leased to franchisees 66 — — 66 Intercompany receivable — 239 (239) — Investment in subsidiaries — 3,721 (3,721) — Other assets, net 824 — — 824
Total assets $ 22,777 $ 3,960 $ (3,960) $ 22,777 LIABILITIES AND EQUITY
Current liabilities:Accounts and drafts payable $ 464 $ — $ — $ 464 Other accrued liabilities 596 239 — 835 Gift card liability 191 — — 191 Current portion of long term debt and finance leases 111 — — 111
Total current liabilities 1,362 239 — 1,601 Term debt, net of current portion 12,397 — — 12,397 Finance leases, net of current portion 315 — — 315 Operating lease liabilities, net of current portion 1,082 — — 1,082 Other liabilities, net 2,236 — — 2,236 Payables to affiliates 239 — (239) — Deferred income taxes, net 1,425 — — 1,425
Total liabilities 19,056 239 (239) 19,056 Partners’ capital:
Class A common units — 7,994 — 7,994 Partnership exchangeable units — (3,002) — (3,002)Common shares 3,026 — (3,026) — Retained earnings 1,966 — (1,966) — Accumulated other comprehensive income (loss) (1,275) (1,275) 1,275 (1,275)
Total Partners’ capital/shareholders’ equity 3,717 3,717 (3,717) 3,717 Noncontrolling interests 4 4 (4) 4
Total equity 3,721 3,721 (3,721) 3,721 Total liabilities and equity $ 22,777 $ 3,960 $ (3,960) $ 22,777
98
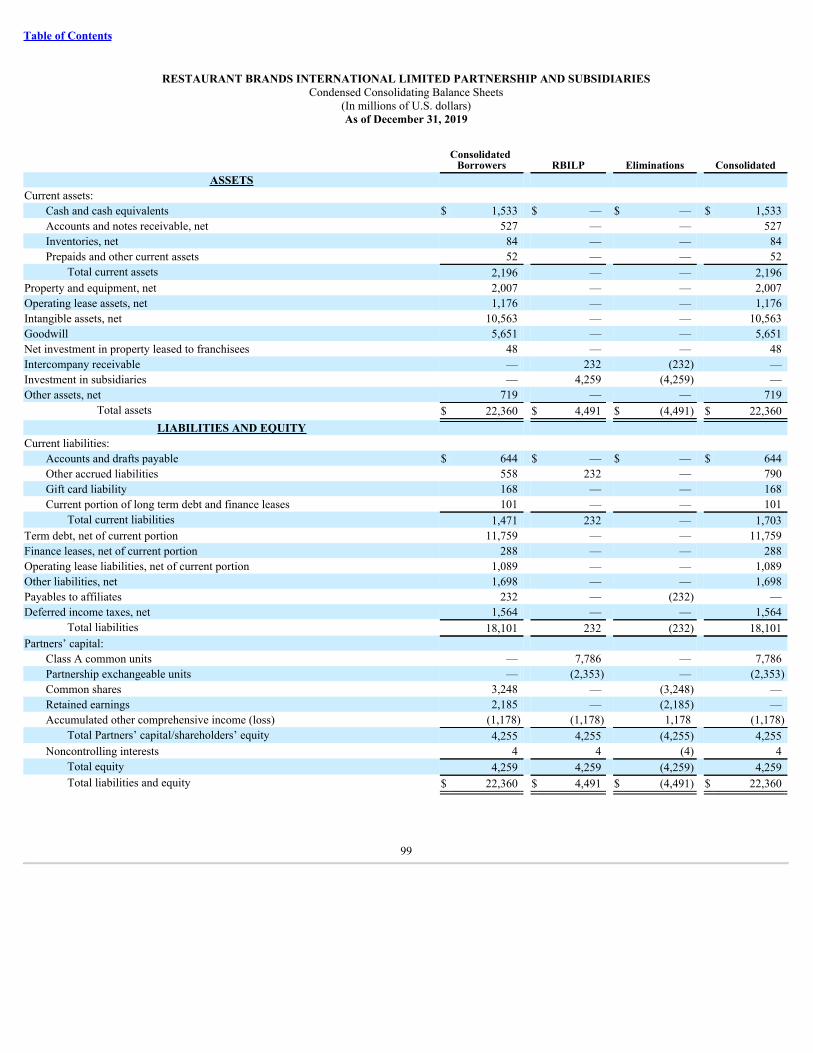
Table of Contents
RESTAURANT BRANDS INTERNATIONAL LIMITED PARTNERSHIP AND SUBSIDIARIESCondensed Consolidating Balance Sheets
(In millions of U.S. dollars)As of December 31, 2019
Consolidated Borrowers RBILP Eliminations Consolidated
ASSETSCurrent assets:
Cash and cash equivalents $ 1,533 $ — $ — $ 1,533 Accounts and notes receivable, net 527 — — 527 Inventories, net 84 — — 84 Prepaids and other current assets 52 — — 52
Total current assets 2,196 — — 2,196 Property and equipment, net 2,007 — — 2,007 Operating lease assets, net 1,176 — — 1,176 Intangible assets, net 10,563 — — 10,563 Goodwill 5,651 — — 5,651 Net investment in property leased to franchisees 48 — — 48 Intercompany receivable — 232 (232) — Investment in subsidiaries — 4,259 (4,259) — Other assets, net 719 — — 719
Total assets $ 22,360 $ 4,491 $ (4,491) $ 22,360 LIABILITIES AND EQUITY
Current liabilities:Accounts and drafts payable $ 644 $ — $ — $ 644 Other accrued liabilities 558 232 — 790 Gift card liability 168 — — 168 Current portion of long term debt and finance leases 101 — — 101
Total current liabilities 1,471 232 — 1,703 Term debt, net of current portion 11,759 — — 11,759 Finance leases, net of current portion 288 — — 288 Operating lease liabilities, net of current portion 1,089 — — 1,089 Other liabilities, net 1,698 — — 1,698 Payables to affiliates 232 — (232) — Deferred income taxes, net 1,564 — — 1,564
Total liabilities 18,101 232 (232) 18,101 Partners’ capital:
Class A common units — 7,786 — 7,786 Partnership exchangeable units — (2,353) — (2,353)Common shares 3,248 — (3,248) — Retained earnings 2,185 — (2,185) — Accumulated other comprehensive income (loss) (1,178) (1,178) 1,178 (1,178)
Total Partners’ capital/shareholders’ equity 4,255 4,255 (4,255) 4,255 Noncontrolling interests 4 4 (4) 4
Total equity 4,259 4,259 (4,259) 4,259 Total liabilities and equity $ 22,360 $ 4,491 $ (4,491) $ 22,360
99

Table of Contents
RESTAURANT BRANDS INTERNATIONAL LIMITED PARTNERSHIP AND SUBSIDIARIESCondensed Consolidating Statements of Operations
(In millions of U.S. dollars)2020
Consolidated Borrowers RBILP Eliminations Consolidated
Revenues:Sales $ 2,013 $ — $ — $ 2,013 Franchise and property revenues 2,955 — — 2,955
Total revenues 4,968 — — 4,968 Operating costs and expenses:
Cost of sales 1,610 — — 1,610 Franchise and property expenses 528 — — 528 Selling, general and administrative expenses 1,264 — — 1,264 (Income) loss from equity method investments 39 — — 39 Other operating expenses (income), net 105 — — 105
Total operating costs and expenses 3,546 — — 3,546 Income from operations 1,422 — — 1,422 Interest expense, net 508 — — 508 Loss on early extinguishment of debt 98 — — 98 Income before income taxes 816 — — 816 Income tax expense (benefit) 66 — — 66
Net income 750 — — 750 Equity in earnings of consolidated subsidiaries — 750 (750) — Net income (loss) 750 750 (750) 750 Net income (loss) attributable to noncontrolling interests 2 2 (2) 2 Net income (loss) attributable to common unitholders $ 748 $ 748 $ (748) $ 748 Total comprehensive income (loss) $ 653 $ 653 $ (653) $ 653
100
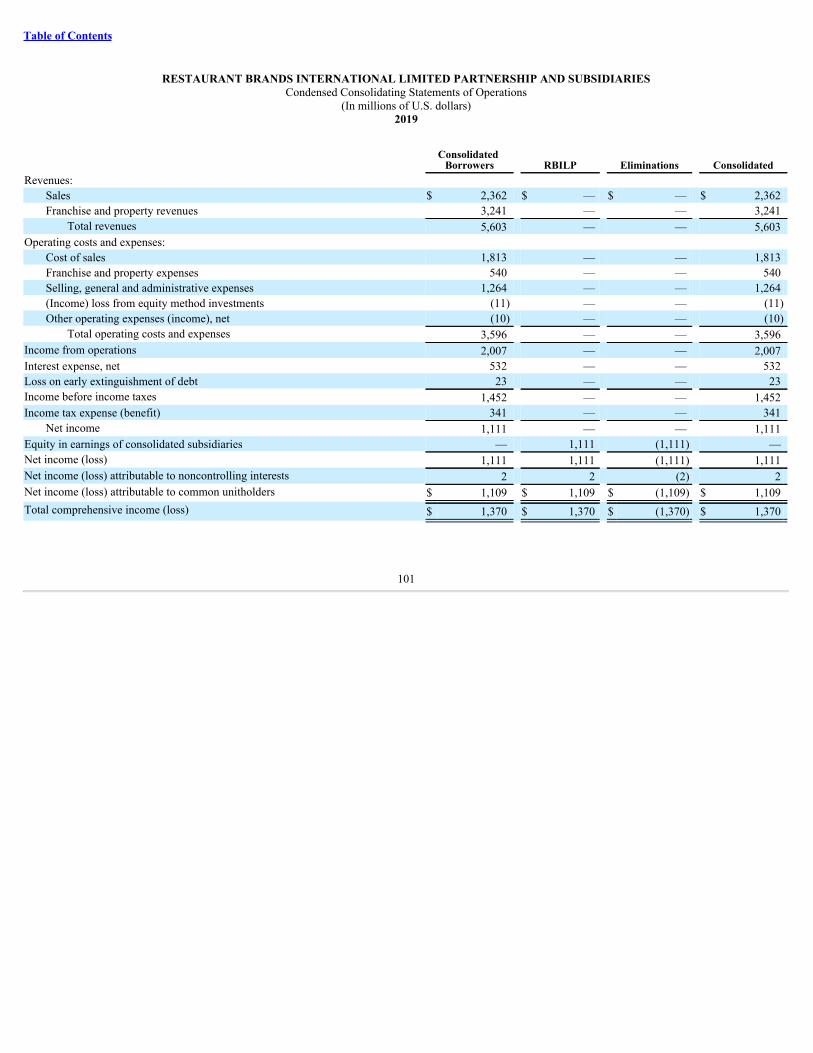
Table of Contents
RESTAURANT BRANDS INTERNATIONAL LIMITED PARTNERSHIP AND SUBSIDIARIESCondensed Consolidating Statements of Operations
(In millions of U.S. dollars)2019
Consolidated Borrowers RBILP Eliminations Consolidated
Revenues:Sales $ 2,362 $ — $ — $ 2,362 Franchise and property revenues 3,241 — — 3,241
Total revenues 5,603 — — 5,603 Operating costs and expenses:
Cost of sales 1,813 — — 1,813 Franchise and property expenses 540 — — 540 Selling, general and administrative expenses 1,264 — — 1,264 (Income) loss from equity method investments (11) — — (11)Other operating expenses (income), net (10) — — (10)
Total operating costs and expenses 3,596 — — 3,596 Income from operations 2,007 — — 2,007 Interest expense, net 532 — — 532 Loss on early extinguishment of debt 23 — — 23 Income before income taxes 1,452 — — 1,452 Income tax expense (benefit) 341 — — 341
Net income 1,111 — — 1,111 Equity in earnings of consolidated subsidiaries — 1,111 (1,111) — Net income (loss) 1,111 1,111 (1,111) 1,111 Net income (loss) attributable to noncontrolling interests 2 2 (2) 2 Net income (loss) attributable to common unitholders $ 1,109 $ 1,109 $ (1,109) $ 1,109 Total comprehensive income (loss) $ 1,370 $ 1,370 $ (1,370) $ 1,370
101

Table of Contents
RESTAURANT BRANDS INTERNATIONAL LIMITED PARTNERSHIP AND SUBSIDIARIESCondensed Consolidating Statements of Operations
(In millions of U.S. dollars)2018
Consolidated Borrowers RBILP Eliminations Consolidated
Revenues:Sales $ 2,355 $ — $ — $ 2,355 Franchise and property revenues 3,002 — — 3,002
Total revenues 5,357 — — 5,357 Operating costs and expenses:
Cost of sales 1,818 — — 1,818 Franchise and property expenses 422 — — 422 Selling, general and administrative expenses 1,214 — — 1,214 (Income) loss from equity method investments (22) — — (22)Other operating expenses (income), net 8 — — 8
Total operating costs and expenses 3,440 — — 3,440 Income from operations 1,917 — — 1,917 Interest expense, net 535 — — 535 Income before income taxes 1,382 — — 1,382 Income tax expense (benefit) 238 — — 238
Net income 1,144 — — 1,144 Equity in earnings of consolidated subsidiaries — 1,144 (1,144) — Net income (loss) 1,144 1,144 (1,144) 1,144 Net income (loss) attributable to noncontrolling interests 1 1 (1) 1 Net income (loss) attributable to common unitholders $ 1,143 $ 1,143 $ (1,143) $ 1,143 Total comprehensive income (loss) $ 591 $ 591 $ (591) $ 591
102

Table of Contents
RESTAURANT BRANDS INTERNATIONAL LIMITED PARTNERSHIP AND SUBSIDIARIESCondensed Consolidating Statements of Cash Flows
(In millions of U.S. dollars)2020
Consolidated
Borrowers RBILP Eliminations ConsolidatedCash flows from operating activities:
Net income $ 750 $ 750 $ (750) $ 750 Adjustments to reconcile net income to net cash provided by operating activities:
Equity in loss (earnings) of consolidated subsidiaries — (750) 750 — Depreciation and amortization 189 — — 189 Premiums paid and non-cash loss on early extinguishment of debt 97 — — 97 Amortization of deferred financing costs and debt issuance discount 26 — — 26 (Income) loss from equity method investments 39 — — 39 Loss (gain) on remeasurement of foreign denominated transactions 100 — — 100 Net (gains) losses on derivatives 32 — — 32 Share-based compensation expense 74 — — 74 Deferred income taxes (208) — — (208)Other 28 — — 28
Changes in current assets and liabilities, excluding acquisitions and dispositions:Accounts and notes receivable (30) — — (30)Inventories and prepaids and other current assets (10) — — (10)Accounts and drafts payable (183) — — (183)Other accrued liabilities and gift card liability 16 — — 16
Tenant inducements paid to franchisees (22) — — (22)Other long-term assets and liabilities 23 — — 23
Net cash provided by operating activities 921 — — 921 Cash flows from investing activities:
Payments for property and equipment (117) — — (117)Net proceeds from disposal of assets, restaurant closures and refranchisings 12 — — 12 Settlement/sale of derivatives, net 33 — — 33 Other investing activities, net (7) — — (7)
Net cash used for investing activities (79) — — (79)Cash flows from financing activities:
Proceeds from issuance of long-term debt 5,235 — — 5,235 Repayments of long-term debt and finance leases (4,708) — — (4,708)Payment of financing costs (43) — — (43)Distributions paid on Class A and Partnership exchangeable units — (959) — (959)Repurchase of Partnership exchangeable units — (380) — (380)Capital contribution from RBI Inc. 82 — — 82 Distributions from subsidiaries (1,339) 1,339 — — (Payments) proceeds from derivatives (46) — — (46)Other financing activities, net (2) — — (2)
Net cash used for financing activities (821) — — (821)Effect of exchange rates on cash and cash equivalents 6 — — 6 Increase (decrease) in cash and cash equivalents 27 — — 27 Cash and cash equivalents at beginning of period 1,533 — — 1,533 Cash and cash equivalents at end of period $ 1,560 $ — $ — $ 1,560
103

Table of Contents
RESTAURANT BRANDS INTERNATIONAL LIMITED PARTNERSHIP AND SUBSIDIARIESCondensed Consolidating Statements of Cash Flows
(In millions of U.S. dollars)2019
Consolidated Borrowers RBILP Eliminations Consolidated
Cash flows from operating activities:Net income $ 1,111 $ 1,111 $ (1,111) $ 1,111 Adjustments to reconcile net income to net cash provided by operating activities:
Equity in loss (earnings) of consolidated subsidiaries — (1,111) 1,111 — Depreciation and amortization 185 — — 185 Premiums paid and non-cash loss on early extinguishment of debt 16 — — 16 Amortization of deferred financing costs and debt issuance discount 29 — — 29 (Income) loss from equity method investments (11) — — (11)Loss (gain) on remeasurement of foreign denominated transactions (14) — — (14)Net (gains) losses on derivatives (49) — — (49)Share-based compensation expense 68 — — 68 Deferred income taxes 58 — — 58 Other 6 — — 6
Changes in current assets and liabilities, excluding acquisitions and dispositions:Accounts and notes receivable (53) — — (53)Inventories and prepaids and other current assets (15) — — (15)Accounts and drafts payable 112 — — 112 Other accrued liabilities and gift card liability (51) — — (51)
Tenant inducements paid to franchisees (54) — — (54)Other long-term assets and liabilities 138 — — 138
Net cash provided by operating activities 1,476 — — 1,476 Cash flows from investing activities:
Payments for property and equipment (62) — — (62)Net proceeds from disposal of assets, restaurant closures and refranchisings 8 — — 8 Settlement/sale of derivatives, net 24 — — 24
Net cash used for investing activities (30) — — (30)Cash flows from financing activities:
Proceeds from issuance of long-term debt 2,250 — — 2,250 Repayments of long-term debt and finance leases (2,266) — — (2,266)Payment of financing costs (50) — — (50)Distributions paid on Class A and Partnership exchangeable units — (901) — (901)Capital contribution from RBI Inc. 102 — — 102 Distributions from subsidiaries (901) 901 — — Proceeds from derivatives 23 — — 23
Net cash used for financing activities (842) — — (842)Effect of exchange rates on cash and cash equivalents 16 — — 16 Increase (decrease) in cash and cash equivalents 620 — — 620 Cash and cash equivalents at beginning of period 913 — — 913 Cash and cash equivalents at end of period $ 1,533 $ — $ — $ 1,533
104

Table of Contents
RESTAURANT BRANDS INTERNATIONAL LIMITED PARTNERSHIP AND SUBSIDIARIESCondensed Consolidating Statements of Cash Flows
(In millions of U.S. dollars)2018
Consolidated
Borrowers RBILP Eliminations ConsolidatedCash flows from operating activities:
Net income $ 1,144 $ 1,144 $ (1,144) $ 1,144 Adjustments to reconcile net income to net cash provided by operating activities:
Equity in loss (earnings) of consolidated subsidiaries — (1,144) 1,144 — Depreciation and amortization 180 — — 180 Amortization of deferred financing costs and debt issuance discount 29 — — 29 (Income) loss from equity method investments (22) — — (22)Loss (gain) on remeasurement of foreign denominated transactions (33) — — (33)Net (gains) losses on derivatives (40) — — (40)Share-based compensation expense 48 — — 48 Deferred income taxes 29 — — 29 Other 5 — — 5
Changes in current assets and liabilities, excluding acquisitions and dispositions:Accounts and notes receivable 19 — — 19 Inventories and prepaids and other current assets (7) — — (7)Accounts and drafts payable 41 — — 41 Other accrued liabilities and gift card liability (219) — — (219)
Tenant inducements paid to franchisees (52) — — (52)Other long-term assets and liabilities 43 — — 43
Net cash provided by operating activities 1,165 — — 1,165 Cash flows from investing activities:
Payments for property and equipment (86) — — (86)Net proceeds from disposal of assets, restaurant closures and refranchisings 8 — — 8 Settlement/sale of derivatives, net 17 — — 17 Other investing activities, net 17 — — 17
Net cash used for investing activities (44) — — (44)Cash flows from financing activities:
Proceeds from issuance of long-term debt 75 — — 75 Repayments of long-term debt and finance leases (74) — — (74)Payment of financing costs (3) — — (3)Distributions paid on Class A and Partnership exchangeable units — (728) — (728)Repurchase of Partnership exchangeable units — (561) — (561)Capital contribution from RBI Inc. 61 — — 61 Distributions from subsidiaries (1,289) 1,289 — — Other financing activities, net (55) — — (55)
Net cash used for financing activities (1,285) — — (1,285)Effect of exchange rates on cash and cash equivalents (20) — — (20)Increase (decrease) in cash and cash equivalents (184) — — (184)Cash and cash equivalents at beginning of period 1,097 — — 1,097 Cash and cash equivalents at end of period $ 913 $ — $ — $ 913
105

Table of Contents
Note 20. Subsequent Events
Dividends
On January 5, 2021, RBI paid a cash dividend of $0.52 per RBI common share to common shareholders of record on December 21, 2020. Partnership madea distribution to RBI as holder of Class A common units in the amount of the aggregate dividends declared and paid by RBI on RBI common shares and also madea distribution in respect of each Partnership exchangeable unit in the amount of $0.52 per exchangeable unit to holders of record on December 21, 2020.
On February 11, 2021, we announced that the RBI board of directors had declared a cash dividend of $0.53 per RBI common share for the first quarter of2020. The dividend will be paid on April 6, 2021 to RBI common shareholders of record on March 23, 2021. Partnership will make a distribution to RBI as holderof Class A common units in the amount of the aggregate dividends declared and paid by RBI on RBI common shares. Partnership will also make a distribution inrespect of each Partnership exchangeable unit in the amount of $0.53 per Partnership exchangeable unit, and the record date and payment date for such distributionwill be the same as the record date and payment date for the cash dividend per RBI common share set forth above.
*****
106

Table of Contents
Item 9. Changes in and Disagreements with Accountants on Accounting and Financial Disclosure
None.
Item 9A. Controls and Procedures
Evaluation of Disclosure Controls and Procedures
An evaluation was conducted under the supervision and with the participation of the management of RBI, as the general partner of Partnership, including theChief Executive Officer (CEO) and Chief Financial Officer (CFO) of RBI, of the effectiveness of the design and operation of Partnership’s disclosure controls andprocedures (as defined in Rule 13a-15e under the Exchange Act) as of December 31, 2020. Based on that evaluation, the CEO and CFO of RBI concluded thatPartnership’s disclosure controls and procedures were effective as of such date.
Internal Control over Financial Reporting
The management of RBI, as general partner of Partnership, including the CEO and CFO, confirm that there were no changes in Partnership’s internal controlover financial reporting during the fourth quarter of 2020 that have materially affected, or are reasonably likely to materially affect, Partnership’s internal controlover financial reporting.
Management’s Report on Internal Control over Financial Reporting
Management’s Report on Internal Control Over Financial Reporting and the report of Independent Registered Public Accounting Firm are set forth in Part II,Item 8 of this Form 10-K.
Item 9B. Other Items
Item 5.02 Departure of Directors or Certain Officers; Appointment of Certain Officers; Compensatory Arrangements of Certain Officers
(e)
On December 8, 2020, the Compensation Committee of RBI's Board of Directors (the “Compensation Committee”) modified the 2020 Annual Bonus SwapProgram that had been previously approved to change the vesting of all newly granted matching restricted stock units (“RSUs”) from cliff vesting after five yearsto vesting ratably over four years. Pursuant to RBI’s Bonus Swap Program, RBI provides eligible employees, including its named executive officers, or NEOs, theability to invest 25% or 50% of their calculated net cash bonus for 2020 (after deducting an amount based on a theoretical tax rate of 40%) into RBI commonshares (“Investment Shares”). Employees who elect to purchase Investment Shares receive matching RSUs. The number of matching RSUs that they receivedepends on their Swap Election Percentage and their level within the organization. All of RBI’s eligible NEOs elected to participate in the 2020 Bonus SwapProgram at the 50% level. The matching RSUs will vest ratably on December 31, 2021, 2022, 2023 and 2024. All unvested matching RSUs will be forfeited if anNEO’s service (including service on the Board of Directors of RBI) is terminated for any reason.
On December 8, 2020, the Compensation Committee approved the 2021 Bonus Swap Program on substantially the same terms as the 2020 Bonus SwapProgram, except that the compensation committee increased the RSU match at each level.
On December 8, 2020, the Compensation Committee approved modifications to the performance criteria for performance share units (“PSUs”) issued byRBI in 2019 and 2020. The PSUs issued in 2019 and some of the PSUs issued in 2020 originally would be earned based on meeting a specific compound annualgrowth rate for organic Adjusted EBITDA for the three-year period from 2019 through 2021, with a catch-up mechanism that allowed for a reduced payout basedon a target for the four year period including 2022. Other PSUs issued in 2020 originally would be earned based on a two year compound annual growth rate ofcomparable sales for Tim Hortons in Canada for 2020 and 2021, with a catch-up mechanism that allowed for reduced payout based on a target for the three -yearperiod including 2022. Given the effects of the COVID-19 pandemic on our business, the ability to meet these targets is greatly diminished, negatively affectingthe retentive value. This situation is intensified by RBI’s practice of granting larger amounts of PSUs on a periodic basis with several years of grants based on thesame multi-year period, as opposed to a more regular annual grant practice, with rolling performance cycles, that many other companies utilize. Therefore, if atranche of PSUs were to lose all value, the individuals holding that tranche may not have other tranches that cover different periods or goals.
In order to preserve the retention value of the PSUs described above, recognize the contributions from our employees to confront the challenges posed by thepandemic and incentivize continued performance for recovery and a move toward growth in 2021, the Compensation Committee approved a modification of theperformance criteria for all of these awards based on a formula consisting of: 30% based on a comparable sales target, 20% based on a net restaurant growth(“NRG”) target and 50% based on an
107
Table of Contents
organic Adjusted EBITDA target, in each case, the targets are one-year targets based on 2021 budget. Each of these targets could be earned between a threshold of50% and a maximum of 200%, provided that the total payout for the awards is capped at 100% of target and subject to a threshold payout of 50%. The newperformance criteria do not contain a catch-up provision and are subject to the same vesting as the original awards. A copy of the Amended Performance AwardAgreement between RBI and each of the NEOs is filed herewith as Exhibit 10.36(c). This summary is qualified in its entirety to the full text of that awardagreement.
Also on December 8, 2020, the Compensation Committee determined to rebalance the mix of base salary and annual incentive compensation for NEOs to bemore competitive. These changes will be effective March 1, 2021. For Mr. Cil, his base salary will increase from $800,000 to $950,000 while his target annualincentive percentage will decrease from 300% to 230%. For Mr. Dunnigan, his base salary will increase from $550,000 to $600,000 while his target annualincentive compensation will decrease from 150% to 130%. For Mr. Kobza, his base salary will increase from $650,000 to $800,000 while his target annualincentive percentage will decrease from 250% to 185%. For Ms. Granat, her base salary will increase from $550,000 to $575,000 while her target annual incentivepercentage will decrease from 150% to 140%.
On December 8, 2020, the Compensation Committee approved the 2021 Annual Bonus Program, which has been updated to decrease the amount ofcompensation tied to individual metrics and add components based on comparable sales and NRG. For 2021 annual incentive, each of the NEOs will have 25% ofthe target based on achievement of individual metrics which may be earned from a threshold of 0% up to 100%; 20% of the target based on comparable salesachievement which may be earned from a threshold of 50% to a maximum of 200%; 15% of the target based on NRG achievement which may be earned from athreshold of 50% to a maximum of 200%; and 40% of the target based on organic Adjusted EBITDA achievement which may be earned from a threshold of 50%to a maximum of 200%. Overall, any annual incentive payout will require (1) achievement of the threshold amount of Adjusted EBITDA, (2) that individualachievement must also be earned at no less than 50% and (3) that certain general and administrative expense targets must be met. Additionally, annual incentiveswill be subject to a 30% reduction if the minimum free cash flow target established for the applicable year is not achieved.
On January 19, 2021, the Compensation Committee approved discretionary awards to Messrs. Cil, Kobza, and Dunnigan and Ms. Granat, which consist ofapproximately 1/3 RSUs and 2/3 performance based RSUs at target. The grants were 49,500 RSUs and 100,500 PBRSUs for Mr. Cil, 41,250 RSUs and 83,750PBRSUs for Mr. Kobza, 16,500 RSUs and 33,500 PBRSUs for Mr. Dunnigan and 9,900 RSUs and 20,100 PBRSUs for Ms. Granat. The RSUs vest ratably onDecember 31 of 2021, 2022 and 2023. The performance measure for purposes of determining the number of PBRSUs earned is the relative total shareholder returnof RBI shares on the NYSE compared to the S&P 500 for the period from December 31, 2020 to December 31, 2023. The Compensation Committee established atarget performance level at the 50th percentile, a performance threshold at or above which 50% of target is earned and below which no shares are earned at the 25thpercentile, a performance level to earn 150% of the target at the 75th percentile and a maximum performance level at the 90th percentile at or above which 200%of the target is earned. Once earned, the PBRSUs will cliff vest on February 19, 2024. In addition, if an executive’s service to RBI is terminated (other than due todeath or disability) prior to February 19, 2023, he or she will forfeit the entire award. A copy of the form of Restricted Stock Unit Awards Agreement between RBIand each of the NEOs is filed herewith as Exhibit 10.36(d) and a copy of the Performance Award Agreement between RBI and each of the NEOs is filed herewithas Exhibit 10.36(e). This summary is qualified in its entirety to the full text of those award agreements.
Part III
Item 10. Directors, Executive Officers and Corporate Governance
The information required by this Item, other than the information regarding the executive officers of RBI set forth under the heading "Executive Officers ofthe Registrant" in Part I of this Form 10-K, as general partner of Partnership, required by Item 401 of Regulation S-K, is incorporated herein by reference fromRBI’s definitive proxy statement to be filed no later than 120 days after December 31, 2020. We refer to this proxy statement as the RBI Definitive ProxyStatement.
Item 11. Executive Compensation
The information required by this item will be contained in the RBI Definitive Proxy Statement and is incorporated herein by reference.
Item 12. Security Ownership of Certain Beneficial Owners and Management and Related Stockholder Matters
The information required by this item, other than the information regarding our equity plans set forth below required by Item 201(d) of Regulation S-K, willbe contained in the RBI Definitive Proxy Statement and is incorporated herein by reference.
108
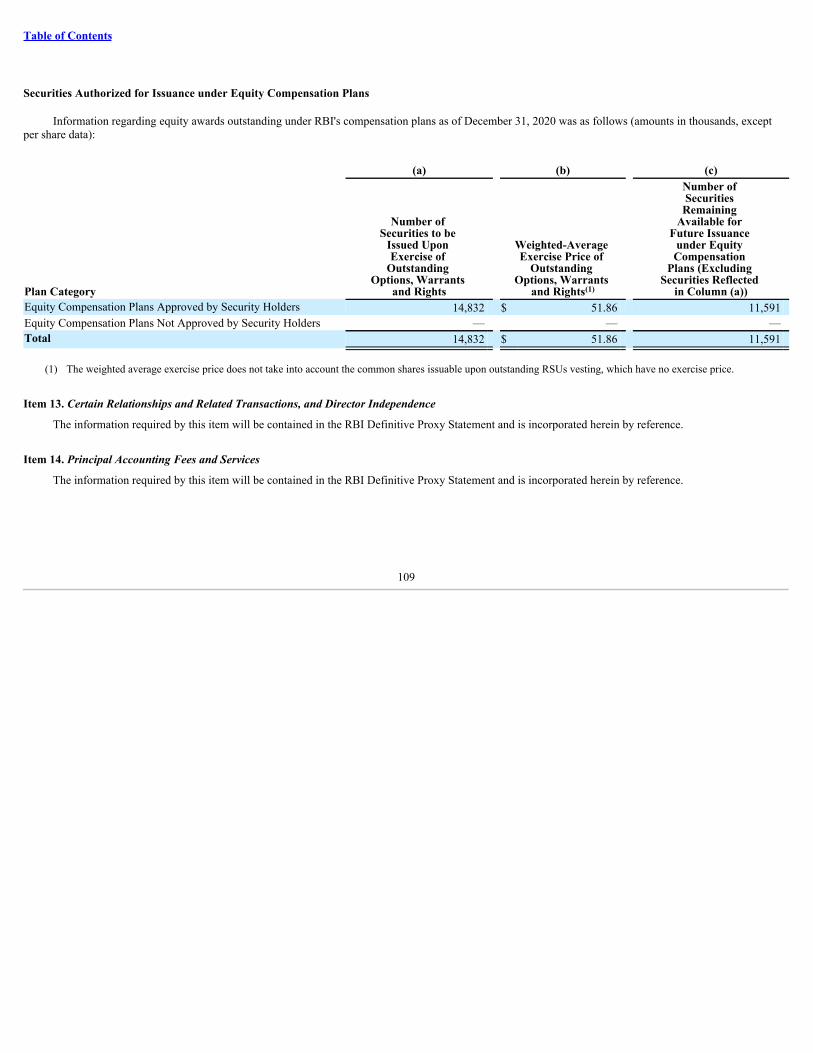
Table of Contents
Securities Authorized for Issuance under Equity Compensation Plans
Information regarding equity awards outstanding under RBI's compensation plans as of December 31, 2020 was as follows (amounts in thousands, exceptper share data):
(a) (b) (c)
Plan Category
Number of Securities to be
Issued Upon Exercise of
Outstanding Options, Warrants
and Rights
Weighted-Average Exercise Price of
Outstanding Options, Warrants
and Rights
Number of Securities Remaining
Available for Future Issuance
under Equity Compensation
Plans (Excluding Securities Reflected
in Column (a))Equity Compensation Plans Approved by Security Holders 14,832 $ 51.86 11,591 Equity Compensation Plans Not Approved by Security Holders — — — Total 14,832 $ 51.86 11,591
(1) The weighted average exercise price does not take into account the common shares issuable upon outstanding RSUs vesting, which have no exercise price.
Item 13. Certain Relationships and Related Transactions, and Director Independence
The information required by this item will be contained in the RBI Definitive Proxy Statement and is incorporated herein by reference.
Item 14. Principal Accounting Fees and Services
The information required by this item will be contained in the RBI Definitive Proxy Statement and is incorporated herein by reference.
(1)
109
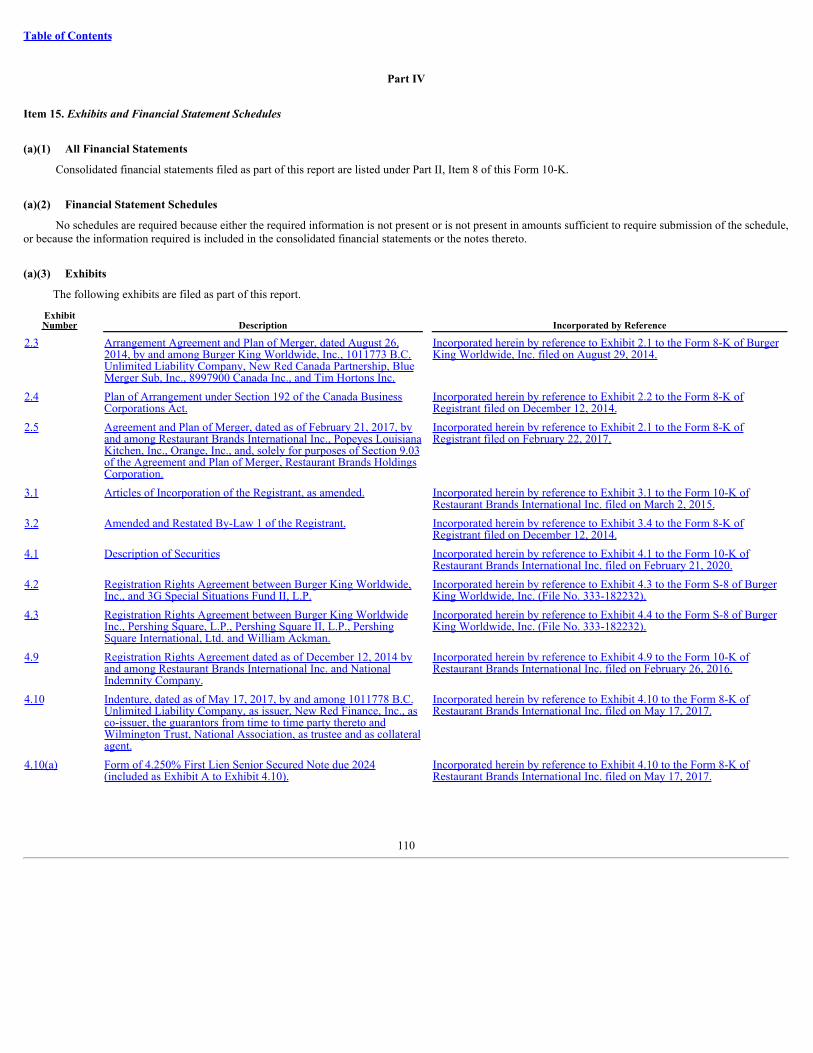
Table of Contents
Part IV
Item 15. Exhibits and Financial Statement Schedules
(a)(1) All Financial Statements
Consolidated financial statements filed as part of this report are listed under Part II, Item 8 of this Form 10-K.
(a)(2) Financial Statement Schedules
No schedules are required because either the required information is not present or is not present in amounts sufficient to require submission of the schedule,or because the information required is included in the consolidated financial statements or the notes thereto.
(a)(3) Exhibits
The following exhibits are filed as part of this report.
ExhibitNumber Description Incorporated by Reference
2.3
Arrangement Agreement and Plan of Merger, dated August 26,2014, by and among Burger King Worldwide, Inc., 1011773 B.C.Unlimited Liability Company, New Red Canada Partnership, BlueMerger Sub, Inc., 8997900 Canada Inc., and Tim Hortons Inc.
Incorporated herein by reference to Exhibit 2.1 to the Form 8-K of BurgerKing Worldwide, Inc. filed on August 29, 2014.
2.4
Plan of Arrangement under Section 192 of the Canada BusinessCorporations Act.
Incorporated herein by reference to Exhibit 2.2 to the Form 8-K ofRegistrant filed on December 12, 2014.
2.5 Agreement and Plan of Merger, dated as of February 21, 2017, byand among Restaurant Brands International Inc., Popeyes LouisianaKitchen, Inc., Orange, Inc., and, solely for purposes of Section 9.03of the Agreement and Plan of Merger, Restaurant Brands HoldingsCorporation.
Incorporated herein by reference to Exhibit 2.1 to the Form 8-K ofRegistrant filed on February 22, 2017.
3.1
Articles of Incorporation of the Registrant, as amended.
Incorporated herein by reference to Exhibit 3.1 to the Form 10-K ofRestaurant Brands International Inc. filed on March 2, 2015.
3.2
Amended and Restated By-Law 1 of the Registrant.
Incorporated herein by reference to Exhibit 3.4 to the Form 8-K ofRegistrant filed on December 12, 2014.
4.1 Description of Securities Incorporated herein by reference to Exhibit 4.1 to the Form 10-K ofRestaurant Brands International Inc. filed on February 21, 2020.
4.2
Registration Rights Agreement between Burger King Worldwide,Inc., and 3G Special Situations Fund II, L.P.
Incorporated herein by reference to Exhibit 4.3 to the Form S-8 of BurgerKing Worldwide, Inc. (File No. 333-182232).
4.3
Registration Rights Agreement between Burger King WorldwideInc., Pershing Square, L.P., Pershing Square II, L.P., PershingSquare International, Ltd. and William Ackman.
Incorporated herein by reference to Exhibit 4.4 to the Form S-8 of BurgerKing Worldwide, Inc. (File No. 333-182232).
4.9 Registration Rights Agreement dated as of December 12, 2014 byand among Restaurant Brands International Inc. and NationalIndemnity Company.
Incorporated herein by reference to Exhibit 4.9 to the Form 10-K ofRestaurant Brands International Inc. filed on February 26, 2016.
4.10 Indenture, dated as of May 17, 2017, by and among 1011778 B.C.Unlimited Liability Company, as issuer, New Red Finance, Inc., asco-issuer, the guarantors from time to time party thereto andWilmington Trust, National Association, as trustee and as collateralagent.
Incorporated herein by reference to Exhibit 4.10 to the Form 8-K ofRestaurant Brands International Inc. filed on May 17, 2017.
4.10(a) Form of 4.250% First Lien Senior Secured Note due 2024(included as Exhibit A to Exhibit 4.10).
Incorporated herein by reference to Exhibit 4.10 to the Form 8-K ofRestaurant Brands International Inc. filed on May 17, 2017.
110
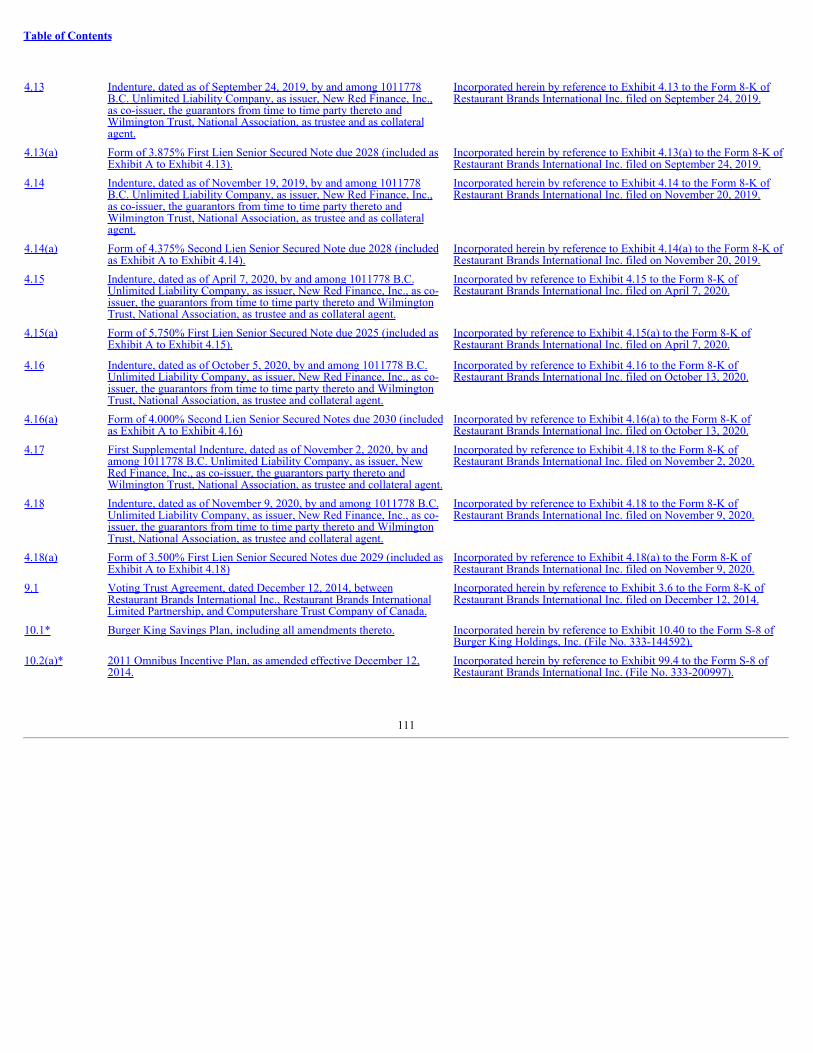
Table of Contents
4.13 Indenture, dated as of September 24, 2019, by and among 1011778B.C. Unlimited Liability Company, as issuer, New Red Finance, Inc.,as co-issuer, the guarantors from time to time party thereto andWilmington Trust, National Association, as trustee and as collateralagent.
Incorporated herein by reference to Exhibit 4.13 to the Form 8-K ofRestaurant Brands International Inc. filed on September 24, 2019.
4.13(a) Form of 3.875% First Lien Senior Secured Note due 2028 (included asExhibit A to Exhibit 4.13).
Incorporated herein by reference to Exhibit 4.13(a) to the Form 8-K ofRestaurant Brands International Inc. filed on September 24, 2019.
4.14 Indenture, dated as of November 19, 2019, by and among 1011778B.C. Unlimited Liability Company, as issuer, New Red Finance, Inc.,as co-issuer, the guarantors from time to time party thereto andWilmington Trust, National Association, as trustee and as collateralagent.
Incorporated herein by reference to Exhibit 4.14 to the Form 8-K ofRestaurant Brands International Inc. filed on November 20, 2019.
4.14(a) Form of 4.375% Second Lien Senior Secured Note due 2028 (includedas Exhibit A to Exhibit 4.14).
Incorporated herein by reference to Exhibit 4.14(a) to the Form 8-K ofRestaurant Brands International Inc. filed on November 20, 2019.
4.15 Indenture, dated as of April 7, 2020, by and among 1011778 B.C.Unlimited Liability Company, as issuer, New Red Finance, Inc., as co-issuer, the guarantors from time to time party thereto and WilmingtonTrust, National Association, as trustee and as collateral agent.
Incorporated by reference to Exhibit 4.15 to the Form 8-K ofRestaurant Brands International Inc. filed on April 7, 2020.
4.15(a) Form of 5.750% First Lien Senior Secured Note due 2025 (included asExhibit A to Exhibit 4.15).
Incorporated by reference to Exhibit 4.15(a) to the Form 8-K ofRestaurant Brands International Inc. filed on April 7, 2020.
4.16 Indenture, dated as of October 5, 2020, by and among 1011778 B.C.Unlimited Liability Company, as issuer, New Red Finance, Inc., as co-issuer, the guarantors from time to time party thereto and WilmingtonTrust, National Association, as trustee and collateral agent.
Incorporated by reference to Exhibit 4.16 to the Form 8-K ofRestaurant Brands International Inc. filed on October 13, 2020.
4.16(a) Form of 4.000% Second Lien Senior Secured Notes due 2030 (includedas Exhibit A to Exhibit 4.16)
Incorporated by reference to Exhibit 4.16(a) to the Form 8-K ofRestaurant Brands International Inc. filed on October 13, 2020.
4.17 First Supplemental Indenture, dated as of November 2, 2020, by andamong 1011778 B.C. Unlimited Liability Company, as issuer, NewRed Finance, Inc., as co-issuer, the guarantors party thereto andWilmington Trust, National Association, as trustee and collateral agent.
Incorporated by reference to Exhibit 4.18 to the Form 8-K ofRestaurant Brands International Inc. filed on November 2, 2020.
4.18 Indenture, dated as of November 9, 2020, by and among 1011778 B.C.Unlimited Liability Company, as issuer, New Red Finance, Inc., as co-issuer, the guarantors from time to time party thereto and WilmingtonTrust, National Association, as trustee and collateral agent.
Incorporated by reference to Exhibit 4.18 to the Form 8-K ofRestaurant Brands International Inc. filed on November 9, 2020.
4.18(a) Form of 3.500% First Lien Senior Secured Notes due 2029 (included asExhibit A to Exhibit 4.18)
Incorporated by reference to Exhibit 4.18(a) to the Form 8-K ofRestaurant Brands International Inc. filed on November 9, 2020.
9.1 Voting Trust Agreement, dated December 12, 2014, betweenRestaurant Brands International Inc., Restaurant Brands InternationalLimited Partnership, and Computershare Trust Company of Canada.
Incorporated herein by reference to Exhibit 3.6 to the Form 8-K ofRestaurant Brands International Inc. filed on December 12, 2014.
10.1* Burger King Savings Plan, including all amendments thereto. Incorporated herein by reference to Exhibit 10.40 to the Form S-8 ofBurger King Holdings, Inc. (File No. 333-144592).
10.2(a)* 2011 Omnibus Incentive Plan, as amended effective December 12,2014.
Incorporated herein by reference to Exhibit 99.4 to the Form S-8 ofRestaurant Brands International Inc. (File No. 333-200997).
111

Table of Contents
10.2(b)* Form of Option Award Agreement under the Burger King WorldwideHoldings, Inc. 2011 Omnibus Incentive Plan.
Incorporated herein by reference to Exhibit 10.77 to the Form 10-Qof Burger King Holdings, Inc. filed on May 12, 2011.
10.4(a)* Amended and Restated 2012 Omnibus Incentive Plan, as amendedeffective December 12, 2014.
Incorporated herein by reference to Exhibit 99.2 to the Form S-8 ofRestaurant Brands International Inc. (File No. 333-200997).
10.4(b)* Form of Option Award Agreement under the Burger King Worldwide,Inc. 2012 Omnibus Incentive Plan.
Incorporated herein by reference to Exhibit 10.25 to the Form 10-Kof Burger King Worldwide, Inc. filed on February 22, 2013.
10.4(c)* Form of Matching Option Award Agreement under the Burger KingWorldwide, Inc. 2012 Omnibus Incentive Plan.
Incorporated herein by reference to Exhibit 10.26 to the Form 10-Kof Burger King Worldwide, Inc. filed on February 22, 2013.
10.4(d)* Form of Amendment to Option Award Agreement under the Burger KingWorldwide Holdings, Inc. 2011 Omnibus Incentive Plan.
Incorporated herein by reference to Exhibit 10.28 to the Form 10-Qof Burger King Worldwide, Inc. filed on April 26, 2013.
10.4(e)* Form of Option Award Agreement under the Burger King Worldwide,Inc. Amended and Restated 2012 Omnibus Incentive Plan.
Incorporated herein by reference to Exhibit 10.29 to the Form 10-Qof Burger King Worldwide, Inc. filed on July 31, 2013.
10.4(f)* Form of Board Member Option Award Agreement under the BurgerKing Worldwide, Inc. Amended and Restated 2012 Omnibus IncentivePlan.
Incorporated herein by reference to Exhibit 10.30 to the Form 10-Qof Burger King Worldwide, Inc. filed on July 31, 2013.
10.4(g)* Form of Option Award Agreement under the Amended and Restated2012 Omnibus Incentive Plan.
Incorporated herein by reference to Exhibit 10.32 to the Form 10-Qof Burger King Worldwide, Inc. filed on October 28, 2013.
10.4(h)* Form of Board Member Option Award Agreement under the Amendedand Restated 2012 Omnibus Incentive Plan.
Incorporated herein by reference to Exhibit 10.33 to the Form 10-Qof Burger King Worldwide, Inc. filed on October 28, 2013.
10.4(i)* Form of Board Member Restricted Stock Unit Award Agreement underthe Amended and Restated 2012 Omnibus Incentive Plan.
Incorporated herein by reference to Exhibit 10.35 to the Form 10-Kof Burger King Worldwide, Inc. filed on February 21, 2014.
10.4(j)* Form of Matching Option Award Agreement under the Amended andRestated 2012 Omnibus Incentive Plan.
Incorporated herein by reference to Exhibit 10.36 to the Form 10-Kof Burger King Worldwide, Inc. filed on February 21, 2014.
10.5 Burger King Form of Director Indemnification Agreement. Incorporated herein by reference to Exhibit 10.1 to the Form 8-K ofBurger King Worldwide, Inc. filed on June 25, 2012.
10.7* Burger King Corporation U.S. Severance Pay Plan. Incorporated herein by reference Exhibit 10.31 to the Form 10-Q ofBurger King Worldwide, Inc. filed on October 28, 2013.
10.10(a) Credit Agreement, dated October 27, 2014, among 1011778 B.C.Unlimited Liability Company, as the Parent Borrower, New RedFinance, Inc., as the Subsidiary Borrower, 1013421 B.C. UnlimitedLiability Company, as Holdings, JPMorgan Chase Bank, N.A., asAdministrative Agent and Collateral Agent, the Lenders Party thereto,Wells Fargo Bank, National Association, as Syndication Agent, theParties listed thereto as Co-Documentation Agents, J.P. MorganSecurities LLC, and Wells Fargo Securities LLC, as Joint LeadArrangers, and J.P. Morgan Securities LLC, Wells Fargo Securities LLC,and Merrill Lynch, Pierce, Fenner and Smith, Incorporated, as JointBook Runners (the “Credit Agreement”).
Incorporated herein by reference to Exhibit 4.2 to the Form S-4 ofRestaurant Brands International Inc. (File No. 333-198769).
10.10(b) Guaranty, dated December 12, 2014, among 1013421 B.C. UnlimitedLiability Company, as Guarantor, Certain Subsidiaries defined therein, asGuarantors, and JPMorgan Chase Bank, N.A., as Collateral Agent.
Incorporated herein by reference to Exhibit 10.2 to the Form 8-K ofRestaurant Brands International Inc. filed on December 12, 2014.
112
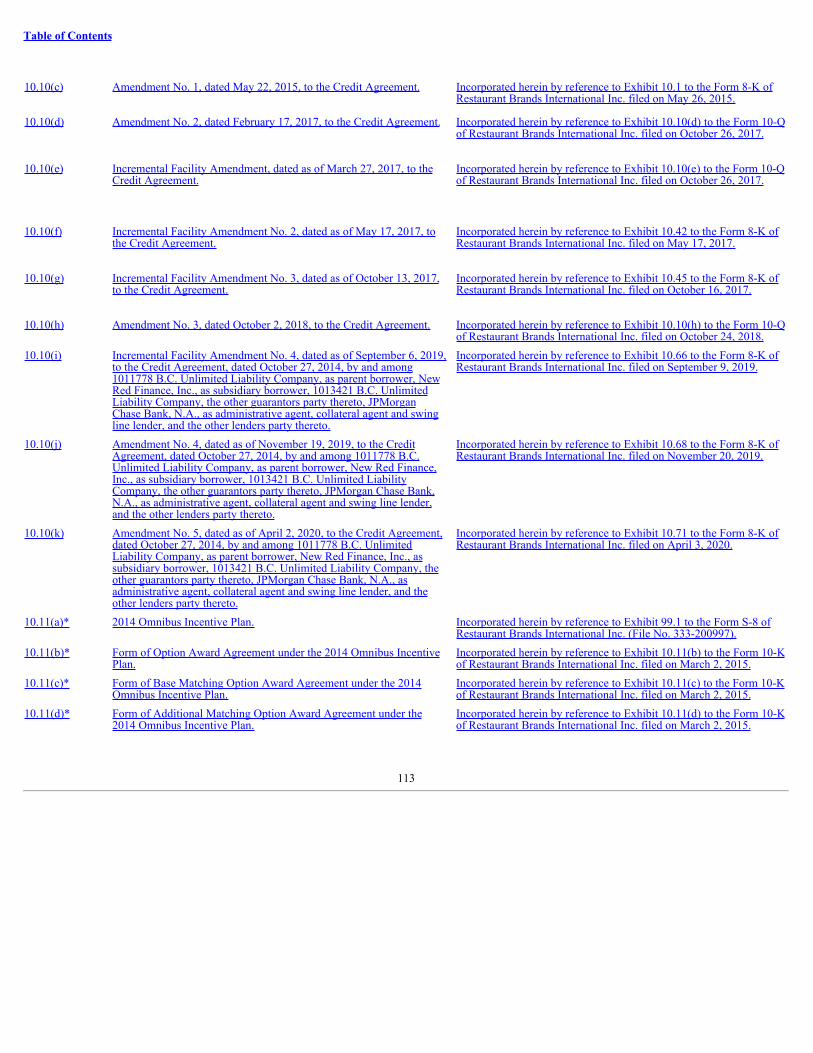
Table of Contents
10.10(c) Amendment No. 1, dated May 22, 2015, to the Credit Agreement. Incorporated herein by reference to Exhibit 10.1 to the Form 8-K ofRestaurant Brands International Inc. filed on May 26, 2015.
10.10(d) Amendment No. 2, dated February 17, 2017, to the Credit Agreement. Incorporated herein by reference to Exhibit 10.10(d) to the Form 10-Qof Restaurant Brands International Inc. filed on October 26, 2017.
10.10(e) Incremental Facility Amendment, dated as of March 27, 2017, to theCredit Agreement.
Incorporated herein by reference to Exhibit 10.10(e) to the Form 10-Qof Restaurant Brands International Inc. filed on October 26, 2017.
10.10(f) Incremental Facility Amendment No. 2, dated as of May 17, 2017, tothe Credit Agreement.
Incorporated herein by reference to Exhibit 10.42 to the Form 8-K ofRestaurant Brands International Inc. filed on May 17, 2017.
10.10(g) Incremental Facility Amendment No. 3, dated as of October 13, 2017,to the Credit Agreement.
Incorporated herein by reference to Exhibit 10.45 to the Form 8-K ofRestaurant Brands International Inc. filed on October 16, 2017.
10.10(h) Amendment No. 3, dated October 2, 2018, to the Credit Agreement. Incorporated herein by reference to Exhibit 10.10(h) to the Form 10-Qof Restaurant Brands International Inc. filed on October 24, 2018.
10.10(i) Incremental Facility Amendment No. 4, dated as of September 6, 2019,to the Credit Agreement, dated October 27, 2014, by and among1011778 B.C. Unlimited Liability Company, as parent borrower, NewRed Finance, Inc., as subsidiary borrower, 1013421 B.C. UnlimitedLiability Company, the other guarantors party thereto, JPMorganChase Bank, N.A., as administrative agent, collateral agent and swingline lender, and the other lenders party thereto.
Incorporated herein by reference to Exhibit 10.66 to the Form 8-K ofRestaurant Brands International Inc. filed on September 9, 2019.
10.10(j) Amendment No. 4, dated as of November 19, 2019, to the CreditAgreement, dated October 27, 2014, by and among 1011778 B.C.Unlimited Liability Company, as parent borrower, New Red Finance,Inc., as subsidiary borrower, 1013421 B.C. Unlimited LiabilityCompany, the other guarantors party thereto, JPMorgan Chase Bank,N.A., as administrative agent, collateral agent and swing line lender,and the other lenders party thereto.
Incorporated herein by reference to Exhibit 10.68 to the Form 8-K ofRestaurant Brands International Inc. filed on November 20, 2019.
10.10(k) Amendment No. 5, dated as of April 2, 2020, to the Credit Agreement,dated October 27, 2014, by and among 1011778 B.C. UnlimitedLiability Company, as parent borrower, New Red Finance, Inc., assubsidiary borrower, 1013421 B.C. Unlimited Liability Company, theother guarantors party thereto, JPMorgan Chase Bank, N.A., asadministrative agent, collateral agent and swing line lender, and theother lenders party thereto.
Incorporated herein by reference to Exhibit 10.71 to the Form 8-K ofRestaurant Brands International Inc. filed on April 3, 2020.
10.11(a)* 2014 Omnibus Incentive Plan. Incorporated herein by reference to Exhibit 99.1 to the Form S-8 ofRestaurant Brands International Inc. (File No. 333-200997).
10.11(b)* Form of Option Award Agreement under the 2014 Omnibus IncentivePlan.
Incorporated herein by reference to Exhibit 10.11(b) to the Form 10-Kof Restaurant Brands International Inc. filed on March 2, 2015.
10.11(c)* Form of Base Matching Option Award Agreement under the 2014Omnibus Incentive Plan.
Incorporated herein by reference to Exhibit 10.11(c) to the Form 10-Kof Restaurant Brands International Inc. filed on March 2, 2015.
10.11(d)* Form of Additional Matching Option Award Agreement under the2014 Omnibus Incentive Plan.
Incorporated herein by reference to Exhibit 10.11(d) to the Form 10-Kof Restaurant Brands International Inc. filed on March 2, 2015.
113

Table of Contents
10.11(e)* Form of Board Member Option Award Agreement under the 2014Omnibus Incentive Plan.
Incorporated herein by reference to Exhibit 10.11(e) to the Form 10-Kof Restaurant Brands International Inc. filed on March 2, 2015.
10.11(f)* Form of Board Member Restricted Stock Unit Award Agreement underthe 2014 Omnibus Incentive Plan.
Incorporated herein by reference to Exhibit 10.11(f) to the Form 10-Kof Restaurant Brands International Inc. filed on March 2, 2015.
10.12 Amended and Restated Limited Partnership Agreement, datedDecember 11, 2014, between Restaurant Brands International Inc.,8997896 Canada Inc. and each person who is admitted as a LimitedPartner in accordance with the terms of the agreement.
Incorporated herein by reference to Exhibit 3.5 to the Form 8-K ofRegistrant filed on December 12, 2014.
10.13 Restaurant Brands International Inc. Form of Director IndemnificationAgreement.
Incorporated herein by reference to Exhibit 10.13 to the Form 10-K ofRestaurant Brands International Inc. filed on March 2, 2015.
10.16(c)* Tim Hortons Inc. Form of Nonqualified Stock Option AwardAgreement under the 2006 Stock Incentive Plan (2011 Award).
Incorporated herein by reference to Exhibit 10(b) to the Form 10-Q ofTim Hortons Inc. filed on August 11, 2011.
10.17(a)* 2012 Stock Incentive Plan, as amended effective December 12, 2014. Incorporated herein by reference to Exhibit 99.3 to the Form S-8 ofRestaurant Brands International Inc. (File No. 333-200997).
10.17(b)* Tim Hortons Inc. Form of Nonqualified Stock Option AwardAgreement under the 2012 Stock Incentive Plan (2012 Award).
Incorporated herein by reference to Exhibit 10(c) to the Form 10-Q ofTim Hortons Inc. filed on August 9, 2012.
10.17(c)* Tim Hortons Inc. Form of Nonqualified Stock Option AwardAgreement under the 2012 Stock Incentive Plan (2013 Award).
Incorporated herein by reference to Exhibit 10(c) to the Form 10-Q ofTim Hortons Inc. filed on May 8, 2013.
10.17(d)* Tim Hortons Inc. Form of Nonqualified Stock Option AwardAgreement under the 2012 Stock Incentive Plan (2014 Award).
Incorporated herein by reference to Exhibit 10(c) to the Form 10-Q ofTim Hortons Inc. filed on August 6, 2014.
10.22* Employment and Post-Covenants Agreement dated as of February 3,2015 between Restaurant Brands International Inc. and Joshua Kobza.
Incorporated herein by reference to Exhibit 10.22 to the Form 10-Q ofRestaurant Brands International Inc. filed on May 5, 2015.
10.23* Employment and Post-Covenants Agreement dated as of February 3,2015 between Burger King Corporation and Joshua Kobza.
Incorporated herein by reference to Exhibit 10.23 to the Form 10-Q ofRestaurant Brands International Inc. filed on May 5, 2015.
10.24* Employment and Post-Covenants Agreement dated as of February 3,2015 between The TDL Group Corp. and Joshua Kobza.
Incorporated herein by reference to Exhibit 10.24 to the Form 10-Q ofRestaurant Brands International Inc. filed on May 5, 2015.
10.32* Form of Non-Compete, Non-Solicitation and ConfidentialityAgreement.
Incorporated herein by reference to Exhibit 10.32 to the Form 10-K ofRestaurant Brands International Inc. filed on February 23, 2021.
10.33* Restaurant Brands International Inc. 2015 Employee Share PurchasePlan.
Incorporated herein by reference to Exhibit 10.30 to the Form S-8 ofRestaurant Brands International Inc. filed on September 1, 2015.
10.35(a)* Form of Base Matching Restricted Stock Unit Award Agreement underthe 2014 Omnibus Incentive Plan.
Incorporated herein by reference to Exhibit 10.35(a) to the Form 10-Qof Restaurant Brands International Inc. filed on April 29, 2016.
10.35(b)* Form of Additional Matching Restricted Stock Unit Award Agreementunder the 2014 Omnibus Incentive Plan.
Incorporated herein by reference to Exhibit 10.35(b) to the Form 10-Qof Restaurant Brands International Inc. filed on April 29, 2016.
10.35(c)* Form of Performance Award Agreement under the 2014 OmnibusIncentive Plan.
Incorporated herein by reference to Exhibit 10.35(c) to the Form 10-Qof Restaurant Brands International Inc. filed on April 29, 2016.
10.35(d)* Form of Stock Option Award Agreement under the 2014 OmnibusIncentive Plan.
Incorporated herein by reference to Exhibit 10.35(d) to the Form 10-Qof Restaurant Brands International Inc. filed on April 29, 2016.
114
Table of Contents
10.36* Restaurant Brands International Inc. Amended and Restated 2014Omnibus Incentive Plan, as amended.
Incorporated herein by reference to Exhibit 10.36 to the Form 10-Q ofRestaurant Brands International Inc. filed on August 1, 2018.
10.36(a)* Form of Performance Award Agreement (TH) under the Amended andRestated 2014 Omnibus Plan
Incorporated herein by reference to Exhibit 10.73 to the Form 10-Q ofRestaurant Brands International Inc. filed on May 1, 2020.
10.36(b)* Form Matching Restricted Stock Unit Agreement under the Amendedand Restated 2014 Omnibus Plan
Incorporated herein by reference to Exhibit 10.36(b) to the Form 10-Kof Restaurant Brands International Inc. filed on February 23, 2021.
10.36(c)* Form Amended Performance Unit Agreement under the Amended andRestated 2014 Omnibus Plan
Incorporated herein by reference to Exhibit 10.36(c) to the Form 10-Kof Restaurant Brands International Inc. filed on February 23, 2021.
10.36(d)* Form Restricted Stock Unit Agreement under the Amended andRestated 2014 Omnibus Plan
Incorporated herein by reference to Exhibit 10.36(d) to the Form 10-Kof Restaurant Brands International Inc. filed on February 23, 2021.
10.36(e)* Form Performance Awards Agreement (TSR) under the Amended andRestated 2014 Omnibus Plan
Incorporated herein by reference to Exhibit 10.36(e) to the Form 10-Kof Restaurant Brands International Inc. filed on February 23, 2021.
10.37* Form of Restaurant Brands International Inc. Board Member StockOption Award Agreement under the Amended and Restated 2014Omnibus Incentive Plan.
Incorporated herein by reference to Exhibit 10.37 to the Form 10-Q ofRestaurant Brands International Inc. filed on October 24, 2016.
10.38* Restaurant Brands International Inc. U.S. Severance Pay Plan. Incorporated herein by reference to Exhibit 10.38 to the Form 10-K ofRestaurant Brands International Inc. filed on February 17, 2017.
10.40* Amendment No. 1 to Restaurant Brands International Inc. Amendedand Restated 2014 Omnibus Incentive Plan.
Incorporated herein by reference to Exhibit 10.39 to the Form 10-Q ofRestaurant Brands International Inc. filed on April 26, 2017.
10.41* Form of Base Matching Restricted Stock Unit Award Agreementunder the Amended and Restated 2014 Omnibus Incentive Plan.
Incorporated herein by reference to Exhibit 10.40 to the Form 10-Q ofRestaurant Brands International Inc. filed on April 26, 2017.
10.42* Form of Additional Matching Restricted Stock Unit Award Agreementunder the Amended and Restated 2014 Omnibus Incentive Plan.
Incorporated herein by reference to Exhibit 10.41 to the Form 10-Q ofRestaurant Brands International Inc. filed on April 26, 2017.
10.49(a)* Employment and Post-Employment Covenants Agreement dated as ofFebruary 9, 2015 by and between The TDL Group Corp. and JillGranat.
Incorporated herein by reference to Exhibit 10.49(a) to the Form 10-Qof Restaurant Brands International Inc. filed on April 24, 2018.
10.49(b)* Employment and Post-Employment Covenants Agreement dated as ofFebruary 9, 2015 by and between Restaurant Brands International Inc.and Jill Granat.
Incorporated herein by reference to Exhibit 10.49(b) to the Form 10-Qof Restaurant Brands International Inc. filed April 24, 2018.
10.49(c)* Employment and Post-Employment Covenants Agreement dated as ofFebruary 9, 2015 by and between Burger King Corporation and JillGranat.
Incorporated herein by reference to Exhibit 10.49(c) to the Form 10-Qof Restaurant Brands International Inc. filed April 24, 2018.
10.50* Employment and Post-Employment Covenants Agreement dated as ofJanuary 22, 2018 by and between The TDL Group Corp. and MatthewDunnigan.
Incorporated herein by reference to Exhibit 10.50 to the Form 10-Q ofRestaurant Brands International Inc. filed on April 29, 2019.
10.51* Employment and Post-Employment Covenants Agreement dated as ofJanuary 22, 2018 by and between Restaurant Brands International Inc.and Matthew Dunnigan.
Incorporated herein by reference to Exhibit 10.51 to the Form 10-Q ofRestaurant Brands International Inc. filed on April 29, 2019.
10.52* Employment and Post-Employment Covenants Agreement dated as ofJanuary 22, 2018 by and between Restaurant Brands International U.S.Services LLC and Matthew Dunnigan.
Incorporated herein by reference to Exhibit 10.52 to the Form 10-Q ofRestaurant Brands International Inc. filed on April 29, 2019.
10.53* Employment and Post-Employment Covenants Agreement dated as ofJanuary 23, 2019 by and between The TDL Group Corp. and Jose E.Cil.
Incorporated herein by reference to Exhibit 10.53 to the Form 10-Q ofRestaurant Brands International Inc. filed on April 29, 2019.
115
Table of Contents
10.54* Employment and Post-Employment Covenants Agreement dated as ofJanuary 23, 2019 by and between Restaurant Brands International Inc.and Jose E. Cil.
Incorporated herein by reference to Exhibit 10.54 to the Form 10-Q ofRestaurant Brands International Inc. filed on April 29, 2019.
10.55* Employment and Post-Employment Covenants Agreement dated as ofJanuary 23, 2019 by and between Burger King Corporation and Jose E.Cil.
Incorporated herein by reference to Exhibit 10.55 to the Form 10-Q ofRestaurant Brands International Inc. filed on April 29, 2019.
10.59* Amendment dated January 23, 2019 to Employment and Post-Covenants Agreement dated as of February 9, 2015 between RestaurantBrands International Inc. and Joshua Kobza.
Incorporated herein by reference to Exhibit 10.59 to the Form 10-Q ofRestaurant Brands International Inc. filed on April 29, 2019.
10.60* Amendment dated January 23, 2019 to Employment and Post-Covenants Agreement dated as of February 9, 2015 between BurgerKing Corporation and Joshua Kobza.
Incorporated herein by reference to Exhibit 10.60 to the Form 10-Q ofRestaurant Brands International Inc. filed on April 29, 2019.
10.61* Amendment dated January 23, 2019 to Employment and Post-Covenants Agreement dated as of February 9, 2015 between The TDLGroup Corp. and Joshua Kobza.
Incorporated herein by reference to Exhibit 10.61 to the Form 10-Q ofRestaurant Brands International Inc. filed on April 29, 2019.
10.62* Form of Performance Award Agreement under Amended and Restated2014 Omnibus Incentive Plan.
Incorporated herein by reference to Exhibit 10.62 to the Form 10-Q ofRestaurant Brands International Inc. filed on April 29, 2019.
10.63* Amended and Restated Performance Award Agreement dated as of May17, 2019 by and between Restaurant Brands International Inc. andDaniel Schwartz.
Incorporated herein by reference to Exhibit 10.63 to the Form 10-Q ofRestaurant Brands International Inc. filed on August 2, 2019.
10.64* Form of Amended and Restated Base Matching Restricted Stock UnitAward Agreement dated as of May 17, 2019 by and between RestaurantBrands International Inc. and Daniel Schwartz.
Incorporated herein by reference to Exhibit 10.64 to the Form 10-Q ofRestaurant Brands International Inc. filed on August 2, 2019.
10.65* Form of Amended and Restated Additional Matching Restricted StockUnit Award Agreement dated as of May 17, 2019 by and betweenRestaurant Brands International Inc. and Daniel Schwartz.
Incorporated herein by reference to Exhibit 10.65 to the Form 10-Q ofRestaurant Brands International Inc. filed on August 2, 2019.
10.72 Purchase Agreement, dated as of April 2, 2020, among Morgan Stanley& Co. LLC, as representative of the Initial Purchasers (as definedtherein), the Issuers (as defined therein) and the Guarantors (as definedtherein).
Incorporated herein by reference to Exhibit 10.72 to the Form 10-Q ofRestaurant Brands International Inc. filed on May 1, 2020.
10.74 Purchase Agreement, dated as of September 16, 2020, among MorganStanley & Co. LLC, as representative of the Initial Purchasers (asdefined therein), the Issuers (as defined therein) and the Guarantors (asdefined therein).
Incorporated herein by reference to Exhibit 10.74 to the Form 10-Q ofRestaurant Brands International Inc. filed on October 28, 2020.
10.75 Purchase Agreement, dated as of October 14, 2020, among MorganStanley & Co. LLC, as representative of the Initial Purchasers (asdefined therein), the Issuers (as defined therein) and the Guarantors (asdefined therein).
Incorporated here by reference to Exhibit 10.75 to the Form 10-Q ofRestaurant Brands International Inc. filed on October 28, 2020.
10.76 Purchase Agreement, dated as of October 20, 2020, among JP MorganSecurities LLC, as representative of the Initial Purchasers (as definedtherein), the Issuers (as defined therein) and the Guarantors (as definedtherein).
Incorporated herein by reference to Exhibit 10.76 to the Form 10-K ofRestaurant Brands International Inc. filed on February 23, 2021.
21.1 List of Subsidiaries of the Registrant. Filed herewith.31.1 Certification of Chief Executive Officer of Restaurant Brands
International Inc., as general partner of Restaurant Brands InternationalLimited Partnership, pursuant to Section 302 of the Sarbanes-Oxley Actof 2002.
Filed herewith.
31.2 Certification of Chief Financial Officer of Restaurant BrandsInternational Inc., as general partner of Restaurant Brands InternationalLimited Partnership, pursuant to Section 302 of the Sarbanes-Oxley Actof 2002.
Filed herewith.
116

Table of Contents
32.1 Certification of Chief Executive Officer of Restaurant BrandsInternational Inc., as general partner of Restaurant Brands InternationalLimited Partnership, pursuant to Section 906 of the Sarbanes-OxleyAct of 2002.
Furnished herewith.
32.2 Certification of Chief Financial Officer of Restaurant BrandsInternational Inc., as general partner of Restaurant Brands InternationalLimited Partnership, pursuant to Section 906 of the Sarbanes-OxleyAct of 2002.
Furnished herewith.
101.INS XBRL Instance Document - the instance document does not appear inthe Interactive Data File because its XBRL tags are embedded withinthe Inline XBRL document
Filed herewith.
101.SCH XBRL Taxonomy Extension Schema Document. Filed herewith.101.CAL XBRL Taxonomy Extension Calculation Linkbase Document. Filed herewith.101.DEF XBRL Taxonomy Extension Definition Linkbase Document. Filed herewith.101.LAB XBRL Taxonomy Extension Label Linkbase Document. Filed herewith.101.PRE XBRL Taxonomy Extension Presentation Linkbase Document. Filed herewith.104 Cover Page Interactive File Formatted as Inline XBRL and contained in Exhibit 101.
* Management contract or compensatory plan or arrangement
Certain instruments relating to long-term borrowings, constituting less than 10 percent of the total assets of the Registrant and its subsidiaries on a consolidatedbasis, are not filed as exhibits herewith pursuant to Item 601(b)(4)(iii)(A) of Regulation S-K. The Registrant agrees to furnish copies of such instruments to theSEC upon request.
Item 16. Form 10-K Summary
None.
Signatures
Pursuant to the requirements of Section 13 or 15(d) of the Securities Exchange Act of 1934, the registrant has duly caused this report to be signed on itsbehalf by the undersigned, thereunto duly authorized.
Restaurant Brands International Limited PartnershipBy: Restaurant Brands International Inc., its general partnerBy: /s/ José E. CilName: José E. CilTitle: Chief Executive Officer
Date: February 23, 2021
117

Table of Contents
Pursuant to the requirements of the Securities Exchange Act of 1934, this report has been signed below by the following persons on behalf of the registrantand in the capacities and on the dates indicated.
Signature Title Date
/s/ José E. Cil Chief Executive Officer of Restaurant Brands International Inc. (principal executive officer)
February 23, 2021
José E. Cil
/s/ Matthew Dunnigan Chief Financial Officer of Restaurant Brands International Inc. (principal financial officer)
February 23, 2021Matthew Dunnigan
/s/ Jacqueline Friesner Controller and Chief Accounting Officer of Restaurant Brands International Inc. (principal accounting officer)
February 23, 2021
Jacqueline Friesner
/s/ Alexandre Behring Co-Chairman of Restaurant Brands International Inc. February 23, 2021Alexandre Behring
/s/ Daniel Schwartz Co-Chairman of Restaurant Brands International Inc. February 23, 2021
Daniel Schwartz
/s/ Maximilien de Limburg Stirum Director of Restaurant Brands International Inc. February 23, 2021Maximilien de Limburg Stirum
/s/ Paul J. Fribourg Director of Restaurant Brands International Inc. February 23, 2021Paul J. Fribourg
/s/ Neil Golden Director of Restaurant Brands International Inc. February 23, 2021Neil Golden
/s/ Ali Hedayat Director of Restaurant Brands International Inc. February 23, 2021Ali Hedayat
/s/ Golnar Khosrowshahi Director of Restaurant Brands International Inc. February 23, 2021Golnar Khosrowshahi
/s/ Jason Melbourne Director of Restaurant Brands International Inc. February 23, 2021Jason Melbourne
/s/ John Prato Director of Restaurant Brands International Inc. February 23, 2021John Prato
/s/ Carlos Alberto Sicupira Director of Restaurant Brands International Inc. February 23, 2021Carlos Alberto Sicupira
/s/ Joao M. Castro-Neves Director of Restaurant Brands International Inc. February 23, 2021Joao M. Castro-Neves
/s/ Roberto Thompson Motta Director of Restaurant Brands International Inc. February 23, 2021Roberto Thompson Motta
118

EXHIBIT 21.1
RESTAURANT BRANDS INTERNATIONAL INC.List of Subsidiaries
Canada1011778 B.C. Unlimited Liability Company1013414 B.C. Unlimited Liability Company1013421 B.C. Unlimited Liability Company1014369 B.C. Unlimited Liability Company1019334 B.C. Unlimited Liability Company1024670 B.C. Unlimited Liability Company1028539 B.C. Unlimited Liability Company1029261 B.C. Unlimited Liability Company1057639 B.C. Unlimited Liability Company1057772 B.C. Unlimited Liability Company1057837 B.C. Unlimited Liability Company1112090 B.C. Unlimited Liability Company1112097 B.C. Unlimited Liability Company1112100 B.C. Unlimited Liability Company1112104 B.C. Unlimited Liability Company1112106 B.C. Unlimited Liability Company12-2019 Holdings ULC12KR Holdings ULC12KRR Holdings ULC12ZZ Holdings ULC2097A Holdings ULC2097AA Holdings ULC2097B Holdings ULC2097P Limited Partnership8997896 Canada Inc.BC12 Limited PartnershipBC12P Limited PartnershipBC12Sub-Orange Holdings ULCBK Canada Service ULCBurger King Canada Holdings Inc.GPAir LimitedGrange Castle Holdings LimitedIPCO Limited PartnershipIPCOA Holdings ULCIPCOAA Holdings ULCIPCOB Holdings ULCKR1 Holdings ULCKR3 Holdings ULCKR4 Holdings ULC

KR5 Holdings ULCKR6 Holdings ULCKR7 Holdings ULCKR8 Holdings ULCKR9 Holdings ULCKR19TDL Holdings ULCLax Holdings ULCLDTA Holdings ULCLDTAA Holdings ULCLDTB Limited PartnershipLDTC Holdings ULCOrange Group International, Inc.P2019 Limited PartnershipPBB Holdings ULCPie 1 Limited PartnershipPie 2 Limited PartnershipPie 3 Limited PartnershipPie 4 Limited PartnershipPLK Enterprises of Canada, Inc.RB Crispy Chicken Holdings ULCRB Iced Capp Holdings ULCRB OCS Holdings ULCRB Timbit Holdings ULCRBHZZ Holdings ULCRBIZZ Holdings ULCRBIZZZ Holdings ULCRestaurant Brands Holdings CorporationRestaurant Brands International Limited PartnershipSBFD Subco ULCTDLDD Holdings ULCTDLRR Holdings ULCThe TDL Group Corp.Tim Hortons Advertising and Promotion Fund (Canada) Inc.Tim Hortons Canadian IP Holdings CorporationZN1 Holdings ULCZN3 Holdings ULCZN4 Holdings ULCZN5 Holdings ULCZN6 Holdings ULCZN7 Holdings ULCZN8 Holdings ULCZN9 Holdings ULCZN19TDL Holdings ULCZNA Holdings ULCZNRBI Limited Partnership

ArgentinaBK Argentina Servicios, S.A.
BrazilBurger King do Brasil Assessoria a Restaurantes Ltda.
ChinaBK (Shanghai) Business Information Consulting Co., Ltd.Burger King (Shanghai) Commercial Consulting Co. Ltd.
GermanyBurger King Beteiligungs GmbH
LuxembourgBurger King (Luxembourg) S.a.r.l.Burger King (Luxembourg) 2 S.a.r.l.Burger King (Luxembourg) 3 S.a.r.l.Orange Lux S.a.r.l.TH Luxembourg S.a.r.l.Restaurant Brands Lux S.a.r.l.
MexicoAdminstracion de Comidas Rapidas, SA de CVBK Comida Rapida, S. de R.L. de C.V.BK Servicios de Comida Rapida, S. de R.L. de C.V.
NetherlandsBurger King Nederland Services B.V.
SingaporeBK AsiaPac, Pte. Ltd.PLK APAC Pte. Ltd.Tim Hortons Asia Pacific Pte. Ltd.
South AfricaBurger King South Africa Holdings (Pty) Ltd.
SwitzerlandBurger King Europe GmbHPLK Europe GmbHTim Hortons Restaurants International GmbHRestaurant Brands Switzerland GmbH
United KingdomBK (UK) Company LimitedBurgerKing Ltd.Burger King (United Kingdom) Ltd.Huckleberry’s Ltd.
UruguayJolick Trading, S.A.

U.S.A.BC3-A, LLCBCp-sub, LLCBK Acquisition, Inc.BK Whopper Bar, LLCBKC-IP, LLCBKHS-A, LLCBlue Holdco 1, LLCBlue Holdco 2, LLCBlue Holdco 3, LLCBlue Holdco 300, LLCBlue Holdco 440, LLCBlue Holdco AKA7, LLCBlue Holdco AKA8, LLCBurger King Capital Finance, Inc.Burger King CorporationBurger King Holdings, Inc.Burger King Interamerica, LLCBurger King Worldwide, Inc.LLC440-A, LLCLLC-K4, LLCLLC-K5, LLCLLC-KZZ, LLCLLC-QQ, LLCLLC-QZ, LLCLLCXOX, LLCNew Red Finance Inc.Orange Group, Inc.Orange Intermediate, LLCPopeyes Louisiana Kitchen, Inc.Restaurant Brands International US Services LLCSBFD Beta, LLCSBFD Holding Co.SBFD, LLCThe Tim’s National Advertising Program, Inc.Tim Donut U.S. Limited, Inc.Tim Hortons (New England), Inc.Tim Hortons USA Inc.
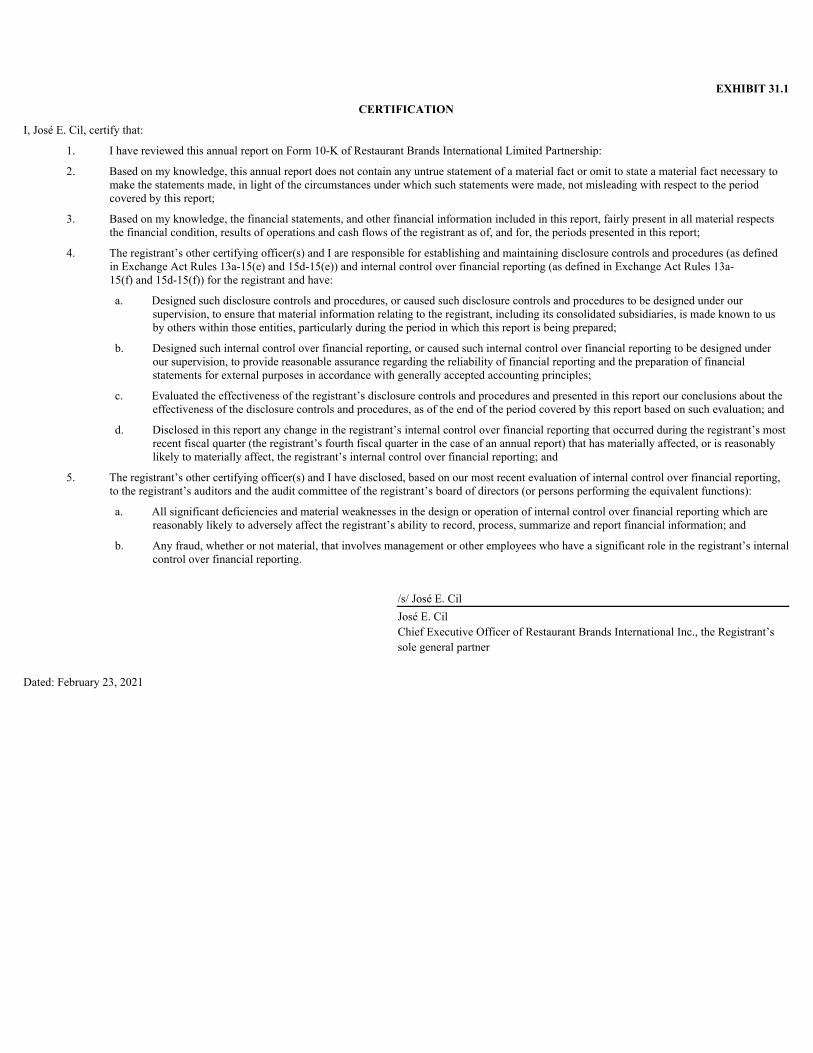
EXHIBIT 31.1
CERTIFICATION
I, José E. Cil, certify that:
1. I have reviewed this annual report on Form 10-K of Restaurant Brands International Limited Partnership:
2. Based on my knowledge, this annual report does not contain any untrue statement of a material fact or omit to state a material fact necessary tomake the statements made, in light of the circumstances under which such statements were made, not misleading with respect to the periodcovered by this report;
3. Based on my knowledge, the financial statements, and other financial information included in this report, fairly present in all material respectsthe financial condition, results of operations and cash flows of the registrant as of, and for, the periods presented in this report;
4. The registrant’s other certifying officer(s) and I are responsible for establishing and maintaining disclosure controls and procedures (as definedin Exchange Act Rules 13a-15(e) and 15d-15(e)) and internal control over financial reporting (as defined in Exchange Act Rules 13a-15(f) and 15d-15(f)) for the registrant and have:
a. Designed such disclosure controls and procedures, or caused such disclosure controls and procedures to be designed under oursupervision, to ensure that material information relating to the registrant, including its consolidated subsidiaries, is made known to usby others within those entities, particularly during the period in which this report is being prepared;
b. Designed such internal control over financial reporting, or caused such internal control over financial reporting to be designed underour supervision, to provide reasonable assurance regarding the reliability of financial reporting and the preparation of financialstatements for external purposes in accordance with generally accepted accounting principles;
c. Evaluated the effectiveness of the registrant’s disclosure controls and procedures and presented in this report our conclusions about theeffectiveness of the disclosure controls and procedures, as of the end of the period covered by this report based on such evaluation; and
d. Disclosed in this report any change in the registrant’s internal control over financial reporting that occurred during the registrant’s mostrecent fiscal quarter (the registrant’s fourth fiscal quarter in the case of an annual report) that has materially affected, or is reasonablylikely to materially affect, the registrant’s internal control over financial reporting; and
5. The registrant’s other certifying officer(s) and I have disclosed, based on our most recent evaluation of internal control over financial reporting,to the registrant’s auditors and the audit committee of the registrant’s board of directors (or persons performing the equivalent functions):
a. All significant deficiencies and material weaknesses in the design or operation of internal control over financial reporting which arereasonably likely to adversely affect the registrant’s ability to record, process, summarize and report financial information; and
b. Any fraud, whether or not material, that involves management or other employees who have a significant role in the registrant’s internalcontrol over financial reporting.
/s/ José E. CilJosé E. CilChief Executive Officer of Restaurant Brands International Inc., the Registrant’ssole general partner
Dated: February 23, 2021

EXHIBIT 31.2
CERTIFICATION
I, Matthew Dunnigan, certify that:
1. I have reviewed this annual report on Form 10-K of Restaurant Brands International Limited Partnership:
2. Based on my knowledge, this annual report does not contain any untrue statement of a material fact or omit to state a material fact necessary tomake the statements made, in light of the circumstances under which such statements were made, not misleading with respect to the periodcovered by this report;
3. Based on my knowledge, the financial statements, and other financial information included in this report, fairly present in all material respectsthe financial condition, results of operations and cash flows of the registrant as of, and for, the periods presented in this report;
4. The registrant’s other certifying officer(s) and I are responsible for establishing and maintaining disclosure controls and procedures (as definedin Exchange Act Rules 13a-15(e) and 15d-15(e)) and internal control over financial reporting (as defined in Exchange Act Rules 13a-15(f) and 15d-15(f)) for the registrant and have:
a. Designed such disclosure controls and procedures, or caused such disclosure controls and procedures to be designed under oursupervision, to ensure that material information relating to the registrant, including its consolidated subsidiaries, is made known to usby others within those entities, particularly during the period in which this report is being prepared;
b. Designed such internal control over financial reporting, or caused such internal control over financial reporting to be designed underour supervision, to provide reasonable assurance regarding the reliability of financial reporting and the preparation of financialstatements for external purposes in accordance with generally accepted accounting principles;
c. Evaluated the effectiveness of the registrant’s disclosure controls and procedures and presented in this report our conclusions about theeffectiveness of the disclosure controls and procedures, as of the end of the period covered by this report based on such evaluation; and
d. Disclosed in this report any change in the registrant’s internal control over financial reporting that occurred during the registrant’s mostrecent fiscal quarter (the registrant’s fourth fiscal quarter in the case of an annual report) that has materially affected, or is reasonablylikely to materially affect, the registrant’s internal control over financial reporting; and
5. The registrant’s other certifying officer(s) and I have disclosed, based on our most recent evaluation of internal control over financial reporting,to the registrant’s auditors and the audit committee of the registrant’s board of directors (or persons performing the equivalent functions):
a. All significant deficiencies and material weaknesses in the design or operation of internal control over financial reporting which arereasonably likely to adversely affect the registrant’s ability to record, process, summarize and report financial information; and
b. Any fraud, whether or not material, that involves management or other employees who have a significant role in the registrant’s internalcontrol over financial reporting.
/s/ Matthew DunniganMatthew DunniganChief Financial Officer of Restaurant Brands International Inc., the Registrant’ssole general partner
Dated: February 23, 2021
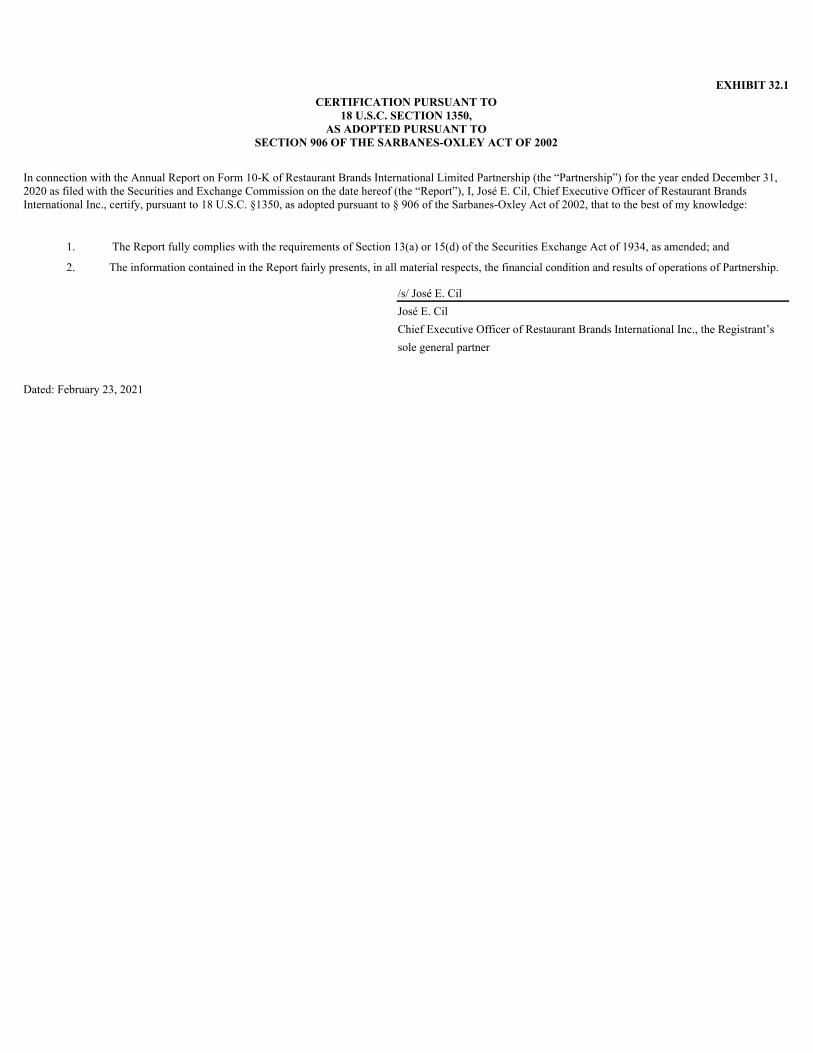
EXHIBIT 32.1CERTIFICATION PURSUANT TO
18 U.S.C. SECTION 1350,AS ADOPTED PURSUANT TO
SECTION 906 OF THE SARBANES-OXLEY ACT OF 2002
In connection with the Annual Report on Form 10-K of Restaurant Brands International Limited Partnership (the “Partnership”) for the year ended December 31,2020 as filed with the Securities and Exchange Commission on the date hereof (the “Report”), I, José E. Cil, Chief Executive Officer of Restaurant BrandsInternational Inc., certify, pursuant to 18 U.S.C. §1350, as adopted pursuant to § 906 of the Sarbanes-Oxley Act of 2002, that to the best of my knowledge:
1. The Report fully complies with the requirements of Section 13(a) or 15(d) of the Securities Exchange Act of 1934, as amended; and
2. The information contained in the Report fairly presents, in all material respects, the financial condition and results of operations of Partnership.
/s/ José E. CilJosé E. CilChief Executive Officer of Restaurant Brands International Inc., the Registrant’ssole general partner
Dated: February 23, 2021

EXHIBIT 32.2CERTIFICATION PURSUANT TO
18 U.S.C. SECTION 1350,AS ADOPTED PURSUANT TO
SECTION 906 OF THE SARBANES-OXLEY ACT OF 2002
In connection with the Annual Report on Form 10-K of Restaurant Brands International Limited Partnership (the “Partnership”) for the year ended December 31,2020 as filed with the Securities and Exchange Commission on the date hereof (the “Report”), I, Matthew Dunnigan, Chief Financial Officer of Restaurant BrandsInternational Inc., certify, pursuant to 18 U.S.C. §1350, as adopted pursuant to §906 of the Sarbanes-Oxley Act of 2002, that to the best of my knowledge:
1. The Report fully complies with the requirements of Section 13(a) or 15(d) of the Securities Exchange Act of 1934, as amended; and
2. The information contained in the Report fairly presents, in all material respects, the financial condition and results of operations of Partnership.
/s/ Matthew DunniganMatthew DunniganChief Financial Officer of Restaurant Brands International Inc., the Registrant’s solegeneral partner
Dated: February 23, 2021