responding to complex key performance indicators · responding to complex key performance...
TRANSCRIPT

@TSC_news
sustainabilityconsortium.org
Sustainable Productsfor a Sustainable Planet
Responding to Complex Key Performance Indicators
September 20, 2017

THE SUSTAINABILITY CONSORTIUM ® | © 2017 ARIZONA STATE UNIVERSITY AND UNIVERSITY OF ARKANSAS 2
Antitrust Statement
The Sustainability Consortium is committed to facilitating a robust, open and honest exchange of ideas and information among itsparticipants on subjects relevant to the agenda of Consortium meetings. It is also committed to compliance with all applicable laws, including antitrust and competition laws.
To avoid any possible problems, communications and exchanges of information at, or attendant to, any Consortium-related proceeding should directly relate to the issues on the agenda.
There should be no discussions or exchanges of information regarding (1) what price any participant has or may charge for itsproducts or services; (2) strategic business plans or (3) whether or not to do business with any person or entity. The Sustainability Consortium does not condone disparagement or untrue statements in any form.
Violation of these policies could jeopardize other participants and the goals of the Consortium and will not be tolerated. Let TSC staff know immediately if you have a concern or question about a possible violation of this policy.

THE SUSTAINABILITY CONSORTIUM ® | © 2017 ARIZONA STATE UNIVERSITY AND UNIVERSITY OF ARKANSAS 3
TSC Marketing Policy
TSC has embraced many different types of organizations across the value chain because we view all as critical stakeholders.
In order to maintain a professional environment where people feel open to sharing information and opinions, we ask that all participating companies refrain from discussion during TSC meetings that which could be construed by other members as direct selling of products and services.
If you feel that another member or participant is engaging in this behavior, please contact Euan Murray, CEO or Jon Johnson, Chairman of the Board.
Attribution RuleParticipants are free to use the information received, but statements shall not be attributed to speakers or participants unlesspermission has been granted.
THE SUSTAINABILITY CONSORTIUM ® | © 2017 ARIZONA STATE UNIVERSITY AND UNIVERSITY OF ARKANSAS 4
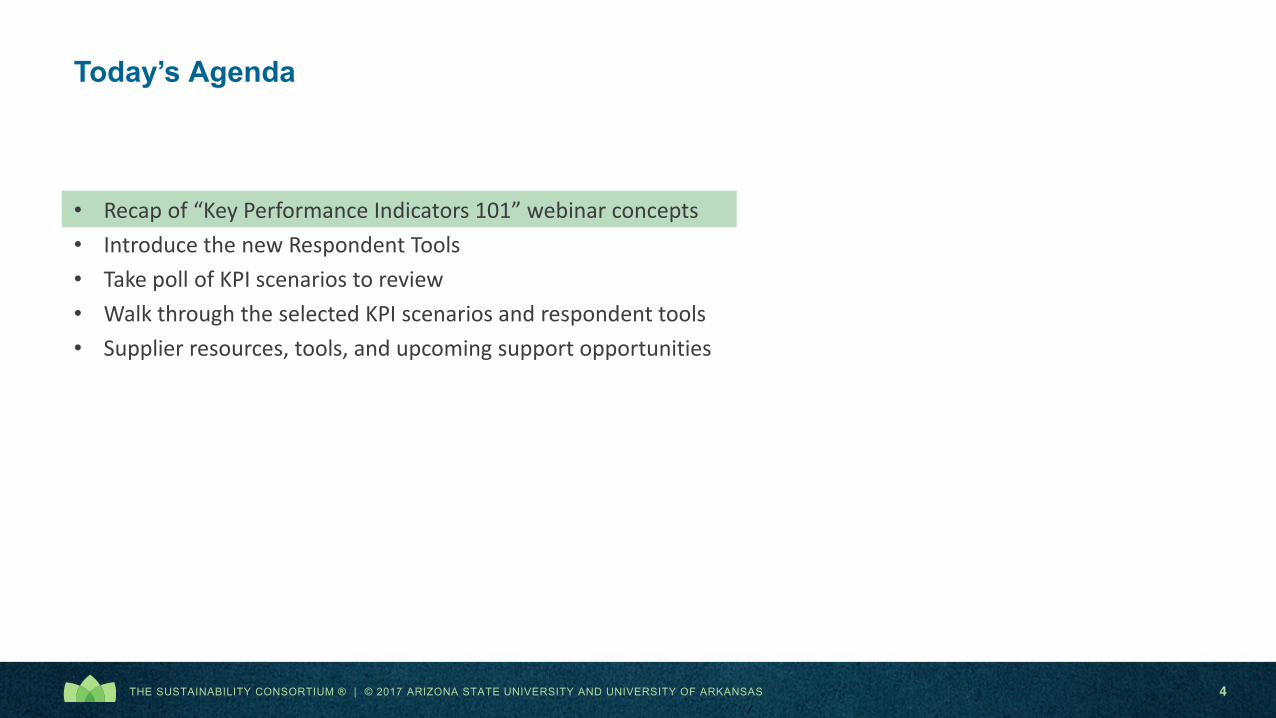
Today’s Agenda
• Recap of “Key Performance Indicators 101” webinar concepts• Introduce the new Respondent Tools• Take poll of KPI scenarios to review• Walk through the selected KPI scenarios and respondent tools• Supplier resources, tools, and upcoming support opportunities
THE SUSTAINABILITY CONSORTIUM ® | © 2017 ARIZONA STATE UNIVERSITY AND UNIVERSITY OF ARKANSAS 5
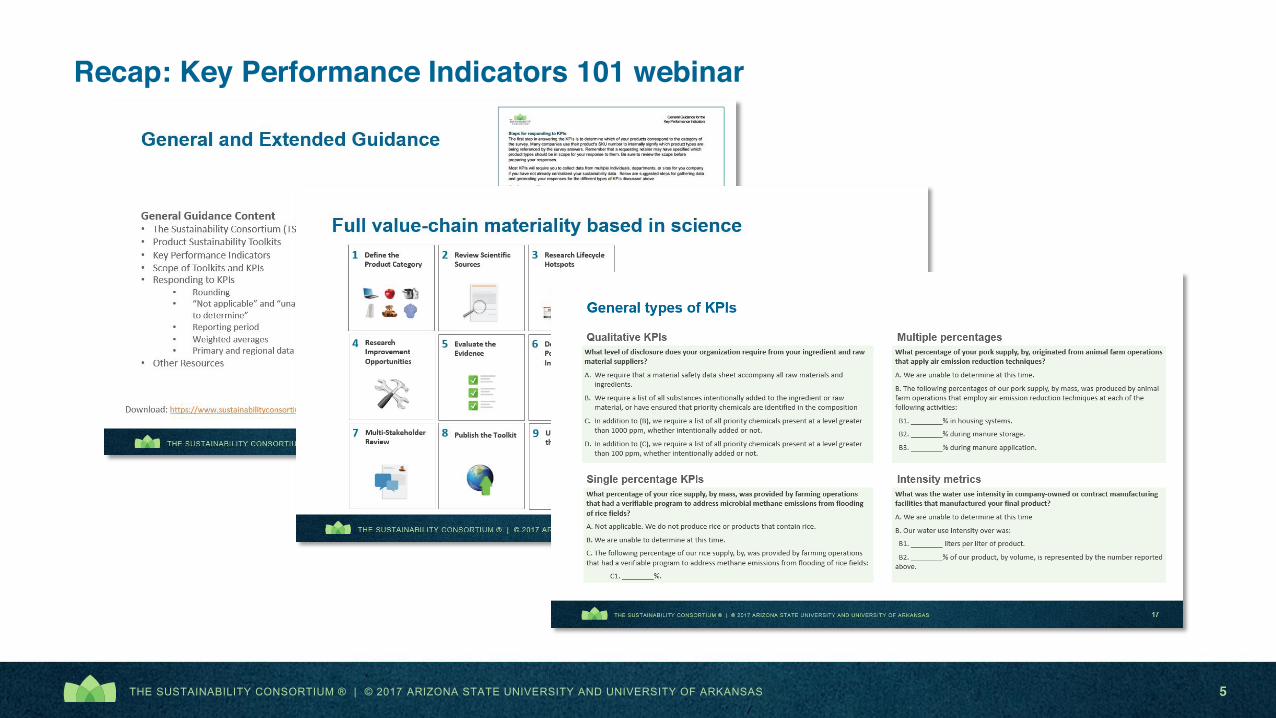
Recap: Key Performance Indicators 101 webinar

THE SUSTAINABILITY CONSORTIUM ® | © 2017 ARIZONA STATE UNIVERSITY AND UNIVERSITY OF ARKANSAS 6
Today’s Agenda
• Recap of “Key Performance Indicators 101” webinar concepts• Introduce the new Respondent Tools• Take poll of KPI scenarios to review• Walk through the selected KPI scenarios and respondent tools• Supplier resources, tools, and upcoming support opportunities
7THE SUSTAINABILITY CONSORTIUM ® | © 2017 ARIZONA STATE UNIVERSITY AND UNIVERSITY OF ARKANSAS
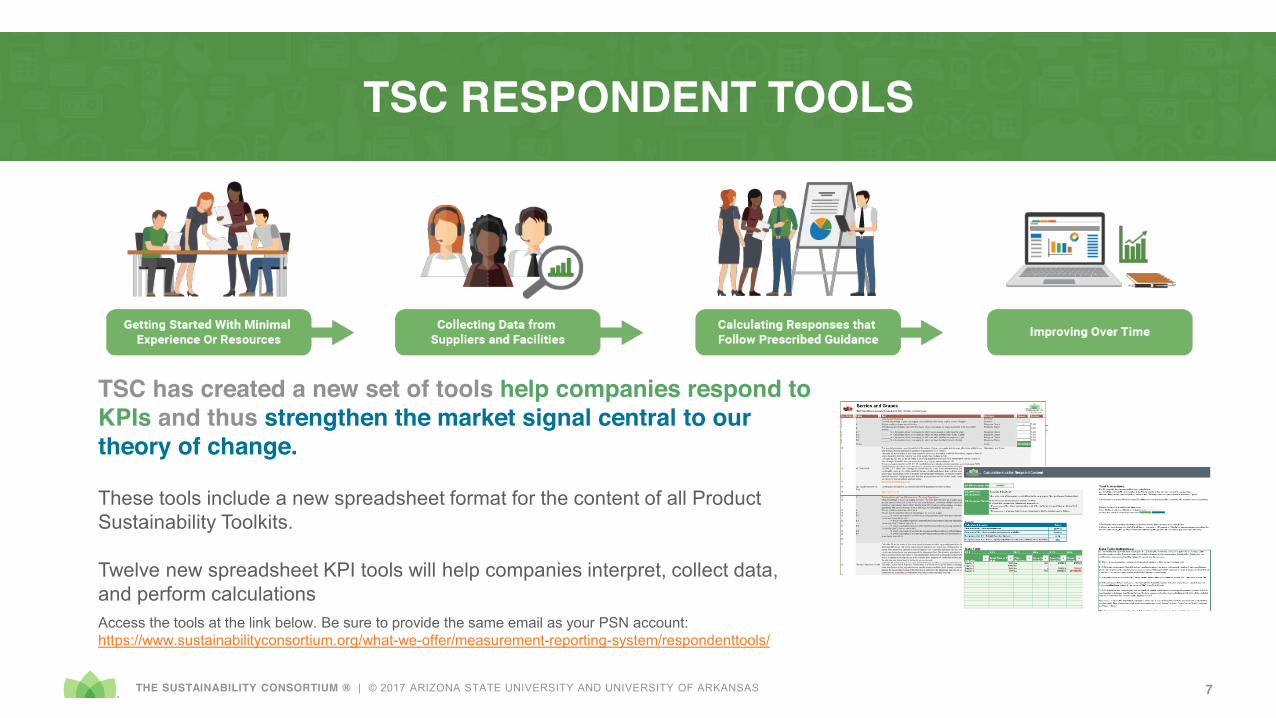
TSC RESPONDENT TOOLS
TSC has created a new set of tools help companies respond to KPIs and thus strengthen the market signal central to our theory of change.
These tools include a new spreadsheet format for the content of all Product Sustainability Toolkits.
Twelve new spreadsheet KPI tools will help companies interpret, collect data, and perform calculationsAccess the tools at the link below. Be sure to provide the same email as your PSN account: https://www.sustainabilityconsortium.org/what-we-offer/measurement-reporting-system/respondenttools/

THE SUSTAINABILITY CONSORTIUM ® | © 2017 ARIZONA STATE UNIVERSITY AND UNIVERSITY OF ARKANSAS 8
0
1000
2000
3000
4000
5000
6000
0 10 20 30 40 50 60 70 80 90 100
Num
ber o
f res
pons
es
Average score
Prioritizing KPIs for Respondent Tools
Many Toolkits
Low scores
Many respondents
112 types total

THE SUSTAINABILITY CONSORTIUM ® | © 2017 ARIZONA STATE UNIVERSITY AND UNIVERSITY OF ARKANSAS 9
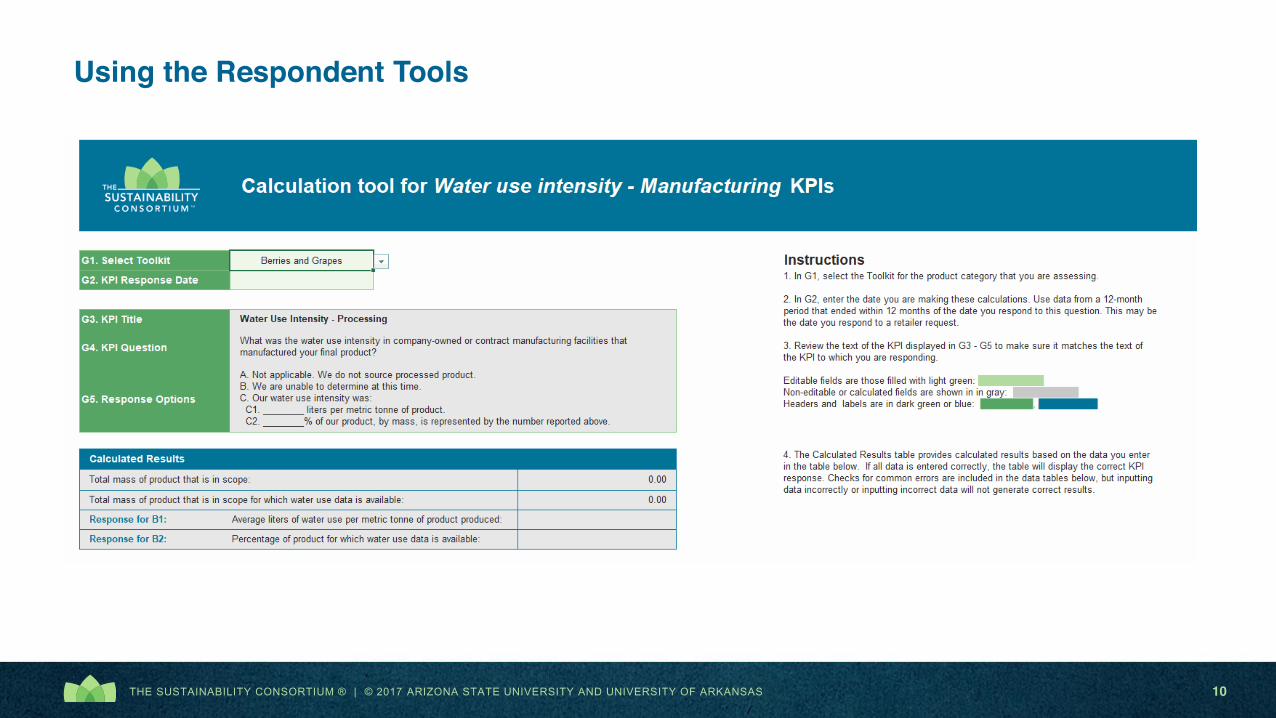
KPI calculation tools
Tools have been produced for the following KPIs used across dozens of Toolkits:
• Water use intensity - Manufacturing • Air Quality (CFT)• Deforestation (PPF) • Fertilizer Application (FBA)• GHG emissions intensity - Manufacturing• Materials Disposition (Electronics)• Priority Chemicals (HPC)• Product Takeback (Electronics)• Recycled and Alternative Fiber (PPF)• Recycled Content (CFT)• Wastewater (CFT)• Water use - Supply chain
These twelve new spreadsheet-based tools walk through the calculation of KPI responses. They include data tables, built in formulas, step-by-step instructions, and basic error detection.
THE SUSTAINABILITY CONSORTIUM ® | © 2017 ARIZONA STATE UNIVERSITY AND UNIVERSITY OF ARKANSAS 10
Using the Respondent Tools

THE SUSTAINABILITY CONSORTIUM ® | © 2017 ARIZONA STATE UNIVERSITY AND UNIVERSITY OF ARKANSAS 11
Using the Respondent Tools

THE SUSTAINABILITY CONSORTIUM ® | © 2017 ARIZONA STATE UNIVERSITY AND UNIVERSITY OF ARKANSAS 12
Spreadsheet CSPs
The Category Sustainability Profile has been an essential part of the Product Sustainability Toolkits. Until now, it was only available in PDF format.
With the new spreadsheet format, you are able to:• Enter your data to see your potential KPI
results and keep track of your responses• Sort and filter Toolkit content to find what
you need quickly• Copy and paste content to your own tracking
files for better management and communication

THE SUSTAINABILITY CONSORTIUM ® | © 2017 ARIZONA STATE UNIVERSITY AND UNIVERSITY OF ARKANSAS 13
Spreadsheet CSPs
Enter your data to see your potential KPI results and keep track of your responses

THE SUSTAINABILITY CONSORTIUM ® | © 2017 ARIZONA STATE UNIVERSITY AND UNIVERSITY OF ARKANSAS 14
Spreadsheet CSPs
Sort and filter Toolkit content to find what you need quickly

THE SUSTAINABILITY CONSORTIUM ® | © 2017 ARIZONA STATE UNIVERSITY AND UNIVERSITY OF ARKANSAS 15
Today’s Agenda
• Recap of “Key Performance Indicators 101” webinar concepts• Introduce the new Respondent Tools• Take poll of KPI scenarios to review• Walk through the selected KPI scenarios and respondent tools• Supplier resources, tools, and upcoming support opportunities

16THE SUSTAINABILITY CONSORTIUM ® | © 2017 ARIZONA STATE UNIVERSITY AND UNIVERSITY OF ARKANSAS
Antibiotic Use – Animal Farm OperationsFish Feed Equivalency Ratio – Aquaculture OperationsEcosystem Degradation - Fishing Operations
Sectors KPIsCross-Sector GHG Emissions Intensity - Manufacturing *
Water Use – Supply Chain*Labor Rights - Supply Chain Water Use Intensity - Manufacturing *Worker Health and Safety - Manufacturing
Packaging Raw Material Sourcing �
Sustainable Packaging Design and Production�
Transportation to Retailers�
Clothing, Footwear, & Textiles
Air Quality – ManufacturingCotton Cultivation - Environmental Impacts
Recycled Content *Wastewater Generation - Supply Chain *
Electronics Conflict MineralsHazardous Substances - DisclosureMaintenance and Refurbishment
Product Takeback Program*Materials Disposition Tracking – Product Takeback Program*
Food, Beverage, & Agriculture
Deforestation and Land Conversion - On-farm�Fertilizer Application - On-farm*GHG Emissions Intensity - Animal Farm Operations
Antibiotic Use – Animal Farm OperationsEcosystem Degradation – Fishing Operations
General Merchandise Safe Transportation of Plastic ResinLubricant Recycling - Lubricant Manufacturing
NMVOC Emissions Control - Refineries
Home & Personal Care Bleaching chemicals - Virgin Fluff Pulp Production�Ingredient Transparency - Business to ConsumerPriority Chemicals - Safety *
Paper, Pulp, & Forestry Product DesignDeforestation - Virgin Fiber Sourcing*�
Recycled and Alternative Fiber *
Toys Product DesignBattery Use and Longevity
*New Respondent Tool available�Updated since 2016 Walmart Sustainability Index

THE SUSTAINABILITY CONSORTIUM ® | © 2017 ARIZONA STATE UNIVERSITY AND UNIVERSITY OF ARKANSAS 17
GHG Emissions Intensity – ManufacturingYour company has been asked about the emissions intensity of products in Category X. You know the GHG emissions intensity for the facilities that manufacture these products, but many of the same facilities also manufacture products in Category Y. The production of both categories can be measured in mass units (metric tonnes). Which formula shows the correct calculation for the following KPI?
Key Performance Indicator (KPI):What was the greenhouse gas emissions intensity associated with company-owned or contract manufacturing facilities that manufactured your final product?
A. We are unable to determine at this time.B. Our greenhouse gas emissions intensity was:
B1. ________ kg CO2e per metric tonne of product. B2. ________% of our product, by mass, is represented by the number reported above.
Calculation & Scope (condensed): • This may include some or all of your organization's corporate scope 1 and 2 emissions, as well
as scope 1 and 2 emissions from any final manufacturing facilities not within your organization's financial or operational control (e.g., contract manufacturers)
• You may calculate B1 using product-specific data or estimate intensity via facility data that is not product-specific.
• If using facility data, calculate B1 as the average of each final manufacturing facility's greenhouse gas emissions intensity, weighted by the total mass of final product produced
• If the manufacturing facilities produce more than one category of product, only weight using the total mass of production specific to the product category in question.
Facility Emissions intensity Mass produced Category X Category Y
A 20 kgCO2e/t 100 t (80%) 25 t (20%)
B 50 kgCO2e/t 75 t (43%) 100 t (57%)
C 30 kgCO2e/t 120 t (100%) 0 t (0%)
20 ∗ 100 + 50 ∗ 75 + 1 30 ∗ 12020 + 50 + 30 = 9350
100 = 𝟗𝟑. 𝟓 𝒌𝒈/𝒕
20 ∗ 100 + 50 ∗ 75 + 30 ∗ 120100 + 75 + 120 = 9350
295 = 𝟑𝟏. 𝟕 𝒌𝒈/𝒕
100 + 75 + 12020 + 30 + 50 = 295
100 = 𝟐. 𝟗𝟓 𝒌𝒈/𝒕
1.
2.
3.
Using the data above, which formula is correct?

THE SUSTAINABILITY CONSORTIUM ® | © 2017 ARIZONA STATE UNIVERSITY AND UNIVERSITY OF ARKANSAS 18
GHG Emissions Intensity – Manufacturing
Explanation: Weighted averages are calculated by multiplying each value to be averaged (facility GHG emissions intensity) by its associated weight (mass of category X produced), then dividing the result by the sum of the weights. This method applies even when there are more than two products manufactured in the same facilities. Because you are being asked about the emissions intensity in Category X, you do not need the emissions intensity data presented to you for Category Y. Use the same mass data to calculate B2, the % of product, by mass, that is represented by the intensity number in B1.
Use the same mass data to calculate B2, the % of product, by mass, that is represented by the intensity number in B1.
This example shows that all facilities are reporting their GHG emissions and the mass of production in each product category, so B2 is 100%.
𝟐𝟎 ∗ 𝟏𝟎𝟎 + 𝟓𝟎 ∗ 𝟕𝟓 + 𝟑𝟎 ∗ 𝟏𝟐𝟎𝟏𝟎𝟎 + 𝟕𝟓 + 𝟏𝟐𝟎 = 9350
295 = 𝟑𝟏. 𝟕 𝒌𝒈/𝒕2.
Correct answer
Facility Emissions intensity
Mass produced Category X Category Y
A 20 kgCO2e/t 100 t (80%) 25 t (20%)
B 50 kgCO2e/t 75 t (43%) 100 t (57%)
C 30 kgCO2e/t 120 t (100%) 0 t (0%)
Key Performance Indicator (KPI):What was the greenhouse gas emissions intensity associated with company-owned or contract manufacturing facilities that manufactured your final product?
A. We are unable to determine at this time.B. Our greenhouse gas emissions intensity was:
B1. 31.7 kg CO2e per metric tonne of product. B2. 100 % of our product, by mass, is represented by the number reported above.
Solution

THE SUSTAINABILITY CONSORTIUM ® | © 2017 ARIZONA STATE UNIVERSITY AND UNIVERSITY OF ARKANSAS 19
Water Use – Supply Chain
Key Performance Indicator (KPI):What percentage of textile fabric used in your final product, by mass purchased, was produced by suppliers that reported their total annual water use?
A. We are unable to determine at this time. B. The following percentage of fabric, by mass purchased, was
produced by suppliers that reported total water use: B1. ________%.
SupplierMass
purchased (tonnes)
Reporting type Reporting end
1 2,000 CSR report March 2017
2 1,000 Direct report June 2015
3 1,000 Direct report April 2017
4 6,000 None -
Calculation & Scope (condensed): • Calculate B1 as the mass purchased from fabric suppliers that reported their annual water use, divided by the total mass purchased from all fabric
suppliers, then multiply by 100. Perform this calculation using data from a 12-month period that ended within 12 months of the date you respond to this question.
• Water use is defined as the total amount of withdrawals from municipal and private water providers, surface water, groundwater, or wells. • Supplier water use reporting can occur through public disclosure or private disclosure from the supplier to your organization directly or through
another party.
You are being asked to respond to the KPI related to water use across your supply chain. On November 1, 2017, what would be the correct response to the following KPI?

THE SUSTAINABILITY CONSORTIUM ® | © 2017 ARIZONA STATE UNIVERSITY AND UNIVERSITY OF ARKANSAS 20
Water Use – Supply Chain
SupplierMass
purchased (tonnes)
Reporting type Reporting end
1 2,000 CSR report March 2017
2 1,000 Direct report June 2015
3 1,000 Direct report April 2017
4 6,000 None -
Total mass 10,000
Key Performance Indicator (KPI):What percentage of textile fabric used in your final product, by mass purchased, was produced by suppliers that reported their total annual water use?
A. We are unable to determine at this time. B. The following percentage of fabric, by mass purchased, was
produced by suppliers that reported total water use: B1. 30 %.
Explanation:Supplier 2 is excluded from the mass purchased from suppliers that reported their annual water use because its reporting period is outside of the required 12-month range. Supplier 4 is excluded because they did not report.
The correct response is calculated by summing the mass purchased from Suppliers 1 and 3, then dividing by the mass purchased from all suppliers: (2,000 tonnes + 1,000 tonnes) / 10,000 tonnes = 30%.
Solution

THE SUSTAINABILITY CONSORTIUM ® | © 2017 ARIZONA STATE UNIVERSITY AND UNIVERSITY OF ARKANSAS 21
Packaging Raw Material SourcingYou are a packaging manufacturer, and the material you use to produce packaging is determined by your customer. You recently implemented a policy of tracking the renewable materials you use in production, but have no data at this time; although, you do know the overall industry average for use of renewable materials is 25%. Data provided by your suppliers has been reported to you within the last 12 months. What is the correct response to the following KPI?
Key Performance Indicator (KPI):What percentage of the sales packaging used for your final products, by mass, was post-consumer recycled material and sustainably-sourced renewable virgin material?
A. Not applicable. We do not use sales packaging for our product.B. We are unable to determine at this time.C. The sales packaging used for our final product was:
C1. _______% of post-consumer recycled content.C2. _______% sustainably-sourced renewable virgin material.
Facility Location Volume of sales packaging
% post-consumer recycled content
% sustainably-sourcedrenewable virgin material
NO DATA AVAILABLE
Calculation & Scope:The scope of this question is the product category’s sales packaging, which is defined as packaging that leaves a store with the consumer. Include the transportation-related packaging for product that is shipped directly to an end consumer. Calculate C1 as the mass of post-consumer recycled material in the sales packaging of your final products, divided by the total mass of sales packaging used for your final products, then multiply by 100. This excludes pre-consumer recycled materials. Calculate C2 as the mass of sustainably-sourced renewable virgin material in the sales packaging of your final products, divided by the total mass of sales packaging used for your final products, then multiply by 100. To be included in C2, the material must be third-party verified (e.g. for paper-based packaging FSC, SFI, PEFC would be examples of certifications for verification). If data on packaging materials specific to these final products is not available, you may use more aggregated internal data to calculate C1 and C2 (e.g., company-level data for sales packaging of similar products). The sum of C1 and C2 cannot be greater than 100%.

THE SUSTAINABILITY CONSORTIUM ® | © 2017 ARIZONA STATE UNIVERSITY AND UNIVERSITY OF ARKANSAS 22
Packaging Raw Material SourcingSolution
Key Performance Indicator (KPI):What percentage of the sales packaging used for your final products, by mass, was post-consumer recycled material and sustainably-sourced renewable virgin material?
A. Not applicable. We do not use sales packaging for our product.B. We are unable to determine at this time.C. The sales packaging used for our final product was:
C1. _______% of post-consumer recycled content.C2. _______% sustainably-sourced renewable virgin material.
Facility Location Volume of sales packaging
% post-consumer recycled content
% sustainably-sourcedrenewable virgin material
NO DATA AVAILABLE
Explanation:While you recently implemented a policy of tracking the materials you use in your sales packaging, you have not yet collected data at the time of answering this KPI.
Improve your product sustainability!First, you should not use an industry average to respond to a KPI, answers should be organization-specific. Second, even though you do not control the specification of the material type, it is still useful to track the percent of materials being used. Calculate the mass of packaging materials originating from these sources, and divide by the total mass of packaging used. You may also reference TSC Improvement Opportunities in the related TSC Category Sustainability Profile.

THE SUSTAINABILITY CONSORTIUM ® | © 2017 ARIZONA STATE UNIVERSITY AND UNIVERSITY OF ARKANSAS 23
Sustainable Packaging DesignYou are a product manufacturer and train your sustainability team, sales team, and product design team on resource conservation, material and process efficiency, and weight optimization in order to improve sales packaging sustainability. You can publicly report the progress on your goals to address these factors and can demonstrate quantifiable impact reductions for the sales packaging of 1,250 out of 2,500 metric tonnes of your final product.
Key Performance Indicator (KPI):What percentage of the sales packaging for your final products, by mass, was recyclable, was formally assessed for material and process efficiency and weight or volume optimization, and for which quantified environmental impact reduction can be demonstrated?
A. Not applicable. We do not use sales packaging for our product.
B. We are unable to determine at this time. C. We are able to report the following for the sales packaging
used in our final products: C1. ________% of our packaging, by mass, was recyclable. C2. ________ % of our packaging, by mass, has demonstrated progress on goals for material and process efficiency during packaging manufacturing.C3. ________ % of our packaging, by mass, has demonstrated progress on goals for weight or volume optimization during packaging design.C4. ________ % of our packaging, by mass, has a demonstrated quantified environmental impact reduction.
Calculation & Scope (condensed):• Calculate C1 as the mass of sales packaging used for your final products that was recyclable,
divided by the total mass of sales packaging used for your final products, then multiply by 100.
• Calculate C2 as the mass of sales packaging used for your final products that has demonstrated progress on goals for material and process efficiency during packaging manufacturing, divided by the total mass of sales packaging used for your final products, then multiply by 100.
• Calculate C3 as the mass of sales packaging used for your final products that has demonstrated progress on goals for weight or volume optimization during packaging design, divided by the total mass of sales packaging used for your final products, then multiply by 100. Goals must be quantitative and time-bound and progress must be reported publicly. Public reporting may include voluntary corporate reporting, sustainability reporting programs, or reporting as part of regulatory compliance.
• Calculate C4 as the mass of sales packaging used for your final products that has demonstrated quantified environmental impact reductions, divided by the total mass sales packaging used for your final products, then multiply by 100. Include sales packaging with demonstrated impact reductions since the inception of the product or since purchase of the brand, if post-inception.
Perform these calculations using data from a 12-month period that ended within 12 months of the date you respond to this question.

THE SUSTAINABILITY CONSORTIUM ® | © 2017 ARIZONA STATE UNIVERSITY AND UNIVERSITY OF ARKANSAS 24
Sustainable Packaging Design
Key Performance Indicator (KPI):What percentage of the sales packaging for your final products, by mass, was recyclable, was formally assessed for material and process efficiency and weight or volume optimization, and for which quantified environmental impact reduction can be demonstrated?
A. Not applicable. We do not use sales packaging for our product.B. We do not consider all of these factors in this category's sales packaging. C. We are able to report the following for the sales packaging used in our
final products: C1. 0% of our packaging was recyclable content.C2. 50 % of our packaging has demonstrated progress on goals for material and process efficiency during packaging manufacturing. C3. 50 % of our packaging has demonstrated progress on goals for weight or volume optimization during packaging design.C4. 50 % of our packaging has a demonstrated quantified environmental impact reduction.
Explanation:None of your packaging contains recyclable content. Your response to C1 = 0%.
You publicly report the progress on your goals for material and process efficiency. Your response to C2 is 1,250 / 2,500 = 50%.
You have demonstrated progress on your goals for weight optimization during packaging design for half of the packaging you produce. Your response to C4 is 50%.
You can also demonstrate quantified environmental impact reduction for half of the packaging you produce, so your response to C3 is 50%.
Solution

THE SUSTAINABILITY CONSORTIUM ® | © 2017 ARIZONA STATE UNIVERSITY AND UNIVERSITY OF ARKANSAS 25
Today’s Agenda
• Recap of “Key Performance Indicators 101” webinar concepts• Introduce the new Respondent Tools• Take poll of KPI scenarios to review• Walk through the selected KPI scenarios and respondent tools• Supplier resources, tools, and upcoming support opportunities

THE SUSTAINABILITY CONSORTIUM ® | © 2017 ARIZONA STATE UNIVERSITY AND UNIVERSITY OF ARKANSAS 26
• TSC General Guidance Document: https://www.sustainabilityconsortium.org/downloads/general-guidance-document/• TSC Respondent Tools: https://www.sustainabilityconsortium.org/what-we-offer/measurement-reporting-system/respondenttools/• TSC Methodology: https://www.sustainabilityconsortium.org/what-we-offer/measurement-reporting-system/methodology/• TSC Sustainability Insights: https://www.sustainabilityconsortium.org/product-sustainability/productfinder/• TSC FAQs: https://www.sustainabilityconsortium.org/about/faq/• SAP Store: https://www.sapstore.com/solutions/99039/TSC-Product-Sustainability-Toolkit-for-SAP-Product-Stewardship-Network• PSN login: https://accounts.sap.com/saml2/idp/sso/accounts.sap.com• Help Desk: [email protected]
• If the Index support team cannot answer your PSN-related question, they will forward your inquiry to PSN Support• If the Index support team cannot answer your TSC Key Performance Indicator-related question, they will forward your inquiry
to TSC Support
Anticipate needing assistance in responding to TSC KPIs or improving your sustainability performance based on your Index results? TSC has trained service providers as a resource for you. Learn More: https://www.sustainabilityconsortium.org/what-we-offer/implementation-services/resources-tools-suppliers/

THE SUSTAINABILITY CONSORTIUM ® | © 2017 ARIZONA STATE UNIVERSITY AND UNIVERSITY OF ARKANSAS 27
TSC is offering an in-person training for suppliers participating in Walmart’s Sustainability Index. The training will give participants an opportunity to go in-depth with responding to complex TSC Key Performance Indicators in terms of data collection and reporting. Additionally, participants will have an opportunity to work one-on-one with TSC staff for 30 minutes to privately address specific questions one may have about their reporting.
Space is limited! Register today: https://www.sustainabilityconsortium.org/events/sustainability-index-supplier-training/

THE SUSTAINABILITY CONSORTIUM ® | © 2017 ARIZONA STATE UNIVERSITY AND UNIVERSITY OF ARKANSAS 28
Coming in November 2017!
Webinar topics are designed around issues TSC has seen retailers indicate as priority, including:
• Deforestation• Energy – Greenhouse Gas Emissions• Packaging• Priority Chemicals• Social Compliance• Sustainable Agriculture
Registration opens in October. Monitor TSC’s Supplier Resources and Tools webpage for more detail!

The Sustainability Consortium® is jointly administered by Arizona State University and University of Arkansas with additional operations at Wageningen UR in the Netherlands and Tianjin, China.
WWW.SUSTAINABILITYCONSORTIUM.ORGFOLLOW US ON TWITTER @TSC_news
Sustainable Products for a Sustainable Planet