10516 001 berkeley ar 2017 aw - berkeley group … key performance indicators financial outlook key...
TRANSCRIPT

2017ANNUAL REPORT

BERKELEY ANNUAL REPORT 2017 STRATEGIC REPORT
02GOVERNANCE
78 Board of Directors
82 Corporate Governance Report
86 Audit Committee Report
88 Nomination Committee Report
89 Directors’ Remuneration Report
108 Directors’ Report
03FINANCIALS
114 Independent Auditors’ Report
120 Consolidated Income Statement
120 Consolidated Statement
of Comprehensive Income
121 Consolidated Statement
of Financial Position
122 Consolidated Statement
of Changes in Equity
123 Consolidated Cash Flow Statement
124 Notes to the Consolidated
Financial Statements
148 Company Balance Sheet
149 Company Statement of Changes
in Equity
150 Notes to the Company
Financial Statements
154 Five Year Summary
155 Financial Diary
155 Registered Office and Advisors
01STRATEGIC REPORT
2 2017 Performance Highlights
6 Chairman’s Statement
8 Chief Executive’s Statement
14 Berkeley’s Strategic Framework
18 Our Vision
42 Berkeley Foundation
46 Our Business Model
56 Where We Operate
59 How We Manage Risk
72 Trading and Financial Review
ABOUT THIS REPORT
Welcome to the 2017 Annual Report of the
Berkeley Group Holdings plc (“the Berkeley
Group”, “Berkeley”, “the Group”), a publicly
owned company, listed on the London Stock
Exchange. The Strategic Report explains
Berkeley’s strategy, business model, risk
management processes and provides an
overview of current performance and outlook.
The Governance section covers the role and
activities of the Board in running the business
and their remuneration. The detailed Financials,
accompanied by a report from the Group’s
auditors, complete the Annual Report.
BERKELEY’S BUSINESS IS ABOUT PLACEMAKING; IT’S ABOUT CREATING STRONG COMMUNITIES WHERE PEOPLE ENJOY A GREAT QUALITY OF LIFE.
Berkeley has a strategic appreciation of the cyclical nature of
the property market and recognises that there are significant
operational risks in identifying, designing, building and selling
homes and creating places.
Berkeley mitigates these risks by focusing on development
in London and the South East of England, markets which
it knows and understands, and forward selling new homes
wherever possible. In doing this, Berkeley maintains a strong
balance sheet, keeps financial risk low and carefully allocates
resources to the right projects at the right time, matching
supply to demand wherever it can.
Inside Front Cover: Dickens Yard, W5 – A stylish combination of heritage buildings, cutting
edge design and public open spaces providing a vibrant new urban quarter for Ealing.
Front cover: The refurbished Chapel at St Joseph’s Gate combining classical Grade II
listed period features with modern, bespoke interior design.
BERKELEY ANNUAL REPORT 2017 STRATEGIC REPORT
1
02
GO
VE
RN
AN
CE
03
FIN
AN
CIA
LS
01 S
TR
AT
EG
IC R
EP
OR
T

FINANCIAL KEY PERFORMANCE INDICATORS FINANCIAL OUTLOOK KEY PERFORMANCE INDICATORS
NON-FINANCIAL KEY PERFORMANCE INDICATORS
2017 PERFORMANCE
HIGHLIGHTS
£812.4
MILLION
467.8 P £2,743
MILLION
41.1% £15.56
2016 £530.9m
2015 £539.7m
2014 £380.0m
2013 £270.7m
2017 £812.4m
2016 295.8p
2017 467.8p
2015 313.0p
2014 221.8p
2013 160.0p
2014 27.5%
2015 35.1%
2013 22.4%
2016 30.8%
2017 41.1%
2014 £2,274m
2015 £2,959m
2013 £1,453m
2016 £3,259m
2017 £2,743m
PROFIT BEFORE TAX BASIC EARNINGS PER SHARE CASH DUE ON FORWARD SALES
70.8 (2016: 71.2)
The six-month rolling Net Promoter
Score is an indicator of the success of
the customer journey and is used across
all industry sectors. Our high levels of
customer satisfaction, as a result of our
continued efforts to provide world-class
customer service, are evidenced through
the Net Promoter Score.
1.83 (2016: 2.40)
Managing health and safety on our sites
is a priority, to protect the wellbeing of
our staff and contractors. This measure
relates the number of reportable injuries
to the number of direct employees across
the Group and the number of contractors
working on our sites.
11.7% (2016: n/a)
Calculated as the percentage of our direct
and indirect workforce that is undertaking
an apprenticeship or vocational training,
this is a measure of the skills development
opportunities that are available across the
business and the contractors working on
our sites.
1.76 (2016: 2.29)
This measure relates our annual
greenhouse gas emissions to the
number of direct employees across
the Group and the number of contractors
working on our sites. This provides
a more meaningful measure than
absolute emissions as it takes changes
in productivity into account.
See page 22
NET PROMOTER SCOREACCIDENT INCIDENT RATE PER 1,000 PEOPLE
APPRENTICES AND TRAINING
GREENHOUSE GAS EMISSIONS INTENSITY
RETURN ON EQUITY NET ASSET VALUE PER SHARE
This is our core measure of profitability,
our absolute return from the sale and
delivery of new homes in the year.
The efficiency of the returns generated
from shareholder equity in the business
is measured by calculating profit before
tax as a percentage of the average of
opening and closing shareholders’ funds.
This balance sheet measure reflects
the value of shareholders’ interests in
the net assets of the business on an
historical cost basis.
£6,378
MILLION
2015 £5,272m
2016 £6,146m
2017 £6,378m
2014 £4,514m
GROSS MARGIN ON LAND HOLDINGS
This provides a measure of expected value
in the Group’s existing land holdings in the
event that the Group successfully sells and
delivers the developments planned for.
This measure of profitability allows for total
profit after tax and takes into account the
weighted average number of shares in issue
during the year. Earnings cover is illustrated
by showing the proportion of earnings per
share paid as dividends per share in the year.
This measures cash due from customers
during the next three financial years under
unconditional contracts for sale, and provides
good visibility over future cash flows.
2014 £10.66
2015 £11.99
2013 £10.09
2016 £13.14
2017 £15.56
ANOTHER YEAR OF EXCELLENT
FINANCIAL AND NON-FINANCIAL
PERFORMANCE WHILST MAINTAINING
A STRONG BALANCE SHEET TO
SUPPORT FUTURE DELIVERY.
See page 40 See page 35 See page 109
BERKELEY ANNUAL REPORT 2017 STRATEGIC REPORTBERKELEY ANNUAL REPORT 2017 STRATEGIC REPORT
2 3
02
GO
VE
RN
AN
CE
03
FIN
AN
CIA
LS
01 S
TR
AT
EG
IC R
EP
OR
T

One Tower Bridge
01 STRATEGIC REPORT
BERKELEY ANNUAL REPORT 2017 STRATEGIC REPORTBERKELEY ANNUAL REPORT 2017 STRATEGIC REPORT
4 5
02
GO
VE
RN
AN
CE
03
FIN
ANN
CIA
CIAA
LS
01 S
TR
AT
EG
IC R
EP
OR
T

CHAIRMAN’S
STATEMENT
£2.3 BNCONTRIBUTED TO THE TREASURY
• Berkeley has contributed a total
of £2.3 billion to the Treasury over
the last five years, through direct
and wider taxation.
• Berkeley contributes to the UK public
finances both through the taxes it
pays directly and the taxes paid by
its suppliers and customers. In 2016,
the total tax paid was £642 million,
an increase of 227% from 2012.
“ BERKELEY HAS BUILT 19,000 NEW HOMES IN THE
LAST FIVE YEARS AND OUR CONTRIBUTION TO
HOUSEBUILDING, JOB CREATION AND THE WIDER
ECONOMY REMAINS STRONG.”
BERKELEY’S CONTRIBUTION TO HOUSEBUILDING, JOB
CREATION AND THE WIDER ECONOMY REMAINS STRONG.
30,000JOBS SUPPORTED
• Berkeley supported through its
business and supply chain a total
of 30,000 jobs in 2016. Berkeley
supports more than five jobs for
every new home built.
• The total number of jobs supported
by Berkeley has more than doubled
over the last five years (up 190%),
compared with a 10% growth in
employment in London and the
South East over the same period.
19,000HOMES BUILT
• Berkeley has built a total of 19,000
homes over the last five years.
£2.6 BNCONTRIBUTION TO ECONOMY
• Berkeley’s contribution to UK GDP
was £2.6 billion in 2016, up 20%
from 2015 and the 8th consecutive
year of growth.
£11.2 MCOMMITTED TO OVER 100 CHARITIES
• £11.2 million has been committed by
the Berkeley Foundation to over 100
charities since 2011.
Proud to be a member of
the Berkeley Group of Companies
Last year, Berkeley made a series of
strategic commitments designed to
create value for our business, for our
shareholders and for society, as part of
a ten year plan for the company. We
have had more than 650 apprentices on
our sites and in our teams over the last
year, a figure that has nearly doubled
in the last 12 months. With an ageing
construction workforce, a substantial
amount of which in London comes from
Europe, introducing the next generation
to the sector is a top priority for our
industry, working in partnership with
Government and Further Education
colleges. Our Net Promoter Score, which
measures customer service, is in the
top quartile, sitting alongside the UK’s
leading retail brands. Our safety record
is the best in our history and people’s
life satisfaction on estates like Kidbrooke
Village, which ten years ago were beset
by crime and inequality, is now more than
20% higher than the UK average, thanks
to the regeneration led by Berkeley in
partnership with the local authority.
At the half year, Berkeley introduced
flexibility to the delivery of its Shareholder
Returns Programme so that future returns
could be made from either dividends
or share buy-backs. Since then we paid
the £1 per share announced in December
on schedule in March, equating to
£138.8 million; £117.7 million as dividend
and £21.1 million through share buy-backs.
In February, we announced that the next
£138.8 million (£1 per share) will be returned
by 30 September 2017, again through a
mix of dividends and share buy-backs. To
date, £23.2 million of share buy-backs have
been made against this commitment.
In closing, Berkeley has delivered
another strong performance in a fast-
changing environment. We have a deep
understanding of our market and real
clarity about the fundamental hallmarks
of our business: quality, community and
a long-term focus on value creation. This
is possible because of the hard work and
expertise of our people to whom I am ever
grateful for their outstanding contribution
to this business. It is greatly appreciated.
I would also like to thank Greg Fry, who
retired from the Board on 31 December
2016, for his loyal service to Berkeley and
St George over some 30 years and I wish
him every happiness in the future.
Tony Pidgley CBEChairman
Data for five years to 30 April 2016, unless
otherwise stated.
Berkeley’s unique operating model is
focused on developing complex sites,
which others are not willing or able to
take on, creating fantastic, sustainable
places with homes built to a high quality
in which our customers want to live
and with which planning authorities are
proud to be associated. This is what
differentiates Berkeley. The additional
operational risk associated with this model
requires Berkeley to maintain its financial
strength at all stages in the cycle and this
is reflected in today’s strong results and
financial position.
The housing market has stabilised in
London and the South East but, while
Berkeley is in excellent shape with further
additions to our unrivalled land bank in the
period, it is an inescapable fact that we
are facing a number of headwinds and a
period of prolonged uncertainty. Brexit and
wider global macro instability impact both
confidence and sentiment and will result in
constrained investment levels.
At the same time, the headwinds from
changes in recent years to SDLT and
mortgage interest deductibility, coupled
with the planning environment’s increasing
demands from the combination of
Affordable Housing, CIL, Section 106
obligations and review mechanisms, are
resulting in reduced levels of new housing
starts in London.
For Berkeley, this leads to greater
uncertainty around the timing of delivery
of homes from our land bank but will
not change our absolute focus on the
quality of the homes and places we
create. Notwithstanding the uncertainty,
Berkeley’s strong forward sales position
and land bank provide sufficient
visibility to reiterate its previous guidance
of delivering at least £3.0 billion of
pre-tax profit in the five years beginning
1 May 2016, assuming prevailing market
conditions persist.
Berkeley has built 19,000 new homes in
the last five years and our contribution to
housebuilding, job creation and the wider
economy remains strong. In London this
year, we have again built 10% of all new
homes, including 10% of new Affordable
Housing, and our contributions to
Affordable Housing and wider community
and infrastructure benefits exceeded
£0.5 billion. Over the five previous years
to 30 April 2016, Berkeley has contributed
a total of £2.3 billion to the Treasury
through direct and wider taxation and we
currently support 13,000 jobs across our
business. Meanwhile, since its inception
in 2011, the Berkeley Foundation has
committed £11.2 million to more than 100
charities, of which over £3 million has
been raised by Berkeley’s staff.
£0.5 BN AFFORDABLE HOUSING AND WIDER CONTRIBUTIONS
• Berkeley has contributed in excess
of £0.5 billion in Affordable Housing
subsidies and wider community and
infrastructure benefits in the year.
BERKELEY ANNUAL REPORT 2017 STRATEGIC REPORTBERKELEY ANNUAL REPORT 2017 STRATEGIC REPORT
6
02
GO
VE
RN
AN
CE
03
FIN
AN
CIA
LS
01 S
TR
AT
EG
IC R
EP
OR
T
7
CHIEF EXECUTIVE’S
STATEMENT
SUMMARY OF PERFORMANCE
Berkeley has delivered pre-tax earnings
of £812.4 million for the year, an increase
of 53.0% on last year. This is from the
sale of 3,905 homes (2016: 3,776) at
an average selling price of £675,000
(2016: £515,000), reflecting the mix
of properties sold in the year.
This result, taken together with the
£530.9 million delivered last year, means
Berkeley has now delivered £1.3 billion
of the £2.0 billion pre-tax earnings target
for the three financial years ending
30 April 2018 that it set in June 2015.
Berkeley has good visibility of the
forthcoming financial year and beyond,
with total cash due on forward sales
over the next three years of £2.74 billion.
Berkeley also reiterates its earnings
guidance for the five years ending
30 April 2021 of at least £3.0 billion of
pre-tax earnings, anticipating earnings for
2017/18 of at least the level of 2016/17.
The housing market in London stabilised
in the second half of the year, following
the disruption either side of the EU
Referendum, and reservations for the
2017 calendar year have recovered to 2015
levels. Notwithstanding this, uncertainty
over Brexit remains and this, coupled with
the impact of high SDLT and multiple
demands from the planning system in
London, mean that supply in our capital
will remain constrained and not reach the
levels required.
We have acquired sixteen new sites in
the year, of which nine are on a conditional
basis, totalling some 7,200 plots. We have
also secured ten new planning consents
and in excess of 30 revised consents.
This activity has seen our land holdings
rise to 46,351 plots with an estimated
future gross margin of £6.4 billion, up
from 42,858 plots and £6.1 billion a year
ago. Since the year-end we have acquired
our first site in St Joseph, in Birmingham’s
Gun Quarter, where we plan to develop
some 400 new homes.
£2.7BN CASH DUE ON FORWARD SALES
£6.4BN GROSS MARGIN ON LAND HOLDINGS
£285.5M NET CASH
“ WE HAVE ACQUIRED
SIXTEEN NEW SITES IN
THE YEAR, OF WHICH NINE
ARE ON A CONDITIONAL
BASIS, TOTALLING SOME
7,200 PLOTS.”
Shareholder Return Return Mechanism
Per share Value Dividends Buy-backs
To 30 September 2016 £6.34 £854.9m £854.9m –
To March 2017 £1.00 £138.8m £117.7m £21.1m
By September 2017 £1.00 £138.8m * £23.3m*
Returns – announced £8.34 £1,132.5m £972.6m £44.4m
By 30 September 2018 £2.00 £277.7m
By 30 September 2019 £2.00 £277.7m
By 30 September 2020 £2.00 £277.7m
By 30 September 2021 £2.00 £277.7m
Returns – to come £8.00 £1,110.8M
Total returns £16.34 £2,243.3m
* As of 20 June 2017. The amount to be paid as a dividend in September 2017 will depend upon the
extent of any further share buy-backs prior to the announcement of the dividend in August 2017.
STRATEGIC DELIVERY
As reported in December 2016, during
the first half of the year the Board of
Berkeley reviewed the mechanism
for making the £10.00 per share of
shareholder returns, remaining to be paid
at that time, in light of its assessment
that the short-term macro volatility
was preventing the long-term value of
Berkeley being recognised by the market.
The payments were re-characterised as
an absolute value per annum and are
now to be made through a combination
of share buy-backs and dividends, rather
than solely dividends. The absolute value
will be increased appropriately for any
new shares issued.
Since the interim results announcement
on 2 December 2016, Berkeley has spent
£44.4 million on share buy-backs across
1.53m shares, at an average cost of
£28.96 per share (range: £28.08 - £30.97
per share). When combined with dividend
payments of £117.7 million in March,
£21.1 million of this was part of the
£138.8 million announced in December
2016 to be returned by 31 March 2017.
The remaining £23.3 million will contribute
to the £138.8 million returns to be made
by 30 September 2017, as announced
on 23 February 2017. The amount to be
paid as a dividend will be announced
on 17 August 2017 and payable on
15 September 2017 to shareholders on
the register on 25 August 2017, taking
account of any further share buy-backs
made in the intervening period.
Given the change to the Shareholder
Returns Programme there were
consequential amendments made to
the rules of the 2011 LTIP and Berkeley
also sought to introduce annual caps for
Executive remuneration within the context
of a new Remuneration Policy, both of
which were approved by shareholders
at the Company’s Extraordinary General
Meeting held on 23 February 2017. The
new Remuneration Policy was approved
by 97%, and the changes to the 2011 LTIP
by 93%, of shareholders who voted.
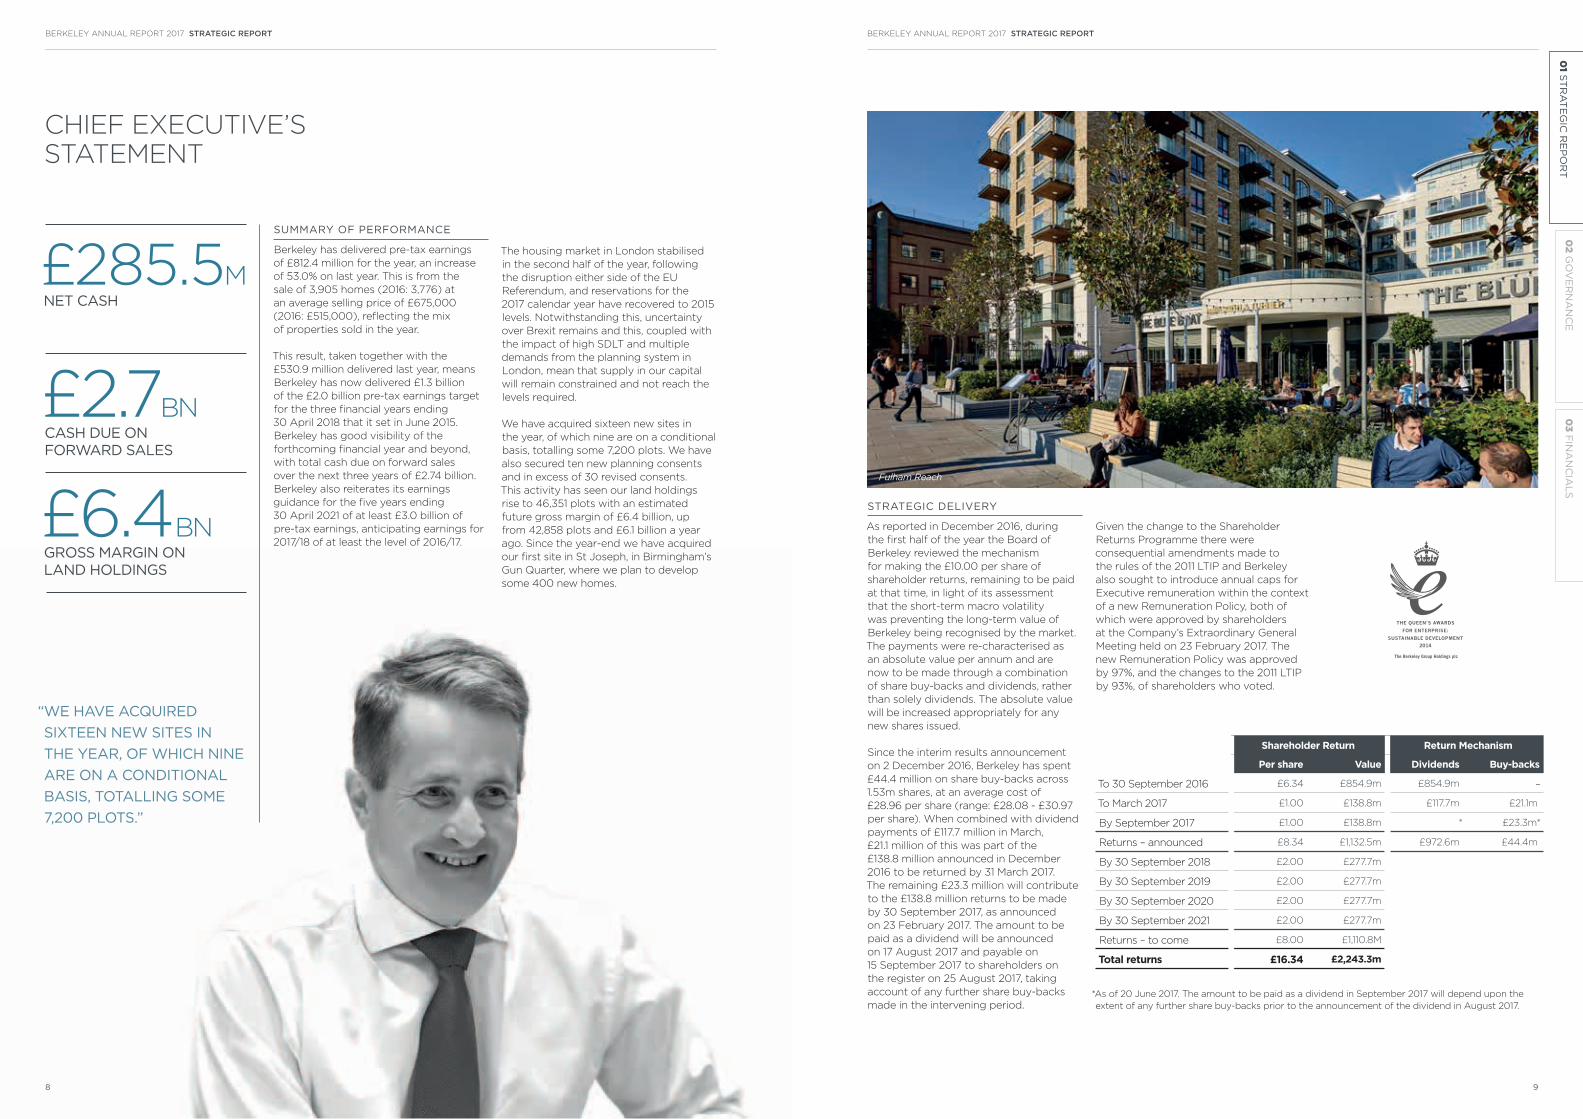
Fulham Reach
BERKELEY ANNUAL REPORT 2017 STRATEGIC REPORTBERKELEY ANNUAL REPORT 2017 STRATEGIC REPORT
8 9
02
GO
VE
RN
AN
CE
03
FIN
AN
CIA
LS
01 S
TR
AT
EG
IC R
EP
OR
T

CHIEF EXECUTIVE’S
STATEMENT
HOUSING MARKET
The housing market in London and the
South East has stabilised in the second
half of the year, following the significant
market dislocation around the EU
Referendum last summer. Taking the
year as a whole, including the period
around the EU Referendum, the value
of reservations is 25% lower than in
2015/16, but this decline has now fully
reversed with the return to more stable
market conditions in which reservation
cancellation rates are at normal levels.
While these conditions are adequate to
meet our profit guidance, they do not
support the much needed growth in
housing delivery in London and we have
seen the number of new starts fall by
some 30% across the Capital, according
to latest figures released by the NHBC
and Molior. This is a result of both demand
and supply side pressures. The high
levels of property taxation, reduction
in mortgage cost deductibility and the
uncertainty that Brexit creates combine
to dampen sentiment and demand.
While the planning environment, with
increased demands from a combination
of Affordable Housing, CIL, Section 106
obligations and review mechanisms, acts
as a restriction on supply.
We continue to see distortions in the
market from these policy measures with
UK investors most acutely affected by
the taxation changes, offset by overseas
customers seeing relative value in the
London market. The new build market
is a small proportion of the overall
housing market but drives the delivery of
additional housing stock and, importantly,
new affordable
homes. The capital
intensive nature
of regenerating
the complex sites
that remain to be
developed in London
requires the certainty
of cash flow and
de-risking that forward sales to investors
generate. It is therefore important that
London remains the open, diverse and
aspirational global city that contributes
so strongly to the UK’s prosperity.
Berkeley began the year with a record
£3.25 billion of cash due on forward sales
and has performed well in the current
trading environment to sustain forward
sales above £2.74 billion in a year of
record revenue delivery. This has been
assisted by launches at West End Gate in
Paddington and The Dumont on Albert
Embankment as well as new phases on our
regeneration schemes and development
outside the Capital in the South East.
Prices remain at or above business plan
levels. Sales continue to be split broadly
evenly between owner occupiers and
investors and include just 157 Help to Buy
reservations (2016: 96).
Build costs have
increased at a similar
rate to last year,
around 6%, with
currency movements
impacting materials
pricing. There
is a recognised skills gap in the UK
construction workforce and it is hard to
predict how build costs will be affected by
Brexit as approximately half of London’s
site labour comes from the EU. This
needs to be addressed by a combination
of continued access to EU labour, skills
training and innovation in construction if
the industry is to achieve its medium-term
production aspirations.
OUR VISION
Berkeley aspires to be a modern world-
class business. Through the framework
of “Our Vision”, we articulate our strategy
across our five areas of strategic focus:
Customers; Homes; Places; Operations
and Our People.
CUSTOMERS
Berkeley seeks to provide exceptional
service to all of our customers, placing
them at the heart of our decisions. Our
performance is independently assessed
using the Net Promoter Score (NPS)
and we compare our results with other
well-known brands using the Institute
of Customer Service’s UK Customer
Satisfaction Index (UK CSI) results. In
March 2017 our six month rolling average
NPS was 70.8 on a scale of -100 to +100
(2016: 71.2), which places Berkeley in the
top quartile for all retail brands across
all sectors. 98% of our customers would
recommend Berkeley to a friend.
We continually engage with our
customers to find out what matters most
to them. At all stages of the customer
experience, the emphasis for our teams
is to put the customer first and they are
empowered to treat each customer as an
individual. We run Sales and Customer
Service Academies which bring talented
individuals from other industries to
Berkeley and ensure the highest
standards are set and maintained.
HOMES
Over the past five years we have
delivered some 19,000 homes, each one
with a focus on individual design and
quality. Three of our developments were
recently category winners within the
London Evening Standard New Homes
Awards and we were proud to win overall
Best Large Housebuilder as well as
development-specific accolades in the
WhatHouse? Awards 2016.
Our current focus within Our Vision is on
developing more resilient, future-proof
homes. We are the first developer to
respond to the industry-wide issue of
overheating by using a risk assessment
methodology on all sites. Our aim is
to build homes where people can live
comfortably in the future with expected
changes in climate. We are also future-
proofing our homes for increasingly
connected lifestyles.
“ THE HOUSING MARKET IN
LONDON AND THE SOUTH
EAST HAS STABILISED IN
THE SECOND HALF OF
THE YEAR.”
“ OVER THE PAST FIVE YEARS WE HAVE DELIVERED
SOME 19,000 HOMES, EACH ONE WITH A FOCUS
ON INDIVIDUAL DESIGN AND QUALITY.”
We now have minimum fibre broadband
infrastructure and wiring standards
which will enable customers to ‘plug in’
emerging technologies according to their
wishes and as and when they become
available. This would not be possible
without working in close collaboration
with Openreach and we were delighted
to be awarded the Openreach Property
Developers Award 2017 for Innovation –
Most Supportive Trialist. During 2018 we
will continue to research applicable smart
technologies, from appliances to security
systems and heating and lighting controls.
This year we have successfully used
off-site construction to deliver the Urban
House concept at Kidbrooke Village,
reducing site complexity and time of
build in addition to having positive
environmental impacts.
Vista, Battersea
Woodberry Down, Finsbury Park
BERKELEY ANNUAL REPORT 2017 STRATEGIC REPORTBERKELEY ANNUAL REPORT 2017 STRATEGIC REPORT
10 11
02
GO
VE
RN
AN
CE
03
FIN
AN
CIA
LS
01 S
TR
AT
EG
IC R
EP
OR
T

CHIEF EXECUTIVE’S
STATEMENT
PLACES
We aim to create great places where
residents enjoy a good quality of life, now
and in the future including, on many of
our larger sites, a variety of retail and
other commercial uses. We continue to
use our toolkit, Creating Successful Places,
as a framework for applying the ideas of
social sustainability to a new development.
Community plans are now in place at
12 of our developments to provide a
structured approach to help communities
to thrive for the long-term. This supports
the ongoing delivery of new community
facilities, including three schools which
opened in September 2016. Many of
our developments also host short-term
community events during construction,
such as a pop-up park and exhibition at
London Dock.
Our long-standing commitment to
environmental sustainability has also been
reinforced by becoming the first developer
to commit to achieving a net biodiversity
gain on every new site. Put simply, this
means there will be more nature when
we finish on site than when we begin. We
believe that landscaping can be beautiful
whilst providing amenity value and
enhancing biodiversity.
.
OPERATIONS
In April 2017 we had more than 13,000
people working on around 58 live
construction sites across London and the
South East of England. With such levels of
activity, it is critical that we undertake the
build process with consideration of the
workforce, the communities in which we
operate and the environment. Testament
to this is that almost half of our sites won a
Considerate Constructors Scheme Award
this year, compared to just 10% nationally.
We recognise the role business must play
in tackling global climate change and
are delighted to be the first housebuilder
to commit to becoming carbon positive.
As part of this, we are targeting a 10%
reduction in 2018 emissions compared
to 2016 levels and are adopting cleaner
energy sources.
There needs to be a joined-up approach
to tackling the industry’s skills crisis and
prestige problem. We are now a client
member of Build UK, which we see as
playing a vital role in reversing the current
trend of more people leaving the industry
than joining it. Through working closely
with our contractors, we have significantly
increased the amount of training within our
workforce; in 2017 more than 1,650 people
were in formal training. Of these, over
650 were apprentices, with the remainder
undertaking vocational training. We were
pleased to be able to recognise some of
the great work which is being achieved
in this area at the inaugural Berkeley
Apprenticeship Awards in autumn 2016.
OUR PEOPLE
Berkeley’s talented and varied people
are our strongest resource. Through
Our Vision, there has been a focus
in 2017 on providing a healthy and
supportive working environment for all
of our employees. Our commitment to
providing healthy workplaces has led to
the launch of a number of new initiatives
across the business and resulted in
Berkeley St Edward being recognised
as a ‘most improved workplace’ within
Vitality’s Britain’s Healthiest Workplace
Awards in 2016. Each of our divisions also
run personal development and talent
management programmes.
Safety is of critical importance to the
company and we are honoured to
have been awarded the Sir George
Earle Trophy in one of our divisions, an
international award from RoSPA for
premier performance in occupational
health and safety; the first time this
prestigious award has been won by a
housebuilder. Over the last ten years
“ IN APRIL 2017 WE HAD MORE THAN 13,000 PEOPLE
WORKING ON AROUND 58 LIVE CONSTRUCTION SITES
ACROSS LONDON AND THE SOUTH EAST OF ENGLAND.”
we have worked extremely hard to
ensure that all our contractors, suppliers
and partners share our commitment
to promoting safe and healthy work
practices. As a result, we have seen a
year-on-year reduction in the number of
incidents. In 2017 our Accident Incident
Rate was 1.83 (2016: 2.4), less than half
the industry average and meaning there
were fewer than two incidents during the
year for every 1,000 people working on
our construction sites.
We continue to support the charitable
work of the Berkeley Foundation, which
we see as integral to being a modern
world-class business, and are thankful
for the dedication and enthusiasm of our
staff who, once again, have raised large
amounts of money and given their time
to support such valuable causes. We are
delighted that the Foundation’s work
has been recognised at the 2017 Third
Sector’s Business Charity Awards, where
it received the Corporate Foundation
Award for the year.
OUTLOOK
Providing an outlook statement today is
by nature challenging, given the level of
prevailing macro uncertainty, but Berkeley
is in great shape. We have added to our
unrivalled land bank in the year. We have
net cash of £285.5 million and our forward
sales of £2.74 billion give good visibility
of profitability and cash flow as we begin
a new financial year. The housing market
in London and the South East remains
under-supplied with low interest rates,
good mortgage availability and robust
underlying demand. Taken together, this
enables Berkeley to reiterate its guidance
of delivering at least £3.0 billion of pre-
tax profit over the five years to 2021,
assuming the return to normal market
conditions continues.
A thriving housing market is underpinned
by confidence and sentiment. In a cyclical
sector this is always finely balanced, more
so in times of uncertainty and heightened
macro risk, and this needs to be
recognised and reflected in the planning
and taxation environments. Otherwise,
looking to the long-term, this could
impact the size of Berkeley’s business
and the speed with which we deliver the
homes and value in the land bank. For
London, the effect could be profound and
we are already seeing a reduction in new
starts at a time when production needs to,
and should, increase.
The combination of Brexit, global
economic and political instability,
increasing planning requirements
and the recent increases in property
taxation serves to increase the risk
profile for developers and this needs to
be recognised if the housing challenge
in London and the South East is to
be addressed. We need conditions for
growth that reduce barriers to entry and
encourage accelerated development from
existing market participants to support
increased delivery across all tenures.
Rob PerrinsChief Executive
Fitzroy Gate, Old Isleworth Chelsea Creek
BERKELEY ANNUAL REPORT 2017 STRATEGIC REPORTBERKELEY ANNUAL REPORT 2017 STRATEGIC REPORT
12 13
02
GO
VE
RN
AN
CE
03
FIN
AN
CIA
LS
01 S
TR
AT
EG
IC R
EP
OR
T
OUR ASPIRATION OUR STRATEGY
TO BE A MODERN, WORLD-CLASS BUSINESS GENERATING LONG-TERM VALUE BY CREATING SUCCESSFUL, SUSTAINABLE PLACES WHERE PEOPLE ASPIRE TO LIVE
TO ENSURE WE REMAIN FIRMLY FOCUSED ON ACHIEVING OUR ASPIRATION, OUR STRATEGIC PLAN IS ARTICULATED THROUGH THE FRAMEWORK OF OUR VISION.
For Berkeley to generate long-term value, the skills, commitment
and approach of our people throughout the business are critical.
We need to ensure we create the right environment to enable
them to work towards a common set of goals.
The framework of Our Vision helps to empower our people,
gives them clear direction across every discipline of the
business and enables them to contribute to the ongoing
success of the business.
STRATEGIC FOCUS AREAS
CUSTOMERS
HOMES
PLACES
OPERATIONS
OUR PEOPLE
Our Vision sets out our underlying core company values,
together with five key strategic focus areas. Every two years
we set targeted, challenging headline commitments to meet
in each of the five focus areas, alongside our everyday actions.
This enables us to continually improve our business activities,
as well as respond to global and industry trends and any
stakeholder concerns.
Our commitments identify aspects of our business that we focus
on to ensure Berkeley remains a market leader across all areas of
its operations and is challenged further to be a modern world-
class business. Achieving these commitments contributes to
generating long-term value.
See page 20
OUR RISK MANAGEMENT
See page 59
OUR ONGOING OPERATIONAL AND MARKET RISK MANAGEMENT UNDERPINS OUR BUSINESS MODEL.
Identifying the risks that a business is exposed to is paramount
to its success. However, understanding and setting the
appropriate level of appetite for risk is even more critical.
OPERATIONAL RISKS
Berkeley recognises that our value added approach means
we have an emphasis towards long-term regeneration, which
presents a complex array of operational challenges on each
of our sites.
Consequently, risk management is embedded throughout the
business and our autonomous, talented operational teams
are required to carefully manage each individual scheme,
regardless of size, to a bespoke design, and embrace Berkeley’s
core values and qualities in their approach.
MARKET RISK
Berkeley has always, and continues to, recognise that the
property market is inherently cyclical, where market sentiment
and transaction levels can change quickly.
Consequently, we operate in London and the South of England,
markets that we know and understand. We believe that
recognising the importance of relationships and applying local
knowledge gives us a competitive advantage and enables us
to deliver new places which are socially, environmentally and
economically successful.
Furthermore, Berkeley keeps financial risk low, by maintaining
a strong balance sheet, forward selling new homes where
possible and carefully allocating resources to the right projects.
This ensures that the business is always well placed, with
the financial flexibility to take advantage of a breadth of
opportunities as they arise.
OUR BUSINESS MODEL
See page 46
OUR BUSINESS IS ABOUT PLACEMAKING; IT’S ABOUT CREATING BESPOKE, HIGH QUALITY DEVELOPMENTS AND STRONG, THRIVING COMMUNITIES.
Our business model is delivered through a structure of
autonomously managed operating companies, each
underpinned by a common focus on quality and attention
to detail, strong commitment to health and safety, the
environment and customer service, and ultimately having a
positive impact in the communities within which we operate.
PRINCIPAL BUSINESS ACTIVITIES
IDENTIFYING AND ACQUIRING LAND
DESIGNING AND PLANNING NEW HOMES AND PLACES
BUILDING NEW HOMES AND PLACES
MARKETING AND CUSTOMER SERVICE
PLACEKEEPING AND STEWARDSHIP
Through undertaking our activities in a responsible way
and with a long-term focus, we aim to deliver value for all
our stakeholders, including our partners, customers, local
communities, shareholders and our people.
We aim to continue to enhance our reputation as a trusted
developer which delivers on our commitments and to ensure
that our developments remain great places in which to live for
decades to come.
BERKELEY’S STRATEGIC
FRAMEWORK
BERKELEY ANNUAL REPORT 2017 STRATEGIC REPORTBERKELEY ANNUAL REPORT 2017 STRATEGIC REPORT
14 15
02
GO
VE
RN
AN
CE
03
FIN
AN
CIA
LS
01 S
TR
AT
EG
IC R
EP
OR
T

HOUSEBUILDING IS NOT JUST ABOUT PROVIDING PEOPLE WITH SHELTER. IT’S ABOUT CREATING FANTASTIC PLACES THAT TRANSFORM PEOPLE’S QUALITY OF LIFE.
Holborough Lakes, Kent
BERKELEY ANNUAL REPORT 2017 STRATEGIC REPORTBERKELEY ANNUAL REPORT 2017 STRATEGIC REPORT
16 17
02
GO
VE
RN
AN
CE
03
FIN
AN
CIA
LS
01 S
TR
AT
EG
IC R
EP
OR
T
EMBEDDING COMMITMENTS INTO OUR BUSINESS
HEADLINE COMMITMENTS
New commitments launched every
two years to ensure Berkeley continues
to aspire to be a leading and
world-class business
LEADING COMMITMENTS
Existing commitments that were previously
headline commitments and are still
considered leading, either within the
industry or across wider business sectors
BUSINESS-AS-USUAL COMMITMENTS
Commitments that are no longer considered
leading but that continue to push the
company to ensure it is consistently a top
performer within the industry or across
wider business sectors
NORMAL PRACTICE
Actions that are fully integrated as part
of business activities and that do not
necessarily set Berkeley apart from
others within the industry or across wider
business sectors
Our Vision provides clear direction and
enables the whole business to work to a
common set of goals, the overarching aim
of which is to be a modern, world-class
business. Five areas of strategic focus
are set out under Our Vision: Customers;
Homes; Places; Operations; and Our
People. To drive improvements in
performance, we continually review and
develop our strategy across our five focus
areas to address the key challenges and
opportunities facing Berkeley, our industry
and other business sectors.
Every two years we launch new headline
commitments identifying our next set of
priority actions. These are determined
through an in-depth review of key
industry, national and global issues,
together with consultation with each
of our autonomous companies and
specialist committees.
OUR VISION
Learn more about Our Vision at www.berkeleygroup.co.uk/our-vision
BERKELEY ASPIRES TO BE A MODERN, WORLD-CLASS BUSINESS. THROUGH THE FRAMEWORK OF OUR VISION WE ARTICULATE OUR STRATEGY ACROSS OUR FIVE AREAS OF STRATEGIC FOCUS: CUSTOMERS; HOMES; PLACES; OPERATIONS; AND OUR PEOPLE.
Some themes continue to feature
prominently within our headline
commitments as they require continual
work to drive incremental performance
improvements; in these instances, our
commitments evolve to challenge us
further to be a world-class business.
Previous headline commitments are
embedded into our ongoing processes
and activities as leading and business-
as-usual commitments. Commitments
apply across all our brands: Berkeley;
St George; St James; St Edward;
St William; and St Joseph.
Underpinning Our Vision is a core set of
company values: having integrity; being
passionate about what we do; showing
respect for people; thinking creatively;
and achieving excellence through detail.
WE CONTINUALLY REVIEW AND DEVELOP OUR
STRATEGY TO ADDRESS THE KEY CHALLENGES
AND OPPORTUNITIES FACING BERKELEY, OUR
INDUSTRY AND OTHER BUSINESS SECTORS.
Provide exceptional service to all of our customers
and put them at the heart of our decisions.
Develop individually designed, high quality homes
with low environmental impact.
Create great places where residents enjoy a good
quality of life, now and in the future.
Make the right long-term decisions whilst running the
business efficiently and working with our supply chain.
Develop a highly skilled workforce who run autonomous businesses, operate in a safe and supportive
working environment and contribute to wider society.
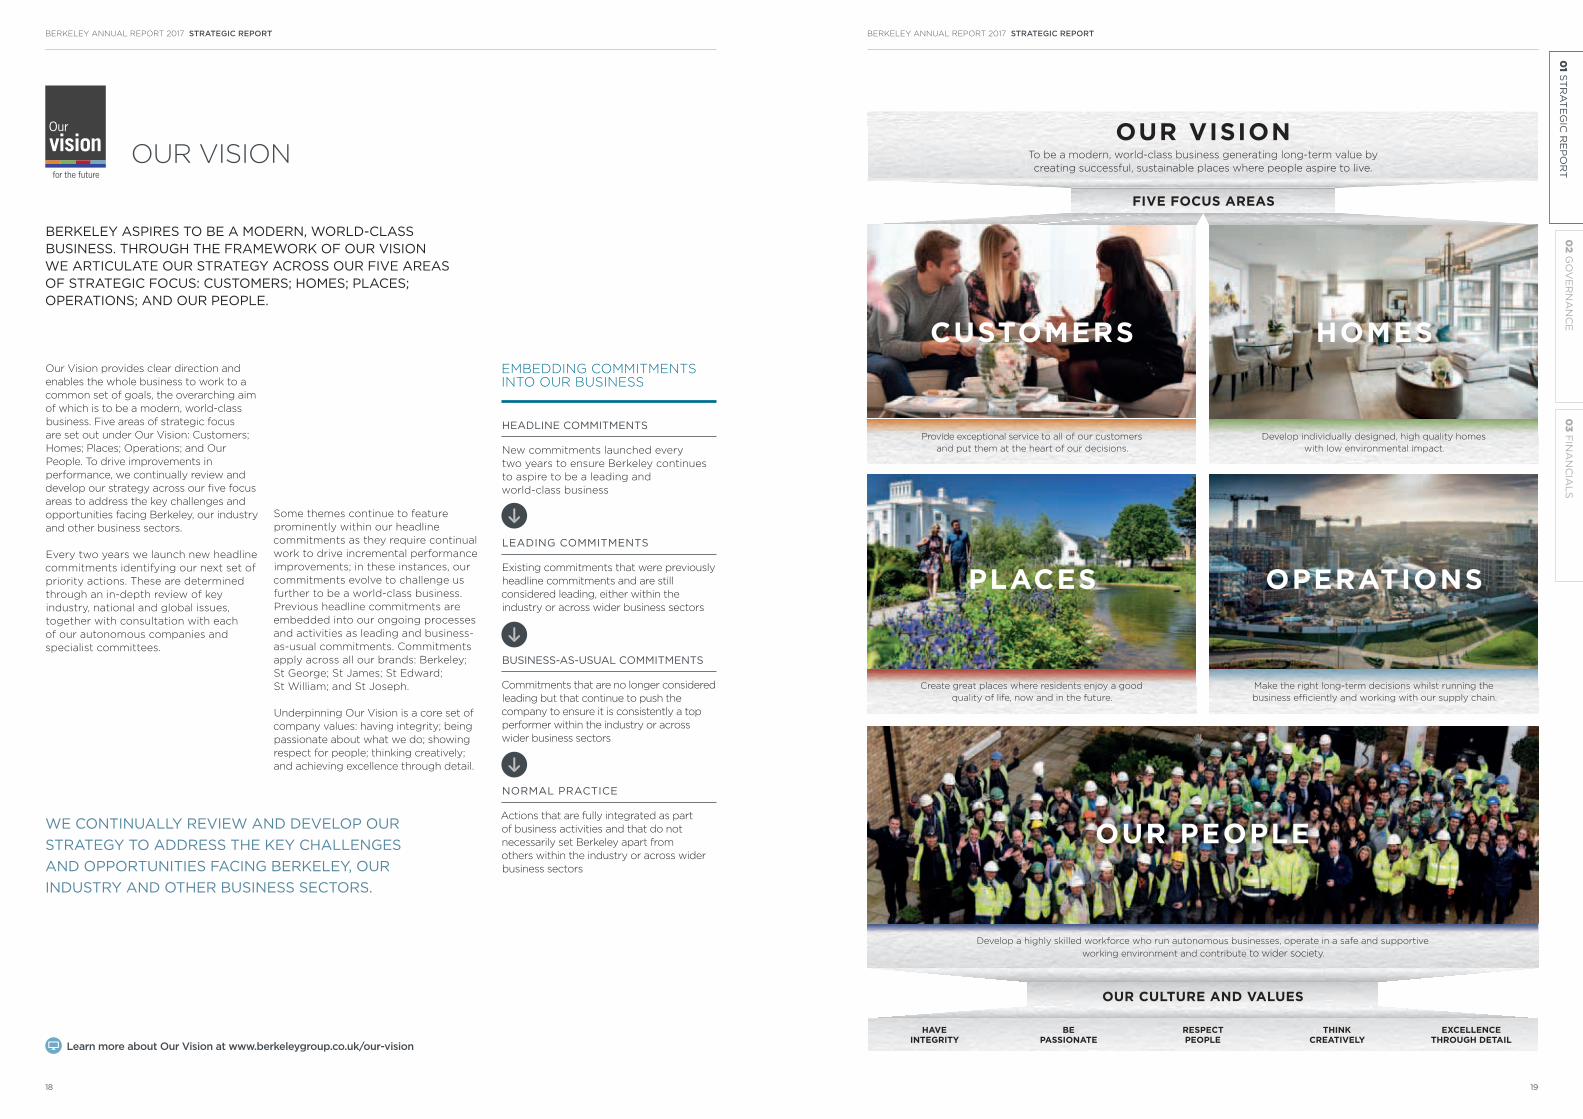
OUR CULTURE AND VALUES
HAVE INTEGRITY
BE PASSIONATE
RESPECT PEOPLE
THINK CREATIVELY
EXCELLENCE THROUGH DETAIL
FIVE FOCUS AREAS
OUR VISIONTo be a modern, world-class business generating long-term value by
creating successful, sustainable places where people aspire to live.
OUR PEOPLE
PLACES
CUSTOMERS
OPERATIONS
HOMES
BERKELEY ANNUAL REPORT 2017 STRATEGIC REPORTBERKELEY ANNUAL REPORT 2017 STRATEGIC REPORT
18 19
02
GO
VE
RN
AN
CE
03
FIN
AN
CIA
LS
01 S
TR
AT
EG
IC R
EP
OR
T

THROUGH THE DETAILED REVIEW OF EMERGING OPPORTUNITIES AND CHALLENGES ON A TWO-YEAR CYCLE, BERKELEY IS ABLE TO EVALUATE AND PROGRESS THE ACTIONS UNDER OUR FOCUS AREAS TO ENSURE OUR COMMITMENTS CONTINUE TO BE RELEVANT, LEADING AND WORLD-CLASS.
OUR VISION APPROACH
AND COMMITMENTS
PLACESHOMES OPERATIONS OUR PEOPLECUSTOMERS
PROVIDING EXCEPTIONAL SERVICE TO ALL OF OUR CUSTOMERS AND PUTTING THEM AT THE HEART OF OUR DECISIONS.
Our approach in this area has evolved
from ensuring that customer-facing teams
provide exceptional service, to a strong
emphasis on all employees placing the
customer at the heart of every decision.
The expectations of our customers are
continually changing. Whilst continuing
to provide world-class customer service,
through another headline commitment
we aim to enhance our engagement with
customers and obtain a more in-depth
insight into their needs.
2016-2018 HEADLINE COMMITMENTS:
Deliver world-class customer
service as evidenced by a top
quartile Net Promoter Score
compared to UK Customer
Satisfaction Index results
Run a programme of engagement
and research to further enhance
our product and processes based
on the needs of our customers
DEVELOPING INDIVIDUALLY DESIGNED, HIGH QUALITY HOMES WITH LOW ENVIRONMENTAL IMPACT.
Our approach in this area has evolved
from a focus on developing homes with
low environmental impact to creating
more resilient, future-proof homes.
Our longstanding commitment to the
environment is reinforced through our
focus on building homes where people
can live comfortably in the future with
expected changes in climate. We are
also aware of rapid changes in
technology so it is vital that we keep
up-to-date with emerging technology
and provide the necessary infrastructure
within our homes.
2016-2018 HEADLINE COMMITMENTS:
Design our homes to consider
future climate change to ensure
continued thermal comfort
Understand the evolution of smart
technology and connectivity in
homes and on developments
CREATING GREAT PLACES WHERE RESIDENTS ENJOY A GOOD QUALITY OF LIFE, NOW AND IN THE FUTURE.
Our approach in this area has evolved
from a longstanding focus on placemaking
to understanding how to create a place
that endures over time.
We now have a greater appreciation of
how important it is to consider quality
of life right from the outset and our new
commitment to creating community plans
provides a structured approach to help
communities to thrive for the long-term,
where people are happy and self-reliant.
We have also become the first developer
to set a commitment to improving
biodiversity on every site.
2016-2018 HEADLINE COMMITMENTS:
Implement community plans on
our developments to facilitate
thriving communities
Develop and apply an approach to
ensure that all new developments
create a net biodiversity gain
MAKING THE RIGHT LONG-TERM DECISIONS WHILST RUNNING THE BUSINESS EFFICIENTLY AND WORKING WITH OUR SUPPLY CHAIN.
Our approach in this area has evolved
from established financial success to
ensuring that, at the same time, we make
a positive contribution to both society and
the environment.
We undertake our construction activities
with consideration of the workforce, the
communities in which we operate and
the environment. We believe that all
companies should take action to reduce
their impact on climate change and are
delighted to be the first housebuilder to
commit to becoming carbon positive. We
are also focused on how we can help to
ease the industry skills crisis.
2016-2018 HEADLINE COMMITMENTS:
Reduce our operational carbon
emissions intensity by 10% and
introduce a programme to become
carbon positive
Ensure at least 1,500 people across
our direct and indirect workforce
undertake an apprenticeship or
vocational training
DEVELOPING A HIGHLY SKILLED WORKFORCE WHO RUN AUTONOMOUS BUSINESSES, OPERATE IN A SAFE AND SUPPORTIVE WORKING ENVIRONMENT AND CONTRIBUTE TO WIDER SOCIETY.
Our approach in this area has evolved
from ensuring safe working environments
to also promoting health and wellbeing
and enhancing talent management across
the business. We continue to support the
charitable work of the Berkeley Foundation.
Attracting, developing and retaining
talent is imperative to our business. It is
therefore vital that we provide the right
opportunities within the business to
enable people to grow and flourish. At the
same time, we want to provide the right
working environments to enhance staff
health and wellbeing.
2016-2018 HEADLINE COMMITMENTS:
Launch and implement a new
programme to promote the
wellbeing of our staff and create
healthy workplaces
Invest in training and development
through our talent management
programmes to realise the potential
of our people across all areas of
the business
The regular review of our approach
enables new priority themes to be
incorporated within our headline
commitments and ultimately our normal
business activity.
In May 2016, we launched a new set of ten
stretching commitments to achieve by
April 2018. Progress updates for each of
our 2016-2018 headline commitments are
provided on pages 22 to 41.
COMMITMENT
PROGRESS
COMMITMENT
PROGRESS
COMMITMENT
PROGRESS
COMMITMENT
PROGRESS
COMMITMENT
PROGRESS
See page 38See page 34See page 30See page 26See page 22
BERKELEY ANNUAL REPORT 2017 STRATEGIC REPORTBERKELEY ANNUAL REPORT 2017 STRATEGIC REPORT
20 21
02
GO
VE
RN
AN
CE
03
FIN
AN
CIA
LS
01 S
TR
AT
EG
IC R
EP
OR
T
CUSTOMERS
PROVIDING EXCEPTIONAL SERVICE TO ALL OF OUR CUSTOMERS AND PUTTING THEM AT THE HEART OF OUR DECISIONS.
2016-2018 HEADLINE COMMITMENTS
NET PROMOTER SCOREDeliver world-class customer service as evidenced by a top quartile Net Promoter Score compared to UK Customer Satisfaction Index results
CUSTOMER INSIGHTRun a programme of engagement and research to further enhance our product and processes based on the needs of our customers
2016-2018 LEADING COMMITMENTS
Use MyHome Plus as an interactive way of communicating with our customers
Market all developments in the UK first
2016-2018 BUSINESS-AS-USUAL COMMITMENTS
Include information on Our Vision and the Berkeley Customer Satisfaction
Commitment in marketing material
Include site-specific sustainability information in marketing material
Ensure Living Guides include information that enables occupants to understand
and operate their home efficiently
NET PROMOTER SCORE
Deliver world-class customer service as evidenced by a top quartile Net Promoter Score compared to UK Customer Satisfaction Index results
The service we provide is professional,
efficient and helpful to make the home-
buying process as straightforward
and enjoyable as possible. We aim to
exceed our customers’ expectations,
starting from the moment a customer
first enquires about a property. Each
customer receives tailored information
relating to their purchase and has a
dedicated person to guide them through
their buying journey and beyond.
We have created a ‘customer first’
mindset and empowered teams
to think and act differently. This is
supported by a range of staff training,
from creative thinking to exemplary
brochure design, and the continuation
of our Sales Academy to bring talented
individuals from other industries into
the business. This year we have also
produced a new publication on the
Berkeley Difference.
We use the Net Promoter Score
to benchmark the levels of service
we provide against well-regarded
companies across all sectors. Our
six-month rolling average Net Promoter
Score of 70.8 compares favourably
with other exemplary companies and
we are pleased to be meeting our
target of performing within the top
quartile of UK Customer Satisfaction
Index results.
CUSTOMER INSIGHT
Run a programme of engagement and research to further enhance our product and processes based on the needs of our customers
Key to the ongoing success of our
business is that we
listen to, understand
and respond to
the needs of our
customers. During
2017 we began to use
an analytics tool to
evaluate commentary
from customer
survey data in more
detail. We have also
extended an online
sharing portal which was originally
implemented in our St James business
to enable lessons learnt to be shared
across the business.
KEY TO THE ONGOING
SUCCESS OF OUR
BUSINESS IS THAT WE
LISTEN TO, UNDERSTAND
AND RESPOND TO
THE NEEDS OF OUR
CUSTOMERS.
The views and feedback of potential
customers who choose not to buy are also
invaluable in helping to shape our future
product. To date, 50 surveys have been
completed at Kidbrooke Village and Royal
Arsenal Riverside and a wider programme
of engagement
with prospective
customers will now
be implemented.
This site-specific
information supports
our annual brand
research of what is
important to people
when selecting a
new home.
In addition, we seek to proactively
enhance the homes we build through
keeping up-to-date with the latest
advances in specification and design.Sales and Marketing Suite at Mill Hill
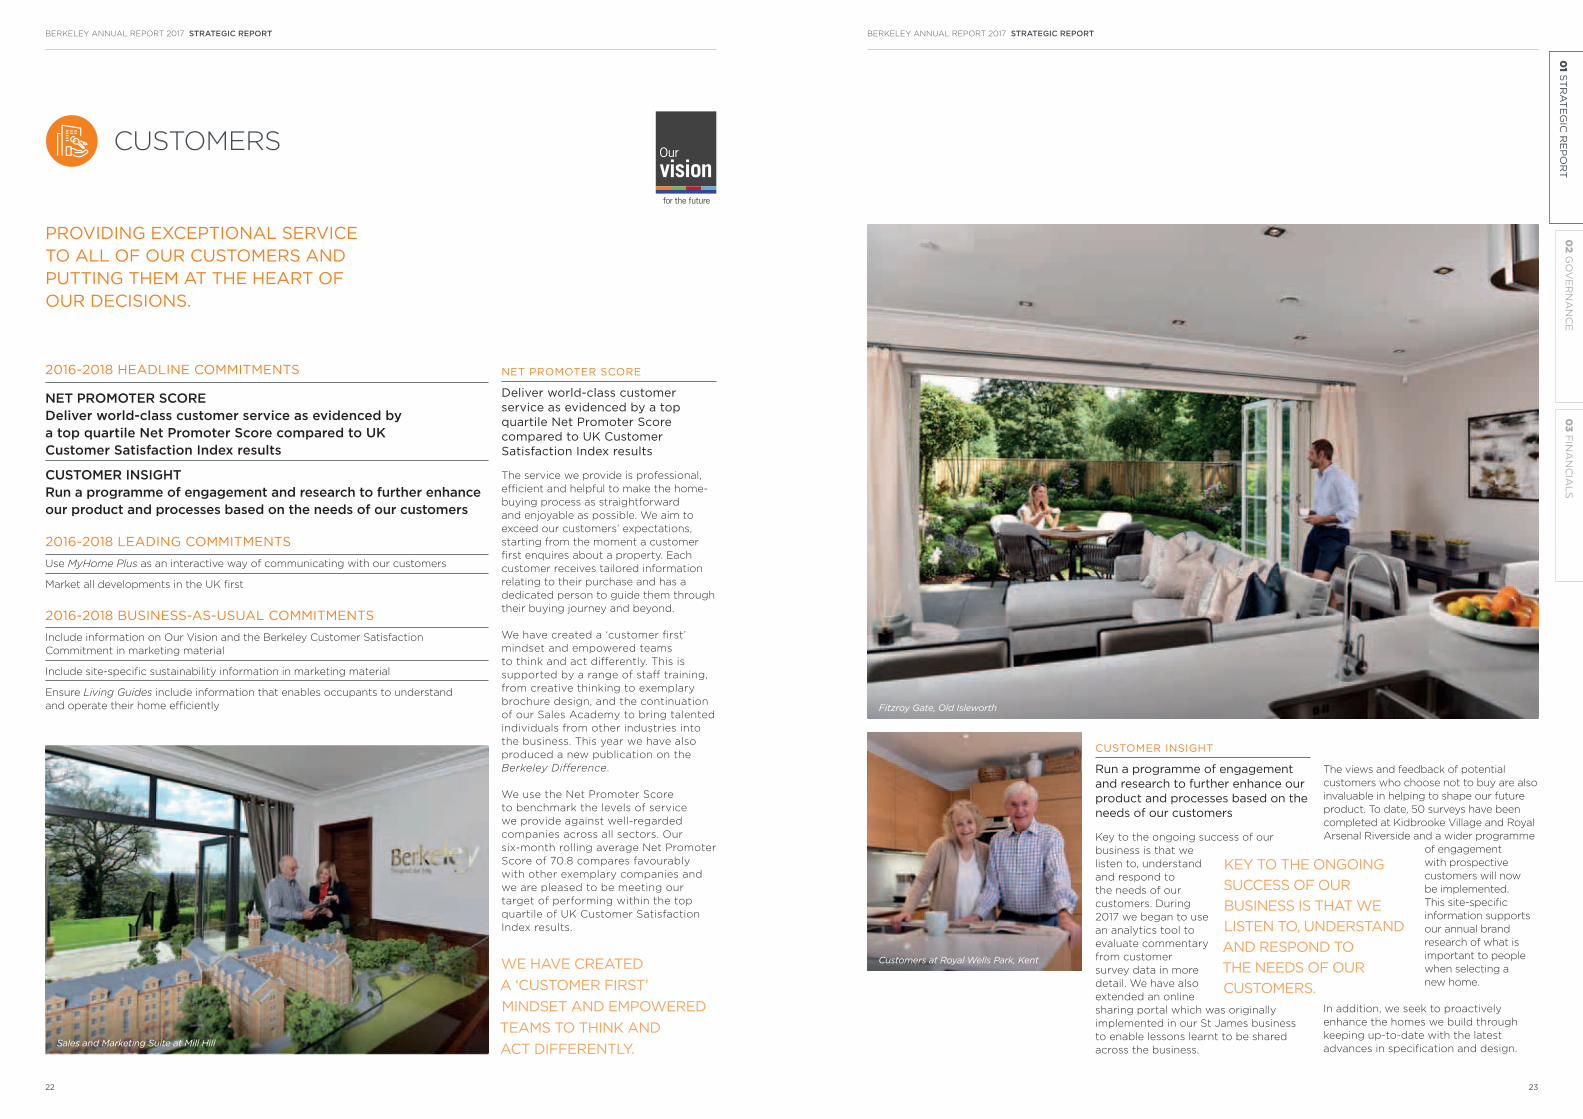
Fitzroy Gate, Old Isleworth
WE HAVE CREATED
A ‘CUSTOMER FIRST’
MINDSET AND EMPOWERED
TEAMS TO THINK AND
ACT DIFFERENTLY.
Customers at Royal Wells Park, Kent
BERKELEY ANNUAL REPORT 2017 STRATEGIC REPORTBERKELEY ANNUAL REPORT 2017 STRATEGIC REPORT
22 23
02
GO
VE
RN
AN
CE
03
FIN
AN
CIA
LS
01 S
TR
AT
EG
IC R
EP
OR
T

HIGH RES NEEDED
CUSTOMERS
COMMUNICATING WITH CUSTOMERS
We enhanced our website in 2017 in order
to strive for seamless communication
with customers from the moment they
first contact us. We are also trialling a
new search tool, My View, which enables
prospective home buyers to search
based on preferred lifestyle choices such
as being close to a park or a theatre.
Once a customer has chosen to
buy a new home they are given the
opportunity to use our interactive online
system, MyHome Plus. Its functionality
has now been extended to cover a
range of features, from selecting choices
and options to receiving updates on
construction progress and the Living
Guide on completion.
We continue to promote sustainable
living at all stages of the customer
journey. At Broadacres we have brought
sustainability to the heart of our sales
suite with an exciting and interactive
presentation platform.
UK FIRST
Our UK First Policy has been in place
since 2014 for all developments,
requiring that every individual home is
made available in the UK either first or
at the same time as launching overseas.
This enables UK customers to have the
opportunity to buy our homes, whilst
also appreciating the vital role that
international investors play in generating
the cash flow and confidence required
to begin construction.
70.8Net Promoter Score
(on a scale of -100 to +100)
98%customers would recommend
us to a friend
Institute of Customer Service ServiceMark
across all businesses
2017 HIGHLIGHTS
Learn more about Customers at www.berkeleygroup.co.uk/about-berkeley-group/our-vision/customers
IN ADDITION TO PROGRESSION OF OUR HEADLINE COMMITMENTS, WE HAVE THE FOLLOWING KEY HIGHLIGHTS FOR THE YEAR.
CUSTOMERS ARE GIVEN THE OPPORTUNITY
TO USE OUR INTERACTIVE ONLINE SYSTEM,
MYHOME PLUS.
Woodhurst Park, Warfield
BERKELEY ANNUAL REPORT 2017 STRATEGIC REPORTBERKELEY ANNUAL REPORT 2017 STRATEGIC REPORT
24 25
02
GO
VE
RN
AN
CE
03
FIN
AN
CIA
LS
01 S
TR
AT
EG
IC R
EP
OR
T

HOMES
DEVELOPING INDIVIDUALLY DESIGNED, HIGH QUALITY HOMES WITH LOW ENVIRONMENTAL IMPACT.
2016-2018 HEADLINE COMMITMENTS
THERMAL COMFORTDesign our homes to consider future climate change to ensure continued thermal comfort
SMART HOMESUnderstand the evolution of smart technology and connectivity in homes and on developments
2016-2018 LEADING COMMITMENTS
Enable fibre broadband on all our new homes and provide community Wi-Fi
Continue the research and development programme to drive innovation in design
and performance
2016-2018 BUSINESS-AS-USUAL COMMITMENTS
Guarantee space standards for all new homes
Provide internal recycling facilities for every home SMART HOMES
Understand the evolution of smart technology and connectivity in homes and on developments
We are increasingly living in a connected
world, with our customers expecting
access to the internet
and good connectivity
from the first day they
move in. Technology
continues to develop,
from enabling us to
control temperature
of our homes
through a smart
phone, to intelligent
devices learning
our behaviours
and movements.
This commitment
helps us to explore
infrastructure and technology and ensure
we continue to provide a high quality and
unique product to our customers.
Incorporating the right broadband
and cabling infrastructure is critical to
future-proof homes and developments
THERMAL COMFORT
Design our homes to consider future climate change to ensure continued thermal comfort
The potential for overheating in new
homes has become a growing issue for
the industry as standards for energy
efficiency and air tightness have increased.
We are taking a proactive approach in this
area to ensure that we deliver high quality
homes which our customers can live in
comfortably for decades to come, with
expected changes in climate.
During 2017 we developed a thermal
comfort risk assessment tool based on
existing industry research and feedback
from our own staff and external experts
on the subject. The tool, which will
now be used on all new sites, takes
into account factors which can affect
overheating, such as location and
building type. It then highlights site-
specific risks and suggested actions to
reduce these. No other developer has an
approach which is applied across all sites.
Several of our projects are already
incorporating measures to minimise
risk within their design. These range
from solar control glazing at Fulham
Gasworks, to amended balcony design
to provide shading at Goodman’s Fields,
to additional insulation of pipework at
Hartland Park.
Following previous work undertaken
with the Zero Carbon Hub, we have
recently contributed to a Good Homes
Alliance working group on overheating.
WE ARE INCREASINGLY
LIVING IN A CONNECTED
WORLD, WITH OUR
CUSTOMERS EXPECTING
ACCESS TO THE
INTERNET AND GOOD
CONNECTIVITY FROM
THE FIRST DAY THEY
MOVE IN.IT IS CRITICAL THAT WE
TAKE A PROACTIVE
APPROACH TO DELIVER
HIGH QUALITY HOMES
WHICH OUR CUSTOMERS
CAN LIVE IN COMFORTABLY
FOR DECADES TO COME.
and enable our customers to adopt
new technologies as they emerge. In
2017 we have developed new minimum
infrastructure recommendations for all
new sites to enable high speed broadband
provision and the transfer of data to each
habitable room. This
enables customers
to benefit from the
freedom of being able
to ‘plug in’ technologies
that they wish as they
become available. This
would not be possible
without working in
close collaboration
with Openreach and
we were delighted
to be awarded the
Openreach Property
Developers Award 2017
for Innovation – Most Supportive Trialist.
During 2018 we will continue to
investigate emerging technologies which
our customers may like to be included
in their home. These could range from
smart appliances to heating and lighting
controls and security technologies.
Merano Residences, Albert Embankment
190 Strand
BERKELEY ANNUAL REPORT 2017 STRATEGIC REPORTBERKELEY ANNUAL REPORT 2017 STRATEGIC REPORT
26 27
02
GO
VE
RN
AN
CE
03
FIN
AN
CIA
LS
01 S
TR
AT
EG
IC R
EP
OR
T

HOMES
69%completed homes supplied with energy
from low carbon or renewable technology
100%homes submitted for planning designed
to incorporate recycling facilities
64%completed homes provided
with smart meters
14%improvement in the average internal water
efficiency of completed homes compared
to Building Regulations requirements
WhatHouse? Awards 2016: Best Luxury
Development (Bronze) and Best
Apartment Scheme (Bronze) for One
Tower Bridge
2017 HIGHLIGHTS
RESEARCH AND DEVELOPMENT
Research and development continually
occurs across the business. To meet the
demands of more high quality homes
in the UK that
are adaptable to
lifestyle changes,
Berkeley has
developed the
Urban House
type. Homes at
our Kidbrooke
Village and Green
Park Village
developments have
been built to this
design type which has adaptable space
and allows the retention of a typical
street appearance while increasing
housing density. We are now investigating
the use of battery storage in conjunction
The Urban House interior at Kidbrooke Village Bersted Park, North Bersted
Wimbledon Hill Park
with solar photovoltaic panels as part of
a ‘hybrid home’ concept. Not only should
this reduce customers’ bills, it could
also help manage
electricity demand
peaks on the
National Grid.
We regularly seek
to collaborate
with external
organisations and
are pleased to have
contributed to and
hosted the launch
of the UK Green Building Council’s (UK-
GBC) work on healthy homes. We are
also part of the Chartered Institution of
Building Services Engineers’ (CIBSE)
Homes for the Future Group.
Learn more about Homes at www.berkeleygroup.co.uk/about-berkeley-group/our-vision/homes
ENVIRONMENTAL FEATURES
Our aim is to seamlessly integrate
environmental features into all homes as
standard. We begin by applying the energy
hierarchy in design
and also incorporate
low energy and
water use fittings
and features
such as internal
recycling bins.
The specification of materials is also key.
In the last year, we have actively fed
into the UK Green Building Council’s
OUR AIM IS TO
SEAMLESSLY INTEGRATE
ENVIRONMENTAL FEATURES
INTO ALL HOMES.
RESEARCH AND
DEVELOPMENT IS CRITICAL
TO ENSURE WE CONTINUE
TO IMPROVE OUR
PRODUCT AND OFFER
HIGH QUALITY HOMES TO
OUR CUSTOMERS.
(UK-GBC) guidance, Embodied Carbon:
Developing a Client Brief, aimed at
enabling built environment clients to
write effective
briefs for measuring
embodied carbon.
We are also part of
the Construction
Industry Research
and Information
Association (CIRIA) working group
developing practical guidance on
how buyers can minimise risk through
responsible procurement of key materials.
SPACE STANDARDS
In 2014, we were the first private
developer to commit to minimum space
standards covering three core aspects
in every home: master bedroom depth;
floor-to-ceiling height; and storage.
Since this time, the Government’s
nationally described space standards
have been adopted in some of the areas
in which we work.
In the absence of consistent requirements
we have continued to apply our own
minimum standards, including a generous
ceiling height of 2.5 metres.
IN ADDITION TO PROGRESSION OF OUR HEADLINE COMMITMENTS, WE HAVE THE FOLLOWING KEY HIGHLIGHTS FOR THE YEAR.
BERKELEY ANNUAL REPORT 2017 STRATEGIC REPORTBERKELEY ANNUAL REPORT 2017 STRATEGIC REPORT
28 29
02
GO
VE
RN
AN
CE
03
FIN
AN
CIA
LS
01 S
TR
AT
EG
IC R
EP
OR
T

PLACES
CREATING GREAT PLACES WHERE RESIDENTS ENJOY A GOOD QUALITY OF LIFE, NOW AND IN THE FUTURE.
COMMUNITY PLANS
Implement community plans on our developments to facilitate thriving communities
Our commitment to implement
community plans further strengthens
Berkeley’s approach to creating successful
places and is an evolution of our leading
work on social sustainability. The aim is to
provide a structure to help facilitate the
development of the community, setting
out an overall vision which is underpinned
by a strategy to engage with local people
to create a sense of ownership and
belonging for the place.
We have developed guidance for our
teams on the elements a plan should
cover and on areas of consideration, such
as how to set up effective community
governance, how to assign a community
concierge and how to set up a community
fund. Plans have now been completed for
12 developments, ranging in scale, location
and mix of housing type. Each is different,
reflecting local needs and aspirations, and
provides a clear plan for the community
to develop and ultimately be self-reliant.
Initiatives include setting up local
community groups, establishing markets
and existing residents initiating a survey to
better understand what their community
needs and wants.
During 2018 we will begin to implement
the plans to gain a deeper understanding
of the success of differing community
governance models and varying events,
communications and initiatives.
2016-2018 HEADLINE COMMITMENTS
COMMUNITY PLANSImplement community plans on our developments to facilitate thriving communities
NET BIODIVERSITY GAINDevelop and apply an approach to ensure that all new developments create a net biodiversity gain
2016-2018 LEADING COMMITMENTS
Measure and increase people’s quality of life by applying Berkeley’s
framework for social sustainability
Apply Berkeley’s climate change adaptation checklist to all developments’
pre-planning and implement measures that address overheating, flooding
and water shortages
2016-2018 BUSINESS-AS-USUAL COMMITMENTS
Follow Berkeley’s Community Engagement Strategy on all planning applications
we submit and develop a Statement of Community Involvement
Consult an ecologist pre-planning on all developments and implement key
recommendations to protect and enhance ecology
Provide at least one electric car charging point in all residential communal car parks
Provide cycle storage on all new developments
Harvest rainwater for reuse on all new developments
Ensure that all commercial space, student accommodation and senior living
housing (where relevant), achieves at least BREEAM Very Good
Install living roofs on all residential apartment roof spaces
NET BIODIVERSITY GAIN
Develop and apply an approach to ensure that all new developments create a net biodiversity gain
We are the first developer to commit to
achieving a net biodiversity gain on all
sites. New development provides the
opportunity to enhance biodiversity and
offers multiple benefits to customers
including promoting wellbeing. Through
this commitment we will ensure there is
more nature on site after development
than before, building on our focus on
providing high-quality public realm and
green infrastructure.
EACH COMMUNITY PLAN IS DIFFERENT,
REFLECTING LOCAL NEEDS AND
ASPIRATIONS, AND PROVIDES A CLEAR
PLAN FOR THE COMMUNITY TO DEVELOP
AND ULTIMATELY BE SELF-RELIANT.
Working with external experts, we have
developed a biodiversity toolkit which
will now be used by our project teams
and their appointed
ecologists on every site.
The toolkit provides
a baseline score for
biodiversity before
any work occurs
and demonstrates
how a net gain will
be achieved. A new
document, The Nine Concepts: Making
Space for Nature and Beauty, provides
guidance on overarching design principles
that support the toolkit and the delivery of
biodiverse developments.
This year, our efforts to enhance
biodiversity were once again recognised
by the Construction Industry Research
and Information
Association (CIRIA) BIG
Biodiversity Challenge
Awards, with One
Tower Bridge winning
the ‘Pollinator Award’
for the installation of
four bee hives. We have
also been collaborating
with wider industry through sponsorship
and participation in CIRIA’s biodiversity
gain principles project.
WE WILL ENSURE
THERE IS MORE
NATURE ON SITE
AFTER DEVELOPMENT
THAN BEFORE
Woodhurst Park
Kidbrooke Village
BERKELEY ANNUAL REPORT 2017 STRATEGIC REPORTBERKELEY ANNUAL REPORT 2017 STRATEGIC REPORT
30 31
02
GO
VE
RN
AN
CE
03
FIN
AN
CIA
LS
01 S
TR
AT
EG
IC R
EP
OR
T

PLACES
PLACEMAKING
The Berkeley approach is to put people
first on every development. This
starts from the outset, with each site
developing a strategy for community
engagement and involvement. It is also a
long-term approach on how we not only
create places, but can play a valuable
role in enabling a thriving community.
We continue to use our social
sustainability toolkit, Creating Successful
Places, as a structured approach to
placemaking and a way to demonstrate
the success of our developments.
As we gain more experience, we are
increasingly working with our managing
agents whose role is also evolving to help
facilitate the growth of the community.
SUSTAINABLE PLACES
We aim to create places where residents
can live a sustainable lifestyle. We focus
on brownfield sites, with scope for
good public transport, and then deliver
mixed-use, mixed-tenure development
with high quality public realm. As well as
access to local public transport options,
we encourage cycle storage and electric
car charging to be provided on all sites. In
2017, 100% of completed developments
provided cycle storage. At 250 City
Road, which is located at a pivotal point
in London’s cycle network, we will be
providing a workshop area and bicycle
To create a place that is thriving, we
include more than just homes; we
build infrastructure that supports the
community. Three
new schools
opened on our
sites in September
2016; at 375
Kensington High
Street, Royal Wells Park and Woodhurst
Park. In January 2017, a four-screen
cinema was opened at Goodman’s Fields
and, later this year, The Bridge Theatre at
One Tower Bridge will open its doors for
the first time.
3schools opened on Berkeley
developments in September 2016
London Evening Standard New Homes
Awards 2016: Best Large Development
for Goodman’s Fields
91%developments with homes within
500 metres of a transport node
CIRIA’s BIG Biodiversity Challenge Awards
2016: Pollinator Category Winner for One
Tower Bridge
12developments produced community plans
WhatHouse? Awards 2016: Best Large
Housebuilder (Gold); Best Mixed-Use
Development (Gold) for Fulham Reach
93%developments incorporated features
that benefit nature
2017 HIGHLIGHTS
THE BERKELEY APPROACH
IS TO PUT PEOPLE FIRST
ON EVERY DEVELOPMENT.
Summer screening at Woodberry DownLearn more about Places at www.berkeleygroup.co.uk/about-berkeley-group/our-vision/places
During the construction phase there is
often the potential to create temporary
facilities to benefit the local community.
At London Dock,
a pop-up park
has hosted street
food markets
and there has
been a temporary
exhibition on the development’s heritage
and public art installation, Trading Words.
In July 2016, we published new
research with the London School
of Economics (LSE) exploring how
urban villages could help the Capital’s
housing crisis. New London Villages
makes a series of recommendations for
placemaking in London.
lifts in addition to almost 20% more
cycle spaces than required by
the planning authority.
As part of our approach to reduce
the effects of climate change we
incorporate green infrastructure such
as open space, parks, gardens and living
roofs. Over 500 trees have already been
planted and a new country park and
greenway delivered at our Woodhurst
Park development which welcomed its
first residents this year.
Kensington Primary Academy
IN ADDITION TO PROGRESSION OF OUR HEADLINE COMMITMENTS, WE HAVE THE FOLLOWING KEY HIGHLIGHTS FOR THE YEAR.
BERKELEY ANNUAL REPORT 2017 STRATEGIC REPORTBERKELEY ANNUAL REPORT 2017 STRATEGIC REPORT
32 33
02
GO
VE
RN
AN
CE
03
FIN
AN
CIA
LS
01 S
TR
AT
EG
IC R
EP
OR
T

OPERATIONS
MAKING THE RIGHT LONG-TERM DECISIONS WHILST RUNNING THE BUSINESS EFFICIENTLY AND WORKING WITH OUR SUPPLY CHAIN.
CARBON POSITIVE
Reduce our operational carbon emissions intensity by 10% and introduce a programme to become carbon positive
In May 2016, in a landmark
announcement for the housing industry,
Berkeley committed to becoming the
first major housebuilder in Britain to be
carbon positive.
In the last year we have focused on
increasing understanding of consumption
across our day-to-day activities on
site, in offices and in sales suites. Our
construction sites are the main contributor
to our carbon emissions and guidance
has been issued on how to address
out-of-hours electricity consumption
together with minimum energy efficiency
recommendations for site set up and
operation. These have been supported
by awareness campaigns and increased
sharing of best practice.
Achievement of the 10% reduction target
will be based on 2018 performance
compared to our baseline emissions
intensity in 2016. Our performance in 2017
indicates good progress towards meeting
our target next year. Greenhouse gas
emissions data is provided on page 109.
At the same time as taking action to
reduce energy consumption, we have
been looking into investing in cleaner
energy sources and offsetting schemes.
We will develop this work further in the
next year and introduce a programme to
become carbon positive.
IN THE LAST YEAR,
MORE THAN 1,650
PEOPLE ACROSS OUR
WORKFORCE HAVE
BEEN UNDERTAKING AN
APPRENTICESHIP OR
VOCATIONAL TRAINING.
APPRENTICES AND TRAINING
Ensure at least 1,500 people across our direct and indirect workforce undertake an apprenticeship or vocational training
We consider the skills crisis to be one
of the most significant risks facing
the industry and
we have a role to
play in encouraging
new people into the
industry and upskilling
the workforce.
Significant progress
has been made since
we set our initial
commitment three
years ago. In the last
year alone, more
than 650 apprentices
were working on our sites and almost
1,000 additional people undertook other
types of vocational training. To promote
action in this area we have a network
2016-2018 HEADLINE COMMITMENTS
CARBON POSITIVEReduce our operational carbon emissions intensity by 10% and introduce a programme to become carbon positive
APPRENTICES AND TRAININGEnsure at least 1,500 people across our direct and indirect workforce undertake an apprenticeship or vocational training
2016-2018 LEADING COMMITMENTS
Broaden the scope of Berkeley’s Innovation Fund
Map our supply chain risks and implement a sustainable specification and
procurement strategy
2016-2018 BUSINESS-AS-USUAL COMMITMENTS
Procure contractors on best overall value
Register all sites with the Considerate Constructors Scheme and achieve a minimum
score of 38/50 in each audit
Undertake sustainability assessments on each site
Ensure all timber is certified
Reduce construction waste by 10% and reuse or recycle at least 90% of total waste
Reduce site water consumption by 5%
Reduce paper consumption by 20%
Undertake sustainability reviews for each permanent office
of dedicated staff across the company
who provide day-to-day support to our
project teams and contractors in offering
appropriate training.
To celebrate the successes of apprentices
working within our supply chain, the
first Berkeley Group
Apprenticeship
Awards were held
in November 2016.
Within the year we
also took on our first
cohort of direct trade
apprentices within
Berkeley Capital
and the Berkeley
Apprenticeship
Scheme model
previously adopted
at Kidbrooke Village
is now being replicated in West London,
in partnership with Ealing, Hammersmith
and West London’s College and with the
support of Ealing Council.
BERKELEY IS THE FIRST
MAJOR HOUSEBUILDER IN
BRITAIN COMMITTED TO
BECOME CARBON POSITIVE.
Apprentice at Goodman’s Fields, Aldgate
Construction at Royal Arsenal Riverside, Woolwich
BERKELEY ANNUAL REPORT 2017 STRATEGIC REPORTBERKELEY ANNUAL REPORT 2017 STRATEGIC REPORT
34 35
02
GO
VE
RN
AN
CE
03
FIN
AN
CIA
LS
01 S
TR
AT
EG
IC R
EP
OR
T

SUSTAINABLE PROCUREMENT
There is growing interest in the
construction industry’s sourcing of labour,
services, materials and products. Our
sites now display posters outlining the
warning signs of modern slavery. Further
details on actions taken to combat
modern slavery can be found on our
website: https://www.berkeleygroup.
co.uk/modern-slavery-statement.
Since becoming a partner of the
Supply Chain Sustainability School, we
have been an active participant of the
Homes Leadership Group, assisting in
determining direction and priority topics.
We have also been a speaker at supplier
days to highlight the challenges faced by
the sector and the supply chain’s role in
addressing these.
INNOVATION
We continue to work with 12 external
projects that received support through
our health and safety Innovation Fund
launched in January 2015. We are
pleased to be able to support research
and products to reduce construction-
related risk and are reviewing whether
we could extend our support to broader
innovation ideas in the future.
Off-site construction increases build
efficiency, with minimised material
management and waste on-site, reduced
disruption to neighbours and improved
health and safety. This year, we have
used a fully-fitted modular system built
off-site to deliver homes of our Urban
House type, reducing on-site delivery
time to 14 weeks. There is scope to
broaden the use of off-site methods in
the future.
RESOURCE EFFICIENCY
In November 2016, we held a waste
campaign to raise awareness of the
quantity produced and encourage
practices that lead to reductions. An
internal material exchange board was
launched, enabling our construction sites,
offices and sales suites to share excess
materials with the ultimate aim of reducing
waste disposal costs, material procurement
costs and environmental impact.
We are also working towards targets
to reduce site water consumption and
office paper consumption.
CONSIDERATE CONSTRUCTION
We aim to manage sites with consideration
of our workforce, the local community and
the environment. Each site is registered to
the Considerate Constructors Scheme (CCS)
and is independently assessed. Our average
audit score was 42/50 in 2017, demonstrating
performance beyond the industry average
of 36/50. Our approach continues to be
recognised, with 33 awards received at the
CCS National Site Awards 2017.
OPERATIONS
Learn more about Operations at www.berkeleygroup.co.uk/about-berkeley-group/our-vision/operations
33Considerate Constructors Scheme 2017
National Site Awards
13%reduction in absolute site carbon
emissions compared to 2016
650+apprentices across our workforce
17%reduction in construction waste produced
per person compared to 2016
Joined Build UK as a Client group member
2017 HIGHLIGHTS
IN ADDITION TO PROGRESSION OF OUR HEADLINE COMMITMENTS, WE HAVE THE FOLLOWING KEY HIGHLIGHTS FOR THE YEAR.
Royal Arsenal Riverside, Woolwich
Site preparation works at Southall Waterside
Kidbrooke Village
BERKELEY ANNUAL REPORT 2017 STRATEGIC REPORTBERKELEY ANNUAL REPORT 2017 STRATEGIC REPORT
36 37
02
GO
VE
RN
AN
CE
03
FIN
AN
CIA
LS
01 S
TR
AT
EG
IC R
EP
OR
T

OUR PEOPLE
DEVELOPING A HIGHLY SKILLED WORKFORCE WHO RUN AUTONOMOUS BUSINESSES, OPERATE IN A SAFE AND SUPPORTIVE WORKING ENVIRONMENT AND CONTRIBUTE TO WIDER SOCIETY.
HEALTHY WORKPLACES
Launch and implement a new programme to promote the wellbeing of our staff and create healthy workplaces
A person’s wellbeing can be influenced
by their surroundings. Through our
commitment to providing healthy
workplaces we seek to improve the quality
of life of our employees and improve
employee satisfaction and productivity.
A checklist has been developed based
on recognised frameworks such as the
Mayor of London’s Healthy Workplace
Charter and the WELL Building Standard.
We have also utilised our links with Bupa
to set out a framework approach to
individual health which can be adopted
by our operating companies.
Health and wellbeing programmes
are in operation across a number of
our divisions and there are plans to
implement them across the whole
business by April 2018. Initiatives to
date are varied and include health
assessments, exercise classes,
encouragement of healthy eating
and sessions on managing stress and
personal finances.
We are delighted that Berkeley St Edward
has been recognised as a ‘most improved
workplace’ within Vitality’s Britain’s
Healthiest Workplace Awards for its
Investing in Our Future programme.
The programme running within St James
has also been a resounding success,
with Bupa noting an outstanding level
of engagement from staff.
TALENT MANAGEMENT
Invest in training and development through our talent management programmes to realise the potential of our people across all areas of the business
Our talented workforce is our strongest
resource; it is vital that that we provide
the right opportunities
within the business to
enable people to grow
and flourish.
As a minimum,
individuals should
have a thorough
induction into the
company and then have a training
assessment and personal development
review available to them. This is then
supplemented, where appropriate,
by more detailed programmes. Our
autonomous companies have developed
approaches tailored to suit their
businesses and staff.
2016-2018 HEADLINE COMMITMENTS
HEALTHY WORKPLACES Launch and implement a new programme to promote the wellbeing of our staff and create healthy workplaces
TALENT MANAGEMENT Invest in training and development through our talent management programmes to realise the potential of our people across all areas of the business
2016-2018 LEADING COMMITMENTS
Pay at least the Living Wage Foundation’s ‘Living Wage’ to all direct employees
Encourage and support every member of staff in contributing every year
to the Berkeley Foundation
2016-2018 BUSINESS-AS-USUAL COMMITMENTS
Provide all direct employees with an individual training assessment and allocate
training based on their job role
Ensure Directors undertake weekly health and safety visits to all live projects
under construction
Annually review the Group Health and Safety Standards and implement them locally
Continue to aspire to operate incident and injury free and target an Accident Incident
Rate (AIR) of 3.00 and an Accident Frequency Rate (AFR) of 0.14
A real strength has been identified
in the opportunities available for
progression and the tendency to
promote from within the business.
A recently launched personal career
development programme in St George
provides further structure around job
descriptions and progression, together
with prompts for
individuals to learn
more about their
working style and
to set development
goals. Within Berkeley
St Edward a range
of programmes are
in place, focusing on
developing all levels of staff from junior
employees through to senior managers.
During 2018 we will be embedding
these initiatives further and ensuring
that each employee across all parts
of the business has access to a
programme to aid their development.
IT IS VITAL THAT WE
PROVIDE THE RIGHT
OPPORTUNITIES TO
ENABLE PEOPLE TO
GROW AND FLOURISH.
AS INDIVIDUALS SPEND A
NOTABLE AMOUNT OF TIME IN
THE WORKPLACE WE HAVE THE
POTENTIAL TO SIGNIFICANTLY
INFLUENCE THE WELLBEING OF
OUR EMPLOYEES.
Chelsea Bridge Wharf Office
Berkeley apprentice
Prince of Wales Drive, Battersea
BERKELEY ANNUAL REPORT 2017 STRATEGIC REPORTBERKELEY ANNUAL REPORT 2017 STRATEGIC REPORT
38 39
02
GO
VE
RN
AN
CE
03
FIN
AN
CIA
LS
01 S
TR
AT
EG
IC R
EP
OR
T

OUR PEOPLE
HEALTH AND SAFETY
We are committed to operating incident
and injury free and aspire to have a positive
health impact on all those employed and
affected by what we do. Over the last
10 years we have worked hard to ensure
that our people, contractors, suppliers
and partners share this commitment.
Showing effective
leadership is critical,
as is empowering our
workforce to take
responsibility for their
own safety as well as
the safety of others.
Group standards
and detailed local
management systems
set clear direction and each site receives
a weekly health and safety visit from a
director in addition to at least eight audits
per year from an independent Group
assessment team.
We have seen an annual decrease in our
Accident Incident Rate (AIR) for more
than five years, including a significant
drop of 24% this year. During 2017
there were fewer than two incidents
for every 1,000 people working on our
construction sites, less than half of the
industry average (4.26, Health and Safety
Executive (HSE) October 2016 figure).
We are delighted that our approach
continues to be recognised externally.
This year was our most successful on
record at the Royal Society for the
GRADUATE SCHEME
Our successful graduate scheme brought
23 young people into the business in
2017 and we are recognised as one of
the top 100 graduate employers by
TheJobCrowd. The scheme includes a
thorough induction followed by a period
of rotation across our departments and
an opportunity to pursue professional
accreditation to bodies such as the Royal
Institution of Chartered Surveyors (RICS).
In 2018, we will welcome around 30
new graduates into the business and
will be implementing our first formal
sandwich placement scheme. This will
allow undergraduates to gain essential
experience as part of their study and an
opportunity to secure a graduate role
with us before they complete their final
year at university.
INCLUSIVITY
We have almost 2,500 direct employees
working in a range of roles across
around 60 sites and 20 permanent
offices. Over a third of our employees
are female, as are a quarter of our Board
directors and senior management.
Our graduate scheme aims for half of
all new recruits to be female. We are
delighted that one of St James’ Assistant
Site Managers, Rachel Darvall (above),
won the Best Construction Newcomer
category at the Women in Build Awards
2016 after joining the scheme in 2015.
In addition to our direct employees, we
support a large and varied workforce
through our contractors with more than
10,500 people working on our sites in April
2017. We believe that the industry offers
real potential for a more diverse workforce
and throughout our work we aim to
promote the breadth of roles available in an
industry which is increasingly cutting edge,
worthwhile and rewarding.
Female Male Total
Total
Employees 930 1,559 2,489
Reporting
to Senior 34 168 202
Management
Senior
Management 2 6 8
Board
of Directors 3 9 12
At 30 April 2017
THE BERKELEY FOUNDATION
Berkeley employees continue to provide
an incredible level of support to the
Foundation, with over 1,400 people
getting involved in volunteering,
fundraising or Give As You Earn this
year. Our aim is to inspire all employees
to do something every year to support
the Foundation.
In 2017, staff raised £876,000 through
fundraising and Give As You Earn. Staff
also volunteered their time to act as
mentors, deliver workshops and training
sessions, and much more.
All of this activity is made possible by the
team of representatives across the business
who coordinate events and encourage their
colleagues to get involved.
More information on the Foundation can
be found on page 42.
RoSPA Health and Safety Awards 2017: Sir
George Earle Trophy for Berkeley East Thames
24%reduction in our Accident Incident Rate
compared to 2016
37%direct employees are female
Women in Build Awards 2016: Best
Construction Newcomer for Rachel Darvall
Payroll Giving Platinum Award 2017
achieved as over 30% of employees
donate through Give As You Earn (GAYE)
NHBC Health and Safety Awards
2016: National Best Site Awards for
Highwood (Large Builder) and Vista
(Multi-Storey Builder)
2017 HIGHLIGHTS
Prevention of Accidents (RoSPA) Awards
and we are honoured that Berkeley East
Thames won the pinnacle of the awards,
the Sir George Earle Trophy. This is
internationally recognised as the premier
performance award for health and safety.
Of the two categories (Large Builder and
Multi-Storey Builder)
that Berkeley featured
in at the National
House Building
Council’s (NHBC) 2016
Health and Safety
Awards, we were the
National Best Site
winners in both.
We are also pleased to collaborate with
wider industry initiatives such as the
Health and Safety Executive’s Construction
Industry Advisory Committee (HSE’s
CONIAC). In 2017, we have been leading on
the production of new health and safety
guidance on the planning, design and
construction of tall buildings.
Learn more about Our People at www.berkeleygroup.co.uk/about-berkeley-group/our-vision/our-people
WE ASPIRE TO HAVE
A POSITIVE HEALTH
IMPACT ON ALL THOSE
EMPLOYED AND
AFFECTED BY WHAT
WE DO.
2.992013
2.462015
2.922014
2.402016
1.832017
Accident Incident Rate
(number of RIDDOR reportable injuries per
1,000 people)
IN ADDITION TO PROGRESSION OF OUR HEADLINE COMMITMENTS, WE HAVE THE FOLLOWING KEY HIGHLIGHTS FOR THE YEAR.
Site induction at Kidbrooke Village
Fundraising through Dragon Boat Racing
BERKELEY ANNUAL REPORT 2017 STRATEGIC REPORTBERKELEY ANNUAL REPORT 2017 STRATEGIC REPORT
40 41
02
GO
VE
RN
AN
CE
03
FIN
AN
CIA
LS
01 S
TR
AT
EG
IC R
EP
OR
T

BERKELEY
FOUNDATION
THE BERKELEY FOUNDATION WAS LAUNCHED IN 2011 TO SUPPORT YOUNG PEOPLE AND THEIR COMMUNITIES IN LONDON AND THE SOUTH OF ENGLAND. IT SUPPORTS PROJECTS WHICH TACKLE HOMELESSNESS, HELP PEOPLE DEVELOP THEIR SKILLS AND MOVE INTO WORK, AND CREATE OPPORTUNITIES FOR DISABLED PEOPLE AND THOSE WITH LIFE-LIMITING ILLNESSES.
The Foundation has grown significantly
in 2017, investing more in its charity
partnerships than ever before. This
expansion was made possible through
funds raised at the Foundation’s fifth
birthday celebrations in spring 2016.
The Foundation has now committed
£11.2 million to more than 100 charities,
reaching over 12,000 people.
Three major new programmes have
been launched during the last year: a
partnership with MyBnk to provide money
management training to care leavers; a
pilot project with the Prince’s Trust and
Mind to test the delivery of mental health
support within Prince’s Trust centres;
and an educational outreach programme
with Teens and Toddlers which aims to
re-engage young people with school and
develop soft skills.
Existing partnerships
are also going from
strength to strength.
The Lord’s Taverners
Disability Cricket
Championship, which
provides year-round
cricket coaching
and competition for
disabled young people
has grown from four to
23 London Boroughs
since its launch, and is expected to reach
all 32 Boroughs by 2018. Partnerships
with Crisis and The Change Foundation
have each been renewed until 2019.
In addition, each Berkeley business
supports its own Designated Charity.
These local charity partnerships give staff
the opportunity to get involved in the
communities where they live and work,
and provide a focus for staff fundraising
and volunteering activities.
In January 2017 the Foundation launched
its revised strategic plan, following a
period of consultation
with partner charities
and other civil society
stakeholders. The
updated strategy
sets out ten clear
priority areas for the
Foundation going
forward, with a set of
measurable targets
against each.
We are delighted that the Foundation’s work
has been recognised through a number
of awards, including the ‘Commitment
to the Community’ award at the 2016
Better Society Awards and the ‘Best
Organisation’ award at the 2016 Mayor’s
Fund for London Awards. The Street Elite
programme, delivered in partnership with
The Change Foundation, also won the ‘Sport
for Employability and Enterprise’ category
at the 2016 Beyond Sport Awards. Most
recently, the Foundation was named ‘Best
Corporate Foundation’ at the 2017 Business
Charity Awards.
THE FOUNDATION
HAS NOW COMMITTED
£11.2 MILLION TO MORE
THAN 100 CHARITIES,
REACHING OVER
12,000 PEOPLE.
Learn more about the Berkeley Foundation at: www.berkeleyfoundation.org.uk
Staff mentoring at a Creativity Works session
Young people enjoying Longridge on Thames activities
The Lord’s TavernersYoung people enjoying Outward Bound Trust activities
Street Elite festival at Westway Sports Centre
Creativity Works graduation
Better Society Awards 2016: Commitment
to the Local Community Award
Third Sector Business Charity Awards
2017: Corporate Foundation Award
5,500people supported through Berkeley
Foundation funded programmes
2017 HIGHLIGHTS
Beyond Sport Awards 2016: Sport
for Employability and Enterprise Award
for Street Elite
BERKELEY ANNUAL REPORT 2017 STRATEGIC REPORTBERKELEY ANNUAL REPORT 2017 STRATEGIC REPORT
42 43
02
GO
VE
RN
AN
CE
03
FIN
AN
CIA
LS
01 S
TR
AT
EG
IC R
EP
OR
T

ON EVERY DEVELOPMENT YOU PUT PEOPLE FIRST, AND THEN WORK ON THE STREETS AND THE BUILDINGS. YOU START WITH A VISION FOR THE COMMUNITY.
Woodberry Down, Finsbury Park
BERKELEY ANNUAL REPORT 2017 STRATEGIC REPORTBERKELEY ANNUAL REPORT 2017 STRATEGIC REPORT
44 45
02
GO
VE
RN
AN
CE
03
FIN
AN
CIA
LS
01 S
TR
AT
EG
IC R
EP
OR
T

01 S
TR
AT
EG
IC R
EP
OR
T
DESIGNING AND PLANNING NEW HOMES AND PLACES
IDENTIFYING AND ACQUIRING LAND
WE ACQUIRE LAND
SELECTIVELY WITH A FOCUS
ON LONG-TERM, COMPLEX
SCHEMES WHERE WE CAN
USE OUR EXPERTISE TO ADD
VALUE THROUGH CREATING
NEW PLACES.
WE WORK WITH LOCAL
AUTHORITIES, COMMUNITIES
AND CONSULTANTS AND
AIM TO TO CREATE UNIQUE
PLACES CHARACTERISED
BY THE QUALITY OF THEIR
DESIGN, PUBLIC REALM,
SUSTAINABILITY AND
WHERE PEOPLE CAN ENJOY
A GOOD QUALITY OF LIFE,
NOW AND IN THE FUTURE.
See page 49See page 48
OUR BUSINESS
MODEL
UNDERSTANDING THE MARKET
Berkeley has a strategic
appreciation of the cyclical
nature of the property
market, recognising that
sentiment and transaction
levels can change quickly
and there are significant
operational risks in
identifying, designing,
building and selling homes
and creating places.
Berkeley mitigates these risks
by focusing on development
in London and the South of
England, markets which it
knows and understands, and
forward selling new homes
wherever possible.
In doing this, Berkeley
maintains a strong balance
sheet, keeps financial risk
low and carefully allocates
resources to the right projects
at the right time, matching
supply to demand wherever
it can.
• An unrivalled reputation
to deliver, based on
more than 40 years
of experience
• A passion for great
placemaking and
stewardship of the
places we create
• Quality and attention to
detail is at the forefront
of everything we do
• A bespoke approach
to every development
• An opportunistic approach
to land acquisitions in the
right locations
• A focus on regeneration of
underutilised, complex sites
into thriving communities
• A highly experienced
and skilled workforce
that provides a significant
level of knowledge
and expertise
• We offset high operational
risk of complex sites with
low financial risk through
a strong balance sheet
WHAT SETS US APART
We operate through a
network of autonomous
brands with management
teams that understand their
local markets.
Proud to be a member of the
Berkeley Group of Companies
OUR BUSINESS STRUCTURE OUR PRINCIPAL BUSINESS ACTIVITIES
BERKELEY’S BUSINESS IS ABOUT PLACEMAKING; IT’S ABOUT CREATING STRONG COMMUNITIES WHERE PEOPLE ENJOY A GREAT QUALITY OF LIFE.
BUILDING NEW HOMES AND PLACES
MARKETING AND CUSTOMER SERVICE
PLACEKEEPING AND STEWARDSHIP
THE QUALITY OF EACH
INDIVIDUAL HOME WE
BUILD AND OUR FOCUS
UPON PLACEMAKING ARE
AT THE FOREFRONT OF ALL
OUR ON-SITE ACTIVITIES.
WHETHER FIRST-TIME
BUYERS, FAMILIES,
EXPERIENCED INVESTORS,
RETAILERS, OUR PARTNERS
IN HOUSING ASSOCIATIONS
OR PROVIDERS OF
STUDENT ACCOMMODATION,
BERKELEY STRIVES
TO ENSURE THAT ITS
CUSTOMERS RECEIVE AN
UNPARALLELED SERVICE
WHEN BUYING FROM
BERKELEY.
WE ARE PROUD OF OUR
PRODUCT AND TAKE A
LONG-TERM VIEW ON
CUSTOMER SERVICE AND
PLACEKEEPING TO ENSURE
PEOPLE ASPIRE TO LIVE IN
THE PLACES WE BUILD FOR
DECADES TO COME.
See page 50 See page 51 See page 52
GREAT PLACES ARE DELIVERED BY BRINGING
TOGETHER TEAMS OF TALENTED PEOPLE
WITH A REAL PASSION FOR CREATING THE
BEST DEVELOPMENTS.
BERKELEY ANNUAL REPORT 2017 STRATEGIC REPORTBERKELEY ANNUAL REPORT 2017 STRATEGIC REPORT
46 47
02
GO
VE
RN
AN
CE
03
FIN
AN
CIA
LS
01 S
TR
AT
EG
IC R
EP
OR
T

IDENTIFYING AND
ACQUIRING LAND
DESIGNING AND PLANNING
NEW HOMES AND PLACES
WE ACQUIRE LAND SELECTIVELY WITH A FOCUS ON LONG-TERM, COMPLEX SCHEMES WHERE WE CAN USE OUR EXPERTISE TO ADD VALUE THROUGH CREATING NEW PLACES.
WE WORK WITH LOCAL AUTHORITIES, COMMUNITIES AND CONSULTANTS AND AIM TO CREATE UNIQUE PLACES CHARACTERISED BY THE QUALITY OF THEIR DESIGN, PUBLIC REALM, SUSTAINABILITY AND WHERE PEOPLE CAN ENJOY A GOOD QUALITY OF LIFE, NOW AND IN THE FUTURE.
HOMES FOR ALL
Berkeley builds for everyone, from
families to first-time buyers, students
to senior people, and luxury living to
affordable housing.
BESPOKE
There is no generic Berkeley development;
every design is bespoke, something
which is uncommon within the industry.
Attention to detail in design is paramount
to ensure homes meet the needs of our
customers and our specifications are
planned to meet the varied needs of all
types of homebuyers.
LOCATION
Our experienced land teams understand
our focus on investing selectively in the
right locations where there is underlying
demand for new homes, good transport
links and the scope to create successful
new places.
Prince of Wales Drive, Battersea
APPRAISAL
We undertake a rigorous internal appraisal
process to assess the opportunities and
risks of potential acquisitions and
pre-authorise all land offers at Board level,
which enables us to act innovatively and
decisively, and deliver on our offers.
RELATIONSHIPS
We believe that recognising the importance
of strong relationships and applying
local knowledge gives us a competitive
advantage and enables us to deliver new
places which are socially, environmentally
and economically successful.
COMPLEX DEVELOPMENTS
The Group thrives in adopting an
entrepreneurial approach in taking on
complex, challenging, brownfield land
which others are often reluctant to
undertake, but only where there are the
right commercial fundamentals, offering
the potential to add value and where we
have the vision to create special places.
FINANCIAL AGILITY
We ensure that the business is operated
with low financial risk through maintaining
a strong balance sheet. This ensures that
the business has the available resources to
act both quickly and opportunistically.
QUALITY
With the knowledge gained from our
completed developments, we strive
to design schemes which are of high
quality, sensitive to their heritage and
surroundings and meet the aspirations
of our customers and local and other
stakeholders.
PARTNERSHIPS
We engage closely with our partners in
the local authorities and surrounding
communities to understand stakeholders’
needs and prevailing sensitivities and
reflect these in our designs. We continue
to strengthen our reputation for quality
and for delivering on our commitments.
COMMUNITY
We create places which will endure as
settled, vibrant communities long into the
future. These are places where people
choose to live, work and spend their time,
and that directly encourage people’s
wellbeing and quality of life.
SUSTAINABILITY
We incorporate sustainable features
into our homes as standard, providing
homeowners with the opportunity to live
more sustainably.
Highwood, Horsham
Land at Winchester
BERKELEY ANNUAL REPORT 2017 STRATEGIC REPORTBERKELEY ANNUAL REPORT 2017 STRATEGIC REPORT
48 49
02
GO
VE
RN
AN
CE
03
FIN
AN
CIA
LS
01 S
TR
AT
EG
IC R
EP
OR
T

INTENSIVE MANAGEMENT
Each of our developments is led by a
dedicated project team responsible for
all aspects of detailed design, delivery,
quality, health and safety, commercial
appraisal and technical detail. The
coordination of professional teams of
consultants and contractors and strong
communication are critical to ensuring
the smooth delivery of every project.
SKILLED WORKFORCE
Recruiting and retaining a high calibre
workforce is crucial. We look to recognise
employees’ performance and potential
and provide support and development
opportunities, whilst also supporting our
wider contractor workforce and helping
to get more people into the industry.
CUSTOMER FOCUS
Our customers are at the heart of all our
decisions. We aim to understand their
needs and consistently meet or exceed
their expectations, whilst providing a
professional, efficient and helpful service
to make the homebuying process as
straightforward and enjoyable as possible.
Each customer receives tailored
information relating to their purchase
and has a dedicated point of contact
throughout the customer journey.
We benchmark our customer service
performance not just against the sector
but against the top businesses in the
country, and look continually to improve
our offering.
Sales teams across the business
have an in-depth knowledge of their
developments and help our customers
find the right home to suit their
needs. They have the knowledge and
understanding to explain the intricacies of
every development, from the specification
of each new home and the technical
details to the on-site amenities and wider
context of the scheme.
BUILDING NEW HOMES
AND PLACES
MARKETING AND
CUSTOMER SERVICE
THE QUALITY OF EACH INDIVIDUAL HOME WE BUILD AND OUR FOCUS UPON PLACEMAKING ARE AT THE FOREFRONT OF ALL OUR ON-SITE ACTIVITIES.
WHETHER FIRST-TIME BUYERS, FAMILIES, EXPERIENCED INVESTORS, RETAILERS, OUR PARTNERS IN HOUSING ASSOCIATIONS OR PROVIDERS OF STUDENT ACCOMMODATION, BERKELEY STRIVES TO ENSURE THAT ITS CUSTOMERS RECEIVE AN UNPARALLELED SERVICE WHEN BUYING FROM BERKELEY.
SUPPLY CHAIN RELATIONS
The support of our supply chain is
critical to the success of our business.
Engagement with our suppliers is
therefore key to remaining a client
of choice and achieving high quality
outcomes, on time and on budget.
INNOVATIVE BUILD SOLUTIONS
We combine our experience from
our previous developments with the
knowledge of our talented workforce to
enable us to successfully build complex
schemes. Our marketing suites are used
as the benchmark for build quality.
UK FIRST
Whilst we appreciate that international
investment plays a vital role in generating
the cash flow and confidence to
commence construction, all of our homes
are marketed in the UK either first, or at the
same time as they are offered overseas.
MEETING DEMAND
Strong underlying demand allows us to
forward sell our homes where possible.
This approach underpins our financial
performance and enables us to run the
business with low financial risk.
HEALTH AND SAFETY
We place the utmost importance on the
health, safety and wellbeing of our people
and our contractor teams on-site. Dedicated
health and safety managers oversee all of
our developments and health and safety
matters are prioritised, monitored and
debated at every Board meeting in every
company within the business.
CONSIDERATE CONSTRUCTION
The reputation of Berkeley amongst
its partners and stakeholders relies on
all of our project teams engaging with
surrounding communities, being a
responsible and considerate neighbour and
conducting our day-to-day operations in
an environmentally efficient manner.
Edenbrook, Hampshire
BERKELEY ANNUAL REPORT 2017 STRATEGIC REPORTBERKELEY ANNUAL REPORT 2017 STRATEGIC REPORT
50 51
02
GO
VE
RN
AN
CE
03
FIN
AN
CIA
LS
01 S
TR
AT
EG
IC R
EP
OR
T

PLACEKEEPING
AND STEWARDSHIP
WE ARE PROUD OF OUR PRODUCT AND TAKE A LONG-TERM VIEW ON BOTH PLACEMAKING AND PLACEKEEPING TO ENSURE PEOPLE ASPIRE TO LIVE IN THE PLACES WE BUILD FOR DECADES TO COME.
CUSTOMER PEACE OF MIND
Dedicated customer relationship
managers continue to provide a high
level of care and service after completion,
which we expect to match the quality of
our product across all of our schemes. All
homes are covered by a Berkeley warranty
in addition to the ten year NHBC warranty.
ESTATE MANAGEMENT
Our work on quality of life and social
sustainability has identified that
placekeeping is just as important as
placemaking and that they should be
thought of as two elements of the same
process. We want to ensure that our
developments remain great places in
which to live for decades to come.
Successful places need the right
long-term management strategy
and we work closely with appointed
managing agents to set the right tone
for our schemes long after they have
been completed. We are committed to
investigating and implementing excellent
forms of estate management and
community governance on our schemes.
FUTURE-PROOFING
We recognise that technology advances
rapidly, sometimes more quickly than
we can build our schemes, and that we
need to be at the forefront of employing
new techniques and enabling the right
infrastructure and technology to serve
our customers.
Brewery Wharf, Twickenham
Concierge at Merano
Woodberry Down, Finsbury Park
Residents’ summer party at 375 Kensington High Street
BERKELEY ANNUAL REPORT 2017 STRATEGIC REPORT
53
02
0G
OOOOVVVVV
ER
VE
RVV
ER
NA
NN
AN
NA
NA
NC
EC
E003
033
FFFFFFFFFFFFFI
FFFFFFFFFFFFFFFI
FFFFFFFFFI
FIIIIIIIIN
AN
NA
NN
AN
NA
NN
AN
NA
NN
AN
NA
NN
AN
NA
NA
NA
NN
AN
NA
NN
AN
AN
NA
NNA
NA
NNN
AN
NA
NA
NA
NAAAA
NAA
NA
NAAA
NA
NAAAAA
NA
NA
NNNNNNNNNNNNCCCCCCCCCCCCCCCCCCCCCCCCCCCCCC
ICCC
IC
ICCCCC
IACCCCC
IACC
IACCCCC
IIAIAIAIIIIAIAIAIAIAIAAAAALS
LS
LS
LS
LS
LS
LLS
LLS
LS
LS
LS
LSSSSSSSSS
01 S
TR
AT
EG
IC R
EP
OR
T
BERKELEY ANNUAL REPORT 2017 STRATEGIC REPORT
52

Abell and Cleland, Westminster
EVERY BERKELEY HOME IS QUALITY LED – ATTENTION TO DETAIL IS PARAMOUNT.
BERKELEY ANNUAL REPORT 2017 STRATEGIC REPORTBERKELEY ANNUAL REPORT 2017 STRATEGIC REPORT
54 55
02
GO
VE
RN
AN
CE
03
FIN
AN
CIA
LS
01 S
TR
AT
EG
IC R
EP
OR
T
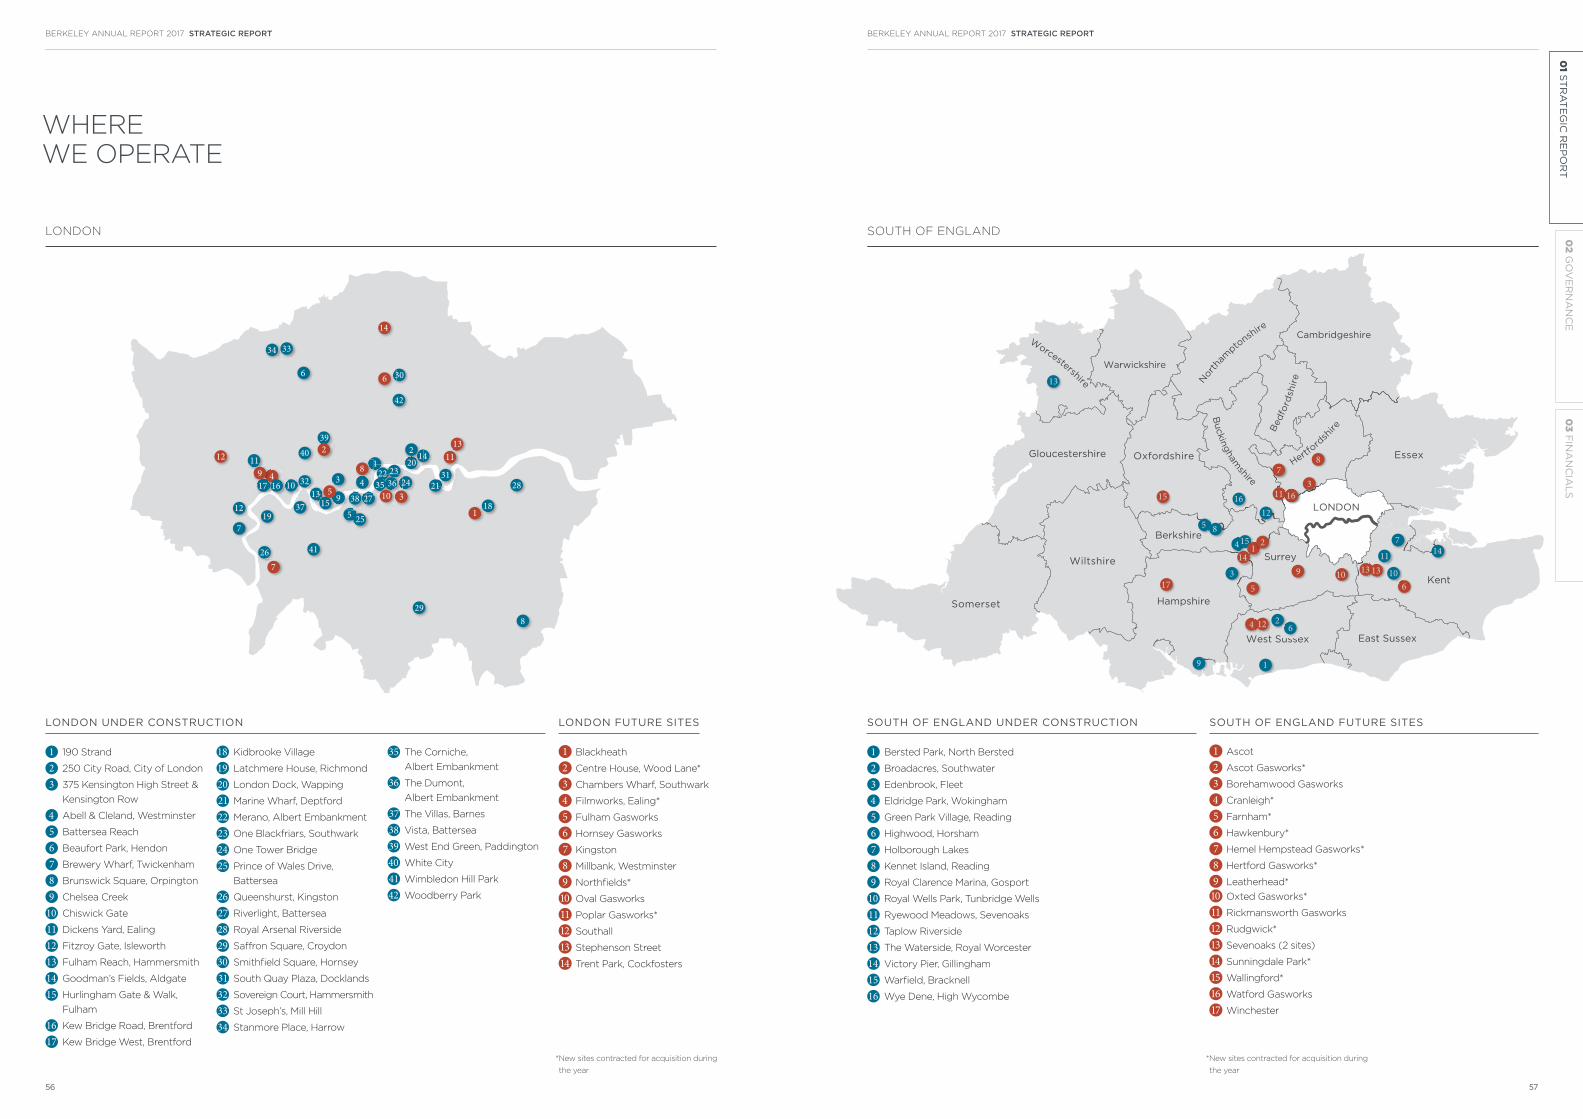
*New sites contracted for acquisition during
the year
*New sites contracted for acquisition during
the year
WHERE
WE OPERATE
LONDON SOUTH OF ENGLAND
12
39
7
37
10
12
32
42
306
34 33
18
28
29
41
5 25
26
17416
11
13 9 2738
431
312235
2324
15
21
142
36310
1311
5
40
6
2
14
1
8
8
7
19
209
1 190 Strand
2 250 City Road, City of London
3 375 Kensington High Street &
Kensington Row
4 Abell & Cleland, Westminster
5 Battersea Reach
6 Beaufort Park, Hendon
7 Brewery Wharf, Twickenham
8 Brunswick Square, Orpington
9 Chelsea Creek
10 Chiswick Gate
11 Dickens Yard, Ealing
12 Fitzroy Gate, Isleworth
13 Fulham Reach, Hammersmith
14 Goodman’s Fields, Aldgate
15 Hurlingham Gate & Walk,
Fulham
16 Kew Bridge Road, Brentford
17 Kew Bridge West, Brentford
18 Kidbrooke Village
19 Latchmere House, Richmond
20 London Dock, Wapping
21 Marine Wharf, Deptford
22 Merano, Albert Embankment
23 One Blackfriars, Southwark
24 One Tower Bridge
25 Prince of Wales Drive,
Battersea
26 Queenshurst, Kingston
27 Riverlight, Battersea
28 Royal Arsenal Riverside
29 Saffron Square, Croydon
30 Smithfield Square, Hornsey
31 South Quay Plaza, Docklands
32 Sovereign Court, Hammersmith
33 St Joseph’s, Mill Hill
34 Stanmore Place, Harrow
35 The Corniche,
Albert Embankment
36 The Dumont,
Albert Embankment
37 The Villas, Barnes
38 Vista, Battersea
39 West End Green, Paddington
40 White City
41 Wimbledon Hill Park
42 Woodberry Park
1 Blackheath
2 Centre House, Wood Lane*
3 Chambers Wharf, Southwark
4 Filmworks, Ealing*
5 Fulham Gasworks
6 Hornsey Gasworks
7 Kingston
8 Millbank, Westminster
9 Northfields*
10 Oval Gasworks
11 Poplar Gasworks*
12 Southall
13 Stephenson Street
14 Trent Park, Cockfosters
LONDON UNDER CONSTRUCTION LONDON FUTURE SITES
1 Bersted Park, North Bersted
2 Broadacres, Southwater
3 Edenbrook, Fleet
4 Eldridge Park, Wokingham
5 Green Park Village, Reading
6 Highwood, Horsham
7 Holborough Lakes
8 Kennet Island, Reading
9 Royal Clarence Marina, Gosport
10 Royal Wells Park, Tunbridge Wells
11 Ryewood Meadows, Sevenoaks
12 Taplow Riverside
13 The Waterside, Royal Worcester
14 Victory Pier, Gillingham
15 Warfield, Bracknell
16 Wye Dene, High Wycombe
SOUTH OF ENGLAND UNDER CONSTRUCTION SOUTH OF ENGLAND FUTURE SITES
Gloucestershire
LONDON
Wiltshire
Hampshire
West Sussex
Surrey
East Sussex
Kent
Essex
Warwickshire
Hertford
sh
ireBed
ford
shir
e
Buckin
gham
shire
Nor
tham
ptonsh
ire
Worcestershire
Cambridgeshire
Somerset
Berkshire
Oxfordshire
usse
f
1
e5 8
9
6
4
9 105
12
11
714
2
1612
10
6
11
316
17
14
15
13 13
1 2415
3
13
87
1 Ascot
2 Ascot Gasworks*
3 Borehamwood Gasworks
4 Cranleigh*
5 Farnham*
6 Hawkenbury*
7 Hemel Hempstead Gasworks*
8 Hertford Gasworks*
9 Leatherhead*
10 Oxted Gasworks*
11 Rickmansworth Gasworks
12 Rudgwick*
13 Sevenoaks (2 sites)
14 Sunningdale Park*
15 Wallingford*
16 Watford Gasworks
17 Winchester
BERKELEY ANNUAL REPORT 2017 STRATEGIC REPORTBERKELEY ANNUAL REPORT 2017 STRATEGIC REPORT
56 57
02
GO
VE
RN
AN
CE
03
FIN
AN
CIA
LS
01 S
TR
AT
EG
IC R
EP
OR
T

HOW WE
MANAGE RISK
RISK APPETITE
The Board is responsible for setting and monitoring the risk
appetite for Berkeley when pursuing its strategic objectives. The
Board’s approach to, and appetite for risk is summarised below:
CYCLICAL MARKET
Berkeley’s business model
is centred on the Board’s
appreciation of the risks
of the cyclical market in
which the business operates,
where market sentiment and
transaction levels can change
quickly, requiring us to adopt
a flexible approach to our
investment decisions.
OPERATIONAL COMPLEXITY
The business model also
recognises the complexity of
the planning and delivery of
the sites Berkeley undertakes,
and mitigates this risk by
focusing its activities in
London and the South East,
recognising the importance
of relationships and local
knowledge and having highly
skilled teams in place.
AUTONOMY AND VALUES
We have recognised brands
and autonomous, talented
and experienced teams who
embrace Berkeley’s core values
in their approach. We create
bespoke solutions for each site
which requires experienced,
intensive management and
as such do not produce a
standard product.
FINANCIAL STRENGTH
This translates into an approach
that, at all times through the
cycle, keeps financial risk low in
recognition of the operational
risks within the business (see
page 61).
THE ASSESSMENT OF RISK AND EMBEDDING RISK MANAGEMENT THROUGHOUT BERKELEY IS A KEY ELEMENT OF SETTING AND DELIVERING THE GROUP’S STRATEGY.
The Group’s risk appetite is reviewed annually and approved by the Board. This review guides the actions we take to
implement our strategy.
The Corniche, Albert Embankment
BERKELEY ANNUAL REPORT 2017 STRATEGIC REPORT
59
02
GO
VE
RN
AN
CE
03
FIN
AN
CIA
LS
01 S
TR
AT
EG
IC R
EP
OR
T
BERKELEY ANNUAL REPORT 2017 STRATEGIC REPORT
58

HOW WE
MANAGE RISK
RISK MANAGEMENT FRAMEWORK
The Board takes overall responsibility for
risk management, and the assessment of
risk and embedding risk management into
the business is a key element of setting
and delivering our strategy. Our approach
combines a top-down strategic review and
feedback of risks by the Board, coupled
with a bottom-up review and reporting of
risk by each operating business.
The top-down assessment of risk by the
Board includes a review of the external
environment in which Berkeley operates,
coupled with a deep seated knowledge
of our industry and operations based on
the substantial experience of the Board.
This takes into account the likelihood and
impact of risks, whether pre-existing or
emerging, which may materialise in the
short or longer-term.
A fundamental principle of the operating
structure of the Group is that the prime
responsibility for assessing, managing
and monitoring the majority of the risks
rests with operational management, thus
ensuring risk management is embedded
in our day-to-day operations.
Risk registers at operational level are
overlain by wider strategic risks facing
the Group, such as macro-economic risk.
This is then assessed and managed by the
Board and Executive Committee.
The Audit Committee has responsibility
for ensuring the effectiveness of risk
management and internal controls on behalf
of the Board. The controls and processes
surrounding how we assess risk across
the Group are explained further in the
Corporate Governance report on page 84.
The principal operating risks and our
approach to mitigating them are described
in more detail on pages 62 to 69.
VIABILITY STATEMENT
In accordance with provision C2.2
of the 2014 revision of the UK
Corporate Governance Code, the
Directors have assessed the longer
term viability of the Group.
The Directors have undertaken their
assessment over a four year period from
1 May 2017 to 30 April 2021. The end of
this period coincides with the end of the
earnings guidance provided by the Board
and broadly with the end of the current
Shareholder Returns Programme. The
majority of the Group’s developments
are long-term in nature and the Board’s
strategic
planning reviews
cover at least
this timeframe.
Furthermore,
the Group owns
or controls the
land required
for this period
and accordingly
there is sufficient
detail within the individual site cash
flow forecasts to enable a meaningful
assessment over this period.
In making its assessment, the Directors
have considered the principal risks
facing the Group and how the Group
mitigates such risks, which are
summarised on pages 62 to 69 of the
Strategic Review. The majority of risks
to the Group are operational in nature
primarily because the sites acquired
are generally complex, long-term
regeneration schemes and therefore
risk management is appropriately
embedded in the day-to-day business
processes and controls. The individual
site cash flow forecasts, which are used
to prepare the Group’s consolidated
cash forecasts, take account of these
individual site operational risks.
The Group’s business model, as set out
on pages 46 and 47 of the Strategic
Review, recognises these operational
risks, and that the property market is
inherently cyclical, and accordingly a
core risk management principal for the
Group is to keep financial risk sufficiently
low through forward selling where
possible, maintaining a sound balance
sheet and headroom within its financing
activities. The Group’s consolidated
cash flow forecasts include appropriate
allowances for discretionary investment
and the quantum and timing of this is
in turn subject to the delivery of the
individual site
operational cash
flows. The viability
assessment has
considered the
impact of reduced
sales activity in
the four year
period from the
business plan
levels as a result
of adverse macro-economic conditions
and the Directors have also taken into
account appropriate mitigating actions
which may be instigated in response,
primarily around curtailed discretionary
investment, such as lower new land
purchases or deferment of new site
starts, amongst others.
Based on the assessment, the Directors
confirm that they have a reasonable
expectation that the Group will be able
to continue in operation and meet its
liabilities as they fall due over the four
year period commencing 1 May 2017.
IN MAKING ITS ASSESSMENT,
THE DIRECTORS HAVE
CONSIDERED THE PRINCIPAL
RISKS FACING THE GROUP
AND HOW THE GROUP
MITIGATES SUCH RISKS.
MANAGEMENT OF FINANCIAL RISKS
Berkeley adopts a prudent approach to managing these financial risks.
EXPOSURE TO FINANCIAL RISKS
The financial risks to which Berkeley is
exposed include:
LIQUIDITY RISK
The risk that the funding required for
the Group to pursue its activities may
not be available.
MARKET CREDIT RISK
The risk that counterparties (mainly
customers) will default on their contractual
obligations, resulting in a loss to the
Group. The Group’s exposure to credit risk
is comprised of cash and cash equivalents
and trade and other receivables.
MARKET INTEREST RATE RISK
The risk that Group financing activities
are affected by fluctuations in market
interest rates.
OTHER FINANCIAL RISKS
Berkeley contracts all of its sales and the
vast majority of its purchases in sterling,
and so has no significant exposure to
currency risk, but does recognise that
its credit risk includes receivables from
customers in a range of jurisdictions who
are themselves exposed to currency risk in
contracting in sterling.
TREASURY POLICY AND CENTRAL OVERVIEW
The Board approves treasury policy and
senior management control day-to-day
operations. Relationships with banks
and cash management are coordinated
centrally as a Group function. The
treasury policy is intended to maintain
an appropriate capital structure to
manage the financial risks identified
and provide the right platform for the
business to manage its operating risks.
LOW GEARING
The Group is currently financing its
operations through shareholder equity,
supported by over £285 million of net
cash on the balance sheet. This in turn
has mitigated its current exposure to
interest rate risk.
HEADROOM PROVIDED BY BANK FACILITIES
The Group extended its borrowing
facilities in the year, and now has
£750 million of committed credit
facilities maturing in November 2021
(2016: £575 million). A term loan of
£300 million was introduced and
the revolving credit facility reduced
from £575 million to £450 million. The
facilities retain optional extensions
to November 2023. Berkeley has a
strong working partnership with the six
banks that provide the facilities (listed
on page 155) and is key to Berkeley’s
approach to mitigating liquidity risk.
FORWARD SALES
Berkeley’s approach to forward
selling new homes to customers
provides good visibility over future
cash flows, as expressed in cash due
on forward sales which stands at
£2,743 million at 30 April 2017. It also
helps mitigate market credit risk by
virtue of customers’ deposits held
from the point of unconditional
exchange of contracts with customers.
LAND HOLDINGS
By investing opportunistically in land
at the right point in the cycle, holding a
clear development pipeline in our land
holdings and continually optimising
our existing holdings, we are not under
pressure to buy new land when it would
be wrong for the long-term returns for
the business.
DETAILED APPRAISAL OF SPENDING COMMITMENTS
A culture which prioritises an
understanding of the impact of all
decisions on the Group’s spending
commitments and hence its balance
sheet, alongside weekly and monthly
reviews of cash flow forecasts at
operating company, divisional and
Group levels, recognises that cash flow
management is central to the continued
success of Berkeley.
BERKELEY ANNUAL REPORT 2017 STRATEGIC REPORTBERKELEY ANNUAL REPORT 2017 STRATEGIC REPORT
60 61
02
GO
VE
RN
AN
CE
03
FIN
AN
CIA
LS
01 S
TR
AT
EG
IC R
EP
OR
T

HOW WE
MANAGE RISK
COMMENTARY
Although UK economic performance has been resilient over the last year,
uncertainty remains over the economic outlook for the UK following the results
of the EU referendum in June 2016 and US elections in November 2016.
Following an inevitable hiatus immediately following the Brexit vote, markets have
since stabilised, although there is no consensus view as to how both these events,
and the recent UK General Election, will impact the UK economy in the short to
medium-term.
Foreign exchange markets remain volatile and whilst interest rates remain low,
UK inflation is increasing, partly driven by the devaluation of sterling. Consequently,
there is likely to be pressure on consumer earnings going forward.
See pages 6 and 8
2017 Performance Highlights see pages 2 and 3
- Net asset value per share
- Profit before tax
- Basic earnings per share
- Return on equity
- Basic EPS
RISK DESCRIPTION AND IMPACT
As a property developer, Berkeley’s
business is sensitive to wider economic
factors such as changes in interest
rates, employment levels and general
consumer confidence.
Some customers are also sensitive
to changes in the sterling exchange
rate in terms of their buying decisions
or ability to meet their obligations
under contracts.
Changes to economic conditions in the
UK, Europe and worldwide may lead to a
reduction in demand for housing which
could impact on the Group’s ability to
deliver its corporate strategy.
APPROACH TO MITIGATING RISK
Recognition that Berkeley operates in a cyclical market is
central to our strategy and maintaining a strong financial
position is fundamental to our business model and protects
us against adverse changes in economic conditions.
Land investment in all market conditions is carefully targeted
and underpinned by demand fundamentals and a solid viability
case, respecting the cyclical nature of the property industry.
Levels of committed expenditure are carefully monitored
against forward sales secured, cash levels and headroom
against our available bank facilities, with the objective of
keeping financial risk low to mitigate the operating risks of
delivery in uncertain markets.
Production programmes are continually assessed, depending
upon market conditions.
The business is committed to operating at an optimal size,
with a strong balance sheet, through autonomous businesses
to maintain the flexibility to react swiftly, when necessary, to
changes in market conditions.
ECONOMIC OUTLOOK
There is significant uncertainty over the nature of Britain’s exit from and
future relations with the EU, alongside how this will impact the UK economy.
The negotiations and transition are expected to take several years, creating
uncertainty that may impact investment levels in the UK from both domestic
and overseas customers and investors, and access to labour markets.
See pages 6 and 8
Significant political events, including
the impact of the vote to leave the EU,
may impact Berkeley’s business through,
for instance, the reluctance of buyers
to make investment decisions due to
political uncertainty and, subsequently,
specific policies and regulation may
be introduced that directly impact our
business model.
Whilst we cannot directly influence political events, the risks
are taken into account when setting our business strategy and
operating model. In addition, we actively engage in the debate
on policy decisions.
POLITICAL OUTLOOK
Following the increased level of risk highlighted last year resulting from the
increased level of property taxes and other regulatory changes, the risk this year
remains at a similar level.
Given the ongoing under supply of new housing in London and the impact this
has on London remaining an inclusive and open global city, the Government’s
White Paper and the Mayor’s continued focus on housing are welcomed, albeit
that these will take some time to effect change given competing priorities.
See pages 6 and 8
Adverse changes to Government policy
on areas such as taxation, housing and
the environment could restrict the
ability of the Group to deliver its strategy.
Failure to comply with laws and
regulations could expose the Group to
penalties and reputational damage.
.
Berkeley is focused geographically on London and the South
of England, which limits our risk when understanding and
determining the impact of new regulation across multiple
locations and jurisdictions.
The effects of changes to Government policies at all levels are
closely monitored by operating businesses and the Board, and
representations made to policy-setters where appropriate.
Berkeley’s experienced teams are well placed to interpret and
implement new regulations at the appropriate time through
direct lines of communication across the Group, with support
from internal and external legal advisors.
Detailed policies and procedures are in place where
appropriate to the prevailing regulations and these are
communicated to all staff.
REGULATION
EXTERNAL RISKS
LIKELIHOOD CHANGE
DURING YEAR
IMPACT CHANGE
DURING YEAR
BERKELEY ANNUAL REPORT 2017 STRATEGIC REPORTBERKELEY ANNUAL REPORT 2017 STRATEGIC REPORT
62 63
02
GO
VE
RN
AN
CE
03
FIN
AN
CIA
LS
01 S
TR
AT
EG
IC R
EP
OR
T
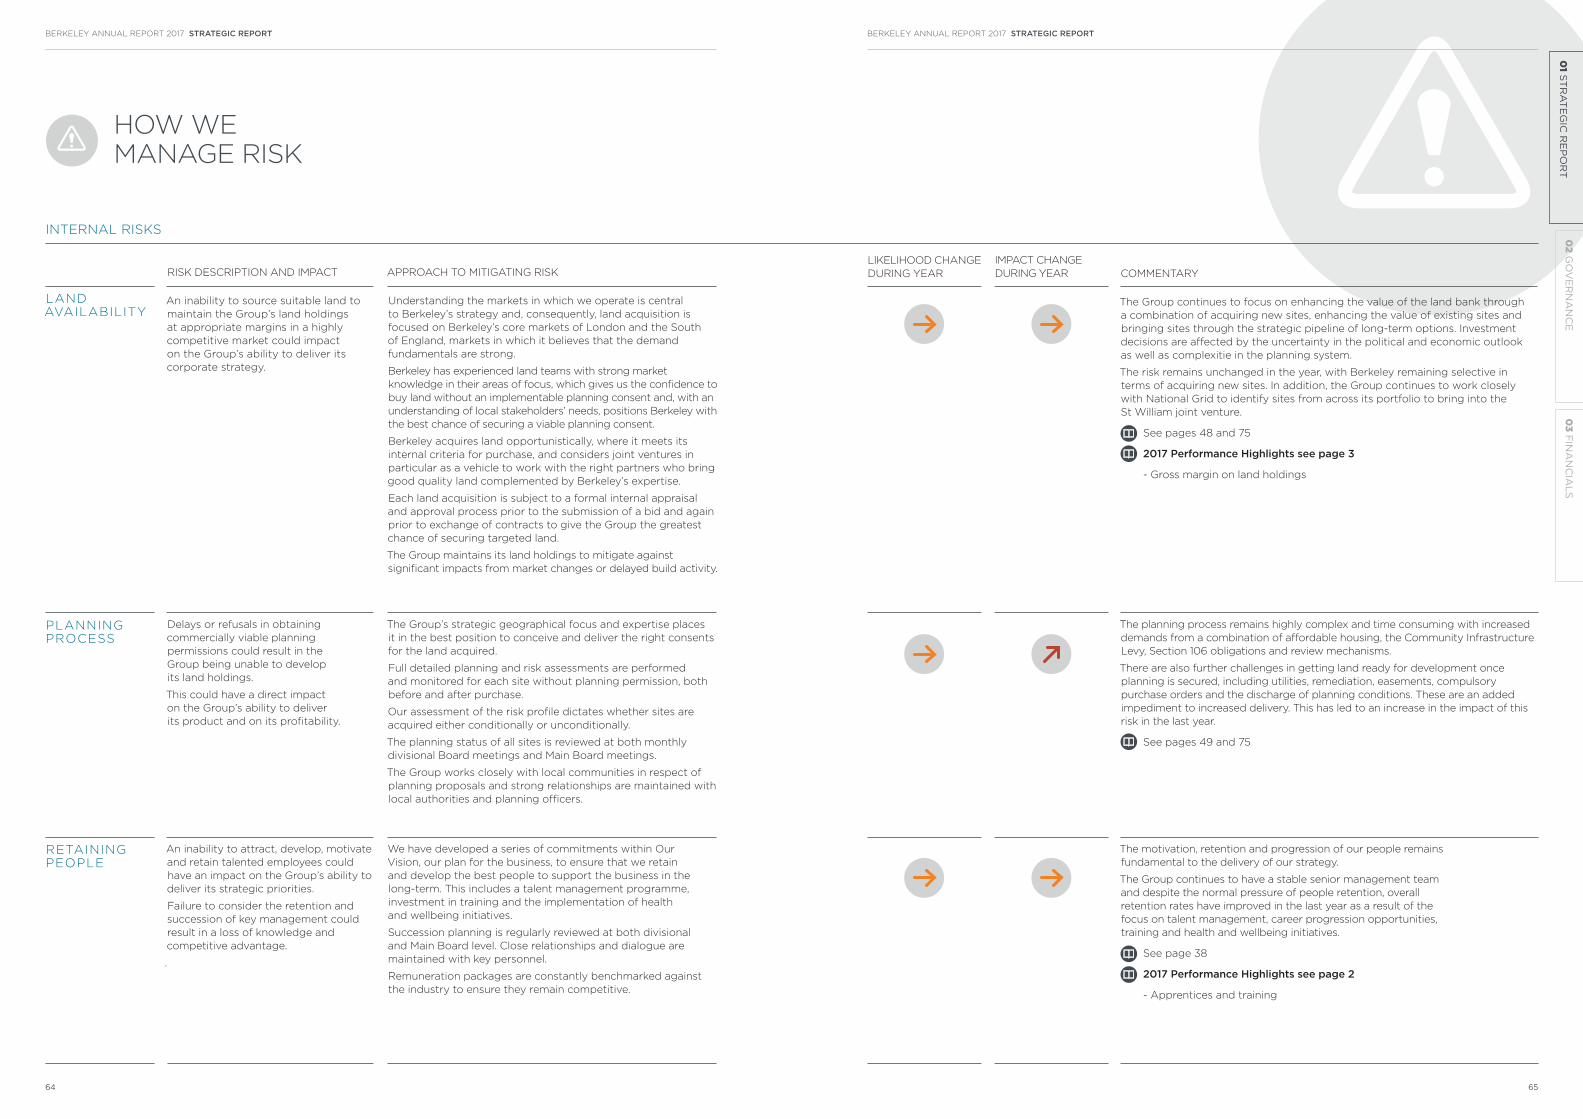
HOW WE
MANAGE RISK
COMMENTARY
The Group continues to focus on enhancing the value of the land bank through
a combination of acquiring new sites, enhancing the value of existing sites and
bringing sites through the strategic pipeline of long-term options. Investment
decisions are affected by the uncertainty in the political and economic outlook
as well as complexitie in the planning system.
The risk remains unchanged in the year, with Berkeley remaining selective in
terms of acquiring new sites. In addition, the Group continues to work closely
with National Grid to identify sites from across its portfolio to bring into the
St William joint venture.
See pages 48 and 75
2017 Performance Highlights see page 3
- Gross margin on land holdings
RISK DESCRIPTION AND IMPACT
An inability to source suitable land to
maintain the Group’s land holdings
at appropriate margins in a highly
competitive market could impact
on the Group’s ability to deliver its
corporate strategy.
APPROACH TO MITIGATING RISK
Understanding the markets in which we operate is central
to Berkeley’s strategy and, consequently, land acquisition is
focused on Berkeley’s core markets of London and the South
of England, markets in which it believes that the demand
fundamentals are strong.
Berkeley has experienced land teams with strong market
knowledge in their areas of focus, which gives us the confidence to
buy land without an implementable planning consent and, with an
understanding of local stakeholders’ needs, positions Berkeley with
the best chance of securing a viable planning consent.
Berkeley acquires land opportunistically, where it meets its
internal criteria for purchase, and considers joint ventures in
particular as a vehicle to work with the right partners who bring
good quality land complemented by Berkeley’s expertise.
Each land acquisition is subject to a formal internal appraisal
and approval process prior to the submission of a bid and again
prior to exchange of contracts to give the Group the greatest
chance of securing targeted land.
The Group maintains its land holdings to mitigate against
significant impacts from market changes or delayed build activity.
LAND AVAILABILITY
The planning process remains highly complex and time consuming with increased
demands from a combination of affordable housing, the Community Infrastructure
Levy, Section 106 obligations and review mechanisms.
There are also further challenges in getting land ready for development once
planning is secured, including utilities, remediation, easements, compulsory
purchase orders and the discharge of planning conditions. These are an added
impediment to increased delivery. This has led to an increase in the impact of this
risk in the last year.
See pages 49 and 75
Delays or refusals in obtaining
commercially viable planning
permissions could result in the
Group being unable to develop
its land holdings.
This could have a direct impact
on the Group’s ability to deliver
its product and on its profitability.
The Group’s strategic geographical focus and expertise places
it in the best position to conceive and deliver the right consents
for the land acquired.
Full detailed planning and risk assessments are performed
and monitored for each site without planning permission, both
before and after purchase.
Our assessment of the risk profile dictates whether sites are
acquired either conditionally or unconditionally.
The planning status of all sites is reviewed at both monthly
divisional Board meetings and Main Board meetings.
The Group works closely with local communities in respect of
planning proposals and strong relationships are maintained with
local authorities and planning officers.
PLANNING PROCESS
The motivation, retention and progression of our people remains
fundamental to the delivery of our strategy.
The Group continues to have a stable senior management team
and despite the normal pressure of people retention, overall
retention rates have improved in the last year as a result of the
focus on talent management, career progression opportunities,
training and health and wellbeing initiatives.
See page 38
2017 Performance Highlights see page 2
- Apprentices and training
An inability to attract, develop, motivate
and retain talented employees could
have an impact on the Group’s ability to
deliver its strategic priorities.
Failure to consider the retention and
succession of key management could
result in a loss of knowledge and
competitive advantage.
.
We have developed a series of commitments within Our
Vision, our plan for the business, to ensure that we retain
and develop the best people to support the business in the
long-term. This includes a talent management programme,
investment in training and the implementation of health
and wellbeing initiatives.
Succession planning is regularly reviewed at both divisional
and Main Board level. Close relationships and dialogue are
maintained with key personnel.
Remuneration packages are constantly benchmarked against
the industry to ensure they remain competitive.
RETAINING PEOPLE
INTERNAL RISKS
LIKELIHOOD CHANGE
DURING YEAR
IMPACT CHANGE
DURING YEAR
BERKELEY ANNUAL REPORT 2017 STRATEGIC REPORTBERKELEY ANNUAL REPORT 2017 STRATEGIC REPORT
64 65
02
GO
VE
RN
AN
CE
03
FIN
AN
CIA
LS
01 S
TR
AT
EG
IC R
EP
OR
T
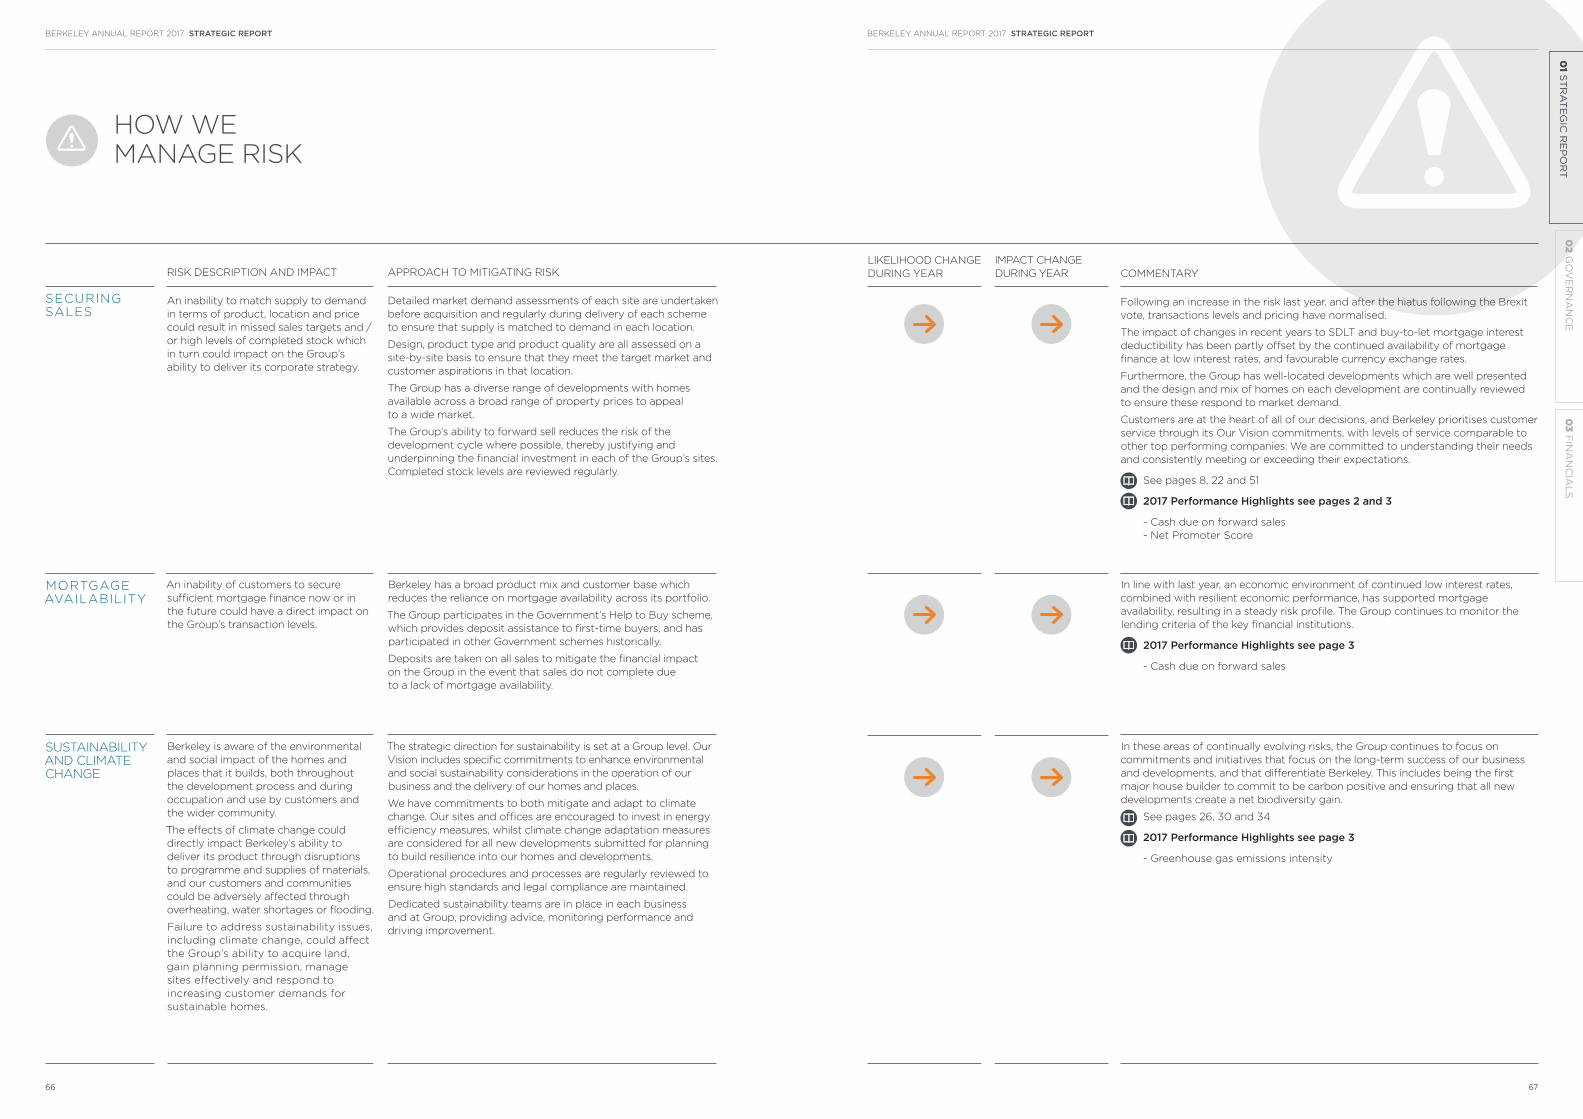
HOW WE
MANAGE RISK
COMMENTARY
Following an increase in the risk last year, and after the hiatus following the Brexit
vote, transactions levels and pricing have normalised.
The impact of changes in recent years to SDLT and buy-to-let mortgage interest
deductibility has been partly offset by the continued availability of mortgage
finance at low interest rates, and favourable currency exchange rates.
Furthermore, the Group has well-located developments which are well presented
and the design and mix of homes on each development are continually reviewed
to ensure these respond to market demand.
Customers are at the heart of all of our decisions, and Berkeley prioritises customer
service through its Our Vision commitments, with levels of service comparable to
other top performing companies. We are committed to understanding their needs
and consistently meeting or exceeding their expectations.
See pages 8, 22 and 51
2017 Performance Highlights see pages 2 and 3
- Cash due on forward sales
- Net Promoter Score
RISK DESCRIPTION AND IMPACT
An inability to match supply to demand
in terms of product, location and price
could result in missed sales targets and /
or high levels of completed stock which
in turn could impact on the Group’s
ability to deliver its corporate strategy.
APPROACH TO MITIGATING RISK
Detailed market demand assessments of each site are undertaken
before acquisition and regularly during delivery of each scheme
to ensure that supply is matched to demand in each location.
Design, product type and product quality are all assessed on a
site-by-site basis to ensure that they meet the target market and
customer aspirations in that location.
The Group has a diverse range of developments with homes
available across a broad range of property prices to appeal
to a wide market.
The Group’s ability to forward sell reduces the risk of the
development cycle where possible, thereby justifying and
underpinning the financial investment in each of the Group’s sites.
Completed stock levels are reviewed regularly.
SECURING SALES
LIKELIHOOD CHANGE
DURING YEAR
IMPACT CHANGE
DURING YEAR
In these areas of continually evolving risks, the Group continues to focus on
commitments and initiatives that focus on the long-term success of our business
and developments, and that differentiate Berkeley. This includes being the first
major house builder to commit to be carbon positive and ensuring that all new
developments create a net biodiversity gain.
See pages 26, 30 and 34
2017 Performance Highlights see page 3
- Greenhouse gas emissions intensity
Berkeley is aware of the environmental
and social impact of the homes and
places that it builds, both throughout
the development process and during
occupation and use by customers and
the wider community.
The effects of climate change could
directly impact Berkeley’s ability to
deliver its product through disruptions
to programme and supplies of materials,
and our customers and communities
could be adversely affected through
overheating, water shortages or flooding.
Failure to address sustainability issues,
including climate change, could affect
the Group’s ability to acquire land,
gain planning permission, manage
sites effectively and respond to
increasing customer demands for
sustainable homes.
The strategic direction for sustainability is set at a Group level. Our
Vision includes specific commitments to enhance environmental
and social sustainability considerations in the operation of our
business and the delivery of our homes and places.
We have commitments to both mitigate and adapt to climate
change. Our sites and offices are encouraged to invest in energy
efficiency measures, whilst climate change adaptation measures
are considered for all new developments submitted for planning
to build resilience into our homes and developments.
Operational procedures and processes are regularly reviewed to
ensure high standards and legal compliance are maintained.
Dedicated sustainability teams are in place in each business
and at Group, providing advice, monitoring performance and
driving improvement.
SUSTAINABILITY AND CLIMATE CHANGE
In line with last year, an economic environment of continued low interest rates,
combined with resilient economic performance, has supported mortgage
availability, resulting in a steady risk profile. The Group continues to monitor the
lending criteria of the key financial institutions.
2017 Performance Highlights see page 3
- Cash due on forward sales
An inability of customers to secure
sufficient mortgage finance now or in
the future could have a direct impact on
the Group’s transaction levels.
Berkeley has a broad product mix and customer base which
reduces the reliance on mortgage availability across its portfolio.
The Group participates in the Government’s Help to Buy scheme,
which provides deposit assistance to first-time buyers, and has
participated in other Government schemes historically.
Deposits are taken on all sales to mitigate the financial impact
on the Group in the event that sales do not complete due
to a lack of mortgage availability.
MORTGAGE AVAILABILITY
BERKELEY ANNUAL REPORT 2017 STRATEGIC REPORTBERKELEY ANNUAL REPORT 2017 STRATEGIC REPORT
66 67
02
GO
VE
RN
AN
CE
03
FIN
AN
CIA
LS
01 S
TR
AT
EG
IC R
EP
OR
T
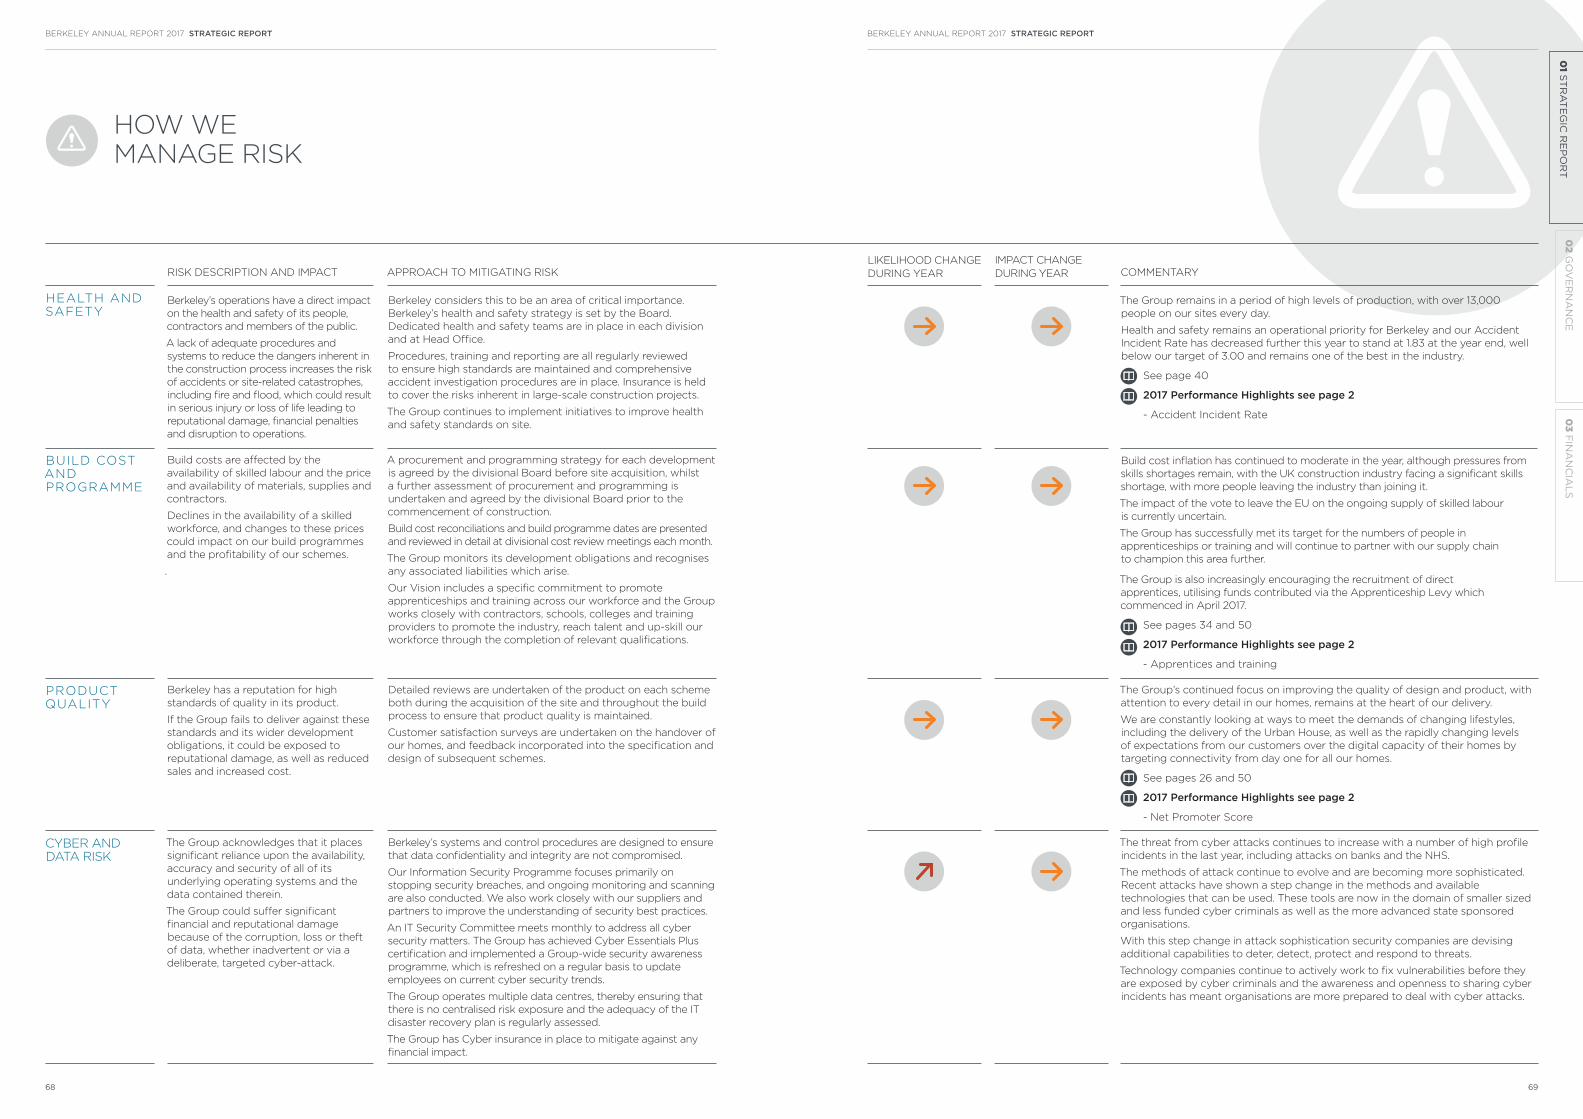
HOW WE
MANAGE RISK
LIKELIHOOD CHANGE
DURING YEAR
IMPACT CHANGE
DURING YEAR
Build cost inflation has continued to moderate in the year, although pressures from
skills shortages remain, with the UK construction industry facing a significant skills
shortage, with more people leaving the industry than joining it.
The impact of the vote to leave the EU on the ongoing supply of skilled labour
is currently uncertain.
The Group has successfully met its target for the numbers of people in
apprenticeships or training and will continue to partner with our supply chain
to champion this area further.
The Group is also increasingly encouraging the recruitment of direct
apprentices, utilising funds contributed via the Apprenticeship Levy which
commenced in April 2017.
See pages 34 and 50
2017 Performance Highlights see page 2
- Apprentices and training
Build costs are affected by the
availability of skilled labour and the price
and availability of materials, supplies and
contractors.
Declines in the availability of a skilled
workforce, and changes to these prices
could impact on our build programmes
and the profitability of our schemes.
.
A procurement and programming strategy for each development
is agreed by the divisional Board before site acquisition, whilst
a further assessment of procurement and programming is
undertaken and agreed by the divisional Board prior to the
commencement of construction.
Build cost reconciliations and build programme dates are presented
and reviewed in detail at divisional cost review meetings each month.
The Group monitors its development obligations and recognises
any associated liabilities which arise.
Our Vision includes a specific commitment to promote
apprenticeships and training across our workforce and the Group
works closely with contractors, schools, colleges and training
providers to promote the industry, reach talent and up-skill our
workforce through the completion of relevant qualifications.
BUILD COST AND PROGRAMME
The Group’s continued focus on improving the quality of design and product, with
attention to every detail in our homes, remains at the heart of our delivery.
We are constantly looking at ways to meet the demands of changing lifestyles,
including the delivery of the Urban House, as well as the rapidly changing levels
of expectations from our customers over the digital capacity of their homes by
targeting connectivity from day one for all our homes.
See pages 26 and 50
2017 Performance Highlights see page 2
- Net Promoter Score
Berkeley has a reputation for high
standards of quality in its product.
If the Group fails to deliver against these
standards and its wider development
obligations, it could be exposed to
reputational damage, as well as reduced
sales and increased cost.
Detailed reviews are undertaken of the product on each scheme
both during the acquisition of the site and throughout the build
process to ensure that product quality is maintained.
Customer satisfaction surveys are undertaken on the handover of
our homes, and feedback incorporated into the specification and
design of subsequent schemes.
PRODUCT QUALITY
The threat from cyber attacks continues to increase with a number of high profile
incidents in the last year, including attacks on banks and the NHS.
The methods of attack continue to evolve and are becoming more sophisticated.
Recent attacks have shown a step change in the methods and available
technologies that can be used. These tools are now in the domain of smaller sized
and less funded cyber criminals as well as the more advanced state sponsored
organisations.
With this step change in attack sophistication security companies are devising
additional capabilities to deter, detect, protect and respond to threats.
Technology companies continue to actively work to fix vulnerabilities before they
are exposed by cyber criminals and the awareness and openness to sharing cyber
incidents has meant organisations are more prepared to deal with cyber attacks.
The Group acknowledges that it places
significant reliance upon the availability,
accuracy and security of all of its
underlying operating systems and the
data contained therein.
The Group could suffer significant
financial and reputational damage
because of the corruption, loss or theft
of data, whether inadvertent or via a
deliberate, targeted cyber-attack.
Berkeley’s systems and control procedures are designed to ensure
that data confidentiality and integrity are not compromised.
Our Information Security Programme focuses primarily on
stopping security breaches, and ongoing monitoring and scanning
are also conducted. We also work closely with our suppliers and
partners to improve the understanding of security best practices.
An IT Security Committee meets monthly to address all cyber
security matters. The Group has achieved Cyber Essentials Plus
certification and implemented a Group-wide security awareness
programme, which is refreshed on a regular basis to update
employees on current cyber security trends.
The Group operates multiple data centres, thereby ensuring that
there is no centralised risk exposure and the adequacy of the IT
disaster recovery plan is regularly assessed.
The Group has Cyber insurance in place to mitigate against any
financial impact.
CYBER AND DATA RISK
COMMENTARY
The Group remains in a period of high levels of production, with over 13,000
people on our sites every day.
Health and safety remains an operational priority for Berkeley and our Accident
Incident Rate has decreased further this year to stand at 1.83 at the year end, well
below our target of 3.00 and remains one of the best in the industry.
See page 40
2017 Performance Highlights see page 2
- Accident Incident Rate
RISK DESCRIPTION AND IMPACT
Berkeley’s operations have a direct impact
on the health and safety of its people,
contractors and members of the public.
A lack of adequate procedures and
systems to reduce the dangers inherent in
the construction process increases the risk
of accidents or site-related catastrophes,
including fire and flood, which could result
in serious injury or loss of life leading to
reputational damage, financial penalties
and disruption to operations.
APPROACH TO MITIGATING RISK
Berkeley considers this to be an area of critical importance.
Berkeley’s health and safety strategy is set by the Board.
Dedicated health and safety teams are in place in each division
and at Head Office.
Procedures, training and reporting are all regularly reviewed
to ensure high standards are maintained and comprehensive
accident investigation procedures are in place. Insurance is held
to cover the risks inherent in large-scale construction projects.
The Group continues to implement initiatives to improve health
and safety standards on site.
HEALTH AND SAFETY
BERKELEY ANNUAL REPORT 2017 STRATEGIC REPORTBERKELEY ANNUAL REPORT 2017 STRATEGIC REPORT
68 69
02
GO
VE
RN
AN
CE
03
FIN
AN
CIA
LS
01 S
TR
AT
EG
IC R
EP
OR
T

PLACEMAKING IS A CRAFT. IT IS NOT A PRODUCTION LINE. AS WELL AS GREAT ARCHITECTURE AND STREETS, RESIDENTS ALSO WANT A GOOD SOCIAL LIFE.
Fitzroy Gate, Old Isleworth
BERKELEY ANNUAL REPORT 2017 STRATEGIC REPORTBERKELEY ANNUAL REPORT 2017 STRATEGIC REPORT
70 71
02
GO
VE
RN
AN
CE
03
FIN
AN
CIA
LS
01 S
TR
AT
EG
IC R
EP
OR
T
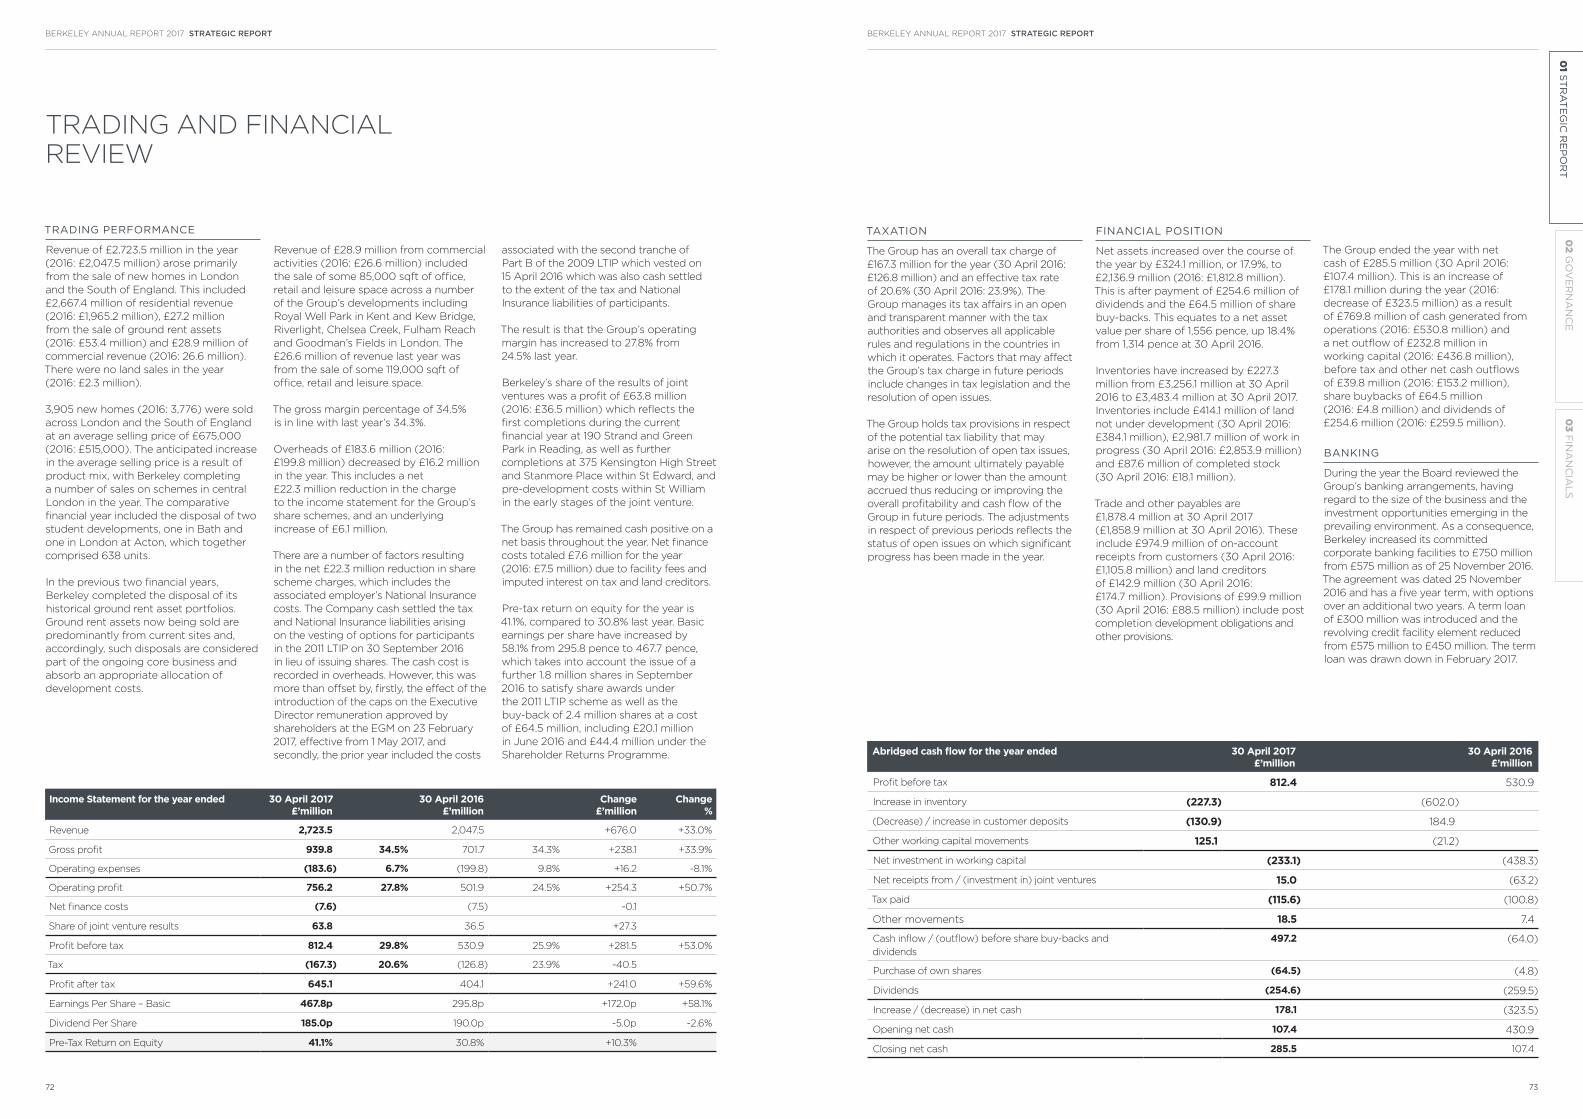
TRADING AND FINANCIAL
REVIEW
TRADING PERFORMANCE
Revenue of £2,723.5 million in the year
(2016: £2,047.5 million) arose primarily
from the sale of new homes in London
and the South of England. This included
£2,667.4 million of residential revenue
(2016: £1,965.2 million), £27.2 million
from the sale of ground rent assets
(2016: £53.4 million) and £28.9 million of
commercial revenue (2016: 26.6 million).
There were no land sales in the year
(2016: £2.3 million).
3,905 new homes (2016: 3,776) were sold
across London and the South of England
at an average selling price of £675,000
(2016: £515,000). The anticipated increase
in the average selling price is a result of
product mix, with Berkeley completing
a number of sales on schemes in central
London in the year. The comparative
financial year included the disposal of two
student developments, one in Bath and
one in London at Acton, which together
comprised 638 units.
In the previous two financial years,
Berkeley completed the disposal of its
historical ground rent asset portfolios.
Ground rent assets now being sold are
predominantly from current sites and,
accordingly, such disposals are considered
part of the ongoing core business and
absorb an appropriate allocation of
development costs.
Revenue of £28.9 million from commercial
activities (2016: £26.6 million) included
the sale of some 85,000 sqft of office,
retail and leisure space across a number
of the Group’s developments including
Royal Well Park in Kent and Kew Bridge,
Riverlight, Chelsea Creek, Fulham Reach
and Goodman’s Fields in London. The
£26.6 million of revenue last year was
from the sale of some 119,000 sqft of
office, retail and leisure space.
The gross margin percentage of 34.5%
is in line with last year’s 34.3%.
Overheads of £183.6 million (2016:
£199.8 million) decreased by £16.2 million
in the year. This includes a net
£22.3 million reduction in the charge
to the income statement for the Group’s
share schemes, and an underlying
increase of £6.1 million.
There are a number of factors resulting
in the net £22.3 million reduction in share
scheme charges, which includes the
associated employer’s National Insurance
costs. The Company cash settled the tax
and National Insurance liabilities arising
on the vesting of options for participants
in the 2011 LTIP on 30 September 2016
in lieu of issuing shares. The cash cost is
recorded in overheads. However, this was
more than offset by, firstly, the effect of the
introduction of the caps on the Executive
Director remuneration approved by
shareholders at the EGM on 23 February
2017, effective from 1 May 2017, and
secondly, the prior year included the costs
Income Statement for the year ended 30 April 2017 £’million
30 April 2016 £’million
Change £’million
Change %
Revenue 2,723.5 2,047.5 +676.0 +33.0%
Gross profit 939.8 34.5% 701.7 34.3% +238.1 +33.9%
Operating expenses (183.6) 6.7% (199.8) 9.8% +16.2 -8.1%
Operating profit 756.2 27.8% 501.9 24.5% +254.3 +50.7%
Net finance costs (7.6) (7.5) -0.1
Share of joint venture results 63.8 36.5 +27.3
Profit before tax 812.4 29.8% 530.9 25.9% +281.5 +53.0%
Tax (167.3) 20.6% (126.8) 23.9% -40.5
Profit after tax 645.1 404.1 +241.0 +59.6%
Earnings Per Share – Basic 467.8p 295.8p +172.0p +58.1%
Dividend Per Share 185.0p 190.0p -5.0p -2.6%
Pre-Tax Return on Equity 41.1% 30.8% +10.3%
associated with the second tranche of
Part B of the 2009 LTIP which vested on
15 April 2016 which was also cash settled
to the extent of the tax and National
Insurance liabilities of participants.
The result is that the Group’s operating
margin has increased to 27.8% from
24.5% last year.
Berkeley’s share of the results of joint
ventures was a profit of £63.8 million
(2016: £36.5 million) which reflects the
first completions during the current
financial year at 190 Strand and Green
Park in Reading, as well as further
completions at 375 Kensington High Street
and Stanmore Place within St Edward, and
pre-development costs within St William
in the early stages of the joint venture.
The Group has remained cash positive on a
net basis throughout the year. Net finance
costs totaled £7.6 million for the year
(2016: £7.5 million) due to facility fees and
imputed interest on tax and land creditors.
Pre-tax return on equity for the year is
41.1%, compared to 30.8% last year. Basic
earnings per share have increased by
58.1% from 295.8 pence to 467.7 pence,
which takes into account the issue of a
further 1.8 million shares in September
2016 to satisfy share awards under
the 2011 LTIP scheme as well as the
buy-back of 2.4 million shares at a cost
of £64.5 million, including £20.1 million
in June 2016 and £44.4 million under the
Shareholder Returns Programme.
TAXATION
The Group has an overall tax charge of
£167.3 million for the year (30 April 2016:
£126.8 million) and an effective tax rate
of 20.6% (30 April 2016: 23.9%). The
Group manages its tax affairs in an open
and transparent manner with the tax
authorities and observes all applicable
rules and regulations in the countries in
which it operates. Factors that may affect
the Group’s tax charge in future periods
include changes in tax legislation and the
resolution of open issues.
The Group holds tax provisions in respect
of the potential tax liability that may
arise on the resolution of open tax issues,
however, the amount ultimately payable
may be higher or lower than the amount
accrued thus reducing or improving the
overall profitability and cash flow of the
Group in future periods. The adjustments
in respect of previous periods reflects the
status of open issues on which significant
progress has been made in the year.
FINANCIAL POSITION
Net assets increased over the course of
the year by £324.1 million, or 17.9%, to
£2,136.9 million (2016: £1,812.8 million).
This is after payment of £254.6 million of
dividends and the £64.5 million of share
buy-backs. This equates to a net asset
value per share of 1,556 pence, up 18.4%
from 1,314 pence at 30 April 2016.
Inventories have increased by £227.3
million from £3,256.1 million at 30 April
2016 to £3,483.4 million at 30 April 2017.
Inventories include £414.1 million of land
not under development (30 April 2016:
£384.1 million), £2,981.7 million of work in
progress (30 April 2016: £2,853.9 million)
and £87.6 million of completed stock
(30 April 2016: £18.1 million).
Trade and other payables are
£1,878.4 million at 30 April 2017
(£1,858.9 million at 30 April 2016). These
include £974.9 million of on-account
receipts from customers (30 April 2016:
£1,105.8 million) and land creditors
of £142.9 million (30 April 2016:
£174.7 million). Provisions of £99.9 million
(30 April 2016: £88.5 million) include post
completion development obligations and
other provisions.
The Group ended the year with net
cash of £285.5 million (30 April 2016:
£107.4 million). This is an increase of
£178.1 million during the year (2016:
decrease of £323.5 million) as a result
of £769.8 million of cash generated from
operations (2016: £530.8 million) and
a net outflow of £232.8 million in
working capital (2016: £436.8 million),
before tax and other net cash outflows
of £39.8 million (2016: £153.2 million),
share buybacks of £64.5 million
(2016: £4.8 million) and dividends of
£254.6 million (2016: £259.5 million).
BANKING
During the year the Board reviewed the
Group’s banking arrangements, having
regard to the size of the business and the
investment opportunities emerging in the
prevailing environment. As a consequence,
Berkeley increased its committed
corporate banking facilities to £750 million
from £575 million as of 25 November 2016.
The agreement was dated 25 November
2016 and has a five year term, with options
over an additional two years. A term loan
of £300 million was introduced and the
revolving credit facility element reduced
from £575 million to £450 million. The term
loan was drawn down in February 2017.
Abridged cash flow for the year ended 30 April 2017 £’million
30 April 2016 £’million
Profit before tax 812.4 530.9
Increase in inventory (227.3) (602.0)
(Decrease) / increase in customer deposits (130.9) 184.9
Other working capital movements 125.1 (21.2)
Net investment in working capital (233.1) (438.3)
Net receipts from / (investment in) joint ventures 15.0 (63.2)
Tax paid (115.6) (100.8)
Other movements 18.5 7.4
Cash inflow / (outflow) before share buy-backs and
dividends
497.2 (64.0)
Purchase of own shares (64.5) (4.8)
Dividends (254.6) (259.5)
Increase / (decrease) in net cash 178.1 (323.5)
Opening net cash 107.4 430.9
Closing net cash 285.5 107.4
BERKELEY ANNUAL REPORT 2017 STRATEGIC REPORTBERKELEY ANNUAL REPORT 2017 STRATEGIC REPORT
72 73
02
GO
VE
RN
AN
CE
03
FIN
AN
CIA
LS
01 S
TR
AT
EG
IC R
EP
OR
T

JOINT VENTURES
Investments accounted for using the equity
method have decreased from £150.0 million
at 30 April 2016 to £135.0 million at
30 April 2017. Berkeley’s joint ventures
include St Edward, a joint venture with
Prudential plc, and St William, a joint
venture with National Grid plc. The
decrease in joint venture investments
during the year reflects dividend
distributions and loan repayments from
St Edward of £91.1 million which exceeded
joint venture net profits of £63.8 million
and further funding into St William during
the year of £12.3 million. In August 2016,
St William entered into a £150 million
facility agreement with Barclays, Lloyds,
and HSBC for a term of three years with
options over a further two years. Along with
the joint venture partner funding already
provided, St William has visibility over its
financing arrangements as it continues to
grow and develop its land bank.
St Edward has four schemes currently
in development at Stanmore Place,
375 Kensington High Street, 190 Strand
and Green Park in Reading. 251 homes
were sold in the year at an average
selling price of £1,322,000 (2016: 240
at £1,329,000), which continues to
reflect the mix at the central London
developments of 375 Kensington High
Street and 190 Strand.
2,152 plots (2016: 1,868 plots) in Berkeley’s
land holdings relate to St Edward schemes.
During the year a resolution to grant
consent for a development in Wallingford
has been obtained. The site has come
through the strategic land holdings and
is now included in the Group’s land bank.
St Edward also controls a commercial
site in Westminster which has a detailed
planning consent but will not move
into development until the premises are
vacated by the current tenant.
6,459 plots (2016: 3,599 plots) in
Berkeley’s land holdings relate to
St William schemes, with five new
schemes contracted in the year. During
the year production commenced on
St William’s Prince of Wales Drive
development in Battersea. Berkeley
continues to work closely with National
Grid to identify sites from across its
portfolio to bring through into its land
holdings. In total, there are now 11
St William developments included in
the Group’s land holdings, where joint
ventures are reflected at the appropriate
share of profit.
LAND
Berkeley has made strong progress in
delivering value into and from its land
holdings during the year, growing its
estimated future gross margin to
£6,378 million at 30 April 2017 from
£6,146 million at the start of the year,
despite a record year of profit delivery
for the Group. This includes the Group’s
50% share of the anticipated gross margin
on joint venture developments. As at
30 April 2017, the Group (including joint
ventures) controlled some 46,351 plots
which compares to 42,858 plots at the
start of the year.
Of the total land holdings plots, 33,771 plots
(2016: 33,786) are owned and included on
the balance sheet and 12,580 plots (2016:
9,072) are contracted sites which do not
yet have a planning consent or are subject
to vacant possession. The Group also holds
a strategic pipeline of long-term options for
in excess of 5,000 plots.
Excluding joint ventures, ten new sites
have been added to the land bank in the
year. These include six developments
in the South East, all in high demand
locations: Farnham, Leatherhead and
Cranleigh in Surrey, Royal Tunbridge Wells
in Kent, Rudgwick in West Sussex and
Sunningdale in Berkshire. In London, we
have acquired two sites unconditionally:
the 21 acre Northfields industrial estate
where Berkeley is preparing a planning
application and a site in Ealing adjacent
to the Group’s existing Dickens Yard
development. In addition, the Group has
conditionally acquired a site on Wood
Lane located immediately to the west of
the existing White City development and
a further conditional site in Paddington
which will enhance the existing West End
Gate development which was released to
production during the year.
In addition, six joint venture sites have
been added to the land bank in the year.
This includes St Edward’s development in
Wallingford, which secured a resolution to
grant consent in the year, and five former
gasworks sites into St William. These five
St William sites comprise some 3,000
homes but remain subject to planning,
which the joint venture will pursue during
the forthcoming financial year, and vacant
possession. Accordingly, these sites are
long-term in nature.
Berkeley has secured ten new planning
consents this year, as well as a significant
number of revised consents which have
sought to improve the development
solution for each scheme to add value
and/or reduce risk, which is a key part of
Berkeley’s approach. The new consents
include, in London, an adjacent phase to
South Quay Plaza and developments in
Kingston and Blackheath. In the South
East Berkeley has secured new consents
on schemes in Wokingham, St Edward’s
Wallingford development (resolution to
grant), Leatherhead, Royal Tunbridge
Wells, Rudgwick and, in St William, at
Borehamwood and Rickmansworth.
TRADING AND FINANCIAL
REVIEW
The Group’s land holdings at 30 April 2017
comprise some 90 sites, which is up from
77 a year ago. Of these, 58 (64%) have an
implementable planning consent and are in
construction and a further 14 (16%) have at
least a resolution to grant planning but the
consent is not yet implementable; typically
due to practical technical constraints
and challenges surrounding, for example,
vacant possession, CPO requirements or
utilities provision. The remaining 18 sites
(20%) are in the planning process, with 15
of these subject to conditional contracts
which means there is low financial risk on
balance sheet. These 15 sites comprise
the 12,580 contracted plots and include
Stephenson Street, Oval Gasworks, the
new site acquired on Wood Lane adjacent
to White City in the year, as well as the St
William former gasworks sites at Fulham,
Poplar and Hornsey.
The estimated future gross margin
represents management’s risk-adjusted
assessment of the potential gross profit for
each site, taking account of a wide range
of factors, including: current sales and
input prices; the political and economic
backdrop; the planning regime; and other
market forces; all of which could have a
significant effect on the eventual outcome.
The increase in gross margin in the year is
due to both acquisitions and value added
through improvements secured both to
current and future schemes, a core part of
the Group’s activities.
Rob PerrinsChief Executive
21 June 2017
Analysis of inventory as at 30 April 2017£’million
Movements £’million
30 April 2016£’million
Land not under development 414.1 +30.0 384.1
Work in progress: land cost 919.0 -56.8 975.8
1,333.1 -26.8 1,359.9
Work in progress: build cost 2,062.7 +184.6 1,878.1
Completed units 87.6 +69.5 18.1
Inventories 3,483.4 +227.3 3,256.1
Land holdings as at 30 April 2017 Variance 30 April 2016
Owned 33,771 -15 33,786
Contracted 12,580 +3,508 9,072
Plots 46,351 +3,493 42,858
Sales value £21,767m +£1,009m £20,758m
Average selling price (ASP)* £520k -£9k £529k
Average plot cost £62k -£1k £63k
Land cost (%) 13.2% +0.3% 12.9%
Gross margin £6,378m +£232m £6,146m
GM% 29.3% -0.3% 29.6%
Abridged balance sheet as at 30 April 2017 £’million
Movements £’million
April 2016 £’million
Non-current assets
- Investment in Joint Ventures 135.0 -15.0 150.0
- Other non-current assets 99.4 -13.2 112.6
Total non current assets 234.4 -28.2 262.6
Inventories 3,483.4 +227.3 3,256.1
Debtors 229.5 +17.2 212.3
Deposits and on account receipts (974.9) +130.9 (1,105.8)
Other trade payables (1,021.1) -189.8 (831.3)
Provisions (99.9) -11.4 (88.5)
Capital employed 1,851.4 +146.0 1,705.4
Net cash 285.5 +178.1 107.4
Net assets 2,136.9 +324.1 1,812.8
Net asset value per share 1,556p +242p 1,314p
* ASP reflects joint ventures at 100%
BERKELEY ANNUAL REPORT 2017 STRATEGIC REPORTBERKELEY ANNUAL REPORT 2017 STRATEGIC REPORT
74 75
02
GO
VE
RN
AN
CE
03
FIN
AN
CIA
LS
01 S
TR
AT
EG
IC R
EP
OR
T

02 GOVERNANCE
Curzon cinema at Goodman’s Fields, Aldgate
BERKELEY ANNUAL REPORT 2017 GOVERNANCEBERKELEY ANNUAL REPORT 2017 GOVERNANCE
76 77
02
GO
VE
RN
AN
CE
03
03
033
FFI
FI
FI
FIN
AN
NA
NA
NNA
NA
CIA
CIA
CIAA
LLS
011
01
01
001
0001
01
01
ST
ST
ST
STTT
RA
TR
ATT
EEGG
IG
ICCCR
CC RRR
EP
OEE
PO
EP
OP
OPP
OP
OR
TR
T
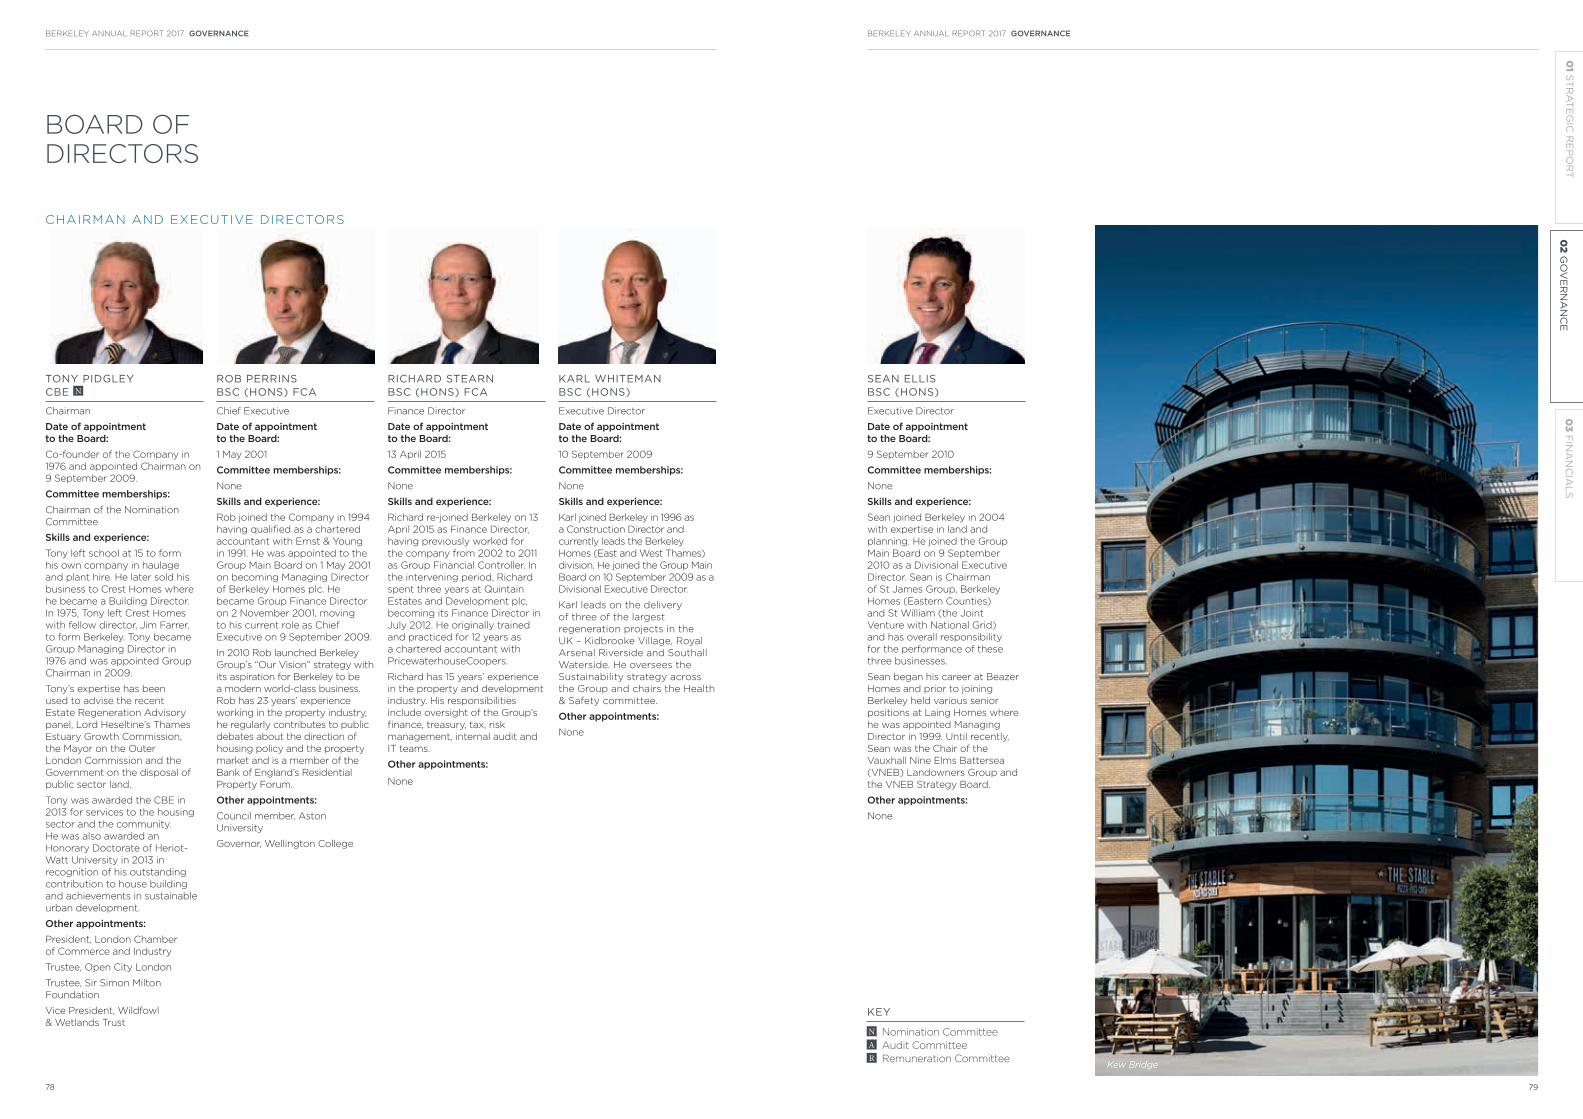
BOARD OF
DIRECTORS
TONY PIDGLEY CBE N
Chairman
Date of appointment to the Board:Co-founder of the Company in
1976 and appointed Chairman on
9 September 2009.
Committee memberships:Chairman of the Nomination
Committee
Skills and experience:Tony left school at 15 to form
his own company in haulage
and plant hire. He later sold his
business to Crest Homes where
he became a Building Director.
In 1975, Tony left Crest Homes
with fellow director, Jim Farrer,
to form Berkeley. Tony became
Group Managing Director in
1976 and was appointed Group
Chairman in 2009.
Tony’s expertise has been
used to advise the recent
Estate Regeneration Advisory
panel, Lord Heseltine’s Thames
Estuary Growth Commission,
the Mayor on the Outer
London Commission and the
Government on the disposal of
public sector land.
Tony was awarded the CBE in
2013 for services to the housing
sector and the community.
He was also awarded an
Honorary Doctorate of Heriot-
Watt University in 2013 in
recognition of his outstanding
contribution to house building
and achievements in sustainable
urban development.
Other appointments:President, London Chamber
of Commerce and Industry
Trustee, Open City London
Trustee, Sir Simon Milton
Foundation
Vice President, Wildfowl
& Wetlands Trust
ROB PERRINS BSC (HONS) FCA
Chief Executive
Date of appointment to the Board:1 May 2001
Committee memberships:None
Skills and experience:Rob joined the Company in 1994
having qualified as a chartered
accountant with Ernst & Young
in 1991. He was appointed to the
Group Main Board on 1 May 2001
on becoming Managing Director
of Berkeley Homes plc. He
became Group Finance Director
on 2 November 2001, moving
to his current role as Chief
Executive on 9 September 2009.
In 2010 Rob launched Berkeley
Group’s “Our Vision” strategy with
its aspiration for Berkeley to be
a modern world-class business.
Rob has 23 years’ experience
working in the property industry,
he regularly contributes to public
debates about the direction of
housing policy and the property
market and is a member of the
Bank of England’s Residential
Property Forum.
Other appointments:Council member, Aston
University
Governor, Wellington College
RICHARD STEARN BSC (HONS) FCA
Finance Director
Date of appointment to the Board:13 April 2015
Committee memberships:None
Skills and experience:Richard re-joined Berkeley on 13
April 2015 as Finance Director,
having previously worked for
the company from 2002 to 2011
as Group Financial Controller. In
the intervening period, Richard
spent three years at Quintain
Estates and Development plc,
becoming its Finance Director in
July 2012. He originally trained
and practiced for 12 years as
a chartered accountant with
PricewaterhouseCoopers.
Richard has 15 years’ experience
in the property and development
industry. His responsibilities
include oversight of the Group’s
finance, treasury, tax, risk
management, internal audit and
IT teams.
Other appointments:
None
KARL WHITEMAN BSC (HONS)
Executive Director
Date of appointment to the Board: 10 September 2009
Committee memberships: None
Skills and experience:Karl joined Berkeley in 1996 as
a Construction Director and
currently leads the Berkeley
Homes (East and West Thames)
division. He joined the Group Main
Board on 10 September 2009 as a
Divisional Executive Director.
Karl leads on the delivery
of three of the largest
regeneration projects in the
UK – Kidbrooke Village, Royal
Arsenal Riverside and Southall
Waterside. He oversees the
Sustainability strategy across
the Group and chairs the Health
& Safety committee.
Other appointments:None
SEAN ELLIS BSC (HONS)
Executive Director
Date of appointment to the Board:9 September 2010
Committee memberships:None
Skills and experience:Sean joined Berkeley in 2004
with expertise in land and
planning. He joined the Group
Main Board on 9 September
2010 as a Divisional Executive
Director. Sean is Chairman
of St James Group, Berkeley
Homes (Eastern Counties)
and St William (the Joint
Venture with National Grid)
and has overall responsibility
for the performance of these
three businesses.
Sean began his career at Beazer
Homes and prior to joining
Berkeley held various senior
positions at Laing Homes where
he was appointed Managing
Director in 1999. Until recently,
Sean was the Chair of the
Vauxhall Nine Elms Battersea
(VNEB) Landowners Group and
the VNEB Strategy Board.
Other appointments:None
CHAIRMAN AND EXECUTIVE DIRECTORS
KEY
N Nomination Committee
A Audit Committee
R Remuneration Committee Kew Bridge
BERKELEY ANNUAL REPORT 2017 GOVERNANCEBERKELEY ANNUAL REPORT 2017 GOVERNANCE
78 79
02
GO
VE
RN
AN
CE
03
FIN
AN
CIA
LS
01 S
TR
AT
EG
IC R
EP
OR
T

SIR JOHN ARMITT N R
Deputy Chairman and Senior
Independent Director
Date of appointment to the Board:1 October 2007 and as Deputy
Chairman on 5 September 2012
Committee memberships:Member of the Nomination and
Remuneration Committees
Skills and experience:Sir John is currently Chairman
of National Express Group PLC
and the City & Guilds Group and
Deputy Chairman of the National
Infrastructure Commission. He is
an Independent Non-executive
Director of Expo 2020. Sir John
was President of the Institution
of Civil Engineers (2015 - 2016),
Chairman of the Olympic Delivery
Authority (2007 - 2014) and
Chairman of the Engineering and
Physical Science Research Council
(2007 - 2012). From 2001 to 2007,
he was Chief Executive of Network
Rail and its predecessor, Railtrack
and prior to that was Chairman of
John Laing plc’s international and
civil engineering divisions.
Sir John is the Senior Independent
Director. He has amassed
extensive operational, commercial
and technical experience
throughout his career and, as
a long-standing Non-executive
Director, is able to use the
experience he has gained to
bring continual challenge to
management. Sir John received
a knighthood in 2012 for services
to engineering and construction
and was awarded the CBE in
1996 for his contribution to the
rail industry.
Other appointments:Chairman, National Express
Group PLC
Chairman, the City &
Guilds Group
Deputy Chairman, National
Infrastructure Commission
Independent Non-executive
Director, Expo 2020
ADRIAN LI MA (CANTAB), MBA, LPC
Independent Non-executive
Director
Date of appointment to the Board:2 September 2013
Committee memberships:None
Skills and experience:Adrian is Executive Director
and Deputy Chief Executive of
The Bank of East Asia, where
he assists the Chief Executive
with the overall management of
the group. He holds a Master of
Management degree from the
Kellogg School of Management
and an MA in Law from the
University of Cambridge.
Adrian brings banking
experience to the Board and
provides valuable insight into the
Far East property and finance
markets as well as global macro-
economic trends.
Other appointments:Executive Director and Deputy
Chief Executive of The Bank of
East Asia, Ltd.
Independent Non-executive
Director of three listed
companies under the Sino Group
(Sino Land Company Ltd., Tsim
Sha Tsui Properties Ltd. and Sino
Hotels (Holdings) Ltd.)
Independent Non-executive
Director, China State
Construction International
Holdings Ltd.
Independent Non-executive
Director, COSCO SHIPPING
Ports Ltd.
ALISON NIMMO CBE A
Independent Non-executive
Director
Date of appointment to the Board:5 September 2011
Committee memberships:Member of the Audit Committee
Skills and experience:Alison is a Chartered Surveyor
and Town Planner by training
and is currently Chief Executive
of The Crown Estate. Prior to
joining The Crown Estate, she
led the design and delivery of
the London 2012 Olympic and
Paralympic venues as Director of
Regeneration and Design at the
Olympic Delivery Authority and
was the lead on sustainability
and legacy for the Olympic Park.
Her previous roles have included
Chief Executive of Sheffield
One and Project Director of
Manchester Millennium Ltd.
Alison has significant
experience of leadership and
Government relations. She was
awarded a CBE in 2004 for
services to urban regeneration
and is a Fellow of the Institute
of Civil Engineers, an Honorary
Fellow of the Royal Institute
of British Architects and has
an honorary degree from
Sheffield Hallam University. In
2014, Alison was awarded the
prestigious Royal Town Planning
Institute Gold Medal for
recognition of her services to
town planning and sustainability
throughout her career.
Other appointments:Chief Executive,
The Crown Estate
Member of Imperial College’s
Council and Chair of its White
City Syndicate Board
Trustee of the UK Green
Building Council
Chair of the CBI’s Economic
Growth Board
VERONICA WADLEY N A
Independent Non-executive
Director
Date of appointment to the Board:3 January 2012
Committee memberships:Member of the Audit and
Nomination Committees
Skills and experience:Veronica is a Journalist by
profession; she was Editor of the
Evening Standard from 2002
to 2009 and previously Deputy
Editor of the Daily Mail and The
Daily Telegraph. She was Senior
Adviser to the Mayor of London
from 2012 to 2016 during which
time Veronica oversaw the
delivery of youth volunteering
and employment programmes
and developed new strategy
for business relationships and
sponsorship for the Greater
London Authority.
Other appointments:Independent Director, Times
Newspapers Holdings Ltd
Chair of the Arts Council London
National Council member of Arts
Council England
GLYN BARKER BSC (HONS) FCA A R
Independent Non-executive
Director
Date of appointment to the Board:3 January 2012
Committee memberships:Chairman of the Remuneration
Committee and a member of the
Audit Committee
Skills and experience:Glyn is a Chartered Accountant
and has extensive experience as
a business leader and trusted
adviser to FTSE 100 companies.
He has a deep understanding
of accounting and regulatory
issues along with extensive
understanding of transactional
and financial services.
Glyn was appointed as a Non-
executive Director of Berkeley
following a 35 year career with
PricewaterhouseCoopers LLP
(“PwC”), where he held a number
of senior posts including UK Vice
Chairman, UK Managing Partner
and UK Head of Assurance. He
also established and ran PwC’s
Transactions Services business.
Other appointments:Senior Independent Non-
executive Director, Aviva plc
Independent Non-executive
Director, Transocean Limited
Chairman, Irwin Mitchell
Holdings Limited
Chairman, Interserve plc.
Senior Advisory Partner,
Novalpina Capital
ANDY MYERS BEng, ACA A R
Independent Non-executive
Director
Date of appointment to the Board:6 December 2013
Committee memberships:Chairman of the Audit
Committee and a member of the
Remuneration Committee
Skills and experience:Andy qualified as a Chartered
Accountant with KPMG in
1990. He has extensive finance
and commercial skills and has
been Chief Financial Officer
at McLaren Technology Group
since 2004 where he has
responsibility for Finance, IT and
Strategic Procurement.
Prior to joining McLaren, Andy
held senior finance roles at Rolls
Royce plc and at the BMW/
Rover Group. He joined Rolls
Royce Plc as Finance Director of
the Combustion Business Unit in
2000 and was promoted to CFO
of the Energy Sector, based in
Washington DC two years later.
Other appointments:Chief Financial Officer
at McLaren Technology
Group Limited
DIANA BRIGHTMORE- ARMOUR FCCA, MCT N
Independent Non-executive
Director
Date of appointment to the Board:1 May 2014
Committee memberships:Nomination Committee
Skills and experience:Diana is a Fellow of the
Chartered Certified Accountants
and a Fellow of the Association
of Corporate Treasurers. She is
currently the Chief Executive
Officer, UK & Europe of The
Australia and New Zealand
Banking Group Ltd where she
is responsible for oversight
of the day-to-day activities
of the branch, including the
local execution of the Group’s
strategy, promoting a culture
of compliance and ensuring
appropriate standards of
conduct and governance. Diana
was previously CEO, Corporate
Banking at Lloyds Banking
Group (2004-2012) and spent
her early career at The Coca
Cola Company.
Diana has 30 years’ international
experience in banking, corporate
finance, financial management,
treasury and audit. She is a strong
supporter of talent development
and gender diversity.
Other appointments:Chief Executive Officer, UK &
Europe of The Australia and New
Zealand Banking Group Ltd
COMPANY SECRETARYG E M PARSONS FCIS
KEY
N Nomination Committee
A Audit Committee
R Remuneration Committee
NON-EXECUTIVE DIRECTORS
BOARD OF
DIRECTORS
BERKELEY ANNUAL REPORT 2017 GOVERNANCEBERKELEY ANNUAL REPORT 2017 GOVERNANCE
80 81
02
GO
VE
RN
AN
CE
03
FIN
AN
CIA
LS
01 S
TR
AT
EG
IC R
EP
OR
T

The Company is committed to maintaining
a high standard of corporate governance.
This section, including the Audit Committee
Report, Directors’ Remuneration Report
and the Nomination Committee Report,
details how the Company has applied the
main principles and provisions of the UK
Corporate Governance Code 2014 (the
Code):
– Leadership
– Effectiveness
– Accountability
– Remuneration
– Relations with shareholders
The Company’s business model is
explained in the Strategic Report. It is
the Board’s view that it has been fully
compliant with the Code throughout the
2016/17 financial year. A copy of the Code
is available on the Financial Reporting
Council’s website www.frc.org.uk
LEADERSHIP
The Board has a collective responsibility
for promoting the long-term success of the
Company in a safe and sustainable manner
in order to create shareholder value. The
Board provides leadership and sets the
Company’s strategic long-term objectives.
Its duties are set out in a formal schedule
of matters specifically reserved for decision
by the Board, which include:
– Overall management of the Group, its
strategy and long-term objectives;
– Approval of corporate plans;
– Approval of all material corporate
transactions;
– Changes to the Group’s capital structure;
– Approval of the Group’s treasury policy;
– Approval of the Group’s interim and
annual results, dividend policy and
shareholder distributions;
– Reviewing the Group’s risks and system
of internal control;
– Changes to the Board and other senior
executive roles;
– Corporate Governance arrangements
and the Board evaluation; and
– Approval of policies in key areas
including Sustainability, Health & Safety,
Business Ethics, Modern Slavery and
Share Dealing.
EFFECTIVENESS
Composition and IndependenceAt the date of this report the Board
comprises twelve Directors: the Chairman,
four Executive Directors and seven
independent Non-executive Directors. The
biographies of these directors are set out
on pages 78 to 81.
The Board has put in place the succession
planning that all successful organisations
require and, as explained in the Nomination
Committee Report on page 88, the
composition of the Board continues to
be reviewed on a regular basis to ensure
that an appropriate balance of skills and
experience is maintained.
The Board reviews the independence of
Non-executive Directors on an annual
basis taking into account each individual’s
professional characteristics, behaviour
and their contribution to unbiased and
independent debate. The Non-executive
Directors, led by the Senior Independent
Director Sir John Armitt, have the skills,
experience, independence and knowledge
of the Company to enable them to
discharge their respective duties and
responsibilities effectively. Each Non-
executive Director is prepared to question
and to challenge management. All of the
Non-executive Directors are considered
to have been independent throughout the
year.
The Board recognises that Sir John Armitt
reached a tenure of nine years as an
independent Non-executive Director during
the year which may lead some investors
to question his independence. The
Board considered this issue and agreed
that Sir John continues to maintain and
contribute an independent view in all Board
deliberations. In addition, his knowledge
of Berkeley and his deep and broad
construction expertise and experience
continues to be of value to the Board.
Comments have been made regarding the
number of directorships Adrian Li holds
and whether this may impact his ability to
fulfil his duties as an Independent Non-
executive Director of Berkeley. Adrian
attends all Board meetings in person and
plays an active role in Board discussions. As
noted in his biography on page 80, three of
Adrian’s directorships are linked under the
Sino Group which is a common corporate
structure in South East Asia. There have
been no changes to these commitments
since he joined the Board in 2015 and the
Board remains content that not only does
Adrian have sufficient time to dedicate to
the Group he also has capacity should
anything unforeseen arise in connection
with Berkeley which may demand more of
his time.
The Executive Directors do not hold any
Non-executive Director appointments or
commitments required to be disclosed
under the Code.
Chairman and Chief ExecutiveThe roles of Chairman and Chief Executive
are separately held and there are clear
written guidelines to support the division of
responsibility between them. The Chairman
is responsible for the effective operation
of the Board and shareholder general
meetings, for overseeing strategy and for
ensuring that each Director contributes
to effective decision-making. The Chief
Executive has day-to-day executive
responsibility for the running of the Group’s
businesses. His role is to develop and
deliver the strategy to enable the Group
to meet its objectives and to develop the
management team.
MeetingsThe Board met formally four times during
the year to 30 April 2017 and there were no
absences.
In addition to the above formal meetings
of the whole Board, the Non-executive
Directors meet with the Chairman. The
Chief Executive and Finance Director are
invited to attend these meetings in part,
to provide an update on the business
activities of the Group. The Non-executive
Directors meet at least annually without the
Chairman present, chaired by the Senior
Independent Director.
Board papers and agendas are sent out
in the week prior to each meeting, thus
allowing sufficient time for detailed review
and consideration of the documents
beforehand. In addition, the Board is
supplied with comprehensive management
information on a regular basis.
Election and re-election of DirectorsThe Articles of Association of the Company
include the requirement for Directors to
submit themselves to shareholders for
re-election every three years. In addition,
all Directors are subject to election by
shareholders at the first opportunity
after their appointment and thereafter at
intervals of no more than three years.
In accordance with the requirements of the
Code, all Directors offer themselves for re-
election at the Annual General Meeting to
be held on 6 September 2017.
Induction and developmentOn appointment, Non-executive Directors
are provided with a detailed induction
CORPORATE GOVERNANCE REPORT
programme. This covers an overview of
the Group’s operations and its policies,
corporate responsibility and corporate
affairs issues, legal matters, and the
opportunity to meet with Directors and key
staff and to visit the Group’s sites.
Ongoing training is available to all
Directors to meet their individual needs.
Board members also receive guidance
on regulatory matters and the corporate
governance framework that the Group
operates under for example, during this
year Directors received training on the
Market Abuse Regulations.
Members of the Audit and Remuneration
Committees received briefings from
our auditors and remuneration advisers
respectively to ensure they remain up
to date with current regulations and
developments.
All Directors have access to advice from
the Company Secretary and independent
professional advisers, at the Company’s
expense, where specific expertise is
required in the course of their duties.
Board evaluationThe Code requires that the Board
undertakes an annual evaluation of its own
performance and that of its committees
and individual directors with an externally
facilitated evaluation conducted at
least every three years. As in 2016, the
Board evaluation for 2017 was externally
facilitated by Claire Howard Consultancies,
who have no other connection with the
Company. Following planning sessions
with the Chairman, Group Solicitor and
Company Secretary and having reviewed
relevant documents, confidential face to
face meetings were held with each of the
Main Board Directors, the Group Solicitor
and the Company Secretary. The Board
evaluation meetings were free-flowing and
covered, inter alia, the following areas:
– Strategic direction, medium-to-long
term strategy and the role of the Board
and its Committees in this context
– Board and Board Committee
composition, dynamics and culture
– The evolution of certain central functions
and the impact on the operation of the
Board and its Committees and vice
versa
– Future-proofing the Business and
the role/working of the Board and its
Committees in this context
– Conduct and outcome of last year’s
Board evaluation and how to get the
best out of this and future reviews.
The review concluded that the
performance of the Board and Board
Committees remains effective and that all
the Directors continue to be committed
to the business and its future prospects.
Recommendations from the previous year’s
Board Evaluation either had been, or were
being, implemented.
The Board has a pivotal role in preserving
the organisation’s culture and ultimately
its success. In line with all successful
organisations, succession planning and
talent management are seen as key
success factors for the business and the
Board continues to focus on this area. The
autonomous structure of the Group also
provides strength in depth which further
mitigates this risk.
The report and recommendations from the
2016/17 Evaluation will be discussed by the
Board with a view to agreeing actions to
be implemented over the coming year as
appropriate.
Conflicts of interestIn accordance with the Companies
Act 2006, the Company’s Articles of
Association allow the Board to authorise
potential conflicts of interest that may arise
and to impose such limits or conditions
as it thinks fit. The decision to authorise a
conflict of interest can only be made by
non-conflicted Directors (those who have
no interest in the matter being considered)
and in making such a decision the Directors
must act in a way they consider in good
faith will be most likely to promote the
Company’s success.
The Company has established a procedure
whereby actual and potential conflicts of
interest of current and proposed roles to be
undertaken by Directors of the Board with
other organisations are regularly reviewed
in respect of both the nature of those
roles, and their time commitment, and for
proper authorisation to be sought prior to
the appointment of any new director. The
Board consider these procedures to be
working effectively.
InsuranceThe Company had in place at 30 April
2017 an appropriate policy which insures
Directors against certain liabilities, including
legal costs, which they may incur in
carrying out their duties. This remains in
place.
Board CommitteesThe Board has delegated certain matters
to individual Executives and to the
specific Committees of the Board; audit,
remuneration and nomination. The main
three Board Committees operate within
clearly defined Terms of Reference
pursuant to the provisions of the Code. The
Terms of Reference can be downloaded
from the section dealing with Investor
Relations on the Berkeley website (www.
berkeleygroup.co.uk). Copies are also
available to shareholders on application to
the Company Secretary.
The responsibilities of the key Board
Committees are described below.
Executive CommitteeThe Executive Committee meets monthly
and reviews the financial and operating
performance of all Group divisions and
companies. The Chief Executive,
R C Perrins, chairs this Committee and
other members comprise, A W Pidgley
CBE, R J Stearn, K Whiteman and S Ellis
alongside other senior management
employees. G J Fry was a member of
the Committee until his retirement on
31 December 2016.
Audit CommitteeThe Audit Committee is responsible for
monitoring and reviewing the financial
reporting and accounting policies of
the Company, reviewing the adequacy
of internal controls and the activities of
the Group’s internal audit function and
overseeing the relationship with the
external auditor. The Audit Committee
comprises four independent Non-executive
Directors. The Committee is chaired by
A Myers and the other members at
30 April 2017 were A Nimmo CBE, G Barker
and V Wadley.
A Myers and G Barker are both considered
to have recent and relevant experience.
A Myers is qualified as a chartered
accountant and is currently Chief Financial
Officer at McLaren Technology Group
Limited and G Barker is also qualified as a
chartered accountant, having previously
held a number of senior posts within PwC
including UK Managing Partner and Head
of Assurance.
The Committee met formally on three
occasions during the year to 30 April 2017
with no absences.
An explanation of the role and activities
of the Audit Committee during the year is
contained in the Audit Committee report
on pages 86 and 87.
Remuneration Committee The Remuneration Committee is
responsible for determining the Company’s
policy for Executive remuneration and
the precise terms of employment and
remuneration of the Executive Directors.
BERKELEY ANNUAL REPORT 2017 GOVERNANCEBERKELEY ANNUAL REPORT 2017 GOVERNANCE
82 83
02
GO
VE
RN
AN
CE
03
FIN
AN
CIA
LS
01 S
TR
AT
EG
IC R
EP
OR
T

At 30 April 2017, the Committee comprised
G Barker, Sir J Armitt and A Myers who are
all independent Non-executive Directors.
The Committee was chaired by G Barker.
The Committee met formally on three
occasions during the year to 30 April 2017
with no absences.
No Director is involved in deciding his
or her remuneration. The Executive
Directors decide the remuneration of
the Non-executive Directors and the
Committee takes into consideration the
recommendations of the Chief Executive
and Finance Director regarding the
remuneration of their Executive colleagues.
The principles and details of Directors’
remuneration are contained in the
Directors’ Remuneration Report on pages
89 to 107.
Nomination CommitteeThe Nomination Committee ensures
that the membership and composition
of the Board, including the balance of
skills, is appropriate, as well as giving full
consideration to succession planning on a
regular basis.
The Committee is chaired by the
Chairman, A W Pidgley CBE, and at 30
April 2017 included Sir J Armitt, V Wadley
and D Brightmore-Armour who are all
independent Non-executive Directors.
The Committee met formally on two
occasions during the year to 30 April 2017
with no absences.
An explanation of the role and activities of
the Nomination Committee during the year
is contained in the Nomination Committee
report on page 88.
ACCOUNTABILITY
Internal control and risk managementThe Board acknowledges that it has overall
responsibility for ensuring that the Group’s
system of internal control complies with the
Code and for reviewing its effectiveness, at
least annually.
Internal control procedures are designed
to manage rather than eliminate the risk
of failure to achieve business objectives,
and can only provide reasonable and
not absolute assurance against material
misstatement or loss.
There are ongoing processes and
procedures for identifying, evaluating and
managing the significant risks faced by the
Group. These processes and procedures
were in place from the start of the financial
year to the date on which the 2017 Annual
Report and Accounts were approved and
accord with Principles C.2.1 and C.2.3 of the
Code and with the FRC’s Guidance on Risk
Management, Internal Control and Related
Business Reporting.
The processes are regularly reviewed by
the Board and include an annual review
by the Directors of the operation and
effectiveness of the system of internal
control as part of its year end procedures.
The key features of the system of internal
control include:
Clear organisational structureThe Group operates through autonomous
divisions and operating companies, each
with its own board. Operating company
boards meet on a weekly basis and
divisional boards on a monthly basis, and
comprehensive information is prepared for
such meetings on a standardised basis to
cover all aspects of the business. Formal
reporting lines and delegated levels of
authority exist within this structure and the
review of risk and performance occurs at
multiple levels throughout the operating
companies, divisions and at a Group level.
Risk assessmentRisk reporting is embedded within ongoing
management reporting throughout
the Group. At operating company and
divisional level, Board meeting agendas
and information packs are structured
around the key risks facing the businesses.
These risks include health and safety, sales,
production (build cost and programme),
land and planning, retaining people,
economic and political outlook, regulatory
and site specific matters.
In addition, there is a formalised process
whereby each division produces quarterly
risk and control reports that identify risks,
the potential impact and the actions
being taken to mitigate the risks. These
risk reports are reviewed and updated
quarterly.
A Group Risk Management Report is
presented at each Group Main Board
Meeting, which overlays wider strategic
risks than those covered by the operations.
This sets out the annual changes in the
risk profile of the Group, the impact and
mitigation of these risks.
Financial reportingA comprehensive budgeting and real-time
forecasting system, covering both profit
and cash, operates within the Group. This
enables executive management to view
key financial and operating data on a daily
basis. On a weekly and monthly basis
more formal reporting up to the Group
Executives is prepared. The results of all
operating units are reported monthly and
compared to budget and forecast.
There is a consolidation process in place
which ensures that there is an audit trail
between the Group’s financial reporting
system and the Group’s statutory financial
statements.
Investment and contracting controlsThe Group has clearly defined guidelines
for the purchase and sale of land within
the Group, which include detailed
environmental, planning and financial
appraisal and are subject to executive
authorisation. Rigorous procedures are also
followed for the selection of consultants
and contractors. The review and
monitoring of all build programmes and
budgets are a fundamental element of the
Company’s financial reporting cycle.
Policies and proceduresPolicies and procedures, including
operating and financial controls, are
detailed in policies and procedures
manuals that are refreshed and improved
as appropriate. Training to staff is given
where necessary.
Central functionsStrong central functions, including Legal,
Health & Safety and Company Secretarial,
provide support and consistency to the
rest of the Group. In addition, the principal
treasury-related risks, decisions and control
processes are managed by the Group
Finance function, under the direction of the
Finance Director.
Internal auditInternal auditors are in place at Group
level and divisional level as appropriate, to
provide assurance on the operation of the
Group’s control framework.
WhistleblowingThe Group has a whistleblowing policy
which has been communicated to all
employees, where Directors, management,
employees and external stakeholders
can report in confidence any concerns
they may have of malpractice, financial
irregularity, breaches of any Group
procedures, or other matters. The policy is
available to view on the Group’s website.
Bribery Act and Anti-Money Laundering RegulationsThe Board has responsibility for complying
with the requirements of the Bribery
Act 2010 and The Money Laundering
Regulations 2007 and is charged
with overseeing the development and
implementation of the Group’s policies
and procedures and monitoring ongoing
compliance.
CORPORATE GOVERNANCE REPORTCONTINUED
REMUNERATION
The principles and details of Directors’
remuneration are contained in the
Directors’ Remuneration Report on pages
89 to 107.
RELATIONS WITH
SHAREHOLDERS
The Company encourages active
dialogue with its current and prospective
shareholders through ongoing meetings or
calls with institutional investors. In addition
shareholders have the opportunity to
meet all Directors after the Annual General
Meeting.
Shareholders are also kept up to date
with the Company’s activities through
the Annual Reports, Interim Results
announcements and Trading Updates. In
addition, the corporate website provides
information on the Group and latest news,
including regulatory announcements.
The presentations made after the
announcement of the preliminary and
interim results are also available in the
Investor Relations section of the website.
The Board is kept informed of the views
of the shareholders through periodic
reports from the Company’s broker, UBS.
Additionally, the Non-executive Directors
have the opportunity to attend the bi-
annual analyst presentations.
The Senior Independent Director is
available to shareholders if they have
concerns where contact through the
normal channels has failed or when such
contact is inappropriate.
During the year, G Barker, Chairman
of the Remuneration Committee, led a
shareholder consultation programme in
connection with the 2017 Remuneration
Policy which was approved by shareholders
at the Extraordinary General Meeting held
on 23 February 2017. Shareholders were
supportive of the changes and 97.18% of
proxy votes lodged prior to the meeting
were in favour of the new policy. Further
information is provided in the Directors’
Remuneration Report.
Annual General Meeting All shareholders are invited to participate
in the Annual General Meeting (“AGM”)
on 6 September 2017 at 11:00am where
the Chairman, the Chief Executive and the
Chairmen of the Audit, Remuneration and
Nomination Committees will be available to
answer questions and will also be available
for discussions with shareholders both
prior to and after the meeting.
In accordance with the Code, the Company
arranges for the Annual Report and
Accounts and related papers to be posted
to shareholders so as to allow at least 20
working days for consideration prior to the
AGM.
The Company complies with the provisions
of the Code relating to the disclosure of
proxy votes, which, including abstentions,
are declared at the AGM after each
resolution has been dealt with on a show
of hands and are announced to the Stock
Exchange shortly after the close of the
meeting. The Company also complies with
the requirements of the Code regarding
the separation of resolutions and the
attendance of the Chairmen of the Board
Committees.
The terms and conditions of appointment
for the Non-executive Directors, which
set out their expected time commitment,
in addition to the service contracts for
the Executive Directors, are available for
inspection at the AGM and during normal
business hours at the Company’s registered
office.
BERKELEY ANNUAL REPORT 2017 GOVERNANCEBERKELEY ANNUAL REPORT 2017 GOVERNANCE
84 85
02
GO
VE
RN
AN
CE
03
FIN
AN
CIA
LS
01 S
TR
AT
EG
IC R
EP
OR
T

AUDIT COMMITTEE REPORT
The Board of Directors presents its Audit
Committee Report for the year ended 30
April 2017 which has been prepared on the
recommendation of the Audit Committee
(“the Committee”).
The report has been prepared in
accordance with the requirements of the
UK Corporate Governance Code, Schedule
8 of the Large & Medium-Sized Companies
and Groups (Accounts and Reports)
Regulations 2008, and the Listing Rules of
the Financial Conduct Authority.
Details of the composition, experience and
the number of meetings of the Committee
are reported on page 83 of the Corporate
Governance Report.
ROLE AND RESPONSIBILITIES OF
THE AUDIT COMMITTEE
The Committee has formal Terms of
Reference which set out its role and the
authority delegated to it by the Board. The
key responsibilities of the Committee are
as follows:
– Financial ReportingMonitoring the integrity of the financial
reporting of the Company and reviewing
significant financial reporting matters
and accounting policies;
– Risk Management and Internal ControlReviewing the adequacy and
effectiveness of the Group’s risk
management and internal control
systems and monitoring the
effectiveness of the Group’s internal
audit function; and
– External AuditOverseeing the relationship with the
external auditor, including appointment,
removal and fees, and ensuring the
auditor’s independence and the
effectiveness of the audit process.
This report considers each of these
responsibilities in turn, and how the
Committee has discharged them during
the year.
FINANCIAL REPORTING
At each of the Audit Committee meetings,
the Finance Director presented, and the
Committee debated, the results and
business plan of the Group and any
significant financial reporting judgements
relevant to this.
The Committee reviewed, prior to their
publication, the financial disclosures in the
Group’s Annual Report and Accounts, Half
Year and Year end Results Announcements
and the contents of Trading Updates issued
during the year. The Committee’s
review incorporated consideration of the
appropriateness of the relevant accounting
policies and financial reporting estimates
and judgements adopted therein.
The Committee’s review of the Annual
Report concentrated on whether,
taken as a whole, it was fair, balanced
and understandable and provided the
information necessary for users of the
Annual Report to assess the Group’s
business strategy and performance.
The views of the Group’s external auditor,
which was in attendance at each meeting
of the Committee during the year,
were taken into account in reaching its
conclusions on these matters.
The significant matters considered by the
Committee during the 2016/17 financial
year included:
– Carrying value of inventories and margin recognitionInventories comprise land not under
development, work in progress and
completed units, which are held in the
balance sheet at the lower of cost and
net realisable value. This requires a
periodic assessment by management of
each of Berkeley’s sites which is sensitive
to assumptions in terms of future sales
prices and construction costs and
recognises the inherently cyclical nature
of the property market and the risks
of delivery. These assumptions are also
relevant to the determination of profit
recognised on properties sold. The
conclusions of this assessment were
reported by exception to the Committee
in a financial overview paper prior to
release of the Group’s annual results.
– ProvisionsThe Committee recognises that
accounting for provisions relies on
management judgement in estimating
the quantum and timing of outflows of
resources to settle any associated legal
or constructive obligations. The Group
holds provisions for post-completion
development obligations, onerous
leases, estate liabilities and litigation. The
basis for determining these provisions
was presented to the Committee for
their consideration. The Committee
reviewed the relevant papers and
discussed the assumptions underlying
this determination with management
and the Group’s external auditor, and
concluded that it was satisfied that the
assumptions adopted were appropriate.
A table of movements in provisions over
the period is included in note 16 to the
financial statements.
– Revenue recognitionThe Committee recognises that
the Group’s accounting policy for
revenue recognition, namely that
properties are treated as sold and
profits are recognised when contracts
are exchanged and building work is
physically complete and the level of
risk that a purchaser may be unable
to complete the purchase, involves an
element of judgement in determining
the point at which building work is
physically complete. The Committee
reviewed the quantum of properties
not yet legally completed at each
balance sheet date, in conjunction with
the review undertaken by the Group’s
external auditor and concluded that the
judgements were appropriate.
– Compliance with laws and regulationsThe Committee recognises that the
Company is subject to laws and
regulations across a number of areas
including, but not limited to, anti-
bribery, anti-money laundering and
sanctions checking. The Committee
considered the Group’s adherence to
relevant regulations and approach to
reviewing and updating its policies with
respect to compliance with laws and
regulations. In performing this review, it
considered in conjunction with external
legal advisors, all relevant and open legal
matters, including those brought by the
former Finance Director Mr Simpkin. The
Committee was satisfied that there were
no material instances of non-compliance
with laws and regulations.
Other matters considered by the
Committee included management’s
assessment of the going concern status
of the Group at the balance sheet date,
and the Board’s assessment of the
viability statement. The Committee
concurred with the approach adopted
on all of these matters.
Since the year end, the Committee has
completed its review of the 2017 Annual
Report and has confirmed to the Board
that it considers it to be fair, balanced
and understandable.
During the year, the Financial Reporting
Council’s Corporate Reporting Review
team (“CRR”) reviewed our Annual
Report and Accounts for the year ended
30 April 2016. Following their review,
the CRR entered into correspondence
with the Group, seeking clarification
on how we had complied with relevant
financial reporting requirements in certain
areas. All correspondence received and
our responses were discussed with the
Company’s Audit Committee and the
Group’s external auditors. Following
the conclusion of the FRC’s review we
have agreed to improve the clarity of
certain disclosures in this year’s financial
statements. We note that the FRC letters
provide no assurance that our report
and accounts are correct in all material
respects; the FRC’s role is not to verify
the information provided but to consider
compliance with reporting requirements.
RISK MANAGEMENT AND
INTERNAL CONTROL
The Committee undertook its annual
review of the Group’s Internal Control
Framework during the year. This review
focused on the system of risk management
and internal control in place which is
explained in more detail on page 84 of
the Corporate Governance Report, and
covered:
– the assessment of the principal risks
facing the Group;
– the key elements of the Group’s control
processes to mitigate these risks;
– the operations and effectiveness of
internal audit.
A paper was also presented to the
Committee which summarised the Group’s
consideration, controls and monitoring of
fraud risk across its activities.
The Committee also considered any
internal control recommendations raised by
the Group’s auditors during the course of
the external audit and the Group’s response
to dealing with such recommendations.
A report summarising the recent
activities of the Internal Audit function
was presented to each of the Committee
meetings during the year. These reports
covered:
– a summary of the key findings arising
from the most recent internal audits
undertaken;
– management responses to any control
weaknesses identified, the closure of any
open items and any recurring themes;
– the outcome of other operational review
work undertaken by the internal audit
function;
– the internal audit plan for the coming
year, for debate with and the approval of
the Committee.
The Committee was satisfied that the
scope, extent and effectiveness of the
Internal Audit function are appropriate for
the Group.
EXTERNAL AUDIT
KPMG LLP (“KPMG”) was appointed as the
Company’s auditor in the year ended 30
April 2014 by way of a competitive tender.
ApproachKPMG presented its audit strategy to
the Audit Committee during the year.
The strategy document identified its
assessment of the risks and other areas
of focus for the purpose of the audit, the
scope of the audit work and updated the
Committee on regulatory changes for the
current year.
KPMG reported to the Committee at the
year end, prior to the public announcement
of the Company’s results, in which it set
out its assessment of the Company’s
accounting judgements and estimates
in respect of these risks and any other
findings arising from its work.
The external auditors have open recourse
to the Non-executive Directors should
they consider it necessary. There is private
dialogue between the Chairman of the
Audit Committee and the external auditors
prior to each Audit Committee meeting
and, after each meeting, the opportunity
for the Committee to meet with the
external auditors without the Executive
Directors and management present.
Independence of the external auditorsAs part of its audit strategy presentation,
KPMG identified the safeguards in
place within its internal processes and
procedures to protect, in respect of its
own role, the independence of its audit.
The FRC’s 2016 Revised Ethical Standard
introduced further restrictions on the
provision of non-audit services. This new
standard applied to the Group from June
2016 and actions were taken with KPMG
to ensure that any ongoing services
prohibited by the new Standard had been
discontinued as required by the Standard.
In order to safeguard auditor
independence, the Committee has a policy
on the provision of non-audit services by
the external auditors. In accordance with
that policy the ratio of audit fees to non-
audit fees should be no greater than 1:1 and
the ratio for the year ended 30 April 2017
was within this limit. Audit and non-audit
fee disclosures are set out in note 4 of the
Consolidated Financial Statements.
Any departure from this ratio will only
be as a consequence of transactional
work, where the Committee considers it
is right for the auditors to undertake such
work where the reasons for doing so are
compelling, such as where:
i) it is proprietary to them;
ii) they have pre-existing knowledge and
experience that precludes the use of
alternative firms;
iii) the nature of the transaction is such
that the Group’s auditors are the only
practical appointment.
Non-audit work carried out by all
accounting firms, including the auditors, is
formally reported to the Audit Committee
at each meeting. There is open dialogue
between KPMG and the Company’s senior
finance team to monitor any proposed new
instructions.
The Committee has concluded that the
auditors are independent.
Appointment of KPMGOn completion of the audit, the
Committee reviewed the performance
and effectiveness of KPMG with feedback
from senior management. The Committee
has resolved to propose KPMG’s re-
appointment at the 2017 Annual General
Meeting.
The Committee remains mindful of
evolving best practice under the UK
Corporate Governance Code 2014 and 2016
and is subject to the new requirements of
the Financial Reporting Council and the
European Union in determining its future
approach to re-tendering the external audit
appointment.
A MyersChairman, Audit Committee21 June 2017
BERKELEY ANNUAL REPORT 2017 GOVERNANCEBERKELEY ANNUAL REPORT 2017 GOVERNANCE
86 87
02
GO
VE
RN
AN
CE
03
FIN
AN
CIA
LS
01 S
TR
AT
EG
IC R
EP
OR
T
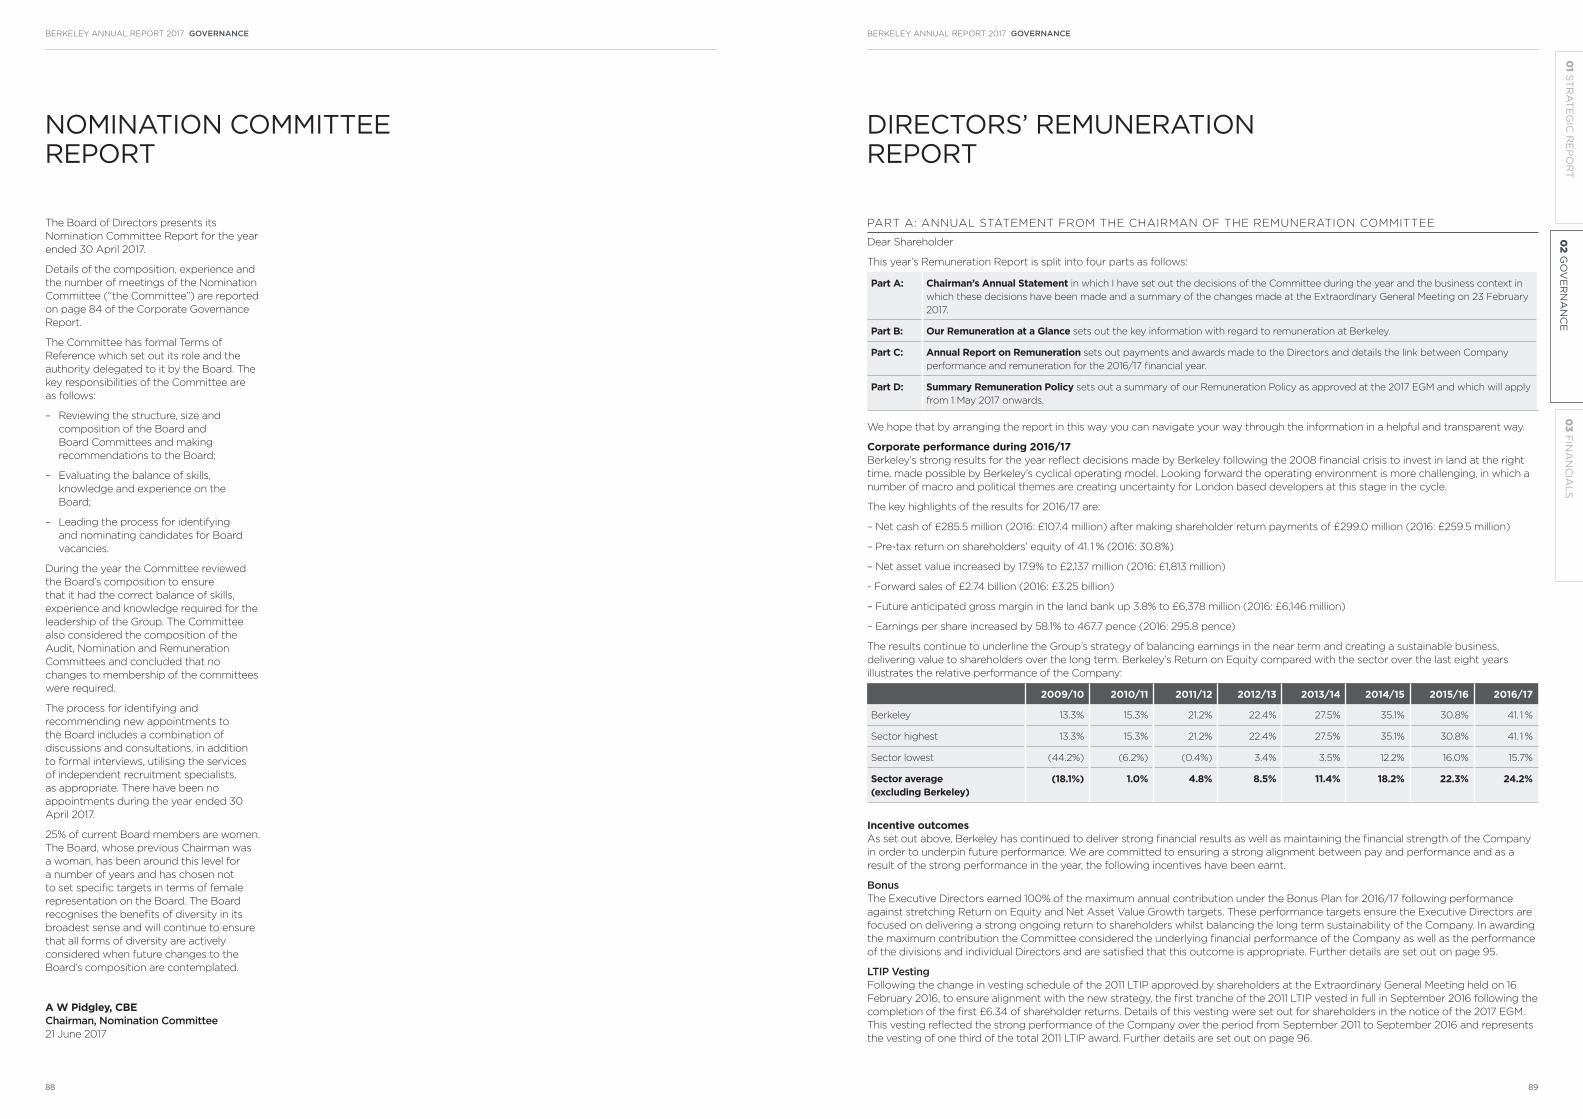
NOMINATION COMMITTEE REPORT
The Board of Directors presents its
Nomination Committee Report for the year
ended 30 April 2017.
Details of the composition, experience and
the number of meetings of the Nomination
Committee (“the Committee”) are reported
on page 84 of the Corporate Governance
Report.
The Committee has formal Terms of
Reference which set out its role and the
authority delegated to it by the Board. The
key responsibilities of the Committee are
as follows:
– Reviewing the structure, size and
composition of the Board and
Board Committees and making
recommendations to the Board;
– Evaluating the balance of skills,
knowledge and experience on the
Board;
– Leading the process for identifying
and nominating candidates for Board
vacancies.
During the year the Committee reviewed
the Board’s composition to ensure
that it had the correct balance of skills,
experience and knowledge required for the
leadership of the Group. The Committee
also considered the composition of the
Audit, Nomination and Remuneration
Committees and concluded that no
changes to membership of the committees
were required.
The process for identifying and
recommending new appointments to
the Board includes a combination of
discussions and consultations, in addition
to formal interviews, utilising the services
of independent recruitment specialists,
as appropriate. There have been no
appointments during the year ended 30
April 2017.
25% of current Board members are women.
The Board, whose previous Chairman was
a woman, has been around this level for
a number of years and has chosen not
to set specific targets in terms of female
representation on the Board. The Board
recognises the benefits of diversity in its
broadest sense and will continue to ensure
that all forms of diversity are actively
considered when future changes to the
Board’s composition are contemplated.
A W Pidgley, CBEChairman, Nomination Committee21 June 2017
PART A: ANNUAL STATEMENT FROM THE CHAIRMAN OF THE REMUNERATION COMMITTEE
Dear Shareholder
This year’s Remuneration Report is split into four parts as follows:
Part A: Chairman’s Annual Statement in which I have set out the decisions of the Committee during the year and the business context in
which these decisions have been made and a summary of the changes made at the Extraordinary General Meeting on 23 February
2017.
Part B: Our Remuneration at a Glance sets out the key information with regard to remuneration at Berkeley.
Part C: Annual Report on Remuneration sets out payments and awards made to the Directors and details the link between Company
performance and remuneration for the 2016/17 financial year.
Part D: Summary Remuneration Policy sets out a summary of our Remuneration Policy as approved at the 2017 EGM and which will apply
from 1 May 2017 onwards.
We hope that by arranging the report in this way you can navigate your way through the information in a helpful and transparent way.
Corporate performance during 2016/17Berkeley’s strong results for the year reflect decisions made by Berkeley following the 2008 financial crisis to invest in land at the right
time, made possible by Berkeley’s cyclical operating model. Looking forward the operating environment is more challenging, in which a
number of macro and political themes are creating uncertainty for London based developers at this stage in the cycle.
The key highlights of the results for 2016/17 are:
– Net cash of £285.5 million (2016: £107.4 million) after making shareholder return payments of £299.0 million (2016: £259.5 million)
– Pre-tax return on shareholders’ equity of 41. 1 % (2016: 30.8%)
– Net asset value increased by 17.9% to £2,137 million (2016: £1,813 million)
- Forward sales of £2.74 billion (2016: £3.25 billion)
– Future anticipated gross margin in the land bank up 3.8% to £6,378 million (2016: £6,146 million)
– Earnings per share increased by 58.1% to 467.7 pence (2016: 295.8 pence)
The results continue to underline the Group’s strategy of balancing earnings in the near term and creating a sustainable business,
delivering value to shareholders over the long term. Berkeley’s Return on Equity compared with the sector over the last eight years
illustrates the relative performance of the Company:
2009/10 2010/11 2011/12 2012/13 2013/14 2014/15 2015/16 2016/17
Berkeley 13.3% 15.3% 21.2% 22.4% 27.5% 35.1% 30.8% 41.1 %
Sector highest 13.3% 15.3% 21.2% 22.4% 27.5% 35.1% 30.8% 41.1 %
Sector lowest (44.2%) (6.2%) (0.4%) 3.4% 3.5% 12.2% 16.0% 15.7%
Sector average (excluding Berkeley)
(18.1%) 1.0% 4.8% 8.5% 11.4% 18.2% 22.3% 24.2%
Incentive outcomesAs set out above, Berkeley has continued to deliver strong financial results as well as maintaining the financial strength of the Company
in order to underpin future performance. We are committed to ensuring a strong alignment between pay and performance and as a
result of the strong performance in the year, the following incentives have been earnt.
Bonus The Executive Directors earned 100% of the maximum annual contribution under the Bonus Plan for 2016/17 following performance
against stretching Return on Equity and Net Asset Value Growth targets. These performance targets ensure the Executive Directors are
focused on delivering a strong ongoing return to shareholders whilst balancing the long term sustainability of the Company. In awarding
the maximum contribution the Committee considered the underlying financial performance of the Company as well as the performance
of the divisions and individual Directors and are satisfied that this outcome is appropriate. Further details are set out on page 95.
LTIP Vesting Following the change in vesting schedule of the 2011 LTIP approved by shareholders at the Extraordinary General Meeting held on 16
February 2016, to ensure alignment with the new strategy, the first tranche of the 2011 LTIP vested in full in September 2016 following the
completion of the first £6.34 of shareholder returns. Details of this vesting were set out for shareholders in the notice of the 2017 EGM.
This vesting reflected the strong performance of the Company over the period from September 2011 to September 2016 and represents
the vesting of one third of the total 2011 LTIP award. Further details are set out on page 96.
DIRECTORS’ REMUNERATION REPORT
BERKELEY ANNUAL REPORT 2017 GOVERNANCEBERKELEY ANNUAL REPORT 2017 GOVERNANCE
88 89
02
GO
VE
RN
AN
CE
03
FIN
AN
CIA
LS
01 S
TR
AT
EG
IC R
EP
OR
T
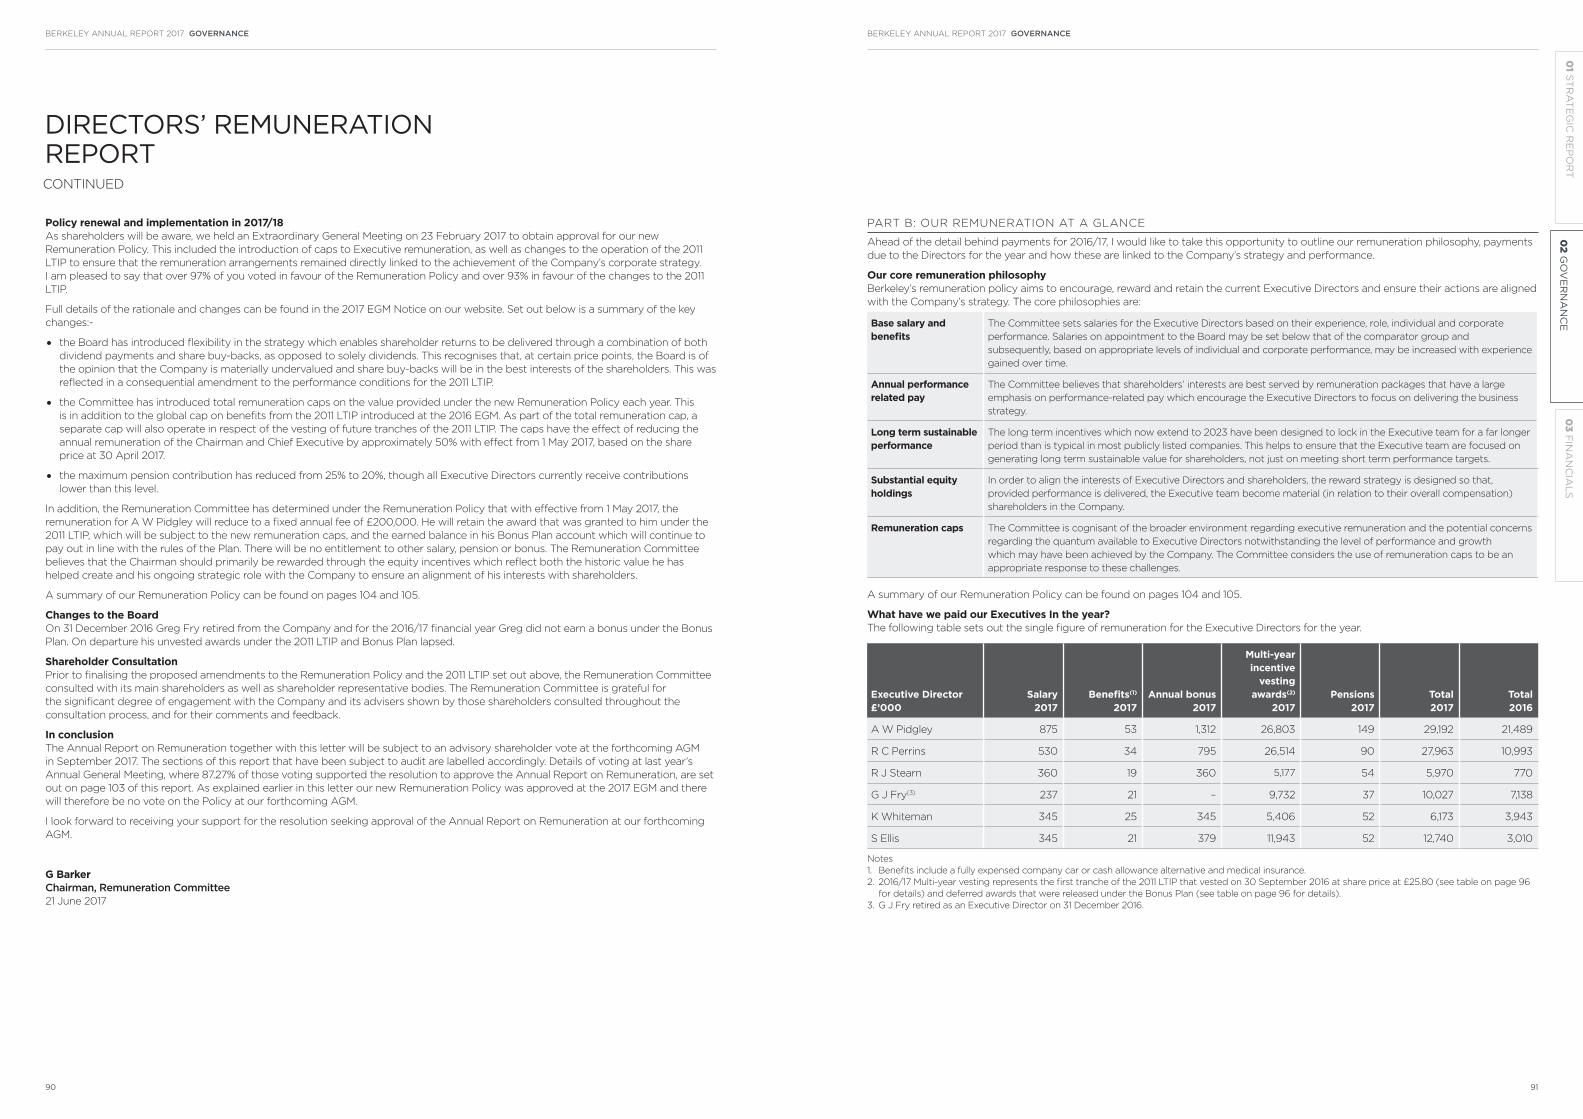
CONTINUED
DIRECTORS’ REMUNERATION REPORT
Policy renewal and implementation in 2017/18 As shareholders will be aware, we held an Extraordinary General Meeting on 23 February 2017 to obtain approval for our new
Remuneration Policy. This included the introduction of caps to Executive remuneration, as well as changes to the operation of the 2011
LTIP to ensure that the remuneration arrangements remained directly linked to the achievement of the Company’s corporate strategy.
I am pleased to say that over 97% of you voted in favour of the Remuneration Policy and over 93% in favour of the changes to the 2011
LTIP.
Full details of the rationale and changes can be found in the 2017 EGM Notice on our website. Set out below is a summary of the key
changes:-
the Board has introduced flexibility in the strategy which enables shareholder returns to be delivered through a combination of both
dividend payments and share buy-backs, as opposed to solely dividends. This recognises that, at certain price points, the Board is of
the opinion that the Company is materially undervalued and share buy-backs will be in the best interests of the shareholders. This was
reflected in a consequential amendment to the performance conditions for the 2011 LTIP.
the Committee has introduced total remuneration caps on the value provided under the new Remuneration Policy each year. This
is in addition to the global cap on benefits from the 2011 LTIP introduced at the 2016 EGM. As part of the total remuneration cap, a
separate cap will also operate in respect of the vesting of future tranches of the 2011 LTIP. The caps have the effect of reducing the
annual remuneration of the Chairman and Chief Executive by approximately 50% with effect from 1 May 2017, based on the share
price at 30 April 2017.
the maximum pension contribution has reduced from 25% to 20%, though all Executive Directors currently receive contributions
lower than this level.
In addition, the Remuneration Committee has determined under the Remuneration Policy that with effective from 1 May 2017, the
remuneration for A W Pidgley will reduce to a fixed annual fee of £200,000. He will retain the award that was granted to him under the
2011 LTIP, which will be subject to the new remuneration caps, and the earned balance in his Bonus Plan account which will continue to
pay out in line with the rules of the Plan. There will be no entitlement to other salary, pension or bonus. The Remuneration Committee
believes that the Chairman should primarily be rewarded through the equity incentives which reflect both the historic value he has
helped create and his ongoing strategic role with the Company to ensure an alignment of his interests with shareholders.
A summary of our Remuneration Policy can be found on pages 104 and 105.
Changes to the BoardOn 31 December 2016 Greg Fry retired from the Company and for the 2016/17 financial year Greg did not earn a bonus under the Bonus
Plan. On departure his unvested awards under the 2011 LTIP and Bonus Plan lapsed.
Shareholder ConsultationPrior to finalising the proposed amendments to the Remuneration Policy and the 2011 LTIP set out above, the Remuneration Committee
consulted with its main shareholders as well as shareholder representative bodies. The Remuneration Committee is grateful for
the significant degree of engagement with the Company and its advisers shown by those shareholders consulted throughout the
consultation process, and for their comments and feedback.
In conclusionThe Annual Report on Remuneration together with this letter will be subject to an advisory shareholder vote at the forthcoming AGM
in September 2017. The sections of this report that have been subject to audit are labelled accordingly. Details of voting at last year’s
Annual General Meeting, where 87.27% of those voting supported the resolution to approve the Annual Report on Remuneration, are set
out on page 103 of this report. As explained earlier in this letter our new Remuneration Policy was approved at the 2017 EGM and there
will therefore be no vote on the Policy at our forthcoming AGM.
I look forward to receiving your support for the resolution seeking approval of the Annual Report on Remuneration at our forthcoming
AGM.
G BarkerChairman, Remuneration Committee 21 June 2017
PART B: OUR REMUNERATION AT A GLANCE
Ahead of the detail behind payments for 2016/17, I would like to take this opportunity to outline our remuneration philosophy, payments
due to the Directors for the year and how these are linked to the Company’s strategy and performance.
Our core remuneration philosophyBerkeley’s remuneration policy aims to encourage, reward and retain the current Executive Directors and ensure their actions are aligned
with the Company’s strategy. The core philosophies are:
Base salary and benefits
The Committee sets salaries for the Executive Directors based on their experience, role, individual and corporate
performance. Salaries on appointment to the Board may be set below that of the comparator group and
subsequently, based on appropriate levels of individual and corporate performance, may be increased with experience
gained over time.
Annual performance related pay
The Committee believes that shareholders’ interests are best served by remuneration packages that have a large
emphasis on performance-related pay which encourage the Executive Directors to focus on delivering the business
strategy.
Long term sustainable performance
The long term incentives which now extend to 2023 have been designed to lock in the Executive team for a far longer
period than is typical in most publicly listed companies. This helps to ensure that the Executive team are focused on
generating long term sustainable value for shareholders, not just on meeting short term performance targets.
Substantial equity holdings
In order to align the interests of Executive Directors and shareholders, the reward strategy is designed so that,
provided performance is delivered, the Executive team become material (in relation to their overall compensation)
shareholders in the Company.
Remuneration caps The Committee is cognisant of the broader environment regarding executive remuneration and the potential concerns
regarding the quantum available to Executive Directors notwithstanding the level of performance and growth
which may have been achieved by the Company. The Committee considers the use of remuneration caps to be an
appropriate response to these challenges.
A summary of our Remuneration Policy can be found on pages 104 and 105.
What have we paid our Executives In the year?The following table sets out the single figure of remuneration for the Executive Directors for the year.
Executive Director £’000
Salary2017
Benefits(1)
2017Annual bonus
2017
Multi-year incentive
vesting awards(2)
2017Pensions
2017Total2017
Total2016
A W Pidgley 875 53 1,312 26,803 149 29,192 21,489
R C Perrins 530 34 795 26,514 90 27,963 10,993
R J Stearn 360 19 360 5,177 54 5,970 770
G J Fry(3) 237 21 – 9,732 37 10,027 7,138
K Whiteman 345 25 345 5,406 52 6,173 3,943
S Ellis 345 21 379 11,943 52 12,740 3,010
Notes
1. Benefits include a fully expensed company car or cash allowance alternative and medical insurance.
2. 2016/17 Multi-year vesting represents the first tranche of the 2011 LTIP that vested on 30 September 2016 at share price at £25.80 (see table on page 96
for details) and deferred awards that were released under the Bonus Plan (see table on page 96 for details).
3. G J Fry retired as an Executive Director on 31 December 2016.
BERKELEY ANNUAL REPORT 2017 GOVERNANCEBERKELEY ANNUAL REPORT 2017 GOVERNANCE
90 91
02
GO
VE
RN
AN
CE
03
FIN
AN
CIA
LS
01 S
TR
AT
EG
IC R
EP
OR
T
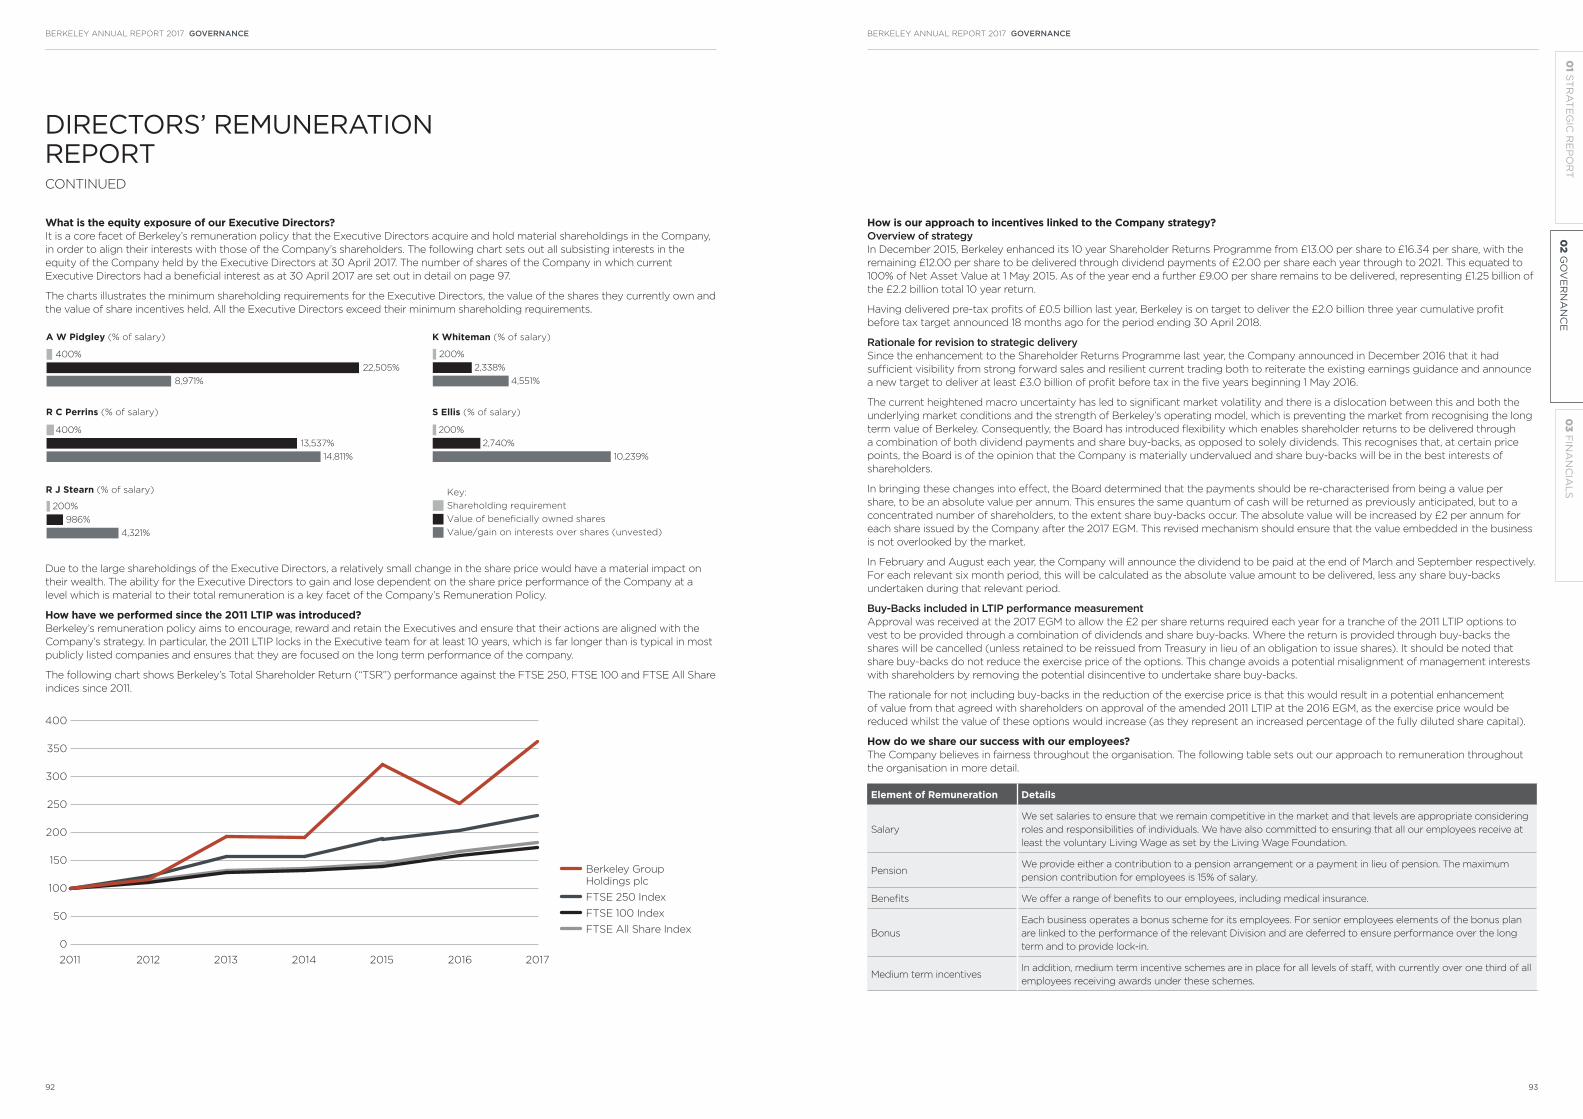
DIRECTORS’ REMUNERATION REPORTCONTINUED
What is the equity exposure of our Executive Directors?It is a core facet of Berkeley’s remuneration policy that the Executive Directors acquire and hold material shareholdings in the Company,
in order to align their interests with those of the Company’s shareholders. The following chart sets out all subsisting interests in the
equity of the Company held by the Executive Directors at 30 April 2017. The number of shares of the Company in which current
Executive Directors had a beneficial interest as at 30 April 2017 are set out in detail on page 97.
The charts illustrates the minimum shareholding requirements for the Executive Directors, the value of the shares they currently own and
the value of share incentives held. All the Executive Directors exceed their minimum shareholding requirements.
Due to the large shareholdings of the Executive Directors, a relatively small change in the share price would have a material impact on
their wealth. The ability for the Executive Directors to gain and lose dependent on the share price performance of the Company at a
level which is material to their total remuneration is a key facet of the Company’s Remuneration Policy.
How have we performed since the 2011 LTIP was introduced?Berkeley’s remuneration policy aims to encourage, reward and retain the Executives and ensure that their actions are aligned with the
Company’s strategy. In particular, the 2011 LTIP locks in the Executive team for at least 10 years, which is far longer than is typical in most
publicly listed companies and ensures that they are focused on the long term performance of the company.
The following chart shows Berkeley’s Total Shareholder Return (“TSR”) performance against the FTSE 250, FTSE 100 and FTSE All Share
indices since 2011.
A W Pidgley (% of salary)
Key:
Shareholding requirement
Value of beneficially owned shares
Value/gain on interests over shares (unvested)
400%
400%
22,505%
8,971%
0 5000 10000 15000 20000 25000
S Ellis (% of salary)
200%
2,740%
10,239%
0 2000 4000 6000 8000 10000 12000
K Whiteman (% of salary)
200%
2,338%
4,551%
0 1000 2000 3000 4000 5000
R C Perrins (% of salary)
13,537%
14,811%
0 3000 6000 9000 12000 15000
R J Stearn (% of salary)
200%
986%
4,321%
0 1000 2000 3000 4000 5000
FTSE 100 Index
FTSE All Share Index
Berkeley Group
Holdings plc
FTSE 250 Index
400
350
300
250
200
150
100
50
0
2011 2012 2013 2014 2015 2016 2017
How is our approach to incentives linked to the Company strategy?Overview of strategyIn December 2015, Berkeley enhanced its 10 year Shareholder Returns Programme from £13.00 per share to £16.34 per share, with the
remaining £12.00 per share to be delivered through dividend payments of £2.00 per share each year through to 2021. This equated to
100% of Net Asset Value at 1 May 2015. As of the year end a further £9.00 per share remains to be delivered, representing £1.25 billion of
the £2.2 billion total 10 year return.
Having delivered pre-tax profits of £0.5 billion last year, Berkeley is on target to deliver the £2.0 billion three year cumulative profit
before tax target announced 18 months ago for the period ending 30 April 2018.
Rationale for revision to strategic deliverySince the enhancement to the Shareholder Returns Programme last year, the Company announced in December 2016 that it had
sufficient visibility from strong forward sales and resilient current trading both to reiterate the existing earnings guidance and announce
a new target to deliver at least £3.0 billion of profit before tax in the five years beginning 1 May 2016.
The current heightened macro uncertainty has led to significant market volatility and there is a dislocation between this and both the
underlying market conditions and the strength of Berkeley’s operating model, which is preventing the market from recognising the long
term value of Berkeley. Consequently, the Board has introduced flexibility which enables shareholder returns to be delivered through
a combination of both dividend payments and share buy-backs, as opposed to solely dividends. This recognises that, at certain price
points, the Board is of the opinion that the Company is materially undervalued and share buy-backs will be in the best interests of
shareholders.
In bringing these changes into effect, the Board determined that the payments should be re-characterised from being a value per
share, to be an absolute value per annum. This ensures the same quantum of cash will be returned as previously anticipated, but to a
concentrated number of shareholders, to the extent share buy-backs occur. The absolute value will be increased by £2 per annum for
each share issued by the Company after the 2017 EGM. This revised mechanism should ensure that the value embedded in the business
is not overlooked by the market.
In February and August each year, the Company will announce the dividend to be paid at the end of March and September respectively.
For each relevant six month period, this will be calculated as the absolute value amount to be delivered, less any share buy-backs
undertaken during that relevant period.
Buy-Backs included in LTIP performance measurementApproval was received at the 2017 EGM to allow the £2 per share returns required each year for a tranche of the 2011 LTIP options to
vest to be provided through a combination of dividends and share buy-backs. Where the return is provided through buy-backs the
shares will be cancelled (unless retained to be reissued from Treasury in lieu of an obligation to issue shares). It should be noted that
share buy-backs do not reduce the exercise price of the options. This change avoids a potential misalignment of management interests
with shareholders by removing the potential disincentive to undertake share buy-backs.
The rationale for not including buy-backs in the reduction of the exercise price is that this would result in a potential enhancement
of value from that agreed with shareholders on approval of the amended 2011 LTIP at the 2016 EGM, as the exercise price would be
reduced whilst the value of these options would increase (as they represent an increased percentage of the fully diluted share capital).
How do we share our success with our employees?The Company believes in fairness throughout the organisation. The following table sets out our approach to remuneration throughout
the organisation in more detail.
Element of Remuneration Details
Salary
We set salaries to ensure that we remain competitive in the market and that levels are appropriate considering
roles and responsibilities of individuals. We have also committed to ensuring that all our employees receive at
least the voluntary Living Wage as set by the Living Wage Foundation.
PensionWe provide either a contribution to a pension arrangement or a payment in lieu of pension. The maximum
pension contribution for employees is 15% of salary.
Benefits We offer a range of benefits to our employees, including medical insurance.
Bonus
Each business operates a bonus scheme for its employees. For senior employees elements of the bonus plan
are linked to the performance of the relevant Division and are deferred to ensure performance over the long
term and to provide lock-in.
Medium term incentivesIn addition, medium term incentive schemes are in place for all levels of staff, with currently over one third of all
employees receiving awards under these schemes.
BERKELEY ANNUAL REPORT 2017 GOVERNANCEBERKELEY ANNUAL REPORT 2017 GOVERNANCE
92 93
02
GO
VE
RN
AN
CE
03
FIN
AN
CIA
LS
01 S
TR
AT
EG
IC R
EP
OR
T
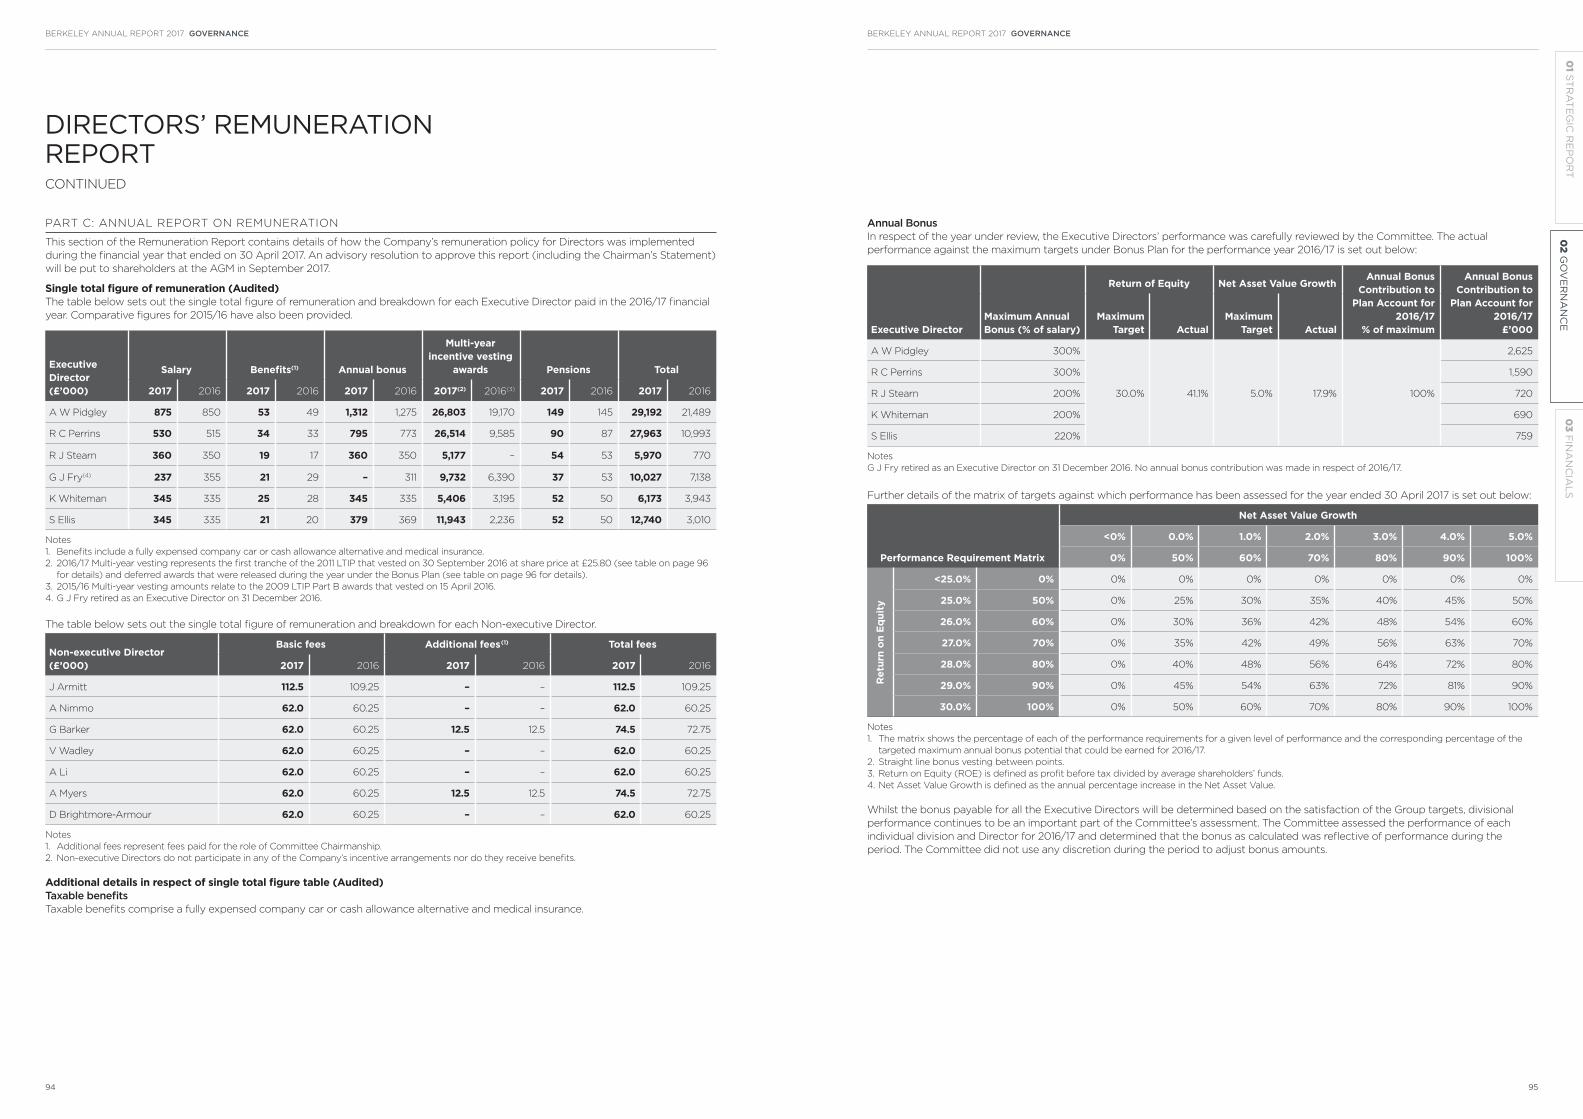
DIRECTORS’ REMUNERATION REPORTCONTINUED
PART C: ANNUAL REPORT ON REMUNERATION
This section of the Remuneration Report contains details of how the Company’s remuneration policy for Directors was implemented
during the financial year that ended on 30 April 2017. An advisory resolution to approve this report (including the Chairman’s Statement)
will be put to shareholders at the AGM in September 2017.
Single total figure of remuneration (Audited)The table below sets out the single total figure of remuneration and breakdown for each Executive Director paid in the 2016/17 financial
year. Comparative figures for 2015/16 have also been provided.
Executive Director (£’000)
Salary Benefits(1) Annual bonus
Multi-year incentive vesting
awards Pensions Total
2017 2016 2017 2016 2017 2016 2017(2) 2016(3) 2017 2016 2017 2016
A W Pidgley 875 850 53 49 1,312 1,275 26,803 19,170 149 145 29,192 21,489
R C Perrins 530 515 34 33 795 773 26,514 9,585 90 87 27,963 10,993
R J Stearn 360 350 19 17 360 350 5,177 – 54 53 5,970 770
G J Fry(4) 237 355 21 29 – 311 9,732 6,390 37 53 10,027 7,138
K Whiteman 345 335 25 28 345 335 5,406 3,195 52 50 6,173 3,943
S Ellis 345 335 21 20 379 369 11,943 2,236 52 50 12,740 3,010
Notes
1. Benefits include a fully expensed company car or cash allowance alternative and medical insurance.
2. 2016/17 Multi-year vesting represents the first tranche of the 2011 LTIP that vested on 30 September 2016 at share price at £25.80 (see table on page 96
for details) and deferred awards that were released during the year under the Bonus Plan (see table on page 96 for details).
3. 2015/16 Multi-year vesting amounts relate to the 2009 LTIP Part B awards that vested on 15 April 2016.
4. G J Fry retired as an Executive Director on 31 December 2016.
The table below sets out the single total figure of remuneration and breakdown for each Non-executive Director.
Non-executive Director (£’000)
Basic fees Additional fees(1) Total fees
2017 2016 2017 2016 2017 2016
J Armitt 112.5 109.25 – – 112.5 109.25
A Nimmo 62.0 60.25 – – 62.0 60.25
G Barker 62.0 60.25 12.5 12.5 74.5 72.75
V Wadley 62.0 60.25 – – 62.0 60.25
A Li 62.0 60.25 – – 62.0 60.25
A Myers 62.0 60.25 12.5 12.5 74.5 72.75
D Brightmore-Armour 62.0 60.25 – – 62.0 60.25
Notes
1. Additional fees represent fees paid for the role of Committee Chairmanship.
2. Non-executive Directors do not participate in any of the Company’s incentive arrangements nor do they receive benefits.
Additional details in respect of single total figure table (Audited)Taxable benefitsTaxable benefits comprise a fully expensed company car or cash allowance alternative and medical insurance.
Annual BonusIn respect of the year under review, the Executive Directors’ performance was carefully reviewed by the Committee. The actual
performance against the maximum targets under Bonus Plan for the performance year 2016/17 is set out below:
Executive DirectorMaximum Annual Bonus (% of salary)
Return of Equity Net Asset Value GrowthAnnual Bonus
Contribution to Plan Account for
2016/17% of maximum
Annual Bonus Contribution to
Plan Account for 2016/17
£’000 Maximum
Target ActualMaximum
Target Actual
A W Pidgley 300%
30.0% 41.1% 5.0% 17.9% 100%
2,625
R C Perrins 300% 1,590
R J Stearn 200% 720
K Whiteman 200% 690
S Ellis 220% 759
Notes
G J Fry retired as an Executive Director on 31 December 2016. No annual bonus contribution was made in respect of 2016/17.
Further details of the matrix of targets against which performance has been assessed for the year ended 30 April 2017 is set out below:
Performance Requirement Matrix
Net Asset Value Growth
<0% 0.0% 1.0% 2.0% 3.0% 4.0% 5.0%
0% 50% 60% 70% 80% 90% 100%
Ret
urn
on E
qui
ty
<25.0% 0% 0% 0% 0% 0% 0% 0% 0%
25.0% 50% 0% 25% 30% 35% 40% 45% 50%
26.0% 60% 0% 30% 36% 42% 48% 54% 60%
27.0% 70% 0% 35% 42% 49% 56% 63% 70%
28.0% 80% 0% 40% 48% 56% 64% 72% 80%
29.0% 90% 0% 45% 54% 63% 72% 81% 90%
30.0% 100% 0% 50% 60% 70% 80% 90% 100%
Notes
1. The matrix shows the percentage of each of the performance requirements for a given level of performance and the corresponding percentage of the
targeted maximum annual bonus potential that could be earned for 2016/17.
2. Straight line bonus vesting between points.
3. Return on Equity (ROE) is defined as profit before tax divided by average shareholders’ funds.
4. Net Asset Value Growth is defined as the annual percentage increase in the Net Asset Value.
Whilst the bonus payable for all the Executive Directors will be determined based on the satisfaction of the Group targets, divisional
performance continues to be an important part of the Committee’s assessment. The Committee assessed the performance of each
individual division and Director for 2016/17 and determined that the bonus as calculated was reflective of performance during the
period. The Committee did not use any discretion during the period to adjust bonus amounts.
BERKELEY ANNUAL REPORT 2017 GOVERNANCEBERKELEY ANNUAL REPORT 2017 GOVERNANCE
94 95
02
GO
VE
RN
AN
CE
03
FIN
AN
CIA
LS
01 S
TR
AT
EG
IC R
EP
OR
T
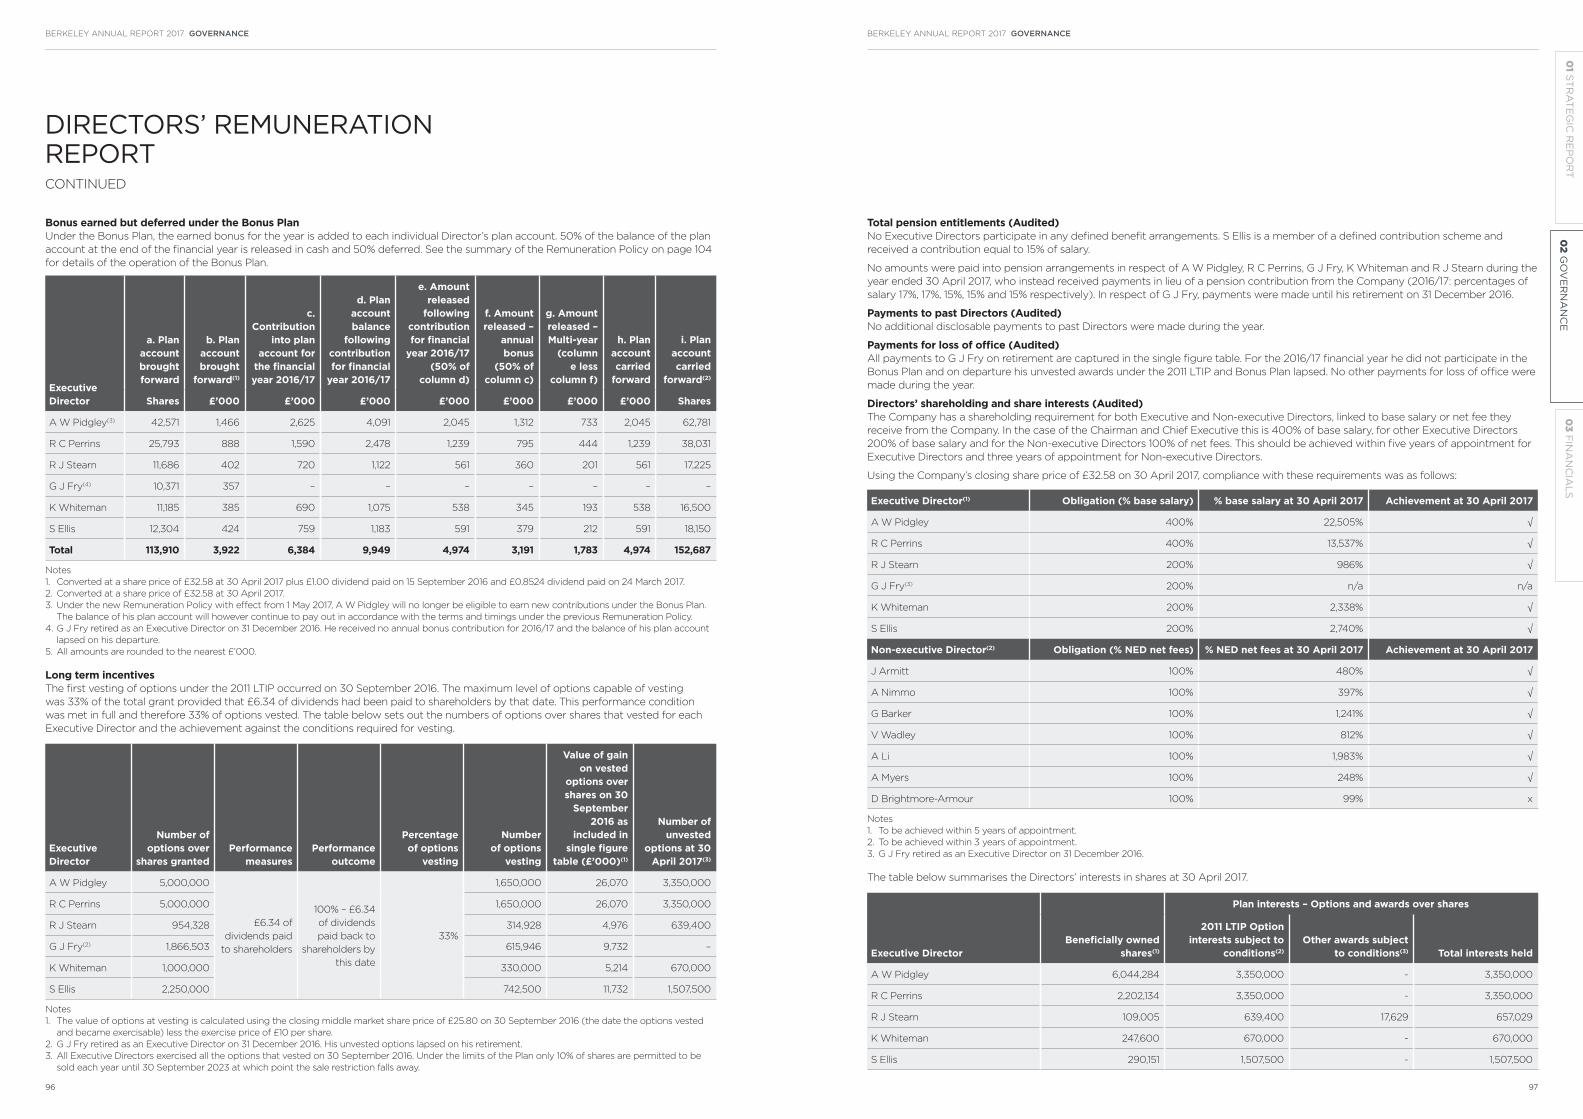
DIRECTORS’ REMUNERATION REPORTCONTINUED
Bonus earned but deferred under the Bonus PlanUnder the Bonus Plan, the earned bonus for the year is added to each individual Director’s plan account. 50% of the balance of the plan
account at the end of the financial year is released in cash and 50% deferred. See the summary of the Remuneration Policy on page 104
for details of the operation of the Bonus Plan.
Executive Director
a. Plan account brought forward
b. Plan account brought
forward(1)
c. Contribution
into plan account for
the financial year 2016/17
d. Plan account balance
following contribution for financial
year 2016/17
e. Amount released
following contribution for financial
year 2016/17 (50% of
column d)
f. Amount released –
annual bonus
(50% of column c)
g. Amount released – Multi-year
(column e less
column f)
h. Plan account carried
forward
i. Plan account carried
forward(2)
Shares £’000 £’000 £’000 £’000 £’000 £’000 £’000 Shares
A W Pidgley(3) 42,571 1,466 2,625 4,091 2,045 1,312 733 2,045 62,781
R C Perrins 25,793 888 1,590 2,478 1,239 795 444 1,239 38,031
R J Stearn 11,686 402 720 1,122 561 360 201 561 17,225
G J Fry(4) 10,371 357 – – – – – – –
K Whiteman 11,185 385 690 1,075 538 345 193 538 16,500
S Ellis 12,304 424 759 1,183 591 379 212 591 18,150
Total 113,910 3,922 6,384 9,949 4,974 3,191 1,783 4,974 152,687
Notes
1. Converted at a share price of £32.58 at 30 April 2017 plus £1.00 dividend paid on 15 September 2016 and £0.8524 dividend paid on 24 March 2017.
2. Converted at a share price of £32.58 at 30 April 2017.
3. Under the new Remuneration Policy with effect from 1 May 2017, A W Pidgley will no longer be eligible to earn new contributions under the Bonus Plan.
The balance of his plan account will however continue to pay out in accordance with the terms and timings under the previous Remuneration Policy.
4. G J Fry retired as an Executive Director on 31 December 2016. He received no annual bonus contribution for 2016/17 and the balance of his plan account
lapsed on his departure.
5. All amounts are rounded to the nearest £’000.
Long term incentivesThe first vesting of options under the 2011 LTIP occurred on 30 September 2016. The maximum level of options capable of vesting
was 33% of the total grant provided that £6.34 of dividends had been paid to shareholders by that date. This performance condition
was met in full and therefore 33% of options vested. The table below sets out the numbers of options over shares that vested for each
Executive Director and the achievement against the conditions required for vesting.
Executive Director
Number of options over
shares granted Performance
measuresPerformance
outcome
Percentage of options
vesting
Number of options
vesting
Value of gain on vested
options over shares on 30
September 2016 as
included in single figure
table (£’000)(1)
Number of unvested
options at 30 April 2017(3)
A W Pidgley 5,000,000
£6.34 of
dividends paid
to shareholders
100% – £6.34
of dividends
paid back to
shareholders by
this date
33%
1,650,000 26,070 3,350,000
R C Perrins 5,000,000 1,650,000 26,070 3,350,000
R J Stearn 954,328 314,928 4,976 639,400
G J Fry(2) 1,866,503 615,946 9,732 –
K Whiteman 1,000,000 330,000 5,214 670,000
S Ellis 2,250,000 742,500 11,732 1,507,500
Notes
1. The value of options at vesting is calculated using the closing middle market share price of £25.80 on 30 September 2016 (the date the options vested
and became exercisable) less the exercise price of £10 per share.
2. G J Fry retired as an Executive Director on 31 December 2016. His unvested options lapsed on his retirement.
3. All Executive Directors exercised all the options that vested on 30 September 2016. Under the limits of the Plan only 10% of shares are permitted to be
sold each year until 30 September 2023 at which point the sale restriction falls away.
Total pension entitlements (Audited)No Executive Directors participate in any defined benefit arrangements. S Ellis is a member of a defined contribution scheme and
received a contribution equal to 15% of salary.
No amounts were paid into pension arrangements in respect of A W Pidgley, R C Perrins, G J Fry, K Whiteman and R J Stearn during the
year ended 30 April 2017, who instead received payments in lieu of a pension contribution from the Company (2016/17: percentages of
salary 17%, 17%, 15%, 15% and 15% respectively). In respect of G J Fry, payments were made until his retirement on 31 December 2016.
Payments to past Directors (Audited)No additional disclosable payments to past Directors were made during the year.
Payments for loss of office (Audited)All payments to G J Fry on retirement are captured in the single figure table. For the 2016/17 financial year he did not participate in the
Bonus Plan and on departure his unvested awards under the 2011 LTIP and Bonus Plan lapsed. No other payments for loss of office were
made during the year.
Directors’ shareholding and share interests (Audited)The Company has a shareholding requirement for both Executive and Non-executive Directors, linked to base salary or net fee they
receive from the Company. In the case of the Chairman and Chief Executive this is 400% of base salary, for other Executive Directors
200% of base salary and for the Non-executive Directors 100% of net fees. This should be achieved within five years of appointment for
Executive Directors and three years of appointment for Non-executive Directors.
Using the Company’s closing share price of £32.58 on 30 April 2017, compliance with these requirements was as follows:
Executive Director(1) Obligation (% base salary) % base salary at 30 April 2017 Achievement at 30 April 2017
A W Pidgley 400% 22,505% √
R C Perrins 400% 13,537% √
R J Stearn 200% 986% √
G J Fry(3) 200% n/a n/a
K Whiteman 200% 2,338% √
S Ellis 200% 2,740% √
Non-executive Director(2) Obligation (% NED net fees) % NED net fees at 30 April 2017 Achievement at 30 April 2017
J Armitt 100% 480% √
A Nimmo 100% 397% √
G Barker 100% 1,241% √
V Wadley 100% 812% √
A Li 100% 1,983% √
A Myers 100% 248% √
D Brightmore-Armour 100% 99% x
Notes
1. To be achieved within 5 years of appointment.
2. To be achieved within 3 years of appointment.
3. G J Fry retired as an Executive Director on 31 December 2016.
The table below summarises the Directors’ interests in shares at 30 April 2017.
Executive DirectorBeneficially owned
shares(1)
Plan interests – Options and awards over shares
2011 LTIP Option interests subject to
conditions(2)
Other awards subject to conditions(3) Total interests held
A W Pidgley 6,044,284 3,350,000 - 3,350,000
R C Perrins 2,202,134 3,350,000 - 3,350,000
R J Stearn 109,005 639,400 17,629 657,029
K Whiteman 247,600 670,000 - 670,000
S Ellis 290,151 1,507,500 - 1,507,500
BERKELEY ANNUAL REPORT 2017 GOVERNANCEBERKELEY ANNUAL REPORT 2017 GOVERNANCE
96 97
02
GO
VE
RN
AN
CE
03
FIN
AN
CIA
LS
01 S
TR
AT
EG
IC R
EP
OR
T

DIRECTORS’ REMUNERATION REPORTCONTINUED
Non-executive DirectorBeneficially owned
shares(1)
Plan interests – Options and awards over shares
2011 LTIP Option interests subject to
conditions(2)
Other awards subject to conditions Total interests held
J Armitt 9,112 - - -
A Nimmo 4,000 - - -
G Barker 15,042 - - -
V Wadley 8,500 - - -
A Li 20,000 - - -
A Myers 3,000 - - -
D Brightmore-Armour 1,000 - - -
Notes
1. Beneficial interests include shares held directly or indirectly by connected persons.
2. The first tranche of the 2011 LTIP awards vested and were exercised during the year by the Executive Director participants (see page 96 for details).
3. Other share awards subject to conditions relate to the buy out shares awarded to R J Stearn on joining Berkeley on 13 April 2015 (the performance
conditions on these shares had been met at the point of the buy-out). Full details were set out in the 2014/15 Directors’ Remuneration Report. In the
event that dealing restrictions were to apply when awards vest, the Company decided that share awards would be converted into a nil-cost option over
the same number of shares on 29 April 2016. The change provides no additional benefit to R J Stearn. The first two tranches of nil cost options (totalling
28,043) vested and were exercised during the year.
There are no vested but unexercised options. Between 30 April 2017 and the date this report was signed there were no changes to the
beneficial interests shown above.
Performance and Group Chairman and Chief Executive pay over past 8 yearsThe graph below shows the Company’s performance, measured by total shareholder return (“TSR”), compared with the performance of
the FTSE 250, FTSE 100 and the FTSE All Share indices. The Company considers these the most relevant indices for total shareholder
return disclosure required under these Regulations.
Notes
1. Total shareholder return (“TSR”) is a measure showing the return on investing in one share of the Company over the measurement period (the return is
the value of the capital gain and reinvested dividends). This calculation is then carried out for the relevant indices.
FTSE 100 Index
FTSE All Share Index
Berkeley Group
Holdings plc
FTSE 250 Index
450
400
350
300
250
200
150
100
50
0
2009 2010 2011 2012 2013 2014 2015 2016 2017
The table below shows the remuneration of the Chairman and Chief Executive for each of the financial years shown above. Given the
nature of the roles of A W Pidgley and R C Perrins, the table below provides this information for both individuals.
Executive Director
Single total figure of remuneration (£’000)(1)
Annual bonus pay-out (as % maximum opportunity)(2)
Multi-year incentive vesting awards (as %
maximum opportunity)A W Pidgley
ChairmanR C Perrins
Chief Executive
2016/17 29,192 27,963 100% 100%/See Note 6
2015/16 21,489 10,993 100% 100%/See Note 5
2014/15 23,296 12,357 100% 100%/See Note 4
2013/14 3,757 2,271 100%
See Note 32012/13 3,638 2,198 100%
2011/12 2,799 1,692 100%
2010/11 2,033 1,226 100% n/a
2009/10 2,406 1,127 100% n/a
Notes
1. Single figure of total remuneration for each year has been calculated in accordance with the Regulations.
2. From 2010/11 onwards the annual bonus pay-out figures represent annual Company contributions under the Bonus Plan, introduced in 2010/11 and then
the new six year Bonus Plan put in place for 2015/16.
3. 2011/12, 2012/13 and 2013/14 Multi-year vesting awards represent deferred awards that were released during the year under the initial Bonus Plan. In
accordance with the initial Bonus Plan rules the Company’s contribution is earned based on the satisfaction of the annual performance conditions. Part of
the Company contribution is provided as a deferred award. 100% of these deferred awards will be paid out unless there has been forfeiture during the
deferral period and subject to continued employment at the date of release. At the year ended 30 April 2015, the last financial year of the initial Bonus
Plan, there were no forfeiture events under the Bonus Plan.
4. 2014/15 Multi-year vesting represents the 2009 LTIP Part B awards that vested during the year and the deferred Bonus Plan awards as per note 3 above.
5. 2015/16 Multi-year vesting represents the 2009 LTIP Part B awards that vested during the year.
6. 2016/17 Multi-year vesting represents the 2011 LTIP first tranche that vested during the year (see table on page 96 for details) and deferred awards that
were released during the year under the Bonus Plan (see table on page 96 for details).
Percentage change in Chairman’s and Chief Executive’s remuneration The table below compares the percentage increase in the Chairman’s and Chief Executive’s pay (including salary, taxable benefits and
annual bonus) between 2015/16 and 2016/17, with the wider employee population. The Company considers the full-time employee
population, excluding the Main Board, to be an appropriate comparator group and the most stable point of comparison:
2015/16 to 2016/17 year on year change (%)
A W Pidgley Chairman
R C PerrinsChief Executive Group employees
Base salary 2.9% 2.9% 5.1%
Taxable benefits 7.3% 3.0% 3.0%
Annual bonus 2.9% 2.9% 4.6%
Relative importance of spend on pay The table below sets out the relative importance of spend on pay in the 2016/17 and 2015/16 financial years compared with distributions
to shareholders.
2016/17(£m)
2015/16(£m) % change
Remuneration of Group employees (including Directors) 194 177 9.6%
Distributions to shareholders 299 259 15.3%
BERKELEY ANNUAL REPORT 2017 GOVERNANCEBERKELEY ANNUAL REPORT 2017 GOVERNANCE
98 99
02
GO
VE
RN
AN
CE
03
FIN
AN
CIA
LS
01 S
TR
AT
EG
IC R
EP
OR
T

DIRECTORS’ REMUNERATION REPORTCONTINUED
Statement of implementation of Remuneration Policy for 2017/18Executive DirectorsThe Remuneration Policy and its implementation for the forthcoming financial year is summarised below. In respect of the 2017/18
financial year and ongoing the Remuneration Committee has determined under the new Remuneration Policy that the only
remuneration payable to the Chairman other than an annual fee of £200,000 will be provided through the award that was granted to
him under the 2011 LTIP (provided the performance conditions are met) and the earned balance in his Bonus Plan account which will
continue to pay out in line with the rules of the Plan. There will be no entitlement to other salary, pension or bonus.
The Remuneration Committee believes that the Chairman should primarily be rewarded through the equity incentives which reflect both
the historic value he has helped create and his ongoing strategic role with the Company to ensure an alignment of his interests with
shareholders. The Remuneration Committee felt that in respect of the other Executive Directors who are responsible for the operation of
the Company and implementation of the strategy that all elements of the proposed Remuneration Policy should be provided.
Salary: In reviewing the salaries of the Executive Directors for 2017/18, the Committee has also taken account of the employment
conditions and salary increases awarded to employees throughout the Group, which were on average 4.6%. The salaries for 2017/18 are
set out below:
Executive Director2016/17 Salary
(£’000)2017/18 Salary
(£’000) % change
FTSE 250 – £’000
Lower Quartile Median Upper Quartile
A W Pidgley(1) 875 200 (77.1%) 155 193 250
R C Perrins 530 545 2.8% 483 551 626
R J Stearn 360 370 2.8% 320 365 419
K Whiteman 345 355 2.9% 303 358 416
S Ellis 345 355 2.9% 303 358 416
Notes
1. As set out in the 2017 EGM Notice, from 1 May 2017, A W Pidgley’s salary for 2017/18 has been set at an annual fee of £200,000. This fee is benchmarked
in the table above against fees for Non-executive Chairmen.
Benefits and Pension: The maximum pension contribution has been reduced from 25% of salary to 20%. The pension contributions for
2017/18 are as follows:
Executive Director2017/18 Pension contribution
(% of salary)
A W Pidgley(1) 0%
R C Perrins 17%
R J Stearn 15%
K Whiteman 15%
S Ellis 15%
Notes
1. As set out in the 2017 EGM Notice, from 1 May 2017, A W Pidgley’s no longer receives a pension contribution from the Company.
No changes proposed to benefits in 2017/18.
Bonus Plan: The maximum bonus opportunities for the year ending 30 April 2018, the third year of operation, are set out below. As set
out in the 2017 EGM Notice, A W Pidgley will no longer be eligible to earn new contributions under the Bonus Plan going forward. The
maximum bonus potential for the other Executive Directors are the same as those provided last financial year.
Executive Director R C Perrins R J Stearn K Whiteman S Ellis
Maximum Bonus (% of salary) 300% 200% 200% 220%
The table below sets out the targets in respect of the forthcoming year for all Executive Directors.
Group performance condition (year ending 30 April 2018)In line with best practice bonus targets are disclosed prospectively in full.
Performance Requirement Matrix
Net Asset Value Growth
<0% 0.0% 1.0% 2.0% 3.0% 4.0% 5.0%0% 50% 60% 70% 80% 90% 100%
Ret
urn
on E
qui
ty
<25.0% 0% Bonus Plan 0% 0% 0% 0% 0% 0%
25.0% 50% 0% 25% 30% 35% 40% 45% 50%
27.0% 60% 0% 30% 36% 42% 48% 54% 60%
29.0% 70% 0% 35% 42% 49% 56% 63% 70%
31.0% 80% 0% 40% 48% 56% 64% 72% 80%
33.0% 90% 0% 45% 54% 63% 72% 81% 90%
35.0% 100% 0% 50% 60% 70% 80% 90% 100%
The Committee when setting the Group performance conditions follows the approach agreed with shareholders as part of the approval
of the Bonus Plan. The Committee committed to setting performance conditions to ensure that over the six year plan period on average
the following ranges were achieved:
– ROE range 20% to 25% p.a.;
– NAV Growth range 0% to 5% p.a.
The Committee believes that taking into account the market faced by the Company and the strategy set that the above targets are
suitably challenging given the incentive opportunity that can be earned. The ROE targets reflect the Company’s expectations on
performance over the next period in the context of the prevailing market uncertainty and risk. The Committee notes that the Company
is in a phase of strong profit delivery, following investment during the downturn, and that more normal levels of profitability will return
from 2018/19 with targets set appropriately to reflect this.
The NAV Growth targets remain the same as the Committee believes they provide the appropriate dynamic tension with the
requirement to pay dividends whilst maintaining the Company’s asset base.
Whilst the bonus payable for all the Executive Directors will be determined by the satisfaction of the Group targets, the divisional
performance continues to be an important part of the Committee’s assessment. At the discretion of the Committee the failure of a
particular Division to meet its individual targets may result in a reduction to the bonus amount paid to the relevant Divisional Director.
Long term incentives: The current Executive Directors will not be granted additional options under the 2011 LTIP.
Caps on LTIP Value and Total Remuneration: For 2017/18 the Remuneration Committee has introduced remuneration caps on the value
provided under the Remuneration Policy each year. The Caps will apply to amounts earned during the financial year commencing 1 May
2017. The following table shows the annual LTIP Cap and the Total Remuneration Cap for each Executive Director.
Executive DirectorLTIP Cap (1)
(£’000)
Other Elements(Salary, Bonus & Pension)
(£’000)
Total Remuneration Cap (1)
(£’000)
A W Pidgley(2) 8,000 200 8,200
R C Perrins 5,500 2,500 8,000
R J Stearn 2,000 1,250 3,250
K Whiteman 2,000 1,250 3,250
S Ellis 3,750 1,250 5,000
Notes
1. The Total Remuneration Cap covers Salary, Bonus; Pension; and LTIP options. The LTIP Cap covers the value at vesting of LTIP options and is a separate
cap within the overall Total Remuneration Cap. In the operation of the LTIP Cap where shares have vested as a result of the performance conditions being
met but the value is capped in a given year, the balance of the shares will be banked and carried forward. This banked balance will still be subject to
continued employment but will become exercisable at the next vesting date provided the Caps are not exceeded. This process will continue until 2023 at
which point any banked shares which have not become exercisable will lapse. The Remuneration Committee has extended the period over which banked
shares become exercisable to 2023 to provide a longer lock-in of participants. The LTIP Cap provides an extension of two years from when the 2011 LTIP
currently finishes in 2021.
2. In respect of the 2017/18 financial year and ongoing the Remuneration Committee has determined under the proposed Remuneration Policy that the only
remuneration payable to the Chairman is a fixed fee of £200,000 p.a., other than the award that was granted to him under the 2011 LTIP, which will be
subject to the new remuneration caps, and the earned balance in his Bonus Plan account which will continue to pay out in line with the rules of the Plan.
There will be no entitlement to other salary, pension or bonus. The Remuneration Committee believes that the Chairman should primarily be rewarded
through the equity incentives which reflect both the historic value he has helped create and his ongoing strategic role with the Company to ensure an
alignment of his interests with shareholders.
BERKELEY ANNUAL REPORT 2017 GOVERNANCEBERKELEY ANNUAL REPORT 2017 GOVERNANCE
100 101
02
GO
VE
RN
AN
CE
03
FIN
AN
CIA
LS
01 S
TR
AT
EG
IC R
EP
OR
T
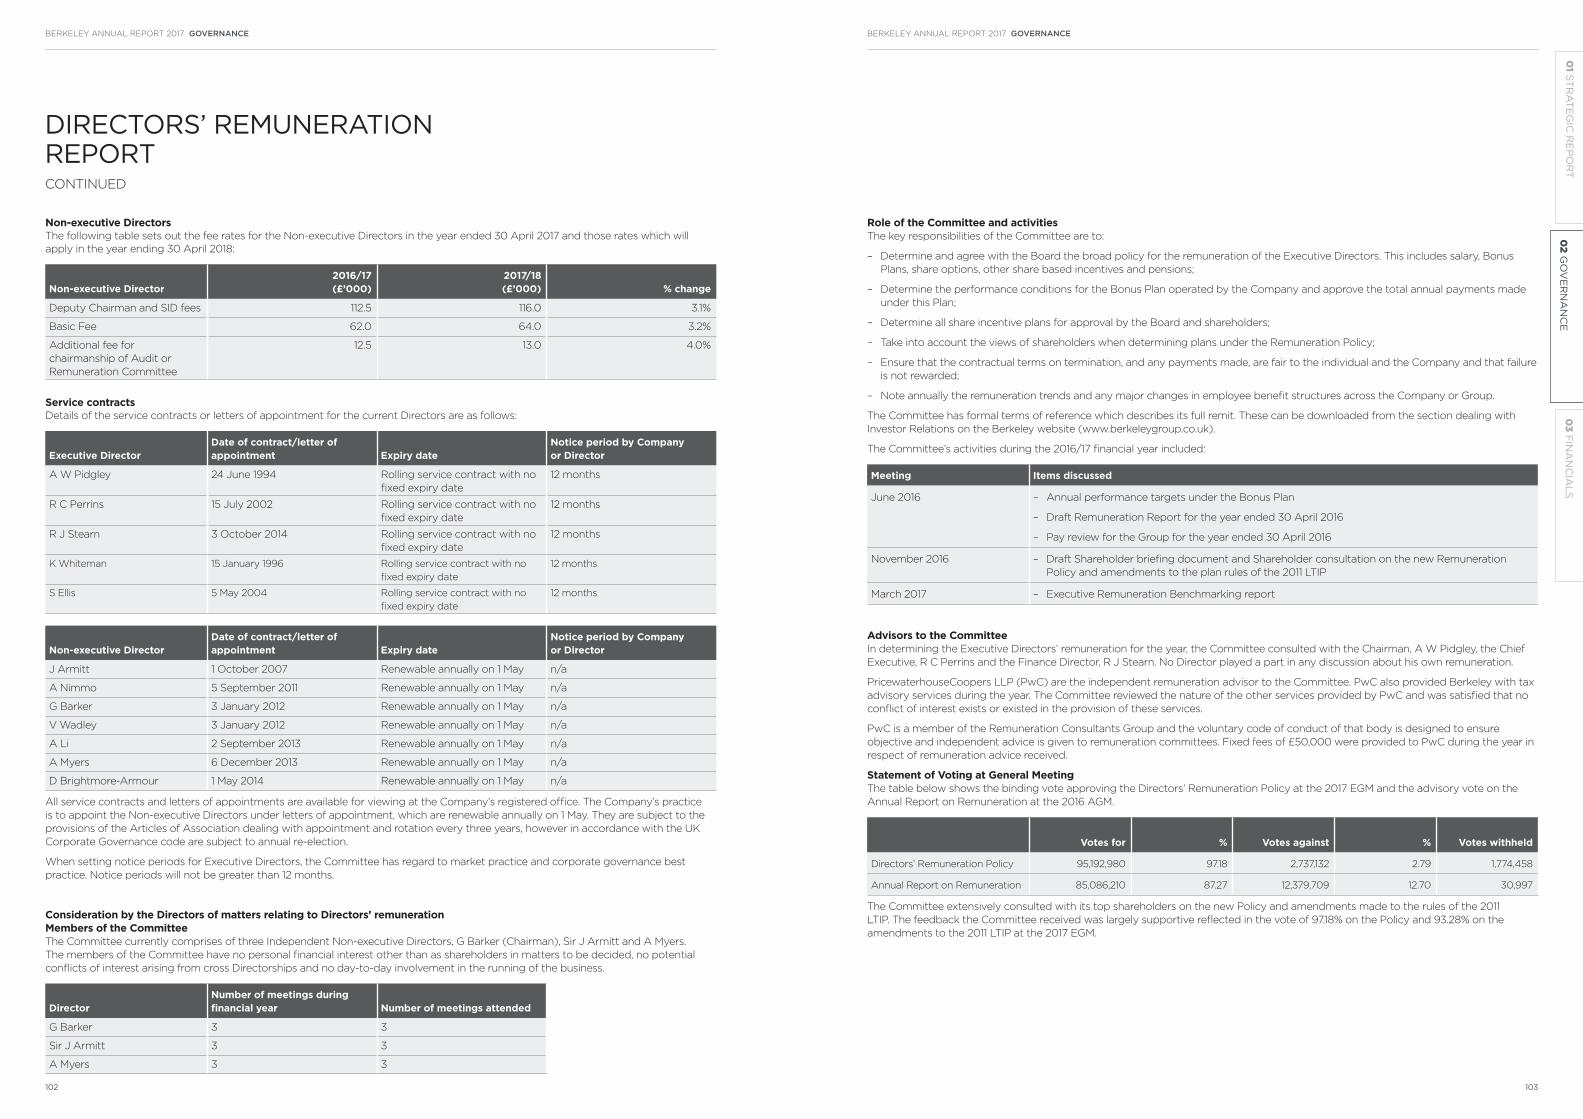
DIRECTORS’ REMUNERATION REPORTCONTINUED
Non-executive DirectorsThe following table sets out the fee rates for the Non-executive Directors in the year ended 30 April 2017 and those rates which will
apply in the year ending 30 April 2018:
Non-executive Director2016/17(£’000)
2017/18(£’000) % change
Deputy Chairman and SID fees 112.5 116.0 3.1%
Basic Fee 62.0 64.0 3.2%
Additional fee for
chairmanship of Audit or
Remuneration Committee
12.5 13.0 4.0%
Service contractsDetails of the service contracts or letters of appointment for the current Directors are as follows:
Executive DirectorDate of contract/letter of appointment Expiry date
Notice period by Company or Director
A W Pidgley 24 June 1994 Rolling service contract with no
fixed expiry date
12 months
R C Perrins 15 July 2002 Rolling service contract with no
fixed expiry date
12 months
R J Stearn 3 October 2014 Rolling service contract with no
fixed expiry date
12 months
K Whiteman 15 January 1996 Rolling service contract with no
fixed expiry date
12 months
S Ellis 5 May 2004 Rolling service contract with no
fixed expiry date
12 months
Non-executive DirectorDate of contract/letter of appointment Expiry date
Notice period by Company or Director
J Armitt 1 October 2007 Renewable annually on 1 May n/a
A Nimmo 5 September 2011 Renewable annually on 1 May n/a
G Barker 3 January 2012 Renewable annually on 1 May n/a
V Wadley 3 January 2012 Renewable annually on 1 May n/a
A Li 2 September 2013 Renewable annually on 1 May n/a
A Myers 6 December 2013 Renewable annually on 1 May n/a
D Brightmore-Armour 1 May 2014 Renewable annually on 1 May n/a
All service contracts and letters of appointments are available for viewing at the Company’s registered office. The Company’s practice
is to appoint the Non-executive Directors under letters of appointment, which are renewable annually on 1 May. They are subject to the
provisions of the Articles of Association dealing with appointment and rotation every three years, however in accordance with the UK
Corporate Governance code are subject to annual re-election.
When setting notice periods for Executive Directors, the Committee has regard to market practice and corporate governance best
practice. Notice periods will not be greater than 12 months.
Consideration by the Directors of matters relating to Directors’ remuneration Members of the CommitteeThe Committee currently comprises of three Independent Non-executive Directors, G Barker (Chairman), Sir J Armitt and A Myers.
The members of the Committee have no personal financial interest other than as shareholders in matters to be decided, no potential
conflicts of interest arising from cross Directorships and no day-to-day involvement in the running of the business.
DirectorNumber of meetings during financial year Number of meetings attended
G Barker 3 3
Sir J Armitt 3 3
A Myers 3 3
Role of the Committee and activitiesThe key responsibilities of the Committee are to:
– Determine and agree with the Board the broad policy for the remuneration of the Executive Directors. This includes salary, Bonus
Plans, share options, other share based incentives and pensions;
– Determine the performance conditions for the Bonus Plan operated by the Company and approve the total annual payments made
under this Plan;
– Determine all share incentive plans for approval by the Board and shareholders;
– Take into account the views of shareholders when determining plans under the Remuneration Policy;
– Ensure that the contractual terms on termination, and any payments made, are fair to the individual and the Company and that failure
is not rewarded;
– Note annually the remuneration trends and any major changes in employee benefit structures across the Company or Group.
The Committee has formal terms of reference which describes its full remit. These can be downloaded from the section dealing with
Investor Relations on the Berkeley website (www.berkeleygroup.co.uk).
The Committee’s activities during the 2016/17 financial year included:
Meeting Items discussed
June 2016 – Annual performance targets under the Bonus Plan
– Draft Remuneration Report for the year ended 30 April 2016
– Pay review for the Group for the year ended 30 April 2016
November 2016 – Draft Shareholder briefing document and Shareholder consultation on the new Remuneration
Policy and amendments to the plan rules of the 2011 LTIP
March 2017 – Executive Remuneration Benchmarking report
Advisors to the CommitteeIn determining the Executive Directors’ remuneration for the year, the Committee consulted with the Chairman, A W Pidgley, the Chief
Executive, R C Perrins and the Finance Director, R J Stearn. No Director played a part in any discussion about his own remuneration.
PricewaterhouseCoopers LLP (PwC) are the independent remuneration advisor to the Committee. PwC also provided Berkeley with tax
advisory services during the year. The Committee reviewed the nature of the other services provided by PwC and was satisfied that no
conflict of interest exists or existed in the provision of these services.
PwC is a member of the Remuneration Consultants Group and the voluntary code of conduct of that body is designed to ensure
objective and independent advice is given to remuneration committees. Fixed fees of £50,000 were provided to PwC during the year in
respect of remuneration advice received.
Statement of Voting at General Meeting The table below shows the binding vote approving the Directors’ Remuneration Policy at the 2017 EGM and the advisory vote on the
Annual Report on Remuneration at the 2016 AGM.
Votes for % Votes against % Votes withheld
Directors’ Remuneration Policy 95,192,980 97.18 2,737,132 2.79 1,774,458
Annual Report on Remuneration 85,086,210 87.27 12,379,709 12.70 30,997
The Committee extensively consulted with its top shareholders on the new Policy and amendments made to the rules of the 2011
LTIP. The feedback the Committee received was largely supportive reflected in the vote of 97.18% on the Policy and 93.28% on the
amendments to the 2011 LTIP at the 2017 EGM.
BERKELEY ANNUAL REPORT 2017 GOVERNANCEBERKELEY ANNUAL REPORT 2017 GOVERNANCE
102 103
02
GO
VE
RN
AN
CE
03
FIN
AN
CIA
LS
01 S
TR
AT
EG
IC R
EP
OR
T

DIRECTORS’ REMUNERATION REPORTCONTINUED
PART D: REMUNERATION POLICY SUMMARY
In line with The Large and Medium-sized Companies and Groups (Accounts and Reports) (Amendment) Regulations 2013, the Directors’
Remuneration Policy has been presented in this report in summary given that the Policy was approved at the 2017 EGM and it is not
intended to move a similar resolution again at the 2017 AGM. The Directors’ Remuneration Policy is available to view in full on the
Company’s website at www.berkeleygroup.co.uk/investor-information/corporate-governance.
Objective and link to strategy
Key features Maximum opportunity Performance conditions and assessment
Executive Directors
Base salary To recruit and retain
Executive Directors of the
appropriate calibre and
experience to achieve
the Company’s business
strategy.
An Executive Director’s basic salary is set
on appointment and reviewed annually
(effective from 1 May each year) or when
there is a change in position or responsibility.
When determining an appropriate level of
salary, the Committee considers:
− the Executive Director’s experience and
responsibilities;
− the performance of the individual
Executive Director and the Group;
− pay and conditions throughout the Group;
− general salary rises to employees;
− the economic environment; and
− levels of base salary for similar positions
with comparable status, responsibility and
skills in peers.
Typically, the base salaries of
Executive Directors in post at the
start of the Policy Period and who
remain in the same role throughout
the Policy Period will be increased
by a similar percentage to the
average annual percentage
increase in salaries of all other
employees in the Group.
The Total Remuneration Cap may
apply to salary.
There are no performance
conditions on salary.
However, the performance
of the individual and the
Company are reflected in the
salary they are paid.
No recovery provisions apply.
Pension and benefits To provide competitive
levels of retirement
benefits.
The Company’s policy is either to provide a
contribution to a pension arrangement or
provide payments in lieu of pension. Other
benefits are provided to the Executive
Directors including a fully expensed
company car or cash allowance alternative,
medical insurance and other benefits may be
provided from time to time.
The maximum pension contribution
allowance for Executive Directors is
20% of salary.
Levels of benefits are defined by
market rates.
No performance or recovery
provisions apply.
Annual bonus Aligns reward to the
key objectives linked to
short to medium term
performance whilst
ensuring that there
is a balance between
incentivising the Executive
Directors, providing a
sustainable ongoing level
of return to shareholders
and ensuring the long
term sustainability of the
Company.
Under the Bonus Plan, awards are earned
annually over a six year plan period, subject
to stretching performance targets, which are
set at the beginning of the plan year.
50% of a participant’s plan account will be
paid out annually for the first five years with
100% of the balance paid at the end of the
sixth plan year.
Malus applies up to the date of payment.
Clawback applies three years post the date
of payment.
The maximum bonus opportunity
is 300% of salary for any plan year.
In operation of the Bonus Plan the
following maximums are currently
applied:
− R C Perrins 300%;
− R J Stearn 200%
− K Whiteman 200%
− S Ellis 220%
The Total Remuneration Cap may
apply to new awards earned under
the Bonus Plan.
An award under the Bonus
Plan is subject to satisfying
financial and strategic/
operational performance/
personal performance
conditions and targets
measured over a period of
one financial year.
The current performance
condition is a matrix of
Return on Equity (ROE) and
Net Asset Value Growth
(NAV).
There is a risk adjustment
mechanism built into the
operation of the Bonus Plan.
If the threshold levels of ROE
or NAV are not met for any
financial year during the six
years of operation of the
Bonus Plan up to 50% of a
participant’s plan account will
be forfeited.
Long term Incentives No plan available for
new grants during the
Policy Period to current
Executive Directors.
No plan available for new grants during the three year Policy Period unless, on recruitment, where a new Executive
Director may be eligible to participate in the 2011 LTIP and also provided the total number of awards granted to all
participants do not exceed the limits agreed with shareholders at the 2011 AGM.
Further details on the operation of the 2011 LTIP are set out below this table.
Total Remuneration CapTo achieve a balance
between the need to
reward and incentivise
the Executive Directors to
implement the Company
strategy and the interests
of other stakeholders in
the Company.
Individual caps will limit the amount of total
remuneration that has been earned over the
financial year and is capable of being paid
out.
Individual Total Remuneration Caps are in
addition to the LTIP Cap.
The elements of remuneration subject to the
Total Remuneration Cap are:
− salary;
− bonus;
− pension; and
− 2011 LTIP (also subject to a separate LTIP
Cap).
Where the total remuneration would exceed
the Total Remuneration Cap the 2011 LTIP
vesting will be reduced first followed by the
bonus.
The Total Remuneration Caps
for the Executive Directors
commencing on 1 May 2017 are set
out below:
Total Remuneration Cap p.a. (£)
A W Pidgley 8,200,000
R C Perrins 8,000,000
R J Stearn 3,250,000
K Whiteman 3,250,000
S Ellis 5,000,000
None
Shareholding requirement To ensure that Executive
Directors’ interests are
aligned with those of
shareholders over a longer
time horizon.
The Committee operates a system of
shareholder guidelines to encourage long
term share ownership by the Executive
Directors.
This should be achieved within five years of
appointment for Executive Directors.
400% of base salary for the Group
Chairman and Chief Executive.
200% of base salary for other
Executive Directors.
Non-executive Directors
To attract Non-executive
Directors with the
requisite skills and
experience to contribute
to the strategy of the
Company and to review
its implementation.
Each Non-executive Director receives a fee
which relates to membership of the Board
and additional fees are paid for Committee
Chairmanship.
Changes are effective from 1 May each year.
Shareholding requirement for Non-executive
Directors equal to 100% of net fees.
Non-executive Directors do not participate
in any variable remuneration or benefits/
pension arrangements.
In general fee rises will be limited to
the level provided to employees of
the Company as a whole.
None
BERKELEY ANNUAL REPORT 2017 GOVERNANCEBERKELEY ANNUAL REPORT 2017 GOVERNANCE
104 105
02
GO
VE
RN
AN
CE
03
FIN
AN
CIA
LS
01 S
TR
AT
EG
IC R
EP
OR
T

DIRECTORS’ REMUNERATION REPORTCONTINUED
2011 LTIPThe following subsisting options will continue to operate on the terms and conditions set out in the 2011 LTIP rules, as approved by
shareholders. Full details of the subsisting options are set out in previous years’ Annual Reports on Remuneration. Options under these
arrangements do not form part of the ongoing Remuneration Policy; however payments may be made in the future subject to the
achievement of the relevant performance conditions.
Objective and link to strategy Key features
Executive Directors
To align Executive Directors’ interests with those of shareholders by
focusing on creating sustainable superior returns to shareholders over a
10 year period.
The 2011 LTIP is a ten year plan which directly supports the Company’s
corporate strategy.
The 2011 LTIP aims to make returns to shareholders in cash over a sustained
period, ensuring that the Group remains at the right size and balances
investment and returns to shareholders.
Options vest in annual tranches based on cumulative return targets. The
exercise price of options will be £16.34 per share less an amount equal to the
value of all dividends paid between the date of approval of the 2011 LTIP and
30 September 2021, provided the exercise price cannot be less than zero.
Individual caps (LTIP Caps) will limit the amount of an option that is capable
of exercise. Any options that are vested but not exercisable due to the LTIP
Cap, will be banked and be capable of exercise in subsequent years subject
to the operation of the LTIP Cap in those years. The period over which
banked options can become exercisable has been extended for an additional
two years (2022 and 2023) after the end of the original performance period
(2021). Any banked options which have not become exercisable by 2023 will
lapse.
The total value of all options granted under the 2011 LTIP is subject to a global
cap at vesting based on the following formulae: Number of shares subject
to Plan x £35 per share. The value of an option for the purpose of the cap
is calculated as the gain on vesting (market price of a share on vesting less
the exercise price x number of shares vesting). The global cap is allocated
proportionately to each vesting. Any element of unused global cap will roll
forward to the next vesting.
Any shares acquired through the exercise of options under the 2011 LTIP are
subject to a restriction that no more than 10% of these shares are eligible to
be sold each year until 30 September 2023 at which point the sale restriction
falls away. This limit is cumulative so if no shares are sold in a year that
number can be sold in a subsequent year as well as the shares eligible for sale
in respect of that year.
Malus applies up to the date of exercise Clawback applies two years post the
date of exercise.
Maximum opportunity Performance conditions and assessment
No new options will be granted under the 2011 LTIP to the current Executive Directors. On
recruitment, a new Executive Director will be eligible to participate in the 2011 LTIP subject to
availability for new grants.
The maximum number of shares capable of being granted to all participants is 19,616,503
shares.
Options were granted to the current
Executive Directors as follows:
Executive Director Number of shares
A W Pidgley 5,000,000
R C Perrins 5,000,000
R J Stearn 954,328
S Ellis 2,250,000
K Whiteman 1,000,000
Where the value of options vesting in a period (as calculated for the purposes of the single
total figure of remuneration disclosure) is greater than the LTIP Cap, the options above the
LTIP Cap will not become exercisable at this vesting date and will be banked. The following
sets out how the LTIP Cap will operate:
1. The potential gain of the tranche of the 2011 LTIP options at the relevant date of vesting (B)
is limited by the LTIP Cap (A) as set out in respect of each Executive Director in the table
above. In all cases the performance conditions will have been satisfied or the tranche will
lapse.
2. This potential gain (B) at the date of vesting is calculated as follows:
Number of options capable of vesting x
(market price of a share on the date of vesting – exercise price) = (B)
3. Where (B) is greater than (A) the excess value will be converted into a number of options
by dividing it by the gain per share subject to each option calculated at the date of vesting.
These options will not become exercisable at this vesting date and will be banked.
4. The number of options calculated under 3 equivalent to the excess value will be banked and
subject to the following terms:
a. There are no further performance conditions to be satisfied;
b. They remain subject to an employment condition until they become exercisable;
c. They will become exercisable at the next vesting date in part or in full up to the value of
the LTIP Cap for that financial year taking into account options vesting in respect of that
year’s 2011 LTIP tranche using the above methodology. In addition;
i. irrespective of whether the relevant tranche for that year vests (i.e. whether the
performance conditions have been met for the tranche) it does not affect the potential
exercise of options in the bank;
ii. this process will continue until all banked options have become exercisable or until 30
September 2023 at which point any banked options that have not become exercisable
will lapse.
The above calculations will be performed at each vesting date for a tranche under the 2011
LTIP. It is therefore possible that options may be banked in a number of years.
In order for options to vest, the following levels of return
(through a combination of dividends and share buy-
backs) must be provided to shareholders.
Date (By)
Return (£) Cumulative Return (£) % of Option vesting
Sept 16
Paid Paid 33.0% (Vested)
Sept 17
277,690,956 277,690,956 plus £2 for each share issued or reissued in the period 1 October 2016 to the 29 September 2017
13.4%
Sept 18
277,690,956 555,381,912 plus £2 for each share issued or reissued in the period 1 October 2016 to the 29 September 2018
13.4%
Sept 19
277,690,956 833,072,868 plus £2 for each share issued or reissued in the period 1 October 2016 to the 29 September 2019
13.4%
Sept 20
277,690,956 1,110,763,824 plus £2 for each share issued or reissued in the period 1 October 2016 to the 29 September 2020
13.4%
Sept 21
277,690,956 1,388,454,780 plus £2 for each share issued or reissued in the period 1 October 2016 to the 29 September 2021
13.4%
Sept 22
n/a n/a Banked balance to cap
Sept 23
n/a n/a Banked balance to cap
If the annual return payment is not made for the
relevant year that tranche of the option will lapse. If in a
subsequent year the cumulative returns paid reach the
targeted level, the tranche for that year will vest; however,
tranches where the annual return payment was not made
for the relevant year will remain lapsed.
It should be noted that any new shares issued (from
Treasury or as newly listed shares) increase the absolute
level of cumulative return required.
The following individual caps on the value of
options capable of exercise will operate:
Executive Director LTIP Cap (£) (p.a.)
A W Pidgley 8,000,000
R C Perrins 5,500,000
R J Stearn 2,000,000
S Ellis 3,750,000
K Whiteman 2,000,000
The Directors Remuneration Report has been approved by the Board.
By Order of the Board
G BarkerChairman, Remuneration Committee21 June 2017
BERKELEY ANNUAL REPORT 2017 GOVERNANCEBERKELEY ANNUAL REPORT 2017 GOVERNANCE
106 107
02
GO
VE
RN
AN
CE
03
FIN
AN
CIA
LS
01 S
TR
AT
EG
IC R
EP
OR
T
DIRECTORS’ REPORT
The Directors submit their report together
with the audited consolidated and
company financial statements for the year
ended 30 April 2017.
Principal activities and review of the businessThe Company is the UK holding company
of a Group engaged in residential-led
property development focusing on urban
regeneration and mixed-use developments.
The Company is incorporated and
domiciled in England and Wales and is
quoted on the London Stock Exchange.
The information that fulfils the
requirements of the Strategic Report
can be found on pages 2 to 75 of the
Annual Report which provide more
detailed commentaries on the business
performance during the year together with
the outlook for the future. In particular,
information in respect of the principal
financial and operating risks of the
business is set out on pages 59 to 69 of the
Strategic Report.
Trading results and dividendsThe Group’s consolidated profit after
taxation for the financial year was £645.1
million (2016: £404.1 million). The Group’s
joint ventures contributed a profit after
taxation of £63.8 million (2016: £36.5
million).
An interim dividend of 100 pence per
share was paid to shareholders on 15
September 2016 and a further interim
dividend of 85.24 pence per share was paid
to shareholders on 24 March 2017. A further
interim dividend is proposed to be paid as
part of the £138.8 million shareholder return
to be provided by 30 September 2017
through a combination of dividends and
share buy-backs. The amount to be paid as
a dividend will be announced on 17 August,
taking account of any share buy-backs
made during the period 2 December 2016
to 30 September 2017. The dividend will be
paid on 15 September 2017 to shareholders
on the register on 25 August 2017.
Post balance sheet eventThere are no post balance sheet events.
Share capitalThe Company had 140,157,183 ordinary
shares in issue at 30 April 2017 (2016
138,257,183). During the year to 30 April
2017 and in accordance with the authority
provided by shareholders at the 2015
and 2016 Annual General Meetings, the
Company has purchased 2,418,472 ordinary
shares with a nominal value of £120,924
which equated to 1.7% of the called up
share capital of the Company at the
beginning of the period, excluding Treasury
shares. The aggregate consideration paid
for these shares was £64.5 million. As at
30 April 2017 the Company held 2,418,472
shares in Treasury. These shares have no
voting rights. Authority will be sought from
shareholders at the forthcoming Annual
General Meeting to renew the authority
given at the 2016 Annual General Meeting
for a further year, permitting the Company
to purchase its own shares in the market up
to a limit of 10% of its issued share capital.
Movements in the Company’s share capital
are shown in note 18 to the consolidated
financial statements.
Information on the Group’s share option
schemes is set out in note 5 to the
consolidated financial statements. Details
of the Long-Term Incentive Schemes
and Long-Term Incentive Plans for key
executives are set out within the Directors’
Remuneration Report on pages 89 to 107.
Articles of associationThe Articles of Association set out the
basic management and administrative
structure of the Company. They regulate
the internal affairs of the Company and
cover such matters as the issue and
transfer of shares, Board and shareholder
meetings, powers and duties of Directors
and borrowing powers. In accordance with
the Articles of Association, Directors can
be appointed or removed by shareholders
in a general meeting.
The Articles may only be amended by
special resolution at a general meeting
of shareholders. Copies are available by
writing to the Company Secretary and
are also open to inspection at Companies
House.
DirectorsThe Directors of the Company and their
profiles are detailed on pages 78 to 81.
All of these Directors served throughout
the year under review. In addition, G J Fry
served as a Director of the Company from
1 May to 31 December 2016.
The Articles of Association of the Company
require Directors to submit themselves for
re-election every three years. In addition,
all Directors are subject to election at the
first opportunity after their appointment to
the Board. However, in accordance with the
UK Corporate Governance Code 2014 all of
the Directors will offer themselves for re-
election at the forthcoming Annual General
Meeting.
The Directors’ interests in the share capital
of the Company and its subsidiaries are
shown in the Directors’ Remuneration
Report on pages 97 and 98. At 30 April
2017 each of the Executive Directors were
deemed to have a non-beneficial interest
in 424,872 (2015: 338,061) ordinary shares
held by the Trustees of The Berkeley
Group Employee Benefit Trust (“EBT”). The
Trustee of the EBT has waived entitlement
to dividends until further notice and has
agreed not to vote on any shares held in
the EBT at any general meeting.
There were no contracts of significance
during, or at the end of, the financial year in
which a Director of the Company is, or was,
materially interested, other than those set
out in note 25 to the consolidated financial
statements, the contracts of employment
of the Executive Directors, which are
terminable within one year, and the
appointment terms of the Non-executive
Directors, which are renewable annually
and terminable on one month’s notice.
Directors’ indemnitiesThe Company’s practice has always been
to indemnify its Directors in accordance
with the Company’s Articles of Association
and to the maximum extent permitted
by law. Qualifying third party indemnities,
under which the Company has agreed
to indemnify the Directors, were in force
during the financial year and at the date
of approval of the financial statements, in
accordance with the Company’s Articles
of Association and to the maximum extent
permitted by law, in respect of all costs,
charges, expenses, losses and liabilities,
which they may incur in or about the
execution of their duties to the Company,
or any entity which is an associated
company (as defined in Section 256 of
the Companies Act 2006), or as a result
of duties performed by the Directors
on behalf of the Company or any such
associated company.
Substantial shareholdersThe Company has been notified of the
following interests, pursuant to Rule 5 of
the Disclosure Guidance and Transparency
Rules (“DGTR”), as at 30 April 2017:
Number of ordinary
shares held(i)
% of voting
rights(i)Nature of holdings
First Eagle
Investment
Management
LLC (ii)
15,197,119 11.02 Indirect
BlackRock Inc. 13,752,976 9.97 Indirect
Standard Life
Investments
6,443,253 4.76 Direct/
Indirect
A W Pidgley, CBE 5,498,916 3.9868 Direct
(i) The number of ordinary shares held and percentage
of voting rights is as stated by the shareholder at the
time of notification.
(ii) First Eagle Overseas Fund have notified the Company
that they hold 4,212,259 ordinary shares which is
3.02% of voting rights. This holding is included in
the indirect interests of 11.02% held by First Eagle
Investment Management LLC.
Between 30 April 2017 and 20 June 2017
the Company has also been notified of the
following interests, pursuant to Rule 5 of
the DGTR:
Number of
ordinary shares
held
% of voting
rights(i)Nature of holdings
BlackRock Inc. 13,784,370 10.00 Indirect
(i) The number of ordinary shares held and percentage
of voting rights held is as stated by the shareholder at
the time of notification.
DonationsThe Group made no political donations
(2016: £nil) during the year.
Employment policyThe Group’s policy of operating through
autonomous subsidiaries has ensured close
consultation with employees on matters
likely to affect their interests. The Group is
firmly committed to the continuation and
strengthening of communication lines with
all its employees.
An Equal Opportunities Policy was
introduced in 2001. Following periodic
reviews (the most recent in September
2010) the policy is now an Equality
and Diversity Policy with the aim of
ensuring that all employees, potential
employees and other individuals receive
equal treatment (including access to
employment, training and opportunity
for promotion) regardless of their age,
disability, gender reassignment, marriage
and civil partnership, pregnancy and
maternity, race, religion or belief (including
lack of belief), sex and sexual orientation.
It is the policy of the Group to support the
employment of people with disabilities
wherever practicable and to ensure,
as far as possible, the training, career
development and promotion opportunities
are available to all employees. This policy
includes employees who become disabled
whilst employed by the Group.
All disclosures concerning diversity of the
Group’s Directors, senior management
and employees (as required under the
Companies Act 2006 (Strategic Report
and Directors’ Report) Regulations 2013)
are contained within the Strategic Report
on page 41.
The Group has implemented Human
Rights, Modern Slavery and Child Labour
policies in support of human rights which
is implicit in all of its pre-existing corporate
policies and procedures. The Group
believes these policies to be effective in
promoting and protecting human rights
by establishing clear ethical standards for
ourselves and our expectations for those
external parties who work with the Group
or on our behalf.
Sustainability The Group is committed to being a
responsible and sustainable business
which thinks about the long-term and
creates positive environmental, social and
economic impacts. These aspects are
considered in the Group’s approach to
managing its operational activities and in
the homes and places it develops.
The Group has an integrated strategy for
the business; Our Vision. Sustainability is a
key element of the Group’s strategy with a
number of commitments directly relating
to sustainability. Information on Our Vision
can be found within the Strategic Report
and on the Group’s website.
The Directors have ultimate responsibility
for sustainability within the Group. The
Sustainability Leadership Team, which
meets monthly to set strategic direction
and review performance, consists of
the Chief Executive, the Board Director
Responsible for Sustainability and the
Group Sustainability Team. Dedicated
operational practitioners work throughout
the business to ensure sustainability is
incorporated into daily activities.
Greenhouse gas emissions
2017 2016
Scope 1 (tCO2e) 2,265 A 2,378 A
Scope 2 (tCO2e) 10,056 A 11,822 A
Scope 3 (tCO2e) 11,383 A 13,667 A
Total (tCO2e) 23,704 A 27,867 A
Emissions intensity
(tCO2e/person)
1.76 2.29
2017 ( A ) and 2016 ( A ) information has been separately
subject to limited assurance by PricewaterhouseCoopers
LLP. For further details of the assurance provided in 2017
and 2016, see the independent assurance reports found
at berkeleygroup.co.uk/sustainability/reports-and-case-
studies.
The Group has reported on greenhouse
gas emissions for which it is responsible, as
required under the Companies Act 2006
(Strategic Report and Directors’ Reports)
Regulations 2013. The emissions disclosed
are aligned to the Group’s financial
reporting year, are considered material
to its business and have the following
parameters:
Scope 1 – direct emissions relating to office,
sales and development site activities; and
work-related travel in company owned
vehicles;
Scope 2 – indirect emissions from
electricity and heat consumed for office,
sales and development site activities;
Scope 3 – other indirect emissions relating
to office, sales and development site
activities; work-related travel in leased and
employee owned vehicles; business air
travel; transmission and distribution losses
of purchased electricity and heat; and
upstream emissions.
Emissions include 50% of those resulting
from the Group’s joint ventures on the basis
of its equity share.
The intensity ratio has been calculated
using the total number of direct employees
across the Group and the number of
contractors working on our sites.
The UK Government Environmental
Reporting Guidelines 2013 and UK
Government GHG Conversion Factors
for Company Reporting have been used
to calculate and report the Group’s
greenhouse gas emissions.
2016 data has been revised based on
more accurate data now being available
for energy consumption within the period.
Further details on these changes, our
established reporting criteria and the
methodology adopted for the overall
calculations can be found at berkeleygroup.
co.uk/sustainability/reports-and-case-
studies.
The Directors confirm that reported
greenhouse gas emissions have been
prepared in accordance with the Group’s
established reporting criteria, are free
from material misstatement and have
been presented in a manner that provides
relevant, reliable, comparable and
understandable information.
Takeover directive – agreements Pursuant to the Companies Act 2006, the
Company is required to disclose whether
there are any significant agreements that
take effect, alter or terminate upon a
change of control.
Change of control provisions are included
as standard in many types of commercial
agreement, notably bank facility
agreements and joint venture shareholder
agreements, for the protection of both
parties. Such standard terms are included
in Berkeley’s bank facility agreement
BERKELEY ANNUAL REPORT 2017 GOVERNANCEBERKELEY ANNUAL REPORT 2017 GOVERNANCE
108 109
02
GO
VE
RN
AN
CE
03
FIN
AN
CIA
LS
01 S
TR
AT
EG
IC R
EP
OR
T

which contains provisions that give the
banks certain rights upon a change of
control of the Company. Similarly, in certain
circumstances, a change of control of
either National Grid or Berkeley may give
the other joint venture partner the ability to
sell its interest in the joint venture.
In addition, the Company’s share schemes
contain provisions which take effect
upon change of control. These do not
entitle the participants to a greater
interest in the shares of the Company
than that created by the initial grant of
the award. The Company does not have
any arrangements with any Director that
provide compensation for loss of office or
employment resulting from a takeover.
Independent Auditors and disclosure of information to AuditorsEach of the persons who is a Director at
the date of approval of this Annual Report
confirms that:
– So far as the Director is aware, there is
no relevant audit information of which
the Company’s auditors are unaware;
and
– The Director has taken all the steps that
he/she ought to have taken as a Director
in order to make himself/herself aware
of any relevant audit information and to
establish that the Company’s auditors
are aware of that information.
This confirmation is given and should
be interpreted in accordance with the
provisions of Section 418 of the Companies
Act 2006.
A resolution to re-appoint KPMG LLP as
auditors to the Company will be proposed
at the Annual General Meeting.
Annual general meetingThe Annual General Meeting of the
Company is to be held at the Woodlands
Park Hotel, Woodlands Lane, Stoke
D’Abernon, Cobham, Surrey KT11 3QB at
11.00am on 6 September 2017. The Notice
of Meeting, which is contained in a separate
letter from the Chairman accompanying
this report, includes a commentary on the
business to be transacted at the Annual
General Meeting.
Share capital structureThe Company is compliant with DGTR
7.2.6. and the information relating to the
Company’s share capital structure is
included in the Directors’ Report on page
108.
Statement of Directors’ responsibilities in respect of the Annual Report and the Financial StatementsThe Directors are responsible for preparing
the Annual Report, the Directors’
Remuneration Report and the financial
statements in accordance with applicable
law and regulations.
Company law requires the Directors
to prepare financial statements for
each financial year. Under that law the
Directors have prepared the Group
Financial Statements in accordance with
International Financial Reporting Standards
(IFRSs) as adopted by the European Union,
and have prepared the Parent Company
Financial Statements in accordance with
United Kingdom Accounting Standards
(United Kingdom Generally Accepted
Accounting Practice) and applicable law.
Under company law the Directors must not
approve the financial statements unless
they are satisfied that they give a true and
fair view of the state of affairs of the Group
and the Company and of the profit or loss
of the Group for that period.
In preparing these financial statements, the
Directors are required to:
– select suitable accounting policies and
then apply them consistently;
– make judgements and estimates that are
reasonable and prudent;
– state whether IFRS as adopted by
the European Union and applicable
UK accounting standards have been
followed, subject to any material
departures disclosed and explained
in the Group and Parent Company
Financial Statements respectively; and
– prepare financial statements on
the going concern basis unless it is
inappropriate to presume that the Group
will continue in business.
The Directors are responsible for keeping
adequate accounting records that
are sufficient to show and explain the
Company’s transactions and disclose
with reasonable accuracy at any time the
financial position of the Company and the
Group and to enable them to ensure that
the financial statements and the Directors’
Remuneration Report comply with the
Companies Act 2006 and, as regards
the Group financial statements, Article
4 of the IAS Regulation. They are also
responsible for safeguarding the assets of
the Company and the Group
and hence for taking reasonable steps for
the prevention and detection of fraud and
other irregularities.
The Directors are responsible for the
maintenance and integrity of the
Company’s website. Legislation in the
United Kingdom governing the preparation
and dissemination of financial statements
may differ from legislation in other
jurisdictions.
Directors responsibility statementEach of the Directors, whose names and
functions are listed on pages 78 to 81
confirm that, to the best of each person’s
knowledge:
a. the Group financial statements, which
have been prepared in accordance with
IFRS’s as adopted by the European Union,
give a true and fair view of the assets,
liabilities, financial position and profit of the
Group;
b. the Strategic Report, together with the
Directors’ report, includes a fair review
of the development and performance
of the business and the position of the
Group, together with a description of the
principal risks and uncertainties that it
faces, including those that would threaten
its business model, future performance,
solvency or liquidity; and
c. the Annual Report, taken as a whole,
is fair, balanced and understandable and
provides the information necessary for
shareholders to assess the Company’s
financial performance and position,
business model and strategy.
Going concernThe Group’s business activities together
with the factors likely to affect its future
development performance and position
are set out in the Strategic Report. The
financial position of the Group, its cash
flows, liquidity position and borrowing
facilities are all described in the Trading and
Financial Review on pages 72 to 75.
The Group has significant financial
resources and the Directors have assessed
the future funding requirements of the
Group, including the return of £2.2 billion
to shareholders by 2021, and compared
this to the level of committed loan facilities
and cash resources over the medium term.
In making this assessment consideration
has been given to the uncertainty inherent
in future financial forecasts and where
applicable reasonable sensitivities have
been applied to the key factors affecting
the financial performance of the Group.
DIRECTORS’ REPORTCONTINUED
The Directors have a reasonable
expectation that the Company has
adequate resources to continue its
operational existence for the foreseeable
future and for this reason they continue
to adopt the going concern basis of
accounting in preparing the annual
financial statements.
By order of the Board
G E M ParsonsCompany SecretaryThe Berkeley Group Holdings plc
Registered number: 5172586
21 June 2017
BERKELEY ANNUAL REPORT 2017 GOVERNANCEBERKELEY ANNUAL REPORT 2017 GOVERNANCE
110 111
02
GO
VE
RN
AN
CE
03
FIN
AN
CIA
LS
01 S
TR
AT
EG
IC R
EP
OR
T

03 FINANCIALS
Royal Arsenal Riverside, Woolwich
BERKELEY ANNUAL REPORT 2017 FINANCIALSBERKELEY ANNUAL REPORT 2017 FINANCIALS
112 113
02
GO
VVE
RN
AN
CE
03
FIN
AN
CIA
LS
01
ST
RA
TE
GIC
RE
PO
RT
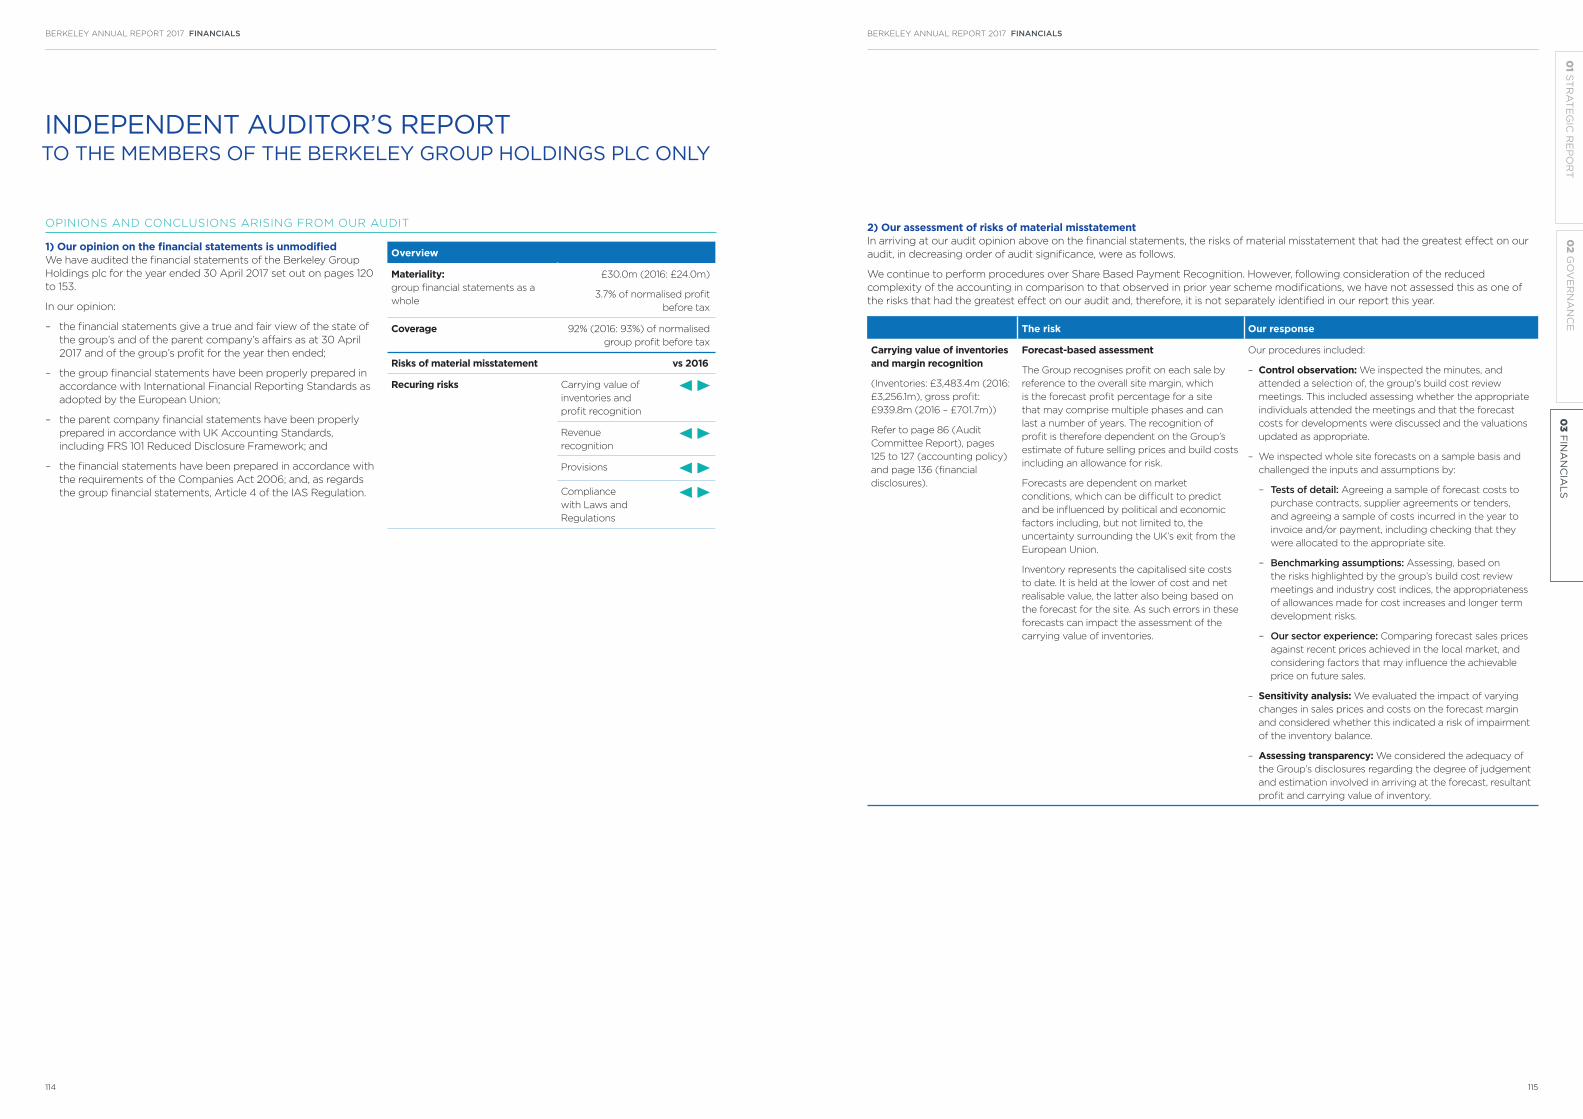
OPINIONS AND CONCLUSIONS ARISING FROM OUR AUDIT
1) Our opinion on the financial statements is unmodified We have audited the financial statements of the Berkeley Group
Holdings plc for the year ended 30 April 2017 set out on pages 120
to 153.
In our opinion:
– the financial statements give a true and fair view of the state of
the group’s and of the parent company’s affairs as at 30 April
2017 and of the group’s profit for the year then ended;
– the group financial statements have been properly prepared in
accordance with International Financial Reporting Standards as
adopted by the European Union;
– the parent company financial statements have been properly
prepared in accordance with UK Accounting Standards,
including FRS 101 Reduced Disclosure Framework; and
– the financial statements have been prepared in accordance with
the requirements of the Companies Act 2006; and, as regards
the group financial statements, Article 4 of the IAS Regulation.
INDEPENDENT AUDITOR’S REPORT TO THE MEMBERS OF THE BERKELEY GROUP HOLDINGS PLC ONLY
Overview
Materiality: group financial statements as a
whole
£30.0m (2016: £24.0m)
3.7% of normalised profit
before tax
Coverage 92% (2016: 93%) of normalised
group profit before tax
Risks of material misstatement vs 2016
Recuring risks Carrying value of
inventories and
profit recognition
Revenue
recognition
Provisions
Compliance
with Laws and
Regulations
2) Our assessment of risks of material misstatement In arriving at our audit opinion above on the financial statements, the risks of material misstatement that had the greatest effect on our
audit, in decreasing order of audit significance, were as follows.
We continue to perform procedures over Share Based Payment Recognition. However, following consideration of the reduced
complexity of the accounting in comparison to that observed in prior year scheme modifications, we have not assessed this as one of
the risks that had the greatest effect on our audit and, therefore, it is not separately identified in our report this year.
The risk Our response
Carrying value of inventories and margin recognition
(Inventories: £3,483.4m (2016:
£3,256.1m), gross profit:
£939.8m (2016 – £701.7m))
Refer to page 86 (Audit
Committee Report), pages
125 to 127 (accounting policy)
and page 136 (financial
disclosures).
Forecast-based assessment
The Group recognises profit on each sale by
reference to the overall site margin, which
is the forecast profit percentage for a site
that may comprise multiple phases and can
last a number of years. The recognition of
profit is therefore dependent on the Group’s
estimate of future selling prices and build costs
including an allowance for risk.
Forecasts are dependent on market
conditions, which can be difficult to predict
and be influenced by political and economic
factors including, but not limited to, the
uncertainty surrounding the UK’s exit from the
European Union.
Inventory represents the capitalised site costs
to date. It is held at the lower of cost and net
realisable value, the latter also being based on
the forecast for the site. As such errors in these
forecasts can impact the assessment of the
carrying value of inventories.
Our procedures included:
– Control observation: We inspected the minutes, and
attended a selection of, the group’s build cost review
meetings. This included assessing whether the appropriate
individuals attended the meetings and that the forecast
costs for developments were discussed and the valuations
updated as appropriate.
– We inspected whole site forecasts on a sample basis and
challenged the inputs and assumptions by:
– Tests of detail: Agreeing a sample of forecast costs to
purchase contracts, supplier agreements or tenders,
and agreeing a sample of costs incurred in the year to
invoice and/or payment, including checking that they
were allocated to the appropriate site.
– Benchmarking assumptions: Assessing, based on
the risks highlighted by the group’s build cost review
meetings and industry cost indices, the appropriateness
of allowances made for cost increases and longer term
development risks.
– Our sector experience: Comparing forecast sales prices
against recent prices achieved in the local market, and
considering factors that may influence the achievable
price on future sales.
– Sensitivity analysis: We evaluated the impact of varying
changes in sales prices and costs on the forecast margin
and considered whether this indicated a risk of impairment
of the inventory balance.
– Assessing transparency: We considered the adequacy of
the Group’s disclosures regarding the degree of judgement
and estimation involved in arriving at the forecast, resultant
profit and carrying value of inventory.
BERKELEY ANNUAL REPORT 2017 FINANCIALSBERKELEY ANNUAL REPORT 2017 FINANCIALS
114 115
02
GO
VE
RN
AN
CE
03
FIN
AN
CIA
LS
01 S
TR
AT
EG
IC R
EP
OR
T

2) Our assessment of risks of material misstatement continued
The risk Our response
Revenue recognition
£232.4m (2016: £132.7m)
Refer to page 86 (Audit
Committee Report), pages
125 to 127 (accounting policy)
and page 137 (financial
disclosures).
2017/2018 sales
It is the Group’s policy to recognise revenue on
residential property units when contracts are
exchanged and the building work is physically
complete.
The legal completion of the sale, being the
point at which the balance of the sale is paid
for and title transfers, remains dependent on
the receipt of final payment. The recognition of
revenue is generally before legal completion,
and as such is potentially more subjective than
recognising at this latter point.
The risk is that the unit is not physically
complete or that the buyer is unable to
complete the purchase, as should either of
these be the case the revenue should not be
recognised.
Our audit procedures included:
– Control observations: Testing controls over property sales
including:
– inspecting documentation evidencing internal
physical inspection and confirmation of build
complete status; and
– obtaining customer background checks including
checks of availability of funds.
– For a sample of sales recorded where the final payment
was not yet received, we performed the following:
– Site visits: physically visited sites to observe build
completion status;
– Control observation: inspected the internal sign-off
sheets to check whether sales had gone through the
Group’s approval process for those sites not visited;
– Tests of detail: we inspected post-year end
bank statements for payments from buyers.
Where significant amounts were still outstanding
we considered other information, such as
correspondence with the buyer, in evaluating the
recoverability of amounts and appropriateness of
related revenue recognition.
– Assessing transparency: We have also considered the
adequacy of the Group’s disclosures in respect of the
judgements taken in recognising revenue for residential
property units prior to legal completion
Provisions
£99.9m (2016: £88.5m)
Refer to page 86 (Audit
Committee Report), pages
125 to 127 (accounting policy)
and pages 137 to 138 (financial
disclosures).
Subjective estimate
The Group holds provisions in respect of
claims and construction related liabilities that
have arisen, or that prior claims experience
indicates may arise, in respect of remediation
of defects subsequent to the completion of
certain developments, as well as in relation
to other matters of litigation including legal
disputes.
The identification and valuation of provisions is
judgmental by its nature and there is a risk that
the estimate is incorrect and the provision is
materially misstated.
Our procedures included:
– Internal enquiry: We enquired of Group and divisional
directors, and inspected board minutes for claims
arising, and challenged whether provisions are required.
– Tests of detail: For all significant known issues and
claims, we inspected the calculation of the provision
held and considered third party evidence, where
available.
– Benchmarking assumptions: For claims that past
events indicated may arise, we evaluated settled issues
and considered any differences in the development
portfolio over time, such as increasing complexity
of construction, in assessing the calculation of the
provision.
– Enquiry of lawyers: In respect of open matters of
litigation, we held discussions with the Group’s internal
and external legal advisors, where applicable, and
reviewed relevant correspondence to assess the
provisions recorded.
– Assessing transparency: We assessed whether the
Group’s disclosures sufficiently present the potential
exposure of the Group.
CONTINUED
INDEPENDENT AUDITOR’S REPORT TO THE MEMBERS OF THE BERKELEY GROUP HOLDINGS PLC ONLY
The risk Our response
Compliance with Laws and Regulations
Refer to page 86 (Audit
Committee Report)
Potential exposure
The Group is subject to a number of laws and
regulations including, but not limited to, anti-
bribery, anti-money laundering, and sanctions
checking which are those most relevant to the
audit.
Failure to comply with applicable laws and
regulations could have a material financial and
reputational impact on the business.
Our procedures included:
Control assessment: We obtained an understanding
of the relevant legal and regulatory framework within
which the Group operates and assessed the design and
operation of its key controls over this framework. We
discussed the policies and procedures with the Group,
including internal legal counsel.
Governance reporting scrutiny: We reviewed Board
papers, and internal audit reports for any recorded
instances of potential non-compliance, and maintained a
high level of vigilance when carrying out our other audit
procedures for indications of non-compliance.
Enquiry with lawyers: We reviewed the Group’s
documentation and correspondence with respect to
relevant legal matters, including those relating to the on-
going dispute with the Group’s former Finance Director.
We had discussions with the Group’s internal and external
legal advisors in respect of these matters.
Assessing transparency: We assessed whether the
Group’s disclosures sufficiently present potential
exposures.
BERKELEY ANNUAL REPORT 2017 FINANCIALSBERKELEY ANNUAL REPORT 2017 FINANCIALS
116 117
02
GO
VE
RN
AN
CE
03
FIN
AN
CIA
LS
01 S
TR
AT
EG
IC R
EP
OR
T

3) Our application of materiality and an overview of the scope of our audit Materiality for the Group financial statements as a whole was
set at £30.0m (2016: £24.0m), determined with reference to a
benchmark of Group profit before taxation of £812.4m (2016:
normalised profit before taxation of £479.9m), of which it
represents 3.7% (2016: 5%).
We reported to the audit committee any corrected or uncorrected
identified misstatements exceeding £1.5m (2016: £1.1m), in addition
to other identified misstatements that warranted reporting on
qualitative grounds.
Of the group’s 18 (2016: 17) components, we subjected 11 (2016: 10)
to full scope audits for group purposes and 5 (2016: 6) to specified
risk-focused procedures, all performed by the group team. The
latter components were not individually financially significant
enough to require a full scope audit for group purposes but did
present specific individual risks that needed to be addressed.
The components within the scope of our work accounted for the
percentages illustrated opposite.
For the residual components, we performed analysis at an
aggregated Group level to re-examine our assessment that there
were no significant risks of material misstatement within these.
CONTINUED
INDEPENDENT AUDITOR’S REPORT TO THE MEMBERS OF THE BERKELEY GROUP HOLDINGS PLC ONLY
Profit before tax£812.4m (2016: £479.9m
normalised)
8%7%
9%12%
12%11%
92%91%
87%
93%88%
88%
8%
7%
9%
12%
(2016 88%)91%
(2016 93%)92%
(2016 88%)87%
12%
11%
Full scope for group audit purposes 2017
Specified risk-focused audit procedures 2017
Full scope for group audit purposes 2016
Specified risk-focused audit procedures 2016
Residual components
Profit before tax
Materiality
05
10
15
20
25
30
Group revenue Group profit before tax
Group total assets
Materiality £30.0m (2016: £24.0m)
£30.0m Whole financial
statements materiality (2016: £24.0m)
£24.7m Range of materiality at
11 components (£1.2m to £24.7m)
(2016: £1.3m to £13.9m)
£1.5m Misstatements
reported to the audit committee
(2016: £1.1m)
4. Our opinion on other matters prescribed by the Companies Act 2006 is unmodifiedIn our opinion:
– the part of the Directors’ Remuneration Report to be audited
has been properly prepared in accordance with the Companies
Act 2006; and
– the information given in the Strategic Report and the Directors’
Report for the financial year is consistent with the financial
statements.
Based solely on the work required to be undertaken in the course
of the audit of the financial statements and from reading the
Strategic Report and the Directors’ Report:
– we have not identified material misstatements in those reports;
and
– in our opinion, those reports have been prepared in accordance
with the Companies Act 2006.
5. We have nothing to report on the disclosures of principal risksBased on the knowledge we acquired during our audit, we have
nothing material to add or draw attention to in relation to:
– the directors’ statement of longer-term viability on page 60,
concerning the principal risks, their management, and, based on
that, the directors’ assessment and expectations of the group’s
continuing in operation over the 4 years to 30 April 2021; or
– the disclosures in note 1 of the financial statements concerning
the use of the going concern basis of accounting.
6. We have nothing to report in respect of the matters on which we are required to report by exceptionUnder ISAs (UK and Ireland) we are required to report to you if,
based on the knowledge we acquired during our audit, we have
identified other information in the annual report that contains a
material inconsistency with either that knowledge or the financial
statements, a material misstatement of fact, or that is otherwise
misleading.
In particular, we are required to report to you if:
– we have identified material inconsistencies between the
knowledge we acquired during our audit and the directors’
statement that they consider that the annual report and
financial statements taken as a whole is fair, balanced and
understandable and provides the information necessary for
shareholders to assess the group’s position and performance,
business model and strategy; or
– the Audit Committee Report does not appropriately address
matters communicated by us to the audit committee.
Under the Companies Act 2006 we are required to report to you if,
in our opinion:
– adequate accounting records have not been kept by the parent
company, or returns adequate for our audit have not been
received from branches not visited by us; or
– the parent company financial statements and the part of
the Directors’ Remuneration Report to be audited are not in
agreement with the accounting records and returns; or
– certain disclosures of directors’ remuneration specified by law
are not made; or
– we have not received all the information and explanations we
require for our audit.
Under the Listing Rules we are required to review:
– the directors’ statements, set out on pages 110 and 60, in
relation to going concern and longer-term viability; and
– the part of the Corporate Governance Statement on page 82
relating to the company’s compliance with the eleven provisions
of the 2014 UK Corporate Governance Code specified for our
review.
We have nothing to report in respect of the above responsibilities.
Scope and responsibilities As explained more fully in the Directors’ Responsibilities
Statement set out on page 110, the directors are responsible for
the preparation of the financial statements and for being satisfied
that they give a true and fair view. A description of the scope of an
audit of financial statements is provided on the Financial Reporting
Council’s website at www.frc.org.uk/auditscopeukprivate. This
report is made solely to the Company’s members as a body and is
subject to important explanations and disclaimers regarding our
responsibilities, published on our website at www.kpmg.com/uk/
auditscopeukco2014a, which are incorporated into this report as if
set out in full and should be read to provide an understanding of
the purpose of this report, the work we have undertaken and the
basis of our opinions.
Sean McCallion (Senior Statutory Auditor)for and on behalf of KPMG LLP, Statutory Auditor Chartered Accountants
15 Canada Square
London, E14 5GL
21 June 2017
BERKELEY ANNUAL REPORT 2017 FINANCIALSBERKELEY ANNUAL REPORT 2017 FINANCIALS
118 119
02
GO
VE
RN
AN
CE
03
FIN
AN
CIA
LS
01 S
TR
AT
EG
IC R
EP
OR
T
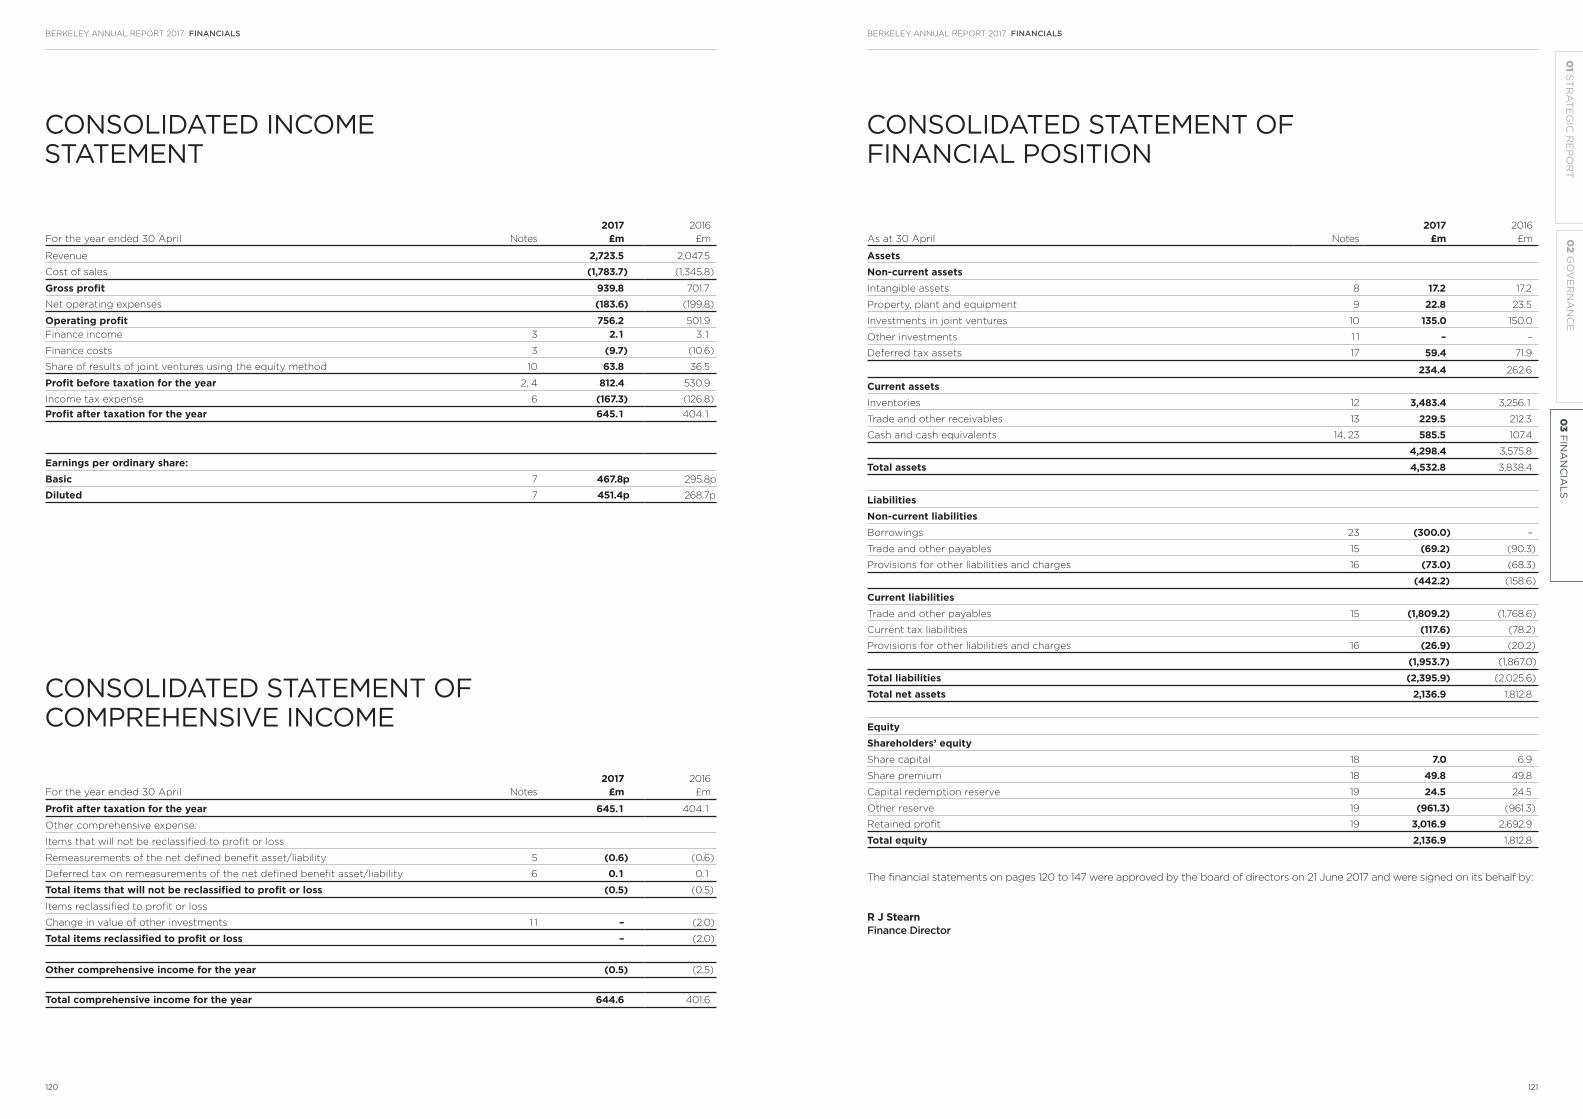
CONSOLIDATED INCOME STATEMENT
CONSOLIDATED STATEMENT OF COMPREHENSIVE INCOME
For the year ended 30 April Notes
2017 £m
2016
£m
Revenue 2,723.5 2,047.5
Cost of sales (1,783.7) (1,345.8)
Gross profit 939.8 701.7
Net operating expenses (183.6) (199.8)
Operating profit 756.2 501.9
Finance income 3 2.1 3.1
Finance costs 3 (9.7) (10.6)
Share of results of joint ventures using the equity method 10 63.8 36.5
Profit before taxation for the year 2, 4 812.4 530.9
Income tax expense 6 (167.3) (126.8)
Profit after taxation for the year 645.1 404.1
Earnings per ordinary share:Basic 7 467.8p 295.8p
Diluted 7 451.4p 268.7p
For the year ended 30 April Notes
2017 £m
2016
£m
Profit after taxation for the year 645.1 404.1
Other comprehensive expense:
Items that will not be reclassified to profit or loss
Remeasurements of the net defined benefit asset/liability 5 (0.6) (0.6)
Deferred tax on remeasurements of the net defined benefit asset/liability 6 0.1 0.1
Total items that will not be reclassified to profit or loss (0.5) (0.5)
Items reclassified to profit or loss
Change in value of other investments 1 1 – (2.0)
Total items reclassified to profit or loss – (2.0)
Other comprehensive income for the year (0.5) (2.5)
Total comprehensive income for the year 644.6 401.6
CONSOLIDATED STATEMENT OF FINANCIAL POSITION
As at 30 April Notes
2017 £m
2016
£m
AssetsNon-current assetsIntangible assets 8 17.2 17.2
Property, plant and equipment 9 22.8 23.5
Investments in joint ventures 10 135.0 150.0
Other investments 1 1 – –
Deferred tax assets 17 59.4 71.9
234.4 262.6
Current assetsInventories 12 3,483.4 3,256.1
Trade and other receivables 13 229.5 212.3
Cash and cash equivalents 14, 23 585.5 107.4
4,298.4 3,575.8
Total assets 4,532.8 3,838.4
LiabilitiesNon-current liabilitiesBorrowings 23 (300.0) –
Trade and other payables 15 (69.2) (90.3)
Provisions for other liabilities and charges 16 (73.0) (68.3)
(442.2) (158.6)
Current liabilitiesTrade and other payables 15 (1,809.2) (1,768.6)
Current tax liabilities (117.6) (78.2)
Provisions for other liabilities and charges 16 (26.9) (20.2)
(1,953.7) (1,867.0)
Total liabilities (2,395.9) (2,025.6)
Total net assets 2,136.9 1,812.8
Equity Shareholders’ equityShare capital 18 7.0 6.9
Share premium 18 49.8 49.8
Capital redemption reserve 19 24.5 24.5
Other reserve 19 (961.3) (961.3)
Retained profit 19 3,016.9 2,692.9
Total equity 2,136.9 1,812.8
The financial statements on pages 120 to 147 were approved by the board of directors on 21 June 2017 and were signed on its behalf by:
R J StearnFinance Director
BERKELEY ANNUAL REPORT 2017 FINANCIALSBERKELEY ANNUAL REPORT 2017 FINANCIALS
120 121
02
GO
VE
RN
AN
CE
03
FIN
AN
CIA
LS
01 S
TR
AT
EG
IC R
EP
OR
T
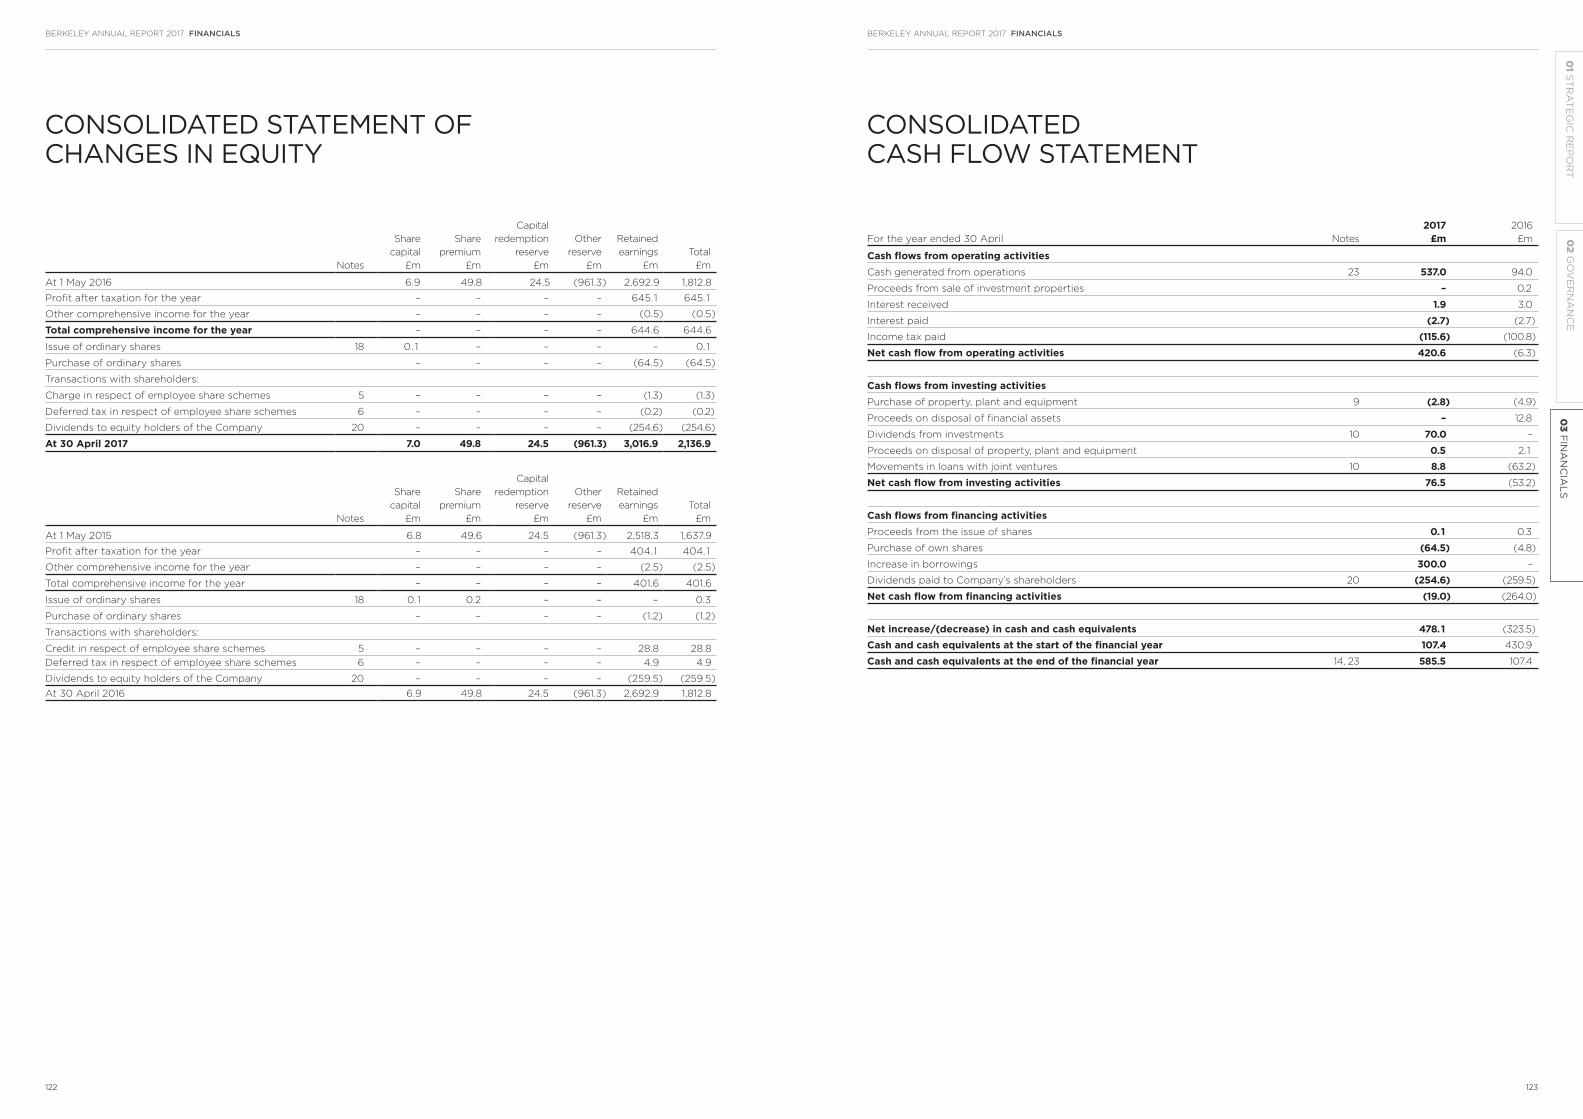
CONSOLIDATED STATEMENT OF CHANGES IN EQUITY
Notes
Share
capital
£m
Share
premium
£m
Capital
redemption
reserve
£m
Other
reserve
£m
Retained
earnings
£m
Total
£m
At 1 May 2016 6.9 49.8 24.5 (961.3) 2,692.9 1,812.8
Profit after taxation for the year – – – – 645.1 645.1
Other comprehensive income for the year – – – – (0.5) (0.5)
Total comprehensive income for the year – – – – 644.6 644.6
Issue of ordinary shares 18 0.1 – – – – 0.1
Purchase of ordinary shares – – – – (64.5) (64.5)
Transactions with shareholders:
Charge in respect of employee share schemes 5 – – – – (1.3) (1.3)
Deferred tax in respect of employee share schemes 6 – – – – (0.2) (0.2)
Dividends to equity holders of the Company 20 – – – – (254.6) (254.6)
At 30 April 2017 7.0 49.8 24.5 (961.3) 3,016.9 2,136.9
Notes
Share
capital
£m
Share
premium
£m
Capital
redemption
reserve
£m
Other
reserve
£m
Retained
earnings
£m
Total
£m
At 1 May 2015 6.8 49.6 24.5 (961.3) 2,518.3 1,637.9
Profit after taxation for the year – – – – 404.1 404.1
Other comprehensive income for the year – – – – (2.5) (2.5)
Total comprehensive income for the year – – – – 401.6 401.6
Issue of ordinary shares 18 0.1 0.2 – – – 0.3
Purchase of ordinary shares – – – – (1.2) (1.2)
Transactions with shareholders:
Credit in respect of employee share schemes 5 – – – – 28.8 28.8
Deferred tax in respect of employee share schemes 6 – – – – 4.9 4.9
Dividends to equity holders of the Company 20 – – – – (259.5) (259.5)
At 30 April 2016 6.9 49.8 24.5 (961.3) 2,692.9 1,812.8
CONSOLIDATED CASH FLOW STATEMENT
For the year ended 30 April Notes
2017 £m
2016
£m
Cash flows from operating activitiesCash generated from operations 23 537.0 94.0
Proceeds from sale of investment properties – 0.2
Interest received 1.9 3.0
Interest paid (2.7) (2.7)
Income tax paid (115.6) (100.8)
Net cash flow from operating activities 420.6 (6.3)
Cash flows from investing activitiesPurchase of property, plant and equipment 9 (2.8) (4.9)
Proceeds on disposal of financial assets – 12.8
Dividends from investments 10 70.0 –
Proceeds on disposal of property, plant and equipment 0.5 2.1
Movements in loans with joint ventures 10 8.8 (63.2)
Net cash flow from investing activities 76.5 (53.2)
Cash flows from financing activitiesProceeds from the issue of shares 0.1 0.3
Purchase of own shares (64.5) (4.8)
Increase in borrowings 300.0 –
Dividends paid to Company’s shareholders 20 (254.6) (259.5)
Net cash flow from financing activities (19.0) (264.0)
Net increase/(decrease) in cash and cash equivalents 478.1 (323.5)
Cash and cash equivalents at the start of the financial year 107.4 430.9
Cash and cash equivalents at the end of the financial year 14, 23 585.5 107.4
BERKELEY ANNUAL REPORT 2017 FINANCIALSBERKELEY ANNUAL REPORT 2017 FINANCIALS
122 123
02
GO
VE
RN
AN
CE
03
FIN
AN
CIA
LS
01 S
TR
AT
EG
IC R
EP
OR
T

1 ACCOUNTING POLICIES
General InformationThe Berkeley Group Holdings plc (the “Company”) is a public limited company incorporated and domiciled in the United Kingdom. The address of its
registered office is Berkeley House, 19 Portsmouth Road, Cobham, Surrey, KT11 1JG. The Company and its subsidiaries (together the “Group”) are engaged in
residential-led, mixed-use property development. Further information about the nature of the Group’s operations and its principal activities are set out in the
Directors’ Report on page 108.
Basis of preparationThese Consolidated Financial Statements have been prepared in accordance with European Union endorsed International Financial Reporting Standards
(“IFRSs”), IFRS-IC interpretations and with those parts of the Companies Act 2006 applicable to companies reporting under IFRS. The Consolidated
Financial Statements have been prepared under the historical cost convention and on the going concern basis. Historical cost is generally based on the fair
value of the consideration given in exchange for the assets.
The preparation of financial statements in conformity with IFRS requires the use of certain critical accounting estimates. It also requires management to
exercise its judgement in the process of applying the Group’s accounting policies. The areas involving a higher degree of judgement or complexity, or areas
where assumptions and estimates are significant to the Consolidated Financial Statements, are disclosed on page 127.
The following new standards, amendments to standards and interpretations (“Standards”) are applicable to the Group and are mandatory for the first time
for the financial year which began on 1 May 2016: Annual Improvements to IFRSs – 2012-2014 Cycle; IFRS 11 Joint Arrangements (Amendment); IAS 16
Property, Plant and Equipment (Amendment); IAS 27 Consolidated and Separate Financial Statements (Amendment); IFRS 10 Consolidated Financial
Statements (Amendment); IFRS 12 Disclosure of Interest in Other Entities (Amendment); IAS 28 Investments in Joint Ventures and Associates
(Amendment) and IAS 1 Presentation of Financial Statements (Amendment). These Standards have not had a material impact on the results of the
Company for the year ended 30 April 2017.
The following new standards, amendments to standards and interpretations (“New Standards”) have been issued, but are not yet effective for the financial
year ended 30 April 2017 and have not been adopted early: IAS 12 Income Taxes (Amendment); IAS 7 Cashflow Statements (Amendment); IFRS 9 Financial
Instruments; IFRS 2 Share Based Payments (Amendment); IFRS 15 Revenue from Contracts with Customers and IFRS 16 Leases.
The Group is currently considering the impact of IFRS 15 Revenue from Contracts with Customers which will be applicable in Berkeley’s financial year
ending 30 April 2019, as well as the other New Standards.
The Group has significant financial resources and the Directors have assessed the future funding requirements of the Group and compared this to the level
of committed loan facilities and cash resources over the medium term. In making this assessment, consideration has been given to the uncertainty inherent
in future financial forecasts and where applicable, reasonable sensitivities have been applied to the key factors affecting the financial performance of the
Group. The Directors have a reasonable expectation that the Group has adequate resources to continue its operational existence for the foreseeable future.
For this reason it continues to adopt the going concern basis of accounting in preparing its consolidated financial statements.
Basis of consolidation(a) Subsidiaries
The Consolidated Financial Statements comprise the financial statements of the Parent Company and all its subsidiary undertakings. The accounting date
for subsidiary undertakings is 30 April.
Subsidiaries are entities controlled by the Group. The Group controls an entity when it is exposed to, or has rights to, variable returns from its involvement
with the entity and has the ability to affect those returns through its power over the entity. In assessing control, the Group takes into consideration
substantive rights that are currently exercisable. The acquisition date is the date on which control is transferred to the acquirer. The financial statements of
subsidiaries are included in the consolidated financial statements from the date that control commences until the date that control ceases. Losses
applicable to the non-controlling interests in a subsidiary are allocated to the non-controlling interests even if doing so causes the non-controlling interests
to have a deficit balance.
Subsidiaries are fully consolidated from the date on which control is transferred to the Group. They are de-consolidated from the date that control ceases.
The purchase method of accounting is used to account for the acquisition of subsidiary undertakings by the Group.
Where necessary, adjustments are made to the financial statements of subsidiaries to bring the accounting policies used into line with those used by the
Group.
All intra-Group transactions, balances, income and expenses are eliminated on consolidation. Acquisition-related costs are expensed as incurred.
(b) Joint ventures
Joint ventures are accounted for using the equity method (equity accounted investees) and are initially recognised at cost. The Group’s investment includes
goodwill identified on acquisition, net of any accumulated impairment losses. The consolidated financial statements include the Group’s share of the total
comprehensive income and equity movements of equity accounted investees, from the date that joint control commences until the date that joint control
ceases. When the Group’s share of losses exceeds its interest in an equity accounted investee, the Group’s carrying amount is reduced to nil and recognition
of further losses is discontinued except to the extent that the Group has incurred legal or constructive obligations or made payments on behalf of an
investee.
Segmental reportingOperating segments are identified in a manner consistent with the internal reporting provided to the chief operating decision-maker. The Group determines
its reportable segments having regard to permitted aggregation criteria with the principal condition being that the operating segments should have similar
economic characteristics.
The Group is predominantly engaged in residential-led, mixed-use property development, comprising residential revenue, revenue from land sales and
commercial revenue.
For the purposes of determining its operating segments, the chief operating decision-maker has been identified as the Executive Committee of the Board.
NOTES TO THE CONSOLIDATED FINANCIAL STATEMENTS
This committee approves investment decisions, allocates the Group’s resources and reviews the internal reporting in order to assess performance.
The Group has determined that its operating segments are the management teams that report into the Executive Committee of the Board. These
management teams are all engaged in residential-led, mixed-use development in the United Kingdom and, having regard to the aggregation criteria in IFRS
8, the Group has one reportable operating segment.
In addition to its development activities, the Group previously held certain residential properties for investment purposes. These investment activities
represent a separate segment which was included within “Other activities” in the prior year, as they did not meet the size thresholds to be disclosed as a
separate reportable segment.
RevenueRevenue represents the amounts receivable from the sale of properties, investment properties and ground rent assets during the year and other income
directly associated with property development. Properties are treated as sold and profits are recognised when contracts are exchanged and the building
work is physically complete. Ground rent assets are treated as sold when contracts are exchanged, all material conditions precedent to the sale have been
satisfied and the risks and rewards of ownership have transferred to the purchaser. See Accounting estimates and judgements below for further disclosures
on revenue recognition.
Rental income is recognised in the income statement on a straight line basis over the life of the lease. Any lease incentives are recognised as an integral part
of the total rental income.
ExpenditureExpenditure recorded in inventory is expensed through cost of sales at the time of the related property sale. The amount of cost related to each property
includes its share of the overall site costs including, where relevant, its share of forecast costs to complete. Net operating expenditure is recognised in
respect of goods and services received when supplied in accordance with contractual terms. Provision is made when an obligation exists for a future liability
in respect of a past event and where the amount of the obligation can be reliably estimated. See Accounting estimates and judgements below for further
disclosures on cost recognition.
TaxationThe taxation expense represents the sum of the current tax payable and deferred tax. Current tax, including UK corporation tax, is provided at the amounts
expected to be paid (or received) using the tax rules and laws that have been enacted, or substantively enacted, by the reporting date.
Deferred taxation is the tax expected to be payable or recoverable on differences between the carrying amounts of assets and liabilities in the financial
statements and corresponding tax bases used in the computation of taxable profit, and is accounted for using the balance sheet liability method. Deferred
tax liabilities are generally recognised on all taxable temporary differences. Deferred tax assets are recognised to the extent that it is probable that taxable
profits will be available against which deductible temporary differences can be utilised. Such assets and liabilities are not recognised if the temporary
difference arises from goodwill, or from the initial recognition (except in a business combination) of other assets and liabilities in a transaction that affects
neither the taxable profit nor the accounting profit, or from differences relating to investments in subsidiaries to the extent that it is probable that they will
not reverse in the foreseeable future.
Deferred taxation is calculated at the tax rates that are expected to apply in the period when the liability is settled or the asset is realised based on tax laws
and rates that have been enacted or substantively enacted at the balance sheet date. The carrying value of deferred tax assets is reviewed at each balance
sheet date and reduced to the extent that it is no longer probable that sufficient taxable profits will be available against which taxable temporary
differences can be utilised. Deferred taxation is charged or credited to the income statement, except when it relates to items charged or credited directly to
reserves, in which case the deferred taxation is also dealt with in reserves.
Deferred taxation assets and liabilities are offset when there is a legally enforceable right to offset current tax assets against current tax liabilities and when
the deferred taxation assets and liabilities relate to income taxes levied by the same taxation authority on either the taxable entity or different taxable
entities where there is an intention to settle the balances on a net basis.
Intangible assetsWhere the cost of acquiring new and additional interests in subsidiaries, joint ventures and businesses exceeds the fair value of the net assets acquired, the
resulting premium on acquisition (goodwill) is capitalised and its subsequent measurement is based on annual impairment reviews and impairment reviews
performed where an impairment indicator exists, with any impairment losses recognised immediately in the income statement. Goodwill is allocated to
cash-generating units for the purpose of impairment testing. The allocation is made to those cash-generating units or groups of cash-generating units that
are expected to benefit from the business combination in which the goodwill arose.
Property, plant and equipmentProperty, plant and equipment is carried at historic purchase cost less accumulated depreciation. Cost includes the original purchase price of the asset and
the costs attributable to bringing the asset to its working condition for its intended use. Depreciation is provided to write off the cost of the assets on a
straight line basis to their residual value over their estimated useful lives at the following annual rates:
Freehold buildings 2% Fixtures and fittings 15%/20%
Motor vehicles 25% Computer equipment 33 1/3%
Freehold property disclosed in the notes to the consolidated financial statements consists of both freehold land and freehold buildings. No depreciation is
provided on freehold land. Computer equipment is included within fixtures and fittings. The assets’ residual values, carrying values and useful lives are
reviewed on an annual basis and adjusted if appropriate at each balance sheet date. Where an impairment is identified, the recoverable amount of the asset
is identified and an impairment loss, where appropriate, is recognised in the income statement.
Subsequent costs are included in the assets’ carrying amount or recognised as a separate asset, as appropriate, only when it is probable that future
economic benefits associated with the item will flow to the Group and the cost of the item can be measured reliably. The carrying amount of the replaced
part is derecognised. All other repairs and maintenance are charged to the income statement during the financial period in which they are incurred.
Gains and losses on disposals are determined by comparing the proceeds with the carrying amount and are recognised within net operating expenses in
the income statement.
BERKELEY ANNUAL REPORT 2017 FINANCIALSBERKELEY ANNUAL REPORT 2017 FINANCIALS
124 125
02
GO
VE
RN
AN
CE
03
FIN
AN
CIA
LS
01 S
TR
AT
EG
IC R
EP
OR
T

1 ACCOUNTING POLICIES CONTINUED
Investment propertiesInvestment properties, which are properties held to earn rental income, are recognised using the “cost model” and are carried in the statement of financial
position at historic cost less accumulated depreciation.
Depreciation is provided to write off the element of the cost of the assets that relates to buildings at 2% per annum on a straight line basis. No depreciation
is charged on the element of the cost of the assets that relates to land.
Sales of investment properties are recognised in revenue and cost of sales. These are considered to be similar in nature to the underlying property sales of
the Group.
InventoriesProperty in the course of development and completed units are valued at the lower of cost and net realisable value. Direct cost comprises the cost of land,
raw materials and development costs but excludes indirect overheads. Provision is made, where appropriate, to reduce the value of inventories and work in
progress to their net realisable value.
Land purchased for development, including land in the course of development, is initially recorded at cost. Where such land is purchased on deferred
settlement terms, and the cost differs from the amount that will subsequently be paid in settling the liability, this difference is charged as a finance cost in
the income statement over the period to settlement.
Trade and other receivablesTrade receivables are recognised initially at fair value and subsequently measured at amortised cost using the effective interest method, less provision for
impairment. A provision for impairment of trade receivables is established when there is objective evidence that the Group will not be able to collect all
amounts due according to the original terms of the receivables. The amount of the provision is the difference between the asset’s carrying amount and the
present value of estimated future cash flows, discounted at the original effective interest rate. The carrying amount of the asset is reduced through the use
of an allowance account, and the amount of the loss is recognised in the income statement within net operating expenses. When a trade receivable is
uncollectible, it is written off against the allowance account for trade receivables. Subsequent recoveries of amounts previously written off are credited
against net operating expense in the income statement.
Cash and cash equivalentsCash and cash equivalents comprises cash balances in hand and at the bank, including bank overdrafts repayable on demand which form part of the
Group’s cash management, for which offset arrangements across Group businesses have been applied where appropriate.
Share capitalOrdinary shares are classified as equity.
Incremental costs directly attributable to the issue of new shares or options are shown in equity as a deduction, net of tax, from the proceeds.
Where any Group company purchases the Company’s equity share capital (treasury shares), the consideration paid, including any directly attributable
incremental costs (net of income taxes) is deducted from equity attributable to the Company’s equity holders until the shares are cancelled, sold or
reissued. Where such shares are subsequently sold or reissued, any consideration received, net of any directly attributable incremental transaction costs and
the related income tax effects, is included in equity attributable to the Company’s equity holders.
BorrowingsBorrowings are recognised initially at fair value, net of transaction costs incurred. Any difference between the proceeds (net of transaction costs) and the
redemption value is recognised in the income statement over the period of the borrowings using the effective interest method.
Trade and other payablesTrade and other payables on normal terms are not interest bearing and are stated at their nominal value which is considered to be their fair value. Trade
payables on extended terms are recorded at their fair value at the date of acquisition of the asset to which they relate. The discount to nominal value is
amortised over the period of the credit term and charged to finance costs.
ProvisionsProvisions are recognised when the Group has a present legal or constructive obligation as a result of past events, and it is probable that an outflow of
resources will be required to settle that obligation, and the amount has been reliably estimated. See Accounting estimates and judgements below for further
disclosures on recognition of provisions.
DepositsNew property deposits and on account contract receipts are held within current trade and other payables.
Employee benefits(a) Pensions
The Group accounts for pensions under IAS 19 “Employee benefits”. The Group has both defined benefit and defined contribution plans. The defined
benefit plan was closed to future accrual with effect from 1 April 2007.
For the defined benefit scheme, the obligations are measured using the projected unit method. The calculation of the net obligation is performed by a
qualified actuary. The operating and financing costs of these plans are recognised separately in the income statement; service costs are set annually on the
basis of actuarial valuations of the scheme and financing costs are recognised in the period in which they arise. Actuarial gains and losses are recognised
immediately in the statement of comprehensive income. In accordance with IAS 19 the Group does not recognise on the statement of financial position any
surplus in the scheme.
Pension contributions under defined contribution schemes are charged to the income statement as they fall due.
(b) Share-based payments
Equity-settledWhere the Company operates equity-settled, share-based compensation plans, the fair value of the employee services received in exchange for the grant of
the options is recognised as an expense. The total amount to be expensed over the vesting period is determined by reference to the fair value of the options
granted, taking into account only service and non-market conditions.
NOTES TO THE CONSOLIDATED FINANCIAL STATEMENTSCONTINUED
At each balance sheet date, the Group revises its estimates of the number of options that are expected to vest. It recognises the impact of the revision to
original estimates, if any, in the income statement, with a corresponding adjustment to equity.
The proceeds received net of any directly attributable transaction costs are credited to share capital (nominal value) and share premium when the options
are exercised.
Cash-settledThe cost of cash settled transactions is recognised as an expense over the vesting period measured by reference to the fair value of the corresponding
liability which is recognised on the balance sheet. The liability is remeasured at fair value at each balance sheet date until settlement with changes in fair
value recognised in the income statement.
See Accounting estimates and judgements below for further disclosures on recognition of share based payments.
DividendsDividend distributions to shareholders are recognised as a liability in the period in which the dividends are appropriately authorised and approved for
payout and are no longer at the discretion of the Company. Unpaid dividends that do not meet these criteria are disclosed in the notes to the financial
statements.
Leasing agreementsPayments and receipts under operating lease agreements are charged or credited against profit on a straight line basis over the life of the lease.
Accounting estimates and judgementsManagement applies the Group’s accounting policies as described above when making critical accounting judgements, of which no individual judgement is
deemed to have a significant impact upon the financial statements, apart from those involving estimations, which are detailed below.
(a) Carrying value of land and work in progress and estimation of costs to complete
The Group holds inventories stated at the lower of cost and net realisable value. Such inventories include land, work in progress and completed units. As
residential development is largely speculative by nature, not all inventories are covered by forward sales contracts. Furthermore due to the nature of the
Group’s activity and, in particular the scale of its developments and the length of the development cycle, the Group has to allocate site-wide development
costs between units being built and/or completed in the current year and those for future years. It also has to forecast the costs to complete on such
developments.
In making such assessments and allocations, there is a degree of inherent estimation uncertainty. The Group has established internal controls designed to
effectively assess and centrally review inventory carrying values and ensure the appropriateness of the estimates made. These assessment and allocations
evolve over the life of the development in line with the risk profile, and accordingly the margin recognised reflects these evolving estimates. Specifically, the
Group has consistently applied an appropriately cautious approach to margin recognition in relation to the Group’s particularly complex, long-term
regeneration developments where certain whole-site costs are accelerated to the early stages of the development to reflect the greater uncertainty and the
evolution of risk over the life of such developments.
(b) Provisions
The Group makes assumptions to determine the timing and its best estimate of the quantum of its construction and other liabilities for which provisions are
held.
(c) Revenue recognition
Berkeley recognises revenue and profit on development property sales at the point of physical completion, where there are contracts exchanged and the
customer is able to proceed to legal completion. This differs from many other housebuilders who recognise revenue and profit on legal completion. The
Directors believe that Berkeley’s basis of accounting is appropriate for the circumstances of its business and that it is in accordance with International
Financial Reporting Standards as adopted by the EU, but note that its approach results in the recognition of both revenue and profits earlier than the legal
completion methodology. Reaching a view as to whether revenue should be recognised requires judgement. These judgements are complemented by
external certifications in assessing whether the properties sold meet the criteria for recognition in respect of physical completion. The customers’ ability to
complete the purchase is also considered at the point of revenue recognition.
Berkeley’s accounting policy removes absolute reliance on the date of legal completion, which Berkeley believes is a significant contributing factor to many
of the customer service issues within the wider industry, without materially altering the financial reporting risk. Adopting an alternative ‘legal completion’
basis for the current and preceeding year would not result in a material adjustment to the financial statements.
2 SEGMENTAL DISCLOSURE
For the purposes of determining its operating segments, the chief operating decision-maker has been identified as the Executive Committee of the Board.
This committee approves investment decisions, allocates the Group’s resources and reviews the internal reporting in order to assess performance.
The Group has determined that its operating segments are the management teams that report into the Executive Committee of the Board. These
management teams are all engaged in residential-led, mixed-use development in the United Kingdom and, having regard to the aggregation criteria in IFRS
8, the Group has one reportable operating segment.
The Group has historically held certain residential properties for investment purposes. These investment activities did represent a separate segment which
was included within other activities, however, the last property was disposed in the year ended April 2016 for revenue of £0.2 million and £nil operating
profit. Therefore, no separate financial information is disclosed.
For the purpose of monitoring segment performance and allocating resources between segments all assets are considered to be attributable to
residential-led mixed-use development.
BERKELEY ANNUAL REPORT 2017 FINANCIALSBERKELEY ANNUAL REPORT 2017 FINANCIALS
126 127
02
GO
VE
RN
AN
CE
03
FIN
AN
CIA
LS
01 S
TR
AT
EG
IC R
EP
OR
T

3 NET FINANCE COSTS
2017 £m
2016
£m
Finance income 2.1 3.1
Finance costs:
Interest payable on bank loans and non-utilisation fees (3.9) (2.8)
Amortisation of facility fees (1.5) (1.0)
Other finance costs (4.3) (6.8)
(9.7) (10.6)
Net finance costs (7.6) (7.5)
Finance income predominantly represents interest earned on cash deposits.
Other finance costs represent imputed interest on taxation and on land purchased on deferred settlement terms.
4 PROFIT BEFORE TAXATION
Profit before taxation is stated after charging/(crediting) the following amounts:
2017 £m
2016
£m
Staff costs (note 5) 270.3 287.3
Depreciation of property, plant and equipment (note 9) 2.8 3.1
Profit on sale of property, plant and equipment (0.2) (0.2)
Profit on sale of other investments – (2.8)
Operating lease costs 2.7 2.8
Fees paid and payable to the Company’s current auditor for the audit of the Parent Company
and consolidated financial statements 0.5 0.4
Fees paid and payable to the Company’s current auditor for other services:
– Audit of the Company’s subsidiaries 0.1 0.1
– Audit related assurance services 0.1 0.1
– Taxation advisory services 0.1 0.1
The value of inventories expensed and included in the cost of sales is £1,625.7 million (2016: £1,264.6 million).
In addition to the above services, the Group’s current auditor has been asked to act as auditor to The Berkeley Final Salary Plan. The appointment of
auditors to the Group’s pension scheme and the fees paid in respect of the audit are agreed by the trustees of the scheme, who act independently of the
management of the Group. The fees paid to the Group’s auditors for audit services to the pension scheme during the year were £8,500 (2016: £10,000).
Fees paid in the year to the Group’s current auditor for audit-related assurance services relate to the interim review.
5 DIRECTORS AND EMPLOYEES
Profit before taxation is stated after charging/(crediting) the following amounts:
2017 £m
2016
£m
Staff costs
Wages and salaries 194.4 177.4
Social security costs 20.1 43.9
Share-based payments – Equity settled 39.0 37.3
Share-based payments – Cash settled 10.6 22.5
Pension costs 6.2 6.2
270.3 287.3
The average monthly number of persons employed by the Group during the year was 2,443 (2016: 2,277).
NOTES TO THE CONSOLIDATED FINANCIAL STATEMENTSCONTINUED
Key Management compensationKey management comprises the Main Board, as the Directors are considered to have the authority and responsibility for planning, directing and controlling
the activities of the Group. Details of Directors’ emoluments as included in the Income Statement during the year are as follows:
2017 £m
2016
£m
Directors' remuneration 2.9 2.9
Amount charged under long term incentive schemes 41.0 33.9
Company contributions to the defined contribution pension schemes 0.1 0.1
44.0 36.9
The Directors’ Remuneration Report includes disclosure of the gains made by Directors on the exercise of share options during the year, which was £83.8
million (2016: £40.6 million) in aggregate.
During the 2014/2015 financial year, the Company dismissed its finance director, Mr Simpkin, who has issued four sets of legal proceedings in the
Employment Tribunal against the Company, the first set being issued on the 28 November 2014. Mr Simpkin claims detriment relating to alleged protected
disclosures and unfair dismissal. All such claims are strongly denied by the Company. The Employment Tribunal claims have been stayed following the initial
stay application of Mr Simpkin, which was rigorously opposed by the Company. On the 28 November 2015 Mr Simpkin served High Court proceedings on
the Company. There is a preliminary High Court hearing in July 2017 to consider the way in which the Remuneration Committee and the Board exercised
their respective discretions not to permit Mr Simpkin to retain awards otherwise lost under 2010 Bonus Plan and the 2009 and 2011 LTIP schemes. The
Company is robustly defending the proceedings with the assistance of external professional advisers. Appropriate provision has been made in the financial
statements for specific costs relating to this matter.
Equity-settled share based paymentsThe Group operates one (2016: two) equity-settled share-based payments schemes. The charge to the income statement in respect of share-based
payments in the year relating to grants of share options awarded under the 2011 Long-Term Incentive Plan was £40.6 million (2016: £38.1 million). The charge
to the income statement attributable to key management is £35.0 million (2016: £27.4 million). The charge to the reserves during the year in respect of
employee share schemes was £1.3 million (2016: £28.8 million credit), resulting from the non-cash IFRS2 charge for the year, as reflected in the cash flow
statement, adjusted for the reclassification of reserves on the decision to cash settle the part of the award relating to taxes which vested during the year.
There were 24,789 exercisable share options at the end of the year. During the year 5,740,438 options vested under the 2011 Long-Term Incentive Plan (2016:
2,765,000 under the 2009 Part B Long-Term Incentive Plan).
2011 Long-Term Incentive PlanThe Company announced in June 2011 as part of a strategic review of the business a long term plan to return approximately £1.7 billion to shareholders over
the next 10 years. In December 2015, a revision to the plan was proposed to return an additional £0.5 billion to shareholders.
A long term remuneration plan was proposed to support this strategy, the 2011 Long Term Incentive Plan (“2011 LTIP”), which was approved by shareholders
at the Annual General Meeting on 5 September 2011 followed by amendments at the Annual General Meeting on 16 February 2016 and the Extraordinary
General Meeting on 23 February 2017. The key features of the 2011 LTIP are:
– if the Company returns £2.3 billion to shareholders over a ten year period via a series of dividend payments and share buy backs (£16.34 per share) by
the milestone dates referred to below, participants will be entitled to exercise options and receive a number of ordinary shares in the capital of the
Company at the end of each period.
– the maximum number of shares capable of being earned by all participants was 19,616,503 shares, being 13% of the fully diluted share capital of the
Company at the date of approval of the plan. During the year, the introduction of individual participant caps was approved by shareholders. The
proportion of options vesting at each milestone date is detailed on page 88 of the Directors Remuneration report.
– the exercise price of options granted under the 2011 LTIP will be £16.34 per share less an amount equal to the value of all dividends, paid between the
date of approval of the 2011 LTIP and vesting dates, beginning in September 2016 with five annual vestings thereafter, provided the exercise price cannot
be less than zero.
The cumulative distributions required by the plan on or before the relative milestone dates are set out below:
Cumulative distributions
30 September 2016 £6.34 per share
30 September 2017 £8.34 per share
30 September 2018 £10.34 per share
30 September 2019 £12.34 per share
30 September 2020 £14.34 per share
30 September 2021 £16.34 per share
The fair value of the options granted during that year, determined using the current market pricing model, was £3.17 for options which then vest on
30 September 2021. The inputs into the current market option pricing model were:
Inputs
Grant date 5 September 2011
Vesting date 30 September 2021
Share price at grant date (p) 1,236
Exercise price (p) nil
Discount rate 6.3%
BERKELEY ANNUAL REPORT 2017 FINANCIALSBERKELEY ANNUAL REPORT 2017 FINANCIALS
128 129
02
GO
VE
RN
AN
CE
03
FIN
AN
CIA
LS
01 S
TR
AT
EG
IC R
EP
OR
T
5 DIRECTORS AND EMPLOYEES CONTINUED
As a result of the modification during the year, which introduced individual participant caps and extended the service period by a further two years, there
was a decrease in the fair value cost of the options although the number of options granted has not changed. This has been considered a non-beneficial
modification for accounting purposes, and accordingly there has been no impact on the accounting treatment applied.
The discount rate was determined by calculating the Group’s expected cost of capital over the vesting period at the grant date.
During the year 1,250,557 options lapsed on the departure of one employee (2016: none) and there were no new additional options granted during the year
(2016: 954,328). As at 30 April 2017 there were 10,187,780 options outstanding (2016: 17,045,831).
2009 Long-Term Incentive PlanPart BPart B of the 2009 Long-Term Incentive Plan vested on 15 April 2016. As a result, 2,487,121 shares were issuable to the participants, representing 2,765,000
options that vested under 2009 LTIP Part B, less 277,879 of shares equivalent to the exercise price on vesting of £3.06 per share. The Company elected to
enable participants to choose to allow the Company to settle the income tax and national insurance liabilities of the participants of the Scheme in lieu of
issuing shares to them for an equivalent value. This reduced the number of shares issuable by a further 1,125,026 to 1,362,095 which were issued on 15 April
2016. The share price at the date of vesting was £29.76. As at 30 April 2016 there were no options outstanding.
Cash-settled share based paymentsBonus Banking PlanUnder the Bonus Banking Plan, detailed in the Directors’ Remuneration Report on page 96, 50% of the balance on the plan account at the end of the
financial year is deferred in notional shares in the Company. The notional shares will be settled in cash each year excluding the year ending 30 April 2021
when the scheme will fully vest and at which point 50% of the remaining balance at that date will be settled in equity, and 50% in cash. Accordingly the plan
is accounted for as cash settled, with only the proportion expected to vest in shares at the end of the plan accounted for as equity settled. This amount is
not of significant quantum to warrant individual disclosure.
The liability has been accrued over the vesting period. The income statement is charged with an estimate for the vesting of notional shares awarded subject
to service and non-market performance conditions. The charge for 2017 was £6.0 million (2016: £6.5 million), all of which related to key management.
The total carrying amount of liabilities for the Bonus Banking Plan at the end of the year was £6.8 million (2016: £5.5 million), recorded in accruals and
deferred income.
During the year end 30 April 2016 the previous Bonus Banking Plan was settled resulting in a £1.2 million charge to reserves as a result of settling the final
balance through the issue of shares purchased from the market.
Senior Management share appreciation rightsCertain key members of senior management have been awarded cash bonuses deferred in notional shares in the Company. The notional shares have a
contractual life of five years after the bonus is allocated, and are settled in cash subject to continued employment by the Company and individual and
divisional performance criteria.
The liability is accrued over the vesting period. The income statement is charged with an estimate for the vesting of notional shares awarded subject to
service and non-market performance conditions. The charge for 2017 was £3.1 million (2016: £16.9 million).
The total carrying amount of liabilities for share appreciation rights at the end of the year was £30.3 million (2016: £43.6 million), recorded in accruals and
deferred income.
PensionsDuring the year, two principal pension schemes were in place for employees. The Berkeley Group plc Group Personal Pension Plan and the St George PLC
Group Personal Pension Plan are defined contribution schemes. The assets of these schemes were held in separate trustee administered funds.
The Berkeley Final Salary Plan is a defined benefit scheme which was closed to future accrual with effect from 1 April 2007.
Defined contribution planContributions amounting to £5.3 million (2016: £5.2 million) were paid into the defined contribution schemes during the year.
Defined benefit planAs at 30 April 2016, the Group operated one defined benefit pension scheme which was closed to future accrual with effect from 1 April 2007. This is a
separate trustee administered fund holding the pension plan assets to meet long term pension liabilities for some 335 past employees. The level of
retirement benefit is principally based on salary earned in the last three years of employment prior to leaving active service and is linked to changes in
inflation up to retirement.
The Berkeley Final Salary Plan is subject to an independent actuarial valuation at least every three years. The most recently finalised valuation was carried
out as at 1 May 2013 and finalised in December 2013. The method adopted in the 2013 valuation was the projected unit method, which assumed a return on
investment both prior to and after retirement of 4.00% per annum and pension increases of 3.25% per annum. The market value of the Berkeley Final Salary
Plan assets as at 1 May 2013 was £16.2 million and covered 97% of the scheme’s liabilities. Following the finalisation of the 2007 valuation, with effect from 1
July 2008, employer’s required regular contributions were reduced to zero. Following the finalisation of the 2013 valuation, the Group agreed with the
Trustees of the Scheme to make additional contributions to the Scheme of £0.2 million for the remainder of the year (1 December 2013 to 30 April 2015) to
address the Scheme’s deficit after which required contributions were reduced to zero. Notwithstanding this the Group made additional voluntary
contributions of £0.6 million during the year (2016: £0.6 million).
For the purposes of IAS 19, the 2013 valuation was updated for 30 April 2016.
The most significant risks to which the plan exposes the group are:
Inflation risk: A rise in inflation rates will lead to higher plan liabilities as a large proportion of the defined benefit obligation is indexed in line with price
inflation. This effect will be limited due to caps on inflationary increases to protect the plan against extreme inflation.
Interest rate risk: A decrease in corporate bond yields would result in an increase to plan liabilities although this effect would be partially offset by an
increase in the value of the plan’s bond holdings.
Mortality risk: An increase in life expectancy would result in an increase to plan liabilities as a significant proportion of the Pension Schemes’ obligations are
to provide benefits for the life of the member.
NOTES TO THE CONSOLIDATED FINANCIAL STATEMENTSCONTINUED
The amounts recognised in the statement of financial position are determined as follows:
2017 £m
2016
£m
Present value of defined benefit obligations (20.5) (15.9)
Fair value of plan assets 21.0 18.1
Net surplus 0.5 2.2
Effect of the asset ceiling (0.5) (2.2)
Net amount recognised on the statement of financial position – –
Movement in net defined benefit asset:
Defined Benefit Obligation Fair Value Plan Assets Net Defined Benefit Asset
2017£m
2016
£m
2017£m
2016
£m
2017£m
2016
£m
Balance at 1 May (15.9) (16.6) 18.1 18.1 2.2 1.5
Included in income statement
Net interest (0.6) (0.6) 0.6 0.6 – –
Included in other comprehensive income
Remeasurements:
Actuarial (loss)/gain arising from:
– demographic assumptions (0.6) – – – (0.6) –
– financial assumptions (3.7) 0.5 – – (3.7) 0.5
– experience adjustments (0.3) 0.3 – – (0.3) 0.3
Return on plan assets
(excluding interest income) – – 2.3 (0.7) 2.3 (0.7)
Other
Contributions by the employer – – 0.6 0.6 0.6 0.6
Benefits paid out 0.6 0.5 (0.6) (0.5) – –
Balance at 30 April (20.5) (15.9) 21.0 18.1 0.5 2.2
Cumulative actuarial gains and losses recognised in equity:
2017 £m
2016
£m
Cumulative amounts of losses recognised in the statement of comprehensive income at 1 May (6.1) (5.6)
Net actuarial losses recognised in the year (2.3) 0.2
Change in the effect of the asset ceiling 1.7 (0.7)
Cumulative amounts of losses recognised in the statement of comprehensive income at 30 April (6.7) (6.1)
The fair value of the assets were as follows:
30 April 2017Long-term
Value £m
30 April 2016
Long-term
Value
£m
UK Equities 0.9 0.8
Global Equities 4.3 3.1
Emerging Market Equities 1.5 1.4
Emerging Market Debt – 0.9
High Yield Bonds 1.9 0.9
Diversified Growth Fund 4.9 3.0
Property – 1.7
Government Bonds (over 15 years) 1.1 0.9
Government Bonds (5 to 15 years) 1.9 1.7
Index Linked Gilts (over 5 years) 2.4 1.9
Corporate Bonds 1.4 1.3
Cash 0.7 0.5
Fair value of plan assets 21.0 18.1
All equity securities and government bonds have quoted prices in active markets. All government bonds are issued by European governments and are
AAA- or AA- rated. All other plan assets are not quoted in an active market.
BERKELEY ANNUAL REPORT 2017 FINANCIALSBERKELEY ANNUAL REPORT 2017 FINANCIALS
130 131
02
GO
VE
RN
AN
CE
03
FIN
AN
CIA
LS
01 S
TR
AT
EG
IC R
EP
OR
T

5 DIRECTORS AND EMPLOYEES CONTINUED
History of asset values
30 April 2017
£m
30 April
2016
£m
30 April
2015
£m
30 April
2014
£m
30 April
2013
£m
Fair value of scheme assets 21.0 18.1 18.1 16.0 16.0
Present value of scheme liabilities (20.5) (15.9) (16.6) (14.8) (14.6)
Net surplus in the plan 0.5 2.2 1.5 1.2 1.4
Actuarial assumptionsThe major assumptions used by the actuary for the 30 April 2017 valuation were:
Valuation at:
30 April2017
30 April
2016
Discount rate 2.60% 3.50%
Inflation assumption (RPI) 3.60% 3.00%
Inflation assumption (CPI) 2.70% 2.10%
Rate of increase in pensions in payment post-97 (Pre-97 receive 3% p.a. increases) 3.60% 3.00%
The mortality assumptions are the standard S2PA CMI_2015_X [1.0%] (2016: S1PA CMI_2015_X [1.0%]) base table for males and females, both adjusted for
each individual’s year of birth to allow for future improvements in mortality rates. The life expectancy of male and female pensioners (now aged 65) retiring
at age 65 on the balance sheet date is 22.0 years and 24.0 years respectively (2016: 22.0 and 24.3). The life expectancy of male and female deferred
pensioners (now aged 45) retiring at age 65 after the balance sheet date is 23.3 years and 25.5 years respectively (2016: aged 40, 23.7 and 26.2).
Sensitivity analysisThe calculation of the defined benefit obligation is sensitive to the assumptions set out above. The following table summarises how the impact on the
defined benefit obligation at the end of the reporting period would have increased as a result of a change in the respective assumptions.
Change in
Assumption
Change in
defined
benefit
obligation
Discount rate -0.25% p.a +4.2%
Rate of inflation +0.25% p.a +3.0%
Rate of mortality +1 year +3.7%
These calculations provide an approximate guide to the sensitivity of results and may not be as accurate as a full valuation carried out on these
assumptions. In practice, changes in some of the assumptions are correlated and so each assumption change is unlikely to occur in isolation, as shown
above.
FundingThe Group expects to pay £0.6 million in contributions to its defined benefit plan in the year ending 30 April 2018, albeit it has no obligation to do so.
6 TAXATION
The tax charge for the year is as follows:
2017 £m
2016
£m
Current tax
UK corporation tax payable (162.4) (107.5)
Adjustments in respect of previous years 1.8 (14.9)
(160.6) (122.4)
Deferred tax
Deferred tax movements (1.7) (4.4)
Adjustments in respect of previous years (5.0) –
(6.7) (4.4)
(167.3) (126.8)
Tax on items recognised directly in other comprehensive income is as follows:
2017 £m
2016
£m
Deferred tax on remeasurements of the net defined benefit asset/liability (note 17) 0.1 0.1
NOTES TO THE CONSOLIDATED FINANCIAL STATEMENTSCONTINUED
Tax on items recognised directly in equity is as follows:
2017 £m
2016
£m
Deferred tax in respect of employee share schemes (note 17) (0.2) 4.9
Current tax in respect of employee share schemes (note 17) (5.6) (7.0)
(5.8) (2.1)
The tax charge assessed for the year differs from the standard rate of UK corporation tax of 19.92% (2016: 20%).
The differences are explained below:
2017 £m
2016
£m
Profit before tax 812.4 530.9
Tax on profit at standard UK corporation tax rate 161.8 106.2
Effects of:
Expenses not deductible for tax purposes 0.9 0.8
Tax effect of share of results of joint ventures 0.1 1.9
Adjustments in respect of previous years 3.2 14.9
Effect of change in rate in tax (note 17) 1.2 1.6
Other 0.1 1.4
Tax charge 167.3 126.8
Corporation tax is calculated at 19.92% of the estimated assessable profit for the year.
The Group manages its tax affairs in an open and transparent manner with the tax authorities and observes all applicable rules and regulations in the
countries in which it operates. Factors that may affect the Group’s tax charge in future periods include changes in tax legislation and the resolution of open
issues. The Group holds tax provisions in respect of the potential tax liability that may arise on the resolution of open tax issues, however, the amount
ultimately payable may be higher or lower than the amount accrued thus reducing or improving the overall profitability and cash flow of the Group in future
periods. The adjustments in respect of previous periods reflects the status of open issues on which significant progress has been made in the year.
Changes to UK corporation tax rates were substantially enacted as part of Finance Act (2015) (No2) on 18 November 2015 and the Finance Act 2016 on
15 September 2016. These changes include reductions to the main rate of corporation tax to 19% from 1 April 2017 and to 17% from 1 April 2020. Deferred
taxes at the balance sheet date have been measured using these enacted tax rates and are based on when these assets are expected to be realised.
7 EARNINGS PER ORDINARY SHARE
Basic earnings per ordinary share is calculated as profit for the financial year attributable to shareholders of the Group divided by the weighted average
number of shares in issue during the year.
2017 £m
2016
£m
Profit attributable to shareholders (£m) 645.1 404.1
Weighted average number of shares (m) 137.9 136.6
Basic earnings per ordinary share (p) 467.8 295.8
For diluted earnings per ordinary share, the weighted average number of shares in issue is adjusted to assume the conversion of all potentially dilutive
ordinary shares. At 30 April 2017, the Group had two (2016: two) categories of potentially dilutive ordinary shares: 11.4 million (2016: 16.8 million) share
options under the 2011 LTIP and 12,000 (2016: 5,000) share options under the Bonus Banking plan.
5.6 million share options vested on 30 September 2016 under the 2011 LTIP scheme and 1.8 million were issued to participants, with the Company settling
the option price and participants’ tax liability in respect of the balance, in lieu of issuing shares. In 2016, 2.8 million share options vested and £1.4 million were
issued, with the Company settling the option price and participants’ tax liability in respect of the balance, in lieu of issuing shares, on 15 April 2016 under Part
B of the 2009 LTIP scheme.
BERKELEY ANNUAL REPORT 2017 FINANCIALSBERKELEY ANNUAL REPORT 2017 FINANCIALS
132 133
02
GO
VE
RN
AN
CE
03
FIN
AN
CIA
LS
01 S
TR
AT
EG
IC R
EP
OR
T

7 EARNINGS PER ORDINARY SHARE CONTINUED
A calculation is performed to determine the number of shares that could have been acquired at fair value based on the aggregate of the exercise price of
each share option and the fair value of future services to be supplied to the Group which is the unamortised share-based payments charge. The difference
between the number of shares that could have been acquired at fair value and the total number of options is used in the diluted earnings per share
calculation.
2017 £m
2016
£m
Profit used to determine diluted EPS (£m) 645.1 404.1
Weighted average number of shares (m) 137.9 136.6
Adjustments for:
Share options – 2009 LTIP Part B (m) – 1.3
Share options – 2011 LTIP (m) 5.0 12.5
Bonus Banking plan shares – –
Shares used to determine diluted EPS (m) 142.9 150.4
Diluted earnings per ordinary share (p) 451.4p 268.7p
8 INTANGIBLE ASSETS
Goodwill
£m
Cost
At 1 May 2016 and 30 April 2017 17.2
Accumulated impairment
At 1 May 2016 and at 30 April 2017 –
Net book value
At 1 May 2016 and at 30 April 2017 17.2
Cost
At 1 May 2015 and 30 April 2016 17.2
Accumulated impairment
At 1 May 2015 and at 30 April 2016 –
Net book value
At 1 May 2015 and at 30 April 2016 17.2
The goodwill balance relates solely to the acquisition of the 50% of the ordinary share capital of St James Group Limited, completed on 7 November 2006
that was not already owned by the Group. The goodwill balance is tested annually for impairment. The recoverable amount has been determined on the
basis of the value in use of the business using the current five year pre-tax forecasts. Key assumptions are as follows:
(i) Cash flows beyond a five year period are not extrapolated;
(ii) A pre-tax discount rate of 8.36% (2016: 10.18%) based on the Group’s weighted average cost of capital.
The Directors have identified no reasonably possible change in a key assumption which would give rise to an impairment charge.
NOTES TO THE CONSOLIDATED FINANCIAL STATEMENTSCONTINUED
9 PROPERTY, PLANT AND EQUIPMENT AND INVESTMENT PROPERTY
Property, plant and equipment
Freehold
property
£m
Fixtures and
fittings
£m
Motor
vehicles
£m
Total
£m
Investment
properties
£m
Cost
At 1 May 2016 17.4 10.0 4.5 31.9 –
Additions – 2.6 0.2 2.8 –
Disposals – (0.5) (1.0) (1.5) –
At 30 April 2017 17.4 12.1 3.7 33.2 –
Accumulated Depreciation
At 1 May 2016 1.1 5.6 1.7 8.4 –
Charge for the year 0.1 2.2 0.5 2.8 –
Disposals – (0.3) (0.5) (0.8) –
At 30 April 2017 1.2 7.5 1.7 10.4 –
Net book value
At 1 May 2016 16.3 4.4 2.8 23.5 –
At 30 April 2017 16.2 4.6 2.0 22.8 –
Cost
At 1 May 2015 16.6 8.7 4.5 29.8 0.2
Additions 2.6 1.6 0.7 4.9 –
Disposals (1.8) (0.3) (0.7) (2.8) (0.2)
At 30 April 2016 17.4 10.0 4.5 31.9 –
Accumulated Depreciation
At 1 May 2015 1.0 3.8 1.5 6.3 –
Charge for the year 0.3 2.1 0.7 3.1 –
Disposals (0.2) (0.3) (0.5) (1.0) –
At 30 April 2016 1.1 5.6 1.7 8.4 –
Net book value
At 1 May 2015 15.6 4.9 3.0 23.5 0.2
At 30 April 2016 16.3 4.4 2.8 23.5 –
10 INVESTMENTS
2017 £m
2016
£m
Unlisted shares at cost 11.0 11.0
Loans 70.3 79.1
Share of post-acquisition reserves 53.8 60.3
Elimination of profit on transfer of inventory to joint ventures (0.1) (0.4)
135.0 150.0
Details of the joint ventures are provided in note 26.
The Group’s share of joint ventures’ net assets, income and expenses is made up as follows:
2017 £m
2016
£m
At 1 May 150.0 50.1
Profit after tax for the year 63.8 36.5
Dividends from investments (70.0) –
Net (decrease)/increase in loans to joint ventures (8.8) 63.4
At 30 April 135.0 150.0
Net (decrease)/increase in loans to joint ventures includes movements in unlisted shares at cost. The current year movement includes no non-cash
movement (2016: £0.2 million).
BERKELEY ANNUAL REPORT 2017 FINANCIALSBERKELEY ANNUAL REPORT 2017 FINANCIALS
134 135
02
GO
VE
RN
AN
CE
03
FIN
AN
CIA
LS
01 S
TR
AT
EG
IC R
EP
OR
T

10 INVESTMENTS CONTINUED
The Group’s share of joint ventures’ net assets, income and expenses is made up as follows:
2017St Edward
£mSt William
£mOther
£mTotal £m
Cash and cash equivalents 129.9 1.2 0.1 131.2Other current assets 126.7 107.3 – 234.0Current assets 256.6 108.5 0.1 365.2Current liabilities (131.2) (36.0) – (167.2)Non-current financial liabilities (51.0) (12.0) – (63.0) 74.4 60.5 0.1 135.0
Revenue 168.7 – – 168.7Costs (94.7) (7.7) – (102.4)Operating profit 74.0 (7.7) – 66.3Interest charges (1.4) (0.9) – (2.3)Profit before taxation 72.6 (8.6) – 64.0Tax charge (0.2) – – (0.2)Share of post tax profit of joint ventures 72.4 (8.6) – 63.8
2016
St Edward
£m
St William
£m
Other
£m
Total
£m
Cash and cash equivalents 127.8 1.6 0.1 129.5
Other current assets 159.6 85.2 – 244.8
Current assets 287.4 86.8 0.1 374.3
Current liabilities (145.9) (22.5) – (168.4)
Non-current liabilities (48.6) (7.3) – (55.9)
92.9 57.0 0.1 150.0
Revenue 161.6 – – 161.6
Costs (118.8) (6.1) – (124.9)
Operating profit 42.8 (6.1) – 36.7
Interest charges – – – –
Profit before taxation 42.8 (6.1) – 36.7
Tax charge (0.2) – – (0.2)
Share of post tax profit of joint ventures 42.6 (6.1) – 36.5
11 OTHER INVESTMENTS
Other investments comprise available-for-sale financial assets.
2017 £m
2016
£m
At 1 May – 12.0
Additions – –
Disposals – (10.0)
Fair value adjustment taken through other comprehensive income – (2.0)
At 30 April – –
Other investments comprise available for sale financial assets. These related to the Group’s investment in 100,000 units in a fund into which in 2014 the
Group sold 534 rental properties.
In the year to 30 April 2016, the Group completed the sale of this investment for proceeds of £12.8 million which realised a profit on disposal of £2.8 million
of which £2.0 million had been previously recognised in the Consolidated Statement of Comprehensive Income and has therefore been recycled through
the Consolidated Income Statement within operating expenses in the prior period.
Further disclosures relating to financial assets are set out in note 24.
12 INVENTORIES
2017 £m
2016
£m
Land not under development 414.1 384.1
Work in progress 2,981.7 2,853.9
Completed units 87.6 18.1
3,483.4 3,256.1
NOTES TO THE CONSOLIDATED FINANCIAL STATEMENTSCONTINUED
13 TRADE AND OTHER RECEIVABLES
2017 £m
2016
£m
Trade receivables 186.1 189.8
Other receivables 32.6 14.5
Prepayments and accrued income 10.8 8.0
229.5 212.3
Further disclosures relating to trade receivables are set out in note 24.
14 CASH AND CASH EQUIVALENTS
2017 £m
2016
£m
Cash and cash equivalents 585.5 107.4
15 TRADE AND OTHER PAYABLES
2017 £m
2016
£m
Current
Trade payables (647.0) (478.0)
Deposits and on account contract receipts (974.9) (1,105.8)
Loans from joint ventures (0.1) (0.1)
Other taxes and social security (49.8) (63.2)
Accruals and deferred income (137.4) (121.5)
(1,809.2) (1,768.6)
Non-current
Trade payables (69.2) (90.3)
Total trade and other payables (1,878.4) (1,858.9)
All amounts included above are unsecured. The total of £49.8 million (2016: £63.2 million) for other taxes and social security includes £14.6 million
(2016: £30.5 million) for Employer’s National Insurance provision in respect of share-based payments.
Further disclosures relating to current trade and non-current trade payables are set out in note 24.
16 PROVISIONS FOR OTHER LIABILITIES AND CHARGES
Post-
completion
development
provisions
Other
Provisions
Total
£m
At 1 May 2016 (73.4) (15.1) (88.5)
Utilised 1.3 1.6 2.9
Released 24.8 1.7 26.5
Charged to the income statement (32.8) (8.0) (40.8)
At 30 April 2017 (80.1) (19.8) (99.9)
Post-
completion
development
provisions
Other
Provisions
Total
£m
At 1 May 2015 (62.0) (13.1) (75.1)
Utilised 1.6 0.4 2.0
Released 18.5 0.3 18.8
Charged to the income statement (31.5) (2.7) (34.2)
At 30 April 2016 (73.4) (15.1) (88.5)
BERKELEY ANNUAL REPORT 2017 FINANCIALSBERKELEY ANNUAL REPORT 2017 FINANCIALS
136 137
02
GO
VE
RN
AN
CE
03
FIN
AN
CIA
LS
01 S
TR
AT
EG
IC R
EP
OR
T

16 PROVISIONS FOR OTHER LIABILITIES AND CHARGES CONTINUED
Analysis of total provisions:
2017£m
2016
£m
Non-current 73.0 68.3
Current 26.9 20.2
Total 99.9 88.5
Provisions for other liabilities and charges primarily relate to provisions for a best estimate of certain post-completion development obligations in respect of
the construction of the Group’s portfolio of complex mixed-use developments which are expected to be incurred in the ordinary course of business, based
on historic experience, but which are uncertain in terms of timing and quantum. The Group continually reviews its utilisation of this provision and, in
recognition that the risk of post-completion development obligations reduces over time, releases any unutilised provision to the income statement on a
systematic basis across the five years following post-completion.
In addition, the Group holds other provisions for onerous leases on properties leased by the Group and for the Group’s exposure to specific estate liabilities
on historic sites developed by the Group, as well as litigation. These are not individually significant in terms of quantum to warrant separate disclosure and
the timing of the utilisation of the other provisions is uncertain.
17 DEFERRED TAX
The movement on the deferred tax account is as follows:
Accelerated
capital
allowances
£m
Retirement
benefit
obligations
£m
Short-term
timing
differences
£m
Total
£m
At 1 May 2016 0.8 0.1 71.0 71.9
Adjustments in respect of previous years – – (5.0) (5.0)
Credited/(charged) to the income statement in year 0.1 (0.1) (0.6) (0.6)
Adjustment in respect of change of tax rate from 20% to 19%/17% (note 6) (0.1) – (1. 1) (1.2)
Charged to income statement in the year – (0.1) (1.7) (1.8)
Credited/(charged) to equity at 19%/17% – 0.1 (0.2) (0.1)
Realisation of deferred tax asset on vesting of employee share scheme – – (5.6) (5.6)
Credited/(charged) to equity in year (note 6) – 0. 1 (5.8) (5.7)
At 30 April 2017 0.8 0.1 58.5 59.4
Accelerated
capital
allowances
£m
Retirement
benefit
obligations
£m
Short-term
timing
differences
£m
Total
£m
At 1 May 2015 0.4 – 72.3 72.7
Transfer to corporation tax receivable – – 5.6 5.6
Credited/(charged) to the income statement in year 0.4 – (3.2) (2.8)
Adjustment in respect of change of tax rate from 20% to 19%/17% (note 6) – – (1.6) (1.6)
Credited/(charged) to income statement in the year 0.4 – (4.8) (4.4)
Credited to equity at 20% – 0.1 7.1 7.2
Adjustment in respect of change of tax rate from 20% to 19%/17% (note 6) – – (2.2) (2.2)
Realisation of deferred tax asset on vesting of employee share scheme – – (7.0) (7.0)
Credited/(charged) to equity in year (note 6) – 0.1 (2.1) (2.0)
At 30 April 2016 0.8 0.1 71.0 71.9
Deferred tax is calculated in full on temporary differences at the tax rates that are expected to apply for the period when the asset is realised and the
liability is settled using a tax rate of 19/17% as appropriate (2016: 19/17%). There is no unprovided deferred tax (2016: nil) at the balance sheet date.
All deferred tax assets are available for offset against deferred tax liabilities and hence the net deferred tax asset at 30 April 2017 is £59.4 million
(2016: £71.9 million).
Deferred tax assets of £44.7 million (2016: £42.8 million) are expected to be recovered after more than one year.
NOTES TO THE CONSOLIDATED FINANCIAL STATEMENTSCONTINUED
The deferred tax credited to equity during the year was as follows:
2017£m
2016
£m
Deferred tax on remeasurements of the net defined benefit asset/liability (note 6) 0.1 0.1
Deferred tax in respect of employee share schemes (note 6) (5.8) (2.1)
Movement in the year (5.7) (2.0)
Cumulative deferred tax credited to equity at 1 May 26.7 28.7
Cumulative deferred tax credited to equity at 30 April 21.0 26.7
18 SHARE CAPITAL AND SHARE PREMIUM
The movements on allotted and fully paid share capital for the Company in the year were as follows:
Ordinary shares Share Capital Share Premium
2017No ‘000
2016
No ‘000
2017£m
2016
£m
2017£m
2016
£m
Issued
At start of year 138,257 136,657 6.9 6.8 49.8 49.6
Issued in year 1,900 1,600 0.1 0.1 – 0.2
At end of year 140,157 138,257 7.0 6.9 49.8 49.8
Each ordinary share of 5p is a voting share in the capital of the Company, is entitled to participate in the profits of the Company and on a winding-up is
entitled to participate in the assets of the Company.
On 22 September 2016, 1.9 million ordinary shares (2016: 1.6 million) were allotted and issued to the Employee Benefit Trust.
During the 2017 financial period, shares were repurchased for a total consideration of £64.5 million, excluding transaction costs. These shares have not been
cancelled.
At 30 April 2017 there were 0.4 million shares held in trust (2016: 0.3 million) by the Employee Benefit Trust. The market value of these shares at 30 April
2017 was £13.8 million (2016: £10.1 million).
19 RESERVES
The movement in reserves is set out in the Consolidated Statement of Changes in Equity on page 112.
Other reserveThe other reserve of negative £961.3 million (2016: negative £961.3 million) arose from the application of merger accounting principles to the financial
statements on implementation of the capital reorganisation of the Group, incorporating a Scheme of Arrangement, in the year ended 30 April 2005.
Capital redemption reserveThe capital redemption reserve was created to maintain the capital of the Company following the redemption of the B Shares associated with the Scheme
of Arrangement created in 2004 which completed on 10 September 2009 with the re-designation of the unissued B shares as ordinary shares.
Retained earningsOn 22 September 2016 the Company issued and transferred to the Company’s Employee Benefit Trust 1.9 million ordinary shares. On 30 September 2016 1.8
million ordinary shares were transferred from the Employee Benefit Trust to Executive Directors to satisfy the exercise of options under the 2011 Long Term
Incentive Plan.
On 2 July 2015 the Company acquired and transferred to the Company’s Employee Benefit Trust 0.1 million of its own shares through purchases on the
London Stock Exchange at a total cost of £4.8 million. On 6 July 2015, 0.1 million ordinary shares were transferred from the Employee Benefit Trust to
Executive Directors to satisfy the exercise of options under the Bonus Banking Plan.
20 DIVIDENDS PER SHARE
The dividends paid in 2017 were a total of £254.6 million, being £117.7 million in March 2017 (85.24 pence per share) and £136.9 million in September 2016
(100 pence per share) (2016: £259.5 million being £136.6 million in January 2016 at 100 pence per share and £122.9 million in September 2015 at 90 pence
per share).
21 CONTINGENT LIABILITIES
Certain companies within the Group have given performance and other trade guarantees on behalf of other members of the Group in the ordinary course
of business. The Group has performance agreements in the ordinary course of business of £12.6 million which are guaranteed by third parties (2016: £15.1
million). The Group considers that the likelihood of an outflow of cash under these agreements is low and that no provision is required.
BERKELEY ANNUAL REPORT 2017 FINANCIALSBERKELEY ANNUAL REPORT 2017 FINANCIALS
138 139
02
GO
VE
RN
AN
CE
03
FIN
AN
CIA
LS
01 S
TR
AT
EG
IC R
EP
OR
T

22 OPERATING LEASES – MINIMUM LEASE PAYMENTS
The total future aggregate minimum lease payments of the Group under non-cancellable operating leases are set out below:
2017£m
2016
£m
Amounts due within:
Within one year 2.5 1.8
Between one and five years 5.2 2.5
After five years 1.6 1.8
9.3 6.1
23 NOTES TO THE CONSOLIDATED CASH FLOW STATEMENT
Reconciliation of profit after taxation for the year to cash generated from operations:
2017£m
2016
£m
Profit after taxation for the year 645.1 404.1
Adjustments for:
– Taxation 167.3 126.8
– Depreciation 2.8 3.1
– Loss/(Profit) on sale of property, plant and equipment 0.2 (0.2)
– Profit on sale of financial assets – (2.8)
– Finance income (2.1) (3.1)
– Finance costs 9.7 10.6
– Share of results of joint ventures after tax (63.8) (36.5)
– Non-cash charge in respect of share-based payments 10.9 28.8
Changes in working capital:
– Increase in inventories (227.3) (602.0)
– Increase in trade and other receivables (18.4) (67.8)
– Increase in trade and other payables 13.2 233.6
– Decrease in employee benefit obligations (0.6) (0.6)
Cash generated from operations 537.0 94.0
Reconciliation of net cash flow to net cash:
2017£m
2016
£m
Net increase/(decrease) in cash and cash equivalents, including bank overdraft 478.1 (323.5)
Net cash inflow from increase in borrowings (300.0) –
Movement in net cash/(debt) in the year 178.1 (323.5)
Opening net cash 107.4 430.9
Closing net cash 285.5 107.4
Net cash:
As at 30 April
2017£m
2016
£m
Cash and cash equivalents 585.5 107.4
Borrowings (300.0) –
Net cash 285.5 107.4
NOTES TO THE CONSOLIDATED FINANCIAL STATEMENTSCONTINUED
24 CAPITAL MANAGEMENT, FINANCIAL INSTRUMENTS AND FINANCIAL RISK MANAGEMENT
The Group finances its operations by a combination of shareholders’ funds, working capital and, where appropriate, borrowings. The Group’s objective when
managing capital is to maintain an appropriate capital structure in the business to allow management to focus on creating sustainable long-term value for
its shareholders, with flexibility to take advantage of opportunities as they arise in the short and medium term. This allows the Group to take advantage of
prevailing market conditions by investing in land opportunistically and work in progress at the right point in the cycle and deliver returns to shareholders
through dividends or share buy backs. In 2012 the Group put in place a long-term strategic plan to see £13 per share returned to shareholders over the
following 10 years. This plan was revised in December 2015 and the return to shareholders increased to £16.34 per share. This plan, reported in more detail in
the Strategic Report on page 9, ensures there is sufficient working capital retained in the business to continue investing selectively in new land opportunities
as they arise.
The Group monitors capital levels principally by monitoring net cash/debt levels, cash flow forecasts and return on average capital employed. The Group
considers capital employed to be net assets adjusted for net cash/debt. Capital employed at 30 April 2017 was £1,851.4 million (2016: £1,705.4 million). The
increase in capital employed in the year of £146.0 million reflects an increase in net assets during the year.
The Group’s financial instruments comprise financial assets being: trade receivables and cash and cash equivalents and financial liabilities being: bank loans,
trade payables, deposits and on account receipts, loans from joint ventures and accruals. Cash and cash equivalents and borrowings are the principal
financial instruments used to finance the business. The other financial instruments highlighted arise in the ordinary course of business.
As all of the operations carried out by the Group are in sterling there is no direct currency risk, and therefore the Group’s main financial risks are primarily:
– liquidity risk – the risk that suitable funding for the Group’s activities may not be available;
– market interest rate risk – the risk that Group financing activities are adversely affected by fluctuation in market interest rates; and
– credit risk – the risk that a counterparty will default on their contractual obligations resulting in a loss to the Group.
Financial instruments: financial assetsThe Group’s financial assets can be summarised as follows:
2017£m
2016
£m
Current
Trade receivables 186.1 189.8
Cash and cash equivalents 585.5 107.4
771.6 297.2
Non-current
Available-for-sale financial assets – –
– –
Total financial assets 771.6 297.2
Trade receivables and available-for-sale financial assets are non-interest bearing. Of the current trade receivables balance of £186.1 million (30 April 2016:
£189.8 million), £159.1 million (30 April 2016: £174.7 million) was not past due, with £18.3 million being 0–30 days past due (30 April 2016: £7.5 million, 0–30
days past due) and £8.7 million being over 30 days past due (30 April 2016: £7.6 million, over 30 days past due).
Cash and cash equivalents are short-term deposits held at either floating rates linked to LIBOR or fixed rates.
There are currently no group’s assets that are measured at fair value.
Financial instruments: financial liabilitiesThe Group’s financial liabilities can be summarised as follows:
2017£m
2016
£m
Current
Trade payables (647.0) (478.0)
Loans from joint ventures (0.1) (0.1)
Accruals and deferred income (137.4) (121.5)
(784.5) (599.6)
Non-current
Trade payables (69.2) (90.3)
Borrowings (300.0) –
(369.2) (90.3)
Total financial liabilities (1,153.7) (689.9)
All amounts included above are unsecured.
Current bank loans have term expiry dates within twelve months of the balance sheet date and are held at floating interest rates linked to LIBOR. Trade
payables and other current liabilities are non-interest bearing.
BERKELEY ANNUAL REPORT 2017 FINANCIALSBERKELEY ANNUAL REPORT 2017 FINANCIALS
140 141
02
GO
VE
RN
AN
CE
03
FIN
AN
CIA
LS
01 S
TR
AT
EG
IC R
EP
OR
T

24 CAPITAL MANAGEMENT, FINANCIAL INSTRUMENTS AND FINANCIAL RISK MANAGEMENT CONTINUED
The maturity profile of the Group’s non-current financial liabilities, all of which are held at amortised cost, is as follows:
2017£m
2016
£m
In more than one year but not more than two years (8.0) (36.6)
In more than two years but not more than five years (338.4) (32.2)
In more than five years (22.8) (21.5)
(369.2) (90.3)
The carrying amounts of the Group’s financial assets and financial liabilities approximate to fair value.
Current trade receivables and current trade and other payables approximate to their fair value as the transactions which give rise to these balances arise in
the normal course of trade and, where relevant, with industry standard payment terms and have a short period to maturity (less than one year).
Current trade receivables include £0.7 million (2016: £8.1 million) relating to amounts owed by St Edward Homes Limited in respect of the inventory sold by
the Group in 2009 (Note 25). This is held at its discounted present value (calculated by discounting expected future cash flows at prevailing interest rates
and yields as appropriate). The discount rate applied reflects the nominal, risk-free pre-tax rate at the balance sheet date, applied to the maturity profile. At
30 April 2017 a rate of 0.21% was applied (2016: 0.67%).
Non-current trade payables comprise long-term land payables, which are held at their discounted present value (calculated by discounting expected future
cash flows at prevailing interest rates and yields as appropriate) and borrowings. The discount rate applied reflects the nominal, risk-free pre-tax rate at the
balance sheet date, applied to the maturity profile of the individual land creditors within the total. At 30 April 2017 a rate of 0.21% was applied (2016: 0.67%).
Non-current loans approximate to fair value as they are held at variable market interest rates linked to LIBOR.
Liquidity riskThis is the risk that suitable funding for the Group’s activities may not be available. Group management addresses this risk through review of rolling cash
flow forecasts throughout the year to assess and monitor the current and forecast availability of funding, and to ensure sufficient headroom against facility
limits and compliance with banking covenants. The committed borrowing facilities are set out below.
The contractual undiscounted maturity profile of the Group’s financial liabilities, included at their carrying value in the preceding tables, is as follows:
2017£m
2016
£m
In less than one year (784.5) (599.6)
In more than one year but not more than two years (8.1) (36.9)
In more than two years but not more than five years (38.6) (33.0)
In more than five years (23.3) (23.3)
(854.5) (692.8)
Market interest rate riskThe Group’s cash and cash equivalents and bank loans expose the Group to cash flow interest rate risk.
The Group’s rolling cash flow forecasts incorporate appropriate interest assumptions, and management carefully assesses expected activity levels and
associated funding requirements in the prevailing and forecast interest rate environment to ensure that this risk is managed.
If interest rates on the Group’s cash/debt balances had been 50 basis points higher throughout the year ended 30 April 2017, profit after tax for the year
would have been £1,116,000 higher (2016: £1,143,000 higher). This calculation is based on the monthly closing net cash/debt balance throughout the year. A
50 basis point increase in interest rate represents management’s assessment of a reasonably possible change for the year ended 30 April 2017.
Credit riskThe Group’s exposure to credit risk encompasses the financial assets being: trade receivables and cash and cash equivalents.
Trade receivables are spread across a wide number of customers, with no significant concentration of credit risk in one area. There has been no impairment
of trade receivables during the year (2016: £nil), nor are there any material provisions held against trade receivables (2016: £nil), and £27.0 million trade
receivables are past their due date (2016: £15.1 million).
The credit risk on cash and cash equivalents is limited because counterparties are leading international banks with long-term A credit-ratings assigned by
international credit agencies.
Committed borrowing facilitiesThe Group has committed borrowing facilities as follows:
2017 2016
Available£m
Drawn£m
Undrawn£m
Termination£m
Available
£m
Drawn
£m
Undrawn
£m
Termination
£m
Term Loan 300 (300) – Nov-21 – – – –
Revolving credit facility 450 – 450 Nov-21 575 – 575 Mar-21
750 (300) 450 575 – 575
On 25 November 2016, Berkeley increased its committed corporate banking facilities to £750 million from £575 million. The facilities have a five year term,
with options over an additional two years.
NOTES TO THE CONSOLIDATED FINANCIAL STATEMENTSCONTINUED
At 30 April 2017 the total drawn down balance of the facility was £300 million (2016: £nil). In addition, at 30 April 2017 there were bank bonds in issue of
£5.0 million (2016: £nil).
The committed facilities are secured by debentures provided by certain Group holding companies over their assets. The facility agreement contains financial
covenants, which is normal for such agreements, with all of which the Group is in compliance.
25 RELATED PARTY TRANSACTIONS
The Group has entered into the following related party transactions:
Transactions with directorsIn terms of new transactions in the 2017 financial year:
i) During the year, Mr A W Pidgley paid £44,794 (2016: £378,593), Mr R C Perrins paid £32,289 (2016: £155,167) and Mr S Ellis paid £92,732 (2016: nil) to the
Group in connection with works carried out at their respective homes at commercial rates in accordance with the relevant policies of the Group. There
were no balances outstanding at the year end.
ii) During the year, shareholder approval was obtained at the Company’s Annual General Meeting held in September 2016 for the purchase by Mr K
Whiteman, a Director of the Company, of an apartment at Royal Arsenal Riverside for £650,000 on 12 April 2016 from Berkeley Homes plc, a wholly
owned subsidiary of the Company. Mr K Whiteman paid a contractual deposit on account of £97,500 during the year (2016: £65,000). At 30 April 2017,
the contractual deposits due had all been paid to the Group, there were no current balances outstanding and the property was still under construction.
iii) During the year, shareholder approval was obtained at the Company’s Extraordinary General Meeting held in February 2017 for the purchase by Mr S Ellis,
a Director of the Company, of an apartment at 190 Strand for £2,285,000 on 1 December 2016 from St Edward (Strand) Partnership, a Joint Venture of
the Company. Mr S Ellis paid a contractual deposit on account of £457,000 during the year. At 30 April 2017, the contractual deposits due had all been
paid to the Group, there were no current balances outstanding and the property was still under construction.
Director property purchases previously disclosed and not yet completed, which have all received shareholder approval, include:
– Mr G J Fry - purchase of an apartment at Brewery Wharf for £565,000 in 2015. Prior to Mr G J Fry retiring as a Director of the Company on 31 December
2016, he legally completed on the purchase of the apartment. All contractual amounts have been paid to the Group,
– Mr G J Fry – purchase of an apartment at Sovereign Court for £819,950 in 2014. As of the date of his retirement as a Director of the Company, Mr G J Fry
had paid all the contractual deposits due, there were no balances outstanding and the property was still under construction.
– Mr R C Perrins – purchase of an apartment at 190 Strand for £2,100,000 in 2013. During the financial year, Mr R C Perrins legally completed on the
purchase of the apartment. All contractual amounts have been paid to the Group
– Ms D Brightmore Armour – purchase of an apartment at 190 Strand for £2,985,000 in 2014 along with a storage room at the property for £101,200 in
2015. At 30 April 2017, the contractual deposits due had all been paid to the Group, there were no current balances outstanding and the property was still
under construction
On retiring as a Director of the Company, Mr G J Fry purchased his company owned vehicle for £29,100, which was the highest of four external quotes
secured by the Group for the vehicle. As of the date of his retirement, Mr G J Fry had paid all amounts owing to the Group at that time.
Berkeley Homes plc has an agreement with Langham Homes, a company controlled by Mr T K Pidgley who is the son of the Group’s Chairman, under which
Langham Homes will be paid a fee for a land introduction on an arm’s length basis. No payments have been made under this agreement in the financial year
(2016: nil) and there were no outstanding balances at the financial year end (2016: nil). Langham Homes has not introduced any new land to the Group in
the year. In the event that any further land purchases are agreed, further fees may be payable to Langham Homes in future periods.
Transactions with joint venturesDuring the financial period there were no transactions with joint ventures other than movements in loans and receipt of a dividend from St Edward of
£70,000,000 (2016: £40,000,000). The outstanding loan balances with joint ventures at 30 April 2017 total £80,700,000 (30 April 2016: £89,800,000).
In 2009 inventory was sold to St Edward Homes Limited for £17,411,000 being the share of the transaction attributable to the other venturer in the joint
venture. At 30 April 2017 an amount of £736,000 was outstanding and included within trade receivables (30 April 2016: £8,091,000).
BERKELEY ANNUAL REPORT 2017 FINANCIALSBERKELEY ANNUAL REPORT 2017 FINANCIALS
142 143
02
GO
VE
RN
AN
CE
03
FIN
AN
CIA
LS
01 S
TR
AT
EG
IC R
EP
OR
T

26 SUBSIDIARIES AND JOINT VENTURES
(a) Subsidiaries
In accordance with section 409 of the Companies Act 2006 a full list of subsidiaries, partnerships, associates, joint ventures and joint arrangements, the
country of incorporation, the registered address and the effective percentage of equity owned, as at 30 April 2017 is disclosed below. The Berkeley Group
plc is the only direct subsidiary of The Berkeley Group Holdings plc and is an intermediate holding company. All wholly-owned and partly owned
subsidiaries are included in the consolidation and all associated undertakings are included in the Group’s financial statements.
All of the companies listed below are incorporated in England and Wales have their registered office address at Berkeley House, 19 Portsmouth Road,
Cobham, Surrey, KT11 1JG and the principle activity is residential led mixed-use development and ancillary activities. All of the companies are wholly owned
by the Group and unless otherwise indicated, all of the companies have ordinary share capital.
NOTES TO THE CONSOLIDATED FINANCIAL STATEMENTSCONTINUED
Agents of Berkeley Commercial Developments Limited
Ely Business Park Limited
Agents of Berkeley (Central London) Limited
Chelsea Bridge Wharf (Block A) Limited
Chelsea Bridge Wharf (Block B) Limited
Chelsea Bridge Wharf (Block P) Limited
Chelsea Bridge Wharf (C North) Limited
Chelsea Bridge Wharf (C South) Limited
Agents of Berkeley Homes (Hampshire) Limited
Berkeley Homes (South Western House No.1)
Limited
Agents of Berkeley Homes plc
Berkeley (Canalside) Limited
Berkeley Build Limited
Berkeley Forty-Five Limited(i)
Berkeley Forty-Four plc
Berkeley Homes (Barn Elms) Limited
Berkeley Homes (Capital) PLC
Berkeley Homes (Central & West London) Plc
Berkeley Homes (Central London) Limited
Berkeley Homes (Chiltern) Limited
Berkeley Homes (East Anglia) Limited
Berkeley Homes (East Kent) Limited
Berkeley Homes (East Thames) Limited
Berkeley Homes (Eastern Counties) Limited
Berkeley Homes (Eastern) Limited
Berkeley Homes (Festival Waterfront
Company) Limited
Berkeley Homes (Hampshire) Limited
Berkeley Homes (Home Counties) plc
Berkeley Homes (North East London) Limited
Berkeley Homes (Oxford & Chiltern) Limited
Berkeley Homes (South East London) Limited
Berkeley Homes (South London) Limited
Berkeley Homes (Southern) Limited
Berkeley Homes (Surrey) Limited
Berkeley Homes (Thames Gateway) Limited
Berkeley Homes (Thames Valley) Limited
Berkeley Homes (Three Valleys) Limited
Berkeley Homes (Urban Developments)
Limited
Berkeley Homes (Urban Living) Limited
Berkeley Homes (Urban Renaissance) Limited
Berkeley Homes (West London) Limited
Berkeley Homes (Western) Limited
Berkeley Homes (West Thames) Limited
Berkeley Ninety-One Limited
Berkeley Partnership Homes Limited
Berkeley STE Limited
Berkeley SW Management Limited
Berkeley Urban Renaissance Limited
Clare Homes Limited
Lisa Estates (St Albans) Limited
PEL Investments Limited
St John Homes Limited
St Joseph Homes Limited
Stanmore Relocations Limited
Tabard Square (Building C) Limited
Agents of Berkeley Twenty Limited
Thirlstone Homes (Western) Limited
Thirlstone Homes Limited
Agents of St George Central London Limited
Castle Court Putney Wharf Limited
Imperial Wharf (Block C) Limited
Imperial Wharf (Block J) Limited
Imperial Wharf (Riverside Tower) Residential
Limited
Agents of St George plc
St George Central London Limited
St George City Limited
St George Kings Cross Limited
St George North London Limited
St George South and Central London Limited
St George South London Limited
St George West London Limited
Agents of St George South London Limited
Battersea Reach Estate Company Limited
Kensington Westside No 2 Limited
Putney Wharf Estate Limited
Riverside West (Block C) Commercial Limited
Riverside West (Block C) Residential Limited
Riverside West (Block D) Commercial Limited
Riverside West (Block D) Residential Limited
Riverside West Car Park Limited
St George Wharf (Block B) Limited
St George Wharf (Block C) Limited
St George Wharf (Block D) Commercial
Limited
St George Wharf Car Park Limited
Agents of St John Homes Limited
Berkeley Sixty-Six Limited
Non-Agency Companies(v)
Ancestral Homes Limited
Berkeley (Inner City Partnerships) Limited
Berkeley (SQP) Limited
Berkeley (Virginia Water) Limited(i)
Berkeley Affordable Homes Limited
Berkeley Asset MSA Limited
Berkeley College Homes Limited
Berkeley Commercial Developments Limited
Berkeley Commercial Investments Limited
Berkeley Commercial Limited
Berkeley Community Villages Limited
Berkeley Construction Limited
Berkeley Developments Limited(i)
Berkeley Eighteen Limited
Berkeley Eighty Limited
Berkeley Eighty-One Limited
Berkeley Eighty-Three Limited
Berkeley Eighty-Two Limited
Berkeley Enterprises Limited
Berkeley Festival Development Limited
Berkeley Festival Hotels Limited
Berkeley Festival Investments Limited
Berkeley Festival Limited
Berkeley Fifty Limited
Berkeley Fifty-Eight Limited
Berkeley Fifty-Five Limited
Berkeley Fifty-Four Limited
Berkeley Fifty-Nine Limited
Berkeley Fifty-One Limited
Berkeley Fifty-Seven Limited
Berkeley Fifty-Three Limited
Berkeley Fifty-Two Limited
Berkeley First Limited
Berkeley Five Limited
Berkeley Forty Limited
Berkeley Forty-Eight Limited
Berkeley Forty-Nine Limited
Berkeley Forty-Seven Limited
Berkeley Forty-Six Limited
Berkeley Forty-Three Limited
Berkeley Forty-Two Limited
Berkeley Fourteen Limited
Berkeley Group Pension Trustees Limited
Berkeley Group Services Limited
Berkeley Group SIP Trustee Limited
Berkeley Guarantee One Limited
Berkeley Homes (Carmelite) Limited
Berkeley Homes (Chertsey) Limited
Berkeley Homes (City & East London) Limited
Berkeley Homes (City) Limited
Berkeley Homes (Dorset) Limited
Berkeley Homes (East London) Limited
Berkeley Homes (Essex) Limited
Berkeley Homes (Fleet) Limited(i)
Berkeley Homes (Greater London) Limited
Berkeley Homes (Hertfordshire &
Cambridgeshire) Limited
Berkeley Homes (Holdings) Limited (in
liquidation)
Berkeley Homes (Kent) Limited
Berkeley Homes (North Western) Limited(i)
Berkeley Homes (PCL) Limited
Berkeley Homes (South) Limited
Berkeley Homes (Stanmore) Limited
Berkeley Homes Group Limited
Berkeley Homes plc(iii)
Berkeley London Residential Limited
Berkeley Manhattan Limited
Berkeley Ninety-Eight Limited
Berkeley Ninety-Five Limited
Berkeley Ninety-Four Limited
Berkeley Ninety-Nine Limited
Berkeley Ninety-Seven Limited
Berkeley Ninety-Six Limited
Berkeley Number Four Limited
Berkeley Number Seven Limited
Berkeley Number Six Limited
Berkeley One Hundred and Eight Limited
Berkeley One Hundred and Eighteen Limited
Berkeley One Hundred and Eighty-Eight
Limited
Berkeley One Hundred and Eighty-Five
Limited
Berkeley One Hundred and Eighty Limited
Berkeley One Hundred and Eighty-Nine
Limited
Berkeley One Hundred and Eighty-One
Limited
Berkeley One Hundred and Eighty-Seven
Limited
Berkeley One Hundred and Eighty-Two
Limited
Berkeley One Hundred and Fifteen Limited
Berkeley One Hundred and Fifty-Eight Limited
Berkeley One Hundred and Fifty-Five Limited
Berkeley One Hundred and Fifty-Four Limited
Berkeley One Hundred and Fifty Limited
Berkeley One Hundred and Fifty-Nine Limited
Berkeley One Hundred and Fifty-One Limited
Berkeley One Hundred and Fifty-Seven
Limited
Berkeley One Hundred and Fifty-Six Limited
Berkeley One Hundred and Fifty-Three Limited
Berkeley One Hundred and Fifty-Two Limited
Berkeley One Hundred and Five Limited
Berkeley One Hundred and Forty-Eight
Limited
Berkeley One Hundred and Forty-Five Limited
Berkeley One Hundred and Forty-Four Limited
Berkeley One Hundred and Forty Limited
Berkeley One Hundred and Forty-Nine Limited
Berkeley One Hundred and Forty-One Limited
Berkeley One Hundred and Forty-Seven
Limited
Berkeley One Hundred and Forty-Six Limited
Berkeley One Hundred and Forty-Three
Limited
Berkeley One Hundred and Four Limited
Berkeley One Hundred and Nine Limited
Berkeley One Hundred and Ninety-Eight
Limited
Berkeley One Hundred and Ninety-Five
Limited
Berkeley One Hundred and Ninety-Four
Limited
Berkeley One Hundred and Ninety Limited
Berkeley One Hundred and Ninety-Nine
Limited
Berkeley One Hundred and Ninety-One
Limited
Berkeley One Hundred and Ninety-Seven
Limited
Berkeley One Hundred and Ninety-Six Limited
Berkeley One Hundred and Ninety-Three
Limited
Berkeley One Hundred and Ninety-Two
Limited
Berkeley One Hundred and One Limited
Berkeley One Hundred and Seven Limited
Berkeley One Hundred and Seventeen Limited
Berkeley One Hundred and Seventy-Eight
Limited
Berkeley One Hundred and Seventy-Five
Limited
Berkeley One Hundred and Seventy-Four
Limited
Berkeley One Hundred and Seventy Limited
Berkeley One Hundred and Seventy-Nine
Limited
Berkeley One Hundred and Seventy-One
Limited
Berkeley One Hundred and Seventy-Seven
Limited
Berkeley One Hundred and Seventy-Six
Limited
Berkeley One Hundred and Seventy-Three
Limited
Berkeley One Hundred and Seventy-Two
Limited
Berkeley One Hundred and Six Limited
Berkeley One Hundred and Sixteen Limited
Berkeley One Hundred and Sixty-Five Limited
Berkeley One Hundred and Sixty-Four Limited
Berkeley One Hundred and Sixty-One Limited
Berkeley One Hundred and Sixty-Six Limited
Berkeley One Hundred and Sixty-Three
Limited
Berkeley One Hundred and Thirteen Limited
Berkeley One Hundred and Thirty-Eight
Limited
Berkeley One Hundred and Thirty-Five Limited
Berkeley One Hundred and Thirty-Four
Limited
Berkeley One Hundred and Thirty Limited
Berkeley One Hundred and Thirty-Nine
Limited
Berkeley One Hundred and Thirty-One Limited
Berkeley One Hundred and Thirty-Seven
Limited
Berkeley One Hundred and Thirty-Six Limited
Berkeley One Hundred and Thirty-Three
Limited
Berkeley One Hundred and Thirty-Two Limited
Berkeley One Hundred and Three Limited
Berkeley One Hundred and Twenty-Eight
Limited
Berkeley One Hundred and Twenty-Five
Limited
Berkeley One Hundred and Twenty-Four
Limited
Berkeley One Hundred and Twenty Limited
Berkeley One Hundred and Twenty-Nine
Limited
Berkeley One Hundred and Twenty-One
Limited
Berkeley One Hundred and Twenty-Seven
Limited
Berkeley One Hundred and Twenty-Six Limited
Berkeley One Hundred and Twenty-Three
Limited
Berkeley One Hundred and Twenty-Two
Limited
Berkeley One Hundred and Two Limited
Berkeley Portsmouth Harbour Limited
Berkeley Portsmouth Waterfront Limited
Berkeley Properties Limited(i)
Berkeley Residential Limited(i)
Berkeley Ryewood Limited
Berkeley Seven Limited
BERKELEY ANNUAL REPORT 2017 FINANCIALSBERKELEY ANNUAL REPORT 2017 FINANCIALS
144 145
02
GO
VE
RN
AN
CE
03
FIN
AN
CIA
LS
01 S
TR
AT
EG
IC R
EP
OR
T

26 SUBSIDIARIES AND JOINT VENTURES CONTINUED
NOTES TO THE CONSOLIDATED FINANCIAL STATEMENTSCONTINUED
Berkeley Seventy Limited
Berkeley Seventy-Four Limited
Berkeley Seventy-Nine Limited
Berkeley Seventy-One PLC(ii)
Berkeley Seventy-Seven Limited
Berkeley Seventy-Six Limited
Berkeley Seventy-Three Limited
Berkeley Seventy-Two Limited
Berkeley Sixty Limited
Berkeley Sixty-Eight Limited
Berkeley Sixty-Five Limited
Berkeley Sixty Four Limited
Berkeley Sixty-Nine Limited
Berkeley Sixty-One Limited
Berkeley Sixty-Six Limited
Berkeley Special Projects Limited
Berkeley Strategic Land Limited(ii)
Berkeley Sustainable Communities Limited
Berkeley Thirty-Eight Limited
Berkeley Thirty-Nine Limited
Berkeley Thirty-Three Limited
Berkeley Three Limited
Berkeley Twenty Limited
Berkeley Twenty-Eight Limited
Berkeley Twenty-Four Limited
Berkeley Twenty-Nine Limited
Berkeley Twenty-Seven Limited
Berkeley Twenty-Three Limited
Berkeley Twenty-Two Limited
Berkeley Two Hundred and Eight Limited
Berkeley Two Hundred and Eighteen Limited
Berkeley Two Hundred and Eleven Limited
Berkeley Two Hundred and Fifteen Limited
Berkeley Two Hundred and Five Limited
Berkeley Two Hundred and Fourteen Limited
Berkeley Two Hundred and Nine Limited
Berkeley Two Hundred and Nineteen Limited
Berkeley Two Hundred and One Limited(i)
Berkeley Two Hundred and Seven Limited
Berkeley Two Hundred and Seventeen Limited
Berkeley Two Hundred and Six Limited
Berkeley Two Hundred and Sixteen Limited
Berkeley Two Hundred and Ten Limited
Berkeley Two Hundred and Thirteen Limited
Berkeley Two Hundred and Three Limited
Berkeley Two Hundred and Twelve Limited
Berkeley Two Hundred and Twenty Limited
Berkeley Two Hundred and Twenty-Four
Limited
Berkeley Two Hundred and Twenty-One
Limited
Berkeley Two Hundred and Twenty-Three
Limited
Berkeley Two Hundred and Twenty-Two
Limited
Berkeley Two Hundred and Two Limited
Berkeley Two Hundred Limited
Berkeley Ventures Limited
BH (City Forum) Limited
Boardcable Limited
Bromyard House (Car Park) Limited
Bromyard House (Freehold) Limited
Bromyard House (North) Limited
Bromyard House Limited
BWW Management Limited
Charco 143 Limited(i)
Chelsea Bridge Wharf (Management
Company) Limited
Chelsea Bridge Wharf Car Park Limited
Community Housing Action Limited
Community Villages Limited
CPWGCO 1 Limited
Drummond Road (Number 1) Limited
Drummond Road (Number 2) Limited
Exchange Place No 2 Limited
Fishguard Bridge Limited
Fishguard Tunnel Limited
Great Woodcote Park Management Limited
Hertfordshire Homes Limited
Historic Homes Limited
Kentdean Limited
One Tower Bridge Limited
Quod Erat Demonstrandum Properties Limited
Retirement Homes Limited
Royal Clarence Yard (Marina) Limited
Royal Clarence Yard (Phase A) Limited
Royal Clarence Yard (Phase B) Limited
Royal Clarence Yard (Phase C) Limited
Royal Clarence Yard (Phase E) Limited
Royal Clarence Yard (Phase G) Management
Company Limited
Royal Clarence Yard (Phase H) Limited
Royal Clarence Yard (Phase I) Limited
Royal Clarence Yard (Phase K) Management
Company Limited
Royal Clarence Yard Estate Limited
Sandgates Developments Limited
Sitesecure Limited
SJC (Highgate) Limited
St Edward Homes Number Five Limited
St Edward Homes Number Four Limited
St Edward Homes Number One Limited
St Edward Homes Number Three Limited
St Edward Homes Number Two Limited
St Edward Limited
St George (Crawford Street) Limited
St George (Queenstown Place) Limited
St George Blackfriars Limited
St George Commercial Limited
St George Developments Limited
St George Ealing Limited
St George Eastern Limited
St George Inner Cities Ltd
St George Investments Ltd
St George London Limited
St George Northfields Limited
St George Partnerships Limited
St George plc(iv)
St George Project Management Limited
St George Properties Limited
St George Real Estate Limited
St George Regeneration Limited
St George Southern Limited
St George Western Limited
St George Wharf Hotel Limited
St George's Hill Property Company Limited
St James West London Limited
St James Group Limited
St James Homes (Grosvenor Dock) Limited
St James Homes Limited
Tabard Square (Building A) Limited
Tabard Square (Building B) Limited
Tabard Square (Car Park) Limited
TBG (1) 2009 Limited
TBG (3) 2009 Limited
TBG (4) Limited
TBG (5) LLP
The Berkeley Festival Waterfront Company
Limited
The Berkeley Group plc
The Millennium Festival Leisure Company
Limited
The Oxford Gateway Development Company
Limited
The Tower, One St George Wharf Limited
Thirlstone (JLP) Limited
Thirlstone Commercial Limited
Thirlstone plc
Woodside Road Limited
(i) A Ordinary and B Ordinary shares
(ii) Ordinary and Preference shares
(iii) Ordinary and Deferred shares
(iv) Ordinary, Deferred and Preference shares
(v) List contains companies that are a
principle to agency agreements but are
not agents themselves
Country of Incorporation Registered office
Aragon Investments Limited Jersey Elizabeth House 9 Castle Street St Helier Jersey JE2 3RT
Berkeley (Carnwath Road) Limited Isle of Man First Floor, Jubilee Buildings, Victoria Street, Douglas, IM1 2SH, Isle of Man
Berkeley (Hong Kong) Limited Hong Kong 3806 Central Plaza, 18 Harbour Road, Wanchai, Hong Kong
Berkeley Homes Special Contracts plc(1) (i) Scotland Saltire Court, 20 Castle Terrace, Edinburgh, EH1 2EN
Berkeley Investments (IOM) Limited Isle of Man First Floor, Jubilee Buildings, Victoria Street, Douglas, IM1 2SH, Isle of Man
Berkeley Property Investments Limited Jersey Elizabeth House 9 Castle Street St Helier Jersey JE2 3RT
Berkeley Residential (Singapore) Limited Singapore 3 Anson Road, #27-01 Springleaf Tower, Singapore, 079909
Berkeley Whitehart Investments Limited Jersey Po Box 521 9 Burrard Street St Helier Jersey JE4 5UE
BRP Investments No.1 Limited Jersey Elizabeth House 9 Castle Street St Helier Jersey JE2 3RT
BRP Investments No.2 Limited Jersey Elizabeth House 9 Castle Street St Helier Jersey JE2 3RT
Comiston Properties Ltd Bahamas Shirlaw House, PO Box SS-19084, Shirley Street, Nassau, Bahamas
Real Star Investments Limited(2) Jersey Elizabeth House 9 Castle Street St Helier Jersey JE2 3RT
St George Battersea Reach Limited Jersey Kleinwort Benson House Po Box 76 Wests Centre St Helier Jersey JE4 8PQ
TBG (Jersey) 2009 Limited Jersey 44 Esplanade St Helier Jersey JE4 9WG
(1) Agency companies of Berkeley Homes plc
(2) Agency companies of St James Group Limited
(i) Ordinary, A Deferred and B Deferred shares
(b) Joint Ventures
At 30 April 2017 the Group had an interest in the following joint ventures which have been equity accounted to 30 April and have an accounting date of 30
April unless otherwise indicated. All of the companies listed below are incorporated in England and Wales have their registered office address at Berkeley
House, 19 Portsmouth Road, Cobham, Surrey, KT11 1JG and the principle activity is residential led mixed-use development and ancillary activities. All of the
companies are 50% owned by the Group and unless otherwise indicated, all of the companies have ordinary share capital:
Berkeley Breamore (Oceana) Limited(ii) St Edward Homes Partnership Freeholds Limited
Berkeley Carlton Holdings Limited(i) St Edward Strand Partnership Freeholds Limited
Berkeley Sutton Limited(ii) St George Little Britain (No 1) Limited(ii)
Community Housing Initiatives Limited** St George Little Britain (No 2) Limited(ii)
Diniwe One Limited St Katharine Homes LLP
Diniwe Two Limited STKM Limited
One Tower Bridge Partnership (unregistered)+ Strand Property Unit Trust (unregistered)+
SEH Manager Limited St William Homes LLP*
SEH Nominee Limited The St Edward Homes Partnership (unregistered)+
SES Manager Limited(iii) The St Edward (Strand) Partnership (unregistered)+
SES Nominee Limited Thirlstone Centros Miller Limited(ii)
St Edward Homes Limited(iv) U B Developments Limited(ii)
(i) A Ordinary shares
(ii) B Ordinary shares
(iii) A Ordinary and B Ordinary shares
(iv) A Ordinary, C Preference and D Preference shares
* Accounting date of 31 March
** Accounting date of 31 December
+ Principal place of business is 19 Portsmouth Road, Cobham, Surrey, KT11 1JG
BERKELEY ANNUAL REPORT 2017 FINANCIALSBERKELEY ANNUAL REPORT 2017 FINANCIALS
146 147
02
GO
VE
RN
AN
CE
03
FIN
AN
CIA
LS
01 S
TR
AT
EG
IC R
EP
OR
T
COMPANY BALANCE SHEET
As at 30 April Notes
2017 £m
2016
£m
Fixed assetsInvestments C5 1,413.9 1,412.7
1,413.9 1,412.7
Current assetsDebtors C6 20.5 26.8
Cash at bank and in hand 0.9 0.9
21.4 27.7
Current liabilitiesCreditors (amounts falling due within one year) C7 (718.9) (634.0)
Net current liabilities (697.5) (606.3)
Total assets less current liabilities and net assets 716.4 806.4
Capital and reservesCalled-up share capital C8 7.0 6.9
Share premium account 49.8 49.8
Capital redemption reserve 24.5 24.5
Profit and loss account 635.1 725.2
Total shareholders’ funds 716.4 806.4
The financial statements on pages 148 to 153 were approved by the board of directors on 21 June 2017 and were signed on its behalf by:
R J StearnFinance Director
COMPANY STATEMENT OF CHANGES IN EQUITY
Notes
Share
capital
£m
Share
premium
£m
Capital
redemption
reserve
£m
Retained
earnings
£m
Total
£m
At 1 May 2016 6.9 49.8 24.5 725.2 806.4
Profit after taxation for the year – – – 228.5 228.5
Issue of ordinary shares C8 0.1 – – – 0.1
Purchase of ordinary shares – – – (64.5) (64.5)
Transactions with shareholders:
Credit in respect of employee share schemes – – – (0.1) (0.1)
Deferred tax in respect of employee share
schemes – – – 0.6 0.6
Dividends to equity holders of the Company C9 – – – (254.6) (254.6)
At 30 April 2017 7.0 49.8 24.5 635.1 716.4
Notes
Share
capital
£m
Share
premium
£m
Capital
redemption
reserve
£m
Retained
earnings
£m
Total
£m
At 1 May 2015 6.8 49.6 24.5 723.8 804.7
Profit after taxation for the year – – – 229.5 229.5
Issue of ordinary shares C8 0.1 0.2 – – 0.3
Purchase of ordinary shares – – – (1.2) (1.2)
Transactions with shareholders:
Credit in respect of employee share schemes – – – 28.8 28.8
Deferred tax in respect of employee share
schemes – – – 3.8 3.8
Dividends to equity holders of the Company C9 – – – (259.5) (259.5)
At 30 April 2016 6.9 49.8 24.5 725.2 806.4
BERKELEY ANNUAL REPORT 2017 FINANCIALSBERKELEY ANNUAL REPORT 2017 FINANCIALS
148 149
02
GO
VE
RN
AN
CE
03
FIN
AN
CIA
LS
01 S
TR
AT
EG
IC R
EP
OR
T

C1 ACCOUNTING POLICIES
Basis of preparationThese financial statements have been prepared in accordance with Financial Reporting Standard 101 Reduced Disclosure Framework (“FRS 101”).
In preparing these financial statements, the Company applies the recognition, measurement and disclosure requirements of International Financial
Reporting Standards as adopted by the EU (“Adopted IFRSs”), but makes amendments where necessary in order to comply with Companies Act 2006 and,
as set out below, where advantage of FRS 101 reduced disclosure exemptions has been taken.
The accounting policies adopted for the Parent Company, The Berkeley Group Holdings plc, are otherwise consistent with those used for the Group which
are set out on pages 124 to 127.
In these financial statements, the company has applied the exemptions available under FRS 101 in respect of the following disclosures:
– Cash Flow Statement and related notes;
– Comparative period reconciliations for share capital and intangible assets;
– Disclosures in respect of transactions with wholly owned subsidiaries;
– Disclosures in respect of capital management;
– The effects of new but not yet effective IFRSs;
– An additional balance sheet for the beginning of the earliest comparative period following the retrospective change in accounting policy; and
– Disclosures in respect of the compensation of Key Management Personnel.
The principal activity of The Berkeley Group Holdings plc (“the Company”) is to act as a holding company.
The Company has not presented its own profit and loss account as permitted by Section 408 of the Companies Act 2006.
Going concernThe Group’s business activities together with the factors likely to affect its future development performance and position are set out in the Strategic Report.
The financial position of the Group, its cash flows, liquidity position and borrowing facilities are all described in the Trading and Financial Review on pages
72 to 75.
The Group has significant financial resources and the Directors have assessed the future funding requirements of the Group, including the return of £2.2
billion to shareholders by 2021, and compared this to the level of committed loan facilities and cash resources over the medium term. In making this
assessment consideration has been given to the uncertainty inherent in future financial forecasts and where applicable reasonable sensitivities have been
applied to the key factors affecting the financial performance of the Group.
Based on the financial performance of the Group, the Directors have a reasonable expectation that the Company has adequate resources to continue its
operational existence for the foreseeable future, notwithstanding its net current liability position of £697.5 million (30 April 2016: £606.3 million). For this
reason they continue to adopt the going concern basis of accounting in preparing the annual financial statements.
ExpenditureExpenditure is recognised in respect of goods and services received when supplied in accordance with contractual terms. Provision is made when an
obligation exists for a future liability in respect of a past event and where the amount of the obligation can be reliably estimated.
PensionsPension contributions under defined contribution schemes are charged to the income statement as they fall due.
InvestmentsInvestments in subsidiary undertakings are included in the balance sheet at cost less provision for any impairment.
Deferred taxationDeferred tax is recognised in respect of all timing differences that have originated but not reversed at the balance sheet date, where transactions or events
that result in an obligation to pay more tax in the future or a right to pay less tax in the future have occurred at the balance sheet date.
A net deferred tax asset is recognised as recoverable and therefore recognised only when, on the basis of all available evidence, it can be regarded as more
likely than not that there will be suitable taxable profits against which to recover carried forward tax losses and from which the future reversal of underlying
timing differences can be deducted.
Deferred tax is measured at the average tax rates that are expected to apply in the periods in which the timing differences are expected to reverse, based
on tax rates and laws that have been enacted or substantively enacted by the balance sheet date. Deferred tax is measured on an undiscounted basis.
Share-based paymentsThe Company operates one equity-settled, share-based compensation plan. The fair value of the employee services received in exchange for the grant of
the options is recognised as an expense. The total amount to be expensed over the vesting period is determined by reference to the fair value of the options
granted.
At each balance sheet date, the Company revises its estimates of the number of options that are expected to vest. It recognises the impact of the revision
to original estimates, if any, in the profit and loss account, with a corresponding adjustment to equity. Amounts recognised in respect of executive directors
of the Company’s subsidiaries are recognised as an addition to cost of Investment.
The proceeds received net of any directly attributable transaction costs are credited to share capital (nominal value) and share premium when the options
are exercised.
NOTES TO THE COMPANY FINANCIAL STATEMENTS
C1 ACCOUNTING POLICIES CONTINUED
DividendsDividend distributions to shareholders are recognised as a liability in the period in which the dividends are appropriately authorised and approved for
payout and are no longer at the discretion of the Company. Unpaid dividends that do not meet these criteria are disclosed in the notes to the financial
statements.
C2 PROFIT/(LOSS) ON ORDINARY ACTIVITIES BEFORE TAXATION
Profit/(loss) on ordinary activities before taxation is stated after charging the following amounts:
2017 £m
2016
£m
Auditors’ remuneration – audit fees 0.1 0.1
No disclosure of other non-audit services has been made as this is included within note 4 of the consolidated financial statements.
C3 DIRECTORS AND EMPLOYEES
2017 £m
2016
£m
Staff costs
Wages and salaries 2.6 3.4
Social security costs (1.2) 14.0
Share-based payments – Equity settled 27.5 21.7
Share-based payments – Cash settled 4.8 3.9
33.7 43.0
The average monthly number of persons employed by the company during the year was 10, all of whom are Directors (2016: 10).
The national insurance payable under the 2011 Long-Term Incentive Plan, following the introduction of individual participate caps, represents a reduction
from the accrued position at the previous year end resulting in an Income Statement credit which has not been entirely offset by current year national
insurance charges.
DirectorsDetails of Directors’ emoluments are set out in the Remuneration Report on pages 89 to 107.
PensionsDuring the year, the Company participated in one of the Group’s pension schemes, The Berkeley Group plc Group Personal Pension Plan. Further details on
this scheme are set out in note 5 of the Consolidated Financial Statements. Contributions amounting to £nil (2016: £57,623) were paid into the defined
contribution scheme during the year.
Share-based paymentsThe charge to the income statement in respect of equity settled share-based payments in the year, relating to grants of shares; share options and notional
shares awarded under the 2011 Long-Term Incentive Plan was £27.5 million (2016: £21.7 million). The charge to the income statement in respect of cash
settled share-based payments under the Bonus Banking Plan was £4.8 million (2016: £3.9 million). The charge to the reserves during the year in respect of
employee share schemes was £0.1 million (2016: £28.8 million), resulting from the non-cash IFRS2 charge for the year adjusted for the reclassification of
reserves on the decision to cash settle the part of the award relating to taxes which vested during the year. Further information on the Company’s share
incentive schemes are included in the Remuneration Report on pages 89 to 107 as well as note 5 to the Consolidated Financial Statements.
C4 THE BERKELEY GROUP HOLDINGS PLC PROFIT AND LOSS ACCOUNT
The profit for the year in the Company is £228.5 million (2016: profit of £229.5 million).
C5 INVESTMENTS
2017 £m
2016
£m
Investments in shares of subsidiary undertaking at cost at 1 May 1,412.7 1,400.6
Additions 1.2 12.1
Investment in shares of subsidiary undertaking at cost at 30 April 1,413.9 1,412.7
Additions in the year relate to company contributions to The Berkeley Group plc for employee services to be settled through the issue of shares on the
vesting of the Berkeley Group Holdings plc 2011 Long Term Incentive Plan awards for the benefit of executive directors of its subsidiaries.
The directors believe that the carrying value of the investments is supported by their underlying net assets.
Details of subsidiaries are given within note 26 of the Consolidated Financial Statements.
BERKELEY ANNUAL REPORT 2017 FINANCIALSBERKELEY ANNUAL REPORT 2017 FINANCIALS
150 151
02
GO
VE
RN
AN
CE
03
FIN
AN
CIA
LS
01 S
TR
AT
EG
IC R
EP
OR
T
C6 DEBTORS
2017 £m
2016
£m
Current
Deferred tax 20.5 26.8
The movements on the deferred tax asset are as follows:
2017 £m
2016
£m
At 1 May 26.8 6.5
Remeasurement of deferred tax on employee share schemes – 14.9
At 1 May 26.8 21.4
Deferred tax in respect of employee share schemes credited to reserves (2.5) 8.1
Realisation of deferred tax asset on vesting of employee share scheme (3.8) (2.7)
At 30 April 20.5 26.8
Deferred tax is calculated in full on temporary differences at the tax rates that are expected to apply for the period when the asset is realised and the
liability is settled using a tax rate of 19/17% as appropriate (2016: 19/17%). Accordingly, all temporary differences have been calculated. There is no
unprovided deferred tax (2016: nil) at the balance sheet date.
The deferred tax asset of £20.5 million relates to short-term timing differences (2016: £26.8 million).
C7 CREDITORS: AMOUNTS FALLING DUE WITHIN ONE YEAR
2017 £m
2016
£m
Amounts owed to subsidiary undertakings (702.9) (609.7)
Other taxation and social security (10.3) (24.3)
Accruals and deferred income (5.7) –
(718.9) (634.0)
All amounts included above are unsecured. The interest rate on £676.0 million (2016: £649.9 million) of the balance owed to subsidiary undertakings is 4.0%
(2016: 4.0%), with no fixed repayment date. At 30 April 2017 all other amounts owed to subsidiary undertakings are at floating rates linked to LIBOR and
have no fixed repayment date.
C8 CALLED-UP SHARE CAPITAL
Each ordinary share of 5p is a voting share in the capital of the Company, is entitled to participate in the profits of the Company and on a winding-up is
entitled to participate in the assets of the Company.
The movements on allotted and fully paid share capital for the Company in the year were as follows:
Ordinary shares Share Capital Share Premium
2017No ‘000
2016
No ‘000
2017£m
2016
£m
2017£m
2016
£m
Issued
At start of year 138,257 136,657 6.9 6.8 49.8 49.6
Issued in year 1,900 1,600 0.1 0.1 – 0.2
At end of year 140,157 138,257 7.0 6.9 49.8 49.8
On 22 September 2016, 1.9 million ordinary shares were allotted and issued to the Employee Benefit Trust (2016: 1.6 million).
On 30 September 2016, 1.8 million ordinary shares (2016: 1.4 million) were transferred from the Employee Benefit Trust to Executive Directors to satisfy the
exercise of options under the 2011 Long Term Incentive Plan (2016: 2009 Long Term Incentive Plan Part B).
At 30 April 2017 there were 0.4m shares held in the Employee Benefit Trust (2016: 0.3m). The market value of these shares at 30 April 2017 was £13.8 million
(2016: £10.1 million).
The movements in the year are disclosed in note 18 and note 19 of the Consolidated Financial Statements.
CONTINUED
NOTES TO THE COMPANY FINANCIAL STATEMENTS
C9 DIVIDENDS PER SHARE
The dividends paid in 2017 were a total of £254.6 million, £117.7 million in March 2017 (85.24 pence per share) and £136.9million in September 2016 (100
pence per share) (2016: £259.5 million being £136.6 million in January 2016, 100 pence per share, and £122.9 million in September 2015, 90 pence per share).
C10 RELATED PARTY TRANSACTIONS
The Company has not undertaken related party transactions during the year with entities that are not wholly owned subsidiaries of The Berkeley Group
Holdings plc. Transactions with wholly owned members of The Berkeley Group Holdings plc are exempt under FRS 101 with reduced disclosure.
BERKELEY ANNUAL REPORT 2017 FINANCIALSBERKELEY ANNUAL REPORT 2017 FINANCIALS
152 153
02
GO
VE
RN
AN
CE
03
FIN
AN
CIA
LS
01 S
TR
AT
EG
IC R
EP
OR
T
FIVE YEAR SUMMARY
Years ended 30 April
2017 £m
2016
£m
2015
£m
2014
£m
2013
£m
Income statementRevenue from operations 2,723.5 2,047.5 2,020.2 1,620.6 1,372.6
Operating profit 756.2 501.9 524.1 374.8 280.1
Share of results of joint ventures 63.8 36.5 28.3 12.1 (1.3)
Net finance costs (7.6) (7.5) (12.7) (6.9) (8.1)
Profit before taxation 812.4 530.9 539.7 380.0 270.7
Taxation (167.3) (126.8) (116.2) (87.1) (61.0)
Profit after taxation 645.1 404.1 423.5 292.9 209.7
Basic earnings per ordinary share 467.8p 295.8p 313.0p 221.8p 160.0p
Statement of financial positionCapital employed 1,851.4 1,705.4 1,207.0 1,312.1 1,277.7
Net cash 285.5 107.4 430.9 129.2 44.7
Net assets 2,136.9 1,812.8 1,637.9 1,441.3 1,322.4
Net assets per share attributable to shareholders(1) 1,556p 1,314p 1,199p 1,066p 1,009p
Ratios and statisticsReturn on capital employed(2) 42.5% 34.5% 41.6% 29.9% 22.9%
Return on equity after tax(3) 32.7% 23.4% 27.5% 21.2% 17.3%
Return on equity before tax(4) 41.1% 30.8% 35.1% 27.5% 22.4%
Units sold(5) 3,905 3,776 3,355 3,742 3,712
(1) Net assets attributable to shareholders divided by the number of shares in issue excluding shares held in treasury and shares held by the employee
benefit trust.
(2) Calculated as profit before interest and taxation (including joint venture (loss)/profit before tax) divided by the average net assets adjusted for (debt)/
cash.
(3) Calculated as profit after taxation attributable to shareholders as a percentage of the average of opening and closing shareholders’ funds.
(4) Calculated as profit before taxation attributable to shareholders as a percentage of the average of opening and closing shareholders’ funds.
(5) The number of units completed and taken to sales in the year excluding joint ventures.
Annual General Meeting and Trading Update 6 September 2017
Half year end 31 October 2017
Interim Results Announcement for the six months ending 31 October 2017 December 2017
Trading Update March 2018
Year end 30 April 2018
Preliminary Announcement of Results for the year ending 30 April 2018 June 2018
Publication of 2018 Annual Report August 2018
FINANCIAL
DIARY
REGISTERED OFFICE
AND ADVISORS
Registered offi ce and principal place of businessBerkeley House
19 Portsmouth Road
Cobham
Surrey HT11 1JG
Registered number: 5172586
RegistrarsCapita Registrars
The Registry
34 Beckenham Road
Beckenham
Kent BR3 4TU
0871 664 0300 (from the UK)
+44 20 8639 3399 (from overseas)
Corporate broker and fi nancial advisorUBS Investment Bank
Share price informationThe Company’s share capital is listed on
the London Stock Exchange. The latest
share price is available via the Company’s
website at www.berkeleygroup.co.uk
SolicitorsHerbert Smith Freehills LLP
BankersBarclays Bank plc
HSBC Bank plc
Lloyds Banking Group plc
Santander UK plc
Svenska Handelsbanken AB (Publ)
The Royal Bank of Scotland
AuditorsKPMG LLP
BERKELEY ANNUAL REPORT 2017 FINANCIALS
155
02
GO
VE
RN
AN
CE
03
FIN
AN
CIA
LS
01 S
TR
AT
EG
IC R
EP
OR
T
BERKELEY ANNUAL REPORT 2017 FINANCIALS
154

The Berkeley Group Holdings plcBerkeley House19 Portsmouth RoadCobhamSurrey KT11 1JGUK
T +44 (0)1932 868 555F +44 (0)1932 868 667www.berkeleygroup.co.uk
Design by Hunter Design
Printed in England by Pureprint GroupThis report is printed on Revive 100 paper. This is made from 100% post consumer waste certifi ed according to the rules of the Forest Stewardship Council (FSC)®. It is manufactured at a mill that is certifi ed to ISO14001 and EMAS environmental standards. The mill uses pulps that are processed chlorine free (PCF). The inks in printing this report are all vegetable-based. Printed at Pureprint Group, ISO14001,FSC certifi ed and CarbonNeutral®