resource performance at ormat's tuscarora geothermal project, nevada · resource performance...
TRANSCRIPT
Proceedings World Geothermal Congress 2015
Melbourne, Australia, 19-25 April 2015
1
Resource Performance at Ormat's Tuscarora Geothermal Project, Nevada USA
Ethan Chabora1, James Lovekin
1, Paul Spielman
2, and Zvi Krieger
2
1GeothermEx, a Schlumberger Company, 3260 Blume Dr., Suite 220, Richmond, CA 94806 USA
2Ormat Nevada, Inc., 6225 Neil Road, Reno, Nevada 89511 USA
Keywords: Tuscarora, tracer testing, numerical modeling, history-matching, injection strategy
ABSTRACT
In late 2011, Ormat Nevada, Inc. started up an 18-MW binary plant at its Tuscarora geothermal project in northeastern Nevada,
USA. The project has successfully overcome two resource challenges since start-up. First, the initial drawdown in reservoir
pressure was too large to allow use of the original discovery well when a downhole production pump was installed. This was
rectified by drilling an additional production well with a casing configuration that allowed a greater pump-setting depth, and the
plant is now operating with stable reservoir pressures. Second, the project experienced an undesirable decline in plant inlet
temperatures in its first year and a half of operation. This was addressed by shutting in one injection well that was shown by tracer
testing to be communicating too directly with production wells. Temperature declines at the plant inlet have now been reduced to a
level compatible with long-term commercial operations. Numerical modeling of the reservoir has closely matched the trends in
reservoir pressures and temperatures and has been valuable in forecasting project performance.
1. INTRODUCTION
In 2010, Ormat Nevada Inc. acquired the Tuscarora geothermal project located in the north-central Basin and Range province of
Nevada, USA (Figure 1). Building on exploration efforts from the late 1970s to the early 2000s by previous developers (some of
whom referred to the project as Hot Sulphur Springs), Ormat drilled three commercially productive wells (65A-8, 65B-8, and
65C-8; see Figure 1), which have been supplying all of the production to the 18-MW binary plant since March 2012.
Single-phase liquid at a recent average temperature of 342°F is produced from a fractured, permeable zone in the Paleozoic
basement sediments between 4,500 and 5,000 feet below ground surface. Re-injection of the cooled production brine generally
occurs in a shallower interval within Tertiary volcanics (between 2,000 and 3,000 feet below ground surface) and is more widely
distributed between four wells to the north of the production area (66-5, 66A-5, 87A-5, and 53-8). One well to the south (57-8)
injects predominantly blow-down water from the power-plant cooling towers.
This operational configuration has evolved over the course of the historical production period as a result of the initial drawdown in
reservoir pressure in the production area along with a prolonged period (nearly 2 years) of production temperature decline of
approximately 3.5°F per year. Multi-well tracer testing was an important key to understanding the hydrogeologic connections
between the wells, and the results were used in conjunction with numerical simulation to revise the operational scheme, which
reduced the rate of temperature decline by a factor of two starting in September 2013.
1.1 Geologic and Structural Setting
Tuscarora is located approximately 50 miles northwest of Elko, Nevada, in the north-central part of the Basin and Range province,
in an area between the Independence and Tuscarora mountain ranges known as Independence Valley. Surface expressions of the
geothermal system include a long, narrow, silica-sinter terrace (~1,000 m long by ~35 m wide) which follows a NNE trend along
Hot Creek, as well as a cluster of boiling springs and fumaroles located about half a mile NE of the main production area
(Figure 1).
The geology of the field has been described in several prior studies, including Sibbett (1982), Coats et al. (1987), GeothermEx
(2009), and Dering and Faulds (2012). The geothermal reservoir is contained in both Tertiary and Paleozoic (basement) rock. The
Paleozoic rocks in this area consist of a deep marine sedimentary/volcanic sequence (sandstone, shale, chert, quartzite, and basalt)
which has been thrust over a shallow marine sequence (silty limestone and dolomite). Because of their age, the Paleozoic rocks are
more indurated, have generally lower porosity and permeability, and have been subjected to far more disruption by faulting and
folding compared to the overlying Tertiary rocks. Although the Paleozoic rocks tend to have low porosity, they are relatively
strong and brittle compared to the Tertiary rocks, and consequently they can generally sustain open fractures better than the Tertiary
rocks. As a result, fracture permeability in the Paleozoics can be a major source of fluid flow to geothermal wells.
In contrast, the stratigraphy of the Tertiary rocks is simpler. Most of the Tertiary rocks are of volcanic origin and include thick
sequences of tuff, fine sediments, and interstratified lava flows. Although these rocks can be quite porous, they tend to have low
permeability except in fractured lava flows or in stratified zones of coarse volcanic breccia. Wells in the Tuscarora field have also
encountered permeable entries at the unconformable contact between the Tertiary and Paleozoic rocks.
Dering and Faulds (2012) have characterized the structural features of the Tuscarora field as a semi-continuous system of NNE- to
NNW-striking, west-dipping normal faults, kinematically linked by a broad left step-over and relay ramp. The geothermal system
is interpreted to lie along the hinge line of an anticlinal accommodation zone, in which a series of west-dipping faults overlap with
east-dipping faults. The pattern of faulting within the step-over is diffuse, with most individual faults being discontinuous along
strike and exhibiting relatively minor offsets. These sets of oppositely dipping, small-offset normal faults within the hinge zone are

Chabora et al.
2
likely breccia-dominated and have sufficient permeability to act as sub-vertical conduits for fluid flow through the system. On the
other hand, the large-offset, range-bounding faults are more likely to be filled with clay gouge and to act as barriers to fluid flow.
Borehole image logs obtained by Ormat from previously existing wells in the field were used to identify the orientation of open
fractures associated with these small-offset intersecting faults, which aided in targeting the successful production wells prior to
operational start-up.
Figure 1: Wellfield map of Tuscarora Geothermal Field in Elko County, Nevada, USA.
1.2 Temperature Anomaly
Analysis of static wellbore temperature surveys acquired over the course of various exploration campaigns in the Tuscarora area
has enabled a reasonable interpretation of the pre-exploitation conditions within the reservoir to be constructed. The data analyzed
Chabora et al.
3
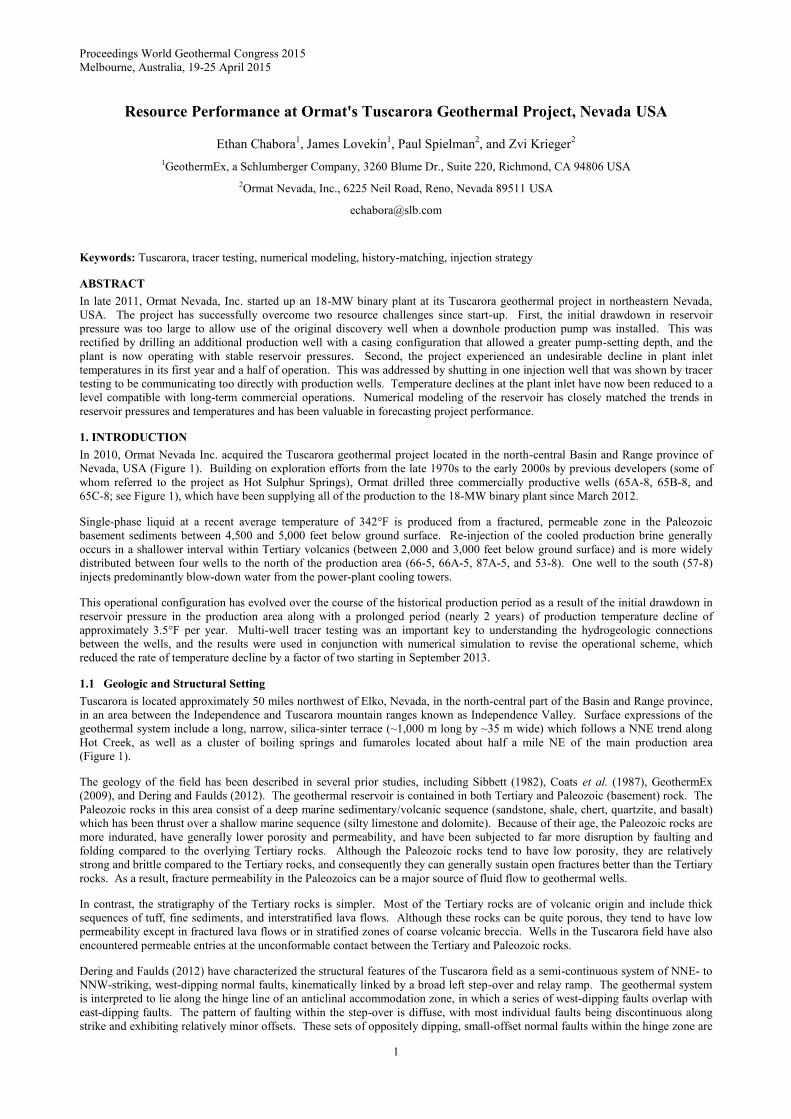
included surveys from 20 shallow temperature-gradient (TG) wells (< 1,500 feet), 8 intermediate-depth slim holes (> 1,500 feet),
and 8 deep, full-diameter wells (> 4,800 feet). From these static temperature profiles, isothermal contours were constructed at
discrete elevations through the reservoir, and then isothermal surfaces were interpolated across the contours; these are presented in
Figure 2, with several of the active wells shown for reference. The shape of the temperature anomaly suggests a predominantly
vertical convective upwelling of hot geothermal fluid (> 360°F) below the main the production area with minor subsurface
discharge to the NNE. The geothermal gradient becomes more conductive south of injection well 57-8 and north of injection well
66-5, indicating the limits of the geothermal reservoir.
Figure 2: Northwest-looking oblique view of isothermal surfaces of the temperature anomaly at Tuscarora Geothermal
Field (a); cross-sectional cutaway of isothermal surfaces (b); production well in red and injection wells in blue.
2. RESOURCE PERFORMANCE
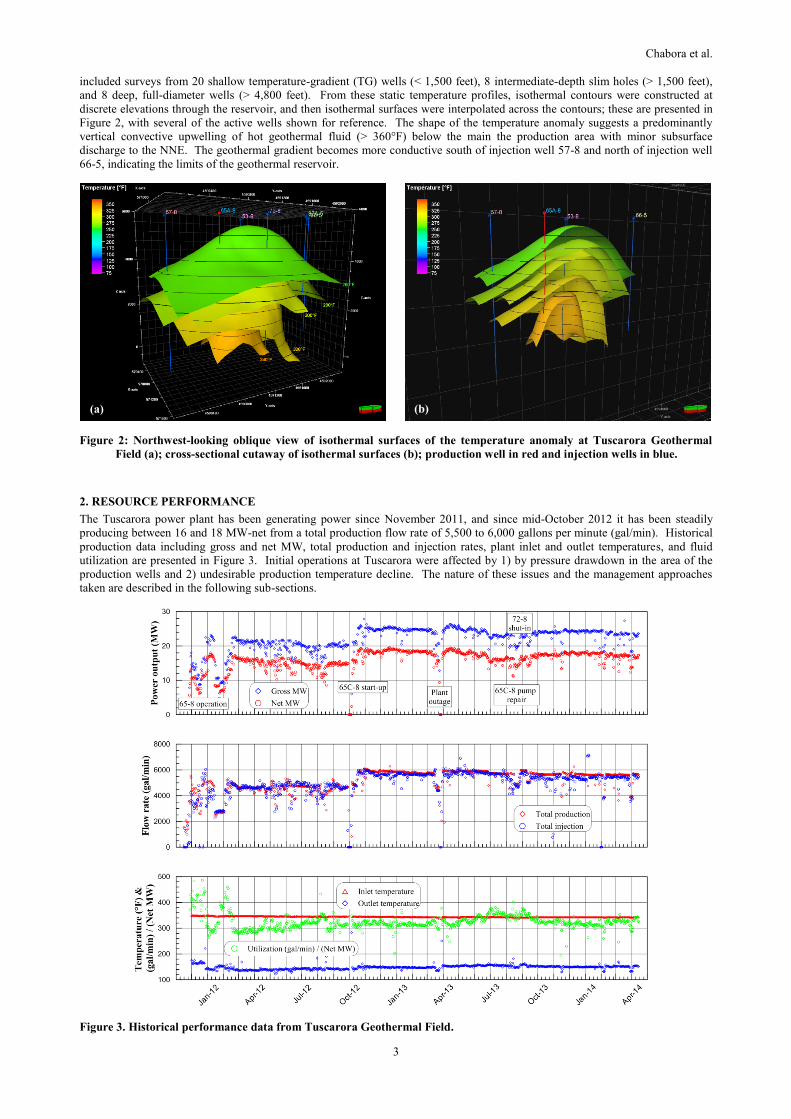
The Tuscarora power plant has been generating power since November 2011, and since mid-October 2012 it has been steadily
producing between 16 and 18 MW-net from a total production flow rate of 5,500 to 6,000 gallons per minute (gal/min). Historical
production data including gross and net MW, total production and injection rates, plant inlet and outlet temperatures, and fluid
utilization are presented in Figure 3. Initial operations at Tuscarora were affected by 1) by pressure drawdown in the area of the
production wells and 2) undesirable production temperature decline. The nature of these issues and the management approaches
taken are described in the following sub-sections.
Figure 3. Historical performance data from Tuscarora Geothermal Field.
(a) (b)

Chabora et al.
4
2.1 Operational Challenges
2.1.1 Pressure Decline
Initial commercial operations of the Tuscarora plant relied on production from three pumped wells: the original discovery well
(65-8), drilled by a prior operator, and two development wells (65A-8, and 65B-8), drilled by Ormat in 2010. The close proximity
of the wells at depth and the rate of fluid extraction from the production zone resulted in a pressure interference effect, which
produced an average pressure drawdown of nearly 500 psi in the production wells. Due to the pressure drawdown, the dynamic
water level dropped to an inoperable depth in well 65-8, which had production casing set at a relatively shallow depth (~ 1,500 feet)
compared to that of 65A-8 and 65B-8 (set deeper than 3,000 feet in each well). As a result, the production pump in well 65-8 could
not be set deep enough to sustain production, and the well was taken offline. From February to October 2012, the field operated on
the production from wells 65A-8 and 65B-8 alone – approximately 2,000 kilopounds per hour (klbs/h) – while a new production
well 65C-8 was drilled. This limited the generation capacity of the power plant to 14 to 16 MW-net due to the lower mass flow
through the binary system.
In mid-October 2012, well 65C-8 was brought online, which resulted in an additional 600 klbs/h of mass production, increased
power generation by 3 MW-net, and caused further pressure drawdown in the production wells (600 psi on average) (Figure 4).
The production pumps in all three wells have been set deep enough to sustain production at the resulting dynamic fluid levels. The
field has since operated steadily at a total mass production rate between 2,500 and 2,600 klbs/h, and the average pressure drawdown
of around 600 psi in the production wells has been maintained.
Figure 4: Average pressure drawdown in production wells with match by numerical simulation.
2.1.2 Temperature Decline
In addition to the pressure drawdown observed in the production wells, initial operations at Tuscarora were also challenged by a
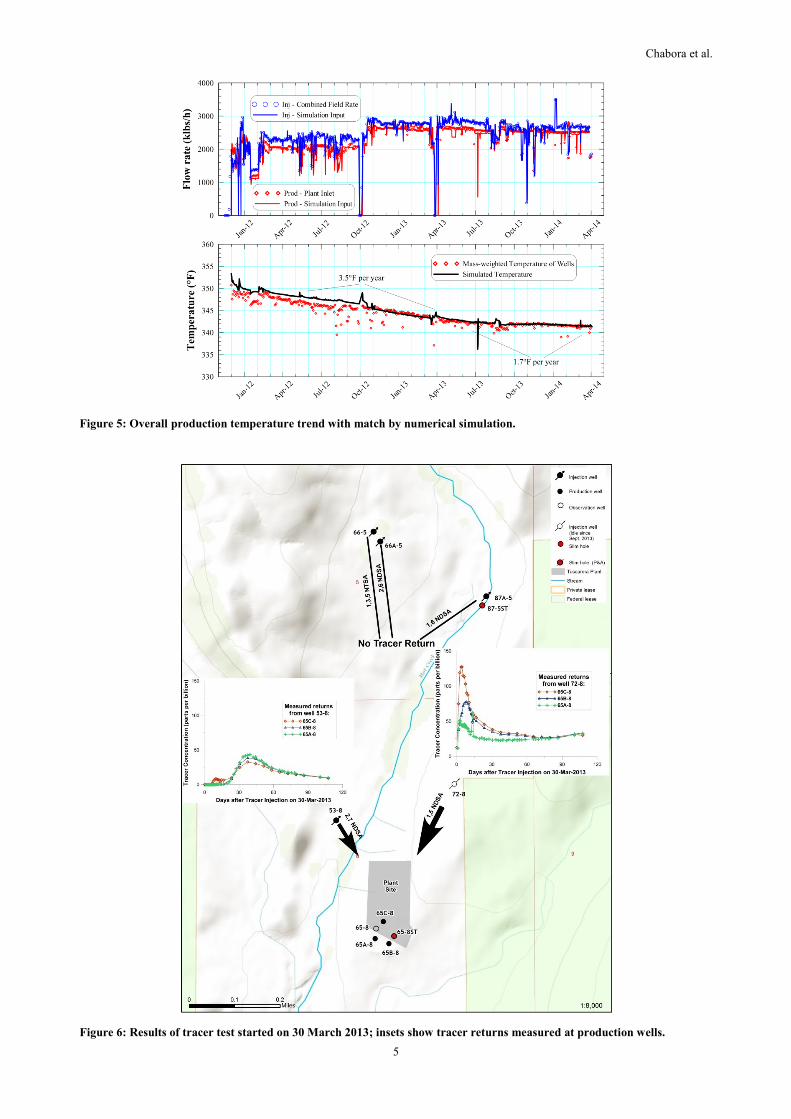
relatively high rate of decline in the production temperature. For nearly the first two years of operation, the plant-inlet temperature
cooled at approximately 3.5°F per year (see Figure 5). Ormat undertook a multi-well tracer study to better understand the
connections between the injection and production wells and to help determine the best course of action to mitigate the cooling.
2.2 Tracer Testing
On 30 March 2013, five distinct non-reactive tracers were injected, one for each of the five injection wells active at the time. For
several months afterwards, samples were taken at the three active production wells to monitor which tracers returned to the
production zone. Figure 6 presents a diagram of the tracer study results, indicating each injector’s tracer type and the returns
observed. Rapid tracer returns from injection well 72-8 were observed in all production wells, with initial returns in several hours
and a peak concentration of 128 parts per billion (ppb) observed in well 65C-8 in less than 4 days. In contrast, returns from
injection well 53-8 arrived after 20 days with peak concentrations approaching 40 ppb at 39 days of elapsed time. Injection wells to
the north of the field (66-5, 66A-5, and 87A-5) showed no returns to the production area throughout the entire monitoring period.
This study clearly demonstrated that the cooling trend was likely driven by the connection between injection well 72-8 and the
production area. The connection to injection well 53-8 was deemed less problematic because of the lag time in initial returns and
the relatively low peak concentration. Furthermore, as discussed further below, injection into well 53-8 appears to provide
beneficial pressure support to the production area.
Chabora et al.
5
Figure 5: Overall production temperature trend with match by numerical simulation.
Figure 6: Results of tracer test started on 30 March 2013; insets show tracer returns measured at production wells.

Chabora et al.
6
2.3 Injection Strategy
Using the insight gained from the tracer test, Ormat decided to discontinue use of injection well 72-8 in September 2013 and to
shift the majority of the fluid to well 53-8, with incremental injection going to well 66A-5. In late October 2013, Ormat also began
to utilize previously-idle well 57-8 (see Figure 1) to inject blow-down water from the plant cooling towers. Overall, this change
resulted in a nearly-immediate and dramatic improvement in the overall production temperature trend. Shortly after the change, the
plant-inlet temperature was observed to recover by 1.5°F, and the temperature decline transitioned from a rate of 3.5°F per year to
1.7°F per year (see Figure 5). In addition, the increased rate of injection to well 53-8 appears to have slightly reduced the pressure
drawdown observed in the production wells (see Figure 4). The resource performance since September 2013 has validated Ormat’s
operational strategy and indicates that the current configuration is sustainable for long-term operations.
3. NUMERICAL SIMULATION
Prior to and throughout the commercial operational period of the Tuscarora field, GeothermEx has maintained a numerical reservoir
model on behalf of Ormat. The model has evolved substantially as a result of the observed resource performance and has been used
to enhance the understanding of the characteristics of the Tuscarora geothermal system, as well as to evaluate key operational
decisions in the management of the resource. A description of the numerical model, the calibration process, and forecast
projections for the Tuscarora resource are described in more detail in the following subsections.
3.1 Model Description
The base grid of the model extends 3 miles east-west (E-W), 4 miles north-south (N-S), and 1.6 miles vertically, with the top of the
model approximately referenced to ground level (5,800 feet above mean sea level). Vertically, the model is divided into 9 layers,
and each layer is subdivided into 26 blocks in the E-W orientation and 32 blocks in the N-S orientation, for a total of 832 blocks in
each layer and 7,488 blocks in the base grid. Characteristic grid-block dimensions of the base grid in the production zone are 400
feet by 400 feet laterally and 800 to 1,000 feet thick. Figure 7a shows the simulation grid with respect to the field map previously
presented in Figure 1.
With continued development of the model over time, local grid refinements were implemented in the region between the production
area and the injection wells 72-8 and 53-8, as well as in the region around the production wells. As will be described, these local
refinements were required to match both the observed pressure drawdown and the impact of nearby injection wells on the
production temperature decline trend. Figure 7b depicts the two locally-refined grids within the skeleton of the base grid along
with several wells for reference. At the intermediate level of grid refinement (the red-colored volume in Figure 7b), the
characteristic grid-block dimensions are 125 by 100 feet laterally and 200 feet vertically near the main production interval. Within
the most-refined regions of the grid (the orange colored volume at the center of Figure 7b), the characteristic grid-block dimensions
are 25 feet by 25 feet laterally and 200 feet thick. This degree of refinement was required, since, the lateral spacing between wells
in the production zone is on the order of 50 feet.
A dual-porosity treatment was applied to the model to capture the fractured nature of the productive geothermal reservoir, in which
the rock matrix provides most of the fluid and heat storage, while the fractures provide the permeable network for fluid flow. The
dual-porosity treatment effectively doubles the number of grid blocks by dividing each block into matrix and fracture elements,
each with different thermophysical properties. In total, the dual-porosity grid for Tuscarora – including all local grid refinements –
is comprised of 40,128 elements.
In general, the matrix elements were assigned porosity values ranging between 2% to 3%, with low permeability values ranging
between 0.05 to 0.5 millidarcies (md). Fracture elements outside the productive zone were assigned porosity values between 2%
and 4% and horizontal and vertical permeability values ranging from 1 to 2 md. Within the productive reservoir, porosity values as
high as 10% and horizontal and vertical permeability values as high as 500 md were assigned to fracture elements.
Figure 7: Spatial extent of base grid relative to the Tuscarora field (a); northwest-looking oblique view of base grid
(magenta) and local grid refinements (red and orange) within main production area (b).
(a) (b)
Chabora et al.
7
3.2 Model Calibration
3.2.1 Initial-State Modeling
Initial-state modeling is the process by which the numerical model is initialized to match the pre-exploitation characteristics of the
geothermal reservoir, including the pressure, temperature, and phase distributions. This is achieved by applying appropriate
boundary conditions for heat and fluid recharge and discharge, then allowing the system to equilibrate over a simulated geologic
time scale (e.g., 100,000 years). Through a trial-and-error process, largely informed by the conceptual understanding of the
resource characteristics, the boundary conditions and grid properties are adjusted until a reasonable match is achieved.
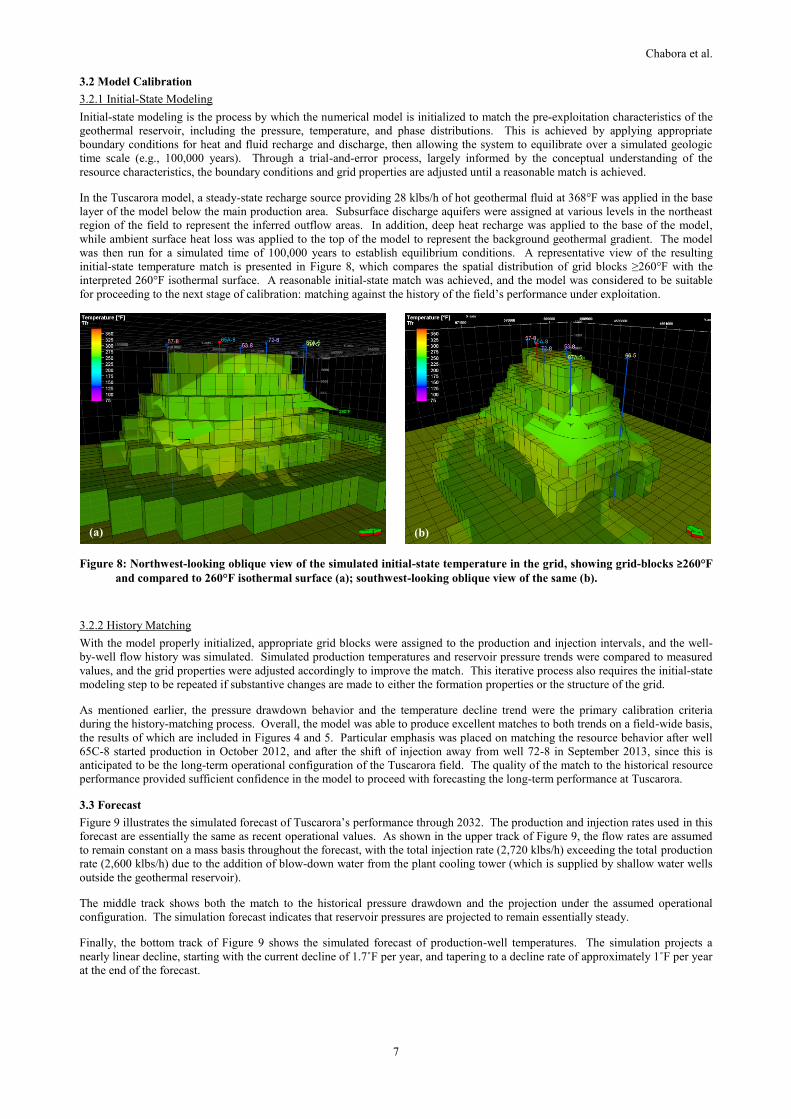
In the Tuscarora model, a steady-state recharge source providing 28 klbs/h of hot geothermal fluid at 368°F was applied in the base
layer of the model below the main production area. Subsurface discharge aquifers were assigned at various levels in the northeast
region of the field to represent the inferred outflow areas. In addition, deep heat recharge was applied to the base of the model,
while ambient surface heat loss was applied to the top of the model to represent the background geothermal gradient. The model
was then run for a simulated time of 100,000 years to establish equilibrium conditions. A representative view of the resulting
initial-state temperature match is presented in Figure 8, which compares the spatial distribution of grid blocks ≥260°F with the
interpreted 260°F isothermal surface. A reasonable initial-state match was achieved, and the model was considered to be suitable
for proceeding to the next stage of calibration: matching against the history of the field’s performance under exploitation.
Figure 8: Northwest-looking oblique view of the simulated initial-state temperature in the grid, showing grid-blocks ≥260°F
and compared to 260°F isothermal surface (a); southwest-looking oblique view of the same (b).
3.2.2 History Matching
With the model properly initialized, appropriate grid blocks were assigned to the production and injection intervals, and the well-
by-well flow history was simulated. Simulated production temperatures and reservoir pressure trends were compared to measured
values, and the grid properties were adjusted accordingly to improve the match. This iterative process also requires the initial-state
modeling step to be repeated if substantive changes are made to either the formation properties or the structure of the grid.
As mentioned earlier, the pressure drawdown behavior and the temperature decline trend were the primary calibration criteria
during the history-matching process. Overall, the model was able to produce excellent matches to both trends on a field-wide basis,
the results of which are included in Figures 4 and 5. Particular emphasis was placed on matching the resource behavior after well
65C-8 started production in October 2012, and after the shift of injection away from well 72-8 in September 2013, since this is
anticipated to be the long-term operational configuration of the Tuscarora field. The quality of the match to the historical resource
performance provided sufficient confidence in the model to proceed with forecasting the long-term performance at Tuscarora.
3.3 Forecast
Figure 9 illustrates the simulated forecast of Tuscarora’s performance through 2032. The production and injection rates used in this
forecast are essentially the same as recent operational values. As shown in the upper track of Figure 9, the flow rates are assumed
to remain constant on a mass basis throughout the forecast, with the total injection rate (2,720 klbs/h) exceeding the total production
rate (2,600 klbs/h) due to the addition of blow-down water from the plant cooling tower (which is supplied by shallow water wells
outside the geothermal reservoir).
The middle track shows both the match to the historical pressure drawdown and the projection under the assumed operational
configuration. The simulation forecast indicates that reservoir pressures are projected to remain essentially steady.
Finally, the bottom track of Figure 9 shows the simulated forecast of production-well temperatures. The simulation projects a
nearly linear decline, starting with the current decline of 1.7˚F per year, and tapering to a decline rate of approximately 1˚F per year
at the end of the forecast.
(a) (b)

Chabora et al.
8
Figure 9: Forecast performance of Tuscarora Geothermal Field.
4. CONCLUSIONS
Since the start of commercial operations in late 2011, the Tuscarora project has faced two operational challenges that have been
successfully managed for the betterment of the long-term resource performance. The initial pressure drawdown observed in the
production wells was addressed by drilling a new well configured with a deeper production casing, thereby enabling the downhole
pump to be set deeper. The problematic temperature decline – initially following a trend of 3.5°F per year – was investigated
through a well-planned and well-executed multi-well tracer testing study, which revealed a particularly strong connection between
injection well 72-8 and the production area. This well was subsequently shut-in and the injection was shifted to other wells in the
field, resulting in a nearly-immediate temperature recovery of 1.5°F and the transition to a lower decline trend of 1.7°F per year.
Numerical simulation was a valuable complement to these field investigations, providing both an enhanced understanding of the
resource characteristics and a tool to evaluate various field management decisions. The high quality of the model match to both the
historical pressure drawdown and temperature decline trends gives a high degree of confidence in the forecast projections of the
resource performance.
ACKNOWLEDGEMENTS
The authors would like to thank Ormat Nevada Inc. for permission to publish this paper. James Morrow and Raysa Roque-Rivera
provided valuable assistance in the organization of the field performance data and preparation of the figures.
REFERENCES
Coats, R.R. (1987). Geology of Elko County, Nevada. Nevada Bureau of Mines and Geology, Bulletin 101.
Dering, G., & Faulds, J. (2012). Structural Controls of the Tuscarora Geothermal Field, Elko County, Nevada. GRC Transactions,
vol. 36, pp. 41-46.
GeothermEx (2009). Geologic review and recommendations for further development, Hot Sulphur Springs geothermal project,
Elko County, Nevada. Consultant report for HSS II, LLC.
Sibbett, B.S. (1982). Geology of the Tuscarora geothermal prospect, Elko County, Nevada. Geological Society of America
Bulletin, vol. 93, pp. 1264-1272.