residue evaluation of certain veterinary drugs - joint … · (laberca), École nationale...
TRANSCRIPT
Progetto1_Layout 1 12/07/10 08:32 Pagina 1

SPECIAL NOTE
While the greatest care has been exercised in the preparation of this information, FAO expressly disclaims any liability to users of these procedures for consequential damages of any kind arising out of, or connected with, their use.

� v
TABLE OF CONTENTS
Table of contents ......................................................................................................................... V�
List of participants ...................................................................................................................... VI�Abbreviations ............................................................................................................................ VII�Introduction ................................................................................................................................ IX�
References .................................................................................................................................. XI�Ractopamine hydrochloride – adddendum to residue monograph ............................................... 1�
Annex 1 - summary of jecfa evaluations of veterinary drug residues�from the 32nd meeting to the present ................................................................................................................................... 41�
Use of JECFA reports and evaluations by registration authorities
Most of the evaluations and summaries contained in this publication are based on unpublished proprietary data submitted to JECFA for use when making its assessment. A registration authority should not consider granting a registration based on an evaluation published herein unless it has first received authorization for such use from the owner of the data or any second party that has received permission from the owner for using the data.
� vi
LIST OF PARTICIPANTS
JOINT FAO/WHO EXPERT COMMITTEE ON FOOD ADDITIVES
Evaluation of data on ractopamine residues in pig tissues
January – May 2010 (Electronic meeting)
Members
Dr D. Arnold, Consultant, Berlin, Germany
Professor A.R. Boobis, Experimental Medicine & Toxicology, Division of Investigative Science, Faculty of Medicine, Imperial College London, London, England
Dr R. Ellis, Consultant, Myrtle Beach, SC, United States of America (USA)
Professor B. Le Bizec, Laboratoire d’Étude des Résidus et Contaminants dans les Aliments (LABERCA), École Nationale Vétérinaire, Agroalimentaire et de l’Alimentation Nantes Atlantique (ONIRIS), Nantes, France
Dr P. Sanders, Laboratoire d’Études et de Recherches sur les Médicaments Vétérinaires et les Désinfectants, Agence Française de Sécurité Sanitaire des Aliments, Fougères, France
Secretariat
Dr A. Tritscher, Department of Food Safety and Zoonoses, World Health Organization, Geneva, Switzerland (WHO Joint Secretary)
Dr A. Wennberg, Nutrition and Consumer Protection Division, Food and Agriculture Organization of the United Nations, Rome, Italy (FAO Joint Secretary)
� vii
ABBREVIATIONS
ADI Acceptable daily intake AOAC AOAC International AUC Area under the curve BW or bw Body weight CAC Codex Alimentarius Commission CAS Chemical Abstracts Service CCRVDF Codex Committee on Residues of Veterinary Drugs in Foods Cl Clearance rate Cmax Maximum concentration CR Renal clearance CV Coefficient of variation Cvr Repeatability CcR Reproducibility ECD Electron capture detector EDI Estimated daily intake FAO Food and Agriculture Organization of the UN GC Gas chromatography GLP Good laboratory practice H or h Hour HPLC High pressure liquid chromatography IM Intramuscular IR Infrared IU International Unit IUPAC International Union of Pure and Applied Chemistry IV Intravenous JECFA Joint FAO/WHO Expert Committee on Food Additives JMPR Joint FAO/WHO Meeting on Pesticide Residues Kg or kg Kilogram (103grams) LC Liquid chromatography LOD Limit of detection LOQ Limit of quantitation �g microgram (10-6grams) mg milligram (10-3grams) min Minimum or minute mL or ml milliliter MRL Maximum Residue Limit MS Mass spectrometry MW or mw Molecular weight N Negative NA or na Not analyzed or not applicable NC or nc Not calculated ND Not detected NOEL No effect level NQ Non quantifiable P Positive QA Quality assurance QC Quality control RP Reverse phase SC Subcutaneous (injection) SD Standard deviation
� viii
S/N Signal to noise ratio SPE Solid phase extraction SD Standard deviation s.e. Standard error t½ Half life TR Total residue TMDI Theoretical maximum daily intake TRR Total radiolabelled residues TRS Technical Report Series TSP Thermospray UV Ultraviolet Vd Volume of distribution WHO World Health Organization
� ix
INTRODUCTION
With reference to the request of the Codex Alimentarius Commission (CAC) at its thirty-second session (Rome, Italy 29 June – 4 July 2009, ALINORM 09/32/REP) to undertake a review of new data on residues of ractopamine in pig tissues, a summary of which was submitted to the eighteenth session of the Codex Committee on Residues of Veterinary Drugs in Food by the People’s Republic of China, the Secretariat of JECFA at FAO and WHO requested the submission of these data and any other pertinent information related to depletion of residues of ractopamine in pig tissues. The Call for data was published on the JECFA websites 4 November 2009 with a deadline 15 December 2009 for submission of the full studies referred to by the People’s Republic of China. Three study reports were submitted to FAO by the Codex contact point of the People’s Republic of China on 20 December 2009. In addition, the full dossier previously submitted to the JECFA Secretariat for the evaluation of ractopamine was made available again by the sponsor of this veterinary drug. The People’s Republic of China submitted one additional report of an experimental study on ractopamine residues in pig tissues on 13 May 2010 and asked the JECFA Secretariat to consider the data in that report. Due to the urgency and specificity of the request for scientific advice from the 32nd CAC, and in view of the lack of time and resources to convene a regular JECFA meeting, the JECFA Secretariat at FAO and WHO agreed that a meeting in electronic format would be constituted to address the request. Ractopamine has been evaluated by JECFA at the fortieth, sixty-second and sixty-sixth meetings of the Committee. An ADI of 0 – 1 �g/ kg bodyweight was established at the sixty-second meeting and full MRLs were recommended for tissues of cattle and pigs. The MRL recommendations were confirmed by the sixty-sixth meeting of the Committee. The monograph addendum in this volume of the FAO JECFA Monographs on the residues of, exposure to and statements on the studies on ractopamine residues in pig tissues submitted were prepared by the invited experts for this electronic meeting of the Joint FAO/WHO Expert Committee on Food Additives (JECFA) during the period of January to May 2010. This was the twentieth meeting convened specifically to consider residues of veterinary drugs in food producing animal species. The Committee has evaluated residues of veterinary drugs at its 12th, 26th, 27th, 32nd, 34th, 36th, 38th, 40th, 42nd, 43rd, 45th, 47th, 48th, 50th, 52nd, 54th, 58th, 60th, 62nd, 66th and 70th meetings (ref. 1-15 and 18-23). The tasks for the Committee was to evaluate the three residue depletion studies on ractopamine in pig tissues submitted by the People’s Republic of China, consider any other relevant studies previously assessed in this context by the Committee, provide recommendations on whether the information contained in the three studies would have an impact on the MRLs for ractopamine in pig tissues previously recommended by JECFA and consider any other scientific issues arising from the evaluation of the studies. The additional study received in May 2010 was considered separately due to its late submission.
Background
In response to the growing use of veterinary medicines in food animal production systems internationally and the potential implications for human health and fair trading practices, a Joint FAO/WHO Expert Consultation on Residues of Veterinary Drugs was convened in Rome, November 1984 (ref. 16). One of the major recommendations of this consultation was the establishment of the Codex Committee on Residues of Veterinary Drugs in Foods (CCRVDF) and the periodic convening of an appropriate expert body to provide independent scientific advice to this Committee and to member countries of FAO and WHO. At its first session in Washington, DC in November 1986, the CCRVDF reaffirmed the need for such a scientific body and made a number of recommendations and suggestions to be considered by JECFA (ref. 17). In response to these recommendations, the 32nd JECFA meeting was devoted entirely to the evaluation of residues of veterinary drugs in food – a new responsibility for the Joint FAO/WHO Expert Committee on Food Additives. Nineteen such meetings of JECFA have been held prior to this meeting.
� x
On-line edition of Residues of some veterinary drugs in animals and foods (from FAO JECFA Monographs and FAO Food and Nutrition paper Number 41) The monographs and statements that have been published in the FAO JECFA Monographs 2 and 6 as well as those published in FAO Food and Nutrition Paper Series 41 (sixteen volumes since 1988) are all available online at http://www.fao.org/ag/agn/jecfa-vetdrugs/search.html. The search interface is available in five languages (Arabic, Chinese, English, French and Spanish) and allows searching for compounds, functional classes, ADI and MRL status. Contact and Feedback More information on the work of the Committee is available from the FAO homepage of JECFA at http://www.fao.org/ag/agn/agns/jecfa_index_en.asp . Readers are invited to address comments and questions on this publication and other topics related to the work of JECFA to:
� xi
REFERENCES
1. Specifications for the Identity and Purity of Food Additives and their Toxicological Evaluation: Some antibiotics (Twelfth Report of the Joint FAO/WHO Expert Committee on Food Additives), FAO Nutrition Meetings Report Series No. 45, 1969; WHO Technical Report Series No. 430, 1969.
2. Evaluation of Certain Food Additives and Contaminants (Twenty-Sixth Report of the Joint FAO/WHO Expert Committee on Food Additives). WHO Technical Report Series No. 683, 1982.
3. Evaluation of Certain Food Additives and Contaminants (Twenty-Seventh Report of the Joint FAO/WHO Expert Committee on Food Additives). WHO Technical Report Series No. 696, 1983.
4. Evaluation of Certain Veterinary Drug Residues in Foods (Thirty-Second Report of the Joint FAO/WHO Expert Committee on Food Additives). WHO Technical Report Series No. 763, 1988.
5. Evaluation of Certain Veterinary Drug Residues in Foods (Thirty-Fourth Report of the Joint FAO/WHO Expert Committee on Food Additives). WHO Technical Report Series No. 788, 1989.
6. Evaluation of Certain Veterinary Drug Residues in Foods (Thirty-Sixth Report of the Joint FAO/WHO Expert Committee on Food Additives). WHO Technical Report Series No. 799, 1990.
7. Evaluation of Certain Veterinary Drug Residues in Foods (Thirty-Eighth Report of the Joint FAO/WHO Expert Committee on Food Additives). WHO Technical Report Series No. 815, 1991.
8. Evaluation of Certain Veterinary Drug Residues in Foods (Fortieth Report of the Joint FAO/WHO Expert Committee on Food Additives). WHO Technical Report Series No. 832, 1993.
9. Evaluation of Certain Veterinary Drug Residues in Foods (Forty-second Report of the Joint FAO/WHO Expert Committee on Food Additives). WHO Technical Report Series No. 851, 1995.
10. Evaluation of Certain Veterinary Drug Residues in Foods (Forty-third Report of the Joint FAO/WHO Expert Committee on Food Additives). WHO Technical Report Series No. 855, 1995.
11. Evaluation of Certain Veterinary Drug Residues in Foods (Forty-fifth Report of the Joint FAO/WHO Expert Committee on Food Additives). WHO Technical Report Series No. 864, 1996.
12. Evaluation of Certain Veterinary Drug Residues in Foods (Forty-seventh Report of the Joint FAO/WHO Expert Committee on Food Additives). WHO Technical Report Series No. 876, 1998.
13. Evaluation of Certain Veterinary Drug Residues in Foods (Forty-eighth Report of the Joint FAO/WHO Expert Committee on Food Additives). WHO Technical Report Series No. 879, 1998.
14. Evaluation of Certain Veterinary Drug Residues in Foods (Fiftieth Report of the Joint FAO/WHO Expert Committee on Food Additives). WHO Technical Report Series No. 888, 1999.
15. Evaluation of Certain Veterinary Drug Residues in Foods (Fifty-second Report of the Joint FAO/WHO Expert Committee on Food Additives). WHO Technical Report Series No. 893, 2000.
16. Residues of Veterinary Drugs in Foods, Report of a Joint FAO/WHO Consultation, Rome, 29 October - 5 November 1984. FAO Food and Nutrition Paper No. 32, 1985.
17. Report of the First Session of the Codex Committee on Residues of Veterinary Drugs in Foods. Washington, D.C., 27-31, October 1986.
18. Evaluation of Certain Veterinary Drug Residues in Foods (Fifty-fourth Report of the Joint FAO/WHO Expert Committee on Food Additives). WHO Technical Report Series No. 900, 2001.
� xii
19. Evaluation of Certain Veterinary Drug Residues in Foods (Fifty-eighth report of the Joint FAO/WHO Expert Committee on Food Additives). WHO Technical Report Series No. 900, 2001.
20. Evaluation of Certain Veterinary Drug Residues in Foods (Sixtieth report of the Joint FAO/WHO Expert Committee on Food Additives). WHO Technical Report Series, No. 918, 2003.
21. Evaluation of Certain Veterinary Drug Residues in Animals and Foods (Sixty-second report of the Joint FAO/WHO Expert Committee on Food Additives). WHO Technical Report Series, No. 925, 2004.
22. Evaluation of Certain Veterinary Drug Residues in Animals and Foods (Sixty-sixth report of the Joint FAO/WHO Expert Committee on Food Additives). WHO Technical Report Series, No. 939, 2006.
23. Evaluation of Certain Veterinary Drug Residues in Animals and Foods (Seventieth report of the Joint FAO/WHO Expert Committee on Food Additives). WHO Technical Report Series, No. 954, 2009).
�
�
�
�
�
�
�
�
�
�
�
�
�
�
Addendum in FAO Foo
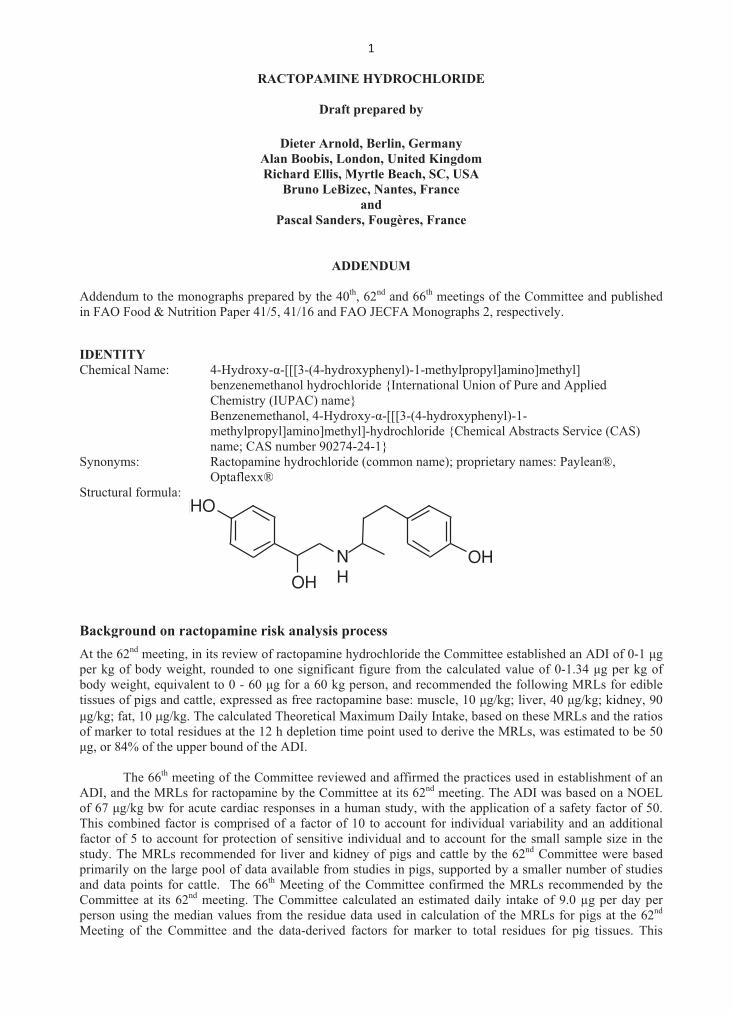
IDENTITY
Chemical N
Synonyms:
Structural fo
Backgroun
At the 62nd per kg of bbody weightissues of p
g/kg; fat, 1of marker to
g, or 84%
TheADI, and thof 67 g/kgThis combifactor of 5 study. The primarily onand data poCommittee person usinMeeting of
to the monood & Nutritio
Y
Name:
formula:
nd on racto
meeting, in ibody weight, ht, equivalenigs and cattl10 g/kg. Tho total residuof the upper
e 66th meetinhe MRLs forg bw for acuned factor isto account fMRLs recomn the large points for cattat its 62nd m
ng the mediaf the Commi
RA
Al
R
ographs prepon Paper 41/5
4-Hydroxy-benzenemetChemistry (Benzenememethylpropname; CASRactopaminOptaflexx®
opamine ri
its review ofrounded to
t to 0 - 60 le, expressedhe calculatedues at the 12r bound of th
ng of the Comr ractopaminute cardiac res comprised for protectionmmended fopool of data tle. The 66th
meeting. Thean values froittee and the
ACTOPAM
Dra
Dieter Arn
lan Boobis,
Richard Ellis
Bruno Le
Pascal San
A
ared by the 5, 41/16 and
- -[[[3-(4-hythanol hydro(IUPAC) namethanol, 4-Hypyl]amino]meS number 902ne hydrochlo
®
sk analysis
f ractopaminone significg for a 60 k
d as free ractd Theoretical 2 h depletion he ADI.
mmittee revine by the Comesponses in aof a factor
n of sensitivr liver and kavailable froh Meeting ofe Committeeom the residue data-derive
1
INE HYDR
aft prepared
nold, Berlin
London, Un
s, Myrtle Be
eBizec, Nant
and
nders, Fougè
ADDENDUM
40th, 62nd and FAO JECFA
ydroxyphenyochloride {Inme} ydroxy- -[[[3ethyl]-hydro274-24-1} oride (commo
s process
e hydrochlorcant figure frkg person, anopamine basMaximum Dtime point u
iewed and afmmittee at ita human studof 10 to acc
ve individualkidney of pigom studies inf the Comm
e calculated ue data useded factors fo
ROCHLORI
d by
, Germany
nited Kingdo
each, SC, US
tes, France
ères, France
M
nd 66th meetinA Monograp
l)-1-methylpnternational U
3-(4-hydroxychloride {Ch
on name); pr
ride the Comrom the calcnd recommense: muscle, 1Daily Intake,used to deriv
ffirmed the pts 62nd meetidy, with the
count for ind and to accogs and cattlen pigs, suppo
mittee confirman estimated
d in calculatior marker to
DE
om
SA
ngs of the Cphs 2, respect
propyl]aminoUnion of Pur
yphenyl)-1- hemical Abst
roprietary na
mmittee estabculated valuended the foll10 g/kg; liv, based on thve the MRLs
practices useing. The ADapplication
dividual variaount for the e by the 62nd
orted by a smmed the MRLd daily intakon of the M
o total residu
Committee antively.
o]methyl] re and Applie
tracts Servic
ames: Paylean
blished an ADe of 0-1.34 lowing MRL
ver, 40 g/kghese MRLs as, was estima
ed in establisDI was based
of a safety fability and asmall sampld Committeemaller numbLs recomme
ke of 9.0 g MRLs for pig
ues for pig t
nd published
ed
e (CAS)
n®,
DI of 0-1 gg per kg of
Ls for edibleg; kidney, 90nd the ratios
ated to be 50
shment of anon a NOEL
factor of 50.an additionale size in the
e were baseder of studies
ended by theper day per
s at the 62nd
tissues. This
d
g f e 0 s 0
n L . l e d s e r d s
HO
OH
OHNH
grafico_Layout 1 12/07/10 12:03 Pagina 1

2�
��
estimate is well below the ADI. Based on this evaluation, the 17th Session of CCRVDF, held in 2007, agreed to forward the proposed MRLs for ractopamine in pig and cattle tissues for adoption to the Codex Alimentarius Commission (CAC).
The government of the People’s Republic of China had decided to conduct a comprehensive evaluation of the human health risk from food of animal origin through the use of ractopamine, because of concern about residue levels in different pig breeds and different farming methods in China. A summary of the test results from three residue depletion studies in pigs was submitted to the 18th Session of CCRVDF held in 2009. The Delegation of the People’s Republic of China particularly expressed concern over the residue levels in lung, stomach, heart, large and small intestine as well as at early time points after withdrawal of medicated feed. The Delegation was of the view that such animal organs are important components of the diet for most consumers in Asian countries, including China.
The summary of the results of the three residue studies was also presented to the 32nd CAC held in 2009. Based at least in part on comments submitted by the People’s Republic of China, the 32nd CAC requested FAO and WHO to request JECFA to undertake a review of new data on residues of ractopamine in pig tissues and to consider whether these data would have any implication on the recommended MRLs for ractopamine in pig tissues, accordingly. Subsequent to the 32nd Session of the CAC, People’s Republic of China provided the detailed study reports of the three independent residue depletion studies to the JECFA Secretariat. New residue studies in the pig
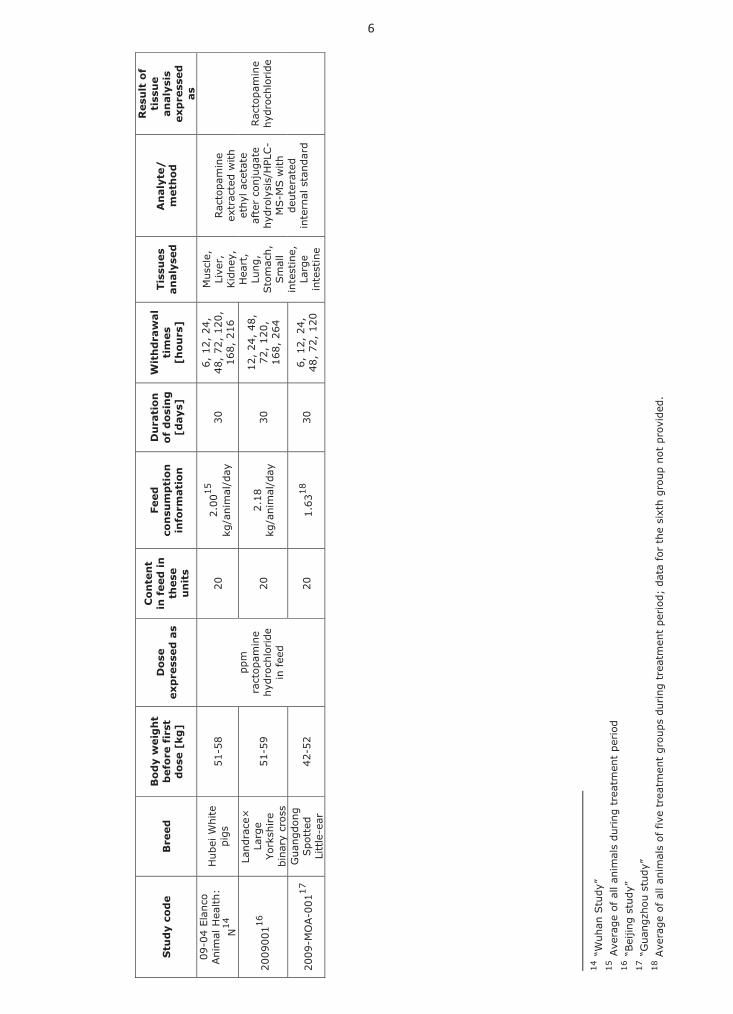
In the three new ractopamine residue depletion studies, different breeds of pigs and different feeding methods were used and they were carried out at three different national laboratories, located in Wuhan, Guangzhou and Beijing. The studies are referred to in this monograph as the three new studies and individually by the location in which the respective studies were carried out. The ractopamine residues in tissues collected were all analyzed using a deconjugation step prior to analysis.
In the study performed in Wuhan (Study no. 09-04 Elanco Animal Health: N), 40 Hubei White Swine were weighed and divided into 8 groups, each group comprising five animals. All pigs received a dose of approximately 20 mg ractopamine HCl per kg medicated animal feed daily for 30 days. (Summary results of the feeding regime are provided below in table 1). An additional group of eight animals served as controls. Five animals were slaughtered at 6, 12 hours, and 1, 2, 3, 5, 7 and 9 days following withdrawal of medicated feed. Muscle, liver, kidney, heart, lung, stomach, large intestine and small intestine were collected and analyzed. The results demonstrated that the ractopamine residue concentrations in liver, kidney, lung, and small intestine were greater than in the other tissues. Residue concentrations in the lung were greater than those in the liver and kidney, and were detected up to nine days following removal of medicated feed. Residues in muscle were below 10 �g/kg at 24 h, but were detectable for five days following removal of medicated feed. Residues in the liver were between 63 and 106 �g/kg at 12h, and one was greater than 40 �g/kg at 24 h following removal of medicated feed, and were detectable for up to five days. Residues in the kidney were highly variable, from 178 and 374 �g/kg at 12h, and one remained greater than 90 �g/kg at 24 h following the withdrawal time, and could be detected up to seven days following the withdrawal time.
In the study performed in Guangzhou (Study no. 2009-MOA-001), 30 Spotted Small-ear pigs were weighed and divided into six groups, each comprising five animals. All pigs received a daily dose at a rate of approximately 20 mg ractopamine HCl per kg medicated animal feed for 30 days. An additional group of six animals served as a control group. Animals were slaughtered 6, 12 hours, and 1, 2, 3 and 5 days after treatment. Samples of muscle, liver, kidney, heart, lung, stomach, large intestine and, small intestine, were collected from all treated and control animals. The results showed that the distribution of ractopamine demonstrated tissue selectivity in the pig, with the highest residue concentrations at 12 h in kidney, with the lung containing the second highest concentrations, followed by stomach, liver, small intestine, large intestine and muscle. The study showed that the mean ractopamine residue level in liver after 6 h and the mean ractopamine residue levels in kidney after 6 h and 12 h were all above 40 �g/kg for liver and 90 �g/kg for kidney. Ractopamine residues in the lung depleted slowly.
3�
��
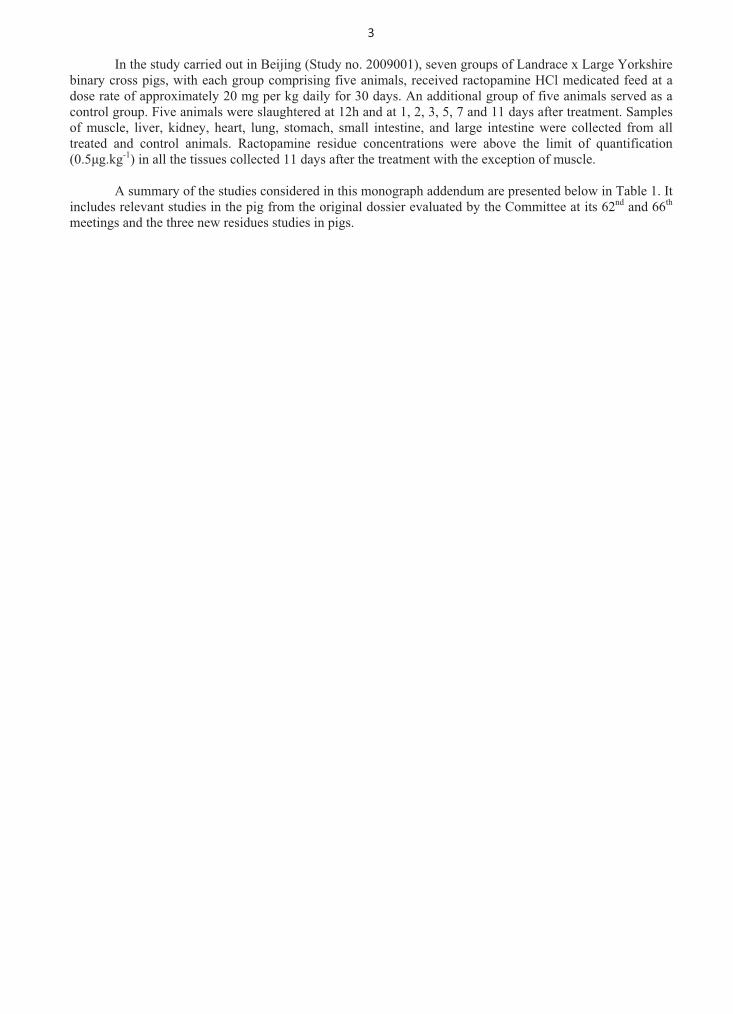
In the study carried out in Beijing (Study no. 2009001), seven groups of Landrace x Large Yorkshire binary cross pigs, with each group comprising five animals, received ractopamine HCl medicated feed at a dose rate of approximately 20 mg per kg daily for 30 days. An additional group of five animals served as a control group. Five animals were slaughtered at 12h and at 1, 2, 3, 5, 7 and 11 days after treatment. Samples of muscle, liver, kidney, heart, lung, stomach, small intestine, and large intestine were collected from all treated and control animals. Ractopamine residue concentrations were above the limit of quantification (0.5�g.kg-1) in all the tissues collected 11 days after the treatment with the exception of muscle.
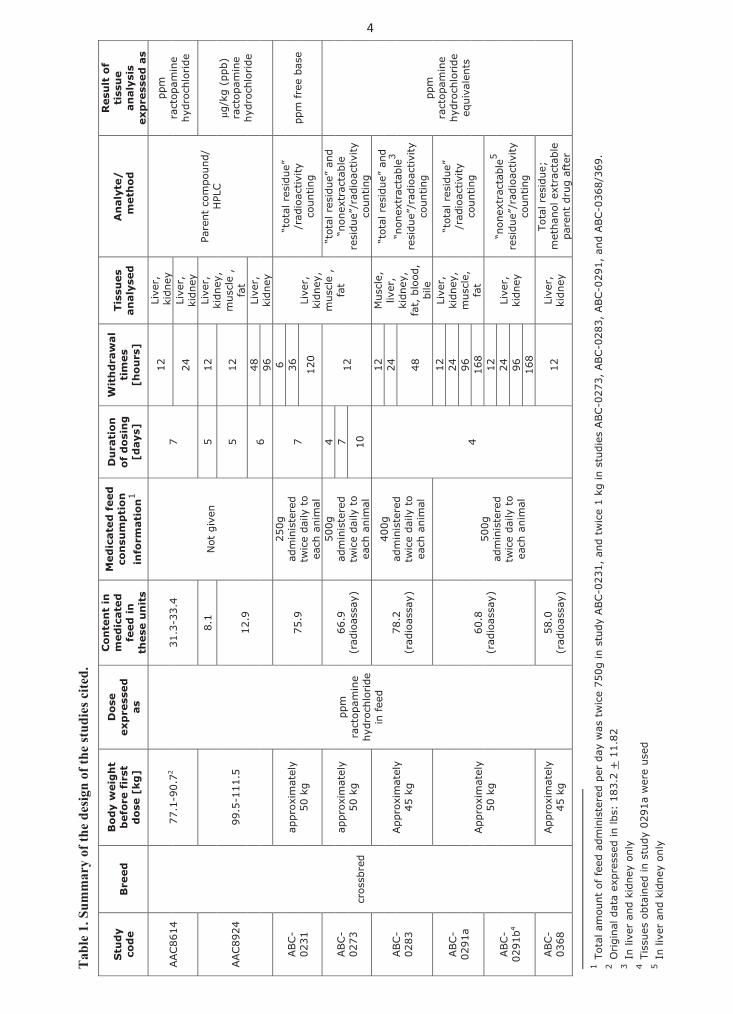
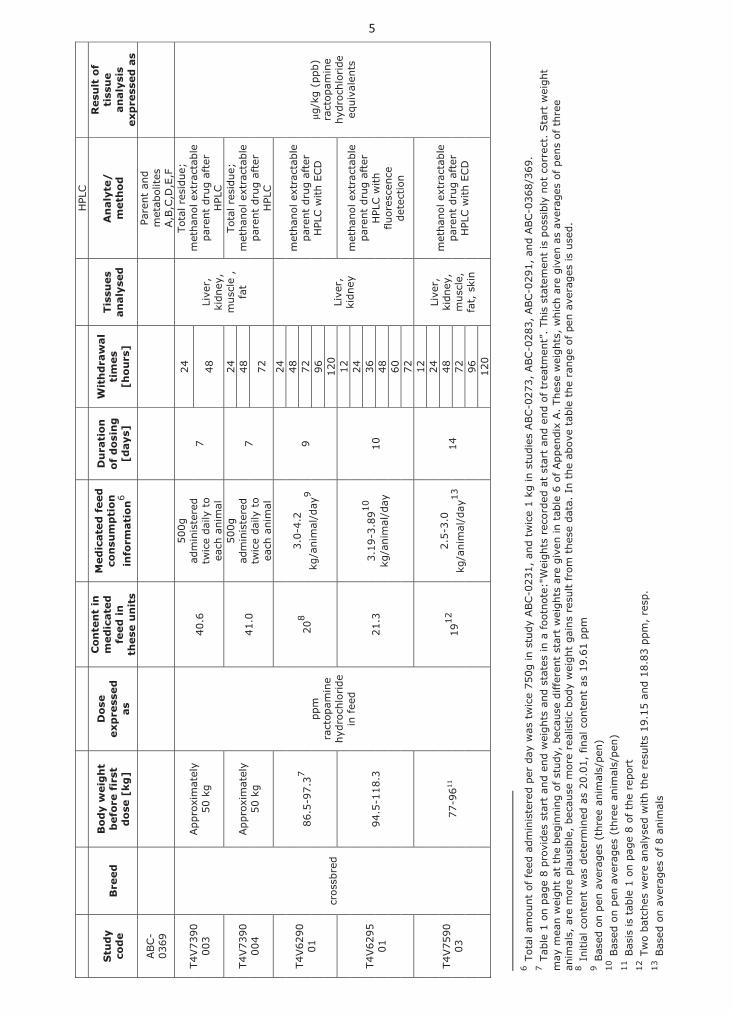
A summary of the studies considered in this monograph addendum are presented below in Table 1. It includes relevant studies in the pig from the original dossier evaluated by the Committee at its 62nd and 66th meetings and the three new residues studies in pigs.
4
Ta
ble
1.
Su
mm
ary
of
the
des
ign
of
the
stu
die
s ci
ted
.
Stu
dy
cod
e
Bre
ed
B
od
y w
eig
ht
befo
re f
irst
d
ose
[kg
]
Do
se
exp
ress
ed
as
Co
nte
nt
in
med
icate
d
feed
in
th
ese
un
its
Med
icate
d f
eed
co
nsu
mp
tio
n
info
rmati
on
1
Du
rati
on
o
f d
osi
ng
[d
ays
]
Wit
hd
raw
al
tim
es
[ho
urs
]
Tis
sues
an
aly
sed
A
naly
te/
m
eth
od
Resu
lt o
f ti
ssu
e
an
aly
sis
exp
ress
ed
as
AAC86
14
cros
sbre
d
77.1
-90.
72
ppm
ra
ctop
amin
e hy
droc
hlor
ide
in f
eed
31.3
-33.
4
Not
giv
en
7 12
Li
ver,
k
idne
y
Pare
nt c
ompo
und/
H
PLC
ppm
ra
ctop
amin
e hy
droc
hlor
ide
24
Live
r,
kidn
ey
AAC89
24
99.5
-111
.5
21 5
1.8Li
ver,
ki
dney
, m
uscl
e ,
fat
μg/k
g (p
pb)
ract
opam
ine
hydr
ochl
orid
e 12
.9
5 12
6 48
Li
ver,
ki
dney
96
ABC-
0231
ap
prox
imat
ely
50 k
g 75
.9
250g
ad
min
iste
red
twic
e da
ily t
o ea
ch a
nim
al
7
6
Live
r,
kidn
ey,
mus
cle
, fa
t
“tot
al r
esid
ue”
/rad
ioac
tivi
ty
coun
ting
pp
m f
ree
base
36
120
ABC-
0273
ap
prox
imat
ely
50 k
g 66
.9
(rad
ioas
say)
500g
ad
min
iste
red
twic
e da
ily t
o ea
ch a
nim
al
4
12
“tot
al r
esid
ue”
and
“non
extr
acta
ble
resi
due”
/rad
ioac
tivi
ty
coun
ting
ppm
ra
ctop
amin
e hy
droc
hlor
ide
equi
vale
nts
7 10
ABC-
0283
App
roxi
mat
ely
45 k
g 78
.2
(rad
ioas
say)
400g
ad
min
iste
red
twic
e da
ily t
o ea
ch a
nim
al
4
12
Mus
cle,
liv
er,
kidn
ey,
fat,
blo
od,
bile
“tot
al r
esid
ue”
and
“non
extr
acta
ble3
resi
due”
/rad
ioac
tivi
ty
coun
ting
24
48
ABC-
0291
a App
roxi
mat
ely
50 k
g 60
.8
(rad
ioas
say)
50
0g
adm
inis
tere
d tw
ice
daily
to
each
ani
mal
12
Live
r,
kidn
ey,
mus
cle,
fa
t
“tot
al r
esid
ue”
/rad
ioac
tivi
ty
coun
ting
24
96
168
ABC-
0291
b4
12
Live
r,
kidn
ey
“non
extr
acta
ble5
resi
due”
/rad
ioac
tivi
ty
coun
ting
24
96
168
ABC-
0368
App
roxi
mat
ely
45 k
g 58
.0
(rad
ioas
say)
12
Li
ver,
ki
dney
Tota
l res
idue
;
met
hano
l ext
ract
able
pa
rent
dru
g af
ter
1 To
tal a
mou
nt o
f fe
ed a
dmin
iste
red
per
day
was
tw
ice
750g
in s
tudy
ABC
-023
1, a
nd t
wic
e 1
kg in
stu
dies
ABC
-027
3, A
BC-0
283,
ABC-0
291,
and
ABC-0
368/
369.
2
Origi
nal d
ata
expr
esse
d in
lbs:
183
.2 +
11.
82
3 In
live
r an
d ki
dney
onl
y 4
Tiss
ues
obta
ined
in s
tudy
029
1a w
ere
used
5
In li
ver
and
kidn
ey o
nly
5
HPL
C
Stu
dy
cod
e
Bre
ed
B
od
y w
eig
ht
befo
re f
irst
d
ose
[kg
]
Do
se
exp
ress
ed
as
Co
nte
nt
in
med
icate
d
feed
in
th
ese
un
its
Med
icate
d f
eed
co
nsu
mp
tio
n
info
rmati
on
6
Du
rati
on
o
f d
osi
ng
[d
ays
]
Wit
hd
raw
al
tim
es
[ho
urs
]
Tis
sues
an
aly
sed
A
naly
te/
m
eth
od
Resu
lt o
f ti
ssu
e
an
aly
sis
exp
ress
ed
as
ABC-
0369
Pa
rent
and
m
etab
olites
A,B
,C,D
,E,F
T4V73
9000
3
cros
sbre
d
App
roxi
mat
ely
50 k
g
ppm
ra
ctop
amin
e hy
droc
hlor
ide
in f
eed
40.6
500g
ad
min
iste
red
twic
e da
ily t
o ea
ch a
nim
al
7 24
Live
r,
kidn
ey,
mus
cle
, fa
t
Tota
l res
idue
;
met
hano
l ext
ract
able
pa
rent
dru
g af
ter
HPL
C
μg/k
g (p
pb)
ract
opam
ine
hydr
ochl
orid
e eq
uiva
lent
s
48
T4V73
9000
4 App
roxi
mat
ely
50 k
g 41
.0
500g
ad
min
iste
red
twic
e da
ily t
o ea
ch a
nim
al
7
24
Tota
l res
idue
;
met
hano
l ext
ract
able
pa
rent
dru
g af
ter
HPL
C
48
72
T4V62
9001
86
.5-9
7.37
02
8 3.
0-4.
2 kg
/ani
mal
/day
9 9
24
Live
r,
kidn
ey
met
hano
l ext
ract
able
pa
rent
dru
g af
ter
HPL
C w
ith
ECD
48
72
96
120
T4V62
9501
3.12
3.811-5.493.
19-3
.8910
kg
/ani
mal
/day
10
12
met
hano
l ext
ract
able
pa
rent
dru
g af
ter
HPL
C w
ith
fluor
esce
nce
dete
ctio
n
24
36
48
60
72
T4V75
9003
77
-9611
19
12
2.5-
3.0
kg/a
nim
al/d
ay13
14
12
Live
r,
kidn
ey,
mus
cle,
fa
t, s
kin
met
hano
l ext
ract
able
pa
rent
dru
g af
ter
HPL
C w
ith
ECD
24
48
72
96
120
6 To
tal a
mou
nt o
f fe
ed a
dmin
iste
red
per
day
was
tw
ice
750g
in s
tudy
ABC
-023
1, a
nd t
wic
e 1
kg in
stu
dies
ABC
-027
3, A
BC-0
283,
ABC-0
291,
and
ABC-0
368/
369.
7
Tabl
e 1
on p
age
8 pr
ovid
es s
tart
and
end
wei
ghts
and
sta
tes
in a
foo
tnot
e:"W
eigh
ts r
ecor
ded
at s
tart
and
end
of
trea
tmen
t”.
This
sta
tem
ent
is p
ossi
bly
not
corr
ect.
Sta
rt w
eigh
t m
ay m
ean
wei
ght
at t
he b
egin
ning
of
stud
y, b
ecau
se d
iffer
ent
star
t w
eigh
ts a
re g
iven
in t
able
6 o
f App
endi
x A.
Thes
e w
eigh
ts,
whi
ch a
re g
iven
as
aver
ages
of
pens
of
thre
e an
imal
s, a
re m
ore
plau
sibl
e, b
ecau
se m
ore
real
istic
body
wei
ght
gain
s re
sult f
rom
the
se d
ata.
In
the
abov
e ta
ble
the
rang
e of
pen
ave
rage
s is
use
d.
8 In
itia
l con
tent
was
det
erm
ined
as
20.0
1, f
inal
con
tent
as
19.6
1 pp
m
9 Bas
ed o
n pe
n av
erag
es (
thre
e an
imal
s/pe
n)
10 B
ased
on
pen
aver
ages
(th
ree
anim
als/
pen)
11
Bas
is is
tab
le 1
on
page
8 o
f th
e re
port
12 T
wo
batc
hes
wer
e an
alys
ed w
ith
the
resu
lts
19.1
5 an
d 18
.83
ppm
, re
sp.
13 B
ased
on
aver
ages
of
8 an
imal
s
6
Stu
dy
cod
e
Bre
ed
B
od
y w
eig
ht
befo
re f
irst
d
ose
[kg
]
Do
se
exp
ress
ed
as
Co
nte
nt
in f
eed
in
th
ese
u
nit
s
Feed
co
nsu
mp
tio
n
info
rmati
on
Du
rati
on
o
f d
osi
ng
[d
ays
]
Wit
hd
raw
al
tim
es
[ho
urs
]
Tis
sues
an
aly
sed
A
naly
te/
m
eth
od
Resu
lt o
f ti
ssu
e
an
aly
sis
exp
ress
ed
as
09-0
4 El
anco
Ani
mal
Hea
lth:
N
14
Hub
ei W
hite
pi
gs
51-5
8
ppm
ra
ctop
amin
e hy
droc
hlor
ide
in f
eed
20
2.00
15
kg/a
nim
al/d
ay
30
6, 1
2, 2
4,
48,
72,
120,
16
8, 2
16
Mus
cle,
Li
ver,
Kid
ney,
H
eart
, Lu
ng,
Sto
mac
h,
Sm
all
inte
stin
e,
Larg
e in
test
ine
Rac
topa
min
e ex
trac
ted
with
ethy
l ace
tate
af
ter
conj
ugat
e hy
drol
ysis
/HPL
C-
MS-M
S w
ith
deut
erat
ed
inte
rnal
sta
ndar
d
Rac
topa
min
e hy
droc
hlor
ide
2009
00116
Land
race
×
Larg
e Yo
rksh
ire
bina
ry c
ross
02 95-15
2.18
kg
/ani
mal
/day
30
12
, 24
, 48
, 72
, 12
0,
168,
264
2009
-MO
A-0
0117
G
uang
dong
Spo
tted
Li
ttle
-ear
02
25-241.
6318
30
6,
12,
24,
48
, 72
, 12
0
14 “
Wuh
an S
tudy
” 15
Ave
rage
of
all a
nim
als
duri
ng t
reat
men
t pe
riod
16
“Bei
jing
stud
y”
17 “
Gua
ngzh
ou s
tudy
” 18
Ave
rage
of
all a
nim
als
of f
ive
trea
tmen
t gr
oups
dur
ing
trea
tmen
t pe
riod
; da
ta f
or t
he s
ixth
gro
up n
ot p
rovi
ded.
7�
��
A “Meta-Analysis” of residue data for ractopamine in swine
Starting point
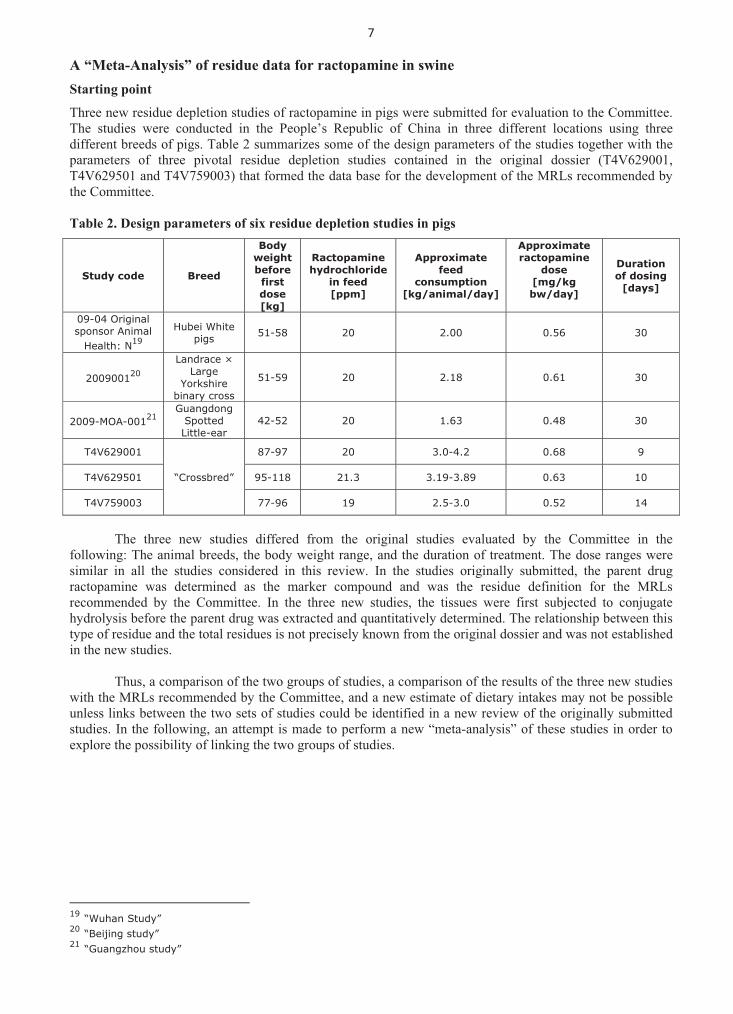
Three new residue depletion studies of ractopamine in pigs were submitted for evaluation to the Committee. The studies were conducted in the People’s Republic of China in three different locations using three different breeds of pigs. Table 2 summarizes some of the design parameters of the studies together with the parameters of three pivotal residue depletion studies contained in the original dossier (T4V629001, T4V629501 and T4V759003) that formed the data base for the development of the MRLs recommended by the Committee. Table 2. Design parameters of six residue depletion studies in pigs
Study code Breed
Body weight before first dose [kg]
Ractopamine hydrochloride
in feed [ppm]
Approximate feed
consumption [kg/animal/day]
Approximate ractopamine
dose [mg/kg bw/day]
Duration of dosing
[days]
09-04 Original sponsor Animal
Health: N19
Hubei White pigs 51-58 20 2.00 0.56 30
200900120
Landrace × Large
Yorkshire binary cross
51-59 20 2.18 0.61 30
2009-MOA-00121 Guangdong
Spotted Little-ear
42-52 20 1.63 0.48 30
T4V629001
“Crossbred”
87-97 20 3.0-4.2 0.68 9
T4V629501 95-118 21.3 3.19-3.89 0.63 10
T4V759003 77-96 19 2.5-3.0 0.52 14
The three new studies differed from the original studies evaluated by the Committee in the
following: The animal breeds, the body weight range, and the duration of treatment. The dose ranges were similar in all the studies considered in this review. In the studies originally submitted, the parent drug ractopamine was determined as the marker compound and was the residue definition for the MRLs recommended by the Committee. In the three new studies, the tissues were first subjected to conjugate hydrolysis before the parent drug was extracted and quantitatively determined. The relationship between this type of residue and the total residues is not precisely known from the original dossier and was not established in the new studies.
Thus, a comparison of the two groups of studies, a comparison of the results of the three new studies
with the MRLs recommended by the Committee, and a new estimate of dietary intakes may not be possible unless links between the two sets of studies could be identified in a new review of the originally submitted studies. In the following, an attempt is made to perform a new “meta-analysis” of these studies in order to explore the possibility of linking the two groups of studies.
������������������������������������������������������������19 “Wuhan Study” 20 “Beijing study” 21 “Guangzhou study”
8�
��
1
10
100
1000
0 5 10 15 20 25 30con
cen
trati
on
of
ract
op
am
ine
in t
issu
es
[�g
/kg
]
Content of ractopamine in feed [ppm]
Residue concentration as function of dose
Liver Kidney Muscleregression liver regression kidney
1. Is it possible to establish a mathematical relationship between the dose administered to animals
and the observed residue concentrations in tissues?
1.1. Studies in the original dossier for which only the amount of ractopamine in animal feed is
known.
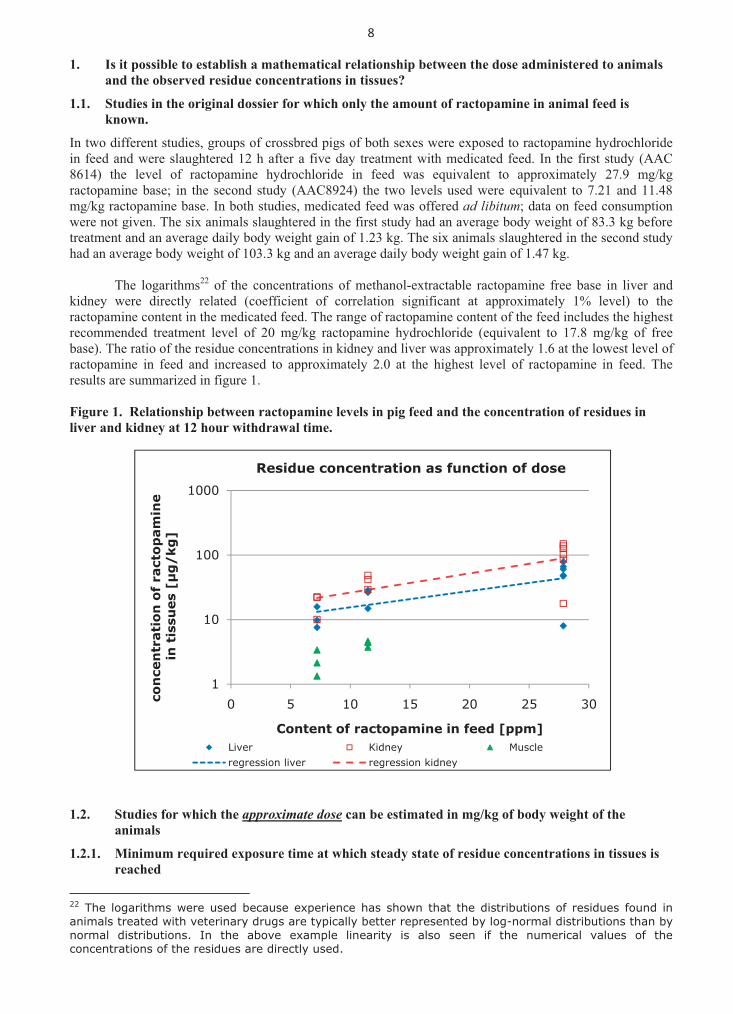
In two different studies, groups of crossbred pigs of both sexes were exposed to ractopamine hydrochloride in feed and were slaughtered 12 h after a five day treatment with medicated feed. In the first study (AAC 8614) the level of ractopamine hydrochloride in feed was equivalent to approximately 27.9 mg/kg ractopamine base; in the second study (AAC8924) the two levels used were equivalent to 7.21 and 11.48 mg/kg ractopamine base. In both studies, medicated feed was offered ad libitum; data on feed consumption were not given. The six animals slaughtered in the first study had an average body weight of 83.3 kg before treatment and an average daily body weight gain of 1.23 kg. The six animals slaughtered in the second study had an average body weight of 103.3 kg and an average daily body weight gain of 1.47 kg.
The logarithms22 of the concentrations of methanol-extractable ractopamine free base in liver and
kidney were directly related (coefficient of correlation significant at approximately 1% level) to the ractopamine content in the medicated feed. The range of ractopamine content of the feed includes the highest recommended treatment level of 20 mg/kg ractopamine hydrochloride (equivalent to 17.8 mg/kg of free base). The ratio of the residue concentrations in kidney and liver was approximately 1.6 at the lowest level of ractopamine in feed and increased to approximately 2.0 at the highest level of ractopamine in feed. The results are summarized in figure 1.
Figure 1. Relationship between ractopamine levels in pig feed and the concentration of residues in
liver and kidney at 12 hour withdrawal time.
1.2. Studies for which the approximate dose can be estimated in mg/kg of body weight of the
animals
1.2.1. Minimum required exposure time at which steady state of residue concentrations in tissues is
reached
������������������������������������������������������������22 The logarithms were used because experience has shown that the distributions of residues found in animals treated with veterinary drugs are typically better represented by log-normal distributions than by normal distributions. In the above example linearity is also seen if the numerical values of the concentrations of the residues are directly used.
9�
��
100
1000
0 2 4 6 8 10 12
tota
l re
sid
ue
[�g
ract
op
am
ine e
qu
ivale
nts
/kg
]
Period of exposure to dose [days]
Liver, total residue Kidney, total residueLiver, tot. res., geomean Kidney, tot. res., geomean
10
15
20
25
30
35
40
0 2 4 6 8 10 12
No
nextr
act
ab
le r
esi
du
e[%
of
tota
l re
sid
ue]
Period of exposure to dose [days]
liver, nonextractable kidney, nonextractableliver, geomean, nonextr. kidney, geomean, nonextr.
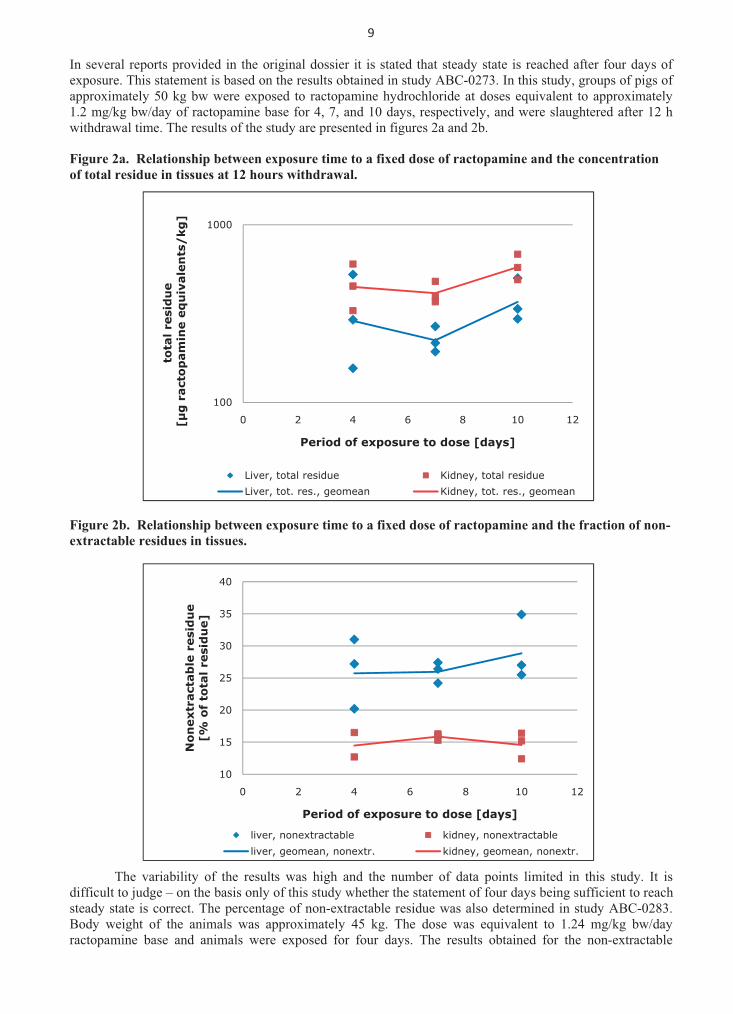
In several reports provided in the original dossier it is stated that steady state is reached after four days of exposure. This statement is based on the results obtained in study ABC-0273. In this study, groups of pigs of approximately 50 kg bw were exposed to ractopamine hydrochloride at doses equivalent to approximately 1.2 mg/kg bw/day of ractopamine base for 4, 7, and 10 days, respectively, and were slaughtered after 12 h withdrawal time. The results of the study are presented in figures 2a and 2b.
Figure 2a. Relationship between exposure time to a fixed dose of ractopamine and the concentration
of total residue in tissues at 12 hours withdrawal.
Figure 2b. Relationship between exposure time to a fixed dose of ractopamine and the fraction of non-
extractable residues in tissues.
The variability of the results was high and the number of data points limited in this study. It is difficult to judge – on the basis only of this study whether the statement of four days being sufficient to reach steady state is correct. The percentage of non-extractable residue was also determined in study ABC-0283. Body weight of the animals was approximately 45 kg. The dose was equivalent to 1.24 mg/kg bw/day ractopamine base and animals were exposed for four days. The results obtained for the non-extractable
10�
��
0
10
20
30
40
50
60
70
0 20 40 60
No
nextr
act
ab
le r
esi
du
e%
of
tota
l re
sid
ue
Withdrawal time [hours]
Kidney
Liver
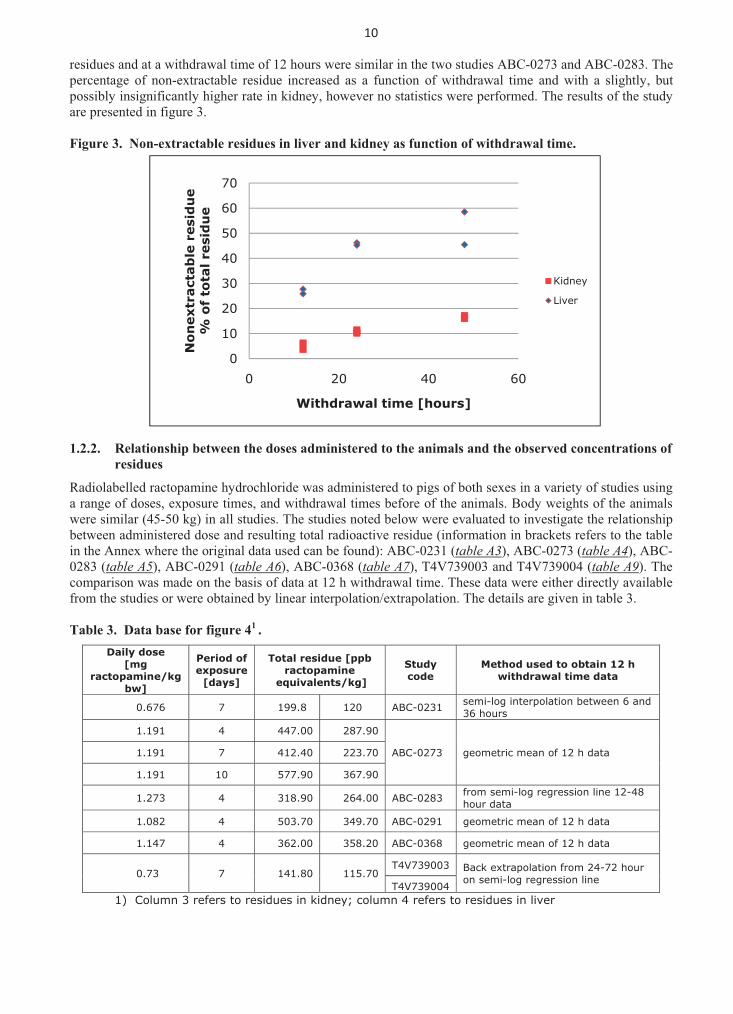
residues and at a withdrawal time of 12 hours were similar in the two studies ABC-0273 and ABC-0283. The percentage of non-extractable residue increased as a function of withdrawal time and with a slightly, but possibly insignificantly higher rate in kidney, however no statistics were performed. The results of the study are presented in figure 3.
Figure 3. Non-extractable residues in liver and kidney as function of withdrawal time.
1.2.2. Relationship between the doses administered to the animals and the observed concentrations of
residues
Radiolabelled ractopamine hydrochloride was administered to pigs of both sexes in a variety of studies using a range of doses, exposure times, and withdrawal times before of the animals. Body weights of the animals were similar (45-50 kg) in all studies. The studies noted below were evaluated to investigate the relationship between administered dose and resulting total radioactive residue (information in brackets refers to the table in the Annex where the original data used can be found): ABC-0231 (table A3), ABC-0273 (table A4), ABC-0283 (table A5), ABC-0291 (table A6), ABC-0368 (table A7), T4V739003 and T4V739004 (table A9). The comparison was made on the basis of data at 12 h withdrawal time. These data were either directly available from the studies or were obtained by linear interpolation/extrapolation. The details are given in table 3. Table 3. Data base for figure 4
1 .
Daily dose [mg
ractopamine/kg bw]
Period of exposure
[days]
Total residue [ppb ractopamine
equivalents/kg]
Study code
Method used to obtain 12 h withdrawal time data
0.676 7 199.8 120 ABC-0231 semi-log interpolation between 6 and 36 hours
1.191 4 447.00 287.90
ABC-0273 geometric mean of 12 h data 1.191 7 412.40 223.70
1.191 10 577.90 367.90
1.273 4 318.90 264.00 ABC-0283 from semi-log regression line 12-48 hour data
1.082 4 503.70 349.70 ABC-0291 geometric mean of 12 h data
1.147 4 362.00 358.20 ABC-0368 geometric mean of 12 h data
0.73 7 141.80 115.70 T4V739003 Back extrapolation from 24-72 hour
on semi-log regression line T4V739004
1) Column 3 refers to residues in kidney; column 4 refers to residues in liver
11�
��
100
1000
0 0.5 1 1.5
tota
l re
sid
ue
�g
ract
op
am
ine
eq
uiv
ale
nts
/kg
daily dose [mg/kg bw]
kidney liver liver kidney
1
10
100
0 0.5 1 1.5Co
nce
ntr
ati
on
of
ract
op
am
ine
[�g
/kg
]
Daily dose [mg/kg bw]
Liver Kidney Liver kidney
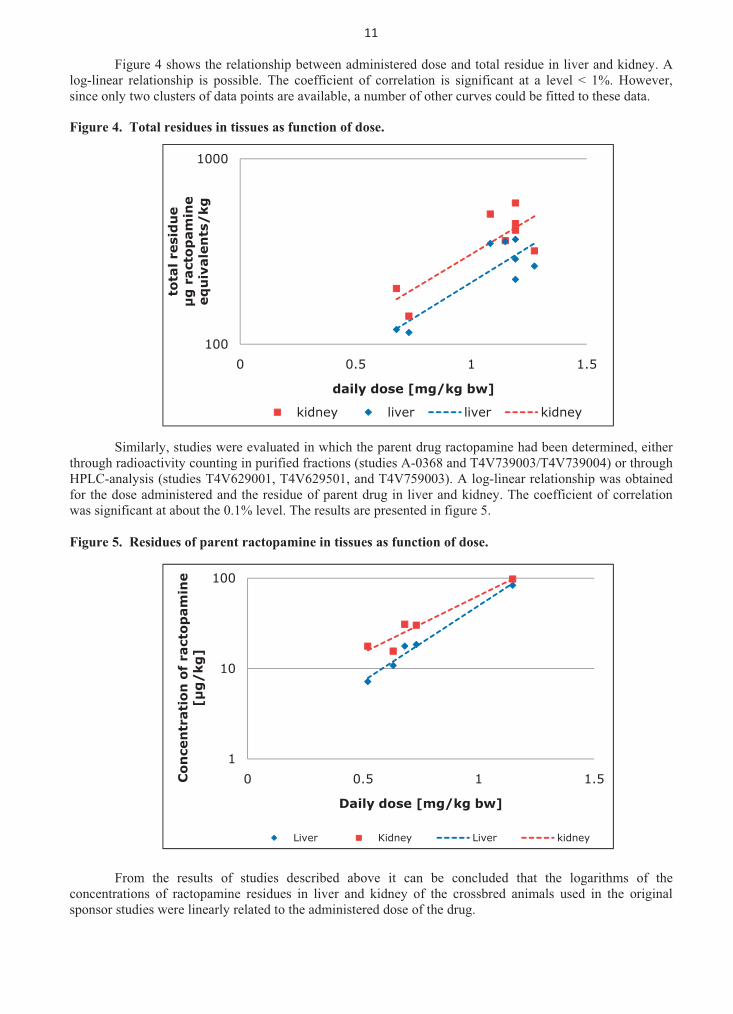
Figure 4 shows the relationship between administered dose and total residue in liver and kidney. A log-linear relationship is possible. The coefficient of correlation is significant at a level < 1%. However, since only two clusters of data points are available, a number of other curves could be fitted to these data.
Figure 4. Total residues in tissues as function of dose.
Similarly, studies were evaluated in which the parent drug ractopamine had been determined, either
through radioactivity counting in purified fractions (studies A-0368 and T4V739003/T4V739004) or through HPLC-analysis (studies T4V629001, T4V629501, and T4V759003). A log-linear relationship was obtained for the dose administered and the residue of parent drug in liver and kidney. The coefficient of correlation was significant at about the 0.1% level. The results are presented in figure 5.
Figure 5. Residues of parent ractopamine in tissues as function of dose. From the results of studies described above it can be concluded that the logarithms of the
concentrations of ractopamine residues in liver and kidney of the crossbred animals used in the original sponsor studies were linearly related to the administered dose of the drug.
12�
��
0
0.05
0.1
0.15
0.2
0.25
0.3
0.35
0.4
0.45
0 20 40 60 80
rati
o m
ark
er
to t
ota
l re
sid
ue
Withdrawal time [hours]
Liver T4V739004 Liver T4V739003regression liver extrapolation liverKidney T4V739004 kidney T4V739003regression kidney extrapolation kidney
2. Relationship between different marker residues and total residue in tissues in the three
new studies
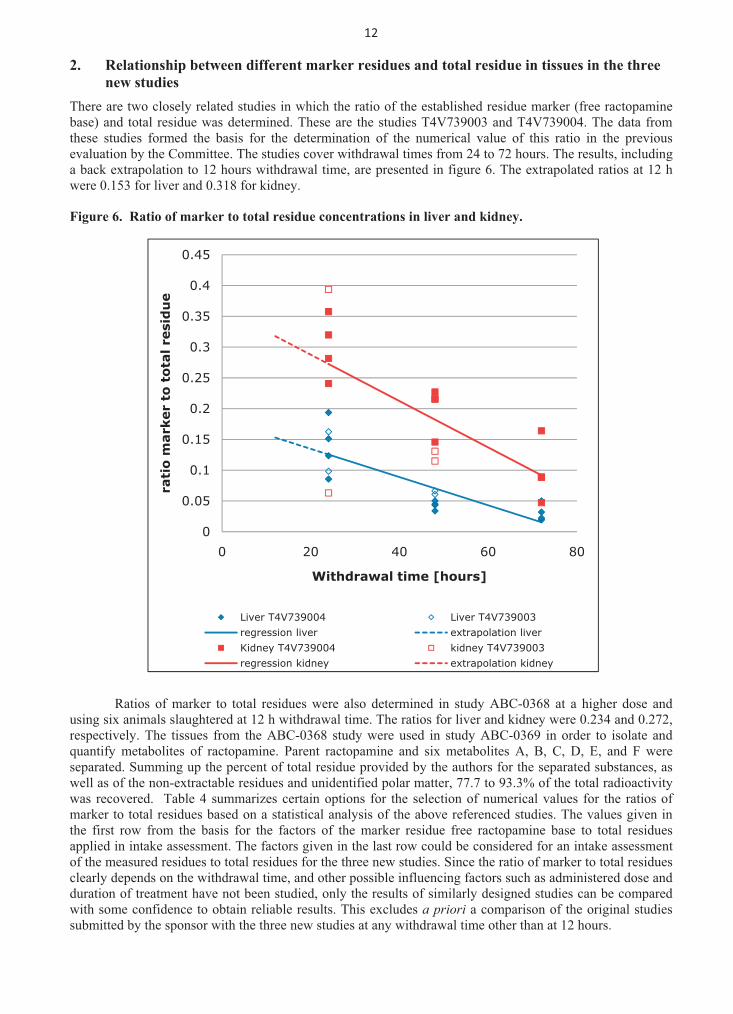
There are two closely related studies in which the ratio of the established residue marker (free ractopamine base) and total residue was determined. These are the studies T4V739003 and T4V739004. The data from these studies formed the basis for the determination of the numerical value of this ratio in the previous evaluation by the Committee. The studies cover withdrawal times from 24 to 72 hours. The results, including a back extrapolation to 12 hours withdrawal time, are presented in figure 6. The extrapolated ratios at 12 h were 0.153 for liver and 0.318 for kidney.
Figure 6. Ratio of marker to total residue concentrations in liver and kidney.
Ratios of marker to total residues were also determined in study ABC-0368 at a higher dose and
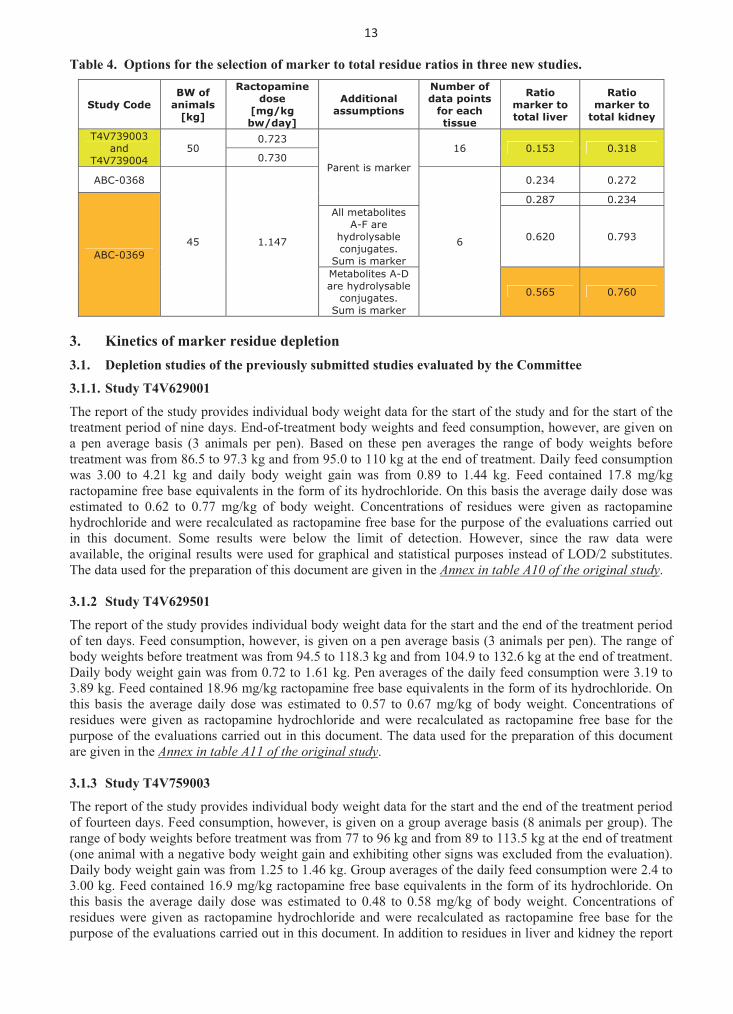
using six animals slaughtered at 12 h withdrawal time. The ratios for liver and kidney were 0.234 and 0.272, respectively. The tissues from the ABC-0368 study were used in study ABC-0369 in order to isolate and quantify metabolites of ractopamine. Parent ractopamine and six metabolites A, B, C, D, E, and F were separated. Summing up the percent of total residue provided by the authors for the separated substances, as well as of the non-extractable residues and unidentified polar matter, 77.7 to 93.3% of the total radioactivity was recovered. Table 4 summarizes certain options for the selection of numerical values for the ratios of marker to total residues based on a statistical analysis of the above referenced studies. The values given in the first row from the basis for the factors of the marker residue free ractopamine base to total residues applied in intake assessment. The factors given in the last row could be considered for an intake assessment of the measured residues to total residues for the three new studies. Since the ratio of marker to total residues clearly depends on the withdrawal time, and other possible influencing factors such as administered dose and duration of treatment have not been studied, only the results of similarly designed studies can be compared with some confidence to obtain reliable results. This excludes a priori a comparison of the original studies submitted by the sponsor with the three new studies at any withdrawal time other than at 12 hours.
13�
��
Table 4. Options for the selection of marker to total residue ratios in three new studies.
Study Code BW of
animals [kg]
Ractopamine dose
[mg/kg bw/day]
Additional assumptions
Number of data points
for each tissue
Ratio marker to total liver
Ratio marker to
total kidney
T4V739003 and
T4V739004 50
0.723
Parent is marker
16 0.153 0.318 0.730
ABC-0368
45 1.147 6
0.234 0.272
ABC-0369
0.287 0.234 All metabolites
A-F are hydrolysable conjugates.
Sum is marker
0.620 0.793
Metabolites A-D are hydrolysable
conjugates. Sum is marker
0.565 0.760
3. Kinetics of marker residue depletion
3.1. Depletion studies of the previously submitted studies evaluated by the Committee
3.1.1. Study T4V629001
The report of the study provides individual body weight data for the start of the study and for the start of the treatment period of nine days. End-of-treatment body weights and feed consumption, however, are given on a pen average basis (3 animals per pen). Based on these pen averages the range of body weights before treatment was from 86.5 to 97.3 kg and from 95.0 to 110 kg at the end of treatment. Daily feed consumption was 3.00 to 4.21 kg and daily body weight gain was from 0.89 to 1.44 kg. Feed contained 17.8 mg/kg ractopamine free base equivalents in the form of its hydrochloride. On this basis the average daily dose was estimated to 0.62 to 0.77 mg/kg of body weight. Concentrations of residues were given as ractopamine hydrochloride and were recalculated as ractopamine free base for the purpose of the evaluations carried out in this document. Some results were below the limit of detection. However, since the raw data were available, the original results were used for graphical and statistical purposes instead of LOD/2 substitutes. The data used for the preparation of this document are given in the Annex in table A10 of the original study. 3.1.2 Study T4V629501
The report of the study provides individual body weight data for the start and the end of the treatment period of ten days. Feed consumption, however, is given on a pen average basis (3 animals per pen). The range of body weights before treatment was from 94.5 to 118.3 kg and from 104.9 to 132.6 kg at the end of treatment. Daily body weight gain was from 0.72 to 1.61 kg. Pen averages of the daily feed consumption were 3.19 to 3.89 kg. Feed contained 18.96 mg/kg ractopamine free base equivalents in the form of its hydrochloride. On this basis the average daily dose was estimated to 0.57 to 0.67 mg/kg of body weight. Concentrations of residues were given as ractopamine hydrochloride and were recalculated as ractopamine free base for the purpose of the evaluations carried out in this document. The data used for the preparation of this document are given in the Annex in table A11 of the original study. 3.1.3 Study T4V759003
The report of the study provides individual body weight data for the start and the end of the treatment period of fourteen days. Feed consumption, however, is given on a group average basis (8 animals per group). The range of body weights before treatment was from 77 to 96 kg and from 89 to 113.5 kg at the end of treatment (one animal with a negative body weight gain and exhibiting other signs was excluded from the evaluation). Daily body weight gain was from 1.25 to 1.46 kg. Group averages of the daily feed consumption were 2.4 to 3.00 kg. Feed contained 16.9 mg/kg ractopamine free base equivalents in the form of its hydrochloride. On this basis the average daily dose was estimated to 0.48 to 0.58 mg/kg of body weight. Concentrations of residues were given as ractopamine hydrochloride and were recalculated as ractopamine free base for the purpose of the evaluations carried out in this document. In addition to residues in liver and kidney the report
14�
��
0.1
1.0
10.0
100.0
0 50 100 150
cont
ent
[ppb
]
hours after last exposure
Depletion of marker residue in liver
T4V629001 T4V629501T4V759003 regression line95/95 Tolerance limit
also provides some data on residues in muscle, fat, and skin. The data used for the preparation of this document are given in the Annex in table A12 of the original study.
3.1.4 Combined statistical evaluation of the previously submitted studies for evaluation
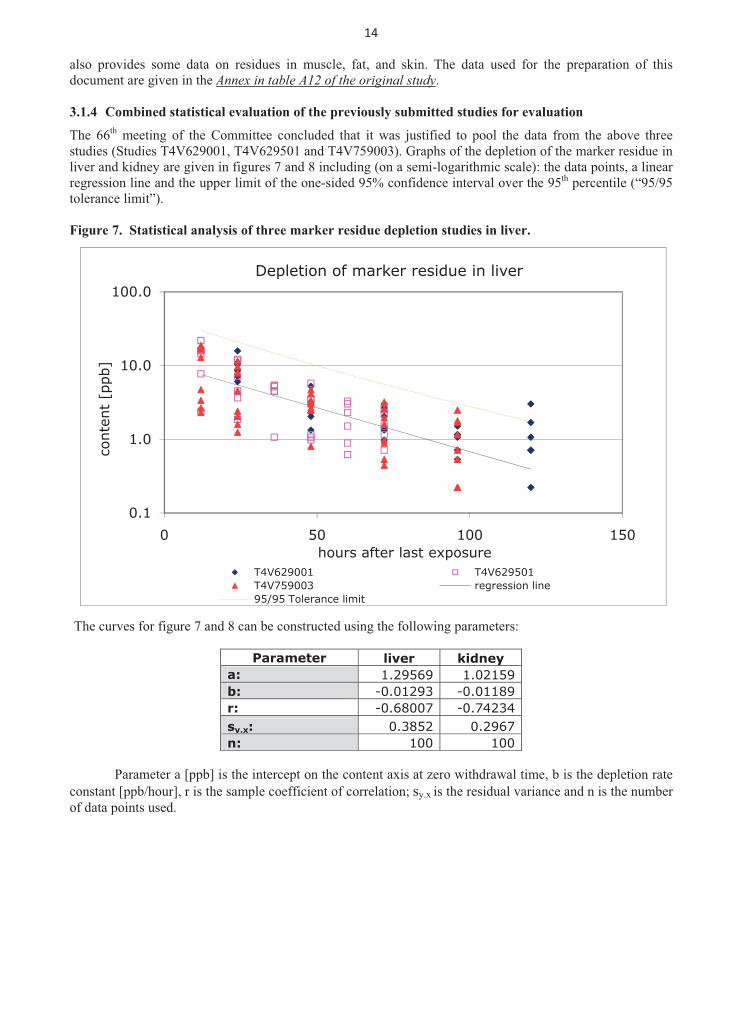
The 66th meeting of the Committee concluded that it was justified to pool the data from the above three studies (Studies T4V629001, T4V629501 and T4V759003). Graphs of the depletion of the marker residue in liver and kidney are given in figures 7 and 8 including (on a semi-logarithmic scale): the data points, a linear regression line and the upper limit of the one-sided 95% confidence interval over the 95th percentile (“95/95 tolerance limit”).
Figure 7. Statistical analysis of three marker residue depletion studies in liver.
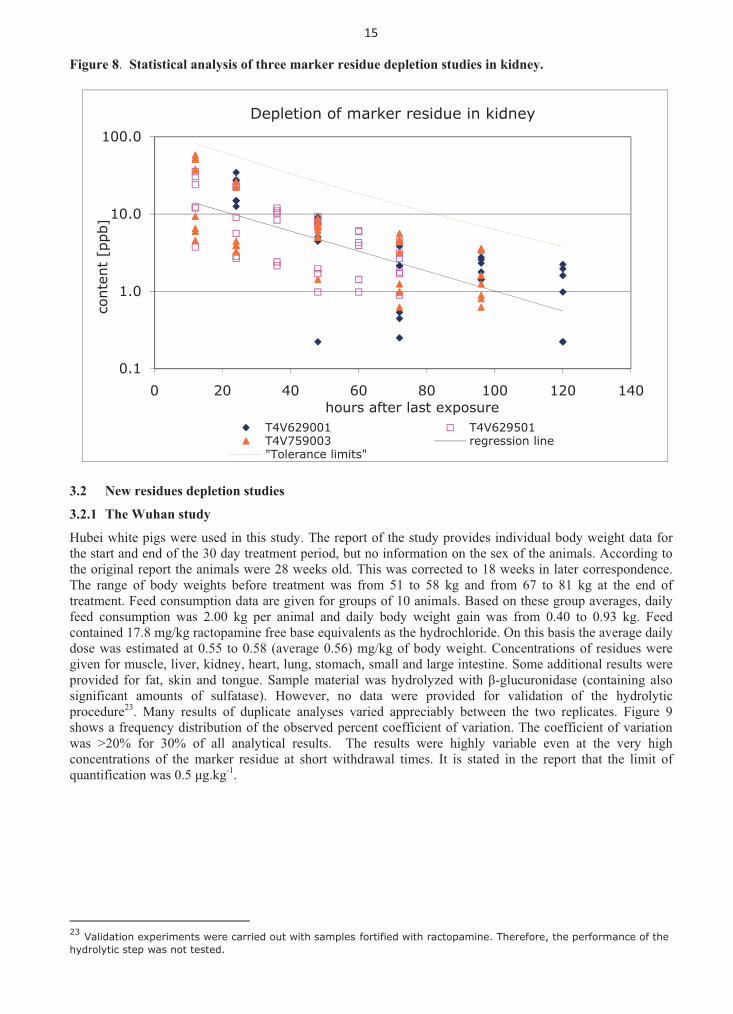
The curves for figure 7 and 8 can be constructed using the following parameters:
Parameter liver kidney a: 1.29569 1.02159 b: -0.01293 -0.01189 r: -0.68007 -0.74234 sy.x: 0.3852 0.2967 n: 100 100
Parameter a [ppb] is the intercept on the content axis at zero withdrawal time, b is the depletion rate
constant [ppb/hour], r is the sample coefficient of correlation; sy.x is the residual variance and n is the number of data points used.
15�
��
0.1
1.0
10.0
100.0
0 20 40 60 80 100 120 140
cont
ent
[ppb
]
hours after last exposure
Depletion of marker residue in kidney
T4V629001 T4V629501T4V759003 regression line"Tolerance limits"
Figure 8. Statistical analysis of three marker residue depletion studies in kidney.
3.2 New residues depletion studies
3.2.1 The Wuhan study
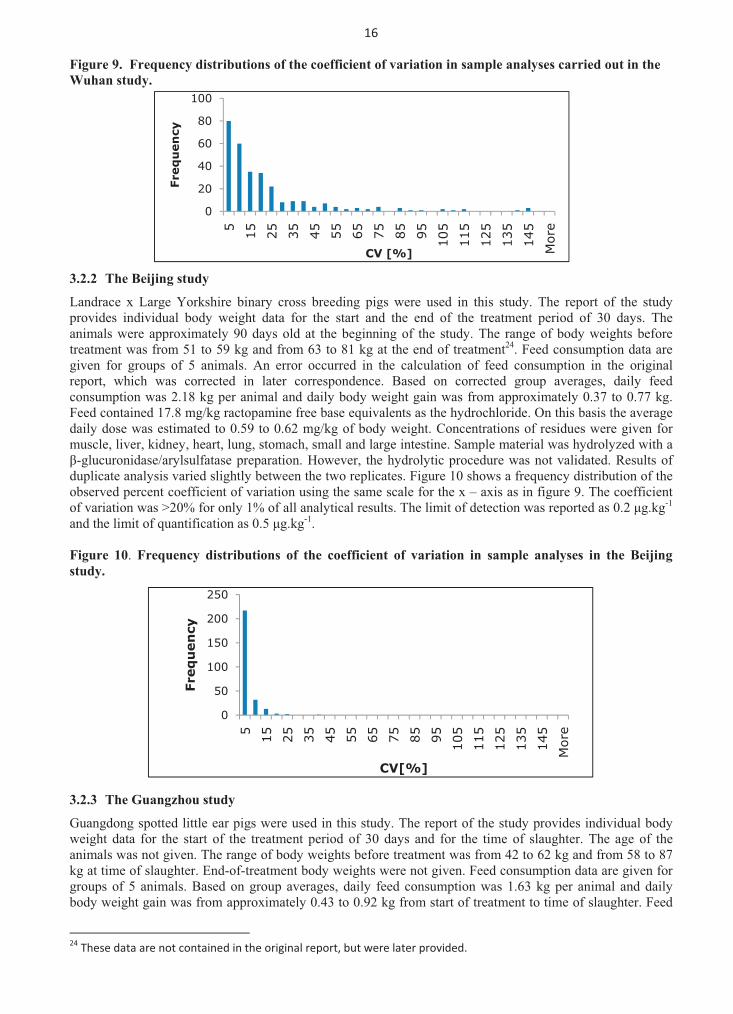
Hubei white pigs were used in this study. The report of the study provides individual body weight data for the start and end of the 30 day treatment period, but no information on the sex of the animals. According to the original report the animals were 28 weeks old. This was corrected to 18 weeks in later correspondence. The range of body weights before treatment was from 51 to 58 kg and from 67 to 81 kg at the end of treatment. Feed consumption data are given for groups of 10 animals. Based on these group averages, daily feed consumption was 2.00 kg per animal and daily body weight gain was from 0.40 to 0.93 kg. Feed contained 17.8 mg/kg ractopamine free base equivalents as the hydrochloride. On this basis the average daily dose was estimated at 0.55 to 0.58 (average 0.56) mg/kg of body weight. Concentrations of residues were given for muscle, liver, kidney, heart, lung, stomach, small and large intestine. Some additional results were provided for fat, skin and tongue. Sample material was hydrolyzed with �-glucuronidase (containing also significant amounts of sulfatase). However, no data were provided for validation of the hydrolytic procedure23. Many results of duplicate analyses varied appreciably between the two replicates. Figure 9 shows a frequency distribution of the observed percent coefficient of variation. The coefficient of variation was >20% for 30% of all analytical results. The results were highly variable even at the very high concentrations of the marker residue at short withdrawal times. It is stated in the report that the limit of quantification was 0.5 �g.kg-1.
������������������������������������������������������������23 Validation experiments were carried out with samples fortified with ractopamine. Therefore, the performance of the hydrolytic step was not tested.
16�
��
0
20
40
60
80
100
5 15 25 35 45 55 65 75 85 95 105
115
125
135
145
Mor
e
Freq
uen
cy
CV [%]
0
50
100
150
200
250
5 15 25 35 45 55 65 75 85 95 105
115
125
135
145
Mor
e
Freq
uen
cy
CV[%]
Figure 9. Frequency distributions of the coefficient of variation in sample analyses carried out in the
Wuhan study. 3.2.2 The Beijing study
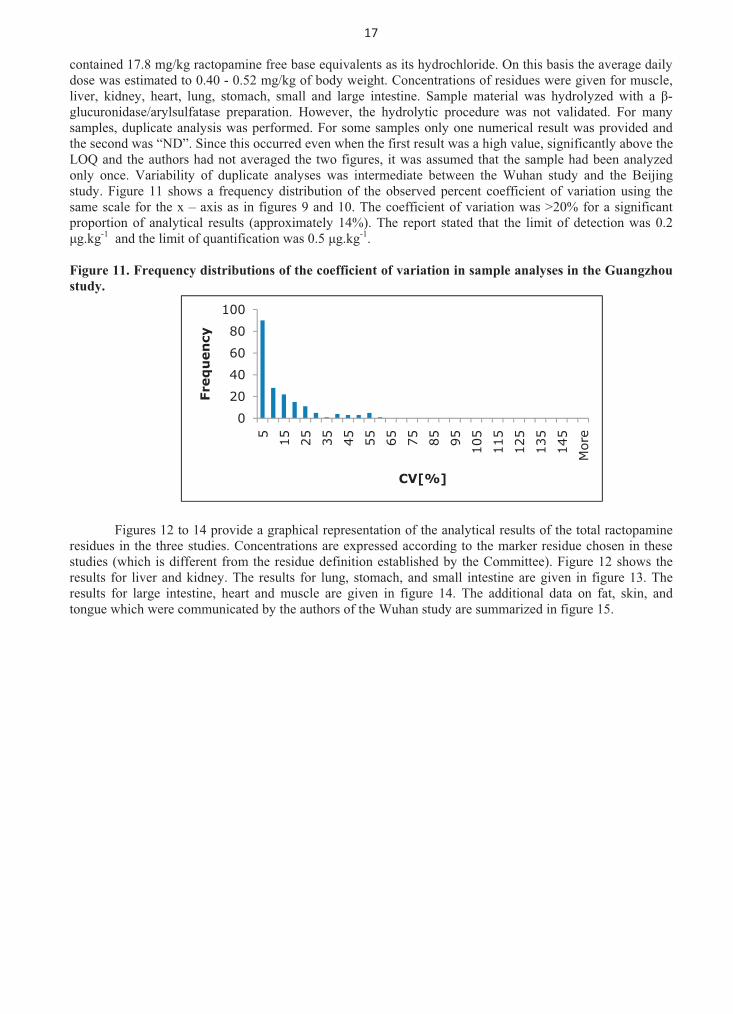
Landrace x Large Yorkshire binary cross breeding pigs were used in this study. The report of the study provides individual body weight data for the start and the end of the treatment period of 30 days. The animals were approximately 90 days old at the beginning of the study. The range of body weights before treatment was from 51 to 59 kg and from 63 to 81 kg at the end of treatment24. Feed consumption data are given for groups of 5 animals. An error occurred in the calculation of feed consumption in the original report, which was corrected in later correspondence. Based on corrected group averages, daily feed consumption was 2.18 kg per animal and daily body weight gain was from approximately 0.37 to 0.77 kg. Feed contained 17.8 mg/kg ractopamine free base equivalents as the hydrochloride. On this basis the average daily dose was estimated to 0.59 to 0.62 mg/kg of body weight. Concentrations of residues were given for muscle, liver, kidney, heart, lung, stomach, small and large intestine. Sample material was hydrolyzed with a �-glucuronidase/arylsulfatase preparation. However, the hydrolytic procedure was not validated. Results of duplicate analysis varied slightly between the two replicates. Figure 10 shows a frequency distribution of the observed percent coefficient of variation using the same scale for the x – axis as in figure 9. The coefficient of variation was >20% for only 1% of all analytical results. The limit of detection was reported as 0.2 �g.kg-1 and the limit of quantification as 0.5 �g.kg-1.
Figure 10. Frequency distributions of the coefficient of variation in sample analyses in the Beijing
study. 3.2.3 The Guangzhou study
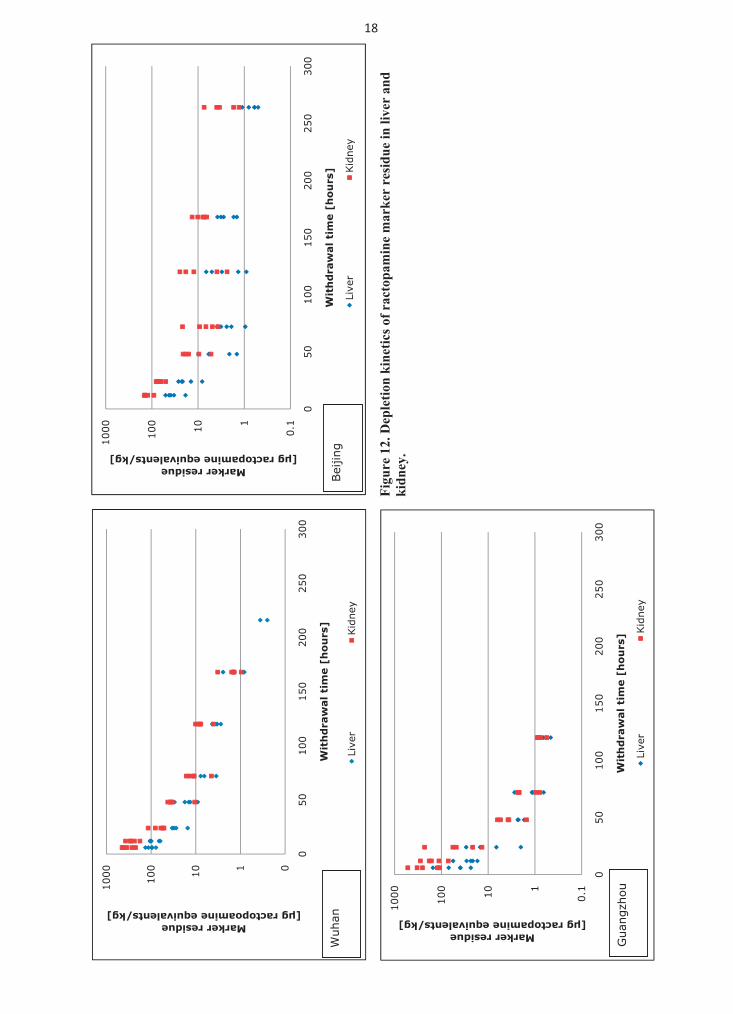
Guangdong spotted little ear pigs were used in this study. The report of the study provides individual body weight data for the start of the treatment period of 30 days and for the time of slaughter. The age of the animals was not given. The range of body weights before treatment was from 42 to 62 kg and from 58 to 87 kg at time of slaughter. End-of-treatment body weights were not given. Feed consumption data are given for groups of 5 animals. Based on group averages, daily feed consumption was 1.63 kg per animal and daily body weight gain was from approximately 0.43 to 0.92 kg from start of treatment to time of slaughter. Feed
������������������������������������������������������������24�These�data�are�not�contained�in�the�original�report,�but�were�later�provided.�
17�
��
0
20
40
60
80
100
5 15 25 35 45 55 65 75 85 95 105
115
125
135
145
Mor
e
Freq
uen
cy
CV[%]
contained 17.8 mg/kg ractopamine free base equivalents as its hydrochloride. On this basis the average daily dose was estimated to 0.40 - 0.52 mg/kg of body weight. Concentrations of residues were given for muscle, liver, kidney, heart, lung, stomach, small and large intestine. Sample material was hydrolyzed with a �-glucuronidase/arylsulfatase preparation. However, the hydrolytic procedure was not validated. For many samples, duplicate analysis was performed. For some samples only one numerical result was provided and the second was “ND”. Since this occurred even when the first result was a high value, significantly above the LOQ and the authors had not averaged the two figures, it was assumed that the sample had been analyzed only once. Variability of duplicate analyses was intermediate between the Wuhan study and the Beijing study. Figure 11 shows a frequency distribution of the observed percent coefficient of variation using the same scale for the x – axis as in figures 9 and 10. The coefficient of variation was >20% for a significant proportion of analytical results (approximately 14%). The report stated that the limit of detection was 0.2 �g.kg-1 and the limit of quantification was 0.5 �g.kg-1.
Figure 11. Frequency distributions of the coefficient of variation in sample analyses in the Guangzhou
study.
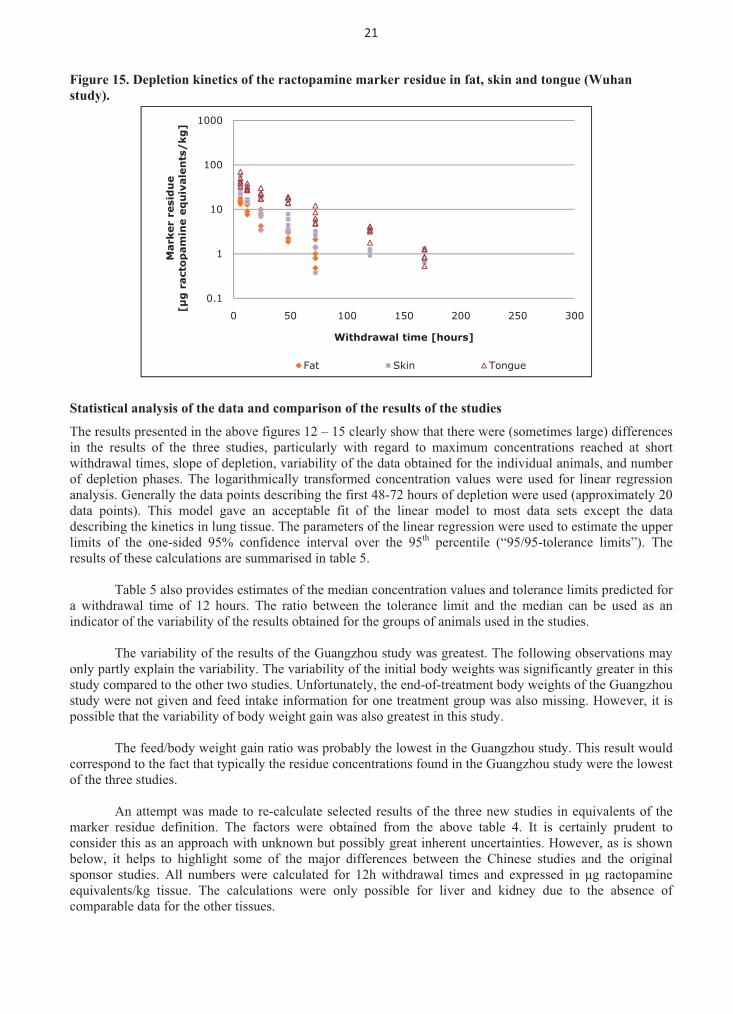
Figures 12 to 14 provide a graphical representation of the analytical results of the total ractopamine residues in the three studies. Concentrations are expressed according to the marker residue chosen in these studies (which is different from the residue definition established by the Committee). Figure 12 shows the results for liver and kidney. The results for lung, stomach, and small intestine are given in figure 13. The results for large intestine, heart and muscle are given in figure 14. The additional data on fat, skin, and tongue which were communicated by the authors of the Wuhan study are summarized in figure 15.
18
0110100
1000
050
100
150
200
250
300
Marker residue [μg ractopoamine equivalents/kg]
Wit
hd
raw
al
tim
e [
ho
urs
]
Live
rKid
ney
0.1110100
1000
050
100
150
200
250
300
Marker residue[μg ractopamine equivalents/kg]
Wit
hd
raw
al
tim
e [
ho
urs
]
Live
rKid
ney
0.1110100
1000
050
100
150
200
250
300
Marker residue[μg ractopamine equivalents/kg]
Wit
hd
raw
al
tim
e [
ho
urs
]
Live
rKid
ney
Fig
ure
12
. D
eple
tio
n k
inet
ics
of
ract
op
am
ine
ma
rker
res
idu
e in
liv
er a
nd
kid
ney
.
Wuh
an
Bei
jing
Gua
ngzh
ou

19
0110100
1000
050
100
150
200
250
300
Marker residue [μg ractopamine equivalents/kg]
Wit
hd
raw
al
tim
e [
ho
urs
]
Lung
Sto
mac
hSm
all i
ntes
tine
0.1110100
1000
050
100
150
200
250
300
Marker residue[μg ractopamine equivalents/kg]
Wit
hd
raw
al
tim
e [
ho
urs
]
Lung
Sto
mac
hSm
all i
ntes
tine
0.1110100
1000
050
100
150
200
250
300
Marker residue[μg ractopamine equivalents/kg]
Wit
hd
raw
al
tim
e [
ho
urs
]
Lung
Sto
mac
hSm
all i
ntes
tine
Fig
ure
13
. D
eple
tio
n k
inet
ics
of
ract
op
am
ine
ma
rker
res
idu
e in
lu
ng
,
sto
ma
ch a
nd
sm
all
in
test
ine.
Wuh
an
Bei
jing
Gua
ngzh
ou

20
0110100
1000
050
100
150
200
250
300
Marker residue[μg ractopamine equivalents/kg]
Wit
hd
raw
al
tim
e [
ho
urs
]
Larg
e in
test
ine
Hea
rtM
uscl
e
0.1110100
1000
050
100
150
200
250
300
Marker residue [μg ractopamine equivalents/kg]
Wit
hd
raw
al
tim
e [
ho
urs
]
Larg
e in
test
ine
Hea
rtM
uscl
e
0.1110100
1000
050
100
150
200
250
300
Marker residue[μg ractopamine equivalents/kg]
Wit
hd
raw
al
tim
es
[ho
urs
]
Larg
e in
test
ine
Hea
rtM
uscl
e
Fig
ure
14
. D
eple
tio
n k
inet
ics
of
ract
op
am
ine
ma
rker
res
idu
e in
la
rge
inte
stin
e, h
eart
an
d m
usc
le.
Wuh
an
Bei
jing
Gua
ngzh
ou
21�
��
0.1
1
10
100
1000
0 50 100 150 200 250 300
Mark
er
resi
du
e[�
g r
act
op
am
ine e
qu
ivale
nts
/kg
]
Withdrawal time [hours]
Fat Skin Tongue
Figure 15. Depletion kinetics of the ractopamine marker residue in fat, skin and tongue (Wuhan
study).
Statistical analysis of the data and comparison of the results of the studies
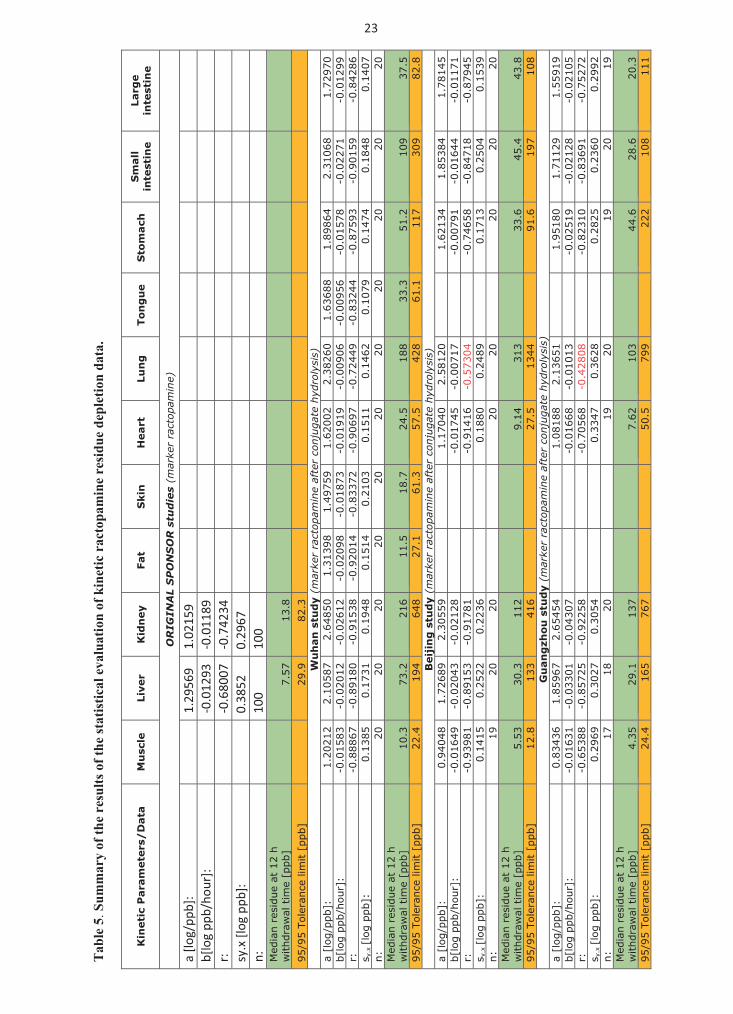
The results presented in the above figures 12 – 15 clearly show that there were (sometimes large) differences in the results of the three studies, particularly with regard to maximum concentrations reached at short withdrawal times, slope of depletion, variability of the data obtained for the individual animals, and number of depletion phases. The logarithmically transformed concentration values were used for linear regression analysis. Generally the data points describing the first 48-72 hours of depletion were used (approximately 20 data points). This model gave an acceptable fit of the linear model to most data sets except the data describing the kinetics in lung tissue. The parameters of the linear regression were used to estimate the upper limits of the one-sided 95% confidence interval over the 95th percentile (“95/95-tolerance limits”). The results of these calculations are summarised in table 5.
Table 5 also provides estimates of the median concentration values and tolerance limits predicted for
a withdrawal time of 12 hours. The ratio between the tolerance limit and the median can be used as an indicator of the variability of the results obtained for the groups of animals used in the studies.
The variability of the results of the Guangzhou study was greatest. The following observations may
only partly explain the variability. The variability of the initial body weights was significantly greater in this study compared to the other two studies. Unfortunately, the end-of-treatment body weights of the Guangzhou study were not given and feed intake information for one treatment group was also missing. However, it is possible that the variability of body weight gain was also greatest in this study.
The feed/body weight gain ratio was probably the lowest in the Guangzhou study. This result would
correspond to the fact that typically the residue concentrations found in the Guangzhou study were the lowest of the three studies.
An attempt was made to re-calculate selected results of the three new studies in equivalents of the
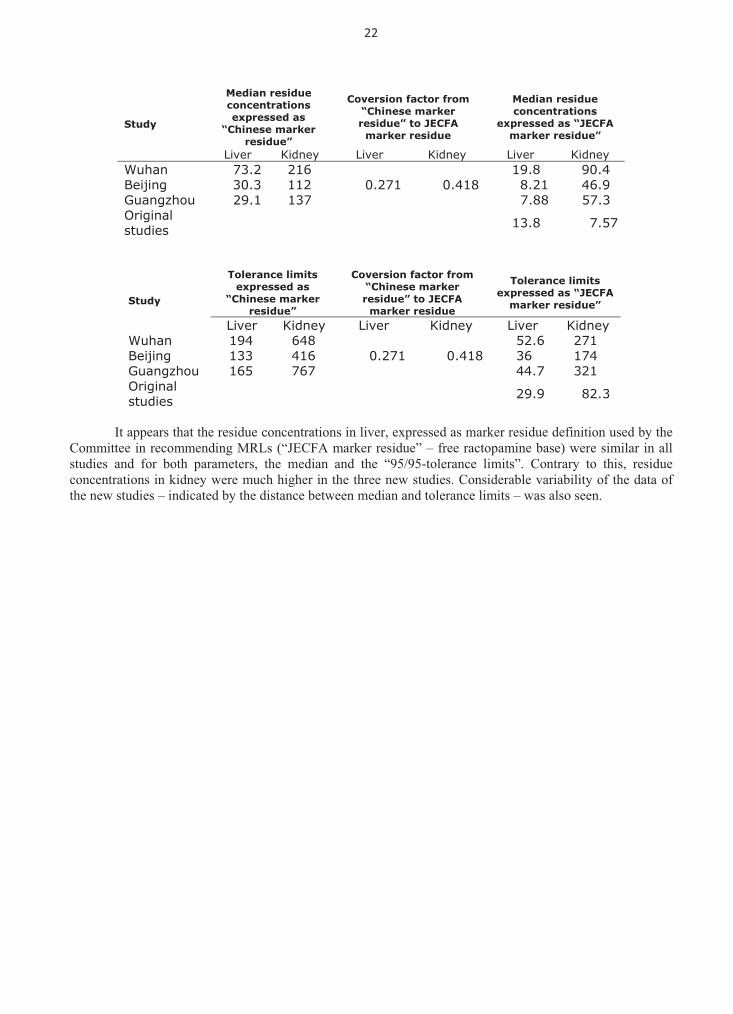
marker residue definition. The factors were obtained from the above table 4. It is certainly prudent to consider this as an approach with unknown but possibly great inherent uncertainties. However, as is shown below, it helps to highlight some of the major differences between the Chinese studies and the original sponsor studies. All numbers were calculated for 12h withdrawal times and expressed in �g ractopamine equivalents/kg tissue. The calculations were only possible for liver and kidney due to the absence of comparable data for the other tissues.
22�
��
Study
Median residue concentrations expressed as
“Chinese marker residue”
Coversion factor from “Chinese marker residue” to JECFA
marker residue
Median residue concentrations
expressed as “JECFA marker residue”
Liver Kidney Liver Kidney Liver Kidney Wuhan 73.2 216
0.271 0.418 19.8 90.4
Beijing 30.3 112 8.21 46.9 Guangzhou 29.1 137 7.88 57.3 Original studies 13.8 7.57
Study
Tolerance limits expressed as
“Chinese marker residue”
Coversion factor from “Chinese marker residue” to JECFA
marker residue
Tolerance limits expressed as “JECFA
marker residue”
Liver Kidney Liver Kidney Liver Kidney Wuhan 194 648
0.271 0.418 52.6 271
Beijing 133 416 36 174 Guangzhou 165 767 44.7 321 Original studies 29.9 82.3
It appears that the residue concentrations in liver, expressed as marker residue definition used by the
Committee in recommending MRLs (“JECFA marker residue” – free ractopamine base) were similar in all studies and for both parameters, the median and the “95/95-tolerance limits”. Contrary to this, residue concentrations in kidney were much higher in the three new studies. Considerable variability of the data of the new studies – indicated by the distance between median and tolerance limits – was also seen.
23
T
ab
le 5
. Su
mm
ary
of
the
resu
lts
of
the
sta
tist
ica
l ev
alu
ati
on
of
kin
etic
ra
cto
pa
min
e re
sid
ue
dep
leti
on
da
ta.
Kin
eti
c P
ara
mete
rs/
Data
M
usc
le
Live
r K
idn
ey
Fat
Skin
H
eart
Lu
ng
To
ng
ue
Sto
mach
S
mall
in
test
ine
Larg
e
inte
stin
e
OR
IGIN
AL S
PO
NS
OR
stu
die
s (m
arke
r ra
ctopam
ine)
a [lo
g/pp
b]:
1.
2956
9 1.
0215
9
b[
log
ppb/
hour
]:
-0
.012
93
-0.0
1189
r:
-
0.
6800
7 -0
.742
34
sy.x
[log
ppb
]:
0.
3852
0.
2967
n:
100
100
Med
ian
resi
due
at 1
2 h
withd
raw
al t
ime
[ppb
]
7.57
13
.8
95/9
5 To
lera
nce
limit [
ppb]
29.9
82
.3
Wu
han
stu
dy (
mar
ker
ract
opam
ine
afte
r co
nju
gat
e hyd
roly
sis)
07927.1
86013.2 46898.1
88636.1 06283.2
20026.1 95794.1
89313.1 05846.2
78501.2 21202.1
:]bpp/gol[ a b[lo
g pp
b/ho
ur]:
-0
.015
83
-0.0
2012
-0
.026
12
-0.0
2098
-0
.018
73
-0.0
1919
-0
.009
06
-0.0
0956
-0
.015
78
-0.0
2271
-0
.012
99 68248.0-
95109.0- 39578.0-
44238.0- 94427.0-
79609.0- 27338.0-
41029.0- 83519.0-
08198.0- 76888.0-
:r s y.x
7041.0
8481.0 4741.0
9701.0 2641.0
1151.0 3012.0
4151.0 8491.0
1371.0 5831.0
:]bpp gol[ 02
02 02
02 02
02 02
02 02
02 02
:n Med
ian
resi
due
at 1
2 h
withd
raw
al t
ime
[ppb
] 10
.3
73.2
21
6 11
.5
18.7
24
.5
188
33.3
51
.2
109
37.5
95
/95
Tole
ranc
e lim
it [
ppb]
22
.4
194
648
27.1
61
.3
57.5
42
8 61
.1
117
309
82.8
B
eij
ing
stu
dy (
mar
ker
ract
opam
ine
afte
r co
nju
gat
e hyd
roly
sis)
54187.1
48358.1 43126.1
02185.2
04071.1
95503.2
98627.1 84049.0
:]bpp/gol[ a b[lo
g pp
b/ho
ur]:
-0
.016
49
-0.0
2043
-0
.021
28
-0.0
1745
-0
.007
17
-0
.007
91
-0.0
1644
-0
.011
71
61419.0-
18719.0-
35198.0- 18939.0-
:r-0
.573
04
-0
.746
58
-0.8
4718
-0
.879
45
s y.x
9351.0
4052.0 3171.0
9842.0
0881.0
6322.0
2252.0 5141.0
:]bpp gol[ 02
02 02
02
02
02
02 91
:n Med
ian
resi
due
at 1
2 h
withd
raw
al t
ime
[ppb
] 5.
53
30.3
11
2
9.
14
313
33
.6
45.4
43
.8
95/9
5 To
lera
nce
limit [
ppb]
12
.8
133
416
27.5
13
44
91
.6
197
108
Gu
an
gzh
ou
stu
dy
(mar
ker
ract
opam
ine
afte
r co
nju
gat
e hyd
roly
sis)
91955.1
92117.1 08159.1
15631.2
88180.1
45456.2
76958.1 63438.0
:]bpp/gol[ a b[lo
g pp
b/ho
ur]:
-0
.016
31
-0.0
3301
-0
.043
07
-0.0
1668
-0
.010
13
-0
.025
19
-0.0
2128
-0
.021
05
86507.0-
85229.0-
52758.0- 88356.0-
:r-0
.428
08
-0
.823
10
-0.8
3691
-0
.752
72
s y.x
2992.0
0632.0 5282.0
8263.0
7433.0
4503.0
7203.0 9692.0
:]bpp gol[ 91
02 91
02
91
02
81 71
:n Med
ian
resi
due
at 1
2 h
withd
raw
al t
ime
[ppb
] 4.
35
29.1
13
7
7.
62
103
44
.6
28.6
20
.3
95/9
5 To
lera
nce
limit [
ppb]
24
.4
165
767
50.5
79
9
222
108
111
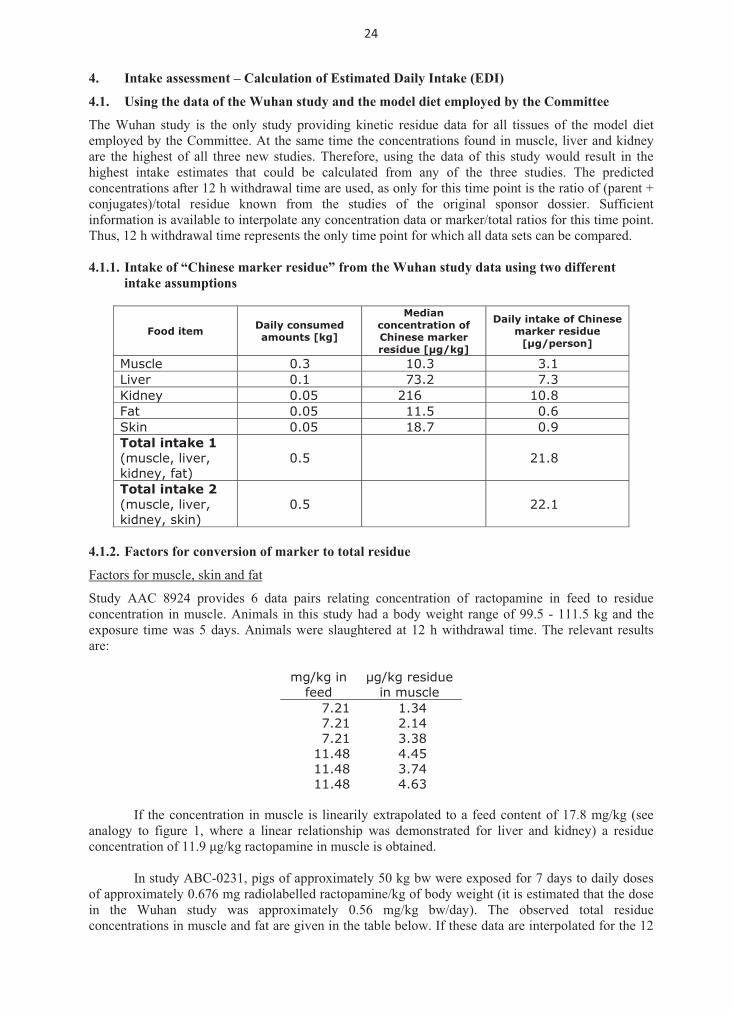
24��
4. Intake assessment – Calculation of Estimated Daily Intake (EDI)
4.1. Using the data of the Wuhan study and the model diet employed by the Committee
The Wuhan study is the only study providing kinetic residue data for all tissues of the model diet employed by the Committee. At the same time the concentrations found in muscle, liver and kidney are the highest of all three new studies. Therefore, using the data of this study would result in the highest intake estimates that could be calculated from any of the three studies. The predicted concentrations after 12 h withdrawal time are used, as only for this time point is the ratio of (parent + conjugates)/total residue known from the studies of the original sponsor dossier. Sufficient information is available to interpolate any concentration data or marker/total ratios for this time point. Thus, 12 h withdrawal time represents the only time point for which all data sets can be compared. 4.1.1. Intake of “Chinese marker residue” from the Wuhan study data using two different
intake assumptions
Food item Daily consumed amounts [kg]
Median concentration of Chinese marker residue [�g/kg]
Daily intake of Chinese marker residue
[�g/person]
Muscle 0.3 10.3 3.1 Liver 0.1 73.2 7.3 Kidney 0.05 216 10.8 Fat 0.05 11.5 0.6 Skin 0.05 18.7 0.9 Total intake 1 (muscle, liver, kidney, fat)
0.5 21.8
Total intake 2 (muscle, liver, kidney, skin)
0.5 22.1
4.1.2. Factors for conversion of marker to total residue
Factors for muscle, skin and fat
Study AAC 8924 provides 6 data pairs relating concentration of ractopamine in feed to residue concentration in muscle. Animals in this study had a body weight range of 99.5 - 111.5 kg and the exposure time was 5 days. Animals were slaughtered at 12 h withdrawal time. The relevant results are:
mg/kg in
feed �g/kg residue
in muscle 7.21 1.34 7.21 2.14 7.21 3.38
11.48 4.45 11.48 3.74 11.48 4.63
If the concentration in muscle is linearily extrapolated to a feed content of 17.8 mg/kg (see
analogy to figure 1, where a linear relationship was demonstrated for liver and kidney) a residue concentration of 11.9 �g/kg ractopamine in muscle is obtained.
In study ABC-0231, pigs of approximately 50 kg bw were exposed for 7 days to daily doses
of approximately 0.676 mg radiolabelled ractopamine/kg of body weight (it is estimated that the dose in the Wuhan study was approximately 0.56 mg/kg bw/day). The observed total residue concentrations in muscle and fat are given in the table below. If these data are interpolated for the 12

25�
��
h withdrawal time, 14.5 and 10.9 �g/kg of total residue concentrations are obtained for muscle and fat, respectively. These total residue concentrations are also in the same order of magnitude of the “Chinese marker residue” concentrations in the Wuhan study.
Withdrawal time [hr]
Animal ID Sex
Concentration of total residue [�g/kg]
Muscle Fat
6 151 M 22 14 6 232 F 38 17
36 205 M 2 5 36 088 F 9 8
120 126 M 3 7 120 165 F 2 4
In study ABC-0273, animals were exposed to approximately 1.191 mg/kg bw/day (twice the
dose of the Wuhan study) of radioactive ractopamine. Exposure was for 4, 7, and 10 days, respectively. Animals were slaughtered after 12 h withdrawal time in each group. The concentrations of total residue in muscle and fat were as follows:
Exposure time [days]
Animal ID Sex
Concentration of total residue
[�g/kg] Muscle Fat
4 773 f 16.02 11.57 4 774 m 16.02 8.01 4 776 f 24.03 8.01 7 775 m 14.24 11.57 7 770 f 16.91 9.79 7 771 m 18.69 8.9
10 767 f 17.8 14.24 10 768 f 23.14 12.46 10 766 m 24.03 13.35
The geometric mean of the individual data was 18.7 and 10.7 �g/kg for muscle and fat,
respectively. An even higher dose of approximately 1.237 mg/kg bw/day of radiolabelled ractopamine was
administered to animals of an approximate body weight of 45 kg for four days (original sponsor study ABC-0283). The following data on total residue in muscle and fat were provided:
Withdrawal time [h]
Animal ID Sex
Concentration of total residue [�g/kg]
Muscle Fat 12 923 f 12.46 13.35 12 926 m 12.46 11.57 24 922 f 5.34 6.23 24 924 m 4.45 5.34 48 916 m 2.67 48 917 f 2.67
These data correspond to a geometric mean at 12 h withdrawal time of 12.46 and 12.43 �g/kg
for muscle and fat, respectively. Doses of approximately 1.082 mg/kg bw/day were administered to animals of approximately
50 kg bw for four days in original sponsor study ABC-0291a. The concentrations of total residue

26�
��
found in muscle and fat are noted below. These data correspond to a geometric mean at 12 h withdrawal time of 18.76 and 18.09 �g/kg for muscle and fat, respectively.
Withdrawal time [h]
Animal ID Sex
Concentration of total residue [�g/kg]
Muscle Fat 12 175 m 11.57 12.46 12 179 m 26.7 22.25 12 188 f 21.36 21.36 48 173 f 6.23 48 185 f 1.78 48 187 m 2.67 96 181 m 1.78 3.56 96 183 f 96 184 m 0.89
168 174 f 4.45 168 182 f 1.78 168 186 m 2.67
All these data suggest that the total residue concentrations in muscle and fat are in the same
order of magnitude as the concentrations of the parent compound and of the marker residue measured in the Wuhan study. That means that at short withdrawal times the only relevant residue in muscle and fat is parent ractopamine. The proposed factor for the conversion of marker to total residue, therefore is 1. For skin almost no data exist to relate the marker residue to total residue. However, the contribution of residues in skin to the total intake is very low. Therefore, within reason, the choice of which factor to use is essentially irrelevent. For this estimate, a factor of 1 was used.
Factors for liver and kidney
The only available data base is the original sponsor study ABC-0369. If it is assumed that only metabolites A,B,C, and D can be hydrolysed to yield ractopamine and that all the other remaining residues are of equal toxicological concern, then the ratio of the Chinese marker residue to total residue would be 0.565 for liver and 0.760 for kidney (see table 4) corresponding to conversion factors of 1.770 for liver and 1.316 for kidney.
4.1.3. Calculation of the EDI on the basis of the Wuhan study
Using the above factors the EDI could be calculated on the basis of the one of the three new studies yielding the highest marker residue concentrations, i.e. the Wuhan study, and the most conservative conversion factors derived from the studies of the original dossier. This calculation is presented in table 6.

27�
��
Table 6. Calculation of the EDI for ractopamine on the basis of the Wuhan study using two
intake estimates.
Food item
Daily consumed amounts
[kg]
Median concentration of Chinese marker residue [�g/kg]
Daily intake of Chinese
marker residue [�g/person]
Coversion factor
Daily intake of total residue
[�g/person] Muscle 0.3 10.3 3.09 1 3.1 Liver 0.1 73.2 7.32 1.770 13.0 Kidney 0.05 216 10.8 1.316 14.2 Fat 0.05 11.5 0.575 1 0.6 Skin 0.05 18.7 0.935 1 0.9 Total intake 1-(muscle, liver, kidney, fat)
0.5 21.8 30.8
Total intake 2 (muscle, liver, kidney, skin)
0.5 22.1 31.2
Doubling of the conversion factor for skin would result in a 3% increase of the intake
estimate. The above two EDI estimates correspond to 38.5 - 39.0% of the upper limit of the ADI for a person with a body weight of 60 kg.
Around 87-88% of this intake results from consumption of 150 g edible offal (liver, kidney). Information provided in the correspondence with scientists from the Chinese Centre for Disease Control (data from the 2002 Chinese Survey on Nutrition, Diet and Health Status) suggested that the 97.5 percentile consumption of all eaters could range around 200 g of kidney, 250 g of liver, 300 g of lung, 300 g of all offal including liver, kidney, heart, lung, stomach, and intestine25. Replacement of the 150 g offal of the model diet by 250 g liver would result in an intake estimate of approximately 31 to 32 �g/person/day. Replacement of the 150 g offal (100 g liver and 50 g kidney) of the model diet by 200 g kidney would result in an intake estimate of approximately 61 �g/person/day.
The coefficient of variation of duplicate estimates of tissue concentrations was particularly unsatisfactory for the Wuhan study. Therefore, in a second run all values with a CV above 20% were omitted in the linear regression; all other data points until 72 hours withdrawal time were used as provided. This improved the goodness of fit, but had almost no effect on the estimated median residue concentrations. The values changed from 10.3 to 10.1 for muscle, 73.2 to 66.9 for liver, and 216.0 to 215.2 for kidney. As a result the EDI on the basis of the model diet was lowered by approximately 3%. This confirms that the observed variability of the analytical method performance had only a small influence on residue depletion and intake estimates.
4.1.4. Using muscle, liver and kidney data of the Beijing and Guangzhou studies
Neither the Bejing or the Guangzhou study provide any residue data for fat tissue. However, since the contribution of fat consumption to the total residue intake is minimal, an intake estimate on the basis of the data sets of the two other studies is possible. The results are summarised in tables 7a and 7b.
������������������������������������������������������������25 Apparently these figures have been rounded in steps of 50g. Some figures are unusual, for example that the subgroup of 2-6 years old children have a higher consumption of kidney than all eaters.
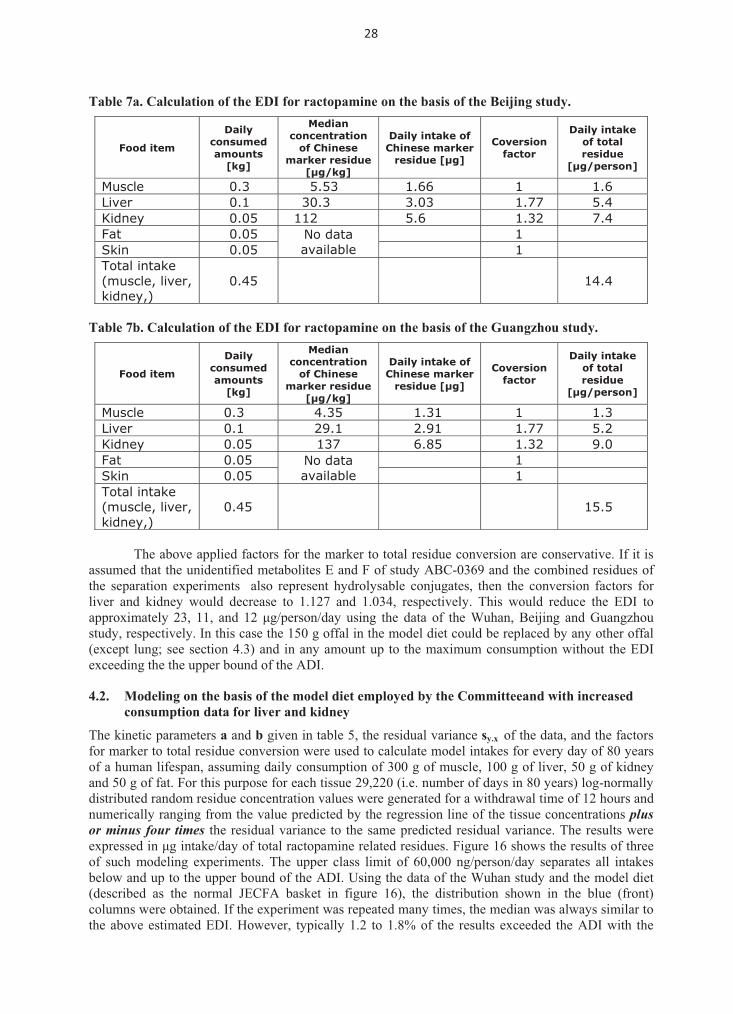
28�
��
Table 7a. Calculation of the EDI for ractopamine on the basis of the Beijing study.
Food item
Daily consumed amounts
[kg]
Median concentration
of Chinese marker residue
[�g/kg]
Daily intake of Chinese marker
residue [�g]
Coversion factor
Daily intake of total residue
[�g/person]
Muscle 0.3 5.53 1.66 1 1.6 Liver 0.1 30.3 3.03 1.77 5.4 Kidney 0.05 112 5.6 1.32 7.4 Fat 0.05 No data
available 1
Skin 0.05 1 Total intake (muscle, liver, kidney,)
0.45 14.4
Table 7b. Calculation of the EDI for ractopamine on the basis of the Guangzhou study.
Food item
Daily consumed amounts
[kg]
Median concentration
of Chinese marker residue
[�g/kg]
Daily intake of Chinese marker
residue [�g]
Coversion factor
Daily intake of total residue
[�g/person]
Muscle 0.3 4.35 1.31 1 1.3 Liver 0.1 29.1 2.91 1.77 5.2 Kidney 0.05 137 6.85 1.32 9.0 Fat 0.05 No data
available 1
Skin 0.05 1 Total intake (muscle, liver, kidney,)
0.45 15.5
The above applied factors for the marker to total residue conversion are conservative. If it is
assumed that the unidentified metabolites E and F of study ABC-0369 and the combined residues of the separation experiments also represent hydrolysable conjugates, then the conversion factors for liver and kidney would decrease to 1.127 and 1.034, respectively. This would reduce the EDI to approximately 23, 11, and 12 �g/person/day using the data of the Wuhan, Beijing and Guangzhou study, respectively. In this case the 150 g offal in the model diet could be replaced by any other offal (except lung; see section 4.3) and in any amount up to the maximum consumption without the EDI exceeding the the upper bound of the ADI. 4.2. Modeling on the basis of the model diet employed by the Committeeand with increased
consumption data for liver and kidney
The kinetic parameters a and b given in table 5, the residual variance sy.x of the data, and the factors for marker to total residue conversion were used to calculate model intakes for every day of 80 years of a human lifespan, assuming daily consumption of 300 g of muscle, 100 g of liver, 50 g of kidney and 50 g of fat. For this purpose for each tissue 29,220 (i.e. number of days in 80 years) log-normally distributed random residue concentration values were generated for a withdrawal time of 12 hours and numerically ranging from the value predicted by the regression line of the tissue concentrations plus or minus four times the residual variance to the same predicted residual variance. The results were expressed in �g intake/day of total ractopamine related residues. Figure 16 shows the results of three of such modeling experiments. The upper class limit of 60,000 ng/person/day separates all intakes below and up to the upper bound of the ADI. Using the data of the Wuhan study and the model diet (described as the normal JECFA basket in figure 16), the distribution shown in the blue (front) columns were obtained. If the experiment was repeated many times, the median was always similar to the above estimated EDI. However, typically 1.2 to 1.8% of the results exceeded the ADI with the
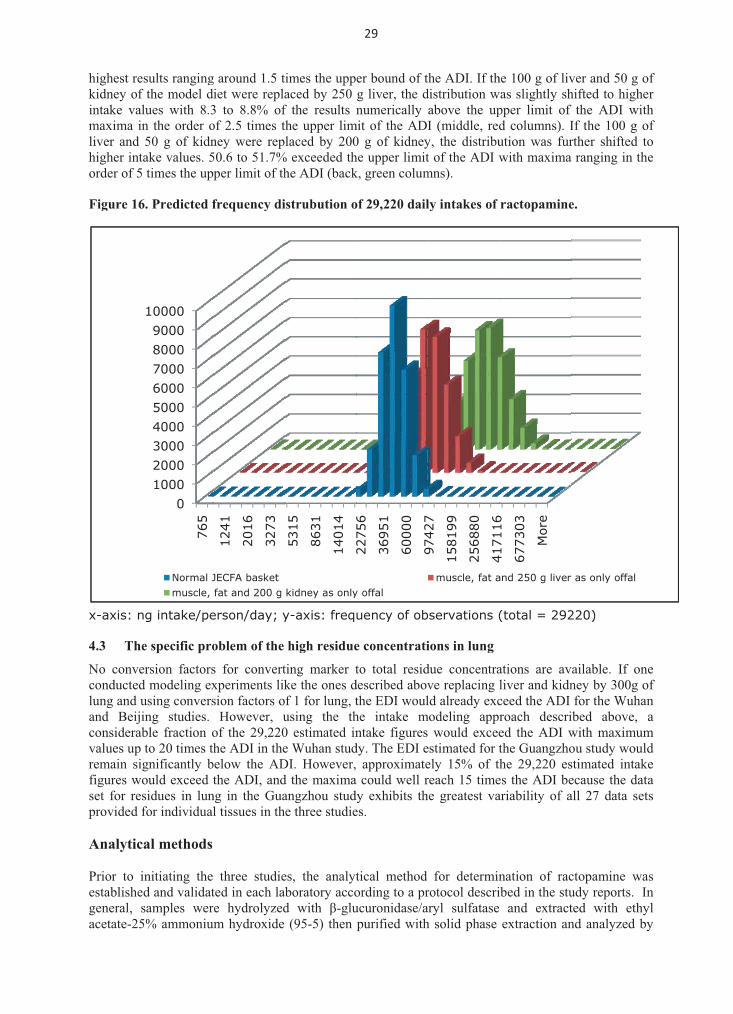
highest rekidney ofintake valmaxima inliver and higher intorder of 5 Figure 16
x-axis: n 4.3 The
No conveconductedlung and uand Beijiconsiderabvalues up remain sifigures wset for reprovided f
Analytic
Prior to iestablishegeneral, sacetate-25
0100020003000400050006000700080009000
10000
765
Normal Jmuscle,
esults rangingf the model dlues with 8.3n the order o50 g of kidn
take values. 55 times the up
6. Predicted f
ng intake/pe
e specific pro
ersion factorsd modeling exusing conversing studies. ble fraction oto 20 times thgnificantly bould exceed tsidues in lunfor individual
cal methods
initiating the ed and validatsamples wer5% ammoniu
1241
2016
3273
JECFA basketfat and 200 g
g around 1.5 tiet were repla3 to 8.8% ofof 2.5 times tney were rep50.6 to 51.7%per limit of th
frequency di
erson/day; y
oblem of the
s for convertxperiments liksion factors o
However, uof the 29,220he ADI in the
below the ADthe ADI, and
ng in the Gual tissues in th
three studieted in each lare hydrolyzedm hydroxide
5315
8631
1401
4
2275
6
kidney as only
times the uppaced by 250f the results nthe upper limlaced by 200
% exceeded thhe ADI (back
istrubution o
y-axis: freq
high residue
ting marker tke the ones df 1 for lung, tusing the th0 estimated ine Wuhan studDI. However, d the maximaangzhou stude three studie
es, the analytboratory accod with �-glu(95-5) then
29�
2275
6
3695
1
6000
0
9742
7
y offal
er bound of tg liver, the dnumerically
mit of the ADI0 g of kidneyhe upper limitk, green colum
of 29,220 dail
uency of ob
e concentrati
to total residdescribed abovthe EDI woulhe intake mntake figures
dy. The EDI e approximate
a could well rdy exhibits thes.
tical method ording to a prucuronidase/apurified with
9742
7
1581
99
2568
80
4171
16
muscle, fat a
the ADI. If thdistribution wabove the upI (middle, red
y, the distribut of the ADI wmns).
ly intakes of
bservations (
ions in lung
due concentrave replacing lld already exc
modeling appr would excee
estimated for tely 15% of threach 15 timehe greatest va
for determinrotocol descriaryl sulfatase h solid phase
4171
16
6773
03
Mor
e
and 250 g liver
he 100 g of livwas slightly shpper limit of d columns). Iution was furwith maxima
ractopamine
(total = 292
ations are avliver and kidnceed the ADI roach descried the ADI wthe Guangzhohe 29,220 es
es the ADI beariability of a
nation of racibed in the stu and extractextraction an
r as only offal
ver and 50 g ohifted to highf the ADI wiIf the 100 g orther shifted a ranging in th
e.
220)
vailable. If onney by 300g ofor the Wuha
ibed above, with maximuou study woustimated intakecause the daall 27 data se
ctopamine waudy reports. Ited with ethnd analyzed b
of her th of to he
ne of an
a um uld ke ata ets
as In
hyl by

30�
��
LC/MS/MS using deuterium labelled (D6)-ractopamine hydrochloride as an internal standard. The limit of quantification (LOQ) reported for this method was 0.5�g.kg-1; the limit of detection (LOD) was 0.2�g.kg-1. This analytical procedure is different from the methods considered in previous evaluations by the Committee where enzymatic hydrolysis was not used in the analytical determination of ractopamine residues. Details on the implications of this hydrolysis step are presented below.
Globally, the analytical strategy can be considered as fit for the purpose. It is based on the use of isotopic dilution (deuterium labelled internal standards) and LC-MS/MS (reverse phase separation, electrospray ionization, and acquisition of the signals in the selected reaction monitoring mode on a triple quadrupole instrument) for characterization of the analytes. However, the main weaknesses concerned the first steps of the method and especially the phase II metabolite deconjugation process with different enzymatic sources and the first extraction step used to recover hydrolyzed metabolites. Conditions used for the deconjugation differed appreciably. The enzyme source was not the same (varying sulfatase and glucuronidase composition, and also from different commercial sources). In addition, the enzyme activity, and the conditions used for the hydrolysis differed to some extent (buffer, pH, temperature, duration). Specific Remarks
Target residues - isomers
The first question of importance is the definition of the real target markers assessed. Ractopamine includes 2 asymmetric carbons and can therefore be considered as a racemic mixture containing four isomers (RR, RS, SR, SS). As the RR isomer is by far the chemical form with the highest affinity for the �1 and �2 adrenergic receptors, the question of the separate quantitation of these isomers can be raised. However, there was no information on the proportion of the various isomers in the residues analyzed.
Internal standards
Deuterated labelled ractopamine has been used (six D/H substitutions used) as the internal standard (IS). The positioning of the labelled atoms on the ractopamine chemical structure is on the aliphatic component. It is an important point as these positions are less easily exchangeable than on the aromatic ring. However, it would be better to use the glucuronide of deuterated ractopamine (GDR) to be as mimetic as possible with the target analytes. This option is particularly important when concentration characterisation has to be performed on tissue (solid material, where extractability is often critical). In the study reports, the calculated amount of ractopamine has probably been slightly underestimated. Moreover, the variability would have been decreased using a glucuronide of deuterated ractopamine as IS.
Counter ion
Ractopamine standards were in the hydrochloride (counter ion) salt form. Correction of ractopamine concentration by 1.121NB is of considerable importance, depending on whether or not the HCl counter ion has been taken into account in the calculation. The situation is different considering the internal standard as its concentration does not appear in the calculation of the target compound. NB: Ractopamine HCl: MW=337.85 (CAS number = 97825-25-7), Ractopamine: MW=301.38 (CAS number = 90274-24-1) Correction factor = 1.121
Chromatography and spectrometry
Two laboratories used HPLC (High performance liquid chromatography), one used UPLC (ultra performance liquid chromatography). There is no expected consequence on the quality of the data, nor their comparability. The three studies used both positive electrospray and triple quadrupoles (QqQ) for quantification; this approach can be considered as the de facto strategy for ractopamine characterization in biological samples.

31�
��
Conditions of the hydrolysis
As noted above, conditions used for the deconjugation differed appreciably. This is probably the most critical stage in the methods that can lead to differences in the results. Moreover, it is common practice to conduct the hydrolysis step after a first extraction of the solid matrix; furthermore, the original tissue sample is usually either digested (e.g. using a protease), or lyophilised and grinded. In these studies, the deconjugation was performed directly on homogenized tissue. The accessibility of the enzyme to the substrate is obviously less facilitated, and it is possible that less of the ractopamine conjugates would be hydrolysed. The consequence would be a slight underestimation of the quantities of conjugated and unconjugated residues combined. The composition of the enzyme preparation is either purified (in this case, there are few additional enzymatic activities, so bound residues are not released), or the preparation is not purified (in this case, it is possible that some endogenous protease in the enzymatic preparation can release some bound residues, but no proof, and little literature on this point is available). In the latter case, it is possible that concentrations of target analytes could be affected by the crude enzymatic preparation, leading once again to an underestimation of ractopamine concentration. Limits of performance
LODs and LOQs were found comparable in the three laboratories (LODs better than 0.2 �g.kg-1 and LOQs better than 0.5 �g.kg-1). There are no major negative comments on the calibration curves used, and the applied quantitation strategies.
Summary of analytical methods
In summary, even if some shortcomings were identified for the different analytical methods used to detect residues in the three new studies, it was noted that: 1. The analytical data provided by the Chinese are of acceptable quality. 2. Even if the strategies used by the three different laboratories were slightly different, and even if in the final analysis, the performance between the three studies is differ to some degree, it can be concluded that the data are valid for use in the analysis presented in this report. Residue depletion study submitted by the People’s Republic of China in May 2010
The Secretariat of JECFA received from the People’s Republic of China on 13 May 2010, a fourth ractopamine residue depletion study in pigs. Given the late receipt of the study, sufficient time was not available to fully analyze and integrate results with the three earlier studies. The Committee noted that no authorship was provided in submitted study report.
The study consisted of 25 Duroc × large White × Landrace pigs of approximately 50 kg body
weight at the start of the study. The feed regimen used medicated feed at 19.2 mg/kg ractopamine hydrochloride daily for thirty days. Feed and weight gain were measured with an automated feed intake and daily weight gain system. Median feed intake per day for this study was higher than in Wuhan, Beijing and Guangzhou studies with pigs consuming 2.61 kg medicated feed per day, with individual animal intake varying from 1.64 to 3.26 kg per day. The Wuhan, Beijing and Guangzhou studies daily intake of medicated feed was 1.63, 2.0 and 2.18 kg per day. Slaughter withdrawal times for the treated pigs were 6, 24, 48 and 72 hours. Sampling times in the Wuhan, Beijing and Guangzhou studies all contained a 12 hour withdrawal time and two of the three studies included a 6 h withdrawal time. The tissues sampled were the same as those in the Wuhan, Beijing and Guangzhou studies.
The sample preparation and analytical method was similar to that used in the other three studies with two important differences. This study included sample preparation with and without enzymatic digestion of the tissue samples prior to extraction and purification and the use of a different internal standard in the residue analysis (a tri-deuterium labelled ractopamine (D3) rather than the

32�
��
hexa-deuterium (D6) labelled ractopamine). The Wuhan, Beijing and Guangzhou studies did not include residue analysis without enzyme hydrolysis. The analytical method was reported to have the same limits of quantitation (LOQ) and detection (LOD). Analysis was performed in three different laboratories, although the names of these laboratories were only provided as acronyms. Ractopamine residue concentrations in liver, kidney, lung, and small intestine were greater than in the other tissues. Residue concentrations in the lung were greater than those in the liver and kidney, and were detected up to nine days following removal of medicated feed. Overall, results were comparable to the Wuhan, Beijing and Guangzhou studies when comparing results involving the enzyme hydrolysis procedure.
The concentration of residues determined using the enzymatic step are all greater than those determined without the enzymatic step except for lung tissue where the ratio was approximately 1. i.e. the residues in lung tissue consisted of mostly free ractopamine. For stomach, large intestine and small intestine tissues the ratios were 1.09 to 1.20. Large coefficients of variation (CV) for the intra-laboratory and inter-laboratory results shows concern with the enzymatic step regarding reproducibility for fat, kidney and liver tissues, in agreement observations made for the residue data for these tissues in the other three studies. More typically, studies that include an enzyme hydrolysis procedure include an initial extraction with an appropriate solvent prior to buffered enzyme hydrolysis. In addition, there are no data provided on the validation of the enzyme hydrolysis procedure in this study.
The analytical data on the residues in all tissues, with and without enzymatic hydrolysis, do
provide information indicating that residue analysis using enzymatic treatment of the crude tissue samples yields higher amounts of measurable residues than the same sample without enzymatic hydrolysis in all tissues at all time points with the exception of some of the lung tissue samples. However, a high variability in the residue levels in this tissue was noted. Levels of residues in all tissue samples using the enzymatic hydrolysis step are of the same order of magnitude as in the Wuhan, Beijing and Guangzhou studies. The new study does indicate, in general, a relatively consistent ratio between the enzymatic and non-enzymatic results for all four sampling times for each individual tissue and organ type. A summary of the residue data from each laboratory, each tissue and each sampling time is noted below in Table 8. The coefficients of variation (CV) for liver, kidney and fat are remarkably high both in absolute values and in comparison with the other tissue results.
The analytical methods were reviewed to assess if the use of the different internal standard in
the residue analysis (a tri-deuterium labelled ractopamine (D3) would influence the comparability of the data between the studies and to evaluate the analytical details of the two approaches consisting in the measurement of ractopamine after an enzymatic hydrolysis step or without hydrolysis (no deconjugation step). The evaluation focused on instruments, analytical method used, validation data, internal standards, enzyme source, extraction and purification procedures, mass spectrometric ions monitored, criteria for analyte identification and overall performance of the method. It was concluded that the method used is fit for purpose of the study with no major analytical concerns regarding the new set of data.
In summary, an overall analysis of the data in this additional study show levels of residues in
all tissue samples using the enzymatic hydrolysis step of the same order of magnitude as in the Wuhan, Beijing and Guangzhou studies. No direct comparison to the dietary exposure assessments was performed using the three studies as no sampling was performed at a 12 hour withdrawal time in this new study.
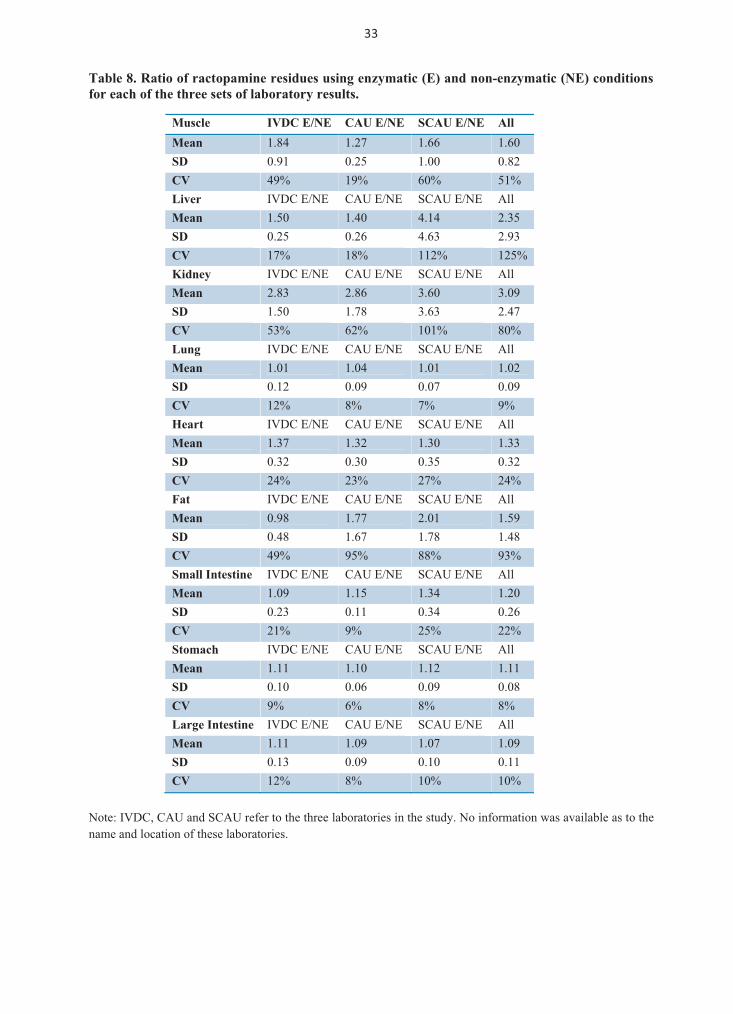
33�
��
Table 8. Ratio of ractopamine residues using enzymatic (E) and non-enzymatic (NE) conditions
for each of the three sets of laboratory results.
Muscle IVDC E/NE CAU E/NE SCAU E/NE All
Mean 1.84 1.27 1.66 1.60 SD 0.91 0.25 1.00 0.82 CV 49% 19% 60% 51% Liver IVDC E/NE CAU E/NE SCAU E/NE All Mean 1.50 1.40 4.14 2.35 SD 0.25 0.26 4.63 2.93 CV 17% 18% 112% 125% Kidney IVDC E/NE CAU E/NE SCAU E/NE All Mean 2.83 2.86 3.60 3.09 SD 1.50 1.78 3.63 2.47 CV 53% 62% 101% 80% Lung IVDC E/NE CAU E/NE SCAU E/NE All Mean 1.01 1.04 1.01 1.02 SD 0.12 0.09 0.07 0.09 CV 12% 8% 7% 9% Heart IVDC E/NE CAU E/NE SCAU E/NE All Mean 1.37 1.32 1.30 1.33 SD 0.32 0.30 0.35 0.32 CV 24% 23% 27% 24% Fat IVDC E/NE CAU E/NE SCAU E/NE All Mean 0.98 1.77 2.01 1.59 SD 0.48 1.67 1.78 1.48 CV 49% 95% 88% 93% Small Intestine IVDC E/NE CAU E/NE SCAU E/NE All Mean 1.09 1.15 1.34 1.20 SD 0.23 0.11 0.34 0.26 CV 21% 9% 25% 22% Stomach IVDC E/NE CAU E/NE SCAU E/NE All Mean 1.11 1.10 1.12 1.11 SD 0.10 0.06 0.09 0.08 CV 9% 6% 8% 8% Large Intestine IVDC E/NE CAU E/NE SCAU E/NE All Mean 1.11 1.09 1.07 1.09 SD 0.13 0.09 0.10 0.11 CV 12% 8% 10% 10%
Note: IVDC, CAU and SCAU refer to the three laboratories in the study. No information was available as to the name and location of these laboratories.
34�
��
Summary and appraisal Background
The monograph addendum to the residue monograph on ractopamine hydrochloride in this volume of the FAO JECFA Monographs on the residues of, exposure to and statements on the studies on ractopamine residues in pig tissues submitted were prepared by the invited experts for this electronic meeting of the Joint FAO/WHO Expert Committee on Food Additives (JECFA) during the period of January to May 2010. The tasks for the Committee was to evaluate three residue depletion studies on ractopamine in pig tissues performed by the People’s Republic of China, consider any other relevant studies previously assessed in this context by the Committee, provide recommendations on whether the information contained in the three new studies would have an impact on the MRLs recommended for ractopamine and consider any other scientific issues arising from the evaluation of the studies. The additional study received in May 2010 was considered separately due to its late submission.
This request originated from the 32nd Session of the CAC, which had asked FAO and WHO to review the three residue studies in pigs using ractopamine hydrochloride medicated feed conducted by the Government of the People’s Republic of China. These studies on ractopamine residue depletion used three different breeds in of pigs and were carried out at three different national laboratories, located in Wuhan, Guangzhou and Beijing. The Delegation of People’s Republic of China had at the 32nd CAC expressed concern over the ractopamine residue levels in lung, stomach, heart, large and small intestine as well as in the tissues for which MRLs were proposed (muscle, liver, kidney and fat), particularly at early time points after withdrawal of the medicated feed.
Description of the three new residue studies in the pig
The Wuhan study used 40 Hubei White Swine. All pigs received a dose of approximately 20 mg ractopamine hydrochloride per kg medicated animal feed daily for 30 days. Average feed consumption was 2.0 kg/animal/day. Animals were slaughtered at 6, 12 hours, and 1, 2, 3, 5, 7 and 9 days following withdrawal of medicated feed. Muscle, liver, kidney, heart, lung, stomach, large intestine and small intestine were collected and analyzed. Ractopamine residue concentrations in liver, kidney, lung, and small intestine were greater than in the other tissues. Residue concentrations in the lung were greater than those in the liver and kidney, and were detected up to nine days following removal of medicated feed.
The Beijing study used Landrace x Large Yorkshire binary cross pigs. Animals received
ractopamine hydrochloride in medicated feed at a dose rate of approximately 20 mg per kg daily for 30 days. Average feed consumption was 2.18 kg/animal/day. Samples of muscle, liver, kidney, heart, lung, stomach, large intestine, and small intestine were collected from all treated and control animals at 12 hours, 1, 2, 3, 5, 7 and 11 days. Ractopamine residue concentrations were above the limit of quantification (0.5 �g.kg-1) in all the tissues collected 11 days after the treatment with the exception of muscle.
The Guangzhou study used 30 Spotted Small-ear pigs. All pigs received a daily dose at a rate
of approximately 20 mg ractopamine hydrochloride per kg medicated animal feed for 30 days. The average feed consumption was 1.63 kg/animal/day. Animals were slaughtered 6, 12 hours, and 1, 2, 3 and 5 days after treatment. Samples of muscle, liver, kidney, heart, lung, stomach, large intestine and small intestine, were collected from all treated and control animals. The distribution of ractopamine demonstrated tissue selectivity in the pig, with the highest residue concentrations at 12 h in kidney, with the lung containing the second highest concentrations, followed by stomach, liver, small intestine, large intestine and muscle. Ractopamine residues in the lung depleted slowly.
Additional residue study submitted in May 2010
The additional study used 25 Duroc × large White × Landrace pigs. All pigs received a daily dose at a rate of approximately 20 mg/kg ractopamine hydrochloride daily for thirty days. The average feed
35�
��
consumption was 2.61 kg/animal/day, higher than in the other three studies. Animals were slaughtered 6, 24, 48 and 72 hour after treatment. The tissues sampled were muscle, liver, kidney, fat, lung, heart, stomach, large and small intestine. Analysis was performed with and without enzymatic digestion of the tissue samples prior to extraction and purification The concentration of residues determined using the enzymatic step are all greater than those determined without the enzymatic step except for lung tissue where the ratio was approximately 1. i.e. the residues in lung tissue consisted of mostly free ractopamine. For stomach, large intestine and small intestine tissues, the ratios were 1.09 to 1.20. Large coefficients of variation (CV) for the intra-laboratory and inter-laboratory results shows concern with the enzymatic step regarding reproducibility for fat, kidney and liver tissues, in agreement observations made for the residue data for these tissues in the other three studies. The levels of residues in all tissue samples analyzed using the enzymatic hydrolysis step were of the same order of magnitude as in the other studies. No direct comparison to the dietary exposure assessments was performed using the three other studies, as no sampling was performed at a 12 hour withdrawal time in this new study. Comparison of new data with previously evaluated data
A detailed analysis was undertaken of the three new studies in comparison with previously assessed studies and used to recommend MRLs. There were differences in study protocols and methodology for determination of ractopamine residues as well as in the determination of ractopamine residues in organ tissues other than liver and kidney. A comprehensive analysis was conducted to estimate the relationship of ractopamine residues as analyzed in the new studies using the enzymatic hydrolysis step with the ractopamine residues as determined in the studies in the previous evaluation by the Committee. The previous evaluation employed the relationship of marker residue to total residues determined without enzyme hydrolysis. Information on the ractopamine metabolites (A, B, C and D representing known ractopamine conjugates) from the previously reviewed ractopamine studies was used for this purpose.
In this analysis, the ratio between kidney and liver free ractopamine residues to total residues
was 0.318 and 0.153, respectively, as estimated from data in the studies previously evaluated the by Committee. The most comparable values of marker to total residues for the data from the three new studies was estimated to 0.76 and 0.565, respectively, based on data from a 12 h withdrawal time point. These estimated values were derived with the aid of residue metabolism data from the previous evaluations. The 12 h time point was used as only the results of similarly designed studies can be compared with some confidence to obtain reliable results. This excludes a priori a comparison of the studies of the original dossier with the new studies at any withdrawal time other than at 12 hours. These ratios were applied in the estimation of dietary exposure.
A detailed analysis of kinetic data on residue depletion studies was carried out. The 66th
meeting of the Committee concluded that it could pool the data from the studies submitted by the sponsor at the 62nd and 66th meeting of the Committee. Semi-logarithmic scale graphs of the depletion of the marker residue in liver and kidney are given in figures 7 and 8. From this analysis, a linear regression line and the upper limit of the one-sided 95% confidence interval over the 95th percentile (“95/95 tolerance limit”) was derived. This limit is the value normally chosen for the MRLs recommended by the Committee. These data were compared with the results of the three new studies. The analysis shows that there were at times large differences in the results of the three studies, particularly with regard to maximum concentrations reached at short withdrawal times, slope of depletion, variability of the data obtained for the individual animals, and number of depletion phases. While comparable residue depletion graphs could be developed, the variability, measured as coefficients of variation (CV) on duplicate analysis, showed notable differences between the three new studies. The CVs on duplicate analysis were lowest for the Beijing study and highest for the Wuhan study.
The logarithmically transformed concentration values from the three new studies were used
for linear regression analysis. This model gave an acceptable fit of the linear model to most data sets
36�
��
except the data describing the kinetics in lung tissue. The parameters of the linear regression were used to estimate the “95/95-tolerance limits”. The ratio between the tolerance limit and the median residue concentrations was used as an indicator of the variability of the results obtained for the groups of animals used in the studies.
The variability of the results of the Guangzhou study was greatest. Factors that may partly
explain the variability include the initial body weights, which were significantly greater in this study compared to the other two studies (however, the end-of-treatment body weights of the Guangzhou study were not given and feed intake information for one treatment group was not provided); variability of body weight gain was also greatest in this study. The feed/body weight gain ratio was the lowest in the Guangzhou study. This result would correspond to the fact that typically the residue concentrations found in the Guangzhou study were the lowest of the three studies.
An attempt was made to re-calculate selected results of the three new studies in equivalents of
marker residue from the 62nd and 66th Committee evaluations (see table 4). The Committee recognized that there are unknown and possibly significant inherent uncertainties with this approach. However, such calculations assist in highlighting some of the major differences between the three new studies and the original studies evaluated by the Committee. The calculations were only possible for liver and kidney due to the absence of comparable data for the other tissues. The analysis suggested that the residue concentrations in liver, expressed as the marker residue, as defined by the Committee at its 66th meeting, were similar in all studies for median and the “95/95 tolerance limits”. Contrary to this, residue concentrations in kidney were much higher in the three new studies. Considerable variability was also found in these data, as indicated by the distance between median and tolerance limits.
Dietary exposure estimates
For the purpose of conducting the dietary intake assessments, the Wuhan study was the only study providing kinetic residue data for all tissues of the model diet employed by the Committee. In addition, the residue concentrations found in muscle, liver and kidney were the highest of the three new studies. Therefore, using the data of the Wuhan study would result in the highest intake estimates. The predicted concentrations after 12 h withdrawal time were used, because only this time point provides comparable data for the ratio of (parent + conjugates)/total residue known from the studies of the original dossier. Sufficient information is available to interpolate any concentration data or marker/total ratios for this time point. Thus, 12 hours withdrawal time represents the only time point for which all data sets could be compared.
The comprehensive analysis of all the data suggests that the total residue concentrations in
muscle and fat are of the same approximate magnitude as the concentrations of the parent compound and of the marker residue as measured in the Wuhan study. Therefore, at short withdrawal times the only relevant residue in muscle and fat is parent ractopamine. The proposed factor for the ratio of marker to total residue is therefore set to 1. For skin almost no data are available to estimate the ratio of marker residue to total residue. However, the contribution of residues in skin to the total intake is very low. Therefore, the choice of which factor to use is, within reason, not significant. For this estimate, the Committee used a factor of 1.
For liver and kidney, the relevant data base for ractopamine residue metabolite information is
the study ABC-0369 evaluated at the 62nd and 66th meeting of the Committee. The Committee assumed that only metabolites A,B,C, and D (ractopamine conjugates) would be enzymatically hydrolysed to yield ractopamine and that all the other remaining endogenous residues are of equal toxicological concern. Using this conservative approach, the ratio of the equivalent marker residue to total residue from the new studies would be 0.565 for liver and 0.760 for kidney (see table 4), corresponding to conversion factors of 1.770 for liver and 1.316 for kidney.
Using the above factors, the estimated daily intake (using median residue concentrations) was
calculated on the basis of the new study that showed the highest marker residue concentrations , i.e.
37�
��
the Wuhan study, and the most conservative conversion factors derived from the studies of the original dossier. Using these conversion factors, the estimated daily intake using muscle, liver, kidney and fat is 30.8 �g; using muscle, liver, kidney and skin, the value is 31.2 �g. Both values are well below the upper bound of the ADI (60 �g per day).
A modeling simulation was conducted to estimate the robustness of the calculations using the
model diet and a diet with increased consumption of liver and kidney. Model intakes for 80 years lifespan (i.e. 29,220 days in 80 years), assuming daily consumption of 300 g of muscle, 100 g of liver, 50 g of kidney and 50 g of fat, were simulated. For each tissue log-normally distributed random values were generated for a 12 h withdrawal time and numerically ranging from the value predicted by the regression line of the tissue concentrations plus or minus four times the residual variance to the same predicted residual variance. Using the data of the Wuhan study and the normal model diet, typically 1.2 to 1.8% of the results would exceed the ADI with the highest results ranging around 1.5 times the upper bound of the ADI. If the 100 g of liver and 50 g of kidney of the model diet were replaced by 250 g liver, based on consumption data provided in the 2002 Chinese Survey on Nutrition, Diet and Health Status provided by the Chinese Centre for Disease Control, the distribution was slightly shifted to higher intake values with 8.3 to 8.8% above the upper limit of the ADI. If the 100 g of liver and 50 g of kidney were replaced by 200 g of kidney, the distribution was further shifted to higher intake values. 50.6 to 51.7% would exceed the upper bound of the ADI.
The Committee recognizes consumption of lung tissue to be a specific issue that has not been
addressed in other residue evaluations. There is no international consensus value to estimate an appropriate consumption of lung tissue. In addition, there are no data to derive conversion factors for marker to total residue concentrations for ractopamine in lung tissue. It was noted that in the overall assessment of the three new studies, there is significant variability for residues in lung tissue (the Guangzhou study exhibits the greatest variability of all 27 data sets provided for individual tissues in the three studies). Therefore, in modeling experiments like the ones described above, replacing liver and kidney by 300 g of lung and using a conversion factors of 1 for marker to total residues, the estimated daily intake (EDI) exceeds the upper bound of the ADI for the Wuhan and Beijing studies. The EDI estimated for the Guangzhou study would remain significantly below the upper bound of the ADI. Analytical Methods
The analytical method used in the three new studies included a step where the tissue samples were hydrolyzed with �-glucuronidase/aryl sulfatase. The hydrolysed sample was then extracted with ethyl acetate-25% ammonium hydroxide (95-5), purified with solid phase extraction and analyzed by LC/MS/MS using deuterium labelled (D6)-ractopamine hydrochloride or tri-deuterium labelled ractopamine (D3) as an internal standard. The limit of quantification (LOQ) reported for this method was 0.5 �g.kg-1; the limit of detection (LOD) was 0.2 �g.kg-1. This analytical procedure for quantifying ractopamine residues is different from the methods considered in previous evaluations by the Committee where enzymatic hydrolysis was not used in the analytical determination of ractopamine residues.
The analytical method applied in the Chinese studies is considered as fit for the purpose. It is based on the use of isotopic dilution (deuterated internal standards) and LC-MS/MS (reverse phase separation, electrospray ionization, and acquisition of the signals in the selected reaction monitoring mode on a triple quadrupole instrument) for characterization of the analytes. However, uncertainties arise through the first steps of the method, especially the phase II metabolite deconjugation process with different enzymatic sources and the first extraction step used to recover hydrolyzed metabolites. No data regarding validation of the enzymatic hydrolysis was provided and it was concluded that this step in the analysis was not validated. Furthermore, the conditions used for the deconjugation differed appreciably. The deconjugation step is probably the most critical stage in the methods that can lead to differences in the results. Moreover, it is common practice to conduct the hydrolysis step after a first extraction of the solid matrix. In addition, the original tissue sample is usually either digested (e.g.
38�
��
using a protease), or lyophilised and ground. In these studies, the deconjugation was performed directly on homogenized tissue. The accessibility of the enzyme to the substrate may be compromised and it is possible that less quantities of the ractopamine conjugates were hydrolysed, however, there was insufficient data to verify this hypothesis. In summary, even if some shortcomings were identified for the different analytical methods used to detect residues in the three new studies, it was noted that the analytical data provided are of acceptable quality, and even if the strategies used by the three different laboratories are slightly different, the performance between the three studies is somewhat different, in the final analysis, it is concluded that all data are valid for use in the analysis presented in this monograph. Conclusion and recommendations
The Committee concluded that, based on the data provided, including those from the three breeds of pigs in the studies undertaken by the People’s Republic of China, and corresponding dietary information, the recommended MRLs are compliant with the ADI as regards consumption of pig tissues of muscle, liver, kidney and fat. The estimated daily intake is approximately 50% of the upper bound of the ADI for a 60 kg person. Substituting specific organ tissue data in the model diet employed by the Committee for liver and kidney would result in dietary intakes that are still below the upper bound of the ADI, with the exception of lung tissue, where specific risk management measures may need to be considered. International food consumption data on offal and other organ tissues such as lung are lacking and further work should be undertaken to address this issue.

39�
��
References
Anonymous (2010). Supplemental Experiments: Tissue Distribution and Depletion of Ractopamine in Pigs after Administration of Ractopamine in Feed. Submitted to the JECFA Secretariat 13 May 2010 by the Codex Contact Point of the People’s Republic of China.
Chen Zhangliu & Zeng Zhenling (2009). Tissue Distribution and Depletion of Ractopamine After In-Feed Administration in Spotted Little-ear Pigs, Study No. 2009-MOA-001, National Reference Laboratory of Veterinary Drug Residues, South China Agricultural University, Guangzhou P.R. China.
Dalidowicz, J.E., Thompson, T.D., & Herberg, R.J. (1984). 14C-EL-737 steady state residue study with swine fed the highest anticipated dose. Agricultural Biochemistry, Lilly Research Laboratories, Division of Eli Lilly & Company, Report Number ABC-0273.
Dalidowicz, J.E., Thompson, T.D., & Herberg, R.J. (1984). 14C-EL-737 swine residue study. Agricultural Biochemistry, Lilly Research Laboratories, Division of Eli Lilly & Company, Report Number ABC-0231.
Dalidowicz, J.E., Thompson, T.D., & Herberg, R.J. (1985). 14C-EL-737 tissue depletion study in swine. AgriculturalBiochemistry, Lilly Research Laboratories, Division of Eli Lilly & Company, Report Number ABC-0291a. Dalidowicz, J.E., Thompson, T.D., & Herberg, R.J. (1986). The depletion of 14C- ractopamine HCl residues in swine during short withdrawal periods. Agricultural Biochemistry, Lilly Research Laboratories, Division of Eli Lilly & Company, Report Number ABC-0283. Dalidowicz J.E., Lewis, J.J. & Thomson, T.D. (1986). 14C-Ractopamine HCl Swine Tissue Residue Study. AgriculturalBiochemistry, Lilly Research Laboratories, Division of Eli Lilly and Company, Report Number ABC-0368.
Dalidowicz, J.E. (1987). Comparative metabolism of 14C-Ractopamine HCl in swine, dogs and rats. Agricultural Biochemistry, Lilly Research Laboratories, Division of Eli Lilly & Company, Report Number ABC-0369. Dalidowicz, J.E., Macy, T.D. & Cochrane, R.L. (1991). Determination of the Decline of Total Residues and the Marker Compound in Liver of Swine Fed 14C-Ractopamine HCl. Animal Science Chemical Research, Lilly Research Laboratories Division of Eli Lilly and Company, Report of Experiments T4V739003 & T4V739004.
Donoho, A.L., Macy, T.D. & Cochrane, R.L. (1991). Ractopamine Tissue Residue Decline Study in Swine. Animal Science Chemical Research, Lilly Research Laboratories, Division of Eli Lilly and Company, Report Number T4V759003. Jianhong Shen, Xi Xia & Haiyang Jiang (2009). Ractopamine Residue Depletion Study in Swine, Study No. 2009001, National Reference Laboratory of Veterinary Drug Residues (CAU) China Agricultural University, Beijing, P.R. China.
Lewis, J.J., Thomson, T.D. & Macy, T.D. (1987). The Determination of Residues in Swine Tissues Following Treatment with Ractopamine Hydrochloride. Lilly Research Laboratories, Division of Eli Lilly and Science Chemical Research, Lilly Research Laboratories, Division of Eli Lilly and Company, Report Number T4V629001.
40�
��
Lewis, J.J., Thomson, T.D. & Macy, T.D. (1987). The Determination of Residues in Swine Tissues Following Treatment with Ractopamine Hydrochloride. Lilly Research Laboratories, Division of Eli Lilly and Company, Report Number AAC8614. Turberg, M.P., Geroulis, D.K., Moran, J.W. & Buck, J.M. (1995). Ractopamine Tissue Residue Decline Study in Swine. Animal Science Product Development, Lilly Research Laboratories, Division of Eli Lilly and Company, Report Number T4V629501. Zonghui Yuan, Ling-li Huang, Yan-fei Tao & Fang-wei Zhu (2009). Non-Clinical Laboratory Study (GLP): Residue Depletion of Ractopamine in Hubei White Pig, A Native Breed in China, Study No. (HZAU) 09-04, National Reference Laboratory of Veterinary Drug Residues and MOA Key Laboratory of Food Safety Evaluation, Huazhong Agricultural University, Wuhan, P.R. China.
41�
��
ANNEX 1
SUMMARY OF JECFA EVALUATIONS OF VETERINARY DRUG RESIDUES
FROM THE 32ND
MEETING TO THE PRESENT
The following table summarises the veterinary drug evaluations conducted by JECFA at the 32nd (1987), 34th (1989), 36th (1990), 38th (1991), 40th (1992), 42nd (1994), 43rd (1994), 45th (1995), 48th (1997), 50th (1998), 52nd (1999), 54th (2000), 58th (2002), 60th (2003), 62nd (2004), 66th (2006) and 70th (2008) meetings. These meetings were devoted exclusively to the evaluation of veterinary drug residues in food. This table must be considered in context with the full reports of these meetings,
published as WHO Technical Report Series.
Some notes regarding the table:
-The “ADI Status” column refers to the ADI and indicates whether an ADI was established; If a full ADI was given, or if the ADI is temporary (T).
-Where an MRL is temporary, it is indicated by “T”.
-Where a compound has been evaluated more than once, the data given are for the most recent evaluation, including the 70th meeting of the Committee.
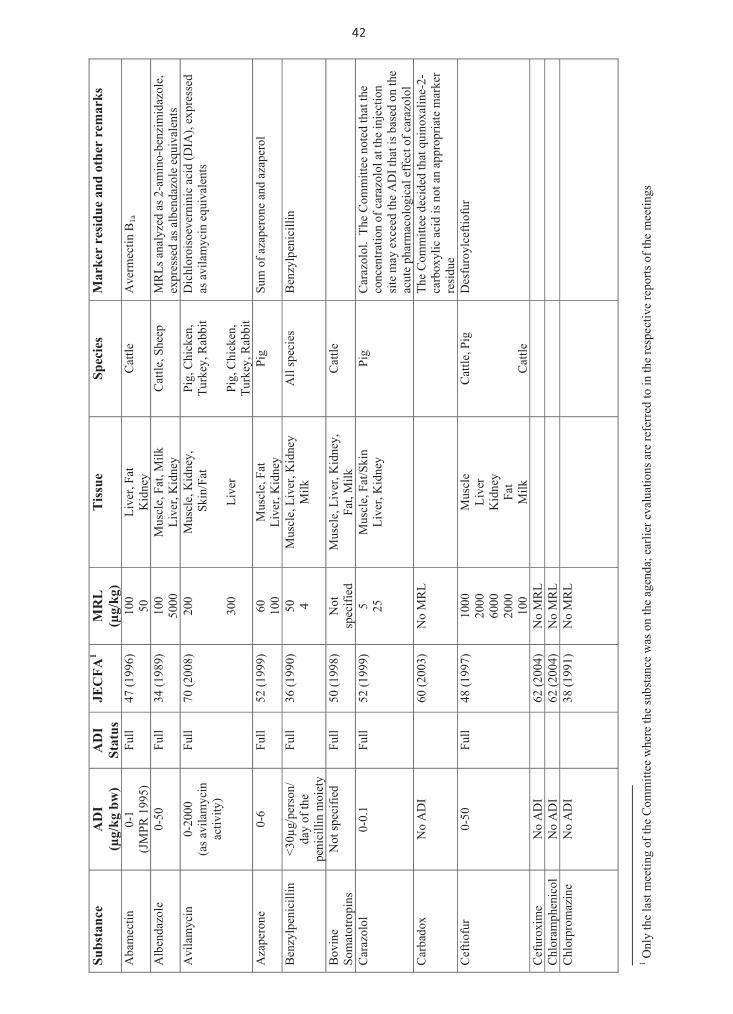
Su
bst
an
ce
AD
I
(g
/kg
bw
)
AD
I
Sta
tus
JE
CF
A1
MR
L
(g/k
g)
Tis
sue
Sp
ecie
s M
ark
er r
esid
ue
an
d o
ther
rem
ark
s
Aba
mec
tin
0-1
(J
MPR
199
5)
Full
47 (1
996)
10
0 50
Li
ver,
Fat
Kid
ney
Cat
tle
Ave
rmec
tin B
1a
Alb
enda
zole
0-
50
Full
34 (1
989)
10
0 50
00M
uscl
e, F
at, M
ilk
Live
r, K
idne
yC
attle
, She
ep
MR
Ls a
naly
zed
as 2
-am
ino-
benz
imid
azol
e,
expr
esse
d as
alb
enda
zole
equ
ival
ents
A
vila
myc
in
0-20
00
(as a
vila
myc
in
activ
ity)
Full
70 (2
008)
20
0 30
0
Mus
cle,
Kid
ney,
S
kin/
Fat
Li
ver
Pig,
Chi
cken
, Tu
rkey
, Rab
bit
Pi
g, C
hick
en,
Turk
ey, R
abbi
t
Dic
hlor
oiso
ever
nini
c ac
id (D
IA),
expr
esse
d as
avi
lam
ycin
equ
ival
ents
Aza
pero
ne
0-6
Full
52 (1
999)
60
10
0 M
uscl
e, F
at
Live
r, K
idne
y Pi
g Su
m o
f aza
pero
ne a
nd a
zape
rol
Ben
zylp
enic
illin
<30
g/pe
rson
/ da
y of
the
peni
cilli
n m
oiet
y
Full
36 (1
990)
50
4
Mus
cle,
Liv
er, K
idne
y M
ilk
All
spec
ies
Ben
zylp
enic
illin
Bov
ine
Som
atot
ropi
ns
Not
spec
ified
Fu
ll 50
(199
8)
Not
sp
ecifi
ed
Mus
cle,
Liv
er, K
idne
y,
Fat,
Milk
C
attle
Car
azol
ol
0-0.
1 Fu
ll 52
(199
9)
5 25
Mus
cle,
Fat
/Ski
n Li
ver,
Kid
ney
Pig
Car
azol
ol.
The
Com
mitt
ee n
oted
that
the
conc
entra
tion
of c
araz
olol
at t
he in
ject
ion
site
may
exc
eed
the
AD
I tha
t is b
ased
on
the
acut
e ph
arm
acol
ogic
al e
ffec
t of c
araz
olol
-2-enilaxoniuq taht dediced eettim
moC ehT
LR
M oN
)3002( 06
ID
A oN
xodabraC
carb
oxyl
ic a
cid
is n
ot a
n ap
prop
riate
mar
ker
resi
due
Cef
tiofu
r 0-
50
Full
48 (1
997)
10
00
2000
60
00
2000
10
0
Mus
cle
Live
r K
idne
y Fa
t M
ilk
Cat
tle, P
ig
C
attle
Des
furo
ylce
ftiof
ur
L
RM o
N )4002( 26
I
DA o
N e
mixorufeC
L
RM o
N )4002( 26
I
DA o
N locinehp
marolhC C
hlor
prom
azin
e N
o A
DI
38
(199
1)
No
MR
L
1 Onl
y th
e la
st m
eetin
g of
the
Com
mitt
ee w
here
the
subs
tanc
e w
as o
n th
e ag
enda
; ear
lier e
valu
atio
ns a
re re
ferr
ed to
in th
e re
spec
tive
repo
rts o
f the
mee
tings
42
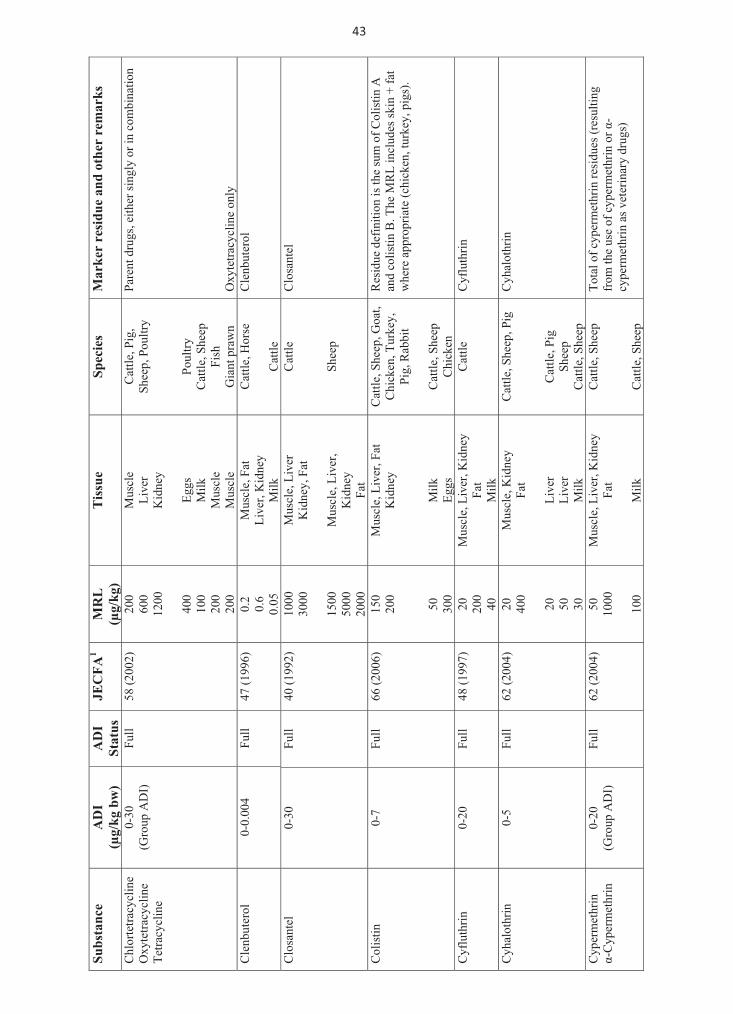
Su
bst
an
ce
AD
I
(g/k
g b
w)
AD
I
Sta
tus
JE
CF
A1
MR
L
(g/k
g)
Tis
sue
Sp
ecie
s M
ark
er r
esid
ue
an
d o
ther
rem
ark
s
Chl
orte
tracy
clin
e O
xyte
tracy
clin
e Te
tracy
clin
e
0-30
(G
roup
AD
I)
Full
58 (2
002)
20
0 60
0 12
00
40
0 10
0 20
0 20
0
Mus
cle
Live
r K
idne
y
Eggs
M
ilk
Mus
cle
Mus
cle
Cat
tle, P
ig,
Shee
p, P
oultr
y
Poul
try
Cat
tle, S
heep
Fi
sh
Gia
nt p
raw
n
Pare
nt d
rugs
, eith
er si
ngly
or i
n co
mbi
natio
n O
xyte
tracy
clin
e on
ly
Cle
nbut
erol
0-
0.00
4 Fu
ll 47
(199
6)
0.2
0.6
0.05
Mus
cle,
Fat
Li
ver,
Kid
ney
Milk
Cat
tle, H
orse
Cat
tle
Cle
nbut
erol
Clo
sant
el
0-30
Fu
ll 40
(199
2)
1000
30
00
15
00
5000
20
00
Mus
cle,
Liv
er
Kid
ney,
Fat
Mus
cle,
Liv
er,
Kid
ney
Fat
Cat
tle
Sh
eep
Clo
sant
el
Col
istin
0-
7 Fu
ll 66
(200
6)
150
200 50
300
Mus
cle,
Liv
er, F
at
Kid
ney
M
ilk
Eggs
Cat
tle, S
heep
, Goa
t, C
hick
en, T
urke
y,
Pig,
Rab
bit
C
attle
, She
ep
Chi
cken
Res
idue
def
initi
on is
the
sum
of C
olis
tin A
an
d co
listin
B. T
he M
RL
incl
udes
skin
+ fa
t w
here
app
ropr
iate
(chi
cken
, tur
key,
pig
s).
Cyf
luth
rin
0-20
Fu
ll 48
(199
7)
20
200
40
Mus
cle,
Liv
er, K
idne
y Fa
t M
ilk
Cat
tle
Cyf
luth
rin
Cyh
alot
hrin
0-
5 Fu
ll 62
(200
4)
20
400 20
50
30
Mus
cle,
Kid
ney
Fat
Live
r Li
ver
Milk
Cat
tle, S
heep
, Pig
Cat
tle, P
ig
Shee
p C
attle
, She
ep
Cyh
alot
hrin
Cyp
erm
ethr
in
-Cyp
erm
ethr
in
0-20
(G
roup
AD
I)
Full
62 (2
004)
50
10
00
10
0
Mus
cle,
Liv
er, K
idne
y Fa
t M
ilk
Cat
tle, S
heep
Cat
tle, S
heep
Tota
l of c
yper
met
hrin
resi
dues
(res
ultin
g fr
om th
e us
e of
cyp
erm
ethr
in o
r -
cype
rmet
hrin
as v
eter
inar
y dr
ugs)
43
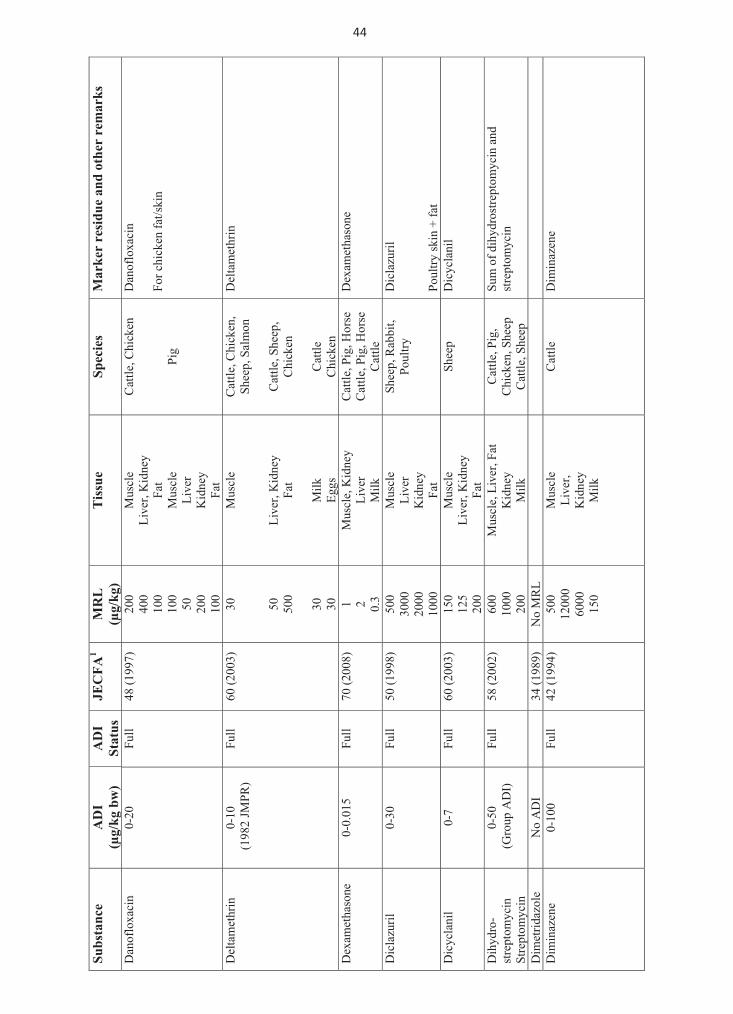
Su
bst
an
ce
AD
I
(g/k
g b
w)
AD
I
Sta
tus
JE
CF
A1
MR
L
(g/k
g)
Tis
sue
Sp
ecie
s M
ark
er r
esid
ue
an
d o
ther
rem
ark
s
Dan
oflo
xaci
n 0-
20
Full
48 (1
997)
20
0 40
0 10
0 10
0 50
20
0 10
0
Mus
cle
Live
r, K
idne
y Fa
t M
uscl
e Li
ver
Kid
ney
Fat
Cat
tle, C
hick
en
Pi
g
Dan
oflo
xaci
n Fo
r chi
cken
fat/s
kin
Del
tam
ethr
in
0-10
(1
982
JMPR
) Fu
ll 60
(200
3)
30 50
500 30
30
Mus
cle
Li
ver,
Kid
ney
Fa
t M
ilk
Eggs
Cat
tle, C
hick
en,
Shee
p, S
alm
on
C
attle
, She
ep,
Chi
cken
Cat
tle
Chi
cken
Del
tam
ethr
in
Dex
amet
haso
ne
0-0.
015
Full
70 (2
008)
1 2 0.3
Mus
cle,
Kid
ney
Live
r M
ilk
Cat
tle, P
ig, H
orse
C
attle
, Pig
, Hor
se
Cat
tle
Dex
amet
haso
ne
Dic
lazu
ril
0-30
Fu
ll 50
(199
8)
500
3000
20
00
1000
Mus
cle
Live
r K
idne
y Fa
t
Shee
p, R
abbi
t, Po
ultry
D
icla
zuril
Po
ultry
skin
+ fa
t D
icyc
lani
l 0-
7 Fu
ll 60
(200
3)
150
125
200
Mus
cle
Live
r, K
idne
y Fa
t
Shee
p D
icyc
lani
l
Dih
ydro
-st
rept
omyc
in
Stre
ptom
ycin
0-50
(G
roup
AD
I)
Full
58 (2
002)
60
0 10
00
200
Mus
cle,
Liv
er, F
at
Kid
ney
Milk
Cat
tle, P
ig,
Chi
cken
, She
ep
Cat
tle, S
heep
Sum
of d
ihyd
rost
rept
omyc
in a
nd
stre
ptom
ycin
Dim
etrid
azol
e N
o A
DI
34
(198
9)N
o M
RL
Dim
inaz
ene
0-10
0 Fu
ll 42
(199
4)
500
1200
0 60
00
150
Mus
cle
Live
r,
Kid
ney
Milk
Cat
tle
Dim
inaz
ene
44
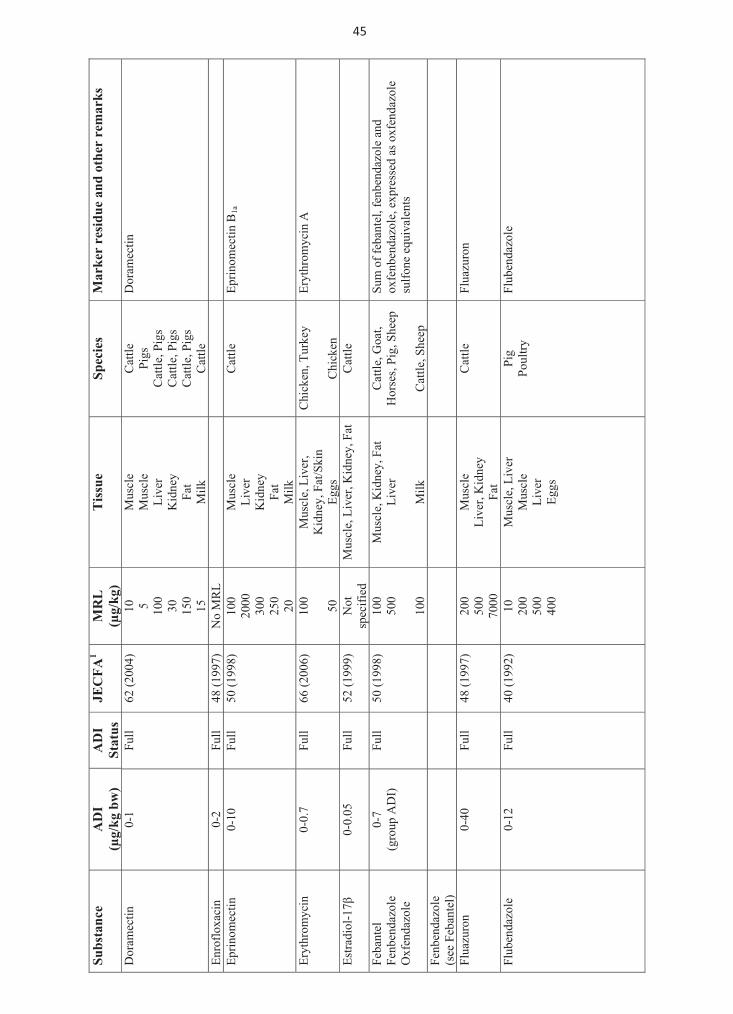
Su
bst
an
ce
AD
I
(g/k
g b
w)
AD
I
Sta
tus
JE
CF
A1
MR
L
(g/k
g)
Tis
sue
Sp
ecie
s M
ark
er r
esid
ue
an
d o
ther
rem
ark
s
Dor
amec
tin
0-1
Full
62 (2
004)
10
5 10
0 30
15
0 15
Mus
cle
Mus
cle
Live
r K
idne
y Fa
t M
ilk
Cat
tle
Pigs
C
attle
, Pig
s C
attle
, Pig
s C
attle
, Pig
s C
attle
Dor
amec
tin
L
RM o
N )7991( 84
lluF 2-0
nicaxolfornE Eprin
omec
tin
0-10
Fu
ll 50
(199
8)
100
2000
30
0 25
0 20
Mus
cle
Live
r K
idne
y Fa
t M
ilk
Cat
tle
Eprin
omec
tin B
1a
Eryt
hrom
ycin
0-
0.7
Full
66 (2
006)
10
0 50
Mus
cle,
Liv
er,
Kid
ney,
Fat
/Ski
n Eg
gs
Chi
cken
, Tur
key
C
hick
en
Eryt
hrom
ycin
A
Estra
diol
-17
0-
0.05
Fu
ll 52
(199
9)
Not
sp
ecifi
ed
Mus
cle,
Liv
er, K
idne
y, F
at
Cat
tle
Feba
ntel
Fe
nben
dazo
le
Oxf
enda
zole
0-7
(g
roup
AD
I)
Full
50 (1
998)
10
0 50
0 10
0
Mus
cle,
Kid
ney,
Fat
Li
ver
M
ilk
Cat
tle, G
oat,
Hor
ses,
Pig,
She
ep
C
attle
, She
ep
Sum
of f
eban
tel,
fenb
enda
zole
and
ox
fenb
enda
zole
, exp
ress
ed a
s oxf
enda
zole
su
lfone
equ
ival
ents
Fenb
enda
zole
(s
ee F
eban
tel)
Flua
zuro
n 0-
40
Full
48 (1
997)
20
0 50
0 70
00
Mus
cle
Live
r, K
idne
y Fa
t
Cat
tle
Flua
zuro
n
Flub
enda
zole
0-
12
Full
40 (1
992)
10
20
0 50
0 40
0
Mus
cle,
Liv
er
Mus
cle
Live
r Eg
gs
Pig
Poul
try
Flub
enda
zole
45
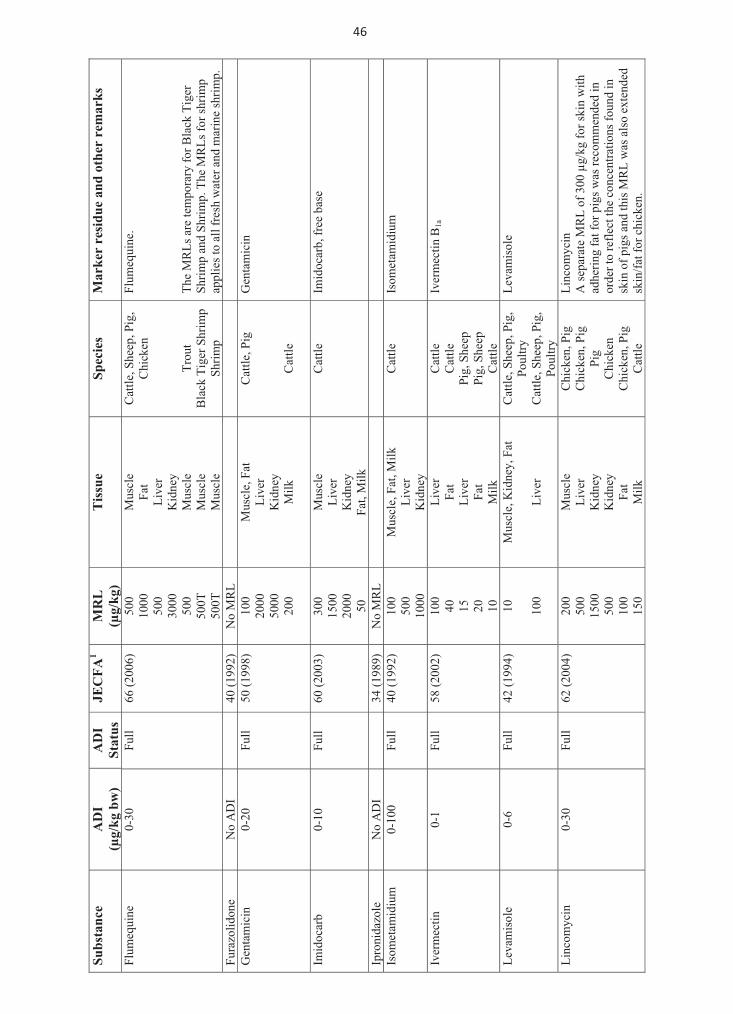
Su
bst
an
ce
AD
I
(g/k
g b
w)
AD
I
Sta
tus
JE
CF
A1
MR
L
(g/k
g)
Tis
sue
Sp
ecie
s M
ark
er r
esid
ue
an
d o
ther
rem
ark
s
Flum
equi
ne
0-30
Fu
ll 66
(200
6)
500
1000
50
0 30
00
500
50
0T
500T
Mus
cle
Fat
Live
r K
idne
y M
uscl
e M
uscl
e M
uscl
e
Cat
tle, S
heep
, Pig
, C
hick
en
Tr
out
Bla
ck T
iger
Shr
imp
Shrim
p
Flum
equi
ne.
The
MR
Ls a
re te
mpo
rary
for B
lack
Tig
er
Shrim
p an
d Sh
rimp.
The
MR
Ls fo
r shr
imp
appl
ies t
o al
l fre
sh w
ater
and
mar
ine
shrim
p.
L
RM o
N )2991( 04
I
DA o
N enodilozaruF G
enta
mic
in
0-20
Fu
ll 50
(199
8)
100
2000
50
00
200
Mus
cle,
Fat
Li
ver
Kid
ney
Milk
Cat
tle, P
ig
C
attle
Gen
tam
icin
Imid
ocar
b 0-
10
Full
60 (2
003)
30
0 15
00
2000
50
Mus
cle
Live
r K
idne
y Fa
t, M
ilk
Cat
tle
Imid
ocar
b, fr
ee b
ase
L
RM o
N )9891( 43
I
DA o
N elozadinorpI Is
omet
amid
ium
0-
100
Full
40 (1
992)
10
0 50
0 10
00
Mus
cle,
Fat
, Milk
Li
ver
Kid
ney
Cat
tle
Is
omet
amid
ium
Iver
mec
tin
0-1
Full
58 (2
002)
10
0 40
15
20
10
Live
r Fa
t Li
ver
Fat
Milk
Cat
tle
Cat
tle
Pig,
She
ep
Pig,
She
ep
Cat
tle
Iver
mec
tin B
1a
Leva
mis
ole
0-6
Full
42 (1
994)
10
10
0
Mus
cle,
Kid
ney,
Fat
Live
r
Cat
tle, S
heep
, Pig
, Po
ultry
C
attle
, She
ep, P
ig,
Poul
try
Leva
mis
ole
Linc
omyc
in
0-30
Fu
ll 62
(200
4)
200
500
1500
50
0 10
0 15
0
Mus
cle
Live
r K
idne
y K
idne
y Fa
t M
ilk
Chi
cken
, Pig
C
hick
en, P
ig
Pig
Chi
cken
C
hick
en, P
ig
Cat
tle
Linc
omyc
in
A se
para
te M
RL
of 3
00
g/kg
for s
kin
with
ad
herin
g fa
t for
pig
s was
reco
mm
ende
d in
or
der t
o re
flect
the
conc
entra
tions
foun
d in
sk
in o
f pig
s and
this
MR
L w
as a
lso
exte
nded
sk
in/fa
t for
chi
cken
.
46
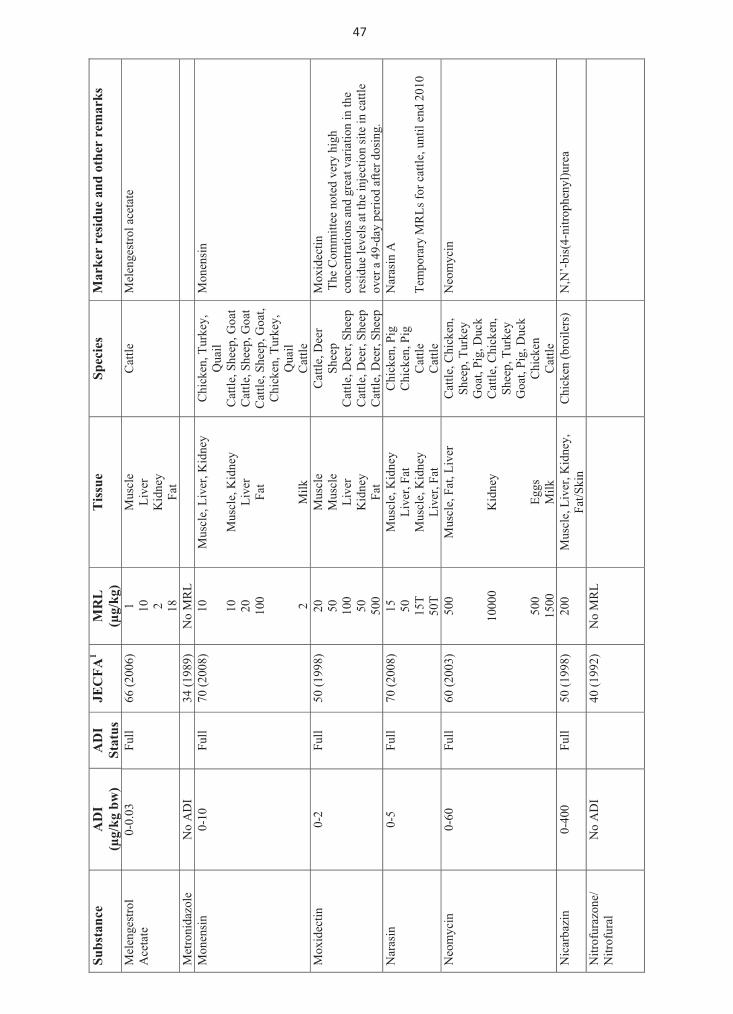
Su
bst
an
ce
AD
I
(g/k
g b
w)
AD
I
Sta
tus
JE
CF
A1
MR
L
(g/k
g)
Tis
sue
Sp
ecie
s M
ark
er r
esid
ue
an
d o
ther
rem
ark
s
Mel
enge
stro
l A
ceta
te
0-0.
03
Full
66 (2
006)
1 10
2 18
Mus
cle
Live
r K
idne
y Fa
t
Cat
tle
Mel
enge
stro
l ace
tate
L
RM o
N )9891( 43
I
DA o
N elozadinorte
M Mon
ensi
n 0-
10
Full
70 (2
008)
10
10
20
100 2
Mus
cle,
Liv
er, K
idne
y
Mus
cle,
Kid
ney
Live
r Fa
t M
ilk
Chi
cken
, Tur
key,
Q
uail
Cat
tle, S
heep
, Goa
t C
attle
, She
ep, G
oat
Cat
tle, S
heep
, Goa
t, C
hick
en, T
urke
y,
Qua
il C
attle
Mon
ensi
n
Mox
idec
tin
0-2
Full
50 (1
998)
20
50
10
0 50
50
0
Mus
cle
Mus
cle
Live
r K
idne
y Fa
t
Cat
tle, D
eer
Shee
p C
attle
, Dee
r, Sh
eep
Cat
tle, D
eer,
Shee
p C
attle
, Dee
r, Sh
eep
Mox
idec
tin
The
Com
mitt
ee n
oted
ver
y hi
gh
conc
entra
tions
and
gre
at v
aria
tion
in th
e re
sidu
e le
vels
at t
he in
ject
ion
site
in c
attle
ov
er a
49-
day
perio
d af
ter d
osin
g.
Nar
asin
0-
5 Fu
ll 70
(200
8)
15
50
15T
50T
Mus
cle,
Kid
ney
Live
r, Fa
t M
uscl
e, K
idne
y Li
ver,
Fat
Chi
cken
, Pig
C
hick
en, P
ig
Cat
tle
Cat
tle
Nar
asin
A
Tem
pora
ry M
RLs
for c
attle
, unt
il en
d 20
10
Neo
myc
in
0-60
Fu
ll 60
(200
3)
500
1000
0
500
1500
Mus
cle,
Fat
, Liv
er
K
idne
y
Eggs
M
ilk
Cat
tle, C
hick
en,
Shee
p, T
urke
y G
oat,
Pig,
Duc
k C
attle
, Chi
cken
, Sh
eep,
Tur
key
Goa
t, Pi
g, D
uck
C
hick
en
Cat
tle
Neo
myc
in
Nic
arba
zin
0-40
0 Fu
ll 50
(199
8)
200
Mus
cle,
Liv
er, K
idne
y,
Fat/S
kin
Chi
cken
(bro
ilers
) N
,N’-
bis(
4-ni
troph
enyl
)ure
a
Nitr
ofur
azon
e/
Nitr
ofur
al
L
RM o
N )2991( 04
I
DA o
N
47
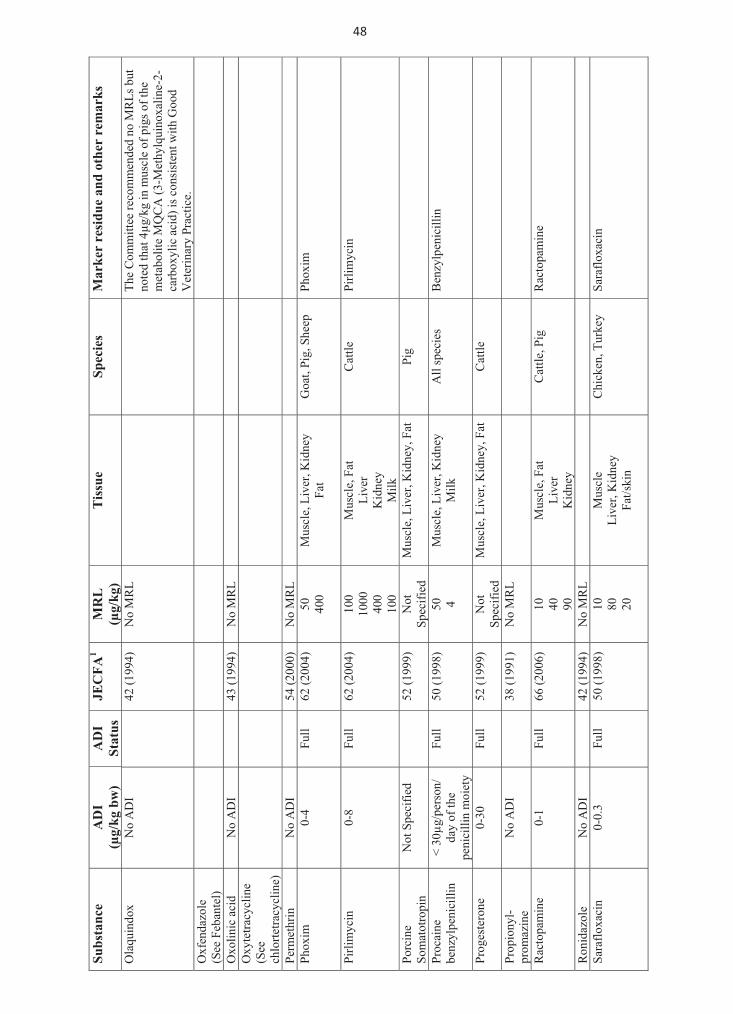
Su
bst
an
ce
AD
I
(g/k
g b
w)
AD
I
Sta
tus
JE
CF
A1
MR
L
(g/k
g)
Tis
sue
Sp
ecie
s M
ark
er r
esid
ue
an
d o
ther
rem
ark
s
tub sLR
M on dednem
mocer eettim
moC ehT
LR
M oN
)4991( 24
ID
A oN
xodniuqalO
note
d th
at 4
g/kg
in m
uscl
e of
pig
s of t
he
met
abol
ite M
QC
A (3
-Met
hylq
uino
xalin
e-2-
carb
oxyl
ic a
cid)
is c
onsi
sten
t with
Goo
d V
eter
inar
y Pr
actic
e.
Oxf
enda
zole
(S
ee F
eban
tel)
Oxo
linic
aci
d N
o A
DI
43
(199
4)N
o M
RL
Oxy
tetra
cycl
ine
(See
ch
lorte
tracy
clin
e)
L
RM o
N )0002( 45
I
DA o
N nirhte
mreP Phox
im
0-4
Full
62 (2
004)
50
40
0 M
uscl
e, L
iver
, Kid
ney
Fat
Goa
t, Pi
g, S
heep
Ph
oxim
Pirli
myc
in
0-8
Full
62 (2
004)
10
0 10
00
400
100
Mus
cle,
Fat
Li
ver
Kid
ney
Milk
Cat
tle
Pirli
myc
in
Porc
ine
Som
atot
ropi
n N
ot S
peci
fied
52
(199
9)
Not
Sp
ecifi
ed
Mus
cle,
Liv
er, K
idne
y, F
at
Pig
Proc
aine
be
nzyl
peni
cilli
n <
30g/
pers
on/
day
of th
e pe
nici
llin
moi
ety
Full
50 (1
998)
50
4
Mus
cle,
Liv
er, K
idne
y M
ilk
All
spec
ies
Ben
zylp
enic
illin
Prog
este
rone
0-
30
Full
52 (1
999)
N
ot
Spec
ified
M
uscl
e, L
iver
, Kid
ney,
Fat
C
attle
Prop
iony
l-pr
omaz
ine
L
RM o
N )1991( 83
I
DA o
N
Rac
topa
min
e 0-
1 Fu
ll 66
(200
6)
10
40
90
Mus
cle,
Fat
Li
ver
Kid
ney
Cat
tle, P
ig
Rac
topa
min
e
L
RM o
N )4991( 24
I
DA o
N elozadino
R Sara
floxa
cin
0-0.
3 Fu
ll 50
(199
8)
10
80
20
Mus
cle
Live
r, K
idne
y Fa
t/ski
n
Chi
cken
, Tur
key
Sara
floxa
cin
48
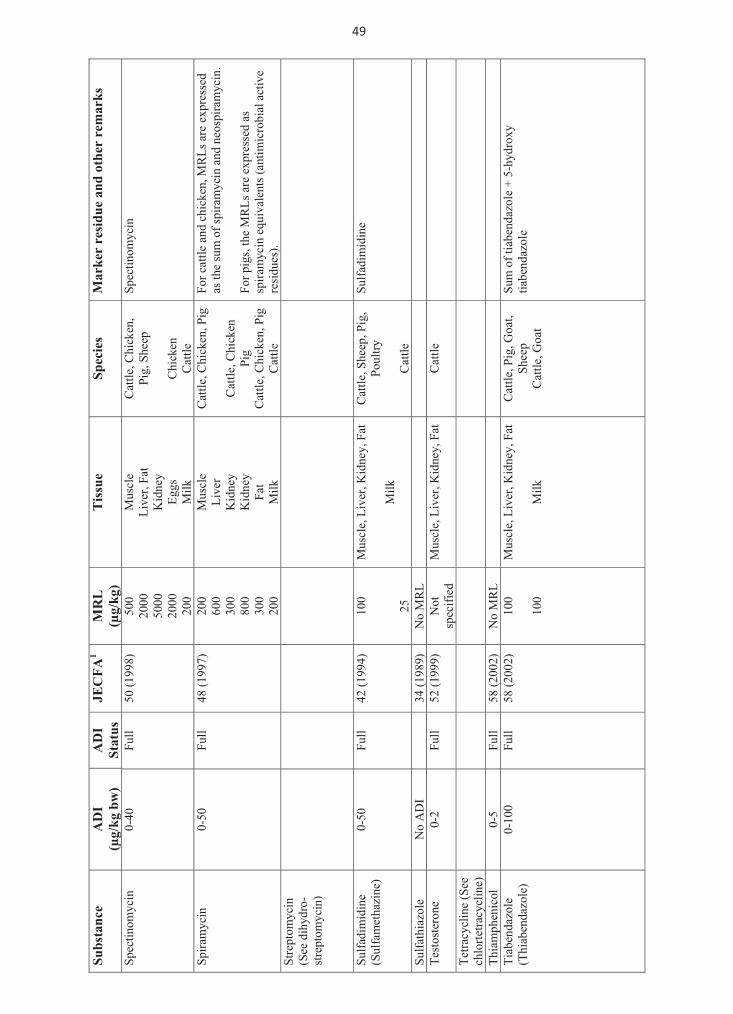
Su
bst
an
ce
AD
I
(g/k
g b
w)
AD
I
Sta
tus
JE
CF
A1
MR
L
(g/k
g)
Tis
sue
Sp
ecie
s M
ark
er r
esid
ue
an
d o
ther
rem
ark
s
Spec
tinom
ycin
0-
40
Full
50 (1
998)
50
0 20
00
5000
20
00
200
Mus
cle
Live
r, Fa
t K
idne
y Eg
gs
Milk
Cat
tle, C
hick
en,
Pig,
She
ep
C
hick
en
Cat
tle
Spec
tinom
ycin
Spira
myc
in
0-50
Fu
ll 48
(199
7)
200
600
300
800
300
200
Mus
cle
Live
r K
idne
y K
idne
y Fa
t M
ilk
Cat
tle, C
hick
en, P
ig
C
attle
, Chi
cken
Pi
g C
attle
, Chi
cken
, Pig
C
attle
For c
attle
and
chi
cken
, MR
Ls a
re e
xpre
ssed
as
the
sum
of s
pira
myc
in a
nd n
eosp
iram
ycin
. Fo
r pig
s, th
e M
RLs
are
exp
ress
ed a
s sp
iram
ycin
equ
ival
ents
(ant
imic
robi
al a
ctiv
e re
sidu
es).
Stre
ptom
ycin
(S
ee d
ihyd
ro-
stre
ptom
ycin
)
Sulfa
dim
idin
e (S
ulfa
met
hazi
ne)
0-50
Fu
ll 42
(199
4)
100 25
Mus
cle,
Liv
er, K
idne
y, F
at
M
ilk
Cat
tle, S
heep
, Pig
, Po
ultry
Cat
tle
Sulfa
dim
idin
e
L
RM o
N )9891( 43
I
DA o
N elozaihtafluS Te
stos
tero
ne
0-2
Full
52 (1
999)
N
ot
spec
ified
M
uscl
e, L
iver
, Kid
ney,
Fat
C
attle
Tetra
cycl
ine
(See
ch
lorte
tracy
clin
e)
L
RM o
N )2002( 85
lluF 5-0
locinehpmaihT Ti
aben
dazo
le
(Thi
aben
dazo
le)
0-10
0 Fu
ll 58
(200
2)
100
100
Mus
cle,
Liv
er, K
idne
y, F
at
M
ilk
Cat
tle, P
ig, G
oat,
Shee
p C
attle
, Goa
t
Sum
of t
iabe
ndaz
ole
+ 5-
hydr
oxy
tiabe
ndaz
ole
49
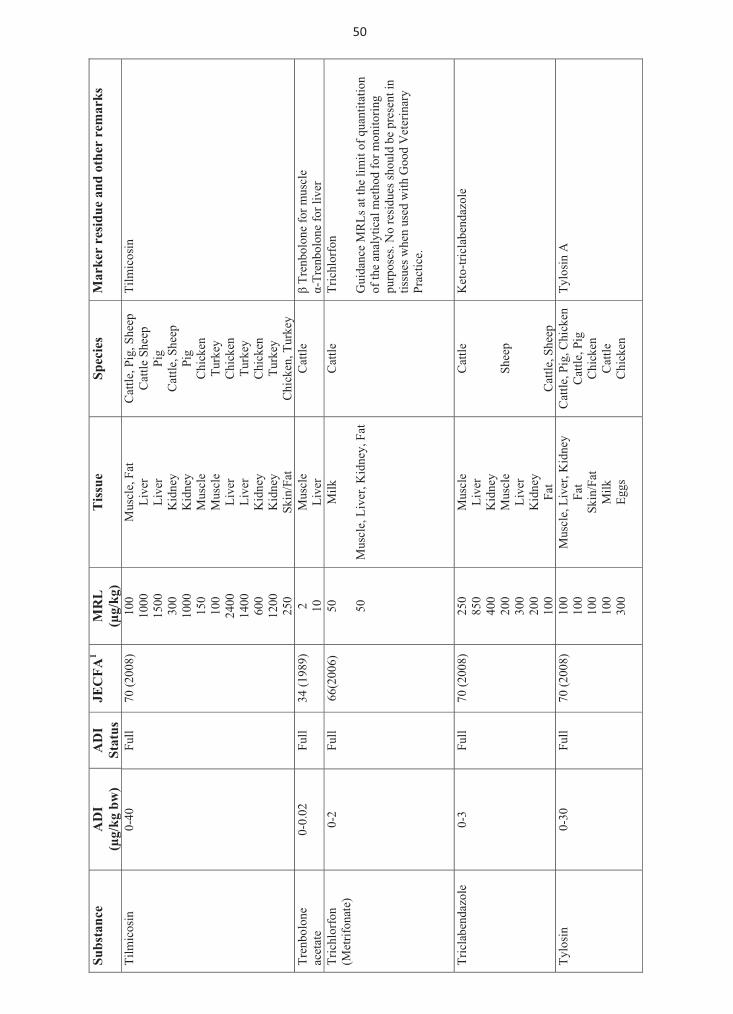
Su
bst
an
ce
AD
I
(g/k
g b
w)
AD
I
Sta
tus
JE
CF
A1
MR
L
(g/k
g)
Tis
sue
Sp
ecie
s M
ark
er r
esid
ue
an
d o
ther
rem
ark
s
Tilm
icos
in
0-40
Fu
ll 70
(200
8)
100
1000
15
00
300
1000
15
0 10
0 24
00
1400
60
0 12
00
250
Mus
cle,
Fat
Li
ver
Live
r K
idne
y K
idne
y M
uscl
e M
uscl
e Li
ver
Live
r K
idne
y K
idne
y Sk
in/F
at
Cat
tle, P
ig, S
heep
C
attle
She
ep
Pig
Cat
tle, S
heep
Pi
g C
hick
en
Turk
ey
Chi
cken
Tu
rkey
C
hick
en
Turk
ey
Chi
cken
, Tur
key
Tilm
icos
in
Tren
bolo
ne
acet
ate
0-0.
02
Full
34 (1
989)
2 10
M
uscl
e Li
ver
Cat
tle
Tre
nbol
one
for m
uscl
e -T
renb
olon
e fo
r liv
er
Tric
hlor
fon
(Met
rifon
ate)
0-
2 Fu
ll 66
(200
6)
50 50
Milk
Mus
cle,
Liv
er, K
idne
y, F
at
Cat
tle
Tric
hlor
fon
Gui
danc
e M
RLs
at t
he li
mit
of q
uant
itatio
n of
the
anal
ytic
al m
etho
d fo
r mon
itorin
g pu
rpos
es. N
o re
sidu
es sh
ould
be
pres
ent i
n tis
sues
whe
n us
ed w
ith G
ood
Vet
erin
ary
Prac
tice.
Tric
labe
ndaz
ole
0-3
Full
70 (2
008)
25
0 85
0 40
0 20
0 30
0 20
0 10
0
Mus
cle
Li
ver
Kid
ney
M
uscl
e Li
ver
Kid
ney
Fat
Cat
tle
Sh
eep
C
attle
, She
ep
Ket
o-tri
clab
enda
zole
Tylo
sin
0-30
Fu
ll 70
(200
8)
100
100
100
100
300
Mus
cle,
Liv
er, K
idne
y Fa
t Sk
in/F
at
Milk
Eg
gs
Cat
tle, P
ig, C
hick
en
Cat
tle, P
ig
Chi
cken
C
attle
C
hick
en
Tylo
sin
A
50
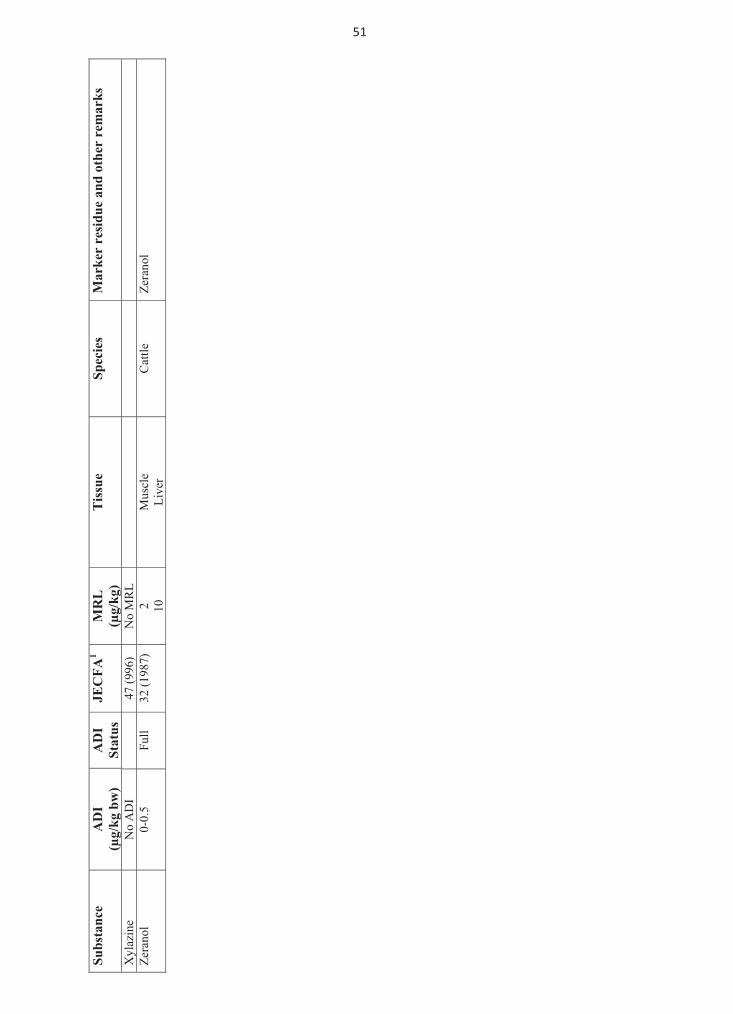
Su
bst
an
ce
AD
I
(g/k
g b
w)
AD
I
Sta
tus
JE
CF
A1
MR
L
(g/k
g)
Tis
sue
Sp
ecie
s M
ark
er r
esid
ue
an
d o
ther
rem
ark
s
L
RM o
N )699( 74
I
DA o
N enizaly
X Zera
nol
0-0.
5 Fu
ll 32
(198
7)
2 10
Mus
cle
Live
r C
attle
Ze
rano
l
51
��
FAO TECHNICAL PAPERS FAO JECFA MONOGRAPHS 1 Combined compendium of food additive specifications – JECFA specifications monographs from the 1st to the 65th
meeting. (E) Vol. 1 Food additives A – D Vol. 2 Food additives E – O Vol. 3 Food additives P – Z Vol. 4 Analytical methods, test procedures and laboratory solutions 2 Residue evaluation of certain veterinary drugs - Joint FAO/WHO Expert Committee on Food Additives 66th meeting 2006 (E) 3 Compendium of food additive specifications -
Joint FAO/WHO Expert Committee on Food Additives 67th meeting 2006 (E) 4 Compendium of food additive specifications -
Joint FAO/WHO Expert Committee on Food Additives 68th meeting 2007 (E) 5 Compendium of food additive specifications -
Joint FAO/WHO Expert Committee on Food Additives 69th meeting 2008 (E) 6 Residue evaluation of certain veterinary drugs -
Joint FAO/WHO Expert Committee on Food Additives 70th meeting 2008 (E) 7 Compendium of food additive specifications -
Joint FAO/WHO Expert Committee on Food Additives 71st meeting 2006 (E) 8 Safety evaluation of certain contaminants in food - Joint FAO/WHO Expert Committee on Food Additives 72nd meeting 2010 (E) Joint FAO/WHO publication WHO Food Additives Series No. 63/ FAO JECFA Monographs 8, in preparation. Availability: 2010
Ar – Arabic Multil – Multilingual C – Chinese * Out of print E – English ** In preparation F – French P – Portuguese S – Spanish The FAO Technical Papers are available through the authorized FAO Sales Agents or directly from Sales and Marketing Group, FAO, Viale delle Terme di Caracalla, 00153 Rome, Italy.
9 7 8 9 2 5 1 0 6 5 7 6 1I1618E/1/06.10/1000
ISBN 978-92-5-106576-1 ISSN 1817-7077