reserves and contingent resources report, and discounted
TRANSCRIPT

Reserves and Contingent Resources Report, and Discounted Cash Flow Data for Oil Assets of
Ithaca Energy (UK) Ltd., an Indirectly Wholly-Owned Subsidiary (100%) of the Company
Tel Aviv, March 22, 2021. Delek Group (TASE: DLEKG, US ADR: DGRLY) (“the Company”) announces
that, further to that stated in the immediate report issued by the Company on July 13, 2020 (Ref. No: 2020-01-074451) with regard to resources attributed to the oil assets held by Ithaca Energy (UK) Limited, an
indirectly held wholly-owned subsidiary (100%) of the Company (“Ithaca”)1, the Company is pleased to provide in this Report information on the reserves and contingent resources attributable to all of Ithaca's oil
assets, as of December 31, 2020, and discounted cash flow data attributable to these oil assets (below in
this Report: the “Oil Assets”)2.
1. NSAI Reserves Report
Attached to this Report, as Appendix A, is a resources report dated March 21, 2021, conducted by Netherland, Sewell & Associates Inc., the Company's independent reserves evaluator (“NSAI” or the
“Reserves Evaluator”), which was prepared in accordance with the guidelines of the Petroleum Resources
Management System (SPE-PRMS) and which contains, among other things, the NSAI assessments with regard to the volume of the reserves and contingent resources attributed to Ithaca's oil assets, as at
December 31, 2020 (the “NSAI Report” or the “Resources Report"). Also attached to this Report is a
letter of consent from NSAI to attach the Resource Report to this Report.
According to the NSAI Report, as set out below, there has been an increase in the volume of oil and
natural gas 2P reserves and in the volume of best estimate 2C contingent resources in all of Ithaca's oil assets, of 39.2 MBOE (less output in the second half of 2020 - see section 8 below) compared to NSAI’s
resources report that included a resource assessment with regard to oil assets, as of June 30, 2020 and
published by the Company on July 13, 2020 (Ref. No.: 2020-01-074451) ("the Previous Report").
Accordingly, the volume of 2P oil and natural gas reserves in all of Ithaca's oil assets, as at December 31, 2020, is 195.4 MMBOE (the Company’s share) and the discounted cash flow value with regard to
these reserves, at discounting rate of 10%, based on the underlying assumptions for the cash flows, is
USD 2.9 billion. In addition, the volume of best estimate (2C) contingent resources is 102.1 MMBOE (the Company’s share) and the discounted cash flow value with regard to these contingent resources, at
discounting rate of 10%, based on the underlying assumptions for the cash flows, is an additional USD
946.4 and all as set out in detail below.
Ithaca's oil assets and the resources attributed to them
1.1 Ithaca’s oil assets are all located on the UK Continental Shelf in the North Sea. According to the
Resources Report, Ithaca's oil assets are divided into four main asset groups, as follows:
1.1.1 The oil assets in the Captain area, which include the Captain and Nutmeg-Surprise
reservoirs (the “Captain Area”);
1.1.2 The Greater Stella Area project, comprising three on-production assets (Stella, Harrier
and Vorlich) and several additional assets that, as at Reporting Date, are non-producing
(the “GSA Area”).
1 Oil assets held by Ithaca Oil and Gas Ltd., which is a wholly owned subsidiary of Ithaca. 2 For definitions of some of the professional terms mentioned in this Report, see the Appendix attached to page A-262
of the Company's 2019 Periodic Report.

1.1.3 A cluster of oil fields for which Ithaca’s subsidiaries serve as Operator (“Group of
Operated Assets”);
1.1.4 A cluster of oil fields that are not operated by Ithaca Group companies (the “Cluster
of Other Non-Operated Assets”).
The table below provides key information from the Resource Report regarding the volume of proved
and probable reserves (2P) and the volume of best estimate contingent resources (2C), attributable
to Ithaca's share in all its oil assets (consolidated), as at December 31, 2020, in MBOE3:
2P Reserves (MBOE)
2C Contingent Resources
(MBOE)
Captain Area 89,103.8 25,672.6
GSA Area 30,896.3 29,092.8
Operated assets 29,130.5 38,387.2
Non-Operated assets 46,363.3 8,961.2
Total Ithaca Assets 195,493.8 102,113.8
1.2 According to the Resources Report, the contingent resources attributed to Ithaca's oil assets are contingent on the commitment to develop the fields and complete the development plans
for the assets. NSAI notes in the Resource Report that its assessments of the contingent resources do not include the possibility of the conditions required for these contingent
resources will not exist, and also states that there is no certainty that the development of
the contingent resources will lead to commercial production from any of these assets.
1.3 The Resource Report sets out clarification of the method used for preparing the Report, and
as part thereof, the Report notes that, (a) NSAI’s assessment of reserves and contingent resources was performed in accordance with the generally accepted SPE Standards for
estimating and auditing of oil and gas field reserves; (b) NSAI did not visit the various sites for preparation of the Report and or check the mechanical operation of the facilities and
wells, or their state; (c) NSAI used standards engineering and geoscience testing methods
to test geoscience and engineering information received from Ithaca, from public sources and from non-confidential information in NSAI's possession; (d) NSAI did not examine the
possible exposure arising from environmental issues. Nonetheless, NSAI noted that it is unaware of any possible environmental obligation that could have a material effect on the
volume of estimated reserves or resources in the reserves report, or on commercial
production, therefore the reserves report does not include the costs that could arise from such obligation; (e) NSAI noted that the estimated volume of reserves should not be deemed
as precise volumes as the assessments on which the Reserves Report is based are subject to risks and uncertainty that could lead to differences in the actual results compared with the
results of the forecasts in the report; (f) NSAI based its assessment on the fact that the reservoirs will be developed in accordance with the working plans it received from Ithaca,
will be operated reasonably, and based on the existing regulatory situation, assuming that
no new regulatory provisions will be regulated that will affect the ability of the holder of the oil rights to produce the estimated volumes and that its forecasts for future production will
be similar to actual performance of the reservoirs; (g) NSAI did not review the contractual rights in the assets or conduct its own evaluation regarding the type of rights and their
validity.
3 Conversion key - the conversion to MMBOE was estimated considering the following data: conversion rate of
natural gas is 1:5.8 BOE to mmcf, i.e. each 5.8 MMCF is equivalent to 1 BOE. the key to the conversion of oil and LPG units is 1:1 BBL to BOE, i.e. every 1 BBL is equivalent to 1 BOE. Caution - MMBOE units may be misleading, especially when used without taking into account additional characteristics; the conversion is made according to the energy ratio at the burner and does not represent a value equivalent

Forward-looking information: NSAI ’s assessments in respect of the volumes of the
reserves and contingent resources attributed to Ithaca’s oil assets as set out in this Report and in the Resources Report, constitute forward-looking information as defined
in the Israel Securities Law, 1968 ("the Securities Law”).
These estimates are partially based on geological, geophysical, engineering and other information received from the wells, and are the estimates and assumptions of NSAI
alone and there can be no certainty in respect of them. Actual quantities of oil, natural gas, condensate and petroleum liquids that will be produced may be different from
these estimates and assumptions, partly due to technical and operational conditions and/or regulatory changes and/or the supply and demand for such energy products
and/or commercial conditions and/or resulting from the actual performance of the
reservoirs. The estimates and assumptions may be updated if additional information becomes available and/or as the result of a range of factors related to oil and natural
gas exploration and production, including due to continued production from the oil
assets.
2. Resources and discounted cash flow information relating to all of Ithaca's oil assets
(consolidated)
Resources and discounted cash flow information attributed to all of Ithaca's oil assets
(consolidated) All the following information is based on the NSAI Report.
2.1 Reserves attributed to all of Ithaca’s oil assets (consolidated)
2.1.1 Quantitative data
Breakdown of the volumes of reserves attributable to all of Ithaca's oil assets
(consolidated) at December 31, 2020.
Forward-looking information: Possible Reserves are the additional reserves that are not
expected to be produced to the same extent as Probable Reserves. There is a 10% chance that actual quantities produced will be equivalent to or higher than the proved
reserves, with the addition of the quantity of the probable and possible reserves.
Reserves in all of Ithaca’s oil assets (consolidated)
Heavy oil
MBBL Light oil
MBBL Natural gas
(MMCF) Heavy oil
MBBL Light oil
MBBL Natural gas
(MMCF)
Gas liquids (NGL) (MBBL)
(MBOE)
Resources Category
Resources in oil asset (100%) Company's share in resources
Proved Reserves (1P)
76,983.8 152,760.7 1,440,061.2 64,557.0 19,464.1 217,487.2 6,796.2 128,315.2
Probable Reserves
55,226.2 61,024.0 445,927.6 30,945.9 16,183.8 96,251.2 3,453.9 67,178.7
Proved + Probable Reserves (2P)
132,210.0 213,784.8 1,885,988.8 95,502.9 35,647.9 313,738.4 10,250.2 195,493.8
Possible Reserves
52,562.0 87,567.6 609,840.2 36,907.3 16,026.2 120,882.3 3,915.9 77,691.1
Proved + Probable + Possible Reserves (3P)
184,772.0 301,352.3 2,495,829.0 132,410.2 51,674.1 434,620.6 14,166.0 273,184.9
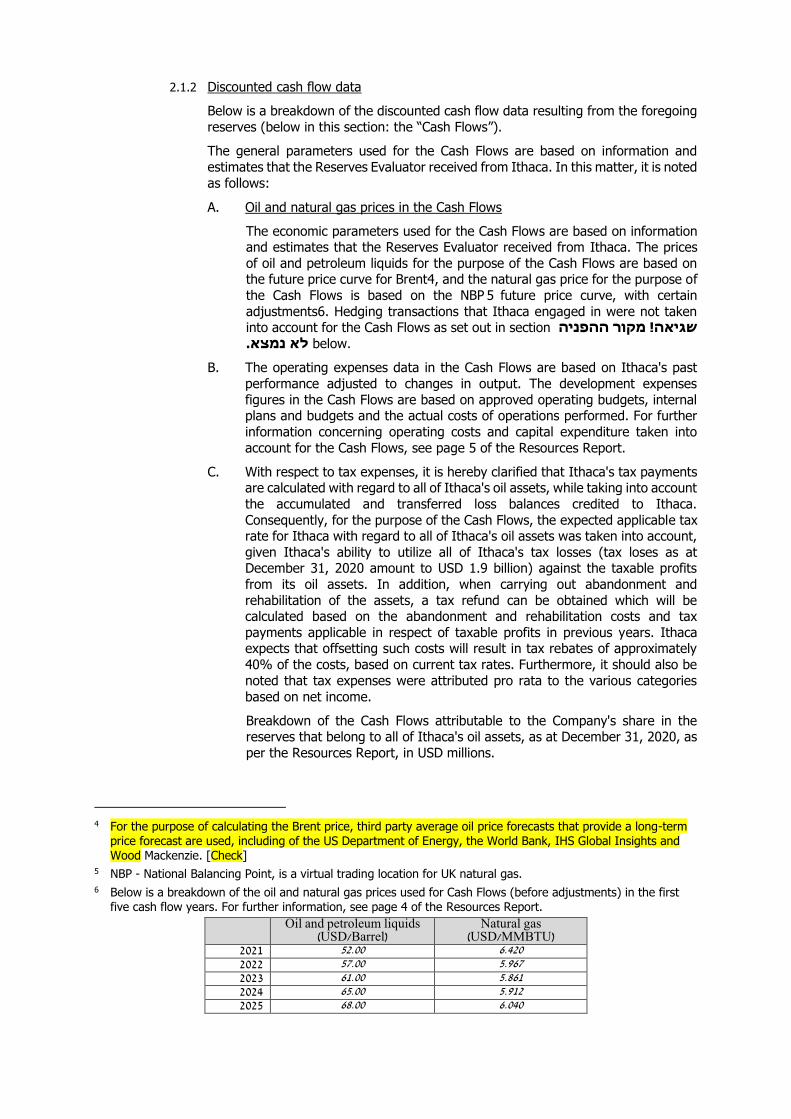
2.1.2 Discounted cash flow data
Below is a breakdown of the discounted cash flow data resulting from the foregoing
reserves (below in this section: the “Cash Flows”).
The general parameters used for the Cash Flows are based on information and
estimates that the Reserves Evaluator received from Ithaca. In this matter, it is noted
as follows:
A. Oil and natural gas prices in the Cash Flows
The economic parameters used for the Cash Flows are based on information and estimates that the Reserves Evaluator received from Ithaca. The prices
of oil and petroleum liquids for the purpose of the Cash Flows are based on the future price curve for Brent4, and the natural gas price for the purpose of
the Cash Flows is based on the NBP 5 future price curve, with certain
adjustments6. Hedging transactions that Ithaca engaged in were not taken into account for the Cash Flows as set out in section שגיאה! מקור ההפניה
.below לא נמצא.
B. The operating expenses data in the Cash Flows are based on Ithaca's past
performance adjusted to changes in output. The development expenses
figures in the Cash Flows are based on approved operating budgets, internal plans and budgets and the actual costs of operations performed. For further
information concerning operating costs and capital expenditure taken into
account for the Cash Flows, see page 5 of the Resources Report.
C. With respect to tax expenses, it is hereby clarified that Ithaca's tax payments are calculated with regard to all of Ithaca's oil assets, while taking into account
the accumulated and transferred loss balances credited to Ithaca.
Consequently, for the purpose of the Cash Flows, the expected applicable tax rate for Ithaca with regard to all of Ithaca's oil assets was taken into account,
given Ithaca's ability to utilize all of Ithaca's tax losses (tax loses as at December 31, 2020 amount to USD 1.9 billion) against the taxable profits
from its oil assets. In addition, when carrying out abandonment and
rehabilitation of the assets, a tax refund can be obtained which will be calculated based on the abandonment and rehabilitation costs and tax
payments applicable in respect of taxable profits in previous years. Ithaca expects that offsetting such costs will result in tax rebates of approximately
40% of the costs, based on current tax rates. Furthermore, it should also be
noted that tax expenses were attributed pro rata to the various categories
based on net income.
Breakdown of the Cash Flows attributable to the Company's share in the reserves that belong to all of Ithaca's oil assets, as at December 31, 2020, as
per the Resources Report, in USD millions.
4 For the purpose of calculating the Brent price, third party average oil price forecasts that provide a long-term
price forecast are used, including of the US Department of Energy, the World Bank, IHS Global Insights and Wood Mackenzie. [Check]
5 NBP - National Balancing Point, is a virtual trading location for UK natural gas. 6 Below is a breakdown of the oil and natural gas prices used for Cash Flows (before adjustments) in the first
five cash flow years. For further information, see page 4 of the Resources Report.
Oil and petroleum liquids (USD/Barrel)
Natural gas (USD/MMBTU)
2021 52.00 6.420 2022 57.00 5.967 2023 61.00 5.861 2024 65.00 5.912 2025 68.00 6.040

Note: It is clarified that the discounted cash flow figures, whether they have been calculated at a specific discount rate or without a discount rate, represent the present
value but not necessarily the fair value.
Forward-looking information: The discounted cash flows set out in this report are
forward-looking information as defined as defined in Section 32A of the Israel
Securities Law. The cash flow figures are based on various assumptions, inter alia, with respect to the volumes of oil and natural gas that will be produced, future market
conditions and energy prices, operating costs, capital expenditure, abandonment expenses and taxes, and there is no certainty whether these will materialize. The
volumes of oil and natural gas that will actually be produced, the selling prices and the various expenses may actually differ materially from the estimates and assumptions on
which the Cash Flows are based due to, among others, global macroeconomic
conditions, supply and demand for energy products, operating and technical conditions, regulatory changes and other factors that are out of, partially or wholly, Ithaca’s
control.

Discounted cash flows from proved reserves (1P) from all of Ithaca’s oil assets (consolidated), as at December 31, 2020, in USD thousands, with regard to the Company's share
End of Period Date
Output volume (MBOE)
Total revenue
Royalty payments
Operating expenses
Development costs
Abandonment costs
Cash flow before
tax Tax 0% 5% 10% 15% 20%
Dec 31, 2021 19,698 888,808 2,205 304,358 155,540 - 426,706 - 426,706 417,712 409,391 401,664 394,464
Dec 31, 2022 18,060 858,667 1,366 281,228 206,093 - 369,980 - 369,980 344,083 321,137 300,691 282,377
Dec 31, 2023 16,916 867,546 956 276,538 280,081 - 309,971 - 309,971 274,331 244,221 218,583 196,595
Dec 31, 2024 14,298 763,836 1,865 286,111 196,328 28,433 251,099 - 251,099 211,424 179,496 153,541 132,245
Dec 31, 2025 18,376 1,099,590 2,052 288,099 137,296 29,002 643,142 41,100 602,042 483,708 392,681 321,805 266,005
Dec 31, 2026 13,038 813,194 1,543 221,592 142,236 35,625 412,198 123,659 288,539 221,568 172,282 135,492 107,672
Dec 31, 2027 9,094 599,474 567 191,771 95,433 61,586 250,116 75,035 175,081 127,371 94,064 70,423 53,387
Dec 31, 2028 7,175 507,521 - 166,876 65,112 80,993 194,540 58,362 136,178 93,918 65,916 47,005 34,012
Dec 31, 2029 5,226 387,184 - 148,520 12,568 69,621 156,476 46,943 109,533 72,252 48,603 33,283 23,167
Dec 31, 2030 2,695 218,420 - 114,684 8,609 97,768 (2,640) (1,056) (1,584) (527) (47) 154 222
Dec 31, 2031 1,791 146,623 - 114,582 732 85,910 (54,601) (21,840) (32,760) (19,228) (11,561) (7,106) (4,457)
Dec 31, 2032 846 68,398 - 60,556 - 87,628 (79,786) (31,914) (47,871) (26,984) (15,618) (9,260) (5,613)
Dec 31, 2033 182 11,233 - 6,320 - 228,705 (223,791) (89,516) (134,275) (72,848) (40,659) (23,287) (13,657)
Dec 31, 2034 170 10,800 - 6,412 - 142,111 (137,723) (55,089) (82,634) (42,940) (23,000) (12,665) (7,153)
Dec 31, 2035 159 10,327 - 6,509 - 144,953 (141,135) (56,454) (84,681) (41,908) (21,427) (11,285) (6,108)
Dec 31, 2036 149 9,938 - 6,609 - 147,852 (144,523) (57,809) (86,714) (40,870) (19,946) (10,049) (5,212)
Dec 31, 2037 140 9,567 - 6,713 - - 2,854 856 1,998 894 416 200 99
Dec 31, 2038 125 8,782 - 6,771 - - 2,012 603 1,408 602 268 124 59
Dec 31, 2039 112 8,067 - 6,838 - - 1,230 369 861 350 148 65 30
Dec 31, 2040 63 4,605 - 4,059 - - 546 164 382 150 61 26 12
Dec 31, 2041 - - - - - 16,079 (16,079) (6,432) (9,648) (3,536) (1,358) (544) (227)
Dec 31, 2042 - - - - - 16,401 (16,401) (6,560) (9,841) (3,435) (1,259) (483) (193)
Dec 31, 2043 - - - - - 16,729 (16,729) (6,692) (10,037) (3,337) (1,168) (428) (164)
Dec 31, 2044 - - - - - 17,064 (17,064) (6,825) (10,238) (3,242) (1,083) (380) (139)
Dec 31, 2045 - - - - - - - - - - - - -
Total 128,315 7,292,581 10,554 2,505,145 1,300,026 1,306,458 2,170,399 6,903 2,163,496 1,989,509 1,791,558 1,607,568 1,447,425

Discounted cash flows from probable reserves from all of Ithaca’s oil assets (consolidated), as at December 31, 2020 in USD thousands, with regard to the Company's share
End of Period Date
Output volume (MBOE)
Total revenue
Royalty payments
Operating expenses
Development costs
Abandonment costs
Cash flow before tax Tax 0% 5% 10% 15% 20%
Dec 31, 2021 3,362 162,823 432 7,758 27,473 - 127,160 - 127,160 123,784 120,670 117,786 115,106
Dec 31, 2022 5,194 268,881 435 38,217 106,771 - 123,459 - 123,459 114,474 106,545 99,507 93,226
Dec 31, 2023 6,986 380,001 408 59,443 28,956 - 291,194 - 291,194 257,707 229,415 205,325 184,664
Dec 31, 2024 8,092 456,500 1,365 64,938 38,114 (28,433) 380,516 124,856 255,661 215,073 182,425 155,897 134,142
Dec 31, 2025 9,731 575,623 1,421 83,432 5,126 (29,002) 514,646 337,231 177,414 142,604 115,813 94,942 78,503
Dec 31, 2026 8,553 521,527 885 142,287 1,228 (35,625) 412,753 197,354 215,398 165,218 128,321 100,803 80,015
Dec 31, 2027 7,212 446,290 1,459 170,563 2,494 (61,586) 333,360 152,235 181,125 132,494 98,357 74,000 56,361
Dec 31, 2028 5,109 315,562 1,764 119,001 913 (80,993) 274,877 125,278 149,599 104,584 74,351 53,671 39,288
Dec 31, 2029 3,971 244,794 1,362 110,216 745 (49,930) 182,401 87,776 94,625 62,787 42,466 29,228 20,440
Dec 31, 2030 2,485 168,089 - 80,434 760 (647) 87,542 34,431 53,111 33,758 21,908 14,490 9,752
Dec 31, 2031 918 74,446 - 9,202 - 90,687 (25,443) (10,177) (15,266) (8,664) (5,039) (2,997) (1,819)
Dec 31, 2032 1,216 101,393 - 57,612 - 12,352 31,430 12,572 18,858 10,608 6,128 3,626 2,194
Dec 31, 2033 1,621 141,889 - 112,965 - (141,097) 170,020 68,008 102,012 55,649 31,223 17,973 10,591
Dec 31, 2034 1,425 129,531 - 114,229 - (18,091) 33,393 13,357 20,036 10,524 5,692 3,161 1,799
Dec 31, 2035 1,033 94,041 - 89,161 - (109,600) 114,480 45,792 68,688 33,722 17,109 8,943 4,805
Dec 31, 2036 191 11,042 - 9,668 - 22,148 (20,774) (8,310) (12,464) (5,358) (2,381) (1,090) (513)
Dec 31, 2037 55 3,316 - 2,525 - 173,400 (172,610) (68,758) (103,851) (46,111) (21,264) (10,150) (5,000)
Dec 31, 2038 13 862 - 89 - 153,825 (153,052) (61,020) (92,032) (38,672) (16,917) (7,677) (3,602)
Dec 31, 2039 13 877 - 93 - 156,902 (156,118) (62,324) (93,794) (37,533) (15,672) (6,802) (3,059)
Dec 31, 2040 - - - - - 15,058 (15,058) (5,969) (9,090) (3,593) (1,483) (636) (283)
Dec 31, 2041 - - - - - 15,359 (15,359) (6,144) (9,216) (3,470) (1,367) (561) (239)
Dec 31, 2042 - - - - - - - - - - - - -
Dec 31, 2043 - - - - - - - - - - - - -
Dec 31, 2044 - - - - - - - - - - - - -
Dec 31, 2045 - - - - - - - - - - - - -
Total 67,179 4,097,487 9,531 1,271,833 212,579 84,728 2,518,816 976,190 1,542,626 1,319,583 1,116,298 949,439 816,371

Discounted cash flows from proved and probable reserves (2P) from all of Ithaca’s oil assets (consolidated), as at December 31, 2020, in USD thousands, for the Company's share
End of Period Date
Output volume (MBOE)
Total revenue
Royalty payments
Operating expenses
Development costs
Abandonment costs
Cash flow before tax Tax 0% 5% 10% 15% 20%
Dec 31, 2021 23,061 1,051,631 2,637 312,116 183,013 - 553,865 - 553,865 541,496 530,061 519,450 509,571
Dec 31, 2022 23,255 1,127,547 1,800 319,445 312,864 - 493,439 - 493,439 458,557 427,682 400,198 375,603
Dec 31, 2023 23,903 1,247,547 1,365 335,980 309,038 - 601,165 - 601,165 532,037 473,636 423,908 381,259
Dec 31, 2024 22,390 1,220,336 3,230 351,048 234,442 - 631,616 124,856 506,760 426,497 361,921 309,438 266,387
Dec 31, 2025 28,107 1,675,214 3,473 371,531 142,422 - 1,157,788 378,331 779,457 626,313 508,494 416,747 344,508
Dec 31, 2026 21,591 1,334,722 2,428 363,880 143,464 - 824,951 321,014 503,937 386,786 300,603 236,295 187,686
Dec 31, 2027 16,307 1,045,763 2,026 362,334 97,927 - 583,477 227,270 356,206 259,865 192,421 144,423 109,748
Dec 31, 2028 12,284 823,083 1,764 285,877 66,024 - 469,417 183,640 285,777 198,502 140,266 100,676 73,300
Dec 31, 2029 9,197 631,978 1,362 258,736 13,312 19,690 338,877 134,719 204,158 135,039 91,069 62,511 43,607
Dec 31, 2030 5,179 386,509 - 195,117 9,368 97,121 84,902 33,375 51,527 33,231 21,861 14,644 9,974
Dec 31, 2031 2,709 221,069 - 123,784 732 176,597 (80,044) (32,018) (48,026) (27,892) (16,600) (10,103) (6,276)
Dec 31, 2032 2,062 169,792 - 118,168 - 99,979 (48,356) (19,342) (29,014) (16,376) (9,490) (5,634) (3,419)
Dec 31, 2033 1,803 153,122 - 119,285 - 87,608 (53,771) (21,508) (32,262) (17,200) (9,436) (5,314) (3,065)
Dec 31, 2034 1,595 140,331 - 120,641 - 124,020 (104,329) (41,732) (62,598) (32,415) (17,309) (9,504) (5,354)
Dec 31, 2035 1,192 104,367 - 95,670 - 35,353 (26,656) (10,662) (15,993) (8,185) (4,318) (2,342) (1,303)
Dec 31, 2036 340 20,980 - 16,277 - 170,000 (165,297) (66,119) (99,178) (46,227) (22,327) (11,139) (5,725)
Dec 31, 2037 195 12,883 - 9,238 - 173,400 (169,756) (67,902) (101,853) (45,217) (20,848) (9,950) (4,901)
Dec 31, 2038 138 9,644 - 6,859 - 153,825 (151,040) (60,416) (90,624) (38,070) (16,649) (7,553) (3,543)
Dec 31, 2039 125 8,945 - 6,931 - 156,902 (154,888) (61,955) (92,933) (37,184) (15,524) (6,737) (3,029)
Dec 31, 2040 63 4,605 - 4,059 - 15,058 (14,512) (5,805) (8,707) (3,443) (1,421) (610) (271)
Dec 31, 2041 - - - - - 31,439 (31,439) (12,576) (18,863) (7,007) (2,725) (1,105) (466)
Dec 31, 2042 - - - - - 16,401 (16,401) (6,560) (9,841) (3,435) (1,259) (483) (193)
Dec 31, 2043 - - - - - 16,729 (16,729) (6,692) (10,037) (3,337) (1,168) (428) (164)
Dec 31, 2044 - - - - - 17,064 (17,064) (6,825) (10,238) (3,242) (1,083) (380) (139)
Dec 31, 2045 - - - - - - - - - - - - -
Total 195,494 11,390,06
9 20,085 3,776,978 1,512,605 1,391,186 4,689,215 983,093 3,706,122 3,309,092 2,907,856 2,557,008 2,263,796

Discounted cash flows from possible reserves from all of Ithaca’s oil assets (consolidated), as at December 31, 2020 in USD thousands, with regard to the Company's share
End of Period Date
Output volume (MBOE)
Total revenue
Royalty payments
Operating expenses
Development costs
Abandonment costs
Cash flow before tax Tax 0% 5% 10% 15% 20%
Dec 31, 2021 3,074 144,580 382 (724) (5,421) - 150,343 - 150,343 146,283 142,539 139,073 135,854
Dec 31, 2022 4,429 227,085 416 617 - - 226,052 - 226,052 210,008 195,809 183,170 171,861
Dec 31, 2023 5,020 275,567 412 9,446 - - 265,710 128,002 137,707 121,965 108,654 97,311 87,575
Dec 31, 2024 4,177 240,696 801 11,775 (26,267) - 254,387 156,692 97,695 82,626 70,438 60,482 52,277
Dec 31, 2025 6,815 410,331 1,711 15,303 26,792 - 366,525 220,818 145,707 115,935 93,242 75,727 62,055
Dec 31, 2026 7,766 475,527 870 27,770 - - 446,887 178,755 268,132 205,412 159,355 125,049 99,161
Dec 31, 2027 6,063 392,457 654 24,552 - - 364,577 145,664 218,913 159,640 118,160 88,651 67,341
Dec 31, 2028 6,129 419,403 576 96,583 - - 322,244 128,898 193,347 134,297 94,894 68,106 49,583
Dec 31, 2029 5,224 366,120 732 93,593 - (19,690) 291,486 116,594 174,891 116,004 78,443 53,985 37,754
Dec 31, 2030 5,146 335,787 1,916 126,999 - (83,579) 290,450 116,180 174,270 109,462 70,278 46,029 30,702
Dec 31, 2031 5,132 321,707 1,760 161,348 387 (156,111) 314,323 125,659 188,663 112,474 68,698 42,897 27,332
Dec 31, 2032 4,271 279,346 1,156 150,746 395 (79,084) 206,132 82,428 123,704 70,649 41,420 24,870 15,262
Dec 31, 2033 2,883 206,377 - 101,844 - (5,547) 110,080 44,032 66,048 36,062 20,254 11,672 6,886
Dec 31, 2034 2,376 177,691 - 93,156 - (40,632) 125,167 50,067 75,100 39,262 21,157 11,719 6,657
Dec 31, 2035 2,168 168,804 - 94,557 - (20,722) 94,969 37,988 56,982 28,389 14,613 7,748 4,222
Dec 31, 2036 1,788 177,141 - 113,505 - (77,031) 140,667 56,267 84,400 40,119 19,738 10,020 5,235
Dec 31, 2037 1,661 164,425 - 120,814 - (78,571) 122,182 48,873 73,309 33,273 15,663 7,622 3,824
Dec 31, 2038 1,489 149,479 - 123,966 - (19,583) 45,096 18,038 27,057 11,634 5,199 2,407 1,151
Dec 31, 2039 1,349 137,865 - 125,461 - (19,974) 32,378 12,951 19,427 7,962 3,398 1,505 690
Dec 31, 2040 732 77,459 - 73,572 - 23,974 (20,088) (8,035) (12,053) (4,707) (1,920) (815) (359)
Dec 31, 2041 - - - - - 187,694 (187,694) (75,078) (112,617) (41,388) (15,934) (6,400) (2,672)
Dec 31, 2042 - - - - - 166,505 (166,505) (66,602) (99,903) (34,897) (12,800) (4,908) (1,960)
Dec 31, 2043 - - - - - 169,836 (169,836) (67,934) (101,901) (33,900) (11,869) (4,353) (1,666)
Dec 31, 2044 - - - - - 173,232 (173,232) (69,293) (103,939) (32,931) (11,005) (3,861) (1,416)
Dec 31, 2045 - - - - - - - - - - - - -
Total 77,691 5,147,848 11,387 1,564,882 (1,438) 120,718 3,452,300 1,380,964 2,071,336 1,633,633 1,288,423 1,037,706 857,349

Discounted cash flows from proved + probable + possible reserves (3P) from all of Ithaca’s oil assets (consolidated), as at December 31, 2020, in USD thousands, for the Company's
share
End of Period Date
Output volume (MBOE)
Total revenue
Royalty payments
Operating expenses
Development costs
Abandonment costs
Cash flow before tax Tax 0% 5% 10% 15% 20%
Dec 31, 2021 26,134 1,196,211 3,019 311,392 177,592 - 704,209 - 704,209 687,779 672,599 658,523 645,425
Dec 31, 2022 27,683 1,354,632 2,216 320,062 312,864 - 719,491 - 719,491 668,564 623,491 583,368 547,464
Dec 31, 2023 28,923 1,523,114 1,777 345,426 309,038 - 866,875 128,002 738,872 654,003 582,291 521,219 468,834
Dec 31, 2024 26,567 1,461,032 4,032 362,823 208,175 - 886,003 281,548 604,455 509,123 432,359 369,920 318,664
Dec 31, 2025 34,922 2,085,545 5,184 386,834 169,214 - 1,524,313 599,149 925,164 742,247 601,735 492,474 406,563
Dec 31, 2026 29,357 1,810,248 3,298 391,649 143,464 - 1,271,838 499,769 772,069 592,198 459,957 361,344 286,847
Dec 31, 2027 22,369 1,438,221 2,680 386,886 100,601 - 948,053 372,934 575,120 419,505 310,581 233,074 177,088
Dec 31, 2028 18,413 1,242,486 2,339 382,461 66,024 - 791,662 312,538 479,124 332,798 235,160 168,783 122,883
Dec 31, 2029 14,421 998,098 2,094 352,329 13,312 - 630,363 251,313 379,050 251,043 169,513 116,496 81,361
Dec 31, 2030 10,326 722,295 1,916 322,116 9,368 13,542 375,352 149,555 225,797 142,693 92,139 60,673 40,676
Dec 31, 2031 7,841 542,776 1,760 285,132 1,119 20,486 234,278 93,641 140,637 84,582 52,098 32,794 21,056
Dec 31, 2032 6,333 449,138 1,156 268,915 395 20,895 157,776 63,086 94,690 54,273 31,929 19,236 11,844
Dec 31, 2033 4,686 359,499 - 221,129 - 82,061 56,309 22,524 33,786 18,862 10,818 6,358 3,821
Dec 31, 2034 3,971 318,022 - 213,797 - 83,387 20,838 8,335 12,503 6,847 3,848 2,215 1,303
Dec 31, 2035 3,360 273,171 - 190,227 - 14,631 68,313 27,325 40,988 20,204 10,295 5,406 2,919
Dec 31, 2036 2,128 198,122 - 129,782 - 92,970 (24,630) (9,852) (14,778) (6,109) (2,589) (1,119) (489)
Dec 31, 2037 1,855 177,308 - 130,052 - 94,829 (47,573) (19,029) (28,544) (11,944) (5,185) (2,327) (1,076)
Dec 31, 2038 1,626 159,123 - 130,825 - 134,243 (105,945) (42,378) (63,567) (26,435) (11,449) (5,146) (2,392)
Dec 31, 2039 1,475 146,810 - 132,393 - 136,928 (122,510) (49,004) (73,506) (29,221) (12,125) (5,232) (2,339)
Dec 31, 2040 795 82,064 - 77,632 - 39,032 (34,600) (13,840) (20,760) (8,151) (3,342) (1,425) (630)
Dec 31, 2041 - - - - - 219,133 (219,133) (87,653) (131,480) (48,395) (18,659) (7,505) (3,138)
Dec 31, 2042 - - - - - 182,906 (182,906) (73,163) (109,744) (38,332) (14,059) (5,391) (2,153)
Dec 31, 2043 - - - - - 186,565 (186,565) (74,626) (111,939) (37,237) (13,036) (4,781) (1,830)
Dec 31, 2044 - - - - - 190,296 (190,296) (76,118) (114,177) (36,173) (12,088) (4,241) (1,555)
Dec 31, 2045 - - - - - - - - - - - - -
Total 273,185 16,537,917 31,471 5,341,860 1,511,166 1,511,904 8,141,515 2,364,057 5,777,458 4,942,725 4,196,279 3,594,714 3,121,145

2.1.3 The following are sensitivity analyses for key parameters that make up Cash Flows (USD thousands)
Sensitivity analysis for change in sales volume for all Ithaca oil assets (consolidated)
Sensitivity/category
Discounting rate
Sensitivity/category
Discounting rate
0% 10% 15% 20% 0% 10% 15% 20%
Increase in sales volume at rate of 10% Decrease in sales volume at rate of 10%
Proved Reserves (1P) 2,624,555.7 2,391,031.9 2,140,850.6 1,913,463.3 Proved Reserves (1P) 1,762,097.4 1,624,631.8 1,463,972.4 1,313,336.8
Probable Reserves 1,671,840.5 1,410,757.9 1,179,242.7 993,452.5 Probable Reserves 1,435,039.4 1,253,064.9 1,077,673.2 928,294.5
Proved + Probable Reserves (2P) 4,296,396.2 3,801,789.8 3,320,093.3 2,906,915.8 Proved + Probable Reserves (2P) 3,197,136.9 2,877,696.7 2,541,645.6 2,241,631.3
Possible Reserves 2,264,014.5 1,755,434.5 1,367,831.4 1,092,252.6 Possible Reserves 1,889,119.2 1,507,178.1 1,204,012.0 981,584.5
Proved + Probable + Possible Reserves (3P)
6,560,410.7 5,557,224.3 4,687,924.7 3,999,168.3 Proved + Probable + Possible Reserves (3P)
5,086,256.1 4,384,874.8 3,745,657.6 3,223,215.8
Increase in sales volume at rate of 15% Decrease in sales volume at rate of 15%
Proved Reserves (1P) 2,844,989.6 2,587,529.4 2,308,277.4 2,053,650.0 Proved Reserves (1P) 1,580,103.1 1,461,152.0 1,316,696.7 1,180,018.3
Probable Reserves 1,734,815.2 1,445,024.0 1,201,147.5 1,011,788.4 Probable Reserves 1,369,394.4 1,201,871.2 1,037,096.3 894,898.2
Proved + Probable Reserves (2P) 4,579,804.8 4,032,553.4 3,509,424.8 3,065,438.4 Proved + Probable Reserves (2P) 2,949,497.5 2,663,023.2 2,353,793.0 2,074,916.5
Possible Reserves 2,371,507.3 1,823,652.3 1,412,660.7 1,123,427.4 Possible Reserves 1,796,231.4 1,443,940.5 1,162,891.7 955,219.6
Proved + Probable + Possible Reserves (3P)
6,951,312.1 5,856,205.7 4,922,085.5 4,188,865.8 Proved + Probable + Possible Reserves (3P)
4,745,728.9 4,106,963.8 3,516,684.7 3,030,136.1
Increase in sales volume at rate of 20% Decrease in sales volume at rate of 20%
Proved Reserves (1P) 3,054,060.6 2,761,141.7 2,455,387.8 2,180,908.3 Proved Reserves (1P) 1,335,426.3 1,255,306.2 1,143,495.2 1,032,974.6
Probable Reserves 1,812,717.7 1,503,076.1 1,243,158.0 1,042,118.0 Probable Reserves 1,380,604.6 1,204,518.3 1,036,290.6 892,097.0
Proved + Probable Reserves (2P) 4,866,778.3 4,264,217.8 3,698,545.8 3,223,026.2 Proved + Probable Reserves (2P) 2,716,030.9 2,459,824.6 2,179,785.8 1,925,071.6
Possible Reserves 2,471,129.2 1,883,689.5 1,451,979.2 1,151,528.9 Possible Reserves 1,705,873.5 1,371,546.9 1,105,004.8 907,571.0
Proved + Probable + Possible Reserves (3P)
7,337,907.5 6,147,907.3 5,150,525.0 4,374,555.1 Proved + Probable + Possible Reserves (3P)
4,421,904.4 3,831,371.4 3,284,790.6 2,832,642.7

Sensitivity analysis for price change for all Ithaca oil assets (consolidated)
Sensitivity/category
Discounting rate
Sensitivity/category
Discounting rate
0% 10% 15% 20% 0% 10% 15% 20%
Increase in price of 10% Decrease in price of 10%
Proved Reserves (1P) 2,645,852.4 2,170,097.5 1,945,692.2 1,752,241.4 Proved Reserves (1P) 1,708,240.4 1,576,743.5 1,420,464.2 1,273,379.3
Probable Reserves 1,766,891.0 1,244,582.6 1,047,095.7 892,871.6 Probable Reserves 1,366,940.7 1,193,648.7 1,026,682.5 883,762.8
Proved + Probable Reserves (2P) 4,412,743.5 3,414,680.1 2,992,787.9 2,645,113.0 Proved + Probable Reserves (2P) 3,075,181.0 2,770,392.3 2,447,146.7 2,157,142.0
Possible Reserves 2,382,452.7 1,427,170.9 1,138,917.6 934,989.4 Possible Reserves 1,783,116.5 1,432,239.5 1,148,857.4 938,404.4
Proved + Probable + Possible
Reserves (3P) 6,795,196.1 4,841,851.0 4,131,705.5 3,580,102.4
Proved + Probable + Possible
Reserves (3P) 4,858,297.5 4,202,631.8 3,596,004.1 3,095,546.4
Increase in price of 15% Decrease in price of 15%
Proved Reserves (1P) 2,875,737.9 2,354,648.5 2,104,386.8 1,888,525.0 Proved Reserves (1P) 1,442,698.3 1,339,147.2 1,209,757.1 1,085,897.2
Probable Reserves 1,870,310.3 1,295,640.8 1,088,719.9 930,326.4 Probable Reserves 1,314,285.8 1,153,106.7 995,140.2 858,173.2
Proved + Probable Reserves (2P) 4,746,048.1 3,650,289.3 3,193,106.8 2,818,851.3 Proved + Probable Reserves (2P) 2,756,984.1 2,492,253.9 2,204,897.3 1,944,070.4
Possible Reserves 2,530,122.3 1,492,522.5 1,188,308.7 974,439.8 Possible Reserves 1,627,591.7 1,325,296.8 1,074,626.2 885,190.5
Proved + Probable + Possible
Reserves (3P) 7,276,170.4 5,142,811.8 4,381,415.4 3,793,291.1
Proved + Probable + Possible
Reserves (3P) 4,384,575.8 3,817,550.7 3,279,523.5 2,829,261.0
Increase in price of 20% Decrease in price of 20%
Proved Reserves (1P) 3,111,682.4 2,535,276.8 2,264,322.5 2,031,892.1 Proved Reserves (1P) 1,104,004.7 1,054,156.4 968,127.9 878,476.8
Probable Reserves 1,983,155.0 1,352,094.1 1,130,235.0 962,061.1 Probable Reserves 1,339,277.5 1,142,841.6 971,494.2 829,876.8
Proved + Probable Reserves (2P) 5,094,837.3 3,887,371.0 3,394,557.4 2,993,953.3 Proved + Probable Reserves (2P) 2,443,282.2 2,196,998.0 1,939,622.1 1,708,353.5
Possible Reserves 2,689,481.2 1,571,861.3 1,246,759.1 1,019,529.8 Possible Reserves 1,473,173.2 1,234,860.5 1,020,883.4 851,889.1
Proved + Probable + Possible
Reserves (3P) 7,784,318.5 5,459,232.3 4,641,316.5 4,013,483.0
Proved + Probable + Possible
Reserves (3P) 3,916,455.4 3,431,858.5 2,960,505.5 2,560,242.6

2.2 Production Information
Breakdown of the production data for the Company’s share of all of Ithaca's oil assets
(consolidated):
2.3 Contingent Resources
Breakdown of the volumes of contingent reserves attributed to all of Ithaca's oil assets (consolidated)
at December 31, 2020. For further information concerning the discounted cash flows resulting from
these resources, see p. 51 of the Resources Report.
Forward-looking information: there is no certainty that production of any part of the
contingent resources is possible.
3. Captain Area resources and discounted cash flow data
Breakdown of resources and discounted cash flow data attributed to the Captain Area, at December 31,
2020. All the following information is based on the NSAI Report.
2020 2019
Oil Natural gas Condensate Oil
Natural gas
Condensate
Total output in the period 13,655,168 BBL
55,863 MCF
1,263,907 BBL
15,573,869 BBL
60,895 MCF
1,515,766 BBL
Average price per output unit (attributable to equity holders of the Company) (USD per BOE)
45.9 32.1 34.1 65.9 28.5 32.3
Average production costs per output unit (USD per BOE)
17.6 17.6 17.6 17.8 17.8 17.8
Royalties to third parties (every payment derived from the output of the on-production asset, including from the gross income from the oil asset) paid per output unit (attributable to equity holders of the Company) (USD per BOE)
0.7 0.7 0.7 0.2 0.2 0.2
Net production costs per output unit (USD per BOE)
27.6 13.8 15.8 47.9 10.5 14.3
Rate of depletion in the reporting period with respect to the total reserves in the oil asset (%)
12.8 12.8 12.8 11.8 11.8 11.8
Contingent resources in all of Ithaca’s oil assets (consolidated)
Heavy oil (MBBL)
Light oil (MBBL)
Natural gas
(MMCF)
Heavy oil (MBBL)
Light oil (MBBL)
Natural gas
(MMCF)
Gas liquids (NGL) (MBBL)
(MBOE)
Resources Category
Resources in oil asset (100%) Company's share in resources
Low estimate (1C)
25,185.6 5,522.8 68,329.1 23,758.8 1,154.1 18,089.4 429.9 28,461.6
Best estimate (2C)
52,506.2 95,039.5 362,790.6 46,852.5 29,285.6 145,872.8 825.2 102,113.8
High estimate (3C)
97,542.0 228,072.9 718,635.3 86,559.6 59,302.8 268,570.4 2,031.4 194,199.0

3.1 Reserves attributed to the Captain Area
3.1.1 Quantitative data
Breakdown of volume of reserves attributed to the Captain Area
Forward-looking information: Possible Reserves are the additional reserves that are not expected to be produced to the same extent as Probable Reserves. There is a 10% chance
that actual quantities produced will be equivalent to or higher than the proved reserves,
with the addition of the quantity of the probable and possible reserves.
3.1.2 Discounted cash flow data
Below is a breakdown of the discounted cash flow data resulting from the foregoing
reserves (below in this section: the “Cash Flows”).
The economic parameters used for the Cash Flows are based on information and estimates
that the Reserves Evaluator received from Ithaca. In this matter, see also section 2.1.2
above.
Note: It is clarified that the discounted cash flow figures, whether they have been calculated at a specific discount rate or without a discount rate, represent the present value but not
necessarily the fair value.
Captain Area reserves
Heavy oil (MBBL)
Light oil (MBBL)
Natural gas (MMCF)
Heavy oil (MBBL)
Light oil (MBBL)
Natural gas (MMCF)
Gas liquids (NGL) (MBBL)
(MBOE)
Reserves Category Resources in oil asset (100%) Company's share in resources
Proved Reserves
(1P) 75,557.1 0.0 0.0 64,223.6 0.0 0.0 0.0 64,223.6
Probable Reserves
29,270.8 0.0 0.0 24,880.2 0.0 0.0 0.0 24,880.2
Proved + Probable Reserves
(2P)
104,827.9 0.0 0.0 89,103.8 0.0 0.0 0.0 89,103.8
Possible Reserves
39,953.8 0.0 0.0 33,960.8 0.0 0.0 0.0 33,960.8
Proved + Probable
+ Possible Reserves
(3P)
144,781.8 0.0 0.0 123,064.5 0.0 0.0 0.0 123,064.5

Discounted cash flows from proved reserves (1P) in the Captain Area, as at December 31, 2020, in USD thousands, for the Company's share
End of Period Date
Output volume (MBOE)
Total revenue
Royalty payments
Operating expenses
Development costs
Abandonment costs
Cash flow before tax Tax 0% 5% 10% 15% 20%
Dec 31, 2021 5,466 288,745 - 95,726 120,506 - 72,514 - 72,514 71,420 70,400 69,445 68,550
Dec 31, 2022 6,143 355,274 - 96,756 198,075 - 60,443 - 60,443 56,262 52,553 49,243 46,275
Dec 31, 2023 6,906 427,014 - 98,778 280,081 - 48,154 - 48,154 42,193 37,206 33,000 29,425
Dec 31, 2024 5,950 391,708 - 96,141 144,948 - 150,619 - 150,619 126,960 107,900 92,388 79,648
Dec 31, 2025 11,568 796,204 - 106,837 136,710 - 552,658 35,317 517,340 415,380 336,995 275,997 228,002
Dec 31, 2026 8,709 625,603 - 105,307 142,236 - 378,061 113,418 264,643 203,114 157,852 124,082 98,556
Dec 31, 2027 6,171 467,959 - 102,154 95,433 - 270,372 81,112 189,261 137,959 102,075 76,559 58,139
Dec 31, 2028 5,209 415,833 - 101,980 65,112 - 248,741 74,622 174,119 120,829 85,305 61,176 44,506
Dec 31, 2029 3,902 323,242 - 101,568 12,568 - 209,106 62,732 146,374 96,972 65,498 45,025 31,454
Dec 31, 2030 2,233 193,884 - 99,848 8,609 - 85,428 34,171 51,257 32,568 21,137 13,985 9,419
Dec 31, 2031 1,389 124,765 - 99,690 732 - 24,343 9,737 14,606 8,831 5,466 3,457 2,229
Dec 31, 2032 576 52,934 - 50,631 - - 2,303 921 1,382 810 487 299 187
Dec 31, 2033 - - - - - 126,215 (126,215) (50,486) (75,729) (41,289) (23,154) (13,320) (7,845)
Dec 31, 2034 - - - - - 128,739 (128,739) (51,496) (77,244) (40,110) (21,470) (11,815) (6,668)
Dec 31, 2035 - - - - - 131,314 (131,314) (52,526) (78,789) (38,964) (19,908) (10,479) (5,668)
Dec 31, 2036 - - - - - 133,941 (133,941) (53,576) (80,364) (37,850) (18,460) (9,294) (4,818)
Dec 31, 2037 - - - - - - - - - - - - -
Dec 31, 2038 - - - - - - - - - - - - -
Dec 31, 2039 - - - - - - - - - - - - -
Dec 31, 2040 - - - - - - - - - - - - -
Dec 31, 2041 - - - - - - - - - - - - -
Dec 31, 2042 - - - - - - - - - - - - -
Dec 31, 2043 - - - - - - - - - - - - -
Dec 31, 2044 - - - - - - - - - - - - -
Dec 31, 2045 - - - - - - - - - - - - -
Total 64,224 4,463,164 - 1,155,414 1,205,008 520,209 1,582,533 203,947 1,378,586 1,155,084 959,882 799,749 671,391

Discounted cash flows from probable reserves in the Captain Area, as at December 31, 2020, in USD thousands, for the Company's share
End of Period Date
Output volume (MBOE)
Total revenue
Royalty payments
Operating expenses
Development costs
Abandonment costs
Cash flow before
tax
Tax 0% 5% 10% 15% 20%
Dec 31, 2021 1,262 66,677 - 3,601 - - 63,076 - 63,076 61,406 59,866 58,440 57,116
Dec 31, 2022 1,858 107,451 - 6,474 - - 100,977 - 100,977 93,883 87,600 82,004 76,993
Dec 31, 2023 1,965 121,481 - 6,477 - - 115,003 - 115,003 101,760 90,572 81,047 72,878
Dec 31, 2024 2,197 144,653 - 11,037 - - 133,616 56,187 77,430 65,141 55,256 47,224 40,637
Dec 31, 2025 3,604 248,037 - 15,069 - - 232,968 221,402 11,566 9,163 7,338 5,934 4,842
Dec 31, 2026 3,090 221,956 - 13,089 - - 208,866 114,973 93,893 72,115 56,082 44,111 35,056
Dec 31, 2027 2,352 178,322 - 10,939 1,420 - 165,963 88,846 77,118 56,241 41,631 31,235 23,728
Dec 31, 2028 1,700 135,722 - 6,890 - - 128,832 73,088 55,744 38,785 27,449 19,730 14,385
Dec 31, 2029 1,150 95,253 - 4,167 - - 91,086 56,608 34,478 22,842 15,429 10,606 7,410
Dec 31, 2030 814 70,650 - 3,623 - - 67,027 25,759 41,267 26,027 16,774 11,026 7,379
Dec 31, 2031 613 55,074 - 3,127 - - 51,947 20,779 31,168 18,716 11,511 7,235 4,639
Dec 31, 2032 936 85,961 - 51,686 - - 34,275 13,710 20,565 11,762 6,906 4,152 2,552
Dec 31, 2033 1,323 125,452 - 103,394 - (126,215) 148,273 59,309 88,964 48,512 27,208 15,656 9,223
Dec 31, 2034 1,193 116,674 - 104,778 - (128,739) 140,635 56,254 84,381 43,826 23,465 12,916 7,292
Dec 31, 2035 824 82,278 - 79,617 - (131,314) 133,975 53,590 80,385 39,766 20,325 10,701 5,790
Dec 31, 2036 - - - - - 0 (0) 0 (0) 764 723 530 356
Dec 31, 2037 - - - - - 136,619 (136,619) (54,648) (81,972) (36,027) (16,448) (7,774) (3,792)
Dec 31, 2038 - - - - - 139,352 (139,352) (55,741) (83,611) (34,998) (15,251) (6,895) (3,223)
Dec 31, 2039 - - - - - 142,139 (142,139) (56,855) (85,283) (33,998) (14,142) (6,115) (2,740)
Dec 31, 2040 - - - - - - - - - - - - -
Dec 31, 2041 - - - - - - - - - - - - -
Dec 31, 2042 - - - - - - - - - - - - -
Dec 31, 2043 - - - - - - - - - - - - -
Dec 31, 2044 - - - - - - - - - - - - -
Dec 31, 2045 - - - - - - - - - - - - -
Total 24,880 1,855,640 - 423,968 1,420 31,841 1,398,410 673,261 725,150 605,687 502,292 421,765 360,519

Discounted cash flows from proved + probable reserves (2P) in the Captain Area, as at December 31, 2020, in USD thousands, for the Company's share
End of Period Date
Output volume (MBOE)
Total revenue
Royalty payments
Operating expenses
Development costs
Abandonment costs
Cash flow before tax
Tax 0% 5% 10% 15% 20%
Dec 31, 2021 6,728 355,422 - 99,327 120,506 - 135,590 - 135,590 132,826 130,266 127,886 125,666
Dec 31, 2022 8,001 462,725 - 103,230 198,075 - 161,420 - 161,420 150,146 140,153 131,247 123,268
Dec 31, 2023 8,871 548,494 - 105,255 280,081 - 163,158 - 163,158 143,953 127,778 114,046 102,303
Dec 31, 2024 8,148 536,361 - 107,178 144,948 - 284,235 56,187 228,049 192,101 163,156 139,612 120,285
Dec 31, 2025 15,171 1,044,241 - 121,906 136,710 - 785,625 256,719 528,906 424,543 344,333 281,932 232,844
Dec 31, 2026 11,800 847,559 - 118,396 142,236 - 586,927 228,391 358,536 275,229 213,935 168,193 133,613
Dec 31, 2027 8,523 646,281 - 113,092 96,853 - 436,336 169,957 266,378 194,200 143,706 107,794 81,866
Dec 31, 2028 6,909 551,554 - 108,869 65,112 - 377,574 147,710 229,863 159,614 112,754 80,907 58,891
Dec 31, 2029 5,052 418,495 - 105,735 12,568 - 300,192 119,340 180,852 119,815 80,927 55,632 38,864
Dec 31, 2030 3,047 264,534 - 103,471 8,609 - 152,455 59,930 92,524 58,595 37,910 25,011 16,797
Dec 31, 2031 2,002 179,838 - 102,816 732 - 76,290 30,516 45,774 27,547 16,977 10,692 6,868
Dec 31, 2032 1,513 138,894 - 102,317 - - 36,578 14,631 21,947 12,572 7,392 4,451 2,739
Dec 31, 2033 1,323 125,452 - 103,394 - - 22,058 8,823 13,235 7,222 4,054 2,336 1,378
Dec 31, 2034 1,193 116,674 - 104,778 - - 11,895 4,758 7,137 3,716 1,995 1,101 624
Dec 31, 2035 824 82,278 - 79,617 - - 2,661 1,064 1,597 803 416 222 122
Dec 31, 2036 - - - - - 133,941 (133,941) (53,576) (80,364) (37,087) (17,738) (8,764) (4,461)
Dec 31, 2037 - - - - - 136,619 (136,619) (54,648) (81,972) (36,027) (16,448) (7,774) (3,792)
Dec 31, 2038 - - - - - 139,352 (139,352) (55,741) (83,611) (34,998) (15,251) (6,895) (3,223)
Dec 31, 2039 - - - - - 142,139 (142,139) (56,855) (85,283) (33,998) (14,142) (6,115) (2,740)
Dec 31, 2040 - - - - - - - - - - - - -
Dec 31, 2041 - - - - - - - - - - - - -
Dec 31, 2042 - - - - - - - - - - - - -
Dec 31, 2043 - - - - - - - - - - - - -
Dec 31, 2044 - - - - - - - - - - - - -
Dec 31, 2045 - - - - - - - - - - - - -
Total 89,104 6,318,804 - 1,579,382 1,206,429 552,050 2,980,943 877,208 2,103,735 1,760,772 1,462,174 1,221,513 1,031,910

Discounted cash flows from possible reserves in the Captain Area, as at December 31, 2020, in USD thousands, for the Company's share
End of Period Date
Output volume (MBOE)
Total revenue
Royalty payments
Operating expenses
Development costs
Abandonment costs
Cash flow before tax Tax 0% 5% 10% 15% 20%
Dec 31, 2021 1,079 56,997 - 2,078 - - 54,920 - 54,920 53,511 52,211 51,007 49,889
Dec 31, 2022 1,954 113,014 - 4,880 - - 108,133 - 108,133 100,338 93,445 87,316 81,837
Dec 31, 2023 2,363 146,098 - 7,571 - - 138,527 44,547 93,981 83,234 74,148 66,405 59,760
Dec 31, 2024 2,077 136,749 - 6,471 - - 130,278 75,535 54,744 46,145 39,215 33,575 28,941
Dec 31, 2025 3,079 211,899 - 7,605 - - 204,293 132,380 71,913 57,563 46,563 38,027 31,329
Dec 31, 2026 3,235 232,350 - 11,035 - - 221,315 89,207 132,108 101,069 78,308 61,375 48,612
Dec 31, 2027 2,946 223,397 - 13,257 2,675 - 207,466 83,294 124,172 90,498 66,946 50,201 38,114
Dec 31, 2028 2,751 219,622 - 14,652 - - 204,969 82,270 122,699 85,159 60,129 43,125 31,375
Dec 31, 2029 2,312 191,517 - 13,732 - - 177,785 71,220 106,565 70,531 47,595 32,690 22,817
Dec 31, 2030 1,607 139,555 - 10,388 - - 129,167 52,279 76,888 48,499 31,261 20,550 13,755
Dec 31, 2031 1,164 104,587 - 7,847 - - 96,740 38,644 58,096 34,865 21,430 13,463 8,628
Dec 31, 2032 1,018 93,476 - 7,391 - - 86,085 34,415 51,670 29,549 17,347 10,430 6,409
Dec 31, 2033 826 78,342 - 5,707 - - 72,635 29,054 43,581 23,719 13,282 7,633 4,492
Dec 31, 2034 702 68,682 - 4,887 - - 63,795 25,518 38,277 19,821 10,585 5,814 3,276
Dec 31, 2035 919 91,768 - 31,258 - - 60,509 24,204 36,306 17,907 9,129 4,796 2,590
Dec 31, 2036 1,611 165,710 - 112,470 - (133,941) 187,180 74,872 112,308 52,112 25,058 12,448 6,370
Dec 31, 2037 1,399 148,043 - 112,725 - (136,619) 171,938 68,775 103,163 45,542 20,883 9,913 4,857
Dec 31, 2038 1,212 131,935 - 113,353 - (139,352) 157,934 63,174 94,760 39,784 17,389 7,885 3,697
Dec 31, 2039 1,097 121,554 - 114,740 - (142,139) 148,953 59,581 89,372 35,668 14,854 6,430 2,884
Dec 31, 2040 609 69,271 - 68,119 - 0 1,152 461 691 274 113 49 22
Dec 31, 2041 - - - - - 147,881 (147,881) (59,152) (88,729) (32,522) (12,489) (5,004) (2,084)
Dec 31, 2042 - - - - - 150,839 (150,839) (60,336) (90,503) (31,593) (11,581) (4,438) (1,772)
Dec 31, 2043 - - - - - 153,856 (153,856) (61,542) (92,313) (30,691) (10,738) (3,936) (1,506)
Dec 31, 2044 - - - - - 156,933 (156,933) (62,773) (94,160) (29,814) (9,957) (3,491) (1,280)
Dec 31, 2045 - - - - - - - - - - - - -
Total 33,961 2,744,565 - 670,166 2,675 57,458 2,014,266 805,625 1,208,641 911,170 695,128 546,261 443,013

Discounted cash flows from proved + probable + possible reserves (3P) in the Captain Area, as at December 31, 2020, in USD thousands, for the Company's share
End of Period Date
Output volume (MBOE)
Total revenue
Royalty payments
Operating expenses
Development costs
Abandonment costs
Cash flow before tax Tax 0% 5% 10% 15% 20%
Dec 31, 2021 7,807 412,420 - 101,405 120,506 - 190,509 - 190,509 186,336 182,476 178,893 175,554
Dec 31, 2022 9,956 575,739 - 108,110 198,075 - 269,554 - 269,554 250,483 233,598 218,563 205,106
Dec 31, 2023 11,234 694,593 - 112,826 280,081 - 301,685 44,547 257,138 227,187 201,926 180,452 162,063
Dec 31, 2024 10,225 673,110 - 113,648 144,948 - 414,514 131,721 282,792 238,247 202,371 173,187 149,225
Dec 31, 2025 18,250 1,256,140 - 129,511 136,710 - 989,919 389,099 600,819 482,106 390,895 319,959 264,173
Dec 31, 2026 15,034 1,079,909 - 129,431 142,236 - 808,242 317,599 490,643 376,298 292,242 229,568 182,225
Dec 31, 2027 11,469 869,678 - 126,349 99,527 - 643,801 253,251 390,551 284,698 210,653 157,995 119,980
Dec 31, 2028 9,660 771,176 - 123,521 65,112 - 582,543 229,981 352,562 244,773 172,883 124,032 90,266
Dec 31, 2029 7,365 610,012 - 119,467 12,568 - 477,977 190,560 287,417 190,346 128,522 88,322 61,681
Dec 31, 2030 4,654 404,089 - 113,859 8,609 - 281,621 112,209 169,412 107,094 69,171 45,561 30,552
Dec 31, 2031 3,166 284,425 - 110,663 732 - 173,030 69,161 103,870 62,412 38,407 24,155 15,497
Dec 31, 2032 2,530 232,371 - 109,708 - - 122,663 49,046 73,617 42,122 24,740 14,881 9,148
Dec 31, 2033 2,149 203,794 - 109,101 - - 94,693 37,877 56,816 30,941 17,337 9,969 5,870
Dec 31, 2034 1,895 185,356 - 109,666 - - 75,690 30,276 45,414 23,538 12,581 6,915 3,900
Dec 31, 2035 1,743 174,046 - 110,875 - - 63,171 25,268 37,902 18,709 9,545 5,019 2,712
Dec 31, 2036 1,611 165,710 - 112,470 - - 53,239 21,296 31,944 15,025 7,321 3,684 1,909
Dec 31, 2037 1,399 148,043 - 112,725 - - 35,318 14,127 21,191 9,515 4,436 2,139 1,065
Dec 31, 2038 1,212 131,935 - 113,353 - - 18,582 7,433 11,149 4,787 2,138 990 474
Dec 31, 2039 1,097 121,554 - 114,740 - - 6,814 2,726 4,088 1,670 711 315 144
Dec 31, 2040 609 69,271 - 68,119 - - 1,152 461 691 274 113 49 22
Dec 31, 2041 - - - - - 147,881 (147,881) (59,152) (88,729) (32,522) (12,489) (5,004) (2,084)
Dec 31, 2042 - - - - - 150,839 (150,839) (60,336) (90,503) (31,593) (11,581) (4,438) (1,772)
Dec 31, 2043 - - - - - 153,856 (153,856) (61,542) (92,313) (30,691) (10,738) (3,936) (1,506)
Dec 31, 2044 - - - - - 156,933 (156,933) (62,773) (94,160) (29,814) (9,957) (3,491) (1,280)
Dec 31, 2045 - - - - - - - - - - - - -
Total 123,065 9,063,368 - 2,249,548 1,209,103 609,508 4,995,209 1,682,834 3,312,376 2,671,941 2,157,302 1,767,775 1,474,924

3.1.3 The following are sensitivity analyses for the key parameters that the Cash Flows are composed of
Sensitivity analysis to changes in sales volume in the Captain Area
Sensitivity/category Discounting rate
Sensitivity/category Discounting rate
0% 10% 15% 20% 0% 10% 15% 20%
Increase in sales volume at rate of 10% Decrease in sales volume at rate of 10%
Proved Reserves (1P)
1,507,602.1 1,048,157.3 873,061.7 733,057.1 Proved Reserves (1P) 1,295,761.5 899,183.7 747,800.0 626,335.6
Probable Reserves 820,586.5 551,000.2 457,588.3 387,553.8 Probable Reserves 627,750.3 454,961.1 389,134.0 337,870.8
Proved + Probable Reserves (2P)
2,328,188.5 1,599,157.5 1,330,649.9 1,120,610.9 Proved + Probable
Reserves (2P) 1,923,511.8 1,354,144.8 1,136,934.0 964,206.4
Possible Reserves 1,289,660.6 733,198.8 574,504.7 464,778.9 Possible Reserves 1,122,377.6 653,717.3 515,666.5 419,672.5
Proved + Probable + Possible Reserves
(3P) 3,617,849.2 2,332,356.2 1,905,154.6 1,585,389.8
Proved + Probable + Possible Reserves
(3P) 3,045,889.5 2,007,862.1 1,652,600.5 1,383,878.9
Increase in sales volume at rate of 15% Decrease in sales volume at rate of 15%
Proved Reserves (1P)
1,573,998.5 1,091,220.6 908,944.7 763,460.4 Proved Reserves (1P) 1,226,829.8 850,542.1 705,423.3 589,089.5
Probable Reserves 865,756.6 574,342.6 473,944.4 399,156.7 Probable Reserves 616,162.1 454,376.0 391,309.5 341,549.6
Proved + Probable Reserves (2P)
2,439,755.1 1,665,563.2 1,382,889.1 1,162,617.1 Proved + Probable Reserves (2P)
1,842,991.9 1,304,918.1 1,096,732.8 930,639.0
Possible Reserves 1,329,685.4 751,311.0 587,715.4 474,839.7 Possible Reserves 1,066,276.8 625,212.3 495,580.9 405,177.9
Proved + Probable + Possible Reserves (3P)
3,769,440.4 2,416,874.2 1,970,604.4 1,637,456.8 Proved + Probable + Possible Reserves (3P)
2,909,268.7 1,930,130.4 1,592,313.7 1,335,816.9
Increase in sales volume at rate of 20% Decrease in sales volume at rate of 20%
Proved Reserves (1P)
1,641,830.9 1,134,790.9 944,393.9 792,839.2 Proved Reserves (1P) 1,138,046.4 784,664.3 649,343.8 541,194.0
Probable Reserves 907,284.9 596,207.5 490,560.7 412,009.6 Probable Reserves 615,470.4 461,596.0 399,812.2 350,166.1
Proved + Probable Reserves (2P)
2,549,115.8 1,730,998.4 1,434,954.7 1,204,848.7 Proved + Probable Reserves (2P)
1,753,516.8 1,246,260.3 1,049,156.0 891,360.0
Possible Reserves 1,372,008.6 769,289.5 600,530.0 484,419.2 Possible Reserves 1,030,271.4 611,345.4 485,907.4 398,167.7
Proved + Probable + Possible Reserves (3P)
3,921,124.4 2,500,287.9 2,035,484.6 1,689,268.0 Proved + Probable + Possible Reserves (3P)
2,783,788.2 1,857,605.7 1,535,063.4 1,289,527.8

Sensitivity analysis to price changes in the Captain Area
Sensitivity/category Discounting rate
Sensitivity/category Discounting rate
0% 10% 15% 20% 0% 10% 15% 20%
Increase in price of 10% Decrease in price of 10%
Proved Reserves (1P) 1,592,079.0 1,117,957.8 937,287.3 792,668.4 Proved Reserves (1P) 1,212,961.9 830,226.5 683,431.3 565,879.2
Probable Reserves 876,771.8 587,795.9 486,921.8 411,652.7 Probable Reserves 578,690.2 419,755.4 360,230.8 313,677.6
Proved + Probable Reserves (2P)
2,468,850.8 1,705,753.7 1,424,209.1 1,204,321.2 Proved + Probable Reserves (2P)
1,791,652.1 1,249,981.9 1,043,662.0 879,556.7
Possible Reserves 1,392,158.6 776,085.5 606,260.7 489,827.9 Possible Reserves 1,026,856.5 606,385.7 480,721.8 392,526.1
Proved + Probable + Possible Reserves (3P)
3,861,009.4 2,481,839.3 2,030,469.8 1,694,149.0 Proved + Probable + Possible Reserves (3P)
2,818,508.5 1,856,367.6 1,524,383.9 1,272,082.9
Increase in price of 15% Decrease in price of 15%
Proved Reserves (1P) 1,705,516.8 1,200,819.9 1,008,220.7 854,367.0 Proved Reserves (1P) 1,119,912.7 745,903.5 606,373.6 495,797.4
Probable Reserves 953,675.3 627,652.8 516,573.5 434,548.7 Probable Reserves 526,501.4 401,151.2 349,119.4 306,847.4
Proved + Probable Reserves (2P)
2,659,192.2 1,828,472.7 1,524,794.2 1,288,915.7 Proved + Probable Reserves (2P)
1,646,414.2 1,147,054.7 955,493.0 802,644.8
Possible Reserves 1,467,065.9 808,715.0 631,425.2 510,144.0 Possible Reserves 922,424.9 558,224.5 445,673.2 365,889.0
Proved + Probable + Possible Reserves (3P)
4,126,258.1 2,637,187.8 2,156,219.4 1,799,059.7 Proved + Probable + Possible Reserves (3P)
2,568,839.1 1,705,279.2 1,401,166.1 1,168,533.8
Increase in price of 20% Decrease in price of 20%
Proved Reserves (1P) 1,813,178.3 1,276,503.7 1,073,223.0 911,220.7 Proved Reserves (1P) 910,177.4 607,700.3 491,450.6 398,627.4
Probable Reserves 1,034,345.8 672,615.0 550,786.5 461,367.4 Probable Reserves 613,736.7 444,030.9 381,102.7 330,953.3
Proved + Probable Reserves (2P)
2,847,524.1 1,949,118.7 1,624,009.5 1,372,588.1 Proved + Probable Reserves (2P)
1,523,914.1 1,051,731.1 872,553.3 729,580.7
Possible Reserves 1,553,852.6 848,691.5 660,193.5 532,091.6 Possible Reserves 797,219.9 503,182.9 405,879.3 335,749.1
Proved + Probable + Possible Reserves (3P)
4,401,376.7 2,797,810.1 2,284,203.0 1,904,679.7 Proved + Probable + Possible Reserves (3P)
2,321,134.0 1,554,914.0 1,278,432.6 1,065,329.8

3.2 Production Information
Breakdown of output attributable to the Company's share in the Captain Area:
2020 2019
Oil Natural gas
Condensat
e
Oil Natural gas Condensat
e
Total output in the period 7,931,973
BBL - -
8,670,695 BBL
- -
Average price per output unit (attributable to equity holders of the Company) (USD per BOE)
41.1 - - 67.4 - -
Average production costs per output unit (USD per BOE)
18.5 - - 21.8 - -
Royalties to third parties (every payment derived from the output of the on-production asset, including from the gross income from the oil asset) paid per output unit (attributable to equity holders of the Company) (USD per BOE)
- - - - - -
Net production costs per output unit (USD per BOE)
24.1 - - 45.6 - -
Rate of depletion in the reporting period with respect to the total reserves in the oil asset (%)
8.9 - - 8.8 - -
3.3 Contingent Resources
Breakdown of volume of contingent resources in the Captain Area, at December 31, 2020 For further information concerning the discounted cash flows resulting from these resources, see p.
54 of the Resources Report.
Forward-looking information: there is no certainty that production of any part of the contingent
resources is possible.
Captain Field Contingent Resources
Heavy oil (MBBL)
Light oil (MBBL)
Natural gas
(MMCF)
Heavy oil (MBBL)
Light oil (MBBL)
Natural gas
(MMCF)
Gas liquids (NGL) (MBBL)
(MBOE)
Resources Category
Resources in oil asset (100%) Company's share in resources
Low estimate (1C)
9,511.6 0.0 0.0 8,084.8 0.0 0.0 0.0 8,084.8
Best estimate (2C)
22,481.5 5,818.1 1,472.7 19,854.5 5,818.1 0.0 0.0 25,672.6
High estimate (3C)
50,788.6 11,766.0 3,574.4 45,713.1 11,766.0 0.0 0.0 57,479.1

4. GSA Project resources and discounted cash flow data
Breakdown of resources and discounted cash flow data attributed to the GSA Project. All the following
information is based on the NSAI Report.
4.1 Reserves attributed to the GSA Project
4.1.1 Quantitative data
Breakdown of volume of reserves attributed to the GSA Project as at December 31,
2020.
Forward-looking information: Possible Reserves are the additional reserves that are not
expected to be produced to the same extent as Probable Reserves. There is a 10% chance that
actual quantities produced will be equivalent to or higher than the proved reserves, with the
addition of the quantity of the probable and possible reserves.
4.1.2 Discounted cash flow data
Below is a breakdown of the discounted cash flow data resulting from the foregoing
reserves (below in this section: the “Cash Flows”).
The economic parameters used for the Cash Flows are based on information and estimates that the Reserves Evaluator received from Ithaca. In this matter, see also
section 2.1.2 above.
Note: It is clarified that the discounted cash flow figures, whether they have been calculated at a specific discount rate or without a discount rate, represent the present value but not
necessarily the fair value.
GSA Project Reserves
Heavy oil (MBBL)
Light oil (MBBL)
Natural gas
(MMCF)
Heavy oil (MBBL)
Light oil (MBBL)
Natural gas
(MMCF)
Gas liquids (NGL) (MBBL)
(MBOE)
Reserves Category
Resources in oil asset (100%) Company's share in resources
Proved Reserves (1P)
0.0 6,804.4 98,296.8 0.0 2,974.1 52,986.7 2,047.1 14,156.8
Probable Reserves
0.0 8,975.9 71,599.8 0.0 6,486.9 49,511.3 1,716.2 16,739.5
Proved + Probable Reserves (2P)
0.0 15,780.4 169,896.6 0.0 9,460.9 102,498.0 3,763.3 30,896.3
Possible Reserves
0.0 7,748.7 71,810.8 0.0 4,615.5 49,156.9 1,720.5 14,811.3
Proved + Probable + Possible Reserves (3P)
0.0 23,529.1 241,707.4 0.0 14,076.4 151,654.9 5,483.8 45,707.6
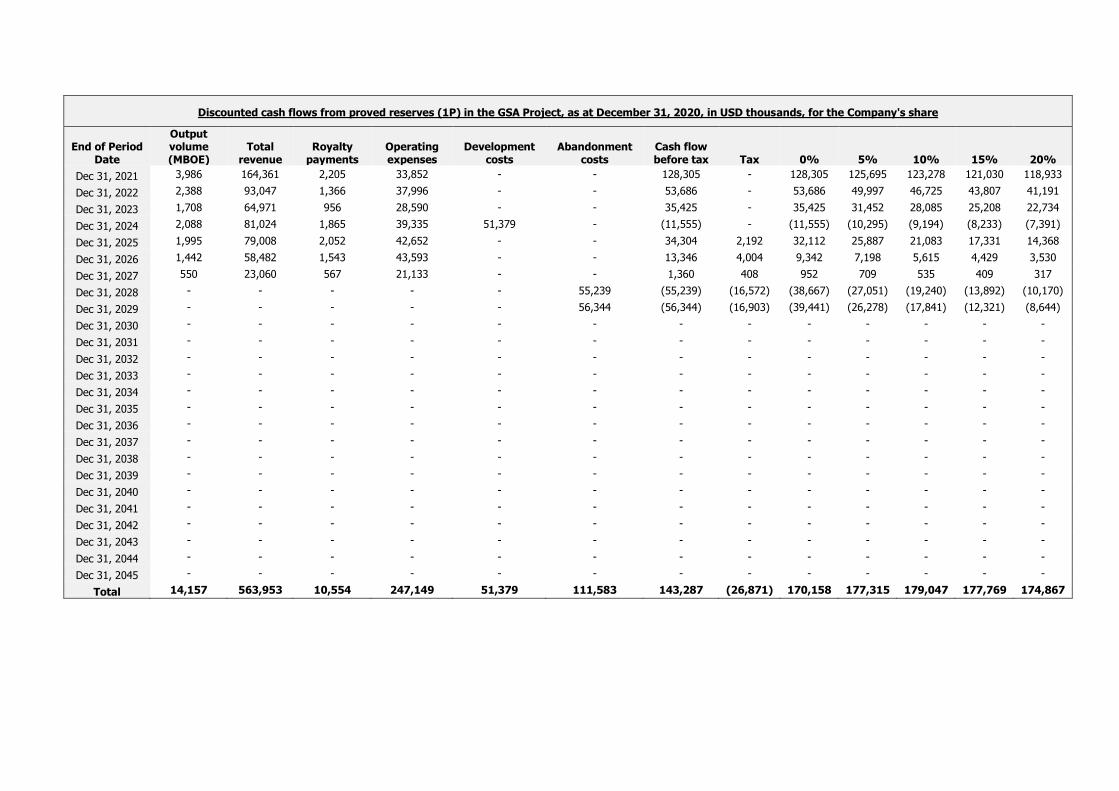
Discounted cash flows from proved reserves (1P) in the GSA Project, as at December 31, 2020, in USD thousands, for the Company's share
End of Period Date
Output volume (MBOE)
Total revenue
Royalty payments
Operating expenses
Development costs
Abandonment costs
Cash flow before tax Tax 0% 5% 10% 15% 20%
Dec 31, 2021 3,986 164,361 2,205 33,852 - - 128,305 - 128,305 125,695 123,278 121,030 118,933
Dec 31, 2022 2,388 93,047 1,366 37,996 - - 53,686 - 53,686 49,997 46,725 43,807 41,191
Dec 31, 2023 1,708 64,971 956 28,590 - - 35,425 - 35,425 31,452 28,085 25,208 22,734
Dec 31, 2024 2,088 81,024 1,865 39,335 51,379 - (11,555) - (11,555) (10,295) (9,194) (8,233) (7,391)
Dec 31, 2025 1,995 79,008 2,052 42,652 - - 34,304 2,192 32,112 25,887 21,083 17,331 14,368
Dec 31, 2026 1,442 58,482 1,543 43,593 - - 13,346 4,004 9,342 7,198 5,615 4,429 3,530
Dec 31, 2027 550 23,060 567 21,133 - - 1,360 408 952 709 535 409 317
Dec 31, 2028 - - - - - 55,239 (55,239) (16,572) (38,667) (27,051) (19,240) (13,892) (10,170)
Dec 31, 2029 - - - - - 56,344 (56,344) (16,903) (39,441) (26,278) (17,841) (12,321) (8,644)
Dec 31, 2030 - - - - - - - - - - - - -
Dec 31, 2031 - - - - - - - - - - - - -
Dec 31, 2032 - - - - - - - - - - - - -
Dec 31, 2033 - - - - - - - - - - - - -
Dec 31, 2034 - - - - - - - - - - - - -
Dec 31, 2035 - - - - - - - - - - - - -
Dec 31, 2036 - - - - - - - - - - - - -
Dec 31, 2037 - - - - - - - - - - - - -
Dec 31, 2038 - - - - - - - - - - - - -
Dec 31, 2039 - - - - - - - - - - - - -
Dec 31, 2040 - - - - - - - - - - - - -
Dec 31, 2041 - - - - - - - - - - - - -
Dec 31, 2042 - - - - - - - - - - - - -
Dec 31, 2043 - - - - - - - - - - - - -
Dec 31, 2044 - - - - - - - - - - - - -
Dec 31, 2045 - - - - - - - - - - - - -
Total 14,157 563,953 10,554 247,149 51,379 111,583 143,287 (26,871) 170,158 177,315 179,047 177,769 174,867

Discounted cash flows from probable reserves in the GSA Project, as at December 31, 2020, in USD thousands, for the Company's share
End of Period Date
Output volume (MBOE)
Total revenue
Royalty payments
Operating expenses
Development costs
Abandonment costs
Cash flow before tax Tax 0% 5% 10% 15% 20%
Dec 31, 2021 816 35,467 432 (3,179) 26,094 - 12,119 - 12,119 11,738 11,387 11,061 10,759
Dec 31, 2022 1,649 77,919 435 4,476 88,135 - (15,126) - (15,126) (14,456) (13,829) (13,242) (12,692)
Dec 31, 2023 2,715 137,353 408 22,939 0 - 114,006 - 114,006 101,233 90,405 81,156 73,200
Dec 31, 2024 2,135 98,136 1,365 18,632 26,267 - 51,872 7,970 43,902 36,954 31,367 26,827 23,104
Dec 31, 2025 2,795 127,769 1,421 23,863 - - 102,485 42,507 59,979 48,340 39,359 32,345 26,808
Dec 31, 2026 1,696 78,281 885 16,014 - - 61,382 25,075 36,307 27,851 21,633 16,996 13,493
Dec 31, 2027 1,735 78,232 1,459 35,676 - - 41,097 16,129 24,968 18,247 13,534 10,174 7,743
Dec 31, 2028 1,766 79,825 1,764 55,913 - (55,239) 77,388 25,237 52,151 36,454 25,909 18,695 13,678
Dec 31, 2029 1,288 59,263 1,362 50,484 - (56,344) 63,761 19,852 43,909 29,268 19,879 13,735 9,640
Dec 31, 2030 146 7,373 - 6,956 - 63,785 (63,368) (24,910) (38,458) (23,460) (14,636) (9,320) (6,048)
Dec 31, 2031 - - - - - 65,061 (65,061) (26,024) (39,037) (22,679) (13,507) (8,227) (5,116)
Dec 31, 2032 - - - - - - - - - - - - -
Dec 31, 2033 - - - - - - - - - - - - -
Dec 31, 2034 - - - - - - - - - - - - -
Dec 31, 2035 - - - - - - - - - - - - -
Dec 31, 2036 - - - - - - - - - - - - -
Dec 31, 2037 - - - - - - - - - - - - -
Dec 31, 2038 - - - - - - - - - - - - -
Dec 31, 2039 - - - - - - - - - - - - -
Dec 31, 2040 - - - - - - - - - - - - -
Dec 31, 2041 - - - - - - - - - - - - -
Dec 31, 2042 - - - - - - - - - - - - -
Dec 31, 2043 - - - - - - - - - - - - -
Dec 31, 2044 - - - - - - - - - - - - -
Dec 31, 2045 - - - - - - - - - - - - -
Total 16,739 779,619 9,531 231,774 140,496 17,264 380,555 85,835 294,721 249,490 211,501 180,201 154,570
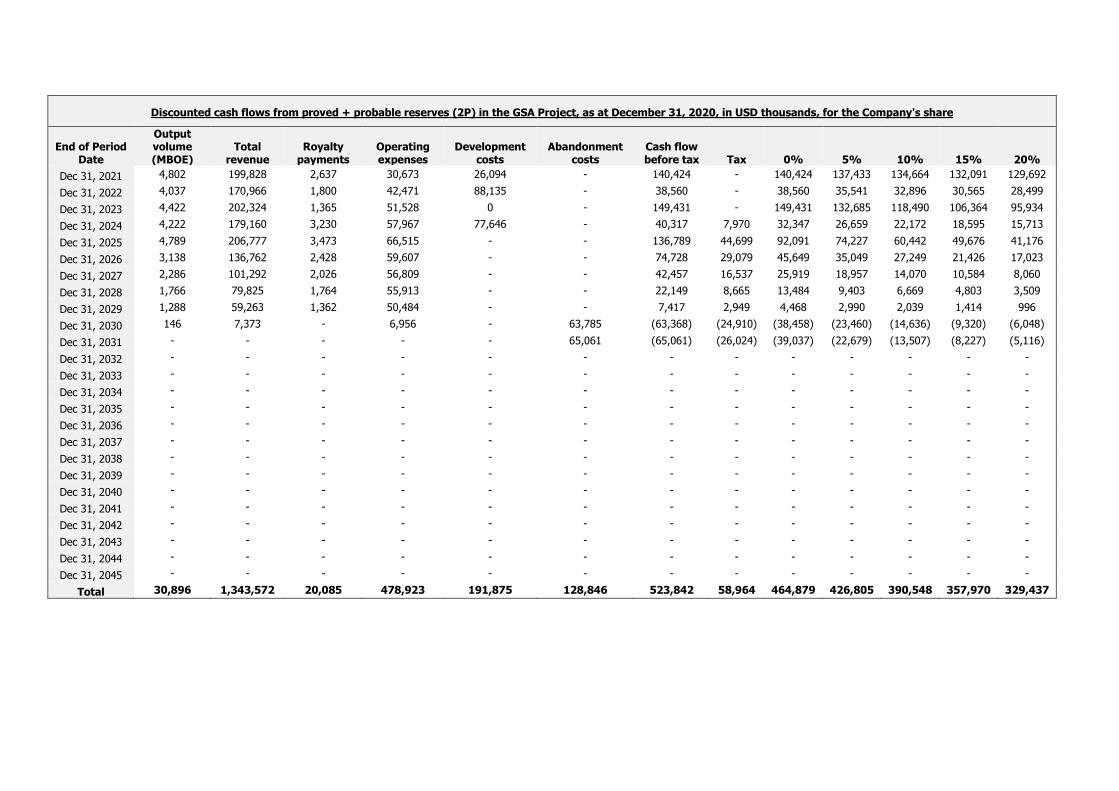
Discounted cash flows from proved + probable reserves (2P) in the GSA Project, as at December 31, 2020, in USD thousands, for the Company's share
End of Period Date
Output volume (MBOE)
Total revenue
Royalty payments
Operating expenses
Development costs
Abandonment costs
Cash flow before tax Tax 0% 5% 10% 15% 20%
Dec 31, 2021 4,802 199,828 2,637 30,673 26,094 - 140,424 - 140,424 137,433 134,664 132,091 129,692
Dec 31, 2022 4,037 170,966 1,800 42,471 88,135 - 38,560 - 38,560 35,541 32,896 30,565 28,499
Dec 31, 2023 4,422 202,324 1,365 51,528 0 - 149,431 - 149,431 132,685 118,490 106,364 95,934
Dec 31, 2024 4,222 179,160 3,230 57,967 77,646 - 40,317 7,970 32,347 26,659 22,172 18,595 15,713
Dec 31, 2025 4,789 206,777 3,473 66,515 - - 136,789 44,699 92,091 74,227 60,442 49,676 41,176
Dec 31, 2026 3,138 136,762 2,428 59,607 - - 74,728 29,079 45,649 35,049 27,249 21,426 17,023
Dec 31, 2027 2,286 101,292 2,026 56,809 - - 42,457 16,537 25,919 18,957 14,070 10,584 8,060
Dec 31, 2028 1,766 79,825 1,764 55,913 - - 22,149 8,665 13,484 9,403 6,669 4,803 3,509
Dec 31, 2029 1,288 59,263 1,362 50,484 - - 7,417 2,949 4,468 2,990 2,039 1,414 996
Dec 31, 2030 146 7,373 - 6,956 - 63,785 (63,368) (24,910) (38,458) (23,460) (14,636) (9,320) (6,048)
Dec 31, 2031 - - - - - 65,061 (65,061) (26,024) (39,037) (22,679) (13,507) (8,227) (5,116)
Dec 31, 2032 - - - - - - - - - - - - -
Dec 31, 2033 - - - - - - - - - - - - -
Dec 31, 2034 - - - - - - - - - - - - -
Dec 31, 2035 - - - - - - - - - - - - -
Dec 31, 2036 - - - - - - - - - - - - -
Dec 31, 2037 - - - - - - - - - - - - -
Dec 31, 2038 - - - - - - - - - - - - -
Dec 31, 2039 - - - - - - - - - - - - -
Dec 31, 2040 - - - - - - - - - - - - -
Dec 31, 2041 - - - - - - - - - - - - -
Dec 31, 2042 - - - - - - - - - - - - -
Dec 31, 2043 - - - - - - - - - - - - -
Dec 31, 2044 - - - - - - - - - - - - -
Dec 31, 2045 - - - - - - - - - - - - -
Total 30,896 1,343,572 20,085 478,923 191,875 128,846 523,842 58,964 464,879 426,805 390,548 357,970 329,437

Discounted cash flows from possible reserves in the GSA Project, as at December 31, 2020, in USD thousands, for the Company's share
End of Period Date
Output volume (MBOE)
Total revenue
Royalty payments
Operating expenses
Development costs
Abandonment costs
Cash flow before tax Tax 0% 5% 10% 15% 20%
Dec 31, 2021 870 37,821 382 (4,248) - - 41,687 - 41,687 40,458 39,327 38,282 37,312
Dec 31, 2022 1,170 54,206 416 (5,331) - - 59,121 - 59,121 54,953 51,262 47,977 45,036
Dec 31, 2023 1,375 66,218 412 (844) - - 66,649 31,906 34,743 30,798 27,460 24,613 22,167
Dec 31, 2024 721 32,971 801 2,437 (26,267) - 56,000 22,637 33,363 28,406 24,366 21,042 18,285
Dec 31, 2025 823 26,980 1,711 1,405 26,792 - (2,929) 7,917 (10,845) (9,245) (7,914) (6,804) (5,875)
Dec 31, 2026 2,234 106,664 870 10,370 - - 95,424 37,782 57,642 44,162 34,262 26,888 21,322
Dec 31, 2027 1,490 72,974 654 6,802 - - 65,518 25,936 39,581 28,910 21,430 16,101 12,247
Dec 31, 2028 1,029 50,997 576 4,204 - - 46,217 18,325 27,892 19,392 13,715 9,852 7,178
Dec 31, 2029 899 43,902 732 7,808 - - 35,362 14,107 21,256 14,063 9,487 6,514 4,545
Dec 31, 2030 1,640 78,173 1,916 50,890 - (63,785) 89,152 35,184 53,968 33,258 20,961 13,484 8,838
Dec 31, 2031 1,504 72,960 1,760 58,483 - (65,061) 77,778 31,107 46,670 27,283 16,349 10,021 6,270
Dec 31, 2032 963 46,677 1,156 42,096 - - 3,425 1,369 2,055 1,190 706 429 266
Dec 31, 2033 92 4,547 - 4,381 - 67,689 (67,524) (27,009) (40,514) (21,641) (11,899) (6,718) (3,885)
Dec 31, 2034 - - - - - 69,043 (69,043) (27,617) (41,426) (21,077) (11,063) (5,975) (3,312)
Dec 31, 2035 - - - - - - - - - - - - -
Dec 31, 2036 - - - - - - - - - - - - -
Dec 31, 2037 - - - - - - - - - - - - -
Dec 31, 2038 - - - - - - - - - - - - -
Dec 31, 2039 - - - - - - - - - - - - -
Dec 31, 2040 - - - - - - - - - - - - -
Dec 31, 2041 - - - - - - - - - - - - -
Dec 31, 2042 - - - - - - - - - - - - -
Dec 31, 2043 - - - - - - - - - - - - -
Dec 31, 2044 - - - - - - - - - - - - -
Dec 31, 2045 - - - - - - - - - - - - -
Total 14,811 695,089 11,387 178,452 525 7,886 496,838 171,645 325,194 270,911 228,450 195,706 170,396

Discounted cash flows from proved + probable + possible reserves (3P) in the GSA Project, as at December 31, 2020, in USD thousands, for the Company's share
End of Period Date
Output volume (MBOE)
Total revenue
Royalty payments
Operating expenses
Development costs
Abandonment costs
Cash flow before tax Tax 0% 5% 10% 15% 20%
Dec 31, 2021 5,672 237,649 3,019 26,425 26,094 - 182,111 - 182,111 177,892 173,992 170,373 167,004
Dec 31, 2022 5,207 225,172 2,216 37,140 88,135 - 97,681 - 97,681 90,493 84,159 78,542 73,535
Dec 31, 2023 5,797 268,542 1,777 50,685 - - 216,081 31,906 184,174 163,483 145,950 130,977 118,101
Dec 31, 2024 4,943 212,132 4,032 60,404 51,379 - 96,317 30,607 65,710 55,065 46,538 39,637 33,998
Dec 31, 2025 5,612 233,757 5,184 67,920 26,792 - 133,861 52,616 81,245 64,982 52,528 42,872 35,301
Dec 31, 2026 5,372 243,427 3,298 69,976 - - 170,152 66,861 103,291 79,212 61,511 48,313 38,345
Dec 31, 2027 3,776 174,266 2,680 63,611 - - 107,975 42,474 65,501 47,867 35,500 26,685 20,307
Dec 31, 2028 2,795 130,822 2,339 60,117 - - 68,366 26,990 41,376 28,795 20,384 14,655 10,687
Dec 31, 2029 2,187 103,165 2,094 58,291 - - 42,779 17,055 25,724 17,053 11,525 7,927 5,541
Dec 31, 2030 1,787 85,546 1,916 57,847 - - 25,784 10,273 15,510 9,798 6,325 4,163 2,790
Dec 31, 2031 1,504 72,960 1,760 58,483 - - 12,717 5,083 7,634 4,603 2,842 1,793 1,154
Dec 31, 2032 963 46,677 1,156 42,096 - - 3,425 1,369 2,055 1,190 706 429 266
Dec 31, 2033 92 4,547 - 4,381 - 67,689 (67,524) (27,009) (40,514) (21,641) (11,899) (6,718) (3,885)
Dec 31, 2034 - - - - - 69,043 (69,043) (27,617) (41,426) (21,077) (11,063) (5,975) (3,312)
Dec 31, 2035 - - - - - - - - - - - - -
Dec 31, 2036 - - - - - - - - - - - - -
Dec 31, 2037 - - - - - - - - - - - - -
Dec 31, 2038 - - - - - - - - - - - - -
Dec 31, 2039 - - - - - - - - - - - - -
Dec 31, 2040 - - - - - - - - - - - - -
Dec 31, 2041 - - - - - - - - - - - - -
Dec 31, 2042 - - - - - - - - - - - - -
Dec 31, 2043 - - - - - - - - - - - - -
Dec 31, 2044 - - - - - - - - - - - - -
Dec 31, 2045 - - - - - - - - - - - - -
Total 45,708 2,038,661 31,471 657,375 192,401 136,733 1,020,681 230,608 790,073 697,716 618,998 553,676 499,833

4.1.3 The following are sensitivity analyses for key parameters that make up Cash Flows (USD thousands)
Sensitivity analysis to changes in sales volume in the GSA Project,
Sensitivity/category Discounting rate
Sensitivity/category Discounting rate
0% 10% 15% 20% 0% 10% 15% 20%
Increase in sales volume at rate of 10% Decrease in sales volume at rate of 10%
Proved Reserves (1P) 222,310.6 219,620.2 214,252.1 208,049.3 Proved Reserves (1P) 108,267.2 121,438.9 124,383.3 125,860.1
Probable Reserves 328,032.1 237,606.9 203,488.0 175,500.7 Probable Reserves 271,502.0 202,002.9 173,434.2 149,181.3
Proved + Probable Reserves (2P)
550,342.7 457,227.1 417,740.1 383,550.0 Proved + Probable Reserves (2P)
379,769.2 323,441.8 297,817.5 275,041.4
Possible Reserves 360,069.8 246,582.1 209,566.9 181,383.9 Possible Reserves 306,435.2 221,199.1 191,574.6 168,234.0
Proved + Probable + Possible Reserves (3P)
910,412.5 703,809.2 627,306.9 564,933.9 Proved + Probable + Possible Reserves (3P)
686,204.4 544,640.8 489,392.0 443,275.5
Increase in sales volume at rate of 15% Decrease in sales volume at rate of 15%
Proved Reserves (1P) 252,578.8 233,921.6 222,366.8 211,044.4 Proved Reserves (1P) 91,277.5 106,212.1 109,939.6 112,131.1
Probable Reserves 338,652.8 254,468.4 223,060.0 197,409.2 Probable Reserves 247,566.5 184,348.9 158,168.7 135,864.8
Proved + Probable Reserves (2P)
591,231.6 488,390.1 445,426.8 408,453.6 Proved + Probable Reserves (2P)
338,844.0 290,561.0 268,108.2 247,996.0
Possible Reserves 376,909.9 256,334.8 217,159.5 187,461.8 Possible Reserves 288,949.6 211,058.4 183,541.1 161,685.6
Proved + Probable + Possible Reserves (3P)
968,141.5 744,724.9 662,586.3 595,915.4 Proved + Probable + Possible Reserves (3P)
627,793.6 501,619.4 451,649.4 409,681.6
Increase in sales volume at rate of 20% Decrease in sales volume at rate of 20%
Proved Reserves (1P) 279,279.7 254,834.6 241,499.2 228,774.7 Proved Reserves (1P) 76,476.1 92,414.1 96,666.0 99,368.1
Probable Reserves 350,015.7 262,803.7 229,856.5 202,932.7 Probable Reserves 219,044.4 163,310.1 140,074.5 120,195.9
Proved + Probable Reserves (2P)
629,295.4 517,638.2 471,355.7 431,707.4 Proved + Probable Reserves (2P)
295,520.6 255,724.2 236,740.5 219,564.0
Possible Reserves 397,172.7 267,680.9 226,236.8 194,998.9 Possible Reserves 270,246.3 200,939.9 175,503.0 155,021.4
Proved + Probable + Possible Reserves (3P)
1,026,468.2 785,319.1 697,592.5 626,706.3 Proved + Probable + Possible Reserves (3P)
565,766.9 456,664.1 412,243.5 374,585.4

Sensitivity analysis to price changes in the GSA Project,
Sensitivity/category Discounting rate
Sensitivity/category Discounting rate
0% 10% 15% 20% 0% 10% 15% 20%
Increase in price of 10% Decrease in price of 10%
Proved Reserves (1P) 230,573.2 226,747.5 220,826.2 214,125.9 Proved Reserves (1P) 101,805.0 115,346.7 118,535.9 120,265.6
Probable Reserves 334,214.2 240,798.1 205,849.5 177,298.4 Probable Reserves 264,962.5 197,486.8 169,661.2 145,992.5
Proved + Probable Reserves (2P)
564,787.4 467,545.6 426,675.7 391,424.3 Proved + Probable Reserves (2P)
366,767.5 312,833.5 288,197.1 266,258.2
Possible Reserves 359,898.1 246,310.9 209,206.8 180,984.5 Possible Reserves 303,946.5 221,447.2 191,965.4 168,591.6
Proved + Probable + Possible Reserves (3P)
924,685.5 713,856.5 635,882.5 572,408.9 Proved + Probable + Possible Reserves (3P)
670,714.1 534,280.7 480,162.5 434,849.7
Increase in price of 15% Decrease in price of 15%
Proved Reserves (1P) 265,788.5 243,919.2 231,528.8 219,592.0 Proved Reserves (1P) 83,722.4 98,743.3 102,639.2 105,034.9
Probable Reserves 341,419.4 256,054.5 223,897.0 197,636.4 Probable Reserves 235,557.0 175,528.7 150,663.0 129,442.7
Proved + Probable Reserves (2P)
607,208.0 499,973.7 455,425.8 417,228.4 Proved + Probable Reserves (2P)
319,279.4 274,272.0 253,302.2 234,477.6
Possible Reserves 383,025.7 259,845.7 220,024.6 189,913.6 Possible Reserves 280,164.2 206,667.9 180,136.9 158,913.9
Proved + Probable + Possible Reserves (3P)
990,233.7 759,819.4 675,450.4 607,142.0 Proved + Probable + Possible Reserves (3P)
599,443.6 480,939.9 433,439.1 393,391.5
Increase in price of 20% Decrease in price of 20%
Proved Reserves (1P) 299,599.4 271,979.2 257,173.1 243,148.4 Proved Reserves (1P) 63,835.2 80,965.5 85,778.9 89,006.0
Probable Reserves 347,881.3 258,146.2 225,209.5 198,539.5 Probable Reserves 205,784.2 155,225.7 133,342.1 114,417.4
Proved + Probable Reserves (2P)
647,480.8 530,125.4 482,382.6 441,687.9 Proved + Probable Reserves (2P)
269,619.4 236,191.2 219,121.0 203,423.4
Possible Reserves 406,945.8 273,201.9 230,498.9 198,382.5 Possible Reserves 258,235.3 191,537.1 167,620.1 148,435.5
Proved + Probable + Possible Reserves (3P)
1,054,426.6 803,327.2 712,881.5 640,070.4 Proved + Probable + Possible Reserves (3P)
527,854.7 427,728.3 386,741.1 351,858.9

4.2 Production Information
Breakdown of output attributable to the Company's share in the GSA Project:
2020 2019
Oil Natural gas
Condensate
Oil Natural gas
Condensate
Total output in the period 712,516
BBL
13,112 MCF
425,128 BBL
789,382
BBL
18,668
MCF
664,820 BBL
Average price per output unit (attributable to equity holders of the Company) (USD per BOE)
41.8 18.5 29.1 64.6 28.3 36.6
Average production costs per output unit
(USD per BOE) 20.9 20.9 20.9 18.6 18.6 18.6
Royalties to third parties (every payment derived from the output of the on-production asset, including from the gross income from the oil asset) paid per output unit (attributable to equity holders of the
Company) (USD per BOE)
0.7 0.7 0.7 1.3 1.3 1.3
Net production costs per output unit (USD
per BOE) 20.2 (3.1) 7.5 44.7 8.4 16.7
Rate of depletion in the reporting period with respect to the total reserves in the oil asset (%)
13.7 13.7 13.7 16 16 16
4.3 Contingent Resources
Breakdown of volume of contingent reserves attributed to the GSA Project as at December 31,
2020. For further information concerning the discounted cash flows resulting from these resources,
see p. 57 of the Resources Report.
Forward-looking information: there is no certainty that production of any part of the contingent
resources is possible.
GSA Project Contingent Resources
Heavy oil (MBBL)
Light oil (MBBL)
Natural gas
(MMCF)
Heavy oil (MBBL)
Light oil (MBBL)
Natural gas
(MMCF)
Gas liquids (NGL) (MBBL)
(MBOE)
Resources Category
Resources in oil asset (100%) Company's share in resources
Low estimate (1C)
0.0 0.0 0.0 0.0 0.0 0.0 0.0 0.0
Best estimate (2C)
0.0 14,498.8 127,402.4 0.0 11,754.3 99,154.0 243.0 29,092.8
High estimate (3C)
0.0 23,089.0 194,433.2 0.0 18,006.5 143,242.9 364.8 43,068.3

5. Group of Operated Assets resources and discounted cash flow data
Breakdown of resources and discounted cash flow data attributed to the Group of Operated Assets. All
the following information is based on the NSAI Report.
5.1 Reserves attributed to the Group of Operated Assets
5.1.1 Quantitative data
Breakdown of the volume of reserves attributable to the Group of Operated Assets, as at
December 31, 2020.
Forward-looking information: Possible Reserves are the additional reserves that are not expected
to be produced to the same extent as Probable Reserves. There is a 10% chance that actual
quantities produced will be equivalent to or higher than the proved reserves, with the addition of
the quantity of the probable and possible reserves.
5.1.2 Discounted cash flow data
Below is a breakdown of the discounted cash flow data resulting from the foregoing reserves
(below in this section: the “Cash Flows”).
The economic parameters used for the Cash Flows are based on information and estimates
that the Reserves Evaluator received from Ithaca. In this matter, see also section 2.1.2
above.
Note: It is clarified that the discounted cash flow figures, whether they have been calculated at a specific discount rate or without a discount rate, represent the
present value but not necessarily the fair value.
Group of Operated Assets Reserves
Heavy oil (MBBL)
Light oil (MBBL)
Natural gas
(MMCF)
Heavy oil (MBBL)
Light oil (MBBL)
Natural gas
(MMCF)
Gas liquids (NGL)
(MBBL) (MBOE)
Reserves Category Resources in oil asset (100%) Company's share in resources
Proved Reserves (1P)
1,426.7 13,838.5 62,752.4 333.4 7,920.6 31,244.9 522.0 14,163.1
Probable Reserves
25,955.4 11,035.7 23,773.1 6,065.8 6,450.2 12,758.3 251.7 14,967.4
Proved + Probable Reserves (2P)
27,382.1 24,874.2 86,525.5 6,399.2 14,370.9 44,003.2 773.7 29,130.5
Possible Reserves
12,608.1 10,532.8 29,261.8 2,946.5 6,190.0 14,859.0 256.8 11,955.1
Proved + Probable + Possible Reserves (3P)
39,990.2 35,407.0 115,787.3 9,345.7 20,560.8 58,862.2 1,030.5 41,085.7

Discounted cash flows from proved reserves (1P) in the Group of Operated Assets, as at December 31, 2020, in USD thousands, for the Company's share
End of Period Date
Output volume (MBOE)
Total revenue
Royalty payments
Operating expenses
Development costs
Abandonment costs
Cash flow
before tax Tax 0% 5% 10% 15% 20%
Dec 31, 2021 4,198 187,963 - 96,602 1,669 - 89,693 - 89,693 87,582 85,633 83,826 82,145
Dec 31, 2022 3,440 167,097 - 75,800 - - 91,297 - 91,297 84,884 79,204 74,144 69,613
Dec 31, 2023 3,137 165,493 - 78,454 - - 87,038 - 87,038 77,175 68,824 61,700 55,579
Dec 31, 2024 2,023 113,216 - 72,610 - 28,433 12,173 - 12,173 10,449 9,036 7,866 6,890
Dec 31, 2025 1,301 72,734 - 63,137 - 29,002 (19,404) (1,240) (18,164) (14,465) (11,639) (9,455) (7,748)
Dec 31, 2026 64 3,345 - 3,277 - 35,625 (35,557) (10,667) (24,890) (18,956) (14,620) (11,405) (8,992)
Dec 31, 2027 - - - - - 49,099 (49,099) (14,730) (34,369) (25,166) (18,698) (14,078) (10,729)
Dec 31, 2028 - - - - - 13,017 (13,017) (3,905) (9,112) (6,523) (4,742) (3,495) (2,609)
Dec 31, 2029 - - - - - 13,277 (13,277) (3,983) (9,294) (6,337) (4,397) (3,100) (2,218)
Dec 31, 2030 - - - - - 34,669 (34,669) (13,868) (20,801) (13,197) (8,552) (5,651) (3,801)
Dec 31, 2031 - - - - - 21,549 (21,549) (8,620) (12,929) (7,667) (4,658) (2,893) (1,833)
Dec 31, 2032 - - - - - 21,980 (21,980) (8,792) (13,188) (7,448) (4,319) (2,566) (1,558)
Dec 31, 2033 - - - - - 22,420 (22,420) (8,968) (13,452) (7,235) (4,005) (2,276) (1,324)
Dec 31, 2034 - - - - - - - - - - - - - Dec 31, 2035 - - - - - - - - - - - - - Dec 31, 2036 - - - - - - - - - - - - - Dec 31, 2037 - - - - - - - - - - - - - Dec 31, 2038 - - - - - - - - - - - - - Dec 31, 2039 - - - - - - - - - - - - - Dec 31, 2040 - - - - - - - - - - - - - Dec 31, 2041 - - - - - - - - - - - - - Dec 31, 2042 - - - - - - - - - - - - - Dec 31, 2043 - - - - - - - - - - - - - Dec 31, 2044 - - - - - - - - - - - - - Dec 31, 2045 - - - - - - - - - - - - -
Total 14,163 709,847 - 389,880 1,669 269,069 49,230 (74,772) 124,002 153,096 167,067 172,618 173,416

Discounted cash flows from probable reserves in the Group of Operated Assets, as at December 31, 2020, in USD thousands, for the Company's share
End of Period Date
Output volume (MBOE)
Total revenue
Royalty payments
Operating expenses
Development costs
Abandonment costs
Cash flow before
tax Tax 0% 5% 10% 15% 20%
Dec 31, 2021 624 32,108 - 10,314 1,378 - 20,416 - 20,416 19,922 19,466 19,043 18,650
Dec 31, 2022 1,024 53,415 - 26,233 18,636 - 8,546 - 8,546 8,031 7,570 7,155 6,779
Dec 31, 2023 1,570 88,455 - 28,508 28,956 - 30,991 - 30,991 27,105 23,858 21,121 18,798
Dec 31, 2024 2,936 176,885 - 33,506 11,847 (28,433) 159,965 34,028 125,937 105,902 89,787 76,695 65,960
Dec 31, 2025 2,503 161,441 - 41,662 5,126 (29,002) 143,654 41,841 101,813 81,861 66,499 54,529 45,098
Dec 31, 2026 2,692 171,563 - 101,396 1,228 (35,625) 104,564 37,520 67,044 51,355 39,832 31,249 24,771
Dec 31, 2027 2,130 141,161 - 111,116 1,074 (49,099) 78,070 26,014 52,056 38,139 28,353 21,359 16,288
Dec 31, 2028 633 48,158 - 39,700 913 (13,017) 20,561 6,857 13,705 9,719 7,004 5,122 3,795
Dec 31, 2029 420 33,988 - 29,114 745 6,413 (2,284) (2,203) (81) (126) (132) (122) (106)
Dec 31, 2030 377 32,040 - 29,561 760 (14,585) 16,304 6,648 9,656 5,920 3,710 2,372 1,544
Dec 31, 2031 59 5,210 - 5,014 - 13,813 (13,617) (5,447) (8,170) (5,079) (3,226) (2,090) (1,379)
Dec 31, 2032 - - - - - 14,090 (14,090) (5,636) (8,454) (5,005) (3,035) (1,880) (1,189)
Dec 31, 2033 - - - - - - - - - - - - -
Dec 31, 2034 - - - - - 57,528 (57,528) (23,011) (34,517) (18,122) (9,804) (5,451) (3,108)
Dec 31, 2035 - - - - - 35,353 (35,353) (14,141) (21,212) (10,776) (5,647) (3,045) (1,685)
Dec 31, 2036 - - - - - 36,060 (36,060) (14,424) (21,636) (10,468) (5,237) (2,701) (1,432)
Dec 31, 2037 - - - - - 36,781 (36,781) (14,712) (22,069) (10,169) (4,856) (2,395) (1,217)
Dec 31, 2038 - - - - - - - - - - - - -
Dec 31, 2039 - - - - - - - - - - - - -
Dec 31, 2040 - - - - - - - - - - - - -
Dec 31, 2041 - - - - - - - - - - - - -
Dec 31, 2042 - - - - - - - - - - - - -
Dec 31, 2043 - - - - - - - - - - - - -
Dec 31, 2044 - - - - - - - - - - - - -
Dec 31, 2045 - - - - - - - - - - - - -
Total 14,967 944,425 - 456,124 70,663 30,278 387,360 73,334 314,026 288,209 254,143 220,961 191,570

Discounted cash flows from proved + probable reserves (2P) in the Group of Operated Assets, as at December 31, 2020, in USD thousands, for the Company's share
End of Period Date
Output volume (MBOE)
Total revenue
Royalty payments
Operating expenses
Development costs
Abandonment costs
Cash flow before
tax Tax 0% 5% 10% 15% 20%
Dec 31, 2021 4,823 220,071 - 106,916 3,047 - 110,109 - 110,109 107,504 105,099 102,869 100,795
Dec 31, 2022 4,464 220,512 - 102,033 18,636 - 99,843 - 99,843 92,915 86,773 81,299 76,393
Dec 31, 2023 4,707 253,948 - 106,962 28,956 - 118,030 - 118,030 104,280 92,682 82,821 74,377
Dec 31, 2024 4,959 290,101 - 106,116 11,847 - 172,138 34,028 138,111 116,351 98,823 84,561 72,850
Dec 31, 2025 3,804 234,175 - 104,799 5,126 - 124,250 40,601 83,649 67,396 54,860 45,074 37,350
Dec 31, 2026 2,755 174,908 - 104,673 1,228 - 69,006 26,852 42,154 32,399 25,213 19,843 15,780
Dec 31, 2027 2,130 141,161 - 111,116 1,074 - 28,971 11,285 17,687 12,973 9,655 7,282 5,559
Dec 31, 2028 633 48,158 - 39,700 913 - 7,545 2,952 4,593 3,196 2,262 1,627 1,186
Dec 31, 2029 420 33,988 - 29,114 745 19,690 (15,561) (6,186) (9,375) (6,463) (4,529) (3,222) (2,323)
Dec 31, 2030 377 32,040 - 29,561 760 20,084 (18,365) (7,219) (11,145) (7,276) (4,842) (3,279) (2,257)
Dec 31, 2031 59 5,210 - 5,014 - 35,362 (35,166) (14,066) (21,100) (12,747) (7,884) (4,983) (3,212)
Dec 31, 2032 - - - - - 36,069 (36,069) (14,428) (21,642) (12,453) (7,354) (4,446) (2,747)
Dec 31, 2033 - - - - - 22,420 (22,420) (8,968) (13,452) (7,235) (4,005) (2,276) (1,324)
Dec 31, 2034 - - - - - 57,528 (57,528) (23,011) (34,517) (18,122) (9,804) (5,451) (3,108) Dec 31, 2035 - - - - - 35,353 (35,353) (14,141) (21,212) (10,776) (5,647) (3,045) (1,685) Dec 31, 2036 - - - - - 36,060 (36,060) (14,424) (21,636) (10,468) (5,237) (2,701) (1,432) Dec 31, 2037 - - - - - 36,781 (36,781) (14,712) (22,069) (10,169) (4,856) (2,395) (1,217) Dec 31, 2038 - - - - - - - - - - - - - Dec 31, 2039 - - - - - - - - - - - - - Dec 31, 2040 - - - - - - - - - - - - - Dec 31, 2041 - - - - - - - - - - - - - Dec 31, 2042 - - - - - - - - - - - - - Dec 31, 2043 - - - - - - - - - - - - - Dec 31, 2044 - - - - - - - - - - - - - Dec 31, 2045 - - - - - - - - - - - - -
Total 29,131 1,654,272 - 846,004 72,331 299,347 436,590 (1,438) 438,028 441,305 421,210 393,579 364,986

Discounted cash flows from possible reserves in the Group of Operated Assets, as at December 31, 2020, in USD thousands, for the Company's share
End of Period Date
Output volume (MBOE)
Total revenue
Royalty payments
Operating expenses
Development costs
Abandonment costs
Cash flow before
tax Tax 0% 5% 10% 15% 20%
Dec 31, 2021 471 21,318 - 1,224 - - 20,093 - 20,093 19,576 19,098 18,655 18,244
Dec 31, 2022 580 27,009 - 1,664 - - 25,346 - 25,346 23,561 21,981 20,574 19,314
Dec 31, 2023 638 32,452 - 2,080 - - 30,372 21,913 8,459 7,478 6,650 5,945 5,342
Dec 31, 2024 673 37,185 - 1,971 - - 35,214 31,863 3,351 2,810 2,377 2,026 1,739
Dec 31, 2025 2,178 135,620 - 5,671 - - 129,949 59,315 70,634 56,367 45,462 37,023 30,418
Dec 31, 2026 1,596 101,282 - 5,895 - - 95,387 37,746 57,641 44,316 34,496 27,156 21,600
Dec 31, 2027 847 56,290 - 2,763 - - 53,527 21,167 32,359 23,628 17,510 13,153 10,002
Dec 31, 2028 1,648 111,275 - 76,019 - - 35,256 13,946 21,310 14,864 10,545 7,597 5,551
Dec 31, 2029 1,157 84,154 - 63,983 - (19,690) 39,861 15,874 23,987 16,170 11,103 7,752 5,496
Dec 31, 2030 532 44,887 - 33,500 - (6,542) 17,929 7,046 10,883 7,152 4,789 3,262 2,256
Dec 31, 2031 384 33,815 - 25,342 387 (14,876) 22,962 9,188 13,773 8,437 5,287 3,382 2,205
Dec 31, 2032 409 36,802 - 30,849 395 (15,174) 20,733 8,295 12,437 7,277 4,365 2,678 1,677
Dec 31, 2033 379 35,212 - 31,363 - (8,048) 11,898 4,759 7,139 3,827 2,111 1,196 694
Dec 31, 2034 352 33,763 - 31,896 - (57,528) 59,395 23,758 35,637 18,707 10,119 5,625 3,206 Dec 31, 2035 112 10,950 - 10,825 - (35,353) 35,478 14,191 21,287 10,814 5,667 3,055 1,691 Dec 31, 2036 - - - - - (12,268) 12,268 4,907 7,361 3,970 2,170 1,205 680 Dec 31, 2037 - - - - - (12,514) 12,514 5,005 7,508 3,857 2,012 1,069 578 Dec 31, 2038 - - - - - 62,270 (62,270) (24,908) (37,362) (15,879) (7,024) (3,222) (1,528) Dec 31, 2039 - - - - - 63,515 (63,515) (25,406) (38,109) (15,425) (6,513) (2,858) (1,299) Dec 31, 2040 - - - - - 39,032 (39,032) (15,613) (23,419) (9,198) (3,772) (1,609) (712) Dec 31, 2041 - - - - - 39,813 (39,813) (15,925) (23,888) (8,935) (3,498) (1,427) (605) Dec 31, 2042 - - - - - - - - - - - - - Dec 31, 2043 - - - - - - - - - - - - - Dec 31, 2044 - - - - - - - - - - - - - Dec 31, 2045 - - - - - - - - - - - - -
Total 11,955 802,015 - 325,044 783 22,638 453,550 197,122 256,428 223,374 184,935 152,237 126,551

Discounted cash flows from proved + probable + possible reserves (3P) in the Group of Operated Assets, as at December 31, 2020, in USD thousands, for the Company's share
End of Period Date
Output volume (MBOE)
Total revenue
Royalty payments
Operating expenses
Development costs
Abandonment costs
Cash flow
before tax Tax 0% 5% 10% 15% 20%
Dec 31, 2021 5,293 241,389 - 108,140 3,047 - 130,202 - 130,202 127,080 124,197 121,525 119,040
Dec 31, 2022 5,044 247,522 - 103,697 18,636 - 125,189 - 125,189 116,476 108,755 101,873 95,707
Dec 31, 2023 5,345 286,399 - 109,041 28,956 - 148,402 21,913 126,489 111,758 99,332 88,767 79,719
Dec 31, 2024 5,632 327,287 - 108,087 11,847 - 207,352 65,891 141,461 119,162 101,200 86,587 74,589
Dec 31, 2025 5,983 369,795 - 110,470 5,126 - 254,199 99,916 154,283 123,763 100,322 82,097 67,769
Dec 31, 2026 4,352 276,190 - 110,568 1,228 - 164,394 64,598 99,795 76,715 59,708 47,000 37,380
Dec 31, 2027 2,976 197,451 - 113,879 1,074 - 82,498 32,452 50,046 36,601 27,165 20,434 15,561
Dec 31, 2028 2,281 159,433 - 115,719 913 - 42,801 16,897 25,903 18,061 12,808 9,224 6,737
Dec 31, 2029 1,576 118,142 - 93,097 745 - 24,300 9,688 14,612 9,707 6,574 4,530 3,172
Dec 31, 2030 909 76,928 - 63,062 760 13,542 (436) (174) (262) (124) (53) (18) (1)
Dec 31, 2031 443 39,025 - 30,356 387 20,486 (12,204) (4,878) (7,326) (4,310) (2,598) (1,600) (1,006)
Dec 31, 2032 409 36,802 - 30,849 395 20,895 (15,337) (6,132) (9,205) (5,176) (2,989) (1,768) (1,069)
Dec 31, 2033 379 35,212 - 31,363 - 14,371 (10,522) (4,209) (6,313) (3,409) (1,894) (1,079) (630)
Dec 31, 2034 352 33,763 - 31,896 - - 1,867 747 1,120 585 315 174 99
Dec 31, 2035 112 10,950 - 10,825 - - 125 50 75 38 20 11 6
Dec 31, 2036 - - - - - 23,792 (23,792) (9,517) (14,275) (6,498) (3,067) (1,496) (752)
Dec 31, 2037 - - - - - 24,268 (24,268) (9,707) (14,561) (6,312) (2,844) (1,327) (639)
Dec 31, 2038 - - - - - 62,270 (62,270) (24,908) (37,362) (15,879) (7,024) (3,222) (1,528)
Dec 31, 2039 - - - - - 63,515 (63,515) (25,406) (38,109) (15,425) (6,513) (2,858) (1,299)
Dec 31, 2040 - - - - - 39,032 (39,032) (15,613) (23,419) (9,198) (3,772) (1,609) (712)
Dec 31, 2041 - - - - - 39,813 (39,813) (15,925) (23,888) (8,935) (3,498) (1,427) (605)
Dec 31, 2042 - - - - - - - - - - - - -
Dec 31, 2043 - - - - - - - - - - - - -
Dec 31, 2044 - - - - - - - - - - - - -
Dec 31, 2045 - - - - - - - - - - - - -
Total 41,086 2,456,287 - 1,171,048 73,114 321,985 890,140 195,684 694,456 664,679 606,144 545,816 491,537

5.1.3 The following are sensitivity analyses for key parameters that make up Cash Flows (USD thousands)
Sensitivity analysis to changes in sales volume in the Group of Operated Assets
Sensitivity/category
Discounting rate Sensitivity/category
Discounting rate
0% 10% 15% 20% 0% 10% 15% 20%
Increase in sales volume at rate of 10% Decrease in sales volume at rate of 10%
Proved Reserves (1P) Proved Reserves (1P)
Probable Reserves Probable Reserves
Proved + Probable Reserves (2P) Proved + Probable Reserves (2P)
Possible Reserves Possible Reserves
Proved + Probable + Possible Reserves (3P) Proved + Probable + Possible Reserves (3P)
Increase in sales volume at rate of 15% Decrease in sales volume at rate of 15%
Proved Reserves (1P) Proved Reserves (1P)
Probable Reserves Probable Reserves
Proved + Probable Reserves (2P) Proved + Probable Reserves (2P)
Possible Reserves Possible Reserves
Proved + Probable + Possible Reserves (3P) Proved + Probable + Possible Reserves (3P)
Increase in sales volume at rate of 20% Decrease in sales volume at rate of 20%
Proved Reserves (1P) Proved Reserves (1P)
Probable Reserves Probable Reserves
Proved + Probable Reserves (2P) Proved + Probable Reserves (2P)
Possible Reserves Possible Reserves
Proved + Probable + Possible Reserves (3P) Proved + Probable + Possible Reserves (3P)
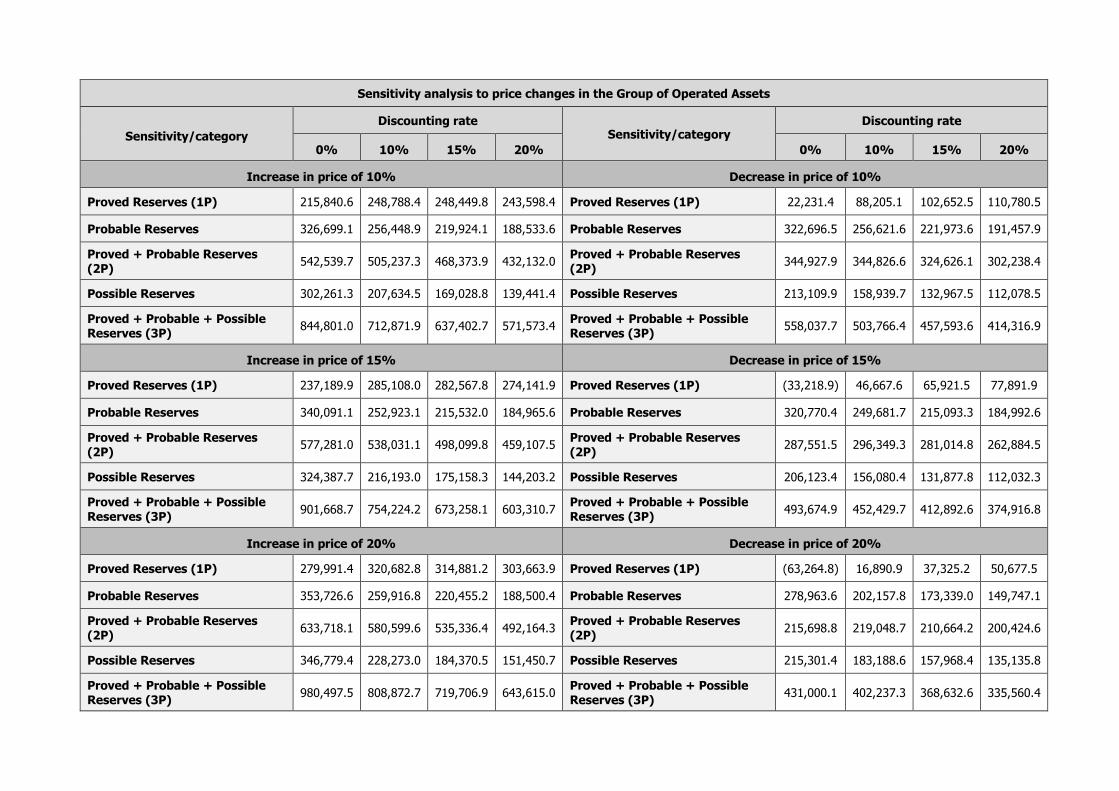
Sensitivity analysis to price changes in the Group of Operated Assets
Sensitivity/category
Discounting rate Sensitivity/category
Discounting rate
0% 10% 15% 20% 0% 10% 15% 20%
Increase in price of 10% Decrease in price of 10%
Proved Reserves (1P) 215,840.6 248,788.4 248,449.8 243,598.4 Proved Reserves (1P) 22,231.4 88,205.1 102,652.5 110,780.5
Probable Reserves 326,699.1 256,448.9 219,924.1 188,533.6 Probable Reserves 322,696.5 256,621.6 221,973.6 191,457.9
Proved + Probable Reserves (2P)
542,539.7 505,237.3 468,373.9 432,132.0 Proved + Probable Reserves (2P)
344,927.9 344,826.6 324,626.1 302,238.4
Possible Reserves 302,261.3 207,634.5 169,028.8 139,441.4 Possible Reserves 213,109.9 158,939.7 132,967.5 112,078.5
Proved + Probable + Possible Reserves (3P)
844,801.0 712,871.9 637,402.7 571,573.4 Proved + Probable + Possible Reserves (3P)
558,037.7 503,766.4 457,593.6 414,316.9
Increase in price of 15% Decrease in price of 15%
Proved Reserves (1P) 237,189.9 285,108.0 282,567.8 274,141.9 Proved Reserves (1P) (33,218.9) 46,667.6 65,921.5 77,891.9
Probable Reserves 340,091.1 252,923.1 215,532.0 184,965.6 Probable Reserves 320,770.4 249,681.7 215,093.3 184,992.6
Proved + Probable Reserves (2P)
577,281.0 538,031.1 498,099.8 459,107.5 Proved + Probable Reserves (2P)
287,551.5 296,349.3 281,014.8 262,884.5
Possible Reserves 324,387.7 216,193.0 175,158.3 144,203.2 Possible Reserves 206,123.4 156,080.4 131,877.8 112,032.3
Proved + Probable + Possible Reserves (3P)
901,668.7 754,224.2 673,258.1 603,310.7 Proved + Probable + Possible Reserves (3P)
493,674.9 452,429.7 412,892.6 374,916.8
Increase in price of 20% Decrease in price of 20%
Proved Reserves (1P) 279,991.4 320,682.8 314,881.2 303,663.9 Proved Reserves (1P) (63,264.8) 16,890.9 37,325.2 50,677.5
Probable Reserves 353,726.6 259,916.8 220,455.2 188,500.4 Probable Reserves 278,963.6 202,157.8 173,339.0 149,747.1
Proved + Probable Reserves (2P)
633,718.1 580,599.6 535,336.4 492,164.3 Proved + Probable Reserves (2P)
215,698.8 219,048.7 210,664.2 200,424.6
Possible Reserves 346,779.4 228,273.0 184,370.5 151,450.7 Possible Reserves 215,301.4 183,188.6 157,968.4 135,135.8
Proved + Probable + Possible Reserves (3P)
980,497.5 808,872.7 719,706.9 643,615.0 Proved + Probable + Possible Reserves (3P)
431,000.1 402,237.3 368,632.6 335,560.4

5.2 Production Information
Breakdown of output attributable to the Company's share in the Group of Operated Assets:
2020 2019
Oil
Natural gas
Condensate
Oil Natural gas Condensate
Total output in the period 2,765,978
BBK
16,037 MCF
184,108
BBL
3,498,387
BBL
18,629
MCF
315,271 BBL
Average price per output unit (attributable to equity holders of the Company) (USD per BOE)
47.5 17.2 42.4 63.9 28.1 31.9
Royalties to third parties (every payment derived from the output of the on-production asset, including from the gross income from the oil asset) paid per output unit (attributable to equity holders of the Company) (USD per BOE)
- - - - - -
Average production costs per output unit (USD per BOE)
16.3 16.3 16.3 16.8 16.8 16.8
Net production costs per output unit (USD per BOE)
31.2 0.9 26.0 47.1 11.3 15.2
Rate of depletion in the reporting period with respect to the total reserves in the oil asset (%)
19.3 19.3 19.3 15.3 15.3 15.3
5.3 Contingent Resources
Breakdown of the volume of contingent reserves attributable to the Group of Operated Assets,
as at December 31, 2020. For further information concerning the discounted cash flows
resulting from these resources, see p. 60 of the Resources Report.
Forward-looking information: there is no certainty that production of any part of the
contingent resources is possible.
Group of Operated Assets Contingent Resources
Heavy oil (MBBL)
Light oil (MBBL)
Natural
gas (MMCF)
Heavy oil (MBBL)
Light oil (MBBL)
Natural
gas (MMCF)
Gas liquids
(NGL) (MBBL)
(MBOE)
Resources Category
Resources in oil asset (100%) Company's share in resources
Low estimate (1C)
15,674.0 1,740.4 23,422.1 15,674.0 870.2 15,202.3 102.7 19,268.0
Best estimate (2C)
30,024.7 9,976.1 50,239.7 26,998.0 5,678.7 32,070.4 181.0 38,387.2
High estimate (3C)
46,753.4 18,926.0 111,016.5 40,846.4 11,308.2 72,148.7 708.8 65,302.8

6. Group of Non-Operated Assets resources and discounted cash flow data
Breakdown of resources and discounted cash flow data attributed to the Group of Non-Operated
Assets. All the following information is based on the NSAI Report.
6.1 Reserves attributed to the Group of Non-Operated Assets
6.1.1 Quantitative data
Breakdown of the volume of reserves attributable to the Group of Non-Operated Assets,
as at December 31, 2020.
Forward-looking information: Possible Reserves are the additional reserves that are not expected to be produced to the same extent as Probable Reserves. There is a 10%
chance that actual quantities produced will be equivalent to or higher than the proved
reserves, with the addition of the quantity of the probable and possible reserves.
6.1.2 Discounted cash flow data
Below is a breakdown of the discounted cash flow data resulting from the foregoing
reserves (below in this section: the “Cash Flows”).
The economic parameters used for the Cash Flows are based on information and
estimates that the Reserves Evaluator received from Ithaca. In this matter, see also
section 2.1.2 above.
Note: It is clarified that the discounted cash flow figures, whether they have
been calculated at a specific discount rate or without a discount rate, represent
the present value but not necessarily the fair value.
Group of Non-Operated Assets Reserves
Heavy oil (MBBL)
Light oil (MBBL)
Natural gas (MMCF)
Heavy oil
(MBBL)
Light oil (MBBL)
Natural gas
(MMCF)
Gas liquids (NGL) (MBBL)
(MBOE)
Reserves Category
Resources in oil asset (100%) Company's share in resources
Proved Reserves (1P)
0.0 132,117.7 1,279,012.0 0.0 8,569.5 133,255.5 4,227.1 35,771.7
Probable Reserves
0.0 41,012.4 350,554.7 0.0 3,246.6 33,981.7 1,486.1 10,591.6
Proved + Probable Reserves (2P)
0.0 173,130.1 1,629,566.7 0.0 11,816.1 167,237.2 5,713.2 46,363.3
Possible Reserves
0.0 69,286.1 508,767.6 0.0 5,220.8 56,866.4 1,938.6 16,963.9
Proved + Probable + Possible Reserves (3P)
0.0 242,416.2 2,138,334.3 0.0 17,036.9 224,103.6 7,651.8 63,327.2

Discounted cash flows from proved reserves (1P) in the Group of Non-Operated Assets, as at December 31, 2020, in USD thousands, for the Company's share
End of Period Date
Output volume (MBOE)
Total revenue
Royalty payments
Operating expenses
Development costs
Abandonment costs
Cash flow
before tax Tax 0% 5% 10% 15% 20%
Dec 31, 2021 6,048 247,739 - 78,178 33,366 - 136,195 - 136,195 133,014 130,080 127,362 124,836
Dec 31, 2022 6,089 243,248 - 70,677 8,018 - 164,553 - 164,553 152,940 142,656 133,497 125,298
Dec 31, 2023 5,166 210,069 - 70,715 - - 139,354 - 139,354 123,511 110,106 98,675 88,858
Dec 31, 2024 4,237 177,887 - 78,025 - - 99,862 - 99,862 84,310 71,755 61,520 53,099
Dec 31, 2025 3,512 151,643 - 75,473 586 - 75,585 4,830 70,754 56,906 46,242 37,931 31,383
Dec 31, 2026 2,823 125,765 - 69,416 - - 56,349 16,905 39,444 30,212 23,434 18,386 14,577
Dec 31, 2027 2,373 108,455 - 68,485 - 12,487 27,483 8,245 19,238 13,869 10,151 7,533 5,661
Dec 31, 2028 1,966 91,688 - 64,897 - 12,737 14,055 4,216 9,838 6,664 4,593 3,216 2,285
Dec 31, 2029 1,324 63,942 - 46,952 - - 16,991 5,097 11,893 7,895 5,342 3,679 2,574
Dec 31, 2030 462 24,536 - 14,836 - 63,099 (53,399) (21,360) (32,039) (19,898) (12,631) (8,180) (5,395)
Dec 31, 2031 402 21,858 - 14,892 - 64,361 (57,395) (22,958) (34,437) (20,391) (12,370) (7,670) (4,853)
Dec 31, 2032 269 15,465 - 9,925 - 65,648 (60,108) (24,043) (36,065) (20,346) (11,786) (6,993) (4,242)
Dec 31, 2033 182 11,233 - 6,320 - 80,070 (75,156) (30,063) (45,094) (24,324) (13,501) (7,691) (4,487)
Dec 31, 2034 170 10,800 - 6,412 - 13,371 (8,983) (3,593) (5,390) (2,830) (1,531) (850) (484)
Dec 31, 2035 159 10,327 - 6,509 - 13,639 (9,821) (3,928) (5,893) (2,944) (1,519) (806) (440)
Dec 31, 2036 149 9,938 - 6,609 - 13,912 (10,583) (4,233) (6,350) (3,019) (1,486) (754) (394)
Dec 31, 2037 140 9,567 - 6,713 - - 2,854 856 1,998 894 416 200 99
Dec 31, 2038 125 8,782 - 6,771 - - 2,012 603 1,408 602 268 124 59
Dec 31, 2039 112 8,067 - 6,838 - - 1,230 369 861 350 148 65 30
Dec 31, 2040 63 4,605 - 4,059 - - 546 164 382 150 61 26 12
Dec 31, 2041 - - - - - 16,079 (16,079) (6,432) (9,648) (3,536) (1,358) (544) (227)
Dec 31, 2042 - - - - - 16,401 (16,401) (6,560) (9,841) (3,435) (1,259) (483) (193)
Dec 31, 2043 - - - - - 16,729 (16,729) (6,692) (10,037) (3,337) (1,168) (428) (164)
Dec 31, 2044 - - - - - 17,064 (17,064) (6,825) (10,238) (3,242) (1,083) (380) (139)
Dec 31, 2045 - - - - - - - - - - - - -
Total 35,772 1,555,617 - 712,702 41,970 405,596 395,349 (95,402) 490,751 504,014 485,563 457,433 427,751

Discounted cash flows from probable reserves in the Group of Non-Operated Assets, as at December 31, 2020, in USD thousands, for the Company's share
End of Period Date
Output volume (MBOE)
Total revenue
Royalty payments
Operating expenses
Development costs
Abandonment costs
Cash flow before
tax Tax 0% 5% 10% 15% 20%
Dec 31, 2021 660 28,570 - (2,978) - - 31,549 - 31,549 30,718 29,952 29,242 28,581
Dec 31, 2022 664 30,096 - 1,034 - - 29,062 - 29,062 27,016 25,204 23,590 22,146
Dec 31, 2023 737 32,712 - 1,519 - - 31,193 - 31,193 27,609 24,580 22,000 19,788
Dec 31, 2024 824 36,826 - 1,763 - - 35,063 26,672 8,391 7,075 6,014 5,150 4,440
Dec 31, 2025 830 38,376 - 2,838 - - 35,538 31,482 4,057 3,241 2,617 2,134 1,755
Dec 31, 2026 1,075 49,728 - 11,788 - - 37,940 19,786 18,154 13,897 10,773 8,447 6,694
Dec 31, 2027 996 48,575 - 12,833 - (12,487) 48,230 21,246 26,984 19,866 14,839 11,230 8,602
Dec 31, 2028 1,009 51,857 - 16,498 - (12,737) 48,095 20,097 27,998 19,625 13,989 10,124 7,430
Dec 31, 2029 1,114 56,290 - 26,451 - 0 29,839 13,520 16,319 10,803 7,291 5,008 3,496
Dec 31, 2030 1,148 58,025 - 40,293 - (49,847) 67,579 26,934 40,645 25,270 16,060 10,413 6,876
Dec 31, 2031 245 14,163 - 1,062 - 11,813 1,288 515 773 378 183 86 37
Dec 31, 2032 280 15,433 - 5,927 - (1,738) 11,244 4,498 6,746 3,851 2,257 1,354 831
Dec 31, 2033 298 16,437 - 9,572 - (14,882) 21,747 8,699 13,048 7,137 4,015 2,317 1,369
Dec 31, 2034 232 12,857 - 9,450 - 53,121 (49,714) (19,886) (29,828) (15,180) (7,969) (4,304) (2,385)
Dec 31, 2035 209 11,763 - 9,544 - (13,639) 15,857 6,343 9,514 4,732 2,431 1,287 699
Dec 31, 2036 191 11,042 - 9,668 - (13,912) 15,286 6,114 9,172 4,347 2,133 1,080 563
Dec 31, 2037 55 3,316 - 2,525 - 0 791 602 189 85 40 19 10
Dec 31, 2038 13 862 - 89 - 14,474 (13,700) (5,279) (8,421) (3,674) (1,666) (782) (379)
Dec 31, 2039 13 877 - 93 - 14,763 (13,979) (5,469) (8,510) (3,536) (1,530) (687) (319)
Dec 31, 2040 - - - - - 15,058 (15,058) (5,969) (9,090) (3,593) (1,483) (636) (283)
Dec 31, 2041 - - - - - 15,359 (15,359) (6,144) (9,216) (3,470) (1,367) (561) (239)
Dec 31, 2042 - - - - - - - - - - - - -
Dec 31, 2043 - - - - - - - - - - - - -
Dec 31, 2044 - - - - - - - - - - - - -
Dec 31, 2045 - - - - - - - - - - - - -
Total 10,592 517,804 - 159,967 - 5,346 352,490 143,761 208,729 176,197 148,362 126,512 109,712

Discounted cash flows from proved + probable reserves (2P) in the Group of Non-Operated Assets, as at December 31, 2020, in USD thousands, for the Company's share
End of Period Date
Output volume (MBOE)
Total revenue
Royalty payments
Operating expenses
Development costs
Abandonment costs
Cash flow before
tax Tax 0% 5% 10% 15% 20%
Dec 31, 2021 6,708 276,310 - 75,200 33,366 - 167,743 - 167,743 163,732 160,032 156,604 153,418
Dec 31, 2022 6,752 273,344 - 71,711 8,018 - 193,615 - 193,615 179,956 167,859 157,087 147,443
Dec 31, 2023 5,902 242,781 - 72,234 - - 170,547 - 170,547 151,120 134,686 120,675 108,645
Dec 31, 2024 5,061 214,713 - 79,788 - - 134,925 26,672 108,254 91,385 77,769 66,670 57,539
Dec 31, 2025 4,342 190,020 - 78,311 586 - 111,123 36,312 74,811 60,147 48,859 40,065 33,137
Dec 31, 2026 3,898 175,493 - 81,204 - - 94,289 36,691 57,599 44,109 34,206 26,833 21,271
Dec 31, 2027 3,369 157,030 - 81,317 - - 75,713 29,491 46,222 33,735 24,990 18,763 14,263
Dec 31, 2028 2,976 143,545 - 81,395 - - 62,150 24,314 37,836 26,289 18,581 13,340 9,714
Dec 31, 2029 2,437 120,232 - 73,403 - - 46,829 18,617 28,213 18,697 12,633 8,687 6,071
Dec 31, 2030 1,609 82,561 - 55,129 - 13,252 14,180 5,574 8,606 5,372 3,429 2,233 1,482
Dec 31, 2031 648 36,020 - 15,955 - 76,174 (56,108) (22,443) (33,665) (20,013) (12,186) (7,585) (4,816)
Dec 31, 2032 549 30,897 - 15,851 - 63,910 (48,864) (19,546) (29,319) (16,495) (9,529) (5,639) (3,411)
Dec 31, 2033 480 27,670 - 15,891 - 65,188 (53,409) (21,364) (32,045) (17,187) (9,486) (5,374) (3,119)
Dec 31, 2034 402 23,657 - 15,862 - 66,492 (58,697) (23,479) (35,218) (18,010) (9,500) (5,154) (2,870)
Dec 31, 2035 368 22,089 - 16,053 - - 6,036 2,414 3,622 1,788 913 480 260
Dec 31, 2036 340 20,980 - 16,277 - - 4,703 1,881 2,822 1,328 647 326 169
Dec 31, 2037 195 12,883 - 9,238 - - 3,645 1,458 2,187 979 455 219 109
Dec 31, 2038 138 9,644 - 6,859 - 14,474 (11,689) (4,675) (7,013) (3,072) (1,398) (658) (320)
Dec 31, 2039 125 8,945 - 6,931 - 14,763 (12,749) (5,100) (7,650) (3,186) (1,381) (621) (289)
Dec 31, 2040 63 4,605 - 4,059 - 15,058 (14,512) (5,805) (8,707) (3,443) (1,421) (610) (271)
Dec 31, 2041 - - - - - 31,439 (31,439) (12,576) (18,863) (7,007) (2,725) (1,105) (466)
Dec 31, 2042 - - - - - 16,401 (16,401) (6,560) (9,841) (3,435) (1,259) (483) (193)
Dec 31, 2043 - - - - - 16,729 (16,729) (6,692) (10,037) (3,337) (1,168) (428) (164)
Dec 31, 2044 - - - - - 17,064 (17,064) (6,825) (10,238) (3,242) (1,083) (380) (139)
Dec 31, 2045 - - - - - - - - - - - - -
Total 46,363 2,073,421 - 872,669 41,970 410,942 747,839 48,360 699,480 680,211 633,924 583,945 537,463

Discounted cash flows from possible reserves in the Group of Non-Operated Assets, as at December 31, 2020, in USD thousands, for the Company's share
End of Period Date
Output volume (MBOE)
Total revenue
Royalty payments
Operating expenses
Development costs
Abandonment costs
Cash flow before
tax Tax 0% 5% 10% 15% 20%
Dec 31, 2021 654 28,444 - 222 (5,421) - 33,643 - 33,643 32,738 31,903 31,129 30,409
Dec 31, 2022 724 32,856 - (596) - - 33,452 - 33,452 31,156 29,120 27,303 25,673
Dec 31, 2023 644 30,800 - 639 - - 30,161 29,636 525 454 396 347 306
Dec 31, 2024 706 33,790 - 895 - - 32,895 26,657 6,238 5,265 4,479 3,839 3,313
Dec 31, 2025 735 35,833 - 621 - - 35,212 21,207 14,005 11,250 9,131 7,481 6,183
Dec 31, 2026 701 35,230 - 470 - - 34,760 14,019 20,741 15,865 12,289 9,630 7,626
Dec 31, 2027 780 39,796 - 1,730 - - 38,066 15,266 22,800 16,604 12,273 9,196 6,977
Dec 31, 2028 701 37,510 - 1,708 - - 35,802 14,356 21,445 14,881 10,505 7,532 5,479
Dec 31, 2029 855 46,547 - 8,071 - - 38,477 15,393 23,084 15,239 10,258 7,029 4,896
Dec 31, 2030 1,367 73,172 - 32,221 - (13,252) 54,203 21,672 32,531 20,553 13,267 8,734 5,853
Dec 31, 2031 2,079 110,346 - 69,677 - (76,174) 116,843 46,719 70,124 41,890 25,632 16,030 10,228
Dec 31, 2032 1,881 102,391 - 70,411 - (63,910) 95,890 38,349 57,541 32,633 19,001 11,333 6,910
Dec 31, 2033 1,586 88,276 - 60,393 - (65,188) 93,071 37,228 55,843 30,158 16,760 9,560 5,585
Dec 31, 2034 1,322 75,247 - 56,374 - (52,148) 71,021 28,408 42,612 21,811 11,516 6,255 3,486
Dec 31, 2035 1,137 66,086 - 52,474 - 14,631 (1,018) (407) (611) (332) (184) (103) (59)
Dec 31, 2036 176 11,431 - 1,034 - 69,178 (58,781) (23,512) (35,269) (15,963) (7,491) (3,632) (1,815)
Dec 31, 2037 262 16,382 - 8,089 - 70,562 (62,269) (24,908) (37,361) (16,126) (7,232) (3,359) (1,611)
Dec 31, 2038 277 17,544 - 10,613 - 57,499 (50,569) (20,227) (30,341) (12,271) (5,166) (2,255) (1,018)
Dec 31, 2039 253 16,312 - 10,722 - 58,649 (53,059) (21,224) (31,836) (12,280) (4,942) (2,067) (896)
Dec 31, 2040 123 8,188 - 5,453 - (15,058) 17,793 7,117 10,676 4,217 1,739 746 331
Dec 31, 2041 - - - - - - - - - 69 53 31 17
Dec 31, 2042 - - - - - 15,667 (15,667) (6,267) (9,400) (3,304) (1,219) (470) (189)
Dec 31, 2043 - - - - - 15,980 (15,980) (6,392) (9,588) (3,209) (1,130) (417) (160)
Dec 31, 2044 - - - - - 16,300 (16,300) (6,520) (9,780) (3,118) (1,048) (370) (136)
Dec 31, 2045 - - - - - - - - - - - - -
Total 16,964 906,180 - 391,219 (5,421) 32,736 487,645 206,572 281,074 228,178 179,910 143,503 117,389

Discounted cash flows from proved + probable + possible reserves (3P) in the Group of Non-Operated Assets, as at December 31, 2020, in USD thousands, for the Company's share
End of Period Date
Output volume (MBOE)
Total revenue
Royalty payments
Operating expenses
Development costs
Abandonment costs
Cash flow before tax Tax 0% 5% 10% 15% 20%
Dec 31, 2021 7,362 304,754 - 75,422 27,945 - 201,386 - 201,386 196,471 191,934 187,732 183,827
Dec 31, 2022 7,477 306,200 - 71,115 8,018 - 227,067 - 227,067 211,112 196,979 184,390 173,116
Dec 31, 2023 6,547 273,581 - 72,873 - - 200,708 29,636 171,071 151,574 135,082 121,023 108,952
Dec 31, 2024 5,767 248,503 - 80,683 - - 167,820 53,329 114,492 96,650 82,249 70,509 60,852
Dec 31, 2025 5,077 225,853 - 78,932 586 - 146,335 57,519 88,816 71,396 57,990 47,546 39,320
Dec 31, 2026 4,599 210,724 - 81,674 - - 129,050 50,710 78,340 59,973 46,496 36,463 28,897
Dec 31, 2027 4,149 196,826 - 83,047 - - 113,779 44,757 69,022 50,339 37,263 27,960 21,240
Dec 31, 2028 3,677 181,055 - 83,103 - - 97,952 38,670 59,282 41,170 29,086 20,872 15,193
Dec 31, 2029 3,293 166,779 - 81,473 - - 85,306 34,010 51,296 33,936 22,892 15,717 10,966
Dec 31, 2030 2,976 155,732 - 87,349 - - 68,383 27,246 41,136 25,925 16,696 10,967 7,335
Dec 31, 2031 2,727 146,366 - 85,631 - - 60,735 24,276 36,459 21,877 13,446 8,446 5,412
Dec 31, 2032 2,430 133,288 - 86,262 - - 47,026 18,803 28,223 16,138 9,472 5,694 3,498
Dec 31, 2033 2,066 115,946 - 76,284 - - 39,662 15,865 23,797 12,971 7,274 4,186 2,466
Dec 31, 2034 1,724 98,904 - 72,236 - 14,344 12,324 4,929 7,394 3,801 2,016 1,100 617
Dec 31, 2035 1,505 88,176 - 68,527 - 14,631 5,018 2,007 3,011 1,457 729 377 200
Dec 31, 2036 517 32,412 - 17,311 - 69,178 (54,078) (21,631) (32,447) (14,636) (6,843) (3,306) (1,646)
Dec 31, 2037 457 29,265 - 17,328 - 70,562 (58,624) (23,450) (35,174) (15,147) (6,777) (3,140) (1,502)
Dec 31, 2038 414 27,188 - 17,473 - 71,973 (62,257) (24,903) (37,354) (15,343) (6,563) (2,913) (1,338)
Dec 31, 2039 378 25,256 - 17,653 - 73,412 (65,809) (26,323) (39,485) (15,466) (6,324) (2,689) (1,185)
Dec 31, 2040 186 12,793 - 9,513 - - 3,281 1,312 1,969 774 318 136 60
Dec 31, 2041 - - - - - 31,439 (31,439) (12,576) (18,863) (6,937) (2,672) (1,074) (449)
Dec 31, 2042 - - - - - 32,068 (32,068) (12,827) (19,241) (6,739) (2,478) (953) (381)
Dec 31, 2043 - - - - - 32,709 (32,709) (13,084) (19,625) (6,546) (2,298) (845) (324)
Dec 31, 2044 - - - - - 33,363 (33,363) (13,345) (20,018) (6,359) (2,131) (749) (276)
Dec 31, 2045 - - - - - - - - - - - - -
Total 63,327 2,979,601 - 1,263,889 36,549 443,679 1,235,485 254,931 980,553 908,390 813,834 727,447 654,851

6.1.3 The following are sensitivity analyses for the key parameters that the Cash Flows are composed of
Sensitivity analysis to changes in sales volume in the Group of Non-Operated Assets
Sensitivity/category Discounting rate
Sensitivity/category Discounting rate
0% 10% 15% 20% 0% 10% 15% 20%
Increase in sales volume at rate of 10% Decrease in sales volume at rate of 10%
Proved Reserves (1P) 678,417.0 626,036.7 580,258.4 536,283.6 Proved Reserves (1P) 328,098.1 351,621.1 336,522.6 318,029.5
Probable Reserves 212,995.8 143,853.6 119,873.7 102,200.9 Probable Reserves 195,381.3 150,892.8 131,771.5 116,198.6
Proved + Probable Reserves (2P)
891,412.9 769,890.4 700,132.1 638,484.5 Proved + Probable Reserves (2P)
523,479.5 502,513.9 468,294.1 434,228.1
Possible Reserves 333,632.4 193,280.0 149,397.2 119,595.5 Possible Reserves 231,163.8 159,381.3 132,141.1 111,818.8
Proved + Probable + Possible Reserves (3P)
1,225,045.2 963,170.4 849,529.3 758,080.0 Proved + Probable + Possible Reserves (3P)
754,643.3 661,895.2 600,435.1 546,046.9
Increase in sales volume at rate of 15% Decrease in sales volume at rate of 15%
Proved Reserves (1P) 760,663.1 688,761.0 634,617.0 583,881.7 Proved Reserves (1P) 260,403.7 293,244.3 283,205.4 269,157.8
Probable Reserves 220,588.0 139,729.3 114,997.3 97,555.2 Probable Reserves 178,847.9 143,485.8 126,015.0 111,296.1
Proved + Probable Reserves (2P)
981,251.0 828,490.4 749,614.3 681,436.9 Proved + Probable Reserves (2P)
439,251.6 436,730.1 409,220.4 380,453.9
Possible Reserves 369,020.7 204,731.5 156,238.8 123,940.9 Possible Reserves 216,476.6 156,345.3 131,918.0 113,349.7
Proved + Probable + Possible Reserves (3P)
1,350,271.7 1,033,221.9 905,853.1 805,377.8 Proved + Probable + Possible Reserves (3P)
655,728.2 593,075.4 541,138.4 493,803.6
Increase in sales volume at rate of 20% Decrease in sales volume at rate of 20%
Proved Reserves (1P) 836,187.6 742,138.2 681,087.6 625,129.1 Proved Reserves (1P) 151,604.5 223,691.0 226,628.7 222,370.3
Probable Reserves 238,001.5 145,901.5 118,154.8 98,873.0 Probable Reserves 213,337.2 158,170.2 135,044.1 116,292.9
Proved + Probable Reserves (2P)
1,074,189.1 888,039.7 799,242.3 724,002.2 Proved + Probable Reserves (2P)
364,941.7 381,861.2 361,672.8 338,663.2
Possible Reserves 396,192.3 211,669.0 160,278.4 126,653.6 Possible Reserves 197,029.4 138,551.0 117,239.4 101,052.5
Proved + Probable + Possible Reserves (3P)
1,470,381.4 1,099,708.7 959,520.7 850,655.8 Proved + Probable + Possible Reserves (3P)
561,971.1 520,412.2 478,912.2 439,715.7

Sensitivity analysis to price changes in the Group of Other Assets
Sensitivity/category Discounting rate
Sensitivity/category Discounting rate
0% 10% 15% 20% 0% 10% 15% 20%
Increase in price of 10% Decrease in price of 10%
Proved Reserves (1P) 607,359.6 576,603.8 539,128.8 501,848.6
Proved Reserves (1P) 371,242.1 386,685.9 368,759.6 347,866.0
Probable Reserves 229,205.9 159,539.6 134,400.3 115,386.8
Probable Reserves 200,591.5 152,818.7 131,897.2 114,834.4
Proved + Probable Reserves (2P) 836,565.5 736,143.4 673,529.2 617,235.5
Proved + Probable Reserves (2P)
571,833.6 539,504.7 500,656.8 462,700.4
Possible Reserves 328,134.7 197,139.9 154,421.4 124,735.6
Possible Reserves 239,203.6 162,084.8 132,749.6 111,034.6
Proved + Probable + Possible Reserves (3P) 1,164,700.3 933,283.3 827,950.6 741,971.1
Proved + Probable + Possible Reserves (3P)
811,037.2 701,589.4 633,406.4 573,735.0
Increase in price of 15% Decrease in price of 15%
Proved Reserves (1P) 667,242.6 624,801.4 582,069.6 540,424.2 Proved Reserves (1P) 272,282.0 318,442.7 310,963.0 298,037.2
Probable Reserves 235,124.4 159,010.3 132,717.4 113,175.6 Probable Reserves 231,457.0 168,778.6 143,297.5 122,883.9
Proved + Probable Reserves (2P)
902,367.0 783,811.7 714,787.0 653,599.8 Proved + Probable Reserves (2P)
503,739.0 487,221.3 454,260.5 420,921.1
Possible Reserves 355,642.9 207,768.8 161,700.5 130,179.0 Possible Reserves 218,879.2 153,653.3 127,502.7 107,727.3
Proved + Probable + Possible Reserves (3P)
1,258,009.9 991,580.5 876,487.6 783,778.8 Proved + Probable + Possible Reserves (3P)
722,618.3 640,874.6 581,763.2 528,648.4
Increase in price of 20% Decrease in price of 20%
Proved Reserves (1P) 718,913.2 666,111.2 619,045.3 573,859.2
Proved Reserves (1P) 193,257.0 262,571.2 263,922.1 258,032.6
Probable Reserves 247,201.2 161,416.1 133,783.7 113,653.9
Probable Reserves 240,792.9 170,079.9 142,092.9 119,689.3
Proved + Probable Reserves (2P) 966,114.4 827,527.3 752,829.0 687,513.0
Proved + Probable Reserves (2P) 434,049.9 432,651.1 406,015.0 377,721.9
Possible Reserves 381,903.4 221,695.0 171,696.2 137,604.9
Possible Reserves 202,416.7 142,974.8 120,421.3 103,170.6
Proved + Probable + Possible Reserves (3P) 1,348,017.8 1,049,222.2 924,525.2 825,118.0
Proved + Probable + Possible Reserves (3P) 636,466.6 575,625.9 526,436.3 480,892.5

6.2 Production Information
Breakdown of output attributable to the Company's share in the Group of Non-Operated Assets:
2020 2019
Oil
Natural gas
Condensate
Oil Natural gas Condensate
Total output in the period 2,244,702
BBL 26,901 MCF
654,671 BBL
2,615,404 BBL
23,597 MCF
535,675 BBL
Average price per output unit (attributable to equity holders of the Company) (USD per BOE)
42.3 18.9 24.5 64.2 29.0 27.1
Royalties to third parties
(every payment derived from the output of the on-production asset, including from the gross income from the oil asset) paid per output unit (attributable to equity holders of the Company) (USD per BOE)
- - - - - -
Average production costs per output unit (USD per BOE)
12.1 12.1 12.1 15.2 15.2 15.2
Net production costs per output unit (USD per BOE)
30.2 6.8 12.4 48.9 13.8 11.18
Rate of depletion in the reporting period with respect to the total reserves in the oil asset (%)
15.6 15.6 15.6 13.5 13.5 13.5
6.3 Contingent Resources
Breakdown of the volume of contingent reserves attributable to the Group of Non-Operated Assets,
as at December 31, 2020. For further information concerning the discounted cash flows resulting
from these resources, see p. 63 of the Resources Report.
Forward-looking information: there is no certainty that production of any part of the
contingent resources is possible.
Group of Non-Operated Assets Contingent Resources
Heavy
oil (MBBL)
Light oil (MBBL)
Natural gas
(MMCF)
Heavy oil
(MBBL)
Light oil (MBBL)
Natural gas
(MMCF)
Gas liquids (NGL)
(MBBL)
(MBOE)
Resources Category Resources in oil asset (100%) Company's share in resources
Low estimate (1C)
0.0 3,782.4 44,907.0 0.0 283.9 2,887.1 327.2 1,108.8
Best estimate (2C)
0.0 64,747.4 183,675.9 0.0 6,034.5 14,648.3 401.1 8,961.2
High estimate (3C)
0.0 174,291.9 409,611.3 0.0 18,222.2 53,178.9 957.7 28,348.7

7. Reconciliation between the data in previous reports with regard to the volume of reserves
attributed to the oil asset
On July 1, 2020, the Company published NSAI’s Resources Report, which included an evaluation of
resources attributable to the oil assets as at June 30, 2020 (Ref. No.: 2020-01-074451) ("the Previous Report"). Below is a breakdown of key data regarding the major differences between the volumes
of resources attributed to Ithaca’s oil assets in the current Resources Report and the Previous Report
(in MBOE):
June 30, 2020
Total Output in the second
half of 2020
December 31, 2020
Total change in
volume
% change
Total according to the Previous
Report
Total according to current NSAI
Report
Total 2P
Reserves 190,839 11,042 195,494
4,655(1) Increase of
2%
Total 2C Contingent Resources
67,547 - 102,113
34,566(2) Increase of 51%
Total 2P + 2C Resources
258,386 11,042 297,607 39,221 Increase of
15%
The differences between the data presented in the Previous Report and that in the current NSAI
Report, as set out in the foregoing table, are mainly due to the following:
(1) The estimated remaining reserves in the Captain, Erskine, Elgin Franklin, Britannia, Jade fields increased according to the NSAI Report by a volume of 21.9 MMBOE. The estimated remaining
reserves in the Alder and Cook fields, and the GSA Project decreased by 6.2 MMBOE.
Total output in the second half of 2020 amounted to 11 million MMBOE and the change amounted
to a volume of 4.6 MMBOE.
(2) The NSAI Report attributed 2C contingent resources to the Marigold and Isabella fields an
additional volume of 35 MMBOE.
8. Management declaration
(1) Declaration date: March 22, 2021
(2) Name of the corporation: Delek Group Ltd.
(3) Name and position of the resource valuation officer in the Company: Gabriel Last, Chairman of
the board of directors
(4) We hereby confirm that the Reserves Evaluator received all the information required to perform
the work.
(5) We hereby confirm that nothing came to our attention that indicates any dependence between
the Reserves Evaluator and the Company.
(6) We confirm that, to the best of our knowledge, the resources reported are the best and most
current estimates available to us.
(7) We hereby confirm that the data included in this Report were prepared in accordance with the
professional terms under Chapter Seven of the Third Schedule to the Securities Regulations (Details of the Prospectus and Draft Prospectus - Structure and Form), 1969, and the meanings
given to them in Petroleum Resources Management System (2018) published by the Petroleum Engineers Association (SPE), the American Association of Petroleum Geologists (AAPG), the
World Petroleum Council (WPC) and the Association of Petroleum Assessment Engineers (SPEE),
as in effect at the time of publication of the Report;
(8) We confirm that no change has been made to the identity of the valuator or the auditor that
prepared or audited the disclosure of the most recent reserves or contingent resources report
issued by the Company.

(9) We agree to include this statement in this report.
Gabriel Last, Chairman of the board of directors
9. Hedging transactions
As part of Ithaca's risk management strategy it carries out, from time to time, hedging transactions
(primarily PUT and SWAP transactions) on oil and natural gas prices, and disposes of such transactions.
As at December 31, 2020, Ithaca has open hedging transactions on oil prices on an amount of 9.4 million
barrels at an average hedged price of USD 43 per barrel. In addition, as at December 31, 2020, Ithaca has open hedge transactions on gas prices for a volume of 497 million thermal units at an average
hedged price of GBP 0.45 per thermal unit.
Breakdown of open hedging transactions at December 31, 2020 on the prices of oil and natural gas:
(A) Hedging the Price of Oil
Period Quantity
(K barrels of oil)
Average exercise price
(USD/barrel)
Swap Q1, 2021 - Q4, 2022 7,540 40
Put Q1, 2021 - Q4, 2021 1,928 56
(B) Hedges on the price of natural gas
Period Quantity
(ktherms)*
Average exercise price
(penny per thermal unit)
Swap Q1, 2021 - Q1, 2023 305,250 45
Put Q1, 2021 - Q4, 2022 191,500 44
* Scope of gas transactions is equivalent to 8,565 BOE
The cost of acquiring the hedging transactions (in non-discounted values) as at December 31, 2020
amounts to USD 33 million, to be repaid over the transaction period (deferred premium), as set out
below:
Year
USD
Millions
2021 29
2022 4
Total 33
Sincerely,
Delek Group Ltd. Approved for reporting by:
Gabriel Last, Chairman of the Board of Directors
Tamir Polikar, Deputy CEO and CFO

This is a convenience translation of the original HEBREW immediate report issued to the Tel Aviv Stock Exchange by the Company on March 22, 2021.
About The Delek Group
Delek Group is an independent E&P company with activities in the UK North Sea and the East
Mediterranean. Delek Group has significant holdings in the Leviathan and Tamar natural gas reservoirs
in the East Mediterranean (Israel's territorial water), with reserves and resources of more than 30 TCF and annual production capacity of more than 20 BCM. These reservoirs are major natural gas suppliers
to the growing markets of Israel, Egypt and Jordan and Delek continues to lead the region’s development into a major natural gas export hub. Through its wholly owned subsidiary Ithaca, Delek
Group holds high-quality oil and natural gas assets in the UK North Sea totaling approximately 260
million barrels of oil equivalent (boe) and producing more than 20 million boe per year. Delek Group is one of Israel’s largest and most prominent companies with a consistent track record of growth. Its
shares are traded on the Tel Aviv Stock Exchange (DLEKG:IT).
For more information on Delek Group please visit www.delek-group.com
Contact
Investors
Limor Gruber Head of Investor Relations
Delek Group Ltd. Tel: +972 9 8638443