research to evaluate the shortage of skilled workers in northern
TRANSCRIPT

Report # 116
Research to Evaluate the Shortage of Skilled Workers in Northern Alberta
Prepared for
The Northern Alberta Labour Market Information Clearinghouse Project
By
Steven Lakey, MBA, CMC

Research to Evaluate the Shortage of Skilled Workers in Northern Alberta
Prepared for The Northern Labour Market Information Clearinghouse Project By Steven Lakey, MBA, CMC TOC Page i
Table of Contents Page Executive Summary Purpose of Study i Method of Study i Findings and Conclusions ii Recommendations vi Chapter 1 – Introduction 1 I. Purpose of the Study 1 II. Methodology 1 III. Structure of Report 2 Chapter 2 – Overview of Socio-economic Background Conditions 4 I. General Demographic Factors and Trends 6 II. Education and Literacy 12 III. Composition of Labour Force 16 IV. Economic Conditions 21 Chapter 3 - Shorter Term Skills Shortages and Workforce Characteristics 26 Limitations 26 I. Composition of the Labour Force and Skills Requirements in 2001 29 II. Changes Between 2001 and 2005 36 III. Changes Forecast for the Period 2005 to 2010 43 IV. Special Note on Construction Trades 51 V. Comparison of Rate of Growth Forecasts for 2005 to 2010 53 VI. Concerns and Issues Faced By Employers 62 Addendum: Summary Tables of Underlying Data 70 Chapter 4 - Longer Term Demographic Issues 74 I. Inter-regional Comparisons 74 II. A More Detailed Review of the Two Sub-regions 85 Chapter 5 - Training and Skills Requirements 89 I. Training and Skills Requirements From a Macro-Perspective 89 II. Training and Skills Requirements for Select Occupations 93 Chapter 6 – Other Factors and Trends That May Affect Skills Shortages 96 I. Technological Innovation and Changes 96 II. Potential Emerging Opportunities 103
A. Coal bed Methane 103 B. Diamond Exploration and Mining 108
III. Other Factors 112 A. In Relation to the Retail Sector 112 B. In Relation to Other Areas of the Service Sector 112
(Tourism, Food Service and Hospitality) C. In Relation to Trades and Apprenticeship 112 D. In Relation to the Aboriginal Community 115 E. In Relation to the Disabled Community 116 F. In Relation to Location 116
Chapter 7 – Strategies, Programs and Best Practices 117 I. Government of Alberta 117 II. Government of Canada 122 III. Other Programs and Initiatives to Address Skills Shortages 125 IV. Implications and Opportunities For Clearinghouse Colleges 127 Chapter 8 – Conclusions and Recommendations 131 I. Conclusions 131 II. Recommendations 138
A. Short Term 138 B. Medium Term 141 C. Longer Term 142
A Review of Issues Pertaining to the Apprenticeship System in Northern Alberta Table of Contents
Prepared for The Northern Labour Market Information Clearinghouse Project By Steven Lakey, MBA, CMC TOC Page ii
Appendix 1 - Occupational Details Appendix 2 – Individuals and Organizations Contacted Appendix 3 - Bibliography

Research to Evaluate the Shortage of Skilled Workers in Northern Alberta Executive Summary
Prepared for The Northern Labour Market Information Clearinghouse Project By Steven K. Lakey, MBA, CMC Page i
Executive Summary Purpose of Study Skills shortages are becoming a critical issue to the Alberta economy. The colleges that are members of the Clearinghouse system require information that will help them to determine how they can best be positioned to address the problem, particularly in the narrower context of Northern Alberta. As such, the purpose of this project is to:
Identify industries/occupations with a shortage of skilled workers and quantify the shortages. Of interest was a focus on the higher profile requirements of the booming resource sector as well as the “general” community and small to medium sized business requirements as the Northern Alberta economy evolves.
Clarify concerns raised by business, industry and other levels of government with respect to the shortage, or potential shortage, of skilled workers in the region.
Identify “professional” occupational /trade position and training requirements and/or upgrading opportunities to meet the needed skills, with an interest in how new forms of production, changes in technology and/or emerging opportunities (such as a potential growing interest in coal bed methane, for example) may affect the requirements.
Help to focus and orchestrate the concerted efforts of the post-secondary institutions, industry, business and government to address the issues.
Method of Study The study was completed in several steps. Following a literature review, and development of a socioeconomic profile for the Region and the Northeast and Northwest Sub-regions, the next step was to use Statistics Canada 2001 census to develop a baseline of skills requirements as reflected by occupations/jobs and the number of individuals in each type. Next, forecasts developed by Alberta Human Resources and Development and to a lesser extent, the Alberta Construction Owners Association were used to develop estimates of the skills required in 2005 and the skills forecast to be required in 2010. Changes in the numbers of individuals required for each occupation type, growth rates, and the concerns of employers in the region were also analyzed to understand shorter- term (through to 2010) skills requirements. Population projections through to 2026, developed by Alberta Finance, were used to complete an analysis of the potential impact of longer-term demographic changes. Based upon the findings of the previous steps, a “prioritization matrix” was developed to provide a potential ranking of perceived importance of occupations and priorities for the colleges. For approximately 30 occupations that were considered to be reflective of the Northern economy, additional research was undertaken to review the specific skills and training required and training programs available. A number of “other factors”, such as the potential impact of technology with respect to the 30 occupations, larger-scale emerging opportunities (such as coal bed methane and diamond exploration), as well as “perceptions and expectations” were reviewed to ascertain their potential impact on the requirement for skills.

Research to Evaluate the Shortage of Skilled Workers in Northern Alberta Executive Summary
Prepared for The Northern Labour Market Information Clearinghouse Project By Steven K. Lakey, MBA, CMC Page ii
The key strategies of the provincial and federal governments to address skills shortages and integrate underrepresented groups as well as some of the programs and best practices were reviewed to attempt to fine tune the opportunities and roles for the Northern Colleges. The preparation of a summary of “findings and conclusions” and “recommendations”, of which the most important are discussed below, was the final step. Findings and Conclusions The major findings and conclusions of the study are summarized below. 1. There are limitations that must be considered with the findings of this project.
They include: Timeliness for the 2001 Census data; projections and forecasts during times of great change; the underlying assumptions used and lack of control over factors such as migration; the lack of information, in some cases, at the regional and sub-regional levels, or the level of statistical validity that has been and /or can be achieved with the same; the “fit” of some of the data from a geographic perspective; and the complexities of using two different occupational systems (NOC-2001 and NOC-2001) for some of the data. Because of some of these limitations, for the most part, the report deals with skills shortages by using the forecast demand for occupations (and sub-components such as growth or decline in numbers and rates of change) as a “surrogate” indicator rather than focusing on the specific skill requirements of occupations, or other possible definitions of skills shortages. Furthermore, it is probably better to consider the trends that can be derived from the data rather than the specific details.
2. Based upon the 2001 Census data, the characteristics of the population of
Northern Alberta are sufficiently different from Alberta and Canada that “unique” solutions to skills shortages may be required.
The population of Northern Alberta is considerably younger, there are fewer people of retirement age, fewer immigrants and visible minorities, and the proportion of the population that is Aboriginal is considerably larger than that of Alberta or Canada. It has a higher proportion of the labour force engaged in trades and equipment operator, sales and service and primary industry occupations. There are also a higher proportion of individuals who work from home and a higher proportion that are self-employed.
3. The basic education levels of Northern Albertans may be limiting factors in meeting future skills requirements.
The proportion of Northern Albertans over the age of 20 who do not have a high school
diploma or equivalent is approximately 67%. By comparison, the comparable figures for Alberta and Canada are approximately 54% and 56%, respectively. Of even greater potential concern is the almost 10% of Northern Albertan who do not have at least grade 9 (compared to 6% for Alberta and 10% for Canada). Up to 6,000 Northern Albertans may be in need of upgrading to achieve even a grade 9 level of education. Up to 1,800 Northern Albertans could benefit from English as Second Language training.
4. Between 2005 and 2010, Northern Alberta will require a net addition of
approximately 19,000 individuals (or perhaps best thought of in terms of “man-

Research to Evaluate the Shortage of Skilled Workers in Northern Alberta Executive Summary
Prepared for The Northern Labour Market Information Clearinghouse Project By Steven K. Lakey, MBA, CMC Page iii
units of skills”) over and above the current base of approximately 175,000, to meet projected demands; however, this figure understates the potential skills shortfall.
The requirements of Northeastern Alberta will grow by approximately 15.8% (9,500 on a base of 61,000 in 2005) and the requirements for Northwestern Alberta will grow by 7.6% (8,900 on a base of approximately 118,000 in 2005). However, the net additional requirement figures do not take account of the complex changes that are occurring within Occupational Categories. For example, the agricultural sector is expected to lose a further approximately 680 positions during the period (in addition to the approximately 5,300 jobs that were estimated to have been lost in the 2001 to 2005 period). In addition, since the projections were developed in 2005, there have been a number of new major construction projects that have received approval. The following table summarizes the 10 Occupational Categories that are forecast to experience the largest increase in numbers.
New Jobs 10 Occupational Categories With the Largest
Increase in Numbers 2005 to 2010 2005 to 2010Percentage of Total
Totals 18,490 100.0% G9 Sales and service occupations, n.e.c. 1,750 9.5% B5 Clerical occupations 1,530 8.3% H7 Transportation equipment operators 1,450 7.8% G2 Retail salespersons and sales clerks 960 5.2% A2 Managers in retail trade, food and accommodation 840 4.5% H1 Construction trades 800 4.3% H4 Mechanics 730 3.9% G3 Cashiers 600 3.2% H8 Helpers, construction and transportation labourers 580 3.1% H6 Heavy equipment and crane operators, including drillers 570 3.1% Sub-total Top 10 9,810 53.1%
5. There are a number of Occupational Categories for which the rate of increase in
demand over the period 20005 to 2010 is expected to be very high. Over the period 2005 to 2010, the annual average growth rate (AAGR) for occupations for the Northern Region and the Wood Buffalo – Cold Lake and Athabasca – Grande Prairie Sub-regions, it is expected to be 1.7%, 2.6% and 1.3%, respectively. In comparison, for all of Alberta is forecast to be 1.8%. In the following table, the 10 Occupational Categories expected to experience the highest AAGR are highlighted.
10 Occupational Categories With the Highest AAGR 2005 to 2010 AAGR
G2 Retail salespersons and sales clerks 3.4% G3 Cashiers 3.0% G1 Wholesale, technical, insurance, real estate sales 3.0% A2 Managers in retail trade, food and accommodation 2.6% J3 Labourers in processing, manufacturing and utilities 2.6% H7 Transportation equipment operators 2.5% H8 Helpers, construction and transportation labourers 2.4% D2 Technical and related occupations in health 2.4% B2 Secretaries 2.3% G8 Child care and home support workers 2.3%

Research to Evaluate the Shortage of Skilled Workers in Northern Alberta Executive Summary
Prepared for The Northern Labour Market Information Clearinghouse Project By Steven K. Lakey, MBA, CMC Page iv
6. Generally speaking, most employers expressed concerns with regard to hiring staff, and wages in Northern Alberta are higher than in other parts of Alberta and reflective of the concerns; however, the most serious concerns were voiced by employers who had a need for specific trades that were in high demand or employers who were not able to compete with the oil and gas sector.
This is a fairly complex subject to discuss and it may be most effective for the reader to reference the tables in Chapter 3, Section VII for further details and comparisons.
7. From a longer-term demographic perspective, the composition of the population of
Northern Alberta may exacerbate the skills shortages, particularly over the period of approximately 2014 to 2020.
Over the period through to 2026, Northern Alberta’s population will be categorized by a rapidly growing youth population and a rapidly growing senior’s population. During the period of approximately 2014 to 2020, the number of retirees will increase rapidly, yet the number of people of “prime work force age” (24 to 64) will not keep pace with withdrawals, particularly if the size of the work force is compared as being a proportion of the total population. The problem will be most severe in the Northwest if current population and migration assumptions hold. The problem starts to correct beginning in about 2022 as the youth population becomes of working age and the number of baby boom” retirees each year begins to decline.
8. With respect to the education levels needed to meet skills requirements in 2010, the following scenario is likely.
Approximately 12% of occupations will require a university education. The two largest components will be teachers and nurses. Between 40% and 53% of occupations will require completion of a two- year college program or an apprenticeship program. The largest concentrations will be for trades persons and equipment operators and those in business, finance and administration. A high school education will be adequate for approximately 20% of future requirements. Most in Northern Alberta will be of a clerical nature. Individuals with less than a high school education (and without other training) will be limited to approximately 15 % of future opportunities.
9. Changes in technology are, in general, not likely to mitigate the shortage of skills
over the near term; however, it will be important for colleges and students to stay abreast of changes and there may be roles for colleges to help to develop technologies.
With the exception of the retail sector, where changes in Radio Frequency Identification (RFID) and Point of Sale (POS) technologies may reduce the need for inventory control and check out/cashier staff, few other technological advances are expected to reduce the need for workers. In the labour intensive construction sector, technological advances are particularly slow to be accepted and are more likely to require workers to have specialized training. The oilsands and forestry sectors are faced with a wide range of ongoing technological challenges that will be required to lower costs and improve efficiencies. There may be a role for Northern colleges to involved in the development of the technology from an applied perspective so that dissemination of knowledge can be advanced as quickly as possible according to the skill sets of workers. For most of the

Research to Evaluate the Shortage of Skilled Workers in Northern Alberta Executive Summary
Prepared for The Northern Labour Market Information Clearinghouse Project By Steven K. Lakey, MBA, CMC Page v
occupations for which the impact of technology was reviewed workers will be required to be more computer literate and have a greater understanding of scientific principles or be able to handle situations that may require judgment such as Freedom of information and Privacy Issues.
10. Some current attitudes and perceptions and economic factors may also be
contributing to the shortage of skills in Northern Alberta.
Many trades have long suffered from negative perceptions (discussed in Chapter 6) that have long acted as deterrents to entry. There is arguably a lack of trust and understanding and commitment between many employers and Aboriginals, and the costs of living in Northern Alberta and perceptions or realities associated with a lack of amenities stop many from considering relocating to the area or make it economically unviable to work in lower paying occupations.
11. Governments and industry are very concerned by the shortage of skills and have
devoted considerable effort and resources to find a solution; however, it is apparent that “new ways” and “new views” may be required.
In the context of Northern Alberta, the number of individuals from the under-represented groups of immigrants, the disabled, youth and Aboriginals who could be realistically drawn into the labour force through to 2010 is relatively small and, based upon a methodology used by Alberta Human Resources and Employment, is estimated in the order of 2,700. This would be approximately 14% of the requirements of Northern Alberta through to 2010. Under this scenario, there is some credence to the emphasis placed upon immigration as a partial solution. A higher proportion of immigrants may create roles for Northern colleges from several perspectives. It is possible that there will likely be a strong requirement to promote cultural sensitivity to ensure that work places and communities are welcome. Furthermore, immigrant families who are not from western cultures may require additional language and cultural assimilation training. Employers, and supervisors in particular, may benefit from additional mentoring training to help to deal with the nuances of a culturally diverse work force. Colleges may also play a stronger role in helping to ensure that some of the expected amenities of a “cultural” nature are in place for their communities and help to ensure that accurate information is made available to immigrants before arrival. Finally, even immigrants from western backgrounds who are fully qualified in a trade or profession may require specialized “bridge” training to adapt to the minor differences and nuances of Northern Alberta and Canada. However, even increasing the number of immigrants is not likely to solve the skills shortage problem. A major component will be to make sure that the existing labour force has the best training and basis skills to be able to enter challenging and high demand occupations and is aware of path ways and options. In this regard, the Government of Alberta is actively seeking input to the development of it’s strategy, and the Government of Canada has developed new programs with resources to support innovative projects of an experimental or pilot nature. Two models for programs that may be of benefit for Northern Alberta and qualify for some of the funding referenced above are the “Talent Pool” and the NAIT “Building on

Research to Evaluate the Shortage of Skilled Workers in Northern Alberta Executive Summary
Prepared for The Northern Labour Market Information Clearinghouse Project By Steven K. Lakey, MBA, CMC Page vi
Demand”. In the case of the “Talent Pool”, resources are focused on individuals who may have “potential” but require minor degrees of assistance. The “Talent Pool” concept could be strengthened considerable by “ambassadors” capable of liaising with, and gaining the trust of certain groups who may not be engaged in the work force to their full potential. The “Building on Demand” model provides a basis to marshal efforts toward solving a common problem, and may lend itself to cases of government monies being matched with private sector monies.
II. Recommendations The major recommendations arising from the study are presented in this section. They have been prepared for consideration of implementation over a phased period of time. As such, they are grouped into three principal “categories or stages”:
• Short-term (primarily between now and June 2006); • Medium-term (June 2006 to June 2007); and • Long-term (Beyond June 2007).
A. Short-term Recommendations In the shorter-term, it is recommended that the report be considered in more detail and a decision be taken as to whether a strategy based, at least in part, on priority issues or occupations (to some extent based upon the potential prioritization in Chapter 4, but in full recognition that other approaches may be appropriate given local circumstances) be adopted. On such as basis, other key short-term recommendations include: • Taking steps to continue or begin to develop networks or forums to exchange information and
evaluate plans and activities of others to ensure that there is the best possible coordinated approach to address common concerns.
• Beginning to acquire a better understanding of the specific skills required for priority
occupations and the impact of technological advances, both of which may be important to determine training approaches given circumstances and characteristics of potential students An added benefit may be the opportunity to play a larger role in the development of technologies from an applied perspective and the associated fostering of innovative and entrepreneurial mind sets.
• Taking steps to become or continue to be familiar with existing strategies, programs and
resources in both the public and private sector to address skills shortages, so that input can be developed to shape the strategies, students and prospective students are aware of resources and pathways, and that opportunities for funding of pilot or innovative projects might be shared or funding might be obtained from government. In this regard, an initiative called the “Talent Pool” (discussed in Chapter 7) designed to outreach and draw in individuals who have potential but may be underutilized may be a good model. The NAIT “Building on Demand” model may also be effective in marshalling resources and effort toward a common problem or objective but at a lesser scale.
• Begin or continue to develop regional programs and activities to accommodate a larger
number of immigrants. Examples include fostering cultural sensitivity and welcome work

Research to Evaluate the Shortage of Skilled Workers in Northern Alberta Executive Summary
Prepared for The Northern Labour Market Information Clearinghouse Project By Steven K. Lakey, MBA, CMC Page vii
places and communities (particularly given the lower education levels and more insular attitudes that may prevail with some employees and residents), mentoring training for foremen and front-line supervisors who may be required to deal with staff , who even while fully qualified of different work place practices, “bridge training” to overcome minor deficiencies in training in the context of specific Canadian practices and technologies, “business English”, and/or English as a Second Language training fore some children and spouses.
B. Medium-term Recommendations The most important recommendations over the medium-term are to continue to review the programs and initiatives referenced above, consider how they may be modified or expanded to be more effective and to ensure that steps have been taken to develop accountability frameworks and criteria to measure progress. Data derived from a source that has a rigorous foundation will be of great importance to give credence to future plans and activities. It will also be vital in order to measure progress and make corrections and change priorities, as required. C. Longer-term Recommendations To a great extent, the skills shortage issue is a result of economic, development and demographic factors that are changing rapidly in some cases, and beyond the control of colleges. As such, the most important recommendation is to stay abreast of issues, monitor achievements against plans and make changes to priorities and methods of training, sharing information and implementing best practices that will be the most effective from a cost and impact point of view.

Research to Evaluate the Shortage of Skilled Workers in Northern Alberta Chapter 1 – Introduction
Prepared for The Northern Labour Market Information Clearinghouse Project By Steven Lakey, MBA, CMC Page
1
Chapter 1 Introduction
I. Purpose of the Study The Northern Labour Market Information Clearinghouse Project, under the direction of the Northern Alberta Development Council, is a partnership of five northern colleges: Grande Prairie Regional College; Keyano College; Northern Lakes College; Portage College and the Fairview campus of the Northern Alberta Institute of Technology. Each year, the five colleges determine a number of subject areas of interest and arrange for additional research to be conducted. At this time, it is considered that the skills shortage in Northern Alberta, may present unique challenges and opportunities for Clearinghouse colleges and the Northern Alberta Development Council (NADC). As such, the purpose of this project is to:
Identify industries/occupations with a shortage of skilled workers and quantify the shortages. Of interest will be a focus on the higher profile requirements of the booming resource sector as well as the “general” community and small to medium sized business requirements as the Northern Alberta economy evolves.
Clarify concerns raised by business, industry and other levels of government with respect to the shortage, or potential shortage, of skilled workers in the region.
Identify “professional”, occupational, and trade position and training requirements and/or upgrading opportunities to meet the needed skills, with an interest in how new forms of production, changes in technology and/or emerging opportunities (such as a potential growing interest in coal bed methane, for example) may affect the requirements.
Help to focus and orchestrate the concerted efforts of the post-secondary institutions, industry, business and government to address the issues.
II. Methodology The report was completed over the period of early December 2005 to early March 2006. In so doing, the following steps were taken:
1. Literature from a variety of sources was reviewed to obtain background information on the issues of interest.
2. An overview of more recent socio-economic conditions in Northern Alberta was prepared.
It covered four main areas: general population and trends; composition of the work force; education and literacy issues; and general economic conditions with an emphasis on construction activity. The overview was based primarily upon 2001 Census data but augmented by other sources. The purpose of the overview was to gain a better understanding of some of the forces and conditions that have resulted in the current situation of Northern Alberta, and to be able to make comparisons in some cases with Alberta and all of Canada.
3. Data from the 2001 census was used to develop a baseline of employment by
occupation, and therefore an indicator of skills requirements for all of Northern Alberta

Research to Evaluate the Shortage of Skilled Workers in Northern Alberta Chapter 1 – Introduction
Prepared for The Northern Labour Market Information Clearinghouse Project By Steven Lakey, MBA, CMC Page
2
and the Northeast and Northwest Sub-regions. Projections developed by Alberta Human Resources and Employment for 47 Occupational Categories (covering 2005 to 2010) and the trades monitored by Alberta Construction Association (through to 2009) were used: to provide an indicator of how employment and skills requirements changed between 2001 and 2005; and to develop forecasts of skills shortages through to the period ending 2010. The data from the forecasts was used to perform calculations such as the “base size” of Occupational Categories, the magnitude of increases and decreases as well as the expected rate of growth or decline in numbers. Other indicators such as vacancy rates, salaries, and difficulties with hiring were also used to gauge concerns of employers.
4. The potential implication of longer -term demographic changes and trends with respect to
skills shortages were also analyzed.
5. Based upon “3” and “4” above, a methodology was developed to provide a potential ranking of priority occupations or Occupational Categories.
1. From step “5”, approximately 30 Occupational Categories and occupations that were
considered to be reflective of the needs of Northern Alberta, and to some extent the unique needs of each region, were selected for further analysis to determine skills and training requirements and existing training programs. The information used for the analysis was extracted from the Alberta Learning Information System (ALIS) web site 1.
7. An additional analysis was completed of “other” factors that could affect skills shortages.
The analysis focused on: the impact of technological change and attitudes and perceptions closely associated with the Occupational Categories and occupations in step “6”; certain demographic groups; and the impact of coal bed methane and diamonds as “potential emerging opportunities”.
8. The key strategies of the governments of Alberta and Canada as well as some existing
public and private sector programs and initiatives focused on addressing skills shortages were reviewed to attain a better understanding of some of the supporting or complementary roles that the Clearinghouse colleges might play, other resources that may be available, as well as best practices in some instances.
9. Based upon the preceding, conclusions and recommendations were prepared.
10. A draft report was prepared and circulated or review.
1. A final report was prepared based upon feed back received.
III. Organization of Report The balance of this report is comprised of the following chapters and appendices:
Chapter 2 – Overview of Socio-Economic and Demographic Background Conditions
1 http://www.alis.gov.ab.ca/wageinfo/

Research to Evaluate the Shortage of Skilled Workers in Northern Alberta Chapter 1 – Introduction
Prepared for The Northern Labour Market Information Clearinghouse Project By Steven Lakey, MBA, CMC Page
3
Chapter 3 – Shorter Term Skills Shortages and Workforce Characteristics
Chapter 4 – Longer Term Demographic Issues
Chapter 5 – Training and Skills Requirements
Chapter 6 – Factors and Trends That May Affect Skills Shortages
Chapter 7 –Strategies, Programs and Best Practices
Chapter 7 – Conclusions and Recommendations
Appendix 1 – Select Occupational Details
Appendix 2 – Individuals and Organizations Contacted
Appendix 3 - Bibliography
Report Limitations The issues addressed in this report are unquestionably of great importance to the planners with Clearinghouse colleges and the current and future residents of Northern Alberta, and considerable effort has gone into making the best use of the resources available. However, there are a number of limitations with the data in terms of among other things: timeliness for the 2001 Census data; projections and forecasts during times of great change; the underlying assumptions used and lack of control over factors such as migration; the lack of information, in some cases, at the regional and sub-regional levels, or the level of statistical validity that has been and /or can be achieved with the same; the “fit” of some of the data from a geographic perspective; and the complexities of using two different occupational systems for some of the data (that while similar, do contain some differences). Because of some of these limitations, for the most part, the report deals with skills shortages by using the forecast demand for occupations (and sub-components such as growth or decline in numbers and rates of change) as a “surrogate” indicator rather than focusing on the specific skill requirements of occupations. Users of the report need to be mindful of the limitations. There is also use of terms - such as Occupational Categories” and “occupations” – that intuitively are of little difference but have considerable consequence if a degree of rigor is to be kept with the data. Wherever possible, the preceding limitations and issues have been highlighted and discussed in more detail, as required, throughout the report.

Research to Evaluate the Shortage of Skilled Workers in Northern Alberta Chapter 2 - Overview of Socio-Economic and Demographic Background Conditions
Prepared for The Northern Labour Market Information Clearinghouse Project By Steven Lakey, MBA, CMC Page 4
Chapter 2 Overview of Socio-Economic and Demographic Background Conditions
This Chapter highlights and discusses some of the demographic and socio-economic factors that are of importance in analyzing skills shortages in Northern Alberta. While there is a considerable body of literature and research that addresses such matters from a province-wide perspective, it can tend to be too general and less meaningful given some of the unique characteristics of the components of the Region. Accordingly, the Chapter presents a discussion and analysis of the following indicators, factors or issues and makes comparisons on a province-wide and Canada-wide basis in many instances:
General Demographic Factors and Trends – encompassing matters such as total population, growth rate, composition according to age groups, race, migration and immigration and family structures.
Education Levels and Literacy Indicators – including school attendance, levels of education and credentials held.
Labour Force – including composition, unemployment, growth rates, participation rates in key sub-categories.
Economic Conditions – including construction activity, and cost of living indicators. The underlying data source is primarily the 2001 Census of Canada. However, updates have been made or additional data have presented where necessary, or where more recent information is available. For the most part, sources are the 1996 Census of Canada or projections developed by Statistics Canada (for Canada) and Alberta Finance (for Alberta). Only instances where the source of data are different from those mentioned above are given specific mention. To the extent possible, the presentation is in keeping with the boundary definitions used in the past for Northern Alberta as below:
• “Northeastern Alberta” is defined as Census Divisions 12 and 16 and Athabasca County of Census Division 13;
• “Northwestern Alberta” is defined as Census Divisions 17, 18 and 19 and Woodlands County of Census Division 13); and
• “Northern Alberta” is defined as the area served by the Northern Alberta Development Council.
However, the boundaries have proven to be “problematic” in some cases due to the information available and difficulty in isolating Woodlands and Athabasca Counties. Instances where different boundaries are used have been indicated clearly in the Chapter. The map on the following page shows the location of the Census Divisions and Counties. An earlier (March 2003) study completed for the Clearinghouse entitled “Demographic Changes in Northern Alberta and Associated Potential Implications for Northern Colleges” may be a useful resource for additional detail pertaining to some of the subject material of this Chapter, particularly in identifying and understanding changes between 1996 and 2001.

Research to Evaluate the Shortage of Skilled Workers in Northern Alberta Chapter 2 - Overview of Socio-Economic and Demographic Background Conditions
Prepared for The Northern Labour Market Information Clearinghouse Project By Steven Lakey, MBA, CMC Page 5

Research to Evaluate the Shortage of Skilled Workers in Northern Alberta Chapter 2 - Overview of Socio-Economic and Demographic Background Conditions
Prepared for The Northern Labour Market Information Clearinghouse Project By Steven Lakey, MBA, CMC Page 6
I General Demographic Factors and Trends This section of Chapter 2 provides an analysis of “General” Demographic Factors and Trends from the perspective of their potential relationship to skills shortages. Key Findings 1. In 2005, the population of Northern Alberta comprised approximately 10% of the
total population of Alberta and 1% of the population of Canada. Based upon data supplied by Alberta Finance 1, the estimated 2005 population of Northern Alberta (with Athabasca and Woodlands Counties included) was approximately 319,000, compared to 3,267,670 for Alberta and 32,270,500 for Canada. The population of the Northeast portion of Northern Alberta is estimated to be approximately 128,000, or 40.2% of the total, while that of Northwest Alberta is estimated to be 190,700, or 59.8% of the total. The following table provides a summary of the respective populations.
2005 POPULATION OVERVIEW
2005 Population% Of
Northern Alberta% Of
Alberta % Of
Canada Northeast 128,318 40.2% 3.9% .40% Northwest 190,675 59.8% 5.9% .58% Northern 318,991 100.0% 9.8% .98% Alberta 3,267,670 100.0% 10.0% Canada 32,270,500 100.0%
Based on data from Alberta Finance Population Projections 2004 –2026 and Statistics Canada CANSIM, table (for fee) 052-0004 and Catalogue no. 91-520-X.
2. The populations of Northern Alberta and Alberta have grown much faster than the average for all of Canada.
From 1996 to 2005, the population of Canada increased by 13.3%. The comparable figures for Northern Alberta and Alberta were 20.4% and 21.1%, respectively. The growth in Northern Alberta is somewhat uneven. For example, driven by the demands of oilsands projects, the population of Northeast Alberta has increased by over 23%, while that of Northwest Alberta has increased by 18%. Alberta’s proportion of the overall population of Canada has remained relatively constant over the period at approximately 10% (with a slight upward trend). Northern Alberta’s proportion of the overall population of Alberta has also remained in the vicinity of 9.5%.
The following table provides a summary of the populations of the regions of Northern Alberta, Alberta and Canada and also shows some relationships and growth rates between several time points.
1 Alberta Population Projections by Census Divisions 2004-2026, October 2004

Research to Evaluate the Shortage of Skilled Workers in Northern Alberta Chapter 2 - Overview of Socio-Economic and Demographic Background Conditions
Prepared for The Northern Labour Market Information Clearinghouse Project By Steven Lakey, MBA, CMC Page 7
OVERVIEW OF POPULATION PROPORTION AND GROWTH 1996 TO 2005
NorthernFactor/Measure Northeast Northwest Alberta Alberta Canada Population (2005) 128,318 190,675 318,991 3,264,670 32,270,500% of Northern Alberta 40.20% 59.80% 100.00% NA NA % of Alberta 3.9% 5.8% 9.80% 100.00% NA % of Canada 0.4% 0.6% 1.0% 10.00% NA Population (2001) 112,752 170,302 283,054 2,974,807 30,007,094% of Northern Alberta 40.00% 60.00% 100.00% NA NA % of Alberta 3.80% 5.60% 9.40% 100.00% NA % of Canada 0.38% 0.56% 0.94% 9.90% 100.00% Population (1996) 104,144 160,878 265,022 2,696,825 28,486,761% of Northern Alberta 39.2% 60.7% 100.0% NA NA % of Alberta 3.8% 6.0% 9.8% 100.0% NA % of Canada .37% .56% .93% 9.5% 10.0% % Increase From 1996 to 2001 8.19% 4.81% 6.20% 10.30% 4.00% % Increase From 2001 to 2005 12.13% 10.68% 11.27% 8.88% 7.01% % Increase 1996 to 2005 23.21% 18.52% 20.36% 21.06% 13.28%
3. A more detailed analysis of the population trends reveals that there are major
differences in the location of growth at the Census Division level.
Note: This discussion and presentation excludes Athabasca and Woodlands Counties, as 2005 population figures are not readily available. Between 1996 and 2005, the population of Northern Alberta (for the purposes of this analysis) grew by 20.9% (24.4% for the Northeast and 18.7% for the Northwest). However, Census Division 16 grew by over 31%, while the population of Census Division 18 grew by only 5.6%. The following table provides a more detailed analysis of changes in population and growth between 1996 and 2005.
COMPARISON OF POPULATION CHANGES 1996 TO 2005
CD 2005 2001 1996
% Change
1996-2005
% Change
2001-2005
% Change
1996-2001
Division 12 67,650 58,362 56,499 19.7% 15.9% 3.3%Division 16 48,025 42,971 36,494 31.6% 11.8% 17.7%Northeast Sub-total 115,675 101,333 92,993 24.4% 14.2% 9.0%Division 17 65,825 57,505 54,709 20.3% 14.5% 5.1%Division 18 15,870 14,346 15,022 5.6% 10.6% -4.5%Division 19 95,575 86,299 79,665 20.0% 10.7% 8.3%Northwest Sub-total 177,270 158,150 149,396 18.7% 12.1% 5.9%Total 292,945 259,483 242,389 20.9% 12.9% 7.1%

Research to Evaluate the Shortage of Skilled Workers in Northern Alberta Chapter 2 - Overview of Socio-Economic and Demographic Background Conditions
Prepared for The Northern Labour Market Information Clearinghouse Project By Steven Lakey, MBA, CMC Page 8
4. On the basis of distribution according to age groups, Northern Alberta’s 2005 population had some minor but notable differences from that of the rest of Alberta and Canada. Note: Athabasca and Woodlands Counties excluded due to lack of information for 2005.
In particular, Northern Alberta: • Has a higher proportion of pre-school aged children (approximately 8.3% compared
with 6.3% for Alberta and 5.3% for all of Canada); • Has a larger school aged population (approximately 20% compared to 19% for
Alberta and 20% for all of Canada); • Has a smaller proportion of the population that is of “prime working age”
(approximately 52% compared to 55% for Alberta and Canada); and • Differs significantly from the rest of Alberta and Canada with respect to the proportion
of senior citizens (those over 65). In 2005, 7.4% of Northern Albertans were over 65, whereas the comparable figures for Alberta and Canada were 10.3% and 13.1%, respectively.
The following table presents more detail and a comparison of the population with a breakdown of the number of individuals and the percentage of the population for key age groups.
2005 POPULATION BREAKDOWN
Age NE NW Northern Alberta Canada Group Numbers Preschool 9,080 15,175 24,255 206,460 1,698,400 School 27,535 43,750 71,285 662,480 6,132,900 Postsecondary 8,990 13,925 22,915 242,115 2,243,300 Prime Working 62,070 90,830 152,900 1,817,665 17,978,200 Retired 8,000 13,590 21,590 335,950 4,217,700 Total 115,675 177,270 292,945 3,264,670 32,270,500 Percentages Preschool 7.8% 8.6% 8.3% 6.3% 5.3% School 23.8% 24.7% 24.3% 20.3% 19.0% Postsecondary 7.8% 7.9% 7.8% 7.4% 7.0% Prime Working 53.7% 51.2% 52.2% 55.7% 55.7% Retired 6.9% 7.7% 7.4% 10.3% 13.1% Total 100.0% 100.0% 100.0% 100.0% 100.0%
Note: The following definitions were used for this analysis:
Preschool School Postsecondary/Early Working Prime Working Retired
Age in Years 0 to 4 5 to 19 20-24 25 to 64 65 +

Research to Evaluate the Shortage of Skilled Workers in Northern Alberta Chapter 2 - Overview of Socio-Economic and Demographic Background Conditions
Prepared for The Northern Labour Market Information Clearinghouse Project By Steven Lakey, MBA, CMC Page 9
5. While the growth in male and female populations is in keeping with the overall population growth rates discussed above (the female population is growing marginally faster), compared to the rest of Alberta and Canada, Northern Alberta has a higher proportion of males.
In 2001, the male to female ratio in Northern Alberta was approximately 1.059 to 1.0 (as might be expected in a largely resource-based economy). By comparison in Alberta the ratio was 1.0 to 1.0, and for Canada as a whole there are more females than males (approximately .961 to 1.0 for males); and the proportion of females has increased since 1996. The following table provides an overview of the male to female ratios based upon 2001 Census data.
2001 MALE/FEMALE COMPARISONS
Factor/Measure Northeast Northwest NADC Alberta Canada 2001 Population 112,675 168,630 281,334 2,974,807 30,007,094 Males 58,085 86,660 144745 1,486,585 14,706,850 Females 54,590 81,970 136,560 1,488,220 15,300,245 Ratio 1.064 1.057 1.059 1.000 0.916
6. In 2001, the Aboriginal population of all areas of Northern Alberta was significantly
higher than that of Alberta or the rest of Canada.
The Aboriginal segment of the population of Northern Alberta was over 17% in 2001. In contrast, the Aboriginal segment of Alberta’s and Canada’s population were approximately 5% and 3%, respectively. The following table highlights and compares the Aboriginal component of the population in each of he regions.
OVERVIEW OF ABORIGINAL POPULATION COMPOSITION IN 2001
Northeast Northwest NADC Alberta Canada 2001 Population 112,675 166,630 281,334 2,974, 807 30,007,094 Aboriginal 19,795 29,715 49,510 156,225 376,310 % Aboriginal 17.7% 17.8% 17.8% 5.3% 3.3%
7. The Median age 2 in Northern Alberta is younger than that of Alberta and Canada.
Correspondingly, as would be expected with a younger population, the percentage over the age of 15 is lower in Northern Alberta than in all of Alberta and all of Canada. This is particularly the case in Census Division 17. The following table provides a summary of median ages and the proportion of the populations over the age of 15. It shows how the median age in Northern Alberta is lower than in other parts of Canada, and correspondingly that the proportion of the population that is older than15 is also proportionally lower.
2 Age is the age at which exactly half of the population is older and half younger.

Research to Evaluate the Shortage of Skilled Workers in Northern Alberta Chapter 2 - Overview of Socio-Economic and Demographic Background Conditions
Prepared for The Northern Labour Market Information Clearinghouse Project By Steven Lakey, MBA, CMC Page 10
COMPARISON OF MEDIAN AGES AND % OVER 15 YEARS OF AGE IN 2001
Factor/Measure Northeast Northwest NADC Alberta Canada 2001 Population 112,675 168,630 281,334 2,974,807 30,007,094 Median Age 32.3 35.0 33.8 35.0 37.6 % Over Age of 15 75.7% 74.0% 74.7% 79.2% 80.9%
Additional details at the Census Division and County levels are summarized for 2001 in the following table along with comparable figures for all of Alberta.
SUMMARY OF MEDIAN AGE AND PROPORTION OF POPULATION OVER 15
BY AREAS IN THE NADC REGION
Median Age % Over 15Division 12 33.1 74.3% Athabasca 37.7 78.0% Woodlands 36.5 76.4% Division 16 30.8 76.7% Division 17 27.3 69.2% Division 18 33.2 74.8% Division 19 32.1 76.8% Average for Alberta 35.0 79.2%
8. The percentage of the Northern Alberta population that is of a visible minority
group (excluding Aboriginals) is very low, compared to the rest of Alberta and Canada,
Visible minorities accounted for 2.7% (3.4% in the Northeast and 2.2% in the Northwest) of the population of Northern Alberta in 2001, while the comparable figures for Alberta and all of Canada were both 11.1%. The five largest visible minority groups in Northern Alberta are: South Asians; Chinese; Arab; Black; Filipino; and Latin American. The following table provides an overview and comparison of visible minority populations.
OVERVIEW OF OTHER VISIBLE MINORITIES POPULATION COMPOSITION IN 2001
Factor/Measure Northeast Northwest NADC Alberta Canada 2001 Population 112,675 168,630 281,334 2,974,807 30,007,094 Visible Minorities 3,800 3,715 7,515 329,930 3,330,787 % of Total 3.40% 2.20% 2.70% 11.10% 11.10% Top Five South Asian 750 640 1,390 69,585 917,075 Chinese 720 55 1,270 99,100 1,029,395 Arab 840 385 1,225 19,325 194,680 Filipino 510 520 1,030 33,940 308,575 Black 495 525 1,020 31,390 662,215 Latin American 110 350 460 18,745 216,975

Research to Evaluate the Shortage of Skilled Workers in Northern Alberta Chapter 2 - Overview of Socio-Economic and Demographic Background Conditions
Prepared for The Northern Labour Market Information Clearinghouse Project By Steven Lakey, MBA, CMC Page 11
Furthermore, while not presented in the preceding table, the growth rate of the visible minority population between 1996 and 2001 is much slower in Northern Alberta (10.9%) compared to 22.5% for both Alberta and all of Canada, respectively.
9. The proportion of the 2001 population of Northern Alberta that is comprised of
immigrants was very small.
Immigrants comprised 5.3% of the population of Northern Alberta in 2001. By comparison, the comparable figures for Alberta is 14.7% and that for all of Canada is 18.2%. The difference is even more pronounced when the time of immigration is taken into account. In this regard, Northern Alberta received a higher proportion of immigrants in the “before 1961” and “1961 to 1970” periods.
The following table summarizes the number of immigrants to each region of interest and also shows the cumulative total effect of immigration as a percentage of the total number of immigrants.
OVERVIEW OF IMMIGRANT POPULATION COMPOSITION
Factor/Measure NortheastNorthwest NADC Alberta Canada 2001 Population 112,675 168,630 281,334 2,974,807 30,007,094 Immigrant Population 6,710 8,210 14,920.0 438,335 5,448,485 % of Total Population 6.0% 4.9% 5.3% 14.7% 18.2% Before 1961 1,405 2,110 3,515 74,000 894,465 Period % 20.9% 25.7% 23.6% 16.9% 16.4% Cumulative Total 20.9% 25.7% 23.6% 16.9% 16.4% 1961-1970 885 1,265 2,150 50,990 745,560 Period % 13.2% 15.4% 14.4% 11.6% 13.7% Cumulative Total 34.1% 41.1% 38.0% 28.5% 30.1% 1971-1980 1,880 1,665 3,545 91,980 936,275 Period % 28.0% 20.3% 23.8% 21.0% 17.2% Cumulative Total 62.1% 61.4% 61.7% 49.5% 47.3% 1981-1990 1,085 1,570 2,655 91,435 1,041,500 Period % 16.2% 19.1% 17.8% 20.9% 19.1% Cumulative Total 78.3% 80.5% 79.5% 70.4% 66.4% 1991-1995 695 780 1,475 63,345 867,355 Period % 10.4% 9.5% 9.9% 14.5% 15.9% Cumulative Total 88.7% 90.0% 89.4% 84.8% 82.3% 1996-2001 745 855 1,600 66,575 963,325 Period % 11.1% 10.4% 10.7% 15.2% 17.7% Cumulative Total 99.8% 100.4% 100.1% 100.0% 100.0%
For additional perspective, between July 1, 2004 and June 30, 2005, Alberta received 17,400 international immigrants, a level not exceeded since 1993/94 (+18,200). Additionally, the province saw a substantial increase in its net inter-provincial migration, which was up 6,000 from the previous year. During this period, the primary source of inter-provincial in-migration was British Columbia, followed by Ontario and Saskatchewan.3
3 Alberta Population Report, Second Quarter 2005, Alberta Finance, Statistics

Research to Evaluate the Shortage of Skilled Workers in Northern Alberta Chapter 2 - Overview of Socio-Economic and Demographic Background Conditions
Prepared for The Northern Labour Market Information Clearinghouse Project By Steven Lakey, MBA, CMC Page 12
II. Education and Literacy This section of Chapter 2, based primarily on 2001 Census data, provides an analysis of education and literacy issues from the perspective of their potential relationship to skills shortages. For points 1 through 4, a single table at the end of point 4 summarizes the discussion. Key Findings 1. Northern Alberta has a relatively high proportion of its population that might be
considered “challenged” in terms of the need for higher levels of education required for the future.
In 2001, approximately 18,000 (or 9.6%) of Northern Albertans have less than a grade 9 level of education. Education levels were lowest in the Northwest part of the province where 10.5% of the population did not have a grade 9 level of education. This is comparable to the Canadian average. By contrast only 6.2% of Albertans overall did not have grade 9.
The rate of high school completion is also relatively poor with approximately 33% of the population over 20 graduating from high school. The comparable figures for Alberta and all of Canada were approximately 36% and 44%, respectively.
2. The proportion of the population with a trade certificate or diploma is higher in Northern Alberta than in other parts of Alberta and Canada.
In Northern Alberta, 18.3% of the population over 20 held a trade certificate or diploma. The relevant figures were 20.2% for the Northeast and 17.1% for the Northwest. In contrast, only 14% of Albertans and 11.8% of Canadians help comparable credentials.
3. College attendance and graduation levels in Northern Alberta are comparable to
those in other areas.
Across all jurisdictions, the proportion of the population that has attended college is approximately 22-24%. Graduation levels range from 65.2% in Northwest Alberta to a 71.8% as a Canadian average.
4. University attendance among the Northern Alberta population is relatively low
although completion levels are roughly comparable to other parts of Canada.
In Northern Alberta, the proportion of the population that has attended university is 13.4% (14.8% in the Northeast and 12.3% in the Northwest). In contrast, the equivalent figures for Alberta and all of Canada were approximately 24%. In reviewing graduation levels of those attending the “success rate” is roughly comparable across all jurisdictions (66% to 70% but with the slightly lower figures attributable to Northern Alberta). The following table presents a summary of education levels and completion rates across all jurisdictions in 2001 as discussed in points 1 through 4. To facilitate more meaningful comparisons, the figures are presented as percentages.

Research to Evaluate the Shortage of Skilled Workers in Northern Alberta Chapter 2 - Overview of Socio-Economic and Demographic Background Conditions
Prepared for The Northern Labour Market Information Clearinghouse Project By Steven Lakey, MBA, CMC Page 13
SUMMARY OF EDUCATION LEVELS AND COMPLETION RATES IN 2001 Factor/Measure Northeast Northwest NADC Alberta Canada Total population 20 years and over 74,760 109,065 183,825 2,100,365 21,857,010 Less than grade 9 8.3% 10.5% 9.6% 6.2% 10.5% Grades 9 to 13 34.2% 37.9% 36.4% 31.5% 31.3% Without high school graduation certificate 65.1% 67.8% 66.8% 63.7% 55.6% With high school graduation certificate 34.9% 32.2% 33.2% 36.3% 44.4% Trades certificate or diploma 20.2% 17.1% 18.3% 14.0% 11.8% College 22.5% 22.2% 22.3% 24.3% 22.5% Without certificate or diploma 31.8% 34.9% 33.6% 30.2% 28.2% With certificate or diploma 68.2% 65.2% 66.4% 69.8% 71.8% University 14.8% 12.3% 13.4% 24.0% 23.9% Without degree 34.4% 34.2% 34.3% 30.6% 29.4% Without certificate or diploma 21.7% 22.4% 22.1% 21.4% 18.0% With certificate or diploma 12.9% 12.2% 12.5% 9.2% 11.4% With bachelor's degree or higher 65.9% 65.6% 65.8% 69.4% 70.6% 5. The figures presented in points “1” to “4” above, indicate that approximately 6,250
Northern Albertans could benefit from improved levels of education in order for the region to be at the [albeit not exemplary] education level of the rest of the province with respect to at least a grade 9 level of education.
As noted above, 9.6% of Northern Albertans and 6.2% of all Albertans do no hold at least a grade 9 level of education. In order to bring the Northern Alberta education level to that of Alberta, and additional 3.4% of a population of approximately 184,000 would require additional assistance.
6. Based upon the 2001 Census, and earlier work of Lakey 4, it is estimated that up to
1,815 individuals in Northern Alberta have limited English language skills and that up to an additional 920 new immigrants may benefit from additional training.
The following table provides a summary of potential demand for ESL or upgrading services.
POTENTIAL DEMAND FOR ENGLISH LANGUAGE TRAINING
Area Non-English Speaking
Individuals New Immigrants Who May Benefit From Assistance
Census Division 12 230 45 Athabasca County 20 40 Woodlands County 30 30 Census Division 16 135 255 Census Division 17 1,060 * 180 Census Division 18 10 20 Census Division 19 330 350 Total 1,815 920
* Includes 590 associated with religious colonies.
4 “Demographic Changes in Northern Alberta and Associated Potential Implications for Northern Colleges”, March 2003

Research to Evaluate the Shortage of Skilled Workers in Northern Alberta Chapter 2 - Overview of Socio-Economic and Demographic Background Conditions
Prepared for The Northern Labour Market Information Clearinghouse Project By Steven Lakey, MBA, CMC Page 14
The need to provide ESL training in the future may increase in response to the strategy of increasing immigration and the Nominee Program (especially for spouses and other family members who may be part of the “solution” to skills shortages).
7. The incidence of school attendance in Northern Alberta among individuals in the
age group of “15 to 24” (presumed to be primarily “adult” or “post-secondary”), as measured by full-time or part-time enrollment, is lower in Northern Alberta than in other parts of Canada.
In Northern Alberta, 43.7% of post-secondary-aged individuals (48.0% in Northeast and 40.9% in Northwest) attended school full-time in 2001. The figure for Alberta was slightly higher (48.6%) and the figure on a nation-wide basis was 57%. The following table provides an overview and comparison of school attendance in Northern Alberta, Alberta and all of Canada.
TOTAL 2001 POPULATION 15 TO 24 YEARS BY SCHOOL ATTENDANCE
Factor Northeast Northwest NADC Alberta Canada Total population 15 to 24 years 16,785 25,940 42,725 435,325 3,988,200 Not attending school 7,855 14,295 22,150 194,155 1,472,470 % Of total 46.8% 55.1% 51.8% 44.6% 36.9% Attending school full time 8,060 10,620 18,680 211,560 2,276,000 % Of total 48.0% 40.9% 43.7% 48.6% 57.1% Attending school part time 855 1,075 1,930 29,605 239,730 % Of total 5.1% 4.1% 4.5% 6.8% 6.0%
8. In 2001, the proportion of individuals in Northern Alberta that had a “non-trade”
post-secondary qualification was lower than the corresponding figures for Alberta and Canada. With both males and females combined, the Canadian average for the proportion of the population with post-secondary qualifications is 34.9%. For all of Alberta, the figure is 35.4%; however, the figures for Northeast, Northwest and Northern Alberta are 31.5%, 26.9% and 28.7%, respectively. The following table provides additional information with respect to the proportion of the population holding post-secondary qualifications.
PROPORTION OF POPULATION WITH POST-SECONDARY QUALIFICATIONS IN 2001
Northeast Northwest NADC Alberta Canada Males 19,430 23,970 43,400 538,880 5,205,420 Females 16,020 21,310 37,330 513,170 5,260,975 Sub-total 35,450 45,280 80,730 1,052,050 10,466,395
Total Pop 112,675 168,630 281,334 2,974,807 30,007,094 % With 31.5% 26.9% 28.7% 35.4% 34.9%

Research to Evaluate the Shortage of Skilled Workers in Northern Alberta Chapter 2 - Overview of Socio-Economic and Demographic Background Conditions
Prepared for The Northern Labour Market Information Clearinghouse Project By Steven Lakey, MBA, CMC Page 15
For additional perspective, between 2001 and 1996, the number of males in Northern Alberta with post-secondary qualifications increased by 17.5% (from approximately 37,000 to 43,000) and the number of females increased by 21.6% (from approximately 31,000 to 37,000). In contrast, the increase for males in all of Alberta and Canada was 19.3% and 13.3%, respectively, and the figures for females were 23.5% and 17.3%, respectively.
9. Post-secondary credentials held by individuals in Northern Alberta tend to be oriented more toward “Applied Science Technologies and Trades” than in other areas of Canada. In 2001, the percentage of Northern Albertans holding “Applied Science Technologies and Trades” credentials was approximately 37% of the population (39.6% in the Northeast and 35.2% in the Northwest). In contrast, the comparable figures for all of Alberta and Canada were 25.2% and 21.3%. On the other hand, the proportion of Northern Albertans holding credentials in the “softer” Social Sciences and Humanities is lower than in other jurisdictions. The following table presents a summary of the types of credentials held across the differing jurisdictions.
INDIVIDUALS WITH POST-SECONDARY QUALIFICATIONS
BY MAJOR FIELD OF STUDY IN 2001
Northeast Northwest NADC Alberta Canada
Total Population With Post-secondary Credentials 35,450 45,280 80,730 1,052,050 10,466,395 Applied science technologies and trades 39.6% 35.3% 37.2% 25.2% 21.3% Commerce, management and business administration 17.1% 18.4% 17.8% 20.9% 21.9% Educational, recreational and counselling services 10.9% 12.2% 11.6% 10.8% 10.4% Health professions and related technologies 10.1% 10.9% 10.5% 11.7% 11.1% Social sciences and related fields 6.4% 6.4% 6.4% 8.2% 9.9% Fine and applied arts 4.3% 4.1% 4.2% 5.0% 5.5% Agricultural, biological, nutritional, and food sciences 3.8% 5.8% 4.9% 5.1% 4.8% Engineering and applied sciences 3.7% 2.6% 3.1% 4.8% 4.7% Humanities and related fields 2.5% 2.8% 2.6% 4.6% 6.4% Mathematics, computer and physical sciences 1.5% 1.1% 1.3% 3.5% 3.8% No specialization 0.2% 0.1% 0.1% 0.2% 0.2%
For additional perspective, there are differences in the “composition and concentration” of qualifications between males and females in Northern Alberta. For examples, for males, the largest three categories in 2001, accounting for 75.2% of the total were related to: applied sciences and trades (27,560 or 63.5% of the total); commerce (2,950 or 6.8% of the total); and engineering related (2,135 or 4.9% of the total). On the other hand, for females, the composition is more broadly split over a number of categories: commerce (11,425 or 30.6% of the total); health related (6,935 or 18.6% of the total); and education, recreation and counseling (6,810 or 18.2% of the total). The top three account for 67.4% of the total.

Research to Evaluate the Shortage of Skilled Workers in Northern Alberta Chapter 2 - Overview of Socio-Economic and Demographic Background Conditions
Prepared for The Northern Labour Market Information Clearinghouse Project By Steven Lakey, MBA, CMC Page 16
III. Composition of Labour Force
This section of Chapter 2 provides an analysis of the Labour Force from the perspective of their potential relationship to skills shortages. It is supplemented significantly by Chapter 3 Key Findings 1. From the perspective of “class of worker”, the most significant difference in the
composition of the labour force in Northern Alberta is that there is a higher percentage of self- employed individuals.
The proportion of self-employed individuals in Northern Alberta is in the range of 7% to 10% (depending upon whether the individual is incorporated or unincorporated), and is up to 2% higher than in other parts of Canada. In previous work completed by Lakey 5, it was noted that between 2001 and 1996, the number of incorporated self employed workers in Northern Alberta increased by over 37% (from 3,955 to 5,420). In contrast, in Alberta the number of self-employed persons increased by 9.5% (from 88,760 to 97,185), and for all of Canada the corresponding increase was only 2.3% (from approximately 593,000 to approximately 606,000). The following table provides a summary of employment according to “class of worker”.
TOTAL LABOUR FORCE 15 YEARS AND OVER BY CLASS OF WORKER IN 2001
Northeast Northwest NADC Alberta Canada All classes of worker 62,935 92,115 155,050 1,681,980 15,576,565 Paid workers 57,010 81,250 138,260 1,532,115 14,260,930 % Of Total 90.6% 88.2% 89.2% 91.1% 91.6% Employees 54,200 74,700 128,900 1,434,930 13,654,450 % Of Total 86.1% 81.1% 83.1% 85.3% 87.7% Self-employed (incorporated) 2,805 6,560 9,365 97,185 606,480 % Of Total 4.5% 7.1% 6.0% 5.8% 3.9% Self-employed (unincorporated) 5,485 9,980 15,465 141,355 1,254,715 % Of Total 8.7% 10.8% 10.0% 8.4% 8.1% Unpaid family workers 460 875 1,335 8,505 60,920 % 0f Total 0.7% 0.9% 0.9% 0.5% 0.4%
Self-employed individuals may not have access to the resources to improve skills that may be available to those with “traditional” jobs.
2. The industry composition of the labour force in Northern Alberta is significantly
different from that in the balance of Alberta and all of Canada, and has a heavy weighting toward primary and resource industries. Resource industries such as agriculture and forestry, and mining and oil and gas extraction accounted for almost 32% of employment in Northern Alberta in 2001 but only
5“Demographic Changes in Northern Alberta and Associated Potential Implications for Northern Colleges”, March 2003

Research to Evaluate the Shortage of Skilled Workers in Northern Alberta Chapter 2 - Overview of Socio-Economic and Demographic Background Conditions
Prepared for The Northern Labour Market Information Clearinghouse Project By Steven Lakey, MBA, CMC Page 17
10% for Alberta jobs and less than 5% for jobs in all of Canada. The following table provides additional information pertaining to the composition of the labour force.
2001 TOTAL LABOUR FORCE 15 YEARS AND OVER BY INDUSTRY (1997 NORTH AMERICAN INDUSTRY CLASSIFICATION SYSTEM)
Industry Northeast Northwest NADC Alberta Canada Total labour force 63,580 92,930 156,510 1,696,760 15,872,075 % Of total population 56.4% 55.1% 55.60% 57.70% 53.50% Industry - Not applicable - 55 55 1,855 15,325 0.0% 0.1% 0.0% 0.1% 0.1% All industries 62,965 92,160 155,125 1,681,980 15,576,565 99.0% 99.2% 99.1% 99.1% 98.1% 11 Agriculture, forestry, fishing and hunting 10,620 8,605 19,225 85,975 169,975 16.7% 9.3% 12.3% 5.1% 1.1% 21 Mining and oil and gas extraction 6,435 9,360 15,795 183,035 1,754,885 10.1% 10.1% 10.1% 10.8% 11.1% 22 Utilities 6,190 8,460 14,650 130,015 879,245 9.7% 9.1% 9.4% 7.7% 5.5% 23 Construction 5,125 3,970 9,095 77,455 904,480 8.1% 4.3% 5.8% 4.6% 5.7% 31-33 Manufacturing 4,765 6,235 11,000 109,040 1,021,020 7.5% 6.7% 7.0% 6.4% 6.4% 41 Wholesale trade 4,650 6,790 11,440 150,005 1,511,355 7.3% 7.3% 7.3% 8.8% 9.5% 44-45 Retail trade 4,585 10,975 15,560 84,570 567,665 7.2% 11.8% 9.9% 5.0% 3.6% 48-49 Transportation and warehousing 3,790 6,275 10,065 122,200 1,046,040 6.0% 6.8% 6.4% 7.2% 6.6% 51 Information and cultural industries 3,115 5,545 8,660 92,440 774,220 4.9% 6.0% 5.5% 5.4% 4.9% 52 Finance and insurance 2,980 4,410 7,390 82,580 748,395 4.7% 4.7% 4.7% 4.9% 4.7% 53 Real estate and rental and leasing 2,070 2,610 4,680 63,805 605,915 3.3% 2.8% 3.0% 3.8% 3.8% 54 Professional, scientific and technical services 2,010 6,435 8,445 134,925 2,174,290 3.2% 6.9% 5.4% 8.0% 13.7% 55 Management of companies and enterprises 1,550 3,155 4,705 118,990 982,300 2.4% 3.4% 3.0% 7.0% 6.2% 56 Admin and support, waste management 1,520 3,170 4,690 75,700 686,530 2.4% 3.4% 3.0% 4.5% 4.3% 61 Educational services 950 1,730 2,680 53,655 635,630 1.5% 1.9% 1.7% 3.2% 4.0% 62 Health care and social assistance 910 1,590 2,500 30,675 259,355 1.4% 1.7% 1.6% 1.8% 1.6% 71 Arts, entertainment and recreation 870 1,080 1,950 32,305 303,860 1.4% 1.2% 1.2% 1.9% 1.9% 72 Accommodation and food services 685 805 1,490 14,780 295,505 1.1% 0.9% 1.0% 0.9% 1.9% 81 Other services (except public administration) 520 1,000 1,520 39,175 417,285 0.8% 1.1% 1.0% 2.3% 2.6% 91 Public administration 445 715 1,160 13,565 118,790 0.7% 0.8% 0.7% 0.8% 0.7%

Research to Evaluate the Shortage of Skilled Workers in Northern Alberta Chapter 2 - Overview of Socio-Economic and Demographic Background Conditions
Prepared for The Northern Labour Market Information Clearinghouse Project By Steven Lakey, MBA, CMC Page 18
3. Trades related occupations accounted for approximately 23% of the labour force of Northern Alberta with the highest proportion in the Northeast (24.3%).
In comparison, trades occupations accounted for approximately 17% and 14%, respectively of the Alberta and Canadian labour force. Primary industry occupations accounted for 13.4% of the Northern Alberta labour force with a high of 15.1% in the Northwest. The comparable figures for Alberta and Canada were 6.9% and 4.2%, respectively. The Northern Alberta labour force composition, as a percentage of the total labour force was also up to 2% lower than in Alberta and all of Canada in the following categories: Health; Art, Culture, Recreation and Sport; Natural and Applied Sciences; and Management. The following table provides a summary of the labour force according to major National Occupational Classification (NOC) categories.
TOTAL LABOUR FORCE 15 YEARS AND OVER BY OCCUPATION IN 2001
Northeast Northwest Northern
Alberta Alberta Canada Total 63,570 92,905 156,475 1,696,760 15,872,070 All occupations 99.0% 99.2% 99.1% 99.1% 98.1% H Trades, transport and operators 24.3% 21.6% 22.7% 16.7% 14.5% G Sales and service 22.9% 21.1% 21.8% 23.3% 23.2% B Business, finance and admin 12.6% 13.4% 13.1% 17.1% 17.4% I Primary industry 10.9% 15.1% 13.4% 6.9% 4.2% A Management 8.3% 8.5% 8.5% 10.4% 10.2% E Social science, ed gov and religion 6.4% 6.5% 6.4% 6.9% 7.6% C Natural and applied sciences 5.4% 4.1% 4.6% 7.0% 6.3% D Health 3.7% 3.3% 3.5% 4.8% 5.1% J Processing, manuf’ing and utilities 3.3% 4.5% 4.0% 3.9% 6.9% F Art, culture, recreation and sport 1.2% 1.2% 1.2% 2.2% 2.7% Not applicable 0.0% 0.8% 0.9% 0.9% 1.9%
Chapter 3 provides a more in-depth analysis of the changes that have occurred since 2001 and the work force requirements from 2005 to 2010.
4. The labour force of Northern Alberta also has a higher proportion of individuals who either work from home or have no fixed work location.
This indicator may be in keeping with the trades and primary industry focus of the work force. In the Northwest, approximately 15% of the work force either worked from home or no fixed location. These figures are in the range of 8% to 12% for other regions. The following table provides a summary of work site locations in 2001.
SUMMARY OF WORK SITE LOCATIONS IN 2001
NortheastNorthwest Northern Alberta Canada Total 2001 Employed 60,045 86,860 146,905 1,608,840 14,695,135 In Census Sub-division of residence 58.1% 46.9% 51.5% 59.4% 47.2% Different Census Division 16.0% 17.3% 16.7% 15.0% 19.9% No Fixed Location 11.8% 15.5% 14.0% 11.8% 8.7% At home 10.9% 15.4% 13.5% 10.3% 8.0% Out of Country 0.1% 0.1% 0.1% 0.4% 0.5%

Research to Evaluate the Shortage of Skilled Workers in Northern Alberta Chapter 2 - Overview of Socio-Economic and Demographic Background Conditions
Prepared for The Northern Labour Market Information Clearinghouse Project By Steven Lakey, MBA, CMC Page 19
5. For Aboriginals residing in smaller isolated communities, participation, employment and unemployment rates in Northern Alberta were considerably less than those for all of Alberta and all of Canada.
Note: Population figures used for this discussion conform to the “traditional” Northern Alberta Development Council area boundaries and exclude parts of Census Division 13, and as such are not directly comparable to the figures used in other parts of this report. In 2001, the Aboriginal Labour Force was relatively small; approximately 4,000 in total. Aboriginal participation rates in Northern Alberta were approximately 46% to 50%, while the participation rates for the non-Aboriginal population across all jurisdictions was closer to 65% to 75%. Aboriginal employment rates were in the range of 36% to 38%, while employment rates for non-Aboriginals were closer to 70% in Alberta and 61% for all of Canada. Aboriginal unemployment rates were 11% while those for non-Aboriginals were approximately 5% in Alberta and 7.4% for all of Canada. The following table provides a summary of the preceding discussion.
2001 PARTICIPATION AND EMPLOYMENT: ABORIGINAL AND NON-ABORIGINAL
Northeast NE Abor Northwest NW Abor Northern North Abor Alberta Canada
Total population 91,960 4,110 112,365 4,395 204,325 8,505 2,322,020 23,901,360 In the labour force 70,190 2,055 84,635 2,045 154,825 4,100 1,696,760 15,872,075 Employed 66,100 1,585 79,255 1,550 145,355 3,135 1,608,840 14,695,135 Unemployed 4,065 455 5,415 495 9,480 950 87,925 1,176,935 Not in the labour force 21,775 2,050 27,720 2,350 49,495 4,400 625,265 8,029,290 Participation rate 76.3% 50.0% 75.3% 46.5% 75.8% 48.2% 73.1% 66.4% Employment rate 71.9% 38.6% 70.5% 35.3% 71.1% 36.9% 69.3% 61.5% Unemployment rate 4.4% 11.1% 4.8% 11.3% 4.6% 11.2% 5.2% 7.4%
6. Persons with disabilities have participation and employment and unemployment
rates that are considerably worse than rates for non-disabled Albertans.
According to “Understanding Alberta’s Labour Force: Looking to the Future”, published in September 2005, Alberta’s population includes 350,000 individuals or approximately 12.5% of the total who report having a disability of some sort. On this basis, it might be reasonable that the disabled population of Northern Alberta is in the order of 30,000 to 35,000 individuals. The following table provides an overview of participation, employment and unemployment rates for the disabled on an Alberta-wide basis in 2001.
COMPARISON OF PARTICIPATION, EMPLOYMENT AND UNEMPLOYMENT RATES (2001) PERSONS WITH DISABILITIES VS PERSONS WITHOUT DISABILITIES
Persons With
Disabilities Persons Without
Disabilities Participation Rate Males 70.7% 89.1% Females 67.1% 77.8% Employment Rate Males 55.2% 84.7% Females 49.4% 73.7% Unemployment Rate Males 22.0% 5.1% Females 26.5% 5.2%
Research to Evaluate the Shortage of Skilled Workers in Northern Alberta Chapter 2 - Overview of Socio-Economic and Demographic Background Conditions
Prepared for The Northern Labour Market Information Clearinghouse Project By Steven Lakey, MBA, CMC Page 20
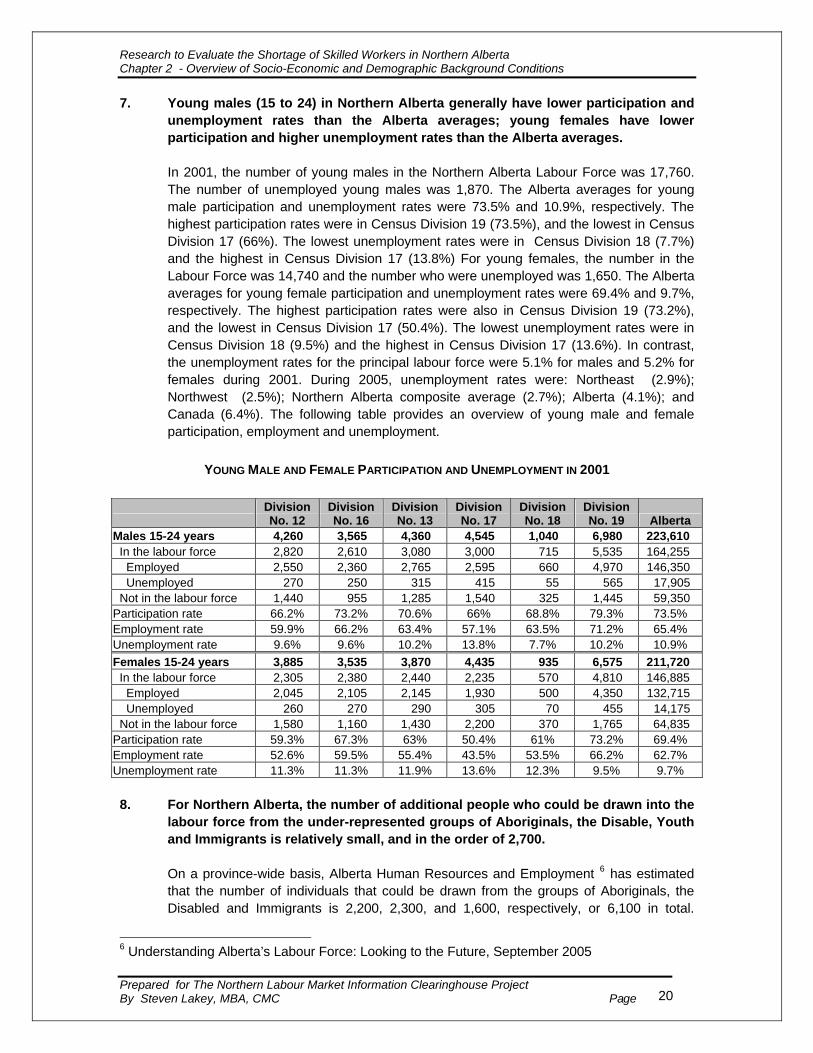
7. Young males (15 to 24) in Northern Alberta generally have lower participation and unemployment rates than the Alberta averages; young females have lower participation and higher unemployment rates than the Alberta averages.
In 2001, the number of young males in the Northern Alberta Labour Force was 17,760. The number of unemployed young males was 1,870. The Alberta averages for young male participation and unemployment rates were 73.5% and 10.9%, respectively. The highest participation rates were in Census Division 19 (73.5%), and the lowest in Census Division 17 (66%). The lowest unemployment rates were in Census Division 18 (7.7%) and the highest in Census Division 17 (13.8%) For young females, the number in the Labour Force was 14,740 and the number who were unemployed was 1,650. The Alberta averages for young female participation and unemployment rates were 69.4% and 9.7%, respectively. The highest participation rates were also in Census Division 19 (73.2%), and the lowest in Census Division 17 (50.4%). The lowest unemployment rates were in Census Division 18 (9.5%) and the highest in Census Division 17 (13.6%). In contrast, the unemployment rates for the principal labour force were 5.1% for males and 5.2% for females during 2001. During 2005, unemployment rates were: Northeast (2.9%); Northwest (2.5%); Northern Alberta composite average (2.7%); Alberta (4.1%); and Canada (6.4%). The following table provides an overview of young male and female participation, employment and unemployment.
YOUNG MALE AND FEMALE PARTICIPATION AND UNEMPLOYMENT IN 2001
Division No. 12
Division No. 16
Division No. 13
Division No. 17
Division No. 18
Division No. 19 Alberta
Males 15-24 years 4,260 3,565 4,360 4,545 1,040 6,980 223,610 In the labour force 2,820 2,610 3,080 3,000 715 5,535 164,255 Employed 2,550 2,360 2,765 2,595 660 4,970 146,350 Unemployed 270 250 315 415 55 565 17,905 Not in the labour force 1,440 955 1,285 1,540 325 1,445 59,350 Participation rate 66.2% 73.2% 70.6% 66% 68.8% 79.3% 73.5% Employment rate 59.9% 66.2% 63.4% 57.1% 63.5% 71.2% 65.4% Unemployment rate 9.6% 9.6% 10.2% 13.8% 7.7% 10.2% 10.9% Females 15-24 years 3,885 3,535 3,870 4,435 935 6,575 211,720 In the labour force 2,305 2,380 2,440 2,235 570 4,810 146,885 Employed 2,045 2,105 2,145 1,930 500 4,350 132,715 Unemployed 260 270 290 305 70 455 14,175 Not in the labour force 1,580 1,160 1,430 2,200 370 1,765 64,835 Participation rate 59.3% 67.3% 63% 50.4% 61% 73.2% 69.4% Employment rate 52.6% 59.5% 55.4% 43.5% 53.5% 66.2% 62.7% Unemployment rate 11.3% 11.3% 11.9% 13.6% 12.3% 9.5% 9.7% 8. For Northern Alberta, the number of additional people who could be drawn into the
labour force from the under-represented groups of Aboriginals, the Disable, Youth and Immigrants is relatively small, and in the order of 2,700. On a province-wide basis, Alberta Human Resources and Employment 6 has estimated that the number of individuals that could be drawn from the groups of Aboriginals, the Disabled and Immigrants is 2,200, 2,300, and 1,600, respectively, or 6,100 in total.
6 Understanding Alberta’s Labour Force: Looking to the Future, September 2005

Research to Evaluate the Shortage of Skilled Workers in Northern Alberta Chapter 2 - Overview of Socio-Economic and Demographic Background Conditions
Prepared for The Northern Labour Market Information Clearinghouse Project By Steven Lakey, MBA, CMC Page 21
Assuming that the incidence of disabled persons in Northern Alberta is similar to that of the Province, and allowing for Northern Alberta’s 10% share of the total population, factoring in the higher incidence of Aboriginals in Northern Alberta (17.8% of the population vs. 5.3%) and lower incidence of immigrants (5.3% of the population vs. 14.7% on a province wide basis), the number of Aboriginals, Disabled and Immigrants who might be able to be drawn into the labour force is approximately 1,000. The prospects for youth are somewhat larger. If youth unemployment rates could be brought into line with the provincial averages, approximately 1,700 additional youth (900 males and 800 females) might be drawn into the labour force.
IV. Economic Conditions This section of Chapter 2 provides an analysis of some key Economic Conditions in Northern Alberta from the perspective of their potential relationship to skills shortages. 1. Major construction activity has placed tremendous pressure on the need for skills.
The largest driver of the economy in Northern Alberta, at present, is the extremely large value of the major construction projects planned or underway. While it is difficult to stay current with the activity, as of September 30, 2005, the value of these projects was over $69 billion, with construction time frames extending to 2011. The vast majority of the work (over $65 billion) is related to oilsands projects near Fort McMurray. In comparison, the category with the next largest value – approximately $1 billion – is Infrastructure. On the basis of a split between the two regions of Northern Alberta used for this study, 97.1% of the value of projects is located in the Northeast and 2.9% is located in the Northwest. The following table summarizes projects, having a value of more than $200,000 as of September 30, 2005, according to region and type of project.
SUMMARY OF MAJOR PROJECTS AS OF SEPTEMBER 30, 2005
Northeast Northwest Total
Project Sector Number $ Number $ Number $ Institutional 16 200,367,800 35 28,359,500 51 228,727,300Forestry & Related 6 712,000,000 6 712,000,000Power 1 175,000,000 1 175,000,000Infrastructure 20 784,845,600 88 296,776,075 108 1,081,621,675Tourism/Recreation 9 56,600,000 25 112,866,800 34 169,466,800Mining 12 174,689,000 12 174,689,000Commercial/Retail 6 21,775,000 29 89,493,990 35 111,268,990Pipelines 7 472,600,000 19 173,200,000 26 645,800,000Residential 21 105,448,470 17 44,368,000 38 149,816,470Agriculture & Related 3 20,110,000 3 20,110,000Oil, Gas & Oilsands 40 5,068,700,000 50 116,876,000 90 65,185,576,000Telecommunications 11 1448000 11 1,448,000Other Industrial 6 125,700,000 12 14,703,000 18 140,403,000Total 137 67,012,075,870 295 2,032,545,865 432 69,044,621,735

Research to Evaluate the Shortage of Skilled Workers in Northern Alberta Chapter 2 - Overview of Socio-Economic and Demographic Background Conditions
Prepared for The Northern Labour Market Information Clearinghouse Project By Steven Lakey, MBA, CMC Page 22
The following tables provide a more detailed breakdown of projects according to Census Division.
MAJOR NORTHEAST PROJECTS AS OF SEPTEMBER 30, 2005
CD 12 CD 16 Athabasca Northeast Project Sector Number Cost Number Cost Number Cost Number Cost Institutional 11 60,067,800 5 140,300,000 16 200,367,800Infrastructure 8 32,945,600 11 745,900,000 1 6,000,000 20 784,845,600Tourism/Recreation 7 43,500,000 2 13,100,000 9 56,600,000Mining 10 11,689,000 2 163,000,000 12 174,689,000Commercial/Retail 6 21,775,000 6 21,775,000Pipelines 2 30,600,000 5 442,000,000 7 472,600,000Residential 1 200,000 20 105,248,470 21 105,448,470
Oil, Gas & Oilsands 9 4,034,000,000 31 61,034,700,000 40 65,06,8700,000Other Industrial 1 150,000 5 125,550,000 6 125,700,000Total 49 4,214,502,400 87 62,791,573,470 1 6,000,000 137 67,012,075,870
MAJOR NORTHWEST PROJECTS AS OF SEPTEMBER 30, 2005
CD 17
CD 18
CD 19 Woodlands NW
Project Sector # $ # $ # $ # $ # $ Institutional 8 2,260,500 1 700,000 26 25,399,000 35 28,359,500Forestry & Related 4 512,000,000 2 200,000,000 6 712,000,000Power 1 175,000,000 1 175,000,000Infrastructure 31 115,132,800 5 18,000,000 52 163,643,275 88 296,776,075Tourism/Recreation 8 15,533,800 3 2,490,000 14 94,843,000 25 112,866,800Mining Commercial/Retail 14 16,920,000 3 629,000 12 71,944,990 29 89,493,990Pipelines 2 50,900,000 11 94,400,000 6 27,900,000 19 173,200,000Residential 1 280,000 7 20,180,000 9 23,908,000 17 44,368,000Agriculture Related 2 15,610,000 1 4,500,000 3 20,110,000Oil, Gas & Oilsands 11 21,164,000 32 91,252,000 7 4,460,000 50 116,876,000Telecommunications 8 1,148,000 3 300,000 11 1448000Other Industrial 7 11,078,000 4 1,225,000 1 24,000,000 12 14,703,000Total 94 766,761,600 69 229,176,000 132 1,032,108,265 1 4,500,000 295 2,032,545,865
2. Other construction activity is also requiring a heavy draw on some skills.
Other construction activity for which it has been more difficult to isolate the “Northern Alberta” component or specific impact in terms of skills include: • An extremely strong residential housing sector driven by record low interest rates in
recent times and strong migration to Alberta from other parts of Canada (as referenced earlier in this Chapter);
• A strong commercial sector required to support growth associated with the support required for the oilsands activity; and
• Competition from places like British Columbia where infrastructure requirements for the 2010 Winter Olympics and a strong residential sector have drawn some skilled workers from Alberta.

Research to Evaluate the Shortage of Skilled Workers in Northern Alberta Chapter 2 - Overview of Socio-Economic and Demographic Background Conditions
Prepared for The Northern Labour Market Information Clearinghouse Project By Steven Lakey, MBA, CMC Page 23
3. The agriculture sector suffers from a variety of maladies that have caused
individuals to leave the industry. Some of the problems have included:
• Unfavourable weather conditions that have limited production; • Reduced access to key markets such as was the case during the BSE crisis; • High operating and machinery costs that have not been supported by a
commensurate increase in prices received for production; • A need to invest heavily in the latest technology (which is expensive) and operate at
larger scales in order to stay competitive; and • Stronger opportunities for individuals in other sectors that present individuals with an
“easier way of life”. 4. Issues associated with energy supply and demand have caused a dramatic
increase in oil and gas exploration. In part due to concerns over security of supply driven by unrest in parts of the world such
as the Middle East and partly due to domestic (North American) and international (China in particular) increase in demand associated with economic growth, there has been a significant increase in prices for oil and gas. Northern Alberta, being a safe and accessible place, is a preferred location for exploration and development. Furthermore, discovery of more accessible coal bed methane and improvements in associated technology may add to exploration and development activity, although there are issues to be resolved (as discussed in Chapter 5).
5. In relation to Forestry, and setting aside the issue of the impact of the “Softwood
Lumber Dispute” which has effectively reduced access to the large United States market, from a longer-term perspective, the industry suffers from sagging prices, a high Canadian dollar, operational inefficiencies and a need to increase the value-added component of production.
Northern Alberta is a relatively major employer and source of revenues for the industry. There is a very real risk that facilities will close or require significant changes in technology, value-added production, innovation and training (further details are discussed in Chapter 5) and in order to be viable. According to the Alberta Forest Suppliers Association, Forestry in Northern Alberta provides for approximately 15,000 or 60% of the 24,000 primary jobs in Alberta. Forestry operations accounted for approximately 75% of total revenues ($6.3 billion out of Approximately $8.4 billion). For perspective, Alberta’s Gross Domestic Product (GDP) in 2001 was 119.5 billion (at basic prices and constant 1997$). By applying employment data to the GDP figures an estimate of the GDP of Northern Alberta is approximately 12.8 billion. 7The following table provides an overview of employment and revenues associated with Forestry in Northern Alberta according to the regions used by the Association.
7 British Columbia – Alberta Northern Corridor Analysis, April 2004

Research to Evaluate the Shortage of Skilled Workers in Northern Alberta Chapter 2 - Overview of Socio-Economic and Demographic Background Conditions
Prepared for The Northern Labour Market Information Clearinghouse Project By Steven Lakey, MBA, CMC Page 24
FORESTRY EMPLOYMENT AND REVENUES IN NORTHERN ALBERTA (2005)
Total
Employment Direct Indirect Revenues ($Billions)
Athabasca/Fort McMurray 3,767 1,760 2,007 $ 1.20 Grande Prairie/Grande Cache 3,334 1,516 1,818 $ 1.30 Peace River/High Level/La Crete 3,255 1,550 1,705 $ 1.30 Slave Lake High Prairie 2,177 1,072 1,105 $ 1.20 Whitecourt 2,885 1,375 1,510 $ 1.30 Total 15,418 7,273 8,145 $ 6.30
Source: Derived from Alberta Forest Products Association The following table provides an overview of the top three employers in each region and their contribution to the total Forestry employment of the region.
TOP THREE FORESTRY EMPLOYERS IN EACH REGION
Region Employer Mill Type Employment % Of Total Regional
Employment Al-Pac Pulp Mill 1,040 27.30% Athabasca/ Fort McMurray Millar Western Saw Mill 240 6.40%
Northlands Saw Mill 185 4.90% Sub-total 1,465 38.89% Weyerhaeuser Pulp Mill 500 15.00% Grande Prairie/Grande Cache Weyerhaeuser Saw Mill 200 6.00%
Canfor Saw Mill 190 5.70% Sub-total 890 26.69% Daishowa - Marubeni Pulp Mill 500 15.36% Peace River/High Level/La Crete Tolko Saw Mill 250 7.68%
Canfor Saw Mill 170 5.22% Sub-total 920 28.26% Vanderwell Saw Mill 190 8.73% Slave Lake High Prairie Weyerhaeuser OSB 180 8.27% Buchanan Saw Mill 165 7.58% Sub-total 535 24.58%
Alberta Newsprint Pulp and Paper 387 13.41%
Whitecourt Millar Western Saw Mill 373 12.93% Blue Ridge Lumber Saw Mill 260 9.01% Total 4,830 31.30%
Source: Derived from Alberta Forest Products Association

Research to Evaluate the Shortage of Skilled Workers in Northern Alberta Chapter 2 - Overview of Socio-Economic and Demographic Background Conditions
Prepared for The Northern Labour Market Information Clearinghouse Project By Steven Lakey, MBA, CMC Page 25
6. Despite opportunities, it is difficult and more costly to find accommodation in Northern Alberta, and other costs are, on balance, also higher.
The average price of a single-family home in 2005 was approximately $430,000 for Fort McMurray and $179,000 for Grande Prairie. By comparison, prices for other Canadian centers were: Regina ($138,000); Calgary ($283,000); and Vancouver ($469,000). Apartment vacancy rates are approximately 0.7% for Fort McMurray and 0.8% for Grande Prairie. In contrast, vacancy rates in Edmonton, Calgary and on average for all of Canada were: 4.5%, 1.6% and 2.7%, respectively. Average rents for a two bedroom apartment are approximately $1,400 per month (if available) in Fort McMurray, and in comparison approximately $750 in Edmonton.
On the basis of Edmonton costs being “100”, 2005 cost of food and cost of non food items for Northern Alberta and other cities and towns are summarized in the following table: 8
COST OF LIVING INDEX (APRIL 2005)
City/Town Food Index Non Food Index Edmonton 100 100
Calgary 99.6 102.8
Fort McMurray 103 118.4
Grande Prairie 106 102.3
High Prairie 104 97.4
Peace River 100 102.1
The skills shortage has caused a rise in wages and salaries (details of select wage and salary rates were provided in Chapter 3) but has also had a “trickle down” effect such that “service sector” jobs, which are lower paying and may also be associated with less desirable working conditions are considered less attractive and do not come close to covering some of the costs associated with living in Northern Alberta.
8 2005 Place-to-Place Price Comparison Survey for Selected Alberta Communities, Alberta Economic Development, November 2005.

Research to Evaluate the Shortage of Skilled Workers in Northern Alberta Chapter 3 –Shorter Term Skills Shortages and Other Workforce Characteristics
Prepared for The Northern Labour Market Information Clearinghouse Project By Steven K. Lakey, MBA, CMC Page
26
Chapter 3 Shorter Term Skills Shortages and Other Workforce Characteristics
The purpose of this Chapter is to quantify skills shortages in the short to medium-term. It provides an analysis of skills shortages and indicators of employers’ concerns according to occupational classifications and occupations in the short-term to medium-term, typically not beyond 2010 to 2013 in most cases due to data limitations (please reference more detailed discussion in the Preamble below). The findings of the Chapter are used to form the basis of more focused discussion and analysis and recommendations in some of the subsequent Chapters.
Limitations The discussion and analysis in this section have been based primarily upon a composition of 2001 Census data and data in two models developed by Alberta Human Resources and Employment: “Athabasca – Grande Prairie Region”; and the “Wood Buffalo – Cold Lake Region” that cover the period 2005 to 2010. While the figures represent the “best available” given the purpose of the assignment and resources available (development of customized models are not feasible from a budgetary and time perspective), there are several limitations and caveats that must be considered: • The geographic areas covered in the AHRE models do not match perfectly with the parts of
Alberta normally considered to be “Northern Alberta” (“Northeast” consisting of Census Divisions 12 and 16 and Athabasca County, and “Northwest “ consisting of Census Divisions 17, 18 and 19 and Wood lands County). As such, it has been necessary to organize the analysis of this Chapter around the geographic definitions used by the AHRE model. “Wood Buffalo – Cold Lake”, corresponding roughly to the Northeast, includes Census Divisions 12 and 16. “Athabasca – Grande Prairie”, corresponding to the Northwest, includes Census Divisions 13, 17, 18 and 19. If the adjustments are not made, the data are not comparable and a number of distortions occur.
• The projections have been developed during a period of turbulent change and economic
growth in Northern Alberta. It is difficult to stay abreast of the changes (particularly the impact of an ever increasing number of oilsands projects), and, despite being reviewed periodically, the changes “test” the underlying assumptions of the models.
• The labour force and skills shortages are fluid and dynamic issues. An analogy that might be
appropriate is that “it is difficult to describe a movie using still shots”. • Forecasts at the regional and Sub-regional levels – Northern Alberta and the two sections of
used for this study (“Northeast” and “Northwest”) – have an inherent degree of “statistical” unreliability due to the relatively small sample sizes upon which the models’ projections are based.

Research to Evaluate the Shortage of Skilled Workers in Northern Alberta Chapter 3 –Shorter Term Skills Shortages and Other Workforce Characteristics
Prepared for The Northern Labour Market Information Clearinghouse Project By Steven K. Lakey, MBA, CMC Page
27
• The 2001 “base data” from the Census is “old” and newer, more accurate data (which will also verify the accuracy of some of the 2005 projection figures) will not be available until the 2006 Census is completed.
• The growth in the number of jobs in an occupational classification is likely a strong indicator of a skills shortage in the occupation; however, cannot be viewed with absolute certainty due to the preceding factors as well as unknown “supply” dynamics of the workforce and population, not reflected in the models may exacerbate or mitigate the skills shortage.
• Data that can be considered as “reliable” extends only as far as 2013 (for construction
trades), and in most other cases only as far as 2010. • Finally, this Chapter makes use of Occupational Classification data from material developed
by Human Resources Development Canada, Alberta Human Resources and Employment, and Statistics Canada. The system used by Human Resources Development Canada is called the National Occupational Classification, or “NOC 2001” system. The system used by the latter two organizations is called the “NOC S” (statistical) 2001” system. The structures of the two systems are essentially similar, except for the first or “prefix” codes used. The following table shows the “cross-over” between the two systems.
CODING SYSTEMS “CROSS-OVER”
Alberta Human Resources
and Employment and Statistics Canada Codes
(NOC – S)1
National Occupational Classification Codes
(NOC) 2
Description
A 0 MANAGEMENT OCCUPATIONS
B 1 BUSINESS, FINANCE AND ADMINISTRATION OCCUPATIONS
C 2 NATURAL AND APPLIED SCIENCES AND RELATED OCCUPATIONS
D 3 HEALTH OCCUPATIONS
E 4 OCCUPATIONS IN SOCIAL SCIENCE, EDUCATION, GOVERNMENT SERVICE AND RELIGION
F 5 OCCUPATIONS IN ART, CULTURE, RECREATION AND SPORT
G 6 SALES AND SERVICE OCCUPATIONS
H 7 TRADES, TRANSPORT AND EQUIPMENT OPERATORS AND RELATED OCCUPATIONS
I 8 OCCUPATIONS UNIQUE TO PRIMARY INDUSTRY
J 9 OCCUPATIONS UNIQUE TO PROCESSING, MANUFACTURING AND UTILITIES
1 http://www.statcan.ca/english/Subjects/Standard/soc/2001/nocs01-menu.htm2 http://www23.hrdc-drhc.gc.ca/2001/e/groups/0.shtml

Research to Evaluate the Shortage of Skilled Workers in Northern Alberta Chapter 3 –Shorter Term Skills Shortages and Other Workforce Characteristics
Prepared for The Northern Labour Market Information Clearinghouse Project By Steven K. Lakey, MBA, CMC Page
28
The NOC – S system is comprised at the highest level of hierarchy of 10 “Major Groups”. Categories. Under the major Groups are more specific “Occupational Categories” of which AHRE tracks 47. The NOC 2001 system is further refined according to the level of education and experience required. The second number, of the occupational code, ranging from 0 to 6, is key in this instance. The smaller the number, the higher the level of education and experience required. The system is further subdivided according to occupational classifications, of which approximately 140 are covered and specific occupations, of which there are approximately 500. The alphanumeric system used by Alberta Human Resources and Employment and Statistics Canada has two-digit and three-digit codes (for increasing specificity) that correspond to the NOC 2001 codes; however, they are perhaps not as intuitive “in their organization.
Given the preceding limitations and caveats, and “complexities” the first step was to make best use of the available information to develop a consistent and standardized forecast that might serve as a “platform” for subsequent discussion and analysis. To do so, 2001 census data was used as a baseline of the number of individuals in each occupational category tracked by Alberta Human Resources and Employment (AHRE) and Statistics Canada. Based upon the models used by AHRE, employment projections for both 2005 and 2010 were used for each occupational category. The number of new jobs estimated to have been created between 2001 and 2005, and 2005 and 2010, and the respective percentage increases in jobs for both periods were also calculated. The results of these calculations, and additional analysis are presented in Addendum Tables A3.1 (all of Northern Alberta), Addendum Table A3.1.1 (conforming to AHRE “Wood Buffalo – Cold Lake” or roughly Northeastern Alberta) and Addendum Table A3.1.2 (conforming to AHRE “Athabasca – Grande Prairie” or roughly Northwestern Alberta. The order of presentation of other data tables and the general discussion and analysis of this Chapter follows as below: • All of Northern Alberta • Wood Buffalo – Cold Lake • Athabasca – Grande Prairie This is a departure from the order of presentation in Chapter 2 (where there is a “roll – up” to higher levels of jurisdictions); however, a “top down” approach seems to result in a better flow. The balance of the analysis and discussion associated with this Chapter follows. In a number of instances throughout, the “full or official” names of some Occupational Categories included in tables have been truncated for space or aesthetic reasons. In order to gain a more complete perspective of the evolution of skills shortages, it is helpful to “track” the labour force over the 10 -year period of the data available with the NOC – S system. This way, one gains a better appreciation of how certain economic and political events have affected the demand for skills and it is also possible to ascertain better instances where there may be outstanding skills shortages. It is probably more useful to focus on the percentages, rather than the specific numerical compositions, particularly in the 2001 to 2005 period.

Research to Evaluate the Shortage of Skilled Workers in Northern Alberta Chapter 3 –Shorter Term Skills Shortages and Other Workforce Characteristics
Prepared for The Northern Labour Market Information Clearinghouse Project By Steven K. Lakey, MBA, CMC Page
29

Research to Evaluate the Shortage of Skilled Workers in Northern Alberta Chapter 3 –Shorter Term Skills Shortages and Other Workforce Characteristics
Prepared for The Northern Labour Market Information Clearinghouse Project By Steven K. Lakey, MBA, CMC Page
30
I. Composition of the Labour Force and Skills Requirements in 2001 The purpose of this Section is to develop a “baseline” of skills required as expressed by the structure of the labour force of Northern Alberta and the two Sub-regions in 2001. Key Findings 1. The Labour Force at the Major Category Level
In 2001, the skills requirements of Northern Alberta were met by approximately 175,855 jobs. Of these, 56,555 were in the “Wood Buffalo – Cold Lake Region” and 119,300 were in the “Athabasca – Grande Prairie Region”. A discussion of the breakdown of the jobs according to a number of Major categories follows. a. Northern Alberta
Trades, transportation and equipment operators and Sales and service occupations are the two largest components of the Northern Alberta labour force accounting for a combined 44.3% of the total.
b. Wood Buffalo – Cold Lake Sub-region
Trades, transportation and equipment operators and Sales and service occupations are the two largest components of the Wood Buffalo – Cold Lake Sub-region labour force accounting for a combined 48.3% of the total. The other proportions are similar to all of Northern Alberta except that the proportion associated with primary industry is approximately 10% instead of 13%.
c. Athabasca – Grande Prairie Sub-region
Trades, transportation and equipment operators and Sales and service occupations are still the two largest components of the Athabasca-Grande Prairie Region labour force accounting for a combined 42.3% of the total. The other overall proportions are similar to all of Northern Alberta except that the proportion associated with primary industry is approximately 17% instead of 13%.
As a starting point, the following table provides a summary of occupations in each Region or Sub-region according to the “NOC – S” system.

Research to Evaluate the Shortage of Skilled Workers in Northern Alberta Chapter 3 –Shorter Term Skills Shortages and Other Workforce Characteristics
Prepared for The Northern Labour Market Information Clearinghouse Project By Steven K. Lakey, MBA, CMC Page
31
SUMMARY OF OCCUPATIONS IN 2001 ACCORDING TO NOC – S MAJOR CATEGORIES
Northern Region 2001 % of Total All Occupations 175,855 100.00% H Trades, transport and equipment operators 40,100 22.70% G Sales and service occupations 38,230 21.60% I Occupations unique to primary industry 26,170 14.80% B Business, finance and administration occupations 23,215 13.10% A Management occupations 14,625 8.30% E Social science, education, government and religion 11,210 6.30% C Natural and applied sciences and related occupations 7,725 4.40% J Unique to processing, manufacturing and utilities 6,180 3.90% D Health occupations 6,310 3.60% F Occupations in art, culture, recreation and sport 2,090 1.20% Wood Buffalo – Cold Lake Sub-region 2001 % Of Total All occupations 56,565 100.00% H Trades, transport and equipment operators 14,150 25.00% G Sales and service occupations 13,315 23.50% B Business, finance and administration occupations 7,140 12.60% I Occupations unique to primary industry 5,745 10.20% A Management occupations 4,765 8.40% E Social science, education, government and religion 3,750 6.60% C Natural and applied sciences and related occupations 3,210 5.70% D Health occupations 2,135 3.80% J Unique to processing, manufacturing and utilities 1,720 3.00% F Occupations in art, culture, recreation and sport 635 1.10% Athabasca – Grande Prairie Sub-region 2001 % Of Total All occupations 119,300 100.00% H Trades, transport and equipment operators 25,965 21.60% G Sales and service occupations 24,920 20.70% I Occupations unique to primary industry 20,430 17.00% B Business, finance and administration occupations 16,065 13.40% A Management occupations 9,860 8.20% E Social science, education, government and religion 7,455 6.20% C Natural and applied sciences and related occupations 4,520 3.80% J Unique to processing, manufacturing and utilities 4,460 3.70% D Health occupations 4,175 3.50% F Occupations in art, culture, recreation and sport 1,450 1.20%

Research to Evaluate the Shortage of Skilled Workers in Northern Alberta Chapter 3 –Shorter Term Skills Shortages and Other Workforce Characteristics
Prepared for The Northern Labour Market Information Clearinghouse Project By Steven K. Lakey, MBA, CMC Page
32
2. The 2001 Labour Force at the Occupational Category Level
The models used by AHRE track 47 occupational categories, of which there are several hundred lower level specific occupations. The tables in this Part provide an overview of the “top 10 and bottom 10” occupational categories for “Northern Alberta” and for both Sub-regions. a. All of Northern Alberta
In 2001, the single largest Occupational Category for Northern Alberta was related to Agriculture. The Region is skewed heavily toward Primary Industry and has a relatively low representation for Professional, Cultural and Manufacturing occupations. The Occupational Categories that constitute the “top 10” (accounting for 86,185 or approximately 50% of occupations) and “bottom 10” (accounting for 9,070 or approximately 5% of occupations. The percentage of skills as represented by occupation, that might be considered professional was approximately 14.9%, with the largest component being teachers and professors, as displayed in the following table.
“Professionals” – All of Northern Alberta Number% of
“Professional” % Of Total
E1 Teachers and professors 5,985 22.87% 3.40%A3 Other managers, n.e.c. 5,720 21.85% 3.20%C0 Professional in natural and applied sciences 3,125 11.94% 1.80%E0 Psychologists, social workers, ministers, policy officers 2,190 8.37% 1.20%A1 Specialist managers 2,160 8.25% 1.20%B0 Professional occupations in business and finance 1,890 7.22% 1.10%D1 Nurse supervisors and registered nurses 1,860 7.11% 1.10%A0 Senior management occupations 1,450 5.54% 0.80%D0 Professional occupations in health 1070 4.09% 0.60%F0 Professional occupations in art and culture 725 2.77% 0.40%Total 26,175 100.0% 14.9% Table 3.1 provides a complete overview of all Northern Alberta skills requirements as represented by occupations.
b. Wood Buffalo – Cold Lake Sub-region
The 2001 occupational base of the Wood Buffalo – Cold Lake Sub-region is skewed toward positions associated with the support and development of the oilsands projects, including a large number of relatively low paying Sales and service positions as well as trades and equipment operators. There are relatively few “Professional”, “Cultural” or “Manufacturing” occupations. The Occupational Categories that constitute the “top 10” (accounting for 26,250 or approximately 47% of occupations) and “bottom 10” (accounting for 2,905 or approximately 5% of occupations. The percentage of skills as represented by occupation, that might be considered professional was approximately 13.8%, with the largest component being teachers and professors, as displayed in the following table.

Research to Evaluate the Shortage of Skilled Workers in Northern Alberta Chapter 3 –Shorter Term Skills Shortages and Other Workforce Characteristics
Prepared for The Northern Labour Market Information Clearinghouse Project By Steven K. Lakey, MBA, CMC Page
33
“Professionals” Wood Buffalo – Cold Lake Number % of “Professional”
% Of Total
E1 Teachers and professors 2,055 22.3% 3.2%A3 Other managers, n.e.c. 1,820 19.7% 2.5%C0 Professional in natural and applied sciences 1,390 15.1% 1.3%E0 Psychologists, social workers, ministers, policy officers 730 7.9% 1.5%A1 Specialist managers 865 9.4% 1.2%B0 Professional occupations in business and finance 685 7.4% 0.9%D1 Nurse supervisors and registered nurses 510 5.5% 0.7%A0 Senior management occupations 395 4.3% 0.3%D0 Professional occupations in health 185 2.0% 1.1%F0 Professional occupations in art and culture 600 6.5% 1.1%Total 9,235 100.0% 13.8%
Table 3.1.1 provides a complete overview of all Wood Buffalo- Cold Lake skills requirements as represented by occupations.
c. Athabasca – Grande Prairie Sub-region There were a relatively high number of occupations related to Agriculture (approximately 11.5% compared to 5% for the Wood Buffalo Cold Lake Sub-region). As is the case in the Wood Buffalo – Cold Lake Sub-region, there are relatively few Cultural, Professional and Manufacturing occupations. The Occupational Categories that constitute the “top 10” (accounting for 60,810 or approximately 51% of occupations) and “bottom 10” (accounting for 6,080 or also approximately 5% of occupations. The percentage of skills as represented by occupation, that might be considered professional was approximately 14.2%, with the largest component being teachers and professors, as displayed in the following table.
“Professionals” Athabasca – Grande Prairie Number % of “Professional”
% Of Total
E1 Teachers and professors 3,930 23.2% 3.3%A3 Other managers, n.e.c. 3,900 23.0% 3.3%C0 Professional in natural and applied sciences 1,735 10.2% 1.5%E0 Psychologists, social workers, ministers, policy officers 1,460 8.6% 1.2%A1 Specialist managers 1,295 7.6% 1.1%B0 Professional occupations in business and finance 1,205 7.1% 1.0%D1 Nurse supervisors and registered nurses 1,260 7.4% 1.1%A0 Senior management occupations 940 5.5% 0.8%D0 Professional occupations in health 675 4.0% 0.6%F0 Professional occupations in art and culture 540 3.2% 0.5%Total 16,940 100.0% 14.2%
Table 3.1.2 provides a complete overview of all Athabasca – Grande Prairie skills requirements as represented by occupations.

Research to Evaluate the Shortage of Skilled Workers in Northern Alberta Chapter 3 –Shorter Term Skills Shortages and Other Workforce Characteristics
Prepared for The Northern Labour Market Information Clearinghouse Project By Steven K. Lakey, MBA, CMC Page
34

Research to Evaluate the Shortage of Skilled Workers in Northern Alberta Chapter 3 –Shorter Term Skills Shortages and Other Workforce Characteristics
Prepared for The Northern Labour Market Information Clearinghouse Project By Steven K. Lakey, MBA, CMC Page
35
TABLE 3.1 2001 OCCUPATIONS BY CATEGORY – NORTHERN ALBERTA
Category Number % Of Total Total 175,855 100.00% I0 Occupations unique to agriculture (excluding labourers) 16,975 9.60% G9 Sales and service occupations, n.e.c. 13,610 7.70% B5 Clerical occupations 11,560 6.50% H7 Transportation equipment operators 9,225 5.20% H4 Mechanics 6,210 3.50% E1 Teachers and professors 5,985 3.40% I1 Forestry, mining, oil and gas (excluding labourers) 5,805 3.30% A3 Other managers, n.e.c. 5,720 3.20% H6 Heavy equipment and crane operators, including drillers 5,635 3.20% H1 Construction trades 5,460 3.10% Sub-total Top 10 86,185 48.7% A2 Managers in retail trade, food and accommodation 5,295 3.00% G2 Retail salespersons and sales clerks 4,870 2.80% C1 Technical related to natural and applied sciences 4,600 2.60% J1 Machine operators in manufacturing 4,470 2.50% H8 Helpers, construction and transportation labourers 4,105 2.30% B2 Secretaries 3,850 2.20% G8 Child care and home support workers 3,555 2.00% I2 Primary production labourers 3,390 1.90% G3 Cashiers 3,190 1.80% H3 Machinists, metal forming, shaping and erecting 3,130 1.80% C0 Professional in natural and applied sciences 3,125 1.80% E2 Paralegals, social services, education and religion n.e.c. 3,035 1.70% G5 Occupations in food and beverage service 3,000 1.70% G6 Occupations in protective services 2,980 1.70% H2 Stationary engineers, power station operators 2,905 1.60% B1 Finance and insurance administration occupations 2,815 1.60% G4 Chefs and cooks 2,670 1.50% B3 Administrative and regulatory occupations 2,555 1.40% E0 Psychologists, social workers, ministers, policy officers 2,190 1.20% A1 Specialist managers 2,160 1.20% G1 Wholesale, technical, insurance, real estate sales 2,080 1.20% H0 Contractors and supervisors in trades and transportation 2,050 1.20% B0 Professional occupations in business and finance 1,890 1.10% D1 Nurse supervisors and registered nurses 1,860 1.10% D2 Technical and related occupations in health 1,690 1.00% D3 Assisting occupations in support of health services 1,685 1.00% A0 Senior management occupations 1,450 0.80% H5 Other trades, n.e.c. 1,380 0.80% F1Technical art, culture, recreation and sport 1,365 0.80% G7 Occupations in travel and accommodation and sport 1,160 0.70% G0 Sales and service supervisors 1115 0.60% D0 Professional occupations in health 1070 0.60% F0 Professional occupations in art and culture 725 0.40% J0 Supervisors in manufacturing 725 0.40% J3 Labourers in processing, manufacturing and utilities 550 0.30% B4 Clerical supervisors 545 0.30% J2 Assemblers in manufacturing 435 0.20% Sub-total Bottom 10 9,070 5.1%

Research to Evaluate the Shortage of Skilled Workers in Northern Alberta Chapter 3 –Shorter Term Skills Shortages and Other Workforce Characteristics
Prepared for The Northern Labour Market Information Clearinghouse Project By Steven K. Lakey, MBA, CMC Page
36
TABLE 3.1.1 2001 OCCUPATIONS BY CATEGORY – WOOD BUFFALO – COLD LAKE SUB-REGION
Occupational Category Number % Of Total Total 56,565 100.00% G9 Sales and service occupations, n.e.c. 4,405 7.80% B5 Clerical occupations 3,695 6.50% I0 Occupations unique to agriculture, excluding labourers 3,185 5.60% H7 Transportation equipment operators 2,605 4.60% H6 Heavy equipment and crane operators, including drillers 2,285 4.00% H4 Mechanics 2,155 3.80% H1 Construction trades 2,105 3.70% E1 Teachers and professors 2,055 3.60% G6 Occupations in protective services 1,940 3.40% A3 Other managers, n.e.c. 1,820 3.20% Sub-total Top 10 26,250 46.2% C1 Technical related to natural and applied sciences 1,820 3.20% G2 Retail salespersons and sales clerks 1,590 2.80% A2 Managers in retail trade, food and accommodation 1,570 2.80% I1 Forestry, mining, oil and gas (excluding labourers) 1,440 2.50% C0 Professional in natural and applied sciences 1,390 2.50% H8 Helpers, construction and transportation labourers 1,375 2.40% H3 Machinists, metal forming, shaping and erecting 1,315 2.30% B2 Secretaries 1,225 2.20% G8 Child care and home support workers 1,200 2.10% H2 Stationary engineers, power station operators 1,190 2.10% J1 Machine operators in manufacturing 1,185 2.10% I2 Primary production labourers 1,115 2.00% G5 Occupations in food and beverage service 1,075 1.90% G3 Cashiers 1,055 1.90% E2 Paralegals, social services, education and religion n.e.c. 970 1.70% A1 Specialist managers 865 1.50% B3 Administrative and regulatory occupations 825 1.50% G4 Chefs and cooks 815 1.40% E0 Psychologists, social workers, ministers, policy officers 730 1.30% H0 Contractors and supervisors in trades and transportation 725 1.30% B0 Professional in business and finance 685 1.20% D3 Assisting in support of health services 640 1.10% D1 Nurse supervisors and registered nurses 600 1.10% B1 Finance and insurance administration 540 1.00% A0 Senior management occupations 510 0.90% D2 Technical and related occupations in health 500 0.90% F1 Technical art, culture, recreation and sport 450 0.80% G0 Sales and service supervisors 430 0.80% G1 Wholesale, technical, insurance, real estate sales 425 0.80% D0 Professional occupations in health 395 0.70% H5 Other trades, n.e.c. 380 0.70% G7 Occupations in travel and accommodation and sport 375 0.70% J3 Labourers in processing, manufacturing and utilities 245 0.40% F0 Professional occupations in art and culture 185 0.30% J0 Supervisors in manufacturing 185 0.30% B4 Clerical supervisors 180 0.30% J2 Assemblers in manufacturing 105 0.20% Sub-total Bottom 10 2,905 5.2%

Research to Evaluate the Shortage of Skilled Workers in Northern Alberta Chapter 3 –Shorter Term Skills Shortages and Other Workforce Characteristics
Prepared for The Northern Labour Market Information Clearinghouse Project By Steven K. Lakey, MBA, CMC Page
37
TABLE 3.1.2 2001 OCCUPATIONS BY CATEGORY – ATHABASCA – GRANDE PRAIRIE SUB-REGION
Category Number % Of Total Total 119,300 100.00% I0 Occupations unique to agriculture, excluding labourers 13,790 11.50% G9 Sales and service occupations, n.e.c. 9,205 7.70% B5 Clerical occupations 7,865 6.50% H7 Transportation equipment operators 6,620 5.50% I1 Forestry, mining, oil and gas (excluding labourers) 4,365 3.60% H4 Mechanics 4,055 3.40% E1 Teachers and professors 3,930 3.30% A3 Other managers, n.e.c. 3,900 3.20% A2 Managers in retail trade, food and accommodation 3,725 3.10% H1 Construction trades 3,355 2.80% Sub-total Top 10 60,810 50.6% H6 Heavy equipment and crane operators, including drillers 3,350 2.80% J1 Machine operators in manufacturing 3,285 2.70% G2 Retail salespersons and sales clerks 3,280 2.70% C1 Technical related to natural and applied sciences 2,780 2.30% H8 Helpers, construction and transportation labourers 2,730 2.30% B2 Secretaries 2,625 2.20% G8 Child care and home support workers 2,355 2.00% B1 Finance and insurance administration occupations 2,275 1.90% I2 Primary production labourers 2,275 1.90% G3 Cashiers 2,135 1.80% E2 Paralegals, social services, education and religion n.e.c. 2,065 1.70% G5 Occupations in food and beverage service 1,925 1.60% G4 Chefs and cooks 1,855 1.50% H3 Machinists, metal forming, shaping and erecting 1,815 1.50% C0 Professional in natural and applied sciences 1,735 1.40% B3 Administrative and regulatory occupations 1,730 1.40% H2 Stationary engineers, power station operators 1,715 1.40% G1 Wholesale, technical, insurance, real estate sales 1,655 1.40% E0 Psychologists, social workers, ministers, policy officers 1,460 1.20% H0 Contractors and supervisors in trades and transportation 1,325 1.10% A1 Specialist managers 1,295 1.10% D1 Nurse supervisors and registered nurses 1,260 1.00% B0 Professional occupations in business and finance 1,205 1.00% D2 Technical and related occupations in health 1,190 1.00% D3 Assisting occupations in support of health services 1,045 0.90% G6 Occupations in protective services 1,040 0.90% H5 Other trades, n.e.c. 1,000 0.80% A0 Senior management occupations 940 0.80% F1 Technical art, culture, recreation and sport 915 0.80% G7 Occupations in travel and accommodation and sport 785 0.70% G0 Sales and service supervisors 685 0.60% D0 Professional occupations in health 675 0.60% F0 Professional occupations in art and culture 540 0.40% J0 Supervisors in manufacturing 540 0.40% B4 Clerical supervisors 365 0.30% J2 Assemblers in manufacturing 330 0.30% J3 Labourers in processing, manufacturing and utilities 305 0.30% Sub-total Bottom 10 6,080 5.2%

Research to Evaluate the Shortage of Skilled Workers in Northern Alberta Chapter 3 –Shorter Term Skills Shortages and Other Workforce Characteristics
Prepared for The Northern Labour Market Information Clearinghouse Project By Steven K. Lakey, MBA, CMC Page
38
II. Changes Between 2001 and 2005
The changes in occupational categories and/or skills requirements that occurred in the period 2001 to 2005 are discussed and analyzed in this Section. The underlying data in this Part “transitions” from relatively “hard” 2001 Census data to estimates for 2005 developed via the AHRE models. Accordingly, there is potential for some margin of error in some of the calculations. Key Findings 1. Changes At The Major Category Level
This Part of the analysis and discussion is associated with changes in the composition of the 10 Major Groups for occupations between 2001 and 2005. Labour force requirement according to Occupational Categories, percentage of total compositions and growth rates are highlighted. a. Northern Alberta Region
In the period 2001 to 2005, the labour force of the Region is estimated to have grown by 1.5% (from 175,855 to 178,440). However, the rate of growth was not uniform. The labour force of the Wood Buffalo – Cold Lake Sub-region increased by approximately 7.2% (from 56,555 to 60,650), while that of the Athabasca – Grande Prairie Sub-region declined by 1.3% (from 119,300 to 117,790). While there were approximately 6,800 new jobs (or occupational requirements), these were offset by declines in the number of Agricultural related occupations. The major category with the largest increase in occupations is “H” - Trades, transport and equipment operators (4,080 or 59.7% of the total) driven by oilsands development, and oil and gas exploration. The Major Category experiencing the most rapid rate of growth is “D – Health occupations (19% increase or 1,200 positions) representing 17.6 4% of the net increase in occupations.
b. Wood Buffalo – Cold Lake Sub-region
Within the Sub-region, the labour force’s net increase was 4,085 or approximately 7.2%, although the gross increase was approximately 5,200. There was a large increase associated with Primary Industry occupations (almost 3,000, and over 57% of the total), and Trades, Transport and Equipment Operators associated with oilsands and heavy oil development (1,830 or 35% of the increase). The Major Group with the largest percentage change was “I” - Occupations Unique to Primary Industry (52%).
c. Athabasca – Grande Prairie Sub-region
While sectors experiencing growth had an increase of approximately 5,000, the Sub-region experienced a net decline of approximately 1,500 occupations (approximately 1.3%). The decline was led by losses in occupations associated with Agriculture (approximately 5,300). The Major Group with the largest increase in occupations was “H” Trades, Transport and Equipment Operators

Research to Evaluate the Shortage of Skilled Workers in Northern Alberta Chapter 3 –Shorter Term Skills Shortages and Other Workforce Characteristics
Prepared for The Northern Labour Market Information Clearinghouse Project By Steven K. Lakey, MBA, CMC Page
39
(2,255 or 44.3% of the gross increase). The Major Group with the largest percentage increase was “D” – Health Occupations at approximately 30% or 1,265 positions.
The following table presents an overview of the changes in occupations at the Major Category level between 2001 and 2005.
2001 TO 2005 CHANGES TO MAJOR CATEGORIES: NORTHERN ALBERTA REGION
New Jobs Northern Total
2001 to 2005% Of Total % Change
2001-2005 All Occupations – Net Increase 2,585 1.00% Gross Increase 6,830 100.00% H Trades, transport and equipment operators 4,080 59.70% 10.17% B Business, finance and administration occupations 1,240 18.20% 5.34% D Health occupations 1,200 17.60% 19.02% A Management occupations 310 4.50% 2.12% F Occupations in art, culture, recreation and sport -45 -2.16% C Natural and applied sciences and related occupations -420 -5.43% J Unique to processing, manufacturing and utilities -655 -9.43% E Social science, education, government and religion -665 -5.93% G Sales and service occupations -915 -2.39% I Occupations unique to primary industry -2,355 -8.99%
New Jobs % Change Wood Buffalo - Cold Lake 2001-2005
% Of Total 2001-2005
All Occupations 4,095 7.20% Gross Increase 5,210 100.00% I Occupations unique to primary industry 2,985 57.20% 52.00% H Trades, transport and equipment operators 1,830 35.10% 12.90% A Management occupations 275 5.20% 5.80% J Unique to processing, manufacturing and utilities 120 2.30% 7.00% F Occupations in art, culture, recreation and sport -5 -0.80% D Health occupations -65 -3.00% E Social science, education, government and religion -210 -5.60% G Sales and service occupations -255 -1.90% B Business, finance and administration occupations -290 -4.10% C Natural and applied sciences and related occupations -300 -9.30%
Athabasca - Grande Prairie New Jobs 2001-2005 % Of Total % Change
Total Change -1,510 2001-2005 Gross Increase 5,080 100.00% H Trades, transport and equipment operators 2,250 44.30% 8.66% B Business, finance and administration occupations 1,530 30.10% 9.51% D Health occupations 1,265 24.90% 30.30% A Management occupations 35 0.07% 0.35% J Unique to processing, manufacturing and utilities -10 - - F Occupations in art, culture, recreation and sport -40 -2.76% C Natural and applied sciences and related occupations -120 -2.65% E Social science, education, government and religion -455 -6.10% G Sales and service occupations -660 -2.65% J Unique to processing, manufacturing and utilities -775 -14.83% I Occupations unique to primary industry -5,330 -26.13%

Research to Evaluate the Shortage of Skilled Workers in Northern Alberta Chapter 3 –Shorter Term Skills Shortages and Other Workforce Characteristics
Prepared for The Northern Labour Market Information Clearinghouse Project By Steven K. Lakey, MBA, CMC Page
40
2. Changes at the Occupational Category Level Between 2001 and 2005 This Part focuses on changes at the Occupational Category level between 2001 and 2005. The analysis and presentation are based around three factors. The first is a narrative discussion of the 10 Occupational Categories that were estimated to have experienced the largest increases and largest declines in numbers. The second is a table of the 10 Occupational Categories experiencing the largest percentage growth. A concluding table provides complete details of all of the factors for each discussion.
a. Northern Alberta Region
The net change for the period is estimated to be approximately 2,600, although the figure suppresses the underlying dynamics of the change. Approximately 14,500 increases were estimated, of which the top 10 Occupational Categories accounted for 83%. The most significant changes were related to Forestry, Mining and Oil and Gas occupations (“I1”). The increase of 3,365 in this category was 23.2% of the gross increases and reflected a 58% change in the number of individuals in the Occupational Category. The 10 Occupational Categories experiencing the largest declines totaled approximately 10,700 and reflected 90% of the total declines of 11,900. The largest declines were estimated to be “I0-Occupations Unique to Agriculture” with a decline of approximately 5,300 and a rate of decline of 31%; and “E1 – Teachers and Professors” with a decline of approximately 1,300 or 23%. The 10 occupational categories with the fastest rate of growth between 2001 and 2005 are presented in the table below.
Fastest Rate of Growth % Increase
Number Of Jobs
G0 Sales and service supervisors 107.17% 1,195J3 Labourers in processing, manufacturing and utilities 101.82% 560H0 Contractors and supervisors in trades and transportation 73.17% 1,500 I1 Forestry, mining, oil and gas (excluding labourers) 57.97% 3,365D3 Assisting occupations in support of health services 35.91% 605D1 Nurse supervisors and registered nurses 26.88% 500E2 Paralegals, social services, education and religion n.e.c. 24.22% 735H4 Mechanics 23.83% 1,480B1 Finance and insurance administration occupations 17.94% 505B5 Clerical occupations 14.71% 1,700
Please reference Table 3.2 for full details of the Northern Alberta Region.
b. Wood Buffalo – Cold Lake Sub-region The net change is approximately 4,100, reflecting increases of 6,600 and decreases of 2,500. The largest increase (1,700) was in “I1 – Forestry, Mining and Oil and Gas occupations and reflected 23% of the total increase and an increase of over 120% for the Occupational Category. “I0- Occupations unique to agriculture, excluding labourers” is also forecast to have experienced a large increase of approximately 1,300, reflecting 20% of the total and an increase of over 40% for the Occupational Category. Such a change seems to go against the trend referenced in other parts of this report and without an explanation so far

Research to Evaluate the Shortage of Skilled Workers in Northern Alberta Chapter 3 –Shorter Term Skills Shortages and Other Workforce Characteristics
Prepared for The Northern Labour Market Information Clearinghouse Project By Steven K. Lakey, MBA, CMC Page
41
raises the question of whether this is an error in the forecast or other discrepancy. The Bottom 10 increases accounted for 2,230 or 88% of the declines of 2,535. The largest single declines were related to occupations related to protective services and numbered 870 or 34% of the total declines. The following table presents the 10 occupational categories with the fastest rate of growth between 2001 and 2005.
Fastest Rate of Growth % Increase NumberOf Jobs
I1 Forestry, mining, oil and gas (excluding labourers) 120.10% 1,730 I0 Occupations unique to agriculture, excluding labourers 41.60% 1,325G1 Wholesale, technical, insurance, real estate sales 24.70% 105J2 Assemblers in manufacturing 23.80% 25H1 Construction trades 22.60% 475H0 Contractors and supervisors in trades and transportation 21.40% 155G3 Cashiers 19.40% 205H3 Machinists, metal forming, shaping and erecting 19.40% 255A2 Managers in retail trade, food and accommodation 18.50% 290H4 Mechanics 17.90% 385G4 Chefs and cooks 17.80% 145
Please reference Table 3.2.1 for full details of the Wood Buffalo –Cold Lake Sub-region.
c. Athabasca – Grande Prairie
The Sub-region is estimated to have experienced a net decline of 1,510 occupations over the period 2001 to 2005. This included increases of 11,150 and decreases of 12,655. The top 10 increases accounted for 90% of the total, or approximately 10,000 positions. The largest increases were “Clerical “(approximately 1,800) and in positions related to Forestry, Mining, and Oil and Gas (1,600). Respectively, they accounted for 16.2% and 14.7% of the total increases and represented growth rates of 23% and 37%. The largest declines were related to Agriculture (approximately 6,600 or 53% and Teachers and Professors (approximately 1,300 or 11% of total declines). The following table presents the 10 occupational categories with the fastest rate of growth between 2001 and 2005.
Fastest Rate of Growth % Change New Jobs J3 Labourers in processing, manufacturing and utilities 191.8% 305 G0 Sales and service supervisors 167.2% 685 H0 Contractors and supervisors in trades and transportation 101.5% 1,325 D3 Assisting occupations in support of health services 58.9% 1,045 D1 Nurse supervisors and registered nurses 40.5% 1,260 E2 Paralegals, social services, education and religion n.e.c. 39.0% 2,065 I1 Forestry, mining, oil and gas (excluding labourers) 37.5% 4,365 H4 Mechanics 27.0% 4,055 B5 Clerical occupations 22.9% 7,865 B1 Finance and insurance administration occupations 20.4% 2,275
Please reference Table 3.2.2 for full details of the Athabasca - Grande Prairie Sub-region.

Research to Evaluate the Shortage of Skilled Workers in Northern Alberta Chapter 3 –Shorter Term Skills Shortages and Other Workforce Characteristics
Prepared for The Northern Labour Market Information Clearinghouse Project By Steven K. Lakey, MBA, CMC Page
42
TABLE 3.2 2001-2005 OCCUPATIONAL CATEGORY CHANGES: NORTHERN ALBERTA REGION
New Jobs % Change Occupational Category 2001-2005
% Of Total 2001-2005
Total 2,585 1.47% Gross Increases 14,510 100.0% I1 Forestry, mining, oil and gas (excluding labourers) 3,365 23.2% 58.0% B5 Clerical occupations 1,700 11.7% 14.7% H0 Contractors and supervisors in trades and transportation 1,500 10.3% 73.2% H4 Mechanics 1,480 10.2% 23.8% G0 Sales and service supervisors 1,195 8.2% 107.2% E2 Paralegals, social services, education and religion n.e.c. 735 5.1% 24.2% D3 Assisting occupations in support of health services 605 4.2% 35.9% J3 Labourers in processing, manufacturing and utilities 560 3.9% 101.8% B1 Finance and insurance administration occupations 505 3.5% 17.9% D1 Nurse supervisors and registered nurses 500 3.4% 26.9% Sub-total Top 10 12,145 83.7% H1 Construction trades 440 3.0% 8.1% H7 Transportation equipment operators 355 2.4% 3.8% G4 Chefs and cooks 350 2.4% 13.1% H3 Machinists, metal forming, shaping and erecting 250 1.7% 8.0% A3 Other managers, n.e.c. 200 1.4% 3.5% G3 Cashiers 170 1.2% 5.3% A1 Specialist managers 140 1.0% 6.5% D0 Professional occupations in health 130 0.9% 12.1% H2 Stationary engineers, power station operators 125 0.9% 4.3% H5 Other trades, n.e.c. 110 0.8% 8.0% B4 Clerical supervisors 35 0.2% 6.4% A2 Managers in retail trade, food and accommodation 25 0.2% 0.5% B0 Professional occupations in business and finance 20 0.1% 1.1% J2 Assemblers in manufacturing 15 0.1% 3.4% G7 Occupations in travel and accommodation and sport -20 -1.7% H6 Heavy equipment and crane operators, including drillers -25 -0.4% F1 Technical art, culture, recreation and sport -25 -1.8% F0 Professional occupations in art and culture -25 -3.4% D2 Technical and related occupations in health -30 -1.8% E0 Psychologists, social workers, ministers, policy officers -40 -1.8% A0 Senior management occupations -50 -3.4% G5 Occupations in food and beverage service -90 -3.0% H8 Helpers, construction and transportation labourers -135 -3.3% C0 Professional in natural and applied sciences -155 -5.0% G1 Wholesale, technical, insurance, real estate sales -160 -7.7% J1 Machine operators in manufacturing -210 -4.7% G2 Retail salespersons and sales clerks -220 -4.5% B3 Administrative and regulatory occupations -235 -9.2% J0 Supervisors in manufacturing -255 -35.2% C1 Technical related to natural and applied sciences -260 -5.7% I2 Primary production labourers -390 -11.5% G9 Sales and service occupations, n.e.c. -590 -4.3% G8 Child care and home support workers -695 -19.5% B2 Secretaries -780 -20.3% G6 Occupations in protective services -850 -28.5% E1 Teachers and professors -1,365 -22.8% I0 Occupations unique to agriculture (excluding labourers) -5,315 -31.3% Sub-total Bottom 10 -10,735

Research to Evaluate the Shortage of Skilled Workers in Northern Alberta Chapter 3 –Shorter Term Skills Shortages and Other Workforce Characteristics
Prepared for The Northern Labour Market Information Clearinghouse Project By Steven K. Lakey, MBA, CMC Page
43
TABLE 3.2.1 2001-2005 OCCUPATIONAL CATEGORY CHANGES - WOOD BUFFALO – COLD LAKE
Occupational Category New Jobs 2001-2005 % Of Total % Growth
2001-2005 Total 4,095 7.2% Gross Increases 6,630 100.0% I1 Forestry, mining, oil and gas (excluding labourers) 1,730 26.1% 120.10% I0 Occupations unique to agriculture, excluding labourers 1,325 20.0% 41.60% G9 Sales and service occupations, n.e.c. 525 7.9% 11.90% H1 Construction trades 475 7.2% 22.60% H4 Mechanics 385 5.8% 17.90% A2 Managers in retail trade, food and accommodation 290 4.4% 18.50% H3 Machinists, metal forming, shaping and erecting 255 3.8% 19.40% H6 Heavy equipment and crane operators, including drillers 235 3.5% 10.30% G3 Cashiers 205 3.1% 19.40% H7 Transportation equipment operators 195 2.9% 7.50% Sub -total Top 10 5,620 84.7% H2 Stationary engineers, power station operators 160 2.4% 13.40% H0 Contractors and supervisors in trades and transportation 155 2.3% 21.40% G4 Chefs and cooks 145 2.2% 17.80% J1 Machine operators in manufacturing 125 1.9% 10.50% G1 Wholesale, technical, insurance, real estate sales 105 1.6% 24.70% G5 Occupations in food and beverage service 65 1.0% 6.00% G0 Sales and service supervisors 50 0.8% 11.60% H5 Other trades, n.e.c. 50 0.8% 13.20% A1 Specialist managers 45 0.7% 5.20% B1 Finance and insurance administration occupations 40 0.6% 7.40% J2 Assemblers in manufacturing 25 0.4% 23.80% A3 Other managers, n.e.c. 20 0.3% 1.10% G7 Occupations in travel and accommodation and sport 15 0.2% 4.00% D0 Professional occupations in health 5 0.1% 1.30% F0 Professional occupations in art and culture 5 0.1% 2.70% B4 Clerical supervisors - 0 0.00% J0 Supervisors in manufacturing -5 -2.70% D1 Nurse supervisors and registered nurses -10 -1.70% D3 Assisting occupations in support of health services -10 -1.60% F1 Technical art, culture, recreation and sport -10 -2.20% E1 Teachers and professors -15 -0.70% B0 Professional occupations in business and finance -25 -3.60% B3 Administrative and regulatory occupations -25 -3.00% J3 Labourers in processing, manufacturing and utilities -25 -10.20% D2 Technical and related occupations in health -50 -10.00% H8 Helpers, construction and transportation labourers -65 -4.70% I2 Primary production labourers -65 -5.80% E2 Paralegals, social services, education and religion n.e.c. -70 -7.20% A0 Senior management occupations -80 -15.70% B5 Clerical occupations -105 -2.80% E0 Psychologists, social workers, ministers, policy officers -130 -17.80% C0 Professional in natural and applied sciences -140 -10.10% C1 Technical related to natural and applied sciences -160 -8.80% B2 Secretaries -185 -15.10% G8 Child care and home support workers -190 -15.80% G2 Retail salespersons and sales clerks -300 -18.90% G6 Occupations in protective services -870 -44.80% Sub-total Bottom 10 (2,230)

Research to Evaluate the Shortage of Skilled Workers in Northern Alberta Chapter 3 –Shorter Term Skills Shortages and Other Workforce Characteristics
Prepared for The Northern Labour Market Information Clearinghouse Project By Steven K. Lakey, MBA, CMC Page
44
TABLE 3.2.1 2001-2005 OCCUPATIONAL CATEGORY CHANGES: ATHABASCA – GRANDE PRAIRIE
Occupational Category New Jobs
2001-2005 % Of Total % Change 2001-2005
Net Change (1,510) (1.3%) Gross Increases 11,145 100.0% B5 Clerical occupations 1,805 16.2% 22.95% I1 Forestry, mining, oil and gas (excluding labourers) 1,635 14.7% 37.46% H0 Contractors and supervisors in trades and transportation 1,345 12.1% 101.51% G0 Sales and service supervisors 1,145 10.3% 167.15% H4 Mechanics 1,095 9.8% 27.00% E2 Paralegals, social services, education and religion n.e.c. 805 7.2% 38.98% D3 Assisting occupations in support of health services 615 5.5% 58.85% J3 Labourers in processing, manufacturing and utilities 585 5.2% 191.80% D1 Nurse supervisors and registered nurses 510 4.6% 40.48% B1 Finance and insurance administration occupations 465 4.2% 20.44% Sub-total Top 10 10,005 90% G4 Chefs and cooks 205 1.8% 11.05% A3 Other managers, n.e.c. 180 1.6% 4.62% H7 Transportation equipment operators 160 1.4% 2.42% D0 Professional occupations in health 125 1.1% 18.52% A1 Specialist managers 95 0.9% 7.34% E0 Psychologists, social workers, ministers, policy officers 90 0.8% 6.16% G2 Retail salespersons and sales clerks 80 0.7% 2.44% H5 Other trades, n.e.c. 60 0.5% 6.00% B0 Professional occupations in business and finance 45 0.4% 3.73% B4 Clerical supervisors 35 0.3% 9.59% A0 Senior management occupations 30 0.3% 3.19% D2 Technical and related occupations in health 20 0.2% 1.68% G6 Occupations in protective services 20 0.2% 1.92% H3 Machinists, metal forming, shaping and erecting -5 -0.28% J2 Assemblers in manufacturing -10 -3.03% C0 Professional in natural and applied sciences -15 -0.86% F1 Technical art, culture, recreation and sport -15 -1.64% F0 Professional occupations in art and culture -30 -5.56% G3 Cashiers -35 -1.64% G7 Occupations in travel and accommodation and sport -35 -4.46% H1 Construction trades -35 -1.04% H2 Stationary engineers, power station operators -35 -2.04% H8 Helpers, construction and transportation labourers -70 -2.56% C1 Technical related to natural and applied sciences -100 -3.60% G5 Occupations in food and beverage service -155 -8.05% B3 Administrative and regulatory occupations -210 -12.14% J0 Supervisors in manufacturing -250 -46.30% H6 Heavy equipment and crane operators, including drillers -260 -7.76% A2 Managers in retail trade, food and accommodation -265 -7.11% G1 Wholesale, technical, insurance, real estate sales -265 -16.01% I2 Primary production labourers -325 -14.29% J1 Machine operators in manufacturing -335 -10.20% G8 Child care and home support workers -505 -21.44% B2 Secretaries -595 -22.67% G9 Sales and service occupations, n.e.c. -1,115 -12.11% E1 Teachers and professors -1,350 -34.35% I0 Occupations unique to agriculture, excluding labourers -6,640 -48.15% Sub-total Bottom 10 (11,655)

Research to Evaluate the Shortage of Skilled Workers in Northern Alberta Chapter 3 –Shorter Term Skills Shortages and Other Workforce Characteristics
Prepared for The Northern Labour Market Information Clearinghouse Project By Steven K. Lakey, MBA, CMC Page
45
III. Changes Forecast for the Period 2005 to 2010
The changes in occupational categories / requirements that are forecast for the period 2005 to 2010 are discussed and analyzed in this Section. The underlying data are based upon the models used by AHRE. Key Findings 1. Changes At The Major Category Level
Similar to Section II, this analysis and discussion are associated with changes in the composition of the 10 Major Groups for occupations forecast for the period 2005 to 2010. Labour force requirement according to Occupational Categories, and their percentage of total compositions and growth rates are highlighted. a. Northern Alberta Region
Gross occupational requirements are expected to increase by 18,650 and accounting for losses in Major Group “I” – Primary Industry, the net increase is forecast to be 18,490. The major category with the largest increase in occupations is “H” - Trades, transport and equipment operators (5,320 or 29% of the total). The Major Category experiencing the most rapid rate of growth is “G” Sales and Service occupations (13.8% increase or 5,150 positions and representing 27.6% of the overall increase in occupations). On balance, category “I”, Occupations Unique to Primary Industry is the sole category expected to experience a decline, although at 160 jobs, it is relatively minor.
b. Wood Buffalo – Cold Lake Sub-region
Gross occupational requirements are expected to increase by 9,680 and accounting for losses of 90 in Major Group “I” – Primary Industry, the net increase is forecast to be 9,590. The major category with the largest increase in occupations is “H” - Trades, transport and equipment operators (3,440 or 35% of the total). The Major Category experiencing the most rapid rate of growth is also “H” at 21.5%.
c. Athabasca – Grande Prairie Sub-region
Gross occupational requirements are expected to increase by 8,970 and accounting for losses of 70 in Major Group “I” – Primary Industry, the net increase is forecast to be 8,900. The major category with the largest increase in occupations is “G” Sales and Service (2,740 or 30.5% of the total). The Major Category experiencing the most rapid rate of growth is also “G” at 11.3%.
At the Major Category Level, the following table provides a summary of changes in occupations forecast for the period 2005 to 2010. For Northern Alberta as a whole and

Research to Evaluate the Shortage of Skilled Workers in Northern Alberta Chapter 3 –Shorter Term Skills Shortages and Other Workforce Characteristics
Prepared for The Northern Labour Market Information Clearinghouse Project By Steven K. Lakey, MBA, CMC Page
46
for each Sub-region, it shows the number and type of new jobs, their percentage of the total number of new jobs, the rate of change forecast for the Major Category, and the number of jobs forecast for 2010.
CHANGES IN OCCUPATIONS BETWEEN 2005 AND 2010 NORTHERN ALBERTA REGION
Northern Total New Jobs % of Total % Change Jobs in 2010% of Jobs
in 2010 All Occupations 18,490 10.40% 196,930 100.0% Gross Increase 18,650 100.00% H Trades, transport and equipment operators 5,320 28.53% 12.00% 49,520 25.1% G Sales and service occupations 5,150 27.61% 13.80% 42,470 21.6% B Business, finance and administration occupations 2,800 15.01% 11.40% 27,260 13.8% A Management occupations 1,790 9.60% 12.00% 16,730 8.5% E Social science, education, government and religion 1,160 6.22% 11.00% 11,700 5.9% D Health occupations 910 4.88% 12.10% 8,420 4.3% C Natural and applied sciences and related occupations 700 3.75% 9.60% 8,010 4.1% J Unique to processing, manufacturing and utilities 630 3.38% 10.00% 6,920 3.5% F Occupations in art, culture, recreation and sport 190 1.02% 9.30% 2,230 1.1% I Occupations unique to primary industry -160 -0.86% -0.70% 23,670 12.0%
Category New Jobs % of Total % Change Jobs in 2010% of Jobs
in 2010 Total All Occupations 9,590 15.80% 70,240 100.0% Gross Increase 9,680 100.00% H Trades, transport and equipment operators 3,440 35.54% 21.50% 19,420 27.6% G Sales and service occupations 2,410 24.90% 18.50% 15,470 22.0% B Business, finance and administration occupations 1,340 13.84% 19.60% 8,190 11.7% A Management occupations 910 9.40% 18.10% 5,950 8.5% C Natural and applied sciences and related occupations 460 4.75% 15.80% 3,370 4.8% E Social science, education, government and religion 450 4.65% 12.70% 3,990 5.7% D Health occupations 330 3.41% 15.90% 2,400 3.4% J Unique to processing, manufacturing and utilities 270 2.79% 14.70% 2,110 3.0% F Occupations in art, culture, recreation and sport 70 0.72% 11.10% 700 1.0% I Occupations unique to primary industry -90 -0.93% -1.00% 8,640 12.3%
Category New Jobs % of Total % Change Jobs in 2010% of Jobs
in 2010 Total All Occupations 8,900 7.60% 126,690 100.0% Gross Increase 8,970 100.00% G Sales and service occupations 2,740 30.55% 11.30% 27,000 21.3% H Trades, transport and equipment operators 1,880 20.96% 6.70% 30,100 23.8% B Business, finance and administration occupations 1,460 16.28% 8.30% 19,070 15.1% A Management occupations 880 9.81% 8.90% 10780 8.5% E Social science, education, government and religion 710 7.92% 10.10% 7,710 6.1% D Health occupations 580 6.47% 10.70% 6,020 4.8% J Unique to processing, manufacturing and utilities 360 4.01% 8.10% 4810 3.8% C Natural and applied sciences and related occupations 240 2.68% 5.50% 4,640 3.7% F Occupations in art, culture, recreation and sport 120 1.34% 8.50% 1,530 1.2% I Occupations unique to primary industry -70 -0.78% -0.50% 15,030 11.9%

Research to Evaluate the Shortage of Skilled Workers in Northern Alberta Chapter 3 –Shorter Term Skills Shortages and Other Workforce Characteristics
Prepared for The Northern Labour Market Information Clearinghouse Project By Steven K. Lakey, MBA, CMC Page
47
2. Changes at the Occupational Category Level The discussion and analysis in this part is from two perspectives. The first is the 10 Occupational Categories with the largest increase in numbers. The second is the 10 Occupational Categories with the smallest increases or largest declines.
a. Northern Alberta Region
Northern Alberta is forecast to require approximately 18,500 additional workers between 2005 and 2010 for a total of approximately 196,000. This represents an increase of 10.4% over a six-year period. On average, the annual increase is forecast to be approximately 3,000 or 1.7%. By comparison, province wide, the average annual increase in jobs is forecast to be 1.6%. The top 10 occupations are expected to account for 53% or approximately 9,000 of the net increase. The only Occupational Categories for which decreases are forecast are in jobs related to agriculture (680) and supervisors in manufacturing (10). The three Occupational Categories with the largest increase in numbers were: Sales and Service (1,750 and reflecting 9.5% of the total increase and an increase of 13.4% for the category); Clerical (1,530 and reflecting 8.3% of the total increase and an increase of 11.5% for the category); and Transport Equipment Operators (1,450 and reflecting 7.8% of the total increase and an increase of 15.3% for the category). The bottom 10 Occupational Categories still accounted for a net increase of 180. The following table presents the 10 occupational categories with the fastest rate of growth between 2005 and 2010.
Fastest Rate of Growth % Change New Jobs % of Total 2010G2 Retail salespersons and sales clerks 20.60% 960 5.20% 5,610
G3 Cashiers 17.90% 600 3.20% 3,960
G1 Wholesale, technical, insurance, real estate sales 17.70% 340 1.80% 2,260
A2 Managers in retail trade, food and accommodation 15.80% 840 4.50% 6,160
J3 Labourers in processing, manufacturing and utilities 15.30% 170 0.90% 1,280
H7 Transportation equipment operators 15.10% 1,450 7.80% 11,030
H8 Helpers, construction and transportation labourers 14.60% 580 3.10% 4,550
D2 Technical and related occupations in health 14.50% 240 1.30% 1,900
B2 Secretaries 14.00% 430 2.30% 3,500
G8 Child care and home support workers 14.00% 400 2.20% 3,260
Table 3.3 provides full details of the changes forecast for Northern Alberta between 2005 and 2010.

Research to Evaluate the Shortage of Skilled Workers in Northern Alberta Chapter 3 –Shorter Term Skills Shortages and Other Workforce Characteristics
Prepared for The Northern Labour Market Information Clearinghouse Project By Steven K. Lakey, MBA, CMC Page
48
b. Wood Buffalo – Cold Lake Sub-region The Wood Buffalo – Cold Lake Sub-region is forecast to require approximately 9,590 additional workers between 2005 and 2010 for a total of approximately 70,240. This represents an increase of 16.8% over a six-year period. On average, the annual increase is forecast to be approximately 1,600 or 2.8%. By comparison, province wide, the average annual increase in jobs is forecast to be 1.6%. The top 10 occupations are expected to account for 54% or approximately 5,200 of the net increase. The only Occupational Category for which decreases are forecast is in jobs related to agriculture (380). The three Occupational Categories with the largest increase in numbers were: Sales and Service (830 and reflecting 8.4% of the total increase and an increase of 25.4% for the category); Transportation and Equipment Operators (710 and reflecting 7.4% of the total increase and an increase of 11.5% for the category); and Clerical (700 and reflecting 7.3% of the total increase and an increase of 19.5% for the category). The bottom 10 Occupational Categories still accounted for a net increase of 30. The bottom 10 Occupational Categories accounted for a net increase of 180. The following table presents the 10 occupational categories with the fastest rate of growth between 2005 and 2010.
Fastest Rate of Growth % Change New Jobs % of Total 2010H8 Helpers, construction and transportation labourers 31.30% 410 4.30% 1,720G2 Retail salespersons and sales clerks 29.50% 380 4.00% 1,670J3 Labourers in processing, manufacturing and utilities 27.30% 60 0.60% 280H1 Construction trades 27.10% 700 7.30% 3,280H7 Transportation equipment operators 25.40% 710 7.40% 3,510H0 Contractors and supervisors in trades and transportation 25.00% 220 2.30% 1,100G1 Wholesale, technical, insurance, real estate sales 22.60% 120 1.30% 650B2 Secretaries 22.10% 230 2.40% 1,270H5 Other trades, n.e.c. 20.90% 90 0.90% 520G0 Sales and service supervisors 20.80% 100 1.00% 580
Table 3.3.1provides full details of the changes forecast for the Wood Buffalo – Cold Lake Sub-region between 2005 and 2010.
c. Athabasca – Grande Prairie Sub-region
The Athabasca – Grande Prairie Sub-region is forecast to require approximately 8,900 additional workers between 2005 and 2010 for a total of approximately 126,000. This represents an increase of 7.6% over a six-year period. On average, the annual increase is forecast to be approximately 1,500 or 1.2%. By comparison, province wide, the average annual increase in jobs is forecast to be 1.6%. The top 10 occupations are expected to account for 58% or approximately

Research to Evaluate the Shortage of Skilled Workers in Northern Alberta Chapter 3 –Shorter Term Skills Shortages and Other Workforce Characteristics
Prepared for The Northern Labour Market Information Clearinghouse Project By Steven K. Lakey, MBA, CMC Page
49
5,200 of the net increase. The only Occupational Categories for which decreases are forecast is in jobs related to agriculture (300) and Supervisors in Manufacturing (40). The three Occupational Categories with the largest increase in numbers were: Sales and Service (920 and reflecting 10.3% of the total increase and an increase of 11.4% for the category); Clerical (830 and reflecting 9.3% of the total increase and an increase of 8.6% for the category); and Transportation and Equipment Operators (740 and reflecting 8.3% of the total increase and an increase of 10.9% for the category); and The bottom 10 Occupational Categories still accounted for a net increase of 100. The following table presents the 10 occupational categories with the fastest rate of growth between 2005 and 2010.
Fastest Rate of Growth % Change New Jobs % of Total 2010G2 Retail salespersons and sales clerks 17.30% 580 6.50% 3,960
G3 Cashiers 16.70% 350 3.90% 2,450
G1 Wholesale, technical, insurance, real estate sales 15.80% 220 2.50% 1,610
A2 Managers in retail trade, food and accommodation 14.50% 500 5.60% 3,940
D2 Technical and related occupations in health 14.00% 170 1.90% 1,380
G8 Child care and home support workers 13.50% 250 2.80% 2,100
E1 Teachers and professors 12.80% 330 3.70% 2,910
J3 Labourers in processing, manufacturing and utilities 12.40% 110 1.20% 1,000
G9 Sales and service occupations, n.e.c. 11.40% 920 10.30% 9,010
H7 Transportation equipment operators 10.90% 740 8.30% 7,520
Table 3.3.2 provides full details of the changes forecast for the Athabasca – Grande Prairie Sub-region between 2005 and 2010.

Research to Evaluate the Shortage of Skilled Workers in Northern Alberta Chapter 3 –Shorter Term Skills Shortages and Other Workforce Characteristics
Prepared for The Northern Labour Market Information Clearinghouse Project By Steven K. Lakey, MBA, CMC Page
50
TABLE 3.3 2005-2010 OCCUPATIONAL CATEGORY CHANGES: NORTHERN ALBERTA REGION
Occupational Category New Jobs 2005 to 2010
Percentage of Total % Change Jobs in
2010 Totals 18,490 100.0% 10.4% 196,930G9 Sales and service occupations, n.e.c. 1,750 9.5% 13.4% 14,770B5 Clerical occupations 1,530 8.3% 11.5% 14,790H7 Transportation equipment operators 1,450 7.8% 15.1% 11,030G2 Retail salespersons and sales clerks 960 5.2% 20.6% 5,610A2 Managers in retail trade, food and accommodation 840 4.5% 15.8% 6,160H1 Construction trades 800 4.3% 13.6% 6,700H4 Mechanics 730 3.9% 9.5% 8,420G3 Cashiers 600 3.2% 17.9% 3,960H8 Helpers, construction and transportation labourers 580 3.1% 14.6% 4,550H6 Heavy equipment and crane operators, including drillers 570 3.1% 10.2% 6,180Sub-total Top 10 9,810 53.1% 82,170E1 Teachers and professors 560 3.0% 12.1% 5,180A3 Other managers, n.e.c. 490 2.7% 8.3% 6,410C1 Technical related to natural and applied sciences 440 2.4% 10.1% 4,780B2 Secretaries 430 2.3% 14.0% 3,500J1 Machine operators in manufacturing 420 2.3% 9.9% 4,680E2 Paralegals, social services, education and religion n.e.c. 410 2.2% 10.9% 4,180G8 Child care and home support workers 400 2.2% 14.0% 3,260H2 Stationary engineers, power station operators 370 2.0% 12.2% 3,400H3 Machinists, metal forming, shaping and erecting 350 1.9% 10.4% 3,730G1 Wholesale, technical, insurance, real estate sales 340 1.8% 17.7% 2,260A1 Specialist managers 310 1.7% 13.5% 2,610B3 Administrative and regulatory occupations 310 1.7% 13.4% 2,630G5 Occupations in food and beverage service 310 1.7% 10.7% 3,220H0 Contractors and supervisors in trades and transportation 290 1.6% 8.2% 3,840D1 Nurse supervisors and registered nurses 280 1.5% 11.9% 2,640B1 Finance and insurance administration occupations 270 1.5% 8.1% 3,590D3 Assisting occupations in support of health services 270 1.5% 11.8% 2,560 I1 Forestry, mining, oil and gas (excluding labourers) 270 1.5% 2.9% 9,440C0 Professional in natural and applied sciences 260 1.4% 8.8% 3,230G4 Chefs and cooks 260 1.4% 8.6% 3,280 I2 Primary production labourers 250 1.4% 8.3% 3,250D2 Technical and related occupations in health 240 1.3% 14.5% 1,900G6 Occupations in protective services 230 1.2% 10.8% 2,360B0 Professional occupations in business and finance 190 1.0% 9.9% 2,100E0 Psychologists, social workers, ministers, policy officers 190 1.0% 8.8% 2,340G0 Sales and service supervisors 180 1.0% 7.8% 2,490H5 Other trades, n.e.c. 180 1.0% 12.1% 1,670J3 Labourers in processing, manufacturing and utilities 170 0.9% 15.3% 1,280A0 Senior management occupations 150 0.8% 10.7% 1,550D0 Professional occupations in health 120 0.6% 10.0% 1,320F1 Technical art, culture, recreation and sport 120 0.6% 9.0% 1,460G7 Occupations in travel and accommodation and sport 120 0.6% 10.5% 1,260B4 Clerical supervisors 70 0.4% 12.1% 650F0 Professional occupations in art and culture 70 0.4% 10.0% 770J2 Assemblers in manufacturing 50 0.3% 11.1% 500J0 Supervisors in manufacturing (10) -0.1% -2.1% 460 I0 Occupations unique to agriculture (excluding labourers) (680) -3.7% -5.8% 10,980Sub-total Bottom 10 180 1.0% 20,230

Research to Evaluate the Shortage of Skilled Workers in Northern Alberta Chapter 3 –Shorter Term Skills Shortages and Other Workforce Characteristics
Prepared for The Northern Labour Market Information Clearinghouse Project By Steven K. Lakey, MBA, CMC Page
51
TABLE 3.3.1 2005-2010 OCCUPATIONAL CATEGORY CHANGES: WOOD BUFFALO – COLD LAKE
Occupational Category New Jobs
2005 to 2010Percentage
of Total % Change Jobs in 2010
Total 9,590 100.0% 15.8% 70,240G9 Sales and service occupations, n.e.c. 830 8.7% 16.80% 5,760H7 Transportation equipment operators 710 7.4% 25.40% 3,510B5 Clerical occupations 700 7.3% 19.50% 4,290H1 Construction trades 700 7.3% 27.10% 3,280H6 Heavy equipment and crane operators, including drillers 460 4.8% 18.30% 2,980H8 Helpers, construction and transportation labourers 410 4.3% 31.30% 1,720G2 Retail salespersons and sales clerks 380 4.0% 29.50% 1,670A2 Managers in retail trade, food and accommodation 340 3.5% 18.30% 2,200H4 Mechanics 340 3.5% 13.40% 2,880A3 Other managers, n.e.c. 330 3.4% 17.90% 2,170Sub-total Top 10 5,200 54.2% 30,460 C1 Technical related to natural and applied sciences 280 2.9% 16.90% 1,940H2 Stationary engineers, power station operators 280 2.9% 20.70% 1,630G3 Cashiers 250 2.6% 19.80% 1,510B2 Secretaries 230 2.4% 22.10% 1,270E1 Teachers and professors 230 2.4% 11.30% 2,270H3 Machinists, metal forming, shaping and erecting 230 2.4% 14.60% 1,800H0 Contractors and supervisors in trades and transportation 220 2.3% 25.00% 1,100G5 Occupations in food and beverage service 210 2.2% 18.40% 1,350C0 Professional in natural and applied sciences 180 1.9% 14.40% 1,430 A1 Specialist managers 170 1.8% 18.70% 1,080G6 Occupations in protective services 160 1.7% 15.00% 1,230 I2 Primary production labourers 160 1.7% 15.20% 1,210J1 Machine operators in manufacturing 160 1.7% 12.20% 1,470B3 Administrative and regulatory occupations 150 1.6% 18.80% 950G4 Chefs and cooks 150 1.6% 15.60% 1,110G8 Child care and home support workers 150 1.6% 14.90% 1,160E2 Paralegals, social services, education and religion n.e.c. 130 1.4% 14.40% 1,030 I1 Forestry, mining, oil and gas (excluding labourers) 130 1.4% 4.10% 3,300B1 Finance and insurance administration occupations 120 1.3% 20.70% 700G1 Wholesale, technical, insurance, real estate sales 120 1.3% 22.60% 650B0 Professional occupations in business and finance 110 1.1% 16.70% 770D3 Assisting occupations in support of health services 100 1.0% 15.90% 730G0 Sales and service supervisors 100 1.0% 20.80% 580D1 Nurse supervisors and registered nurses 90 0.9% 15.30% 680E0 Psychologists, social workers, ministers, policy officers 90 0.9% 15.00% 690H5 Other trades, n.e.c. 90 0.9% 20.90% 520A0 Senior management occupations 70 0.7% 16.30% 500D0 Professional occupations in health 70 0.7% 17.50% 470D2 Technical and related occupations in health 70 0.7% 15.60% 520G7 Occupations in travel and accommodation and sport 60 0.6% 15.40% 450J3 Labourers in processing, manufacturing and utilities 60 0.6% 27.30% 280F1 Technical art, culture, recreation and sport 50 0.5% 11.40% 490B4 Clerical supervisors 30 0.3% 16.70% 210J0 Supervisors in manufacturing 30 0.3% 16.70% 210F0 Professional occupations in art and culture 20 0.2% 10.50% 210J2 Assemblers in manufacturing 20 0.2% 15.40% 150 I0 Occupations unique to agriculture, excluding labourers -380 -4.0% -8.40% 4,130Sub-total Bottom 10 30 0.3% 7,120

Research to Evaluate the Shortage of Skilled Workers in Northern Alberta Chapter 3 –Shorter Term Skills Shortages and Other Workforce Characteristics
Prepared for The Northern Labour Market Information Clearinghouse Project By Steven K. Lakey, MBA, CMC Page
52
TABLE 3.3.2 2005-2010 OCCUPATIONAL CATEGORY CHANGES: ATHABASCA – GRANDE PRAIRIE SUB-REGION
Occupational Category New Jobs
2005-2010 % Of Total % Change 2005-2010
Jobs in 2010
Total 8,900 100.0% 7.6% 126,690G9 Sales and service occupations, n.e.c. 920 10.3% 11.40% 9,010B5 Clerical occupations 830 9.3% 8.60% 10,500H7 Transportation equipment operators 740 8.3% 10.90% 7,520G2 Retail salespersons and sales clerks 580 6.5% 17.3% 3,960A2 Managers in retail trade, food and accommodation 500 5.6% 14.5% 3,940H4 Mechanics 390 4.4% 7.60% 5,540G3 Cashiers 350 3.9% 16.70% 2,450E1 Teachers and professors 330 3.7% 12.80% 2,910E2 Paralegals, social services, education and religion n.e.c. 280 3.1% 9.80% 3,150J1 Machine operators in manufacturing 260 2.9% 8.80% 3,210Sub-total Top 10 5,180 58.0% 52,190G8 Child care and home support workers 250 2.8% 13.50% 2,100G1 Wholesale, technical, insurance, real estate sales 220 2.5% 15.80% 1,610B2 Secretaries 200 2.2% 9.90% 2,230D1 Nurse supervisors and registered nurses 190 2.1% 10.70% 1,960D2 Technical and related occupations in health 170 1.9% 14.00% 1,380D3 Assisting occupations in support of health services 170 1.9% 10.20% 1,830H8 Helpers, construction and transportation labourers 170 1.9% 6.40% 2,830A3 Other managers, n.e.c. 160 1.8% 3.90% 4,240B3 Administrative and regulatory occupations 160 1.8% 10.50% 1,680C1 Technical related to natural and applied sciences 160 1.8% 6.00% 2,840B1 Finance and insurance administration occupations 150 1.7% 5.50% 2,890 A1 Specialist managers 140 1.6% 10.10% 1,530 I1 Forestry, mining, oil and gas (excluding labourers) 140 1.6% 2.30% 6,140H3 Machinists, metal forming, shaping and erecting 120 1.3% 6.60% 1,930G4 Chefs and cooks 110 1.2% 5.30% 2,170H6 Heavy equipment and crane operators, including drillers 110 1.2% 3.60% 3,200J3 Labourers in processing, manufacturing and utilities 110 1.2% 12.40% 1,000E0 Psychologists, social workers, ministers, policy officers 100 1.1% 6.50% 1,650G5 Occupations in food and beverage service 100 1.1% 5.60% 1,870H1 Construction trades 100 1.1% 3.00% 3,420H2 Stationary engineers, power station operators 90 1.0% 5.40% 1,770H5 Other trades, n.e.c. 90 1.0% 8.50% 1,150 I2 Primary production labourers 90 1.0% 4.60% 2,040A0 Senior management occupations 80 0.9% 8.20% 1,050B0 Professional occupations in business and finance 80 0.9% 6.40% 1,330C0 Professional in natural and applied sciences 80 0.9% 4.70% 1,800G0 Sales and service supervisors 80 0.9% 4.40% 1,910F1 Technical art, culture, recreation and sport 70 0.8% 7.80% 970G6 Occupations in protective services 70 0.8% 6.60% 1,130H0 Contractors and supervisors in trades and transportation 70 0.8% 2.60% 2,740G7 Occupations in travel and accommodation and sport 60 0.7% 8.00% 810D0 Professional occupations in health 50 0.6% 6.30% 850F0 Professional occupations in art and culture 50 0.6% 9.80% 560B4 Clerical supervisors 40 0.4% 10.00% 440J2 Assemblers in manufacturing 30 0.3% 9.40% 350J0 Supervisors in manufacturing -40 -0.4% -13.80% 250 I0 Occupations unique to agriculture, excluding labourers -300 -3.4% -4.20% 6,850Sub-total Bottom 10 100 1.1% 14,950

Research to Evaluate the Shortage of Skilled Workers in Northern Alberta Chapter 3 –Shorter Term Skills Shortages and Other Workforce Characteristics
Prepared for The Northern Labour Market Information Clearinghouse Project By Steven K. Lakey, MBA, CMC Page
53
IV. Special Note on Construction Trades According to the “Alberta Construction Workforce Supply/Demand Forecast for 2005 to 2009”3, published in May 2005:
• The current engineering and construction cycle is driven largely by oilsands projects in the Fort McMurray area, related projects in other areas of the province and government infrastructure investment.
• The 2005 to 2009 construction cycle is expected to be similar to that of 1998 to 2003 but
with a higher peak than that experienced in 2001. There is a sharp increase in demand for trades over the next three years, with employment exceeding 180,000, followed by an easing of demand in 2008 and a decline after 2009. Supply will not be able to keep pace with demand until after 2009. There is likely to be significant difficulty in finding pipe fitters, industrial electricians, boilermakers, ironworkers and crane operators.
• The following table summarizes the forecast total demand for certain trades associated
with major construction projects (those with a value of more than $50 million) over the period 2005 to 2009.
DEMAND FOR TRADES – MAJOR ALBERTA PROJECTS 2005 TO 2009
Trade 2005 2006 2007 2008 2009 Cumulative Boilermakers 530 490 630 320 180 2,150 Bricklayers 230 190 240 70 40 770 Carpenters 1,180 1,250 1,410 2,000 620 6,460 Electricians 1,600 2,030 2,330 2,570 1,070 9,600 Insulators 940 1,050 1,440 1,150 580 5,160 Ironworkers 1,400 1,770 1,780 1,760 620 7,330 Labourers 1,600 1,620 1,950 2,650 640 8,460 Millwrights 500 430 430 290 100 1,750 Operating Engineers 1,450 1,610 1,940 2,090 780 7,870 Plumbers / Pipe Fitters 2,700 3,460 3,820 3,950 1,780 15,710 Sheet Metal Workers 990 1,120 1,380 1,540 420 5,450 Welders 850 860 940 1,080 430 4,160 Other Occupations 4,670 4,580 4,520 4,580 1,560 19,910 Total 18,640 20,460 22,810 24,050 8,820 94,780
Reports prepared by The Construction Sector Council 4 and the Construction Owners of Alberta 5 have also included an analysis of the supply and demand for construction trades, through to 2013. The table below has been developed using data from the two organizations. It provides an indication of the supply/demand outlook for 15 key trades in Alberta. A five-point rating system has been developed to provide an indication of the supply and demand situation: 3 Alberta Construction Workforce Supply/ Demand Forecast for 2005-2009 ,May 2005 4 Construction Looking Forward: Labour Requirements for Alberta for 2005 to 2013, Revised July 2005 5 Alberta Construction Workforce Supply/ Demand Forecast for 2005-2009, May 2005

Research to Evaluate the Shortage of Skilled Workers in Northern Alberta Chapter 3 –Shorter Term Skills Shortages and Other Workforce Characteristics
Prepared for The Northern Labour Market Information Clearinghouse Project By Steven K. Lakey, MBA, CMC Page
54
• “1” – Workers meeting employer requirements are available in local markets to meet an increase in demand at the current rate of compensation and working conditions.
• “2” – Workers meeting employer qualifications are available in local or adjacent markets to met an increase in demand at the current offered rate and other working conditions.
• “3” – The availability of workers meeting employer qualifications in the local market may be limited by large projects, plant shut downs or other short-term increases in demand. However, similar or weaker conditions exist in other markets so that mobility is an option.
• “4” – Workers meeting employer qualifications are generally not available in local and adjacent markets to meet any increase. Employers may need to compete to attract workers. Recruiting and mobility may extend beyond traditional sources and practices.
• “5” – Needed workers meeting employer qualifications are not available in local or adjacent markets to meet demand so that products or production may be delayed. Competition is intense and recruiting reaches to remote markets.
Due to the heavy concentration of work in Northern Alberta, the indicators are likely of interest, and provide another perspective for this project. Shortages will be particularly for some trades in a number of years. These instances are highlighted in yellow in the table, below.
2005 TO 2013 SUPPLY/DEMAND OUTLOOK FOR 15 KEY CONSTRUCTION TRADES
Trade/Year 2005 2006 2007 2008 2009 2010 2011 2012 2013Boilermakers 3 4 3 4 1 2 2 3 3 Bricklayers 3 3 3 4 3 3 3 3 4 Carpenters 3 3 3 4 4 3 3 3 3 Millwrights 3 4 4 3 2 3 3 4 4 Helpers and Labourers 2 3 3 3 4 3 3 3 3 Crane Operators 3 4 3 4 3 1 1 2 3 Electricians (Except Industrial and Power Systems) 3 3 3 3 3 2 2 2 3 Heavy Equipment Operators (Except Crane) 3 3 4 4 4 4 3 3 4 Industrial Electricians 2 3 4 3 2 1 1 2 2 Insulators 3 3 3 4 1 1 1 2 2 Ironworkers 3 4 4 3 2 1 1 3 3 Plumbers 3 3 4 3 3 1 1 2 3 Sheet Metal Workers 3 3 3 4 3 1 2 2 3 Steamfitters and Pipe fitters 3 4 4 4 3 2 2 3 3 Welders 3 3 4 3 3 2 2 3 3 "Average" 2.87 3.33 3.47 3.53 2.73 2 2 2.67 3.07
Derived From: “Alberta Construction Workforce Supply/ Demand Forecast for 2005-2009, May 2005” and “Construction Looking Forward: Labour Requirements for Alberta for 2005 to 2013, Revised July 2005”

Research to Evaluate the Shortage of Skilled Workers in Northern Alberta Chapter 3 –Shorter Term Skills Shortages and Other Workforce Characteristics
Prepared for The Northern Labour Market Information Clearinghouse Project By Steven K. Lakey, MBA, CMC Page
55
VI. Comparison of Rate of Growth Forecasts for 2005 to 2010
This Part of Chapter 3 provides a brief overview and comparison of rate of growth forecasts. At the regional and Sub-regional level, it compares the average annual growth rate for the period 2005 to 2010 growth for Major Groups and Occupational Categories tracked by the AHRE model. Key Findings 1. Forecasts at the Major Group Level
As a “yard stick” for this Part, Human Resources and Skills Development Canada is forecasting that the annual average growth rate in employment/skills on a national basis will be 1.5% for the period 2004 to 2008 and 0.9% for the period 2009 to 2013.6 For Alberta, the corresponding annual average growth rate for the period 2005 to 2010 is 1.8%. For all of Northern Alberta the figure for the 2005 to 2010 period is 1.7%; however, there are strong differences between the two Sub-regions in terms of growth rates and the types of skills that will be in demand. In some instances, the rate of growth in the Wood Buffalo – Cold lake Sub-region is more than double the rate of growth for the Athabasca – Grande Prairie Sub-region. Growth is positive for all Major Groups except for “Occupations Unique to Primary Industry” where, on balance, minor declines are forecast due to losses in the Agricultural sector. The following table provides an overview and comparison of annual average growth forecasts for Major Groups.
PROJECTED AVERAGE ANNUAL GROWTH RATES FOR 2005-2010
MAJOR GROUPS
Northern RegionWood Buffalo –
Cold Lake Sub-region
Athabasca – Grande Prairie
Sub-region Total 1.7% 2.6% 1.3% G Sales and service occupations 2.3% 3.1% 1.9% D Health occupations 2.0% 2.7% 1.8% A Management occupations 2.0% 3.0% 1.5% H Trades, transport and equipment operators 2.0% 3.6% 1.1% B Business, finance and administration occupations 1.9% 3.3% 1.4% E Social science, education, government and religion 1.8% 2.1% 1.7% J Unique to processing, manufacturing and utilities 1.7% 2.5% 1.4% C Natural and applied sciences and related occupations 1.6% 2.6% 0.9% F Occupations in art, culture, recreation and sport 1.6% 1.9% 1.4% I Occupations unique to primary industry -0.1% -0.2% -0.1%
2. Occupational Category Forecasts at the Regional and Sub-regional Level
The specific Occupational Category forecasts for the period 2005 to 2010 for the Northern Alberta Region and the Wood Buffalo – Cold Lake and Athabasca-Grande Prairie Sub-regions are discussed and analyzed at greater length in this Part. Throughout, comparisons are made with the corresponding “province-wide” forecasts.
6 Looking Ahead: Ten Year Outlook for the Canadian Labour Market 2004-2013 , October 2004

Research to Evaluate the Shortage of Skilled Workers in Northern Alberta Chapter 3 –Shorter Term Skills Shortages and Other Workforce Characteristics
Prepared for The Northern Labour Market Information Clearinghouse Project By Steven K. Lakey, MBA, CMC Page
56
a. Northern Alberta Region
In declining order, the Occupational Categories having growth forecasts greater than the Province-wide average are summarized in the following table:
NORTHERN ALBERTA REGION
OCCUPATIONAL CATEGORIES WITH ANNUAL AVERAGE GROWTH GREATER THAN THE PROVINCE-WIDE AVERAGE
Occupational Category Average Annual Growth Forecast
Occupational Category
Average Annual Growth
Forecast
G2 Retail salespersons and sales clerks 3.4% H2 Stationary engineers, power station operators
2.0%
G3 Cashiers 3.0% B4 Clerical supervisors 2.0%
G1 Wholesale, technical, insurance, real estate sales 3.0% E1 Teachers and professors 2.0%
A2 Managers in retail trade, food and accommodation 2.6% H5 Other trades, n.e.c. 2.0%
J3 Labourers in processing, manufacturing and utilities 2.6% D1 Nurse supervisors and registered nurses 2.0%
H7 Transportation equipment operators 2.5% D3 Assisting occupations in support of health services
2.0%
H8 Helpers, construction and transportation labourers 2.4% B5 Clerical occupations 1.9%
D2 Technical and related occupations in health 2.4% J2 Assemblers in manufacturing 1.9%
B2 Secretaries 2.3% E2 Paralegals, social services, education and religion n.e.c.
1.8%
G8 Child care and home support workers 2.3% G6 Occupations in protective services 1.8%
H1 Construction trades 2.3% A0 Senior management occupations 1.8%
A1 Specialist managers 2.3% G5 Occupations in food and beverage service 1.8%
B3 Administrative and regulatory occupations 2.2%
G7 Occupations in travel and accommodation and sport
1.8%
G9 Sales and service occupations, n.e.c. 2.2%
In declining order, the Occupational Categories having growth forecasts that are less than the province-wide average are summarized in the following table.

Research to Evaluate the Shortage of Skilled Workers in Northern Alberta Chapter 3 –Shorter Term Skills Shortages and Other Workforce Characteristics
Prepared for The Northern Labour Market Information Clearinghouse Project By Steven K. Lakey, MBA, CMC Page
57
NORTHERN ALBERTA REGION OCCUPATIONAL CATEGORIES WITH ANNUAL AVERAGE GROWTH RATES
LESS THAN THE PROVINCE-WIDE AVERAGE
Occupational Category Average Annual Growth
Forecast Occupational Category
Average Annual Growth
Forecast H3 Machinists, metal forming, shaping and erecting 1.7% E0 Psychologists, social workers, ministers,
policy officers 1.5%
H6 Heavy equipment and crane operators, 1.7% G4 Chefs and cooks 1.4%
C1 Technical natural and applied sciences 1.7% A3 Other managers, n.e.c. 1.4%
D0 Professional occupations in health 1.7% I2 Primary production labourers 1.4% F0 Professional occupations in art and culture 1.7% H0 Contractors and supervisors in trades
and transportation 1.4%
B0 Professional in business and finance 1.7% B1 Finance and insurance administration 1.4%
J1 Machine operators in manufacturing 1.7% G0 Sales and service supervisors 1.3%
H4 Mechanics 1.6% I1 Forestry, mining, oil and gas (excl labourers) 0.5%
F1 Technical art, culture, rec and sport 1.5% J0 Supervisors in manufacturing -0.4% C0 Professional in natural and applied sciences 1.5% I0 Occupations unique to agriculture
(excluding labourers) -1.0%
b. Wood Buffalo – Cold Lake Sub-region
With an annual average growth rate of 2.6% for the Occupational Categories tracked, skills shortages for this Sub-region will be severe. The annual average growth rate exceeds the already high Province-wide average (1.8%) for all categories except two:
• I1 Forestry, mining, oil and gas (excluding labourers) : 0.7% • I0 Occupations unique to agriculture, excluding labourers: -1.4%
For a number of Occupational Categories, the skills shortages will be particularly severe as the annual average growth rates exceed the already high Province-wide rates by more than 1.5%. These Occupational Categories with their growth rates, compared to the Province wide growth rates, are as below:
• H8 Helpers, construction and transportation labourers 5.2% vs. 3.7% • G2 Retail salespersons and sales clerks: 4.9% vs. 2.6% • J3 Labourers in processing, manufacturing and utilities: 4.6% vs. 2.5% • G1 Wholesale, technical, insurance, real estate sales: 3.8% vs. 1.8% • H5 Other trades, n.e.c:.3.5% vs. 2.0% • G0 Sales and service supervisors: 3.5% vs. 1.1% • B1 Finance and insurance administration occupations 3.5% vs. 1.6%
In declining order, the Occupational Categories having growth forecasts greater than the Province-wide average are summarized in the following table.

Research to Evaluate the Shortage of Skilled Workers in Northern Alberta Chapter 3 –Shorter Term Skills Shortages and Other Workforce Characteristics
Prepared for The Northern Labour Market Information Clearinghouse Project By Steven K. Lakey, MBA, CMC Page
58
WOOD BUFFALO – COLD LAKE SUB-REGION OCCUPATIONAL CATEGORIES WITH ANNUAL AVERAGE GROWTH RATES
GREATER THAN THE PROVINCE-WIDE AVERAGE
Occupational Category Average Annual Growth
Occupational Category Average Annual Growth
H8 Helpers, const and transp labourers 5.2% B0 Professional in business and fin 2.8% G2 Retail salespersons and sales clerks 4.9% B4 Clerical supervisors 2.8% J3 Labourers in process, man & utilities 4.6% J0 Supervisors in manufacturing 2.8% H1 Construction trades 4.5% A0 Senior management 2.7% H7 Trans & equipment operators 4.2% D3 Assisting in support of health 2.7% H0 Contractors and supervisors in trades 4.2% G4 Chefs and cooks 2.6% G1 Wholesale, technical, ins, real estate 3.8% D2 Technical and related in health 2.6% B2 Secretaries 3.7% G7 Travel, accommodation and 2.6% H5 Other trades, n.e.c. 3.5% J2 Assemblers in manufacturing 2.6% G0 Sales and service supervisors 3.5% D1 Nurse supervisors and RNs 2.6% H2 Stationary engineers, power station 3.5% I2 Primary production labourers 2.5% B1 Finance/ insurance administration 3.5% G6 protective services 2.5%
G3 Cashiers 3.3% E0 Psychologists, social workers, ministers, policy officers 2.5%
B5 Clerical occupations 3.3% G8 Child care and home support 2.5% B3 Administrative and regulatory 3.1% H3 Machinists, metal forming, 2.4%
A1 Specialist managers 3.1% C0 Professional natural/ applied sciences 2.4%
G5 Food and beverage service 3.1% E2 Paralegals, social services, and 2.4% H6 Heavy equip and crane operators, 3.1% H4 Mechanics 2.2%
A2 Mgrs in retail trade, food and accomm 3.1% J1 Machine operators in manufacturing 2.0%
A3 Other managers, n.e.c. 3.0% F1 Technical art, culture, 1.9% D0 Professional occupations in health 2.9% E1 Teachers and professors 1.9% C1 Technical natural / applied sciences 2.8% F0 Professional in art and culture 1.8% G9 Sales and service occupations 2.8%
c. Athabasca – Grande Prairie Sub-region
Based upon the data contained in the AHRE model, the skills shortage outlook in the Sub-region is not as severe as in the Wood Buffalo – Cold Lake Sub-region or Province -wide. Of 47 occupational categories tracked, 12 had growth rates that were more than the province wide average. However, of the 12, only one, “G2- Retail Sales Clerks” was more than 1% greater than the province wide annual average growth rate of 1.8%. In declining order, the Occupational Categories having annual average growth forecasts greater than the Province-wide average are summarized in the following table.

Research to Evaluate the Shortage of Skilled Workers in Northern Alberta Chapter 3 –Shorter Term Skills Shortages and Other Workforce Characteristics
Prepared for The Northern Labour Market Information Clearinghouse Project By Steven K. Lakey, MBA, CMC Page
59
ATHABASCA – GRANDE PRAIRIE SUB-REGION OCCUPATIONAL CATEGORIES WITH ANNUAL AVERAGE GROWTH RATES
GREATER THAN THE PROVINCE-WIDE AVERAGE
Occupational Category Growth Forecast
Total 1.3% G2 Retail salespersons and sales clerks 2.9% G3 Cashiers 2.8% G1 Wholesale, technical, insurance, real estate sales 2.6% A2 Managers in retail trade, food and accommodation 2.4% D2 Technical and related occupations in health 2.3% G8 Child care and home support workers 2.3% E1 Teachers and professors 2.1% J3 Labourers in processing, manufacturing and utilities 2.1% G9 Sales and service occupations, n.e.c. 1.9% H7 Transportation equipment operators 1.8% D1 Nurse supervisors and registered nurses 1.8% B3 Administrative and regulatory occupations 1.8%
In declining order, the Occupational Categories having average annual growth forecasts that are less than the Province-wide average are summarized in the following table.
ATHABASCA – GRANDE PRAIRIE SUB-REGION
CATEGORIES WITH ANNUAL AVERAGE GROWTH LESS THAN THE PROVINCE-WIDE AVERAGE
Occupational Category
Forecast Occupational Category
Forecast D3 Assisting in support of health services 1.7% B0 Professional in business and finance 1.1%
A1 Specialist managers 1.7% D0 Professional occupations in health 1.1% B4 Clerical supervisors 1.7% C1 Technical natural and applied sciences 1.0% B2 Secretaries 1.7% G5 Food and beverage service 0.9% E2 Paralegals, social services, education 1.6% B1 Finance and insurance administration 0.9%
F0 Professional in art and culture 1.6% H2 Stationary engineers, power station 0.9% J2 Assemblers in manufacturing 1.6% G4 Chefs and cooks 0.9% J1 Machine operators in manufacturing 1.5% C0 Prof in natural and applied sciences 0.8% B5 Clerical occupations 1.4% I2 Primary production labourers 0.8% H5 Other trades, n.e.c. 1.4% G0 Sales and service supervisors 0.7% A0 Senior management occupations 1.4% A3 Other managers, n.e.c. 0.7% G7 Travel and accommodation and sport 1.3% H6 Heavy equip and crane operators 0.6%
F1 Technical art, culture, recreation and 1.3% H1 Construction trades 0.5%
H4 Mechanics 1.3% H0 Contractors and supervisors in trades and 0.4%
H3 Machinists, metal forming, shaping and 1.1% I1 Forestry, mining, oil and gas (excl
labourers) 0.4%
G6 Occupations in protective services 1.1% I0 Unique to agriculture, excluding labourers -0.7%
E0 Psychologists, social workers, ministers, 1.1% J0 Supervisors in manufacturing -2.3%
H8 Helpers, construction and transportation 1.1%

Research to Evaluate the Shortage of Skilled Workers in Northern Alberta Chapter 3 –Shorter Term Skills Shortages and Other Workforce Characteristics
Prepared for The Northern Labour Market Information Clearinghouse Project By Steven K. Lakey, MBA, CMC Page
60
Tables 3.4 (Northern Region), 3.4.1 (Wood Buffalo – Cold Lake Sub-region) and 3.4.2 (Athabasca – Grande Prairie Sub-region) provide an overviews and comparisons of growth forecasts for Occupational Categories. The Occupational Categories are organized to show annual average growth rates from highest to lowest. For each Occupational Category, the annual average growth rate for the Northern Region is compared with that for all of Alberta. The third column provides an indicator of whether the regional growth figure is “Above”, “Below” or “Neutral” with the Alberta-wide forecast. Instances where the difference is greater than 1.5% are indicated in “Bold”. The fourth column provides any additional comments that may be required.

Research to Evaluate the Shortage of Skilled Workers in Northern Alberta Chapter 3 –Shorter Term Skills Shortages and Other Workforce Characteristics
Prepared for The Northern Labour Market Information Clearinghouse Project By Steven K. Lakey, MBA, CMC Page
61
TABLE 3.4 NORTHERN REGION
OVERVIEW OF ANNUAL AVERAGE GROWTH FORECAST 2005 TO 2010
Occupational Categories Northern Region Average
Provincial Average
Outlook Rating
All Occupations 1.7% 1.8% Below G2 Retail salespersons and sales clerks 3.4% 2.6% Above G3 Cashiers 3.0% 2.0% Above G1 Wholesale, technical, insurance, real estate sales 3.0% 1.8% Above A2 Managers in retail trade, food and accommodation 2.6% 2.6% Neutral J3 Labourers in processing, manufacturing and utilities 2.6% 2.5% Above H7 Transportation equipment operators 2.5% 2.7% Below H8 Helpers, construction and transportation labourers 2.4% 3.7% Below D2 Technical and related occupations in health 2.4% 2.0% Above B2 Secretaries 2.3% 3.3% Below G8 Child care and home support workers 2.3% 2.1% Above H1 Construction trades 2.3% 3.2% Below A1 Specialist managers 2.3% 1.8% Above B3 Administrative and regulatory occupations 2.2% 2.0% Above G9 Sales and service occupations, n.e.c. 2.2% 2.4% Below H2 Stationary engineers, power station operators 2.0% 2.8% Below B4 Clerical supervisors 2.0% 1.5% Above E1 Teachers and professors 2.0% 1.2% Above H5 Other trades, n.e.c. 2.0% 2.0% Neutral D1 Nurse supervisors and registered nurses 2.0% 2.1% Below D3 Assisting occupations in support of health services 2.0% 2.2% Below B5 Clerical occupations 1.9% 2.2% Below J2 Assemblers in manufacturing 1.9% 2.2% Below E2 Paralegals, social services, education and religion n.e.c. 1.8% 1.9% Below G6 Occupations in protective services 1.8% 2.4% Below A0 Senior management occupations 1.8% 4.7% BELOW G5 Occupations in food and beverage service 1.8% 2.4% Below G7 Occupations in travel and accommodation and sport 1.8% 2.6% Below H3 Machinists, metal forming, shaping and erecting 1.7% 2.6% Below H6 Heavy equipment and crane operators, including drillers 1.7% 2.7% Below C1 Technical related to natural and applied sciences 1.7% 2.1% Below D0 Professional occupations in health 1.7% 2.5% Below F0 Professional occupations in art and culture 1.7% 1.8% Below B0 Professional occupations in business and finance 1.7% 2.0% Below J1 Machine operators in manufacturing 1.7% 2.6% Below H4 Mechanics 1.6% 2.0% Below F1 Technical art, culture, recreation and sport 1.5% 2.0% Below C0 Professional in natural and applied sciences 1.5% 1.9% Below E0 Psychologists, social workers, ministers, policy officers 1.5% 2.5% Below G4 Chefs and cooks 1.4% 2.5% Below A3 Other managers, n.e.c. 1.4% 2.7% Below I2 Primary production labourers 1.4% 2.4% Below H0 Contractors and supervisors in trades and transportation 1.4% 1.3% Below B1 Finance and insurance administration occupations 1.4% 1.6% Below G0 Sales and service supervisors 1.3% 1.1% Above I1 Forestry, mining, oil and gas (excluding labourers) 0.5% 1.4% Below J0 Supervisors in manufacturing -0.4% 1.4% Below I0 Occupations unique to agriculture (excluding labourers) -1.0% 0.3% Below

Research to Evaluate the Shortage of Skilled Workers in Northern Alberta Chapter 3 –Shorter Term Skills Shortages and Other Workforce Characteristics
Prepared for The Northern Labour Market Information Clearinghouse Project By Steven K. Lakey, MBA, CMC Page
62
TABLE 3.4.1 WOOD BUFFALO – COLD LAKE SUB-REGION
OVERVIEW OF ANNUAL AVERAGE GROWTH FORECAST 2005 TO 2010
Occupational Categories Sub-region Average
Provincial Average
Outlook Rating
Total 2.6% 1.8% Above H8 Helpers, construction and transportation labourers 5.2% 3.7% ABOVE G2 Retail salespersons and sales clerks 4.9% 2.6% ABOVE J3 Labourers in processing, manufacturing and utilities 4.6% 2.5% ABOVE H1 Construction trades 4.5% 3.2% Above H7 Transportation equipment operators 4.2% 2.7% Above H0 Contractors and supervisors in trades and transportation 4.2% 1.3% Above G1 Wholesale, technical, insurance, real estate sales 3.8% 1.8% ABOVE B2 Secretaries 3.7% 3.3% Above H5 Other trades, n.e.c. 3.5% 2.0% ABOVE G0 Sales and service supervisors 3.5% 1.1% ABOVE H2 Stationary engineers, power station operators 3.5% 2.8% Above B1 Finance and insurance administration occupations 3.5% 1.6% ABOVE G3 Cashiers 3.3% 2.0% Above B5 Clerical occupations 3.3% 2.2% Above B3 Administrative and regulatory occupations 3.1% 2.0% Above A1 Specialist managers 3.1% 1.8% Above G5 Occupations in food and beverage service 3.1% 2.4% Above H6 Heavy equipment and crane operators, including drillers 3.1% 2.7% Above A2 Managers in retail trade, food and accommodation 3.1% 2.6% Above A3 Other managers, n.e.c. 3.0% 2.7% Above D0 Professional occupations in health 2.9% 2.5% Above C1 Technical related to natural and applied sciences 2.8% 2.1% Above G9 Sales and service occupations, n.e.c. 2.8% 2.4% Above B0 Professional occupations in business and finance 2.8% 2.0% Above B4 Clerical supervisors 2.8% 1.5% Above J0 Supervisors in manufacturing 2.8% 1.4% Above A0 Senior management occupations 2.7% 4.7% BELOW D3 Assisting occupations in support of health services 2.7% 2.0% Above G4 Chefs and cooks 2.6% 2.5% Above D2 Technical and related occupations in health 2.6% 2.0% Above G7 Occupations in travel and accommodation and sport 2.6% 2.6% Even J2 Assemblers in manufacturing 2.6% 2.2% Above D1 Nurse supervisors and registered nurses 2.6% 2.1% Above I2 Primary production labourers 2.5% 2.4% Above G6 Occupations in protective services 2.5% 2.4% Above E0 Psychologists, social workers, ministers, policy officers 2.5% 2.5% Even G8 Child care and home support workers 2.5% 2.1% Above H3 Machinists, metal forming, shaping and erecting 2.4% 2.6% Below C0 Professional in natural and applied sciences 2.4% 1.9% Above E2 Paralegals, social services, education and religion n.e.c. 2.4% 1.9% Above H4 Mechanics 2.2% 2.0% Above J1 Machine operators in manufacturing 2.0% 2.6% Below F1 Technical art, culture, recreation and sport 1.9% 2.0% Below E1 Teachers and professors 1.9% 1.2% Above F0 Professional occupations in art and culture 1.8% 1.8% Below I1 Forestry, mining, oil and gas (excluding labourers) 0.7% 1.4% Below I0 Occupations unique to agriculture, excluding labourers -1.4% 0.3% Below

Research to Evaluate the Shortage of Skilled Workers in Northern Alberta Chapter 3 –Shorter Term Skills Shortages and Other Workforce Characteristics
Prepared for The Northern Labour Market Information Clearinghouse Project By Steven K. Lakey, MBA, CMC Page
63
TABLE 3.4.2 ATHABASCA – GRANDE PRAIRIE SUB-REGION
OVERVIEW OF ANNUAL AVERAGE GROWTH FORECAST 2005 TO 2010
Occupational Categories Sub-region Average
Provincial Average
Outlook Rating
Total 1.3% 1.8% G2 Retail salespersons and sales clerks 2.9% 2.6% Above G3 Cashiers 2.8% 2.0% Above G1 Wholesale, technical, insurance, real estate sales 2.6% 1.8% Above A2 Managers in retail trade, food and accommodation 2.4% 2.6% Below D2 Technical and related occupations in health 2.3% 2.0% Above G8 Child care and home support workers 2.3% 2.1% Above E1 Teachers and professors 2.1% 1.2% Above J3 Labourers in processing, manufacturing and utilities 2.1% 2.5% Below G9 Sales and service occupations, n.e.c. 1.9% 2.4% Below H7 Transportation equipment operators 1.8% 2.7% Below D1 Nurse supervisors and registered nurses 1.8% 2.1% Below B3 Administrative and regulatory occupations 1.8% 2.0% Below D3 Assisting occupations in support of health services 1.7% 2.0% Below A1 Specialist managers 1.7% 1.8% Below B4 Clerical supervisors 1.7% 1.5% Above B2 Secretaries 1.7% 3.3% BELOW E2 Paralegals, social services, education and religion n.e.c. 1.6% 1.9% Below F0 Professional occupations in art and culture 1.6% 1.8% Below J2 Assemblers in manufacturing 1.6% 2.2% Below J1 Machine operators in manufacturing 1.5% 2.6% Below B5 Clerical occupations 1.4% 2.2% Below H5 Other trades, n.e.c. 1.4% 2.5% Below A0 Senior management occupations 1.4% 4.7% BELOW G7 Occupations in travel and accommodation and sport 1.3% 2.6% Below F1 Technical art, culture, recreation and sport 1.3% 2.0% Below H4 Mechanics 1.3% 2.0% Below H3 Machinists, metal forming, shaping and erecting 1.1% 2.6% Below G6 Occupations in protective services 1.1% 2.4% Below E0 Psychologists, social workers, ministers, policy officers 1.1% 2.5% Below H8 Helpers, construction and transportation labourers 1.1% 3.7% BELOW B0 Professional occupations in business and finance 1.1% 2.0% Below D0 Professional occupations in health 1.1% 2.5% Below C1 Technical related to natural and applied sciences 1.0% 2.1% Below G5 Occupations in food and beverage service 0.9% 2.4% BELOW B1 Finance and insurance administration occupations 0.9% 1.6% Below H2 Stationary engineers, power station operators 0.9% 2.8% BELOW G4 Chefs and cooks 0.9% 2.5% BELOW C0 Professional in natural and applied sciences 0.8% 1.9% Below I2 Primary production labourers 0.8% 2.4% Below G0 Sales and service supervisors 0.7% 1.1% Below A3 Other managers, n.e.c. 0.7% 2.7% BELOW H6 Heavy equipment and crane operators, including drillers 0.6% 2.7% BELOW H1 Construction trades 0.5% 3.2% BELOW H0 Contractors and supervisors in trades and transportation 0.4% 1.3% Below I1 Forestry, mining, oil and gas (excluding labourers) 0.4% 1.4% Below I0 Occupations unique to agriculture, excluding labourers -0.7% 0.3% Below J0 Supervisors in manufacturing -2.3% 1.4% BELOW

Research to Evaluate the Shortage of Skilled Workers in Northern Alberta Chapter 3 –Shorter Term Skills Shortages and Other Workforce Characteristics
Prepared for The Northern Labour Market Information Clearinghouse Project By Steven K. Lakey, MBA, CMC Page
64
VII. Concerns and Issues Faced By Employers The final aspect of this Chapter is to attempt to capture some of the concerns of employers with respect to skills shortages. Given the data available and to ensure a degree of consistency, the findings of a survey commissioned for Alberta Human Resources and Employment (AHRE) in 2005, and made available from the “WageInfo” section of the ALIS web site 7 were used. The results are classified according to the NOC system (up to four-digit numerical code) rather than NOC – S (alphanumeric code) and organized according to Region, (data representative of “all of Northern Alberta” are not available) and for the “Wood Buffalo – Cold Lake” Sub-region and the “Athabasca – Grande Prairie Sub-region”, of particular interest for the purposes of this project would be:
• Degree of difficulty experienced in hiring individuals; • Indicators of vacancies for the occupations of interest; • Indicators of potential earnings; and • How the Sub-regional results (three items above) compare to the “Province-wide”
comparable data. In order to complete the analysis, it was first necessary to determine representative occupations and their NOC codes that would “match” with the Occupational Categories used in preceding Parts of this Chapter. As there are over 500 NOC codes, it was necessary to be selective in choosing a manageable number that would represent the perceived needs and characteristics of the communities in Northern Alberta. The following table, organized according to average annual growth rate for Occupational Categories (from earlier section) represents the “cross-over” from the NOC – S to the NOC system.
NOC –S TO NOC CROSSOVER
NOC - S NOC Occupational Categories Name/Description NOC Code
G9 Sales and service occupations, n.e.c. Food Counter Attendants Janitors Hairstylists and Barbers
6641 6663 6271
B5 Clerical occupations Shippers and Receivers Storekeepers and Parts Clerks
1471 1472
H7 Transportation equipment operators Truck Drivers 7411 G2 Retail salespersons and sales clerks Retail salespersons and clerks 6421
A2 Managers in retail trade, food and accommodation Restaurant and Food Service Managers Accommodation Service Managers
0631 0632
H1 Construction trades Plumbers Carpenters
7251 7271
H4 Mechanics Heavy Duty Mechanics Automotive Repair Technicians
7312 7321
G3 Cashiers Cashiers 6611 H8 Helpers, construction and transportation labourers Trades helpers and Labourers 7611
H6 Heavy equipment and crane operators, including drillers Heavy Equipment Operators (Except Crane) Crane Operators
7421 7371
E1 Teachers and professors Elementary and Kindergarten Teachers 4142 A3 Other managers, n.e.c. Business Service Managers 0651
C1 Technical related to natural and applied sciences Geological / Minerals Technicians Forestry Technologists and Technicns
2212 2223
B2 Secretaries Secretaries (Except Legal and Medical) 1241
J1 Machine operators in manufacturing Petroleum, Gas and Chemical Operators Saw Mill Machine Operators
9232 9431
7 http://www.alis.gov.ab.ca/wageinfo/

Research to Evaluate the Shortage of Skilled Workers in Northern Alberta Chapter 3 –Shorter Term Skills Shortages and Other Workforce Characteristics
Prepared for The Northern Labour Market Information Clearinghouse Project By Steven K. Lakey, MBA, CMC Page
65
E2 Paralegals, social services, education and religion n.e.c. Community and Social Service Workers 4212 G8 Child care and home support workers Baby Sitters and Nannies 6474
H2 Stationary engineers, power station operators Stationary Engineers Power Systems Operators
7351 7352
H3 Machinists, metal forming, shaping and erecting Sheet Metal Workers 7261 G1 Wholesale, technical, insurance, real estate sales Insurance Agents 6231
A1 Specialist managers Financial Managers/Accountants Facility Operation and Maintenance Managers Engineering Managers
0111 0721 0211
B3 Administrative and regulatory occupations Personnel and Recruitment Officers Purchasing Agents and Officers Administrative Officers/Aboriginal Liaison
1223 1225 1221
G5 Occupations in food and beverage service Bartenders Food and Beverage Servers
6452 6453
H0 Contractors and supervisors in trades and transportation Heavy Construction Electrical Trades and Telecommunications
7217 7212
D1 Nurse supervisors and registered nurses Head Nurses Registered Nurses
3151 3152
B1 Finance and insurance administration occupations Bookkeepers Insurance Adjusters
1231 1233
D3 Assisting occupations in support of health services Dental Assistants Orderlies
3411 3413
I1 Forestry, mining, oil and gas (excluding labourers)
Supervisors, Logging and Forestry Supervisors, Oil and Gas Drilling Oil and Gas Well Drilling Workers Logging Machine Operators
8211 8222 8232 8241
C0 Professional in natural and applied sciences Geologists Urban and Land Use Planners
2113 2153
G4 Chefs and cooks Chefs Cooks
6241 6242
I2 Primary production labourers Oil and Gas and Related Labourers Logging and Forestry Labourers
8615 8616
D2 Technical and related occupations in health Medical Laboratory Technicians Dental Hygenists Licensed Practical Nurses
3212 3222 3233
G6 Occupations in protective services Police Officers Firefighters Security Guards and Related Occupations
6261 6262 6651
B0 Professional occupations in business and finance Financial Managers/Accountants 1111 E0 Psychologists, social workers, ministers, policy officers Counsellors 4143 G0 Sales and service supervisors Retail Trade Managers 0621 H5 Other trades, n.e.c. Roofers and Shinglers 7291 J3 Labourers in processing, manufacturing and utilities Labourers in Wood, Pulp and Paper Processing 9614 A0 Senior management occupations Senior Managers, Health, Education, Social and Community 0014
D0 Professional occupations in health Dentists General Practitioners
3113 3112
F1 Technical art, culture, recreation and sport Photographers Coaches
5221 5252
G7 Occupations in travel and accommodation and sport Travel Agents Front Desk Clerks
6431 6435
B4 Clerical supervisors Supervisors, General Office 1211
F0 Professional occupations in art and culture Librarians Conservators and Curators
5111 5112
J2 Assemblers in manufacturing Wood Products Assemblers/Inspectors 9493 J0 Supervisors in manufacturing Supervisors Forestry Products Processing 9215 I0 Occupations unique to agriculture (excluding labourers) Farmers and Farm Managers 8251
Once the NOC codes had been identified, it was possible to extract the relevant data from the ALIS WageInfo site. To the extent possible, indicators for each NOC code were identified for both the Wood Buffalo – Cold Lake and Athabasca – Grande Prairie Sub-regions and compared to the corresponding province-wide indicators. However, for some NOC codes, Sub-regional indicators were not available and it was necessary to use the province-wide indicators as surrogates. Bearing

Research to Evaluate the Shortage of Skilled Workers in Northern Alberta Chapter 3 –Shorter Term Skills Shortages and Other Workforce Characteristics
Prepared for The Northern Labour Market Information Clearinghouse Project By Steven K. Lakey, MBA, CMC Page
66
the preceding limitations in mind and that the NOC codes selected represent only a portion of the total, the findings are of interest.
a. Wood Buffalo – Cold Lake Sub-region
Table 3.5.1 represents a summary and organization of the data for the Wood Buffalo – Cold Lake Sub-region. It is organized according to hiring difficulty for the selected occupations. For each occupation, the percentage of employers experiencing difficulty in hiring is indicated along with the estimated vacancy rate in the Sub-region for the occupation and the average hourly earnings. The corresponding Province-wide indicators are also presented to facilitate comparisons.
TABLE 3.5.1: WOOD BUFFALO – COLD LAKE COMPARED TO ALL OF ALBERTA
W-CL Alberta
Occupation With Hiring Vacancy Average
With Hiring Vacancy Average
NOC Difficulties Rate Wage Difficulties Rate Wage Code 2005 2005 2005 2005 2005 2005
Cooks 6242 58% 14% $11.60 53% 9% $10.39 Truck Drivers 7411 53% 1% $20.58 49% 6% $19.49 Restaurant and Food Service Managers 0631 52% 21% $14.66 19% 6% $14.18 Automotive Repair Technicians 7321 50% 9% $26.61 48% 8% $22.47 Food and Beverage Servers 6453 50% 10% $7.18 35% 5% $7.15 Heavy Duty Mechanics 7312 47% 4% $35.97 38% 7% $25.45 Carpenters 7271 45% 2% $33.02 37% 1% $34.57 Retail salespersons and sales clerks 6421 45% 3% $12.07 28% 2% $13.92 Construction trades helpers and Labourers 7611 43% 2% $27.12 36% 6% $17.12 Cashiers 6611 43% 13% $10.91 42% 8% $10.99 Food Counter Attendants 6641 40% 6% $9.62 44% 7% $8.59 Front Desk Clerks 6435 40% 9% $11.85 44% 4% $9.69 Grocery Clerks 6622 40% 14% $9.75 30% 3% $9.57 Heavy Equipment Operators (Except Crane) 7421 39% 0% $32.78 38% 4% $23.75 Storekeepers and Parts Clerks 1472 35% 2% $26.64 24% 4% $17.52 Business Service Managers 0651 33% 8% $25.95 11% 5% $24.36 Welders 7265 33% 1% $35.75 41% 6% $25.15 Oil and Gas Drilling, Servicing and Related Labourers 8615 33% 7% $18.62 40% 10% $16.63 Delivery And Courier Services 7414 25% 15% $11.45 30% 5% $15.72 Accommodation Service Managers 632 25% 0% $18.49 10% 4% $17.48 Drafting Technologists and Technicians 2253 25% 4% $23.57 25% 3% $26.37 Bartenders 6452 25% 10% $8.07 23% 3% $7.63 Security Guards and Related Occupations 6651 17% 0% $10.50 20% 0% $10.60 Janitors 6663 15% 10% $13.02 20% 1% $12.61 General Office Clerks 1411 11% 0% $18.75 10% 0% $17.87 Shippers and Receivers 1471 11% 0% $10.87 23% 3% $14.03 Construction Managers 0711 10% 11% $23.84 13% 4% $31.70 Financial Managers/Accountants 1111 10% 0% $40.55 12% 2% $26.63 Retail Trade Managers 0621 8% 1% $18.80 9% 1% $21.89 Secretaries (Except Legal and Medical) 1241 8% 0% $19.01 6% 0% $19.11 Administrative Officers/Aboriginal Liaison 1221 7% 5% $21.07 6% 1% $22.89
Primary Production Mgrs (Except Agriculture) 0811 0% 0% $45.88 6% 1% $38.88 Senior Mgrs, Health, Educ, Social and Community 0014 0% 0% $43.68 5% 0% $40.60 Supervisors, General Office 1211 NA NA $24.45 0% 0% $25.82
Librarians 5111 NA NA $24.43 0.05 0.02 $25.83

Research to Evaluate the Shortage of Skilled Workers in Northern Alberta Chapter 3 –Shorter Term Skills Shortages and Other Workforce Characteristics
Prepared for The Northern Labour Market Information Clearinghouse Project By Steven K. Lakey, MBA, CMC Page
67
b. Athabasca- Grande Prairie Sub-region Table 3.5.2 represents a summary of the data for the Athabasca – Grande Prairie Sub-region. It is organized according to hiring difficulty for the selected occupations. For each occupation, the percentage of employers experiencing difficulty in hiring is indicated along with the estimated vacancy rate in the Sub-region for the occupation and the average hourly earnings. The corresponding Province-wide indicators are also presented to facilitate comparisons.
TABLE 3.5.2: 2005 HIRING DIFFICULTIES ATHABASCA – GRANDE PRAIRIE COMPARED TO ALBERTA A - GP Alberta
Occupation NOC Code
With Hiring Difficulties
Vacancy Rate
Average
Wage With Hiring Difficulties
Vacancy Rate
Average
Wage
Sheet Metal Workers 7261 80% 19% $21.76 60% 3% $24.88 Oil and Gas Well Drilling Workers 8232 63% 4% $25.89 41% 4% $20.99 Paralegal and Related 4211 60% 0% $20.05 23% 0% $19.62 Truck Drivers 7411 58% 4% $21.54 49% 6% $19.49 Food Counter Attendants 6641 56% 11% $8.64 44% 7% $8.59 Front Desk Clerks 6435 52% 3% $8.92 44% 4% $9.69 Cashiers 6611 52% 9% $10.44 42% 8% $10.99 Orderlies 3413 50% 2% $13.43 28% 1% $13.93 Licensed Practical Nurses 3233 43% 0% $18.25 48% 1% $17.86 Automotive Repair Technicians 7321 38% 3% $24.59 48% 8% $22.47 Retail salespersons/ sales clerks 6421 35% 5% $14.27 28% 2% $13.92 Heavy Duty Mechanics 7312 34% 8% $24.93 38% 7% $25.45 Labourers in Wood, Pulp and Paper 9614 33% 14% $14.56 42% 9% $15.40 Storekeepers and Parts Clerks 1472 32% 3% $17.78 24% 4% $17.52 Restaurant/ Food Service Mgrs 0631 31% 11% $14.10 19% 6% $14.18 Business Service Managers 0651 31% 8% $21.51 11% 5% $24.36 Grocery Clerks 6622 30% 5% $9.53 30% 3% $9.57 Welders 7265 30% 14% $34.58 41% 6% $25.15 Wholesale Sales Representatives 6221 29% 3% $32.20 19% 2% $28.24 Dispatchers and Radio Operators 1475 26% 8% $24.61 20% 2% $20.52 Construction Helpers/ Labourers 7611 26% 8% $15.49 36% 6% $17.12 Mech Eng Technologists / Technicians 2232 25% 13% $32.49 39% 4% $33.01 Janitors 6663 24% 5% $14.34 20% 1% $12.61 Delivery And Courier Services 7414 24% 1% $15.17 30% 5% $15.72 Elementary /Kindergarten Teachers 4142 22% 0% $31.23 11% 0% $34.99 Supervisors, Logging and Forestry 8211 20% 6% $29.00 10% 4% $28.91 Accommodation Service Managers 0632 18% 5% $15.68 10% 4% $17.48 General Office Clerks 1411 17% 0% $17.55 10% 0% $17.87 Electrical Technologists/ Technicians 2241 17% 7% $31.52 12% 1% $31.72 Purchasing and Inventory Clerks 1474 14% 0% $20.03 7% 1% $19.87 Community / Soc Service Workers 4212 14% 2% $15.83 24% 2% $15.52 Logging Machine Operators 8241 14% 1% $21.01 14% 1% $20.71 Senior Mgrs, Health, Educ, Social and Community 0014 13% 0% $52.45 5% 0% $40.60 Shippers and Receivers 1471 13% 2% $13.82 23% 3% $14.03 Operation and Maintenance Managers 0721 13% 2% $24.89 11% 0% $25.62 Retail Trade Managers 0621 12% 2% $21.87 9% 1% $21.89 Construction Managers 0711 12% 2% $30.84 13% 4% $31.70 Payroll Clerks 1432 11% 0% $21.87 10% 3% $22.08 Supervisors, Oil and Gas Drilling 8222 11% 1% $36.63 17% 2% $33.83 Bookkeepers (B/A) 1231 10% 1% $18.71 9% 2% $17.79 Primary Prod Mgrs (Except Agriculture) 811 9% 4% $43.65 6% 1% $38.88 Financial Managers/Accountants 1111 6% 0% $33.20 12% 2% $26.63 Secondary Teachers 4141 0% 0% $28.92 7% 0% $34.81 Secretaries (Except Legal and Med 1241 0% 0% $19.92 6% 0% $19.11 Librarians 5111 0 0 $23.46 14% 0% $31.42 Wood Products Assemblers/Inspectors 9493 NA NA $18.84 40% 9% $15.95
Supervisors Forestry Products Processing 9215 0 0 $28.53 0% 0% $28.60

Research to Evaluate the Shortage of Skilled Workers in Northern Alberta Chapter 3 –Shorter Term Skills Shortages and Other Workforce Characteristics
Prepared for The Northern Labour Market Information Clearinghouse Project By Steven K. Lakey, MBA, CMC Page
68
c. Remaining NOC Codes With No Sub-regional Data Tables 3.5.3A and B capture the remaining occupations and NOC Codes for which it is necessary to use Province-wide indicators as surrogates.
TABLE 3.5.3A ( WOOD BUFFALO COLD LAKE) IDENTIFIED OCCUPATIONS SORTED BY HIRING DIFFICULTY
BASED UPON ALBERTA-WIDE DATA
% Of Employers Vacancy Average
With Rates Hourly Hiring Wage
Wood Buffalo Cold Lake
NOC Difficulties Bricklayers 7281 89% 26% $31.12
Plasterers and Drywall Installers 7284 63% 7% $21.67 Sheet Metal Workers 7261 60% 3% $24.88 Baby Sitters and Nannies 6474 60% 5% $10.98 Ironworkers 7264 59% 5% $22.22 Drillers and Blasters 7372 57% 2% $14.98 Coaches 5252 56% 5% $21.35 Crane Operators 7371 56% 8% $32.88 Plumbers 7251 55% 5% $24.57 Refrigeration and Air Conditioning Mechanics 7313 50% 10% $25.79 Hairstylists and Barbers 6271 50% 7% $13.96 Stationary Engineers 7351 50% 4% $27.72 Roofers and Shinglers 7291 44% 8% $19.85 Insulators 7293 43% 5% $23.93 Structural Fabricators and Fitters 7263 41% 13% $21.37 Firefighters 6262 40% 7% $27.88 Travel Agents 6431 39% 2% $17.08 Mech Eng Technologists and Technicians 2232 39% 4% $33.01 Counsellors 4143 38% 0% $24.63 Architectural Technologists and Technicians 2251 36% 3% $24.78 Steamfitters 7252 34% 6% $23.50 Logging and Forestry Labourers 8616 33% 2% $17.13 Civil EngTechnologists and Technicians 2231 32% 3% $31.41 Pipefitting Trades 7213 32% 2% $22.89 Urban and Land Use Planners 2153 30% 2% $35.43 Geologists 2113 29% 7% $34.62 Wood Products Assemblers/Inspectors 9493 29% 1% $13.98 Mapping Technologists and Technicians 2255 27% 0% $25.71 Chefs 6241 27% 5% $14.92 Chemical Technologists and Technicians 2211 24% 4% $27.20
Note: Data for NOC Code 3112 (Physicians) not available.

Research to Evaluate the Shortage of Skilled Workers in Northern Alberta Chapter 3 –Skills Shortages and Other Workforce Characteristics
Prepared for The Northern Labour Market Information Clearinghouse Project By Steven K. Lakey, MBA, CMC Page 69
TABLE 3.5.3B ATHABASCA – GRANDE PRAIRIE IDENTIFIED OCCUPATIONS SORTED BY HIRING DIFFICULTY
BASED UPON ALBERTA-WIDE DATA
% Of Employers Vacancy Average With Rates Hourly
Hiring Wage Athabasca – Grande Prairie
NOC Difficulties Hairstylists and Barbers 6271 50% 7% $13.96 Refrigeration and Air Conditioning Mechanics 7313 50% 10% $25.79 Dental Hygienists 3222 45% 6% $39.73 Structural Fabricators and Fitters 7263 41% 13% $21.37 Counsellors 4143 38% 0% $24.63 Registered Nurses 3152 38% 1% $28.90 Architectural Technol and Technicians 2251 36% 3% $24.78 Insurance Agents 6231 35% 3% $21.53 Civil Eng Technologists and Technicians 2231 32% 3% $31.41 Other Religious Occupations 4217 30% 0% $31.41 Mapping Technologists and Technicians 2255 27% 0% $16.88 Real Estate Agents 6232 26% 1% $25.71 Drafting Technologists and Technicians 2253 25% 3% $57.88 Petroleum, Gas and Chemical Operators 9232 24% 2% $26.37 Chemical Technologists and Technicians 2211 24% 4% $33.60 Engineering Managers 0211 24% 2% $27.20 Farmers and Farm Managers 8251 20% 0% $16.98 Photographers 5221 20% 0% $25.26 Forestry Technologists and Techs 2223 20% 0% $47.41 Dental Assistants 3411 15% 2% $21.87 Conservators and Curators 5112 14% 0% $31.42 Teacher Assistants 6472 13% 0% $19.11 Eng Inspectors and Regulatory Officers 2262 11% 0% $13.84 Dentists 3113 11% 0% 65.38 Residential Home Builders and Renovators 0712 10% 2% $25.20 Geological and Minerals Technicians 2212 8% 3% $25.46 Insurance Adjusters 1233 8% 2% $25.93 Saw Mill Machine Operators 9431 7% 1% $21.29 Ironworkers 7264 6% 5% $22.85 Supervisors Forestry Products Processing 9215 0% 0% $28.60
Note: Data for NOC Code 3112 (Physicians) not available.

Research to Evaluate the Shortage of Skilled Workers in Northern Alberta Chapter 3 –Skills Shortages and Other Workforce Characteristics
Prepared for The Northern Labour Market Information Clearinghouse Project By Steven K. Lakey, MBA, CMC Page 70
Chapter 3
Addendum of Supporting Tables

Research to Evaluate the Shortage of Skilled Workers in Northern Alberta Chapter 3 –Skills Shortages and Other Workforce Characteristics
Prepared for The Northern Labour Market Information Clearinghouse Project By Steven K. Lakey, MBA, CMC Page 71
ADDENDUM TABLE A3.1 – OCCUPATIONAL CATEGORY DETAILS FOR “NORTHERN ALBERTA”
Northern Total 2001 2005 New Jobs % Change 2010 New Jobs % ChangeAll Occupations 175,855 178,440 2,585 1.47% 196,930 18,490 10.40% A Management occupations 14,625 14,940 315 2.12% 16,730 1,790 12.00% A0 Senior management occupations 1,450 1,400 -50 -3.45% 1,550 150 10.70% A1 Specialist managers 2,160 2,300 140 6.48% 2,610 310 13.50% A2 Managers in retail trade, food and accommodation 5,295 5,320 25 0.47% 6,160 840 15.80% A3 Other managers, n.e.c. 5,720 5,920 200 3.50% 6,410 490 8.30% B Business, finance and administration occupations 23,215 24,460 1,245 5.34% 27,260 2,800 11.40% B0 Professional occupations in business and finance 1,890 1,910 20 1.06% 2,100 190 9.90% B1 Finance and insurance administration occupations 2,815 3,320 505 17.94% 3,590 270 8.10% B2 Secretaries 3,850 3,070 -780 -20.26% 3,500 430 14.00% B3 Administrative and regulatory occupations 2,555 2,320 -235 -9.20% 2,630 310 13.40% B4 Clerical supervisors 545 580 35 6.42% 650 70 12.10% B5 Clerical occupations 11,560 13,260 1,700 14.71% 14,790 1,530 11.50% C Natural and applied sciences and related occupations 7,725 7,310 -415 -5.43% 8,010 700 9.60% C0 Professional in natural and applied sciences 3,125 2,970 -155 -4.96% 3,230 260 8.80% C1 Technical related to natural and applied sciences 4,600 4,340 -260 -5.65% 4,780 440 10.10% D Health occupations 6,310 7,510 1,200 19.02% 8,420 910 12.10% D0 Professional occupations in health 1070 1,200 130 12.15% 1,320 120 10.00% D1 Nurse supervisors and registered nurses 1,860 2,360 500 26.88% 2,640 280 11.90% D2 Technical and related occupations in health 1,690 1,660 -30 -1.78% 1,900 240 14.50% D3 Assisting occupations in support of health services 1,685 2,290 605 35.91% 2,560 270 11.80% E Social science, education, government and religion 11,210 10,540 -670 -5.93% 11,700 1,160 11.00% E0 Psychologists, social workers, ministers, policy officers 2,190 2,150 -40 -1.83% 2,340 190 8.80% E1 Teachers and professors 5,985 4,620 -1,365 -22.81% 5,180 560 12.10% E2 Paralegals, social services, education and religion n.e.c. 3,035 3,770 735 24.22% 4,180 410 10.90% F Occupations in art, culture, recreation and sport 2,090 2,040 -50 -2.16% 2,230 190 9.30% F0 Professional occupations in art and culture 725 700 -25 -3.45% 770 70 10.00% F1 Technical art, culture, recreation and sport 1,365 1,340 -25 -1.83% 1,460 120 9.00% G Sales and service occupations 38,230 37,320 -910 -2.39% 42,470 5,150 13.80% G0 Sales and service supervisors 1115 2,310 1,195 107.17% 2,490 180 7.80% G1 Wholesale, technical, insurance, real estate sales 2,080 1,920 -160 -7.69% 2,260 340 17.70% G2 Retail salespersons and sales clerks 4,870 4,650 -220 -4.52% 5,610 960 20.60% G3 Cashiers 3,190 3,360 170 5.33% 3,960 600 17.90% G4 Chefs and cooks 2,670 3,020 350 13.11% 3,280 260 8.60% G5 Occupations in food and beverage service 3,000 2,910 -90 -3.00% 3,220 310 10.70% G6 Occupations in protective services 2,980 2,130 -850 -28.52% 2,360 230 10.80% G7 Occupations in travel and accommodation and sport 1,160 1,140 -20 -1.72% 1,260 120 10.50% G8 Child care and home support workers 3,555 2,860 -695 -19.55% 3,260 400 14.00% G9 Sales and service occupations, n.e.c. 13,610 13,020 -590 -4.34% 14,770 1,750 13.40% H Trades, transport and equipment operators 40,100 44,200 4,100 10.17% 49,520 5,320 12.00% H0 Contractors and supervisors in trades and transportation 2,050 3,550 1,500 73.17% 3,840 290 8.20% H1 Construction trades 5,460 5,900 440 8.06% 6,700 800 13.60% H2 Stationary engineers, power station operators 2,905 3,030 125 4.30% 3,400 370 12.20% H3 Machinists, metal forming, shaping and erecting 3,130 3,380 250 7.99% 3,730 350 10.40% H4 Mechanics 6,210 7,690 1,480 23.83% 8,420 730 9.50% H5 Other trades, n.e.c. 1,380 1,490 110 7.97% 1,670 180 12.10% H6 Heavy equipment and crane operators, including drillers 5,635 5,610 -25 -0.44% 6,180 570 10.20% H7 Transportation equipment operators 9,225 9,580 355 3.85% 11,030 1,450 15.10% H8 Helpers, construction and transportation labourers 4,105 3,970 -135 -3.29% 4,550 580 14.60% I Occupations unique to primary industry 26,170 23,830 -2,340 -8.99% 23,670 -160 -0.70% I0 Occupations unique to agriculture (excluding labourers) 16,975 11,660 -5,315 -31.31% 10,980 -680 -5.80% I1 Forestry, mining, oil and gas (excluding labourers) 5,805 9,170 3,365 57.97% 9,440 270 2.90% I2 Primary production labourers 3,390 3,000 -390 -11.50% 3,250 250 8.30% J Unique to processing, manufacturing and utilities 6,180 6,290 110 -9.43% 6,920 630 10.00% J0 Supervisors in manufacturing 725 470 -255 -35.17% 460 -10 -2.10% J1 Machine operators in manufacturing 4,470 4,260 -210 -4.70% 4,680 420 9.90% J2 Assemblers in manufacturing 435 450 15 3.45% 500 50 11.10% J3 Labourers in processing, manufacturing and utilities 550 1,110 560 101.82% 1,280 170 15.30%

Research to Evaluate the Shortage of Skilled Workers in Northern Alberta Chapter 3 –Skills Shortages and Other Workforce Characteristics
Prepared for The Northern Labour Market Information Clearinghouse Project By Steven K. Lakey, MBA, CMC Page 72
ADDENDUM TABLE A3.1.1 - OCCUPATIONAL CATEGORY DETAILS FOR “WOOD BUFFALO – COLD LAKE”
2001 2005 New Jobs % Change 2010 New Jobs % Change All occupations 56,555 60,650 4,095 7.20% 70,240 9,590 15.8% A Management occupations 4,765 5,040 275 7.24% 5,950 910 18.1% A0 Senior management occupations 510 430 -80 5.77% 500 70 16.3% A1 Specialist managers 865 910 45 -15.69% 1,080 170 18.7% A2 Managers in retail trade, food and accommodation 1,570 1,860 290 5.20% 2,200 340 18.3% A3 Other managers, n.e.c. 1,820 1,840 20 18.47% 2,170 330 17.9% B Business, finance and administration occupations 7,150 6,850 -300 1.10% 8,190 1,340 19.6% B0 Professional occupations in business and finance 685 660 -25 -4.20% 770 110 16.7% B1 Finance and insurance administration occupations 540 580 40 -3.65% 700 120 20.7% B2 Secretaries 1,225 1,040 -185 7.41% 1,270 230 22.1% B3 Administrative and regulatory occupations 825 800 -25 -15.10% 950 150 18.8% B4 Clerical supervisors 180 180 - -3.03% 210 30 16.7% B5 Clerical occupations 3,695 3,590 -105 4,290 700 19.5% C Natural and applied sciences and related occupations 3,210 2,910 -300 -2.84% 3,370 460 15.8% C0 Professional in natural and applied sciences 1,390 1,250 -140 -9.35% 1,430 180 14.4% C1 Technical related to natural and applied sciences 1,820 1,660 -160 -10.07% 1,940 280 16.9% D Health occupations 2,135 2,070 -65 -8.79% 2,400 330 15.9% D0 Professional occupations in health 395 400 5 -3.04% 470 70 17.5% D1 Nurse supervisors and registered nurses 600 590 -10 1.27% 680 90 15.3% D2 Technical and related occupations in health 500 450 -50 -1.67% 520 70 15.6% D3 Assisting occupations in support of health services 640 630 -10 -10.00% 730 100 15.9% E Social science, education, government and religion 3,755 3,540 -215 -6.07% 3,990 450 12.7% E0 Psychologists, social workers, ministers, policy officers 730 600 -130 -5.73% 690 90 15.0% E1 Teachers and professors 2,055 2,040 -15 -17.81% 2,270 230 11.3% E2 Paralegals, social services, education and religion n.e.c. 970 900 -70 -0.73% 1,030 130 14.4% F Occupations in art, culture, recreation and sport 635 630 -5 -7.22% 700 70 11.1% F0 Professional occupations in art and culture 185 190 5 -0.79% 210 20 10.5% F1 Technical art, culture, recreation and sport 450 440 -10 2.70% 490 50 11.4% G Sales and service occupations 13,310 13,060 -250 -2.22% 15,470 2,410 18.5% G0 Sales and service supervisors 430 480 50 -1.88% 580 100 20.8% G1 Wholesale, technical, insurance, real estate sales 425 530 105 11.63% 650 120 22.6% G2 Retail salespersons and sales clerks 1,590 1,290 -300 24.71% 1,670 380 29.5% G3 Cashiers 1,055 1,260 205 -18.87% 1,510 250 19.8% G4 Chefs and cooks 815 960 145 19.43% 1,110 150 15.6% G5 Occupations in food and beverage service 1,075 1,140 65 17.79% 1,350 210 18.4% G6 Occupations in protective services 1,940 1,070 -870 6.05% 1,230 160 15.0% G7 Occupations in travel and accommodation and sport 375 390 15 -44.85% 450 60 15.4% G8 Child care and home support workers 1,200 1,010 -190 4.00% 1,160 150 14.9% G9 Sales and service occupations, n.e.c. 4,405 4,930 525 -15.83% 5,760 830 16.8% H Trades, transport and equipment operators 14,135 15,980 1,845 11.92% 19,420 3,440 21.5% H0 Contractors and supervisors in trades and transportation 725 880 155 13.05% 1,100 220 25.0% H1 Construction trades 2,105 2,580 475 21.38% 3,280 700 27.1% H2 Stationary engineers, power station operators 1,190 1,350 160 22.57% 1,630 280 20.7% H3 Machinists, metal forming, shaping and erecting 1,315 1,570 255 13.45% 1,800 230 14.6% H4 Mechanics 2,155 2,540 385 19.39% 2,880 340 13.4% H5 Other trades, n.e.c. 380 430 50 17.87% 520 90 20.9% H6 Heavy equipment and crane operators, including drillers 2,285 2,520 235 13.16% 2,980 460 18.3% H7 Transportation equipment operators 2,605 2,800 195 10.28% 3,510 710 25.4% H8 Helpers, construction and transportation labourers 1,375 1,310 -65 7.49% 1,720 410 31.3% I Occupations unique to primary industry 5,740 8,730 2,990 -4.73% 8,640 -90 -1.0% I0 Occupations unique to agriculture, excluding labourers 3,185 4,510 1,325 52.09% 4,130 -380 -8.4% I1 Forestry, mining, oil and gas (excluding labourers) 1,440 3,170 1,730 41.60% 3,300 130 4.1% I2 Primary production labourers 1,115 1,050 -65 120.14% 1,210 160 15.2% J Unique to processing, manufacturing and utilities 1,720 1,840 120 -5.83% 2,110 270 14.7% J0 Supervisors in manufacturing 185 180 -5 6.98% 210 30 16.7% J1 Machine operators in manufacturing 1,185 1,310 125 -2.70% 1,470 160 12.2% J2 Assemblers in manufacturing 105 130 25 10.55% 150 20 15.4% J3 Labourers in processing, manufacturing and utilities 245 220 -25 23.81% 280 60 27.3%

Research to Evaluate the Shortage of Skilled Workers in Northern Alberta Chapter 3 –Skills Shortages and Other Workforce Characteristics
Prepared for The Northern Labour Market Information Clearinghouse Project By Steven K. Lakey, MBA, CMC Page 73
ADDENDUM TABLE A3.1.2 –OCCUPATIONAL CATEGORY DETAILS FOR “ATHABASCA – GRANDE PRAIRIE”
2001 2005 New Jobs % Change 2010 New Jobs % Change All occupations 119,300 117,790 -1,510 -1.27% 126,690 8,900 7.60% A Management occupations 9,860 9,900 40 0.41% 10780 880 8.90% A0 Senior management occupations 940 970 30 3.19% 1,050 80 8.20% A1 Specialist managers 1,295 1,390 95 7.34% 1,530 140 10.10% A2 Managers in retail trade, food and accommodation 3,725 3,460 -265 -7.11% 3,960 500 14.50% A3 Other managers, n.e.c. 3,900 4,080 180 4.62% 4,240 160 3.90% B Business, finance and administration occupations 16,065 17,610 1,545 9.62% 19,070 1,460 8.30% B0 Professional occupations in business and finance 1,205 1,250 45 3.73% 1,330 80 6.40% B1 Finance and insurance administration occupations 2,275 2,740 465 20.44% 2,890 150 5.50% B2 Secretaries 2,625 2,030 -595 -22.67% 2,230 200 9.90% B3 Administrative and regulatory occupations 1,730 1,520 -210 -12.14% 1,680 160 10.50% B4 Clerical supervisors 365 400 35 9.59% 440 40 10.00% B5 Clerical occupations 7,865 9,670 1,805 22.95% 10,500 830 8.60% C Natural and applied sciences and related occupations 4,515 4,400 -115 -2.55% 4,640 240 5.50% C0 Professional in natural and applied sciences 1,735 1,720 -15 -0.86% 1,800 80 4.70% C1 Technical related to natural and applied sciences 2,780 2,680 -100 -3.60% 2,840 160 6.00% D Health occupations 4,175 5,440 1,265 30.30% 6,020 580 10.70% D0 Professional occupations in health 675 800 125 18.52% 850 50 6.30% D1 Nurse supervisors and registered nurses 1,260 1,770 510 40.48% 1,960 190 10.70% D2 Technical and related occupations in health 1,190 1,210 20 1.68% 1,380 170 14.00% D3 Assisting occupations in support of health services 1,045 1,660 615 58.85% 1,830 170 10.20% E Social science, education, government and religion 7,455 7,000 -455 -6.10% 7,710 710 10.10% E0 Psychologists, social workers, ministers, policy officers 1,460 1,550 90 6.16% 1,650 100 6.50% E1 Teachers and professors 3,930 2,580 -1350 -34.35% 2,910 330 12.80% E2 Paralegals, social services, education and religion n.e.c. 2,065 2,870 805 38.98% 3,150 280 9.80% F Occupations in art, culture, recreation and sport 1,455 1,410 -45 -3.09% 1,530 120 8.50% F0 Professional occupations in art and culture 540 510 -30 -5.56% 560 50 9.80% F1 Technical art, culture, recreation and sport 915 900 -15 -1.64% 970 70 7.80% G Sales and service occupations 24,920 24,260 -660 -2.65% 27,000 2,740 11.30% G0 Sales and service supervisors 685 1,830 1,145 167.15% 1,910 80 4.40% G1 Wholesale, technical, insurance, real estate sales 1,655 1,390 -265 -16.01% 1,610 220 15.80% G2 Retail salespersons and sales clerks 3,280 3,360 80 2.44% 3,940 580 17.30% G3 Cashiers 2,135 2,100 -35 -1.64% 2,450 350 16.70% G4 Chefs and cooks 1,855 2,060 205 11.05% 2,170 110 5.30% G5 Occupations in food and beverage service 1,925 1,770 -155 -8.05% 1,870 100 5.60% G6 Occupations in protective services 1,040 1,060 20 1.92% 1,130 70 6.60% G7 Occupations in travel and accommodation and sport 785 750 -35 -4.46% 810 60 8.00% G8 Child care and home support workers 2,355 1,850 -505 -21.44% 2,100 250 13.50% G9 Sales and service occupations, n.e.c. 9,205 8,090 -1115 -12.11% 9,010 920 11.40% H Trades, transport and equipment operators 25,965 28,220 2,255 8.68% 30,100 1,880 6.70% H0 Contractors and supervisors in trades and transportation 1,325 2,670 1,345 101.51% 2,740 70 2.60% H1 Construction trades 3,355 3,320 -35 -1.04% 3,420 100 3.00% H2 Stationary engineers, power station operators 1,715 1,680 -35 -2.04% 1,770 90 5.40% H3 Machinists, metal forming, shaping and erecting 1,815 1,810 -5 -0.28% 1,930 120 6.60% H4 Mechanics 4,055 5,150 1,095 27.00% 5,540 390 7.60% H5 Other trades, n.e.c. 1,000 1,060 60 6.00% 1,150 90 8.50% H6 Heavy equipment and crane operators, including drillers 3,350 3,090 -260 -7.76% 3,200 110 3.60% H7 Transportation equipment operators 6,620 6,780 160 2.42% 7,520 740 10.90% H8 Helpers, construction and transportation labourers 2,730 2,660 -70 -2.56% 2,830 170 6.40% I Occupations unique to primary industry 20,430 15,100 -5,330 -26.09% 15,030 -70 -0.50% I0 Occupations unique to agriculture, excluding labourers 13,790 7,150 -6640 -48.15% 6,850 -300 -4.20% I1 Forestry, mining, oil and gas (excluding labourers) 4,365 6,000 1,635 37.46% 6,140 140 2.30% I2 Primary production labourers 2,275 1,950 -325 -14.29% 2,040 90 4.60% J Unique to processing, manufacturing and utilities 4,460 4,450 -10 -0.22% 4810 360 8.10% J0 Supervisors in manufacturing 540 290 -250 -46.30% 250 -40 -13.80% J1 Machine operators in manufacturing 3,285 2,950 -335 -10.20% 3,210 260 8.80% J2 Assemblers in manufacturing 330 320 -10 -3.03% 350 30 9.40% J3 Labourers in processing, manufacturing and utilities 305 890 585 191.80% 1,000 110 12.40%

Research to Evaluate the Shortage of Skilled Workers in Northern Alberta Chapter 4 –Longer Term Demographic Issues
Prepared for The Northern Labour Market Information Clearinghouse Project By Steven K. Lakey, MBA, CMC Page 74
Chapter 4 Longer Term Demographic Issues
The purpose of Chapter 4 is to analyze and discuss the potential impact that longer-term demographic trends and issues may have on the skills challenges and opportunities for Northern Alberta. There are two Sections. Section I uses population projections developed by Alberta Finance to compare Northern Alberta and the two Sub-regions (Wood Buffalo - Cold Lake and Athabasca Grande Prairie) with Alberta and Canada. There are some advantages and limitations to the data and analysis used for Section I (to be discussed in more detail below). Section II provides a more detailed review of the two Sub-regions in order to address some of the limitations and issues associated with Section I, although in so doing, it is not completely free of issues. I. Inter-regional Comparisons This Section of Chapter 4 analyses demographic changes and discusses the likely impact on skills shortages. It uses Statistics Canada data for the population projections for Canada and Alberta Finance data for the projections related to Alberta. The underlying data are presented as Tables 4.1 and 4.1.1. The Alberta Finance data includes “Low”, “Medium” and “High” growth scenarios for each Census Division. Only the “Medium” scenario forecasts include single age data. For the “Low” and “High” forecasts, the data are according to age groups. It was considered that the “High” growth scenario was more likely than the “Medium” for Northeastern Alberta and would include the best overall projections for the purposes of this project, however, it is necessary to be mindful of some of the limitations with the data and the process followed. The use of data according to five-year age groups can tend to distort the number of individuals in a particular “category”. The most obvious example is with post-secondary students. One is “forced” to use data starting at age 20 when most individuals have normally completed high school by 18. Most are finished by 22 instead of 24 etc. In terms of the “process”, the analysis makes use of a number of ratios or rates that are common in demographic analysis:
• Dependency Rates/Ratios - Dependency Ratios are an indication of the burden placed on the work force (aged 15 to 64) by no-working segments of the population, generally seniors and students. They can also be used to gain a better appreciation of population changes and potential resource requirements. This report includes a Child Dependency Ratio and a Seniors’ Dependency Ratio.
• Other Ratios - Other ratios used in this Section include Job Entry vs. Pre-
retirement Ratio (a measure of those in the age groups of 15 to 24 vs. those in the age group of 55 to 64 as an indicator of likely work force additions and departures) and, School-Aged Vs Post-Secondary Ratio (those in the age group of 5 to 19 vs. those 20 to 29 and a measure of the supply for post-secondary institutes).
In order to be consistent with other research, the definitions above have been used throughout for this Section; however, the writer is concerned that they, in themselves, may be problematic if some of the skills shortages and other challenges ahead are to be resolved. Section II conducts an analysis from an approach that uses different definitions and categories that may be more meaningful for Northern Alberta and the 21st century.

Research to Evaluate the Shortage of Skilled Workers in Northern Alberta Chapter 4 –Longer Term Demographic Issues
Prepared for The Northern Labour Market Information Clearinghouse Project By Steven K. Lakey, MBA, CMC Page 75
TABLE 4.1 2005, 2016 AND 2026 POPULATION OVERVIEW
NORTHERN ALBERTA SUB-REGIONS
NE NW Northern
2005 2016 2026 Change 2005-2026
% Change 2005-2026 2005 2016 2026
Change 2005-2026
% Change 2005-2026 2005 2016 2026
Change 2005-2026
% Change 2005-2026
0-4 9,080 13,390 14,510 5,430 59.8% 15,175 18,785 20,395 5,220 34.4% 24,255 32,175 34,905 10,650 43.9% 5-9 8,630 12,305 14,900 6,270 72.7% 14,230 17,860 20,135 5,905 41.5% 22,860 30,165 35,035 12,175 53.3% 10-14 9,320 10,975 14,670 5,350 57.4% 14,880 16,745 19,675 4,795 32.2% 24,200 27,720 34,345 10,145 41.9% 15-19 9,585 9,585 13,540 3,955 41.3% 14,640 14,790 18,555 3,915 26.7% 24,225 24,375 32,095 7,870 32.5% 20-24 8,990 10,370 12,485 3,495 38.9% 13,925 15,715 17,500 3,575 25.7% 22,915 26,085 29,985 7,070 30.9% 25-29 7,925 11,015 12,185 4,260 53.8% 12,985 15,765 15,850 2,865 22.1% 20,910 26,780 28,035 7,125 34.1% 30-34 8,530 11,160 13,245 4,715 55.3% 13,380 15,585 16,850 3,470 25.9% 21,910 26,745 30,095 8,185 37.4% 35-39 8,815 9,720 13,935 5,120 58.1% 12,665 13,870 16,635 3,970 31.3% 21,480 23,590 30,570 9,090 42.3% 40-44 10,250 9,625 13,580 3,330 32.5% 14,180 14,050 16,105 1,925 13.6% 24,430 23,675 29,685 5,255 21.5% 45-49 9,430 9,510 11,535 2,105 22.3% 13,005 13,150 14,120 1,115 8.6% 22,435 22,660 25,655 3,220 14.4% 50-54 7,475 10,305 10,365 2,890 38.7% 10,475 13,925 14,035 3,560 34.0% 17,950 24,230 24,400 6,450 35.9% 55-59 5,730 9,735 10,090 4,360 76.1% 8,060 13,065 12,825 4,765 59.1% 13,790 22,800 22,915 9,125 66.2% 60-64 3,915 7,665 11,100 7,185 183.5% 6,080 10,560 13,170 7,090 116.6% 9,995 18,225 24,270 14,275 142.8% 65-69 2,715 5,600 22,005 19,290 710.5% 4,655 7,715 11,765 7,110 152.7% 7,370 13,315 33,770 26,400 358.2% 70-74 2,040 3,690 16,650 14,610 716.2% 3,535 5,275 8,835 5,300 149.9% 5,575 8,965 25,485 19,910 357.1% 75-79 1,440 2,205 11,000 9,560 663.9% 2,560 3,655 5,740 3,180 124.2% 4,000 5,860 16,740 12,740 318.5% 80-84 995 1,360 6,530 5,535 556.3% 1,665 2,220 3,210 1,545 92.8% 2,660 3,580 9,740 7,080 266.2% 85-89 550 695 3,410 2,860 520.0% 790 1,140 1,610 820 103.8% 1,340 1,835 5,020 3,680 274.6% 90+ 260 280 1,110 850 326.9% 385 440 485 100 26.0% 645 720 1,595 950 147.3% TOTAL 115,675 149,190 195,200 79,525 68.7% 177,270 214,310 247,495 70,225 39.6% 292,945 363,500 442,695 149,750 51.1%

ReseCha
arch to Evaluate the Shortage of Skilled Workers in Northern Alberta pter 4 –Longer Term Demographic Issues
Prepared for The Northern Labour Market Information Clearinghouse Project By Steven K. Lakey, MBA, CMC Page 76
TABLE 4.1.1 2005, 2016 AND 2026 POPULATION OVERVIEW
NORTHERN ALBERTA, ALBERTA AND CANADA
Northern Alberta Canada
2005 2016 2026 Change
2005-2026 % Change2005-2026 2005 2016 2026
Change 2005-2026
% Change2005-2026 2005 2016 2026
Change 2005-2026
% Change 2005-2026
0-4 24,255 32,175 34,905 10,650 43.9% 206,460 232,635 231,870 25,410 12.3% 1,698,400 1,781,900 1,812,800 114,400 6.7% 5-9 22,860 30,165 35,035 12,175 53.3% 206,875 233,915 243,140 36,265 17.5% 1,882,300 1,810,700 1,910,900 28,600 1.5% 10-14 24,200 27,720 34,345 10,145 41.9% 222,675 227,900 249,160 26,485 11.9% 2,104,800 1,858,100 1,956,800 (148,000) -7.0% 15-19 24,225 24,375 32,095 7,870 32.5% 232,930 218,040 246,725 13,795 5.9% 2,145,800 2,006,400 1,990,300 (155,500) -7.2% 20-24 22,915 26,085 29,985 7,070 30.9% 242,115 237,920 244,585 2,470 1.0% 2,243,300 2,304,100 2,096,800 (146,500) -6.5% 25-29 20,910 26,780 28,035 7,125 34.1% 248,295 258,765 243,890 (4,405) -1.8% 2,194,300 2,376,700 2,241,400 47,100 2.1% 30-34 21,910 26,745 30,095 8,185 37.4% 245,410 271,640 266,600 21,190 8.6% 2,224,800 2,462,800 2,542,100 317,300 14.3% 35-39 21,480 23,590 30,570 9,090 42.3% 241,265 274,035 281,525 40,260 16.7% 2,365,800 2,462,600 2,639,600 273,800 11.6% 40-44 24,430 23,675 29,685 5,255 21.5% 276,865 262,475 286,035 9,170 3.3% 2,745,900 2,390,600 2,649,300 (96,600) -3.5% 45-49 22,435 22,660 25,655 3,220 14.4% 271,035 252,355 281,475 10,440 3.9% 2,619,500 2,431,600 2,561,700 (57,800) -2.2% 50-54 17,950 24,230 24,400 6,450 35.9% 225,390 271,285 264,045 38,655 17.2% 2,301,800 2,695,400 2,417,800 116,000 5.0% 55-59 13,790 22,800 22,915 9,125 66.2% 180,395 271,290 248,240 67,845 37.6% 2,011,500 2,614,100 2,404,500 393,000 19.5% 60-64 9,995 18,225 24,270 14,275 142.8% 129,010 227,030 259,220 130,210 100.9% 1,514,600 2,272,300 2,612,400 1,097,800 72.5% 65-69 7,370 13,315 33,770 26,400 358.2% 99,960 175,500 249,430 149,470 149.5% 1,193,500 1,942,100 2,466,600 1,273,100 106.7% 70-74 5,575 8,965 25,485 19,910 357.1% 85,130 117,950 195,900 110,770 130.1% 1,042,600 1,401,500 2,044,100 1,001,500 96.1% 75-79 4,000 5,860 16,740 12,740 318.5% 67,810 80,505 135,940 68,130 100.5% 864,300 993,300 1,610,800 746,500 86.4% 80-84 2,660 3,580 9,740 7,080 266.2% 47,060 55,940 76,865 29,805 63.3% 625,300 724,300 1,016,100 390,800 62.5% 85-89 1,340 1,835 5,020 3,680 274.6% 24,630 33,185 38,395 13,765 55.9% 322,500 465,500 560,300 237,800 73.7% 90+ 645 720 1,595 950 147.3% 11,360 12,335 12,965 1,605 14.1% 169,500 272,700 348,300 178,800 105.5% TOTAL 292,945 363,500 442,695 149,750 51.1% 3,264,670 3,714,700 4,056,005 791,335 24.2% 32,270,500 35,266,800 37,882,600 5,612,100 17.4%

Research to Evaluate the Shortage of Skilled Workers in Northern Alberta Chapter 4 –Longer Term Demographic Issues
Prepared for The Northern Labour Market Information Clearinghouse Project By Steven K. Lakey, MBA, CMC Page 77
A final caveat is that it is not possible to isolate Athabasca and Woodlands County without great difficulty given the nature of the available data. As such, the population forecasts used have the same boundaries as in Chapter 3. The Wood Buffalo – Cold Lake Sub-region corresponds to the Northeast and includes Census Divisions 12 and 16; the Athabasca – Grande Prairie Sub-region corresponds to the Northwest and includes Census Divisions 13, 17, 18 and 19. Except as noted specifically otherwise, the data sources in this Chapter are the Alberta Population Projections by Census Divisions 2004 to 2026 for Alberta and Statistics Canada projections for Canada. Key Findings 1. Between 2005 and 2026, the projected population growth rate for Northern Alberta
and its two Sub-regions (Northeast and Northwest) is faster than that of Alberta and much faster than that of all of Canada.
The population of Northern Alberta is projected to grow by 51.1% with the Northeast growing by 68.7% and the Northwest by 39.6%. In comparison, the populations of all of Alberta and Canada will grow by 24.2% and 17.4%, respectively. The following table summarizes the projected changes in population between 2005 and 2026.
COMPARISON OF OVERALL POPULATION CHANGES
BETWEEN 2005 AND 2026
Change %
Change Region 2005 2016 2026 2005-2026 2005-2026Northeast 115,675 149,190 195,200 79,525 68.7% Northwest 177,270 214,310 247,495 70,225 39.6% Northern 292,945 363,500 442,695 149,750 51.1% Alberta 3,264,670 3,714,700 4,056,005 791,335 24.2% Canada 32,270,500 35,266,800 37,882,600 5,612,100 17.4%
Discussion of Implications
Northern Alberta can expect to experience continued “growing pains” in terms of
infrastructure requirements and skills shortages. The rate of growth may create problems and opportunities that are very different than in other parts, and some effort may be required to ensure that the unique needs and differences of the Region are understood. To some extent, skills shortages may be allayed by skills surpluses in other parts of Canada where growth will be slower. Overcoming some of the current barriers such as high housing costs and infrastructure and facility deficits (discussed at greater length in Chapter 5) may be important to be able to attract the necessary workers.

Research to Evaluate the Shortage of Skilled Workers in Northern Alberta Chapter 4 –Longer Term Demographic Issues
Prepared for The Northern Labour Market Information Clearinghouse Project By Steven K. Lakey, MBA, CMC Page 78
2. As a percentage of the total, the populations of the two Sub-regions of Northern Alberta will change considerably, while the populations of Northern Alberta (relative to all of Alberta) and all of Alberta (relative to Canada) will grow slightly.
As a percentage of the total Northern population, the population of Northeastern Alberta will rise from 39.5% to 44.1% of the total and that of Northwestern Alberta will decline from 60.5% to 55.9% of the total). As a percentage of the population of all of Alberta, Northern Alberta will grow from 9.0% to 10.9%. Alberta’s population, as a percentage of all of Canada, will grow from approximately 10.0% to 10.7%. The following table provides a summary of the projected changes and the associated population figures.
CHANGES IN POPULATION OF LOWER JURISDICTIONS
IN RELATION TO TOTAL POPULATIONS
2005 % Of Pop 2016 % Of Pop 2026 % Of PopNortheast 115,675 39.5% 149,190 41.0% 195,200 44.1% Northwest 177,270 60.5% 214,310 59.0% 247,495 55.9% Northern 292,945 9.0% 363,500 9.8% 442,695 10.9% Alberta 3,264,670 10.0% 3,714,700 10.5% 4,056,005 10.7% Canada 32,270,500 100.0% 35,266,800 100.0% 37,882,600 100.0%
Discussion of Implications The Region will warrant greater representation and consideration in overall planning.
3. The characteristics and composition of the population of Northern Alberta are
considerably different from Alberta and Canada, both now (2005 data) and in the future (2026 projections).
In 2005, as noted earlier in Chapter 2, Northern Alberta’s population is younger than that of Alberta and Canada. In Northern Alberta, the six largest population age groups, with one exception (40 to 44) all were under 24 years of age and accounted for 48.8% of the population. Northwest Alberta, generally speaking, fits the overall population profile (as might be expected due to its larger population) with the six largest accounting for 49.2% of the population. In Northeastern Alberta, the population is slightly older, with the six largest age groups accounting for 49.1% of the population. In contrast, the populations of Alberta and Canada tend to have the largest concentrations in the 20 to 49 range for Alberta and 20 to 54 for Canada. In Alberta, the six largest age groups account for 47.7%, and for all of Canada, they account for 44.2%. The following table presents a summary of populations by age group sorted around Northern Alberta. In each jurisdiction, the six largest age groups are shaded.

Research to Evaluate the Shortage of Skilled Workers in Northern Alberta Chapter 4 –Longer Term Demographic Issues
Prepared for The Northern Labour Market Information Clearinghouse Project By Steven K. Lakey, MBA, CMC Page 79
2005 COMPOSITION OF POPULATION BY AGE GROUPS Age Group Northeast Northwest Northern Alberta Canada 0-4 7.80% 8.60% 8.30% 6.30% 5.30% 5-9 7.50% 8.00% 7.80% 6.30% 5.80% 10-14 8.10% 8.40% 8.30% 6.80% 6.50% 15-19 8.30% 8.30% 8.30% 7.10% 6.60% 20-24 7.80% 7.90% 7.80% 7.40% 7.00% 25-29 6.90% 7.30% 7.10% 7.60% 6.80% 30-34 7.40% 7.50% 7.50% 7.50% 6.90% 35-39 7.60% 7.10% 7.30% 7.40% 7.30% 40-44 8.90% 8.00% 8.30% 8.50% 8.50% 45-49 8.20% 7.30% 7.70% 8.30% 8.10% 50-54 6.50% 5.90% 6.10% 6.90% 7.10% 55-59 5.00% 4.50% 4.70% 5.50% 6.20% 60-64 3.40% 3.40% 3.40% 4.00% 4.40% 65-69 2.30% 2.60% 2.50% 3.10% 3.70% 70-74 1.80% 2.00% 1.90% 2.60% 3.20% 75-79 1.20% 1.40% 1.40% 2.10% 2.70% 80-84 0.90% 0.90% 0.90% 1.40% 2.00% 85-89 0.50% 0.40% 0.50% 0.80% 1.10% 90+ 0.20% 0.20% 0.20% 0.30% 0.50%
By 2016, the six largest age groups for Northern Alberta are forecast to be split between 0-4 and 20-24 and comprise 46.8% of the population. The pattern is similar in both the Northeast and Northwest Sub-regions with the proportion of the populations being 46.5% for the Northeast and 46.9% for the Northwest. On the other hand, the composition of the population for Alberta and Canada is considerably older with the six largest age groups generally in the 25 to 59 age range for Alberta and in the 30 to 59 age range for Canada. The proportion of the population in these age ranges is forecast to be 43.4% for Alberta and 42.7% for Canada. The following table presents a summary of populations by age group sorted around Northern Alberta. In each jurisdiction, the six largest are shaded.
2016 COMPOSITION OF POPULATION BY AGE GROUPS
Age Group Northeast Northwest Northern Alberta Canada 0-4 9.0% 8.8% 8.9% 6.3% 5.1% 5-9 8.2% 8.3% 8.3% 6.3% 5.1% 10-14 7.4% 7.8% 7.6% 6.1% 5.3% 15-19 6.4% 6.9% 6.7% 5.9% 5.7% 20-24 7.0% 7.3% 7.2% 6.4% 6.5% 25-29 7.4% 7.4% 7.4% 7.0% 6.7% 30-34 7.5% 7.3% 7.4% 7.3% 7.0% 35-39 6.5% 6.5% 6.5% 7.4% 7.0% 40-44 6.5% 6.6% 6.5% 7.1% 6.8% 45-49 6.4% 6.1% 6.2% 6.8% 6.9% 50-54 6.9% 6.5% 6.7% 7.3% 7.6% 55-59 6.5% 6.1% 6.3% 7.3% 7.4% 60-64 5.1% 4.9% 5.0% 6.1% 6.4% 65-69 3.8% 3.6% 3.7% 4.7% 5.5% 70-74 2.5% 2.5% 2.5% 3.2% 4.0% 75-79 1.5% 1.7% 1.6% 2.2% 2.8% 80-84 0.9% 1.0% 1.0% 1.5% 2.1% 85-89 0.5% 0.5% 0.5% 0.9% 1.3% 90+ 0.2% 0.2% 0.2% 0.3% 0.8%

Research to Evaluate the Shortage of Skilled Workers in Northern Alberta Chapter 4 –Longer Term Demographic Issues
Prepared for The Northern Labour Market Information Clearinghouse Project By Steven K. Lakey, MBA, CMC Page 80
By 2026, there starts to be a “polarization” in the population characteristics of Northern Alberta as compared to Canada, in particular, and to a lesser extent, all of Alberta. The population of Northern Alberta remains young with the six largest age groups being under 35 and comprising 44.6% of the population. The pattern is very similar for Northwestern Alberta, with the six largest accounting for 45.6%. Northeastern Alberta is projected to have a slightly older population with the six largest age groups accounting for 43.1% of the total. Alberta’s six largest age groups are, for the most part (with one exception of 60 to 64), between 30 and 54 and will account for 40.4% of the 2026 population. Nation-wide, the six largest age groups are generally n the range of 35 to 65 and account for 40.5% of the total population. The following table provides a summary of population by age group (as a percentage) with the six largest age groups in each jurisdiction highlighted.
2026 COMPOSITION OF POPULATION BY AGE GROUPS
Age Group Northeast Northwest Northern Alberta Canada 0-4 7.40% 8.20% 7.90% 5.70% 4.80% 5-9 7.60% 8.10% 7.90% 6.00% 5.00% 10-14 7.50% 7.90% 7.80% 6.10% 5.20% 15-19 6.90% 7.50% 7.20% 6.10% 5.30% 20-24 6.40% 7.10% 6.80% 6.00% 5.50% 25-29 6.20% 6.40% 6.30% 6.00% 5.90% 30-34 6.80% 6.80% 6.80% 6.60% 6.70% 35-39 7.10% 6.70% 6.90% 6.90% 7.00% 40-44 7.00% 6.50% 6.70% 7.10% 7.00% 45-49 5.90% 5.70% 5.80% 6.90% 6.80% 50-54 5.30% 5.70% 5.50% 6.50% 6.40% 55-59 5.20% 5.20% 5.20% 6.10% 6.30% 60-64 5.70% 5.30% 5.50% 6.40% 6.90% 65-69 11.30% 4.80% 5.00% 6.10% 6.50% 70-74 8.50% 3.60% 3.80% 4.80% 5.40% 75-79 5.60% 2.30% 2.50% 3.40% 4.30% 80-84 3.30% 1.30% 1.50% 1.90% 2.70% 85-89 1.70% 0.70% 0.80% 0.90% 1.50% 90+ 0.60% 0.20% 0.30% 0.30% 0.90%
Another way to look at the shifting demographics is to calculate the change in the number of individuals in each age group. The following tables shows the results of such a calculation, with the results organized according to the largest to smallest age group in all of Northern Alberta, and provides comparable data for all of Alberta and Canada.

Research to Evaluate the Shortage of Skilled Workers in Northern Alberta Chapter 4 –Longer Term Demographic Issues
Prepared for The Northern Labour Market Information Clearinghouse Project By Steven K. Lakey, MBA, CMC Page 81
AGE GROUP CHANGE IN NUMBERS FROM 2005 TO 2016 SORTED BY NORTHERN ALBERTA
Age Group Northeast Northwest Northern Alberta Canada 55-59 4,005 5,005 9,010 90,895 602,600 60-64 3,750 4,480 8,230 98,020 757,700 0-4 4,310 3,610 7,920 26,175 83,500 5-9 3,675 3,630 7,305 27,040 (71,600) 50-54 2,830 3,450 6,280 45,895 393,600 65-69 2,885 3,060 5,945 75,540 748,600 25-29 3,090 2,780 5,870 10,470 182,400 30-34 2,630 2,205 4,835 26,230 238,000 10-14 1,655 1,865 3,520 5,225 (246,700) 70-74 1,650 1,740 3,390 32,820 358,900 20-24 1,380 1,790 3,170 (4,195) 60,800 35-39 905 1,205 2,110 32,770 96,800 75-79 765 1,095 1,860 12,695 129,000 80-84 365 555 920 8,880 99,000 85-89 145 350 495 8,555 143,000 45-49 80 145 225 (18,680) (187,900) 15-19 - 150 150 (14,890) (139,400) 90+ 20 55 75 975 103,200 40-44 (625) (130) (755) (14,390) (355,300) TOTAL 33,515 37,040 70,555 450,030 2,996,300
AGE GROUP CHANGE IN NUMBERS FROM 2005 TO 2026 SORTED BY NORTHERN ALBERTA
Age Group Northeast Northwest Northern Alberta Canada 60-64 7,185 7,090 14,275 130,210 1,097,800 5-9 6,270 5,905 12,175 36,265 28,600 0-4 5,430 5,220 10,650 25,410 114,400 10-14 5,350 4,795 10,145 26,485 (148,000) 55-59 4,360 4,765 9,125 67,845 393,000 35-39 5,120 3,970 9,090 40,260 273,800 30-34 4,715 3,470 8,185 21,190 317,300 15-19 3,955 3,915 7,870 13,795 (155,500) 25-29 4,260 2,865 7,125 (4,405) 47,100 20-24 3,495 3,575 7,070 2,470 (146,500) 50-54 2,890 3,560 6,450 38,655 116,000 40-44 3,330 1,925 5,255 9,170 (96,600) 65-69 19,290 7,110 4,395 149,470 1,273,100 70-74 14,610 5,300 3,260 110,770 1,001,500 45-49 2,105 1,115 3,220 10,440 (57,800) 75-79 9,560 3,180 1,740 68,130 746,500 80-84 5,535 1,545 550 29,805 390,800 85-89 2,860 820 270 13,765 237,800 90+ 850 100 (160) 1,605 178,800
Northern Alberta will likely experience a disproportionate increase in the number of very young people. For example, the increase in the number of individuals in the age group of 5 to 9 (12,175) will be almost half of the increase for all of Canada (28,600). The number of individuals about to enter pre-retirement age (55 +) is also disproportionately high. For Northern Alberta it is 9,125 and for all of Canada, the figure is 393,000. (If ratios

Research to Evaluate the Shortage of Skilled Workers in Northern Alberta Chapter 4 –Longer Term Demographic Issues
Prepared for The Northern Labour Market Information Clearinghouse Project By Steven K. Lakey, MBA, CMC Page 82
proportional to the relative populations were to hold, the comparable figure for Canada would be in the order of 900,000.)
Discussion of Implications
Northern Alberta may be faced with stronger pressures than those faced by other jurisdictions to provide services to both the very young and the elderly. By 2016, the Northeast Sub-region, in particular, needs to be prepared for a dramatic rise in the number of “senior citizens”. Out-migration may be a mitigating factor, which cannot be determined at this time.
4. At present, the Seniors’ Dependency Ratio is low in Northern Alberta (and other
jurisdictions); however, the situation changes relatively significantly by 2026.
The current Seniors’ Dependency Ratio in Northern Alberta is (10.8% overall) with the ratio for the Northwest being slightly higher at 11.4% and slightly lower in the Northeast at 9.9%. In contrast, the ratio for all of Alberta is 14.7% and 19.0% for Canada. As the population ages and the aging groups grow at a faster rate than others, as discussed above, the Seniors’ Dependency Ratio increase to approximately 21% for Northern Alberta, 27% for Alberta and 33% for Canada. The rate of change is the highest in the Northeast Sub-region, (approximately 140% vs. in the range of approximately 78% to 98% in other jurisdictions). The ratios are summarized n the table below.
SENIORS’ DEPENDENCY RATES
Region 2005 2016 2026 %
Change2005-2026
Northeast 9.9% 14.0% 23.8% 140.0% Northwest 11.4% 14.6% 20.3% 78.6% Northern 10.8% 14.3% 21.9% 102.5% Alberta 14.7% 18.7% 27.1% 84.6% Canada 19.2% 24.1% 33.3% 73.0%
Discussion of Implications Overall, Northern Alberta will have a smaller proportion of its population of “senior citizen
age”, when compared to other parts of the province and Canada, and the “burden” that this group will place on the work force should be relatively light. However, the potential caveat is that it will be necessary to engage individuals to be part of the work force in parts of Northern Alberta where participation levels are low. Northeastern Alberta may be faced with increased pressure to provide the kinds of services that would be need by senior citizens. A proportionally higher number of “geriatric” health care providers and other community service providers may be necessary, particularly in the Northeast, where the rate of growth for the Senior citizen aged population is almost twice as fast as in other parts of Canada. As many of the aging individuals may be the “legacy” of

Research to Evaluate the Shortage of Skilled Workers in Northern Alberta Chapter 4 –Longer Term Demographic Issues
Prepared for The Northern Labour Market Information Clearinghouse Project By Steven K. Lakey, MBA, CMC Page 83
workers drawn to the area by major oilsands producers, there may be a case for an argument, that such employers should bear an increased level of responsibility for the provision of such required services.
5. The School-aged (K-12) Dependency Rate in Northern Alberta is considerably
higher than that for Alberta and all of Canada but will decline by 2026 to be more comparable to Alberta and Canada. For all of Northern Alberta, the School-aged Dependency Rate in 2005 was 35.9% (consisting of 34.1% in the Northeast and 36.6% in the Northwest). By comparison, the comparable figures for Alberta and Canada were 28.9% and 27.4%, respectively. Between 2005 and 2016, the rate increases slightly; however, by 2026, the rate declines to 21.9% for all of Northern Alberta (23.8% for the Northeast and 20.3% for the Northwest). The rates for Alberta and Canada decline slightly to 28.2% and 24.3%. The rate of change between 2005 and 2026 is the highest in the Northwest Sub-region (-44.5%) and the lowest for “all of Alberta” (-2.5%). The following table presents a summary and comparison of the rates.
SCHOOL-AGED DEPENDENCY RATES
Region 2005 2016 2026 %
Change2005-2026
Northeast 34.1% 37.2% 23.8% -30.3% Northwest 36.6% 38.0% 20.3% -44.5% Northern 35.9% 37.7% 21.9% -39.0% Alberta 28.9% 27.3% 28.2% -2.5% Canada 27.4% 22.7% 24.3% -11.6%
Discussion of Implications School-aged individuals, as a percentage of the “working population” (15 to 64 population) will rise slightly between 2005 and 2016 but the proportion will decline by 2026, as will the proportion of skills required to serve this group. However, as noted in point 3, above, the number of individuals of school age will increase more rapidly than in other parts of Canada, which may require that the current level of skills and services directed toward this group remain more or less constant.
6. The current Job-entry to Retirement rate in Northern Alberta is very high compared
to Alberta and Canada and will decline significantly 2026.
At present, across all of Northern Alberta (including both Sub-regions), the number of people of job-entry age is approximately twice the number of people of pre-retirement age, (as demonstrated by the figures of close to 2.00 in the table below). In comparison, the comparable figures are approximately 1.5 times for Alberta and only 1.2 times for Canada. However, with aging “Baby Boomers”, over the next 10 years, the ratio declines

Research to Evaluate the Shortage of Skilled Workers in Northern Alberta Chapter 4 –Longer Term Demographic Issues
Prepared for The Northern Labour Market Information Clearinghouse Project By Steven K. Lakey, MBA, CMC Page 84
significantly. For Northern Alberta, the ratio remains positive in the range of 1.14 to 1.29. For “all of Alberta” and Canada, it will be less than “1”, meaning that there will be fewer people entering the labour force than those planning to leave. By 2026, as the large numbers of very young people in Northern Alberta become of job-entry age, the ratio improves slightly for Northern Alberta but continues to decline for “all of Alberta (.97) and Canada (.8). The rate of change is the highest in the Northeast Sub-region (approximately -36%) vs. approximately -31% for the Northwest Sub-region, -37% for Alberta and -32% for all of Canada. The following table provides a summary and comparison of Job-entry vs. Pre-retirement rates.
JOB-ENTRY VS PRE-RETIREMENT RATES
Region 2005 2016 2026 %
Change2005-2026
Northeast 1.926 1.147 1.228 -36.2% Northwest 2.02 1.291 1.387 -31.3% Northern 1.982 1.230 1.316 -33.6% Alberta 1.535 .915 0.968 -36.9% Canada 1.245 .882 0.815 -32.4%
Discussion of Implications This trend has serious potential implications. Given low participation rates within the
Aboriginal population, there may be fewer people entering the work force than people leaving. Furthermore, Northern Alberta may be faced with a situation whereby the opportunities created in other parts of Canada result in a departure of the labour force, particularly if housing costs remain high and services and infrastructure are not on a par with those in other parts of Alberta and Canada. Barring radical changes in the base of the economy or technological advances that may reduce the need for skills, the trend reinforces the imperative of fully engaging the potential labour pool in Northern Alberta and to provide the necessary training over the next 20 years.
7. Despite a slight decline between 2005 and 2016, Northern Alberta will have a higher
proportion of school-aged compared to post-secondary-aged individuals than in other parts of Canada.
In 2005, the ratio of school-aged to post-secondary aged individuals in Northern Alberta was approximately 1.6 to 1 (and relatively consistent across both Sub-regions). The comparable figures for all of Alberta and Canada were approximately 1.3 to 1.4. By 2016, the ratio for Northern Alberta declines slightly to approximately 1.5 before climbing back to approximately 1.75 by 2026. “All of Alberta” and Canada are faced with slightly different scenarios. For “all of Alberta”, the ratio climbs to approximately 1.37 by 2016 and 1.51 by 2026. Nation-wide, the ratio dips slightly by 2016 to 1.21 before recovering to approximately 1.51 by 2026. Over the period 2005 to 22026, the percentage change is approximately 7% to 8% in Northern Alberta, 12% in Alberta and –2.3% for Canada. The

Research to Evaluate the Shortage of Skilled Workers in Northern Alberta Chapter 4 –Longer Term Demographic Issues
Prepared for The Northern Labour Market Information Clearinghouse Project By Steven K. Lakey, MBA, CMC Page 85
following table provides a summary and comparison of the School-aged vs. Post-secondary-aged ratios.
SCHOOL-AGED VS. POST-SECONDARY-AGED RATES
Region 2005 2016 2026 %
Change2005-2026
Northeast 1.63 1.537 1.75 7.3% Northwest 1.63 1.569 1.75 7.7% Northern 1.64 1.556 1.75 6.9% Alberta 1.35 1.369 1.51 12.0% Canada 1.38 1.212 1.35 -2.3%
Discussion of Implications Should the Aboriginal population be more engaged to receive training and participate in the labour force, there might be disproportionate pressure to provide services to the group. The rapid increase in the numbers of individuals of school age and post-secondary age referenced earlier may create additional pressures for related skills. After 2026, there is potential that these individuals may be able to play an active and productive role in addressing the shortage of skills. II. A More Detailed Review of the Two Sub-regions The analysis used for this Section of the report is based upon data and methodology that are slightly different from what was to develop the discussion in the preceding Section. The data points are every second year. In addition, instead of a “post-secondary” age group covering 20-29, a new category of “post-secondary/early working” covering ages 20 to 24 has been used, and the category of “Prime Working Age” (25 to 64) has been substituted for the older labour force definition of ages 15 to 64. Tables 4.2 (Northeast) and 4.2.1 (Northwest) present the data used for the analysis. The following definitions were used for this analysis:
Preschool School Postsecondary/
Early Working Prime Working Retired
Age in Years 0 to 4 5 to 19 20-24 25 to 64 65 + Northeast Sub-region The discussion and analysis for the Northeast Sub-region are based upon the Alberta Finance “High Growth” scenario for Census Division 16 and “Medium Growth” scenario for Census Division 12. The analysis is based upon a calculation of the biennial change (Increase or decrease) in the number of individuals in each of the categories as defined above.
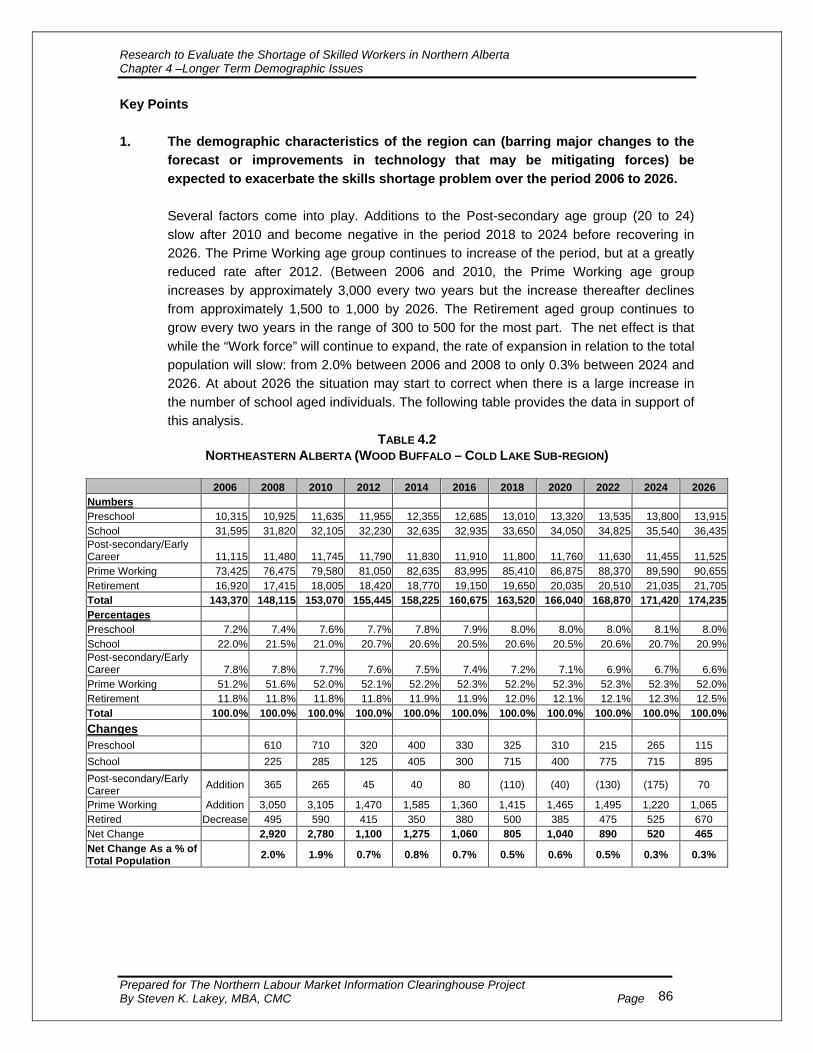
Research to Evaluate the Shortage of Skilled Workers in Northern Alberta Chapter 4 –Longer Term Demographic Issues
Prepared for The Northern Labour Market Information Clearinghouse Project By Steven K. Lakey, MBA, CMC Page 86
Key Points 1. The demographic characteristics of the region can (barring major changes to the
forecast or improvements in technology that may be mitigating forces) be expected to exacerbate the skills shortage problem over the period 2006 to 2026.
Several factors come into play. Additions to the Post-secondary age group (20 to 24) slow after 2010 and become negative in the period 2018 to 2024 before recovering in 2026. The Prime Working age group continues to increase of the period, but at a greatly reduced rate after 2012. (Between 2006 and 2010, the Prime Working age group increases by approximately 3,000 every two years but the increase thereafter declines from approximately 1,500 to 1,000 by 2026. The Retirement aged group continues to grow every two years in the range of 300 to 500 for the most part. The net effect is that while the “Work force” will continue to expand, the rate of expansion in relation to the total population will slow: from 2.0% between 2006 and 2008 to only 0.3% between 2024 and 2026. At about 2026 the situation may start to correct when there is a large increase in the number of school aged individuals. The following table provides the data in support of this analysis.
TABLE 4.2 NORTHEASTERN ALBERTA (WOOD BUFFALO – COLD LAKE SUB-REGION)
2006 2008 2010 2012 2014 2016 2018 2020 2022 2024 2026
Numbers Preschool 10,315 10,925 11,635 11,955 12,355 12,685 13,010 13,320 13,535 13,800 13,915School 31,595 31,820 32,105 32,230 32,635 32,935 33,650 34,050 34,825 35,540 36,435Post-secondary/Early Career 11,115 11,480 11,745 11,790 11,830 11,910 11,800 11,760 11,630 11,455 11,525Prime Working 73,425 76,475 79,580 81,050 82,635 83,995 85,410 86,875 88,370 89,590 90,655Retirement 16,920 17,415 18,005 18,420 18,770 19,150 19,650 20,035 20,510 21,035 21,705Total 143,370 148,115 153,070 155,445 158,225 160,675 163,520 166,040 168,870 171,420 174,235Percentages Preschool 7.2% 7.4% 7.6% 7.7% 7.8% 7.9% 8.0% 8.0% 8.0% 8.1% 8.0%School 22.0% 21.5% 21.0% 20.7% 20.6% 20.5% 20.6% 20.5% 20.6% 20.7% 20.9%Post-secondary/Early Career 7.8% 7.8% 7.7% 7.6% 7.5% 7.4% 7.2% 7.1% 6.9% 6.7% 6.6%Prime Working 51.2% 51.6% 52.0% 52.1% 52.2% 52.3% 52.2% 52.3% 52.3% 52.3% 52.0%Retirement 11.8% 11.8% 11.8% 11.8% 11.9% 11.9% 12.0% 12.1% 12.1% 12.3% 12.5%Total 100.0% 100.0% 100.0% 100.0% 100.0% 100.0% 100.0% 100.0% 100.0% 100.0% 100.0%Changes Preschool 610 710 320 400 330 325 310 215 265 115 School 225 285 125 405 300 715 400 775 715 895 Post-secondary/Early Career Addition 365 265 45 40 80 (110) (40) (130) (175) 70
Prime Working Addition 3,050 3,105 1,470 1,585 1,360 1,415 1,465 1,495 1,220 1,065 Retired Decrease 495 590 415 350 380 500 385 475 525 670 Net Change 2,920 2,780 1,100 1,275 1,060 805 1,040 890 520 465 Net Change As a % of Total Population 2.0% 1.9% 0.7% 0.8% 0.7% 0.5% 0.6% 0.5% 0.3% 0.3%

Research to Evaluate the Shortage of Skilled Workers in Northern Alberta Chapter 4 –Longer Term Demographic Issues
Prepared for The Northern Labour Market Information Clearinghouse Project By Steven K. Lakey, MBA, CMC Page 87
Northwest Sub-region Key Points 1. The demographic characteristics of the Northwest Sub-region may also exacerbate
the skills shortage problem, particularly over the period 2018 to 2026.
The factors are more pronounced than in the Northeast Sub-region. Growth in the “Post-secondary” age group becomes negative between 2016 and 2020 before changing in 2022 and increasing rapidly between 2024 and 2026 (from approximately 120 to 940 and to over 1,200). The growth in the “Prime Working” age population is at a rate that is declining rapidly (from approximately 4,000 entrants every two years between 2006 to 2016 to approximately 1,200 by 2026). The number of retirees experiences significant growth (from approximately 1,500 between 2026 and 2008 to over 3,000 between 2024 and 2026. The net effect is that the work force actually experiences a net decline of between 600 and 900 every two years from 2020 and on. When the net change is calculated as a percentage of the total population, the problem is more obvious. Rather than increasing, the work force actually decreases in real terms. The “School-aged” population increases rapidly in the period of 2014 to 2022 but not fast enough to compensate for the “withdrawals” of retirees. The following table provides the data in support of this analysis.
TABLE 4.2.1 NORTHWESTERN ALBERTA (ATHABASCA – GRANDE PRAIRIE SUB-REGION)
2006 2008 2010 2012 2014 2016 2018 2020 2022 2024 2026
Preschool 20,305 21,150 22,030 22,945 23,840 24,610 25,150 25,500 25,740 25,975 26,295School 58,520 59,265 59,900 60,830 62,345 64,180 66,725 69,430 72,165 74,335 76,290Post-secondary/Early Career 19,765 20,435 20,755 21,015 21,175 20,960 20,565 20,315 20,435 21,380 22,600Prime Working 128,355 132,730 137,650 142,195 146,085 150,140 153,505 156,060 158,075 159,580 160,795Retirement 23,555 25,005 26,450 28,185 30,250 32,315 34,755 37,710 40,760 43,875 47,000Total 250,500 258,585 266,785 275,170 283,695 292,205 300,700 309,015 317,175 325,145 332,980 Preschool 8.10% 8.20% 8.30% 8.30% 8.40% 8.40% 8.40% 8.30% 8.10% 8.00% 7.90%School 23.40% 22.90% 22.50% 22.10% 22.00% 22.00% 22.20% 22.50% 22.80% 22.90% 22.90%Post-secondary/Early Career 7.90% 7.90% 7.80% 7.60% 7.50% 7.20% 6.80% 6.60% 6.40% 6.60% 6.80%Prime Working 51.20% 51.30% 51.60% 51.70% 51.50% 51.40% 51.00% 50.50% 49.80% 49.10% 48.30%Retirement 9.40% 9.70% 9.90% 10.20% 10.70% 11.10% 11.60% 12.20% 12.90% 13.50% 14.10%Total 100.0% 100.0% 100.0% 100.00% 100.0% 100.0% 100.0% 100.0% 100.00% 100.00% 100.00%Changes Preschool 845 880 915 895 770 540 350 240 235 320School 745 635 930 1,515 1,835 2,545 2,705 2,735 2,170 1,955
Post-secondary Addition 670 320 260 160 -215 -395 -250 120 945 1,220Prime Working Addition 4,375 4,920 4,545 3,890 4,055 3,365 2,555 2,015 1,505 1,215Retired Decrease 1,450 1,445 1,735 2,065 2,065 2,440 2,955 3,050 3,115 3,125Net Change 3,595 3,795 3,070 1,985 1,775 530 -650 -915 -665 -690Net Change As a % of Total Population 1.40% 1.50% 1.20% 0.70% 0.60% 0.20% -0.20% -0.30% -0.20% -0.20%

Research to Evaluate the Shortage of Skilled Workers in Northern Alberta Chapter 4 –Longer Term Demographic Issues
Prepared for The Northern Labour Market Information Clearinghouse Project By Steven K. Lakey, MBA, CMC Page 88
Discussion of Implications The demographic characteristics and profile of Northern Alberta, particularly over the period of approximately 2014 to 2018 are not likely to contribute to an easing of skills shortages. Rather, they support the imperative of ensuring that each individual has the best education and training to support his or her potential; as to use an analogy, “all hands will need to be on deck to row the boat”. It will be vital for planners at colleges to take appropriate measures.

Research to Evaluate the Shortage of Skilled Workers in Northern Alberta Chapter 5 - Training and Skills Requirements
Prepared for The Northern Labour Market Information Clearinghouse Project By Steven K. Lakey, MBA, CMC Page
89
Chapter 5 Training and Skills Requirements
The purpose of this Chapter is to provide more detail with respect to the training and skills requirements associated with the Occupational Categories discussed in Chapter 3. The focus of this Chapter is both “Macro” and “Micro”. Section I addresses training requirements from a higher level, systemic perspective and Section II provides more a more detailed review of training requirements for a more select group of occupations. An addendum provides considerably more detail pertaining to duties, educational requirements and existing training programs for potential priority occupations. I. Training and Skills Requirements From a Macro-Perspective The primary objective of this Section is to convey an overview of training and skills requirements according to skill level and subject matter. To do so, the Section makes use of the “representative” occupations used to develop indicators of employers’ concerns in Chapter 3. Based upon the NOC codes utilized in Section F of Chapter 3, it possible to develop a profile of training and skills requirements for the Northern Alberta Region and the Wood Buffalo – Cold Lake and Athabasca – Grande Prairie Sub-regions as each NOC code contains such information. From the Preamble to Chapter 3, readers will recall that the NOC system is broken into 10 major occupational groups with a numerical code as follows:
• 0: Management Occupations • 1: Business, Finance and Administration • 2: Natural and Applied Sciences • 3: Health Occupations • 4: Social Science, Education, Government and Religion • 5: Art, Culture, Recreation and Sport • 6: Sales and Service • 7: Trades and Transport Equipment Operators • 8: Unique to Primary Industry • 9: Unique to Processing Manufacturing and Utilities
The occupational groups are broken down further according to the skill level required. There are four skill levels as follows: • Skill Level “A”: graduation from university – NOC codes starting with “1”; • Skill Level “B”: completion of a college or apprenticeship program – NOC codes starting with “2” or
“3”; • Skill Level “C”: completion of secondary school or specialized training – NOC codes starting with “4”
or “5”; and • Skill Level “D”: On-the-Job Training – NOC codes starting with “6”.
The final two digits of the NOC codes refer to the specific occupation and are of minor importance for this analysis.
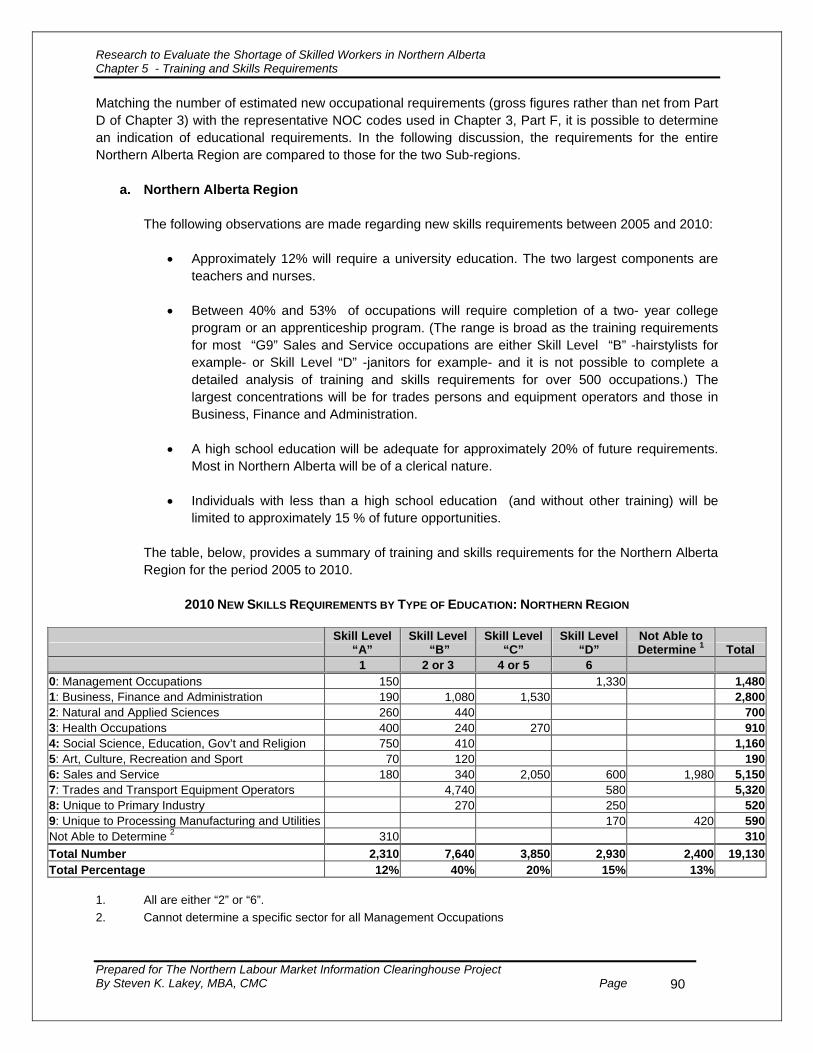
Research to Evaluate the Shortage of Skilled Workers in Northern Alberta Chapter 5 - Training and Skills Requirements
Prepared for The Northern Labour Market Information Clearinghouse Project By Steven K. Lakey, MBA, CMC Page
90
Matching the number of estimated new occupational requirements (gross figures rather than net from Part D of Chapter 3) with the representative NOC codes used in Chapter 3, Part F, it is possible to determine an indication of educational requirements. In the following discussion, the requirements for the entire Northern Alberta Region are compared to those for the two Sub-regions.
a. Northern Alberta Region
The following observations are made regarding new skills requirements between 2005 and 2010:
• Approximately 12% will require a university education. The two largest components are teachers and nurses.
• Between 40% and 53% of occupations will require completion of a two- year college
program or an apprenticeship program. (The range is broad as the training requirements for most “G9” Sales and Service occupations are either Skill Level “B” -hairstylists for example- or Skill Level “D” -janitors for example- and it is not possible to complete a detailed analysis of training and skills requirements for over 500 occupations.) The largest concentrations will be for trades persons and equipment operators and those in Business, Finance and Administration.
• A high school education will be adequate for approximately 20% of future requirements.
Most in Northern Alberta will be of a clerical nature. • Individuals with less than a high school education (and without other training) will be
limited to approximately 15 % of future opportunities.
The table, below, provides a summary of training and skills requirements for the Northern Alberta Region for the period 2005 to 2010.
2010 NEW SKILLS REQUIREMENTS BY TYPE OF EDUCATION: NORTHERN REGION
Skill Level
“A” Skill Level
“B” Skill Level
“C” Skill Level
“D” Not Able to Determine 1 Total
1 2 or 3 4 or 5 6 0: Management Occupations 150 1,330 1,4801: Business, Finance and Administration 190 1,080 1,530 2,8002: Natural and Applied Sciences 260 440 7003: Health Occupations 400 240 270 9104: Social Science, Education, Gov’t and Religion 750 410 1,1605: Art, Culture, Recreation and Sport 70 120 1906: Sales and Service 180 340 2,050 600 1,980 5,1507: Trades and Transport Equipment Operators 4,740 580 5,3208: Unique to Primary Industry 270 250 5209: Unique to Processing Manufacturing and Utilities 170 420 590Not Able to Determine 2 310 310Total Number 2,310 7,640 3,850 2,930 2,400 19,130Total Percentage 12% 40% 20% 15% 13%
1. All are either “2” or “6”. 2. Cannot determine a specific sector for all Management Occupations

Research to Evaluate the Shortage of Skilled Workers in Northern Alberta Chapter 5 - Training and Skills Requirements
Prepared for The Northern Labour Market Information Clearinghouse Project By Steven K. Lakey, MBA, CMC Page
91
b. Wood Buffalo – Cold Lake Sub-region The following observations are made regarding new skills requirements between 2005 and 2010:
• The proportion of occupations that will require a university education is slightly lower than for the Region as a whole (11% vs. 12%); however, the two largest components are still teachers and nurses.
• Between 44% and 56% of occupations will require completion of a two- year college
program or an apprenticeship program. (The reason for the range is the same as for the entire Region; it is not possible to separate the training requirements for some of the Sales and Service occupations.) The largest concentrations are the same as for the entire Region; however, the weightings have differences. Trades persons and equipment operators will account for 69% of those requiring such training (as compared to 62% for the entire Northern Region) and those in Business, Finance and Administration will account for only 12% as compared to 14% for the entire Region.
• 16% of occupations will require a high school education (as compared to approximately
20% for the entire Region) of future requirements. Most occupations requiring high school level training are also clerical nature.
• Individuals with less than a high school education will be limited to approximately 17% of
opportunities compared to 15 % for the entire Region.
The table, below, provides a summary of training and skills requirements for the Wood Buffalo – Cold Lake Sub-region for the period 2005 to 2010.
2010 NEW SKILLS REQUIREMENTS BY TYPE OF EDUCATION: WOOD BUFFALO – COLD LAKE SUB-REGION
Skill Level
“A” Skill Level
“B” Skill Level
“C” Skill Level
“D” Not Able to Determine 1 Total
1 2 or 3 4 or 5 6 0: Management Occupations 70 670 7401: Business, Finance and Administration 110 530 700 1,3402: Natural and Applied Sciences 189 280 4693: Health Occupations 160 70 100 3304: Social Science, Education, Gov’t and Religion 320 130 4505: Art, Culture, Recreation and Sport 20 50 706: Sales and Service 100 220 850 250 990 2,4107: Trades and Transport Equipment Operators 0 3,030 410 3,4408: Unique to Primary Industry 0 130 160 2909: Unique to Processing Manufacturing and Utilities 30 60 180 270Not Able to Determine 2 170 170
Total Number 1,139 4,400 1,620 1,650 1,170 9,979
Total Percentage 11% 44% 16% 17% 12% 1. All are either “2” or “6”. 2. Cannot determine a specific sector for all Management Occupations

Research to Evaluate the Shortage of Skilled Workers in Northern Alberta Chapter 5 - Training and Skills Requirements
Prepared for The Northern Labour Market Information Clearinghouse Project By Steven K. Lakey, MBA, CMC Page
92
c. Athabasca – Grande Prairie Sub-region
Generally speaking, the skills requirements are more diversified than for the entire Northern Region but on balance somewhat lower. The following observations are made regarding new skills requirements between 2005 and 2010:
• The percentage of occupations that will require a university education is higher than for the Region as a whole (13% vs. 12%); and the two largest components are still teachers and nurses.
• Between 39% and 50% of occupations will require completion of a two- year college
program or an apprenticeship program. (The reason for the range is the same as for the entire Region; it is not possible to separate the training requirements for some of the Sales and Service occupations.) The largest concentrations are the same as for the entire Region; however, the weightings have differences. Trades persons and equipment operators will account for only 48% (compared to 69% for Wood Buffalo – Cold Lake and 62% for the entire Region). Business, Finance and Administration will account for 18% compared to 14% for the entire Region and 12% for Wood Buffalo - Cold Lake.
• 24% of occupations will require a high school education (as compared to approximately
20% for the entire Region and 16% for Wood Buffalo – Cold Lake). Most are also clerical nature; however, proportionally there will be more.
• Individuals with less than a high school education will be limited to 14% of opportunities
compared to 17% for Wood Buffalo – Cold Lake and 15 % for the entire Region.
The table, below, provides a summary of training and skills requirements for the Woodlands – Cold Lake Sub-region for the period 2005 to 2010.
2010 NEW SKILLS REQUIREMENTS BY TYPE OF EDUCATION: ATHABASCA – GRANDE PRAIRIE SUB-REGION
Skill Level
“A” Skill Level
“B” Skill Level
“C” Skill Level
“D” Not Able to Determine 1 Total
1 2 or 3 4 or 5 6 0: Management Occupations 80 580 660
1: Business, Finance and Administration 80 630 830 1,540
2: Natural and Applied Sciences 80 160 240
3: Health Occupations 240 170 170 580
4: Social Science, Education, Gov’t and Religion 430 280 710
5: Art, Culture, Recreation and Sport 50 70 120
6: Sales and Service 80 150 1,170 350 990 2,740
7: Trades and Transport Equipment Operators 1,710 170 1,880
8: Unique to Primary Industry 140 90 230
9: Unique to Processing Manufacturing and Utilities 290 110 400
Not Able to Determine 2 140 140
Total Number 1,180 3,600 2,170 1,300 990 9,240
Total Percentage 13% 39% 24% 14% 11% 1. All are either “2” or “6”. 2. Cannot determine a specific sector for all Management Occupations

Research to Evaluate the Shortage of Skilled Workers in Northern Alberta Chapter 5 - Training and Skills Requirements
Prepared for The Northern Labour Market Information Clearinghouse Project By Steven K. Lakey, MBA, CMC Page
93
II. Training and Skills Requirements for Select Occupations This Section, in conjunction with Appendix 1, provides a more detailed discussion of the training and skills requirements for 32 select occupations. The process and rationale for the selection of the occupations is discussed in the next Part.
The selection of the occupations was based upon attempting to strike a balance among a number of elements: • In the first place, it was desirable to focus on the Occupational Categories or occupations perceived
to have the greatest perceived “need”. A rating system was developed based upon three criteria from Chapter 3: the number of new individuals required between 2005 and 2010; the average annual growth rate for the Occupational Category over the period 2005 to 2010; and the relative size of the Occupational Category in 2005 (percentage of the total number of occupations. Each of the Occupational Categories was ranked from “1” to “47” based upon the criteria and a “total score being the sum of the three factors was calculated. The results of the process are summarized in Table 5.1.
Other factors that came into play on a somewhat more subjective basis but acted as “checks and balances” included: vacancy rates and hiring difficulties in 2005; the industrial base of the Region and Sub-regions; as well as the longer-term impact of population and demographic trends.
• The second factor was to attempt to ensure that the majority of the occupations would be somewhat
more in keeping with the existing strengths of the colleges in the Clearinghouse system and their student bodies; e.g. would the colleges be able to exert some influence to satisfy the skill shortage?
• Thirdly, notwithstanding the above, it was desirable to ensure that there was some representation
among key sectors of the economy. While there are a number of more formal industrial classification systems, such as the North American Industry Classification System – 1997, the criteria and definitions used were too broad or not in keeping with the composition of the Northern Alberta economy. For this reason and to ensure that there were practical boundaries for other aspects of the study, the following sectors were agreed to during an interim briefing session:
o A category to capture occupations that transcend multiple sectors (Multiple) o Ongoing and operational Service Sector including “Retail, Financial and Hospitality”
components (Service) o Ongoing Oil and Gas Exploration o Health, Social Work and Education (HSE) o Ongoing and operational Forestry (Forestry) o Ongoing and operational Oilsands (Oilsands) o Construction through to 2013 (Construction)
Each Occupational Category can have more than one specific occupation. As such, and based upon the preceding criteria, the occupational categories and occupations covered in this Chapter are summarized in Table 4.2

ReseCha
arch to Evaluate the Shortage of Skilled Workers in Northern Alberta pter 5 - Training and Skills Requirements
Prepared for The Northern Labour Market Information Clearinghouse Project By Steven K. Lakey, MBA, CMC Page
94
TABLE 5.1: OCCUPATIONAL CATEGORY PRIORITIZATION
Occupational Category New Jobs2005-2010
% Change2005-2010
Size of 2005
Workforce Total
Points
G9 Sales and service occupations, n.e.c. 3 6 4 13 B5 Clerical occupations 1 13 2 16 H7 Transportation equipment operators 4 1 11 16 G2 Retail salespersons and sales clerks 5 4 10 19 A2 Managers in retail trade, food and accommodation 2 20 1 23 H1 Construction trades 6 11 8 25 H4 Mechanics 8 2 19 29 G3 Cashiers 9 7 15 31 H8 Helpers, construction and transportation labourers 11 15 12 38 H6 Heavy equipment and crane operators, including drillers 14 9 21 44 E1 Teachers and professors 7 34 6 47 A3 Other managers, n.e.c. 10 28 9 47 C1 Technical related to natural and applied sciences 16 22 16 54 B2 Secretaries 17 10 27 54 J1 Machine operators in manufacturing 18 14 22 54 E2 Paralegals, social services, education and religion n.e.c. 13 29 13 55 G8 Child care and home support workers 12 39 7 58 H2 Stationary engineers, power station operators 20 3 35 58 H3 Machinists, metal forming, shaping and erecting 15 32 14 61 G1 Wholesale, technical, insurance, real estate sales 19 27 18 64 A1 Specialist managers 21 12 31 64 B3 Administrative and regulatory occupations 22 13 29 64 G5 Occupations in food and beverage service 25 18 28 71 H0 Contractors and supervisors in trades and transportation 23 24 26 73 D1 Nurse supervisors and registered nurses 28 44 5 77 B1 Finance and insurance administration occupations 32 8 37 77 D3 Assisting occupations in support of health services 27 19 32 78 I1 Forestry, mining, oil and gas (excluding labourers) 24 41 17 82 C0 Professional in natural and applied sciences 38 5 43 86 G4 Chefs and cooks 26 42 20 88 I2 Primary production labourers 29 36 25 90 D2 Technical and related occupations in health 33 23 34 90 G6 Occupations in protective services 30 38 23 91 B0 Professional occupations in business and finance 37 16 38 91 E0 Psychologists, social workers, ministers, policy officers 31 40 24 95 G0 Sales and service supervisors 47 47 3 97 H5 Other trades, n.e.c. 34 33 36 103 J3 Labourers in processing, manufacturing and utilities 39 25 39 103 A0 Senior management occupations 35 37 33 105 D0 Professional occupations in health 43 17 45 105 F1 Technical art, culture, recreation and sport 36 43 30 109 G7 Occupations in travel and accommodation and sport 42 26 42 110 B4 Clerical supervisors 40 30 41 111 F0 Professional occupations in art and culture 45 21 46 112 J2 Assemblers in manufacturing 41 35 40 116 J0 Supervisors in manufacturing 44 31 44 119 I0 Occupations unique to agriculture (excluding labourers) 46 46 47 139
Table 5.2 provides an overview of the Occupational Categories and occupations reviewed in more detail in Appendix 1.

Research to Evaluate the Shortage of Skilled Workers in Northern Alberta Chapter X - Training and Skills Requirements
Prepared for The Northern Labour Market Information Clearinghouse Project By Steven K. Lakey, MBA, CMC Page
95
TABLE 5.2: PROPOSED OCCUPATIONAL CATEGORIES AND OCCUPATIONS SELECTED FOR MORE DETAILED ANALYSIS Applicable to Multiple
Sectors Service Sector Oil and Gas
Exploration HSE Ongoing Oilsands Forestry Construction
H4 – Mechanics 7312
Heavy Duty 7321
Automotive Service Techs
A2 - Retail Trade Managers and Supervisors
0621 Retail Trade Managers
0631 Restaurant and Food
Service Managers
I1 - Oil and Gas Well Drilling Workers
8232 Rig Technicians
8412 Oil and Gas Well
Loggers and Testers
E1 - Teachers and Professors
4132 Elementary Teachers
C1 - Technical Occupations in Civil,
Mechanical and Industrial Engineering
2213 Environmental Auditors
I1 – Operations Unique to Forestry
Excluding Labourers
8241 Logging Machine
Operators
H8 - Other Trades Helpers and Labourers
7611 Construction Trades
Helpers and Labourers
H6 - Heavy Equipment Operators
7421 Heavy Equipment
Operators 7411
Truck Drivers 7371
Crane Operators
G2 - Retail Salespersons and
Sales Clerks 6421
Retail Salespersons and Sales Clerks
C0 - Professional in Natural and Applied
Sciences 2132
Mechanical Engineers
G8 - Childcare and Home Support
Workers 6474
Babysitters
H2 - Stationary Engineers, Power Station Operators
7352 Power Engineer
J1 - Machine Operators in
Manufacturing 9431
Sawmill Machine Operators
H0 - Trades Contractors and
Supervisors 7212
Electrical Contractors
B5 - Clerical 1471
Shippers and Receivers
1432 Payroll Clerks
G9 - Sales and Service nec
6271 Hairstylists
6651 Security Guards
D1 - Nurse Supervisors and
Registered Nurses 3152
Registered Nurses
H1 – Construction Trades 7261
Sheet Metal Workers 7264
Ironworkers 7271
Carpenters G4 - Chefs and Cooks
6242 Cooks
G3 - Cashiers 6611
Cashiers
E0 (22) Social Workers
4152 Social Workers
B3 - Administrative and Regulatory
Occupations 1225
Purchasing Agents and Officers
D3 - Assisting Occupations in
Support of Health Services
3411 Dental Assistants
Research to Evaluate the Shortage of Skilled Workers in Northern Alberta Chapter 6 – Factors and Trends That May Affect Skills Shortages
Prepared for The Northern Labour Market Information Clearinghouse Project By Steven K. Lakey, MBA, CMC Page 96
Chapter 6 Factors and Trends That May Affect Skills Shortages
The purpose of this Chapter is to provide an overview and analysis of some of the major factors and forces that may affect skills shortages in Northern Alberta. In so doing, it examines:
Selected Technological and Innovation Changes; Some Potential Changing Priorities and Emerging Opportunities; and Perceptions and Expectations.
I. Technological Innovation and Changes The potential impact of technology is seen in two ways: it can reduce the need for workers and alleviate skills shortages in some cases; and it can require the need for new skills and training, which may exacerbate skills shortages. This Part of the report contains a review of some of the potential impacts of select technology advances (and need for advances, in some cases) for some of the Occupational Categories, occupations and industries that are of importance to Northern Alberta, and alluded to in Chapter 3. Oil and Gas Exploration I1 – Oil and gas Well Drilling Contractors C1 – Professional Occupations in Natural and Applied Science C2 – Technical Occupations in Natural and Applied Science Some of the major recent technological innovations in the exploration and production sector 1 include: 3-D and 4-D Seismic Imaging - The development of seismic imaging in three dimensions greatly changed the nature of natural gas exploration. This technology uses traditional seismic imaging techniques, combined with powerful computers and processors, to create a three-dimensional model of the subsurface layers. 4-D seismology expands on this, by adding time as a dimension, allowing exploration teams to observe how subsurface characteristics change over time. Exploration teams can now identify natural gas prospects more easily, place wells more effectively, reduce the number of dry holes drilled, reduce drilling costs, and cut exploration time. This leads to both economic and environmental benefits. CO2-Sand Fracturing - Fracturing techniques have been used since the 1970s to help increase the flow rate of natural gas and oil from underground formations. CO2-Sand fracturing involves using a mixture of sand propants and liquid CO2 to fracture formations, creating and enlarging cracks through which oil and natural gas may flow more freely. The CO2 then vaporizes, leaving only sand in the formation, holding the newly enlarged cracks open. Because there are no other substances used in this type of fracturing, there are no 'leftovers' from the fracturing process that must be removed. This means that, while this type of fracturing effectively opens the formation
1 http://www.naturalgas.org/environment/technology.asp

Research to Evaluate the Shortage of Skilled Workers in Northern Alberta Chapter 6 – Factors and Trends That May Affect Skills Shortages
Prepared for The Northern Labour Market Information Clearinghouse Project By Steven K. Lakey, MBA, CMC Page 97
and allows for increased recovery of oil and natural gas, it does not damage the deposit, generates no below ground wastes, and protects groundwater resources. Coiled Tubing - Coiled tubing technologies replace the traditional rigid, jointed drill pipe with a long, flexible coiled pipe string. This greatly reduces the cost of drilling, as well as providing a smaller drilling footprint, requiring less drilling mud, faster rig set up, and reducing the time normally needed to make drill pipe connections. Coiled tubing can also be used in combination with slimhole drilling to provide very economic drilling conditions, and less impact on the environment. Measurement While Drilling - Measurement-While-Drilling (MWD) systems allow for the collection of data from the bottom of a well as it is being drilled. This allows engineers and drilling teams access to up to the second information on the exact nature of the rock formations being encountered by the drill bit. This improves drilling efficiency and accuracy in the drilling process, allows better formation evaluation as the drill bit encounters the underground formation, and reduces the chance of formation damage and blowouts. Slimhole Drilling - Slimhole drilling is exactly as it sounds; drilling a slimmer hole in the ground to get to natural gas and oil deposits. In order to be considered slimhole drilling, at least 90 percent of a well must be drilled with a drill bit less than six inches in diameter (whereas conventional wells typically use drill bits as large as 12.25 inches in diameter). Slimhole drilling can significantly improve the efficiency of drilling operations, as well as decrease its environmental impact. In fact, shorter drilling times and smaller drilling crews can translate into a 50 percent reduction in drilling costs, while reducing the drilling footprint by as much as 75 percent. Because of its low cost profile and reduced environmental impact, slimhole drilling provides a method of economically drilling exploratory wells in new areas, drilling deeper wells in existing fields, and providing an efficient means for extracting more natural gas and oil from undepleted fields. Forestry Sector I1 – Operations Unique to Forestry (Excluding Labourers) J2 – Machine Operators in Manufacturing While the Forest industry has traditionally been slower than others to embrace new technologies, and in the current environment cost and financial viability factors are major concerns or barriers to implementation, the study, Technology Roadmap: Lumber and Value-Added Wood Products, 2 identified some of the emerging technologies that have 1) the potential to reduce the need for some skills and/or 2) may require changes to training programs. The need and opportunity to transform the industry and practices to “high technology” and the implications that it may have should not be overlooked. A brief enumeration of some of the potential “break through technologies” needed or being developed is below:
2 http://strategis.ic.gc.ca/epic/internet/infi-if.nsf/en/fb01315e.html

Research to Evaluate the Shortage of Skilled Workers in Northern Alberta Chapter 6 – Factors and Trends That May Affect Skills Shortages
Prepared for The Northern Labour Market Information Clearinghouse Project By Steven K. Lakey, MBA, CMC Page 98
• Image processing to analyze forest stands and characterize the resource (primary sector) to allow managers to make better decisions regarding forest management, log allocation and log processing;
• Supply chain utilization system to integrate all supply inputs (all sectors) to for example match a client’s wood preference or need with existing processed products or even certain stands of timber with desired characteristics;
• External and internal scanning techniques for logs and lumber (all sectors) would facilitate comprehensive information on log characteristics and value optimization;
• Automatic identification of individual softwood species; • Technology to sort lumber into categories of comparable dryability; • Computer-assisted vision systems to automate quality control and wood matching
operations; • Automation of equipment adjustment and tool changes to reduce down time and maintain
precision; • Kiln controllers to optimize drying cycle for individual load and exterior characteristics; • Integrated systems to grade wood products on-line; • Expert systems and simulators to transfer technology to managers and operators; • Integrated on-line quality control and process control; and/or • Development of new products as a result of significant modifications of wood properties,
such as chemical, physical or even genetic processes. Oilsands H2 – Power Station Operators B3 – Administrative and Regulatory Occupations Although oil sands have been commercially produced in North America for the last 40 years, the potential - and pressure - for successful continued development is enormous. Investment projects targeting oil sands development could amount to as much as $90 billion over the next 30 years. Projections for projects currently contemplated indicate that production could double to five million barrels per day by 2030. Future growth will rely heavily on the development of technology to be successful. In the Oil sands Technology Road Map championed by the Alberta Chamber of Resources, the vision is summarized as; “Canada’s Oil Sands Industry will be a world leader in production and in the value that it creates in its products. The industry will employ economically efficient processes and technologies in a way that minimizes the environmental health and safety impacts of production and shares the opportunity for wealth generation across the country.” The oil sands technology road map identifies the following challenges to achieve the vision: Cost structure; Markets; Upgrading; Pipelines; Diluent; Natural gas use; Environmental “foot print”; Air emissions; Water use; Sulphur; Coke; and Construction costs. Key in situ issues include: Market for product and Energy use; and natural gas dependency.

Research to Evaluate the Shortage of Skilled Workers in Northern Alberta Chapter 6 – Factors and Trends That May Affect Skills Shortages
Prepared for The Northern Labour Market Information Clearinghouse Project By Steven K. Lakey, MBA, CMC Page 99
Key mining challenges include: Diluent for transport; Overall recovery; Water conservation; Air emissions; Environmental “foot print”. Key upgrading challenges: Construction cost control; Capital and operating costs; Green fuels market and synthetic crude oil quality; Natural gas demand; Expanded markets and end uses; and Coke and sulphur production. These “challenges” suggest that the pursuit for new and improved technology to help to address some of the issues will be relentless and the changes will affect almost all aspects of oilsands development; in some instances in ways that cannot yet be foreseen. Construction H0 – Trades Contractors and Supervisors H1 – Construction Trades H8 – Trades Helpers and Labourers A report completed for the Construction Sector Council 3 , provides the basis for this commentary. Within three sectors of the construction industry: Civil; Industrial-Commercial-Institutional (ICI) and Residential, the report examined the impact of six new technologies or innovations:
1. Pre-fabrication 2. Longer-life materials and components 3. Machinery and equipment such as new robotics technologies. 4. Task elimination arising from new materials and new design strategies such as in
concrete forming where stay in place forms eliminate the need to dismantle traditional forms.
5. Displacement of existing materials by new materials such as structural steel replacing cast –in –place concrete or concrete paving replacing asphalt paving.
6. Efficiency gained from project management (applicable chiefly on large projects in all sectors).
It concluded that the technology related implications are likely to be led by the civil sector. New specialized skills and greater computer literacy will be required; however, the overall demand for labour will not be affected significantly. Three factors affect the acceptance of new technology and the impact on the overall demand for labour. First, construction is intrinsically labour intensive. Second, owner preferences and location factors impose significant limits on the scope for standardizing construction products. Third, the structure of liability in the construction industry engenders a high degree of conservatism. The following table provides a succinct summary of the findings.
3 The Impact of Technology on the Construction Labour Market, Winter 2004

Research to Evaluate the Shortage of Skilled Workers in Northern Alberta Chapter 6 – Factors and Trends That May Affect Skills Shortages
Prepared for The Northern Labour Market Information Clearinghouse Project By Steven K. Lakey, MBA, CMC Page 100
IMPACT OF TECHNOLOGY ON THE CONSTRUCTION LABOUR MARKET Sector/Innovation Civil ICI Residential
Prefabrication Not a major trend
Moderate importance to commercial and institutional buildings (primarily exterior cladding) but major importance to large industrial projects
Most important trend
No significant impact
Moderate reductions in time required for mechanical installations; major reductions in labour costs for major projects.
Reduction in on-site labour, lower number of helpers required, commensurate increase in the number of specialized installers required.
Longer life Materials and Components Important Trend Low importance No significant
implications
Moderately less demand for equipment operators and concrete finishing crews such as labourers, carpenters, rod men, while high performance concrete finishers will require more skills to correctly place and finish concrete.
No significant implications on labour demand
Machinery and Equipment
Single most important type of innovation Low importance Modest implications
Increased scale equipment, multi-tasking equipment and robotics will increase need for operators to have computers skills. Reductions in “labourer” crew sizes can be expected; less time will be required to complete projects; and employment hours per million dollars of construction expenditures will decline.
Impact on training requirements at specific trade level.
Task Elimination Arising From New Materials and new Design Strategies
Not a major trend
Moderate importance Important trend
No significant impact Closely related to pre-fabrication
Displacing Existing Materials by New Materials
Moderate importance Moderate importance
Shift from asphalt to slightly more labour intensive concrete.
Move away from broadly trained tradespersons to specialized installers.
Efficiency Gains From Project Management High potential importance Limited applicability
Reductions in non-productive time equate directly to fewer employment hours.
Not expected to have a major impact on the piece rate remuneration practices in effect.

Research to Evaluate the Shortage of Skilled Workers in Northern Alberta Chapter 6 – Factors and Trends That May Affect Skills Shortages
Prepared for The Northern Labour Market Information Clearinghouse Project By Steven K. Lakey, MBA, CMC Page 101
Retail and Service Sectors G3 – Cashiers G2 – Retail Salespersons and Sales Clerks G-9 – Sales and Service nec A2 – Retail Trade Managers and Supervisors Three technological advancements are likely to affect the above–noted Occupational Categories The first is in the application of technology to improve the supply chain – such as radio-frequency identification (RFID), new POS systems that accurately track sales, and supply-chain software that helps manage the movement of goods and inventory. The implications are: 1) the potential reduction of staff to accomplish some tasks such as inventory taking, for example; 2) future staff will need to be familiar with such technologies and applications. The second advancement is the application of technology to selling merchandise – including the installation of in-store kiosks, improved Web site technology, and the “seamless” marriage of online and offline retailing consumer technology. Using these methods, resellers and the entire supply chain can benefit from greater efficiencies within the sales channel; however, new skills may need to be acquired. The third advancement (and related to the two advancements above) is the impact of “self – checkouts”, which are already in place in some settings and would reduce the need for cashiers and some sales clerks. “Other” Sectors and Occupational Categories D1 – Nurse Supervisors and Registered Nurses The development of user-friendly software programs to promote charting efficiency is allowing nurses to spend more time with patients. Advances in the storage and management of data are allowing nurses to be more efficient in searching for information such as patient records but also raise issues associated with Freedom of Information and Privacy, which may slow the growth in the use of such technology until such time that outstanding legal and ethical issues are resolved. Advances in tele-health technology are allowing more patients to remain out of acute care facilities and greater efficiency in the number of individuals that can be monitored or cared for by a nurse or health care provider. They also have the potential for greater use of “remote” procedures. H6 – Heavy Equipment Operators Trends toward increased use of Global Positioning Devices (GPS) and greater use of computers for vehicles may reduce the need for operators, particularly for hazardous or repetitive applications, and the use of simulators for training. H4 – Mechanics The increasing presence of satellite telematic devices (such as General Motors’ “Onstar”) and increases in data storage capacity inside automobiles and heavy equipment, through the use of Flash memory or even hard drives will increase the memory, and therefore functionality, of

Research to Evaluate the Shortage of Skilled Workers in Northern Alberta Chapter 6 – Factors and Trends That May Affect Skills Shortages
Prepared for The Northern Labour Market Information Clearinghouse Project By Steven K. Lakey, MBA, CMC Page 102
applications that can be sent remotely to automobiles. It will be possible to monitor vehicles remotely to advise when service is required and to also provide service solutions through means such as “software patches” sent wirelessly and directly into a customer’s vehicle. Consumer choices with respect to after-market repair and service (there is an increasing trend toward providing service to a variety of makes and models) may require greater use of computer technology to share repair procedures and other specification information. Nano-technology advances may result in new manufacturing processes and compounds for engine parts that may result in a need for changes to the way some repairs have been made traditionally. E-1 Teachers and Professors E0 – Social Workers So far, aside from new applications for distance learning and improved research capabilities via the Internet, the impact of digital technology on K-12 education and social work has been relatively minor. However, technology advances are often applied in ways that are unanticipated. New pedagogical techniques appropriate to using technology likely will be forthcoming. In addition, using technology to solve difficult learning or management problems may allow teachers and social workers to be better able to take a more student/client -centered approach to learning and accommodate multiple learning styles and needs. In Northern Alberta, such applications may have the most significant potential for making best use of the underutilized Aboriginal labour pool. Depending upon the skills and technology available to clients, digital counseling and use of telelink technologies, such as those mentioned in “nursing”, may have applications for future social workers. G-8 Nannies and Babysitters To some extent, greater use of remote monitoring devices (similar to the tele-health devices for the Nursing occupations, above, in may allow those in this Occupational Category to be able to care for a larger number of children at the same time. D3 – Assisting Occupations in Support of Health Services Advances in cosmetic dentistry (and associated increased demand) and new ways of detecting and treating oral diseases (x-rays and laser applications, respectively, for example) may result in shifts in training requirements to be even more “preventive and maintenance” oriented. Those in the field will also need to be familiar with “patient tracking” (and associated Freedom of Information and Privacy Issues) systems and be more marketing and service oriented. The need for computer skills with general office applicability will be expected. G4 – Chefs and Cooks A trend toward healthier eating may require Chefs and Cooks to become more familiar with the chemical and physiological outcomes of certain food combinations and a requirement to use such skills in menu planning and food preparation. This trend will be reinforced if food prices increase or certain food sources become scarce. There is also likely a greater need to stay abreast of research findings and be more dedicated to lifelong learning.

Research to Evaluate the Shortage of Skilled Workers in Northern Alberta Chapter 6 – Factors and Trends That May Affect Skills Shortages
Prepared for The Northern Labour Market Information Clearinghouse Project By Steven K. Lakey, MBA, CMC Page 103
II. Potential Emerging Opportunities Northern Alberta’s rich mineral potential provides two potential new opportunities that are worthy of mention and may warrant future consideration with respect to future planning and programming for Northern Colleges: Coal bed Methane; and Diamonds. In the following, a brief overview is presented of the opportunities, issues and potential roles for Northern Colleges. A. Coal bed Methane While Coal bed Methane (CBM) has been used to a limited extent in the past and is prevalent in areas such as Medicine Hat, where it is found relatively close to the surface, the recent announcement that after over three years of challenging work to overcome drilling, completion and production challenges, commercial quantities of the gas being produced in the Mannville Formation in northwest Alberta, where the size of the resource is estimated to be as much as half of the potential in Western Canada, has kindled considerable interest as demonstrated in part by the $544 million paid in December of 2005 for oil and gas exploration rights. The Resource CBM 4 is a sweet natural gas (which means it does not contain hydrogen sulphide) found in most coal deposits. It is created over the millions of years required to convert plant material into coal. The methane in a coal seam is not stored as a compressed gas but absorbed chemically into the coal and held in place by the overlying rock and water pressure. When extracted, CBM is a “pipeline-quality” energy that can be used for home heating, natural gas-fired electrical generation and as an industrial fuel. CBM is high in heating value, generally between approximately 900 and 1,050 Btu/scf. Conversely, gas produced from the in-situ combustion of coal is low in heat content, typically in the range of 150 to 300 Btu/scf. Until recently, methane from coal beds has been considered an "unconventional" resource because of the unique properties of coal, which constitutes both a source and a reservoir of natural gas. The Size and Location of the Resource According to the Canadian Gas Potential Committee 5, estimates of the CBM gas resource nationwide could range anywhere between 187 trillion cubic feet (tcf) to about 460 tcf. The Alberta Energy and Utilities Board estimates Alberta’s reserves at 135 tcf to 410 tcf. For comparison, preliminary estimates of the resource base of CBM in the United States are in the range of 400 to 800 or more trillion cubic feet (Tcf) in-Place. Estimates for individual basins vary from a few Tcf to more than 80 Tcf. For comparison, 20 tcf of CBM would supply United States gas needs for a year. As such, the potential for Alberta CBM might be considered on a par with that of the Oilsands. Companies, such as, but certainly not limited to Encana and Nexen and many “juniors”, have CBM projects being evaluated in Central and Southern Alberta, Southeastern and Northeastern BC and Northwestern Alberta. The most advanced projects are in the Palliser region of southern Alberta and within the Elk Valley coalfield west of the continental divide in the East Kootenays. Recently, there has been considerable interest in the Horseshoe Canyon area of Central Alberta
4 http://www.ags.gov.ab.ca/publications/ABSTRACTS/INF_108.shtml 5 http://www.acr-alberta.com/Featured/Black_Gold.htm

Research to Evaluate the Shortage of Skilled Workers in Northern Alberta Chapter 6 – Factors and Trends That May Affect Skills Shortages
and the Andley and Mannville Formations, which take in parts of Northern Alberta. The following map depicts the regions of Alberta considered to have CBM potential.
POTENTIAL COAL BED METHANE AREAS IN ALBERTA
Notwithstanding the estimated resource size, there are uncertainties when trying to determine the amount of recoverable methane gas. Every CBM project is unique, due to the associated geology, and while some of the technology from the U.S. experience is helpful, the Canadian coal beds are typically less gassy and less porous, making it harder for the methane to flow to a well bore. The United States industry is more established and developed in places such as Wyoming and Colorado; however, there are a wide range of technical issues which may need to be overcome, if the full potential is to be realized, and for which the Alberta regulators have adopted a slower, “wait and see” approach. Some of these issues are discussed below. Basic Production Issues and Technology
Prepared for The Northern Labour Market Information Clearinghouse Project By Steven K. Lakey, MBA, CMC Page 104
The production of gas from coal beds can be accomplished by drilling and “completing” vertical or horizontal boreholes. (With the exception of the fracturing created by the drilling, there is no destruction of the coal deposits.) As an aside, horizontal boreholes appear to have an advantage in the geology of Alberta. While CBM can be extracted using conventional natural gas technology, some modifications to the process are required. Methane cannot be extracted until the water that permeates coal beds is pumped off because it traps the gas in the coal. This dewatering lowers

Research to Evaluate the Shortage of Skilled Workers in Northern Alberta Chapter 6 – Factors and Trends That May Affect Skills Shortages
Prepared for The Northern Labour Market Information Clearinghouse Project By Steven K. Lakey, MBA, CMC Page 105
coal bed pressure and is like taking the cork out of a bottle of champagne, the bubbles (methane) come to the top. Typically, bottomhole pumps, either rotary (progressive cavity pumps) or reciprocating (beam pump with pumpjack), are used to pump water from the coal seam. Dewatering often means dumping 12 to 15 gallons of water a minute from each well -- a process that must continue for a year on average before achieving maximum methane production. In addition, many coal bed methane wells require initial dewatering of the coal by means of a variety of pumping arrangements. Most of the wells drilled for coal degasification require reservoir stimulation, usually through casing perforations, employing various combinations of hydraulic fracturing, such as sand-water, sand-foam, or sand-gel, in order to increase permeability to gas. One of the major problems associated with “conventional” processes is the disposal of the water pumped out. This issue is discussed further below. New Technology For almost six years, the Alberta Research Council has been working with the Canadian, U.S. and other governments to enhance methane recovery by injecting carbon dioxide from large producers of greenhouse gases into coal beds. The technique has helped increase recovery from the San Juan coal beds in the United States, but research in Alberta is still inconclusive. The process is called enhanced coal bed methane recovery, and is similar to the popular practices of using CO2 injection to enhance production from oil reservoirs. In this method the injected CO2 is absorbed by the coal and stored in the pore matrix of the coal seams, releasing the trapped methane. The process results in two or three molecules of CO2 absorbed for each molecule of methane released. In this closed process, the CO2 produced from the coal-burning or methane-burning power plants is injected into the CBM reservoirs to produce more methane, and the cycle continues. Because there is an abundance of suitable coal beds in North America, and in countries such as China, the process has the potential to be widely applicable. If adopted, it would have a significant impact on GHG reduction from fossil fuel production and use. For example, a possible application would be to set up power plants near the coal beds and inject the carbon dioxide they produce into the coal beds to produce methane that can then be used to fuel the plants – a cycle in which virtually no carbon dioxide would be released into the atmosphere. New and innovative geological tools such as “high resolution aero magnets” (HRAM) are beginning to be used to account for coal bed regional variations in planning and monitoring drilling programs with greater precision. Challenges and Risks A brief discussion of some of the key risks and challenges follows. Technical Each CBM “play” is unique, requiring different techniques for drilling, completing and stimulating wells. For example, if the coal bed is too shallow, pressures are not high enough to absorb the methane on the coal surface and if it’s too deep the pressure is shut off and collapses the

Research to Evaluate the Shortage of Skilled Workers in Northern Alberta Chapter 6 – Factors and Trends That May Affect Skills Shortages
Prepared for The Northern Labour Market Information Clearinghouse Project By Steven K. Lakey, MBA, CMC Page 106
fracture, making it impossible to retrieve the methane gas. Ideal conditions in Canada are between 400 and 1000 metres (1200-3000 feet) below the surface. Potential players need a large land base, as the wells produce at very low rates and it can take up to two years to reach peak levels. But once in production, the CBM well’s production continues for several years -- some U.S. wells are still producing after 20 years. The initial capital investments are huge and success is not guaranteed because the amount of gas that can be produced depends not only on the correct depth, but on the thickness and lateral continuity of the coal, the level of permeability that is controlled by the amount of fracturing or cleats, and other barriers such as impermeable layers and faults or folds that keep the gas trapped within the coal seam. Regulatory and Environmental As noted above, the dewatering requirement is a major issue. In Canada, there is a stronger regulatory framework to build on, including established rules for water disposal, but the rules are still “sketchy” when it comes to CBM and differ in each provincial jurisdiction. In Alberta, ground disposal of any kind of oilfield water is governed by the Energy and Utilities Board, while surface water handling -- unless it is stored in tanks -- falls under the jurisdiction of the Department of Environment. Under the status quo, CBM developments would require a combination of permits from both authorities to proceed. But special circumstances unique to CBM production also require outright rule changes that are still under review. Alberta tightened environmental laws in 1999 to make surface discharge an unacceptable practice, despite exemptions granted to the coal industry for tailings ponds. Likewise, oil and gas operators are not allowed to have evaporation ponds under an interpretation of the current rules. Finally, in September 2001, the Alberta Department of Energy delivered a report of CBM that recommended establishing subcommittees to look at specific sections where changes might be made, including environmental rules. But the report itself does not represent government policy and the lack of regulatory clarity adds another level of uncertainty. More serious than the issue of dispersing dirty water is the issue of what to do with fresh water produced from coal seams -- dewatering non-saline aquifers is against the Alberta Environmental Protection Act. Any other type of groundwater use requires diversion permits. As an example of “what can go wrong”, in the Powder River Basin of Wyoming, the state’s CBM industry now produces enough water to supply thousands of people per day, but instead much of the water, which ranges from fresh to brackish, is simply spilled on the ground. There is potential risk to aquifers, rivers and streams and many lawsuits and land disputes have arisen. Such concerns have also recently been voiced in central Alberta. Other Issues Clear reserve reporting standards under National Instrument 51-1016 have yet to be developed. The “industry” faces fierce competition for rigs and equipment and manpower from “traditional” oil and gas explorers.
6 For a more detailed explanation of this regulation pertaining to the disclosure of oil and gas activities, please reference www.albertasecurities.com

Research to Evaluate the Shortage of Skilled Workers in Northern Alberta Chapter 6 – Factors and Trends That May Affect Skills Shortages
Prepared for The Northern Labour Market Information Clearinghouse Project By Steven K. Lakey, MBA, CMC Page 107
In Alberta, there is uncertainty around the ownership of freehold lands, which may result in a variety of legal issues such as trespass, ownership of the resource and the need to develop “alternative business solutions”. While there is great interest in CBM among institutional investors, in order for it to go “toe to toe” with conventional oil and gas, there must be a clear advantage in terms of profitability in order to justify the risk. At present, it is not clear that such an advantage exists and it may be necessary to improve technology and operating and exploration efficiencies. Related to the above point, greater effort and attention needs to be focussed on determining the “best practices” for various conditions as the industry begins to move into the commercialization phase. It may be difficult to determine curriculum and roles for educational institutions until processes and procedures are defined and accepted. Synopsis of Implications for Northern Alberta and Colleges The industry, with most “plays” in Northern Alberta in the Northwest, Grande Prairie area, is in an early commercialization phase. While there is tremendous potential with the large reserves of the region, there are a number of regulatory, legal and environmental issues that need to be addressed. In addition, specific exploration and production technologies that will result in the “best business cases” need to be “standardized”. Such matters need to be resolved before the role of Northern Colleges will be clearer. However, it is apparent that those working directly in the industry will need to become more familiar with the unique geological and physics aspects of CBM exploration and production, some of which were referenced above. The more advanced and innovative methods resulting in the convergence of geology, physics and “business” will require that individuals have a more rigorous educational background. The industry also presents the potential need for individuals who are versed in hydraulics and pumping technologies. Depending upon the specifics of the final resolution of environmental and regulatory issues, the industry presents the potential need for individuals who are versed in more specific applications and fields of environmental monitoring and reclamation. The already fierce competition for manpower and equipment may cause companies to seek more creative options to modify existing equipment or provide specific upgrading training to those who may have the requisite educational or experience backgrounds. Peripheral to the industry, there is likely to be an increased demand for “supporting” individuals such as other construction workers, heavy equipment operators, camp staff such as cooks, as well as warehousing, transportation and logistics staff. It is suggested that college staff increase efforts to stay abreast with industry, government and educational institutions such as SAIT in order to determine best potential roles. At this time, it is envisaged that the roles of Northern colleges will be to ensure that “basic, essential skills” training is in keeping with the needs to enter the industry and in possibly providing shorter-term, industry upgrading or specific topic training.

Research to Evaluate the Shortage of Skilled Workers in Northern Alberta Chapter 6 – Factors and Trends That May Affect Skills Shortages
Prepared for The Northern Labour Market Information Clearinghouse Project By Steven K. Lakey, MBA, CMC Page 108
B. Diamond Exploration and Mining Worldwide production of rough diamonds in 2004 was estimated to be 162 million Carats (Mcat) with a value of approximately US 10.4 billion, representing and increase of approximately 3.3% in production and 13.4% in value over 2003. The top producers by volume and value are summarized in the following table.
GLOBAL DIAMOND PRODUCTION IN 2003
Country/Region Volume(Mcat)
% of Total
Value (US$ Bil)
% of Total
Russian Federation 39.8 24.5 1.988 19.1 Botswana 31.1 19.2 2.330 22.4 Democratic Republic of the Congo 29.4 18.1 .723 7.0 Australia 20.4 12.7 .338 3.3 South Africa 14.3 8.8 1.273 12.2 Canada 12.6 7.8 1.712 16.5 Sub-total 147.6 91.1 8.364 80.5
Clearly, Canada holds a position of importance in the industry by virtue of the high value and quality of its production. Canada’s first diamond mine, Ekatai was discovered approximately 300 km north east of Yellowknife in 1991, and came into production in 1998. At present, there are two diamond mines in the Northwest Territories (Ekatai and Diavik (and three other advanced sites exist in Nunavut, Northern Ontario and other parts of the NWT). The Diavik mine came into production in 2002 at a cost of $1.3 billion and employs approximately 700. In 2004, over 120 companies spent approximately $260 million exploring sites in Alberta, NWT, Nunavut, Saskatchewan, Ontario, Quebec, Newfoundland and Labrador. By comparison, between 1995 and 2001, mineral exploration companies in Alberta spent a total of CAN $76 million, of which about $61 million, or 80 per cent of expenditures, was related to diamond exploration. The Canadian diamond industry employs about 1200 people in mine operations and over 1000 more in support industries for exploration and mining. In total, the Canadian industry provides some 4000 direct and indirect jobs. Aboriginal persons comprise 30 to 40 percent of the work forces at Ekati and Diavik. Global demand for diamonds is forecast to increase by 5% per year through to 2010, while supply is expected to increase by only 1.8%. Canada’s production was expected to increase to 12.8 Mcat by 2005. A factor for which it is difficult to ascertain the impact, is the ability that now exists to manufacture synthetic diamonds more easily, and at a lower cost. At the present time, there appears to be a preference for “natural” diamonds for ”affairs of the heart” applications (where Canada’s diamonds are held in high regard); however, there may be a place for synthetic

Research to Evaluate the Shortage of Skilled Workers in Northern Alberta Chapter 6 – Factors and Trends That May Affect Skills Shortages
Prepared for The Northern Labour Market Information Clearinghouse Project By Steven K. Lakey, MBA, CMC Page 109
diamonds in future industrial and laboratory applications, which could be a factor that disrupts the supply/demand balance. Synthetic diamonds currently account for about 6% of the total.7
Most cutting and polishing takes place in Belgium and India. The cutting and polishing industry in Canada is still quite small with seven companies in Yellowknife, Vancouver, Toronto and Matane, Quebec. The world’s Top diamond producing companies are: De Beers, Rio Tinto, Aber Diamond Corp, BHP Billiton and the top producing diamond mines 8 are Argyle, Diavik, Ekati, Baken, Merlin. For a more complete synopsis of the Canadian and global diamond industry, please reference http://www.nrcan.gc.ca/mms/cmy/content/2004/26.pdf Diamond Exploration and the Kimberlite Relationship Kimberlite is a rock type first categorized over a 100 years ago based on descriptions of the diamond-bearing pipes of Kimberley, South Africa. Kimberlite is characterized as a hybrid, volatile-rich, potassic, ultrabasic igneous rock. Although volumetrically insignificant on a global scale, kimberlite commonly occurs in fields, or clusters, comprising up to 100 individual, steep-sided intrusions. Kimberlites are only the mechanism by which diamonds are brought to the surface. Diamonds form much earlier than the kimberlite in the diamond stability field at depths of 110 km to 150 km and temperatures of 900°C to 1200°C. Because kimberlites are derived from deep within the earth (>150 km below the surface), they are able to transport mantle and possibly diamonds to the surface. Kimberlitic rocks are the most important primary source of diamonds and the main rock type in which significant, economically viable diamond deposits capable of sustained profitable mining have been found so far. Economic concentrations of diamonds only occur in about one per cent of known kimberlites worldwide. Alberta in Context According to the Alberta Geological Survey 9, the geology of Alberta is favourable for discoveries of diamonds because: • Most of Alberta constitutes a younger, flat-lying sedimentary platform underlain by an older
(>2 billion years) craton; • Alberta contains tectonic features that may have provided pathways for kimberlite intrusion; • There is evidence of several ages of volcanic activity in Alberta, including late Cretaceous,
which was the most prolific period for world-wide kimberlite volcanism; and
7 Enroute Magazine, February 2006 8 http://www.infomine.com/commodities/diamond.asp 9 http://www.ags.gov.ab.ca/activities/Kimberlites/kimberlites_general.shtml

Research to Evaluate the Shortage of Skilled Workers in Northern Alberta Chapter 6 – Factors and Trends That May Affect Skills Shortages
• There are a large number of geological, geophysical and geochemical anomalies in Alberta that may have been, or are related to, emplacement of potentially diamondiferous kimberlites.
To September 2003, 48 kimberlitic pipes have been discovered in three separate areas of the northern Alberta: • Mountain Lake cluster: two pipes discovered in 1989 to1990 by Monopros Limited (the then
Canadian exploration subsidiary of De Beers). • Buffalo Head Hills field: 38 pipes discovered between 1997 and January 2003 by Ashton
Mining of Canada Inc., in a joint venture with EnCana Corporation and Pure Gold Resources Ltd. The Buffalo Head Hills area has the highest diamond content results to date. Twenty-six
• of the 48 pipes are diamondiferous, and at least three of the kimberlites (K14, K91 and K252) contain estimated diamond grades of >11 carats per hundred tones (cpht) with one Buffalo Head Hills pipe (kimberlite K252) having preliminary mini-bulk (22.8 t) sample grades of 55 cpht.
• Birch Mountains field: eight pipes, which includes seven pipes discovered in 1998 by Kennecott Canada Exploration Inc., Montello Resources Ltd. and Redwood Resources Ltd., and one pipe discovered in December 2000 by New Blue Ribbon Resources Ltd.
The following map, produced by the Alberta Geological Survey provides a depiction of the principal diamond exploration activity in Alberta.
Alberta will have the basis for a diamond mine if explorers can discover a favourable combination of:
Prepared for The Northern Labour Market Information Clearinghouse Project By Steven K. Lakey, MBA, CMC Page 110

Research to Evaluate the Shortage of Skilled Workers in Northern Alberta Chapter 6 – Factors and Trends That May Affect Skills Shortages
Prepared for The Northern Labour Market Information Clearinghouse Project By Steven K. Lakey, MBA, CMC Page 111
• A ‘near-surface' pipe with diamond grades similar to, or better than, the estimated 55 carats per hundred tonnes in pipe K252, Buffalo Head Hills;
• An economic pipe, or marginal-grade pipe, with diamonds of similar quality to some that have been found to date within Alberta (e.g., a gem quality, 0.76 c, yellow diamond from K6, Buffalo Head Hills);
• A marginal-grade pipe, but with aerially extensive near-surface dimensions similar to many of the pipes discovered to date (e.g., several Alberta pipes crop out and have an aerial extent of up to 48 ha.); and
• Pipes associated with kimberlite-indicator mineral (KIM) targets in other parts of Alberta, some of which have mantle chemistry indicative of diamondiferous kimberlites.
Synopsis and Implications for Northern Colleges There is evidence of potential and interest in a diamond industry in Alberta as demonstrated by Alberta’s geology, exploration expenditures and a growing world market. The implications and opportunities for Northern Colleges are perhaps best thought of in two phases. In the first, there may be expected an increased demand for those with skills in geology, mapping, data entry and analysis, managing people, operating and maintaining specialized equipment, transportation (including aerial) and security. Given, Alberta’s proximity to the Northwest Territories and Nunavut, and the potential for discovery and development of a mine in Alberta, there may be longer-term potential for a “Western or Northern Diamond Mining Industry Technology Institute” or “Centre of Excellence” to support training and development for the many individuals, skills and specialized technologies required to support a complete industry. (When considered with or in conjunction with the requirements to support other aspects of the oil and gas exploration or oilsands, the concept has more credence.) Some of the potential topics and technologies that might be considered include are summarized in the following table with hyperlinks to web-sites that may help to provide perspective and insight to the topics: Bioleaching and Bioremediation Blasting Environmental Technology
Geotechnical Technology Cyanide Hydrometallurgical ProcessingLeaching Information Health & Safety Metallurgical Information
On-Line Mining Law QualityOn-Line Software Information for Mining and Geosciences
Reclamation and Environmental Protection
Quarries and Gravel Pits
Robotics and Intelligent Systems
Surface Water and Groundwater Technology
Sediment Ponds Tailings Technology
Mine Roads Waste Rock Rock Slope StabilityTailings Mine Costs Community RelationsSubsidence Responsible Mining Erosion
Water Balance Heap Leach Pads
Research to Evaluate the Shortage of Skilled Workers in Northern Alberta Chapter 6 – Factors and Trends That May Affect Skills Shortages
Prepared for The Northern Labour Market Information Clearinghouse Project By Steven K. Lakey, MBA, CMC Page 112
III. Other Factors This Section reviews, on a select sector- by- sector basis, a number of other explicit issues that have the potential to exacerbate the skills shortage problem. A. In Relation to the Retail Sector The retail sector typically includes the following types of businesses: national and regional department stores, mass merchants, specialty chains, independent stores, online merchants, supermarkets and grocery, liquor, beer and wines, automotives parts, services and accessories, general merchandise, drugs and patent medicines, building and home improvement products, sporting goods, hobbies, music and books, gasoline service stations, clothing and shoes, and furniture and appliances. According to the Retail Council of Canada 10, the most frequent misconceptions regarding the retail sector include: • Retail is not viewed as a progressive industry by mid career individuals; • The industry does not pay well; and • The industry lacks responsibility and prestige. B. In Relation to Other Areas of the Service Sector (Tourism, Food Service and Hospitality) Some of the perceptions, and “realities”, that contribute to skills shortages for this sector, particularly when there are many other possible choices in many parts of Northern Alberta include: • The jobs pay minimum wage; • The jobs only offer part-time employment and shift work; • In some cases (tourism, for example), they are only available in the summer months; • They involve stressful “face to face” contact with the public; • They sometimes involve working in small or confined areas; such as booths for cashiers; • Post-secondary education and training are not needed for employment in the tourism
industry; and • Changes and advances in technology do not have an impact on tourism careers. C. In Relation to Trades and Apprenticeship There are biases and prejudices in making career choices. As noted in earlier work completed by Lakey for the Clearinghouse 11, The choice of apprenticeship does not start out on equal footing
10 http://www.retaileducation.ca/cms/sitem.cfm 11 A Review of Issues Pertaining to the Apprenticeship System in Northern Alberta: Chapter 8 – Enhancing the Image of Apprenticeship Programs, March 2003

Research to Evaluate the Shortage of Skilled Workers in Northern Alberta Chapter 6 – Factors and Trends That May Affect Skills Shortages
Prepared for The Northern Labour Market Information Clearinghouse Project By Steven K. Lakey, MBA, CMC Page 113
with other education and training options. To be a viable option, attitudes have to be open enough to allow objective consideration. According to several studies, young peoples' attitudes toward, and perceptions of, apprenticeship have been biased. Some of the influences and perceptions are discussed briefly below: • Young people are influenced significantly by the experiences and attitudes of parents and
guidance counselors. The parents of many of today’s Alberta high school students have been affected adversely by early 1980s down turns in the economy and resulting lack of opportunities or difficulties in getting re-established. As a result, some tend not to encourage their children to go into the trades. To a great extent, and while the situation is changing, guidance counselors tend to channel “non-university bound” students into the trades, which with some of society’s current values, results in a “second class” stigma.
• In some instances, the stigma noted above is reinforced in that training programs do not
provide students with essential skills. Setting aside the issue of “low achieving students” the nature of many of today’s trades, as referenced in Chapter 3, is such that practitioners must be able to digest large amounts of technical data and communicate with many diverse groups; these “skills” are often not taught at high school – even for “academic” students – and their absence in some curriculums may be setting some apprentices up for failure. Secondly, in some instances, the methods of instruction that have been used may not recognize the unique characteristics of the trade or the learning styles or needs of students. In both cases, students may struggle resulting in negative stigmas.
• To some extent, the stakeholders, such as associations and employers, are “guilty” of not
presenting a “common front” in providing current information about the opportunities in the trades such as wages, working conditions, culture and opportunities for advancement and cross-over to other careers. Many employers of trades people are small businesses resulting in a somewhat fragmented market that is exacerbated by: 1) the fact that the owners are pre-occupied with the day to day aspects of running their businesses and do not have time to participate in activities that would promote the trade or industry; and 2) many of today’s owners and managers were brought up and trained in a time and a way that causes them to be uncomfortable in such roles.
While there are still perceptions of trades being involved in dirty or menial activities, many trades are evolving toward more knowledge intensity, and many new high technology, knowledge intensive occupations that did not exist say 20 years ago, are emerging. The fact that many companies involved in the trades are small enterprises with less than 10 employees, also results in a “dead end” or Joe’s Garage” mentality with many negative connotations associated with such companies. The opportunities for entrepreneurship or career advancement are not recognized or promoted.

Research to Evaluate the Shortage of Skilled Workers in Northern Alberta Chapter 6 – Factors and Trends That May Affect Skills Shortages
Prepared for The Northern Labour Market Information Clearinghouse Project By Steven K. Lakey, MBA, CMC Page 114
• The trades still tend to be dominated by males and participation by other groups such as Aboriginals tends to be low. Women and minorities, have to a great extent, not been encouraged to enter them until more recently, and accurate information is not available.
• Within the business community, there is still a perception of apprenticeship training as being
a “cost” or “burden” to the company. There needs to be a paradigm shift towards the perception of “investment”, and companies must find ways and means that will provide apprentices with the proper training but use them in a manner that will be a “profit centre”.
• The way in which success is measured in the trades may not be on the same level as for
“academic” programs. Until more recently, students and employers were not recognized for excellence, nor for that matter were benchmarks or standards developed.
A second major factor is that experienced workers are becoming more selective, and in some cases, less mobile. According to the Alberta Construction Owners Association, attracting workers to more remote northern locations (where much of the demand is in Alberta) will be one of the largest challenges facing the industry. In general, workers are becoming more informed and have a greater number of options closer to “home”. Much of the labour force that was eager to develop oil sands projects in the late 1970s is closer to retirement, does not want to travel out of town or overnight, and when they do are demanding a variety of amenities in camps to create a more comfortable environment. A third factor relates to the type of management, supervision and mentoring that occurs in many trades, particularly those in the construction industry. According to a survey and report commissioned by the Construction Sector Council: 12
• The quality of mentoring is uneven. Most respondents reported a degree of dissatisfaction
with the quality of mentoring as it is being delivered in the work place noting that apprentices are not getting full exposure to the skills required, that they are being assigned menial tasks, that there is no formal system in place to ensure that mentoring takes place and that more attention need to be paid to on-the job training.
• The typical journeyman is not prepared to be a mentor. Mentoring tends not to be part of the
apprenticeship curriculum. Other than supervisory training, there are very few opportunities for a journeyman to acquire training on how to be a mentor. In addition, the importance of mentoring is not stressed in the work place.
• There are a number of other barriers. Some journeymen are reluctant to pass on their
“wisdom” to others on the belief that “others should be expected to learn the hard way, just as they did”. The daily pressures of work often make it difficult to find the time to practice effective mentoring. For most journeymen, there is no “incentive” to be a mentor as there is typically no reward such as a pay premium. In many instances, apprentices need to have a greater willingness and ability to manage their own learning and to acquire a well-rounded set
12 Emerging Trends in Management, Supervision and Mentoring in the Construction industry, Construction Sector Council, Winter 2004

Research to Evaluate the Shortage of Skilled Workers in Northern Alberta Chapter 6 – Factors and Trends That May Affect Skills Shortages
Prepared for The Northern Labour Market Information Clearinghouse Project By Steven K. Lakey, MBA, CMC Page 115
of skills. Some apprentices are not sufficiently active participants in the learning process. Finally, the resources available to foster mentoring are few and are not well known.
D. In Relation to the Aboriginal Community This discussion is based largely on a study completed by the Alberta Chamber of Resources in 2003 in relation to Aboriginal training programs.13 The major conclusions are summarized below. • There is uncertainty about the effectiveness of many Aboriginal programs. The experience
has generally been a record of some success and much frustration. Most programs identified as a best or promising practice during the interviews and included in the database are relatively new - largely implemented in the last 12 to 18 months. For many companies, programs are not well documented and tend to be a response, usually at the operational level, to an immediate issue rather than as part of an overall strategy. Few have specific budgetary appropriations for Aboriginal initiatives but tend to find the money in other areas when needed.
• A surprising number of companies do not have a formal Aboriginal policy and a significant
portion of those that have a policy, do not communicate it well internally. Even for those companies, which have an Aboriginal policy, it is often part of an overall corporate vision, values and principles framework. Few companies have a designated “champion” at senior management levels.
• Corporate reputation and image on Aboriginal issues are important to many companies.
However, there is a general lack of systematic reporting, assessment or benchmarking of results. This may become a more significant issue in the future if customers, shareholders and the general public start to demand evidence of corporate responsibility on Aboriginal relations.
• Corporate culture and lack of strong commitment by senior management were cited as
limiting factors for some companies in developing and implementing Aboriginal programs. These factors were also seen as helping to perpetuate negative stereotypes and sending a message to employees that increased Aboriginal participation is not a corporate priority. Most suppliers generally follow the lead of their resource industry clients and do what is necessary to meet bid requirements rather than initiate their own programs. However, there are some notable exceptions where suppliers have seen a business case in building relationships with Aboriginal communities and organizations as a business development strategy.
• Finally, There is a tendency for managers to overestimate the comfort level of Aboriginal
employees and a lack of trust of management on behalf of Aboriginal participants.
13 Alberta Chamber of Resources- Aboriginal Programs Project: Final Report, “Sharing Knowledge” December 2003

Research to Evaluate the Shortage of Skilled Workers in Northern Alberta Chapter 6 – Factors and Trends That May Affect Skills Shortages
Prepared for The Northern Labour Market Information Clearinghouse Project By Steven K. Lakey, MBA, CMC Page 116
E. In Relation to the Disabled Community In Alberta, there are over 350,000 Albertans who have a disability of some type. 14 Generally speaking, other than their disability, which may limit some opportunities or require special accommodation, these individuals have several disadvantages 15 that result in lower levels of skills or a reduced ability to upgrade skills: • They have lower levels of education. The following table provides a summary of education
levels for those between 15 and 64 with and without disabilities.
EDUCATION ATTAINMENT IN 2001 FOR ADULTS AGED 15 TO 64 WITH AND WITHOUT DISABILITIES
Level of Education Disabled
IndividualsWithout Disabilities
Less Than High School 31.6% 26.5% High School 20.9% 26.0% Trade Certificate 13.8% 12.0% College 20.0% 16.2% University 13.3% 19.3%
• Their employment rates are lower. In 2001, the employment rate for Albertans with
disabilities was 52.1%, while the employment rate for those with no disabilities was 79.3%. • Albertans with disabilities tend to earn less than those without disabilities. In 2001, the
average annual earnings of those aged 15 to 64 with disabilities was $24,317, while the average annual earnings for those without disabilities was $31,621.
• Some factors that have limited participation of the disabled community have included access
in terms of parking spaces, door width (for wheel chairs in some cases) and ease of opening as well as elevators, and a lack of audio and visual warning devices in some instances.
F. In Relation to Location 1. Northern Alberta cities and towns are perceived to [and do] lack some of the
educational, cultural, infrastructure and health care amenities and facilities that are found in Edmonton and Calgary.
For certain segments of the population, lack of facilities and amenities, when combined with higher costs, can be important enough to discount employment opportunities, particularly when a four to five hour journey to Edmonton is the apparent “remedy”.
14 2004-05 Baseline Report of the Canada – Alberta Labour market Agreement for Persons With Disabilities 15 Ibid

Research to Evaluate the Shortage of Skilled Workers in Northern Alberta Chapter 7 - Strategies, Programs and Best Practices
Prepared for The Northern Labour Market Information Clearinghouse Project By Steven Lakey, MBA, CMC Page 117
Chapter 7 Strategies, Programs and Best Practices
The purpose of this Chapter is to provide a review and analysis of some of the organizations, key strategies and programs and best practices that have been developed within Alberta to address the skills shortages problem. By having a basic understanding of their focus and objectives, it may be easier for Northern Colleges to explore linkages and other options to determine the best potential roles and activities. I. Government of Alberta At the present time, Alberta is facing a number of skills related challenges associated with: • Expected strong economic growth in a tightening labour market; • Increased urbanization causing regional labour and skills shortages in many rural
communities; • Rising educational requirements for many jobs and a population that is falling behind other
provinces in post-secondary education attainment; and • A changing and competitive global landscape during a time when the population overall is
aging. An overview of how the Alberta government plans to address skills shortages in the future is presented below. Primary Activities As part of the response to address the issues, the government undertakes a number of activities including: • Supporting Albertans with skills upgrading, job search services, career counseling, language
training. • Providing labour market information. • Promoting apprenticeship (in the past 10 years, apprenticeship has increased by 98 per cent,
with more than 47,000 apprentices presently working in the province). • Supporting industry through the Provincial Nominee Program, an employer-driven
immigration program used to address skilled labour shortages. • Partnering with post-secondary institutions to provide programs for areas of skill shortages. • Providing full-time and part-time training grants for Albertans with low incomes. • Providing support for people with disabilities to overcome barriers to work. • Ensuring fair and safe workplaces. • The new Supporting Immigrants and Immigration to Alberta policy is aimed at attracting and
retaining more immigrants to the province to help fill the skills shortage. The goal is to attract at least 24,000 immigrants to Alberta each year.
For more information about what the Alberta government is doing to address skill shortages, reference Alberta's Skill Shortages: An Inventory of Government of Alberta Initiatives.

Research to Evaluate the Shortage of Skilled Workers in Northern Alberta Chapter 7 - Strategies, Programs and Best Practices
Prepared for The Northern Labour Market Information Clearinghouse Project By Steven Lakey, MBA, CMC Page 118
Strategic Framework In recent years, the Government of Alberta has invested considerable effort and resources toward addressing the problems and has developed strategies to address issues related to skills including the following:
• Today’s Opportunities, Tomorrow’s Promise, which recognizes leading in learning and unleashing innovation as key pillars for Alberta’s future growth and prosperity.
• A Learning Alberta, which articulates a new vision and policy outcomes for Alberta’s post-
secondary sector.
• Securing Tomorrow’s Prosperity: Sustaining the Alberta Advantage, which recognizes the importance of people in moving to a knowledge-based and value-added economy.
• Rural Development Strategy, which recognizes that higher levels of participation and
education levels are fundamental to increasing the vibrancy and capacity of communities.
• Strengthening Relationships, Alberta’s high priority focus on improving the well-being and self -reliance of the Aboriginal community.
• Supporting Immigrants and Immigration to Alberta and Integrating Skilled Immigrants into
the Alberta Economy, in support of the development of immigration and the attraction of immigrants to Alberta.
• Growing our Future, Alberta’s life sciences strategy.
• Prepared for Growth, formulated to address the three priorities of increasing the skills and
knowledge of Albertans, increasing the mobility of labour in Canada and increasing the number of immigrants to Alberta.
While each is of importance in its own right, it is recognized that longer term needs and issues are not addressed adequately. New Approaches to be Explored Because of the limitations of the existing strategies, a new strategy “Building and Educating Tomorrow’s Workforce: A framework to enhance Alberta’s people capacity” has been developed and is now being refined through consultation with the public. The vision of the strategy over the next 10 years is to create an Alberta with:
• A high quality of life; • An improved supply of appropriately skilled workers; • Highly skilled, educated and innovative people who achieve their full potential; and • An adaptable, flexible high performance workforce, and high performance work
environments that will ensure competitiveness on a global front.

Research to Evaluate the Shortage of Skilled Workers in Northern Alberta Chapter 7 - Strategies, Programs and Best Practices
Prepared for The Northern Labour Market Information Clearinghouse Project By Steven Lakey, MBA, CMC Page 119
The guiding principles of the strategy include:
• A focus on people and quality - In so doing, Alberta is committed to maximizing the skills and talents of Albertans first, including those from underrepresented groups such as Aboriginals, the disabled and immigrants. In situations where developing existing Albertans will not be sufficient to meet needs, inter-provincial migration and immigration are considered to be appropriate ways to address some skills shortages. Ensuring that Albertans have access to affordable and high quality learning and training opportunities will be a priority.
• A focus on innovation – that ensures that Albertans have access to world-class
education and skills training and up to date methods that make full use of technology and investment in capital goods.
• A focus on responsiveness – with a system that is flexible.
• A focus on the future – that will build long - term capacity and encourage participation in
continuous learning
• A focus on collaboration and partnerships – that engages all public and private sector stakeholders.
Objectives There are a number of “short-term” “Intermediate-term” and “long-term” targets associated with the strategy. Each is discussed briefly below, and an estimate of the potential share for Northern Alberta is also indicated. Short –Term (up to three years) Description Province-wide
Target Northern “Share”
Increase the number of immigrants each year 24,000 2,400 Increase occupational and integrated training in areas of skills shortages over three years
1,500 150
Increase part-time occupational training for workers in low income/low skills jobs over three years
1,500 150
Increase the number of Aboriginal apprentices over three years 1,500 250 Increase ESL training over three years 900 90 Increase the number of immigrants enrolled in bridge programs over three years
700 70
Increase the number of immigrants accepted by the Provincial nominee Program over three years
2,000 200
Increase awareness of labour market issues - - Increase satisfaction among Albertans with respect to labour market information
Increase the number of adequate and effective partnerships among private and public sector bodies to address labour force issues.

Research to Evaluate the Shortage of Skilled Workers in Northern Alberta Chapter 7 - Strategies, Programs and Best Practices
Prepared for The Northern Labour Market Information Clearinghouse Project By Steven Lakey, MBA, CMC Page 120
Intermediate - Term (three to five years) Description Province-
wide Target Northern “Share”
Increase the number of new apprentices starting each year 15,000 1,500 Increase the number of Aboriginal peoples in training over five years
3,000 500
Increase the number of skilled immigrants employed in positions that use their qualifications by 10% over five years
Increase the number of Albertans employed in knowledge based industries by eight percent by 2009
Increase the number of Albertans employed in knowledge-intensive industries as a percentage of Albertans employed in all companies to 6.6% by 2009
Long Term (five to 10 years) Description Province-wide
Target Northern “Share”
Expand Alberta’s advanced education system by 30,000 learning opportunities by 2010-11
30,000 3,000
Ensure that Alberta’s productivity growth rate is higher than the national average
Ensure that Alberta has the highest level of education attainment in the country.
Themes The strategy outlines a framework around four main themes (Inform, Attract, Develop, and Retain) that will lead to greater innovation, adaptability, and competitiveness in individual Albertans and Alberta's workforce and work environment: • Inform - This theme encompasses the three other themes. By providing information that
assists individuals, industry and business and education and training institutions in making well-informed decisions, it will be easier to attract, develop, and retain workers.
• Attract - Advancing skill levels and participation levels of underutilized groups is not
sufficient to fill all jobs; Alberta must diversify its people base by attracting inter-provincial migrants and immigrants.
• Develop - Develop speaks to educating and training Albertans so they can participate in
Alberta's economy and to establish a high performance workforce. Industry and employers need to recognize the importance of developing people's ability and knowledge to remain competitive.
• Retain - With more people retiring and fewer workers entering the labour market, increased
attention needs to be paid to finding ways of retaining workers via enhanced community and work attractiveness.

Research to Evaluate the Shortage of Skilled Workers in Northern Alberta Chapter 7 - Strategies, Programs and Best Practices
Prepared for The Northern Labour Market Information Clearinghouse Project By Steven Lakey, MBA, CMC Page 121
There are a number of priority actions associated with each theme of the strategy. Those that are considered to be of potential relevance to Northern Alberta colleges are discussed below. Inform • Work with public and private sector employers to develop a marketing campaign to inform of
prominent labour force initiatives and issues. • Work with public and private sector groups to promote increased development of current and
new labour force planning tools and models. • Work with stakeholder to raise awareness of higher education by promoting the benefits of
advanced education. • Work with private and public sector employers and industry to develop new methods that help
match employers with potential pools of workers to fill job vacancies. • Develop mechanisms to bring partners – such as employers, community organizations,
labour groups, professional organizations etc - to develop and initiate initiatives, enhance coordination and share best practices.
• Help Albertans to explore career pathways. Attract • Develop a coordinated marketing strategy to increase awareness about Alberta and position
the province as a destination of choice. • Work with industry, employers, professional organizations and industry and training providers
to improve the process for recognizing credentials, competencies and prior learning. Develop • Develop and implement comprehensive strategies to increase high school completion rates. • Develop strategies to increase participation in integrated and occupational training ((e.g. “just
in time” training programs for areas of skills shortages. • Develop strategies to increase training opportunities and participation among Aboriginal
peoples, immigrants and the disabled. • Develop training and learning opportunities that allow Albertans to upgrade skills while
working such as part-time, mentoring and employer supported training. • Develop work and education training programs to improve access and transitions into and
within the advanced education system.

Research to Evaluate the Shortage of Skilled Workers in Northern Alberta Chapter 7 - Strategies, Programs and Best Practices
Prepared for The Northern Labour Market Information Clearinghouse Project By Steven Lakey, MBA, CMC Page 122
Retain • Continue to build upon the success of the Work Safe Alberta initiative to implement new
approaches to further reduce work related injury or disease. • Develop programs to support and integrate new immigrants such as ESL, settlement
services, welcoming communities and welcoming workplaces. • Work with community groups to develop community action plans to address labour force
retention issues. II. Government of Canada Some of the key Government of Canada strategies and initiatives designed to address skills shortages are discussed below. 1. Workplace Skills Initiative The Workplace Skills Initiative (WSI) is a new Human Resources and Skills Development Canada funding initiative, designed to help pilot innovative models that will mobilize and transform Canadian workplaces to meet both present and future challenges. A major objective of WSI is to fund pilot projects, which respond to a range of skills-related challenges in Canadian workplaces, improving our productivity and positioning us to compete effectively in the 21-century economy. A Call for Proposals package invites eligible organizations and their partners to develop projects that are:
• Partnership-based; • Focused on employers and employed Canadians; and • Support the objectives of the WSI, as defined in the Call for Proposals package.
2. Youth Employment Strategy The Youth Employment Strategy (YES) 1 is the Government of Canada's commitment to help young people, particularly those facing barriers to employment, get the information and gain the skills, work experience and abilities they need to make a successful transition to the workplace. Under the Youth Employment Strategy, Service Canada offers the following three programs: • Skills Link • Career Focus • Summer Work Experience
1 http://www.hrsdc.gc.ca/en/epb/yi/yep/newprog/yesprograms.shtml

Research to Evaluate the Shortage of Skilled Workers in Northern Alberta Chapter 7 - Strategies, Programs and Best Practices
Prepared for The Northern Labour Market Information Clearinghouse Project By Steven Lakey, MBA, CMC Page 123
To participate, youth must be between the ages of 15 and 30 (inclusive) at time of intake/selection and meet other residency and eligibility requirements. Employers must be businesses, Crown corporations, organizations (including not-for-profit, professional, employer and labour associations), public health and educational institutions, band/tribal councils and Municipal governments. More detail pertaining to each program is below. a. Skills Link Skills Link provides funding to community organizations to help youth facing barriers to employment - such as single parents, Aboriginal youth, young persons with disabilities, recent immigrants, youth living in rural and remote areas and high school dropouts - develop the broad range of skills, knowledge and work experience they need to participate in the job market. In particular it: • Offers a range of programs and services that can be tailored to meet individual needs and
provide more intensive assistance over longer periods of time. • Provides a client-centred approach based on an assessment of the specific needs of
individual youth. The program supports youth in developing basic and advanced employment skills. Participants benefit from a coordinated approach, providing longer-term supports and services that can help them find and keep a job.
b. Career Focus Career Focus provides funding for employers to help post-secondary graduates obtain career-related work opportunities in Canada to support their development of advanced skills, to help them make career-related links to the job market, and to assist them in becoming leaders in their field. In particular, it: • Provides funding for employers to help post-secondary graduates obtain career-related work
opportunities in Canada to support their development of advanced skills, to help them make career-related links to the job market, and to assist them in becoming leaders in their field.
• Offers youth a range of work experiences, learning and skill-building activities to help them choose careers and to encourage them to pursue advanced studies.
Eligibility and participation requirements are similar to those of the Skills Link program. However, because sponsor organizations are responsible for recruiting and selecting participants for this program, interested post-secondary graduates must directly contact organizations that have received funding for a Career Focus project. Service Canada has four delivery structures for its Career Focus program: • National Career Focus - provides financial assistance to employers and organizations to
deliver projects that are national in scope to provide post-secondary graduate youth with work experiences within Canada.
• Regional Career Focus – is administered through a network of regional/local offices located across the country. These projects provide financial assistance to employers and organizations to deliver projects at the regional and local levels.

Research to Evaluate the Shortage of Skilled Workers in Northern Alberta Chapter 7 - Strategies, Programs and Best Practices
• Sectoral Youth Career Focus - provides financial support to National Sector Councils and other cross-sectoral organizations. These organizations in turn develop work experience opportunities for post-secondary graduates.
• International Academic Mobility (IAM) - supports Canadian post secondary institutions in offering international learning opportunities to their students.
c. Summer Work Experience Summer Work Experience provides wage subsidies to employers to create summer employment for secondary and post-secondary students, and support the operation of summer employment offices. In particular, it: • Creates summer employment opportunities for secondary and post-secondary students, and • Supports the operation of summer employment offices where they may also find a job. These
jobs provide students with the opportunity to acquire skills, gain valuable work experience and help finance their return to school.
The program includes: • Summer Career Placements provides wage subsidies for private, public and not-for-profit
employers to create career-related summer jobs for secondary and post-secondary students from 15 to 30 years of age (inclusive).
• Service Canada Centres for Youth (SCCY) located across Canada and open to the public from May to August, free of charge.
These programs are delivered in partnership with 13 other federal departments/ agencies and various private, public and not-for-profit groups. 2 The two most likely of interest for Northern Alberta youth include: • Canada Mortgage and Housing Corporation
Housing Internship Initiative for First Nations & Inuit Youth (HIIFNIY) An initiative providing on-the-job training for First Nations and Inuit youth to assist them in pursuing employment in the housing industry.
• Indian and Northern Affairs Canada
First Nations and Inuit Youth Employment Strategy This site lists a number of programs which are designed to give First Nations and Inuit youth what they need to prepare for and participate in the world of work
2 http://www.hrsdc.gc.ca/en/epb/yi/yep/newprog/general.shtml
Prepared for The Northern Labour Market Information Clearinghouse Project By Steven Lakey, MBA, CMC Page 124

Research to Evaluate the Shortage of Skilled Workers in Northern Alberta Chapter 7 - Strategies, Programs and Best Practices
Prepared for The Northern Labour Market Information Clearinghouse Project By Steven Lakey, MBA, CMC Page 125
III. Other Programs and Initiatives to Address Skills Shortages This Section of the Chapter provides a brief review of some of the other programs and best practices that have been developed. 1. NAIT – Building on Demand In October of 2005, NAIT unveiled its Building on Demand campaign by announcing its goal to raise $50 million to help pay for the construction of 11 training centres which will focus on apprenticeship technologies and business. The institute will train 160,000 skilled workers in the apprenticeship and business fields from 2010-2020. Suncor Energy’s investment of $3 million is so far the largest cash gift NAIT has ever received. This investment will be used to create the NAIT Suncor Energy Centre for Piping Technologies. It will also support 10 scholarships each year for five years for students participating in this training. The scholarships will focus on aboriginal, immigrant, and female students – demographic groups that are currently underrepresented in Alberta’s trades workforce. Spartan Controls and Waiward Steel are other major investors. As of November 2005, approximately $13.5 million had been raised. 2. Talent Pool Project The Talent Pool Project began after the Calgary Chamber’s Human Resources Policy Committee became conscious that many businesses were having difficulty finding skilled workers. At the same time Committee members knew there were people in Calgary who were either under-employed or unemployed. It was launched to determine what business needed if it was to broaden recruiting efforts to reach the under-employed and unemployed. A Project Coordinator was engaged to oversee it. The Talent Pool’s primary task is to define businesses’ needs and to test companies’ willingness to access candidate pools they often overlooked. Information was gathered from companies of various sizes and from a broad range of business sectors in Calgary through interviews and focus groups. Organizations representing people most often unemployed or under employed were also interviewed. The nature of the under-utilized labour force was defined and the barriers members encountered in finding employment that fully utilized their abilities were documented. Then best practices were gathered from Calgary business and those in other cities in North America. The Talent Pool is strongly supported by the Calgary Chamber of Commerce where the project’s office is located. A report titled “Tapping Into Calgary’s Diverse Workforce” was published as a reference for employers. The report identified youth, older workers, new immigrants, Aboriginal people and people with disabilities as under-utilized, skilled labour groups and described the nature of each. It detailed best practices that companies could use to attract workers who were members of these groups and how to build a reputation as an organization that welcomes them both as employees and as customers. The report also described the challenges faced by each group and offered solutions for successful recruitment and retention. Contacts were also provided so that employers could easily get more information and reach organizations representing each Talent Pool group.
Research to Evaluate the Shortage of Skilled Workers in Northern Alberta Chapter 7 - Strategies, Programs and Best Practices
Prepared for The Northern Labour Market Information Clearinghouse Project By Steven Lakey, MBA, CMC Page 126
3. Workink Alberta WORKink Alberta is a web site hosted by EmployAbilities and operates in partnership with the Canadian Council of Rehabilitation and Work (CCRW), Community Futures Network Society of Alberta (CFNSA) and is funded through Alberta Human Resources and Employment, Community Futures Network Society of Alberta and Oteenow Employment & Training Society. It: • Is a virtual employment resource for job seekers with disabilities, entrepreneurs with
disabilities, Aboriginals with disabilities, employers, and career practitioners. • Connected to all areas of the province through community partnerships with agencies in rural
and urban areas. • Contains job postings, training opportunities, links to helpful web sites, and powerful articles
on looking for employment, hiring individuals with disabilities and dismantling barriers to employment.
• Offers online employment counseling services both via email and through a real-time chat room. Job seekers can easily access these employment services from any Internet computer, which can be helpful for Albertans in rural areas and Albertans who have mobility impairments. Through the web site, job seekers can participate in Virtual Workshops featuring such topics such as: Disclosing your Disability, Networking and Employer Expectations. Additionally, employers can hold job interviews, orientations and meet with a disability specialist through chat rooms saving time and money.
4. Syncrude Syncrude supports a number of different educational programs and initiatives that assist us in our commitment to bring qualified people into its workforce. a Operations
Keyano College Mine Operations Co-op Program A 10-month program for entry-level candidates that includes a three-month work term.
Keyano College Power Engineering Co-op Program A two-year program with two six-month work terms to train entry-level candidates to 3rd class Power Engineer qualifications.
Keyano College Process Operator Co-op Program A two-year program that includes completing the 4th class Power Engineer certification in addition to a Process Operations Certificate with an eight-month work term.
Saskatchewan Indian Institute of Technology (SIIT) Process Operator Co-op Program
b. Trades
Community Co-op Apprenticeship Program Apprenticeship program for local residents. Includes trades such as boilermaker, crane operator, electrician, sheet metal worker, machinist, instrumentation, millwright, pipe fitter and welder

Research to Evaluate the Shortage of Skilled Workers in Northern Alberta Chapter 7 - Strategies, Programs and Best Practices
Prepared for The Northern Labour Market Information Clearinghouse Project By Steven Lakey, MBA, CMC Page 127
NAIT Mechanical and Construction Trades Preparation Aboriginal Program Heavy Equipment Technician Co-op Program Registered Apprenticeship Program (RAP) Two-year trade apprenticeship program for grade 11 and 12 students
c. Administrative, Professional, Technical
Co-op / Discipline Program Non-Local: About 60 universities and colleges across Canada in a variety of disciplines including engineering, technologies, computer science, and other administrative and professional disciplines Local: Keyano College Co-op Program including programs in Accounting, General Business, Computer Information Systems, University Studies Engineering (1st year), Engineering Technology, Environmental Technology, Nursing and Office Administration
Saskatchewan Indian Institute of Technology (SIIT) Accounting and computer science
d. General Student Program
General Summer Student Program Summer employment program with administrative, heavy equipment operator and general worker opportunities
Career Prep Includes Grades 11 and 12 internships, as well as Educator internship
Work Experience Unpaid work experience opportunities for post-secondary students
Job Shadow Half or full-day job shadowing for local high school students
Take Our Kids To Work Day One-day job shadowing for Grade 9 students
IV. Implications and Opportunities For Clearinghouse Colleges The aggressive objectives of the Government of Alberta, and some of the newer programs of the Federal Government and other best practices have the following opportunities and implications: 1. College administrators and planners should ensure that they are familiar with new
programs and strategies and have provided input and feedback.
In particular, it is suggested that there is an opportunity to provide comments pertaining to the new strategy “Building and Educating Tomorrow’s Workforce: A framework to enhance Alberta’s people capacity”. Furthermore, some of the new Federal programs and strategies may provide an opportunity to fund innovative and experimental pilot projects tailored to the unique needs of communities and residents within the catchment areas of Clearinghouse colleges.

Research to Evaluate the Shortage of Skilled Workers in Northern Alberta Chapter 7 - Strategies, Programs and Best Practices
Prepared for The Northern Labour Market Information Clearinghouse Project By Steven Lakey, MBA, CMC Page 128
2. Steps should be taken to further strengthen linkages and the flow of labour market information within regions.
It is suggested that some of the important roles for the colleges are to 1) make sure that students and prospective students are fully familiar with all sources of labour market information; and 2) consider how it might be possible to take a more proactive stance in developing labour market information at the regional level with local employers. For example, through Alberta Works Employment and Training Services, Albertans have access to career, workplace and labour market information to help choose a training or learning path, to find and keep a job and to plan or change careers. In particular: •
Careers in Motion is a new state-of-the-art mobile Labour Market Information Centre. • Job Placement Services matches unemployed Albertans with employers who need to
fill jobs. • Labour Market Information Centres provide information to help make career, learning
and work decisions. • Canada-Alberta Job Order Bank Service (JOBS) is a job bank service for Alberta job
seekers and employers. • Career Hotline offers career consulting and referral services to help Albertans with
their career planning needs. • Career & Employment Assistance Services helps Albertans interested in employment
transitions prepare for the workforce. • Youth Connections provides Alberta youth with career planning and counselling
services, labour market information, assistance connecting with learning and work opportunities and access to workplace programs.
3. The “Talent Pool” project model provides the potential platform to address several opportunities and needs within Northern Alberta and should be reviewed for possible applications at the local level.
The model provides a stronger ability for employers to link with individuals who have key skill sets but may need some assistance or training to overcome minor obstacles. It might be possible for colleges to provide some of the training in the form of special short programs or “bridges”. Another strong benefit of the “Talent Pool” model is that the use of “ambassadors” who are trusted and respected by under-represented groups such as Aboriginals, Youth, the Disable and older workers will help to ensure that some of the current problems that might be consider to be “cultural or perceptual” are mitigated. This could be either via the greater level of “comfort” created by the ambassador or the ability of the ambassador to help to design initiatives to address problems and help to be a “champion”. The ability to provide counselling or mentoring services somewhat similar to those provided under the Workink Alberta program will help to further improve linkages and improvement of understandings.

Research to Evaluate the Shortage of Skilled Workers in Northern Alberta Chapter 7 - Strategies, Programs and Best Practices
Prepared for The Northern Labour Market Information Clearinghouse Project By Steven Lakey, MBA, CMC Page 129
4. The successful integration of a larger number of immigrants will create opportunities and needs for colleges.
Between 1997 and 2001, approximately 29,000 immigrants with post-secondary credentials arrived in Alberta; however, it is estimated that about half are unemployed or under employed. The major contributors to immigration under employment include poor pre-migration information, lack of understanding of the credentialing process in Alberta, limited access to bridging programs, and level of English language proficiency.
In addition, Ontario, British Columbia and Manitoba have introduced initiatives to integrate skilled immigrants into the labour market and the federal Innovation Strategy includes integration of skilled immigrants as a priority for achieving innovation and productivity goals. Colleges can help to play a role in providing information to embassies and High Commissions related to local communities in Alberta. Upon arrival, new immigrants and employers and other residents may be faced with the challenges of ensuring that work places and communities are “welcome” and that there is an appreciation of other cultures and customs. Even for immigrants who speak English, come from “Western” cultures, and have credentials that are accepted fully, there may be a need for skills and language “bridging” courses from the perspective of “work place” terminology” and the specifics of how a trade or a profession is practiced in Canada. It may be particularly helpful for foremen and supervisors to have mentorship training (for which there would appear to be a need in any event, based upon the discussion in Chapter 6) to help with the integration of new immigrants. Spouses and children of immigrants may require specialized language or other training. To this end, and in conjunction with some of the other discussion, above, spouses and children may present employers with a supply of labour for some “hard to fill” service sector jobs while language skills are being improved. The “Building on Demand” model of marshalling resources to address a collective problem may have some potential to address some of the issues that may be associated with immigrants.
5. From a demographic perspective, Northern Alberta is in a stronger potential
position to deal with future skills shortages than are other parts of Canada because the population is considerably younger.
However, It is relatively clear from the previous Chapters of this study that Northern Albertans will require a higher level of education, in general, than that which currently exists in order to meet the skills requirements of the future. To capitalize on the potential will require that future youth have the basic skills to be able to succeed in more demanding post-secondary training programs. An important potential role for

Research to Evaluate the Shortage of Skilled Workers in Northern Alberta Chapter 7 - Strategies, Programs and Best Practices
Prepared for The Northern Labour Market Information Clearinghouse Project By Steven Lakey, MBA, CMC Page 130
Clearinghouse colleges may be to help to design programs that will ensure a higher likelihood of success (possibly via some of the potential pilot projects or greater use of “trusted role models” such as in the “Talent Pool” model) and to ensure that youth are more aware of career and learning pathways.
6. The potential role for colleges in fostering innovation as part of the overall strategy to address skills shortages should not be overlooked. Colleges need to try to ensure that students are of an entrepreneurial mindset. There may also be opportunities to take a greater role in the development of applications for some technologies and in the establishment of formal or informal networks to share technical and business information. From point 2, some Federal monies may be available to explore innovative and experimental initiatives and efforts should be made to establish linkages with Federal officials and to obtain additional information.

Research to Evaluate the Shortage of Skilled Workers in Northern Alberta Chapter 8 –Conclusions and Recommendations
Prepared for The Northern Labour Market Information Clearinghouse Project By Steven K. Lakey, MBA, CMC Page
131
Chapter 8 Conclusions and Recommendations
This chapter summarizes the major findings and conclusions and recommendations arising from the preceding evaluation of the shortage of skills in Northern Alberta. I. Findings and Conclusions The major findings and conclusions of the study are as follows. 1. There are a number of limitations that must be considered with the findings of this
project.
As noted in Chapter 1, they include: • Timeliness for the 2001 Census data; • Projections and forecasts during times of great change; • The underlying assumptions used and lack of control over factors such as migration; • The lack of information, in some cases, at the regional and sub-regional levels, or the
level of statistical validity that has been and /or can be achieved with the same; • The “fit” of some of the data from a geographic perspective; and • The complexities of using two different occupational systems (NOC-2001 and NOC-
2001) for some of the data. Because of some of these limitations, for the most part, the report deals with skills shortages by using the forecast demand for occupations (and sub-components such as growth or decline in numbers and rates of change) as a “surrogate” indicator rather than focusing on the specific skill requirements of occupations, or other possible definitions of skills shortages. Furthermore, it is probably better to consider the trends that can be derived from the data rather than the specific details.
2. When Northern Alberta is compared to Alberta and Canada, there are considerable
differences in terms of factors such the rate of growth for the population, the composition of the population and the composition of the labour force that may require the development of unique solutions to the issues associated with skills shortages.
The population is considerably younger, there are fewer people of retirement age, fewer immigrants and visible minorities, and the proportion of the population that is Aboriginal is considerably larger than that of Alberta or Canada. Using the 1997 North American Industry Classification System as one indicator, Northern Alberta has a higher proportion of its workforce engaged in primary industry (12% vs. 5% for Alberta and 1% for Canada) and the retail sector (almost 10% vs. 5% for Alberta and

Research to Evaluate the Shortage of Skilled Workers in Northern Alberta Chapter 8 –Conclusions and Recommendations
Prepared for The Northern Labour Market Information Clearinghouse Project By Steven K. Lakey, MBA, CMC Page
132
3.6% for Canada) There are also lower levels of individuals engaged in technical and professional services (5.4% vs. 8% for Alberta and almost 14% for Canada), and management of companies (3% vs. 7% for Alberta and 5% for Canada). Using the NOC – S classification system, there is a high proportion of individuals engaged in trades (23% vs. 16% for Alberta and 14% for Canada), and a lower level of individuals engaged in business related occupations (13% vs. 17% for Alberta and Canada. The proportion of individuals engaged in primary industry is 13% vs. 6% for Alberta and 4% for Canada. There is also a higher proportion of individuals who work out of their homes (almost 14% vs. 10% for Alberta and 8% for Canada), and individuals who are self-employed (16% vs. 14% for Alberta and 12% for Canada. It will be of considerable interest to ascertain how these proportions may have changed once the 2006 census is completed. Aboriginals, particularly those in smaller and more isolated communities, have participation, employment and unemployment rates that are relatively poor. On average, these were 48%, 37% and 11%, respectively vs. 76%, 71% and 5%, respectively for the non-Aboriginal population. In general, the population of Northern Alberta has grown on a par with Alberta but much faster than Canada; however, the growth is not distributed evenly. Census Division 16 has experienced growth of almost 32%, while the growth in Census Division 18 has been less than 6%, reflecting an overall shift to larger urban areas. The following table provides a summary of key variables.
Variable Northeast Northwest North Alberta CanadaMedian age (2001) 32.3 35.0 33.8 35.0 37.6 Aboriginal (2001) 17.7% 17.8% 17.8% 5.3% 3.3% Visible Minority (2001) 3.4% 2.2% 2.7% 11.1% 11.1% Immigrants (2001) 6.0% 4.9% 5.3% 14.7% 18.2% Preschool (2005) 7.8% 8.6% 8.3% 6.3% 5.3%School (2005) 23.8% 24.7% 24.3% 20.3% 19.0%Postsecondary/Early Career (2005) 7.8% 7.9% 7.8% 7.4% 7.0%Prime Working (2005) 53.7% 51.2% 52.2% 55.7% 55.7%Retired (2005) 6.9% 7.7% 7.4% 10.3% 13.1%Total 100.0% 100.0% 100.0% 100.0% 100.0%
Note: The following definitions were used for the 2005 data:
Preschool School Postsecondary/Early Career Prime Working Retired
0 to 4 5 to 19 20-24 25 to 64 65 +

Research to Evaluate the Shortage of Skilled Workers in Northern Alberta Chapter 8 –Conclusions and Recommendations
Prepared for The Northern Labour Market Information Clearinghouse Project By Steven K. Lakey, MBA, CMC Page
133
3. The basic education levels of Northern Albertans may be limiting factors in
meeting future skills requirements. The proportion of Northern Albertans over the age of 20 who do not have a high school diploma or equivalent is approximately 67%. By comparison, the comparable figures for Alberta and Canada are approximately 54% and 56%, respectively. Of even greater potential concern is the almost 10% of Northern Albertan who do not have at least grade 9 (compared to 6% for Alberta and 10% for Canada). Up to 6,000 Northern Albertans may be in need of upgrading to achieve even a grade 9 level of education. Up to 1,800 Northern Albertans could benefit from English as Second Language training. The percentage of Northern Albertans who hold university degrees or other professional credentials is approximately 12%, while a further analysis of training needs through to 2010 suggests that closer to 14% to 15% of occupations will require such credentials.
4. In reviewing the historical profile of skills requirements in Northern Alberta it is
apparent that much of the demand over the period 2001 to 2005 has been met via withdrawals from the agriculture sector to the oil and gas sector (companies able to pay premium wages).
During the period 2001 to 2005, the Northern Alberta skills requirement are estimated to have grown by approximately 2,600 jobs or 1.5% (from 175,800 to 178,400) with a net increase of 4,100 in the Northeast and a loss of 1,500 in the Northwest. However, it is estimated that the Agriculture sector lost approximately 5,300 with an estimated additional 3,300 jobs being created in relation to oil and gas exploration.
5. Between 2005 and 2010, Northern Alberta will require a net addition of
approximately 19,000 individuals (or perhaps best thought of in terms of “man-units of skills”) over and above the current base of approximately 175,000, to meet projected demands; however, this figure understates the potential skills shortfall.
The requirements of Northeastern Alberta will grow by approximately 15.8% (9,500 on a base of 61,000 in 2005) and the requirements for Northwestern Alberta will grow by 7.6% (8,900 on a base of approximately 118,000 in 2005). However, the net additional requirement figures do not take account of the complex changes that are occurring within Occupational Categories. For example, the agricultural sector is expected to lose a further approximately 680 positions during the period (in addition to the approximately 5,300 jobs that were estimated to have been lost in the 2001 to 2005 period, as above. In addition, since the projections were developed in 2005, there have been a number of new major construction projects that have received approval. In terms of the composition of the additional requirements, the following table provides a summary of the 10 Occupational Categories that will have the largest increase in numbers between 2005 and 2010.

Research to Evaluate the Shortage of Skilled Workers in Northern Alberta Chapter 8 –Conclusions and Recommendations
Prepared for The Northern Labour Market Information Clearinghouse Project By Steven K. Lakey, MBA, CMC Page
134
10 OCCUPATIONAL CATEGORIES WITH THE LARGEST INCREASE IN NUMBERS – 2005 TO 2010
New Jobs Northern
2005 to 2010Percentage of Total
Totals 18,490 100.0% G9 Sales and service occupations, n.e.c. 1,750 9.5% B5 Clerical occupations 1,530 8.3% H7 Transportation equipment operators 1,450 7.8% G2 Retail salespersons and sales clerks 960 5.2% A2 Managers in retail trade, food and accommodation 840 4.5% H1 Construction trades 800 4.3% H4 Mechanics 730 3.9% G3 Cashiers 600 3.2% H8 Helpers, construction and transportation labourers 580 3.1% H6 Heavy equipment and crane operators, including drillers 570 3.1% Sub-total Top 10 9,810 53.1%
New Jobs Wood Buffalo – Cold Lake
2005 to 2010Percentage of Total
Total 9,590 100.0% G9 Sales and service occupations, n.e.c. 830 8.7% H7 Transportation equipment operators 710 7.4% B5 Clerical occupations 700 7.3% H1 Construction trades 700 7.3% H6 Heavy equipment and crane operators, including drillers 460 4.8% H8 Helpers, construction and transportation labourers 410 4.3% G2 Retail salespersons and sales clerks 380 4.0% A2 Managers in retail trade, food and accommodation 340 3.5% H4 Mechanics 340 3.5% A3 Other managers, n.e.c. 330 3.4% Sub-total Top 10 5,200 54.2%
New Jobs Athabasca – Grande Prairie
2005-2010 % Of Total
Total 8,900 100.0% G9 Sales and service occupations, n.e.c. 920 10.3% B5 Clerical occupations 830 9.3% H7 Transportation equipment operators 740 8.3% G2 Retail salespersons and sales clerks 580 6.5% A2 Managers in retail trade, food and accommodation 500 5.6% H4 Mechanics 390 4.4% G3 Cashiers 350 3.9% E1 Teachers and professors 330 3.7% E2 Paralegals, social services, education and religion n.e.c. 280 3.1% J1 Machine operators in manufacturing 260 2.9% Sub-total Top 10 5,180 58.0%

Research to Evaluate the Shortage of Skilled Workers in Northern Alberta Chapter 8 –Conclusions and Recommendations
Prepared for The Northern Labour Market Information Clearinghouse Project By Steven K. Lakey, MBA, CMC Page
135
6. There are a number of Occupational Categories for which the rate of increase in
demand over the period 20005 to 2010 is expected to be very high. Over the period 2005 to 2010, the annual average growth rate (AAGR) for occupations for the Northern Region and the Wood Buffalo – Cold Lake and Athabasca – Grande Prairie Sub-regions, it is expected to be 1.7%, 2.6% and 1.3%, respectively. In comparison, for all of Alberta is forecast to be 1.8%. In the following table, the 10 Occupational Categories expected to experience the highest AAGR are highlighted.
10 OCCUPATIONAL CATEGORIES WITH THE HIGHEST AAGR 2005 TO 2010
AAGR Northern / Occupational Category
G2 Retail salespersons and sales clerks 3.4% G3 Cashiers 3.0% G1 Wholesale, technical, insurance, real estate sales 3.0% A2 Managers in retail trade, food and accommodation 2.6% J3 Labourers in processing, manufacturing and utilities 2.6% H7 Transportation equipment operators 2.5% H8 Helpers, construction and transportation labourers 2.4% D2 Technical and related occupations in health 2.4% B2 Secretaries 2.3% G8 Child care and home support workers 2.3%
AAGR Wood Buffalo – Cold Lake / Occupational Category
H8 Helpers, const and transp labourers 5.2% G2 Retail salespersons and sales clerks 4.9% J3 Labourers in process, man & utilities 4.6% H1 Construction trades 4.5% H7 Trans & equipment operators 4.2% H0 Contractors and supervisors in trades 4.2% G1 Wholesale, technical, ins, real estate 3.8% B2 Secretaries 3.7% H5 Other trades, n.e.c. 3.5% G0 Sales and service supervisors 3.5%
AAGR Athabasca – Grande Prairie / Occupational Category
G2 Retail salespersons and sales clerks 2.9% G3 Cashiers 2.8% G1 Wholesale, technical, insurance, real estate sales 2.6% A2 Managers in retail trade, food and accommodation 2.4% D2 Technical and related occupations in health 2.3% G8 Child care and home support workers 2.3% E1 Teachers and professors 2.1% J3 Labourers in processing, manufacturing and utilities 2.1% G9 Sales and service occupations, n.e.c. 1.9% H7 Transportation equipment operators 1.8%

Research to Evaluate the Shortage of Skilled Workers in Northern Alberta Chapter 8 –Conclusions and Recommendations
Prepared for The Northern Labour Market Information Clearinghouse Project By Steven K. Lakey, MBA, CMC Page
136
7. Generally speaking, most employers expressed concerns with regard to hiring staff, and wages in Northern Alberta are higher than in other parts of Alberta and reflective of the concerns; however, the most serious concerns were voiced by employers who had a need for specific trades that were in high demand or employers who were not able to compete with the oil and gas sector.
This is a fairly complex subject to discuss and it may be most effective for the reader to reference the tables in Chapter 3, Section VII for further details and comparisons.
8. From a longer-term demographic perspective, the composition of the population of
Northern Alberta may exacerbate the skills shortages, particularly over the period of approximately 2014 to 2020.
Over the period through to 2026, Northern Alberta’s population will be categorized by a rapidly growing youth population and a rapidly growing senior’s population. During the period of approximately 2014 to 2020, the number of retirees will increase rapidly, yet the number of people of “prime work force age” (24 to 64) will not keep pace with withdrawals, particularly if the size of the work force is compared as being a proportion of the total population. The problem will be most severe in the Northwest if current population and migration assumptions hold. The problem starts to correct beginning in about 2022 as the youth population becomes of working age and the number of baby boom” retirees each year begins to decline.
9. With respect to the education levels needed to meet skills requirements in 2010,
the following scenario is likely.
Approximately 12% of occupations will require a university education. The two largest components will be teachers and nurses. Between 40% and 53% of occupations will require completion of a two- year college program or an apprenticeship program. The largest concentrations will be for trades persons and equipment operators and those in business, finance and administration. A high school education will be adequate for approximately 20% of future requirements. Most in Northern Alberta will be of a clerical nature. Individuals with less than a high school education (and without other training) will be limited to approximately 15 % of future opportunities.
10. Changes in technology are, in general, not likely to mitigate the shortage of skills over the near term; however, it will be important for colleges and students to stay abreast of changes and there may be roles for colleges to help to develop technologies.
With the exception of the retail sector, where changes in Radio Frequency Identification (RFID) and Point of Sale (POS) technologies may reduce the need for inventory control and check out/cashier staff, few other technological advances are expected to reduce the need for workers. In the labour intensive construction sector, technological advances are particularly slow to be accepted and are more likely to require workers to have

Research to Evaluate the Shortage of Skilled Workers in Northern Alberta Chapter 8 –Conclusions and Recommendations
Prepared for The Northern Labour Market Information Clearinghouse Project By Steven K. Lakey, MBA, CMC Page
137
specialized training. The oilsands and forestry sectors are faced with a wide range of ongoing technological challenges that will be required to lower costs and improve efficiencies. There may be a role for Northern colleges to involved in the development of the technology from an applied perspective so that dissemination of knowledge can be advanced as quickly as possible according to the skill sets of workers. For most of the occupations for which the impact of technology was reviewed workers will be required to be more computer literate and have a greater understanding of scientific principles or be able to handle situations that may require judgment such as Freedom of information and Privacy Issues.
11. Other possible emerging opportunities such as coal bed methane and diamonds
have the potential to further exacerbate the shortage of skills; however, there are associated issues that may “dampen” their impacts.
In the case of coal bed methane, each “play” has different geological characteristics that require specific technologies and there are serious issues with respect to discharge or disposal of water required to extract the methane. While there is strong evidence to support diamonds in Alberta, no “commercial” diamond kimberlites have yet been found. Canadian diamonds are held in high regard for “matters of the heart”; however, with increasing finds in the Northwest Territories and Nunavut and strong evidence in Saskatchewan and other parts of Eastern Canada, the market may begin to suffer from dilution. In addition, advances in synthetic diamond production have reduced costs and increased capabilities for commercial and industrial applications of diamonds.
12. Some current attitudes and perceptions and economic factors may also be
contributing to the shortage of skills in Northern Alberta.
Many trades have long suffered from negative perceptions (discussed in Chapter 6) that have long acted as deterrents to entry. There is arguably a lack of trust and understanding and commitment between many employers and Aboriginals, and the costs of living in Northern Alberta and perceptions or realities associated with a lack of amenities stop many from considering relocating to the area or make it economically unviable to work in lower paying occupations.
13. Governments and industry are very concerned by the shortage of skills and have
devoted considerable effort and resources to find a solution; however, it is apparent that “new ways” and “new views” may be required.
In the context of Northern Alberta, the number of individuals from the under-represented groups of immigrants, the disabled, youth and Aboriginals who could be realistically drawn into the labour force through to 2010 is relatively small and estimated in the order of 2,700. This would be approximately 14% of the requirements of Northern Alberta through to 2010. Under this scenario, there is some credence to the emphasis placed upon immigration as a partial solution.

Research to Evaluate the Shortage of Skilled Workers in Northern Alberta Chapter 8 –Conclusions and Recommendations
Prepared for The Northern Labour Market Information Clearinghouse Project By Steven K. Lakey, MBA, CMC Page
138
A higher proportion of immigrants may create roles for Northern colleges from several perspectives. It is possible that there will likely be a strong requirement to promote cultural sensitivity to ensure that work places and communities are welcome. Furthermore, immigrant families who are not from western cultures may require additional language and cultural assimilation training. Employers, and supervisors in particular, may benefit from additional mentoring training to help to deal with the nuances of a culturally diverse work force. Colleges may also play a stronger role in helping to ensure that some of the expected amenities of a “cultural” nature are in place for their communities and help to ensure that accurate information is made available to immigrants before arrival. Finally, even immigrants from western backgrounds who are fully qualified in a trade or profession may require specialized “bridge” training to adapt to the minor differences and nuances of Northern Alberta and Canada. However, even increasing the number of immigrants is not likely to solve the skills shortage problem. A major component will be to make sure that the existing labour force has the best training and basis skills to be able to enter challenging and high demand occupations and is aware of path ways and options. In this regard, the Government of Alberta is actively seeking input to the development of it’s strategy, and the Government of Canada has developed new programs with resources to support innovative projects of an experimental or pilot nature. Two models for programs that may be of benefit for Northern Alberta and qualify for some of the funding referenced above are the “Talent Pool” and the NAIT “Building on Demand”. In the case of the “Talent Pool”, resources are focused on individuals who may have “potential” but require minor degrees of assistance. The “Talent Pool” concept could be strengthened considerable by “ambassadors” capable of liaising with, and gaining the trust of certain groups who may not be engaged in the work force to their full potential. The “Building on Demand” model provides a basis to marshal efforts toward solving a common problem, and may lend itself to cases of government monies being matched with private sector monies.
II. Recommendations The major recommendations arising from the study are presented in this section. They have been prepared for consideration of implementation over a phased period of time. As such, they are grouped into three principal “categories or stages”:
• A - Short-term (primarily between now and June 2006); • B - Medium-term (June 2006 to June 2007); and • C - Long-term (Beyond June 2007).

Research to Evaluate the Shortage of Skilled Workers in Northern Alberta Chapter 8 –Conclusions and Recommendations
Prepared for The Northern Labour Market Information Clearinghouse Project By Steven K. Lakey, MBA, CMC Page
139
A. Short-term Recommendations 1. Review the details of this report and consider whether to more formally focus
efforts on select occupations or occupational categories that may be of a higher priority.
Chapter 3 of the report presents considerable detail regarding the expected change in
demand for 47 Occupational Categories as well as other indicators of the concerns of employers such as hiring difficulties or vacancy rates. Chapter 4 presents a possible matrix for the prioritization of Occupational Categories based upon the size of the labour force base, increase in numbers of workers as well as percentage change in requirements. It is possible that there might be other factors of relevance at the local level that would have a bearing on the prioritization of resources such as needs within the catchment area of colleges and the existing programs and skills of the colleges.
2. If it is decided that a strategy based, at least in part, upon the prioritization of
occupations might be appropriate, begin/continue to consult with other stakeholders to share information, review needs and existing plans and strategies and their advantages and disadvantages and begin to plan how best to proceed with a coordinated approach.
Other stakeholders are likely to include major employers, local levels of government, unions and professional associations as well as various community and other interest groups. In formulating networks and structures, the objective would be to develop a greater flow of information to better understand the objectives, needs and concerns within the sectors or occupational classifications, to share information on best practices and to apprise other stakeholders of, among other things, current activities, strategies and other developments that may affect other sectors, or to share research or the costs of more specific research related to attaining a better understanding of the specific circumstances of the industry in Northern Alberta and potential roles that the colleges may play. Depending upon the needs and interests of stakeholders, a variety of forums or mechanisms might be possible from regular and formal (monthly or otherwise) meetings, special tasks forces, to less formal information and networking opportunities.
3. Consider beginning a more detailed review of the training needs of specific
priority occupations (possibly based upon the information provided as Appendix 1 as well as the impact of technological change discussed in Chapter 5). The objective would be to start to develop a better understanding of the occupations and training requirements and how local students are currently prepared, and the type of new skills that may be required. This may also be an appropriate opportunity for the colleges to begin to become more involved in the development and application of some technologies, and may be a strong tenant in fostering a higher degree of innovation. In addition, based upon existing training programs discussed in Appendix 1, it may be

Research to Evaluate the Shortage of Skilled Workers in Northern Alberta Chapter 8 –Conclusions and Recommendations
Prepared for The Northern Labour Market Information Clearinghouse Project By Steven K. Lakey, MBA, CMC Page
140
possible to begin to further refine the prioritization process referenced in “1”, above, and to start to develop a better understanding of how to best prepare local students for the programs and for the specific institutions to begin to consider any modifications to their programs or teaching methods. The objective would be to begin to consider how to best accommodate Northern students to improve outcomes and completion rates without diluting the content or quality of the program in some cases.
4. Take steps to continue to become familiar with existing and new government and
private sector programs, resources and strategies (and their key staff), and provide input as required or desired. The input may be on an individual college basis, or from the basis of stakeholder groups or other combinations that may have been formed in points “1” through “3”.
There are several potential objectives and/or benefits:
• A forum is created to provide input into the development of the strategy, given unique Northern Alberta needs;
• Clearinghouse members develop better channels for sharing information, addressing concerns and coordinating efforts;
• Clearinghouse members and other stakeholders are in a stronger position to provide information on different pathways and job search resources to existing and prospective students and other community stakeholders; and
• Opportunities may be identified to obtain funding for pilot or other innovative programs focused on specific groups or needs.
5. Begin to develop relationships with individuals or “recruiters” who may have
influence over groups of individuals such as older individuals, youth, immigrants, Aboriginals and disabled individuals who have skills but are not working, or are traditionally under-represented in the labour force.
The objective would be to gain a better understanding of how to make under-represented individuals more aware of opportunities (such as places to advertise, how to advertise, etc.) and the additional benefit to potential employers of understanding of key motivations and needs for a positive, longer-term (career oriented) and rewarding work experience and other employer and employee barriers that may need to be overcome to move forward into the work force. If there appears to be interest and benefits, the steps may lead to a more formal “Talent Pool” or “Building on Demand” emphasis over the medium to longer-term.
6. Begin or continue to assess and develop activities and needs to accommodate larger numbers of immigrants.
As noted in Chapter 2, the proportion of the population of Northern Alberta that is of a visible minority or immigrant background is very small compared to Alberta and Canada.

Research to Evaluate the Shortage of Skilled Workers in Northern Alberta Chapter 8 –Conclusions and Recommendations
Prepared for The Northern Labour Market Information Clearinghouse Project By Steven K. Lakey, MBA, CMC Page
141
It might be fair to accept that with the generally lower levels of education in Northern Alberta that some segments of the population may have a tendency to be more “insular” in their outlooks. As such, a greater effort to foster mutual understanding and respect and to create “welcoming communities and work places” in general may be warranted. More specifically, training at the supervisory or foreman level to foster mentoring may be beneficial. Immigrants may benefit from “bridge training” to address minor deficiencies in their training in the context of Alberta, ways and practices and technologies as well as day to day “business English”. There may also be a role for colleges to play a larger role in providing prospective immigrants with information pertaining to specific communities before coming to Alberta and to help meet the needs of spouses and children when, for example, language skills are in need of improvement.
B. Medium-term Recommendations 1. Continue to review programs and activities and establish networks and forums for
recommendations “1” through “6”, above.
A key consideration or objective will be to refine activities to help to ensure that the application of “collective resources” is optimal toward addressing areas of concern. This might encompass the specifics of individuals or groups who should be represented, creation of ways and means of sharing information and environmental scanning so as to be able to accommodate changes in priorities or objectives as circumstances evolve.
2. Consider how priority efforts or successful initiatives might be expanded further
into the community or work place.
As a specific example, should the “Talent Pool” concept be considered a valuable tool, there might be the need or opportunity to have a larger cadre of paid “ambassadors” who could act as “trusted liaisons” or “role models” to help to bring specific groups or individuals into the work place. The value of the approach goes further to include acquiring a better understanding of some of the specific approaches to the delivery of educational programs that may have the best chance of success given the interests, aptitudes and needs of certain groups. Given some of the longer-term demographic characteristics of Northern Alberta that may further exacerbate the skills shortage challenge starting in eight to 10 years time, it will be of vital importance that all Northern Albertans have the opportunity, basis skills and outlook to achieve full potential.
3. As priority efforts and needs become clearer, begin to develop more formal
accountability frameworks and ways and means of establishing objectives and monitoring progress.
It is likely to be of great importance to be able to have good records of progress achieved in order to be in a stronger position to “sway” other efforts and to attract additional

Research to Evaluate the Shortage of Skilled Workers in Northern Alberta Chapter 8 –Conclusions and Recommendations
Prepared for The Northern Labour Market Information Clearinghouse Project By Steven K. Lakey, MBA, CMC Page
142
resources to meet objectives. Furthermore, a formal review of achievements against plans will be vital in order to monitor progress and have the basis to make rigorous assessments and to implement changes to activities or priorities if and as when required.
C. Longer-term Recommendations 1. Continue to monitor progress and develop and refine activities, priorities and
strategies as required.
The skills shortfall is a very complex issue and is driven to some extent by factors such as development, rising costs and demographic characteristics beyond the control or influence of the Clearinghouse colleges. It is unlikely that any one approach will suffice. As such, as efforts to address skills shortages evolve, it may be apparent that different priorities are in order. Different teaching methods or programs may be more effective in helping to ensure that the population in general and select groups are best prepared. Changes in technology, such as Internet or teleconferencing options may prove to be effective in ensuring desired outcomes or reducing costs. Other forums or networks may be better in marshalling resources or creating awareness. Certain individuals or approaches may be more effective and certain institutions or combinations may be best positioned to address needs.

Research to Evaluate the Shortage of Skilled Workers in Northern Alberta Appendix 1 – Select Occupational Details
Prepared for The Northern Labour Market Information Clearinghouse Project By Steven K. Lakey, MBA, CMC Appendix 1 Page
1
Appendix 1 Select Occupational Details
More detailed information is presented in this Appendix for each of the occupations listed in Table 5.2 of Chapter 5, including: • An overview and description of duties; • Educational requirements; and • Existing training programs. The information is derived from the Alberta Learning Information System (ALIS) web site. While lengthy, and perhaps best viewed as an appendix, a key consideration and desire in the preparation of this portion of the report was to provide information that Clearinghouse planners could use to: consider and design programs according to the unique characteristics of the students in the “catchment” areas of colleges; consult with other educators; and provide some counseling to prospective students. Occupations Applicable to Multiple Sectors H4 - Mechanics 1. Heavy Duty Mechanics: NOC Code 7312 Overview of Duties Heavy equipment technicians maintain, repair and overhaul towed and self-propelled heavy vehicles and industrial heavy equipment and commercial transport devices connected to or moved by a power unit. Duties vary from one position to another but, in general, heavy equipment technicians: Interpret work orders and technical manuals; Keep equipment cleaned, lubricated and maintained; Diagnose faults or malfunctions; Adjust equipment and repair or replace defective parts, components or systems; Test repaired equipment for proper performance to ensure that the work done meets manufacturers' specifications and legislated regulations; and Write service reports. In Alberta, the heavy equipment technician trade has four branches. A journeyman in the trade may be certified as a: Transport Trailer Mechanic; Truck and Transport Mechanic; Heavy Duty Equipment Mechanic (Off-Road); or Heavy Equipment Technician. Transport trailer mechanics maintain and repair transport devices such as flat decks, dry freight vans, refrigerated vans, tankers, converters, boosters, pole trailers, jeeps, steering dollies and dump trailers, and any other commercial pull type devices). Truck and transport mechanics maintain and repair vehicles and equipment such as: Stationary and mobile internal combustion engines and components; On-highway vehicles (trucks and buses); and Towed on-highway and off-highway vehicles (trailers). Heavy-duty equipment mechanics (off-road) maintain and repair vehicles and equipment such as: Stationary and mobile internal combustion engines and components; Tracked equipment (crawler tractors); Ground-engaging equipment and components such as rippers, ditchers, backhoes and trenchers and similar equipment; Towed earth-moving equipment (scrapers); Self-

Research to Evaluate the Shortage of Skilled Workers in Northern Alberta Appendix 1 – Select Occupational Details
Prepared for The Northern Labour Market Information Clearinghouse Project By Steven K. Lakey, MBA, CMC Appendix 1 Page
2
propelled earth-moving equipment (motor scrapers); Off-highway motor vehicles (trucks); and Towed off-highway vehicles (trailers). Heavy equipment technicians maintain and repair vehicles and equipment such as: Stationary and mobile internal combustion engines and components; Tracked equipment (crawler tractors); Ground engaging equipment and components, including rippers, ditchers, backhoes, trenchers and similar equipment; Towed earth moving equipment (scrapers); Self-propelled earth moving equipment (motor scrapers); Rubber tired equipment (tractors); On-highway and off-highway motor vehicles (trucks); and Towed on-highway and off-highway vehicles (trailers). Educational Requirements To work in Alberta, heavy equipment technicians must be registered apprentices or certified journeymen. To register with Alberta Apprenticeship and Industry Training, apprentices must: • Have at least an Alberta high school transcript (with Math 20 or 23, Applied Math 20 or Pure
Math 20, English 20 or 23 and Science 20, Physics 20, Biology 20 or Chemistry 20) or equivalent or pass an entrance exam
• Find a suitable employer who is willing to hire and train an apprentice. Most employers prefer to hire high school graduates or technical school graduates and may select apprentices from among their current employees.
The terms of apprenticeship for the Heavy Equipment Technician trade are as follows: • Transport Trailer Mechanic is two years (two 12-month periods) that include a minimum of
1,500 hours of on-the-job training and eight weeks of technical training in the first year and a minimum of 1,800 hours of on-the-job training in the second.
• Truck and Transport Mechanic is three years (three 12-month periods) that include a minimum of 1,500 hours of on-the-job training and eight weeks of technical training each year.
• Heavy Duty Equipment Mechanic (Off Road) is three years (three 12-month periods) that include a minimum of 1,500 hours of on-the-job training and eight weeks of technical training each year.
• Heavy Equipment Technician is four years (four 12-month periods) that include a minimum of 1,500 hours of on-the-job training and eight weeks of technical training each year.
Apprentices are required to provide their own tools. The cost of the tools can range from $10,000 to $25,000. Applicants who have related training or work experience may be eligible for credit or certification. Apprentices in the Off-Road and Truck and Transport branches may attempt the Interprovincial Exam in the final period of their apprenticeship training and, if successful, will be granted a Red Seal (which is recognized in most parts of Canada). Apprentices currently registered in the old Heavy Equipment Technician program must contact the nearest Alberta Apprenticeship and Industry Training office about the options available for completing their apprenticeship training program. Programs in Alberta Technical training is arranged by Alberta Apprenticeship and Industry Training and is currently offered at: Keyano College in Fort McMurray; Lakeland College in Vermilion; Lethbridge Community College; The Northern Alberta Institute of Technology (NAIT) in Edmonton and Fairview; Olds College; Red Deer College; and The Southern Alberta Institute of Technology (SAIT) in Calgary.

Research to Evaluate the Shortage of Skilled Workers in Northern Alberta Appendix 1 – Select Occupational Details
Prepared for The Northern Labour Market Information Clearinghouse Project By Steven K. Lakey, MBA, CMC Appendix 1 Page
3
Outside the apprenticeship program, the following post-secondary institutions offer related training: • Lethbridge Community College offers a one-year Agricultural and Heavy Equipment
Technician certificate program. The entrance requirement is Applied Math 10 or Pure Math 10 and English Language Arts 20-1, 20-2 or equivalent.
• The Northern Alberta Institute of Technology (NAIT) in Edmonton offers a two-year Industrial Heavy Equipment Technology diploma program. The entrance requirement is a high school diploma or equivalent with English 20 or 33, Pure Math 20 or Math 33 and Physics 30 or Science 30. NAIT also offers a 32-week General Mechanic certificate of achievement. Applicants require English 10 or Grade 11 English and Math 10 or a Grade 11 Math or equivalent.
• The Southern Alberta Institute of Technology (SAIT) in Calgary offers a one year Heavy Equipment Technician certificate program. The entrance requirement is at least 70 Alberta high school credits (Grade 11) with Pure Math 20, Applied Math 20 or Math 23, a Grade 11 English and Grade 11 science.
Pre-employment programs for prospective apprentices and continuing education programs for journeymen may be offered on an as needed basis by the institution(s) listed above or other schools. 2. Automotive Service Technicians: NOC Code - 7321 Overview and Duties Automotive service technicians adjust, test and repair engines, steering systems, braking systems, drive trains, vehicle suspensions, electrical systems and air-conditioning systems and do wheel alignments. In large shops, they sometimes specialize in repairing, rebuilding and servicing specific parts such as braking systems, suspension and steering systems. In smaller shops, they may work on a wider variety of repair jobs. Duties vary from one position to another but, in general, automotive service technicians: determine the problem by reading the work order, examining the vehicle, using testing equipment or taking the vehicle for a test drive; dismantle faulty assemblies and repair or replace worn or damaged parts; and/or reassemble, adjust and test the repaired mechanism. Automotive service technicians may also: perform scheduled maintenance services such as oil changes, lubrications and tune ups and advise customers on work performed, general vehicle conditions and future repair requirements. Education Requirements To work in Alberta, automotive service technicians must be registered apprentices or certified journeymen. To register with Alberta Apprenticeship and Industry Training, apprentices must: • Have at least English Language Arts 20-2, Applied Math 20 or Math 23 and Science 10 or
equivalent or pass an entrance exam; and • Find a suitable employer who is willing to hire and train an apprentice. Most employers prefer
to hire high school graduates and may select apprentices from among their current employees. A working knowledge of electricity, electronics and computers is an asset.
The term of apprenticeship is four years (four 12-month periods) that include a minimum of 1,500 hours of on-the-job training and eight weeks of technical training each year. High school students can become apprentices and gain credits toward apprenticeship training and a high school diploma at the same time through the Registered Apprenticeship Program (RAP).

Research to Evaluate the Shortage of Skilled Workers in Northern Alberta Appendix 1 – Select Occupational Details
Prepared for The Northern Labour Market Information Clearinghouse Project By Steven K. Lakey, MBA, CMC Appendix 1 Page
4
Apprentices are required to provide their own tools. Applicants who have related training or work experience may be eligible for credit or certification. Training Programs Technical training is arranged by Alberta Apprenticeship and Industry Training and is currently offered at: Lakeland College in Vermilion; Lethbridge Community College; Medicine Hat College; the Northern Alberta Institute of Technology (NAIT) in Edmonton and Fairview; Red Deer College; and the Southern Alberta Institute of Technology (SAIT) in Calgary. Outside the apprenticeship program, the following post-secondary institutions offer related training: • Lethbridge Community College offers a one-year Automotive Systems certificate program.
The entrance requirements are Applied Math 30, Pure Math 30 and English Language Arts 30-1, 30-2 or equivalent.
• Northern Alberta Institute of Technology (NAIT) in Edmonton offers a one-year Automotive Mechanic certificate program. The entrance requirement is Grade 10 with English, math and science. Preference may be given to those who also have automotive experience. NAIT also offers a 32-week General Mechanic certificate of achievement. Applicants require English 10 or Grade 11 English and Math 10 or a Grade 11 Math or equivalent.
• Red Deer College offers a one- year Automotive Service certificate. The entrance requirement is Pure Math 10, Applied Math 20 or Math 23 and English 10, 23 or equivalent.
• Southern Alberta Institute of Technology (SAIT) in Calgary offers a two-year Automotive Service Technology diploma program. The entrance requirement is a minimum of 70 Alberta high school credits (Grade 11) with Pure Math 20, Applied Math 20 or Math 23, Grade 11 English and a Grade 11 science. All applicants are required to write a mechanical reasoning test.
Pre-employment programs for prospective apprentices and continuing education programs for journeymen may be offered on an as needed basis by the institution(s) listed above or other schools. H6 – Heavy Equipment Operators 1. Heavy Equipment Operators: NOC Code – 7421 Overview and Duties Heavy equipment operators use a variety of mobile machines and attachments to excavate, grade and landscape earth or move workers, materials and equipment. They control equipment by moving levers or foot pedals, operating switches and/or turning dials. Their job titles generally reflect the types of machines they operate (e.g. bulldozer operator, grader operator). However, operators may operate several types of equipment. • Bulldozer operators, also called cat operators or cat skinners, operate crawler-tractors
equipped with: large blades across the front for moving obstacles; rippers for tearing up terrain; and work platforms for other workers to work from. They clear and level land on construction, mining and forestry sites, and push other equipment to provide traction and assistance when needed.

Research to Evaluate the Shortage of Skilled Workers in Northern Alberta Appendix 1 – Select Occupational Details
Prepared for The Northern Labour Market Information Clearinghouse Project By Steven K. Lakey, MBA, CMC Appendix 1 Page
5
• Back-hoe operators use a variety of attachments to dig trenches, load heavy materials, vibrate and break rock or concrete, back-fill excavations and scoop and dump materials. There are two types of back hoes: rubber-tired and track (often called excavators).
• Front-end loader operators operate mobile machines with buckets on the front for picking up heavy loads of earth, rock, sand, gravel or snow and dumping it into piles, excavations or trucks.
• Grader operators spread and level earth, sand, gravel and rock, and plow snow in the winter
by controlling the height and angle of grader blades. To level surfaces to a specified grade, they make successive passes over the working area, watching reference stakes, level gauges and/or the hand signals of other workers.
• Paver operators operate asphalt-paving machines that lay down asphalt for roads,
driveways and parking lots with the aid of stakes and level gauges. • Power shovel operators manipulate a boom or crane that supports a dipper handle with a
large dipper. The dipper is used to scoop up dirt, rock and coal, and drop it into trucks or piles.
• Scraper operators scrape, load and haul earth on mining or construction sites. They level
work sites, haul soil for roads and right-of-ways and haul coal and ore at mining sites. • Other heavy-duty equipment operators manipulate the controls of machines unique to
particular industries (e.g. tree harvesters and skidders in forestry and trench excavators in pipeline construction).
Education Requirements Heavy equipment operators are generally trained on the job or take related training programs. They need to know how to: operate heavy equipment safely; perform preventive maintenance tasks; diagnose mechanical problems; read grade plans and use grade stakes in measuring the amount of earth to be moved; and follow directions that are spoken or given by hand signals. Training Programs Some operators start as labourers or truck drivers and move to heavier equipment as they develop skills under the supervision of experienced operators. The length of the required on-the-job training varies with the type of machine and with the individual's ability. On-the-job training may be supplemented by a few weeks of training sponsored by industry-related organizations such as equipment manufacturers or unions. The following Alberta post-secondary institutions offer related programs: • Keyano College, in Fort McMurray, offers an eight-week Heavy Construction Equipment
Operator certificate program, which specializes in the operation of crawler tractors, motor scrapers, compactors and skid steers. Applicants for this program must be at least 18 years of age, have Grade 10, have a valid Class 5 driver's license, complete an employer survey questionnaire, submit a resume and references, and participate in a personal interview.
• Northern Lakes College, in Grouard, offers a 40-week Petroleum Employment Training Certificate of Completion program. Applicants must have high school credits in core courses or equivalent and a Class 5 driver's license.
Continuing education programs are often offered on an as needed basis.

Research to Evaluate the Shortage of Skilled Workers in Northern Alberta Appendix 1 – Select Occupational Details
Prepared for The Northern Labour Market Information Clearinghouse Project By Steven K. Lakey, MBA, CMC Appendix 1 Page
6
2. Truck Drivers: NOC Code - 7411 Overview and Description Truck drivers operate gasoline or diesel-powered trucks, tractor-trailers and similar vehicles to transport goods and materials over local routes or long distances. Duties and responsibilities vary from one position to another but, in general, truck drivers: operate trucks and sometimes maneuver them in tight spaces; routinely inspect brakes, tires, lights, horns, and cooling and refrigeration equipment before leaving the warehouse or terminal; load trucks to maximize the use of space and distribute weight accordingly, and to ensure safety on the road; secure cargo on the truck and place protective padding around articles to prevent damage during transit; conduct security checks and inspections en route; make emergency roadside adjustments and repairs; follow local and inter-provincial highway safety regulations; have the weight of the entire unit checked as directed by weighing officials at highway scales; keep records of loads delivered and picked up, arrival and departure times, and maintain vehicle log books (fuel consumption, mileage). Some truck drivers specialize in operating special types of vehicles such as: heavy trucks for overweight loads; tank trucks which transport bulk liquids; gravel trucks; tractor-trailers (two or more vehicles hooked together); industrial trucks (involving special equipment); garbage trucks (for more information, see the Refuse Truck Driver occupational profile); log and muskeg trucks; extended length vehicles. Many truck drivers are owner-operators who own their own vehicles and lease their trucks and services to other companies. Education Requirements Truck drivers must have air brakes certification and should have at least Grade 10 English reading and writing skills. Employers may require drivers to have first aid and CPR certification, WHMIS (Workplace Hazardous Materials Information System) training, TDG (Transportation of Dangerous Goods) training or H2S Alive training. Training Programs Many people get started in the trucking industry by taking training courses offered by public colleges or private truck driving schools. Program length, content, costs and admission requirements vary. 3. Crane Operators: NOC Code – 7371 Overview and Description Crane and hoisting equipment operators service and operate the hoist and swing equipment used to move machinery, materials and other large objects. They manipulate a number of pedals and levers to rotate the crane and raise and lower loads. Some or all of these operations may be performed simultaneously. There are several different branches of the Crane and Hoisting Equipment Operator trade: • Wellhead boom truck operators set up and operate hydraulic booms used for wellhead
pumping, wire line, perforating, coil tubing, snubbing, and the rig-up and rig-out of slant service rig operations.

Research to Evaluate the Shortage of Skilled Workers in Northern Alberta Appendix 1 – Select Occupational Details
Prepared for The Northern Labour Market Information Clearinghouse Project By Steven K. Lakey, MBA, CMC Appendix 1 Page
7
• Boom truck operators (formerly medium and heavy boom truck operators) set up, service and
operate hydraulic booms mounted on turrets affixed to trucks that are capable of moving heavy loads. Certification is required when operating:
• Booms (including telescoping booms and articulating booms possessing live lines) capable of
swinging, hoisting and booming up and down with a lifting capacity of greater than 4.5 tonnes and less than 40.8 tonnes.
• Articulating booms without live lines with a lifting capacity of greater than 7.3 tonnes and less
than 40.8 tonnes. • Tower crane operators service and operate travelling, fixed or climbing type hoisting
equipment with a vertical mast or tower and a jib. Tower crane operators are often involved in assembling the crane on-site.
• Mobile crane operators (includes hydraulic and conventional crane mobile operators) service
and operate booms which are mounted on crawlers or wheeled frames as well as travelling, fixed or climbing type hoisting equipment with a vertical mast or tower and a jib. They may also:
Drive the crane to the job site Rig the machine up by pinning the boom and pendant cables and pull the hoist cable
in preparation for operation Set up the machine for the lift by making it level and stable using blocking and
leveling materials. Certification is required when operating mobile cranes 13.6 tonnes or more. Education Requirements To work in Alberta, crane and hoisting equipment operators must be registered apprentices or certified journeymen. To register with Alberta Apprenticeship and Industry Training, apprentices must: • Have at least an Alberta Grade 10 education or equivalent or pass an entrance exam; and • Find a suitable employer who is willing to hire and train an apprentice. Most employers prefer
to hire high school graduates and may select apprentices from among their current employees.
The terms of apprenticeship for the Crane and Hoisting Equipment Operator are as follows: • Boom Truck Operators is one year (one 12-month period) that includes a minimum of 1,200
hours of on-the-job training and five weeks of technical training. • Wellhead Boom Truck Operators is one year (one 12-month period) that includes
a minimum of 100 hours of on-the-job training and three days of technical training. • Mobile Crane Operators is three years (three 12-month periods) that include a minimum of
1,500 hours of on-the-job training and four weeks of technical training in the first year, a minimum of 1,500 hours of on-the-job training in the second and a minimum of 1,500 hours of on-the-job training and five weeks of technical training in the third.

Research to Evaluate the Shortage of Skilled Workers in Northern Alberta Appendix 1 – Select Occupational Details
Prepared for The Northern Labour Market Information Clearinghouse Project By Steven K. Lakey, MBA, CMC Appendix 1 Page
8
• Tower Crane Operators is two years (two 12-month periods) that include a minimum of 1,000 hours of on-the-job training and three weeks of technical training in the first year and a minimum of 1,000 hours of on-the-job training in the second year.
High school students can become apprentices and gain credits toward apprenticeship training and a high school diploma at the same time through the Registered Apprenticeship Program (RAP). There are no apprenticeship programs for the Conventional Mobile Crane Operator and the Hydraulic Mobile Crane Operator trades at this time. Applicants who have related training or work experience may be eligible for credit or certification. Training Programs Alberta Apprenticeship and Industry Branch arranges technical training for the Crane and Hoisting Equipment Operator trade. The location of the training varies depending on the branch. For: • Boom truck and mobile crane operators, technical training is currently being offered at the
Northern Alberta Institute of Technology (NAIT) in Edmonton. • Wellhead boom truck operators, technical training is currently being offered at Enform
(formerly Petroleum Industry Training Service and Canadian Petroleum Safety Council) in Nisku.
B-5 Clerical Positions 1. Shippers and Receivers: NOC Code – 1471 Overview and Duties Shippers and receivers wrap, pack and unpack, store, ship, receive and record the movement of parts, supplies, materials, equipment and stock to and from retailers, wholesalers, manufacturing companies, and other commercial and industrial organizations. Shippers and receivers' duties vary depending on the size and nature of the organization. In small companies, one shipper and receiver may be responsible for all shipping and receiving. In larger organizations, responsibilities may be divided among several shippers and several receivers. In general, shippers and receivers perform the following tasks or supervise others who perform these tasks: • Determine the least expensive and quickest method of shipment, arrange delivery, and
prepare bills of lading, invoices and other shipping documents • Assemble containers and crates, pack goods to be shipped and attach packing slips
(identifying information and shipping instructions) • Direct delivery trucks to shipping doors or designated marshalling areas, and help load and
unload goods safely • Inspect and count items received, check them against invoices or other documents, record
shortages and reject damaged goods • Unpack and store goods in the appropriate storage areas • Comply with transportation of dangerous goods legislation • Keep accurate records of items received and where they are stored • Retrieve stored items and trace lost shipments as needed
Research to Evaluate the Shortage of Skilled Workers in Northern Alberta Appendix 1 – Select Occupational Details
Prepared for The Northern Labour Market Information Clearinghouse Project By Steven K. Lakey, MBA, CMC Appendix 1 Page
9
• Conduct regular safety inspections, maintain safe working conditions, report safety hazards and ensure safety equipment is in good working order.
Depending on the employer, shippers and receivers also may: • Operate forklifts, hand trucks or other materials-handling equipment • Type address labels or use computers to create shipping labels and perform record-keeping
functions • Use special bar-coding devices to put number codes on items and retrieve information from
codes • Prepare customs declarations and export documents • Call customers or carriers to co-ordinate pick-up and delivery, or have inventory items
inspected • Inspect received goods, fill out forms for damaged and returned items, and route them
correctly • Contact vendors to resolve problems or contact service depots to arrange for repairs • order replacement items. Education Requirements Shippers and receivers are trained on the job and must continue acquiring new skills to keep up with technological advances. Although there is no standard minimum education requirement, most employers prefer to hire high school graduates or graduates of related training programs. Computer and warehouse experience, or knowledge of Workplace Hazardous Materials Information System (WHMIS) and Transportation of Dangerous Goods (TDG) regulations are definite assets. Training in rigging procedures is important for shippers and receivers who are required to hook up lifting devices. Training Programs In Alberta, the following sources offer warehousing programs: • Alberta Apprenticeship and Industry Training offers a program leading to an Alberta
Occupational Certificate. For more information, see the Warehousing Professionals occupational profile.
• Calgary Board of Education Chinook Learning Services in Calgary offers an eight -course Warehousing certificate program. Applicants must be at least 17 years of age and Canadian citizens or landed immigrants. Basic math and reading skills are required.
• Northern Alberta Institute of Technology in Fairview offers a Warehouse Training Certificate of Proficiency program by non-distance and distance education. The entrance requirement for Level 1 of the program is English 10 or 13 and Grade 10 math, or equivalent.
Continuing education programs are often offered on an as needed basis. G4 – Chefs and Cooks 1. Cooks: NOC Code - 6242 Overview and Duties Cooks prepare food in public and private eating establishments including hotels, restaurants, institutions, trains and ships. Depending on the establishment, cooks can be employed at various tasks. However, their major responsibilities fall under three categories: nutrition, food costs and sanitation. In general, cooks: study menus to estimate food requirements and obtain the necessary food from storage or from suppliers; wash, peel and cut vegetables; clean and cut

Research to Evaluate the Shortage of Skilled Workers in Northern Alberta Appendix 1 – Select Occupational Details
Prepared for The Northern Labour Market Information Clearinghouse Project By Steven K. Lakey, MBA, CMC Appendix 1 Page
10
meats, fish and poultry; clean kitchen equipment and cooking utensils; prepare, season and cook foods such as soups, salads, meat, fish, gravies, vegetables, desserts, sauces and casseroles; carve meats, prepare portions on a plate and add gravies, sauces and garnish to servings; bake pastries; prepare buffets (e.g. platters, showpieces); prepare special diets; and/or oversee menu planning, regulate stock control and supervise kitchen staff. Education Requirements To work in Alberta, cooks must be ONE of the following: • Registered apprentices • Certified journeymen • Working for an employer who is satisfied that they have the skills and knowledge expected of
certified journeymen • Self-employed. To register with Alberta Apprenticeship and Industry Training, apprentices must: • Have at least an Alberta Grade 9 education or equivalent or pass an entrance exam • Find a suitable employer who is willing to hire and train an apprentice. Most employers prefer
to hire high school graduates and may select apprentices from among their current employees.
The term of apprenticeship is three years (three 12-month periods) that include a minimum of 1,560 hours of on-the-job training and eight weeks of technical training each year. High school students can become apprentices and gain credits toward apprenticeship training and a high school diploma at the same time through the Registered Apprenticeship Program (RAP). Applicants who have related training or work experience may be eligible for credit or certification. Cook apprentices may attempt the Interprovincial Exam in the final period of their apprenticeship training and, if successful, will be granted a Red Seal (which is recognized in most parts of Canada). Training Programs Technical training is arranged by Alberta Apprenticeship and Industry Training and is currently offered at: • Lethbridge Community College; • The Northern Alberta Institute of Technology (NAIT) in Edmonton; • Red Deer College; and • The Southern Alberta Institute of Technology (SAIT) in Calgary. In addition, Weekly apprenticeship training (WATS) is also offered at Lethbridge Community College and Red Deer College. Outside the apprenticeship program, the following post-secondary institutions offer related training: • Lethbridge Community College offers a Culinary Careers diploma program. The entrance
requirement is a minimum of 60 high school credits with at least 60 per cent in Applied Math 20 and Language Arts 20B or equivalent.
• The Northern Alberta Institute of Technology (NAIT) in Edmonton offers a one-year certificate and a two-year Culinary Arts diploma program. The entrance requirement is Grade 10 or equivalent with English and math. NAIT also offers a 60-hour Culinary Kitchen Skills Series program.

Research to Evaluate the Shortage of Skilled Workers in Northern Alberta Appendix 1 – Select Occupational Details
Prepared for The Northern Labour Market Information Clearinghouse Project By Steven K. Lakey, MBA, CMC Appendix 1 Page
11
• Portage College in Lac La Biche offers a 32-week Culinary Arts certificate program. The entrance requirement is Grade 9 or equivalent.
• The Southern Alberta Institute of Technology (SAIT) in Calgary offers a 56-week Professional Cooking diploma program. The entrance requirement is at least 35 high school credits with Pure Math 10 or Applied Math 10 or Math 13 and English Language Arts 10-1 or 10-2, English 10 or 13, or Humanities 10 or equivalent. A resume is required.
Pre-employment programs for prospective apprentices and continuing education programs for journeymen may be offered on an as needed basis by the institution(s) listed above or other schools. 2. Purchasing Agents: NOC Code - 1225 Overview and Duties Purchasing agents buy goods, materials, supplies and services and ensure that they are of the quantity, quality, price and availability required by their organization. Duties and responsibilities vary from one position to another but, in general, purchasing agents: consult with other departments in the organization to determine what goods (e.g. equipment, office supplies) and services are needed; develop strategic purchasing programs that consolidate company spending for specific commodities; oversee the process of issuing requests for information and proposals, and tendering contracts to ensure that the process is fair, competitive, legal and provides best value for the organization; analyze proposals or tenders; purchase the right quality and quantity, at the right time and price, from the best possible source; administer contracts for the supply of goods, services and space; trace shipments, follow up undelivered goods, and resolve problems and disputes; arrange the payment of duty and freight charges; prepare and administer budgets and contracts. In smaller organizations, purchasing agents may be directly involved in purchasing and expediting the delivery of goods. Depending on the urgency and value of the required products, orders may be submitted electronically or by telephone or facsimile. Purchasing agents usually ask suppliers for quotations in writing or call for public tenders, sometimes using local newspapers or the Internet to advertise them. The basic criterion in awarding a tender is to obtain the maximum value for the money spent as well as satisfy all specifications and requests. Errors can be very costly to the organization. In larger organizations, experienced purchasing agents may: supervise buyers, purchasing clerks or expediters who review schedule shipments from suppliers and ensure deliveries are made on time and according to contracts; develop negotiation strategies and lead teams in supplier negotiations for goods or services; implement processes that facilitate employee access to goods and services and reduce administrative costs; analyze commodity vendor data and forecast trends; recommend and implement approved purchasing policies and procedures; develop and implement supplier performance management strategies; administer purchasing card programs. To keep up to date so they can make informed decisions, purchasing agents: use the Internet and read promotional literature including catalogues and trade journals; consult legal and risk management personnel; network with people in other purchasing departments; inspect samples submitted by suppliers attend trade shows, conventions and seminars; write and review product specifications; negotiate with suppliers' representatives and end users.
Research to Evaluate the Shortage of Skilled Workers in Northern Alberta Appendix 1 – Select Occupational Details
Prepared for The Northern Labour Market Information Clearinghouse Project By Steven K. Lakey, MBA, CMC Appendix 1 Page
12
Education Requirements There are a variety of ways to become a purchasing agent. In the past, high school graduates have started in entry level positions such as purchasing clerk, expediter or junior buyer, or working in departments where stock is processed (e.g. stores or shipping/receiving). However, most employers prefer to hire applicants who have post-secondary education in business administration/commerce, supply chain management or economics, particularly for positions that involve cost analysis, legal issues and contract administration. Certified Professional Purchaser is a protected title under Alberta's Professional and Occupational Associations Registration Act. This means that to call yourself a Certified Professional Purchaser, you must be a registered member of the Alberta Institute of the Purchasing Management Association of Canada (AIPMAC). You can be a member of the AIPMAC but do not have to be registered if you do not call yourself a Certified Professional Purchaser. Training Programs A number of employers provide training on the job for newly hired purchasing agents. Computer skills and familiarity with commonly used word processing, spreadsheet and database programs, and other technology used in e-commerce and for ordering is a definite asset. Courses in purchasing, buying and finance are offered by the Extension or Continuing Education Divisions of universities, colleges and technical institutes and are definite assets for advancement. Individuals who have a university degree or college or technical institute diploma with courses in business administration or commerce may be able to start at a higher level and advance more quickly. Some industries prefer to hire purchasing agents who have related background knowledge. For example, a chemical company might require purchasing agents in the company to have a diploma or degree in chemistry. Service Sector A2 – Retail Trade Managers and Supervisors 1. Retail Trade Managers: NOC Code - 0621 Overview and Duties Retail store managers plan, organize, direct and control the operations of stores that sell merchandise and services to the public. They may be employees or self-employed. Retail store managers manage retail outlets such as department stores, supermarkets, car dealerships and specialty boutiques. Their primary responsibility is to ensure that their businesses make a profit. Specific duties vary depending on the size and nature of the business but, in general, store managers: supervise the day-to-day operations of the store; supervise department managers or directly supervise staff, set up work schedules and assign duties; determine staffing requirements, hire or oversee the hiring of staff and, when necessary, dismiss employees; train new employees or arrange for training; administer budgets and authorize financial transactions; monitor product inventories and trends in consumer buying to anticipate which products will be in demand; implement or administer price and credit policies; monitor anti-theft procedures and policies, and take appropriate action when thefts occur; oversee security measures, including ensuring that doors and safes are locked and alarms are set, and answering calls from security

Research to Evaluate the Shortage of Skilled Workers in Northern Alberta Appendix 1 – Select Occupational Details
Prepared for The Northern Labour Market Information Clearinghouse Project By Steven K. Lakey, MBA, CMC Appendix 1 Page
13
companies and the police in case of break-ins; monitor the outside of the building and make sure safety hazards such as hanging ice are removed; provide assistance when employees are unusually busy; and deal with customer complaints and recommendations. Store managers may also: organize staff safety programs; locate and select merchandise for resale; meet with manufacturers' sales representatives to discuss product lines; co-ordinate activities in various store departments; develop and implement marketing strategies and decide how merchandise should be displayed; meet other store managers or shopping mall managers to discuss issues of common concern (e.g. mall policies); write and authorize reports to head office. Education Requirements Employers generally require managers to have several years of previous experience in the retail industry. Many employers also require applicants to have related post-secondary education. Some large retail chains have in-house management trainee programs and only promote managers from within the company. Training Programs Part-time and full-time post-secondary programs related to business administration, colleges, technical institutes and universities throughout the province offer management and entrepreneurship. Admission requirements vary from one program to another but generally include a high school diploma with Grade 12 English and math courses. For information about marketing programs in particular, see the Marketing Manager occupational profile. 2. Restaurant and Food Service Managers: NOC Code - 0631 Overview and Duties Restaurant managers plan, organize, direct and control the operation of establishments in which food and beverages are served. The specific duties performed by restaurant managers depend on the nature of the establishments they manage. In general, however, restaurant managers: consult with chefs to select menu items that will appeal to customers and make efficient use of food supplies, and assign prices to menu items; design wine and liquor lists appropriate to menus; estimate supplies needed, order supplies and deal with food, beverage and equipment suppliers and their representatives; recruit and train new employees, schedule work hours and keep employment records; oversee the daily operations of the restaurant to ensure health and safety regulations and policies are met; ensure that maintenance and decor standards are maintained; supervise restaurant staff; maintain friendly contact with customers and resolve customer complaints; develop marketing strategies and supervise advertising campaigns; track the overall profitability of the restaurant and forecast revenues; prepare budgets and manage finances, including maintaining records of costs and payments made to suppliers, balancing daily cash received with records of sales, and depositing daily income for safekeeping. In large restaurants or hotel chains, restaurant managers may delegate many tasks to other employees such as assistant managers or executive chefs. In smaller restaurants, executive chef and restaurant manager positions may be combined. In fast food restaurants and other food service facilities, restaurant managers may have several assistant managers, each of whom supervises a different shift. Education Requirements

Research to Evaluate the Shortage of Skilled Workers in Northern Alberta Appendix 1 – Select Occupational Details
Prepared for The Northern Labour Market Information Clearinghouse Project By Steven K. Lakey, MBA, CMC Appendix 1 Page
14
The best background for restaurant managers is a combination of experience and education in the field. Computer skills (for working with point of sale systems) and the ability to speak a second language are definite assets. It is still possible to work from the bottom up in restaurant management if on the job training is supplemented with further education. Some large restaurant chains sponsor their own management training programs. However, employers may prefer to hire applicants who already have related post-secondary education. Training Programs The following institutions offer post-secondary programs related to the supervision and management of hospitality services: • Lethbridge Community College offers a two-year diploma program in Hotel and Restaurant
Management. The entrance requirement is a high school diploma or equivalent with credit in English 30 or 33, Math 30 or 33 or Applied Math 30 or Pure Math 30.
• The Northern Alberta Institute of Technology in Edmonton offers a: One-year certificate and a two-year Hospitality Management diploma program. The
minimum education requirement for both programs is Grade 11 including English and Math.
Two year Food and Nutrition Management diploma. The entrance requirement for this program is a high school diploma with English 30 or 33, Math 20 or 23, Biology 20 or 30, and any 30 level science.
• Red Deer College offers one-year certificate and two year diploma programs in Hospitality and Tourism with a specialization in food and beverage management. The entrance requirement is a high school diploma or equivalent.
• Robertson College offers a 40-week International Hospitality and Hotel Management program. The entrance requirement is a high school diploma with Grade 12 English.
• The Southern Alberta Institute of Technology in Calgary offers a two-year plus three-month internship diploma program in Hotel and Restaurant Management. The entrance requirement is a high school diploma or equivalent with English 30 or 33 and Pure or Applied Math 30.
• Training Inc., a private vocational school in Lethbridge, offers a 12-week Hotel and Restaurant Operations program. Applicants must be contact the school for entrance requirements.
• Trend College, a private vocational school in Edmonton, offers a 34-week Hotel and Tourism Management Studies program and a 50-week International Hotel and Tourism Management Studies program. Applicants must be at least 19 years of age, undergo a personal interview and have a high school diploma or equivalent qualifications.
• The University of Calgary Haskayne School of Business offers a four-year Bachelor of Hotel and Resort Management (BHRM) program that may also be taken as a five-year co-op program. The entrance requirement is a high school diploma with an average of at least 70 per cent in English 30, Math 30, and three other appropriate Grade 12 subjects, and/or a SAIT diploma in Hotel and Restaurant Management (or equivalent) with a grade point average of 3.0/4 or above. The University also offers four year and five year co-op Bachelor of Commerce programs in Tourism and Hospitality Management.

Research to Evaluate the Shortage of Skilled Workers in Northern Alberta Appendix 1 – Select Occupational Details
Prepared for The Northern Labour Market Information Clearinghouse Project By Steven K. Lakey, MBA, CMC Appendix 1 Page
15
G2 – Retail Salespersons and Sales Clerks 1. Retail Salespersons and Sales Clerks: NOC Code - 6421 Overview and Duties Retail salespersons sell or rent goods and services to customers in stores and other retail businesses. They work in many different types of establishments, assisting customers with the selection and purchase of merchandise. In specialty stores, they sell or rent merchandise ranging from books, food and clothing to major appliances, and automobiles. In department stores, they usually work in specific departments. In smaller owner-managed stores, they are responsible for serving customers in all areas of the store. First and foremost, the responsibility is to sell merchandise and ensure customer satisfaction. To accomplish this objective, salespersons may: greet customers and assist them in identifying their needs (e.g. the size of shoe or refrigerator they need); demonstrate, fit or measure merchandise for customers and promote products such as credit card services; advise customers on the use and care of merchandise; answer questions regarding the store and its merchandise; process payments (cash, cheques, direct debit and charge cards) and provide sales receipts; assist customers with returns and exchanges of merchandise; wrap customer purchases or arrange for delivery; estimate or quote prices, credit terms, trade-in allowances and warranties; check and order stock; and/or stock shelves and maintain display areas. Salespersons must be aware of current store sales promotions, policies regarding payment and exchanges, and store security practices. They may be required to develop new markets by soliciting new business when they are not busy serving customers. Education Requirements There are no standard education requirements for retail salespersons; however, most employers prefer to hire high school graduates. Those who have post-secondary education have a greater opportunity for advancement to supervisory and management positions, particularly if they are located near the head offices of larger firms. Salespersons who sell expensive or complex merchandise may require special knowledge or skills. For example, those who sell computer systems must have at least a basic knowledge of electronics and computer software or hardware to be able to answer customer questions. Training Programs Small shops train staff on the job; larger stores may have their own in-house training programs. G3 – Cashiers 1. Cashiers: NOC Code - 6611 Overview and Duties: Cashiers total bills, accept payments, make change, provide information, fill out forms and provide receipts for goods and services in supermarkets, department stores, theatres, restaurants and other establishments. Most cashiers operate electronic cash registers and optical price scanners. At the beginning of each shift, they are given a specified amount of money in a drawer and, at the end of the shift, may be required to balance their cash against total cash receipts. Cashiers must be familiar with the store's prices, policies and procedures to: accept payments in cash or by cheque, credit/debit card, traveller's cheque, or point of sale; process coupons, discounts and gift certificates; provide refunds.

Research to Evaluate the Shortage of Skilled Workers in Northern Alberta Appendix 1 – Select Occupational Details
Prepared for The Northern Labour Market Information Clearinghouse Project By Steven K. Lakey, MBA, CMC Appendix 1 Page
16
Cashiers or checkout clerks in supermarkets and cafeterias: greet customers; enter the prices of all items or scan the products, and subtract the value of any coupons or special discounts; provide information such as where to find products; total bills and accept payment; thank customers and offer carry-out service; keep the checkout area clean and orderly; ensure that they have adequate change and appropriate cash levels at all times; use the paging system to request information or assistance as needed. They may also: weigh produce and bulk food; package or bag purchased merchandise; return unwanted items to the shelves and stock shelves during slack periods, or stand on the line ready to serve the first available customer. Cashiers in retail stores tabulate bills, accept payment and pack purchased goods in bags or boxes. Most employers in the retail industry prefer to hire people who also act as salespersons (for more information, see the Retail Salesperson occupational profile). Cashiers in restaurants may also: accept reservations or take-out orders; type menus; sell candy and cigarettes; and seat guests. Box office cashiers sell tickets for admission to places of entertainment such as theatres, stadiums and skating rinks. In general, they: provide information about events in person or via telephone, Internet or mail; describe venue layouts and seating locations to help customers choose the best possible seats; fill reservations for seats; and often do public relations work as well. Cashiers who work in government departments and other large organizations such as utility companies receive payment for things such as utility bills, taxes and parking fines. Education Requirements The primary requirement for cashiers is the ability to provide good customer service and work with numbers accurately and quickly. Computer experience is an asset. Cashiers who work for businesses where currency is exchanged must know how to process foreign exchanges. Cashiers may work with large sums of money and therefore must be bondable (acceptable to a bonding company as a responsible person). Training Programs Cashiers are usually trained on the job. Some employers provide short training sessions before putting inexperienced cashiers on the selling floor. G-9 – Sales and Service nec 1. Hairstylists and Barbers: NOC Code - 6271 Overview and Duties Hairstylists cut and style hair to suit the client's face and lifestyle. Duties vary from one position to another but, in general, hairstylists: shampoo, cut, trim, colour, wave and style hair, wigs and hairpieces; shave, trim and shape beards and moustaches; suggest appropriate styling aids or hairstyles; analyze hair and scalp and suggest treatment. Hairstylists must keep their station clean and organized. Scissors, combs and brushes and clippers must be sterilized and kept in good working condition. Those who own or manage a salon: order supplies, pay bills and keep records; hire and supervise employees; encourage staff to learn new skills.

Research to Evaluate the Shortage of Skilled Workers in Northern Alberta Appendix 1 – Select Occupational Details
Prepared for The Northern Labour Market Information Clearinghouse Project By Steven K. Lakey, MBA, CMC Appendix 1 Page
17
Education Requirements To work in Alberta, hairstylists must be registered apprentices or certified journeymen. To register with Alberta Apprenticeship and Industry Training, apprentices must: have at least an Alberta Grade 10 education or equivalent or pass an entrance exam; and find a suitable employer who is willing to hire and train an apprentice. The term of apprenticeship is two years (two 12-month periods) that include a minimum of 1,400 hours of on-the-job training and ten weeks of technical training each year. High school students can become apprentices and gain credits toward apprenticeship training and a high school diploma at the same time through the Registered Apprenticeship Program (RAP). Applicants who have related training or work experience may be eligible for credit or certification. Hairstylist apprentices may attempt the Interprovincial Exam in the final period of their apprenticeship training and, if successful, will be granted a Red Seal (which is recognized in most parts of Canada). Training Programs Technical training is arranged by Alberta Apprenticeship and Industry Training and is currently offered at: Marvel College in Edmonton; and Delmar College of Hair Design Ltd. in Calgary. Outside the apprenticeship program, the following post-secondary institutions offer related training: • Academy of Professional Hair Design, a private vocational school in Red Deer, offers a 40-
week Beauty Culture program. The entrance requirement is a high school diploma or equivalent.
• Artists Within, a private vocational school in Calgary, offers a full-time (eight weeks) and a part-time (16 weeks) Hair Design program. Applicants must be 19 years of age or have a high school diploma or equivalent.
• Delmar College of Hair Design, a private vocational school in Calgary, offers a 36-week Hairstylist program. The entrance requirement is a high school diploma or equivalent.
• Est-Elle Academy of Hair Design, a private vocational school in Edmonton, offers a 39-week Beauty Culture program.
• G.P. Hair Academy, a private vocational school in Grande Prairie, offers a 40-week Hairstyling program. The entrance requirement is at least 33 credits with Grade 10 English, Math and Science or equivalent.
• HCC Choice College, a private vocational school in Spruce Grove, offers a 48-week Hair Design and Cosmetology program.
• L.A. School of Hair Design, a private vocational school in Lethbridge, offers a 37-week Beauty Culture program. The entrance requirement is at least 33 credits with Grade 10 English and Math or equivalent.
• Marvel College, a private vocational school in Calgary, Edmonton and Red Deer offers a 37-week Hairstyling program. The entrance requirement is a high school diploma or equivalent.
• Master's School of Hair Design, a private vocational school in Medicine Hat, offers a 39-week Beauty Culture program. The entrance requirement is Grade 10 or equivalent. Applicants must also be at least 16 years of age.
• Northern Lights Academy of Cosmetology, a private vocational school in Grande Prairie, offers a 40-week Hairstylist program. The entrance requirement is Grade 10 or equivalent, a résumé, two letters of reference and a personal letter. Applicants must also be at least 17 years of age.

Research to Evaluate the Shortage of Skilled Workers in Northern Alberta Appendix 1 – Select Occupational Details
Prepared for The Northern Labour Market Information Clearinghouse Project By Steven K. Lakey, MBA, CMC Appendix 1 Page
18
Pre-employment programs for prospective apprentices and continuing education programs for journeymen may be offered on an as needed basis by the institution(s) listed above or other schools. 2. Security Guards: NOC Code - 6651 Overview and Duties Security guards protect an organization's property, personnel and information against fire, theft, vandalism and illegal entry. Specific duties vary depending on the area of employment. For example, security guards may work at shopping centres, banks, sports facilities, airports, conventions, parking lots, construction sites or in public buildings such as hospitals, museums and art galleries. In general, security guards: patrol an assigned area; check doors, windows, locks and building interiors for signs of damage or theft; provide information, guide traffic or respond to complaints and maintain order; watch for intruders, sometimes through the use of electronic surveillance systems; observe and keep records of security-related activities. In case of fire or the presence of unauthorized persons, the security guard sounds an alarm or telephones the supervisor, fire department or police. In some situations, security guards may make arrests. The following types of security work involve being outside and driving. In patrol car service, a security guard, alone or accompanied by a dog or another guard, patrols construction sites, buildings, property, etc. as a daily or nightly routine. In mobile patrol, security guards respond to alarms from businesses, residences and schools. If an actual break and enter is detected, they contact police. In camp or construction site guard service, security guards patrol and do gate clearance work at large construction sites or plants. This work may be seasonal, with more opportunities for employment during the summer months. Inspectors visit work sites to ensure that security employees are performing their duties. Education Requirements Most employers prefer to hire people who have at least high school education. Some security agencies have no minimum education requirements; however, they do require applicants to: speak and write English; be 18 years of age or older; have good character references and no police record; and be in good health. Some companies require that guards have valid first aid and CPR certificates, a valid driver's license and their own mode of transportation. Training Programs Most security guards are trained on the job. However, having some related training prior to employment is a definite asset, particularly for later advancement. Being able to communicate in a second language is also an asset. The Canadian Society for Industrial Security offers three non-progressive levels of certification for security guards: Certified Security Officer; Certified Security Supervisor; and Certified Security Professional In Alberta, the following post-secondary institutions offer security-related programs.

Research to Evaluate the Shortage of Skilled Workers in Northern Alberta Appendix 1 – Select Occupational Details
Prepared for The Northern Labour Market Information Clearinghouse Project By Steven K. Lakey, MBA, CMC Appendix 1 Page
19
• Columbia College, a private vocational school in Calgary, offers Criminal Justice Certificate and Diploma programs. These programs may be taken as 25-week full-time programs or 50-week part-time programs. The entrance requirements for the Certificate program include a high school diploma with at least 60 per cent in English 30 and Math 30 or equivalent, a successful interview and a criminal record check.
• Grant MacEwan College in Edmonton offers a two-year Police and Security diploma program with a specialization in Investigations and Security Management. The entrance requirement is a high school diploma or equivalent with at least 65 per cent in English 30 (or at least 75 per cent in English 33 or a skills assessment). A criminal record check and fitness test are required.
• Hilltop Security Academy, a private vocational school in Calgary and Edmonton, offers a 12-week Private Security Professional program. Applicants must have adequate oral and written communication skills, a clear criminal records check and 33 credits toward an high school diploma (Grade 10) with English 10 or Math 10 or equivalent.
• Lethbridge Community College offers a one-year Risk Management Certificate program. The entrance requirement is a high school diploma or equivalent. Applicants are required to take a computerized placement test, complete a questionnaire and attend an interview with a faculty member. A medical examination and eyesight/colour vision testing are recommended.
• Medicine Hat College offers a two-year Police and Security diploma program. The entrance requirements include a high school diploma with at least 60 per cent in English 30 or equivalent, and completion of a Standard First Aid and CPR certificate. An interview and program orientation are required and a physical fitness test may be required. This program is offered in partnership with Grant MacEwan College.
• NorQuest College in Edmonton offers a 40-week Aboriginal Policing and Security certificate program. Applicants must be at least 19 years old and have successfully completed a Grade 10 English and Math or equivalent. A valid driver's license, fitness assessment and medical exam are also required.
• Northern Lakes College in Grouard offers a 10-month Aboriginal and Community Policing certificate program. Applicants must be at least 19 years old and have successfully completed English 23 and Math 13 or Applied Math 10 or equivalent. A valid driver's license, criminal record check, fitness assessment, medical exam and personal interview are also required. Graduates of this program may apply for credit toward police and security programs at Lethbridge Community College, Grant MacEwan College or Athabasca University.
• The University of Alberta Faculty of Extension offers an eight course Security Management program. The entrance requirement is a high school diploma or equivalent.
• The University of Calgary Faculty of Continuing Education offers a 300-hour Security Management program. Applicants must have a high school diploma, be over 23 years of age and have suitable business experience.
Continuing education programs are often offered on an as needed basis.

Research to Evaluate the Shortage of Skilled Workers in Northern Alberta Appendix 1 – Select Occupational Details
Prepared for The Northern Labour Market Information Clearinghouse Project By Steven K. Lakey, MBA, CMC Appendix 1 Page
20
Oil and Gas Exploration A. I1 Forestry, mining, oil and gas (excluding labourers) 1. Rig Technicians: NOC 2001 Code(s) - 8232.1 Overview and Duties Drilling rigs drill the initial holes for oil and gas wells. Each rig consists of a derrick, draw-works and other surface equipment that provide the force required for drill pipe to bore a hole into the earth. After a drilling rig reaches the layer of earth that contains oil or gas, well casing is installed and the rig is dismantled and moved to another site. Rig technicians operate oil and gas drilling rigs. This newly defined trade has three journeyman certification levels commonly known as motorhand (level 1), derrickhand (level 2) and driller (level 3). Motorhands (Rig Technician Level 1): regularly maintain drilling rig engines, transmissions, heating systems, diesel electric generators and motors, hydraulic systems and other mechanical equipment; maintain equipment logs and preventative maintenance records; monitor inventories of fuels, oil filters, lube oils, greases and other service items; work under the direction of the derrickhand and driller; supervise, train and work with floorhands and laborers, ensuring they work safely and efficiently; participate in rig mobilization and de-mobilization (rig-up and tear-out). Derrickhands (Rig Technician Level 2): operate and maintain drilling fluid systems and pumps during drilling; mix fluid chemicals and additives as required by the program; handle sections of drill string assembly from a platform on the rig derrick during tripping operations; monitor and record mud flows and volumes and fluid properties (mud weight); work under the direction of the driller and assist the driller with crew supervision, ensuring the crew works safely and efficiently; participate in rig mobilization and de-mobilization. Drillers (Rig Technician Level 3): supervise rig crews and the operation of drilling equipment; ensure crews work safely and efficiently; report directly to drilling rig managers; operate the draw-works, rotary equipment and pumps, and supervise the assembly of drill string; ensure that safety and support equipment is functioning properly; monitor the progress of drilling operations and communicate with well-site supervisors; keep a current record of drilling progress; train crew members; introduce procedures which may help the crew to work more safely or effectively; participate in the supervision of rig mobilization and de-mobilization. Related High School Subjects: Community Health; Energy and Mines; Mathematics; Mechanics; and Physical Education To work in Alberta, level 1 and 2 rig technicians must be ONE of the following: registered apprentices; certified journeymen; have a Qualification or Equivalency credential. Level 3 rig technicians must be registered apprentices or certified journeymen. To register with Alberta Apprenticeship and Industry Training, apprentices must find a suitable employer who is willing to hire and train an apprentice. Most employers prefer to hire high school graduates and may select apprentices from among their current employees. The term of apprenticeship is three years (three 12 month periods) that include a minimum of 1500 hours of on-the-job training and four weeks (30 hours per week) of technical training each year. Apprentices may opt out of the program after completing one or more periods of the

Research to Evaluate the Shortage of Skilled Workers in Northern Alberta Appendix 1 – Select Occupational Details
Prepared for The Northern Labour Market Information Clearinghouse Project By Steven K. Lakey, MBA, CMC Appendix 1 Page
21
program and qualify for the level of certification related to the highest period completed. There are three levels of journeyman certification:
• Level 1 Rig Technicians can perform motorhand tasks • Level 2 Rig Technicians can perform motorhand or derrickhand tasks • Level 3 Rig Technicians can perform motorhand, derrickhand or driller tasks.
Applicants who have related training or work experience may be eligible for credit or certification. Technical training is arranged by the Alberta Apprenticeship and Industry Training Branch. Outside of the apprenticeship program, Enform (formerly Petroleum Industry Training Service and Canadian Petroleum Safety Council) in Calgary and Nisku (near Edmonton) offers courses for those employed on drilling rigs and pre-employment courses for those wanting to gain experience prior to working in the industry. 2. Oil and Gas Well Loggers and Testers: NOC Code- 8412 Overview and Duties Oil and gas well loggers and testers operate specialized tools, instruments and equipment to provide services related to oil and gas well drilling, completion and servicing. Hydrocarbon mud loggers, also called hydrocarbon data analysts, analyze mud from the well to obtain information about rock formations. In general, they use instruments to: identify formation characteristics and qualities (from cuttings in the mud returning from down-hole drilling); determine whether or not traces of oil or gas are present in the mud; analyze gases carried to the surface in drilling mud. Mud logging results help to determine drill bit selection and drilling rates, and may indicate a need for core sampling or drill stem testing. Coring operators take core samples that are analyzed by geologists, geophysicists and engineers to provide additional information about subsurface geology (to determine the potential productivity of a well). In general, coring operators: choose and deliver the special bits required to obtain core samples; direct drillers in core sample operations; box and record samples for the well site geologist or to send to the operating company or a laboratory for evaluation. Drill stem testers perform tests on the fluid in rock formations to help determine the potential productivity of an oil or gas well. With assistance from their helpers, they: drive trucks with the testing equipment to and from drilling sites; assemble and dismantle testing tools; supervise the activities of rig crews who operate the rig equipment that lowers the testing tools into the well. Drill stem testers who are also qualified to use equipment that pressure tests casing or tubing for leaks may be called pressure testers. Wireline operators lower special instruments or tools into wells on a slender, flexible, metal cable called a wireline. They lower special instruments such as: complex electrical logging equipment; perforating guns which, when detonated, perforate well casing and permit oil and gas to flow into the well; special tools and equipment used to retrieve broken or lost drilling or production equipment. In general, wireline operators: drive wireline trucks to and from drilling sites; assemble and attach the special instruments or tools required for the job; operate the winch from the truck to lower and raise the instruments or tools. Precise positioning of the equipment is necessary to ensure that the job is done safely and properly. Wireline operators carefully follow the directions of field supervisors who work from mobile units that house complex computer equipment.

Research to Evaluate the Shortage of Skilled Workers in Northern Alberta Appendix 1 – Select Occupational Details
Prepared for The Northern Labour Market Information Clearinghouse Project By Steven K. Lakey, MBA, CMC Appendix 1 Page
22
Education and Training Related High School subjects include: Community Health; Electro-Technologies; Energy and Mines; Language Arts; Mathematics; Mechanics; Physical Education; and Science (Chemistry; and Physics); however, education/training requirements vary. Most loggers and testers are trained on the job. There is no minimum education requirement but many employers prefer to hire high school graduates. Related courses (e.g. in math, chemistry, geology, electronics or mechanics) and experience working on drilling or service rigs are definite assets. It is possible to gain technical knowledge and advance more quickly by taking courses in different aspects of drilling or service operations. Enform (formerly Petroleum Industry Training Service and Canadian Petroleum Safety Council) in Calgary and Nisku (near Edmonton) offers courses for those employed on drilling and service rigs as well as pre-employment courses for those wanting to gain experience prior to working in the oil and gas industry. Wireline operators must: have a heavy truck driver's license (Alberta Class 3) and air brake certification; be licensed by the provincial government before they are allowed to handle the types of explosives used in perforating activities; be certified in the transportation of dangerous goods (TDG); be trained in first aid. 3. Mechanical Engineers: NOC Code - 2132 Overview and Duties Mechanical engineers research, design and evaluate machines, devices, equipment, systems and processes, and plan and oversee their development, installation, operation and maintenance. Mechanical engineers work on a wide variety of mechanical systems including: industrial systems and processing (e.g. in refineries, petrochemical facilities, mines); manufacturing systems, plants and products; environmental control systems (heating, ventilating and air conditioning); transportation equipment (land, sea, air, space); utility systems and infrastructure delivering water, gas, oil and power ; emerging fields such as robotics, biomedical engineering, commercial space travel, lasers, nanotechnology, telecommunications and computer components and systems. There are many different specializations in mechanical engineering. The following illustrate some of the possibilities. Design engineers create the plans for new products, machines, industrial equipment, instruments, processes and systems and provide technical support for changes to existing ones. Development engineers analyze proposed products or processes, test them out and attempt to improve them. Manufacturing engineers plan, develop and research the tools, processes, machines and equipment needed to produce quality products economically (for more information, see the Manufacturing Engineer occupational profile). Sales engineers are involved in technical sales and service. Research engineers investigate and develop new materials, processes, engineering tools and phenomena that may enable the creation of new products, systems and applications. Education Requirements The minimum education requirement for mechanical engineers is a bachelor's degree in mechanical engineering. Training Programs In Alberta, the Faculties of Engineering at the University of Alberta in Edmonton and the University of Calgary offer four year bachelor degree programs in mechanical engineering. Both institutions also offer a co-operative education or internship program consisting of periods of

Research to Evaluate the Shortage of Skilled Workers in Northern Alberta Appendix 1 – Select Occupational Details
Prepared for The Northern Labour Market Information Clearinghouse Project By Steven K. Lakey, MBA, CMC Appendix 1 Page
23
academic study alternating with periods of planned work experience in industry. Co-operative/internship engineering degree programs usually require five years to complete. The admission requirement for engineering programs at both the University of Alberta and the University of Calgary is a high school diploma with an overall average of 78 or 80 per cent in the following subjects: English 30; Chemistry 30; Pure Math 30; Math 31; and Physics 30. Post-secondary institutions throughout the province offer university transfer programs that allow students to apply up to two years of study toward university bachelor's degree programs. It is the student's responsibility to ensure that the courses they choose to take will be accepted for credit at the institution to which they wish to transfer. Health, Social Services and Education E1 – Teachers and Professors 1. Elementary Teachers: NOC Code - 4132 Overview and Duties Elementary school teachers teach and facilitate the learning of children ranging in age from four to 12 years in Kindergarten to Grade 6. In general, elementary school teachers: identify children's individual and collective learning needs; plan and deliver instruction based on student learning needs and special needs; provide a stimulating learning environment in which each child can experience growth and develop to potential; help students learn appropriate knowledge, skills and attitudes; use various assessment tools to evaluate and communicate student progress; serve as role models for students. Elementary classes vary in size and often include students who represent a broad range of abilities, interests and needs. A variety of instructional and assessment strategies are required to maintain student interest and maximize individual learning. In addition, elementary teachers: meet with parents; meet with other professionals to discuss individual student needs and progress; organize and direct the work of teacher assistants and parent volunteers; supervise extra-curricular and after-school activities; attend meetings, seminars and in-service training sessions; deal with children's crises such as forgotten lunches, minor scrapes, family emergencies or not being picked up as scheduled. Most elementary teachers are responsible for a homeroom class of 20 to 33 children and teach most subjects. Some teachers team-teach or teach music, second languages or physical education at different grade levels. Elementary teachers who have specialized in Early Childhood Education are trained to work with children from kindergarten to Grade 3. These programs focus on the development of positive self-concepts in young children and include planning, organizing and providing a wide variety of experiences that foster understanding and use of language through: practical experiments, stories, discussions, songs, art, games and other exploratory learning activities; listening experiences; individual and group activities and projects. Most kindergarten teachers in urban areas teach two different groups of children each day (one in the morning, one in the afternoon). In rural areas, kindergarten teachers often work in half-day or alternate full-day programs.

Research to Evaluate the Shortage of Skilled Workers in Northern Alberta Appendix 1 – Select Occupational Details
Prepared for The Northern Labour Market Information Clearinghouse Project By Steven K. Lakey, MBA, CMC Appendix 1 Page
24
Many schools in Alberta offer language immersion/bilingual programs in Arabic, French, German, Hebrew, Mandarin, Polish, Spanish, Ukrainian, native and other languages. In addition, the number of non-English speaking immigrant children in the province has created a need for English as a Second Language (ESL) teachers. ESL classes are usually taught by elementary teachers who have completed related university course work. Education Requirements In Alberta, the minimum qualification required to teach in an elementary school is four years of post-secondary education leading to a bachelor of education (B.Ed.) degree. Training Programs he following post-secondary institutions offer B.Ed. degree programs. • Canadian University College in Lacombe offers a four-year B.Ed. program with a
specialization in elementary education. The admission requirement is a high school diploma or equivalent with an average of at least 60 per cent in English Language Arts 30-1 (or English 30), Pure Math 30 and two other 30 level courses, preferably laboratory sciences.
• Concordia University College of Alberta in Edmonton offers a two-year B.Ed. after-degree program in elementary education. The admission requirement is a bachelor's degree with a grade point average (GPA) of 2.3/4 on the most recently attempted 30 credits. The admission requirement for degree programs is a high school diploma or equivalent with an overall average of at least 60 per cent in English Language Arts 30-1 (or English 30) and four other appropriate 30 level subjects.
• The King's University College in Edmonton offers a two-year B.Ed. after-degree program in elementary education. The admission requirement is a bachelor's degree with specified courses and a GPA of at least 2.7/4 in the last 60 credits.
• The University of Alberta in Edmonton offers B.Ed. degree, joint degree and after-degree programs in elementary education through the Faculty of Education and the Faculte Saint-Jean. Off-campus B.Ed. degree programs can be completed at Blue Quills College, Grande Prairie Regional College, Maskwachees Cultural College, Northern Lakes College and Red Deer College. The admission requirement for the Faculty of Education is a competitive average in one year of pre-professional studies (usually in Arts, Science, Human Ecology or Physical Education) including 24 units of transferable course weight to the student's B.Ed. major. Admission to pre-professional studies programs generally requires a competitive average in English Language Arts 30-1 (or English 30), three 30 level humanities or science subjects, and one other approved 30 level subject. The admission requirement for the Faculte Saint-Jean program is the same except that 30 level French is specifically required.
• The University of Calgary offers B.Ed. after-degree and combined degree programs in elementary education. Students take three years in General Studies, Fine Arts, Kinesiology or Science, then transfer to Education for the remaining two years of a five year combined degree program. The admission requirement for General Studies is a high school diploma or equivalent with a competitive average in English Language Arts 30-1 (or English 30), Pure or Applied Math 30 (or Math 31), and three of the following: Biology 30, Chemistry 30, Physics 30, Social Studies 30, Science 30, or one five-credit Grade 12 subject (French 30, 30S or 30N recommended).
• The University of Lethbridge offers combined degree and after-degree B.Ed. programs. The admission requirement for the after-degree program is a GPA of at least 2.5/4 in a bachelor's degree program with a major in a school subject. Students are admitted to the Faculty of Education after two or three years of university studies. Admission requirements for combined degree programs depend on the combined degree desired. The basic entrance requirement is an average of at least 65 per cent in English Language Arts 30-1 (or English

Research to Evaluate the Shortage of Skilled Workers in Northern Alberta Appendix 1 – Select Occupational Details
Prepared for The Northern Labour Market Information Clearinghouse Project By Steven K. Lakey, MBA, CMC Appendix 1 Page
25
30), three 30 level subjects (math or science courses may be required or recommended) and a fifth Grade 12 subject.
Competition for admission to quota programs is often keen. Post-secondary institutions may give preference to applicants who have had previous experience working with children in a leadership capacity. Valuable experience can be obtained from: playground supervision; day care work; hospital volunteering; amateur sports coaching; teacher assistant work; working with children in organized groups. Post-secondary institutions throughout the province offer university transfer programs that allow students to apply up to two years of study toward university bachelor's degree programs. It is the student's responsibility to ensure that the courses they choose to take will be accepted for credit at the institution to which they wish to transfer. 2. Babysitters/Nannies: NOC Code - 6474 Overview and Duties Nannies care for children in private homes, providing for their social, emotional, intellectual and physical development. Nannies' duties vary depending on the household and the number and age of children but, in general, they: supervise and guide children; bath and dress infants and help children dress and wash; sterilize bottles, prepare formulas and change diapers for infants; plan and prepare nutritious meals for the children or whole family; keep children's rooms and the household clean and tidy; do the childrens' laundry and ironing; organize age-appropriate play activities; take children to school and appointments; supervise study periods and assist with homework; support the emotional development and well-being of the children in their care; discipline children according to the methods requested by the parents; perform housekeeping duties as time allows. Nannies may also keep records, which include daily observations about each child and information about activities, meals served and medications administered. Nannies usually receive instructions from their employers, but often work with little supervision. Education Requirements There are no standard education requirements for nannies. Some employers consider related experience and the ability to care for children, cook, clean and get along well with others more important than formal education. Most families require job applicants to have a high school diploma or a certificate in Early Childhood Education (for more information, see the Early Childhood Educator occupational profile). Character references are usually requested and some employers require police clearance. First-aid certification and CPR training, and courses related to childcare and child development are definite assets.

Research to Evaluate the Shortage of Skilled Workers in Northern Alberta Appendix 1 – Select Occupational Details
Prepared for The Northern Labour Market Information Clearinghouse Project By Steven K. Lakey, MBA, CMC Appendix 1 Page
26
Training Programs SICES International Academy, a private vocational school in Edmonton, offers a 200-hour Caregiver program and a six-month Live-in Caregiver program. High school credits may be awarded for some modules in the Live-in Caregiver program. 3. Registered Nurses: NOC Code - 3152 Overview and Duties Registered nurses provide professional nursing services for individuals, families, groups and communities, deliver health-education programs and provide consultative nursing services to promote, maintain and restore patient health. Registered nurses may work independently or as members of a health care team. Key roles include: providing direct care; assessing the needs of individuals, families, groups or communities; planning, implementing and documenting nursing care plans; co-coordinating patient care; health counseling; managing and implementing patient care plans, leading nursing teams and advocating for clients. In hospitals and related health care settings, these roles may include activities such as: co-coordinating the activities of multi-disciplinary teams responsible for planning and implementing patient care plans; observing, assessing and monitoring patient symptoms, reactions and progress; independently implementing nursing interventions as needed; collaborating with other members of health care teams regarding patient treatments and examinations; administering medications, injections and intravenous therapy; preparing patients and assisting surgeons during operations; assisting in childbirth, managing labour and caring for newborns and their families; preventing or treating injuries or illness; supervising the provision of patient and client care; managing nursing services. Registered nurses may specialize in providing a particular type of care (e.g. emergency/trauma care or critical care) or in working with a particular type of patient (e.g. working with children or with individuals who have heart disease). Increasingly, nurses are employed in community and workplace settings as well as traditional health care settings. For more information, see the Community Health Nurse and Occupational Health Nurse profiles. For information about nursing duties specific to psychiatric units and facilities, see the Psychiatric Nurse occupational profile. Education Requirements In Alberta, registered nurse status requires a diploma or bachelor's degree in nursing. Under the current legislation governing registered nurses in Alberta, the Nursing Profession Act and associated regulations, only registered members of the Alberta Association of Registered Nurses (AARN) may call themselves or practice as a Registered Nurse. Training Programs The following post-secondary institutions offer approved nursing education programs: Athabasca University Grande Prairie Regional College Grant MacEwan College in Edmonton Keyano College in Fort McMurray Lethbridge Community College Medicine Hat College Mount Royal College in Calgary

Research to Evaluate the Shortage of Skilled Workers in Northern Alberta Appendix 1 – Select Occupational Details
Prepared for The Northern Labour Market Information Clearinghouse Project By Steven K. Lakey, MBA, CMC Appendix 1 Page
27
Red Deer College University of Alberta in Edmonton University of Calgary University of Lethbridge. These schools offer collaborative programs to enable students to graduate with a bachelor's degree in nursing. Degree programs may allow students to exit at the Diploma level. Admission requirements vary but generally include a high school diploma with an overall average of at least 60 or 65 per cent in: English 30; Biology 30; Chemistry 30 (some institutions will accept Science 30) Math 30 or Pure Math 30 (some institutions will accept Math 31, Physics 30, or at least 60 per cent in Math 33 or Applied Math 30); a fifth 30-level course (Social Studies 30 or a 30-level language recommended). Admission to quota programs is competitive so higher marks may be required to gain admission. 4. Social Workers: NOC Code - 4152 Overview and Duties Social workers help individuals, families, groups, communities and organizations develop the skills and resources they need to enhance their social functioning and social environments. Specific duties and client populations vary from setting to setting. Social workers may work in: family counselling agencies providing assessment, counselling, treatment and referral services to individuals and their families in areas such as parenting and marriage counseling; health care teams in hospitals, mental health clinics or home care agencies; community health teams working with patients and family members to overcome emotional, behavioural, social and financial difficulties; correctional services working with youth and adult offenders; the education system providing counselling and consultation services for students, parents and teachers; government social service departments delivering social policy and advocacy programs such as income support programs, child protection programs, childcare programs or foster care and adoption programs; community agencies developing prevention and intervention programs to meet community needs (for example, addressing problems such as homelessness, family violence, addictions, racism) residential settings providing counselling, role modeling, crisis intervention, assessment, advocacy and referral services for children, adolescents, people with disabilities or the elderly; employment assistance programs and private agencies providing employment-related assessment, counselling, treatment and referral services; program development, organizational development and evaluation; social research, planning and advocacy organizations; community and economic development with disadvantaged groups international social work in developing countries; settlement and immigration services for new Canadians providing assessment and counselling services, training seminars or services related to policy development, program planning, evaluation and research. Education Requirements Social workers must have a diploma, bachelor's degree or master's degree in social work. Some employers require a minimum of a Bachelor of Social Work (BSW) degree. Other requirements may include a criminal record check, a valid driver's license and the use of a vehicle. Training Programs

Research to Evaluate the Shortage of Skilled Workers in Northern Alberta Appendix 1 – Select Occupational Details
Prepared for The Northern Labour Market Information Clearinghouse Project By Steven K. Lakey, MBA, CMC Appendix 1 Page
28
In Alberta, the following institutions offer two-year diploma programs in social work: • Grant MacEwan College in Edmonton • Maskwachees Cultural College in Hobbema and Edmonton, and through Blue Quills
First Nations College in St. Paul • Mount Royal College in Calgary and through Medicine Hat College • Northern Lakes College in Slave Lake • Portage College in Lac La Biche • Red Deer College
Entrance requirements for these programs vary but generally include a high school diploma or equivalent with specified minimum marks in English Language Arts 30-1 or English 30, or equivalent. Social Studies 30 may be recommended or required. Other requirements may include a minimum age, related volunteer work or life experience, references, a criminal record check and a Child Welfare Information System check (if required by a field practicum agency). The University of Calgary offers a BSW degree program in Calgary, Edmonton, Lethbridge, Grande Prairie and various rural and remote aboriginal communities. To apply for admission to this program, students must meet the basic admission requirements for the University of Calgary and specific requirements for different routes in the program. A minimum 2.3/4 grade point average (GPA) is required. The basic admission requirement for the University of Calgary is a high school diploma or equivalent with an average of at least 70 per cent in English Language Arts 30-1 or English 30 and four other appropriate Grade 12 subjects. Applicants for the program may be University of Calgary transfer students, other transfer students, Alberta social work diploma graduates or after-degree students. The University of Calgary also offers MSW and PhD programs in social work. The entrance requirement for the master's degree program is an accredited BSW or any other bachelor's degree with at least two years of experience (volunteer or paid) in the social service field, and a grade point average (GPA) of at least 3.0/4. University transfer programs are offered by colleges and universities located throughout the province. It is the student's responsibility to ensure that the courses chosen will be accepted for credit by the University of Calgary. Distance education programs are offered by post-secondary institutions outside of Alberta. 4. Dental Assistants: NOC Code - 3411 Overview and Duties Dental assistants work with health care professionals and related agencies in any or all of the following capacities: chair side assistant, intra-oral assistant, administrative assistant, community health assistant, dental education and research assistant. As chair side assistants, dental assistants: receive and prepare patients for treatment; sterilize, prepare and set out dental instruments and materials; process x-rays; assist dentists during dental procedures; record dental procedures performed; educate patients. As intra-oral assistants, dental assistants who have appropriate training and registration may: polish clinical crowns and apply fluoride; apply dental dams, pit and fissure sealants, desensitizing agents, topical anesthetic, and cavity bases and liners; take preliminary impressions for diagnostic casts apply and remove matrices and wedges; remove sutures; place and fabricate temporary crowns and restorations; expose radiographs (x-rays; perform periodontal screening and recording; place and remove gingival retraction cords; perform specialized orthodontic procedures.

Research to Evaluate the Shortage of Skilled Workers in Northern Alberta Appendix 1 – Select Occupational Details
Prepared for The Northern Labour Market Information Clearinghouse Project By Steven K. Lakey, MBA, CMC Appendix 1 Page
29
As receptionists, dental assistants may: answer telephone calls; co-ordinate appointment schedules; keep records of bank transactions, treatment plan procedures and payroll; use and maintain dental computer software; maintain an inventory of supplies. Education Requirements In Alberta, dental assistants may:
• take a dental assistant training program and then look for related work • find employment and take courses while they are working.
Training Programs The Northern Alberta Institute of Technology (NAIT) in Edmonton and the Southern Alberta Institute of Technology (SAIT) in Calgary offer Dental Assisting programs that are accredited by the Commission on Dental Accreditation of Canada. NAIT offers:
• a ten-month Dental Assisting program. The entrance requirement is a high school diploma or equivalent with English 30 or 33, Biology 30 and Chemistry 30. To be successful in this program, students must have basic computer literacy.
• Dental Assisting Independent Study certificate programs through Continuing Education. Applicants must be employed in a dental office at least 12 hours per week.
• direct patient care courses and refresher courses through Continuing Education.
SAIT offers:
• a ten-month Dental Assisting program. The entrance requirement is a high school diploma or equivalent with an average of at least 60 per cent in English 30 or 33, Math 30, 31 or 33 or Pure Math 30, Biology 30, Chemistry 30 and a high school typing/keyboarding course.
• Dental Assisting courses through Continuing Education. Applicants must be registered as a RDA (registered dental assistant) and have successfully completed the National Dental Assisting Examining Board (NDAEB) examination.
• preparation courses for the NDAEB examination through Continuing Education.
Competition for admission to the ten-month dental assisting programs is often keen so higher than minimum marks are generally required to gain admission. Two private vocational schools in the province also offer dental assistant training programs:
• Columbia College in Calgary offers a condensed 28-week Dental Assistant program that includes a four to six week practicum. The entrance requirement is Grade 12 or equivalent.
• KDM Dental College International Inc. in Calgary and Edmonton offers an accelerated 25-week Dental Assisting program that includes four weeks of work experience. The entrance requirement is a high school diploma with at least 60 per cent in English and Math 30, and a Grade 11 science or equivalent. KDM Dental College in Calgary also offers a 104-week, part-time Dental Assisting program. Graduates of both programs are eligible to write the NDAEB exam.

Research to Evaluate the Shortage of Skilled Workers in Northern Alberta Appendix 1 – Select Occupational Details
Prepared for The Northern Labour Market Information Clearinghouse Project By Steven K. Lakey, MBA, CMC Appendix 1 Page
30
Ongoing Oilsands C1 – Technical Occupations in Mechanical and Industrial Engineering 1. Environmental Auditor: NOC Code - 2263 Overview and Duties Environmental auditors assess the environmental performance of operations in business and industry. Environmental auditors assess the management of operations in all types of businesses to ensure corporate and government standards of environmental control are being met. Their objective is to detect any existing or potential environmental problems in the company's operations, and take appropriate action. Environmental auditors may conduct compliance audits or management system audits: Compliance audits assess how well businesses meet standards set out in environmental legislation and guidelines, and internal company guidelines. Management performance audits measure conformance to management system criteria. Depending on their areas of specialization, environmental auditors may: review the overall operations of the businesses they are assessing ; select and manage an audit team; gather data using questionnaires and on-site inspections and interviewing; examine clients' records for appropriate government permits and requirements, safety standards, maintenance, and inventory control measures; review emergency handling procedures, employee training (for compliance with corporate and government standards), environmental monitoring programs and waste management efforts; identify alternate clean-up methods, where appropriate; write final audit reports and discuss findings and recommendations with clients; make presentations to directors and management; help businesses develop environmental management plans (policies and procedures). Education Requirements Environmental auditors must be knowledgeable about environmental management methods and techniques, related legislation and regulations, and business and industrial operations. Most have post-secondary education in scientific or engineering fields such as biology, chemistry, environmental sciences or environmental engineering. They may have an undergraduate degree in engineering, science, environmental law or environmental studies, or related work experience and a technical diploma specializing in environmental technology, chemical technology or engineering technology. For on-site audits, safety training may be required. Training Programs Post-secondary institutions throughout Alberta offer programs in biology, chemistry, biochemistry, environmental science and related disciplines. The following institutions offer two year diploma programs specifically in environmental science or technology: • Keyano College in Fort McMurray offers a two year Environmental Technology diploma
program. The entrance requirement is a high school diploma with Grade 11 math, chemistry and biology.
• Lakeland College in Vermilion offers two year diploma programs in Agro-Environmental Technology, Conservation and Vegetation Management Technology, Environmental Conservation and Reclamation, Environmental Protection Technology, and Natural Resources Technology. The entrance requirement for all programs is a high school diploma with English Language Arts 30-1 or English 30 (or 65 per cent in English Language Arts 30-2

Research to Evaluate the Shortage of Skilled Workers in Northern Alberta Appendix 1 – Select Occupational Details
Prepared for The Northern Labour Market Information Clearinghouse Project By Steven K. Lakey, MBA, CMC Appendix 1 Page
31
or English 33), Math 30 or Pure Math 30 (or 65 per cent in Applied Math 30 or Math 33), Biology 30 and Chemistry 30.
• Lethbridge Community College offers a two year Environmental Sciences diploma program with specializations in renewable resource management, and environmental assessment and restoration. The entrance requirement is a high school diploma with English Language Arts 30-1, Biology 20, Chemistry 20 and Applied Math 20, or equivalent. Applicants who do not have at least 70 per cent in ELA 30-1 and Applied Math 20 will be required to complete a computerized placement test. Medicine Hat College also offers the first year of this program.
• Mount Royal College in Calgary offers a one year certificate program in Environmental Technology. This program is designed for students who have experience in environmental management or related fields.
• The Northern Alberta Institute of Technology (NAIT) in Edmonton offers a two year Biological Sciences Technology diploma program with specializations in environmental sciences and renewable resources. The entrance requirement is a high school diploma with English Language Arts 30-1 or 30-2, Chemistry 30, Biology 30 and Applied or Pure Math 30 (or equivalent).
• Olds College offers a two year Land and Water Resources diploma program. The entrance requirement is a high school diploma with Pure or Applied Math 20 (or equivalent) and Chemistry 20, Biology 20 or Science 30.
• The Southern Alberta Institute of Technology (SAIT) in Calgary offers two year Environmental Technology diploma program. The entrance requirement is a high school diploma with at least 60 per cent in Pure Math 30 and Chemistry 30, and at least 50 per cent in English Language Arts 30-2 (or equivalent).
• The following post-secondary institutions offer degree programs specifically in environmental science:
• Concordia University College of Alberta in Edmonton offers three and four year B.Sc. degree programs in environmental science. The entrance requirement is an average of at least 60 per cent in English Language Arts 30-1, Pure Math 30, Chemistry 30 and Biology 30 (or equivalent) and one other appropriate 30-level subject.
• The King's University College in Edmonton offers three and four year Bachelor of Arts and B.Sc. degree programs in environmental studies. The entrance requirement is an average of at least 60 per cent in English Language Arts 30-1, Pure Math 30, and one of Biology 30 or Chemistry 30 (both are recommended), and two other approved 30-level courses.
• Lakeland College in Vermilion a Bachelor of Applied Environmental Management degree program with a reclamation/remediation stream and a monitoring/environmental protection stream. The entrance requirement is successful completion of a related two year diploma program from a recognized post-secondary institution.
• The University of Alberta offers four year degree programs in Environmental and Conservation Sciences (Edmonton), Environmental and Conservation Sciences/Native Studies Combined (Edmonton) and Environmental Science (Camrose). The entrance requirement for these programs is a competitive average of 65 to 80 per cent in English Language Arts 30-1, Pure Math 30, Chemistry 30, Biology 30 and one other Grade 12 subject.
• The University of Calgary offers a four year B.Sc. degree program in Environmental Science. The entrance requirement is a high school diploma with a competitive average in English Language Arts 30-1, Pure Math 30 (or equivalent), Chemistry 30, two of the following: Biology 30, Math 31, Physics 30, and one other 30-level subject selected from an approved list. Biology 30 is required for the biological sciences concentration. Students must complete a year of appropriate university studies before being admitted to this program.
• The University of Lethbridge offers a four year B.Sc. degree program in Environmental Science. The entrance requirement is an average of at least 65 per cent in English Language Arts 30-1, Biology 30, Chemistry 30, Pure Math 30 (or equivalent) and a fifth Grade 12 subject (Math 31 recommended).

Research to Evaluate the Shortage of Skilled Workers in Northern Alberta Appendix 1 – Select Occupational Details
Prepared for The Northern Labour Market Information Clearinghouse Project By Steven K. Lakey, MBA, CMC Appendix 1 Page
32
3. Power Engineer: NOC Code - 7351 Overview and Duties Power engineers supervise, operate and maintain machinery and boilers that provide power, heat, refrigeration and other utility services to heavy industry and large building complexes. Power engineers are responsible for the safe and efficient operation and maintenance of industrial equipment such as boilers, steam and gas turbines, generators, gas and diesel internal combustion engines, pumps, condensers, compressors, pressure vessels and related controls. In large industrial or building complexes, they also may be responsible for heating, air-conditioning, ventilation, refrigeration, fire systems and building control systems. Responsibilities vary from one position to another but, in general, power engineers: ensure that safety codes and other applicable regulations are followed; use automatic or manual controls to start, operate and shutdown plant systems; monitor alarms, gauges and other instruments associated with plant operations; trouble shoot and take corrective action to prevent equipment or system failures; isolate equipment mechanically and electrically for inspection and repair; ensure that equipment and processes operate at maximum efficiency; assist in the development of operation, maintenance and safety procedures; maintain a daily log of operation, maintenance and safety activities; investigate and report on safety-related accidents or incidents; write reports about plant operation; work with outside agencies, consultants and contractors. Industrial plants and building operations often are automated to enhance production efficiency and improve safety. In more modern plants, senior power engineers may work in control room environments, analyzing problems and taking action to ensure continuous and reliable operation of equipment and systems. At times, they must switch from automatic controls to manual controls to correct problems and ensure the safety of staff and equipment. Education Requirements In Alberta, power engineers are certified through the Alberta Boilers Safety Association. Certification examinations are standardized and accepted in all provinces except Quebec. There are five levels of certification, advancing from Fifth Class certificate to First Class certificate. Each level of certification has different training and employment experience requirements. Completion of an approved course is required to challenge Fourth and Fifth Class Certificate of Competency examinations. To write the examination for the Third Class certificate, candidates must have: the required operating experience with a Fourth Class certificate; Science 10 or Physics 10, Applied Math 10 or Pure Math 10 (or Math 10 or 13) and English 10 or 13 (or equivalent education) or pass Part A of a recognized Third Class course in power engineering. To write the examination for the Second Class certificate, candidates must have: the required operating experience with a Third Class certificate; Science 20 or Physics 20, Applied Math 20 or Pure Math 20 (or Math 20 or 23) and English 20 or 23 (or equivalent education) or pass Part A of a recognized Second Class course in power engineering. To write the examination for the First Class certificate, candidates must have: the required operating experience with a Second Class certificate; Science 30 or Physics 30, Applied Math 20 or Pure Math 20 (or equivalent) and English 20 or 23 (or equivalent), or pass Part A of a First Class course in power engineering.

Research to Evaluate the Shortage of Skilled Workers in Northern Alberta Appendix 1 – Select Occupational Details
Prepared for The Northern Labour Market Information Clearinghouse Project By Steven K. Lakey, MBA, CMC Appendix 1 Page
33
Training Programs Power engineering programs and continuing education courses are offered by the following post-secondary institutions in Alberta: • Grande Prairie Regional College • Keyano College in Fort McMurray • Lakeland College in Lloydminster, • Lethbridge Community College • Medicine Hat College • Northern Alberta Institute of Technology (NAIT) in Edmonton and Fairview • Northern Lakes College in Grouard • Portage College in Lac La Biche • Red Deer College • Southern Alberta Institute of Technology (SAIT) in Calgary. Entrance requirements for entry level power engineering programs vary but generally include Grade 10 or 11 English, math and physics courses. Some programs require a high school diploma or equivalent. Forestry I1 – Operators Unique to Forestry Excluding Labourers 1. Logging Machine Operators: NOC Code - 8241 Overview and Duties Logging/forestry equipment operators use machinery and equipment to fell, process and load trees at logging sites. Logging/forestry equipment operators perform a broad range of logging operations to mechanically harvest timber (convert standing trees into forms suitable for use in mills). They operate complex machines, which are often tracked or rubber-tired for travelling over rough terrain. Operating these machines may require manipulating levers and foot pedals, or using on-board computers to monitor and control operations. Depending on the harvesting method being used, several logging/forestry equipment operators may be required at each logging site: Feller-buncher operators operate tracked, backhoe-like machines that cut trees at the base and pile them in bunches in preparation for being moved elsewhere. Delimber operators operate machines that remove rot and limbs from felled trees and trim tops to meet required specifications. Harvesters operate machines that can fell, de-limb and cut trees into logs of full or shortwood lengths. The logs are then bunched into piles for delivery to roadsides. Skidder operators operate rubber tired, four wheel drive machines that are used to move trees from the cutblock to the roadside and pile trees in a way that allows easy access for delimber or process operators. Processor operators operate machines that process trees at the roadside. This usually involves stripping limbs, cutting logs into predetermined lengths and piling them for loading.

Research to Evaluate the Shortage of Skilled Workers in Northern Alberta Appendix 1 – Select Occupational Details
Prepared for The Northern Labour Market Information Clearinghouse Project By Steven K. Lakey, MBA, CMC Appendix 1 Page
34
Forwarder operators operate forwarder machines to transport wood that has been cut to lengths to the roadside. Log loader operators, sometimes called butt'n'top loaders or picker truck operators, load logs piled at roadsides onto logging trucks for transport to mills. Log loaders look much like cherry pickers with mechanical grapple tongs that grip logs for lifting. Log loader operators raise logs as smoothly and accurately as possible and place them on logging truck trailers to form balanced loads within legal axle-weight limits. Portable chipper operators operate machines which reduce whole trees to chips and blow them into tractor-trailer units. The chips are then hauled to pulp or paper manufacturing plants. Although the work of logging/forestry equipment operators is often repetitious, it takes skill and concentration. To operate increasingly sophisticated equipment, operators must have the knowledge required to make harvesting decisions that can have a long term impact on the forest. For example, tree processor operators must know about log quality and be able to interpret printouts generated by on-board computers. They also must be able to maintain complex equipment. Education Requirements There are no formal educational requirements for logging/forestry equipment operator occupations. However, applicants must be able to read manuals and other materials that are written at a Grade 9 reading level. Before they are allowed on site, new hires may be required to have: a first aid certificate; Workplace Hazardous Materials Information Systems (WHMIS) training; Transport of Dangerous Goods (TDG) training; Sour Gas (H2S) training. Trained logging/forestry equipment operators must be able to: accurately identify tree species; employ efficient, sound felling and logging practices; maintain equipment effectively; read maps; adapt methods to suit local conditions. A working knowledge of provincial harvesting rules and regulations governing logging is essential to minimize environmental damage. Because machinery maintenance is required during the off season and when breakdowns occur, operators should have the mechanical skills required to handle minor repairs and recognize major problems. The following qualifications would be definite assets when seeking employment: related experience or training (for example, in heavy equipment operation or the use of global positioning and data systems); wildlife safety training; chain saw certificate; equipment maintenance and service training; a high school diploma; forestry or environmental courses (for example, training related to water course crossing, harvesting ground rules, log quality).

Research to Evaluate the Shortage of Skilled Workers in Northern Alberta Appendix 1 – Select Occupational Details
Prepared for The Northern Labour Market Information Clearinghouse Project By Steven K. Lakey, MBA, CMC Appendix 1 Page
35
Training Programs In Alberta, the Northern Lakes College in Grouard offers a 12 week Woodland Equipment Operator program that includes theory, practicum and simulator training. The entrance requirement is Grade 10 English and math, or mature student status; and a valid Class 5 driver's license. Applicants must complete a health status form and a career investigation. Most companies provide on-the-job training under the supervision of an experienced, competent worker. The length of the training period varies with the type of machine and the trainee's ability but usually takes about six months. On-the-job training may be supplemented by a few weeks of training sponsored by an equipment manufacturer. 2. Sawmill Machine Operators: NOC Code - 9431 Overview and Duties Sawmill machine operators operate, monitor and control automated machines and equipment that process logs into lumber, shingles and shakes. Sawing logs into boards and planks of varying widths and thicknesses requires a fairly standard series of operations but the processes used vary from one sawmill to another. In some sawmills, the work of sawmill machine operators is labour intensive. In other mills, technological advances have decreased the amount of manual labour required. Sawmill machine operators may use various types of automated equipment to: move logs from storage yards onto transfer decks; convey logs through laser scanners that determine the most profitable cutting patterns for each log; send logs through cut-off saws that cut logs to optimum lengths; debark logs; feed logs through various types of saws, edgers and trimmers to produce rough lumber; sort and stack lumber according to length, width and thickness; move stacks of lumber to storage yards and, later, to and from drying kilns; feed rough lumber through planers to give it a smooth (dressed) surface; wrap or strap lumber into packages and label packages for shipment. In general, sawmill machine operators: use front end loaders, stationary deck cranes or gantry cranes to feed logs into the sawmill; operate equipment from consoles or control rooms to scan logs for size and quality; convey logs and lumber to and from saws; saw logs into rough lumber; saw, trim, sort, stack, put in dry kiln and plane rough lumber into dressed lumber of various sizes and saw or split shingles and shakes; monitor logs and lumber movement to ensure cuts satisfy customer requirements; clean and maintain equipment; attend regularly scheduled safety meetings. Education Requirements Employers generally prefer to hire high school graduates but may hire people who have less education if they have experience operating machinery or equipment. Training Programs Sawmill machine operators are trained on the job. They usually start in entry level labouring positions. After a number of years, employees may be offered machine operating positions as they become available. With experience and satisfactory performance operating one type of machine, they advance to more complex tasks. Construction

Research to Evaluate the Shortage of Skilled Workers in Northern Alberta Appendix 1 – Select Occupational Details
Prepared for The Northern Labour Market Information Clearinghouse Project By Steven K. Lakey, MBA, CMC Appendix 1 Page
36
H8 – Other Trades Helpers and Labourers 1. Construction Trades Helpers and Labourers: NOC Code - 7611 Overview and Duties Construction craft labourers prepare and clean up construction sites, move materials and equipment and perform demolition, excavation and compaction activities. Construction craft labourers work on a wide variety of buildings, structures and premises, including municipal sewer and water mains, roads, dams, bridges, tunnels, railways and canals. Their duties and responsibilities vary from one job to another but, in general, they: handle and distribute construction materials (e.g. load and unload vehicles with supplies, equipment and construction materials; move tools, equipment and construction materials to and from work areas; remove rubble and other debris); excavate, backfill and compact subgrade (e.g. move and level earth using shovels and rakes, operate pneumatic tampers); place, consolidate and protect case-in-place concrete or masonry structures (e.g. shovel cement and other materials into cement mixers; mix, pour and spread concrete; use electric and pneumatic vibrators); install municipal sewer and water mains (e.g. dig trenches using shovels and other hand tools, align pipes and perform related activities); assemble and dismantle scaffolding, ramps, catwalks, shoring and barricades at construction sites. Construction craft labourers may also: drill and blast rock at construction sites; demolish buildings; sort, clean and pile salvaged materials from demolished buildings; operate jackhammers and drills to break up concrete or pavement. Education Requirements/Training Programs Construction craft labourer is a designated occupation in Alberta. This means that training and certification are not required but trainees can apply to Alberta Apprenticeship and Industry Training for an Alberta Occupational Certificate. To register, trainees must: have at least an Alberta Grade 9 education or equivalent or pass an entrance exam; and find a suitable employer who is willing to hire a trainee. Most employers prefer to hire high school graduates and/or people who already have related training or experience. The term of training for the construction craft labourer program is a minimum of 12 months that include at least 2,000 hours of work experience. Applicants who have related training or experience may qualify for credit or certification. H0 – Trades Contractors and Supervisors 1. Electrical Contractors: NOC Code - 7212 Overview and Duties Electrical contractors erect or install electrical installations or equipment. They may also repair, service or maintain electrical installations or equipment. Electrical contractors apply for and obtain permits for electrical work. They may do various types of electrical work or specialize in particular types of projects: residential (e.g. houses, condominiums, apartment buildings); commercial (e.g. office buildings, shopping malls); institutional (e.g. schools, hospitals, government funded projects); industrial (e.g. refineries, factories).

Research to Evaluate the Shortage of Skilled Workers in Northern Alberta Appendix 1 – Select Occupational Details
Prepared for The Northern Labour Market Information Clearinghouse Project By Steven K. Lakey, MBA, CMC Appendix 1 Page
37
Duties and responsibilities vary from one position to another but, in general, electrical contractors: negotiate project requirements with customers; estimate material, equipment, labour and other costs; prepare bids for the electrical work involved in construction projects; negotiate contract terms with clients plan and schedule the work; purchase materials; hire and supervise electricians and apprentices; negotiate with unions and other parties; track progress and ensure compliance with architectural plans, blueprints, safety codes and other specifications; co-ordinate activities with other construction managers ensure that projects are completed on schedule and within budget; prepare progress reports for clients; prepare invoices and manage receivables. Electrical contractors usually have a skeleton crew of employees and hire additional help as needed. Education Requirements Electrical contractors need related education and supervisory experience. They may be journeyman electricians or have post-secondary education in electrical engineering. For more information, see the Electrician, Electrical Engineering Technologist and Electrical Engineer occupational profiles. Training Programs The Electrical Contractors Association of Alberta offers a Professional Education Program that includes the following courses: Accounting Principles; Business and Public Relations; Assessing and Finalizing the Tender; Legal Implications; Project Management; and Safety Principles. H1 – Construction Trades 1. Sheet Metal Workers: NOC Code - 7261 Overview and Duties Sheet metal workers design, fabricate, assemble, install and repair sheet metal products. Sheet metal workers use many types of metal including black and galvanized steel, copper, brass, nickel, stainless steel, aluminum and tin plate to make products such as: pollution control systems, dust collection and control systems, air-slides, grain spouts, material blowers, air-veyors and other air systems; heating, ventilating and air conditioning systems; solar heating and cooling systems; metal showcases, display neon and metal signs; metal cabinets, custom built tables, counters and fixtures for hospitals, kitchen equipment and items for the food service and beverage industry; electrical panels and related equipment dairy, brewery and laboratory equipment; metal shelving, lockers, window frames, metal doors and frames, toilet partitions; flashing, coping, troughing and roof drainage systems; custom or small fabrication runs of sheet metal items. On occasion, sheet metal workers substitute fibreglass or plastic for metals. Duties vary from one position to another but, in general, sheet metal workers: lay out, measure and mark dimensions and reference lines on sheet metal according to drawings or templates; use laser or plasma cutting equipment, numerically-controlled or computerized equipment, hand and power shears and snips and light metal-working equipment to cut, drill or punch, bend and shape sheet metal; fasten components together with bolts, screws, cement, rivets, adhesives or solder or by welding; install and repair sheet metal products and ensure installations conform to specifications and building codes; do metal cladding of insulated piping and equipment on

Research to Evaluate the Shortage of Skilled Workers in Northern Alberta Appendix 1 – Select Occupational Details
Prepared for The Northern Labour Market Information Clearinghouse Project By Steven K. Lakey, MBA, CMC Appendix 1 Page
38
industrial sites; make and install flashing, coping for roofing applications; supply, install, service and repair air handling equipment, furnaces, fans and air terminal devices. Sheet metal workers may work from verbal instructions or blueprints, or design small jobs themselves. Education Requirements To work in Alberta, sheet metal workers must be registered apprentices or certified journeymen. To register with Alberta Apprenticeship and Industry Training, apprentices must: have Alberta Math 20 or 23, Pure Math 20 or Applied Math 20 or equivalent or pass an entrance exam; and find a suitable employer who is willing to hire and train an apprentice. Most employers prefer to hire high school graduates and may select apprentices from among their current employees. Sheet metal workers need a good background in practical math, geometry and blueprint reading. The term of apprenticeship is four years (four 12-month periods) that include a minimum of 1,425 hours of on-the-job training and ten weeks of technical training each year. High school students can become apprentices and gain credits toward apprenticeship training and a high school diploma at the same time through the Registered Apprenticeship Program (RAP). Applicants who have related training or work experience may be eligible for credit or certification. Training Programs Technical training is arranged by Alberta Apprenticeship and Industry Training and is currently offered at: the Northern Alberta Institute of Technology (NAIT) in Edmonton; and the Southern Alberta Institute of Technology (SAIT) in Calgary. Pre-employment programs for prospective apprentices and continuing education programs for journeymen may be offered on an as needed basis by the institution(s) listed above or other schools. 2. Ironworkers: NOC Code - 7264 Overview and Duties Ironworkers fabricate, construct and join scaffolding, structural steel buildings, bridges, ornamental ironwork and pre-cast structures. Ironworkers erect structural steel components, reinforce steel, post tension tendons, and install conveyors and robotic equipment. Sometimes they perform reconstructive work on existing structures. Duties vary from one position to another but, in general, ironworkers: read blueprints and specifications to lay out the work; unload and stack steel units so each piece can be hoisted as needed; erect and install scaffolding, construction cranes, derricks and other hoisting equipment; assemble rigging (cables, pulleys, hooks) to move heavy equipment and materials; attach cables from a crane or derrick and direct crane operators with hand signals or radios; position steel units, align holes and insert temporary bolts; check the alignments and join steel parts by bolting or welding them with an electric arc process; assemble and erect pre-fabricated metal structures; select, cut, bend, position and secure steel bars or wire mesh in concrete forms to reinforce the concrete; install ornamental and other structural metalwork such as curtain walls, metal stairways, railings and power doors; unload and install pre-cast components.

Research to Evaluate the Shortage of Skilled Workers in Northern Alberta Appendix 1 – Select Occupational Details
Prepared for The Northern Labour Market Information Clearinghouse Project By Steven K. Lakey, MBA, CMC Appendix 1 Page
39
Education Requirements To work in Alberta, ironworkers must be registered apprentices or certified journeymen. To register with Alberta Apprenticeship and Industry Training, apprentices must: have at least an Alberta Grade 10 education (with Math 10, Math 13, Applied Math 10 or Pure Math 10 and English 10 or 13) or equivalent or pass an entrance exam; and find a suitable employer who is willing to hire and train an apprentice. Most employers prefer to hire high school graduates and may select apprentices from among their current employees. The terms of apprenticeship for the Ironworker trade are as follows: Ironworker is three years (four 9-month periods) that include a minimum of 1,125 hours of on-the-job training and six weeks of technical training each period. Ironworker-metal building systems erector is two periods. The first period spans a minimum of 24 months and includes a minimum of 3,000 hours of on-the-job training and six weeks of technical training. The second period comprises of six weeks of technical training with no minimum months required. Training Programs Technical training is arranged by Alberta Apprenticeship and Industry Training and is currently offered at the Northern Alberta Institute of Technology (NAIT) in Edmonton. Pre-employment programs for prospective apprentices and continuing education programs for journeymen may be offered on an as needed basis by the institution(s) listed above or other schools. 3. Carpenters: NOC Code – 7271 Overview and Duties Carpenters construct, erect and repair buildings and other structures made of wood, wood substitutes, steel and other materials. Carpenters' duties vary from one position to another. In residential jobs, they crib the basement, build a framework of walls, roof, exterior and interior finishes, and install doors, windows, flooring, cabinets, stairs, handrails, panelling, moulding and ceiling tiles. In commercial or industrial jobs, they build concrete forms, scaffolding, bridges, trestles, tunnels, shelters, towers and other structures. In maintenance jobs, they repair and remodel existing structures of all kinds. In any type of position, carpentry tasks generally involve: reading blueprints or getting instructions from a supervisor; doing the layout (selecting materials, planning sequences and methods of work, measuring and marking materials to avoid costly mistakes or omissions); cutting and shaping materials and joining them with nails, screws, bolts or glue; checking completed units to be sure they are level, square, plumb and the right size, shape and location. Carpenters must work accurately and economically and follow national and local building codes. Some carpenters specialize in a particular type of work such as framing, bench or finishing work. Education Requirements
Research to Evaluate the Shortage of Skilled Workers in Northern Alberta Appendix 1 – Select Occupational Details
Prepared for The Northern Labour Market Information Clearinghouse Project By Steven K. Lakey, MBA, CMC Appendix 1 Page
40
To work in Alberta, carpenters must be ONE of the following: registered apprentices; certified journeymen; working for an employer who is satisfied that they have the skills and knowledge expected of certified journeymen; or self-employed. To register with Alberta Apprenticeship and Industry Training, apprentices must: have at least an Alberta Grade 9 education or equivalent or pass an entrance exam; and find a suitable employer who is willing to hire and train an apprentice. Most employers prefer to hire high school graduates and may select apprentices from among their current employees. The term of apprenticeship is four years (four 12-month periods) that include a minimum of 1,360 hours of on-the-job training and eight weeks of technical training each year. High school students can become apprentices and gain credits toward apprenticeship training and a high school diploma at the same time through the Registered Apprenticeship Program (RAP). Apprentices are required to provide their own tools. Training Programs Technical training is arranged by Alberta Apprenticeship and Industry Training and is currently offered at: Keyano College in Fort McMurray; Lakeland College in Vermilion; Lethbridge Community College; Medicine Hat College; the Northern Alberta Institute of Technology (NAIT) in Edmonton and Fairview; Northern Lakes College in Grouard; Portage College in Lac La Biche; Red Deer College; the Southern Alberta Institute of Technology (SAIT) in Calgary. Competency-Based Apprenticeship Training (CBAT) is also offered by Lethbridge Community College, Red Deer College and SAIT. Outside the apprenticeship program, the following post-secondary institutions offer related training: the Northern Alberta Institute of Technology (NAIT) in Edmonton offers a one year Millwork and Carpentry certificate program. The entrance requirement is Grade 10 with English and math. Red Deer College offers a one year Carpentry and Construction certificate program. The entrance requirement is Pure Math 10 or Applied Math 20 or Math 23 and English 10 or 23 or equivalent.